Page Replies to initial written questions raised by Finance ...
472
Index Page Replies to initial written questions raised by Finance Committee Members in examining the Estimates of Expenditure 2016-17 Director of Bureau : Secretary for Labour and Welfare Session No. : 21 File Name : LWB(L)-2-e1.docx Reply Serial No. Question Serial No. Name of Member Head Programme LWB(L)001 1515 CHAN Kin-por 90 (3) Safety and Health at Work LWB(L)002 0544 CHAN Yuen-han 90 (2) Employment Services LWB(L)003 1664 CHAN Yuen-han 90 (2) Employment Services LWB(L)004 2407 CHAN Yuen-han 90 (1) Labour Relations (2) Employment Services (4) Employees’ Rights and Benefits LWB(L)005 3038 CHAN Yuen-han 90 (2) Employment Services LWB(L)006 0022 Tommy CHEUNG Yu-yan 90 (2) Employment Services LWB(L)007 0023 Tommy CHEUNG Yu-yan 90 (3) Safety and Health at Work LWB(L)008 2372 Tommy CHEUNG Yu-yan 90 (4) Employees’ Rights and Benefits LWB(L)009 1372 CHIANG Lai-wan 90 (4) Employees’ Rights and Benefits LWB(L)010 1373 CHIANG Lai-wan 90 (4) Employees’ Rights and Benefits LWB(L)011 1374 CHIANG Lai-wan 90 (3) Safety and Health at Work LWB(L)012 1375 CHIANG Lai-wan 90 (2) Employment Services LWB(L)013 1376 CHIANG Lai-wan 90 (4) Employees’ Rights and Benefits LWB(L)014 1379 CHIANG Lai-wan 90 (2) Employment Services LWB(L)015 1381 CHIANG Lai-wan 90 (2) Employment Services LWB(L)016 1382 CHIANG Lai-wan 90 (2) Employment Services LWB(L)017 1384 CHIANG Lai-wan 90 (2) Employment Services LWB(L)018 1385 CHIANG Lai-wan 90 (2) Employment Services LWB(L)019 1386 CHIANG Lai-wan 90 (4) Employees’ Rights and Benefits LWB(L)020 1387 CHIANG Lai-wan 90 (4) Employees’ Rights and Benefits LWB(L)021 1388 CHIANG Lai-wan 90 (4) Employees’ Rights and Benefits LWB(L)022 1389 CHIANG Lai-wan 90 (4) Employees’ Rights and Benefits LWB(L)023 1390 CHIANG Lai-wan 90 (1) Labour Relations (4) Employees’ Rights and Benefits
-
Upload
khangminh22 -
Category
Documents
-
view
1 -
download
0
Transcript of Page Replies to initial written questions raised by Finance ...
Index Page
Replies to initial written questions raised by Finance Committee Members in examining the Estimates of Expenditure 2016-17
Director of Bureau : Secretary for Labour and Welfare
Session No. : 21 File Name : LWB(L)-2-e1.docx
Reply Serial
No. Question
Serial No. Name of Member Head Programme
LWB(L)001 1515 CHAN Kin-por 90 (3) Safety and Health at Work LWB(L)002 0544 CHAN Yuen-han 90 (2) Employment Services LWB(L)003 1664 CHAN Yuen-han 90 (2) Employment Services LWB(L)004 2407 CHAN Yuen-han 90 (1) Labour Relations
(2) Employment Services (4) Employees’ Rights and Benefits
LWB(L)005 3038 CHAN Yuen-han 90 (2) Employment Services LWB(L)006 0022 Tommy CHEUNG
Yu-yan 90 (2) Employment Services
LWB(L)007 0023 Tommy CHEUNG Yu-yan
90 (3) Safety and Health at Work
LWB(L)008 2372 Tommy CHEUNG Yu-yan
90 (4) Employees’ Rights and Benefits
LWB(L)009 1372 CHIANG Lai-wan 90 (4) Employees’ Rights and Benefits
LWB(L)010 1373 CHIANG Lai-wan 90 (4) Employees’ Rights and Benefits
LWB(L)011 1374 CHIANG Lai-wan 90 (3) Safety and Health at Work LWB(L)012 1375 CHIANG Lai-wan 90 (2) Employment Services LWB(L)013 1376 CHIANG Lai-wan 90 (4) Employees’ Rights and
Benefits LWB(L)014 1379 CHIANG Lai-wan 90 (2) Employment Services LWB(L)015 1381 CHIANG Lai-wan 90 (2) Employment Services LWB(L)016 1382 CHIANG Lai-wan 90 (2) Employment Services LWB(L)017 1384 CHIANG Lai-wan 90 (2) Employment Services LWB(L)018 1385 CHIANG Lai-wan 90 (2) Employment Services LWB(L)019 1386 CHIANG Lai-wan 90 (4) Employees’ Rights and
Benefits LWB(L)020 1387 CHIANG Lai-wan 90 (4) Employees’ Rights and
Benefits LWB(L)021 1388 CHIANG Lai-wan 90 (4) Employees’ Rights and
Benefits LWB(L)022 1389 CHIANG Lai-wan 90 (4) Employees’ Rights and
Benefits LWB(L)023 1390 CHIANG Lai-wan 90 (1) Labour Relations
(4) Employees’ Rights and Benefits
Reply Serial No.
Question Serial
No. Name of Member Head Programme LWB(L)024 1391 CHIANG Lai-wan 90 (3) Safety and Health at Work LWB(L)025 1392 CHIANG Lai-wan 90 (1) Labour Relations LWB(L)026 1393 CHIANG Lai-wan 90 (3) Safety and Health at Work LWB(L)027 1394 CHIANG Lai-wan 90 (4) Employees’ Rights and
Benefits LWB(L)028 1395 CHIANG Lai-wan 90 (2) Employment Services LWB(L)029 1397 CHIANG Lai-wan 90 (2) Employment Services LWB(L)030 0381 Albert HO
Chun-yan 90
LWB(L)031 0382 Albert HO Chun-yan
90 (2) Employment Services
LWB(L)032 0384 Albert HO Chun-yan
90 (1) Labour Relations
LWB(L)033 0386 Albert HO Chun-yan
90 (2) Employment Services
LWB(L)034 0387 Albert HO Chun-yan
90 (2) Employment Services
LWB(L)035 1280 Cyd HO Sau-lan 90 (2) Employment Services LWB(L)036 0533 KWOK Wai-keung 90 (2) Employment Services LWB(L)037 0534 KWOK Wai-keung 90 (2) Employment Services LWB(L)038 0535 KWOK Wai-keung 90 (2) Employment Services LWB(L)039 0536 KWOK Wai-keung 90 (2) Employment Services LWB(L)040 2570 KWOK Wai-keung 90 (1) Labour Relations LWB(L)041 2571 KWOK Wai-keung 90 (2) Employment Services LWB(L)042 2572 KWOK Wai-keung 90 (2) Employment Services LWB(L)043 2573 KWOK Wai-keung 90 (2) Employment Services LWB(L)044 0279 Jeffrey LAM
Kin-fung 90 (2) Employment Services
LWB(L)045 0802 Emily LAU Wai-hing
90 (2) Employment Services
LWB(L)046 0803 Emily LAU Wai-hing
90 (2) Employment Services
LWB(L)047 1316 LEE Cheuk-yan 90 (1) Labour Relations LWB(L)048 1317 LEE Cheuk-yan 90 (1) Labour Relations LWB(L)049 1318 LEE Cheuk-yan 90 (2) Employment Services LWB(L)050 1319 LEE Cheuk-yan 90 (2) Employment Services LWB(L)051 1320 LEE Cheuk-yan 90 (2) Employment Services LWB(L)052 1321 LEE Cheuk-yan 90 (2) Employment Services LWB(L)053 1322 LEE Cheuk-yan 90 (2) Employment Services LWB(L)054 1323 LEE Cheuk-yan 90 (2) Employment Services LWB(L)055 1324 LEE Cheuk-yan 90 (2) Employment Services LWB(L)056 2080 LEE Cheuk-yan 90 (3) Safety and Health at Work LWB(L)057 2081 LEE Cheuk-yan 90 (3) Safety and Health at Work LWB(L)058 2082 LEE Cheuk-yan 90 (3) Safety and Health at Work LWB(L)059 2083 LEE Cheuk-yan 90 (4) Employees’ Rights and
Benefits
Reply Serial No.
Question Serial
No. Name of Member Head Programme LWB(L)060 2084 LEE Cheuk-yan 90 (4) Employees’ Rights and
Benefits LWB(L)061 2085 LEE Cheuk-yan 90 (4) Employees’ Rights and
Benefits LWB(L)062 2874 LEE Cheuk-yan 90 (1) Labour Relations LWB(L)063 0666 Priscilla LEUNG
Mei-fun 90 (2) Employment Services
LWB(L)064 0754 LEUNG Yiu-chung 90 (1) Labour Relations (4) Employees’ Rights and Benefits
LWB(L)065 1328 LEUNG Yiu-chung 90 (1) Labour Relations LWB(L)066 2120 LEUNG Yiu-chung 90 (1) Labour Relations LWB(L)067 2121 LEUNG Yiu-chung 90 (3) Safety and Health at Work
(4) Employees’ Rights and Benefits
LWB(L)068 2123 LEUNG Yiu-chung 90 (4) Employees’ Rights and Benefits
LWB(L)069 2124 LEUNG Yiu-chung 90 (3) Safety and Health at Work LWB(L)070 2125 LEUNG Yiu-chung 90 (4) Employees’ Rights and
Benefits LWB(L)071 2126 LEUNG Yiu-chung 90 (4) Employees’ Rights and
Benefits LWB(L)072 2127 LEUNG Yiu-chung 90 (1) Labour Relations LWB(L)073 2243 Martin LIAO
Cheung-kong 90 (2) Employment Services
LWB(L)074 0350 LO Wai-kwok 90 (2) Employment Services LWB(L)075 3108 Claudia MO 90 (4) Employees’ Rights and
Benefits LWB(L)076 1719 POON Siu-ping 90 (1) Labour Relations LWB(L)077 2350 POON Siu-ping 90 (2) Employment Services LWB(L)078 2351 POON Siu-ping 90 (3) Safety and Health at Work LWB(L)079 2352 POON Siu-ping 90 (3) Safety and Health at Work LWB(L)080 3149 POON Siu-ping 90 (3) Safety and Health at Work LWB(L)081 3150 POON Siu-ping 90 (4) Employees’ Rights and
Benefits LWB(L)082 2252 SIN Chung-kai 90 (2) Employment Services LWB(L)083 2253 SIN Chung-kai 90 (2) Employment Services LWB(L)084 2254 SIN Chung-kai 90 (4) Employees’ Rights and
Benefits LWB(L)085 2255 SIN Chung-kai 90 (3) Safety and Health at Work LWB(L)086 2256 SIN Chung-kai 90 (4) Employees’ Rights and
Benefits LWB(L)087 2257 SIN Chung-kai 90 (4) Employees’ Rights and
Benefits LWB(L)088 2258 SIN Chung-kai 90 (3) Safety and Health at Work LWB(L)089 2259 SIN Chung-kai 90 (1) Labour Relations
Reply Serial No.
Question Serial
No. Name of Member Head Programme (4) Employees’ Rights and Benefits
LWB(L)090 2260 SIN Chung-kai 90 (4) Employees’ Rights and Benefits
LWB(L)091 2261 SIN Chung-kai 90 (4) Employees’ Rights and Benefits
LWB(L)092 2262 SIN Chung-kai 90 (4) Employees’ Rights and Benefits
LWB(L)093 2263 SIN Chung-kai 90 (1) Labour Relations LWB(L)094 2264 SIN Chung-kai 90 (2) Employment Services LWB(L)095 2266 SIN Chung-kai 90 (4) Employees’ Rights and
Benefits LWB(L)096 2267 SIN Chung-kai 90 (2) Employment Services LWB(L)097 0188 TANG Ka-piu 90 (2) Employment Services LWB(L)098 0189 TANG Ka-piu 90 (2) Employment Services LWB(L)099 0190 TANG Ka-piu 90 (2) Employment Services LWB(L)100 0191 TANG Ka-piu 90 (2) Employment Services LWB(L)101 2276 TANG Ka-piu 90 (1) Labour Relations LWB(L)102 2277 TANG Ka-piu 90 (2) Employment Services LWB(L)103 2278 TANG Ka-piu 90 (3) Safety and Health at Work LWB(L)104 1790 James TIEN
Pei-chun 90 (2) Employment Services
LWB(L)105 1791 James TIEN Pei-chun
90 (3) Safety and Health at Work
LWB(L)106 0052 WONG Kwok-kin 90 (1) Labour Relations LWB(L)107 0054 WONG Kwok-kin 90 (1) Labour Relations LWB(L)108 0109 WONG Kwok-kin 90 (2) Employment Services LWB(L)109 0202 WONG Kwok-kin 90 (4) Employees’ Rights and
Benefits LWB(L)110 0203 WONG Kwok-kin 90 (1) Labour Relations LWB(L)111 0204 WONG Kwok-kin 90 (2) Employment Services LWB(L)112 2681 Helena WONG
Pik-wan 90 (1) Labour Relations
LWB(L)113 2684 Helena WONG Pik-wan
90 (1) Labour Relations
LWB(L)114 2408 CHAN Yuen-han 141 (7) Subvention: Vocational Training Council (Vocational Training)
LWB(L)115 1383 CHIANG Lai-wan 141 (4) Manpower Development LWB(L)116 1396 CHIANG Lai-wan 141 (7) Subvention: Vocational
Training Council (Vocational Training)
LWB(L)117 1403 CHIANG Lai-wan 141 (4) Manpower Development LWB(L)118 0479 Frederick FUNG
Kin-kee 141 (4) Manpower Development
LWB(L)119 0385 Albert HO 141 (7) Subvention: Vocational
Reply Serial No.
Question Serial
No. Name of Member Head Programme Chun-yan Training Council (Vocational
Training) LWB(L)120 2574 KWOK Wai-keung 141 (7) Subvention: Vocational
Training Council (Vocational Training)
LWB(L)121 2575 KWOK Wai-keung 141 (7) Subvention: Vocational Training Council (Vocational Training)
LWB(L)122 2271 Martin LIAO Cheung-kong
141 (4) Manpower Development
LWB(L)123 0343 LO Wai-kwok 141 (4) Manpower Development LWB(L)124 1718 POON Siu-ping 141 (7) Subvention: Vocational
Training Council (Vocational Training)
LWB(L)125 3214 Michael TIEN Puk-sun
141 (4) Manpower Development
LWB(L)126 0205 WONG Kwok-kin 141 (4) Manpower Development LWB(L)127 0383 Albert HO
Chun-yan 173 (1) Student Assistance
Scheme LWB(L)128 2182 LEUNG
Kwok-hung 173 (1) Student Assistance
Scheme LWB(L)129 1921 Kenneth LEUNG 173 (1) Student Assistance
Scheme LWB(L)130 3645 Fernando
CHEUNG Chiu-hung
90 (2) Employment Services
LWB(L)131 3677 Fernando CHEUNG Chiu-hung
90 (3) Safety and Health at Work
LWB(L)132 3679 Fernando CHEUNG Chiu-hung
90 (3) Safety and Health at Work
LWB(L)133 3680 Fernando CHEUNG Chiu-hung
90 (3) Safety and Health at Work
LWB(L)134 5967 Fernando CHEUNG Chiu-hung
90 (1) Labour Relations
LWB(L)135 5982 Fernando CHEUNG Chiu-hung
90 (2) Employment Services
LWB(L)136 6025 Fernando CHEUNG Chiu-hung
90 (2) Employment Services
LWB(L)137 6751 Fernando CHEUNG Chiu-hung
90 (2) Employment Services
Reply Serial No.
Question Serial
No. Name of Member Head Programme LWB(L)138 6758 Fernando
CHEUNG Chiu-hung
90 (2) Employment Services
LWB(L)139 6764 Fernando CHEUNG Chiu-hung
90 (2) Employment Services
LWB(L)140 7072 Fernando CHEUNG Chiu-hung
90 (2) Employment Services
LWB(L)141 7074 Fernando CHEUNG Chiu-hung
90 (2) Employment Services
LWB(L)142 7171 Fernando CHEUNG Chiu-hung
90 (4) Employees’ Rights and Benefits
LWB(L)143 5576 CHEUNG Kwok-che
90 (2) Employment Services
LWB(L)144 6522 CHEUNG Kwok-che
90 (4) Employees’ Rights and Benefits
LWB(L)145 3978 Albert HO Chun-yan
90 (2) Employment Services
LWB(L)146 7202 Emily LAU Wai-hing
90 (4) Employees’ Rights and Benefits
LWB(L)147 7203 Emily LAU Wai-hing
90 (4) Employees’ Rights and Benefits
LWB(L)148 7204 Emily LAU Wai-hing
90 (4) Employees’ Rights and Benefits
LWB(L)149 7205 Emily LAU Wai-hing
90 (4) Employees’ Rights and Benefits
LWB(L)150 4449 LEUNG Kwok-hung
90 (3) Safety and Health at Work
LWB(L)151 4450 LEUNG Kwok-hung
90 (4) Employees’ Rights and Benefits
LWB(L)152 4451 LEUNG Kwok-hung
90 (4) Employees’ Rights and Benefits
LWB(L)153 4452 LEUNG Kwok-hung
90
LWB(L)154 4453 LEUNG Kwok-hung
90 (3) Safety and Health at Work
LWB(L)155 4755 MA Fung-kwok 90 (2) Employment Services LWB(L)156 4756 MA Fung-kwok 90 (2) Employment Services LWB(L)157 4110 WONG Kwok-hing 90 LWB(L)158 4111 WONG Kwok-hing 90 LWB(L)159 4112 WONG Kwok-hing 90 LWB(L)160 7214 WONG Kwok-kin 90 (1) Labour Relations
(2) Employment Services
Reply Serial No.
Question Serial
No. Name of Member Head Programme LWB(L)161 6778 Fernando
CHEUNG Chiu-hung
141
LWB(L)162 6782 Fernando CHEUNG Chiu-hung
141
LWB(L)163 3472 Charles Peter MOK 141 (4) Manpower Development LWB(L)164 4633 James TIEN
Pei-chun 141 (4) Manpower Development
S e s s i o n 2 1 L W B ( L ) - P a g e 1
Examination of Estimates of Expenditure 2016-17 Reply Serial No.
LWB(L)001 CONTROLLING OFFICER’S REPLY (Question Serial No. 1515)
Head: (90) Labour Department
Subhead (No. & title): ( )
Programme: (3) Safety and Health at Work
Controlling Officer: Commissioner for Labour (Donald TONG)
Director of Bureau: Secretary for Labour and Welfare Question: Under Programme (3) Safety and Health at Work, the indicators for 2015 show that the number of investigations of accidents at workplaces was 15 046; the number of warnings issued by occupational safety officers was 32 812; the number of suspension/improvement notices issued was 3 145. The above 3 figures were higher than those in 2014. In this connection, has the Government assessed whether the present situation of suspected breaches of the relevant legislation at workplaces is more serious than the previous year? In this regard, what is the establishment of civil servants (including occupational safety officers, etc.) responsible for these duties in the coming year? Has assessment been made on the need to substantially increase manpower to enhance the promotion of occupational safety and monitor the compliance of relevant legislation at workplaces? Asked by: Hon CHAN Kin-por (Member Question No. 22) Reply: The number of investigations of accidents at workplaces conducted by the staff of the Labour Department (LD) is subject to the nature of the accidents and the need for evidence collection. The number of suspension/improvement notices and warnings issued will depend on the circumstances and gravity of the breaches found during enforcement operations under the relevant occupational safety and health legislation. The actual number in respect of the above work varies from year to year. Investigations of accidents at workplaces and enforcement of occupational safety and health legislation are integral parts of LD’s ongoing work, and the manpower involved cannot be separately identified. LD will review the staff establishment from time to time, and adjust work priorities and deploy internal resources and manpower when necessary, so as to step up efforts in enforcement and inspections, publicity and promotion as well as education and training.
- End -
S e s s i o n 2 1 L W B ( L ) - P a g e 2
Examination of Estimates of Expenditure 2016-17 Reply Serial No.
LWB(L)002 CONTROLLING OFFICER’S REPLY (Question Serial No. 0544)
Head: (90) Labour Department
Subhead (No. & title): ( )
Programme: (2) Employment Services
Controlling Officer: Commissioner for Labour (Donald TONG)
Director of Bureau: Secretary for Labour and Welfare Question: Regarding the implementation of the Employment Programme for the Middle-aged (EPM), would the Government advise this Committee: (a) of the number of employers and job seekers registered under EPM in each of the past 3
years; and the number of mature persons placed into employment under EPM, with breakdowns by age, gender, educational attainment, industry, occupation, job nature and mode of employment;
(b) of the numbers of persons among those placed into employment whose length of
service in the same post were less than 3 months, 3 to 6 months, more than 6 months to 1 year, more than 1 year to 2 years, and more than 2 years respectively; whether it has conducted any thorough survey to gain a better understanding of the departure of some of the mature persons after a short term of service and the reasons for that; and
(c) whether the Government has any plan to step up the promotional and publicity efforts
in 2016-17 to encourage more employers and mature persons to participate in EPM? If yes, what are the details and expenditure involved? If not, what are the reasons?
Asked by: Hon CHAN Yuen-han (Member Question No. 23) Reply: The information sought is provided as follows: (a) EPM offers employers an allowance for engaging unemployed job seekers aged 40 or
above in full-time or part-time permanent jobs and providing them with on-the-job training. Employers who place vacancies with the Labour Department (LD) are not restricted to consider middle-aged job seekers exclusively, and no prior registration under EPM is required for job seekers as relevant registration can be made by their
S e s s i o n 2 1 L W B ( L ) - P a g e 3
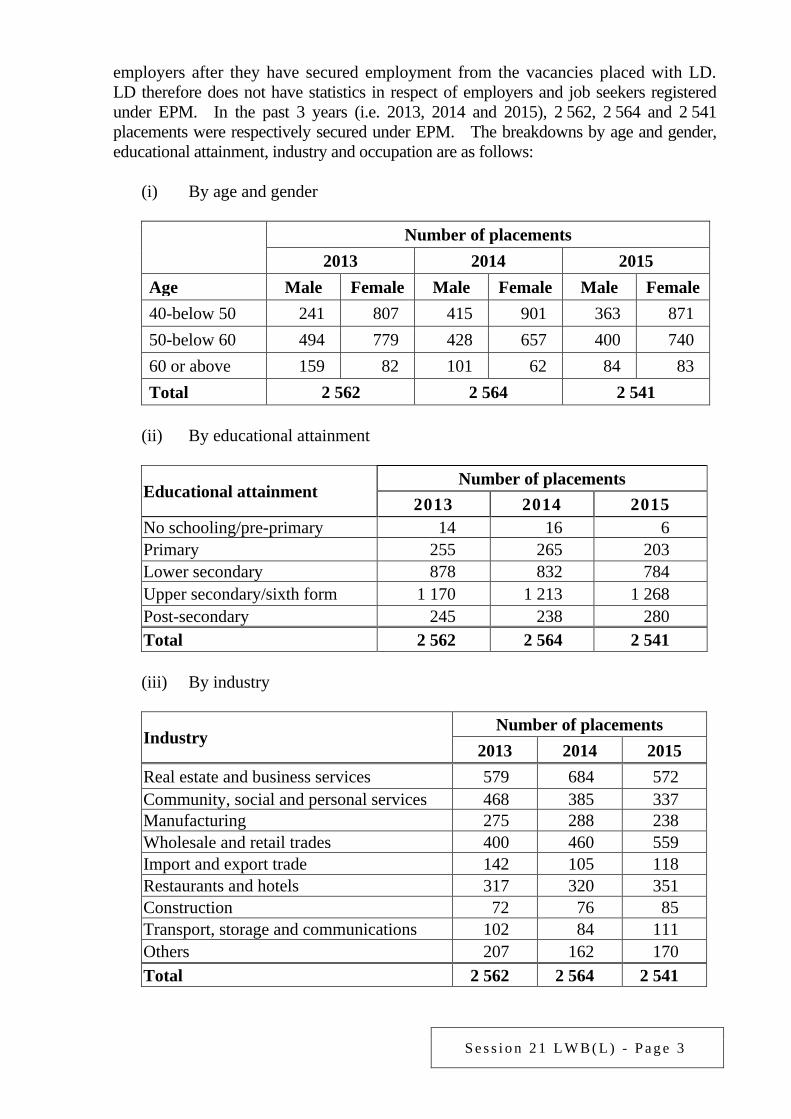
employers after they have secured employment from the vacancies placed with LD. LD therefore does not have statistics in respect of employers and job seekers registered under EPM. In the past 3 years (i.e. 2013, 2014 and 2015), 2 562, 2 564 and 2 541 placements were respectively secured under EPM. The breakdowns by age and gender, educational attainment, industry and occupation are as follows:
(i) By age and gender
Number of placements 2013 2014 2015 Age Male Female Male Female Male Female 40-below 50 241 807 415 901 363 871 50-below 60 494 779 428 657 400 740 60 or above 159 82 101 62 84 83 Total 2 562 2 564 2 541
(ii) By educational attainment
Educational attainment Number of placements
2013 2014 2015 No schooling/pre-primary 14 16 6 Primary 255 265 203 Lower secondary 878 832 784 Upper secondary/sixth form 1 170 1 213 1 268 Post-secondary 245 238 280 Total 2 562 2 564 2 541
(iii) By industry
Industry Number of placements
2013 2014 2015 Real estate and business services 579 684 572 Community, social and personal services 468 385 337 Manufacturing 275 288 238 Wholesale and retail trades 400 460 559 Import and export trade 142 105 118 Restaurants and hotels 317 320 351 Construction 72 76 85 Transport, storage and communications 102 84 111 Others 207 162 170 Total 2 562 2 564 2 541
S e s s i o n 2 1 L W B ( L ) - P a g e 4
(iv) By occupation
Occupation Number of placements
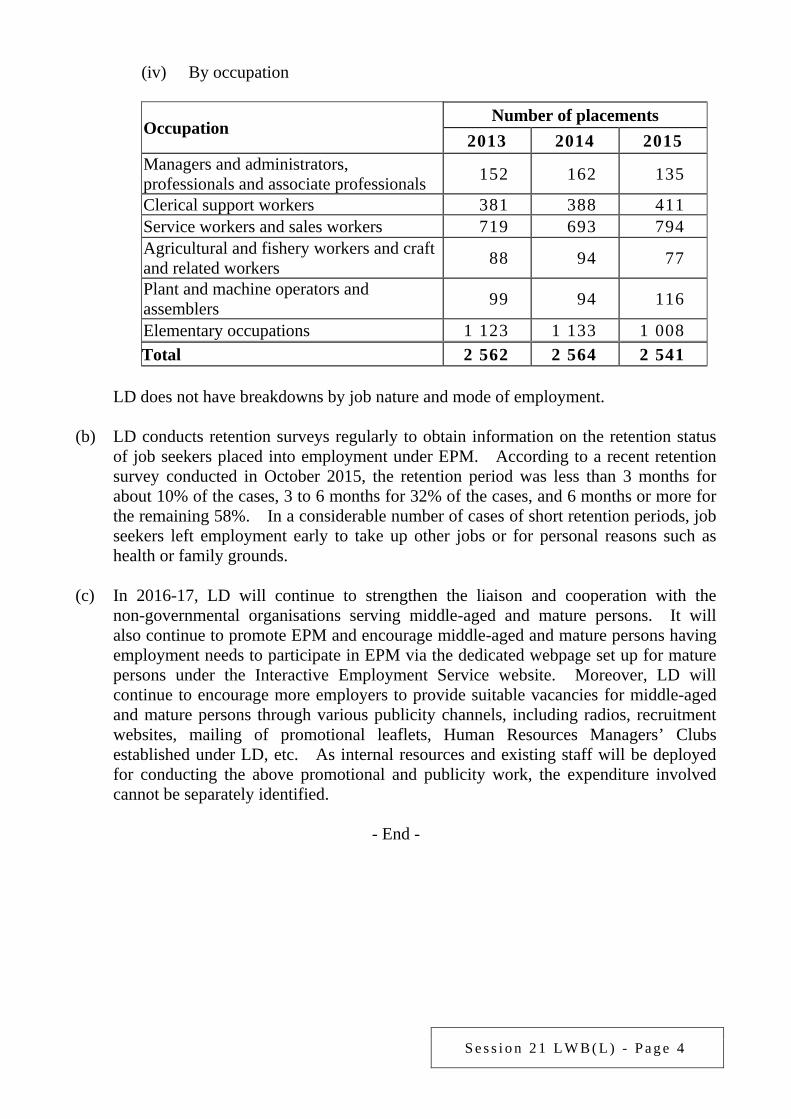
2013 2014 2015 Managers and administrators, professionals and associate professionals 152 162 135
Clerical support workers 381 388 411 Service workers and sales workers 719 693 794 Agricultural and fishery workers and craft and related workers 88 94 77
Plant and machine operators and assemblers 99 94 116
Elementary occupations 1 123 1 133 1 008 Total 2 562 2 564 2 541
LD does not have breakdowns by job nature and mode of employment. (b) LD conducts retention surveys regularly to obtain information on the retention status
of job seekers placed into employment under EPM. According to a recent retention survey conducted in October 2015, the retention period was less than 3 months for about 10% of the cases, 3 to 6 months for 32% of the cases, and 6 months or more for the remaining 58%. In a considerable number of cases of short retention periods, job seekers left employment early to take up other jobs or for personal reasons such as health or family grounds.
(c) In 2016-17, LD will continue to strengthen the liaison and cooperation with the
non-governmental organisations serving middle-aged and mature persons. It will also continue to promote EPM and encourage middle-aged and mature persons having employment needs to participate in EPM via the dedicated webpage set up for mature persons under the Interactive Employment Service website. Moreover, LD will continue to encourage more employers to provide suitable vacancies for middle-aged and mature persons through various publicity channels, including radios, recruitment websites, mailing of promotional leaflets, Human Resources Managers’ Clubs established under LD, etc. As internal resources and existing staff will be deployed for conducting the above promotional and publicity work, the expenditure involved cannot be separately identified.
- End -
S e s s i o n 2 1 L W B ( L ) - P a g e 5
Examination of Estimates of Expenditure 2016-17 Reply Serial No.
LWB(L)003 CONTROLLING OFFICER’S REPLY (Question Serial No. 1664)
Head: (90) Labour Department
Subhead (No. & title): ( )
Programme: (2) Employment Services
Controlling Officer: Commissioner for Labour (Donald TONG)
Director of Bureau: Secretary for Labour and Welfare Question: Regarding the employment situation of ethnic minorities (EMs), would the Government advise this Committee: (a) of the number of EMs employed in Hong Kong so far (with breakdowns by gender,
age, educational attainment, nationality, residential district, industry, occupation, mode of employment and salary level);
(b) of the total number of EM job seekers registered and, of these, the number of
successful placements through the referral services of the Labour Department (LD) in 2015 (with breakdowns by gender, age, educational attainment, nationality, residential district, industry, occupation, mode of employment and salary level); and
(c) whether LD has any plan to review and improve the existing employment support
services provided for EMs in 2016-17, including increasing the number of interpreters and shortening the waiting time for interpretation service, setting up additional special counters in job centres to help EMs find jobs, raising the awareness of EM culture among frontline staff and their competency in handling related work, as well as allocating additional resources for public education and promotion so as to enhance employers’ and the public’s awareness and understanding of the Race Discrimination Ordinance (RDO)? If yes, what are the details? If not, what are the reasons?
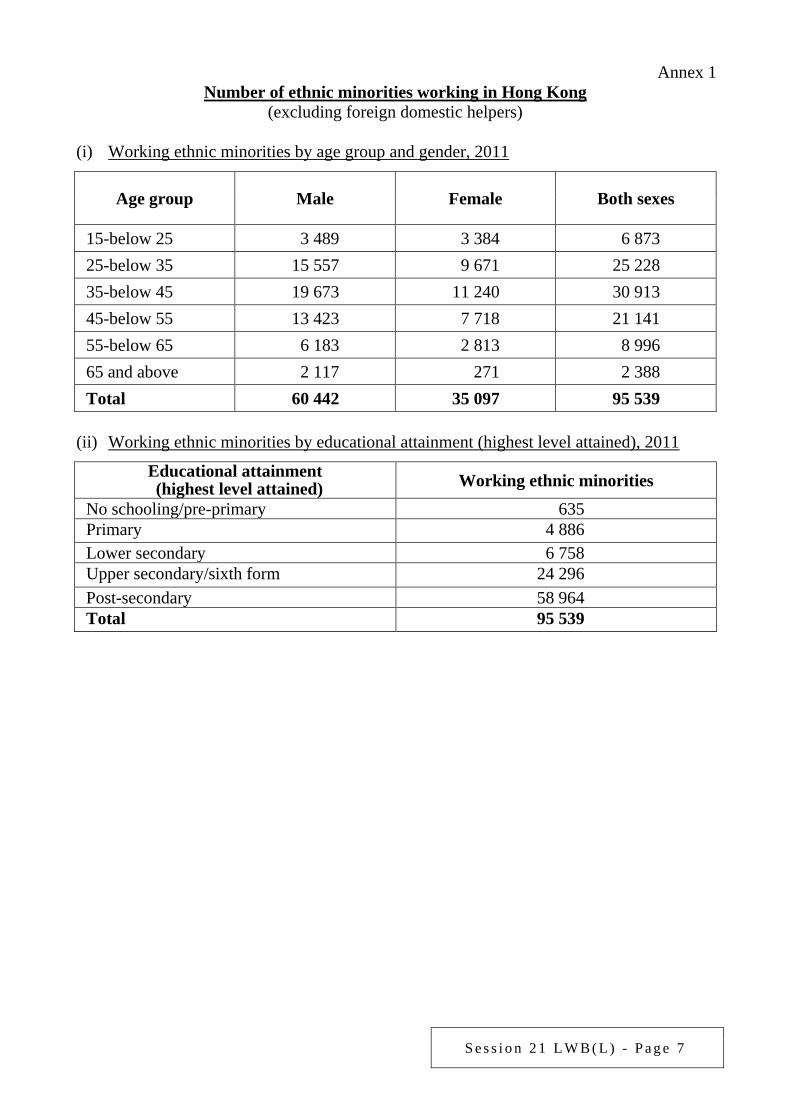
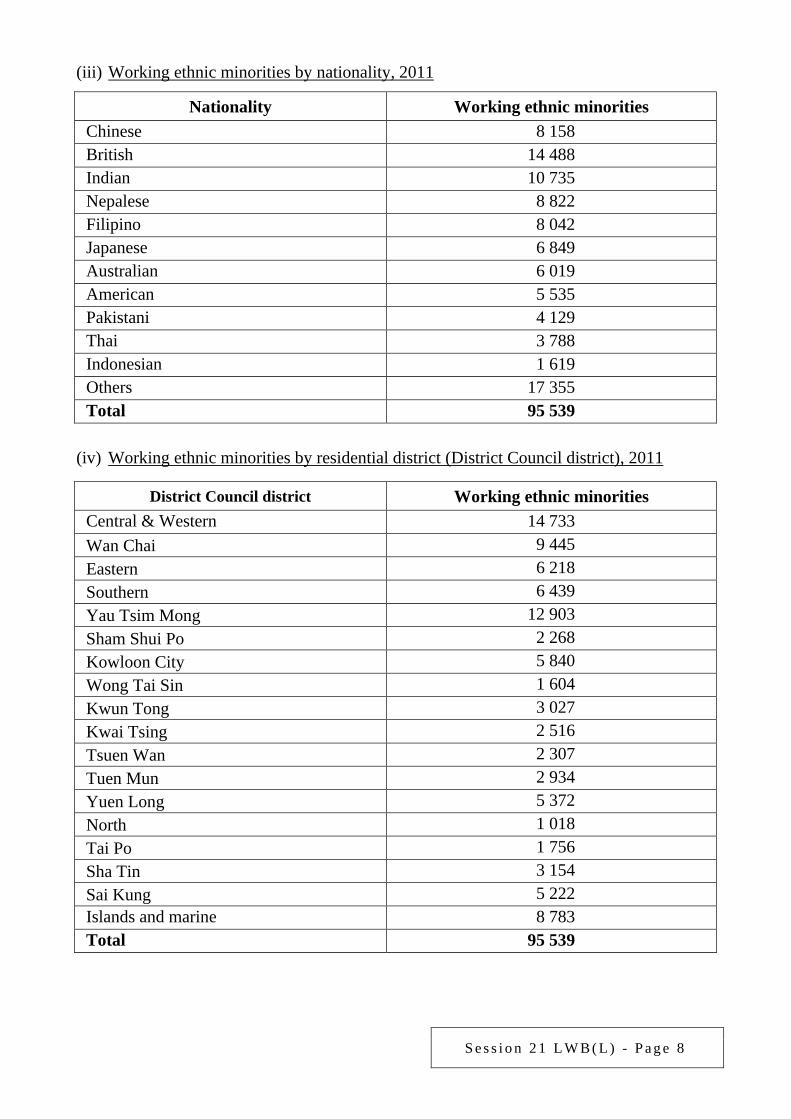
Asked by: Hon CHAN Yuen-han (Member Question No. 24) Reply: The information sought is provided as follows: (a) According to the 2011 Population Census conducted by the Census and Statistics
Department (C&SD), the data of EMs working in Hong Kong (excluding foreign
S e s s i o n 2 1 L W B ( L ) - P a g e 6
domestic helpers) are set out at Annex 1. C&SD does not collect breakdown figures by mode of employment.
(b) In 2015, there were 994 EM job seekers registered with LD for employment services.
Of these, the number of placements secured through LD’s referral services was 75. Job seekers may be placed into employment either through the referral services of LD or by direct application to employers who advertise their vacancies via LD. Currently, around 99% of the vacancies advertised through LD are open for direct application by job seekers. Breakdowns of placements secured for EM job seekers through LD’s referral by gender, age, educational attainment, ethnic origin, residential district, industry, occupation and salary level are at Annex 2. LD does not keep breakdown figures by mode of employment.
(c) In addition to general employment services and facilities, LD has set up special
counters and resource corners in all job centres in various districts to provide EM job seekers with job referral services and employment information. Tailor-made employment briefings are also regularly organised by the centres to help EMs understand the latest employment market situation and improve job search skills.
In 2016-17, LD will continue to make arrangements with non-governmental
organisations (NGOs) to provide telephone simultaneous interpretation service, as necessary, for EM job seekers who do not speak Chinese and English, as well as to provide them with on-the-spot simultaneous interpretation service at large-scale and district-based inclusive job fairs. In addition, LD will continue to employ trainees of the Youth Employment and Training Programme who can communicate in EM languages as employment services ambassadors (ESAs) in job centres or industry-based recruitment centres under the Employment Services Ambassador Programme for Ethnic Minorities, so as to strengthen the employment services for EMs.
To raise the sensitivity of frontline staff to EM culture, LD will continue to invite
NGOs familiar with their culture to organise talks on EM customs and culture as well as skills in communicating with EMs. Moreover, LD will arrange regular training on anti-discrimination legislation for its staff and procure books on serving EM communities for circulation, in order to enhance staff’s understanding of and skills in rendering services to EMs. Meanwhile, the staff at job centres will also get to know EMs better through collaborating and getting along with ESAs of different ethnic origins continuously in their daily work.
On publicity, education and training in 2016-17, the Equal Opportunities Commission
will continue to promote employers’ and the public’s awareness and understanding of RDO through a series of programmes, including online publicity and roving exhibitions, as well as seminars and training for employers, employees, educational institutions, NGOs and community groups, etc.
S e s s i o n 2 1 L W B ( L ) - P a g e 7
Annex 1 Number of ethnic minorities working in Hong Kong
(excluding foreign domestic helpers)
(i) Working ethnic minorities by age group and gender, 2011
Age group Male Female Both sexes
15-below 25 3 489 3 384 6 873 25-below 35 15 557 9 671 25 228 35-below 45 19 673 11 240 30 913 45-below 55 13 423 7 718 21 141 55-below 65 6 183 2 813 8 996 65 and above 2 117 271 2 388 Total 60 442 35 097 95 539
(ii) Working ethnic minorities by educational attainment (highest level attained), 2011
Educational attainment (highest level attained) Working ethnic minorities
No schooling/pre-primary 635 Primary 4 886 Lower secondary 6 758 Upper secondary/sixth form 24 296 Post-secondary 58 964 Total 95 539
S e s s i o n 2 1 L W B ( L ) - P a g e 8
(iii) Working ethnic minorities by nationality, 2011
Nationality Working ethnic minorities Chinese 8 158 British 14 488 Indian 10 735 Nepalese 8 822 Filipino 8 042 Japanese 6 849 Australian 6 019 American 5 535 Pakistani 4 129 Thai 3 788 Indonesian 1 619 Others 17 355 Total 95 539
(iv) Working ethnic minorities by residential district (District Council district), 2011
District Council district Working ethnic minorities Central & Western 14 733 Wan Chai 9 445 Eastern 6 218 Southern 6 439 Yau Tsim Mong 12 903 Sham Shui Po 2 268 Kowloon City 5 840 Wong Tai Sin 1 604 Kwun Tong 3 027 Kwai Tsing 2 516 Tsuen Wan 2 307 Tuen Mun 2 934 Yuen Long 5 372 North 1 018 Tai Po 1 756 Sha Tin 3 154 Sai Kung 5 222 Islands and marine 8 783 Total 95 539
S e s s i o n 2 1 L W B ( L ) - P a g e 9
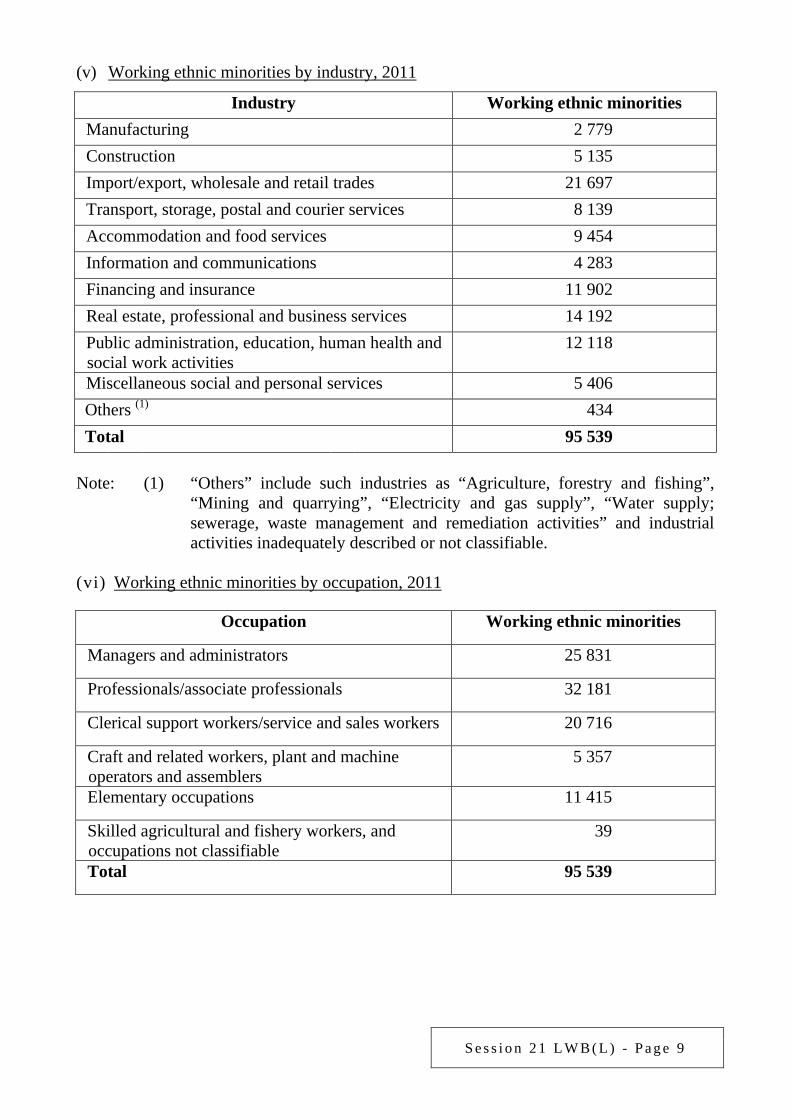
(v) Working ethnic minorities by industry, 2011
Industry Working ethnic minorities Manufacturing 2 779 Construction 5 135 Import/export, wholesale and retail trades 21 697 Transport, storage, postal and courier services 8 139 Accommodation and food services 9 454 Information and communications 4 283 Financing and insurance 11 902 Real estate, professional and business services 14 192 Public administration, education, human health and social work activities
12 118
Miscellaneous social and personal services 5 406 Others (1) 434 Total 95 539
Note: (1) “Others” include such industries as “Agriculture, forestry and fishing”, “Mining and quarrying”, “Electricity and gas supply”, “Water supply; sewerage, waste management and remediation activities” and industrial activities inadequately described or not classifiable.
(vi) Working ethnic minorities by occupation, 2011
Occupation Working ethnic minorities
Managers and administrators 25 831
Professionals/associate professionals 32 181
Clerical support workers/service and sales workers 20 716
Craft and related workers, plant and machine operators and assemblers
5 357
Elementary occupations 11 415
Skilled agricultural and fishery workers, and occupations not classifiable
39
Total 95 539
S e s s i o n 2 1 L W B ( L ) - P a g e 1 0
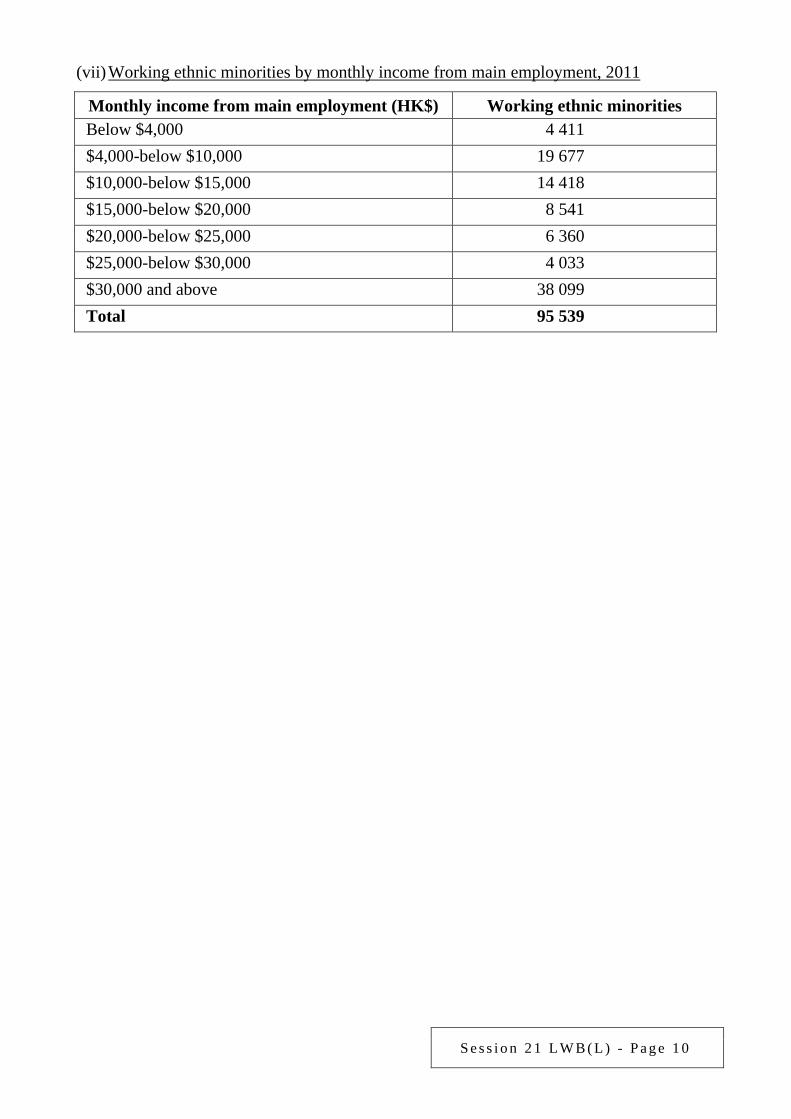
(vii) Working ethnic minorities by monthly income from main employment, 2011
Monthly income from main employment (HK$) Working ethnic minorities Below $4,000 4 411 $4,000-below $10,000 19 677 $10,000-below $15,000 14 418 $15,000-below $20,000 8 541 $20,000-below $25,000 6 360 $25,000-below $30,000 4 033 $30,000 and above 38 099 Total 95 539
S e s s i o n 2 1 L W B ( L ) - P a g e 1 1
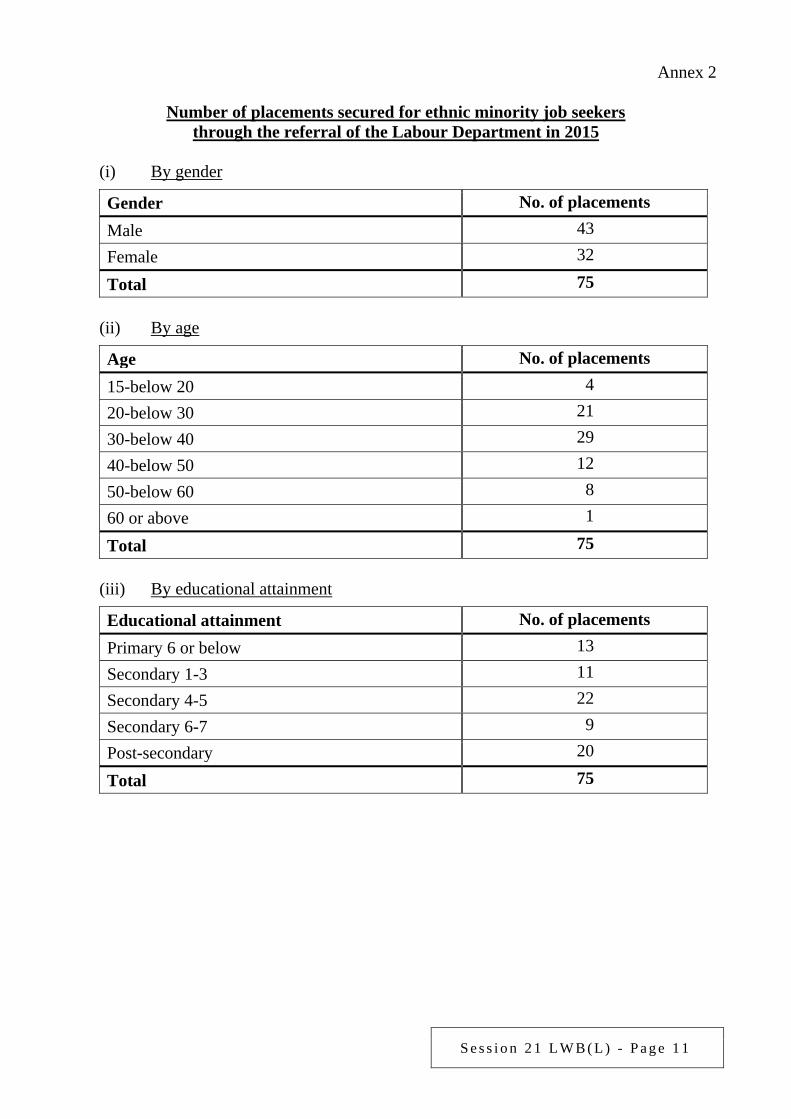
Annex 2
Number of placements secured for ethnic minority job seekers through the referral of the Labour Department in 2015
(i) By gender
Gender No. of placements Male 43
Female 32
Total 75 (ii) By age
Age No. of placements 15-below 20 4 20-below 30 21 30-below 40 29 40-below 50 12
50-below 60 8 60 or above 1
Total 75 (iii) By educational attainment
Educational attainment No. of placements Primary 6 or below 13 Secondary 1-3 11 Secondary 4-5 22
Secondary 6-7 9 Post-secondary 20
Total 75
S e s s i o n 2 1 L W B ( L ) - P a g e 1 2
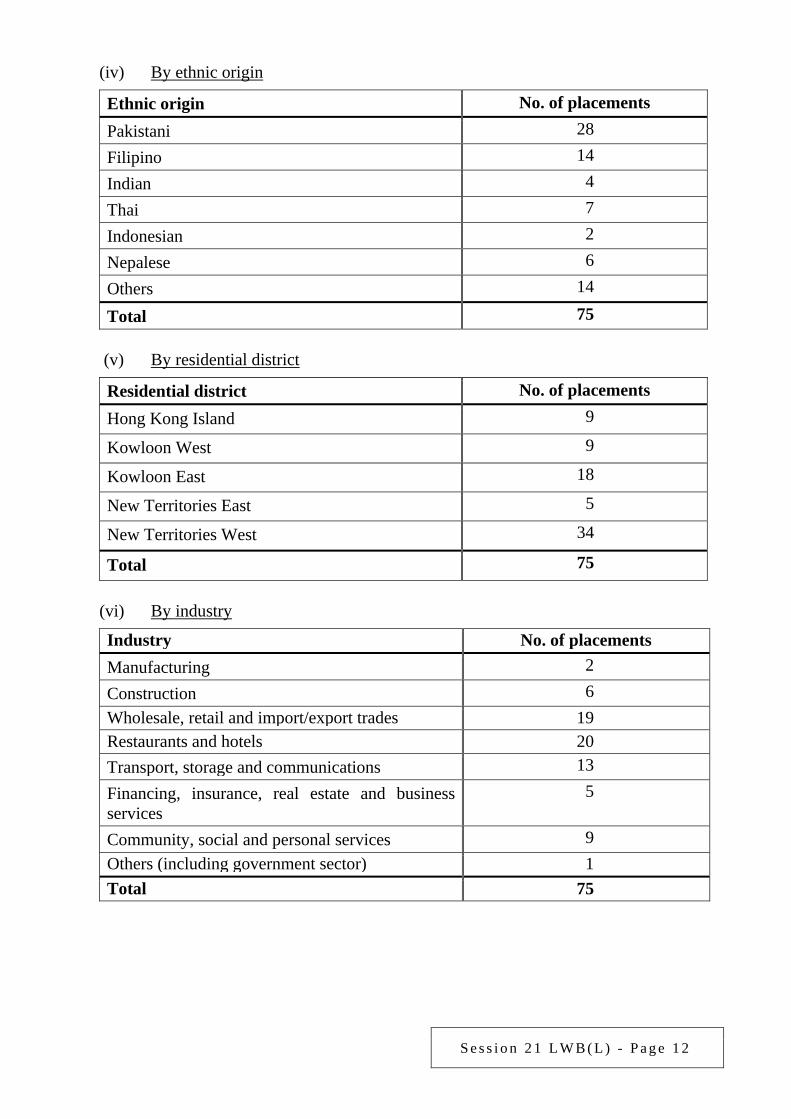
(iv) By ethnic origin Ethnic origin No. of placements Pakistani 28 Filipino 14 Indian 4 Thai 7 Indonesian 2 Nepalese 6
Others 14
Total 75 (v) By residential district
Residential district No. of placements Hong Kong Island 9
Kowloon West 9
Kowloon East 18
New Territories East 5
New Territories West 34
Total 75 (vi) By industry
Industry No. of placements Manufacturing 2 Construction 6 Wholesale, retail and import/export trades 19 Restaurants and hotels 20 Transport, storage and communications 13 Financing, insurance, real estate and business services
5
Community, social and personal services 9 Others (including government sector) 1 Total 75
S e s s i o n 2 1 L W B ( L ) - P a g e 1 3
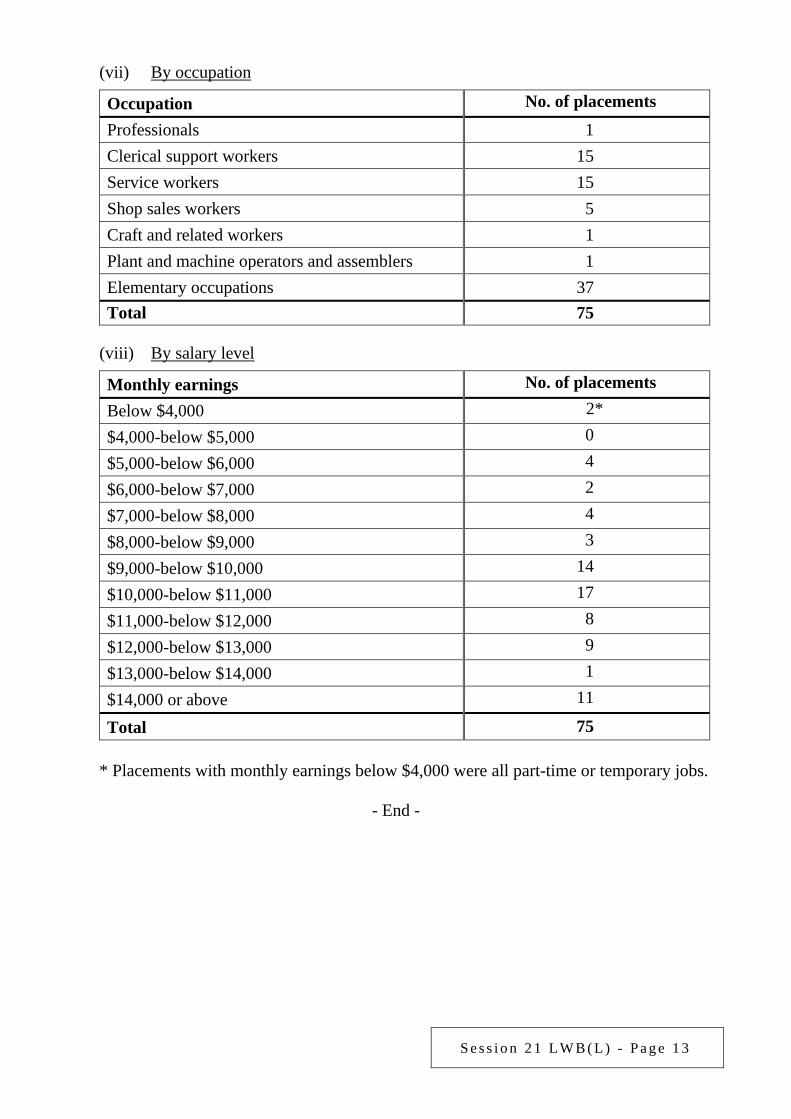
(vii) By occupation Occupation No. of placements Professionals 1 Clerical support workers 15 Service workers 15 Shop sales workers 5 Craft and related workers 1 Plant and machine operators and assemblers 1 Elementary occupations 37 Total 75
(viii) By salary level
Monthly earnings No. of placements Below $4,000 2* $4,000-below $5,000 0 $5,000-below $6,000 4 $6,000-below $7,000 2 $7,000-below $8,000 4 $8,000-below $9,000 3
$9,000-below $10,000 14 $10,000-below $11,000 17 $11,000-below $12,000 8 $12,000-below $13,000 9 $13,000-below $14,000 1 $14,000 or above 11
Total 75 * Placements with monthly earnings below $4,000 were all part-time or temporary jobs.
- End -
S e s s i o n 2 1 L W B ( L ) - P a g e 1 4
Examination of Estimates of Expenditure 2016-17 Reply Serial No.
LWB(L)004 CONTROLLING OFFICER’S REPLY (Question Serial No. 2407)
Head: (90) Labour Department
Subhead (No. & title): ( )
Programme: (1) Labour Relations (2) Employment Services (4) Employees’ Rights and Benefits
Controlling Officer: Commissioner for Labour (Donald TONG)
Director of Bureau: Secretary for Labour and Welfare Question: Regarding women employment, would the Government provide the following information: (a) What were the specific work and expenditure involved to unleash the working
potential of women in 2015-16? (b) How much funding has been earmarked for promoting women employment in
2016-17? (c) Does the Government have any plan to review the outdated Employment Ordinance to
encourage more women to enter the labour market, such as entitling pregnant employees to full-pay maternity leave and extended statutory maternity leave, implementing Standard Working Hours, conducting annual review of the Statutory Minimum Wage (SMW) rate and plugging legislative loopholes to protect female employees from exploitation in casual jobs? If yes, what are the details and the estimated timetable? If not, what are the reasons?
Asked by: Hon CHAN Yuen-han (Member Question No. 49) Reply: The information sought is provided as follows: (a)&(b) To remove the barriers for women to enter or stay in employment, the Government
launched measures in 2015-16 to enhance child care services, including increasing, by phases, the provision of about 5 000 Extended Hours Service (EHS) places at aided child care centres (CCCs) and kindergarten-cum-CCCs in districts with high demand (1 200 of such places were provided in 2015-16). The
S e s s i o n 2 1 L W B ( L ) - P a g e 1 5
measure involved an estimated full-year expenditure of about $127 million. From 2015-16 onwards, the Government has also provided resources for aided standalone CCCs and service units providing EHS and Occasional Child Care Service to enhance supervisory and administrative support. The measure involved an estimated full-year expenditure of about $5.6 million.
Besides, to reinforce family support between generations and enhance child care to
support women in fulfilling work and family commitments, the Government has also launched a 2-year pilot project on Child Care Training for Grandparents in March 2016. The pilot project involves an expenditure of about $3.3 million, which will be funded by the Lotteries Fund.
To support women employment, the Employees Retraining Board (ERB) offered
on a pilot basis the Modular Certificates Accumulation Scheme in 2015-16 to allow trainees who could not enrol in the Foundation Certificate in Post-natal Care Worker Training on a full-time basis to flexibly arrange their time for further studies and acquire recognised qualifications. ERB also introduced a pilot First-Hire-Then-Train Scheme to assist unemployed persons aged 40 or above (mainly home-makers) in securing employment as care workers for residential care homes for the elderly. Moreover, women may enrol in over 700 training courses in accordance with their own aspirations, interests and training needs.
In 2016-17, ERB will continue to organise courses under the Modular Certificates
Accumulation Scheme to facilitate trainees to flexibly arrange their time for study and obtain graduation certificates with qualification equivalent to corresponding full-time courses. ERB will also explore the extension of the pilot First-Hire-Then-Train Scheme to cover other training courses with market demand. In addition, to support new arrivals (mainly women) to undertake part-time employment, ERB will put in place a part-time job referral platform under the Smart Starter Pilot Scheme to provide free referral to part-time non-home related job vacancies and follow-up services for new arrivals who have completed courses offered by ERB.
In 2015-16, the Labour and Welfare Bureau (LWB) earmarked a funding of $2
million to the Women’s Commission (WoC) for launching the Funding Scheme for Women’s Development (Funding Scheme) under the theme of “Women’s Employment”. Under the Funding Scheme, 18 District Councils and various women’s groups may implement various programmes relating to women employment. In 2015-16, funding was provided to 54 projects under the Funding Scheme. In 2016-17, LWB will continue to provide funding to WoC for implementation of the Funding Scheme.
In 2015-16, the Labour Department (LD) provided comprehensive and free
employment services for job seekers, including women, through a network of 13 job centres, 3 industry-based recruitment centres, the Telephone Employment Service Hotline, the Interactive Employment Service (iES) website, and numerous vacancy search terminals installed at various locations across the territory. All job centres provide personalised employment advisory service. Job seekers may
S e s s i o n 2 1 L W B ( L ) - P a g e 1 6
meet the employment officers in job centres to obtain employment market information and job search advice, and join LD’s employment programmes with the assistance of employment officers to enhance their employability.
To meet the wishes of some job seekers (especially women) to find part-time jobs
to release time for fulfilment of their family or other commitments, LD has specially set up a dedicated webpage on part-time vacancies under the iES website and organised thematic part-time job fairs in job centres since May 2015, in order to facilitate job seekers interested in part-time employment, including women, to search for suitable vacancies.
LD promoted family-friendly employment practices (FFEP) to the community in
2015-16 through a wide range of publicity channels and various educational and promotional activities, including publications, large-scale seminars, roving exhibitions, newspaper feature articles, periodicals of major employers’ associations and trade union federations, public transport network as well as regular meetings and exchanges with business executives and human resources managers.
In 2016-17, LD will continue to assist job seekers, women in particular, who wish
to work part-time in securing employment. LD will also continue to widely promote FFEP among the public and encourage employers to help employees, including women, achieve a balance between work and family life through various channels, a range of educational and promotional activities and the production of a new set of television and radio Announcements in the Public Interest.
As the expenditure involved in ERB’s work mentioned above is absorbed within
its operating cost, and the promotion of women employment is an integral part of LD’s work, the expenditure involved cannot be separately identified.
(c) The Government has reviewed labour legislation from time to time so as to
improve employees’ rights and benefits progressively, having regard to Hong Kong’s social changes and pace of economic development, and taking into account the need to strike a reasonable balance between the interests of employers and employees. For example, over the past few years, the Government has implemented SMW, criminalised defaults on payment of awards of the Labour Tribunal or Minor Employment Claims Adjudication Board, and implemented statutory paternity leave for men. The Government will continue to conduct timely reviews of labour legislation to improve employees’ rights and benefits.
- End -
S e s s i o n 2 1 L W B ( L ) - P a g e 1 7
Examination of Estimates of Expenditure 2016-17 Reply Serial No.
LWB(L)005 CONTROLLING OFFICER’S REPLY (Question Serial No. 3038)
Head: (90) Labour Department
Subhead (No. & title): (700) General non-recurrent
Programme: (2) Employment Services
Controlling Officer: Commissioner for Labour (Donald TONG)
Director of Bureau: Secretary for Labour and Welfare Question: Regarding the Work Incentive Transport Subsidy (WITS) Scheme, would the Government provide the following information: (a) the respective numbers of individual-based applications and household-based
applications since the implementation of the Scheme and, among which, the number of successful applications and its percentage share in the total number of applications (with breakdowns by the applicant’s gender, age, household size, residential district, industry, monthly wage level and rate of subsidy granted);
(b) the number of rejected applications since the implementation of the Scheme (with a
breakdown by reason for rejection) and, among which, the respective numbers of individual-based applications and household-based applications; and
(c) whether the Government has any plan to increase the level of subsidy rate to further
alleviate the burden of travelling expenses incurred in commuting to and from work on the grassroots in 2016-17? If yes, what are the details and additional expenditure involved? If not, what are the reasons?
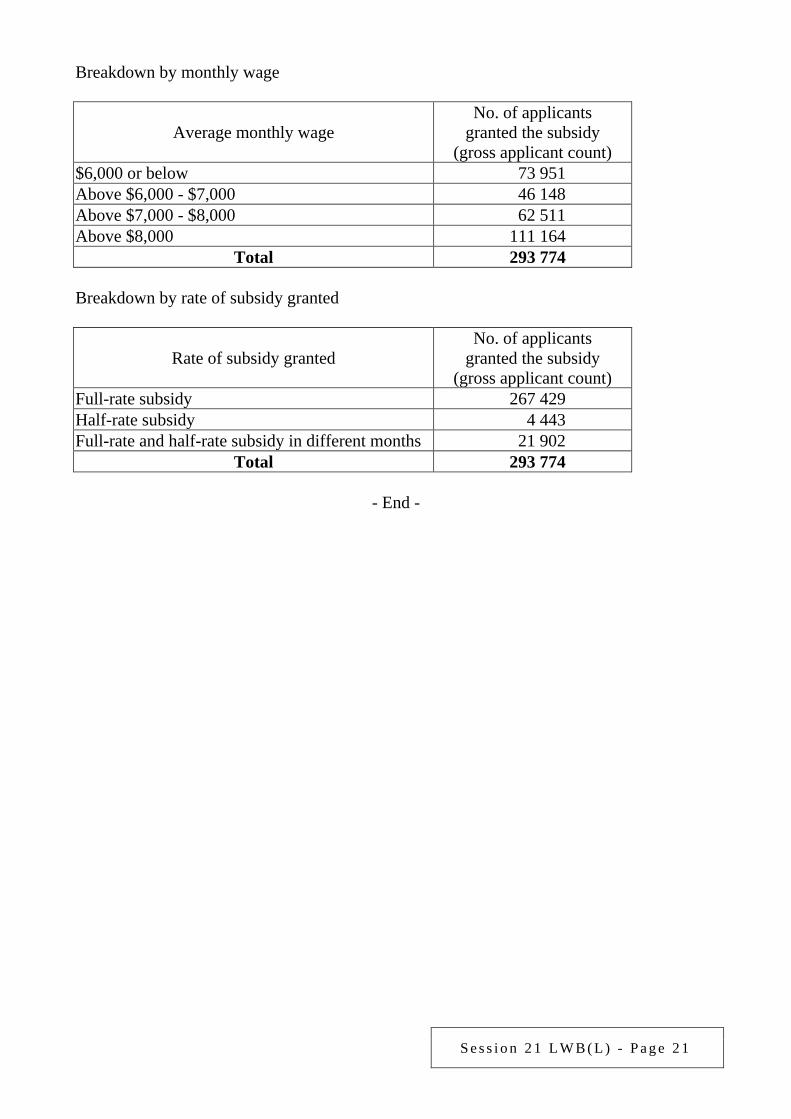
Asked by: Hon CHAN Yuen-han (Member Question No. 48) Reply: The information sought is provided as follows: (a) As at end-February 2016, the WITS Scheme received a total of 320 116 applications,
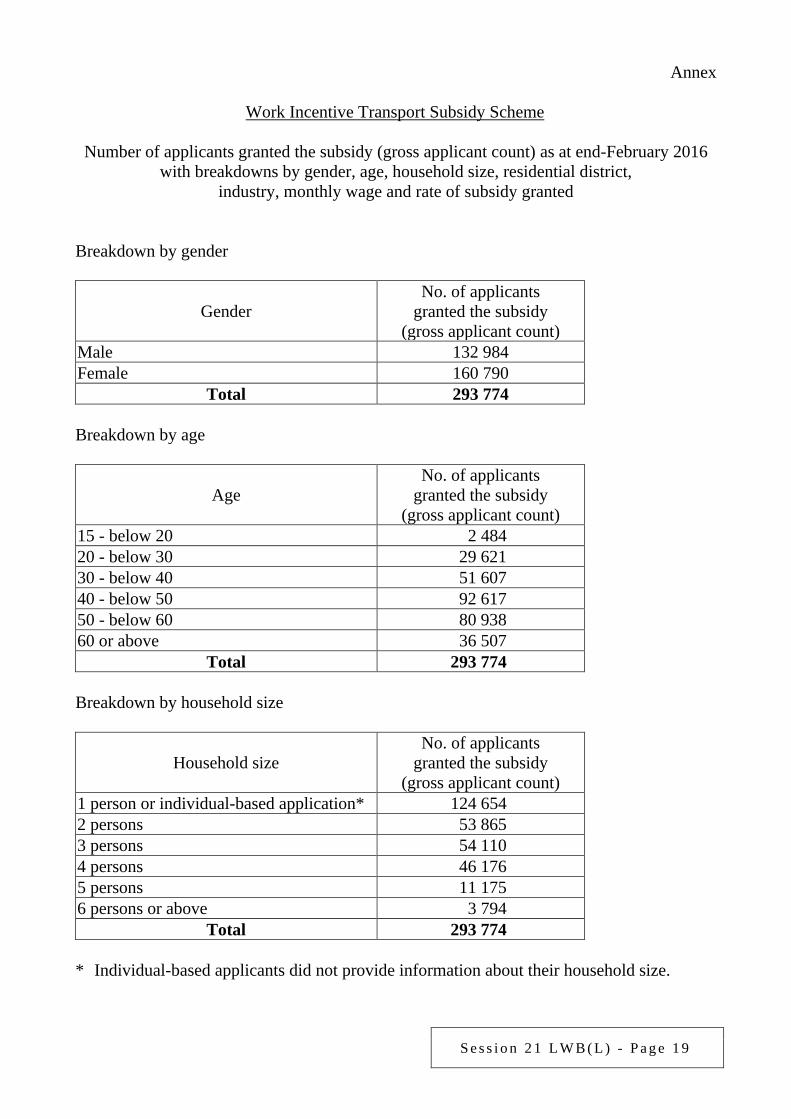
including 131 791 individual-based applications and 188 325 household-based applications. The Labour Department (LD) has completed processing of 312 453 applications. Of these, 278 333 applications involving a gross applicant count of 293 774 were granted the subsidy, representing 89% of the applications with
S e s s i o n 2 1 L W B ( L ) - P a g e 1 8
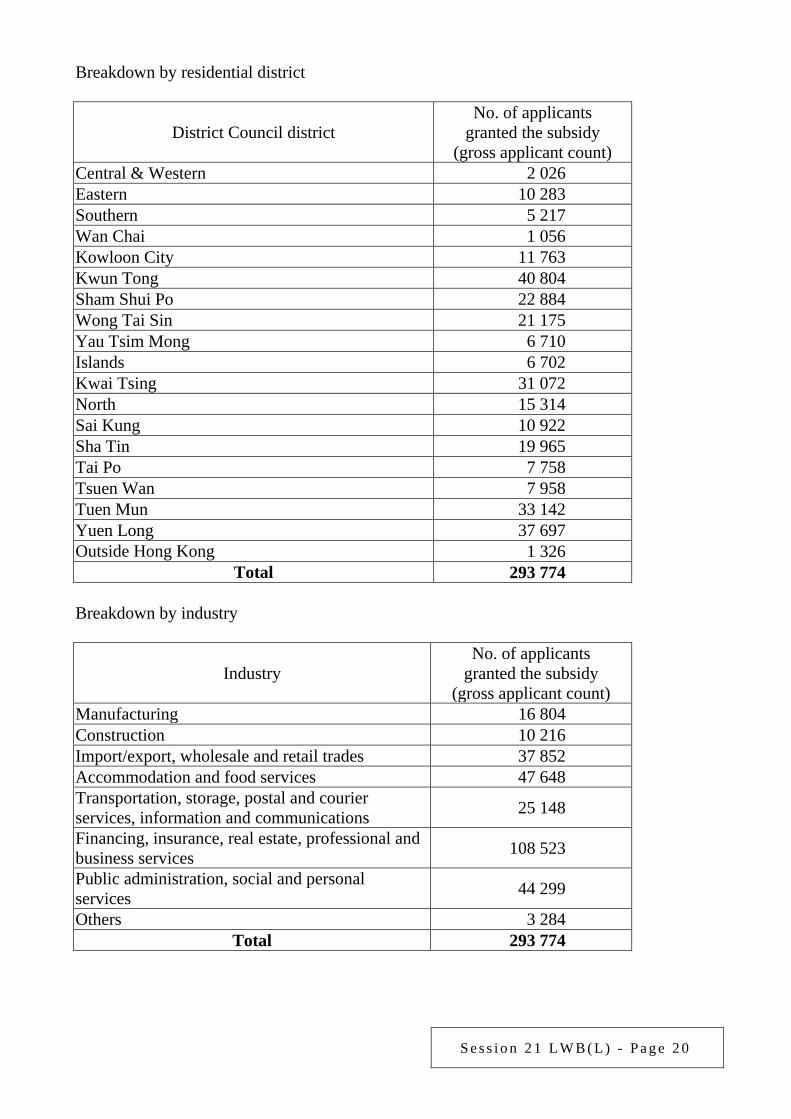
processing completed. Breakdowns of the number of applicants who were granted the subsidy (gross applicant count) by gender, age, household size, residential district, industry, monthly wage and rate of subsidy granted are set out at Annex.
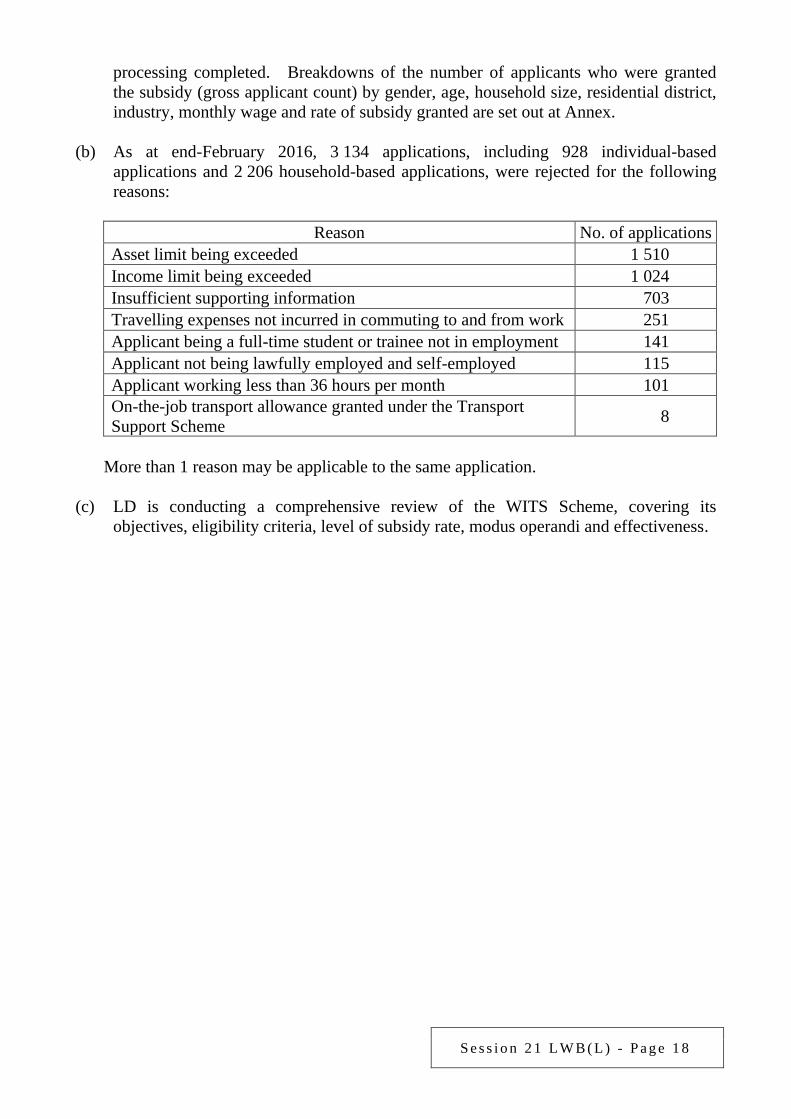
(b) As at end-February 2016, 3 134 applications, including 928 individual-based
applications and 2 206 household-based applications, were rejected for the following reasons:
Reason No. of applications
Asset limit being exceeded 1 510 Income limit being exceeded 1 024 Insufficient supporting information 703 Travelling expenses not incurred in commuting to and from work 251 Applicant being a full-time student or trainee not in employment 141 Applicant not being lawfully employed and self-employed 115 Applicant working less than 36 hours per month 101 On-the-job transport allowance granted under the Transport Support Scheme 8
More than 1 reason may be applicable to the same application. (c) LD is conducting a comprehensive review of the WITS Scheme, covering its
objectives, eligibility criteria, level of subsidy rate, modus operandi and effectiveness.
S e s s i o n 2 1 L W B ( L ) - P a g e 1 9
Annex
Work Incentive Transport Subsidy Scheme
Number of applicants granted the subsidy (gross applicant count) as at end-February 2016 with breakdowns by gender, age, household size, residential district,
industry, monthly wage and rate of subsidy granted Breakdown by gender
Gender No. of applicants
granted the subsidy (gross applicant count)
Male 132 984 Female 160 790
Total 293 774 Breakdown by age
Age No. of applicants
granted the subsidy (gross applicant count)
15 - below 20 2 484 20 - below 30 29 621 30 - below 40 51 607 40 - below 50 92 617 50 - below 60 80 938 60 or above 36 507
Total 293 774 Breakdown by household size
Household size No. of applicants
granted the subsidy (gross applicant count)
1 person or individual-based application* 124 654 2 persons 53 865 3 persons 54 110 4 persons 46 176 5 persons 11 175 6 persons or above 3 794
Total 293 774 * Individual-based applicants did not provide information about their household size.
S e s s i o n 2 1 L W B ( L ) - P a g e 2 0
Breakdown by residential district
District Council district No. of applicants
granted the subsidy (gross applicant count)
Central & Western 2 026 Eastern 10 283 Southern 5 217 Wan Chai 1 056 Kowloon City 11 763 Kwun Tong 40 804 Sham Shui Po 22 884 Wong Tai Sin 21 175 Yau Tsim Mong 6 710 Islands 6 702 Kwai Tsing 31 072 North 15 314 Sai Kung 10 922 Sha Tin 19 965 Tai Po 7 758 Tsuen Wan 7 958 Tuen Mun 33 142 Yuen Long 37 697 Outside Hong Kong 1 326
Total 293 774 Breakdown by industry
Industry No. of applicants
granted the subsidy (gross applicant count)
Manufacturing 16 804 Construction 10 216 Import/export, wholesale and retail trades 37 852 Accommodation and food services 47 648 Transportation, storage, postal and courier services, information and communications 25 148
Financing, insurance, real estate, professional and business services 108 523
Public administration, social and personal services 44 299
Others 3 284 Total 293 774
S e s s i o n 2 1 L W B ( L ) - P a g e 2 1
Breakdown by monthly wage
Average monthly wage No. of applicants
granted the subsidy (gross applicant count)
$6,000 or below 73 951 Above $6,000 - $7,000 46 148 Above $7,000 - $8,000 62 511 Above $8,000 111 164
Total 293 774 Breakdown by rate of subsidy granted
Rate of subsidy granted No. of applicants
granted the subsidy (gross applicant count)
Full-rate subsidy 267 429 Half-rate subsidy 4 443 Full-rate and half-rate subsidy in different months 21 902
Total 293 774
- End -
S e s s i o n 2 1 L W B ( L ) - P a g e 2 2
Examination of Estimates of Expenditure 2016-17 Reply Serial No.
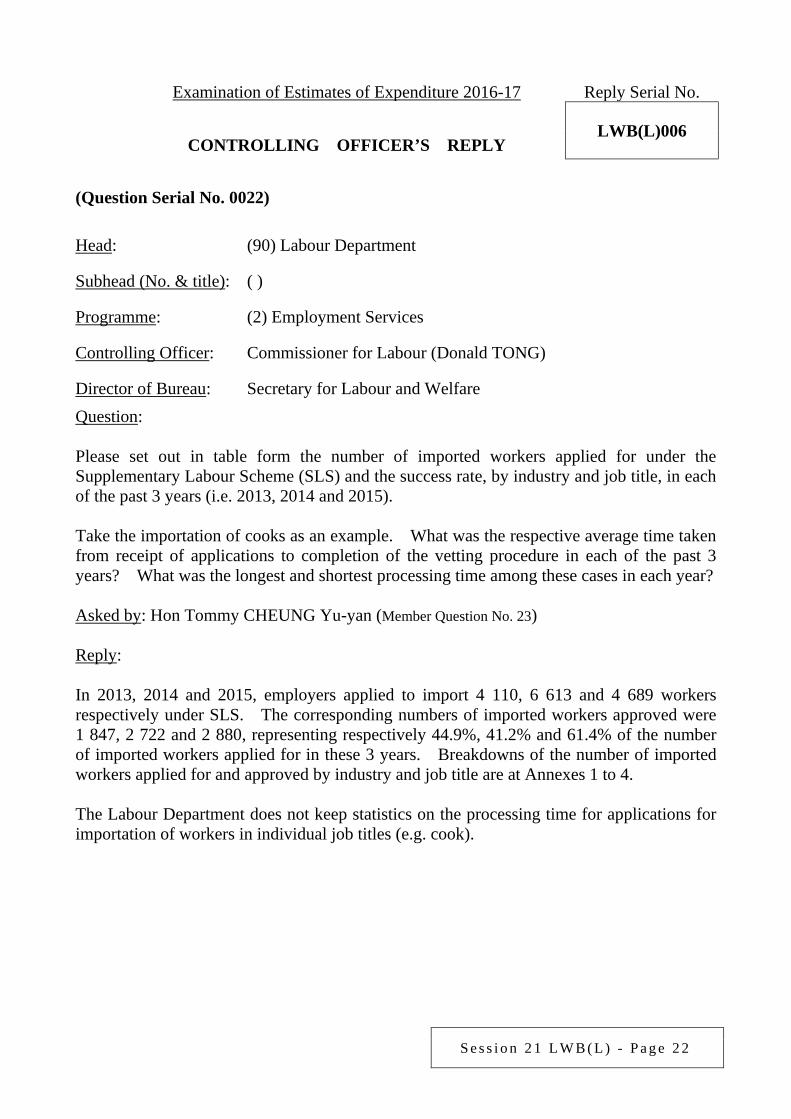
LWB(L)006 CONTROLLING OFFICER’S REPLY (Question Serial No. 0022)
Head: (90) Labour Department
Subhead (No. & title): ( )
Programme: (2) Employment Services
Controlling Officer: Commissioner for Labour (Donald TONG)
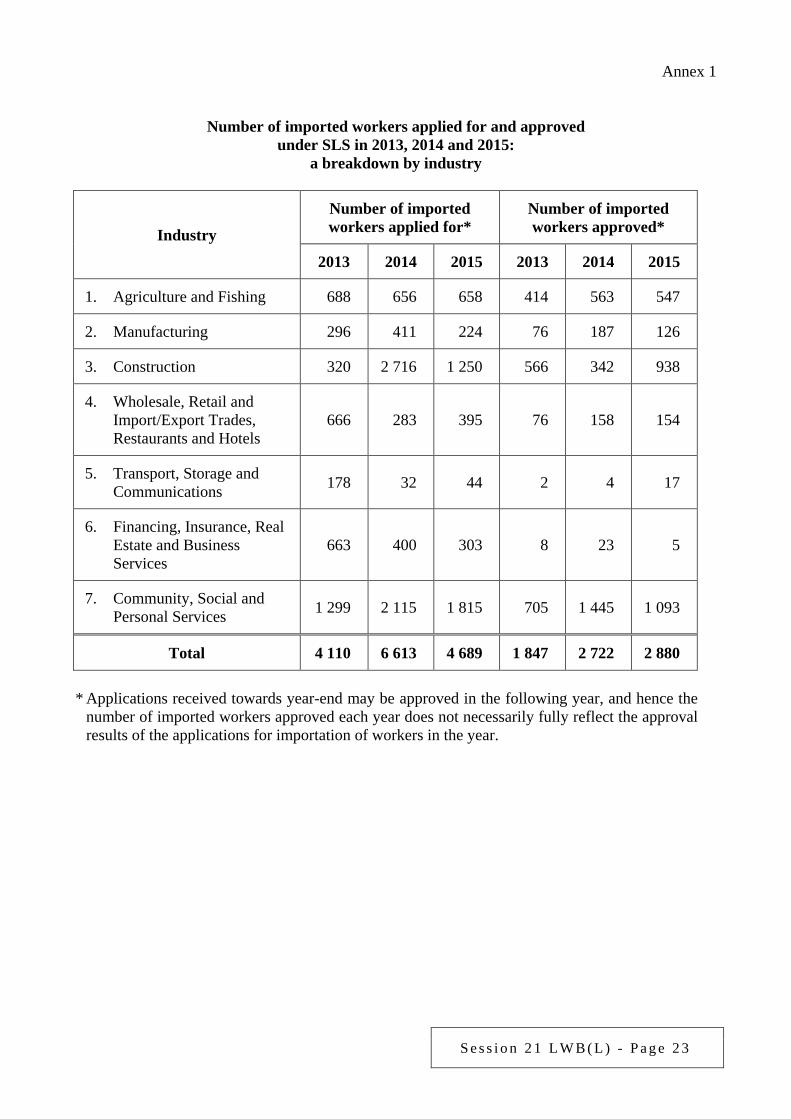
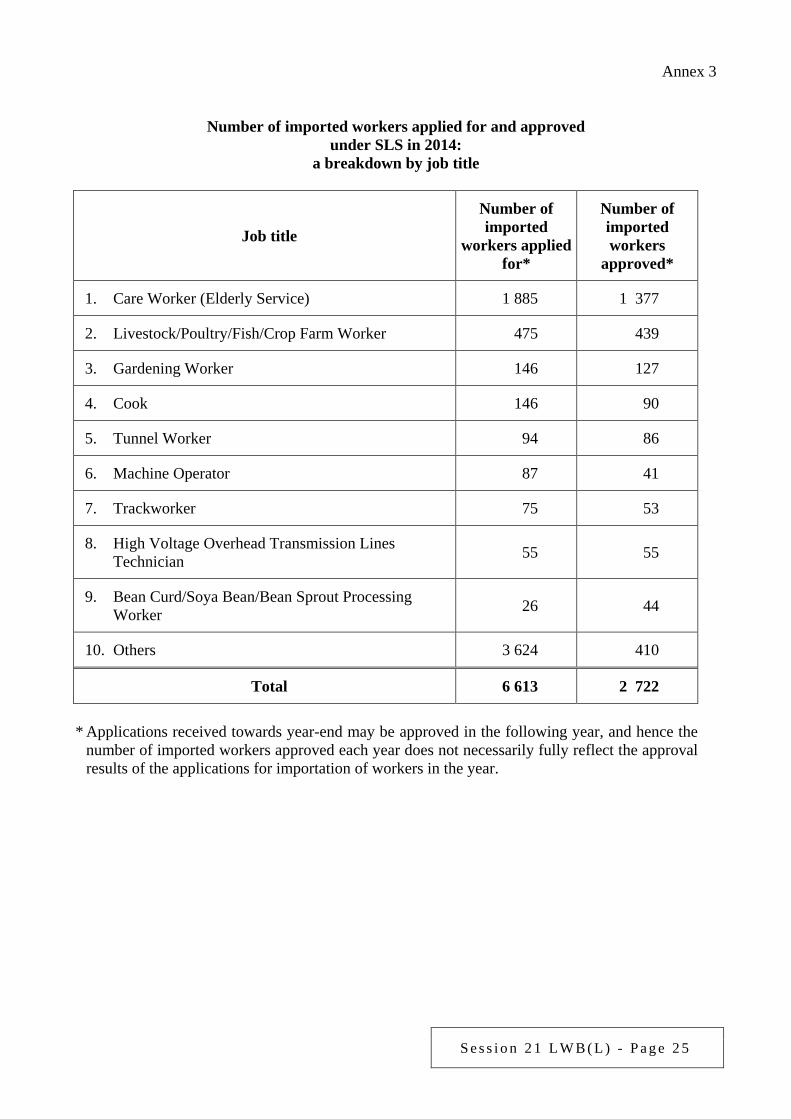
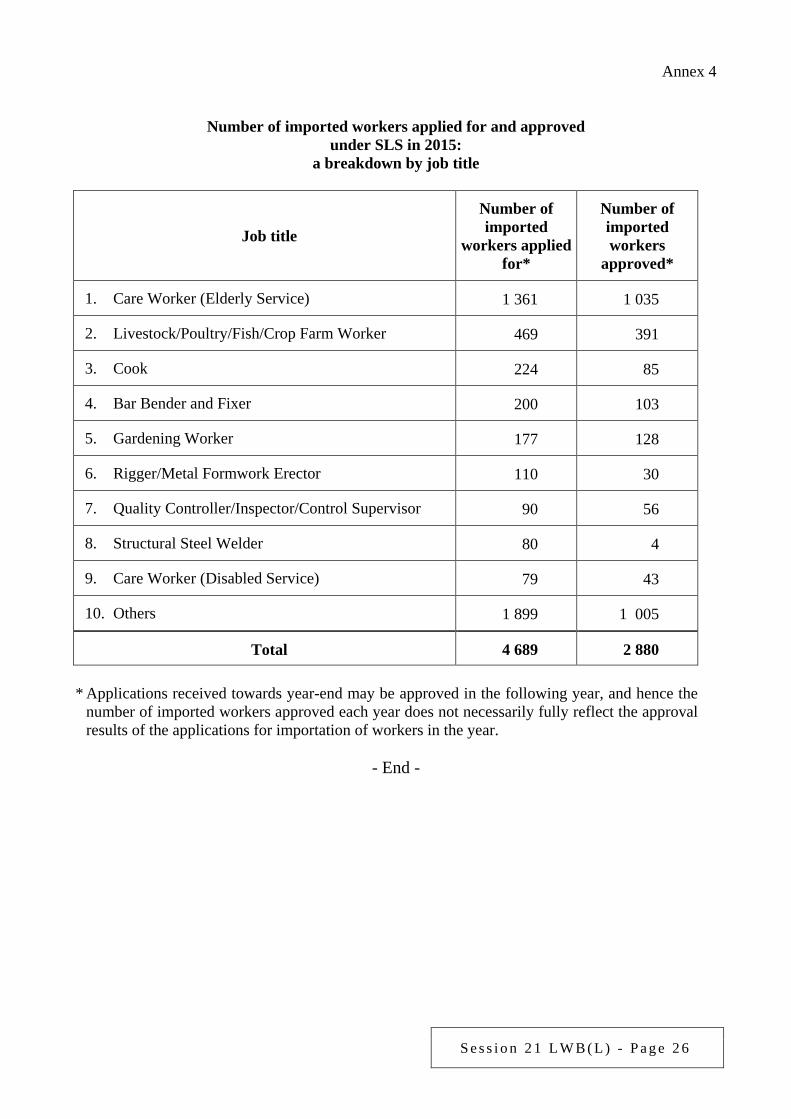
Director of Bureau: Secretary for Labour and Welfare Question: Please set out in table form the number of imported workers applied for under the Supplementary Labour Scheme (SLS) and the success rate, by industry and job title, in each of the past 3 years (i.e. 2013, 2014 and 2015). Take the importation of cooks as an example. What was the respective average time taken from receipt of applications to completion of the vetting procedure in each of the past 3 years? What was the longest and shortest processing time among these cases in each year? Asked by: Hon Tommy CHEUNG Yu-yan (Member Question No. 23) Reply: In 2013, 2014 and 2015, employers applied to import 4 110, 6 613 and 4 689 workers respectively under SLS. The corresponding numbers of imported workers approved were 1 847, 2 722 and 2 880, representing respectively 44.9%, 41.2% and 61.4% of the number of imported workers applied for in these 3 years. Breakdowns of the number of imported workers applied for and approved by industry and job title are at Annexes 1 to 4. The Labour Department does not keep statistics on the processing time for applications for importation of workers in individual job titles (e.g. cook).
S e s s i o n 2 1 L W B ( L ) - P a g e 2 3
Annex 1
Number of imported workers applied for and approved under SLS in 2013, 2014 and 2015:
a breakdown by industry
Industry
Number of imported workers applied for*
Number of imported workers approved*
2013 2014 2015 2013 2014 2015
1. Agriculture and Fishing 688 656 658 414 563 547
2. Manufacturing 296 411 224 76 187 126
3. Construction 320 2 716 1 250 566 342 938
4. Wholesale, Retail and Import/Export Trades, Restaurants and Hotels
666 283 395 76 158 154
5. Transport, Storage and Communications 178 32 44 2 4 17
6. Financing, Insurance, Real Estate and Business Services
663 400 303 8 23 5
7. Community, Social and Personal Services 1 299 2 115 1 815 705 1 445 1 093
Total 4 110 6 613 4 689 1 847 2 722 2 880
* Applications received towards year-end may be approved in the following year, and hence the
number of imported workers approved each year does not necessarily fully reflect the approval results of the applications for importation of workers in the year.
S e s s i o n 2 1 L W B ( L ) - P a g e 2 4
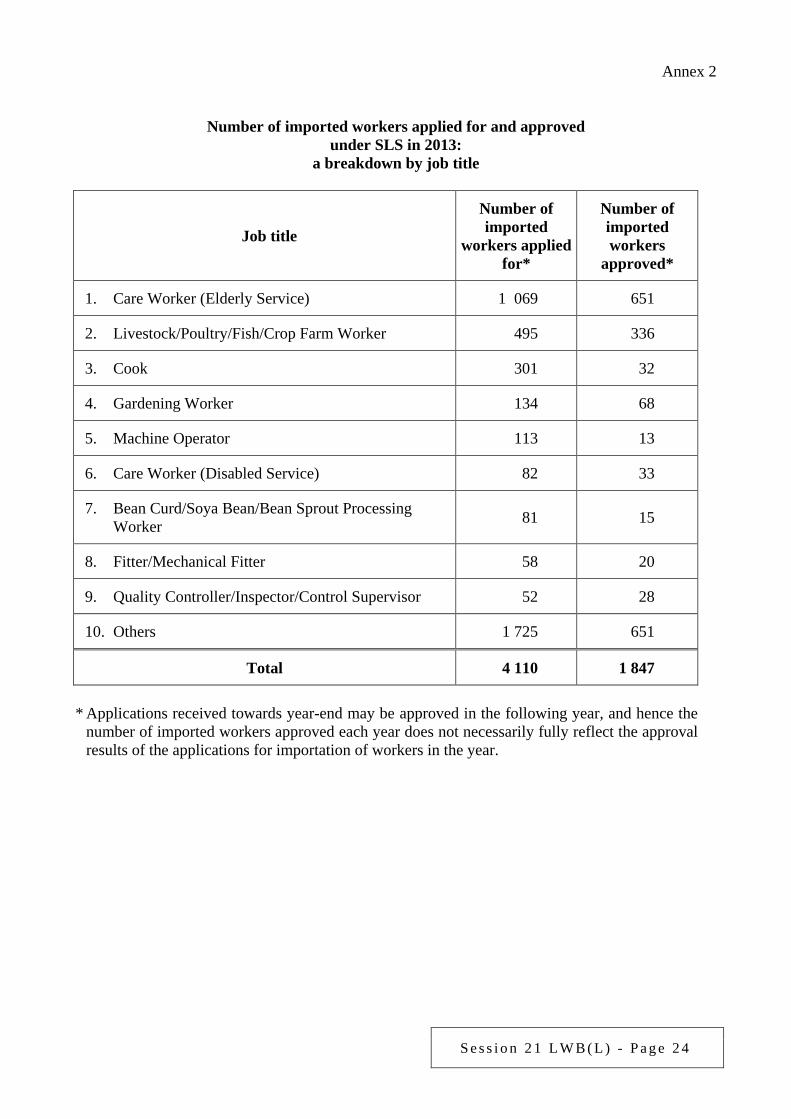
Annex 2
Number of imported workers applied for and approved under SLS in 2013:
a breakdown by job title
Job title
Number of imported
workers applied for*
Number of imported workers
approved*
1. Care Worker (Elderly Service) 1 069 651
2. Livestock/Poultry/Fish/Crop Farm Worker 495 336
3. Cook 301 32
4. Gardening Worker 134 68
5. Machine Operator 113 13
6. Care Worker (Disabled Service) 82 33
7. Bean Curd/Soya Bean/Bean Sprout Processing Worker 81 15
8. Fitter/Mechanical Fitter 58 20
9. Quality Controller/Inspector/Control Supervisor 52 28
10. Others 1 725 651
Total 4 110 1 847
* Applications received towards year-end may be approved in the following year, and hence the
number of imported workers approved each year does not necessarily fully reflect the approval results of the applications for importation of workers in the year.
S e s s i o n 2 1 L W B ( L ) - P a g e 2 5
Annex 3
Number of imported workers applied for and approved under SLS in 2014:
a breakdown by job title
Job title
Number of imported
workers applied for*
Number of imported workers
approved*
1. Care Worker (Elderly Service) 1 885 1 377
2. Livestock/Poultry/Fish/Crop Farm Worker 475 439
3. Gardening Worker 146 127
4. Cook 146 90
5. Tunnel Worker 94 86
6. Machine Operator 87 41
7. Trackworker 75 53
8. High Voltage Overhead Transmission Lines Technician 55 55
9. Bean Curd/Soya Bean/Bean Sprout Processing Worker 26 44
10. Others 3 624 410
Total 6 613 2 722
* Applications received towards year-end may be approved in the following year, and hence the
number of imported workers approved each year does not necessarily fully reflect the approval results of the applications for importation of workers in the year.
S e s s i o n 2 1 L W B ( L ) - P a g e 2 6
Annex 4
Number of imported workers applied for and approved under SLS in 2015:
a breakdown by job title
Job title
Number of imported
workers applied for*
Number of imported workers
approved*
1. Care Worker (Elderly Service) 1 361 1 035
2. Livestock/Poultry/Fish/Crop Farm Worker 469 391
3. Cook 224 85
4. Bar Bender and Fixer 200 103
5. Gardening Worker 177 128
6. Rigger/Metal Formwork Erector 110 30
7. Quality Controller/Inspector/Control Supervisor 90 56
8. Structural Steel Welder 80 4
9. Care Worker (Disabled Service) 79 43
10. Others 1 899 1 005
Total 4 689 2 880 * Applications received towards year-end may be approved in the following year, and hence the
number of imported workers approved each year does not necessarily fully reflect the approval results of the applications for importation of workers in the year.
- End -
S e s s i o n 2 1 L W B ( L ) - P a g e 2 7
Examination of Estimates of Expenditure 2016-17 Reply Serial No.
LWB(L)007 CONTROLLING OFFICER’S REPLY (Question Serial No. 0023)
Head: (90) Labour Department
Subhead (No. & title): ( )
Programme: (3) Safety and Health at Work
Controlling Officer: Commissioner for Labour (Donald TONG)
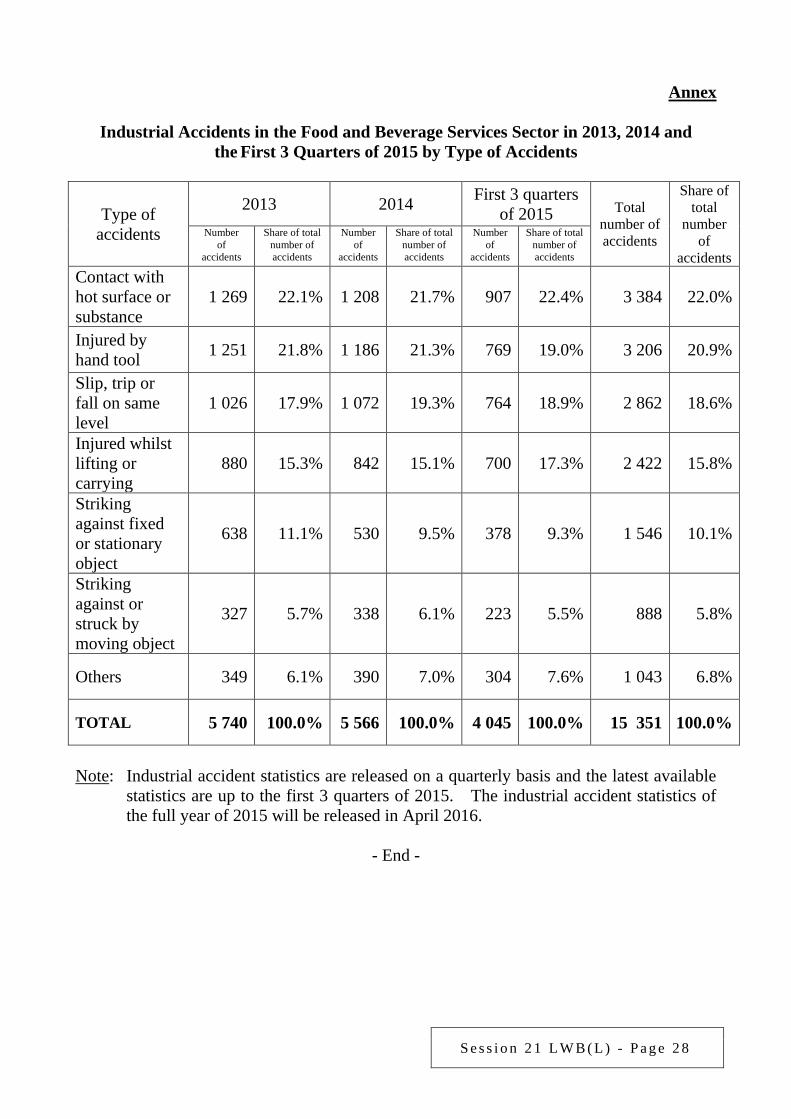
Director of Bureau: Secretary for Labour and Welfare Question: Regarding accidents in the food and beverage services sector, please provide a breakdown by type of accidents and its percentage share among all accidents in the food and beverage sector, the number of injuries/deaths and the amount of compensation claimed for work injuries in the past 3 years (i.e. 2013-2015). Asked by: Hon Tommy CHEUNG Yu-yan (Member Question No. 24) Reply: In the full years of 2013 and 2014, as well as the first 3 quarters of 2015, the numbers of industrial accidents in the food and beverage services sector were 5 740, 5 566 and 4 045 respectively. No industrial fatalities occurred during these periods. A breakdown by type of accidents and percentage share among all industrial accidents in the food and beverage services sector is provided at Annex. The amounts of employees’ compensation for work injuries payable in 2013, 2014 and 2015 in the food and beverage services sector were $99.0 million, $103.6 million and $113.1 million respectively.
S e s s i o n 2 1 L W B ( L ) - P a g e 2 8
Annex
Industrial Accidents in the Food and Beverage Services Sector in 2013, 2014 and
the First 3 Quarters of 2015 by Type of Accidents
Type of accidents
2013 2014 First 3 quarters of 2015 Total
number of accidents
Share of total
number of
accidents
Number of
accidents
Share of total number of accidents
Number of
accidents
Share of total number of accidents
Number of
accidents
Share of total number of accidents
Contact with hot surface or substance
1 269 22.1% 1 208 21.7% 907 22.4% 3 384 22.0%
Injured by hand tool 1 251 21.8% 1 186 21.3% 769 19.0% 3 206 20.9%
Slip, trip or fall on same level
1 026 17.9% 1 072 19.3% 764 18.9% 2 862 18.6%
Injured whilst lifting or carrying
880 15.3% 842 15.1% 700 17.3% 2 422 15.8%
Striking against fixed or stationary object
638 11.1% 530 9.5% 378 9.3% 1 546 10.1%
Striking against or struck by moving object
327 5.7% 338 6.1% 223 5.5% 888 5.8%
Others 349 6.1% 390 7.0% 304 7.6% 1 043 6.8%
TOTAL 5 740 100.0% 5 566 100.0% 4 045 100.0% 15 351 100.0%
Note: Industrial accident statistics are released on a quarterly basis and the latest available
statistics are up to the first 3 quarters of 2015. The industrial accident statistics of the full year of 2015 will be released in April 2016.
- End -
S e s s i o n 2 1 L W B ( L ) - P a g e 2 9
Examination of Estimates of Expenditure 2016-17 Reply Serial No.
LWB(L)008 CONTROLLING OFFICER’S REPLY (Question Serial No. 2372)
Head: (90) Labour Department
Subhead (No. & title): ( )
Programme: (4) Employees’ Rights and Benefits
Controlling Officer: Commissioner for Labour (Donald TONG)
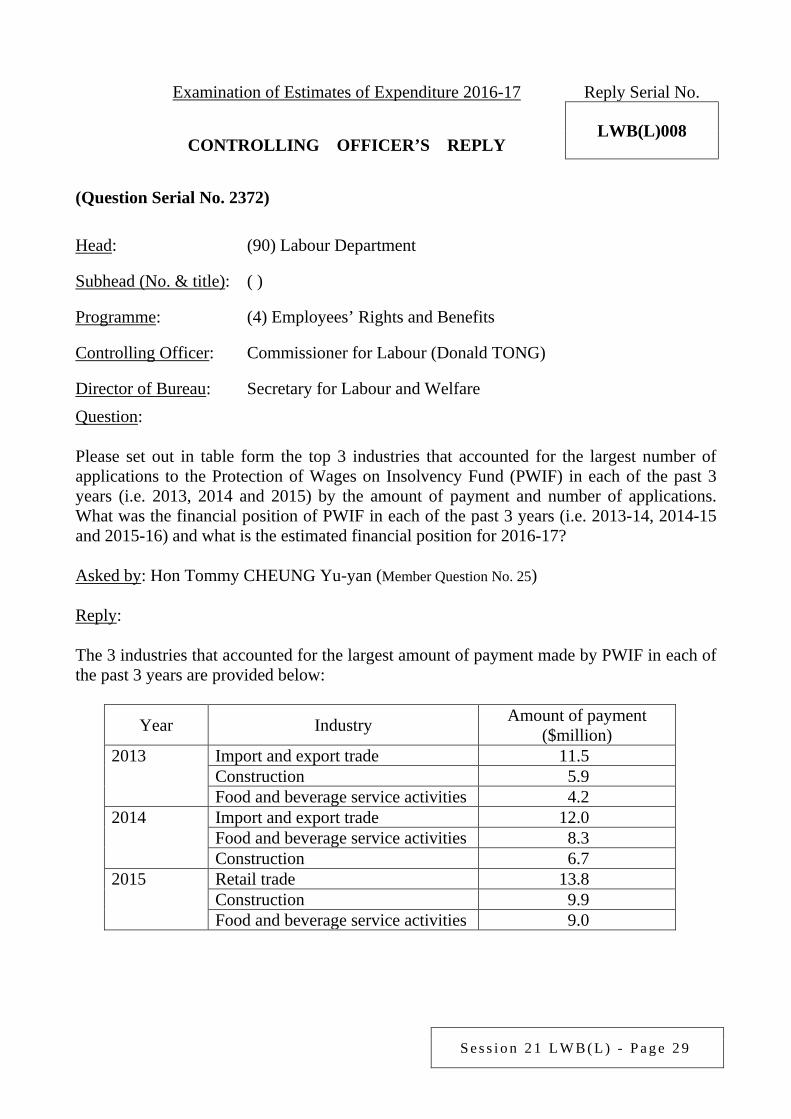
Director of Bureau: Secretary for Labour and Welfare Question: Please set out in table form the top 3 industries that accounted for the largest number of applications to the Protection of Wages on Insolvency Fund (PWIF) in each of the past 3 years (i.e. 2013, 2014 and 2015) by the amount of payment and number of applications. What was the financial position of PWIF in each of the past 3 years (i.e. 2013-14, 2014-15 and 2015-16) and what is the estimated financial position for 2016-17? Asked by: Hon Tommy CHEUNG Yu-yan (Member Question No. 25) Reply: The 3 industries that accounted for the largest amount of payment made by PWIF in each of the past 3 years are provided below:
Year Industry Amount of payment ($million)
2013 Import and export trade 11.5 Construction 5.9 Food and beverage service activities 4.2
2014 Import and export trade 12.0 Food and beverage service activities 8.3 Construction 6.7
2015 Retail trade 13.8 Construction 9.9 Food and beverage service activities 9.0
S e s s i o n 2 1 L W B ( L ) - P a g e 3 0
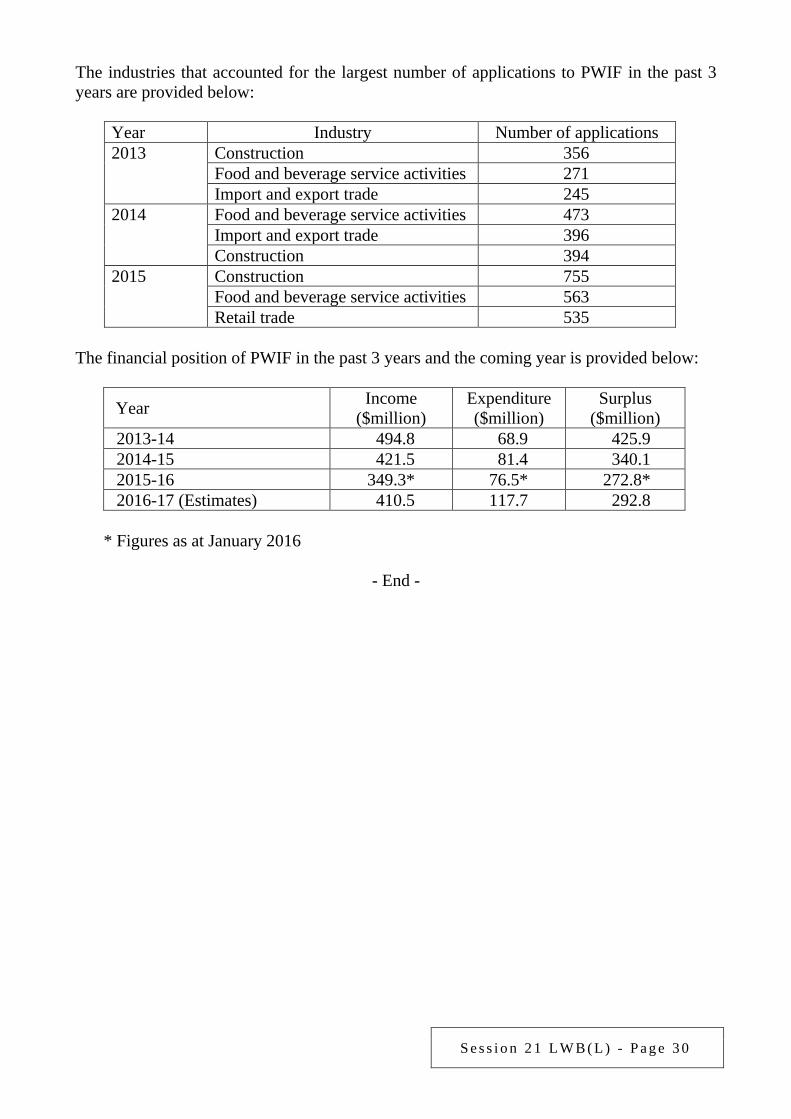
The industries that accounted for the largest number of applications to PWIF in the past 3 years are provided below:
Year Industry Number of applications 2013 Construction 356
Food and beverage service activities 271 Import and export trade 245
2014 Food and beverage service activities 473 Import and export trade 396 Construction 394
2015 Construction 755 Food and beverage service activities 563 Retail trade 535
The financial position of PWIF in the past 3 years and the coming year is provided below:
Year Income ($million)
Expenditure ($million)
Surplus ($million)
2013-14 494.8 68.9 425.9 2014-15 421.5 81.4 340.1 2015-16 349.3* 76.5* 272.8* 2016-17 (Estimates) 410.5 117.7 292.8
* Figures as at January 2016
- End -
S e s s i o n 2 1 L W B ( L ) - P a g e 3 1
Examination of Estimates of Expenditure 2016-17 Reply Serial No.
LWB(L)009 CONTROLLING OFFICER’S REPLY (Question Serial No. 1372)
Head: (90) Labour Department
Subhead (No. & title): ( )
Programme: (4) Employees’ Rights and Benefits
Controlling Officer: Commissioner for Labour (Donald TONG)
Director of Bureau: Secretary for Labour and Welfare Question: (a) Please provide a breakdown of the number of applications to the Protection of Wages
on Insolvency Fund (PWIF) from 2011-12 to 2015-16 by the time required to effect payment.
(b) Please provide breakdowns of the number of applications to PWIF from 2011-12 to
2015-16 by industry, the total amount claimed and the average amount of ex gratia payment made per application.
(c) Please provide the financial position of PWIF in the past 5 years (i.e. from 2011-12 to
2015-16) and the estimated financial position for 2016-17. (d) What measures does the Government take to simplify the procedures of verifying
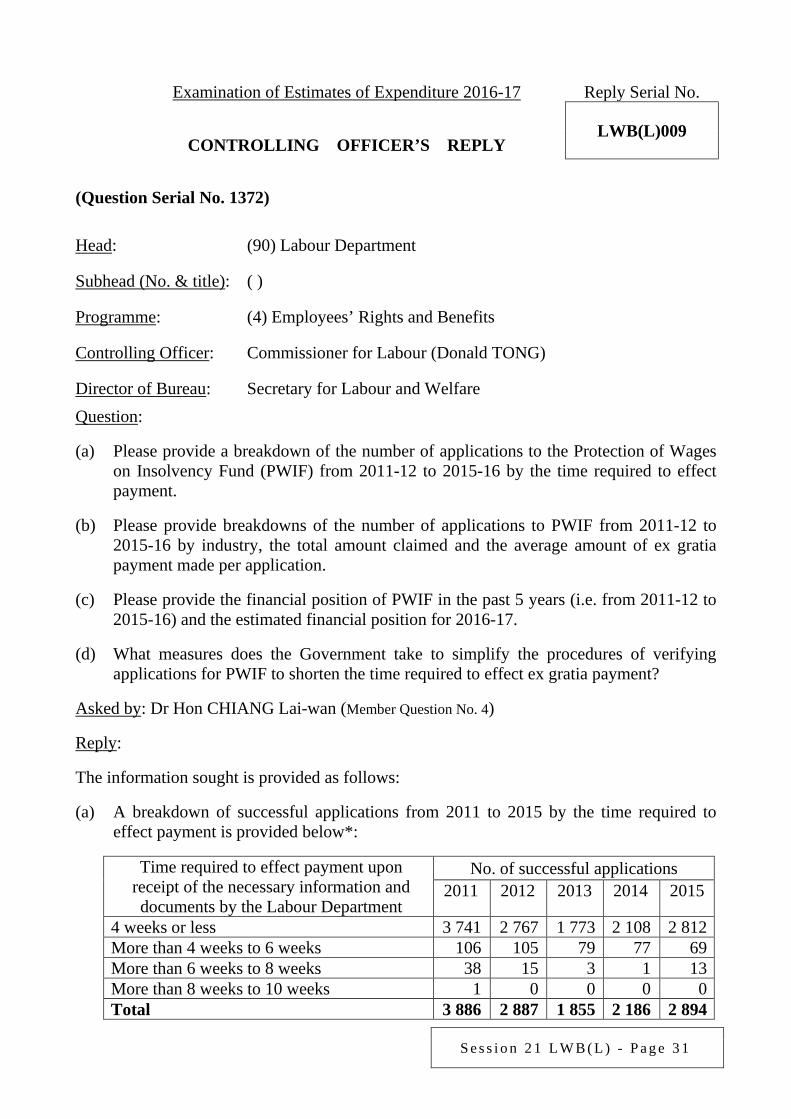
applications for PWIF to shorten the time required to effect ex gratia payment? Asked by: Dr Hon CHIANG Lai-wan (Member Question No. 4) Reply: The information sought is provided as follows: (a) A breakdown of successful applications from 2011 to 2015 by the time required to
effect payment is provided below*:
Time required to effect payment upon receipt of the necessary information and documents by the Labour Department
No. of successful applications 2011 2012 2013 2014 2015
4 weeks or less 3 741 2 767 1 773 2 108 2 812 More than 4 weeks to 6 weeks 106 105 79 77 69 More than 6 weeks to 8 weeks 38 15 3 1 13 More than 8 weeks to 10 weeks 1 0 0 0 0 Total 3 886 2 887 1 855 2 186 2 894
S e s s i o n 2 1 L W B ( L ) - P a g e 3 2
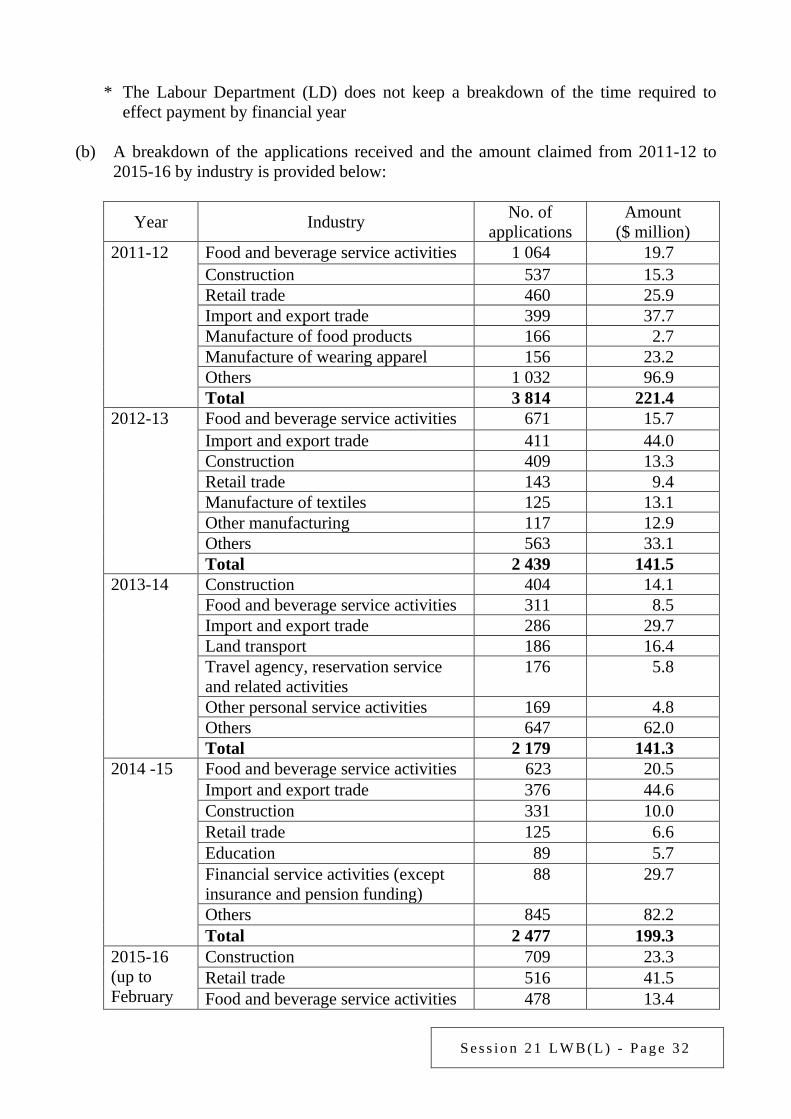
* The Labour Department (LD) does not keep a breakdown of the time required to
effect payment by financial year
(b) A breakdown of the applications received and the amount claimed from 2011-12 to 2015-16 by industry is provided below:
Year Industry No. of applications
Amount ($ million)
2011-12 Food and beverage service activities 1 064 19.7 Construction 537 15.3 Retail trade 460 25.9 Import and export trade 399 37.7 Manufacture of food products 166 2.7 Manufacture of wearing apparel 156 23.2 Others 1 032 96.9 Total 3 814 221.4
2012-13 Food and beverage service activities 671 15.7 Import and export trade 411 44.0 Construction 409 13.3 Retail trade 143 9.4 Manufacture of textiles 125 13.1 Other manufacturing 117 12.9 Others 563 33.1 Total 2 439 141.5
2013-14 Construction 404 14.1 Food and beverage service activities 311 8.5 Import and export trade 286 29.7 Land transport 186 16.4 Travel agency, reservation service and related activities
176 5.8
Other personal service activities 169 4.8 Others 647 62.0 Total 2 179 141.3
2014 -15 Food and beverage service activities 623 20.5 Import and export trade 376 44.6 Construction 331 10.0 Retail trade 125 6.6 Education 89 5.7 Financial service activities (except insurance and pension funding)
88 29.7
Others 845 82.2 Total 2 477 199.3
2015-16 (up to February
Construction 709 23.3 Retail trade 516 41.5 Food and beverage service activities 478 13.4
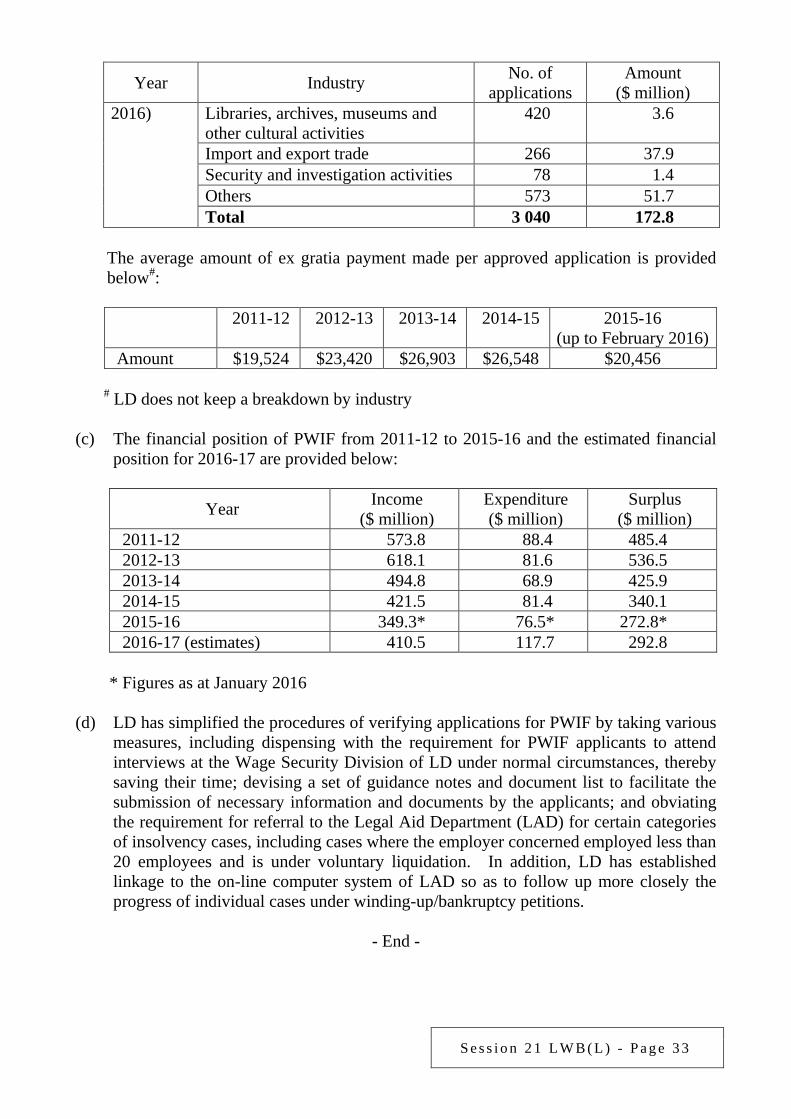
S e s s i o n 2 1 L W B ( L ) - P a g e 3 3
Year Industry No. of applications
Amount ($ million)
2016) Libraries, archives, museums and other cultural activities
420 3.6
Import and export trade 266 37.9 Security and investigation activities 78 1.4 Others 573 51.7 Total 3 040 172.8
The average amount of ex gratia payment made per approved application is provided
below#:
2011-12 2012-13 2013-14 2014-15 2015-16 (up to February 2016)
Amount $19,524 $23,420 $26,903 $26,548 $20,456 # LD does not keep a breakdown by industry
(c) The financial position of PWIF from 2011-12 to 2015-16 and the estimated financial
position for 2016-17 are provided below:
Year Income ($ million)
Expenditure ($ million)
Surplus ($ million)
2011-12 573.8 88.4 485.4 2012-13 618.1 81.6 536.5 2013-14 494.8 68.9 425.9 2014-15 421.5 81.4 340.1 2015-16 349.3* 76.5* 272.8* 2016-17 (estimates) 410.5 117.7 292.8
* Figures as at January 2016
(d) LD has simplified the procedures of verifying applications for PWIF by taking various
measures, including dispensing with the requirement for PWIF applicants to attend interviews at the Wage Security Division of LD under normal circumstances, thereby saving their time; devising a set of guidance notes and document list to facilitate the submission of necessary information and documents by the applicants; and obviating the requirement for referral to the Legal Aid Department (LAD) for certain categories of insolvency cases, including cases where the employer concerned employed less than 20 employees and is under voluntary liquidation. In addition, LD has established linkage to the on-line computer system of LAD so as to follow up more closely the progress of individual cases under winding-up/bankruptcy petitions.
- End -
S e s s i o n 2 1 L W B ( L ) - P a g e 3 4
Examination of Estimates of Expenditure 2016-17 Reply Serial No.
LWB(L)010 CONTROLLING OFFICER’S REPLY (Question Serial No. 1373)
Head: (90) Labour Department
Subhead (No. & title): ( )
Programme: (4) Employees’ Rights and Benefits
Controlling Officer: Commissioner for Labour (Donald TONG)
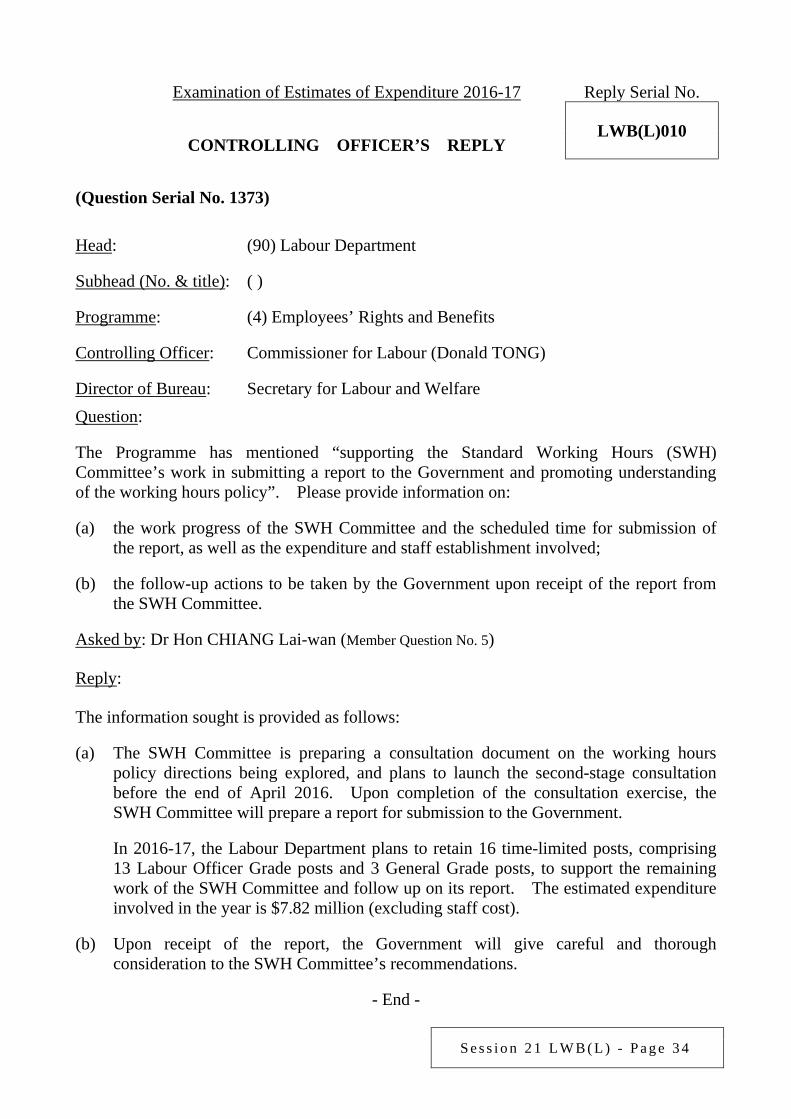
Director of Bureau: Secretary for Labour and Welfare Question: The Programme has mentioned “supporting the Standard Working Hours (SWH) Committee’s work in submitting a report to the Government and promoting understanding of the working hours policy”. Please provide information on: (a) the work progress of the SWH Committee and the scheduled time for submission of
the report, as well as the expenditure and staff establishment involved; (b) the follow-up actions to be taken by the Government upon receipt of the report from
the SWH Committee. Asked by: Dr Hon CHIANG Lai-wan (Member Question No. 5) Reply: The information sought is provided as follows: (a) The SWH Committee is preparing a consultation document on the working hours
policy directions being explored, and plans to launch the second-stage consultation before the end of April 2016. Upon completion of the consultation exercise, the SWH Committee will prepare a report for submission to the Government.
In 2016-17, the Labour Department plans to retain 16 time-limited posts, comprising
13 Labour Officer Grade posts and 3 General Grade posts, to support the remaining work of the SWH Committee and follow up on its report. The estimated expenditure involved in the year is $7.82 million (excluding staff cost).
(b) Upon receipt of the report, the Government will give careful and thorough
consideration to the SWH Committee’s recommendations.
- End -

S e s s i o n 2 1 L W B ( L ) - P a g e 3 5
Examination of Estimates of Expenditure 2016-17 Reply Serial No.
LWB(L)011 CONTROLLING OFFICER’S REPLY (Question Serial No. 1374)
Head: (90) Labour Department
Subhead (No. & title): ( )
Programme: (3) Safety and Health at Work
Controlling Officer: Commissioner for Labour (Donald TONG)
Director of Bureau: Secretary for Labour and Welfare Question: Regarding occupational accidents in the construction industry, please provide the following information: (a) Please provide a breakdown of injuries and fatalities in the construction industry by
type of accidents and its percentage share among all construction accidents, as well as the accident rates per 1 000 workers in the past 3 years (i.e. 2013-14, 2014-15 and 2015-16).
(b) What measures does the Government take to reduce the number of accidents in the
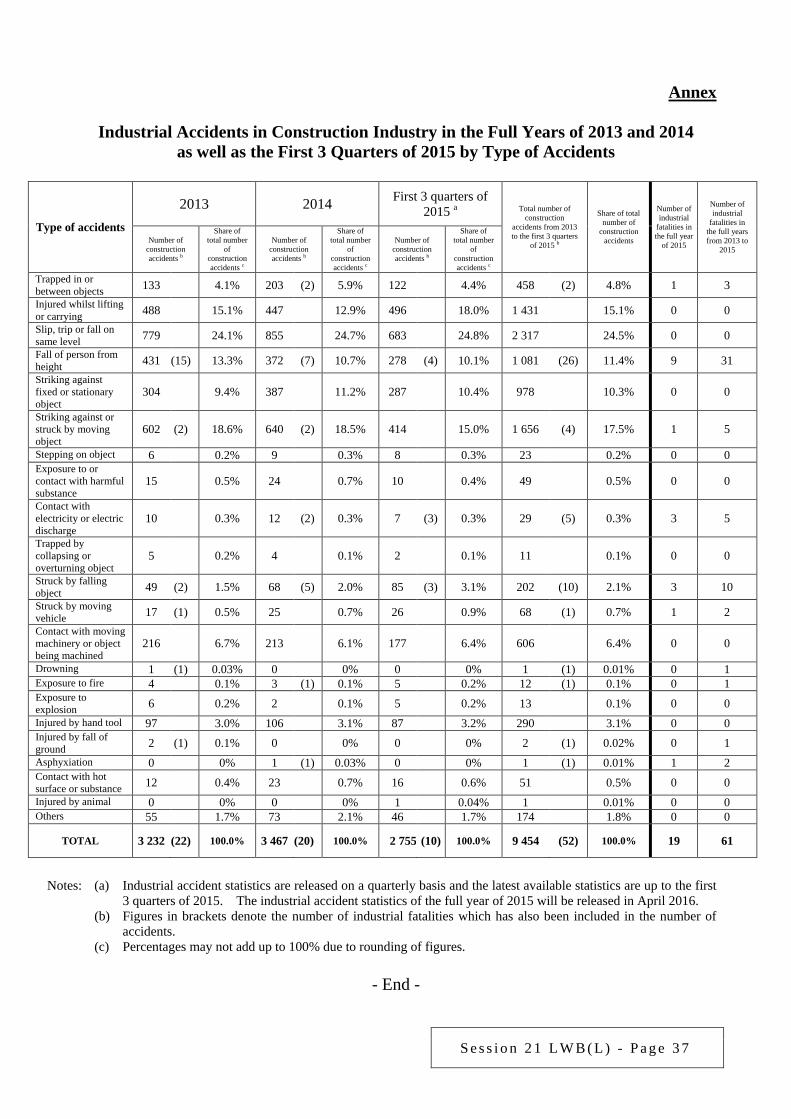
construction industry? Asked by: Dr Hon CHIANG Lai-wan (Member Question No. 6) Reply: The information sought is provided as follows: (a) In the full years of 2013 and 2014, as well as the first 3 quarters of 2015, there were
respectively 3 232, 3 467 and 2 755 industrial accidents in the construction industry. The respective industrial accident rates per 1 000 workers were 40.8, 41.9 and 39.6. A breakdown by type of accidents is provided at Annex.
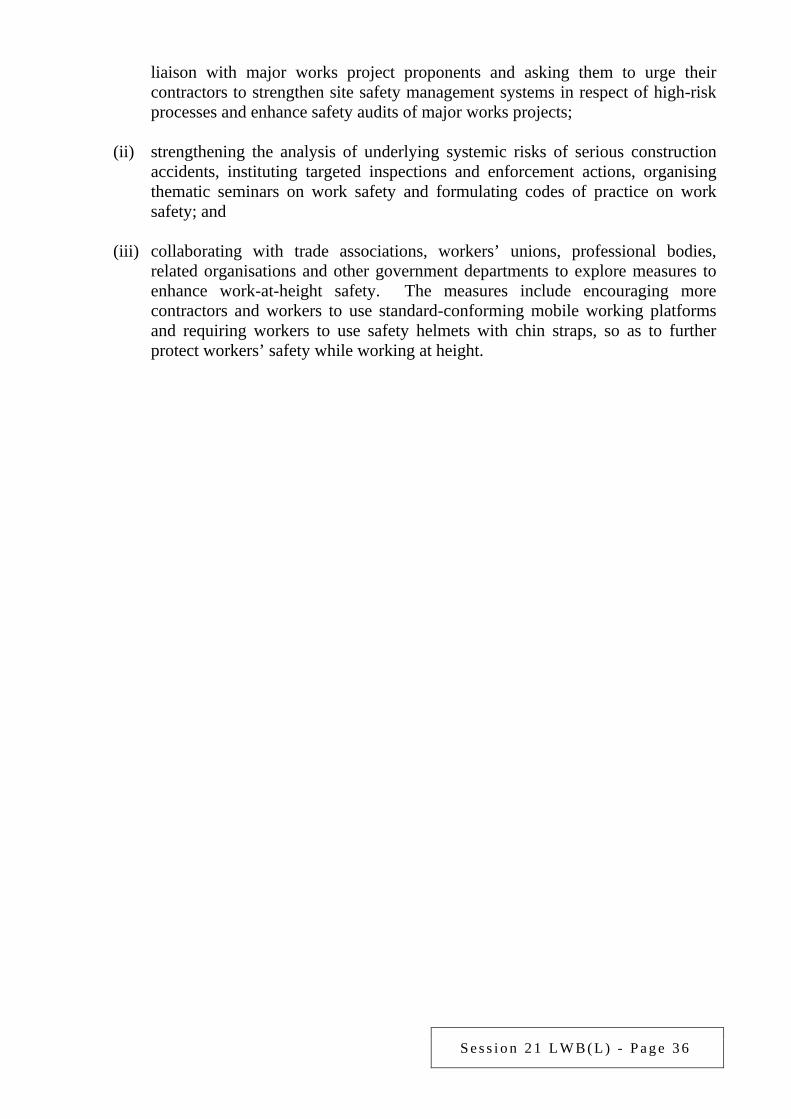
(b) In addition to carrying out routine inspections as well as educational and publicity
work, the Labour Department will intensify the following systemic preventive and enforcement measures in 2016-17 to tackle fall-from-height hazards and other work hazards posed to construction workers:
(i) containing work risks at source by targeting systemic work risks such as
work-at-height, lifting operations and electrical work, including enhancing
S e s s i o n 2 1 L W B ( L ) - P a g e 3 6
liaison with major works project proponents and asking them to urge their contractors to strengthen site safety management systems in respect of high-risk processes and enhance safety audits of major works projects;
(ii) strengthening the analysis of underlying systemic risks of serious construction
accidents, instituting targeted inspections and enforcement actions, organising thematic seminars on work safety and formulating codes of practice on work safety; and
(iii) collaborating with trade associations, workers’ unions, professional bodies,
related organisations and other government departments to explore measures to enhance work-at-height safety. The measures include encouraging more contractors and workers to use standard-conforming mobile working platforms and requiring workers to use safety helmets with chin straps, so as to further protect workers’ safety while working at height.
S e s s i o n 2 1 L W B ( L ) - P a g e 3 7
Annex
Industrial Accidents in Construction Industry in the Full Years of 2013 and 2014
as well as the First 3 Quarters of 2015 by Type of Accidents
Type of accidents
2013 2014 First 3 quarters of 2015 a Total number of
construction accidents from 2013 to the first 3 quarters
of 2015 b
Share of total number of
construction accidents
Number of industrial
fatalities in the full year
of 2015
Number of industrial
fatalities in the full years from 2013 to
2015 Number of
construction accidents b
Share of total number
of construction accidents c
Number of construction accidents b
Share of total number
of construction accidents c
Number of construction accidents b
Share of total number
of construction accidents c
Trapped in or between objects 133 4.1% 203 (2) 5.9% 122 4.4% 458 (2) 4.8% 1 3 Injured whilst lifting or carrying 488 15.1% 447 12.9% 496 18.0% 1 431 15.1% 0 0 Slip, trip or fall on same level 779 24.1% 855 24.7% 683 24.8% 2 317 24.5% 0 0 Fall of person from height 431 (15) 13.3% 372 (7) 10.7% 278 (4) 10.1% 1 081 (26) 11.4% 9 31 Striking against fixed or stationary object
304 9.4% 387 11.2% 287 10.4% 978 10.3% 0 0
Striking against or struck by moving object
602 (2) 18.6% 640 (2) 18.5% 414 15.0% 1 656 (4) 17.5% 1 5
Stepping on object 6 0.2% 9 0.3% 8 0.3% 23 0.2% 0 0 Exposure to or contact with harmful substance
15 0.5% 24 0.7% 10 0.4% 49 0.5% 0 0
Contact with electricity or electric discharge
10 0.3% 12 (2) 0.3% 7 (3) 0.3% 29 (5) 0.3% 3 5
Trapped by collapsing or overturning object
5 0.2% 4 0.1% 2 0.1% 11 0.1% 0 0
Struck by falling object 49 (2) 1.5% 68 (5) 2.0% 85 (3) 3.1% 202 (10) 2.1% 3 10 Struck by moving vehicle 17 (1) 0.5% 25 0.7% 26 0.9% 68 (1) 0.7% 1 2 Contact with moving machinery or object being machined
216 6.7% 213 6.1% 177 6.4% 606 6.4% 0 0
Drowning 1 (1) 0.03% 0 0% 0 0% 1 (1) 0.01% 0 1 Exposure to fire 4 0.1% 3 (1) 0.1% 5 0.2% 12 (1) 0.1% 0 1 Exposure to explosion 6 0.2% 2 0.1% 5 0.2% 13 0.1% 0 0 Injured by hand tool 97 3.0% 106 3.1% 87 3.2% 290 3.1% 0 0 Injured by fall of ground 2 (1) 0.1% 0 0% 0 0% 2 (1) 0.02% 0 1 Asphyxiation 0 0% 1 (1) 0.03% 0 0% 1 (1) 0.01% 1 2 Contact with hot surface or substance 12 0.4% 23 0.7% 16 0.6% 51 0.5% 0 0 Injured by animal 0 0% 0 0% 1 0.04% 1 0.01% 0 0 Others 55 1.7% 73 2.1% 46 1.7% 174 1.8% 0 0
TOTAL 3 232 (22) 100.0% 3 467 (20) 100.0% 2 755 (10) 100.0% 9 454 (52) 100.0% 19 61
Notes: (a) Industrial accident statistics are released on a quarterly basis and the latest available statistics are up to the first
3 quarters of 2015. The industrial accident statistics of the full year of 2015 will be released in April 2016. (b) Figures in brackets denote the number of industrial fatalities which has also been included in the number of
accidents. (c) Percentages may not add up to 100% due to rounding of figures.
- End -
S e s s i o n 2 1 L W B ( L ) - P a g e 3 8
Examination of Estimates of Expenditure 2016-17 Reply Serial No.
LWB(L)012 CONTROLLING OFFICER’S REPLY (Question Serial No. 1375)
Head: (90) Labour Department
Subhead (No. & title): ( )
Programme: (2) Employment Services
Controlling Officer: Commissioner for Labour (Donald TONG)
Director of Bureau: Secretary for Labour and Welfare Question: The Labour Department (LD) operates 2 Youth Employment Resource Centres (YERCs) in the name of Youth Employment Start (Y.E.S.) which targets to provide personalised advisory and support services on employment and self-employment to young people aged 15 to 29. In this connection, would the Government advise this Committee of the following: (a) Please provide a breakdown of the estimated expenditure and staff establishment of the
2 YERCs in 2016-17. (b) Does the Government stipulate any criteria for evaluating and assessing the
effectiveness of YERCs? If yes, what is their effectiveness? If not, what are the reasons?
(c) In recent years, the Government has been proactively promoting youth
entrepreneurship. What is the role of YERCs in supporting youth entrepreneurship? How will the Government strengthen the related work in the future?
(d) Has the Government considered setting up more YERCs to strengthen the training for
young people, enhance their employability and provide one-stop employment advisory service?
Asked by: Dr Hon CHIANG Lai-wan (Member Question No. 7) Reply: The information sought is provided as follows: (a) In 2016-17, the estimated expenditure (excluding staff cost) for operating the 2
YERCs is about $19.3 million. At present, the 2 YERCs are managed by 12 LD
S e s s i o n 2 1 L W B ( L ) - P a g e 3 9
staff. Another 18 staff are provided by a non-governmental organisation engaged under a service contract to operate the services.
(b) In 2015, a total of 73 394 young people benefited from the services provided by the 2
YERCs. LD conducted regular opinion surveys and focus group discussions to understand users’ views on the services so as to evaluate the effectiveness of YERCs. Young people attending the training programmes and counselling found these activities and services useful in mapping out their career path and pursuing self-employment.
(c) YERCs provide support services to young people aged between 15 and 29 who aspire
to self-employment. Y.E.S. organises regular workshops relating to self-employment and entrepreneurship and provides qualified legal and accounting advisory services. It also invites young entrepreneurs to share their success stories of setting up businesses with young people, so as to equip them with self-employment and entrepreneurship skills. Self-employment Experience Days are organised in collaboration with large shopping malls to offer opportunities to young people with business aspirations to gain experience in setting up a business or self-employment. Business workstations, meeting rooms and design corners with professional design software/hardware in Y.E.S. are made available for use free of charge. LD will continue to keep in view the young people’s needs for self-employment support and assist them in mapping out their career path.
(d) The 2 YERCs in Kowloon and the New Territories are conveniently located to serve
young people throughout the territory. There is no plan to set up more YERCs at this stage. LD will continue to keep in view the young people’s employment needs and provide appropriate career advisory services.
- End -
S e s s i o n 2 1 L W B ( L ) - P a g e 4 0
Examination of Estimates of Expenditure 2016-17 Reply Serial No.
LWB(L)013 CONTROLLING OFFICER’S REPLY (Question Serial No. 1376)
Head: (90) Labour Department
Subhead (No. & title): ( )
Programme: (4) Employees’ Rights and Benefits
Controlling Officer: Commissioner for Labour (Donald TONG)
Director of Bureau: Secretary for Labour and Welfare Question: The Employment Agencies Administration (EAA) of the Labour Department (LD) is responsible for regulating the operation of employment agencies (EAs) which provide intermediary service for foreign domestic helpers (FDHs) through licensing, regular and surprise inspections, complaint investigations and prosecutions, etc., so as to ensure that they are operating in compliance with the law. Besides, the Programme has mentioned the plan of “introducing a code of practice (CoP) to tighten control on local employment agencies”. Would the Government provide the following information: (a) What is the estimated expenditure and staff establishment of EAA in 2016-17? (b) How many overcharging or malpractice complaints against intermediaries for FDHs
were received by EAA in the past 3 years (2013-14 to 2015-16)? How did EAA deal with these complaints?
(c) How many inspections to intermediaries for FDHs were carried out by EAA in the past
3 years (2013-14 to 2015-16)? What were the types of inspections (including regular and surprise inspections)?
(d) Please provide details of the proposal for drawing up the CoP. (e) Does the Government have any plan to conduct a comprehensive review on the
regulation of EAs, such as introducing a demerit point system on EA licence? Asked by: Dr Hon CHIANG Lai-wan (Member Question No. 8) Reply: The information sought is provided as follows:
S e s s i o n 2 1 L W B ( L ) - P a g e 4 1
(a) In 2016-17, the estimated expenditure of EAA (excluding staff cost) is $2.1 million. Its staff establishment comprises 15 Labour Officer Grade staff and 6 clerical staff.
(b) In 2013, 2014 and 2015, EAA respectively received 194, 170 and 176 complaints
against EAs engaged in FDH placements. Upon receipt of complaints, EAA had initiated investigations promptly and prosecutions had been instituted where there was sufficient evidence. The numbers of EAs successfully prosecuted in these 3 years were 5, 4 and 12 respectively. For EAs convicted of overcharging, LD will consider revoking or refusing to renew their licences.
(c) In 2013, 2014 and 2015, EAA respectively conducted 1 013, 1 352 and 1 348
inspections, covering both regular and surprise ones, to intermediaries for FDHs. (d)&(e) LD is drawing up a CoP for EAs. The drafting work is expected to be completed
sometime in April/May 2016. The Government will then consult the industry and stakeholders. If the CoP could not achieve its objective, the Government does not rule out the introduction of other regulatory measures to strengthen the regulation of EAs.
- End -
S e s s i o n 2 1 L W B ( L ) - P a g e 4 2
Examination of Estimates of Expenditure 2016-17 Reply Serial No.
LWB(L)014 CONTROLLING OFFICER’S REPLY (Question Serial No. 1379)
Head: (90) Labour Department
Subhead (No. & title): ( )
Programme: (2) Employment Services
Controlling Officer: Commissioner for Labour (Donald TONG)
Director of Bureau: Secretary for Labour and Welfare Question: Regarding the Youth Employment and Training Programme (YETP) of the Labour Department (LD), would the Government advise this Committee of: (a) the expenditure and staff establishment for YETP under LD for 2016-2017; (b) the number of trainees enrolled under YETP since its inception up to 2015-2016 and
the training cost per person; (c) the placement rate, average wage and industry profile of the trainees upon completing
the courses since YETP’s inception up to 2015-2016? Asked by: Dr Hon CHIANG Lai-wan (Member Question No. 11) Reply: The information sought is provided as follows: (a) The estimated expenditure for implementing YETP in 2016-17 is $112.7 million. A
team comprising 69 LD officers will be responsible for the administration, promotion and monitoring of the service provision of YETP.
(b) In September 2009, LD enhanced and integrated the Youth Pre-employment Training
Programme and Youth Work Experience and Training Scheme to become a “through-train” programme - YETP. It offers young people 12 months’ employment support services covering pre-employment training, workplace attachment, on-the-job training, reimbursement of course and examination fees, and customised career guidance and employment support services provided by case managers who are professional social workers. The customised career guidance may be extended by another 12 months for trainees who have found work.
S e s s i o n 2 1 L W B ( L ) - P a g e 4 3
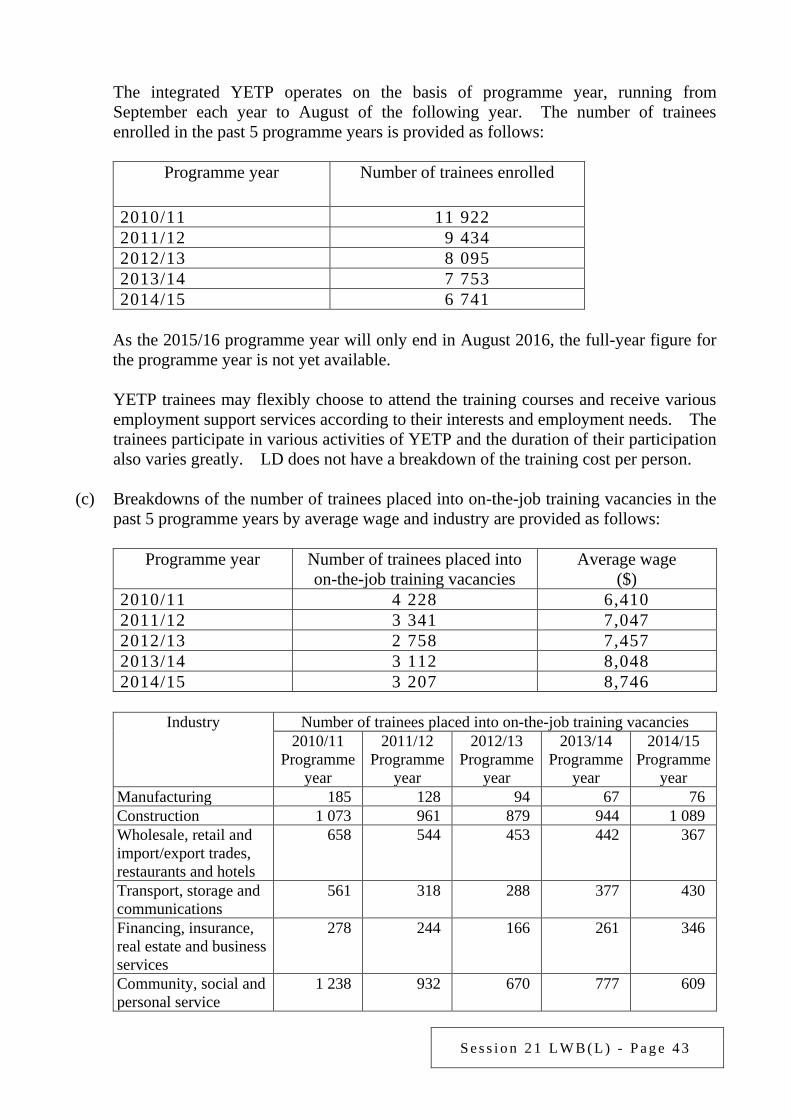
The integrated YETP operates on the basis of programme year, running from
September each year to August of the following year. The number of trainees enrolled in the past 5 programme years is provided as follows:
Programme year Number of trainees enrolled
2010/11 11 922 2011/12 9 434 2012/13 8 095 2013/14 7 753 2014/15 6 741
As the 2015/16 programme year will only end in August 2016, the full-year figure for
the programme year is not yet available.
YETP trainees may flexibly choose to attend the training courses and receive various employment support services according to their interests and employment needs. The trainees participate in various activities of YETP and the duration of their participation also varies greatly. LD does not have a breakdown of the training cost per person.
(c) Breakdowns of the number of trainees placed into on-the-job training vacancies in the
past 5 programme years by average wage and industry are provided as follows:
Programme year Number of trainees placed into on-the-job training vacancies
Average wage ($)
2010/11 4 228 6,410 2011/12 3 341 7,047 2012/13 2 758 7,457 2013/14 3 112 8,048 2014/15 3 207 8,746
Industry Number of trainees placed into on-the-job training vacancies
2010/11 Programme
year
2011/12 Programme
year
2012/13 Programme
year
2013/14 Programme
year
2014/15 Programme
year Manufacturing 185 128 94 67 76 Construction 1 073 961 879 944 1 089 Wholesale, retail and import/export trades, restaurants and hotels
658 544 453 442 367
Transport, storage and communications
561 318 288 377 430
Financing, insurance, real estate and business services
278 244 166 261 346
Community, social and personal service
1 238 932 670 777 609
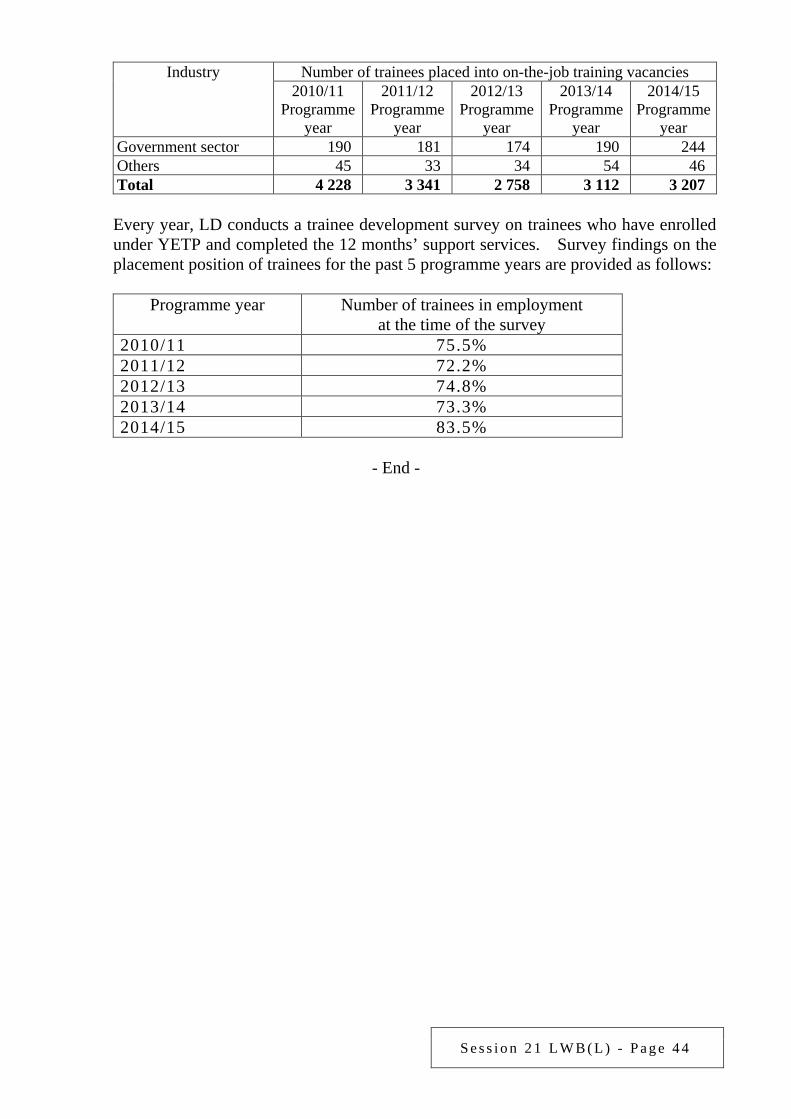
S e s s i o n 2 1 L W B ( L ) - P a g e 4 4
Industry Number of trainees placed into on-the-job training vacancies 2010/11
Programme year
2011/12 Programme
year
2012/13 Programme
year
2013/14 Programme
year
2014/15 Programme
year Government sector 190 181 174 190 244 Others 45 33 34 54 46 Total 4 228 3 341 2 758 3 112 3 207
Every year, LD conducts a trainee development survey on trainees who have enrolled
under YETP and completed the 12 months’ support services. Survey findings on the placement position of trainees for the past 5 programme years are provided as follows:
Programme year Number of trainees in employment
at the time of the survey 2010/11 75.5% 2011/12 72.2% 2012/13 74.8% 2013/14 73.3% 2014/15 83.5%
- End -
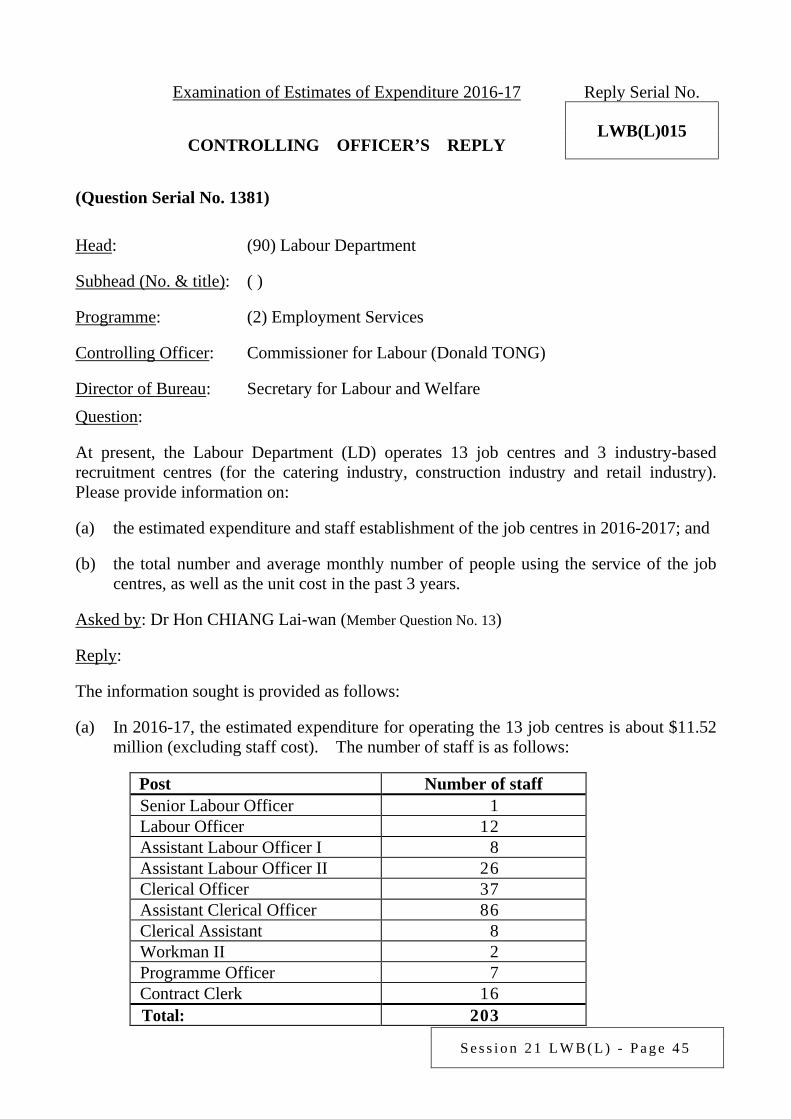
S e s s i o n 2 1 L W B ( L ) - P a g e 4 5
Examination of Estimates of Expenditure 2016-17 Reply Serial No.
LWB(L)015 CONTROLLING OFFICER’S REPLY (Question Serial No. 1381)
Head: (90) Labour Department
Subhead (No. & title): ( )
Programme: (2) Employment Services
Controlling Officer: Commissioner for Labour (Donald TONG)
Director of Bureau: Secretary for Labour and Welfare Question: At present, the Labour Department (LD) operates 13 job centres and 3 industry-based recruitment centres (for the catering industry, construction industry and retail industry). Please provide information on: (a) the estimated expenditure and staff establishment of the job centres in 2016-2017; and
(b) the total number and average monthly number of people using the service of the job
centres, as well as the unit cost in the past 3 years. Asked by: Dr Hon CHIANG Lai-wan (Member Question No. 13) Reply: The information sought is provided as follows: (a) In 2016-17, the estimated expenditure for operating the 13 job centres is about $11.52
million (excluding staff cost). The number of staff is as follows:
Post Number of staff Senior Labour Officer 1 Labour Officer 12 Assistant Labour Officer I 8 Assistant Labour Officer II 26 Clerical Officer 37 Assistant Clerical Officer 86 Clerical Assistant 8 Workman II 2 Programme Officer 7 Contract Clerk 16 Total: 203

S e s s i o n 2 1 L W B ( L ) - P a g e 4 6
(b) In 2015, a total of 67 221 job seekers registered for free employment services provided
by LD. For most of the job seekers, registration is not a pre-requisite for them to make use of the various facilities and services provided at the job centres. They can also directly contact the employers who have placed advertisements at LD’s job centres or on its website. LD does not keep statistics on the total number and average monthly number of people using the services of job centres and hence cannot provide the unit cost.
- End -
S e s s i o n 2 1 L W B ( L ) - P a g e 4 7
Examination of Estimates of Expenditure 2016-17 Reply Serial No.
LWB(L)016 CONTROLLING OFFICER’S REPLY (Question Serial No. 1382)
Head: (90) Labour Department
Subhead (No. & title): ( )
Programme: (2) Employment Services
Controlling Officer: Commissioner for Labour (Donald TONG)
Director of Bureau: Secretary for Labour and Welfare Question: Would the Government provide this Committee with the following information: (a) breakdowns by age, gender, industry, occupation and earnings of able-bodied job
seekers who secured placements through the employment services of the Labour Department (LD) in 2015-16;
(b) breakdowns by gender, age, industry and occupation of the changes in average
earnings of able-bodied job seekers who secured placements through the employment services of LD before and after the implementation of Statutory Minimum Wage (SMW) on 1 May 2011?
Asked by: Dr Hon CHIANG Lai-wan (Member Question No. 14) Reply: The information sought is provided as follows: (a) In 2015, LD secured 148 347 placements for able-bodied job seekers. Of these,
14 040 placements were secured through the referral services of LD while 134 307 placements were made through direct application by job seekers to employers who advertised their vacancies through LD. Job seekers who have found work through direct application are not required to report their placements to LD. LD therefore does not have statistics in respect of the placements of these job seekers. Breakdowns of the 14 040 placements secured through the referral of LD by age and gender, industry, occupation and earnings are as follows:
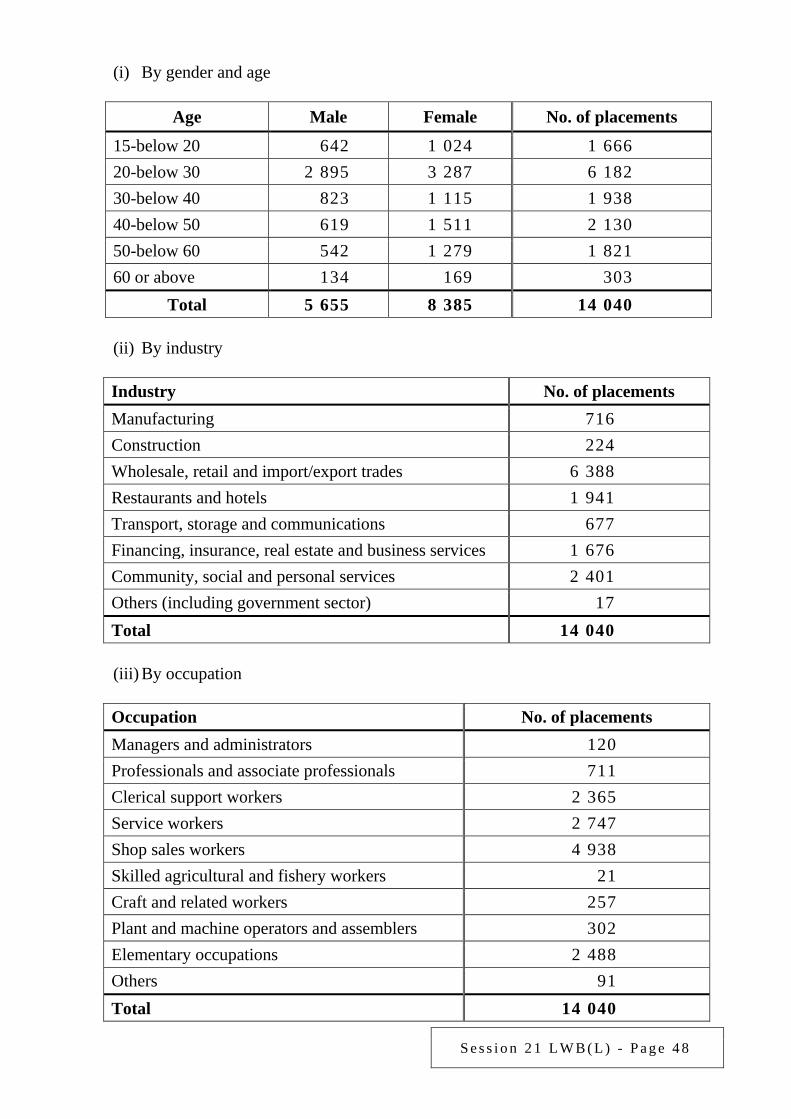
S e s s i o n 2 1 L W B ( L ) - P a g e 4 8
(i) By gender and age
Age Male Female No. of placements
15-below 20 642 1 024 1 666 20-below 30 2 895 3 287 6 182 30-below 40 823 1 115 1 938 40-below 50 619 1 511 2 130 50-below 60 542 1 279 1 821 60 or above 134 169 303
Total 5 655 8 385 14 040 (ii) By industry
Industry No. of placements Manufacturing 716 Construction 224 Wholesale, retail and import/export trades 6 388 Restaurants and hotels 1 941 Transport, storage and communications 677 Financing, insurance, real estate and business services 1 676 Community, social and personal services 2 401 Others (including government sector) 17 Total 14 040
(iii) By occupation
Occupation No. of placements Managers and administrators 120 Professionals and associate professionals 711 Clerical support workers 2 365 Service workers 2 747 Shop sales workers 4 938 Skilled agricultural and fishery workers 21 Craft and related workers 257 Plant and machine operators and assemblers 302 Elementary occupations 2 488 Others 91 Total 14 040
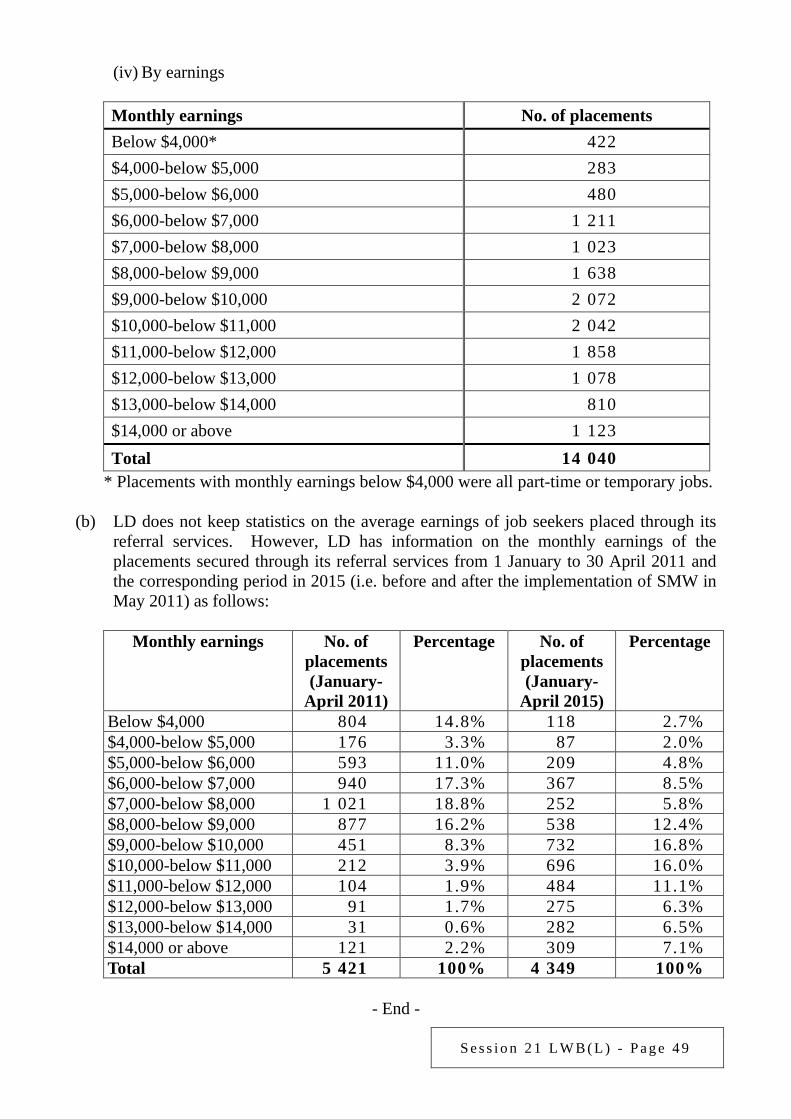
S e s s i o n 2 1 L W B ( L ) - P a g e 4 9
(iv) By earnings
Monthly earnings No. of placements Below $4,000* 422 $4,000-below $5,000 283 $5,000-below $6,000 480 $6,000-below $7,000 1 211 $7,000-below $8,000 1 023 $8,000-below $9,000 1 638 $9,000-below $10,000 2 072 $10,000-below $11,000 2 042 $11,000-below $12,000 1 858 $12,000-below $13,000 1 078 $13,000-below $14,000 810 $14,000 or above 1 123 Total 14 040
* Placements with monthly earnings below $4,000 were all part-time or temporary jobs.
(b) LD does not keep statistics on the average earnings of job seekers placed through its referral services. However, LD has information on the monthly earnings of the placements secured through its referral services from 1 January to 30 April 2011 and the corresponding period in 2015 (i.e. before and after the implementation of SMW in May 2011) as follows:
Monthly earnings No. of
placements (January-
April 2011)
Percentage No. of placements (January-
April 2015)
Percentage
Below $4,000 804 14.8% 118 2.7% $4,000-below $5,000 176 3.3% 87 2.0% $5,000-below $6,000 593 11.0% 209 4.8% $6,000-below $7,000 940 17.3% 367 8.5% $7,000-below $8,000 1 021 18.8% 252 5.8% $8,000-below $9,000 877 16.2% 538 12.4% $9,000-below $10,000 451 8.3% 732 16.8% $10,000-below $11,000 212 3.9% 696 16.0% $11,000-below $12,000 104 1.9% 484 11.1% $12,000-below $13,000 91 1.7% 275 6.3% $13,000-below $14,000 31 0.6% 282 6.5% $14,000 or above 121 2.2% 309 7.1% Total 5 421 100% 4 349 100%
- End -
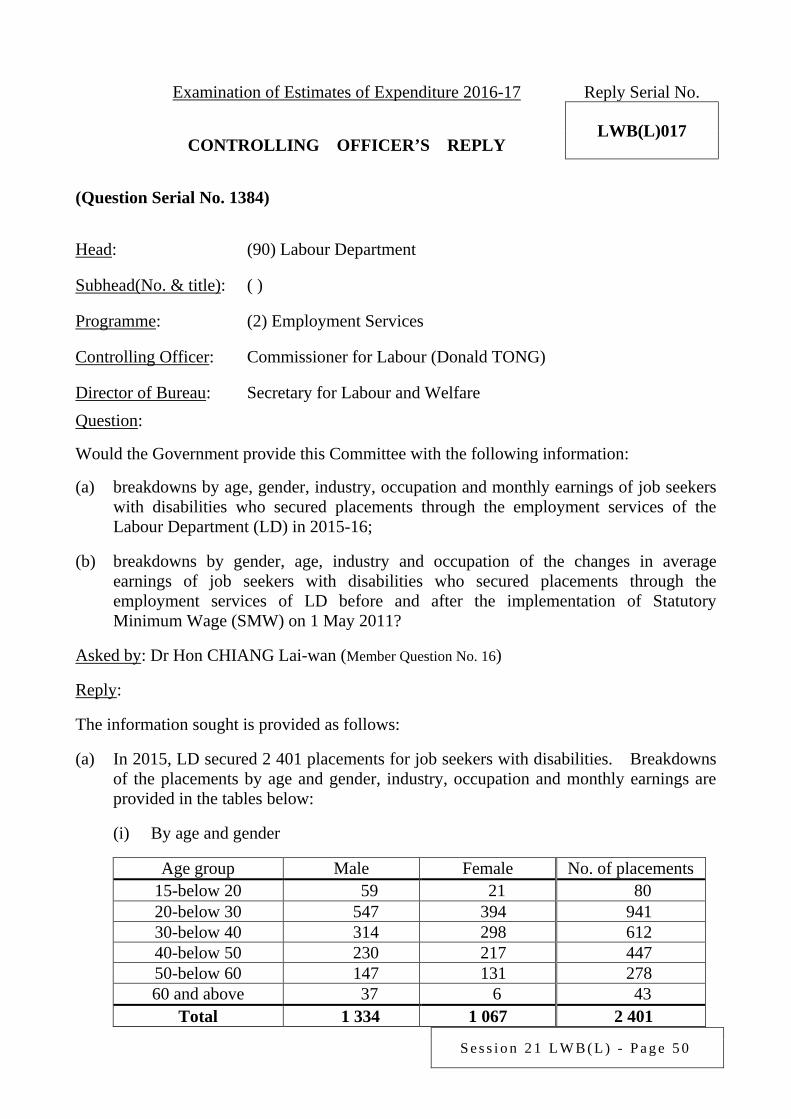
S e s s i o n 2 1 L W B ( L ) - P a g e 5 0
Examination of Estimates of Expenditure 2016-17 Reply Serial No.
LWB(L)017 CONTROLLING OFFICER’S REPLY (Question Serial No. 1384)
Head: (90) Labour Department
Subhead(No. & title): ( )
Programme: (2) Employment Services
Controlling Officer: Commissioner for Labour (Donald TONG)
Director of Bureau: Secretary for Labour and Welfare Question: Would the Government provide this Committee with the following information: (a) breakdowns by age, gender, industry, occupation and monthly earnings of job seekers
with disabilities who secured placements through the employment services of the Labour Department (LD) in 2015-16;
(b) breakdowns by gender, age, industry and occupation of the changes in average
earnings of job seekers with disabilities who secured placements through the employment services of LD before and after the implementation of Statutory Minimum Wage (SMW) on 1 May 2011?
Asked by: Dr Hon CHIANG Lai-wan (Member Question No. 16) Reply: The information sought is provided as follows: (a) In 2015, LD secured 2 401 placements for job seekers with disabilities. Breakdowns
of the placements by age and gender, industry, occupation and monthly earnings are provided in the tables below:
(i) By age and gender
Age group Male Female No. of placements
15-below 20 59 21 80 20-below 30 547 394 941 30-below 40 314 298 612 40-below 50 230 217 447 50-below 60 147 131 278 60 and above 37 6 43
Total 1 334 1 067 2 401
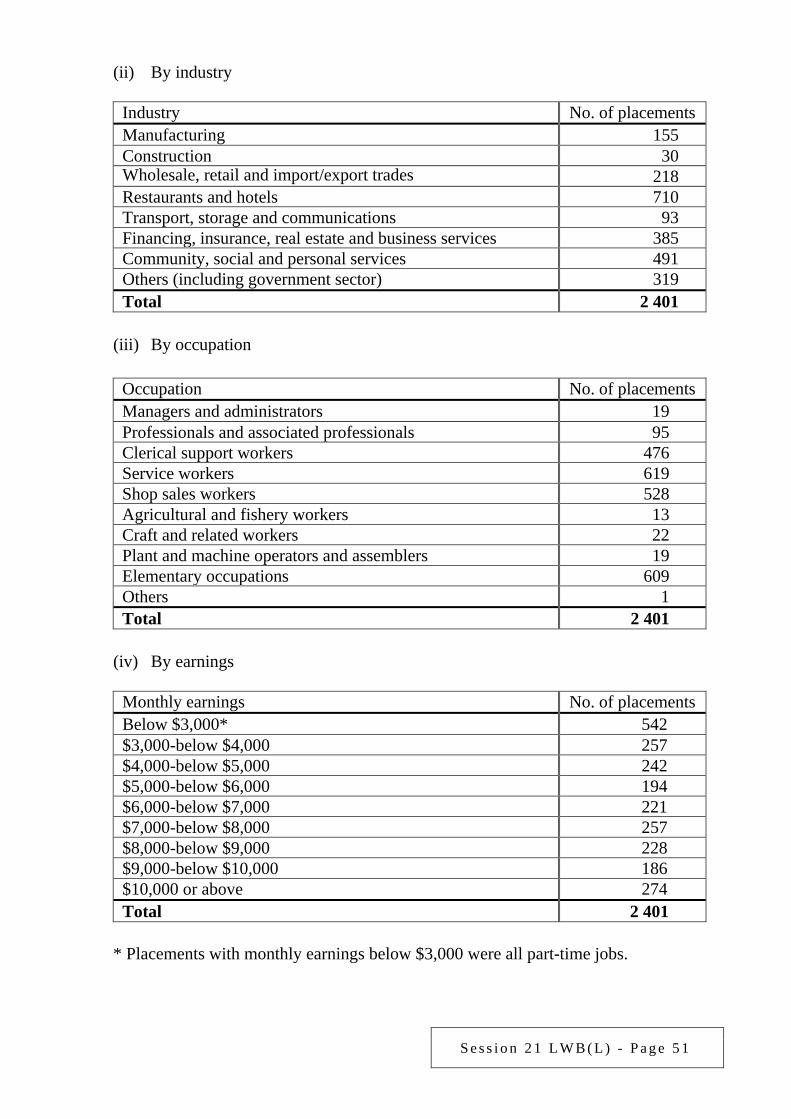
S e s s i o n 2 1 L W B ( L ) - P a g e 5 1
(ii) By industry
Industry No. of placements Manufacturing 155 Construction 30 Wholesale, retail and import/export trades 218 Restaurants and hotels 710 Transport, storage and communications 93 Financing, insurance, real estate and business services 385 Community, social and personal services 491 Others (including government sector) 319 Total 2 401
(iii) By occupation
Occupation No. of placements Managers and administrators 19 Professionals and associated professionals 95 Clerical support workers 476 Service workers 619 Shop sales workers 528 Agricultural and fishery workers 13 Craft and related workers 22 Plant and machine operators and assemblers 19 Elementary occupations 609 Others 1 Total 2 401
(iv) By earnings
Monthly earnings No. of placements Below $3,000* 542 $3,000-below $4,000 257 $4,000-below $5,000 242 $5,000-below $6,000 194 $6,000-below $7,000 221 $7,000-below $8,000 257 $8,000-below $9,000 228 $9,000-below $10,000 186 $10,000 or above 274 Total 2 401
* Placements with monthly earnings below $3,000 were all part-time jobs.

S e s s i o n 2 1 L W B ( L ) - P a g e 5 2
(b) LD does not keep statistics on the average earnings of job seekers placed through referral services. A breakdown of the placements for job seekers with disabilities by monthly earnings from 1 January to 30 April 2011 and the corresponding period in 2015 (i.e. before and after the implementation of SMW in May 2011) is provided below:
Monthly earnings No. of
placements (January-April
2011)
Percentage No. of placements
(January-April 2015)
Percentage
Below $3,000 227 34.1% 189 23.1% $3,000-below $4,000 78 11.7% 115 14.1% $4,000-below $5,000 76 11.4% 93 11.4% $5,000-below $6,000 82 12.3% 63 7.7% $6,000-below $7,000 107 16.1% 66 8.1% $7,000-below $8,000 62 9.3% 88 10.8% $8,000-below $9,000 26 3.8% 79 9.7% $9,000-below $10,000 3 0.5% 65 7.9% $10,000 or above 5 0.8% 60 7.3% Total 666 100% 818 100%
- End -

S e s s i o n 2 1 L W B ( L ) - P a g e 5 3
Examination of Estimates of Expenditure 2016-17 Reply Serial No.
LWB(L)018 CONTROLLING OFFICER’S REPLY (Question Serial No. 1385)
Head: (90) Labour Department
Subhead (No. & title): ( )
Programme: (2) Employment Services
Controlling Officer: Commissioner for Labour (Donald TONG)
Director of Bureau: Secretary for Labour and Welfare Question: Regarding the employment of persons with disabilities, would the Government provide the following information: (a) The respective figures of persons with disabilities employed by government
departments from 2013-14 to 2015-16:
Type of disability 2013-14 2014-15 2015-16 (1) Mobility restrictions (2) Visual impairment (3) Hearing impairment (4) Speech impairment (5) Mental illness/emotional
disorder
(6) Autism (7) Specific learning difficulties (8) Attention deficit/hyperactivity
disorder
(9) Intellectual disability Total Percentage share of persons with disabilities among all government employees
(b) The respective figures of persons with disabilities who secured placements through the
employment services of the Labour Department (LD) from 2013-14 to 2015-16:
Type of disability 2013-14 2014-15 2015-16 (1) Mobility restrictions
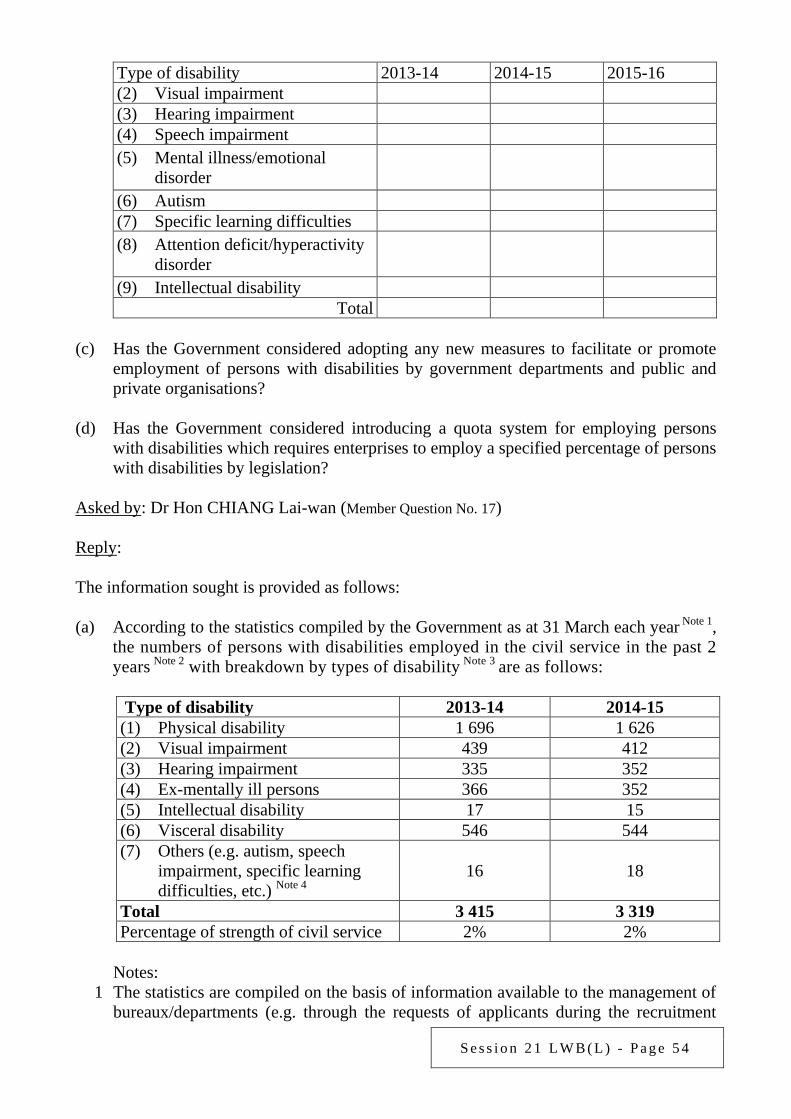
S e s s i o n 2 1 L W B ( L ) - P a g e 5 4
Type of disability 2013-14 2014-15 2015-16 (2) Visual impairment (3) Hearing impairment (4) Speech impairment (5) Mental illness/emotional
disorder
(6) Autism (7) Specific learning difficulties (8) Attention deficit/hyperactivity
disorder
(9) Intellectual disability Total
(c) Has the Government considered adopting any new measures to facilitate or promote
employment of persons with disabilities by government departments and public and private organisations?
(d) Has the Government considered introducing a quota system for employing persons
with disabilities which requires enterprises to employ a specified percentage of persons with disabilities by legislation?
Asked by: Dr Hon CHIANG Lai-wan (Member Question No. 17) Reply: The information sought is provided as follows: (a) According to the statistics compiled by the Government as at 31 March each year Note 1,
the numbers of persons with disabilities employed in the civil service in the past 2 years Note 2 with breakdown by types of disability Note 3 are as follows:
Type of disability 2013-14 2014-15
(1) Physical disability 1 696 1 626 (2) Visual impairment 439 412 (3) Hearing impairment 335 352 (4) Ex-mentally ill persons 366 352 (5) Intellectual disability 17 15 (6) Visceral disability 546 544 (7) Others (e.g. autism, speech
impairment, specific learning difficulties, etc.) Note 4
16 18
Total 3 415 3 319 Percentage of strength of civil service 2% 2%
Notes:
1 The statistics are compiled on the basis of information available to the management of bureaux/departments (e.g. through the requests of applicants during the recruitment
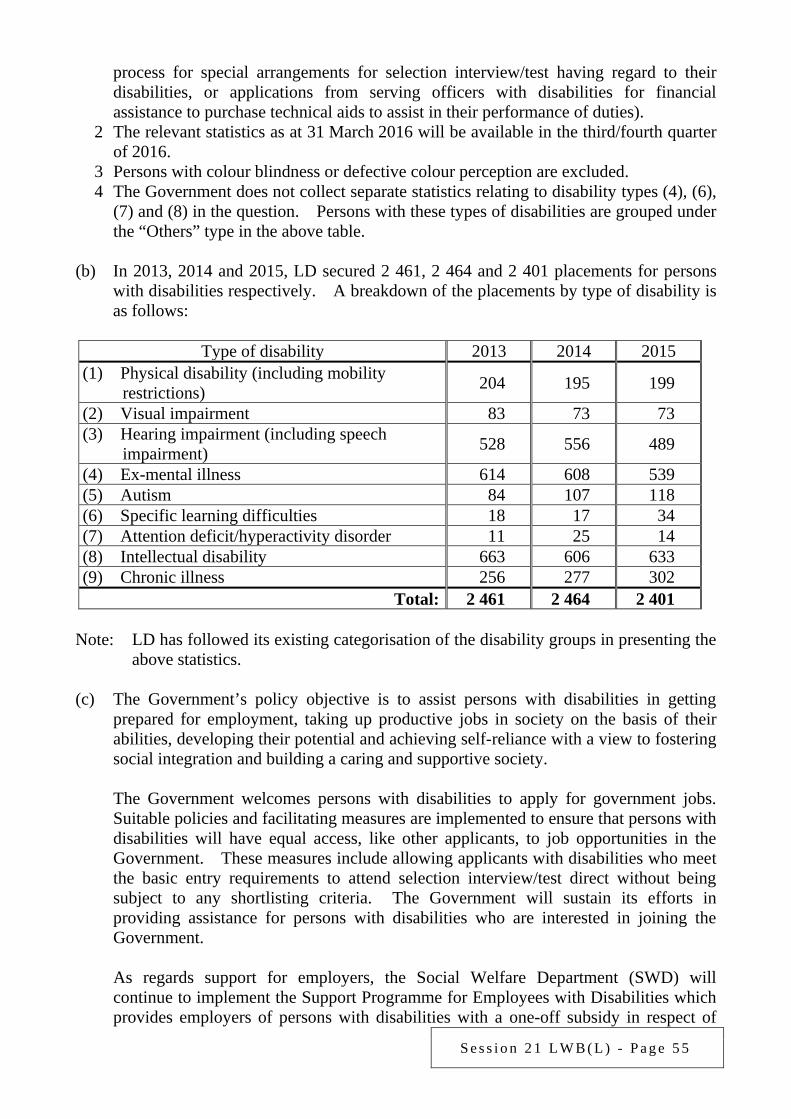
S e s s i o n 2 1 L W B ( L ) - P a g e 5 5
process for special arrangements for selection interview/test having regard to their disabilities, or applications from serving officers with disabilities for financial assistance to purchase technical aids to assist in their performance of duties).
2 The relevant statistics as at 31 March 2016 will be available in the third/fourth quarter of 2016.
3 Persons with colour blindness or defective colour perception are excluded. 4 The Government does not collect separate statistics relating to disability types (4), (6),
(7) and (8) in the question. Persons with these types of disabilities are grouped under the “Others” type in the above table.
(b) In 2013, 2014 and 2015, LD secured 2 461, 2 464 and 2 401 placements for persons
with disabilities respectively. A breakdown of the placements by type of disability is as follows:
Type of disability 2013 2014 2015
(1) Physical disability (including mobility restrictions) 204 195 199
(2) Visual impairment 83 73 73 (3) Hearing impairment (including speech
impairment) 528 556 489
(4) Ex-mental illness 614 608 539 (5) Autism 84 107 118 (6) Specific learning difficulties 18 17 34 (7) Attention deficit/hyperactivity disorder 11 25 14 (8) Intellectual disability 663 606 633 (9) Chronic illness 256 277 302
Total: 2 461 2 464 2 401 Note: LD has followed its existing categorisation of the disability groups in presenting the
above statistics. (c) The Government’s policy objective is to assist persons with disabilities in getting
prepared for employment, taking up productive jobs in society on the basis of their abilities, developing their potential and achieving self-reliance with a view to fostering social integration and building a caring and supportive society.
The Government welcomes persons with disabilities to apply for government jobs.
Suitable policies and facilitating measures are implemented to ensure that persons with disabilities will have equal access, like other applicants, to job opportunities in the Government. These measures include allowing applicants with disabilities who meet the basic entry requirements to attend selection interview/test direct without being subject to any shortlisting criteria. The Government will sustain its efforts in providing assistance for persons with disabilities who are interested in joining the Government.
As regards support for employers, the Social Welfare Department (SWD) will
continue to implement the Support Programme for Employees with Disabilities which provides employers of persons with disabilities with a one-off subsidy in respect of
S e s s i o n 2 1 L W B ( L ) - P a g e 5 6
each employee with disabilities for procurement of assistive devices and/or workplace modifications. Employers of persons with disabilities are offered subsidy of up to $20,000 for each employee with disabilities. SWD has also implemented enhancement measures which include increasing the maximum level of subsidy up to $40,000 for procurement of single item of assistive device and its essential accessories for deserving cases.
LD has been promoting employment of persons with disabilities to employers and
providing support to employers of persons with disabilities. LD will maintain contact with employers of persons with disabilities to keep in view the work progress of employees with disabilities and render appropriate services. In 2016-17, LD will engage a non-governmental organisation under a pilot scheme to provide professional counselling service to needy job seekers with disabilities.
The Labour and Welfare Bureau has launched the Talent-Wise Employment Charter
and Inclusive Organisations Recognition Scheme (the Scheme) since 2013 to mobilise the Government, public and private sectors to make joint efforts to further promote the employment of persons with disabilities through participation in the Scheme. A signatory to the Scheme will devise a host of sustainable measures commensurate with its mode of operation and strive for their effective implementation.
(d) The Government has no plan at this stage to introduce a mandatory employment quota
system to avoid creating a negative labelling effect which is not conducive to persons with disabilities’ integration into the community. The Government will, as in the past, continue to actively provide vocational training and employment support for persons with disabilities, adopt positive encouragement measures, such as giving due recognition to good employers, sharing good practices and providing incentive and assistance to employers, so as to increase job opportunities for persons with disabilities and enhance employers’ willingness to accept and devise facilitating measures for the employment of persons with disabilities, thereby fostering an inclusive society.
- End -
S e s s i o n 2 1 L W B ( L ) - P a g e 5 7
Examination of Estimates of Expenditure 2016-17 Reply Serial No.
LWB(L)019 CONTROLLING OFFICER’S REPLY (Question Serial No. 1386)
Head: (90) Labour Department
Subhead (No. & title): ( )
Programme: (4) Employees’ Rights and Benefits
Controlling Officer: Commissioner for Labour (Donald TONG)
Director of Bureau: Secretary for Labour and Welfare Question: Please provide the following information about Statutory Minimum Wage (SMW): (a) Please set out the manpower and expenditure involved in publicity, consultation
service and enforcement through inspections regarding the implementation of SMW in 2016-17.
(b) What was the total number of enquiries on SMW or complaints against employers’
non-compliance with the Minimum Wage Ordinance (MWO) received by the Labour Department (LD) in 2015-16 and what were the investigation results?
(c) What was the total number of inspections against violations of MWO conducted by
LD in 2015-16 and what were the inspection results? Asked by: Dr Hon CHIANG Lai-wan (Member Question No. 18) Reply: The information sought is provided as follows: (a) The estimated expenditure for publicising SMW in 2016-17 is $3.55 million. As the
publicity, consultation service and enforcement through inspections for SMW are undertaken by staff among their other duties, the manpower and expenditure involved cannot be separately identified.
(b) In 2015, LD held 209 SMW-related consultation meetings with enquirers. LD also
received 63 complaints against employers’ non-compliance with MWO. Follow-up actions on all these complaints confirmed that employees of most cases had received SMW or had recovered the shortfall in wages.
S e s s i o n 2 1 L W B ( L ) - P a g e 5 8
(c) In 2015, LD conducted 38 601 workplace inspections to establishments of various industries to check employers’ compliance with labour laws such as MWO. Including reported cases, 9 cases involving suspected violation of MWO were detected. Follow-up actions on all such cases confirmed that employees of most cases had received SMW or had recovered the shortfall in wages. LD issued 1 warning to an employer suspected to have contravened MWO and secured 4 convictions for breach of SMW requirement.
- End -
S e s s i o n 2 1 L W B ( L ) - P a g e 5 9
Examination of Estimates of Expenditure 2016-17 Reply Serial No.
LWB(L)020 CONTROLLING OFFICER’S REPLY (Question Serial No. 1387)
Head: (90) Labour Department
Subhead (No. & title): ( )
Programme: (4) Employees’ Rights and Benefits
Controlling Officer: Commissioner for Labour (Donald TONG)
Director of Bureau: Secretary for Labour and Welfare Question: Please provide the following information relating to government service contractors: (a) Please set out the number of workers hired by government service contractors in
2015-16, the job titles or occupations involved, the government departments served, their average hourly wage and monthly salary, their average working hours and number of holidays.
(b) In engaging service contractors, does the Government assess if they have taken
comprehensive occupational safety measures? (c) Will the Government consider reviewing the criteria for engaging government service
contractors by making it a requirement in the terms of contract to provide comprehensive employees’ benefits and take occupational safety measures?
Asked by: Dr Hon CHIANG Lai-wan (Member Question No. 19) Reply: The information sought is provided as follows: (a) Individual bureaux/departments (B/Ds) are responsible for their own procurement of
services to meet operational needs, and for administering and overseeing the related service contracts. The Labour Department (LD) does not keep information on the procurement of each B/D and the employment terms of the employees concerned.
(b) Individual B/Ds will consider various factors and circumstances according to their
own needs in engaging service contractors, and assess whether the contractors can fulfil the requirements laid down in the service contracts in selecting suitable service contractors. If a contractor fails to take adequate safety measures as stipulated in the
S e s s i o n 2 1 L W B ( L ) - P a g e 6 0
occupational safety and health legislations, LD will handle the case in accordance with the law.
(c) Individual B/Ds formulate and review the criteria for engaging government service
contractors according to their own needs. Generally speaking, the terms of service contracts have included a requirement for contractors to provide employees with protection such as statutory employment rights and benefits and occupational safety and health. If a contractor fails to comply with the relevant legislations, LD will handle the case in accordance with the law.
- End -
S e s s i o n 2 1 L W B ( L ) - P a g e 6 1
Examination of Estimates of Expenditure 2016-17 Reply Serial No.
LWB(L)021 CONTROLLING OFFICER’S REPLY (Question Serial No. 1388)
Head: (90) Labour Department
Subhead (No. & title): ( )
Programme: (4) Employees’ Rights and Benefits
Controlling Officer: Commissioner for Labour (Donald TONG)
Director of Bureau: Secretary for Labour and Welfare Question: It is stated in the Programme that the Labour Department (LD) has continued its promotional efforts in enhancing the understanding of employers and foreign domestic helpers (FDHs) on their statutory and contractual rights and obligations. In this connection, would the Government provide the following information: (a) Please set out the respective numbers of breaches of the Employment Ordinance (EO)
and Immigration Ordinance (IO) by FDHs and their employers as well as the category of offences committed in the past 3 years.
(b) Are there any strategies, measures or inspections to reduce non-compliance of EO or
IO by FDHs and their employers? Asked by: Dr Hon CHIANG Lai-wan (Member Question No. 20) Reply: The information sought is provided as follows: (a) In 2013, 2014 and 2015, the numbers of cases in which FDH employers were
convicted of offences under EO were 3, 3 and 2 respectively. The offences were related to late payment or non-payment of wages, holidays, or defaults on the awarded payment of the Labour Tribunal.
Over the same period, the numbers of cases in which FDHs were arrested for breaching IO were 793, 749 and 962 respectively. The cases involved FDHs taking up illegal employment, making false representations to officers of the Immigration Department (ImmD) for obtaining FDH employment visas or overstaying. The numbers of cases in which FDH employers were arrested for breaching IO were 200, 148 and 135 respectively. The cases involved employers illegally employing FDHs,
S e s s i o n 2 1 L W B ( L ) - P a g e 6 2
instructing FDHs to perform non-domestic duties, or aiding or abetting FDHs in making false representations to officers of ImmD for obtaining employment visas.
(b) To enhance understanding of FDHs and their employers of the relevant provisions in
EO and IO and the consequences of non-compliance, LD and ImmD produce practical guides, leaflets and posters in a number of FDHs’ mother languages, organise roving exhibitions and seminars to promote the relevant provisions, place advertisements in local newspapers usually read by FDHs, set up information kiosks at the popular gathering places of FDHs on their rest days, broadcast television and radio Announcements in the Public Interest and disseminate information to FDHs through the publicity channels of mobile network operators. Meanwhile, LD has been collaborating more closely with the consulates concerned in organising briefings for newly-arrived FDHs to provide relevant information to them. Relevant materials in different languages are provided to the consulates concerned, FDH groups and non-governmental organisations as well and are uploaded to LD’s website for public viewing. Moreover, LD produces leaflets specifically for FDH employers to remind them of the points to note when employing FDHs. LD also briefs employment agencies through talks and seminars on matters relating to the employment of FDHs.
Regarding the efforts against FDHs engaging in activities in breach of IO, relevant measures and enforcement actions taken by ImmD include: assessing FDHs’ employment visa applications in a rigorous manner, enhancing intelligence collection, stepping up investigation and prosecution against FDHs taking up unauthorised work, enhancing publicity and encouraging the public to report illegal employment.
- End -
S e s s i o n 2 1 L W B ( L ) - P a g e 6 3
Examination of Estimates of Expenditure 2016-17 Reply Serial No.
LWB(L)022 CONTROLLING OFFICER’S REPLY (Question Serial No. 1389)
Head: (90) Labour Department
Subhead (No. & title): ( )
Programme: (4) Employees’ Rights and Benefits
Controlling Officer: Commissioner for Labour (Donald TONG)
Director of Bureau: Secretary for Labour and Welfare Question: Regarding combating illegal employment, would the Government provide the following information: (a) What are the specific work details of as well as the expenditure and staff establishment
involved in combating illegal employment in 2016-17? (b) What were the numbers of cases of illegal employment, and the employers and illegal
workers involved in the past 3 years (2013-14 to 2015-16)? How many of these cases involved torture claims, including those made before and after arrest?
(c) The torture claim mechanism is abused by some claimants who seek to work illegally
in Hong Kong. Has the Government considered adopting new measures to tackle the problem of illegal employment?
Asked by: Dr Hon CHIANG Lai-wan (Member Question No. 21) Reply: The information sought is provided as follows: (a) In 2016-17, the Labour Department (LD) will continue to mount intelligence-based
joint operations with the Police and the Immigration Department (ImmD) to raid establishments suspected to have been involved in illegal employment. LD will also launch territory-wide publicity activities through various channels to enhance public awareness of the serious consequences of employing illegal workers and encourage the reporting of suspected offences.
Combating illegal employment is part of the duties of labour inspectors who are also
responsible for the enforcement of various labour laws. Hence, LD cannot separately
S e s s i o n 2 1 L W B ( L ) - P a g e 6 4
identify the expenditure and staff establishment involved in combating illegal employment. LD has earmarked $220,000 as expenditure for publicity against illegal employment in 2016-17.
(b) The number of cases of suspected illegal employment detected by LD and the numbers
of employers and illegal workers involved in the past 3 years are tabulated as follows:
2013 2014 2015 Number of cases of suspected illegal employment 215 206 198
Number of employers involved 169 131 149 Number of illegal workers involved 312 233 281
All cases of suspected illegal employment were referred to ImmD or the Police for
further follow-up. LD does not have information as to whether these cases involved torture claims.
(c) Combating illegal employment is an ongoing effort of LD. In 2016-17, LD will
continue to proactively collect intelligence and combat illegal employment at various levels in conjunction with other law enforcement departments. LD will also regularly review the effectiveness of the enforcement actions.
- End -
S e s s i o n 2 1 L W B ( L ) - P a g e 6 5
Examination of Estimates of Expenditure 2016-17 Reply Serial No.
LWB(L)023 CONTROLLING OFFICER’S REPLY (Question Serial No. 1390)
Head: (90) Labour Department
Subhead (No. & title): ( )
Programme: (1) Labour Relations (4) Employees’ Rights and Benefits
Controlling Officer: Commissioner for Labour (Donald TONG)
Director of Bureau: Secretary for Labour and Welfare Question: Regarding tackling involuntary false self-employment, would the Government provide the following information: (a) Please set out the staff establishment and expenditure involved in tackling false
self-employment in 2016-17. (b) Please set out the total number of complaints handled by the Labour Department (LD)
involving false self-employment or employees who involuntarily signed self-employment contracts in the past 3 years (from 2013-14 to 2015-16) and, among which, the number of successful convictions.
(c) Since the implementation of Statutory Minimum Wage, the problem of disputes
involving false self-employment in the labour market has been getting worse. In this regard, has the Government considered educating employees on how to protect their statutory rights in an employer-employee relationship through publicity and education, and stepping up efforts in monitoring and tackling the employer-initiated signing of self-employment contracts by employees?
Asked by: Dr Hon CHIANG Lai-wan (Member Question No. 22) Reply: The information sought is provided as follows: (a) LD staff responsible for detecting false self-employment are also responsible for the
enforcement of various labour laws. Therefore, the manpower and expenditure involved in tackling false self-employment cannot be separately identified.
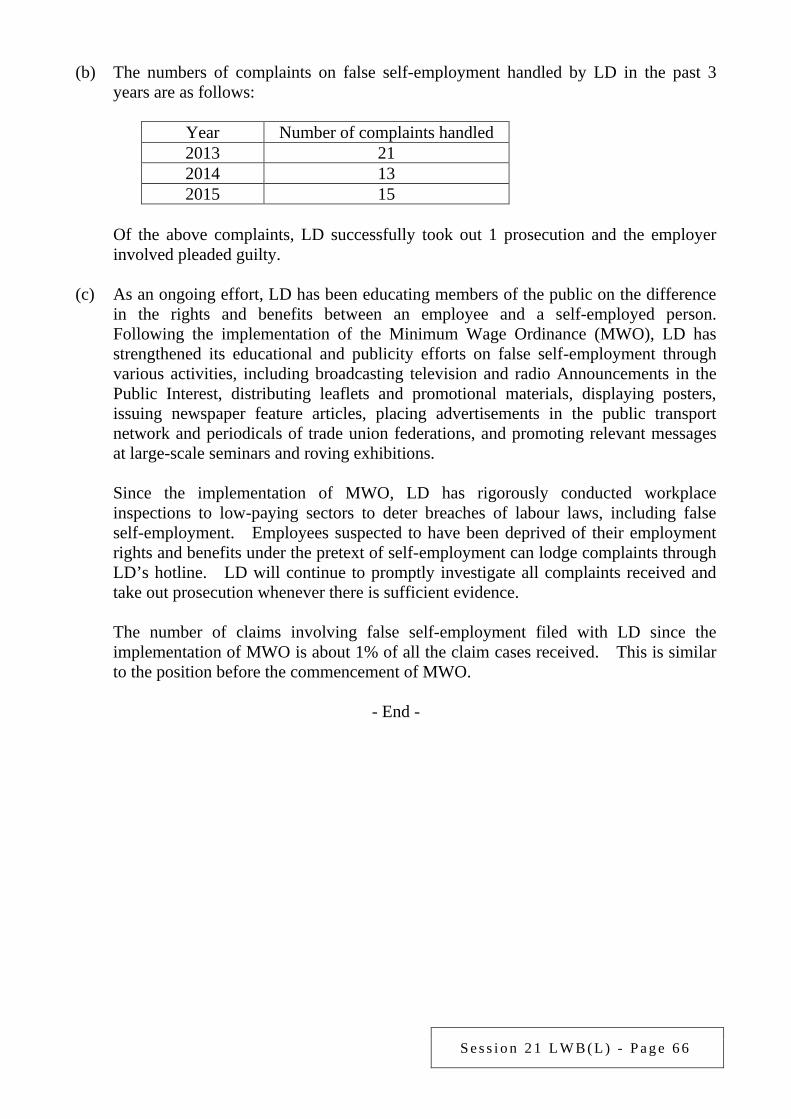
S e s s i o n 2 1 L W B ( L ) - P a g e 6 6
(b) The numbers of complaints on false self-employment handled by LD in the past 3 years are as follows:
Year Number of complaints handled 2013 21 2014 13 2015 15
Of the above complaints, LD successfully took out 1 prosecution and the employer
involved pleaded guilty.
(c) As an ongoing effort, LD has been educating members of the public on the difference in the rights and benefits between an employee and a self-employed person. Following the implementation of the Minimum Wage Ordinance (MWO), LD has strengthened its educational and publicity efforts on false self-employment through various activities, including broadcasting television and radio Announcements in the Public Interest, distributing leaflets and promotional materials, displaying posters, issuing newspaper feature articles, placing advertisements in the public transport network and periodicals of trade union federations, and promoting relevant messages at large-scale seminars and roving exhibitions.
Since the implementation of MWO, LD has rigorously conducted workplace
inspections to low-paying sectors to deter breaches of labour laws, including false self-employment. Employees suspected to have been deprived of their employment rights and benefits under the pretext of self-employment can lodge complaints through LD’s hotline. LD will continue to promptly investigate all complaints received and take out prosecution whenever there is sufficient evidence.
The number of claims involving false self-employment filed with LD since the
implementation of MWO is about 1% of all the claim cases received. This is similar to the position before the commencement of MWO.
- End -
S e s s i o n 2 1 L W B ( L ) - P a g e 6 7
Examination of Estimates of Expenditure 2016-17 Reply Serial No.
LWB(L)024 CONTROLLING OFFICER’S REPLY (Question Serial No. 1391)
Head: (90) Labour Department
Subhead (No. & title): ( )
Programme: (3) Safety and Health at Work
Controlling Officer: Commissioner for Labour (Donald TONG)
Director of Bureau: Secretary for Labour and Welfare Question: Regarding the protection of occupational safety and health, would the Government provide the following information: (a) the details of and expenditure and staff establishment for the publicity, educational and
promotional campaigns as well as inspections targeting various contraventions of the occupational safety and health codes for 2016-17;
(b) whether the Government has considered introducing measures targeting industries
with more occupational injuries, such as catering, transport, manufacturing and construction industries, to enhance the awareness of employers and employees in these industries on occupational safety and health?
Asked by: Dr Hon CHIANG Lai-wan (Member Question No. 23) Reply: The information sought is provided as follows: (a) The Labour Department (LD) will continue to adopt a multi-pronged strategy to
enhance occupational safety and health in various industries through inspection and enforcement, education and training as well as publicity and promotion. LD will also launch special enforcement operations targeting high-risk processes, such as work-at-height, lifting operations and electrical work. In respect of publicity, education and promotion, LD will, in collaboration with the Occupational Safety and Health Council, major trade associations and the workers’ unions concerned, organise promotional campaigns to enhance the occupational safety and health awareness of employers and employees in various industries through training courses, seminars, roving exhibitions, out-reaching promotional visits, television and radio Announcements in the Public Interest, occupational safety and health messages
S e s s i o n 2 1 L W B ( L ) - P a g e 6 8
publicised on newspapers and LD’s webpages, and compilation and updating of safety guidelines. LD will also conduct inspections and promotions for different industries and workplaces in accordance with the risks of the industries and work processes involved. The above work is an integral part of LD’s ongoing work on occupational safety and health, and the expenditure and manpower involved cannot be separately identified.
(b) Apart from the education, publicity and promotion efforts mentioned above, LD will
launch in 2016-17 large-scale promotional campaigns targeting the construction and catering industries to enhance the safety awareness of employers and employees in these industries, as the construction industry records the highest accident rate and number of fatalities, while the catering industry accounts for the largest number of accidents. LD will also continue to keep in view the occupational accident rates and occupational injuries in other industries, including the transport and manufacturing industries, and enhance publicity and promotional programmes on occupational safety and health for the industries concerned where necessary.
- End -
S e s s i o n 2 1 L W B ( L ) - P a g e 6 9
Examination of Estimates of Expenditure 2016-17 Reply Serial No.
LWB(L)025 CONTROLLING OFFICER’S REPLY (Question Serial No. 1392)
Head: (90) Labour Department
Subhead (No. & title): ( )
Programme: (1) Labour Relations
Controlling Officer: Commissioner for Labour (Donald TONG)
Director of Bureau: Secretary for Labour and Welfare Question: There are views in the community that the Government should conduct a comprehensive review on the existing legislation on the age limit of industry personnel. Would the Government advise this Committee of the following: (a) the occupations which are currently subject to a statutory retirement age and the
requirements concerned; whether it has compiled statistics on such occupations in relation to the average retirement age in the past 3 years, the number of serving employees, as well as the number and percentage of those employees expected to be retiring within the coming 3 years;
(b) given that elderly persons of the present age generally have better health conditions
than those in the past, and that technological advancements have rendered many occupations less physically demanding than in the past, does it have plans to conduct a review and industry consultations on whether the statutory retirement ages of various occupations still suit the present circumstances, so as to explore room for upward adjustment of the retirement ages; if yes, what are the details; if not, what are the reasons; and
(c) whether it has studied and formulated measures to promote elderly-friendly work
environment to encourage elderly employment; if yes, what are the details; if not, what are the reasons?
Asked by: Dr Hon CHIANG Lai-wan (Member Question No. 24) Reply: The information sought is provided as follows:
S e s s i o n 2 1 L W B ( L ) - P a g e 7 0
(a) & (b) Under the Security and Guarding Services Ordinance (Cap. 460), there are 4 categories (A, B, C and D) of Security Personnel Permits (SPP). Category B SPP covers a wide range of security services. Its holders may perform guarding work in respect of any persons, premises or properties. Category C SPP is required for performing guarding work which requires the carrying of arms and ammunition. The upper age limits for Categories B and C SPP are set at the age of 70 and 55 respectively. At present, there are 274 600 and 1 600 Categories B and C holders respectively. Among them, there are about 5 400 Category B SPP holders aged between 67 and 69, and 67 Category C SPP holders aged between 52 and 54. The Government does not keep information on the average retirement age of security personnel, the number of serving security personnel, and the number and percentage of those expected to be retiring within the coming 3 years.
In line with the Population Policy of extending the working life of citizens and
unleashing the potential of local workforce, and having considered the actual situation of the security industry and its regulatory requirements and consulted the trade and labour organisations, the Security and Guarding Services Industry Authority raised the upper age limit of Category B security personnel from 65 to 70 and imposed a biennial medical check requirement for holders aged 65 or above on 18 December 2015.
To ensure navigational safety of non-local vessels within the waters of Hong
Kong, the Pilotage Ordinance (Cap. 84) stipulates that all vessels of 3 000 gross tonnage or over and some other specified vessels, while navigating in the waters of Hong Kong, shall be under the pilotage of licensed pilot. In May 2013, the Ordinance was amended to allow Class I pilots beyond the age of 65 to continue to work in accordance with their licences until the age of 68. The statistics of serving and retired pilots are set out at Annex 1.
Under the Education Ordinance (Cap. 279), a teacher or principal in the
establishment of an aided school shall normally not continue to be employed if he/she has attained the age of 60 years or more before the commencement of the school year. However, the Permanent Secretary for Education may issue to the Incorporated Management Committee or School Management Committee of the aided school concerned permission to continue to employ the teacher or principal aged 60 or above for a period of not more than one school year. The maximum aggregate period for which permission may be issued shall be five consecutive school years. The statistics on teachers of public sector secondary and primary schools are set out at Annex 2.
(c) Since 1 June 2015, the Government has raised the retirement age for new recruits
to the civilian grades to 65 and that for the disciplined services grades to 60. As regards extending the service of serving civil servants, a Post-retirement Service Contract Scheme has been introduced, which enables departments to engage retired civil servants on contract terms to undertake ad hoc duties requiring specific civil service expertise or experience. Meanwhile, the staff sides have
S e s s i o n 2 1 L W B ( L ) - P a g e 7 1
been engaged in discussions about the implementation details of adjusted mechanism on further employment of civil servants beyond retirement age.
In respect of the promotion of a friendly working environment for mature
persons, the Labour Department will continue to encourage employers, through various publicity channels and a range of educational and promotional activities, to adopt friendly employment practices at workplaces, which include measures suitable for mature persons, having regard to the individual circumstances of their companies. The activities include staging roving exhibitions in various districts throughout the territory, publishing feature articles in newspapers, widely distributing publications, broadcasting on television and radio, placing advertisements in the public transport network and publicising relevant messages through different employers’ networks, etc.
S e s s i o n 2 1 L W B ( L ) - P a g e 7 2
Annex 1
Statistics of Serving and Retired Pilots
Serving Pilots At present, there are a total of 105 licensed pilots and 3 apprentice pilots in Hong Kong. Retired Pilots A total of 10 pilots retired in the past 3 years (i.e. 2013, 2014 and 2015) at an average retirement age of 64.8.
A total of 8 pilots are expected to retire in the coming 3 years (i.e. 2016, 2017 and 2018), which represents 7.6% of the current number of serving licensed pilots.
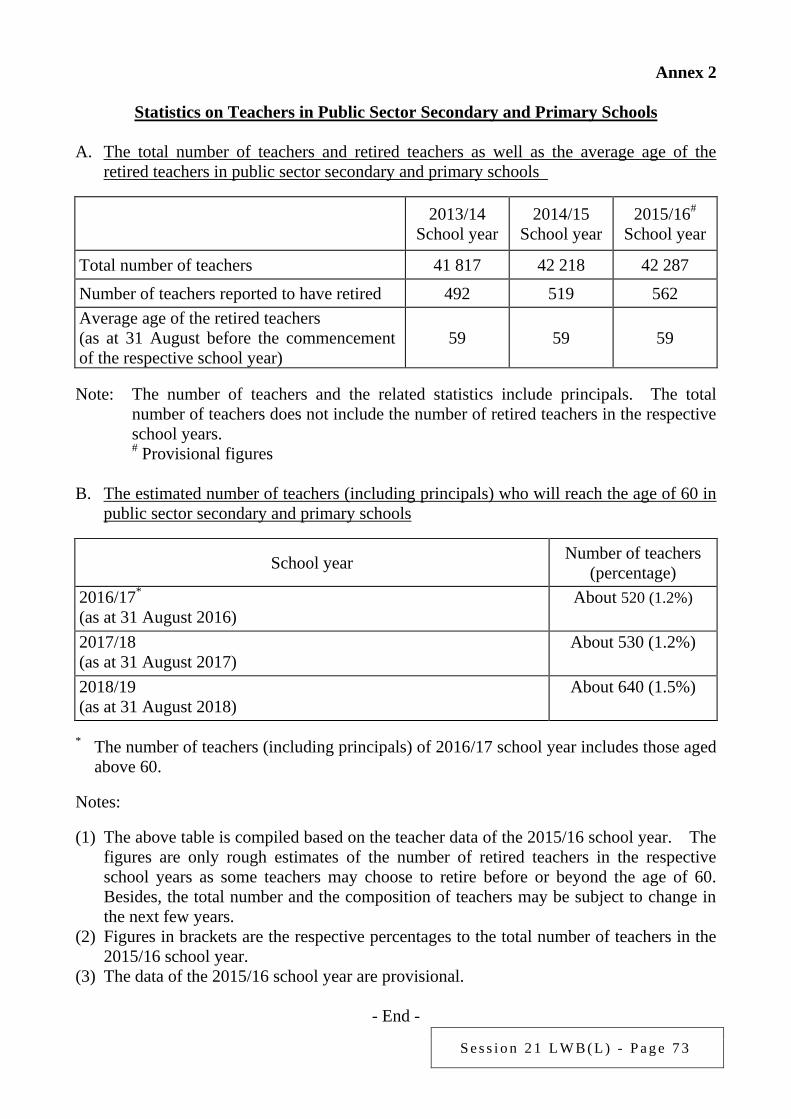
S e s s i o n 2 1 L W B ( L ) - P a g e 7 3
Annex 2
Statistics on Teachers in Public Sector Secondary and Primary Schools
A. The total number of teachers and retired teachers as well as the average age of the retired teachers in public sector secondary and primary schools
2013/14
School year 2014/15
School year 2015/16#
School year
Total number of teachers 41 817 42 218 42 287
Number of teachers reported to have retired 492 519 562 Average age of the retired teachers (as at 31 August before the commencement of the respective school year)
59 59 59
Note: The number of teachers and the related statistics include principals. The total
number of teachers does not include the number of retired teachers in the respective school years.
# Provisional figures B. The estimated number of teachers (including principals) who will reach the age of 60 in
public sector secondary and primary schools
School year Number of teachers (percentage)
2016/17* (as at 31 August 2016)
About 520 (1.2%)
2017/18 (as at 31 August 2017)
About 530 (1.2%)
2018/19 (as at 31 August 2018)
About 640 (1.5%)
* The number of teachers (including principals) of 2016/17 school year includes those aged
above 60. Notes: (1) The above table is compiled based on the teacher data of the 2015/16 school year. The
figures are only rough estimates of the number of retired teachers in the respective school years as some teachers may choose to retire before or beyond the age of 60. Besides, the total number and the composition of teachers may be subject to change in the next few years.
(2) Figures in brackets are the respective percentages to the total number of teachers in the 2015/16 school year.
(3) The data of the 2015/16 school year are provisional.
- End -
S e s s i o n 2 1 L W B ( L ) - P a g e 7 4
Examination of Estimates of Expenditure 2016-17 Reply Serial No.
LWB(L)026 CONTROLLING OFFICER’S REPLY (Question Serial No. 1393)
Head: (90) Labour Department
Subhead (No. & title): ( )
Programme: (3) Safety and Health at Work
Controlling Officer: Commissioner for Labour (Donald TONG)
Director of Bureau: Secretary for Labour and Welfare Question: The Employees’ Compensation Ordinance (ECO), Occupational Deafness (Compensation) Ordinance (ODCO) and Pneumoconiosis and Mesothelioma (Compensation) Ordinance (PMCO) prescribe altogether 52 occupational diseases. Would the Government provide: (a) the number of confirmed cases for each type of occupational diseases in 2013-14,
2014-15 and 2015-16; (b) the number of services provided and the average waiting time for an appointment at
the 2 occupational health clinics of the Labour Department (LD) in Kwun Tong and Fanling in 2013-14, 2014-15 and 2015-16;
(c) whether the Government has any plan to review the types of occupational diseases and
consider prescribing more common diseases suffered by employees as occupational diseases?
Asked by: Dr Hon CHIANG Lai-wan (Member Question No. 25) Reply: The information sought is provided as follows: (a) The number of confirmed cases for each type of occupational diseases from 2013 to
2015 is provided below:
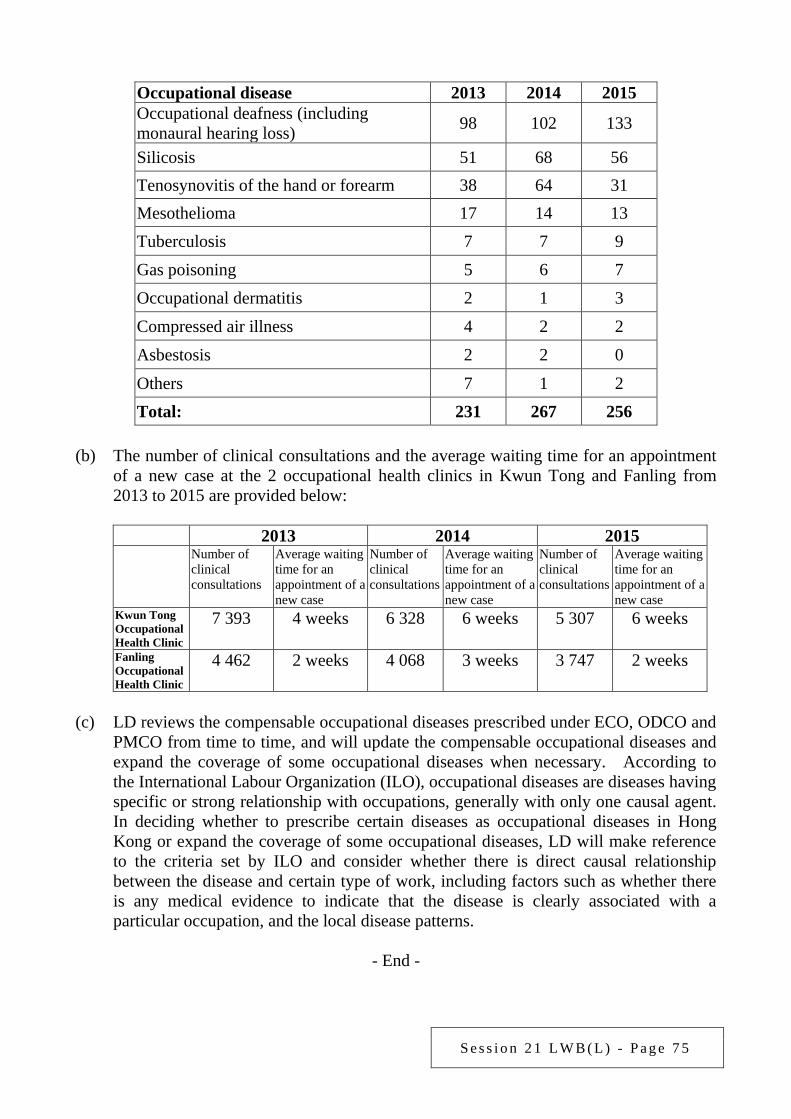
S e s s i o n 2 1 L W B ( L ) - P a g e 7 5
Occupational disease 2013 2014 2015 Occupational deafness (including monaural hearing loss) 98 102 133
Silicosis 51 68 56 Tenosynovitis of the hand or forearm 38 64 31 Mesothelioma 17 14 13 Tuberculosis 7 7 9 Gas poisoning 5 6 7 Occupational dermatitis 2 1 3 Compressed air illness 4 2 2 Asbestosis 2 2 0
Others 7 1 2 Total: 231 267 256
(b) The number of clinical consultations and the average waiting time for an appointment
of a new case at the 2 occupational health clinics in Kwun Tong and Fanling from 2013 to 2015 are provided below:
2013 2014 2015
Number of clinical consultations
Average waiting time for an appointment of a new case
Number of clinical consultations
Average waiting time for an appointment of a new case
Number of clinical consultations
Average waiting time for an appointment of a new case
Kwun Tong Occupational Health Clinic
7 393 4 weeks 6 328 6 weeks 5 307 6 weeks
Fanling Occupational Health Clinic
4 462 2 weeks 4 068 3 weeks 3 747 2 weeks
(c) LD reviews the compensable occupational diseases prescribed under ECO, ODCO and
PMCO from time to time, and will update the compensable occupational diseases and expand the coverage of some occupational diseases when necessary. According to the International Labour Organization (ILO), occupational diseases are diseases having specific or strong relationship with occupations, generally with only one causal agent. In deciding whether to prescribe certain diseases as occupational diseases in Hong Kong or expand the coverage of some occupational diseases, LD will make reference to the criteria set by ILO and consider whether there is direct causal relationship between the disease and certain type of work, including factors such as whether there is any medical evidence to indicate that the disease is clearly associated with a particular occupation, and the local disease patterns.
- End -
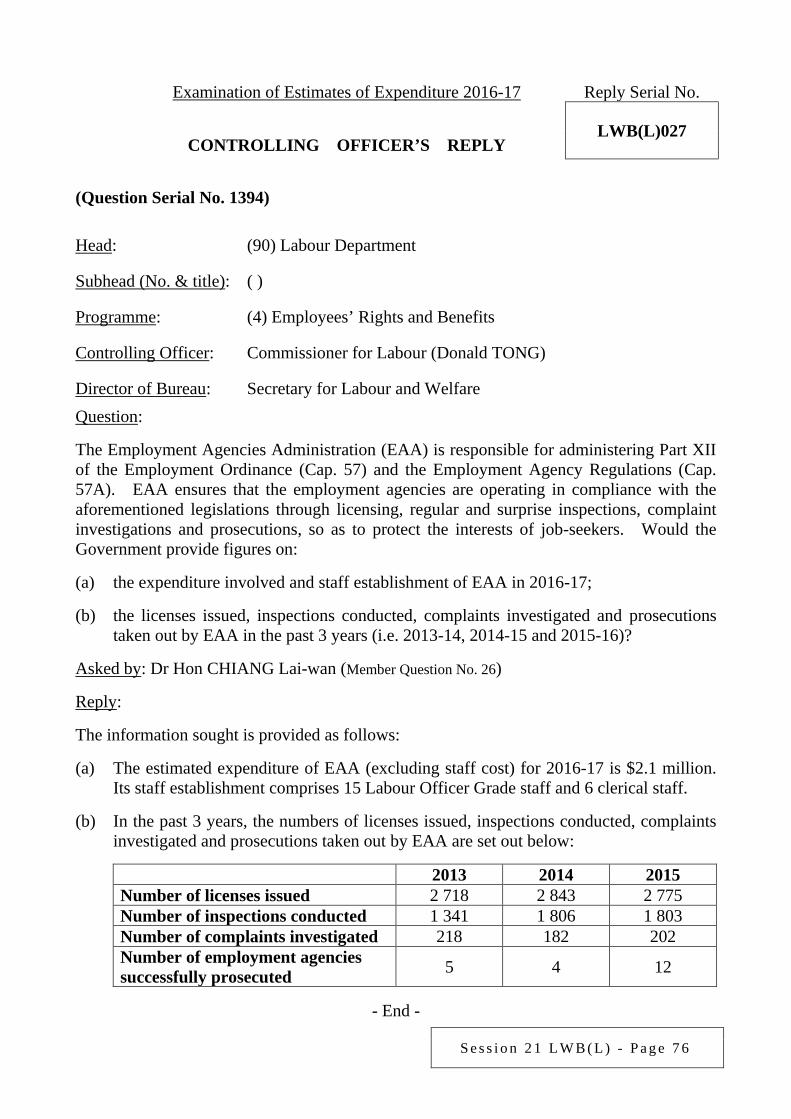
S e s s i o n 2 1 L W B ( L ) - P a g e 7 6
Examination of Estimates of Expenditure 2016-17 Reply Serial No.
LWB(L)027 CONTROLLING OFFICER’S REPLY (Question Serial No. 1394)
Head: (90) Labour Department
Subhead (No. & title): ( )
Programme: (4) Employees’ Rights and Benefits
Controlling Officer: Commissioner for Labour (Donald TONG)
Director of Bureau: Secretary for Labour and Welfare Question: The Employment Agencies Administration (EAA) is responsible for administering Part XII of the Employment Ordinance (Cap. 57) and the Employment Agency Regulations (Cap. 57A). EAA ensures that the employment agencies are operating in compliance with the aforementioned legislations through licensing, regular and surprise inspections, complaint investigations and prosecutions, so as to protect the interests of job-seekers. Would the Government provide figures on: (a) the expenditure involved and staff establishment of EAA in 2016-17; (b) the licenses issued, inspections conducted, complaints investigated and prosecutions
taken out by EAA in the past 3 years (i.e. 2013-14, 2014-15 and 2015-16)? Asked by: Dr Hon CHIANG Lai-wan (Member Question No. 26) Reply: The information sought is provided as follows: (a) The estimated expenditure of EAA (excluding staff cost) for 2016-17 is $2.1 million.
Its staff establishment comprises 15 Labour Officer Grade staff and 6 clerical staff. (b) In the past 3 years, the numbers of licenses issued, inspections conducted, complaints
investigated and prosecutions taken out by EAA are set out below:
2013 2014 2015 Number of licenses issued 2 718 2 843 2 775 Number of inspections conducted 1 341 1 806 1 803 Number of complaints investigated 218 182 202 Number of employment agencies successfully prosecuted 5 4 12
- End -

S e s s i o n 2 1 L W B ( L ) - P a g e 7 7
Examination of Estimates of Expenditure 2016-17 Reply Serial No.
LWB(L)028 CONTROLLING OFFICER’S REPLY (Question Serial No. 1395)
Head: (90) Labour Department
Subhead (No. & title): ( )
Programme: (2) Employment Services
Controlling Officer: Commissioner for Labour (Donald TONG)
Director of Bureau: Secretary for Labour and Welfare Question: The Labour Department (LD) will implement the pilot Employment Services Ambassador Programme for Ethnic Minorities (ESAP), under which trainees of the Youth Employment and Training Programme (YETP) who can communicate in ethnic minority languages are employed to work as employment services ambassadors (ESAs) in LD’s job centres, recruitment centres and job fairs. Please provide the details, expenditure and staff establishment of the above pilot programme. Asked by: Dr Hon CHIANG Lai-wan (Member Question No. 27) Reply: To strengthen the employment services for ethnic minorities, LD has launched since September 2014 ESAP, under which trainees of YETP who can communicate in ethnic minority languages are employed as ESAs for 6 months. Since the launch of ESAP, LD has employed 63 trainees who were assigned to work in LD’s job centres or industry-based recruitment centres. Their main duties were to assist in handling enquiries from job seekers, in particular ethnic minorities, on the employment services of LD, and help them use various facilities in job centres; to render on-site support in job fairs organised by LD; to assist in establishing and maintaining contact with members of the ethnic minority communities to promote the employment services of LD; and to conduct questionnaire surveys and follow-up with ethnic minority job seekers on their employment situation. The expenditures for providing on-the-job training under ESAP were about $0.77 million and $1.75 million in 2014-15 and 2015-16 respectively. LD has earmarked $1.95 million as expenditure for providing related on-the-job training in 2016-17, which includes payments for the salary and benefits of ethnic minority ESAs, training allowance for the trainees, expenditure for training programmes, etc. ESAP is implemented by LD staff among their other duties, and the manpower involved cannot be separately identified.
- End -
S e s s i o n 2 1 L W B ( L ) - P a g e 7 8
Examination of Estimates of Expenditure 2016-17 Reply Serial No.
LWB(L)029 CONTROLLING OFFICER’S REPLY (Question Serial No. 1397)
Head: (90) Labour Department
Subhead (No. & title): ( )
Programme: (2) Employment Services
Controlling Officer: Commissioner for Labour (Donald TONG)
Director of Bureau: Secretary for Labour and Welfare Question: In order to provide our youths the opportunity of living and working temporarily overseas while holidaymaking, those aged 18 to 30 may now apply for working holiday visas with the relevant host economies. Would the Government provide the following information: (a) the details of the Working Holiday Scheme (WHS), including the number of
signatories, the length of stay allowed in each country and whether engagement in short-term employment and short-term courses is allowed, etc.;
(b) a breakdown by country in table form of the local youths who applied for working
holiday visas for other economies and the youths from other economies who applied for working holiday visas for Hong Kong in the past 3 years (2013-14 to 2015-16); and
(c) whether the Government has any plan to explore the signing of WHS arrangements
with more economies and encourage more of our youths to enrich their global exposure?
Asked by: Dr Hon CHIANG Lai-wan (Member Question No. 29) Reply: The information sought is provided as follows: (a) Since 2001, the HKSAR Government has established bilateral WHS arrangements
with the governments of 10 economies, namely New Zealand, Australia, Ireland, Germany, Japan, Canada, Korea, France, the United Kingdom (UK) and Austria. Save for the WHS arrangements established with the UK and Austria which allow Hong Kong youths to stay for up to 24 months and 6 months respectively, participants of the remaining 8 WHS are allowed to stay in the partner economies for up to 12 months for holidaying, taking up short-term employment to subsidise their travel
S e s s i o n 2 1 L W B ( L ) - P a g e 7 9
expenses, and/or studying short-term courses (except Ireland under its established visa policy).
(b) Based on the information provided by the governments of WHS partner economies
and the Immigration Department, breakdowns of the number of Hong Kong youths and youths from partner economies who were granted working holiday visas from 2013 to 2015 are set out at Annexes 1 and 2 respectively.
(c) In the coming year, the Labour Department will continue to enhance promotion of
WHS and explore the signing of new WHS arrangements with more economies and expansion of the annual quota with the governments of existing WHS partner economies, so as to give Hong Kong youths more opportunities to choose and participate in WHS.
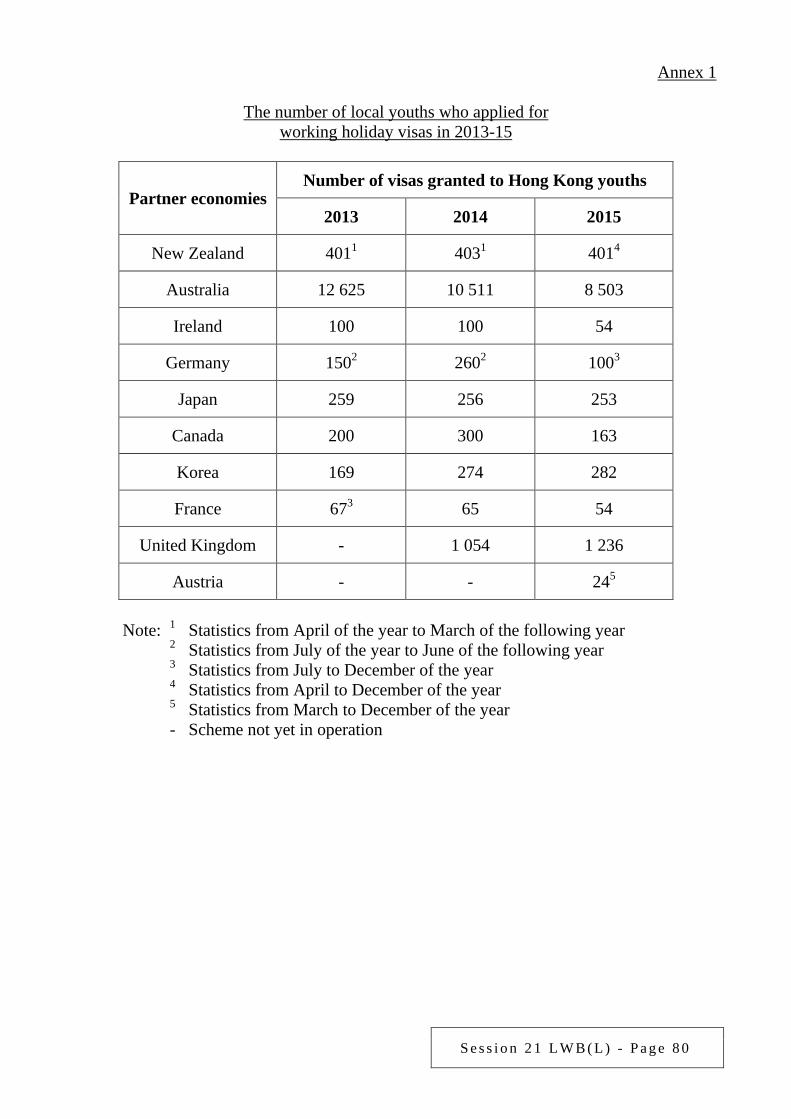
S e s s i o n 2 1 L W B ( L ) - P a g e 8 0
Annex 1
The number of local youths who applied for working holiday visas in 2013-15
Partner economies Number of visas granted to Hong Kong youths
2013 2014 2015
New Zealand 4011 4031 4014
Australia 12 625 10 511 8 503
Ireland 100 100 54
Germany 1502 2602 1003
Japan 259 256 253
Canada 200 300 163
Korea 169 274 282
France 673 65 54
United Kingdom - 1 054 1 236
Austria - - 245
Note: 1 Statistics from April of the year to March of the following year
2 Statistics from July of the year to June of the following year 3 Statistics from July to December of the year 4 Statistics from April to December of the year 5 Statistics from March to December of the year - Scheme not yet in operation
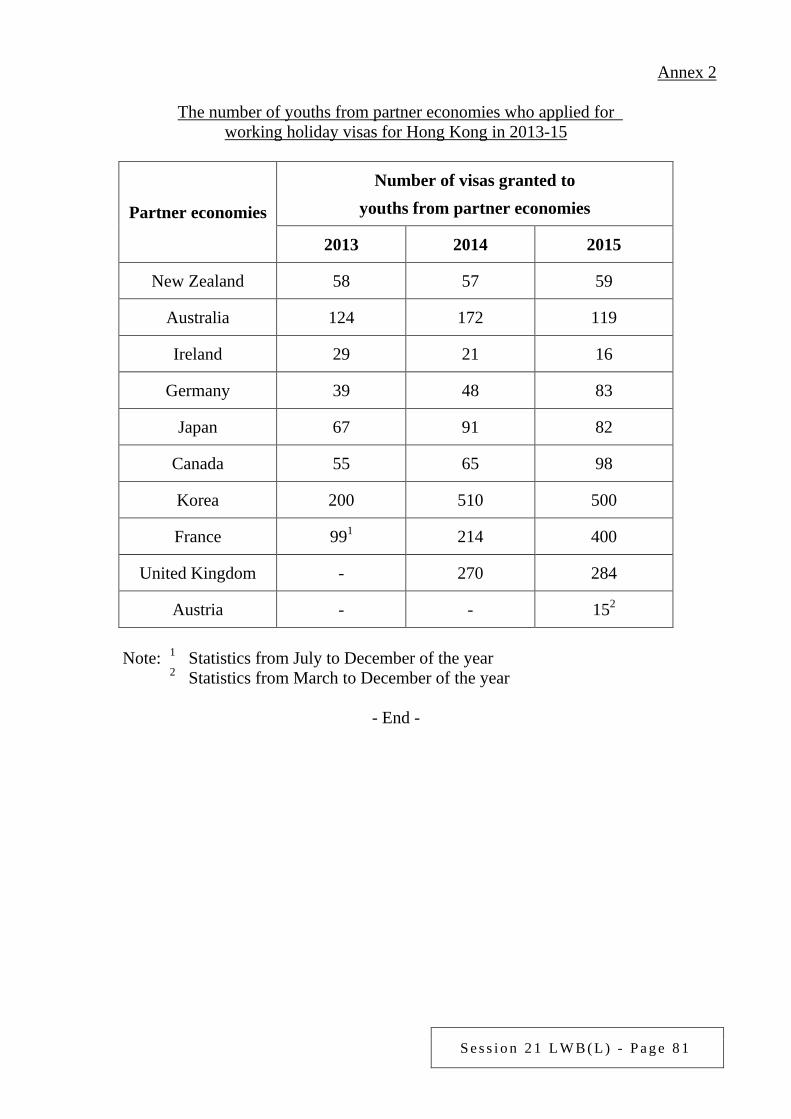
S e s s i o n 2 1 L W B ( L ) - P a g e 8 1
Annex 2
The number of youths from partner economies who applied for working holiday visas for Hong Kong in 2013-15
Partner economies
Number of visas granted to youths from partner economies
2013 2014 2015
New Zealand 58 57 59
Australia 124 172 119
Ireland 29 21 16
Germany 39 48 83
Japan 67 91 82
Canada 55 65 98
Korea 200 510 500
France 991 214 400
United Kingdom - 270 284
Austria - - 152
Note: 1 Statistics from July to December of the year
2 Statistics from March to December of the year
- End -

S e s s i o n 2 1 L W B ( L ) - P a g e 8 2
Examination of Estimates of Expenditure 2016-17 Reply Serial No.
LWB(L)030 CONTROLLING OFFICER’S REPLY (Question Serial No. 0381)
Head: (90) Labour Department
Subhead (No. & title): ( )
Programme: Not specified
Controlling Officer: Commissioner for Labour (Donald TONG)
Director of Bureau: Secretary for Labour and Welfare Question: In paragraph 148 of his 2015-16 Budget Speech, the Financial Secretary mentioned that “I asked all policy bureaux… to achieve more efficient use of resources through re-engineering and re-prioritising. I have also launched the ‘0-1-1’ envelope savings programme to reduce operating expenditure by a total of two per cent over the next three financial years. Resources saved will be re-allocated for new services.” Please advise this Committee of the details of the implementation of the “0-1-1” envelope savings programme by the Labour Department (LD), the services affected and expenditure involved in 2015-16 and 2016-17. Asked by: Hon Albert HO Chun-yan (Member Question No. 20) Reply: In the face of an ageing population, shrinking labour supply and slowing economic growth, the Government needs to contain the growth of expenditure to ensure fiscal sustainability. “0-1-1” envelope savings programme is a fiscal planning tool aimed at achieving more efficient use of public resources through greater efforts in re-engineering and re-prioritisation such that the savings can be re-deployed to the implementation of new or enhanced services. LD’s estimated recurrent expenditure for 2016-17 reflects an increase of $116 million (7.9%) over the revised estimate for 2015-16. The new services mainly include: establishing a dedicated employment information e-platform for job seekers with higher education; intensifying systematic preventive and enforcement efforts to tackle fall-from-height hazards and other work hazards in the construction sector; and formulating and implementing a code of practice to tighten control on local employment agencies. LD will continue to make efficient use of resources such that savings can be re-deployed to enhance existing services and meet new service needs.
- End -
S e s s i o n 2 1 L W B ( L ) - P a g e 8 3
Examination of Estimates of Expenditure 2016-17 Reply Serial No.
LWB(L)031 CONTROLLING OFFICER’S REPLY (Question Serial No. 0382)
Head: (90) Labour Department
Subhead (No. & title): ( )
Programme: (2) Employment Services
Controlling Officer: Commissioner for Labour (Donald TONG)
Director of Bureau: Secretary for Labour and Welfare Question: Regarding the implementation of integrated employment services at the Employment in One-stop (EOS) in Tin Shui Wai to enhance employment support to job seekers, please provide the following information: details of the specific work of the employment and training centre and the expenditure involved in the past year; details of the specific work of the employment and training centre and the expenditure involved in 2016-17; whether the Government will assess the effectiveness of EOS; the details if an assessment is to be made or the reasons for not doing so; and the number of beneficiaries, and a breakdown of the placement rate by occupation since the setting up of the centre. Asked by: Hon Albert HO Chun-yan (Member Question No. 21) Reply: EOS in Tin Shui Wai provides free recruitment and employment services to employers and job seekers. Apart from providing a full range of semi-self-help job search facilities and employment services available at job centres of the Labour Department (LD), EOS also offers enhanced services, such as the assessment of job seekers’ employment needs through a needs assessment tool for provision of tailor-made employment services, as well as case management and employment support services by registered social workers to job seekers with special employment difficulties and recipients of Comprehensive Social Security Assistance (CSSA) referred by the Social Welfare Department (SWD). In addition, EOS co-organises with the Employees Retraining Board (ERB) training activities for enhancing the job search skills of job seekers. The revised estimated expenditure for EOS in 2015-16 was about $8.2 million (excluding staff cost). In 2016-17, EOS will continue to provide free recruitment and enhanced employment services to employers and job seekers. It will also provide case management and employment support services. LD will continue to co-organise with ERB training activities to enhance the job search skills of job seekers. The estimated operational expenses for EOS in 2016-17 are about $8.5 million (excluding staff cost).
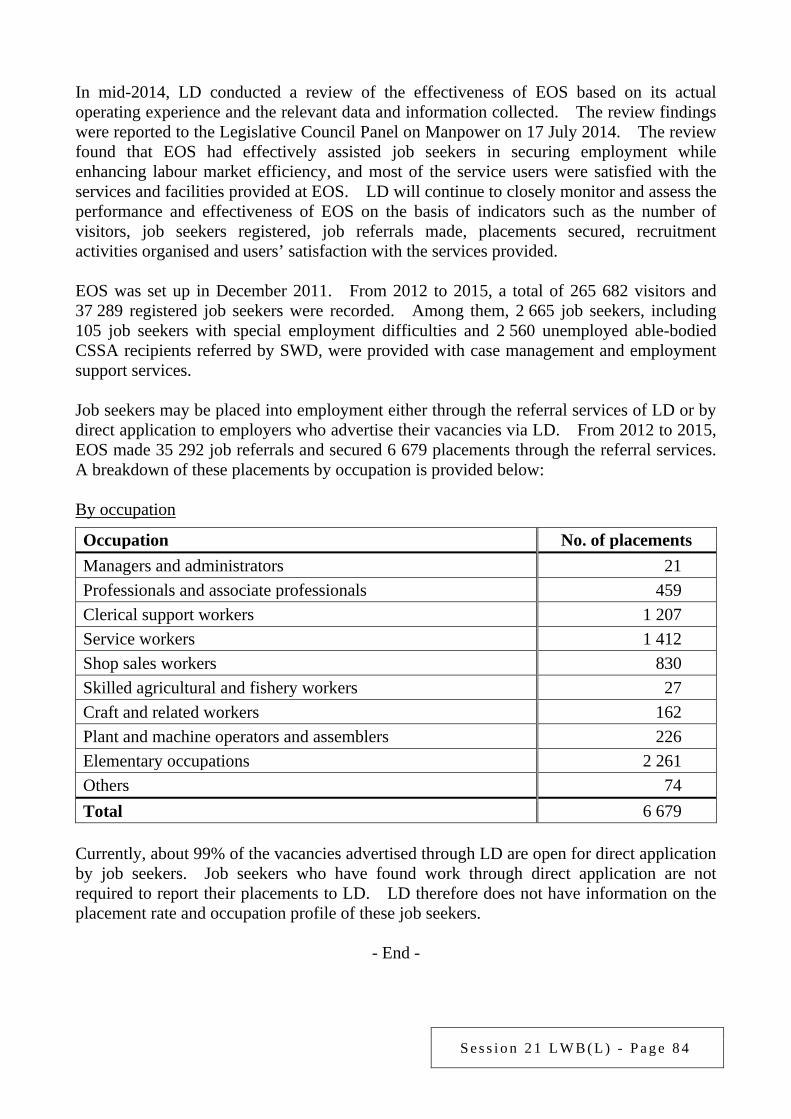
S e s s i o n 2 1 L W B ( L ) - P a g e 8 4
In mid-2014, LD conducted a review of the effectiveness of EOS based on its actual operating experience and the relevant data and information collected. The review findings were reported to the Legislative Council Panel on Manpower on 17 July 2014. The review found that EOS had effectively assisted job seekers in securing employment while enhancing labour market efficiency, and most of the service users were satisfied with the services and facilities provided at EOS. LD will continue to closely monitor and assess the performance and effectiveness of EOS on the basis of indicators such as the number of visitors, job seekers registered, job referrals made, placements secured, recruitment activities organised and users’ satisfaction with the services provided. EOS was set up in December 2011. From 2012 to 2015, a total of 265 682 visitors and 37 289 registered job seekers were recorded. Among them, 2 665 job seekers, including 105 job seekers with special employment difficulties and 2 560 unemployed able-bodied CSSA recipients referred by SWD, were provided with case management and employment support services. Job seekers may be placed into employment either through the referral services of LD or by direct application to employers who advertise their vacancies via LD. From 2012 to 2015, EOS made 35 292 job referrals and secured 6 679 placements through the referral services. A breakdown of these placements by occupation is provided below: By occupation
Occupation No. of placements Managers and administrators 21 Professionals and associate professionals 459 Clerical support workers 1 207 Service workers 1 412 Shop sales workers 830 Skilled agricultural and fishery workers 27 Craft and related workers 162 Plant and machine operators and assemblers 226 Elementary occupations 2 261 Others 74 Total 6 679
Currently, about 99% of the vacancies advertised through LD are open for direct application by job seekers. Job seekers who have found work through direct application are not required to report their placements to LD. LD therefore does not have information on the placement rate and occupation profile of these job seekers.
- End -
S e s s i o n 2 1 L W B ( L ) - P a g e 8 5
Examination of Estimates of Expenditure 2016-17 Reply Serial No.
LWB(L)032 CONTROLLING OFFICER’S REPLY (Question Serial No. 0384)
Head: (90) Labour Department
Subhead (No. & title): ( )
Programme: (1) Labour Relations
Controlling Officer: Commissioner for Labour (Donald TONG)
Director of Bureau: Secretary for Labour and Welfare Question: What was the expenditure on family-friendly policies in 2015-16? What were the details of work? This year’s estimated expenditure has made no mention of family-friendly policies. Does it mean that the Government will reduce expenditure on these policies? Asked by: Hon Albert HO Chun-yan (Member Question No. 23) Reply: The Labour Department (LD) has been acting as a facilitator in promoting family-friendly employment practices (FFEP) and disseminates relevant information to the community and employers through educational and promotional activities. In 2015-16, LD published a series of news supplements to share the successful experiences of a number of enterprises in implementing FFEP and publicise the advantages they brought to both employers and employees. The series were compiled into a casebook for wide distribution to related companies and parties to encourage more employers to foster a family-friendly working culture. On top of the existing general guidelines on FFEP, LD collaborated with employers and employees in the catering industry to introduce detailed industry-based practical guidelines for reference by employers in the industry. The total expenditure was about $1.1 million. In 2016-17, LD will continue to widely promote the adoption of FFEP among the public and encourage employers to help employees achieve a balance between work and family life through various channels, a range of educational and promotional activities, and the production of a new set of television and radio Announcements in the Public Interest. LD will also continue to promote relevant messages through industry-based Tripartite Committees. The estimated expenditure is about $1.1 million.
- End -
S e s s i o n 2 1 L W B ( L ) - P a g e 8 6
Examination of Estimates of Expenditure 2016-17 Reply Serial No.
LWB(L)033 CONTROLLING OFFICER’S REPLY (Question Serial No. 0386)
Head: (90) Labour Department
Subhead (No. & title): ( )
Programme: (2) Employment Services
Controlling Officer: Commissioner for Labour (Donald TONG)
Director of Bureau: Secretary for Labour and Welfare Question: Regarding the Working Holiday Scheme (WHS), would the Government advise this Committee of: (a) the current number of WHS participants and the host economies they are staying in; (b) the new initiatives under WHS and the estimated expenditure for 2016-17? Asked by: Hon Albert HO Chun-yan (Member Question No. 25) Reply: The information sought is provided as follows: (a) Since 2001, the HKSAR Government has established bilateral WHS arrangements
with the governments of 10 economies, namely New Zealand, Australia, Ireland, Germany, Japan, Canada, Korea, France, the United Kingdom and Austria. Based on the information provided by the governments of WHS partner economies, about 70 000 Hong Kong youths were granted working holiday visas as at the end of 2015. Among them, 11 070 were granted working holiday visas in 2015. A breakdown of the figures in 2015 is set out at Annex.
(b) In 2016-17, Labour Department (LD) will continue to enhance promotion of WHS,
including organising talks, setting up relevant webpages and distributing publicity materials such as posters, pamphlets and postcards in various government organisations, public places and tertiary institutions. LD will also explore the signing of new WHS arrangements with more economies and expansion of the annual quota with the governments of existing WHS partner economies, so as to give Hong Kong youths more opportunities to choose and participate in WHS. LD has earmarked approximately $900,000 for the above publicity work.
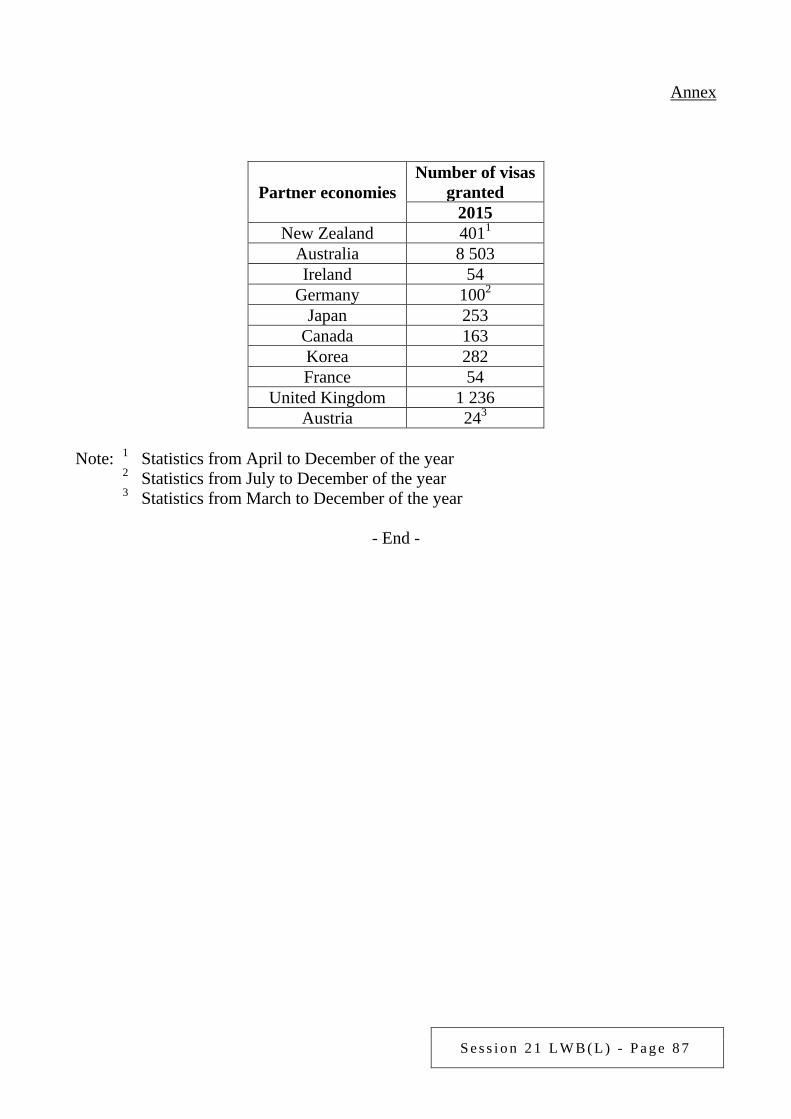
S e s s i o n 2 1 L W B ( L ) - P a g e 8 7
Annex
Partner economies Number of visas
granted 2015
New Zealand 4011 Australia 8 503 Ireland 54
Germany 1002 Japan 253
Canada 163 Korea 282 France 54
United Kingdom 1 236 Austria 243
Note: 1 Statistics from April to December of the year 2 Statistics from July to December of the year 3 Statistics from March to December of the year
- End -
S e s s i o n 2 1 L W B ( L ) - P a g e 8 8
Examination of Estimates of Expenditure 2016-17 Reply Serial No.
LWB(L)034 CONTROLLING OFFICER’S REPLY (Question Serial No. 0387)
Head: (90) Labour Department
Subhead (No. & title): ( )
Programme: (2) Employment Services
Controlling Officer: Commissioner for Labour (Donald TONG)
Director of Bureau: Secretary for Labour and Welfare Question: It is stated that the Government will establish a dedicated employment information e-platform for local residents who receive higher education outside Hong Kong and overseas talents. What are the details and expenditure involved? Asked by: Hon Albert HO Chun-yan (Member Question No. 26) Reply: To strengthen employment support for persons with higher education, in particular Hong Kong students who are educated in overseas tertiary institutes, the second generation of Hong Kong emigrants who are interested in working in Hong Kong, as well as persons from overseas with higher academic/professional qualifications, the Labour Department (LD) will set up a dedicated employment information e-platform in the fourth quarter of 2016. The e-platform aims to enhance their understanding of the Hong Kong labour market as well as facilitating their search and application for suitable job openings through the new dedicated webpage. LD will collaborate with relevant bodies such as career service centres and student associations of overseas universities or colleges, and the Government’s Hong Kong Economic and Trade Offices overseas to publicise the services of the dedicated employment information e-platform to persons with higher educational attainment overseas. The estimated expenditure for 2016-17 is $1.35 million (excluding staff cost).
- End -
S e s s i o n 2 1 L W B ( L ) - P a g e 8 9
Examination of Estimates of Expenditure 2016-17 Reply Serial No.
LWB(L)035 CONTROLLING OFFICER’S REPLY (Question Serial No. 1280)
Head: (90) Labour Department
Subhead (No. & title): (000) Operational expenses
Programme: (2) Employment Services
Controlling Officer: Commissioner for Labour (Donald TONG)
Director of Bureau: Secretary for Labour and Welfare Question: (a) Please provide breakdowns of unemployed persons, persons with disabilities, young
people, new arrivals and ethnic minorities who sought employment through the employment services of the Labour Department (LD) in 2015-2016.
(b) Please provide breakdowns, by gender, age, industry, employment district and
earnings, of able-bodied job seekers and job seekers with disabilities who secured placements through the employment services in 2015-2016.
Asked by: Hon Cyd HO Sau-lan (Member Question No. 3) Reply: The information sought is provided as follows: (a) As job seekers who registered for employment services with LD are not required to
report their employment situations to LD, LD does not have statistics on the number of registered job seekers who were unemployed. A breakdown of persons with disabilities, young people (i.e. aged 15 to 24), new arrivals and ethnic minorities who registered for employment services with LD in 2015 is as follows:
No. of persons who registered for
employment services * Persons with disabilities 2 720 Young people 25 235 New arrivals 4 132 Ethnic minorities 994
* Job seekers who registered for employment services with LD may belong to
more than 1 group.
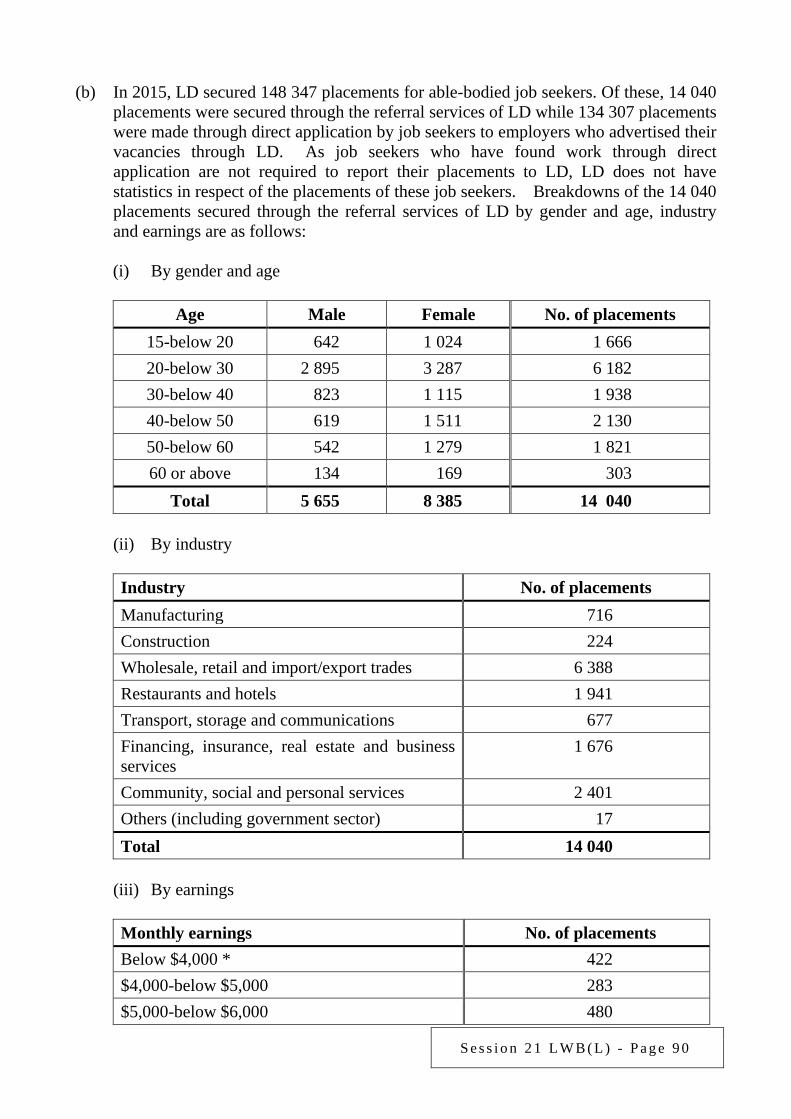
S e s s i o n 2 1 L W B ( L ) - P a g e 9 0
(b) In 2015, LD secured 148 347 placements for able-bodied job seekers. Of these, 14 040
placements were secured through the referral services of LD while 134 307 placements were made through direct application by job seekers to employers who advertised their vacancies through LD. As job seekers who have found work through direct application are not required to report their placements to LD, LD does not have statistics in respect of the placements of these job seekers. Breakdowns of the 14 040 placements secured through the referral services of LD by gender and age, industry and earnings are as follows:
(i) By gender and age
Age Male Female No. of placements 15-below 20 642 1 024 1 666 20-below 30 2 895 3 287 6 182 30-below 40 823 1 115 1 938 40-below 50 619 1 511 2 130 50-below 60 542 1 279 1 821 60 or above 134 169 303
Total 5 655 8 385 14 040 (ii) By industry
Industry No. of placements Manufacturing 716 Construction 224 Wholesale, retail and import/export trades 6 388 Restaurants and hotels 1 941 Transport, storage and communications 677 Financing, insurance, real estate and business services
1 676
Community, social and personal services 2 401 Others (including government sector) 17 Total 14 040
(iii) By earnings
Monthly earnings No. of placements Below $4,000 * 422 $4,000-below $5,000 283 $5,000-below $6,000 480
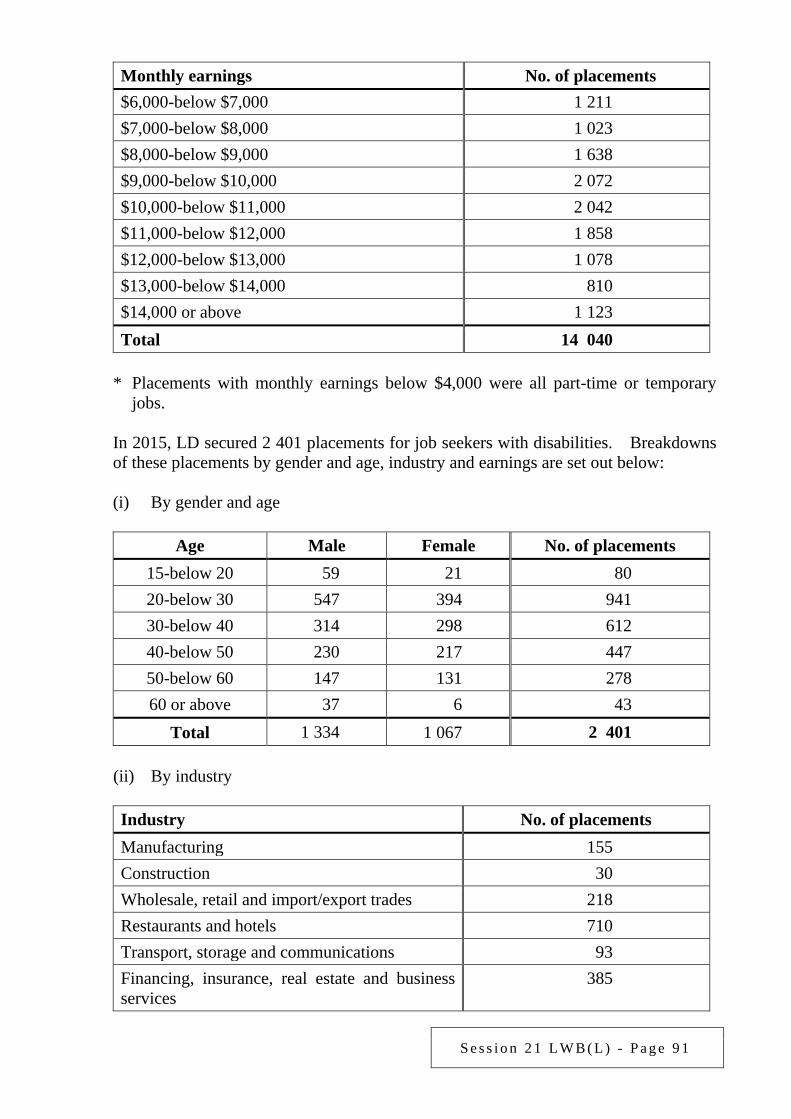
S e s s i o n 2 1 L W B ( L ) - P a g e 9 1
Monthly earnings No. of placements $6,000-below $7,000 1 211 $7,000-below $8,000 1 023 $8,000-below $9,000 1 638 $9,000-below $10,000 2 072 $10,000-below $11,000 2 042 $11,000-below $12,000 1 858 $12,000-below $13,000 1 078 $13,000-below $14,000 810 $14,000 or above 1 123 Total 14 040
* Placements with monthly earnings below $4,000 were all part-time or temporary
jobs. In 2015, LD secured 2 401 placements for job seekers with disabilities. Breakdowns
of these placements by gender and age, industry and earnings are set out below: (i) By gender and age
Age Male Female No. of placements 15-below 20 59 21 80 20-below 30 547 394 941 30-below 40 314 298 612 40-below 50 230 217 447 50-below 60 147 131 278 60 or above 37 6 43
Total 1 334 1 067 2 401 (ii) By industry
Industry No. of placements Manufacturing 155 Construction 30 Wholesale, retail and import/export trades 218 Restaurants and hotels 710 Transport, storage and communications 93 Financing, insurance, real estate and business services
385
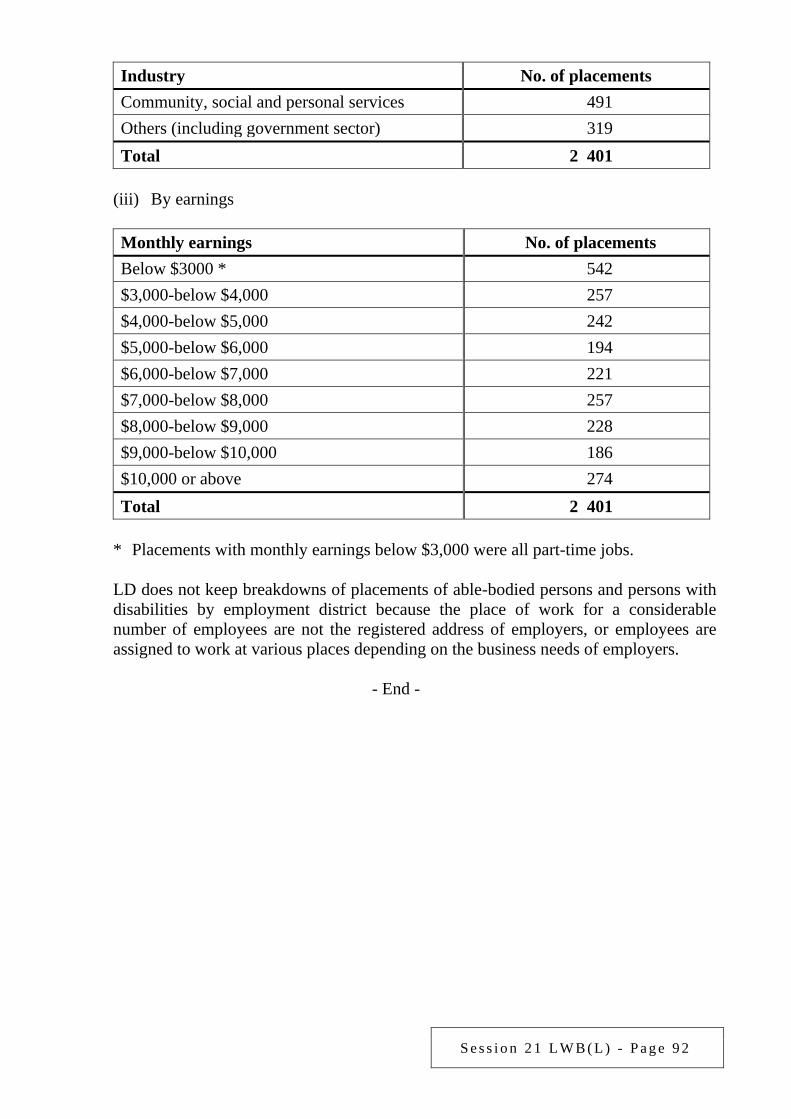
S e s s i o n 2 1 L W B ( L ) - P a g e 9 2
Industry No. of placements Community, social and personal services 491 Others (including government sector) 319 Total 2 401
(iii) By earnings
Monthly earnings No. of placements Below $3000 * 542 $3,000-below $4,000 257 $4,000-below $5,000 242 $5,000-below $6,000 194 $6,000-below $7,000 221 $7,000-below $8,000 257 $8,000-below $9,000 228 $9,000-below $10,000 186 $10,000 or above 274 Total 2 401
* Placements with monthly earnings below $3,000 were all part-time jobs.
LD does not keep breakdowns of placements of able-bodied persons and persons with disabilities by employment district because the place of work for a considerable number of employees are not the registered address of employers, or employees are assigned to work at various places depending on the business needs of employers.
- End -
S e s s i o n 2 1 L W B ( L ) - P a g e 9 3
Examination of Estimates of Expenditure 2016-17 Reply Serial No.
LWB(L)036 CONTROLLING OFFICER’S REPLY (Question Serial No. 0533)
Head: (90) Labour Department
Subhead (No. & title): ( )
Programme: (2) Employment Services
Controlling Officer: Commissioner for Labour (Donald TONG)
Director of Bureau: Secretary for Labour and Welfare Question: Regarding the operation of the Recruitment Centre for the Retail Industry (Recruitment Centre), would the Government advise this Committee of: (a) the number of vacancies received each year, with breakdowns by year, job title, mode
of employment and wage level; (b) the number of job seekers registered each year, with breakdowns by year, age and
gender; and (c) the number of job seekers with placements secured through the referral of the
Recruitment Centre, with breakdowns by year, age, gender, job title, mode of employment and wage level?
Asked by: Hon KWOK Wai-keung (Member Question No. 17) Reply: The information sought is provided as follows: (a) Breakdowns of the number of vacancies received by the Recruitment Centre by year,
job title, mode of employment and earnings are provided below:
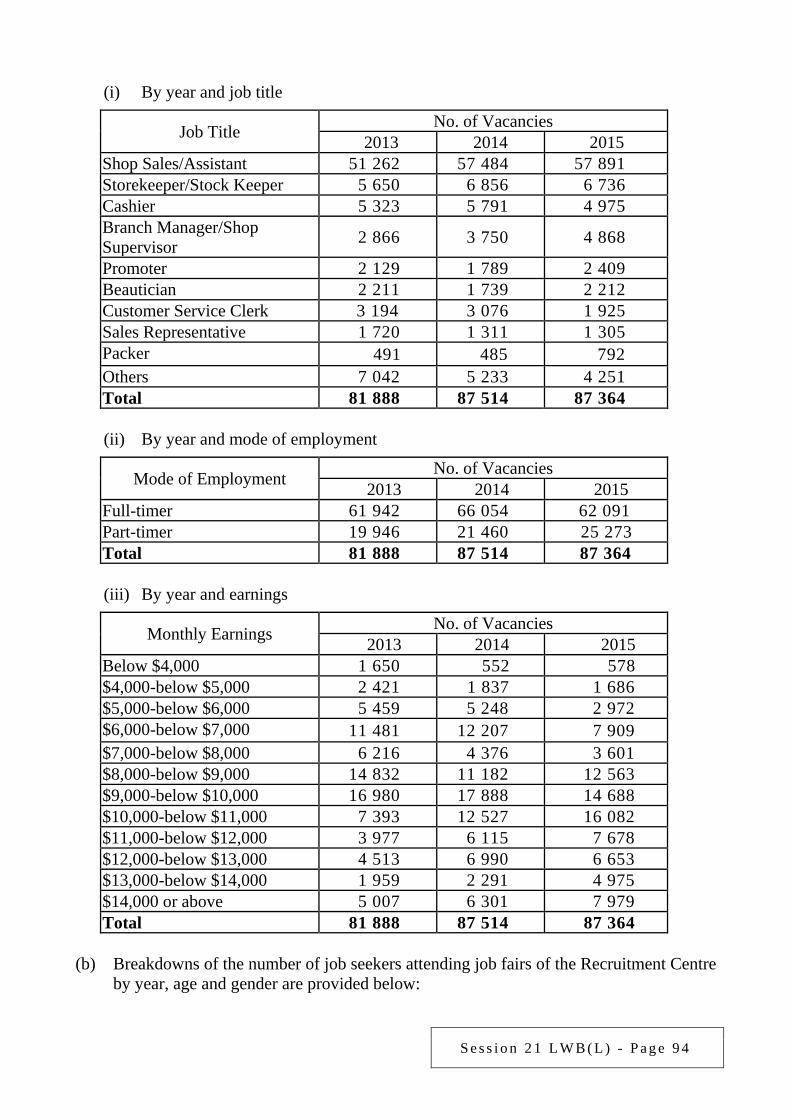
S e s s i o n 2 1 L W B ( L ) - P a g e 9 4
(i) By year and job title
Job Title No. of Vacancies 2013 2014 2015
Shop Sales/Assistant 51 262 57 484 57 891 Storekeeper/Stock Keeper 5 650 6 856 6 736 Cashier 5 323 5 791 4 975 Branch Manager/Shop Supervisor 2 866 3 750 4 868
Promoter 2 129 1 789 2 409 Beautician 2 211 1 739 2 212 Customer Service Clerk 3 194 3 076 1 925 Sales Representative 1 720 1 311 1 305 Packer 491 485 792 Others 7 042 5 233 4 251 Total 81 888 87 514 87 364
(ii) By year and mode of employment
Mode of Employment No. of Vacancies 2013 2014 2015
Full-timer 61 942 66 054 62 091 Part-timer 19 946 21 460 25 273 Total 81 888 87 514 87 364
(iii) By year and earnings
Monthly Earnings No. of Vacancies 2013 2014 2015
Below $4,000 1 650 552 578 $4,000-below $5,000 2 421 1 837 1 686 $5,000-below $6,000 5 459 5 248 2 972 $6,000-below $7,000 11 481 12 207 7 909 $7,000-below $8,000 6 216 4 376 3 601 $8,000-below $9,000 14 832 11 182 12 563 $9,000-below $10,000 16 980 17 888 14 688 $10,000-below $11,000 7 393 12 527 16 082 $11,000-below $12,000 3 977 6 115 7 678 $12,000-below $13,000 4 513 6 990 6 653 $13,000-below $14,000 1 959 2 291 4 975 $14,000 or above 5 007 6 301 7 979 Total 81 888 87 514 87 364
(b) Breakdowns of the number of job seekers attending job fairs of the Recruitment Centre
by year, age and gender are provided below:
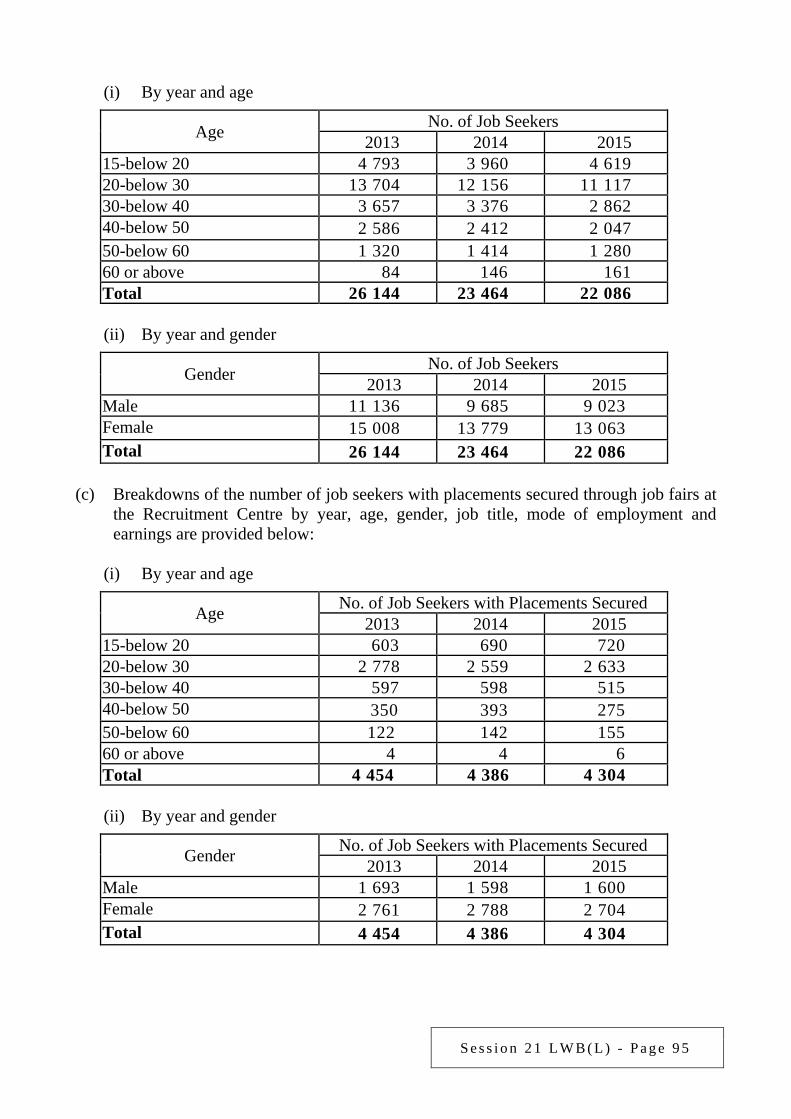
S e s s i o n 2 1 L W B ( L ) - P a g e 9 5
(i) By year and age
Age No. of Job Seekers 2013 2014 2015
15-below 20 4 793 3 960 4 619 20-below 30 13 704 12 156 11 117 30-below 40 3 657 3 376 2 862 40-below 50 2 586 2 412 2 047 50-below 60 1 320 1 414 1 280 60 or above 84 146 161 Total 26 144 23 464 22 086
(ii) By year and gender
Gender No. of Job Seekers 2013 2014 2015
Male 11 136 9 685 9 023 Female 15 008 13 779 13 063 Total 26 144 23 464 22 086
(c) Breakdowns of the number of job seekers with placements secured through job fairs at
the Recruitment Centre by year, age, gender, job title, mode of employment and earnings are provided below:
(i) By year and age
Age No. of Job Seekers with Placements Secured 2013 2014 2015
15-below 20 603 690 720 20-below 30 2 778 2 559 2 633 30-below 40 597 598 515 40-below 50 350 393 275 50-below 60 122 142 155 60 or above 4 4 6 Total 4 454 4 386 4 304
(ii) By year and gender
Gender No. of Job Seekers with Placements Secured 2013 2014 2015
Male 1 693 1 598 1 600 Female 2 761 2 788 2 704 Total 4 454 4 386 4 304
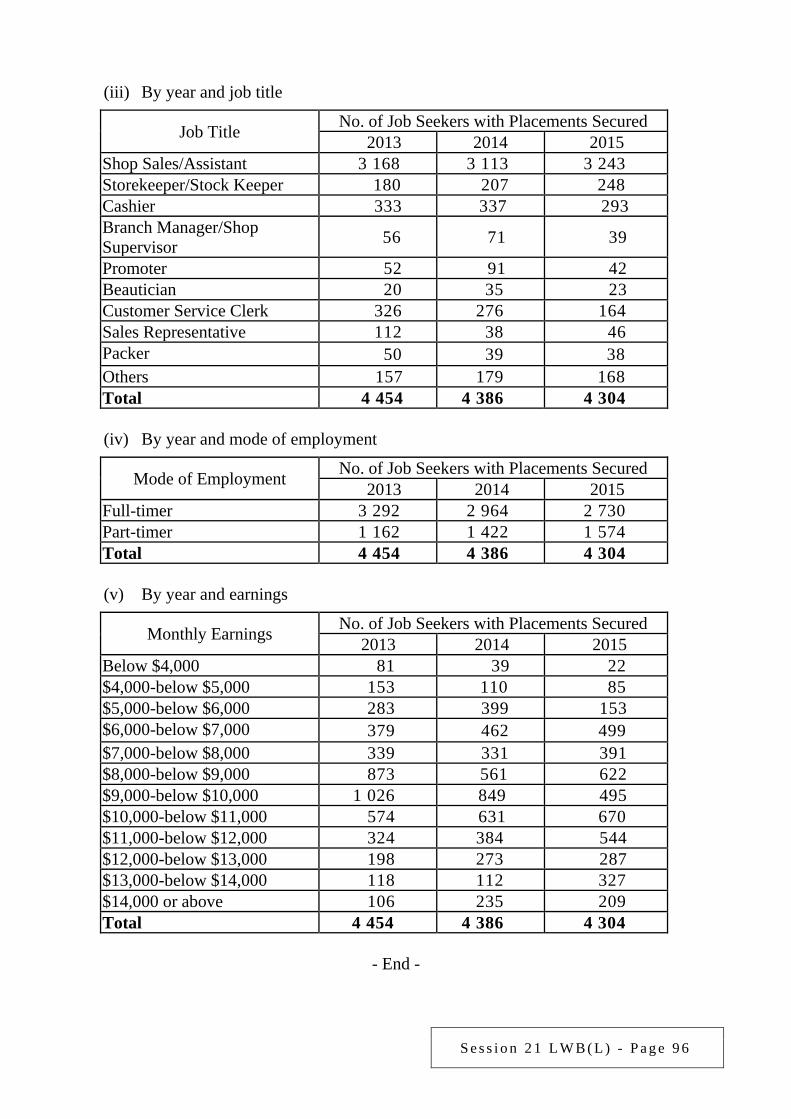
S e s s i o n 2 1 L W B ( L ) - P a g e 9 6
(iii) By year and job title
Job Title No. of Job Seekers with Placements Secured 2013 2014 2015
Shop Sales/Assistant 3 168 3 113 3 243 Storekeeper/Stock Keeper 180 207 248 Cashier 333 337 293 Branch Manager/Shop Supervisor 56 71 39
Promoter 52 91 42 Beautician 20 35 23 Customer Service Clerk 326 276 164 Sales Representative 112 38 46 Packer 50 39 38 Others 157 179 168 Total 4 454 4 386 4 304
(iv) By year and mode of employment
Mode of Employment No. of Job Seekers with Placements Secured 2013 2014 2015
Full-timer 3 292 2 964 2 730 Part-timer 1 162 1 422 1 574 Total 4 454 4 386 4 304
(v) By year and earnings
Monthly Earnings No. of Job Seekers with Placements Secured 2013 2014 2015
Below $4,000 81 39 22 $4,000-below $5,000 153 110 85 $5,000-below $6,000 283 399 153 $6,000-below $7,000 379 462 499 $7,000-below $8,000 339 331 391 $8,000-below $9,000 873 561 622 $9,000-below $10,000 1 026 849 495 $10,000-below $11,000 574 631 670 $11,000-below $12,000 324 384 544 $12,000-below $13,000 198 273 287 $13,000-below $14,000 118 112 327 $14,000 or above 106 235 209 Total 4 454 4 386 4 304
- End -
S e s s i o n 2 1 L W B ( L ) - P a g e 9 7
Examination of Estimates of Expenditure 2016-17 Reply Serial No.
LWB(L)037 CONTROLLING OFFICER’S REPLY (Question Serial No. 0534)
Head: (90) Labour Department
Subhead (No. & title): ( )
Programme: (2) Employment Services
Controlling Officer: Commissioner for Labour (Donald TONG)
Director of Bureau: Secretary for Labour and Welfare Question: Regarding the operation of the Recruitment Centre for the Catering Industry (Recruitment Centre), would the Government advise this Committee of: (a) the number of vacancies received each year, with breakdowns by year, job title, mode
of employment and wage level; (b) the number of job seekers registered each year, with breakdowns by year, age and
gender; and (c) the number of job seekers with placements secured through the referral services of the
Recruitment Centre, with breakdowns by year, age, gender, job title, mode of employment and wage level?
Asked by: Hon KWOK Wai-keung (Member Question No. 18) Reply: The information sought is provided as follows: (a) Breakdowns of the number of vacancies received by the Recruitment Centre by year,
job title, mode of employment and earnings are provided below:
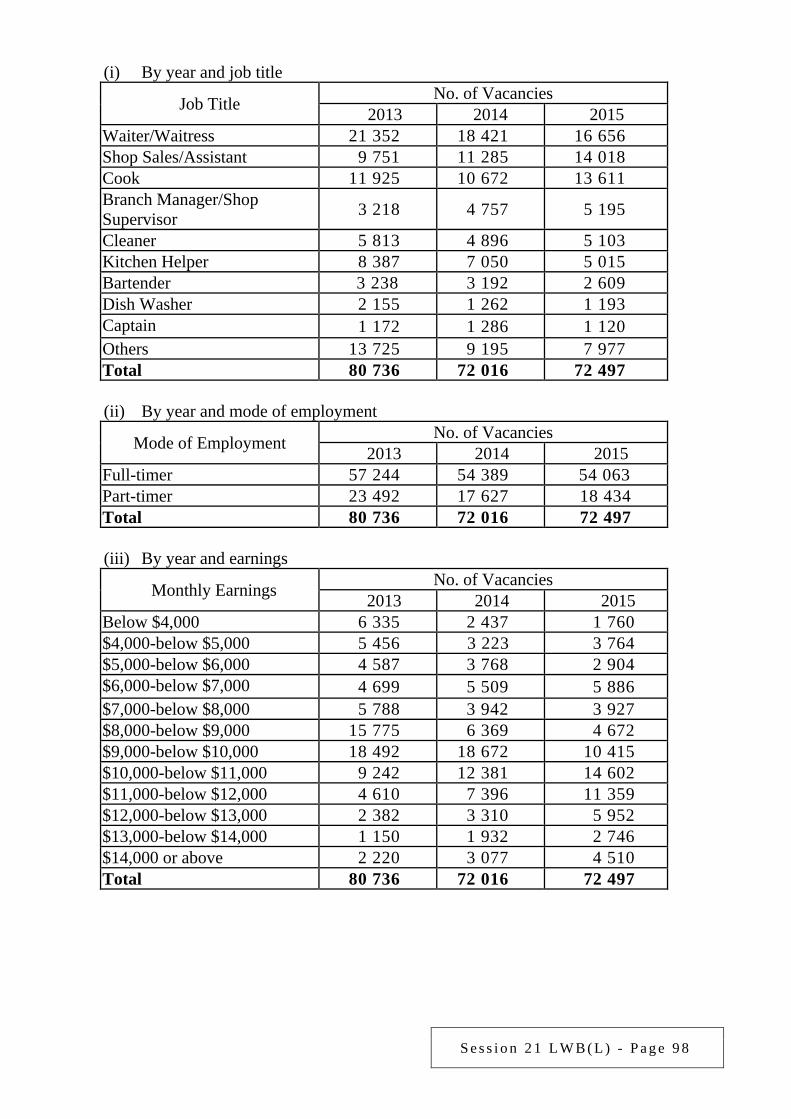
S e s s i o n 2 1 L W B ( L ) - P a g e 9 8
(i) By year and job title
Job Title No. of Vacancies 2013 2014 2015
Waiter/Waitress 21 352 18 421 16 656 Shop Sales/Assistant 9 751 11 285 14 018 Cook 11 925 10 672 13 611 Branch Manager/Shop Supervisor 3 218 4 757 5 195
Cleaner 5 813 4 896 5 103 Kitchen Helper 8 387 7 050 5 015 Bartender 3 238 3 192 2 609 Dish Washer 2 155 1 262 1 193 Captain 1 172 1 286 1 120 Others 13 725 9 195 7 977 Total 80 736 72 016 72 497
(ii) By year and mode of employment
Mode of Employment No. of Vacancies 2013 2014 2015
Full-timer 57 244 54 389 54 063 Part-timer 23 492 17 627 18 434 Total 80 736 72 016 72 497
(iii) By year and earnings
Monthly Earnings No. of Vacancies 2013 2014 2015
Below $4,000 6 335 2 437 1 760 $4,000-below $5,000 5 456 3 223 3 764 $5,000-below $6,000 4 587 3 768 2 904 $6,000-below $7,000 4 699 5 509 5 886 $7,000-below $8,000 5 788 3 942 3 927 $8,000-below $9,000 15 775 6 369 4 672 $9,000-below $10,000 18 492 18 672 10 415 $10,000-below $11,000 9 242 12 381 14 602 $11,000-below $12,000 4 610 7 396 11 359 $12,000-below $13,000 2 382 3 310 5 952 $13,000-below $14,000 1 150 1 932 2 746 $14,000 or above 2 220 3 077 4 510 Total 80 736 72 016 72 497
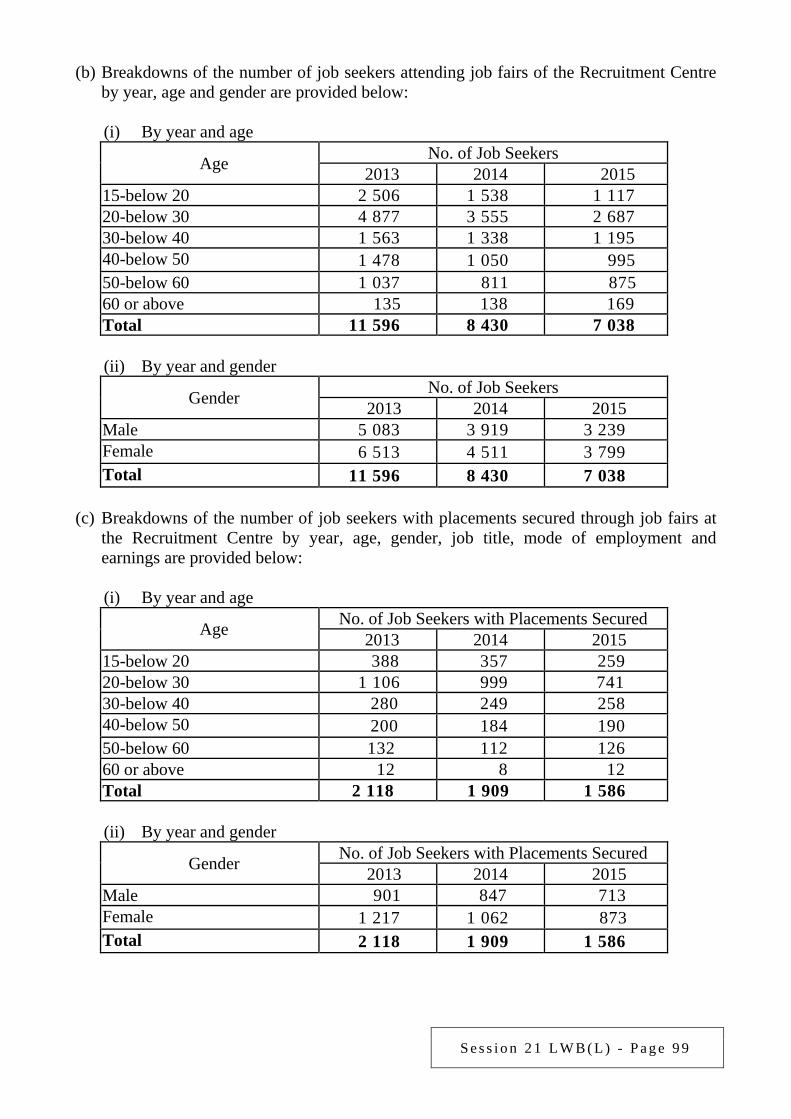
S e s s i o n 2 1 L W B ( L ) - P a g e 9 9
(b) Breakdowns of the number of job seekers attending job fairs of the Recruitment Centre by year, age and gender are provided below:
(i) By year and age
Age No. of Job Seekers 2013 2014 2015
15-below 20 2 506 1 538 1 117 20-below 30 4 877 3 555 2 687 30-below 40 1 563 1 338 1 195 40-below 50 1 478 1 050 995 50-below 60 1 037 811 875 60 or above 135 138 169 Total 11 596 8 430 7 038
(ii) By year and gender
Gender No. of Job Seekers 2013 2014 2015
Male 5 083 3 919 3 239 Female 6 513 4 511 3 799 Total 11 596 8 430 7 038
(c) Breakdowns of the number of job seekers with placements secured through job fairs at
the Recruitment Centre by year, age, gender, job title, mode of employment and earnings are provided below:
(i) By year and age
Age No. of Job Seekers with Placements Secured 2013 2014 2015
15-below 20 388 357 259 20-below 30 1 106 999 741 30-below 40 280 249 258 40-below 50 200 184 190 50-below 60 132 112 126 60 or above 12 8 12 Total 2 118 1 909 1 586
(ii) By year and gender
Gender No. of Job Seekers with Placements Secured 2013 2014 2015
Male 901 847 713 Female 1 217 1 062 873 Total 2 118 1 909 1 586
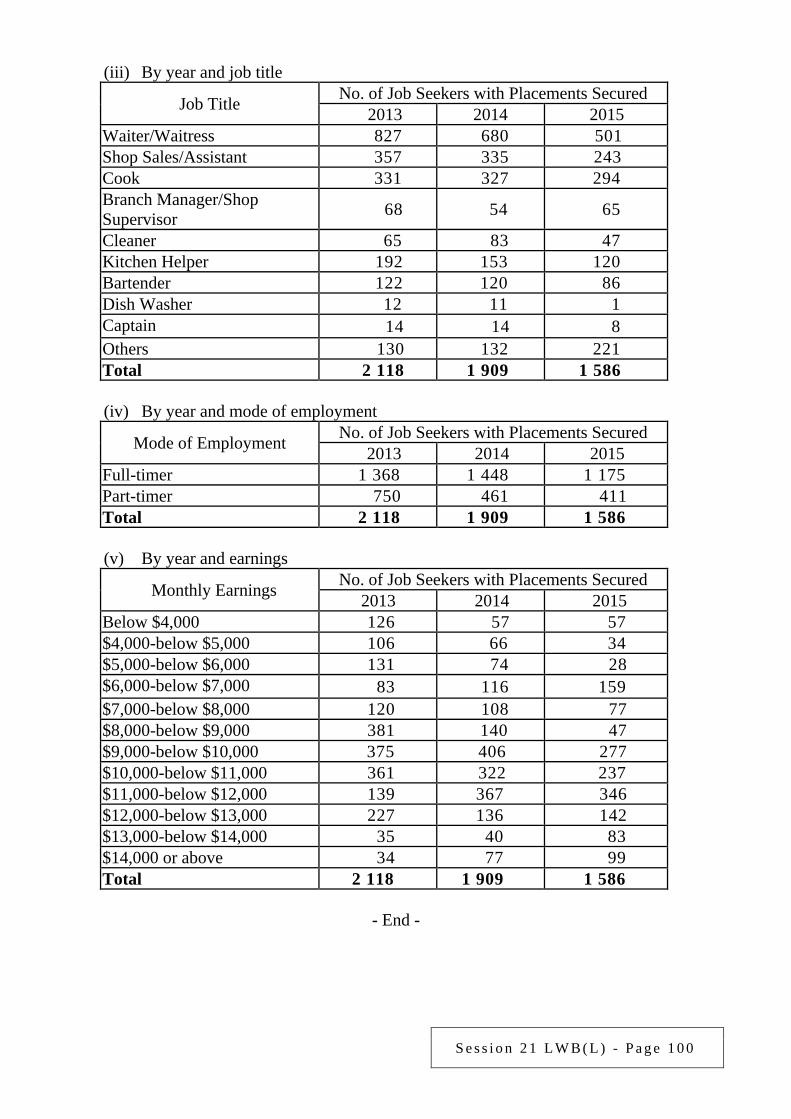
S e s s i o n 2 1 L W B ( L ) - P a g e 1 0 0
(iii) By year and job title
Job Title No. of Job Seekers with Placements Secured 2013 2014 2015
Waiter/Waitress 827 680 501 Shop Sales/Assistant 357 335 243 Cook 331 327 294 Branch Manager/Shop Supervisor 68 54 65
Cleaner 65 83 47 Kitchen Helper 192 153 120 Bartender 122 120 86 Dish Washer 12 11 1 Captain 14 14 8 Others 130 132 221 Total 2 118 1 909 1 586
(iv) By year and mode of employment
Mode of Employment No. of Job Seekers with Placements Secured 2013 2014 2015
Full-timer 1 368 1 448 1 175 Part-timer 750 461 411 Total 2 118 1 909 1 586
(v) By year and earnings
Monthly Earnings No. of Job Seekers with Placements Secured 2013 2014 2015
Below $4,000 126 57 57 $4,000-below $5,000 106 66 34 $5,000-below $6,000 131 74 28 $6,000-below $7,000 83 116 159 $7,000-below $8,000 120 108 77 $8,000-below $9,000 381 140 47 $9,000-below $10,000 375 406 277 $10,000-below $11,000 361 322 237 $11,000-below $12,000 139 367 346 $12,000-below $13,000 227 136 142 $13,000-below $14,000 35 40 83 $14,000 or above 34 77 99 Total 2 118 1 909 1 586
- End -
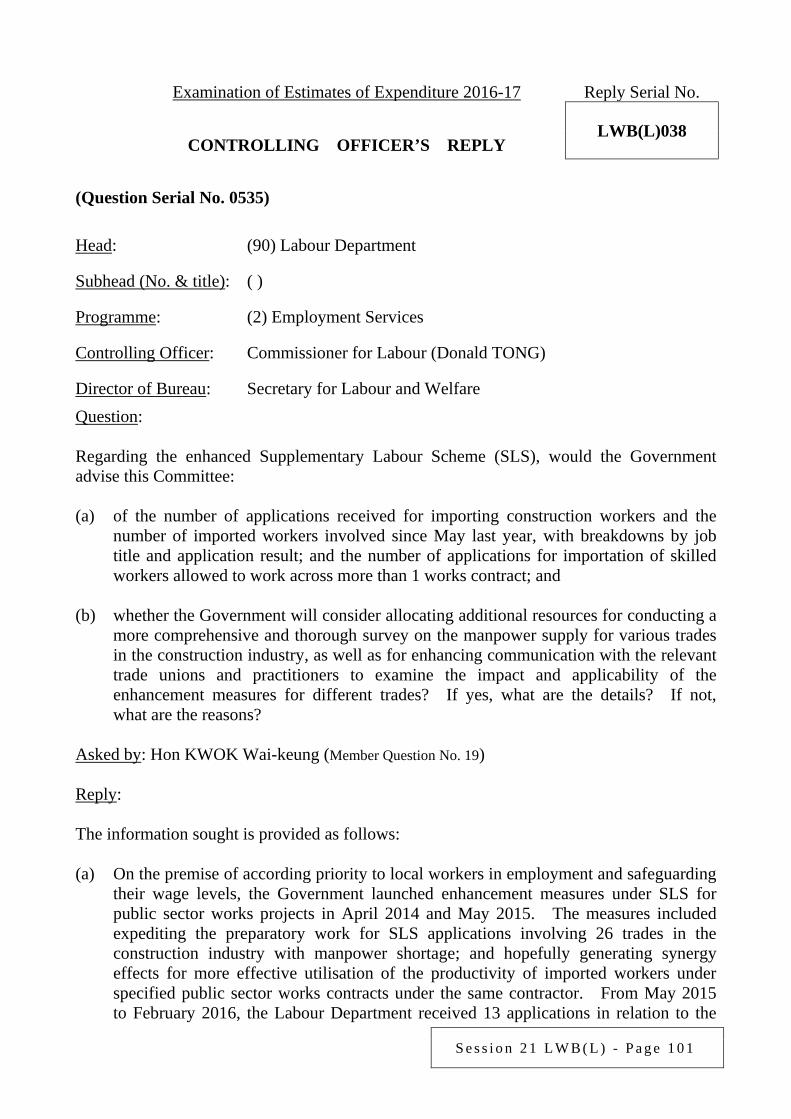
S e s s i o n 2 1 L W B ( L ) - P a g e 1 0 1
Examination of Estimates of Expenditure 2016-17 Reply Serial No.
LWB(L)038 CONTROLLING OFFICER’S REPLY (Question Serial No. 0535)
Head: (90) Labour Department
Subhead (No. & title): ( )
Programme: (2) Employment Services
Controlling Officer: Commissioner for Labour (Donald TONG)
Director of Bureau: Secretary for Labour and Welfare Question: Regarding the enhanced Supplementary Labour Scheme (SLS), would the Government advise this Committee: (a) of the number of applications received for importing construction workers and the
number of imported workers involved since May last year, with breakdowns by job title and application result; and the number of applications for importation of skilled workers allowed to work across more than 1 works contract; and
(b) whether the Government will consider allocating additional resources for conducting a
more comprehensive and thorough survey on the manpower supply for various trades in the construction industry, as well as for enhancing communication with the relevant trade unions and practitioners to examine the impact and applicability of the enhancement measures for different trades? If yes, what are the details? If not, what are the reasons?
Asked by: Hon KWOK Wai-keung (Member Question No. 19) Reply: The information sought is provided as follows: (a) On the premise of according priority to local workers in employment and safeguarding
their wage levels, the Government launched enhancement measures under SLS for public sector works projects in April 2014 and May 2015. The measures included expediting the preparatory work for SLS applications involving 26 trades in the construction industry with manpower shortage; and hopefully generating synergy effects for more effective utilisation of the productivity of imported workers under specified public sector works contracts under the same contractor. From May 2015 to February 2016, the Labour Department received 13 applications in relation to the
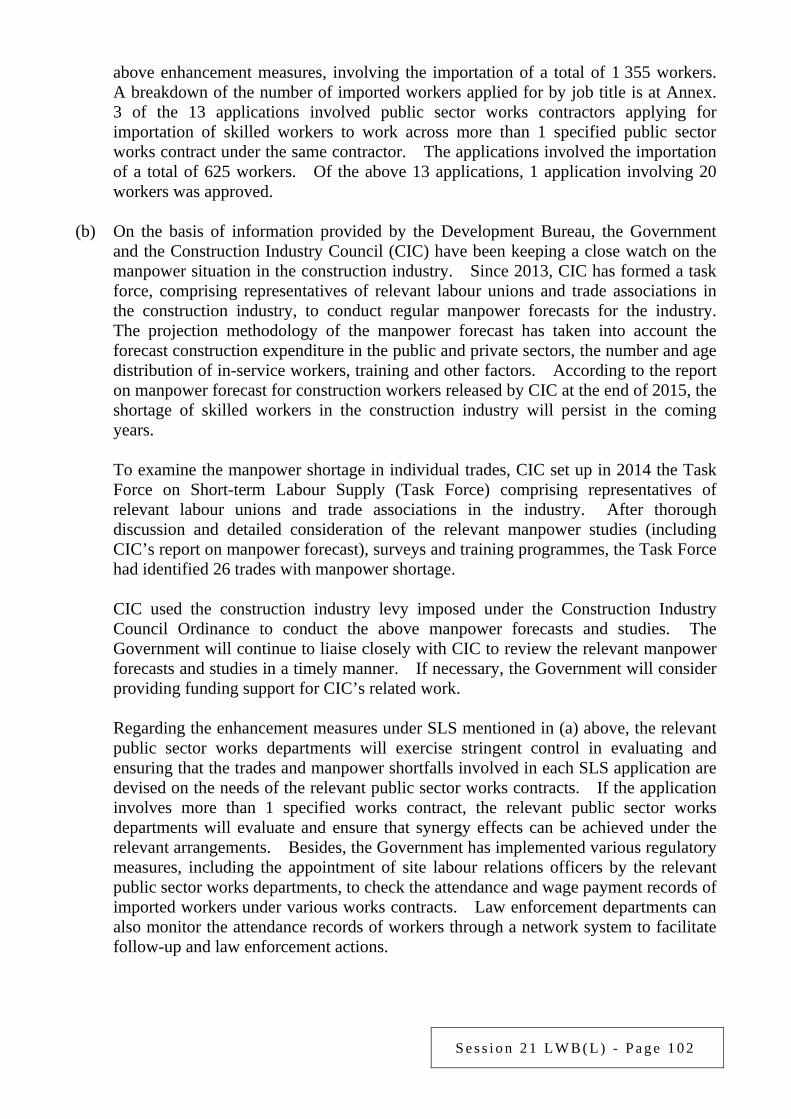
S e s s i o n 2 1 L W B ( L ) - P a g e 1 0 2
above enhancement measures, involving the importation of a total of 1 355 workers. A breakdown of the number of imported workers applied for by job title is at Annex. 3 of the 13 applications involved public sector works contractors applying for importation of skilled workers to work across more than 1 specified public sector works contract under the same contractor. The applications involved the importation of a total of 625 workers. Of the above 13 applications, 1 application involving 20 workers was approved.
(b) On the basis of information provided by the Development Bureau, the Government
and the Construction Industry Council (CIC) have been keeping a close watch on the manpower situation in the construction industry. Since 2013, CIC has formed a task force, comprising representatives of relevant labour unions and trade associations in the construction industry, to conduct regular manpower forecasts for the industry. The projection methodology of the manpower forecast has taken into account the forecast construction expenditure in the public and private sectors, the number and age distribution of in-service workers, training and other factors. According to the report on manpower forecast for construction workers released by CIC at the end of 2015, the shortage of skilled workers in the construction industry will persist in the coming years.
To examine the manpower shortage in individual trades, CIC set up in 2014 the Task
Force on Short-term Labour Supply (Task Force) comprising representatives of relevant labour unions and trade associations in the industry. After thorough discussion and detailed consideration of the relevant manpower studies (including CIC’s report on manpower forecast), surveys and training programmes, the Task Force had identified 26 trades with manpower shortage.
CIC used the construction industry levy imposed under the Construction Industry
Council Ordinance to conduct the above manpower forecasts and studies. The Government will continue to liaise closely with CIC to review the relevant manpower forecasts and studies in a timely manner. If necessary, the Government will consider providing funding support for CIC’s related work.
Regarding the enhancement measures under SLS mentioned in (a) above, the relevant
public sector works departments will exercise stringent control in evaluating and ensuring that the trades and manpower shortfalls involved in each SLS application are devised on the needs of the relevant public sector works contracts. If the application involves more than 1 specified works contract, the relevant public sector works departments will evaluate and ensure that synergy effects can be achieved under the relevant arrangements. Besides, the Government has implemented various regulatory measures, including the appointment of site labour relations officers by the relevant public sector works departments, to check the attendance and wage payment records of imported workers under various works contracts. Law enforcement departments can also monitor the attendance records of workers through a network system to facilitate follow-up and law enforcement actions.

S e s s i o n 2 1 L W B ( L ) - P a g e 1 0 3
The Government will continue to liaise closely with the industry, including relevant labour unions, and review the effectiveness of the measures in a timely manner to ensure the sustainable social and economic development of Hong Kong.
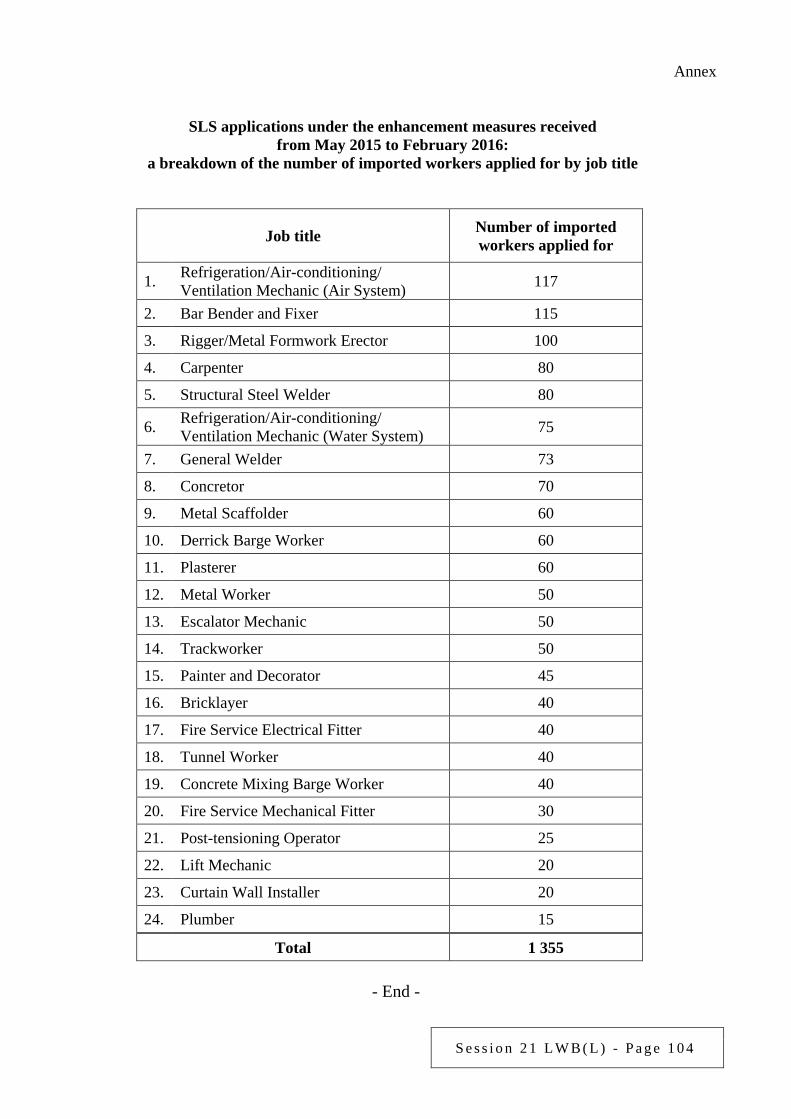
S e s s i o n 2 1 L W B ( L ) - P a g e 1 0 4
Annex
SLS applications under the enhancement measures received from May 2015 to February 2016:
a breakdown of the number of imported workers applied for by job title
Job title Number of imported workers applied for
1. Refrigeration/Air-conditioning/ Ventilation Mechanic (Air System) 117
2. Bar Bender and Fixer 115
3. Rigger/Metal Formwork Erector 100
4. Carpenter 80
5. Structural Steel Welder 80
6. Refrigeration/Air-conditioning/ Ventilation Mechanic (Water System) 75
7. General Welder 73
8. Concretor 70
9. Metal Scaffolder 60
10. Derrick Barge Worker 60
11. Plasterer 60
12. Metal Worker 50
13. Escalator Mechanic 50
14. Trackworker 50
15. Painter and Decorator 45
16. Bricklayer 40
17. Fire Service Electrical Fitter 40
18. Tunnel Worker 40
19. Concrete Mixing Barge Worker 40
20. Fire Service Mechanical Fitter 30
21. Post-tensioning Operator 25
22. Lift Mechanic 20
23. Curtain Wall Installer 20
24. Plumber 15
Total 1 355
- End -
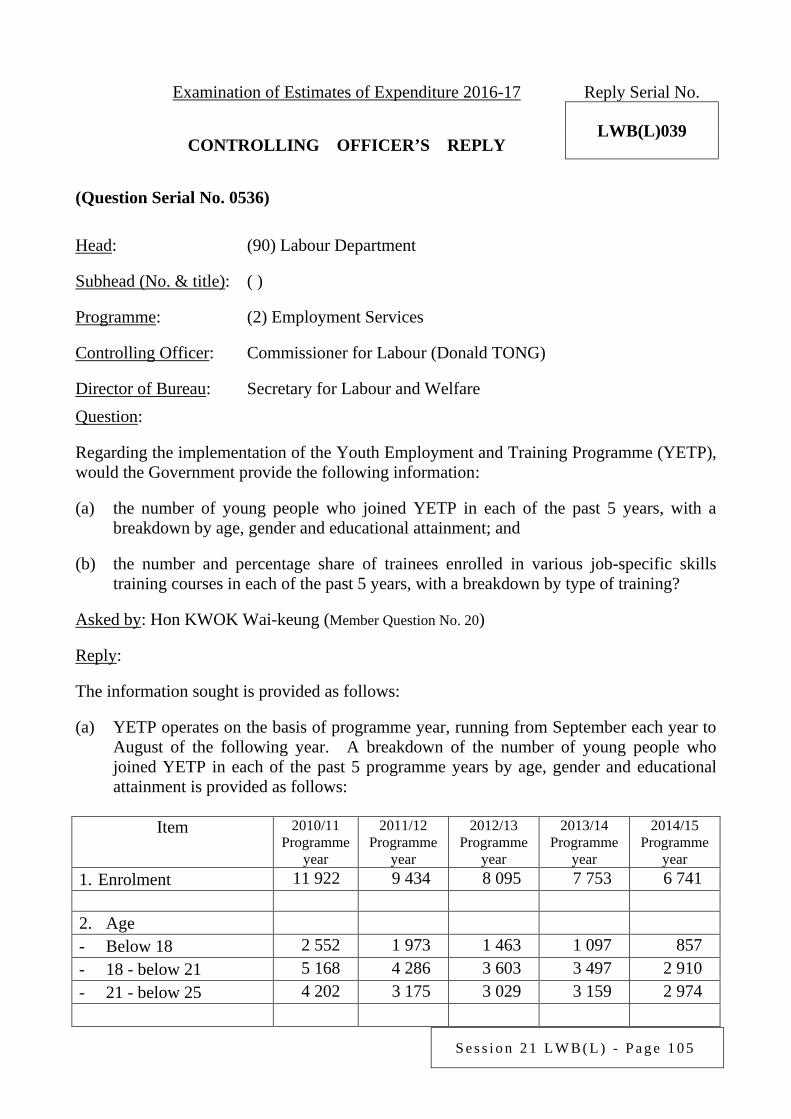
S e s s i o n 2 1 L W B ( L ) - P a g e 1 0 5
Examination of Estimates of Expenditure 2016-17 Reply Serial No.
LWB(L)039 CONTROLLING OFFICER’S REPLY (Question Serial No. 0536)
Head: (90) Labour Department
Subhead (No. & title): ( )
Programme: (2) Employment Services
Controlling Officer: Commissioner for Labour (Donald TONG)
Director of Bureau: Secretary for Labour and Welfare Question: Regarding the implementation of the Youth Employment and Training Programme (YETP), would the Government provide the following information: (a) the number of young people who joined YETP in each of the past 5 years, with a
breakdown by age, gender and educational attainment; and (b) the number and percentage share of trainees enrolled in various job-specific skills
training courses in each of the past 5 years, with a breakdown by type of training? Asked by: Hon KWOK Wai-keung (Member Question No. 20) Reply: The information sought is provided as follows: (a) YETP operates on the basis of programme year, running from September each year to
August of the following year. A breakdown of the number of young people who joined YETP in each of the past 5 programme years by age, gender and educational attainment is provided as follows:
Item 2010/11
Programme year
2011/12 Programme
year
2012/13 Programme
year
2013/14 Programme
year
2014/15 Programme
year 1. Enrolment 11 922 9 434 8 095 7 753 6 741 2. Age - Below 18 2 552 1 973 1 463 1 097 857 - 18 - below 21 5 168 4 286 3 603 3 497 2 910 - 21 - below 25 4 202 3 175 3 029 3 159 2 974
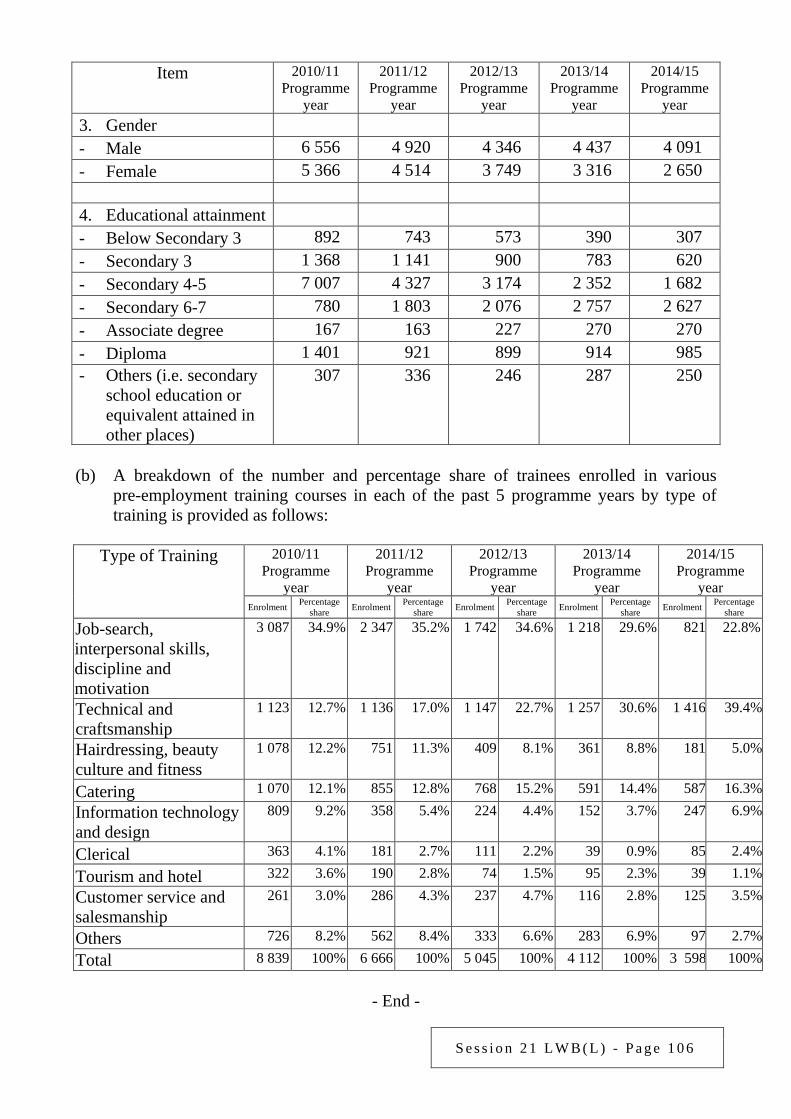
S e s s i o n 2 1 L W B ( L ) - P a g e 1 0 6
Item 2010/11 Programme
year
2011/12 Programme
year
2012/13 Programme
year
2013/14 Programme
year
2014/15 Programme
year 3. Gender - Male 6 556 4 920 4 346 4 437 4 091 - Female 5 366 4 514 3 749 3 316 2 650 4. Educational attainment - Below Secondary 3 892 743 573 390 307 - Secondary 3 1 368 1 141 900 783 620 - Secondary 4-5 7 007 4 327 3 174 2 352 1 682 - Secondary 6-7 780 1 803 2 076 2 757 2 627 - Associate degree 167 163 227 270 270 - Diploma 1 401 921 899 914 985 - Others (i.e. secondary
school education or equivalent attained in other places)
307 336 246 287 250
(b) A breakdown of the number and percentage share of trainees enrolled in various
pre-employment training courses in each of the past 5 programme years by type of training is provided as follows:
Type of Training 2010/11
Programme year
2011/12 Programme
year
2012/13 Programme
year
2013/14 Programme
year
2014/15 Programme
year Enrolment Percentage
share Enrolment Percentage share Enrolment Percentage
share Enrolment Percentage share Enrolment Percentage
share
Job-search, interpersonal skills, discipline and motivation
3 087 34.9% 2 347 35.2% 1 742 34.6% 1 218 29.6% 821 22.8%
Technical and craftsmanship
1 123 12.7% 1 136 17.0% 1 147 22.7% 1 257 30.6% 1 416 39.4%
Hairdressing, beauty culture and fitness
1 078 12.2% 751 11.3% 409 8.1% 361 8.8% 181 5.0%
Catering 1 070 12.1% 855 12.8% 768 15.2% 591 14.4% 587 16.3%
Information technology and design
809 9.2% 358 5.4% 224 4.4% 152 3.7% 247 6.9%
Clerical 363 4.1% 181 2.7% 111 2.2% 39 0.9% 85 2.4%
Tourism and hotel 322 3.6% 190 2.8% 74 1.5% 95 2.3% 39 1.1%
Customer service and salesmanship
261 3.0% 286 4.3% 237 4.7% 116 2.8% 125 3.5%
Others 726 8.2% 562 8.4% 333 6.6% 283 6.9% 97 2.7%
Total 8 839 100% 6 666 100% 5 045 100% 4 112 100% 3 598 100%
- End -
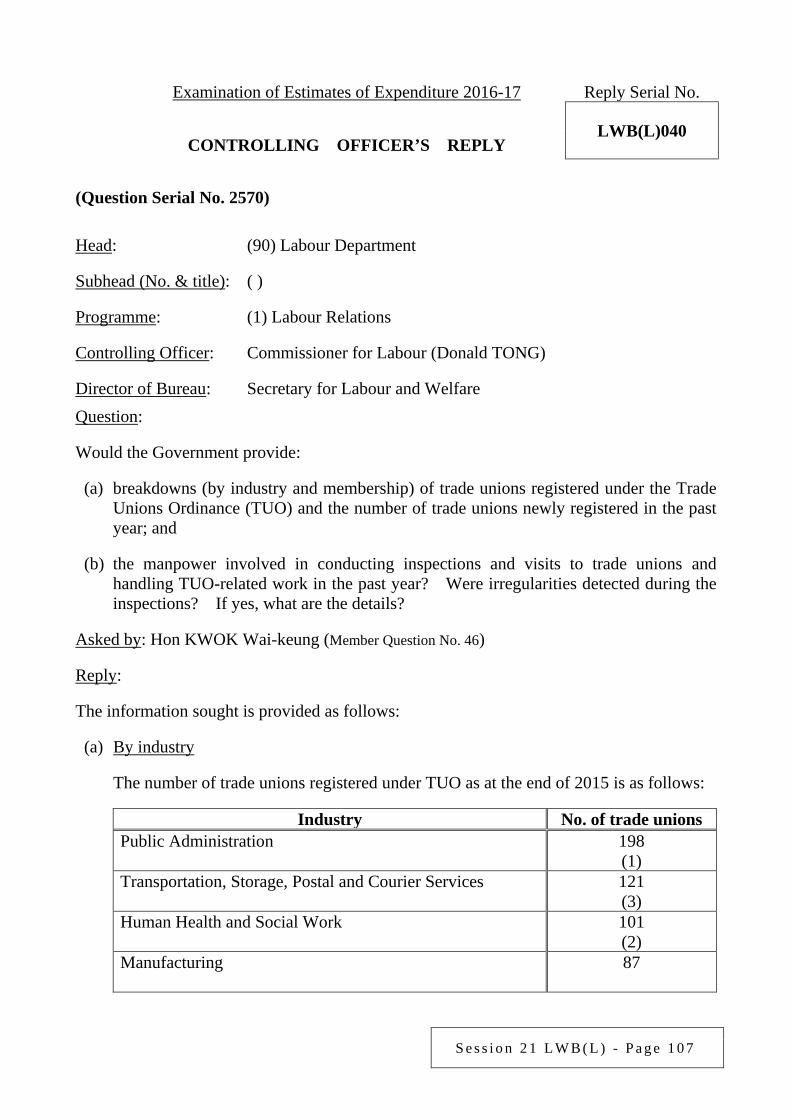
S e s s i o n 2 1 L W B ( L ) - P a g e 1 0 7
Examination of Estimates of Expenditure 2016-17 Reply Serial No.
LWB(L)040 CONTROLLING OFFICER’S REPLY (Question Serial No. 2570)
Head: (90) Labour Department
Subhead (No. & title): ( )
Programme: (1) Labour Relations
Controlling Officer: Commissioner for Labour (Donald TONG)
Director of Bureau: Secretary for Labour and Welfare Question: Would the Government provide: (a) breakdowns (by industry and membership) of trade unions registered under the Trade
Unions Ordinance (TUO) and the number of trade unions newly registered in the past year; and
(b) the manpower involved in conducting inspections and visits to trade unions and
handling TUO-related work in the past year? Were irregularities detected during the inspections? If yes, what are the details?
Asked by: Hon KWOK Wai-keung (Member Question No. 46) Reply: The information sought is provided as follows: (a) By industry
The number of trade unions registered under TUO as at the end of 2015 is as follows:
Industry No. of trade unions Public Administration 198
(1) Transportation, Storage, Postal and Courier Services 121
(3) Human Health and Social Work 101
(2) Manufacturing
87
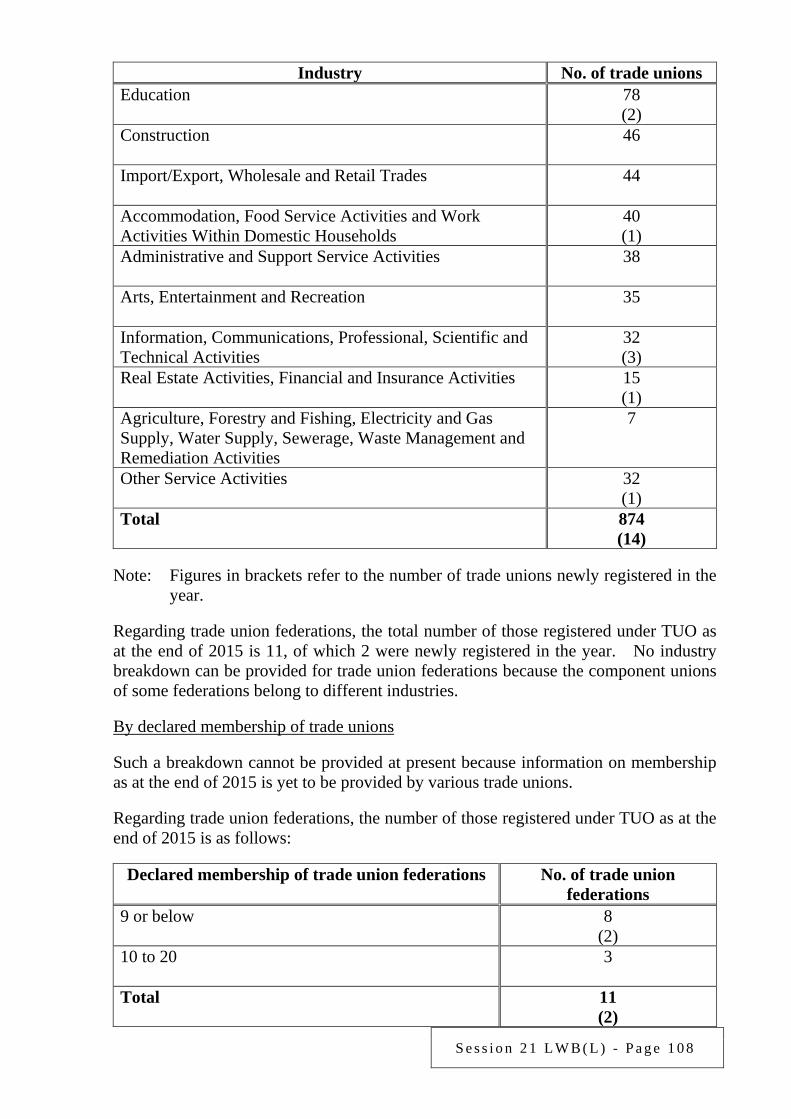
S e s s i o n 2 1 L W B ( L ) - P a g e 1 0 8
Industry No. of trade unions Education 78
(2) Construction
46
Import/Export, Wholesale and Retail Trades
44
Accommodation, Food Service Activities and Work Activities Within Domestic Households
40 (1)
Administrative and Support Service Activities
38
Arts, Entertainment and Recreation
35
Information, Communications, Professional, Scientific and Technical Activities
32 (3)
Real Estate Activities, Financial and Insurance Activities 15 (1)
Agriculture, Forestry and Fishing, Electricity and Gas Supply, Water Supply, Sewerage, Waste Management and Remediation Activities
7
Other Service Activities 32 (1)
Total 874 (14)
Note: Figures in brackets refer to the number of trade unions newly registered in the
year.
Regarding trade union federations, the total number of those registered under TUO as at the end of 2015 is 11, of which 2 were newly registered in the year. No industry breakdown can be provided for trade union federations because the component unions of some federations belong to different industries.
By declared membership of trade unions
Such a breakdown cannot be provided at present because information on membership as at the end of 2015 is yet to be provided by various trade unions.
Regarding trade union federations, the number of those registered under TUO as at the end of 2015 is as follows:
Declared membership of trade union federations No. of trade union
federations 9 or below 8
(2) 10 to 20
3
Total 11 (2)
S e s s i o n 2 1 L W B ( L ) - P a g e 1 0 9
Note: Figures in brackets refer to the number of trade union federations newly
registered in the year. (b) The Registry of Trade Unions (RTU) had 17 staff to handle TUO-related work in
2015. As the inspections and visits to trade unions were conducted by staff among their other duties, the manpower involved in this area of work could not be separately identified.
The main purposes of the inspections and visits to trade unions are to assist the trade unions to comply with TUO and promote sound trade union management. The scope of general inspections and visits covers checking whether a name list containing the names of all officers and their titles has been prominently exhibited, whether there is a common seal, and whether the register of members and accounts and relevant records are properly kept in the offices as required by TUO. RTU staff also make use of the opportunities offered by the inspections and visits to strengthen their communications with trade unions, and where necessary answer enquiries and offer advice. No obvious irregularities were detected during inspections and visits in the past year.
- End -
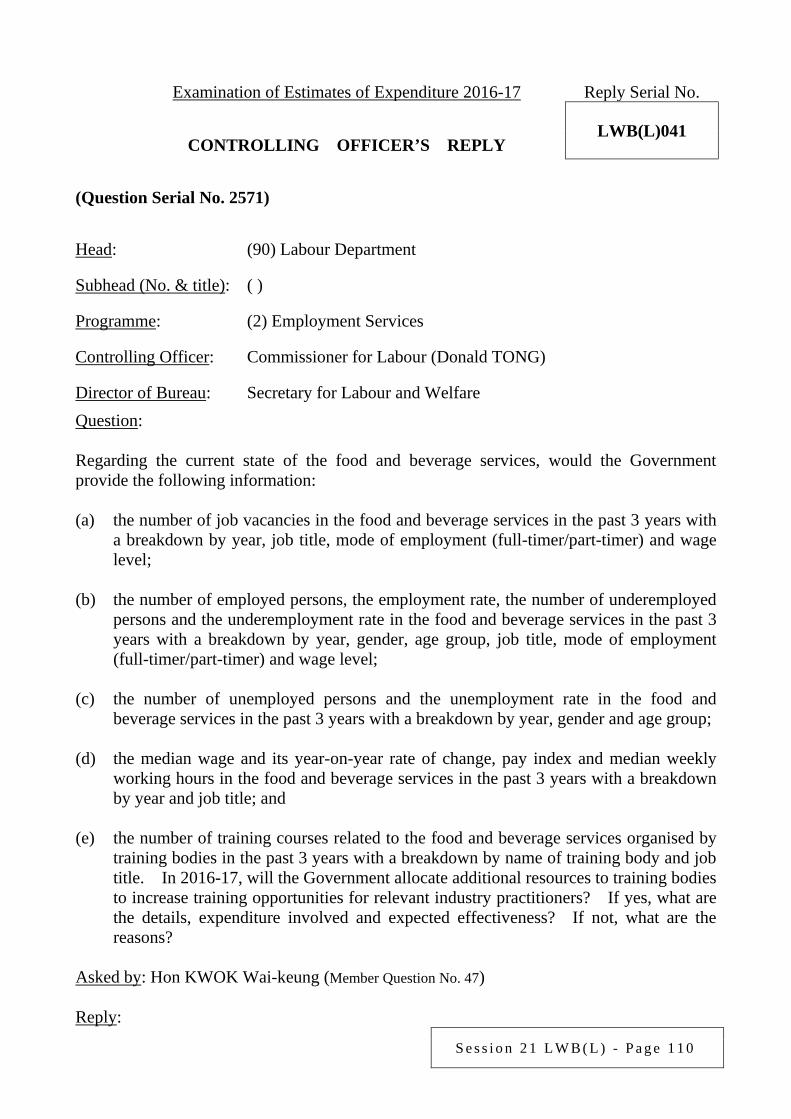
S e s s i o n 2 1 L W B ( L ) - P a g e 1 1 0
Examination of Estimates of Expenditure 2016-17 Reply Serial No.
LWB(L)041 CONTROLLING OFFICER’S REPLY (Question Serial No. 2571)
Head: (90) Labour Department
Subhead (No. & title): ( )
Programme: (2) Employment Services
Controlling Officer: Commissioner for Labour (Donald TONG)
Director of Bureau: Secretary for Labour and Welfare Question: Regarding the current state of the food and beverage services, would the Government provide the following information: (a) the number of job vacancies in the food and beverage services in the past 3 years with
a breakdown by year, job title, mode of employment (full-timer/part-timer) and wage level;
(b) the number of employed persons, the employment rate, the number of underemployed
persons and the underemployment rate in the food and beverage services in the past 3 years with a breakdown by year, gender, age group, job title, mode of employment (full-timer/part-timer) and wage level;
(c) the number of unemployed persons and the unemployment rate in the food and
beverage services in the past 3 years with a breakdown by year, gender and age group; (d) the median wage and its year-on-year rate of change, pay index and median weekly
working hours in the food and beverage services in the past 3 years with a breakdown by year and job title; and
(e) the number of training courses related to the food and beverage services organised by
training bodies in the past 3 years with a breakdown by name of training body and job title. In 2016-17, will the Government allocate additional resources to training bodies to increase training opportunities for relevant industry practitioners? If yes, what are the details, expenditure involved and expected effectiveness? If not, what are the reasons?
Asked by: Hon KWOK Wai-keung (Member Question No. 47) Reply:
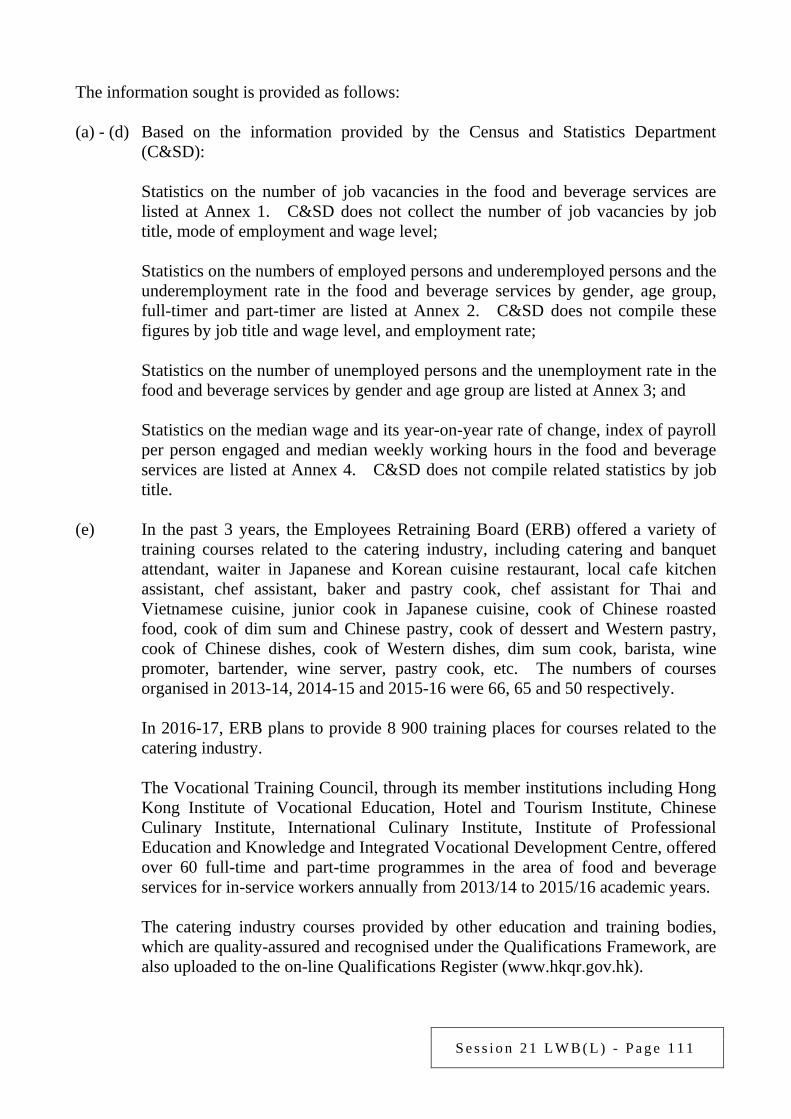
S e s s i o n 2 1 L W B ( L ) - P a g e 1 1 1
The information sought is provided as follows: (a) - (d) Based on the information provided by the Census and Statistics Department
(C&SD): Statistics on the number of job vacancies in the food and beverage services are
listed at Annex 1. C&SD does not collect the number of job vacancies by job title, mode of employment and wage level;
Statistics on the numbers of employed persons and underemployed persons and the
underemployment rate in the food and beverage services by gender, age group, full-timer and part-timer are listed at Annex 2. C&SD does not compile these figures by job title and wage level, and employment rate;
Statistics on the number of unemployed persons and the unemployment rate in the
food and beverage services by gender and age group are listed at Annex 3; and Statistics on the median wage and its year-on-year rate of change, index of payroll
per person engaged and median weekly working hours in the food and beverage services are listed at Annex 4. C&SD does not compile related statistics by job title.
(e) In the past 3 years, the Employees Retraining Board (ERB) offered a variety of
training courses related to the catering industry, including catering and banquet attendant, waiter in Japanese and Korean cuisine restaurant, local cafe kitchen assistant, chef assistant, baker and pastry cook, chef assistant for Thai and Vietnamese cuisine, junior cook in Japanese cuisine, cook of Chinese roasted food, cook of dim sum and Chinese pastry, cook of dessert and Western pastry, cook of Chinese dishes, cook of Western dishes, dim sum cook, barista, wine promoter, bartender, wine server, pastry cook, etc. The numbers of courses organised in 2013-14, 2014-15 and 2015-16 were 66, 65 and 50 respectively.
In 2016-17, ERB plans to provide 8 900 training places for courses related to the
catering industry. The Vocational Training Council, through its member institutions including Hong
Kong Institute of Vocational Education, Hotel and Tourism Institute, Chinese Culinary Institute, International Culinary Institute, Institute of Professional Education and Knowledge and Integrated Vocational Development Centre, offered over 60 full-time and part-time programmes in the area of food and beverage services for in-service workers annually from 2013/14 to 2015/16 academic years.
The catering industry courses provided by other education and training bodies,
which are quality-assured and recognised under the Qualifications Framework, are also uploaded to the on-line Qualifications Register (www.hkqr.gov.hk).

S e s s i o n 2 1 L W B ( L ) - P a g e 1 1 2
There are a wide diversity of training bodies and types of courses related to the catering industry in Hong Kong. The Labour Department does not keep information on the resources allocated by the Government to these training bodies.
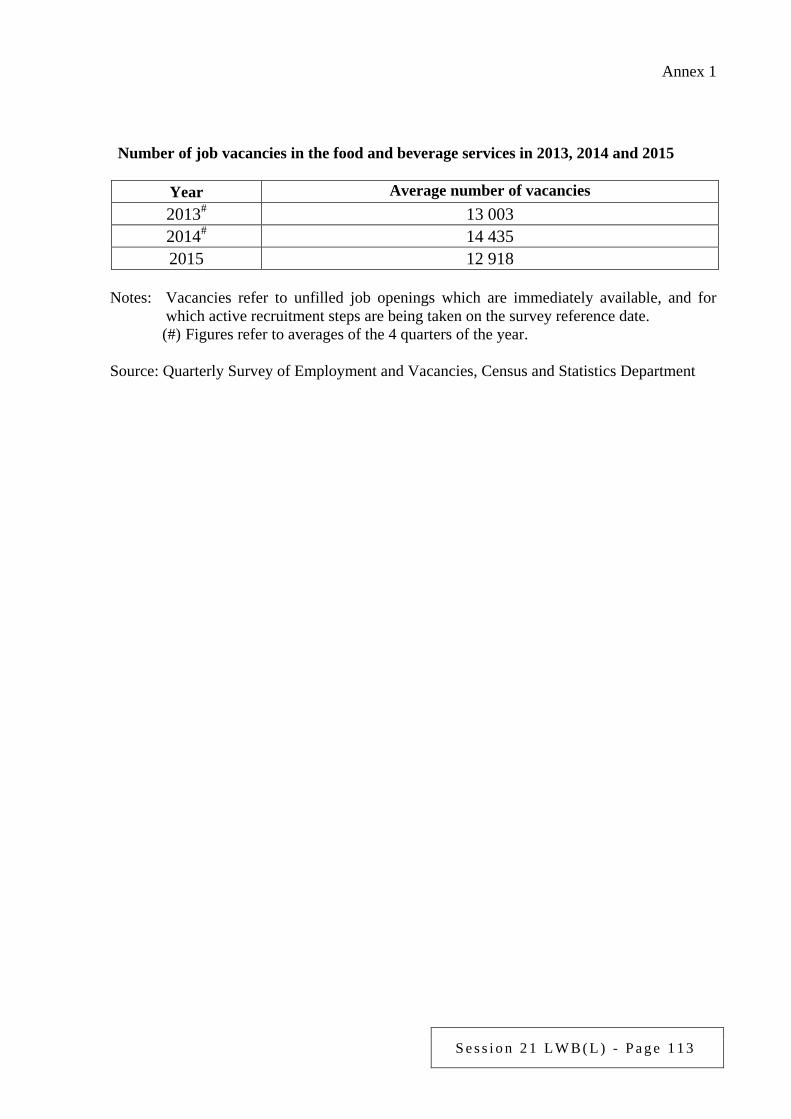
S e s s i o n 2 1 L W B ( L ) - P a g e 1 1 3
Annex 1
Number of job vacancies in the food and beverage services in 2013, 2014 and 2015
Year Average number of vacancies 2013# 13 003 2014# 14 435 2015 12 918
Notes: Vacancies refer to unfilled job openings which are immediately available, and for
which active recruitment steps are being taken on the survey reference date. (#) Figures refer to averages of the 4 quarters of the year.
Source: Quarterly Survey of Employment and Vacancies, Census and Statistics Department
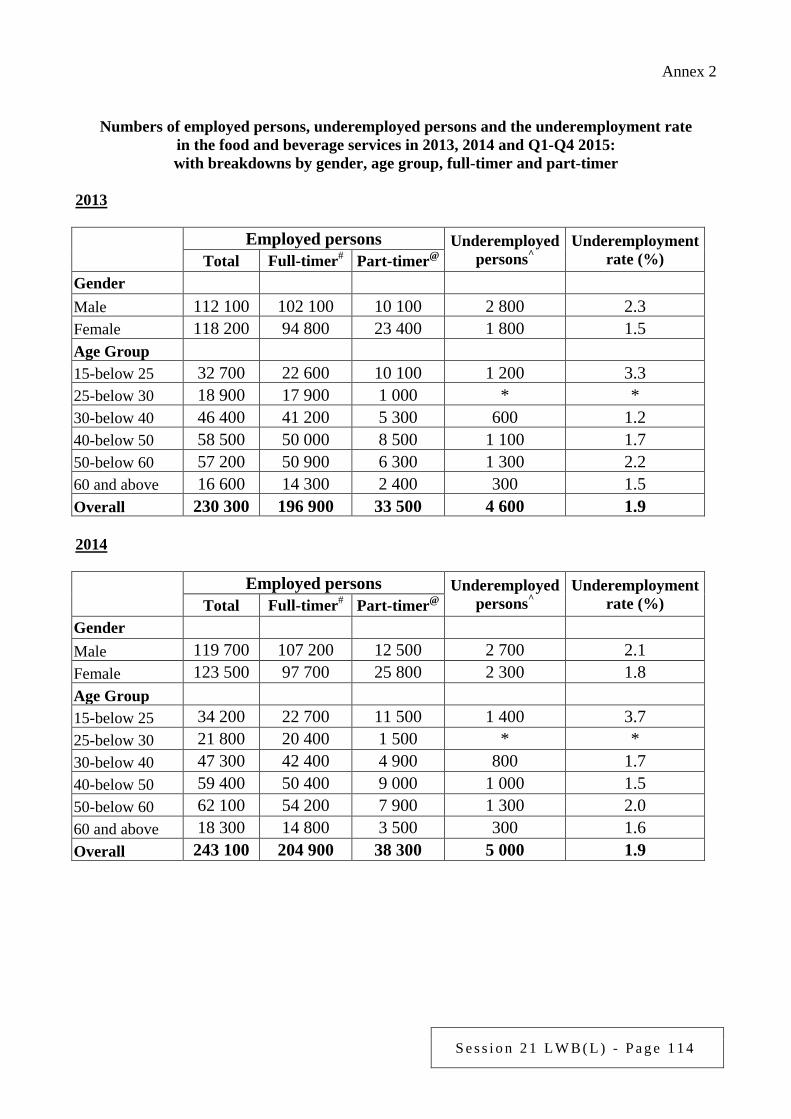
S e s s i o n 2 1 L W B ( L ) - P a g e 1 1 4
Annex 2
Numbers of employed persons, underemployed persons and the underemployment rate in the food and beverage services in 2013, 2014 and Q1-Q4 2015: with breakdowns by gender, age group, full-timer and part-timer
2013
Employed persons Underemployed persons^
Underemployment rate (%) Total Full-timer# Part-timer@
Gender Male 112 100 102 100 10 100 2 800 2.3 Female 118 200 94 800 23 400 1 800 1.5 Age Group 15-below 25 32 700 22 600 10 100 1 200 3.3 25-below 30 18 900 17 900 1 000 * * 30-below 40 46 400 41 200 5 300 600 1.2 40-below 50 58 500 50 000 8 500 1 100 1.7 50-below 60 57 200 50 900 6 300 1 300 2.2 60 and above 16 600 14 300 2 400 300 1.5 Overall 230 300 196 900 33 500 4 600 1.9 2014
Employed persons Underemployed persons^
Underemployment rate (%) Total Full-timer# Part-timer@
Gender Male 119 700 107 200 12 500 2 700 2.1 Female 123 500 97 700 25 800 2 300 1.8 Age Group 15-below 25 34 200 22 700 11 500 1 400 3.7 25-below 30 21 800 20 400 1 500 * * 30-below 40 47 300 42 400 4 900 800 1.7 40-below 50 59 400 50 400 9 000 1 000 1.5 50-below 60 62 100 54 200 7 900 1 300 2.0 60 and above 18 300 14 800 3 500 300 1.6 Overall 243 100 204 900 38 300 5 000 1.9
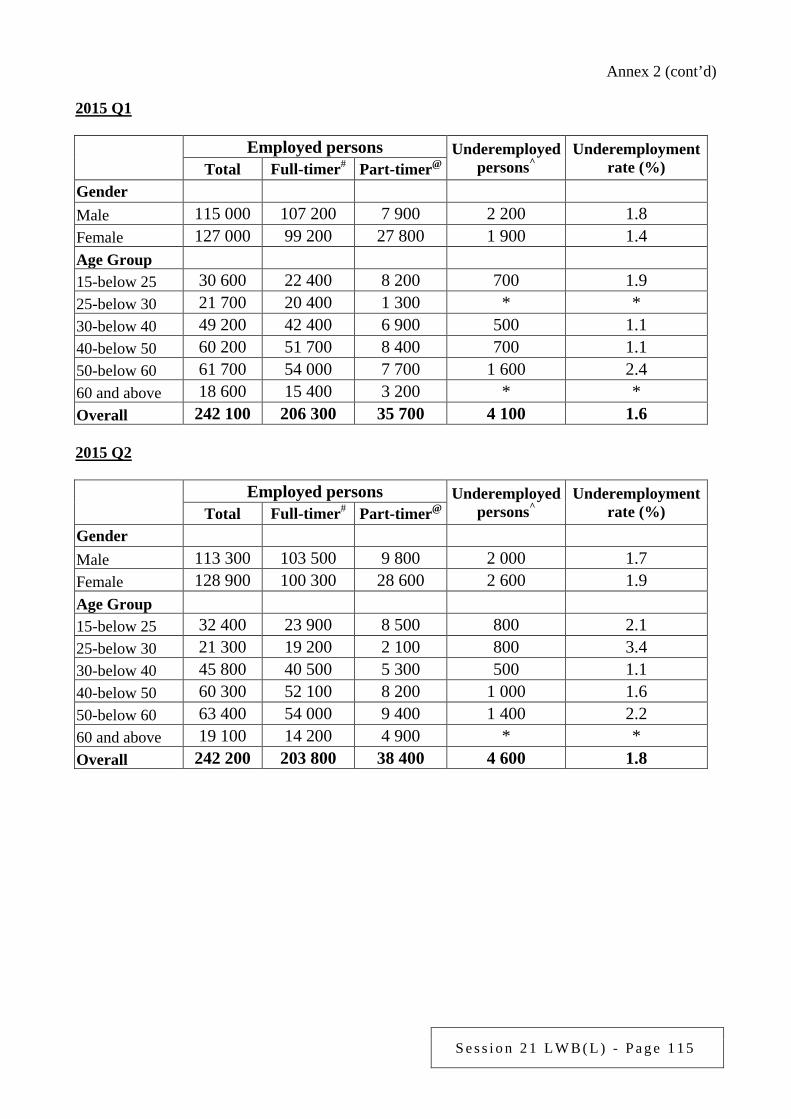
S e s s i o n 2 1 L W B ( L ) - P a g e 1 1 5
Annex 2 (cont’d) 2015 Q1
Employed persons Underemployed persons^
Underemployment rate (%) Total Full-timer# Part-timer@
Gender Male 115 000 107 200 7 900 2 200 1.8 Female 127 000 99 200 27 800 1 900 1.4 Age Group 15-below 25 30 600 22 400 8 200 700 1.9 25-below 30 21 700 20 400 1 300 * * 30-below 40 49 200 42 400 6 900 500 1.1 40-below 50 60 200 51 700 8 400 700 1.1 50-below 60 61 700 54 000 7 700 1 600 2.4 60 and above 18 600 15 400 3 200 * * Overall 242 100 206 300 35 700 4 100 1.6 2015 Q2
Employed persons Underemployed persons^
Underemployment rate (%) Total Full-timer# Part-timer@
Gender Male 113 300 103 500 9 800 2 000 1.7 Female 128 900 100 300 28 600 2 600 1.9 Age Group 15-below 25 32 400 23 900 8 500 800 2.1 25-below 30 21 300 19 200 2 100 800 3.4 30-below 40 45 800 40 500 5 300 500 1.1 40-below 50 60 300 52 100 8 200 1 000 1.6 50-below 60 63 400 54 000 9 400 1 400 2.2 60 and above 19 100 14 200 4 900 * * Overall 242 200 203 800 38 400 4 600 1.8
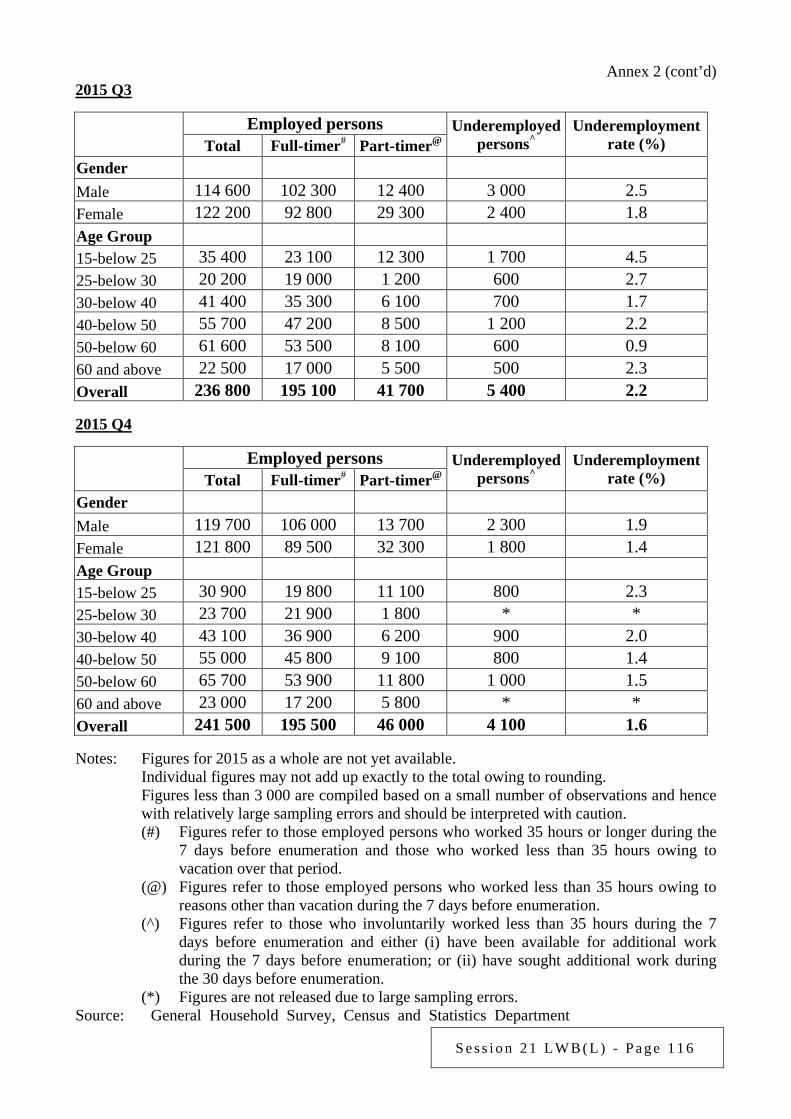
S e s s i o n 2 1 L W B ( L ) - P a g e 1 1 6
Annex 2 (cont’d) 2015 Q3
Employed persons Underemployed persons^
Underemployment rate (%) Total Full-timer# Part-timer@
Gender Male 114 600 102 300 12 400 3 000 2.5 Female 122 200 92 800 29 300 2 400 1.8 Age Group 15-below 25 35 400 23 100 12 300 1 700 4.5 25-below 30 20 200 19 000 1 200 600 2.7 30-below 40 41 400 35 300 6 100 700 1.7 40-below 50 55 700 47 200 8 500 1 200 2.2 50-below 60 61 600 53 500 8 100 600 0.9 60 and above 22 500 17 000 5 500 500 2.3 Overall 236 800 195 100 41 700 5 400 2.2 2015 Q4
Employed persons Underemployed persons^
Underemployment rate (%) Total Full-timer# Part-timer@
Gender Male 119 700 106 000 13 700 2 300 1.9 Female 121 800 89 500 32 300 1 800 1.4 Age Group 15-below 25 30 900 19 800 11 100 800 2.3 25-below 30 23 700 21 900 1 800 * * 30-below 40 43 100 36 900 6 200 900 2.0 40-below 50 55 000 45 800 9 100 800 1.4 50-below 60 65 700 53 900 11 800 1 000 1.5 60 and above 23 000 17 200 5 800 * * Overall 241 500 195 500 46 000 4 100 1.6 Notes: Figures for 2015 as a whole are not yet available. Individual figures may not add up exactly to the total owing to rounding. Figures less than 3 000 are compiled based on a small number of observations and hence
with relatively large sampling errors and should be interpreted with caution. (#) Figures refer to those employed persons who worked 35 hours or longer during the
7 days before enumeration and those who worked less than 35 hours owing to vacation over that period.
(@) Figures refer to those employed persons who worked less than 35 hours owing to reasons other than vacation during the 7 days before enumeration.
(^) Figures refer to those who involuntarily worked less than 35 hours during the 7 days before enumeration and either (i) have been available for additional work during the 7 days before enumeration; or (ii) have sought additional work during the 30 days before enumeration.
(*) Figures are not released due to large sampling errors. Source: General Household Survey, Census and Statistics Department
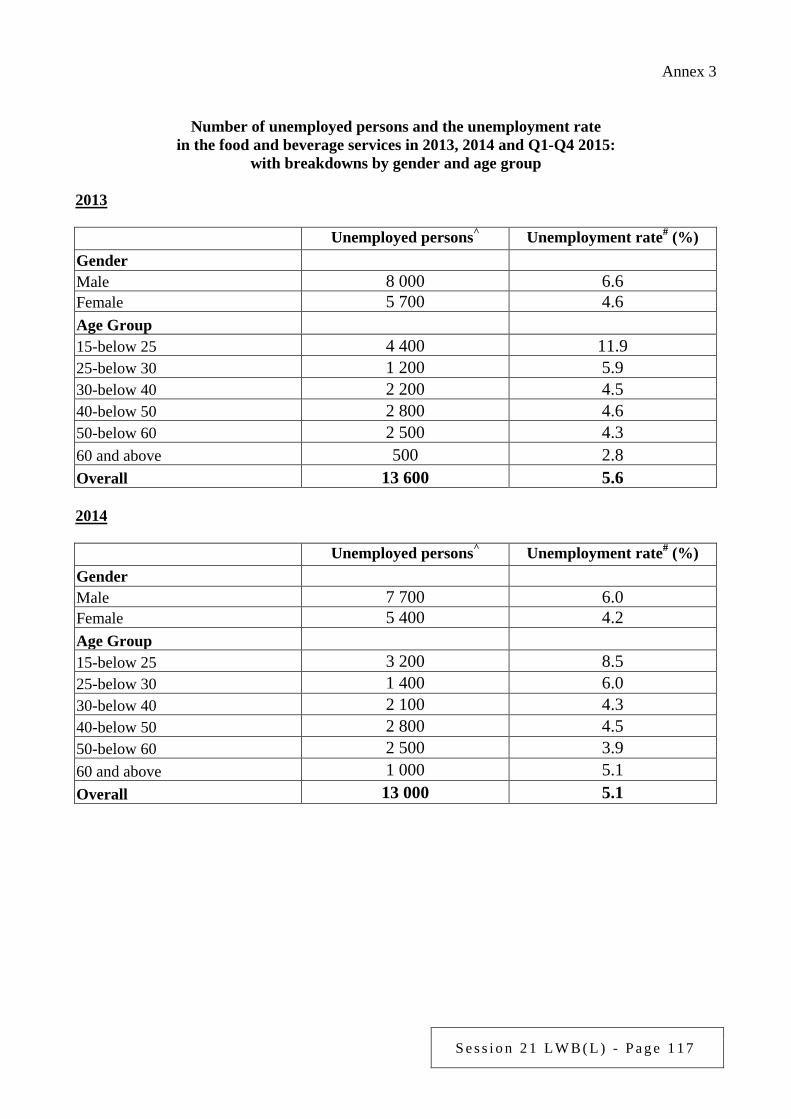
S e s s i o n 2 1 L W B ( L ) - P a g e 1 1 7
Annex 3
Number of unemployed persons and the unemployment rate in the food and beverage services in 2013, 2014 and Q1-Q4 2015:
with breakdowns by gender and age group 2013
Unemployed persons^ Unemployment rate# (%)
Gender Male 8 000 6.6 Female 5 700 4.6 Age Group
15-below 25 4 400 11.9 25-below 30 1 200 5.9 30-below 40 2 200 4.5 40-below 50 2 800 4.6 50-below 60 2 500 4.3 60 and above 500 2.8 Overall 13 600 5.6 2014
Unemployed persons^ Unemployment rate# (%)
Gender Male 7 700 6.0 Female 5 400 4.2 Age Group 15-below 25 3 200 8.5 25-below 30 1 400 6.0 30-below 40 2 100 4.3 40-below 50 2 800 4.5 50-below 60 2 500 3.9 60 and above 1 000 5.1 Overall 13 000 5.1
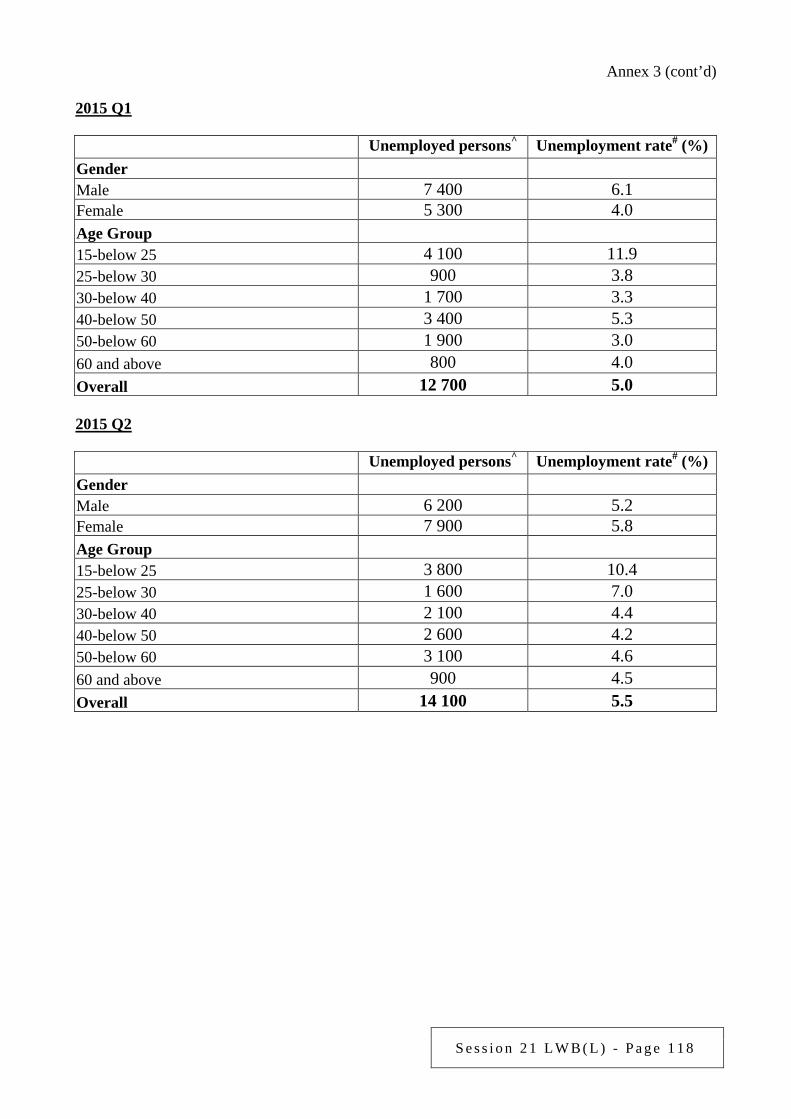
S e s s i o n 2 1 L W B ( L ) - P a g e 1 1 8
Annex 3 (cont’d) 2015 Q1
Unemployed persons^ Unemployment rate# (%)
Gender Male 7 400 6.1 Female 5 300 4.0 Age Group 15-below 25 4 100 11.9 25-below 30 900 3.8 30-below 40 1 700 3.3 40-below 50 3 400 5.3 50-below 60 1 900 3.0 60 and above 800 4.0 Overall 12 700 5.0 2015 Q2
Unemployed persons^ Unemployment rate# (%)
Gender Male 6 200 5.2 Female 7 900 5.8 Age Group 15-below 25 3 800 10.4 25-below 30 1 600 7.0 30-below 40 2 100 4.4 40-below 50 2 600 4.2 50-below 60 3 100 4.6 60 and above 900 4.5 Overall 14 100 5.5
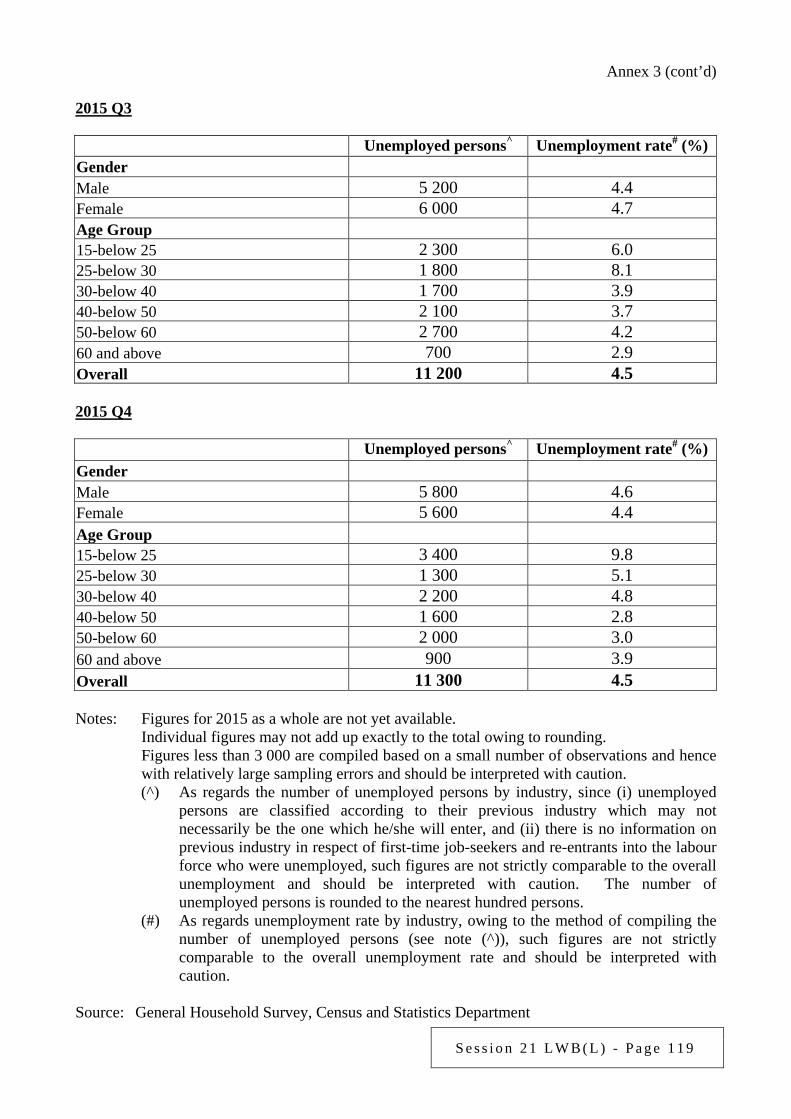
S e s s i o n 2 1 L W B ( L ) - P a g e 1 1 9
Annex 3 (cont’d) 2015 Q3
Unemployed persons^ Unemployment rate# (%) Gender Male 5 200 4.4 Female 6 000 4.7 Age Group 15-below 25 2 300 6.0 25-below 30 1 800 8.1 30-below 40 1 700 3.9 40-below 50 2 100 3.7 50-below 60 2 700 4.2 60 and above 700 2.9 Overall 11 200 4.5 2015 Q4
Unemployed persons^ Unemployment rate# (%)
Gender Male 5 800 4.6 Female 5 600 4.4 Age Group 15-below 25 3 400 9.8 25-below 30 1 300 5.1 30-below 40 2 200 4.8 40-below 50 1 600 2.8 50-below 60 2 000 3.0 60 and above 900 3.9 Overall 11 300 4.5 Notes: Figures for 2015 as a whole are not yet available. Individual figures may not add up exactly to the total owing to rounding. Figures less than 3 000 are compiled based on a small number of observations and hence
with relatively large sampling errors and should be interpreted with caution. (^) As regards the number of unemployed persons by industry, since (i) unemployed
persons are classified according to their previous industry which may not necessarily be the one which he/she will enter, and (ii) there is no information on previous industry in respect of first-time job-seekers and re-entrants into the labour force who were unemployed, such figures are not strictly comparable to the overall unemployment and should be interpreted with caution. The number of unemployed persons is rounded to the nearest hundred persons.
(#) As regards unemployment rate by industry, owing to the method of compiling the number of unemployed persons (see note (^)), such figures are not strictly comparable to the overall unemployment rate and should be interpreted with caution.
Source: General Household Survey, Census and Statistics Department
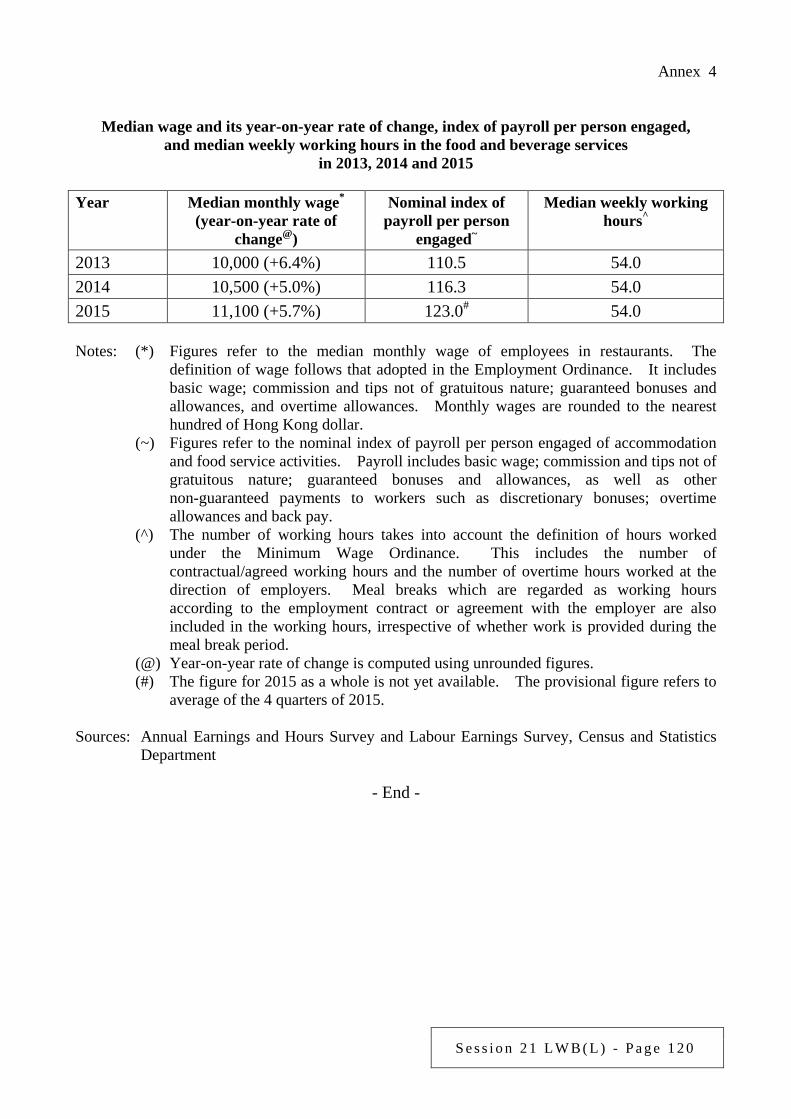
S e s s i o n 2 1 L W B ( L ) - P a g e 1 2 0
Annex 4
Median wage and its year-on-year rate of change, index of payroll per person engaged, and median weekly working hours in the food and beverage services
in 2013, 2014 and 2015
Year Median monthly wage* (year-on-year rate of
change@)
Nominal index of payroll per person
engaged~
Median weekly working hours^
2013 10,000 (+6.4%) 110.5 54.0 2014 10,500 (+5.0%) 116.3 54.0 2015 11,100 (+5.7%) 123.0# 54.0
Notes: (*) Figures refer to the median monthly wage of employees in restaurants. The
definition of wage follows that adopted in the Employment Ordinance. It includes basic wage; commission and tips not of gratuitous nature; guaranteed bonuses and allowances, and overtime allowances. Monthly wages are rounded to the nearest hundred of Hong Kong dollar.
(~) Figures refer to the nominal index of payroll per person engaged of accommodation and food service activities. Payroll includes basic wage; commission and tips not of gratuitous nature; guaranteed bonuses and allowances, as well as other non-guaranteed payments to workers such as discretionary bonuses; overtime allowances and back pay.
(^) The number of working hours takes into account the definition of hours worked under the Minimum Wage Ordinance. This includes the number of contractual/agreed working hours and the number of overtime hours worked at the direction of employers. Meal breaks which are regarded as working hours according to the employment contract or agreement with the employer are also included in the working hours, irrespective of whether work is provided during the meal break period.
(@) Year-on-year rate of change is computed using unrounded figures. (#) The figure for 2015 as a whole is not yet available. The provisional figure refers to
average of the 4 quarters of 2015. Sources: Annual Earnings and Hours Survey and Labour Earnings Survey, Census and Statistics
Department
- End -
S e s s i o n 2 1 L W B ( L ) - P a g e 1 2 1
Examination of Estimates of Expenditure 2016-17 Reply Serial No.
LWB(L)042 CONTROLLING OFFICER’S REPLY (Question Serial No. 2572)
Head: (90) Labour Department
Subhead (No. & title): ( )
Programme: (2) Employment Services
Controlling Officer: Commissioner for Labour (Donald TONG)
Director of Bureau: Secretary for Labour and Welfare Question: Regarding the current state of the security services industry, would the Government provide the following information: (a) the number of job vacancies in the security services in the past 3 years with a
breakdown by year, job title, mode of employment (full-timer/part-timer) and wage level;
(b) the number of employed persons, the employment rate, the number of underemployed
persons and the underemployment rate in the security services industry in the past 3 years with a breakdown by year, gender, age group, job title, mode of employment (full-timer/part-timer) and wage level;
(c) the number of unemployed persons and the unemployment rate in the security services
industry in the past 3 years with a breakdown by year, gender and age group; (d) the median wage and its year-on-year rate of change, pay index and median weekly
working hours in the security services industry in the past 3 years with a breakdown by year and job title; and
(e) the number of training courses related to the security services industry organised by
training bodies in the past 3 years with a breakdown by name of training body and job title. In 2016-17, will the Government allocate additional resources to training bodies to increase training opportunities for relevant industry practitioners? If yes, what are the details, expenditure involved and expected effectiveness? If not, what are the reasons?
Asked by: Hon KWOK Wai-keung (Member Question No. 48) Reply:
S e s s i o n 2 1 L W B ( L ) - P a g e 1 2 2
The information sought is provided as follows: (a) - (d) Based on the information provided by the Census and Statistics Department
(C&SD): Statistics on the number of job vacancies in the security services industry are listed
at Annex 1. C&SD does not collect the number of job vacancies by job title, mode of employment and wage level;
Statistics on the numbers of employed persons and underemployed persons and the
underemployment rate in the security services industry by gender, age group, full-timer and part-timer are listed at Annex 2. C&SD does not compile these figures by job title and wage level, and employment rate;
Statistics on the number of unemployed persons and the unemployment rate in the
security services industry by gender and age group are listed at Annex 3; and Statistics on the median wage and its year-on-year rate of change and median
weekly working hours in the security services industry are listed at Annex 4. C&SD does not compile related statistics by job title and the annual nominal index of payroll per person engaged for security services industry.
(e) In the past 3 years, the Employees Retraining Board (ERB) offered a variety of
training courses related to the property management and security industry, including security guard and building attendant, clubhouse and recreation assistant, supervisor in clubhouse and recreation facilities, as well as facilities management officer, etc. The numbers of courses organised in 2013-14, 2014-15 and 2015-16 were 33, 31 and 23 respectively.
In 2016-17, ERB plans to provide 10 400 training places for courses related to the
property management and security industry. The security services industry courses provided by other education and training
bodies, which are quality-assured and recognised under the Qualifications Framework, are also uploaded to the on-line Qualifications Register (www.hkqr.gov.hk).
There are a wide diversity of training bodies and types of courses related to the
security services industry in Hong Kong. The Labour Department does not keep information on the resources allocated by the Government to these training bodies.
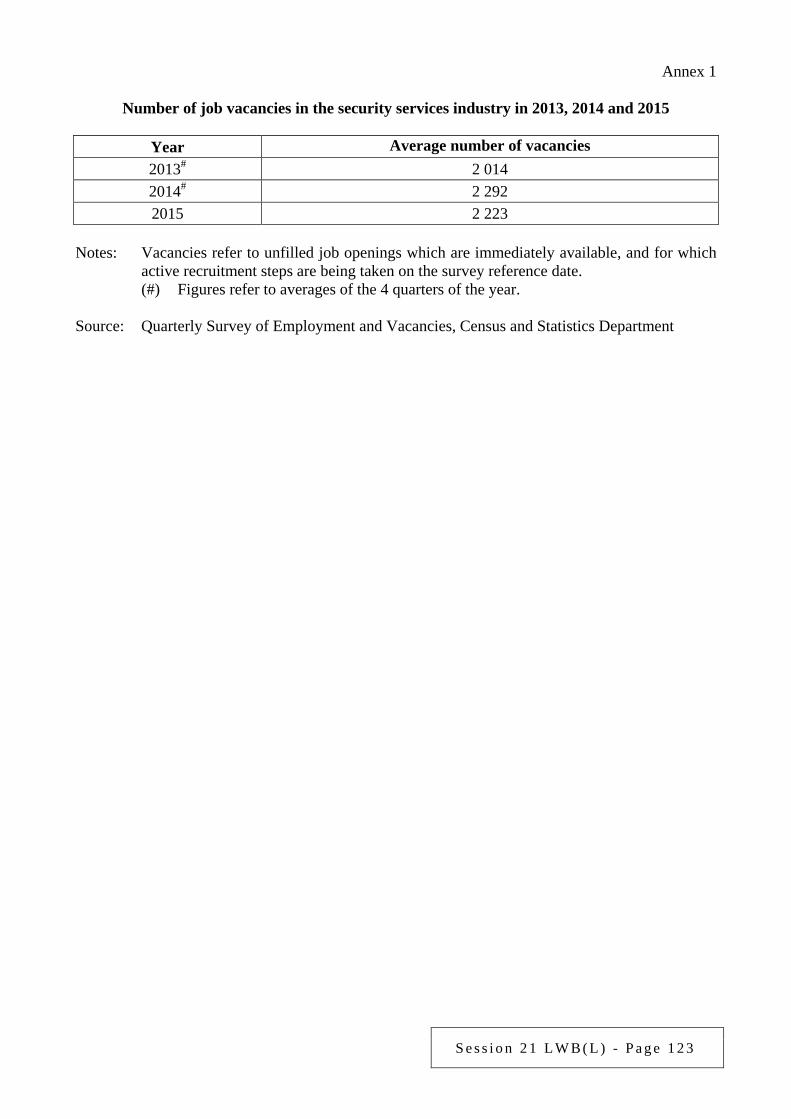
S e s s i o n 2 1 L W B ( L ) - P a g e 1 2 3
Annex 1
Number of job vacancies in the security services industry in 2013, 2014 and 2015
Year Average number of vacancies 2013# 2 014 2014# 2 292 2015 2 223
Notes: Vacancies refer to unfilled job openings which are immediately available, and for which
active recruitment steps are being taken on the survey reference date. (#) Figures refer to averages of the 4 quarters of the year.
Source: Quarterly Survey of Employment and Vacancies, Census and Statistics Department
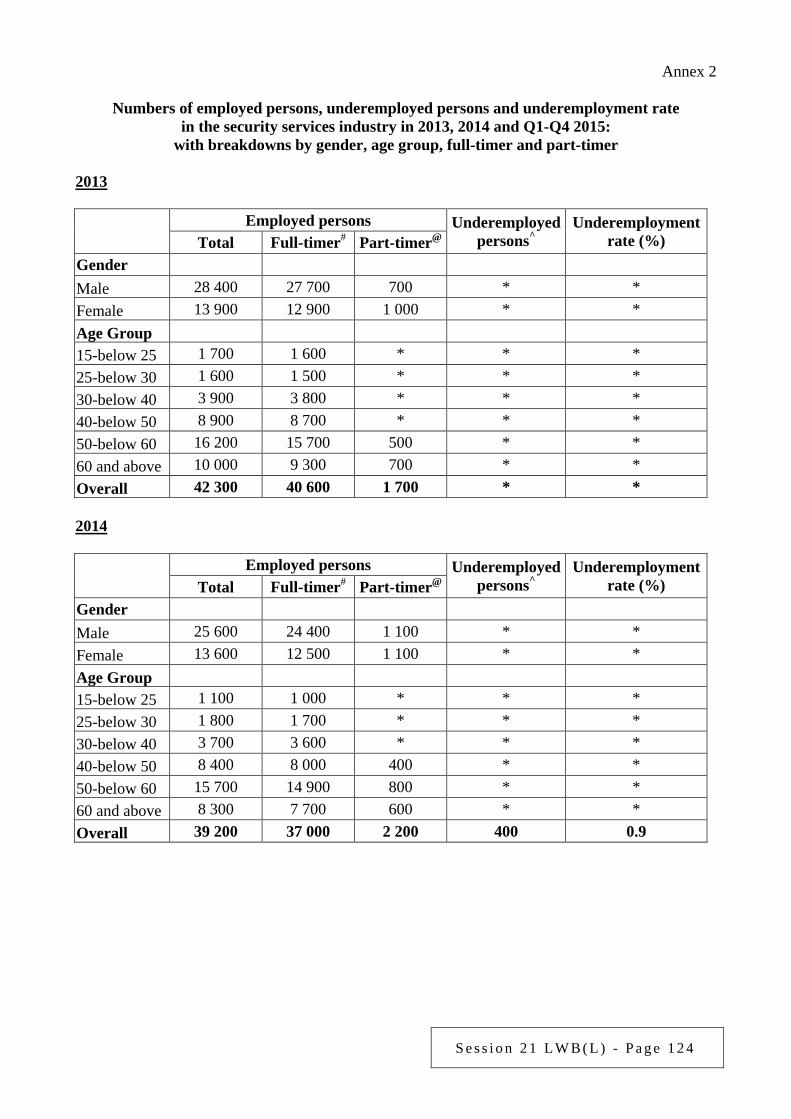
S e s s i o n 2 1 L W B ( L ) - P a g e 1 2 4
Annex 2
Numbers of employed persons, underemployed persons and underemployment rate in the security services industry in 2013, 2014 and Q1-Q4 2015:
with breakdowns by gender, age group, full-timer and part-timer 2013
Employed persons Underemployed
persons^ Underemployment
rate (%) Total Full-timer# Part-timer@ Gender Male 28 400 27 700 700 * * Female 13 900 12 900 1 000 * * Age Group 15-below 25 1 700 1 600 * * * 25-below 30 1 600 1 500 * * * 30-below 40 3 900 3 800 * * * 40-below 50 8 900 8 700 * * * 50-below 60 16 200 15 700 500 * * 60 and above 10 000 9 300 700 * * Overall 42 300 40 600 1 700 * * 2014
Employed persons Underemployed
persons^ Underemployment
rate (%) Total Full-timer# Part-timer@ Gender Male 25 600 24 400 1 100 * * Female 13 600 12 500 1 100 * * Age Group 15-below 25 1 100 1 000 * * * 25-below 30 1 800 1 700 * * * 30-below 40 3 700 3 600 * * * 40-below 50 8 400 8 000 400 * * 50-below 60 15 700 14 900 800 * * 60 and above 8 300 7 700 600 * * Overall 39 200 37 000 2 200 400 0.9
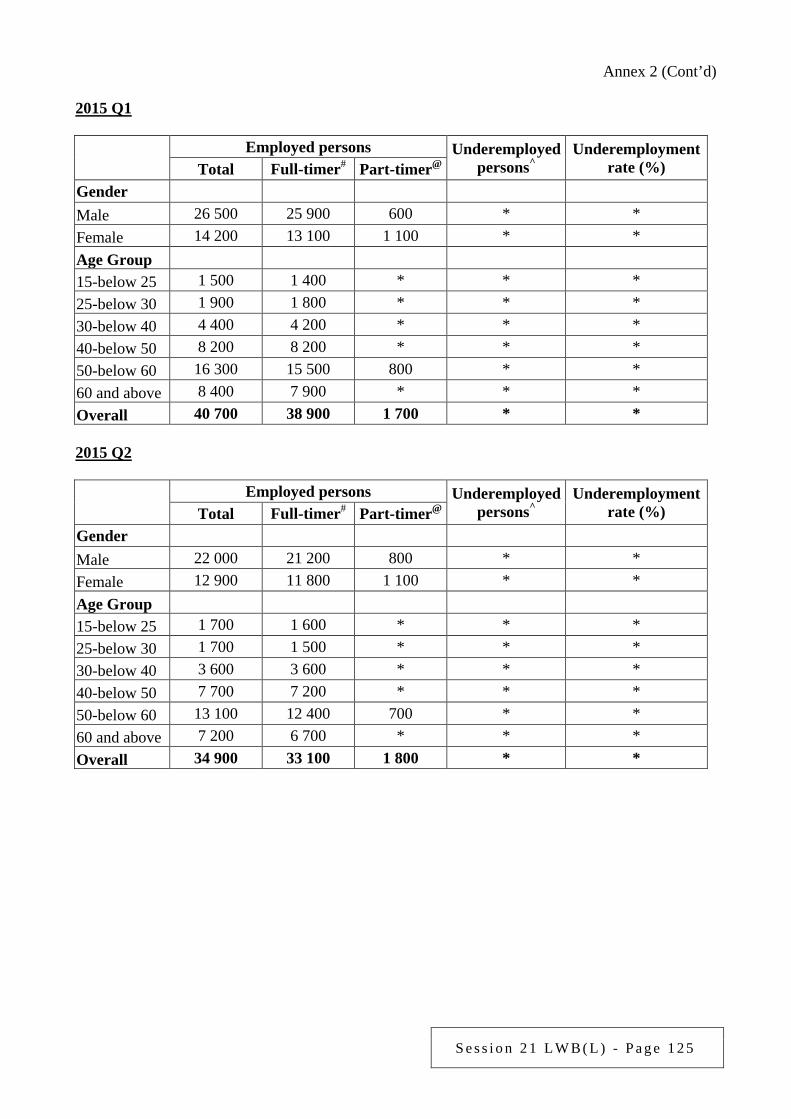
S e s s i o n 2 1 L W B ( L ) - P a g e 1 2 5
Annex 2 (Cont’d) 2015 Q1
Employed persons Underemployed
persons^ Underemployment
rate (%) Total Full-timer# Part-timer@ Gender Male 26 500 25 900 600 * * Female 14 200 13 100 1 100 * * Age Group 15-below 25 1 500 1 400 * * * 25-below 30 1 900 1 800 * * * 30-below 40 4 400 4 200 * * * 40-below 50 8 200 8 200 * * * 50-below 60 16 300 15 500 800 * * 60 and above 8 400 7 900 * * * Overall 40 700 38 900 1 700 * * 2015 Q2
Employed persons Underemployed
persons^ Underemployment
rate (%) Total Full-timer# Part-timer@ Gender Male 22 000 21 200 800 * * Female 12 900 11 800 1 100 * * Age Group 15-below 25 1 700 1 600 * * * 25-below 30 1 700 1 500 * * * 30-below 40 3 600 3 600 * * * 40-below 50 7 700 7 200 * * * 50-below 60 13 100 12 400 700 * * 60 and above 7 200 6 700 * * * Overall 34 900 33 100 1 800 * *
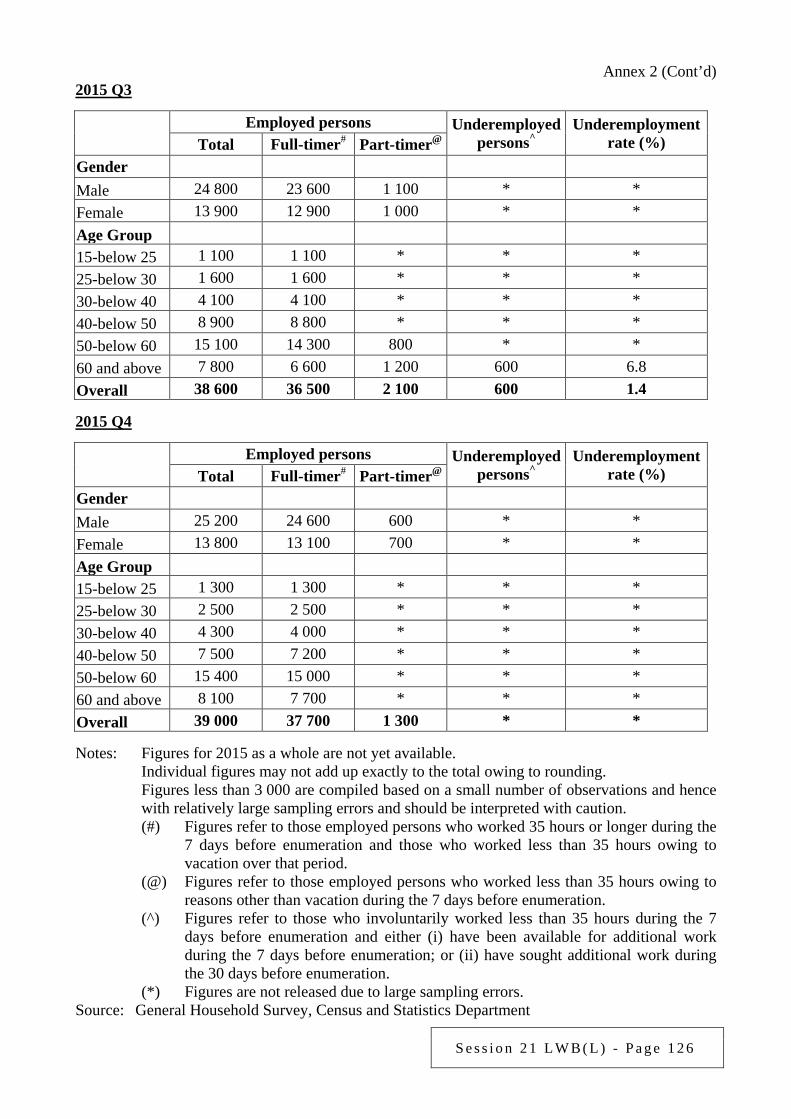
S e s s i o n 2 1 L W B ( L ) - P a g e 1 2 6
Annex 2 (Cont’d) 2015 Q3
Employed persons Underemployed
persons^ Underemployment
rate (%) Total Full-timer# Part-timer@ Gender Male 24 800 23 600 1 100 * * Female 13 900 12 900 1 000 * * Age Group 15-below 25 1 100 1 100 * * * 25-below 30 1 600 1 600 * * * 30-below 40 4 100 4 100 * * * 40-below 50 8 900 8 800 * * * 50-below 60 15 100 14 300 800 * * 60 and above 7 800 6 600 1 200 600 6.8 Overall 38 600 36 500 2 100 600 1.4 2015 Q4
Employed persons Underemployed
persons^ Underemployment
rate (%) Total Full-timer# Part-timer@ Gender Male 25 200 24 600 600 * * Female 13 800 13 100 700 * * Age Group 15-below 25 1 300 1 300 * * * 25-below 30 2 500 2 500 * * * 30-below 40 4 300 4 000 * * * 40-below 50 7 500 7 200 * * * 50-below 60 15 400 15 000 * * * 60 and above 8 100 7 700 * * * Overall 39 000 37 700 1 300 * * Notes: Figures for 2015 as a whole are not yet available. Individual figures may not add up exactly to the total owing to rounding. Figures less than 3 000 are compiled based on a small number of observations and hence
with relatively large sampling errors and should be interpreted with caution. (#) Figures refer to those employed persons who worked 35 hours or longer during the
7 days before enumeration and those who worked less than 35 hours owing to vacation over that period.
(@) Figures refer to those employed persons who worked less than 35 hours owing to reasons other than vacation during the 7 days before enumeration.
(^) Figures refer to those who involuntarily worked less than 35 hours during the 7 days before enumeration and either (i) have been available for additional work during the 7 days before enumeration; or (ii) have sought additional work during the 30 days before enumeration.
(*) Figures are not released due to large sampling errors. Source: General Household Survey, Census and Statistics Department
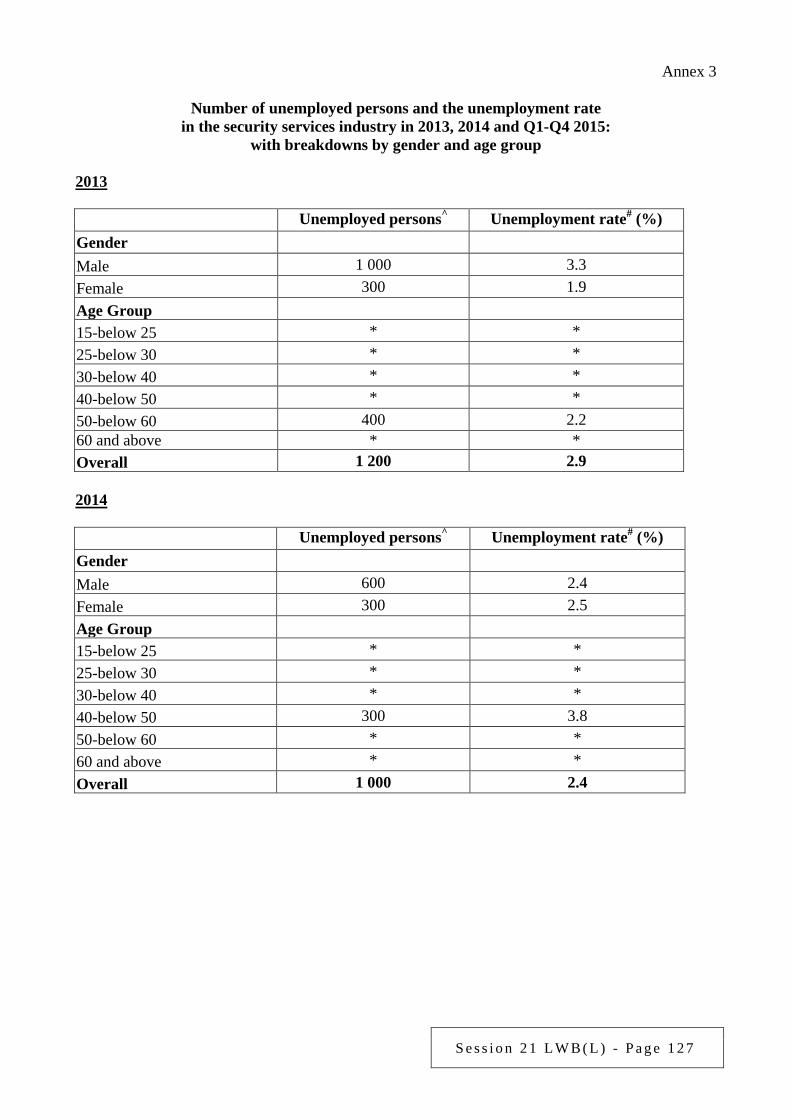
S e s s i o n 2 1 L W B ( L ) - P a g e 1 2 7
Annex 3
Number of unemployed persons and the unemployment rate in the security services industry in 2013, 2014 and Q1-Q4 2015:
with breakdowns by gender and age group 2013
Unemployed persons^ Unemployment rate# (%)
Gender Male 1 000 3.3
Female 300 1.9 Age Group 15-below 25 * * 25-below 30 * * 30-below 40 * * 40-below 50 * * 50-below 60 400 2.2 60 and above * * Overall 1 200 2.9 2014
Unemployed persons^ Unemployment rate# (%)
Gender Male 600 2.4
Female 300 2.5 Age Group 15-below 25 * * 25-below 30 * * 30-below 40 * * 40-below 50 300 3.8 50-below 60 * * 60 and above * * Overall 1 000 2.4
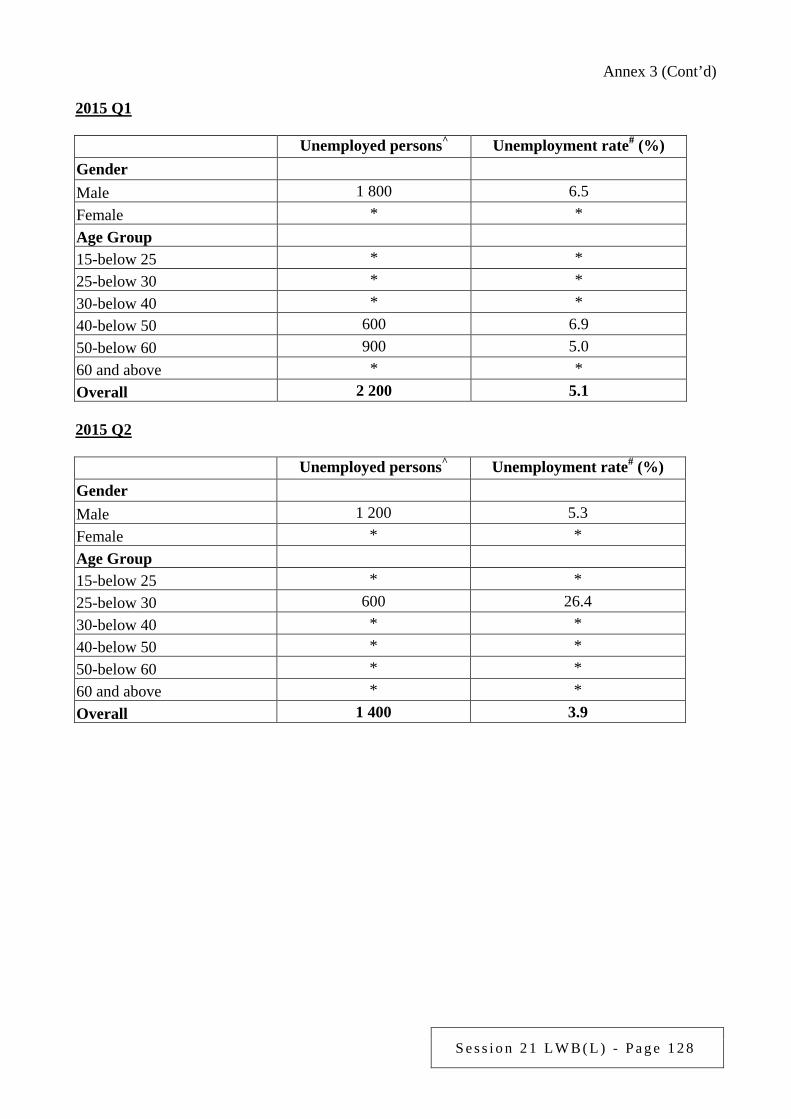
S e s s i o n 2 1 L W B ( L ) - P a g e 1 2 8
Annex 3 (Cont’d) 2015 Q1
Unemployed persons^ Unemployment rate# (%)
Gender Male 1 800 6.5
Female * * Age Group 15-below 25 * * 25-below 30 * * 30-below 40 * * 40-below 50 600 6.9 50-below 60 900 5.0 60 and above * * Overall 2 200 5.1 2015 Q2
Unemployed persons^ Unemployment rate# (%)
Gender Male 1 200 5.3
Female * * Age Group 15-below 25 * * 25-below 30 600 26.4 30-below 40 * * 40-below 50 * * 50-below 60 * * 60 and above * * Overall 1 400 3.9
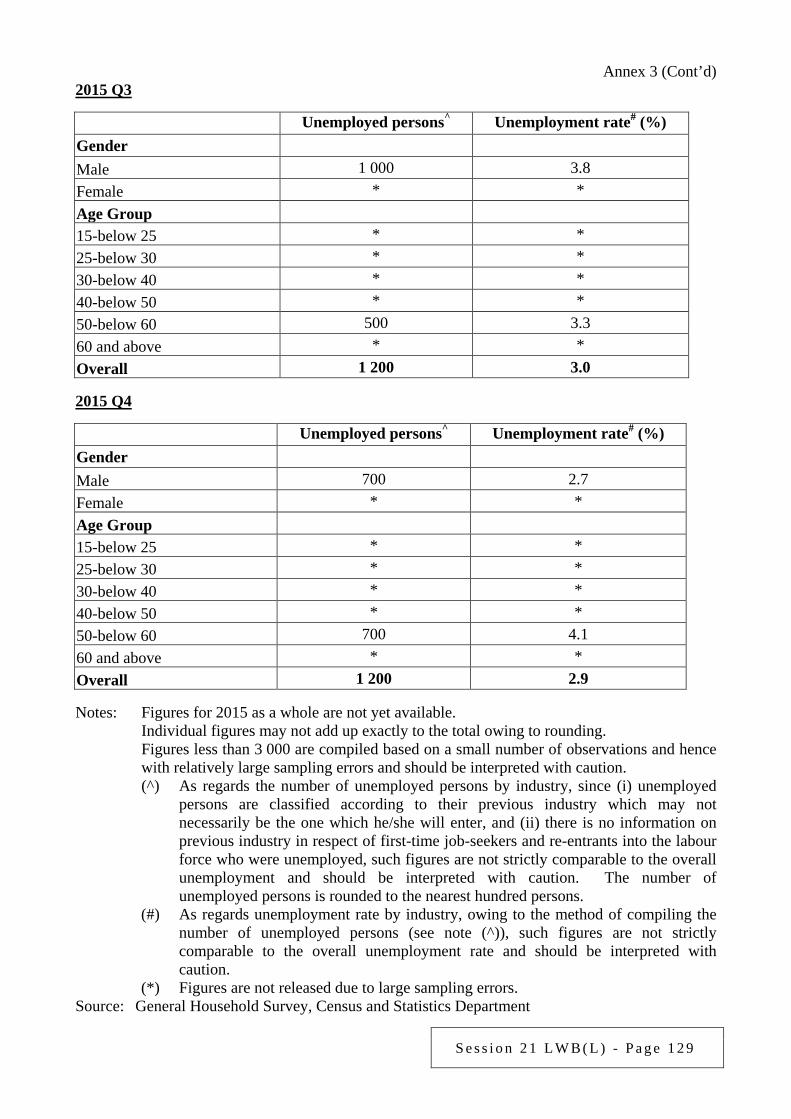
S e s s i o n 2 1 L W B ( L ) - P a g e 1 2 9
Annex 3 (Cont’d) 2015 Q3
Unemployed persons^ Unemployment rate# (%)
Gender Male 1 000 3.8
Female * * Age Group 15-below 25 * * 25-below 30 * * 30-below 40 * * 40-below 50 * * 50-below 60 500 3.3 60 and above * * Overall 1 200 3.0 2015 Q4
Unemployed persons^ Unemployment rate# (%)
Gender Male 700 2.7
Female * * Age Group 15-below 25 * * 25-below 30 * * 30-below 40 * * 40-below 50 * * 50-below 60 700 4.1 60 and above * * Overall 1 200 2.9 Notes: Figures for 2015 as a whole are not yet available. Individual figures may not add up exactly to the total owing to rounding. Figures less than 3 000 are compiled based on a small number of observations and hence
with relatively large sampling errors and should be interpreted with caution. (^) As regards the number of unemployed persons by industry, since (i) unemployed
persons are classified according to their previous industry which may not necessarily be the one which he/she will enter, and (ii) there is no information on previous industry in respect of first-time job-seekers and re-entrants into the labour force who were unemployed, such figures are not strictly comparable to the overall unemployment and should be interpreted with caution. The number of unemployed persons is rounded to the nearest hundred persons.
(#) As regards unemployment rate by industry, owing to the method of compiling the number of unemployed persons (see note (^)), such figures are not strictly comparable to the overall unemployment rate and should be interpreted with caution.
(*) Figures are not released due to large sampling errors. Source: General Household Survey, Census and Statistics Department
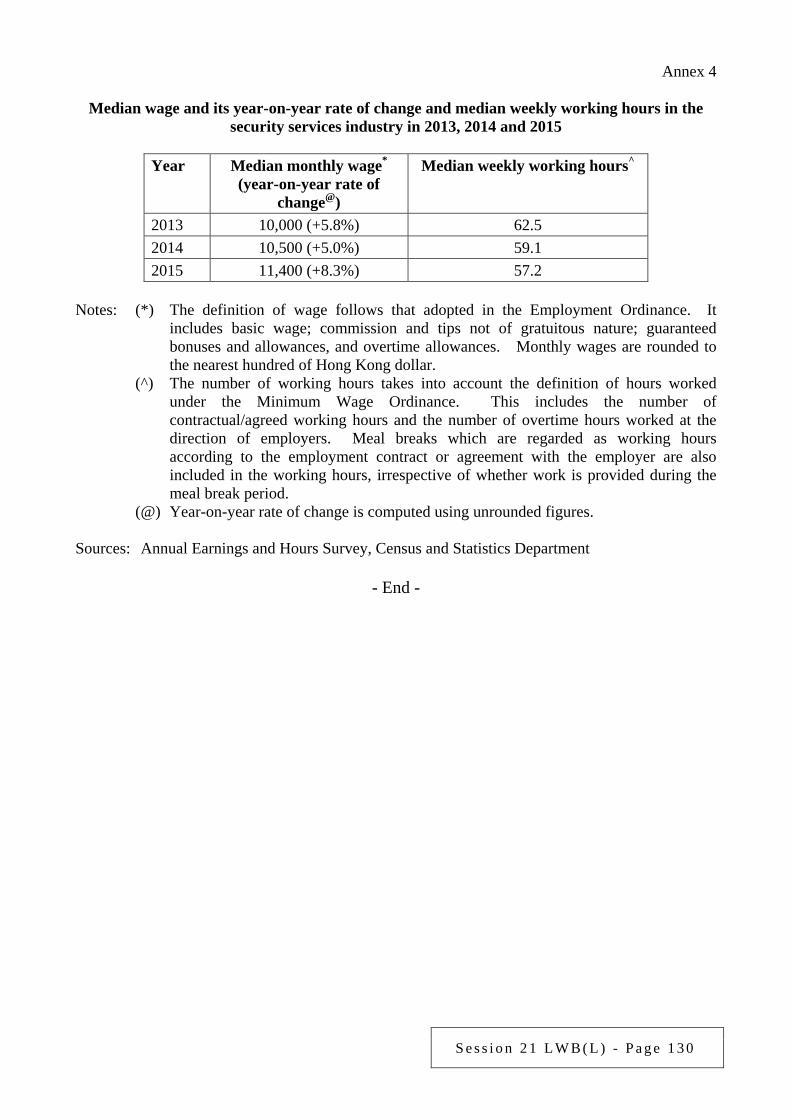
S e s s i o n 2 1 L W B ( L ) - P a g e 1 3 0
Annex 4
Median wage and its year-on-year rate of change and median weekly working hours in the security services industry in 2013, 2014 and 2015
Year Median monthly wage*
(year-on-year rate of change@)
Median weekly working hours^
2013 10,000 (+5.8%) 62.5 2014 10,500 (+5.0%) 59.1 2015 11,400 (+8.3%) 57.2
Notes: (*) The definition of wage follows that adopted in the Employment Ordinance. It
includes basic wage; commission and tips not of gratuitous nature; guaranteed bonuses and allowances, and overtime allowances. Monthly wages are rounded to the nearest hundred of Hong Kong dollar.
(^) The number of working hours takes into account the definition of hours worked under the Minimum Wage Ordinance. This includes the number of contractual/agreed working hours and the number of overtime hours worked at the direction of employers. Meal breaks which are regarded as working hours according to the employment contract or agreement with the employer are also included in the working hours, irrespective of whether work is provided during the meal break period.
(@) Year-on-year rate of change is computed using unrounded figures. Sources: Annual Earnings and Hours Survey, Census and Statistics Department
- End -
S e s s i o n 2 1 L W B ( L ) - P a g e 1 3 1
Examination of Estimates of Expenditure 2016-17 Reply Serial No.
LWB(L)043 CONTROLLING OFFICER’S REPLY (Question Serial No. 2573)
Head: (90) Labour Department
Subhead (No. & title): ( )
Programme: (2) Employment Services
Controlling Officer: Commissioner for Labour (Donald TONG)
Director of Bureau: Secretary for Labour and Welfare Question: Regarding the current state of the retail industry, would the Government provide the following information: (a) the number of job vacancies in the retail industry in the past 3 years with a breakdown
by year, job title, mode of employment (full-timer / part-timer) and wage level; (b) the number of employed persons, the employment rate, the number of underemployed
persons and the underemployment rate in the retail industry in the past 3 years with a breakdown by year, gender, age group, job title, mode of employment (full-timer/part-timer) and wage level;
(c) the number of unemployed persons and the unemployment rate in the retail industry in
the past 3 years with a breakdown by year, gender and age group; (d) the median wage and its year-on-year rate of change, pay index and median weekly
working hours in the retail industry in the past 3 years with a breakdown by year and job title; and
(e) the number of training courses related to the retail industry organised by training
bodies in the past 3 years with a breakdown by name of training body and job title. In 2016-17, will the Government allocate additional resources to training bodies to increase training opportunities for relevant industry practitioners? If yes, what are the details, expenditure involved and expected effectiveness? If not, what are the reasons?
Asked by: Hon KWOK Wai-keung (Member Question No. 49) Reply:
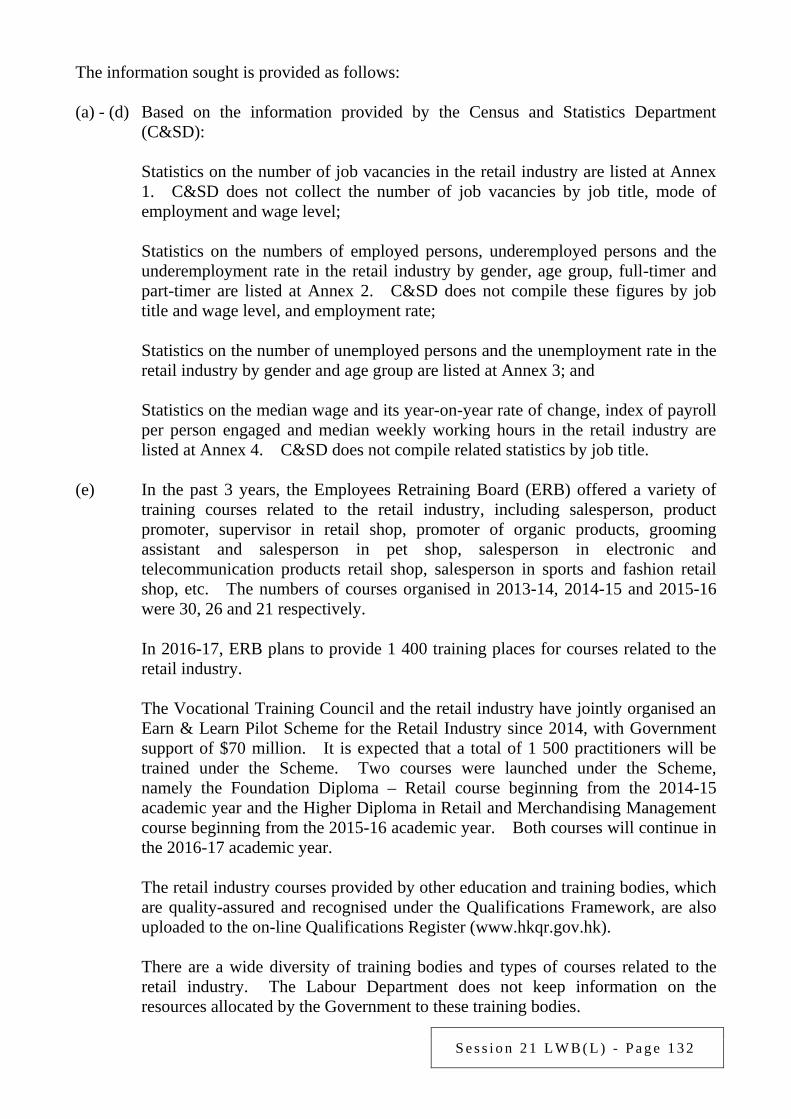
S e s s i o n 2 1 L W B ( L ) - P a g e 1 3 2
The information sought is provided as follows: (a) - (d) Based on the information provided by the Census and Statistics Department
(C&SD): Statistics on the number of job vacancies in the retail industry are listed at Annex
1. C&SD does not collect the number of job vacancies by job title, mode of employment and wage level;
Statistics on the numbers of employed persons, underemployed persons and the
underemployment rate in the retail industry by gender, age group, full-timer and part-timer are listed at Annex 2. C&SD does not compile these figures by job title and wage level, and employment rate;
Statistics on the number of unemployed persons and the unemployment rate in the
retail industry by gender and age group are listed at Annex 3; and Statistics on the median wage and its year-on-year rate of change, index of payroll
per person engaged and median weekly working hours in the retail industry are listed at Annex 4. C&SD does not compile related statistics by job title.
(e) In the past 3 years, the Employees Retraining Board (ERB) offered a variety of
training courses related to the retail industry, including salesperson, product promoter, supervisor in retail shop, promoter of organic products, grooming assistant and salesperson in pet shop, salesperson in electronic and telecommunication products retail shop, salesperson in sports and fashion retail shop, etc. The numbers of courses organised in 2013-14, 2014-15 and 2015-16 were 30, 26 and 21 respectively.
In 2016-17, ERB plans to provide 1 400 training places for courses related to the
retail industry. The Vocational Training Council and the retail industry have jointly organised an
Earn & Learn Pilot Scheme for the Retail Industry since 2014, with Government support of $70 million. It is expected that a total of 1 500 practitioners will be trained under the Scheme. Two courses were launched under the Scheme, namely the Foundation Diploma – Retail course beginning from the 2014-15 academic year and the Higher Diploma in Retail and Merchandising Management course beginning from the 2015-16 academic year. Both courses will continue in the 2016-17 academic year.
The retail industry courses provided by other education and training bodies, which
are quality-assured and recognised under the Qualifications Framework, are also uploaded to the on-line Qualifications Register (www.hkqr.gov.hk).
There are a wide diversity of training bodies and types of courses related to the
retail industry. The Labour Department does not keep information on the resources allocated by the Government to these training bodies.
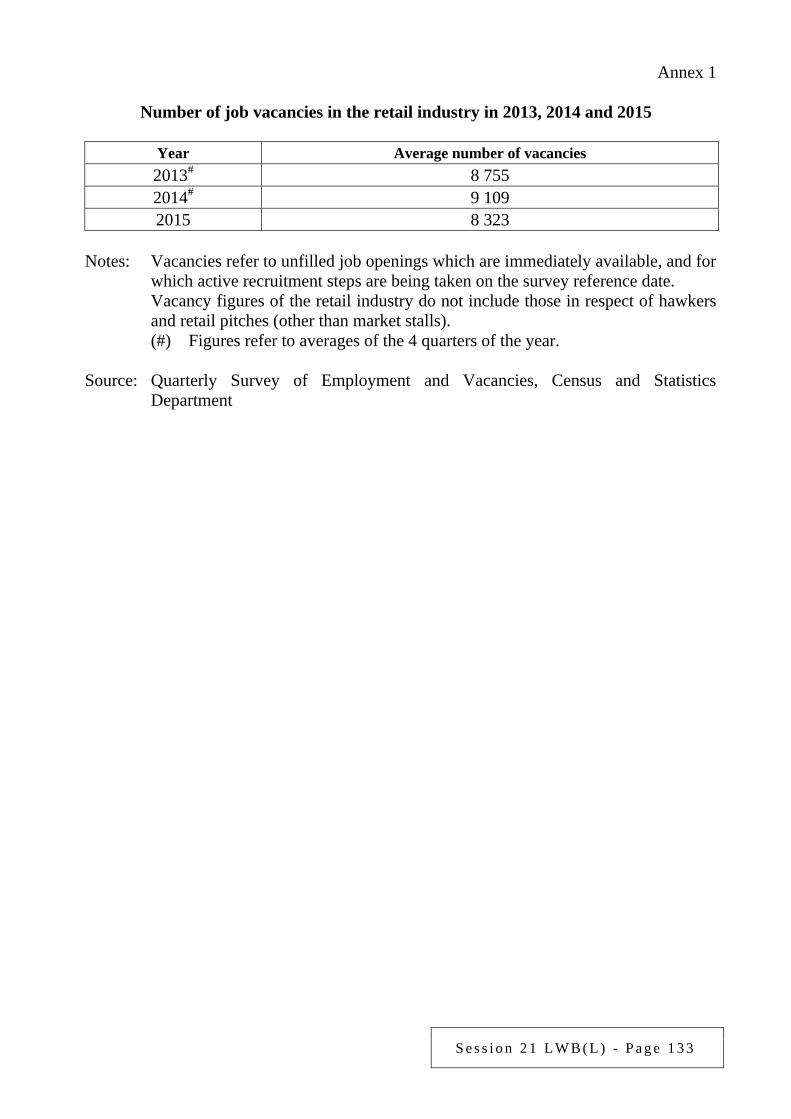
S e s s i o n 2 1 L W B ( L ) - P a g e 1 3 3
Annex 1
Number of job vacancies in the retail industry in 2013, 2014 and 2015
Year Average number of vacancies 2013# 8 755 2014# 9 109 2015 8 323
Notes: Vacancies refer to unfilled job openings which are immediately available, and for
which active recruitment steps are being taken on the survey reference date. Vacancy figures of the retail industry do not include those in respect of hawkers
and retail pitches (other than market stalls). (#) Figures refer to averages of the 4 quarters of the year.
Source: Quarterly Survey of Employment and Vacancies, Census and Statistics Department
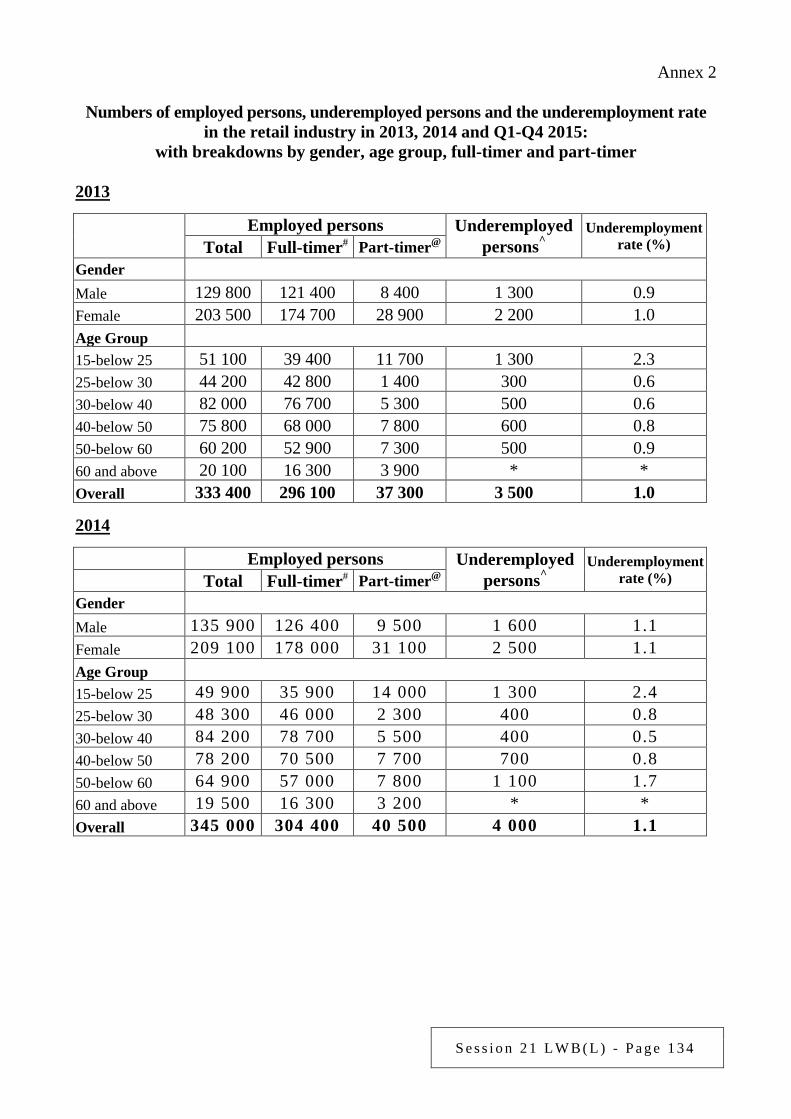
S e s s i o n 2 1 L W B ( L ) - P a g e 1 3 4
Annex 2
Numbers of employed persons, underemployed persons and the underemployment rate in the retail industry in 2013, 2014 and Q1-Q4 2015:
with breakdowns by gender, age group, full-timer and part-timer 2013
Employed persons Underemployed persons^
Underemployment rate (%) Total Full-timer# Part-timer@
Gender Male 129 800 121 400 8 400 1 300 0.9 Female 203 500 174 700 28 900 2 200 1.0 Age Group 15-below 25 51 100 39 400 11 700 1 300 2.3 25-below 30 44 200 42 800 1 400 300 0.6 30-below 40 82 000 76 700 5 300 500 0.6 40-below 50 75 800 68 000 7 800 600 0.8 50-below 60 60 200 52 900 7 300 500 0.9 60 and above 20 100 16 300 3 900 * * Overall 333 400 296 100 37 300 3 500 1.0
2014
Employed persons Underemployed persons^
Underemployment rate (%) Total Full-timer# Part-timer@
Gender Male 135 900 126 400 9 500 1 600 1.1 Female 209 100 178 000 31 100 2 500 1.1 Age Group 15-below 25 49 900 35 900 14 000 1 300 2.4 25-below 30 48 300 46 000 2 300 400 0.8 30-below 40 84 200 78 700 5 500 400 0.5 40-below 50 78 200 70 500 7 700 700 0.8 50-below 60 64 900 57 000 7 800 1 100 1.7 60 and above 19 500 16 300 3 200 * * Overall 345 000 304 400 40 500 4 000 1.1
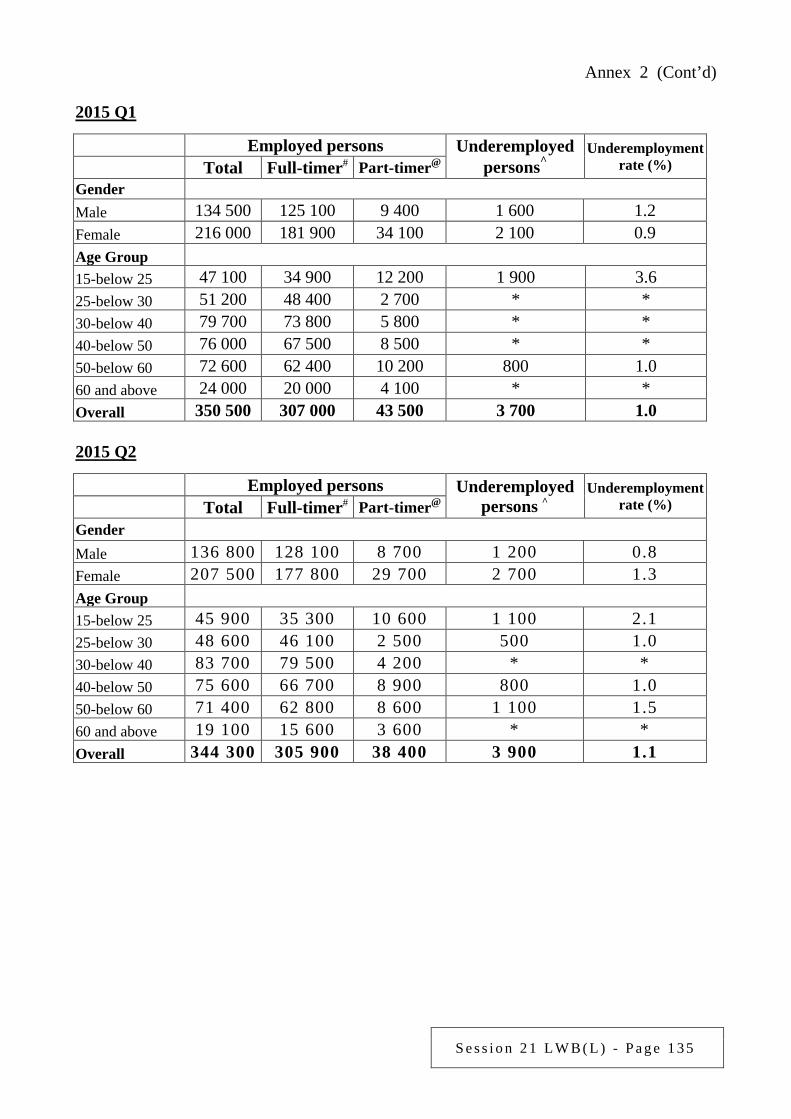
S e s s i o n 2 1 L W B ( L ) - P a g e 1 3 5
Annex 2 (Cont’d) 2015 Q1
Employed persons Underemployed persons^
Underemployment rate (%) Total Full-timer# Part-timer@
Gender Male 134 500 125 100 9 400 1 600 1.2 Female 216 000 181 900 34 100 2 100 0.9 Age Group 15-below 25 47 100 34 900 12 200 1 900 3.6 25-below 30 51 200 48 400 2 700 * * 30-below 40 79 700 73 800 5 800 * * 40-below 50 76 000 67 500 8 500 * * 50-below 60 72 600 62 400 10 200 800 1.0 60 and above 24 000 20 000 4 100 * * Overall 350 500 307 000 43 500 3 700 1.0 2015 Q2
Employed persons Underemployed persons ^
Underemployment rate (%) Total Full-timer# Part-timer@
Gender Male 136 800 128 100 8 700 1 200 0.8 Female 207 500 177 800 29 700 2 700 1.3 Age Group 15-below 25 45 900 35 300 10 600 1 100 2.1 25-below 30 48 600 46 100 2 500 500 1.0 30-below 40 83 700 79 500 4 200 * * 40-below 50 75 600 66 700 8 900 800 1.0 50-below 60 71 400 62 800 8 600 1 100 1.5 60 and above 19 100 15 600 3 600 * * Overall 344 300 305 900 38 400 3 900 1.1
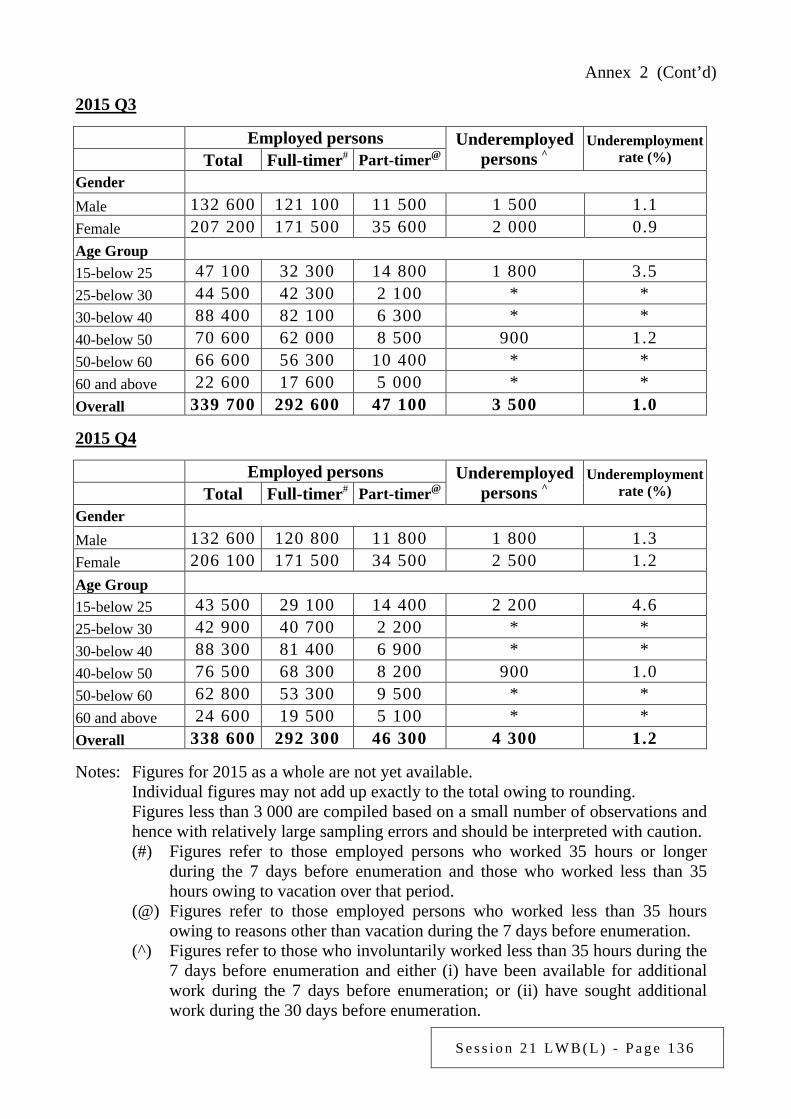
S e s s i o n 2 1 L W B ( L ) - P a g e 1 3 6
Annex 2 (Cont’d)
2015 Q3
Employed persons Underemployed persons ^
Underemployment rate (%) Total Full-timer# Part-timer@
Gender Male 132 600 121 100 11 500 1 500 1.1 Female 207 200 171 500 35 600 2 000 0.9 Age Group 15-below 25 47 100 32 300 14 800 1 800 3.5 25-below 30 44 500 42 300 2 100 * * 30-below 40 88 400 82 100 6 300 * * 40-below 50 70 600 62 000 8 500 900 1.2 50-below 60 66 600 56 300 10 400 * * 60 and above 22 600 17 600 5 000 * * Overall 339 700 292 600 47 100 3 500 1.0
2015 Q4
Employed persons Underemployed persons ^
Underemployment rate (%) Total Full-timer# Part-timer@
Gender Male 132 600 120 800 11 800 1 800 1.3 Female 206 100 171 500 34 500 2 500 1.2 Age Group 15-below 25 43 500 29 100 14 400 2 200 4.6 25-below 30 42 900 40 700 2 200 * * 30-below 40 88 300 81 400 6 900 * * 40-below 50 76 500 68 300 8 200 900 1.0 50-below 60 62 800 53 300 9 500 * * 60 and above 24 600 19 500 5 100 * * Overall 338 600 292 300 46 300 4 300 1.2
Notes: Figures for 2015 as a whole are not yet available. Individual figures may not add up exactly to the total owing to rounding. Figures less than 3 000 are compiled based on a small number of observations and
hence with relatively large sampling errors and should be interpreted with caution. (#) Figures refer to those employed persons who worked 35 hours or longer
during the 7 days before enumeration and those who worked less than 35 hours owing to vacation over that period.
(@) Figures refer to those employed persons who worked less than 35 hours owing to reasons other than vacation during the 7 days before enumeration.
(^) Figures refer to those who involuntarily worked less than 35 hours during the 7 days before enumeration and either (i) have been available for additional work during the 7 days before enumeration; or (ii) have sought additional work during the 30 days before enumeration.

S e s s i o n 2 1 L W B ( L ) - P a g e 1 3 7
(*) Figures are not released due to large sampling errors.
Source: General Household Survey, Census and Statistics Department
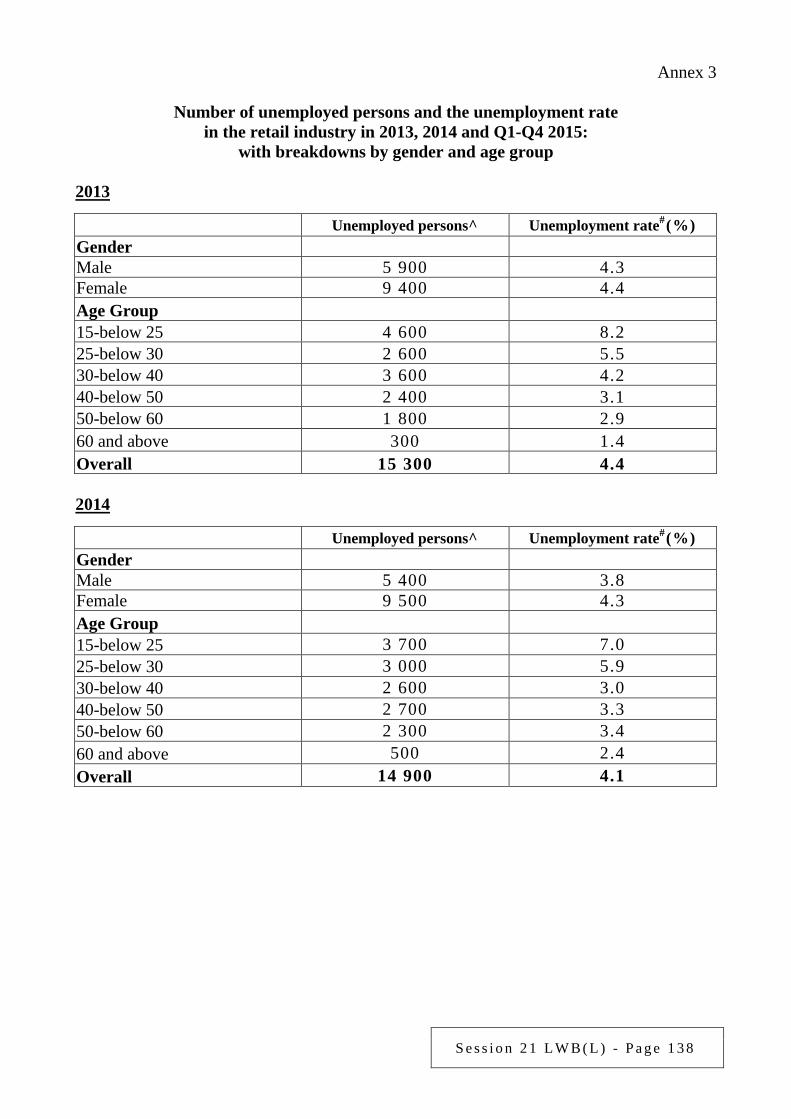
S e s s i o n 2 1 L W B ( L ) - P a g e 1 3 8
Annex 3
Number of unemployed persons and the unemployment rate in the retail industry in 2013, 2014 and Q1-Q4 2015:
with breakdowns by gender and age group 2013
Unemployed persons^ Unemployment rate#(%) Gender Male 5 900 4.3 Female 9 400 4.4 Age Group 15-below 25 4 600 8.2 25-below 30 2 600 5.5 30-below 40 3 600 4.2 40-below 50 2 400 3.1 50-below 60 1 800 2.9 60 and above 300 1.4 Overall 15 300 4.4 2014
Unemployed persons^ Unemployment rate#(%) Gender Male 5 400 3.8 Female 9 500 4.3 Age Group 15-below 25 3 700 7.0 25-below 30 3 000 5.9 30-below 40 2 600 3.0 40-below 50 2 700 3.3 50-below 60 2 300 3.4 60 and above 500 2.4 Overall 14 900 4.1

S e s s i o n 2 1 L W B ( L ) - P a g e 1 3 9
Annex 3 (Cont’d) 2015 Q1
Unemployed persons^ Unemployment rate#(%) Gender Male 5 900 4.2 Female 12 900 5.6 Age Group 15-below 25 4 500 8.8 25-below 30 2 700 5.0 30-below 40 2 700 3.3 40-below 50 4 400 5.4 50-below 60 4 100 5.3 60 and above * * Overall 18 800 5.1 2015 Q2
Unemployed persons^ Unemployment rate# (%) Gender Male 4 400 3.1 Female 10 000 4.6 Age Group 15-below 25 5 300 10.3 25-below 30 2 000 3.9 30-below 40 2 800 3.2 40-below 50 2 300 3.0 50-below 60 1 600 2.3 60 and above * * Overall 14 400 4.0
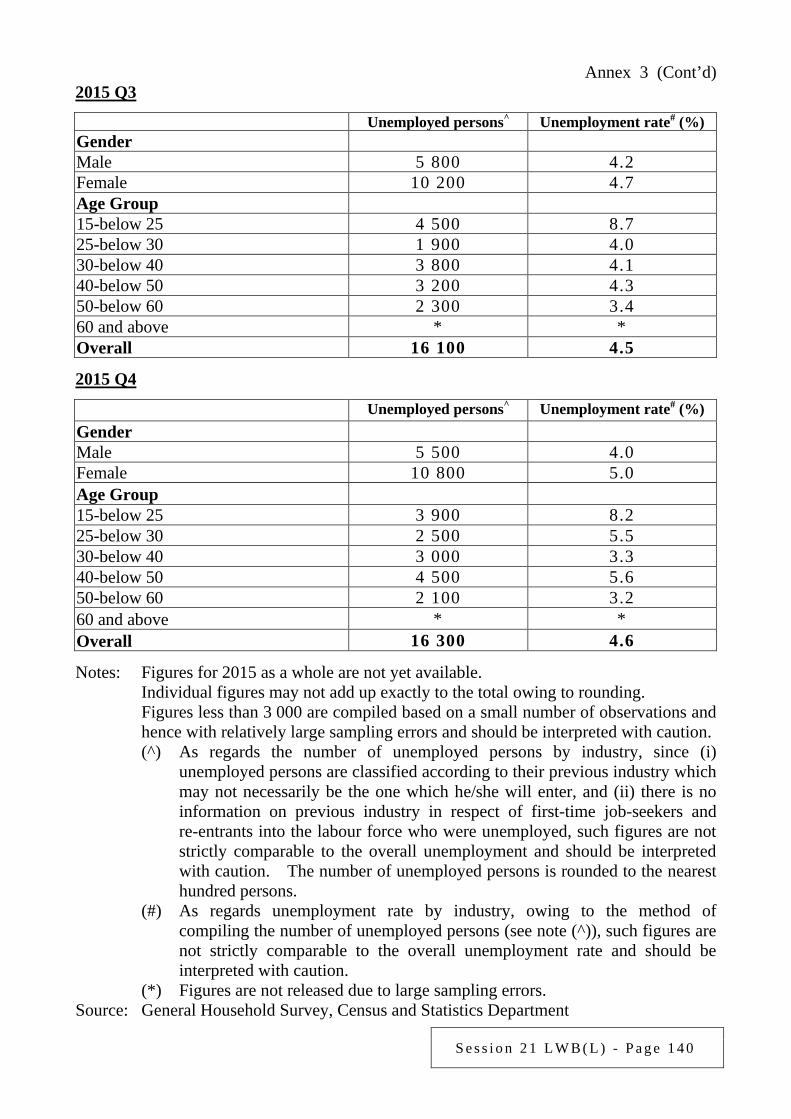
S e s s i o n 2 1 L W B ( L ) - P a g e 1 4 0
Annex 3 (Cont’d) 2015 Q3
Unemployed persons^ Unemployment rate# (%) Gender Male 5 800 4.2 Female 10 200 4.7 Age Group 15-below 25 4 500 8.7 25-below 30 1 900 4.0 30-below 40 3 800 4.1 40-below 50 3 200 4.3 50-below 60 2 300 3.4 60 and above * * Overall 16 100 4.5 2015 Q4
Unemployed persons^ Unemployment rate# (%)
Gender Male 5 500 4.0 Female 10 800 5.0 Age Group 15-below 25 3 900 8.2 25-below 30 2 500 5.5 30-below 40 3 000 3.3 40-below 50 4 500 5.6 50-below 60 2 100 3.2 60 and above * * Overall 16 300 4.6 Notes: Figures for 2015 as a whole are not yet available. Individual figures may not add up exactly to the total owing to rounding. Figures less than 3 000 are compiled based on a small number of observations and
hence with relatively large sampling errors and should be interpreted with caution. (^) As regards the number of unemployed persons by industry, since (i)
unemployed persons are classified according to their previous industry which may not necessarily be the one which he/she will enter, and (ii) there is no information on previous industry in respect of first-time job-seekers and re-entrants into the labour force who were unemployed, such figures are not strictly comparable to the overall unemployment and should be interpreted with caution. The number of unemployed persons is rounded to the nearest hundred persons.
(#) As regards unemployment rate by industry, owing to the method of compiling the number of unemployed persons (see note (^)), such figures are not strictly comparable to the overall unemployment rate and should be interpreted with caution.
(*) Figures are not released due to large sampling errors. Source: General Household Survey, Census and Statistics Department
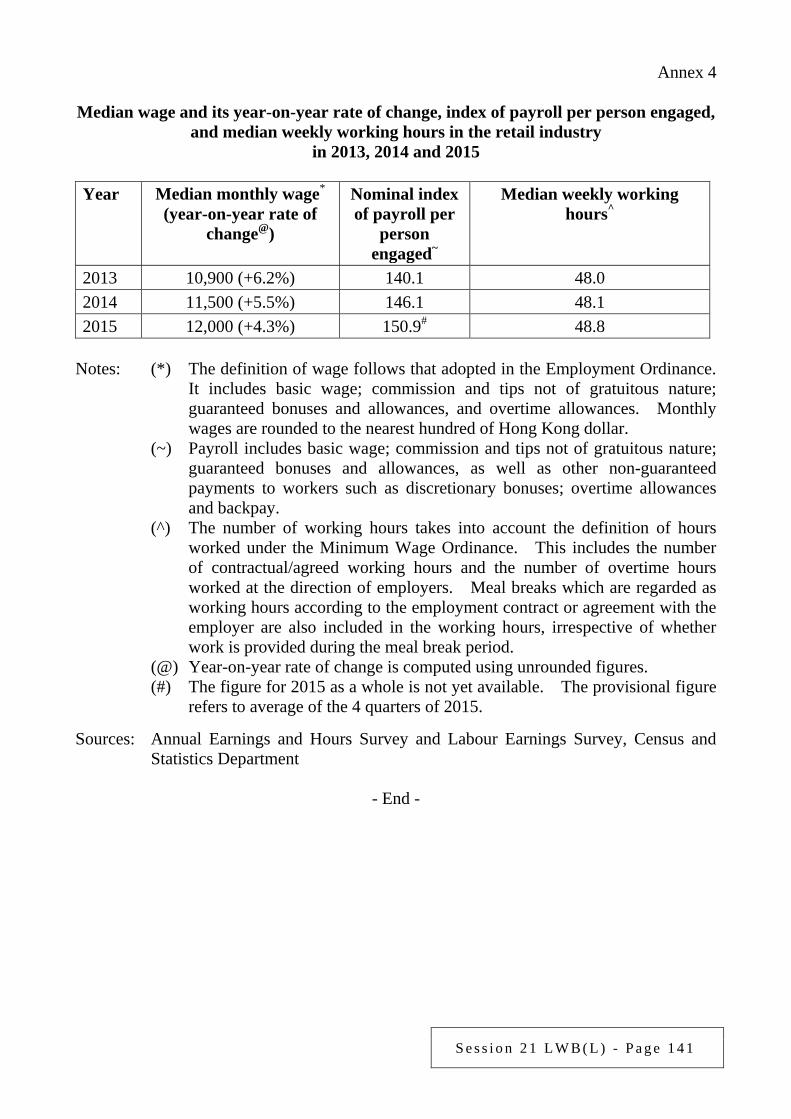
S e s s i o n 2 1 L W B ( L ) - P a g e 1 4 1
Annex 4 Median wage and its year-on-year rate of change, index of payroll per person engaged,
and median weekly working hours in the retail industry in 2013, 2014 and 2015
Year Median monthly wage*
(year-on-year rate of change@)
Nominal index of payroll per
person engaged~
Median weekly working hours^
2013 10,900 (+6.2%) 140.1 48.0 2014 11,500 (+5.5%) 146.1 48.1 2015 12,000 (+4.3%) 150.9# 48.8
Notes: (*) The definition of wage follows that adopted in the Employment Ordinance.
It includes basic wage; commission and tips not of gratuitous nature; guaranteed bonuses and allowances, and overtime allowances. Monthly wages are rounded to the nearest hundred of Hong Kong dollar.
(~) Payroll includes basic wage; commission and tips not of gratuitous nature; guaranteed bonuses and allowances, as well as other non-guaranteed payments to workers such as discretionary bonuses; overtime allowances and backpay.
(^) The number of working hours takes into account the definition of hours worked under the Minimum Wage Ordinance. This includes the number of contractual/agreed working hours and the number of overtime hours worked at the direction of employers. Meal breaks which are regarded as working hours according to the employment contract or agreement with the employer are also included in the working hours, irrespective of whether work is provided during the meal break period.
(@) Year-on-year rate of change is computed using unrounded figures. (#) The figure for 2015 as a whole is not yet available. The provisional figure
refers to average of the 4 quarters of 2015.
Sources: Annual Earnings and Hours Survey and Labour Earnings Survey, Census and Statistics Department
- End -
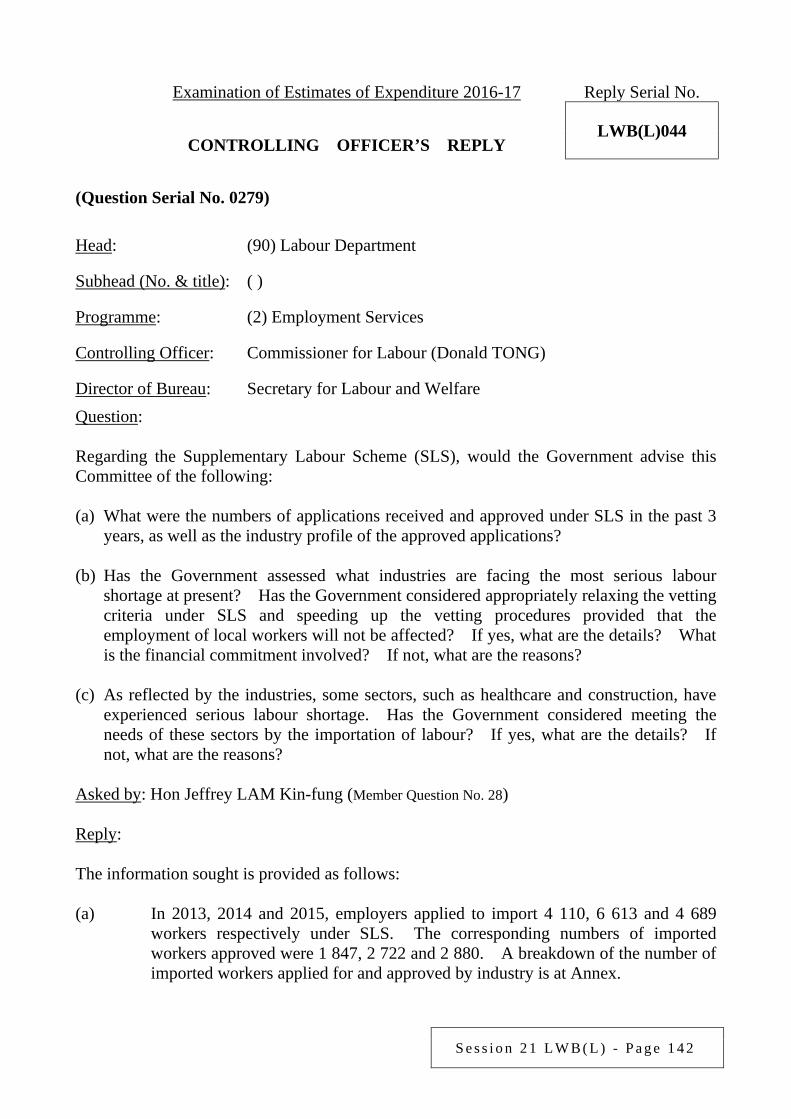
S e s s i o n 2 1 L W B ( L ) - P a g e 1 4 2
Examination of Estimates of Expenditure 2016-17 Reply Serial No.
LWB(L)044 CONTROLLING OFFICER’S REPLY (Question Serial No. 0279)
Head: (90) Labour Department
Subhead (No. & title): ( )
Programme: (2) Employment Services
Controlling Officer: Commissioner for Labour (Donald TONG)
Director of Bureau: Secretary for Labour and Welfare Question: Regarding the Supplementary Labour Scheme (SLS), would the Government advise this Committee of the following: (a) What were the numbers of applications received and approved under SLS in the past 3
years, as well as the industry profile of the approved applications? (b) Has the Government assessed what industries are facing the most serious labour
shortage at present? Has the Government considered appropriately relaxing the vetting criteria under SLS and speeding up the vetting procedures provided that the employment of local workers will not be affected? If yes, what are the details? What is the financial commitment involved? If not, what are the reasons?
(c) As reflected by the industries, some sectors, such as healthcare and construction, have
experienced serious labour shortage. Has the Government considered meeting the needs of these sectors by the importation of labour? If yes, what are the details? If not, what are the reasons?
Asked by: Hon Jeffrey LAM Kin-fung (Member Question No. 28) Reply: The information sought is provided as follows: (a) In 2013, 2014 and 2015, employers applied to import 4 110, 6 613 and 4 689
workers respectively under SLS. The corresponding numbers of imported workers approved were 1 847, 2 722 and 2 880. A breakdown of the number of imported workers applied for and approved by industry is at Annex.
S e s s i o n 2 1 L W B ( L ) - P a g e 1 4 3
(b)&(c) The Government has all along been closely monitoring the manpower demand and supply for different industries, strengthening training initiatives and attracting new entrants. On the premise of according priority to local workers in employment, importation of labour is allowed on an appropriate, limited and targeted basis to relieve the manpower shortage in individual industries. Employers facing genuine difficulties in local recruitment can apply for importation of skilled workers on a limited scale under SLS, thereby addressing the manpower needs of individual industries with labour shortage.
Having regard to the manpower shortage in the elderly care sector, the Government introduced measures in April 2014, allowing private residential care homes for the elderly participating in the Enhanced Bought Place Scheme to apply for the importation of care workers for their non-bought places. As regards the construction industry, the Government launched enhancement measures in April 2014 to help expedite the preparatory work in relation to SLS applications involving 26 trades with manpower shortage made by public sector works contractors. In addition, having regard to the unique characteristics of the construction industry, flexibility enhancement measures were launched under SLS in May 2015.
To enhance the processing and vetting of SLS applications and to offer job
matching services to eligible local job seekers on relevant job titles, the Labour Department (LD) has from 2015-16 created 3 Labour Officer Grade posts for 4 years. The corresponding total annual staff cost is about $2.04 million. LD will continue to monitor the caseloads and the needs of job seekers for job matching services.
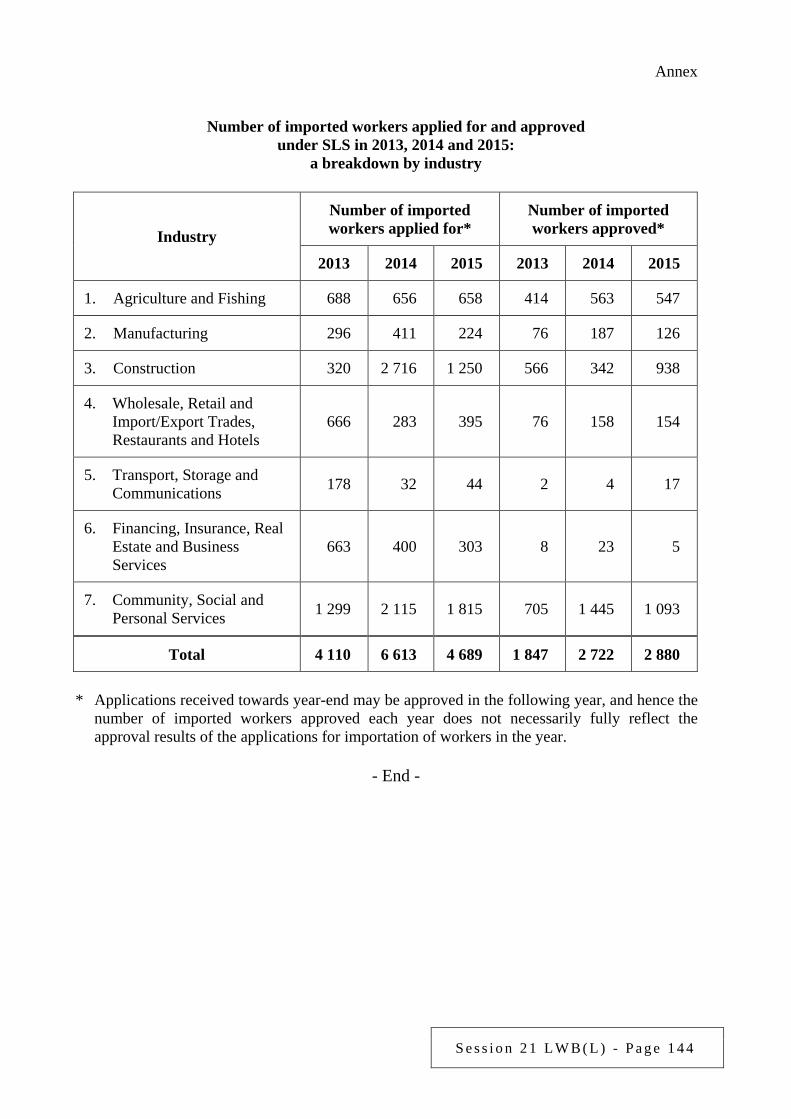
S e s s i o n 2 1 L W B ( L ) - P a g e 1 4 4
Annex
Number of imported workers applied for and approved under SLS in 2013, 2014 and 2015:
a breakdown by industry
Industry
Number of imported workers applied for*
Number of imported workers approved*
2013 2014 2015 2013 2014 2015
1. Agriculture and Fishing 688 656 658 414 563 547
2. Manufacturing 296 411 224 76 187 126
3. Construction 320 2 716 1 250 566 342 938
4. Wholesale, Retail and Import/Export Trades, Restaurants and Hotels
666 283 395 76 158 154
5. Transport, Storage and Communications 178 32 44 2 4 17
6. Financing, Insurance, Real Estate and Business Services
663 400 303 8 23 5
7. Community, Social and Personal Services 1 299 2 115 1 815 705 1 445 1 093
Total 4 110 6 613 4 689 1 847 2 722 2 880
* Applications received towards year-end may be approved in the following year, and hence the
number of imported workers approved each year does not necessarily fully reflect the approval results of the applications for importation of workers in the year.
- End -

S e s s i o n 2 1 L W B ( L ) - P a g e 1 4 5
Examination of Estimates of Expenditure 2016-17 Reply Serial No.
LWB(L)045 CONTROLLING OFFICER’S REPLY (Question Serial No. 0802)
Head: (90) Labour Department
Subhead (No. & title): ( )
Programme: (2) Employment Services
Controlling Officer: Commissioner for Labour (Donald TONG)
Director of Bureau: Secretary for Labour and Welfare Question: What was the number of ethnic minority job seekers registered with the job centres of the Labour Department (LD) for employment services in the past 3 years? What was the placement rate? What is the number of ethnic language-speaking staff currently working at each job centre? Has the Government assessed whether the manpower arrangement can meet the employment needs of the ethnic minority job seekers? Will additional resources be allocated to recruit more staff? If yes, what are the details and the expenditure involved? If not, what are the reasons? Asked by: Hon Emily LAU Wai-hing (Member Question No. 21) Reply: In 2013, 2014 and 2015, 787, 901 and 994 ethnic minority job seekers respectively registered for employment services at LD’s job centres. The corresponding numbers of placements secured through LD’s referral services were 57, 65 and 75. Job seekers may be placed into employment either through the referral services of LD or by direct application to employers who advertise their vacancies via LD. Currently, around 99% of the vacancies advertised through LD are open for direct application by job seekers. Job seekers who have found work through direct application are not required to report their placements to LD. LD therefore does not have the figures on the placement rate. To strengthen the employment services for ethnic minorities, LD currently employs 15 ethnic language speaking-trainees of the Youth Employment and Training Programme, who can also speak Chinese or English, to work as employment services ambassadors (ESAs) at job centres and industry-based recruitment centres for 6 months under the Employment Services Ambassador Programme for Ethnic Minorities. There is no pre-set quota on the number of ethnic minority ESAs, and LD will recruit an appropriate number of ethnic minority ESAs having regard to service demand. LD has earmarked $1.95 million for the implementation of the project in 2016-17, which includes payments for the salary and

S e s s i o n 2 1 L W B ( L ) - P a g e 1 4 6
benefits of ethnic minority ESAs, training allowance for the trainees, and expenditure for training programmes, etc. LD has also made arrangements with non-governmental organisations to provide telephone simultaneous interpretation service, as necessary, for ethnic minority job seekers who do not speak Chinese and English, as well as to provide them with on-the-spot simultaneous interpretation service at inclusive job fairs.
- End -
S e s s i o n 2 1 L W B ( L ) - P a g e 1 4 7
Examination of Estimates of Expenditure 2016-17 Reply Serial No.
LWB(L)046 CONTROLLING OFFICER’S REPLY (Question Serial No. 0803)
Head: (90) Labour Department
Subhead (No. & title): ( )
Programme: (2) Employment Services
Controlling Officer: Commissioner for Labour (Donald TONG)
Director of Bureau: Secretary for Labour and Welfare Question:
Regarding the Employment Services Ambassador Programme for Ethnic Minorities (ESAP), would the Government advise this Committee: (a) of the expenditure for ESAP in 2015-16; (b) of the number of ethnic minorities who applied for and were admitted to ESAP;
(c) of the estimated expenditure and details of ESAP in 2016-17; and
(d) whether the Government will consider recruiting more ethnic minorities into ESAP? Asked by: Hon Emily LAU Wai-hing (Member Question No. 22) Reply: The information sought is provided as follows: (a) The total expenditure on ESAP implemented by the Labour Department (LD) in
2015-16 was about $1.75 million. (b) Since the launch of ESAP in September 2014, a total of 123 persons have submitted
applications. 90 of them were selected and 63 finally employed. (c) In 2016-17, LD will continue to recruit employment services ambassadors (ESAs)
under ESAP. The estimated total expenditure is about $1.95 million, including payments for the salary and benefits of ethnic minority trainees, expenditure for training programmes, training allowance for the trainees, etc.
S e s s i o n 2 1 L W B ( L ) - P a g e 1 4 8
(d) LD has no pre-set quota on the number of ethnic minority ESAs. Having regard to service demand, LD will recruit an appropriate number of ethnic minority ESAs to provide services at job centres and industry-based recruitment centres.
- End -
S e s s i o n 2 1 L W B ( L ) - P a g e 1 4 9
Examination of Estimates of Expenditure 2016-17 Reply Serial No.
LWB(L)047 CONTROLLING OFFICER’S REPLY (Question Serial No. 1316)
Head: (90) Labour Department
Subhead (No. & title): (000) Operational expenses
Programme: (1) Labour Relations
Controlling Officer: Commissioner for Labour (Donald TONG)
Director of Bureau: Secretary for Labour and Welfare Question: (a) Please provide breakdowns of labour disputes handled in 2015 by industry and cause. (b) Please provide a breakdown of claims handled in 2015 by cause. How many of these
claims were related to Statutory Minimum Wage (SMW)? Asked by: Hon LEE Cheuk-yan (Member Question No. 27) Reply: The information sought is provided as follows: (a) Breakdowns of labour disputes (involving over 20 employees) handled by the Labour
Department (LD) in 2015 by industry and cause are as follows: By industry
Industry No. of labour disputes Construction 35 Restaurants and hotels 5 Transport, storage and communications 5 Community, social and personal services 3 Wholesale, retail and import/export trades 2 Financing, insurance, real estate and business services 1 Manufacturing 1 Others 1 Total 53
S e s s i o n 2 1 L W B ( L ) - P a g e 1 5 0
By cause
Cause No. of labour disputes Disputes involving principal contractor and subcontractor 28 Cessation of business/insolvency 14 Non-payment of wages 3 Variation of terms of employment contract 2 Dismissal 2 Retrenchment 1 Others 3 Total 53
(b) A breakdown of claims (involving 20 or less employees) handled by LD in 2015 by
cause is provided as follows:
Cause No. of claims Termination of contract 6 563 Non-payment of wages 4 579 Non-payment of holiday pay/annual leave pay/rest day pay/sickness allowance 1 484
Cessation of business/insolvency 134 Retrenchment/lay-off 119 Variation of terms of employment contract 80 Others 1 429 Total 14 388
Among the 14 388 claims handled as referred to in the above table, 57 were related to SMW.
- End -
S e s s i o n 2 1 L W B ( L ) - P a g e 1 5 1
Examination of Estimates of Expenditure 2016-17 Reply Serial No.
LWB(L)048 CONTROLLING OFFICER’S REPLY (Question Serial No. 1317)
Head: (90) Labour Department
Subhead (No. & title): (000) Operational expenses
Programme: (1) Labour Relations
Controlling Officer: Commissioner for Labour (Donald TONG)
Director of Bureau: Secretary for Labour and Welfare Question: Would the Government provide the following information for 2015: (a) the number of claims filed by employees pursuant to Part VIA of the Employment
Ordinance (EO), and the number of cases ruled in favour of employees; (b) of the cases ruled in favour of employees mentioned in (a), the number of cases in
which an order for reinstatement or re-engagement was granted by the court or the Labour Tribunal (LT);
(c) a breakdown of the number of cases by the amount of terminal payments awarded by
the court or LT; and (d) whether it knows if any employers in the cases mentioned in (c) used the Mandatory
Provident Fund (MPF) contributions to offset part of the terminal payments? If not, will the Government consider collecting such information so that the public can assess whether the protection under Part VIA of EO is adequate or not?
Asked by: Hon LEE Cheuk-yan (Member Question No. 28) Reply: The information sought is provided as follows: (a) The number of claims filed by employees with the court / LT pursuant to Part VIA of
EO in 2015 and the number of cases ruled in favour of employees are provided as follows:
S e s s i o n 2 1 L W B ( L ) - P a g e 1 5 2
2015 Number of Part VIA claims filed 701 Number of Part VIA claims disposed of 607 Number of Part VIA claims ruled in favour of employees (i) awarded 73 (ii) settled 384
(b) Of the cases ruled in favour of employees mentioned in (a), 1 order for reinstatement
was made by the court / LT. No order for re-engagement was made. (c) In 2015, a total of 9 cases were awarded terminal payments by the court / LT. The
court and LT do not keep information on the breakdown of the number of cases by amount of terminal payments awarded.
(d) Employers may apply on their own to the MPF trustees for using the accrued benefits
attributed to employer’s contribution in the employees’ MPF account to offset part of the terminal payments after the conclusion of the cases. The Labour Department does not have information in this regard.
- End -
S e s s i o n 2 1 L W B ( L ) - P a g e 1 5 3
Examination of Estimates of Expenditure 2016-17 Reply Serial No.
LWB(L)049 CONTROLLING OFFICER’S REPLY (Question Serial No. 1318)
Head: (90) Labour Department
Subhead (No. & title): (000) Operational expenses
Programme: (2) Employment Services
Controlling Officer: Commissioner for Labour (Donald TONG)
Director of Bureau: Secretary for Labour and Welfare Question: With respect to Programme (2) Employment Services, would the Government provide the following information: (a) breakdowns by gender, age, industry, occupation and earnings of the numbers of
able-bodied job seekers who secured placements through the employment services of the Labour Department (LD) in 2015;
(b) among the breakdown figures in (a) above, what are the respective numbers of
part-time, temporary and full-time jobs with monthly earnings less than $4,000? Asked by: Hon LEE Cheuk-yan (Member Question No. 29) Reply: The information sought is provided as follows: (a) In 2015, LD secured 148 347 placements for able-bodied job seekers. Of these,
14 040 placements were secured through the referral services of LD while 134 307 placements were made through direct applications by job seekers to employers who advertised their vacancies through LD. Job seekers who have found work through direct application are not required to report their placements to LD. LD therefore does not have statistics in respect of the placements of these job seekers. Breakdowns of the 14 040 placements secured through the referral of LD by gender and age, industry, occupation and earnings are as follows:
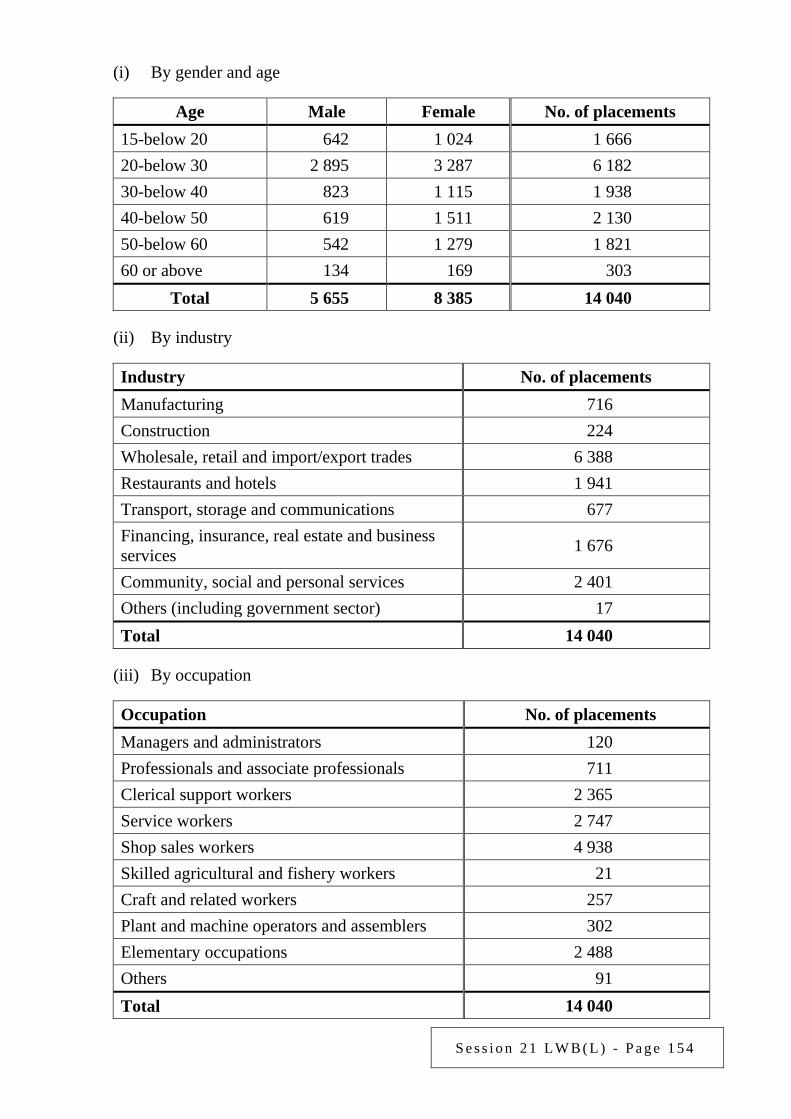
S e s s i o n 2 1 L W B ( L ) - P a g e 1 5 4
(i) By gender and age
Age Male Female No. of placements 15-below 20 642 1 024 1 666 20-below 30 2 895 3 287 6 182 30-below 40 823 1 115 1 938 40-below 50 619 1 511 2 130 50-below 60 542 1 279 1 821 60 or above 134 169 303
Total 5 655 8 385 14 040
(ii) By industry
Industry No. of placements Manufacturing 716 Construction 224 Wholesale, retail and import/export trades 6 388 Restaurants and hotels 1 941 Transport, storage and communications 677 Financing, insurance, real estate and business services 1 676
Community, social and personal services 2 401 Others (including government sector) 17 Total 14 040
(iii) By occupation
Occupation No. of placements Managers and administrators 120 Professionals and associate professionals 711 Clerical support workers 2 365 Service workers 2 747 Shop sales workers 4 938 Skilled agricultural and fishery workers 21 Craft and related workers 257 Plant and machine operators and assemblers 302 Elementary occupations 2 488 Others 91 Total 14 040
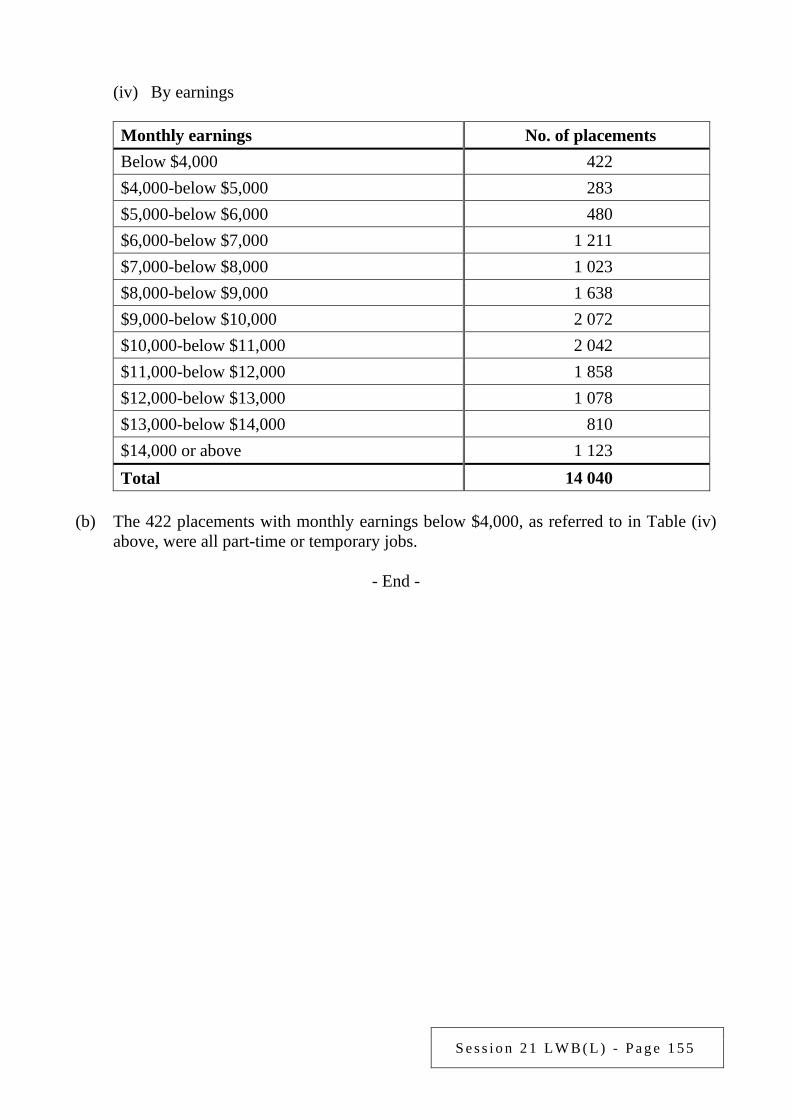
S e s s i o n 2 1 L W B ( L ) - P a g e 1 5 5
(iv) By earnings
Monthly earnings No. of placements Below $4,000 422 $4,000-below $5,000 283 $5,000-below $6,000 480 $6,000-below $7,000 1 211 $7,000-below $8,000 1 023 $8,000-below $9,000 1 638 $9,000-below $10,000 2 072 $10,000-below $11,000 2 042 $11,000-below $12,000 1 858 $12,000-below $13,000 1 078 $13,000-below $14,000 810 $14,000 or above 1 123 Total 14 040
(b) The 422 placements with monthly earnings below $4,000, as referred to in Table (iv)
above, were all part-time or temporary jobs.
- End -
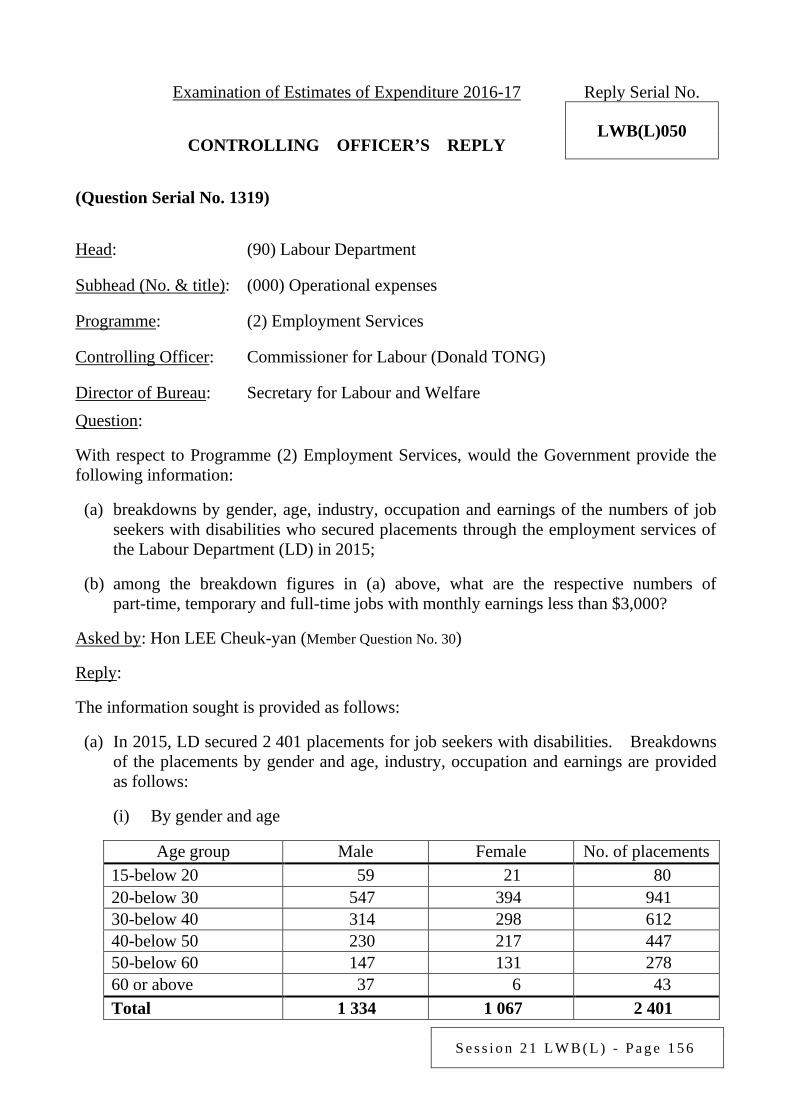
S e s s i o n 2 1 L W B ( L ) - P a g e 1 5 6
Examination of Estimates of Expenditure 2016-17 Reply Serial No.
LWB(L)050 CONTROLLING OFFICER’S REPLY (Question Serial No. 1319)
Head: (90) Labour Department
Subhead (No. & title): (000) Operational expenses
Programme: (2) Employment Services
Controlling Officer: Commissioner for Labour (Donald TONG)
Director of Bureau: Secretary for Labour and Welfare Question: With respect to Programme (2) Employment Services, would the Government provide the following information: (a) breakdowns by gender, age, industry, occupation and earnings of the numbers of job
seekers with disabilities who secured placements through the employment services of the Labour Department (LD) in 2015;
(b) among the breakdown figures in (a) above, what are the respective numbers of
part-time, temporary and full-time jobs with monthly earnings less than $3,000? Asked by: Hon LEE Cheuk-yan (Member Question No. 30) Reply: The information sought is provided as follows: (a) In 2015, LD secured 2 401 placements for job seekers with disabilities. Breakdowns
of the placements by gender and age, industry, occupation and earnings are provided as follows:
(i) By gender and age
Age group Male Female No. of placements 15-below 20 59 21 80 20-below 30 547 394 941 30-below 40 314 298 612 40-below 50 230 217 447 50-below 60 147 131 278 60 or above 37 6 43 Total 1 334 1 067 2 401
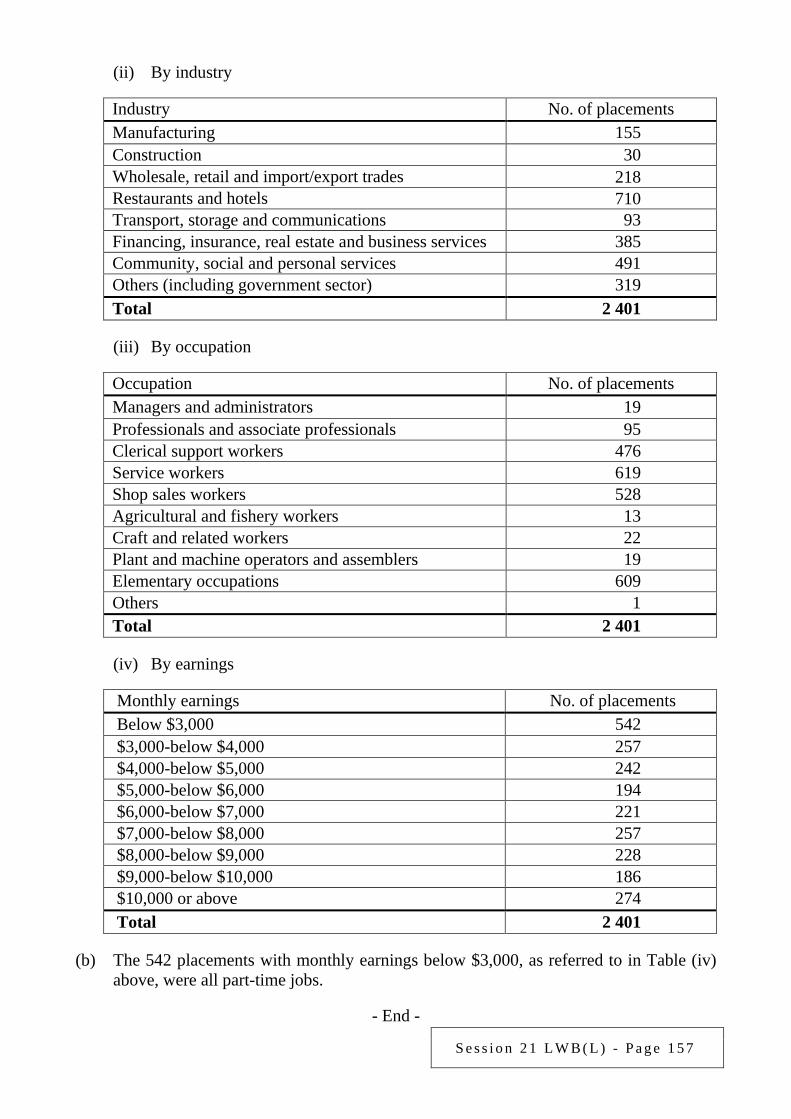
S e s s i o n 2 1 L W B ( L ) - P a g e 1 5 7
(ii) By industry
Industry No. of placements Manufacturing 155 Construction 30 Wholesale, retail and import/export trades 218 Restaurants and hotels 710 Transport, storage and communications 93 Financing, insurance, real estate and business services 385 Community, social and personal services 491 Others (including government sector) 319 Total 2 401
(iii) By occupation
Occupation No. of placements Managers and administrators 19 Professionals and associate professionals 95 Clerical support workers 476 Service workers 619 Shop sales workers 528 Agricultural and fishery workers 13 Craft and related workers 22 Plant and machine operators and assemblers 19 Elementary occupations 609 Others 1 Total 2 401
(iv) By earnings
Monthly earnings No. of placements Below $3,000 542 $3,000-below $4,000 257 $4,000-below $5,000 242 $5,000-below $6,000 194 $6,000-below $7,000 221 $7,000-below $8,000 257 $8,000-below $9,000 228 $9,000-below $10,000 186 $10,000 or above 274 Total 2 401
(b) The 542 placements with monthly earnings below $3,000, as referred to in Table (iv)
above, were all part-time jobs.
- End -
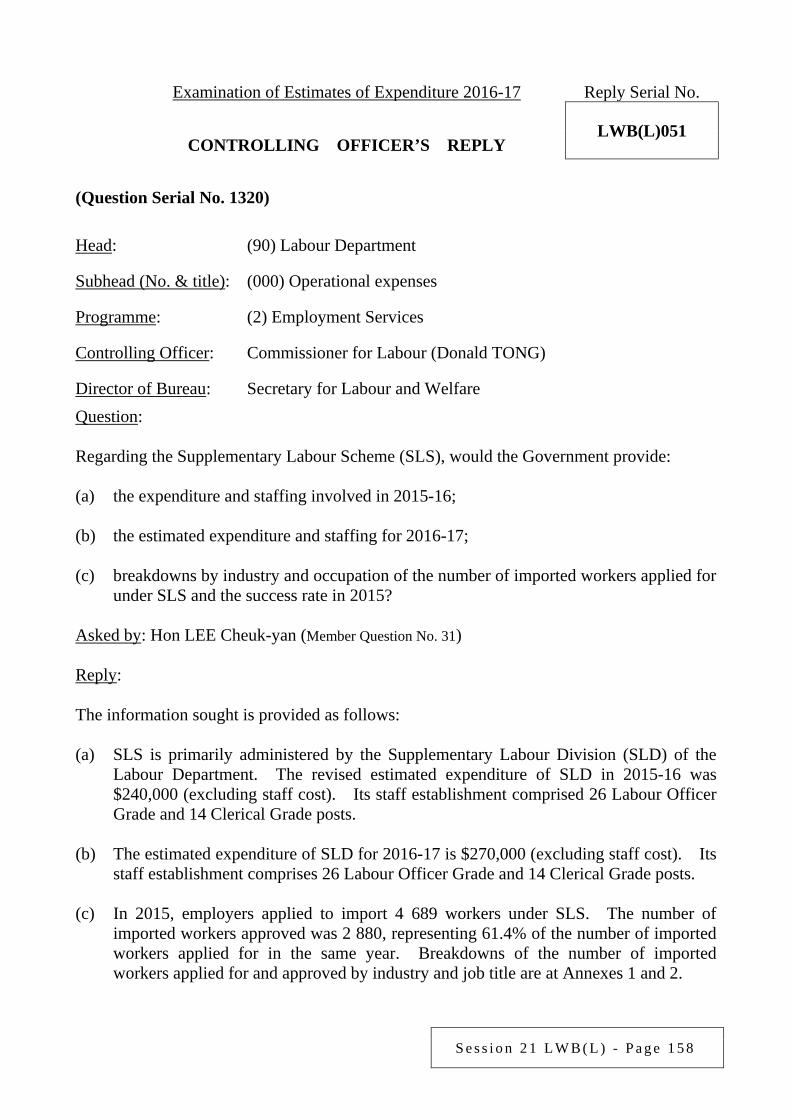
S e s s i o n 2 1 L W B ( L ) - P a g e 1 5 8
Examination of Estimates of Expenditure 2016-17 Reply Serial No.
LWB(L)051 CONTROLLING OFFICER’S REPLY (Question Serial No. 1320)
Head: (90) Labour Department
Subhead (No. & title): (000) Operational expenses
Programme: (2) Employment Services
Controlling Officer: Commissioner for Labour (Donald TONG)
Director of Bureau: Secretary for Labour and Welfare Question: Regarding the Supplementary Labour Scheme (SLS), would the Government provide: (a) the expenditure and staffing involved in 2015-16; (b) the estimated expenditure and staffing for 2016-17; (c) breakdowns by industry and occupation of the number of imported workers applied for
under SLS and the success rate in 2015? Asked by: Hon LEE Cheuk-yan (Member Question No. 31) Reply: The information sought is provided as follows: (a) SLS is primarily administered by the Supplementary Labour Division (SLD) of the
Labour Department. The revised estimated expenditure of SLD in 2015-16 was $240,000 (excluding staff cost). Its staff establishment comprised 26 Labour Officer Grade and 14 Clerical Grade posts.
(b) The estimated expenditure of SLD for 2016-17 is $270,000 (excluding staff cost). Its
staff establishment comprises 26 Labour Officer Grade and 14 Clerical Grade posts. (c) In 2015, employers applied to import 4 689 workers under SLS. The number of
imported workers approved was 2 880, representing 61.4% of the number of imported workers applied for in the same year. Breakdowns of the number of imported workers applied for and approved by industry and job title are at Annexes 1 and 2.
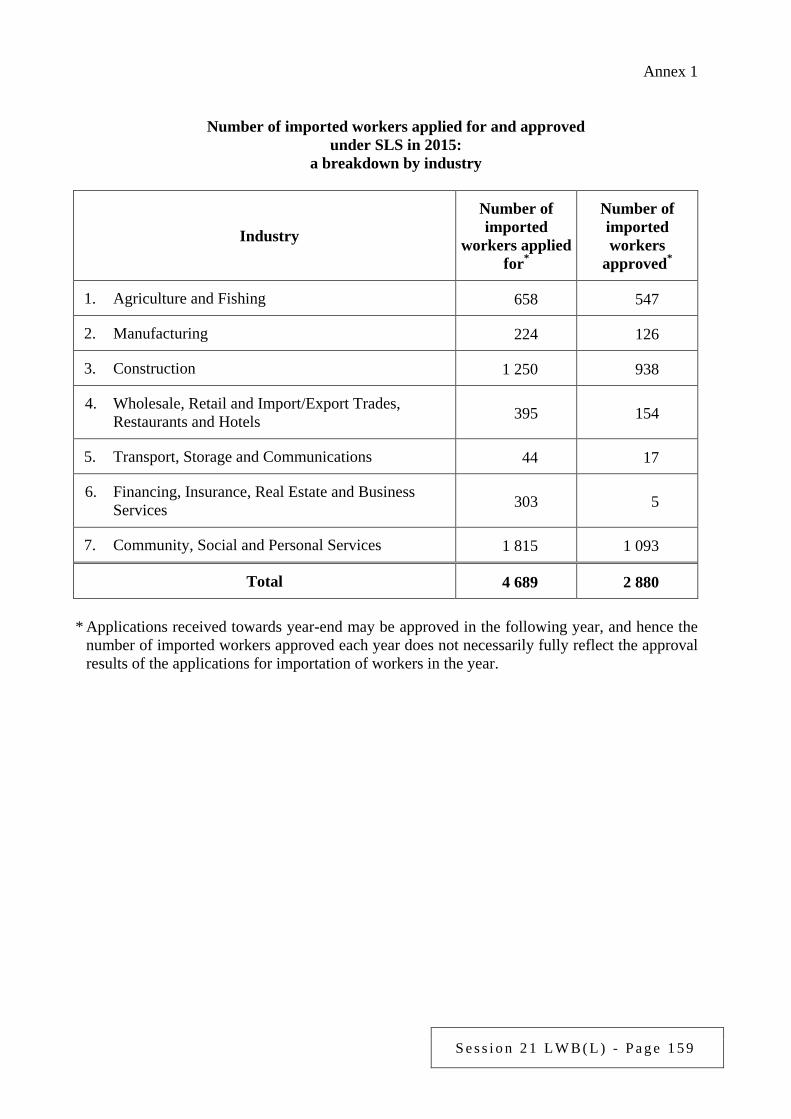
S e s s i o n 2 1 L W B ( L ) - P a g e 1 5 9
Annex 1
Number of imported workers applied for and approved under SLS in 2015:
a breakdown by industry
Industry
Number of imported
workers applied for*
Number of imported workers
approved*
1. Agriculture and Fishing 658 547
2. Manufacturing 224 126
3. Construction 1 250 938
4. Wholesale, Retail and Import/Export Trades, Restaurants and Hotels 395 154
5. Transport, Storage and Communications 44 17
6. Financing, Insurance, Real Estate and Business Services 303 5
7. Community, Social and Personal Services 1 815 1 093
Total 4 689 2 880
* Applications received towards year-end may be approved in the following year, and hence the number of imported workers approved each year does not necessarily fully reflect the approval results of the applications for importation of workers in the year.
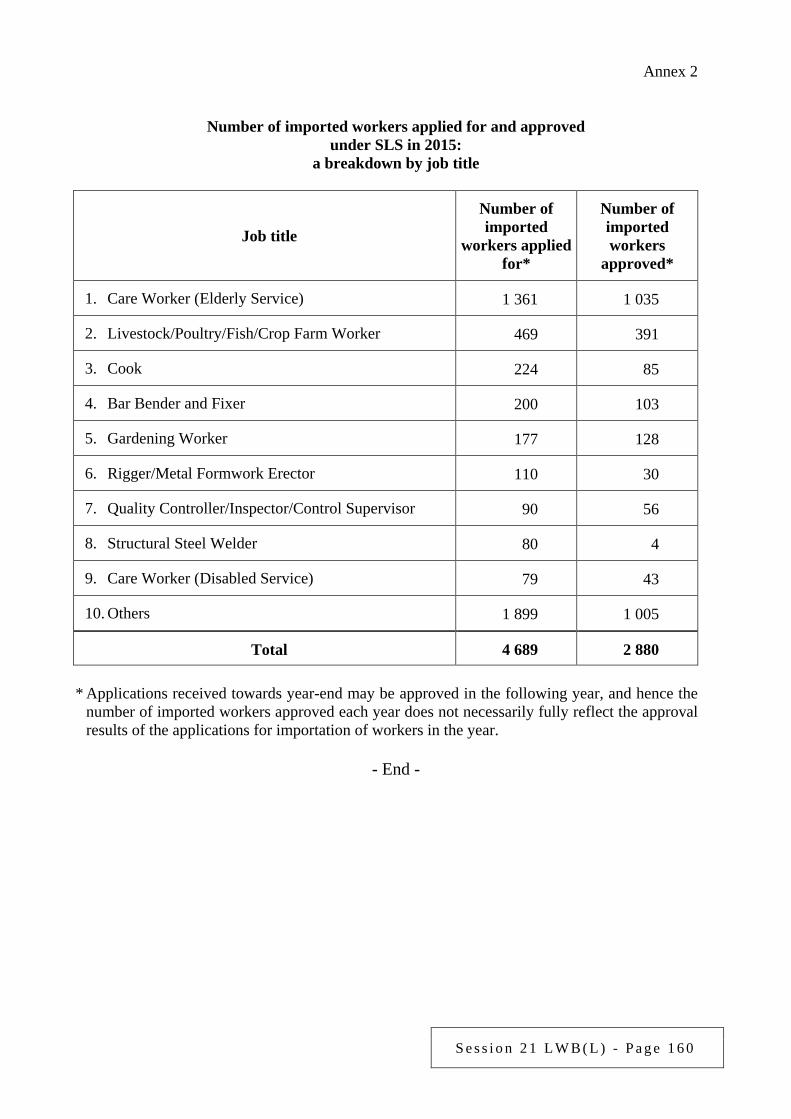
S e s s i o n 2 1 L W B ( L ) - P a g e 1 6 0
Annex 2
Number of imported workers applied for and approved under SLS in 2015:
a breakdown by job title
Job title
Number of imported
workers applied for*
Number of imported workers
approved*
1. Care Worker (Elderly Service) 1 361 1 035
2. Livestock/Poultry/Fish/Crop Farm Worker 469 391
3. Cook 224 85
4. Bar Bender and Fixer 200 103
5. Gardening Worker 177 128
6. Rigger/Metal Formwork Erector 110 30
7. Quality Controller/Inspector/Control Supervisor 90 56
8. Structural Steel Welder 80 4
9. Care Worker (Disabled Service) 79 43
10. Others 1 899 1 005
Total 4 689 2 880 * Applications received towards year-end may be approved in the following year, and hence the
number of imported workers approved each year does not necessarily fully reflect the approval results of the applications for importation of workers in the year.
- End -
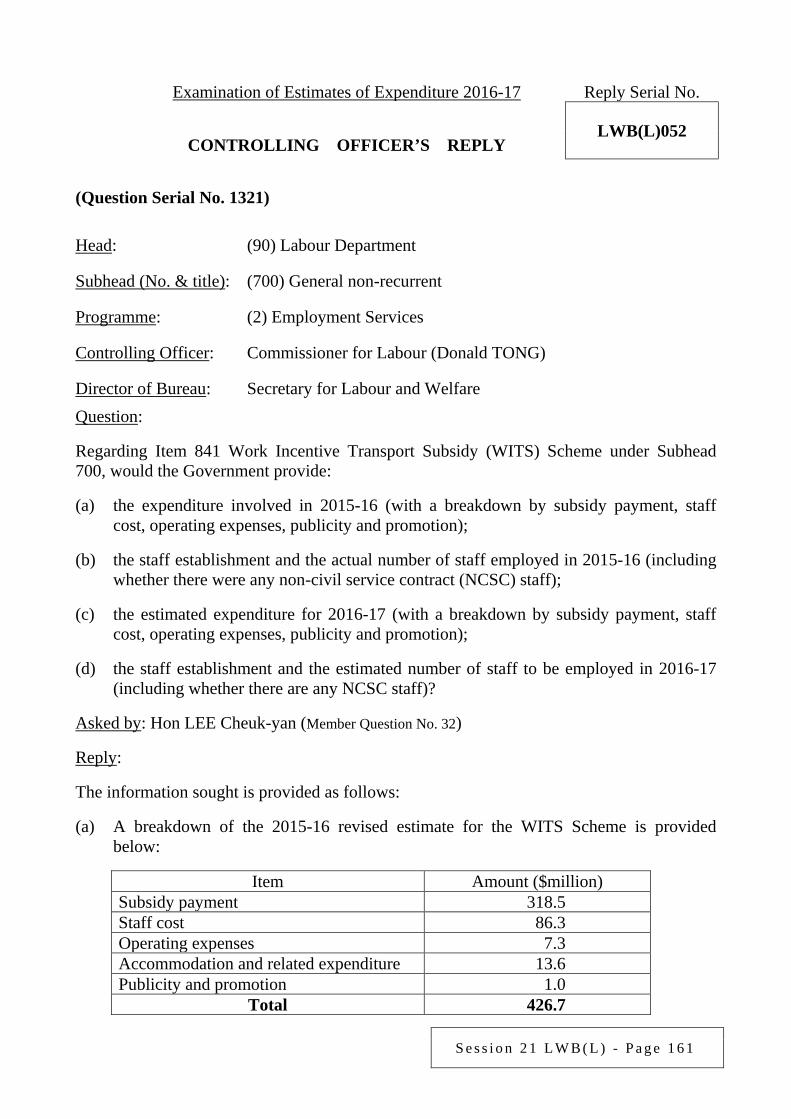
S e s s i o n 2 1 L W B ( L ) - P a g e 1 6 1
Examination of Estimates of Expenditure 2016-17 Reply Serial No.
LWB(L)052 CONTROLLING OFFICER’S REPLY (Question Serial No. 1321)
Head: (90) Labour Department
Subhead (No. & title): (700) General non-recurrent
Programme: (2) Employment Services
Controlling Officer: Commissioner for Labour (Donald TONG)
Director of Bureau: Secretary for Labour and Welfare Question: Regarding Item 841 Work Incentive Transport Subsidy (WITS) Scheme under Subhead 700, would the Government provide: (a) the expenditure involved in 2015-16 (with a breakdown by subsidy payment, staff
cost, operating expenses, publicity and promotion); (b) the staff establishment and the actual number of staff employed in 2015-16 (including
whether there were any non-civil service contract (NCSC) staff); (c) the estimated expenditure for 2016-17 (with a breakdown by subsidy payment, staff
cost, operating expenses, publicity and promotion); (d) the staff establishment and the estimated number of staff to be employed in 2016-17
(including whether there are any NCSC staff)? Asked by: Hon LEE Cheuk-yan (Member Question No. 32) Reply: The information sought is provided as follows: (a) A breakdown of the 2015-16 revised estimate for the WITS Scheme is provided
below:
Item Amount ($million) Subsidy payment 318.5 Staff cost 86.3 Operating expenses 7.3 Accommodation and related expenditure 13.6 Publicity and promotion 1.0
Total 426.7
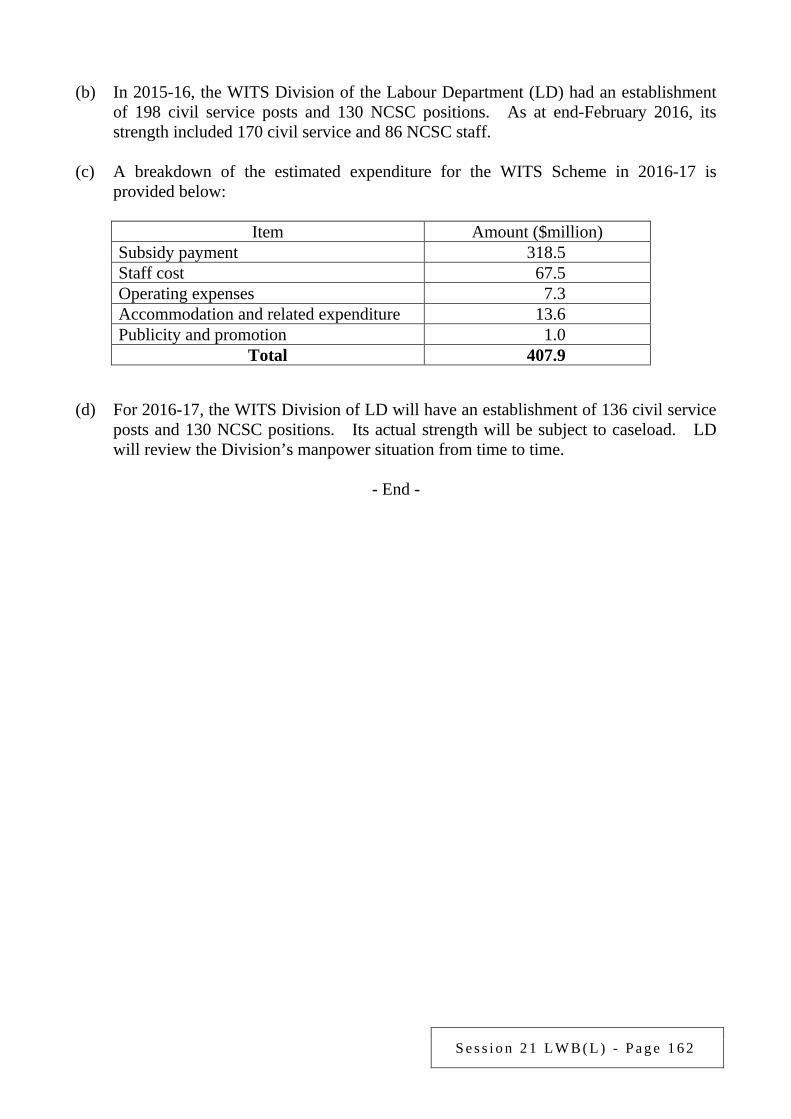
S e s s i o n 2 1 L W B ( L ) - P a g e 1 6 2
(b) In 2015-16, the WITS Division of the Labour Department (LD) had an establishment
of 198 civil service posts and 130 NCSC positions. As at end-February 2016, its strength included 170 civil service and 86 NCSC staff.
(c) A breakdown of the estimated expenditure for the WITS Scheme in 2016-17 is
provided below:
Item Amount ($million) Subsidy payment 318.5 Staff cost 67.5 Operating expenses 7.3 Accommodation and related expenditure 13.6 Publicity and promotion 1.0
Total 407.9
(d) For 2016-17, the WITS Division of LD will have an establishment of 136 civil service posts and 130 NCSC positions. Its actual strength will be subject to caseload. LD will review the Division’s manpower situation from time to time.
- End -
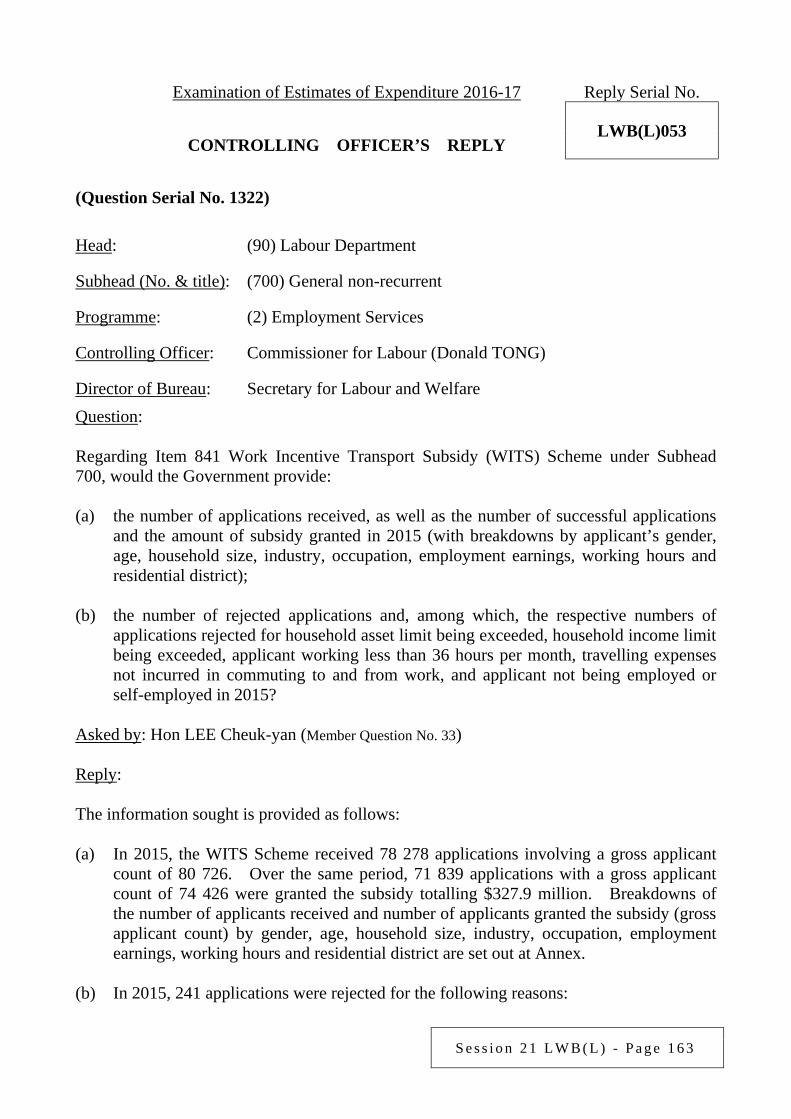
S e s s i o n 2 1 L W B ( L ) - P a g e 1 6 3
Examination of Estimates of Expenditure 2016-17 Reply Serial No.
LWB(L)053 CONTROLLING OFFICER’S REPLY (Question Serial No. 1322)
Head: (90) Labour Department
Subhead (No. & title): (700) General non-recurrent
Programme: (2) Employment Services
Controlling Officer: Commissioner for Labour (Donald TONG)
Director of Bureau: Secretary for Labour and Welfare Question: Regarding Item 841 Work Incentive Transport Subsidy (WITS) Scheme under Subhead 700, would the Government provide: (a) the number of applications received, as well as the number of successful applications
and the amount of subsidy granted in 2015 (with breakdowns by applicant’s gender, age, household size, industry, occupation, employment earnings, working hours and residential district);
(b) the number of rejected applications and, among which, the respective numbers of
applications rejected for household asset limit being exceeded, household income limit being exceeded, applicant working less than 36 hours per month, travelling expenses not incurred in commuting to and from work, and applicant not being employed or self-employed in 2015?
Asked by: Hon LEE Cheuk-yan (Member Question No. 33) Reply: The information sought is provided as follows: (a) In 2015, the WITS Scheme received 78 278 applications involving a gross applicant
count of 80 726. Over the same period, 71 839 applications with a gross applicant count of 74 426 were granted the subsidy totalling $327.9 million. Breakdowns of the number of applicants received and number of applicants granted the subsidy (gross applicant count) by gender, age, household size, industry, occupation, employment earnings, working hours and residential district are set out at Annex.
(b) In 2015, 241 applications were rejected for the following reasons:
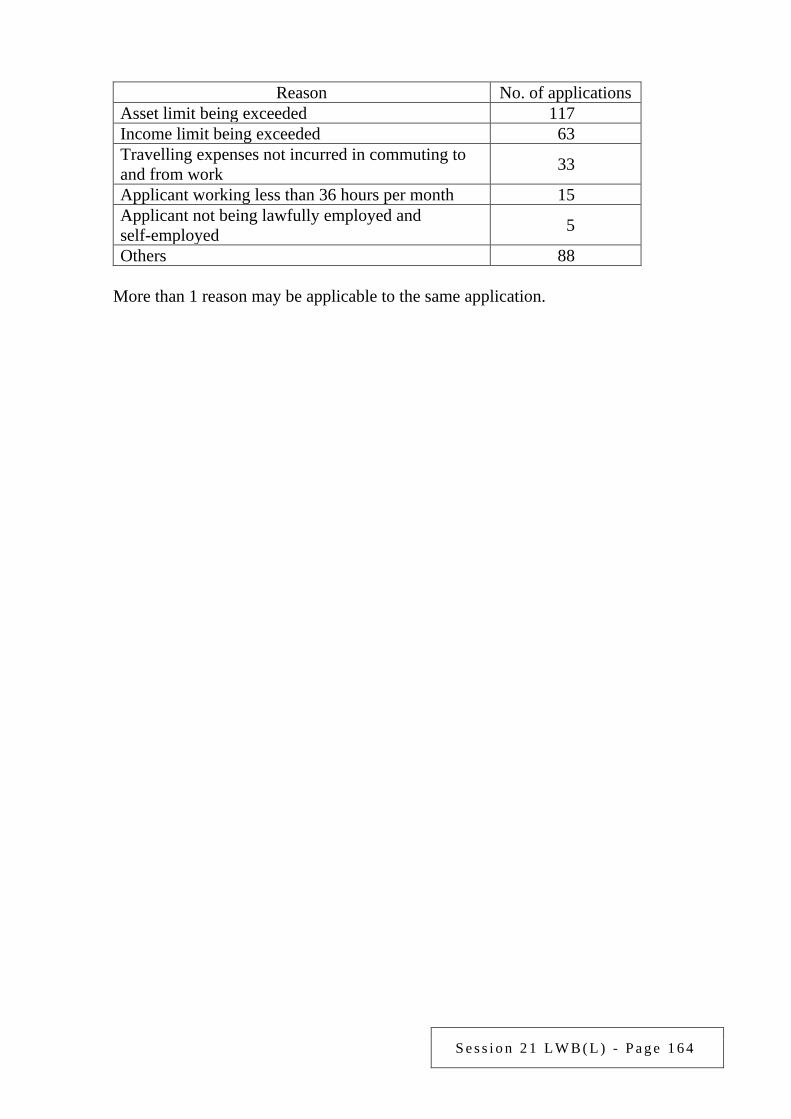
S e s s i o n 2 1 L W B ( L ) - P a g e 1 6 4
Reason No. of applications
Asset limit being exceeded 117 Income limit being exceeded 63 Travelling expenses not incurred in commuting to and from work 33
Applicant working less than 36 hours per month 15 Applicant not being lawfully employed and self-employed 5
Others 88
More than 1 reason may be applicable to the same application.
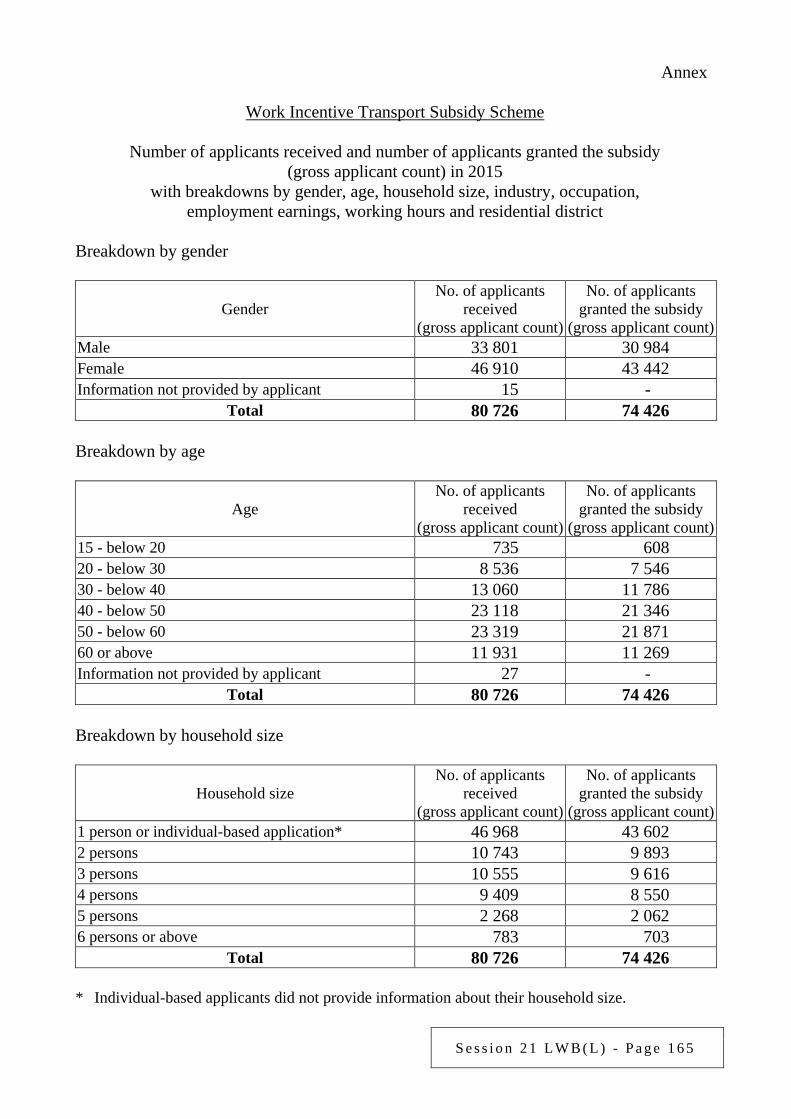
S e s s i o n 2 1 L W B ( L ) - P a g e 1 6 5
Annex
Work Incentive Transport Subsidy Scheme
Number of applicants received and number of applicants granted the subsidy (gross applicant count) in 2015
with breakdowns by gender, age, household size, industry, occupation, employment earnings, working hours and residential district
Breakdown by gender
Gender No. of applicants
received (gross applicant count)
No. of applicants granted the subsidy
(gross applicant count) Male 33 801 30 984 Female 46 910 43 442 Information not provided by applicant 15 -
Total 80 726 74 426 Breakdown by age
Age No. of applicants
received (gross applicant count)
No. of applicants granted the subsidy
(gross applicant count) 15 - below 20 735 608 20 - below 30 8 536 7 546 30 - below 40 13 060 11 786 40 - below 50 23 118 21 346 50 - below 60 23 319 21 871 60 or above 11 931 11 269 Information not provided by applicant 27 -
Total 80 726 74 426 Breakdown by household size
Household size No. of applicants
received (gross applicant count)
No. of applicants granted the subsidy
(gross applicant count) 1 person or individual-based application* 46 968 43 602 2 persons 10 743 9 893 3 persons 10 555 9 616 4 persons 9 409 8 550 5 persons 2 268 2 062 6 persons or above 783 703
Total 80 726 74 426 * Individual-based applicants did not provide information about their household size.
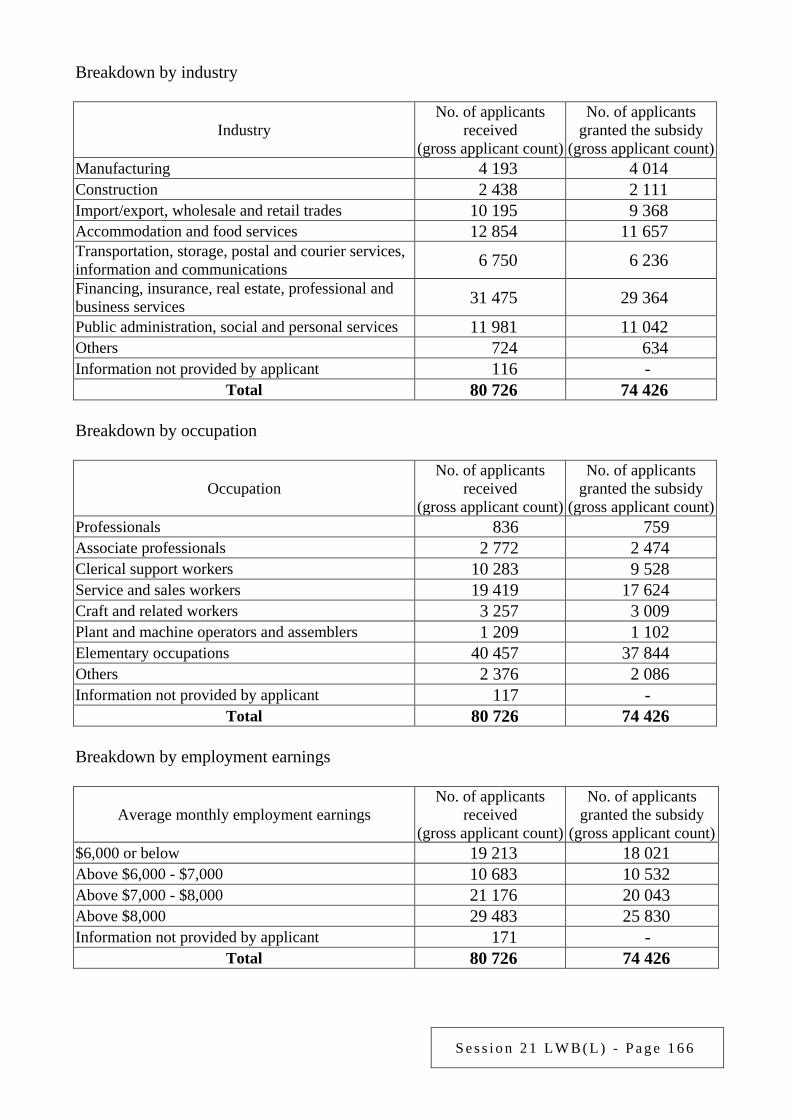
S e s s i o n 2 1 L W B ( L ) - P a g e 1 6 6
Breakdown by industry
Industry No. of applicants
received (gross applicant count)
No. of applicants granted the subsidy
(gross applicant count) Manufacturing 4 193 4 014 Construction 2 438 2 111 Import/export, wholesale and retail trades 10 195 9 368 Accommodation and food services 12 854 11 657 Transportation, storage, postal and courier services, information and communications 6 750 6 236 Financing, insurance, real estate, professional and business services 31 475 29 364
Public administration, social and personal services 11 981 11 042 Others 724 634 Information not provided by applicant 116 -
Total 80 726 74 426 Breakdown by occupation
Occupation No. of applicants
received (gross applicant count)
No. of applicants granted the subsidy
(gross applicant count) Professionals 836 759 Associate professionals 2 772 2 474 Clerical support workers 10 283 9 528 Service and sales workers 19 419 17 624 Craft and related workers 3 257 3 009 Plant and machine operators and assemblers 1 209 1 102 Elementary occupations 40 457 37 844 Others 2 376 2 086 Information not provided by applicant 117 -
Total 80 726 74 426 Breakdown by employment earnings
Average monthly employment earnings No. of applicants
received (gross applicant count)
No. of applicants granted the subsidy
(gross applicant count) $6,000 or below 19 213 18 021 Above $6,000 - $7,000 10 683 10 532 Above $7,000 - $8,000 21 176 20 043 Above $8,000 29 483 25 830 Information not provided by applicant 171 -
Total 80 726 74 426
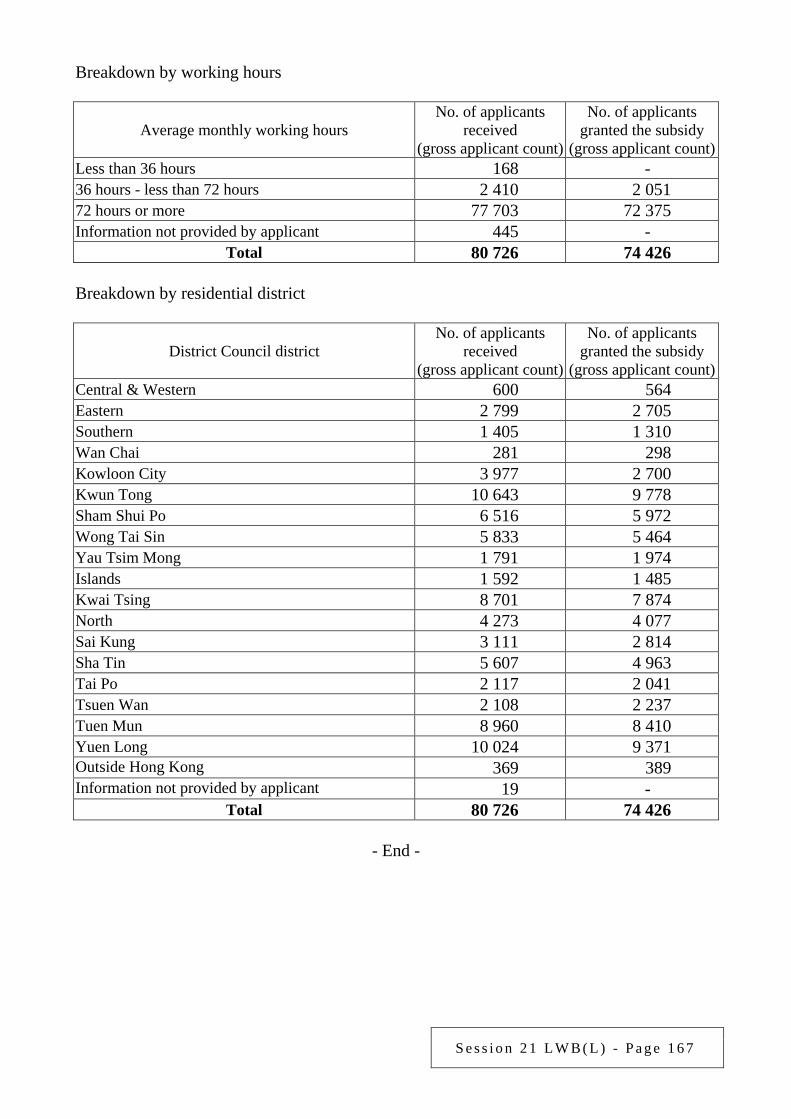
S e s s i o n 2 1 L W B ( L ) - P a g e 1 6 7
Breakdown by working hours
Average monthly working hours No. of applicants
received (gross applicant count)
No. of applicants granted the subsidy
(gross applicant count) Less than 36 hours 168 - 36 hours - less than 72 hours 2 410 2 051 72 hours or more 77 703 72 375 Information not provided by applicant 445 -
Total 80 726 74 426 Breakdown by residential district
District Council district No. of applicants
received (gross applicant count)
No. of applicants granted the subsidy
(gross applicant count) Central & Western 600 564 Eastern 2 799 2 705 Southern 1 405 1 310 Wan Chai 281 298 Kowloon City 3 977 2 700 Kwun Tong 10 643 9 778 Sham Shui Po 6 516 5 972 Wong Tai Sin 5 833 5 464 Yau Tsim Mong 1 791 1 974 Islands 1 592 1 485 Kwai Tsing 8 701 7 874 North 4 273 4 077 Sai Kung 3 111 2 814 Sha Tin 5 607 4 963 Tai Po 2 117 2 041 Tsuen Wan 2 108 2 237 Tuen Mun 8 960 8 410 Yuen Long 10 024 9 371 Outside Hong Kong 369 389 Information not provided by applicant 19 -
Total 80 726 74 426
- End -
S e s s i o n 2 1 L W B ( L ) - P a g e 1 6 8
Examination of Estimates of Expenditure 2016-17 Reply Serial No.
LWB(L)054 CONTROLLING OFFICER’S REPLY (Question Serial No. 1323)
Head: (90) Labour Department
Subhead (No. & title): (000) Operational expenses
Programme: (2) Employment Services
Controlling Officer: Commissioner for Labour (Donald TONG)
Director of Bureau: Secretary for Labour and Welfare Question: Regarding the Youth Employment and Training Programme (YETP), would the Government provide: (a) the expenditure involved in 2014-15 and 2015-16 and the estimated expenditure for
2016-17; (b) the respective numbers of employers and trainees who were granted the training
allowances and the amounts involved in 2014-15 and 2015-16;
(c) the respective numbers of trainees who received pre-employment training in 2014-15 and 2015-16;
(d) the respective numbers of trainees who were placed into on-the-job training vacancies
in 2014-15 and 2015-16 (with breakdowns by industry and occupation); and
(e) the employment rate of the trainees in 2014-15 (with breakdowns by industry and occupation)?
Asked by: Hon LEE Cheuk-yan (Member Question No. 34) Reply: The information sought is provided as follows: (a) In 2014-15 and 2015-16, the actual expenditure and estimated expenditure for
implementing YETP were $79.8 million and $77.1 million respectively. In 2016-17, the Labour Department (LD) has earmarked $112.7 million for YETP to meet rising expenses (including the provision of case management and employment support services, launch of different projects in collaboration with employers and various
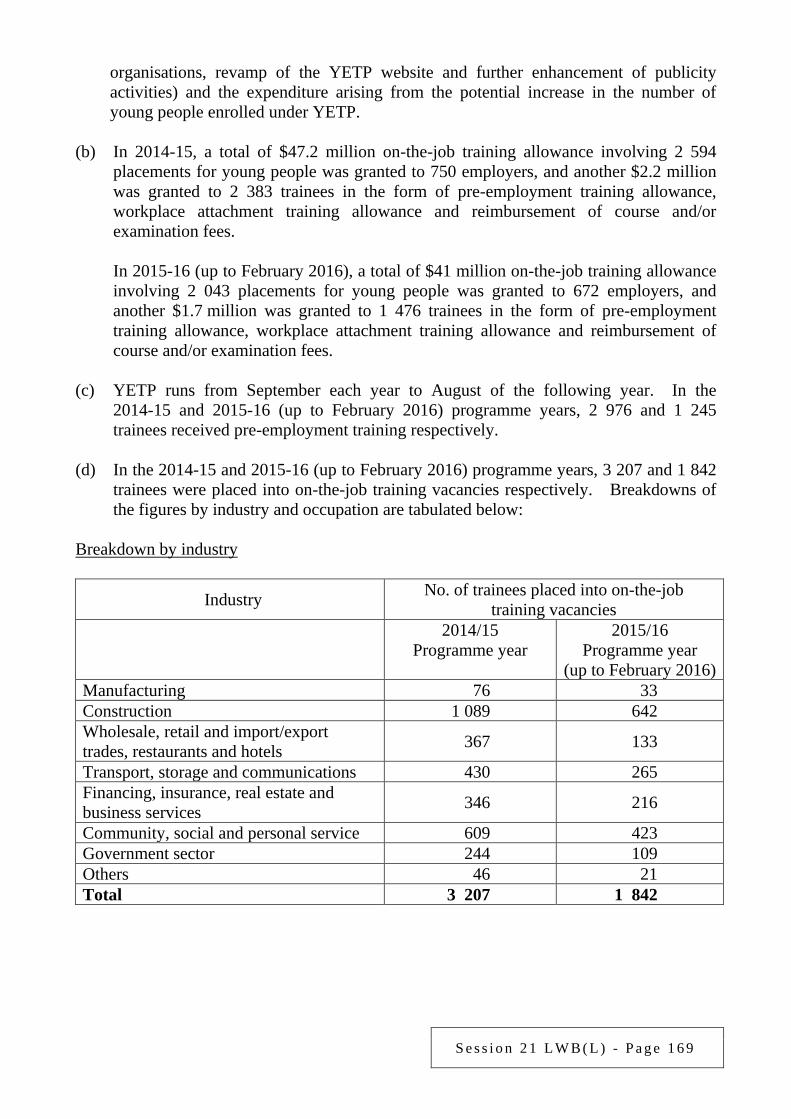
S e s s i o n 2 1 L W B ( L ) - P a g e 1 6 9
organisations, revamp of the YETP website and further enhancement of publicity activities) and the expenditure arising from the potential increase in the number of young people enrolled under YETP.
(b) In 2014-15, a total of $47.2 million on-the-job training allowance involving 2 594
placements for young people was granted to 750 employers, and another $2.2 million was granted to 2 383 trainees in the form of pre-employment training allowance, workplace attachment training allowance and reimbursement of course and/or examination fees.
In 2015-16 (up to February 2016), a total of $41 million on-the-job training allowance
involving 2 043 placements for young people was granted to 672 employers, and another $1.7 million was granted to 1 476 trainees in the form of pre-employment training allowance, workplace attachment training allowance and reimbursement of course and/or examination fees.
(c) YETP runs from September each year to August of the following year. In the
2014-15 and 2015-16 (up to February 2016) programme years, 2 976 and 1 245 trainees received pre-employment training respectively.
(d) In the 2014-15 and 2015-16 (up to February 2016) programme years, 3 207 and 1 842
trainees were placed into on-the-job training vacancies respectively. Breakdowns of the figures by industry and occupation are tabulated below:
Breakdown by industry
Industry No. of trainees placed into on-the-job training vacancies
2014/15
Programme year 2015/16
Programme year (up to February 2016)
Manufacturing 76 33 Construction 1 089 642 Wholesale, retail and import/export trades, restaurants and hotels 367 133
Transport, storage and communications 430 265 Financing, insurance, real estate and business services 346 216
Community, social and personal service 609 423 Government sector 244 109 Others 46 21 Total 3 207 1 842
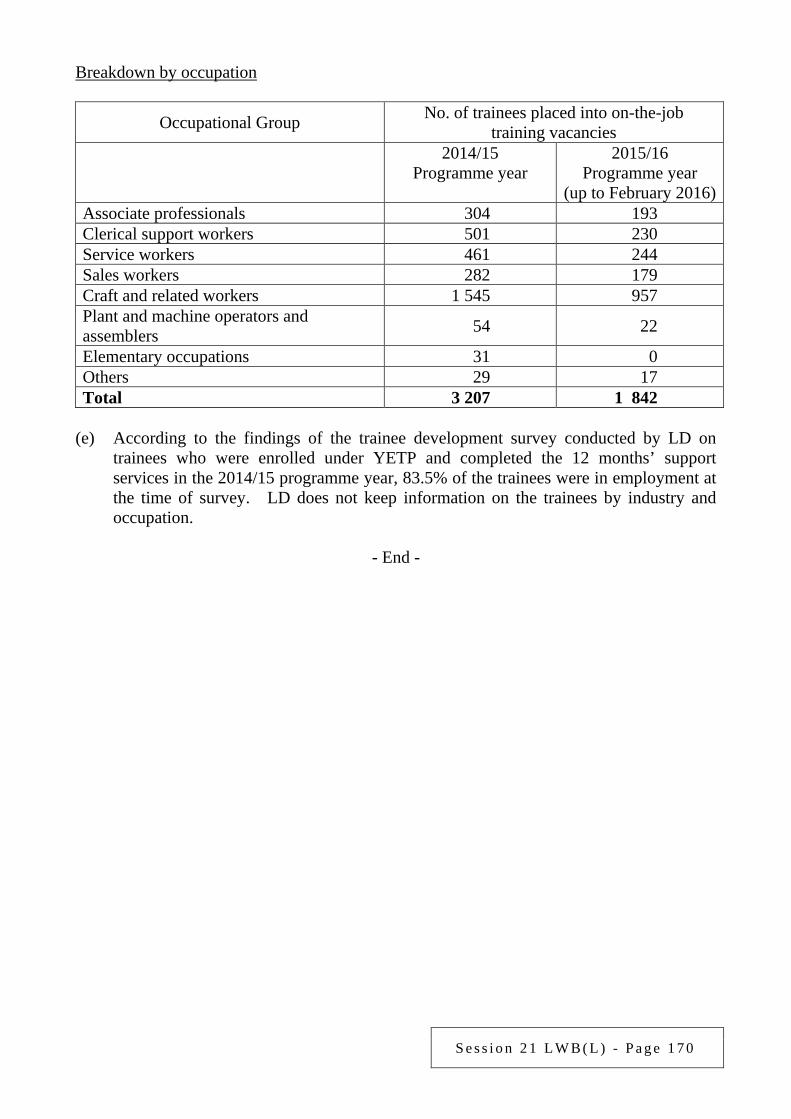
S e s s i o n 2 1 L W B ( L ) - P a g e 1 7 0
Breakdown by occupation
Occupational Group No. of trainees placed into on-the-job training vacancies
2014/15
Programme year 2015/16
Programme year (up to February 2016)
Associate professionals 304 193 Clerical support workers 501 230 Service workers 461 244 Sales workers 282 179 Craft and related workers 1 545 957 Plant and machine operators and assemblers 54 22
Elementary occupations 31 0 Others 29 17 Total 3 207 1 842
(e) According to the findings of the trainee development survey conducted by LD on
trainees who were enrolled under YETP and completed the 12 months’ support services in the 2014/15 programme year, 83.5% of the trainees were in employment at the time of survey. LD does not keep information on the trainees by industry and occupation.
- End -
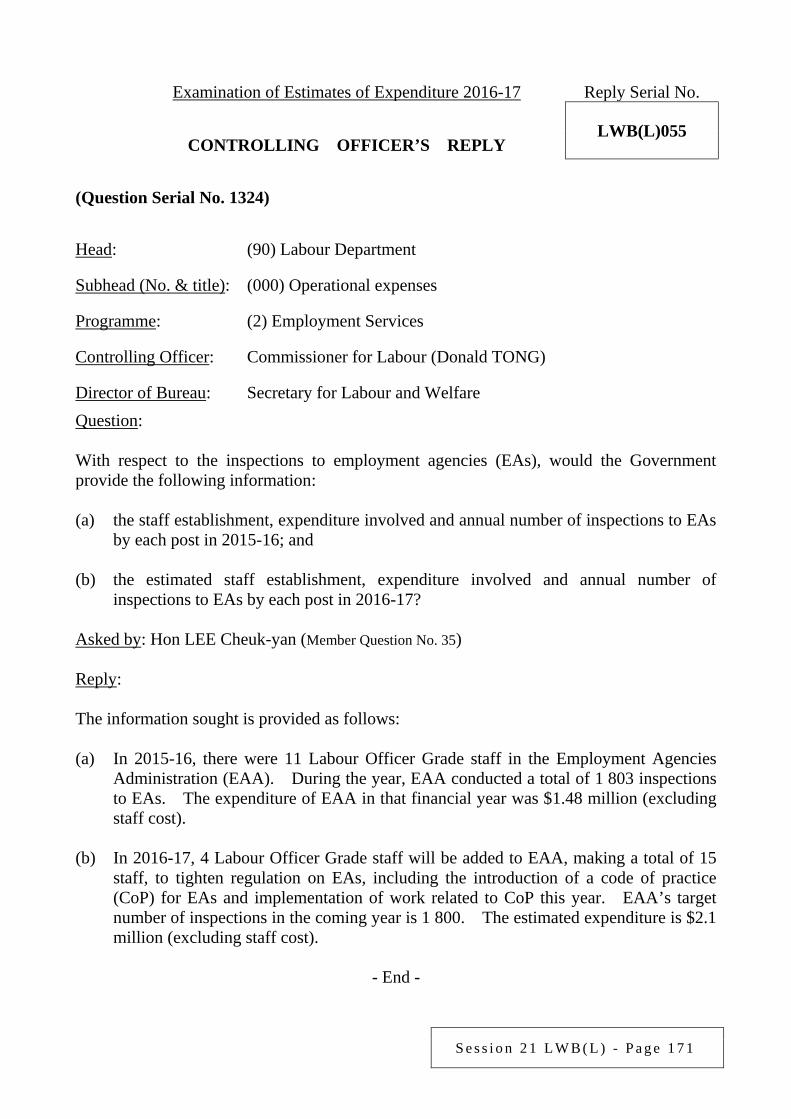
S e s s i o n 2 1 L W B ( L ) - P a g e 1 7 1
Examination of Estimates of Expenditure 2016-17 Reply Serial No.
LWB(L)055 CONTROLLING OFFICER’S REPLY (Question Serial No. 1324)
Head: (90) Labour Department
Subhead (No. & title): (000) Operational expenses
Programme: (2) Employment Services
Controlling Officer: Commissioner for Labour (Donald TONG)
Director of Bureau: Secretary for Labour and Welfare Question: With respect to the inspections to employment agencies (EAs), would the Government provide the following information: (a) the staff establishment, expenditure involved and annual number of inspections to EAs
by each post in 2015-16; and (b) the estimated staff establishment, expenditure involved and annual number of
inspections to EAs by each post in 2016-17? Asked by: Hon LEE Cheuk-yan (Member Question No. 35) Reply: The information sought is provided as follows: (a) In 2015-16, there were 11 Labour Officer Grade staff in the Employment Agencies
Administration (EAA). During the year, EAA conducted a total of 1 803 inspections to EAs. The expenditure of EAA in that financial year was $1.48 million (excluding staff cost).
(b) In 2016-17, 4 Labour Officer Grade staff will be added to EAA, making a total of 15
staff, to tighten regulation on EAs, including the introduction of a code of practice (CoP) for EAs and implementation of work related to CoP this year. EAA’s target number of inspections in the coming year is 1 800. The estimated expenditure is $2.1 million (excluding staff cost).
- End -
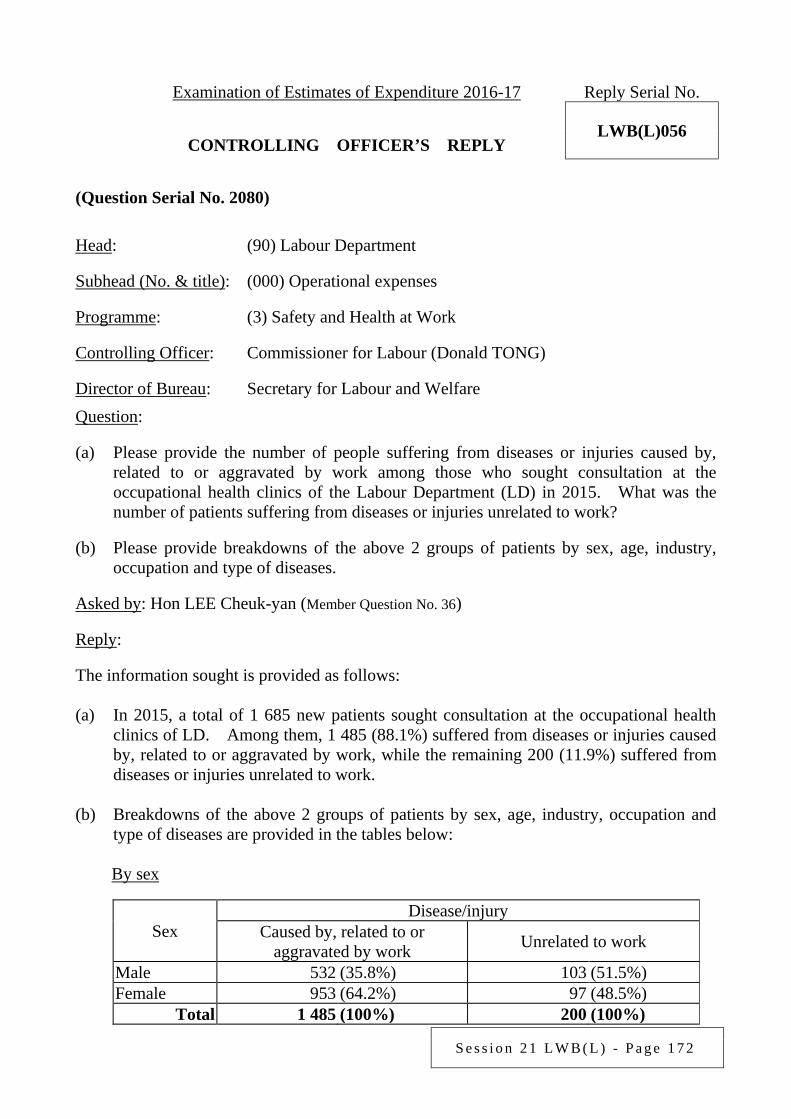
S e s s i o n 2 1 L W B ( L ) - P a g e 1 7 2
Examination of Estimates of Expenditure 2016-17 Reply Serial No.
LWB(L)056 CONTROLLING OFFICER’S REPLY (Question Serial No. 2080)
Head: (90) Labour Department
Subhead (No. & title): (000) Operational expenses
Programme: (3) Safety and Health at Work
Controlling Officer: Commissioner for Labour (Donald TONG)
Director of Bureau: Secretary for Labour and Welfare Question: (a) Please provide the number of people suffering from diseases or injuries caused by,
related to or aggravated by work among those who sought consultation at the occupational health clinics of the Labour Department (LD) in 2015. What was the number of patients suffering from diseases or injuries unrelated to work?
(b) Please provide breakdowns of the above 2 groups of patients by sex, age, industry,
occupation and type of diseases. Asked by: Hon LEE Cheuk-yan (Member Question No. 36) Reply: The information sought is provided as follows: (a) In 2015, a total of 1 685 new patients sought consultation at the occupational health
clinics of LD. Among them, 1 485 (88.1%) suffered from diseases or injuries caused by, related to or aggravated by work, while the remaining 200 (11.9%) suffered from diseases or injuries unrelated to work.
(b) Breakdowns of the above 2 groups of patients by sex, age, industry, occupation and
type of diseases are provided in the tables below: By sex
Sex Disease/injury
Caused by, related to or aggravated by work Unrelated to work
Male 532 (35.8%) 103 (51.5%) Female 953 (64.2%) 97 (48.5%)
Total 1 485 (100%) 200 (100%)
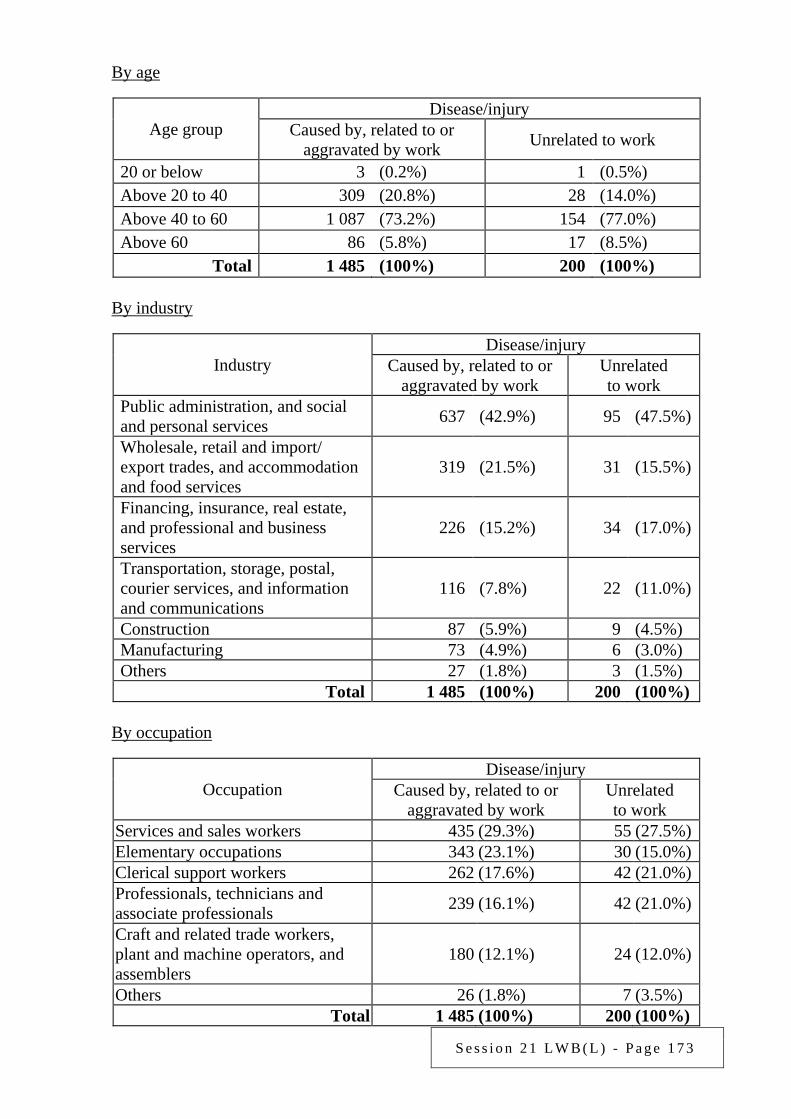
S e s s i o n 2 1 L W B ( L ) - P a g e 1 7 3
By age
Age group Disease/injury
Caused by, related to or aggravated by work Unrelated to work
20 or below 3 (0.2%) 1 (0.5%) Above 20 to 40 309 (20.8%) 28 (14.0%) Above 40 to 60 1 087 (73.2%) 154 (77.0%) Above 60 86 (5.8%) 17 (8.5%)
Total 1 485 (100%) 200 (100%) By industry
Industry Disease/injury
Caused by, related to or aggravated by work
Unrelated to work
Public administration, and social and personal services 637 (42.9%) 95 (47.5%)
Wholesale, retail and import/ export trades, and accommodation and food services
319 (21.5%) 31 (15.5%)
Financing, insurance, real estate, and professional and business services
226 (15.2%) 34 (17.0%)
Transportation, storage, postal, courier services, and information and communications
116 (7.8%) 22 (11.0%)
Construction 87 (5.9%) 9 (4.5%) Manufacturing 73 (4.9%) 6 (3.0%) Others 27 (1.8%) 3 (1.5%)
Total 1 485 (100%) 200 (100%) By occupation
Occupation Disease/injury
Caused by, related to or aggravated by work
Unrelated to work
Services and sales workers 435 (29.3%) 55 (27.5%) Elementary occupations 343 (23.1%) 30 (15.0%) Clerical support workers 262 (17.6%) 42 (21.0%) Professionals, technicians and associate professionals 239 (16.1%) 42 (21.0%)
Craft and related trade workers, plant and machine operators, and assemblers
180 (12.1%) 24 (12.0%)
Others 26 (1.8%) 7 (3.5%) Total 1 485 (100%) 200 (100%)
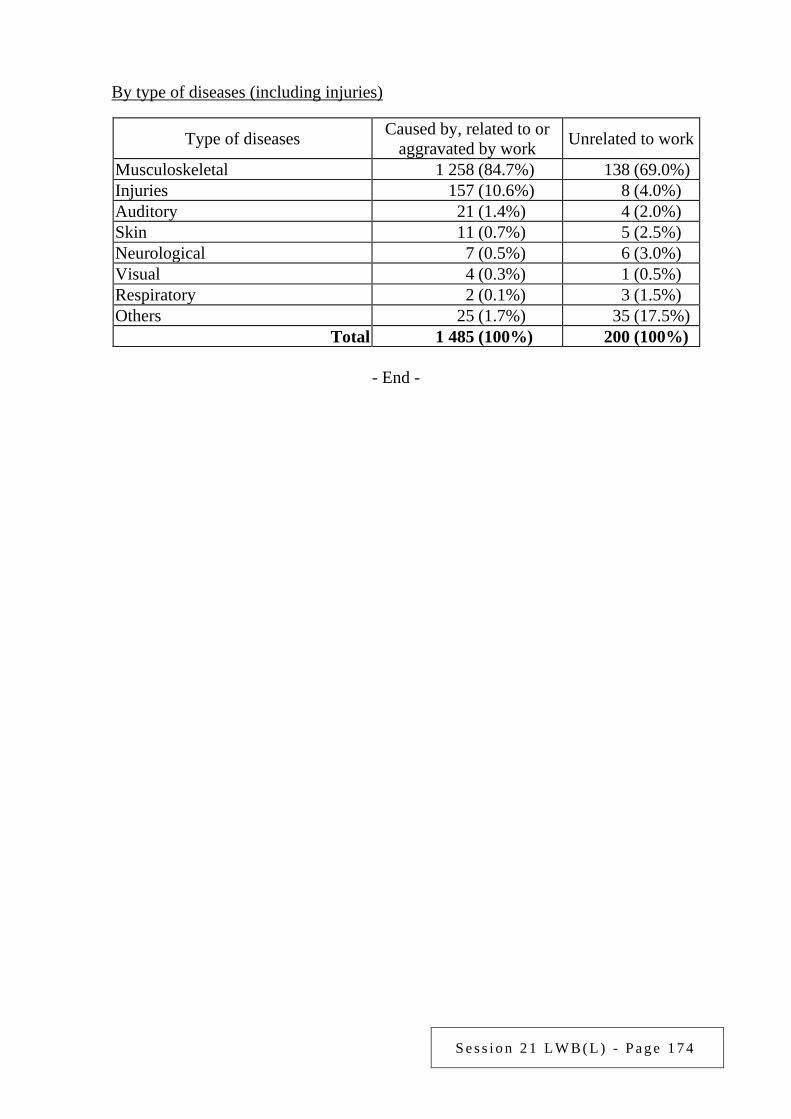
S e s s i o n 2 1 L W B ( L ) - P a g e 1 7 4
By type of diseases (including injuries)
Type of diseases Caused by, related to or aggravated by work Unrelated to work
Musculoskeletal 1 258 (84.7%) 138 (69.0%) Injuries 157 (10.6%) 8 (4.0%) Auditory 21 (1.4%) 4 (2.0%) Skin 11 (0.7%) 5 (2.5%) Neurological 7 (0.5%) 6 (3.0%) Visual 4 (0.3%) 1 (0.5%) Respiratory 2 (0.1%) 3 (1.5%) Others 25 (1.7%) 35 (17.5%)
Total 1 485 (100%) 200 (100%)
- End -

S e s s i o n 2 1 L W B ( L ) - P a g e 1 7 5
Examination of Estimates of Expenditure 2016-17 Reply Serial No.
LWB(L)057 CONTROLLING OFFICER’S REPLY (Question Serial No. 2081)
Head: (90) Labour Department
Subhead (No. & title): (000) Operational expenses
Programme: (3) Safety and Health at Work
Controlling Officer: Commissioner for Labour (Donald TONG)
Director of Bureau: Secretary for Labour and Welfare Question: (a) What systematic preventive and enforcement measures are expected to be taken in
2016-17 to tackle fall-from-height hazards and other work hazards in the construction sector? What are the staff establishment and expenditure involved?
(b) What initiatives and promotional programmes are expected to be launched in 2016-17
to raise the standard and awareness of stakeholders in the construction and catering industries on occupational safety and health? What are the staff establishment and expenditure involved?
(c) Will measures be taken in 2016-17 to step up efforts against non-reporting of work
accidents by contractors? If yes, what are the details of the measures, and the manpower and expenditure involved?
Asked by: Hon LEE Cheuk-yan (Member Question No. 37) Reply: The information sought is provided as follows: (a) In addition to carrying out routine inspections as well as educational and publicity
work, the Labour Department (LD) will intensify the following systemic preventive and enforcement measures in 2016-17 to tackle fall-from-height hazards and other work hazards posed to workers in construction works (including major works projects and renovation, maintenance, alteration and addition works):
(i) containing work risks at source by targeting systemic work risks such as
work-at-height, lifting operations and electrical work, including enhancing liaison with major works project proponents and asking them to urge their
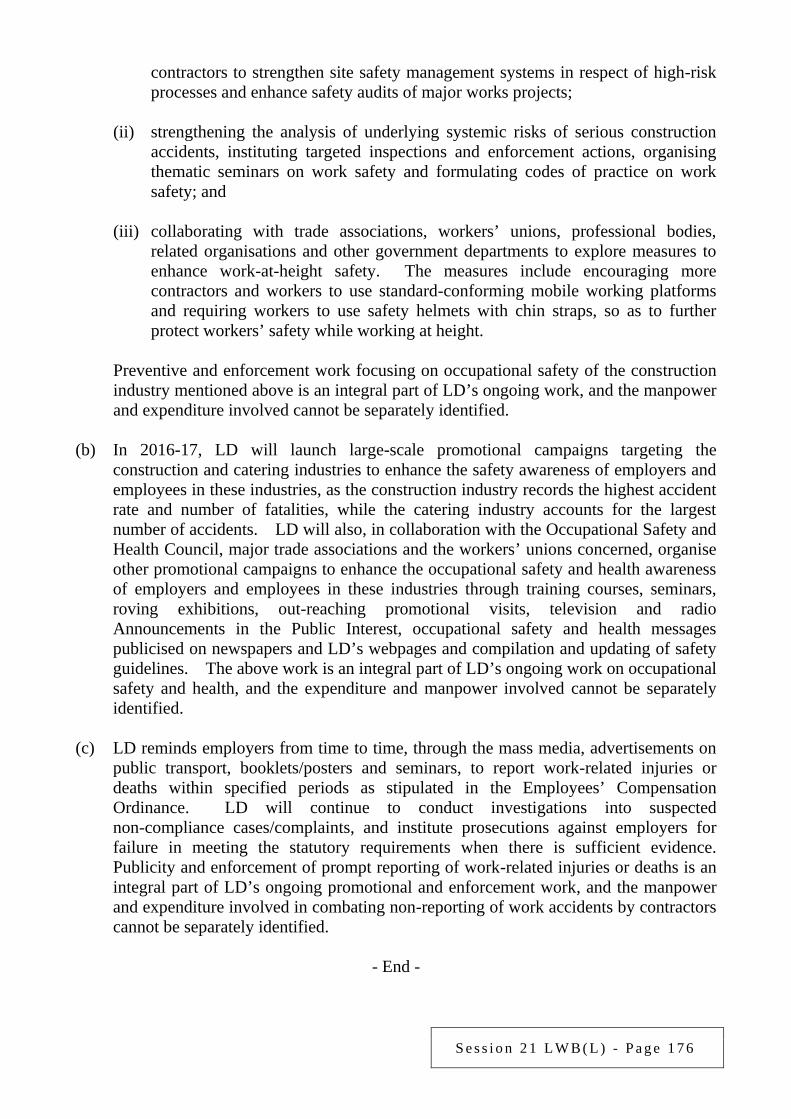
S e s s i o n 2 1 L W B ( L ) - P a g e 1 7 6
contractors to strengthen site safety management systems in respect of high-risk processes and enhance safety audits of major works projects;
(ii) strengthening the analysis of underlying systemic risks of serious construction
accidents, instituting targeted inspections and enforcement actions, organising thematic seminars on work safety and formulating codes of practice on work safety; and
(iii) collaborating with trade associations, workers’ unions, professional bodies,
related organisations and other government departments to explore measures to enhance work-at-height safety. The measures include encouraging more contractors and workers to use standard-conforming mobile working platforms and requiring workers to use safety helmets with chin straps, so as to further protect workers’ safety while working at height.
Preventive and enforcement work focusing on occupational safety of the construction
industry mentioned above is an integral part of LD’s ongoing work, and the manpower and expenditure involved cannot be separately identified.
(b) In 2016-17, LD will launch large-scale promotional campaigns targeting the
construction and catering industries to enhance the safety awareness of employers and employees in these industries, as the construction industry records the highest accident rate and number of fatalities, while the catering industry accounts for the largest number of accidents. LD will also, in collaboration with the Occupational Safety and Health Council, major trade associations and the workers’ unions concerned, organise other promotional campaigns to enhance the occupational safety and health awareness of employers and employees in these industries through training courses, seminars, roving exhibitions, out-reaching promotional visits, television and radio Announcements in the Public Interest, occupational safety and health messages publicised on newspapers and LD’s webpages and compilation and updating of safety guidelines. The above work is an integral part of LD’s ongoing work on occupational safety and health, and the expenditure and manpower involved cannot be separately identified.
(c) LD reminds employers from time to time, through the mass media, advertisements on
public transport, booklets/posters and seminars, to report work-related injuries or deaths within specified periods as stipulated in the Employees’ Compensation Ordinance. LD will continue to conduct investigations into suspected non-compliance cases/complaints, and institute prosecutions against employers for failure in meeting the statutory requirements when there is sufficient evidence. Publicity and enforcement of prompt reporting of work-related injuries or deaths is an integral part of LD’s ongoing promotional and enforcement work, and the manpower and expenditure involved in combating non-reporting of work accidents by contractors cannot be separately identified.
- End -
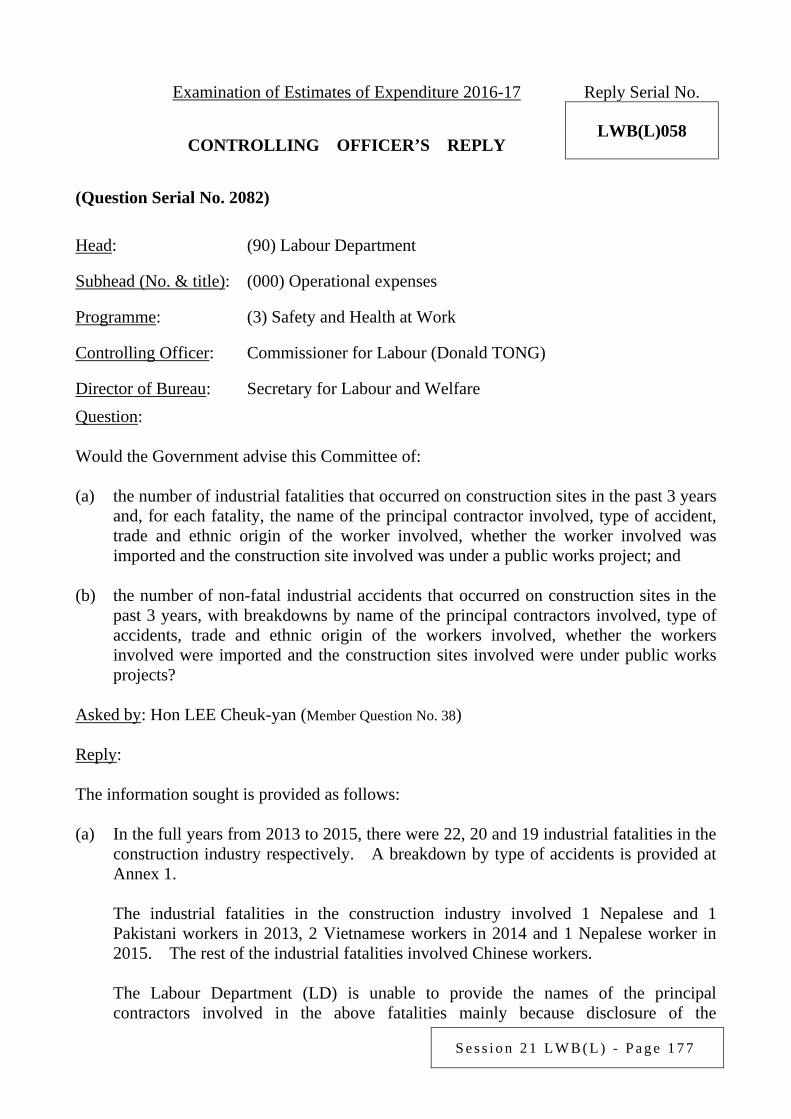
S e s s i o n 2 1 L W B ( L ) - P a g e 1 7 7
Examination of Estimates of Expenditure 2016-17 Reply Serial No.
LWB(L)058 CONTROLLING OFFICER’S REPLY (Question Serial No. 2082)
Head: (90) Labour Department
Subhead (No. & title): (000) Operational expenses
Programme: (3) Safety and Health at Work
Controlling Officer: Commissioner for Labour (Donald TONG)
Director of Bureau: Secretary for Labour and Welfare Question: Would the Government advise this Committee of: (a) the number of industrial fatalities that occurred on construction sites in the past 3 years
and, for each fatality, the name of the principal contractor involved, type of accident, trade and ethnic origin of the worker involved, whether the worker involved was imported and the construction site involved was under a public works project; and
(b) the number of non-fatal industrial accidents that occurred on construction sites in the
past 3 years, with breakdowns by name of the principal contractors involved, type of accidents, trade and ethnic origin of the workers involved, whether the workers involved were imported and the construction sites involved were under public works projects?
Asked by: Hon LEE Cheuk-yan (Member Question No. 38) Reply: The information sought is provided as follows: (a) In the full years from 2013 to 2015, there were 22, 20 and 19 industrial fatalities in the
construction industry respectively. A breakdown by type of accidents is provided at Annex 1.
The industrial fatalities in the construction industry involved 1 Nepalese and 1 Pakistani workers in 2013, 2 Vietnamese workers in 2014 and 1 Nepalese worker in 2015. The rest of the industrial fatalities involved Chinese workers.
The Labour Department (LD) is unable to provide the names of the principal contractors involved in the above fatalities mainly because disclosure of the
S e s s i o n 2 1 L W B ( L ) - P a g e 1 7 8
information will result in those who are facing or may face legal proceedings not having a chance of a fair trial.
LD does not keep breakdowns of each fatality by trade of the worker involved and whether the worker was imported.
In the full years from 2013 to 2015, there were respectively 5, 3 and 4 industrial fatalities involving public works projects.
(b) In the full years of 2013 and 2014, as well as the first 3 quarters of 2015, there were
respectively 3 210, 3 447 and 2 745 non-fatal industrial accidents in the construction industry. A breakdown by type of accidents is provided at Annex 2. LD does not keep breakdowns of each non-fatal accident by name of the principal contractor, trade and ethnic origin of the worker involved and whether the worker was imported.
In the full years of 2013 and 2014, as well as the first 3 quarters of 2015, there were respectively 183, 197 and 174 non-fatal industrial accidents involving public works projects.
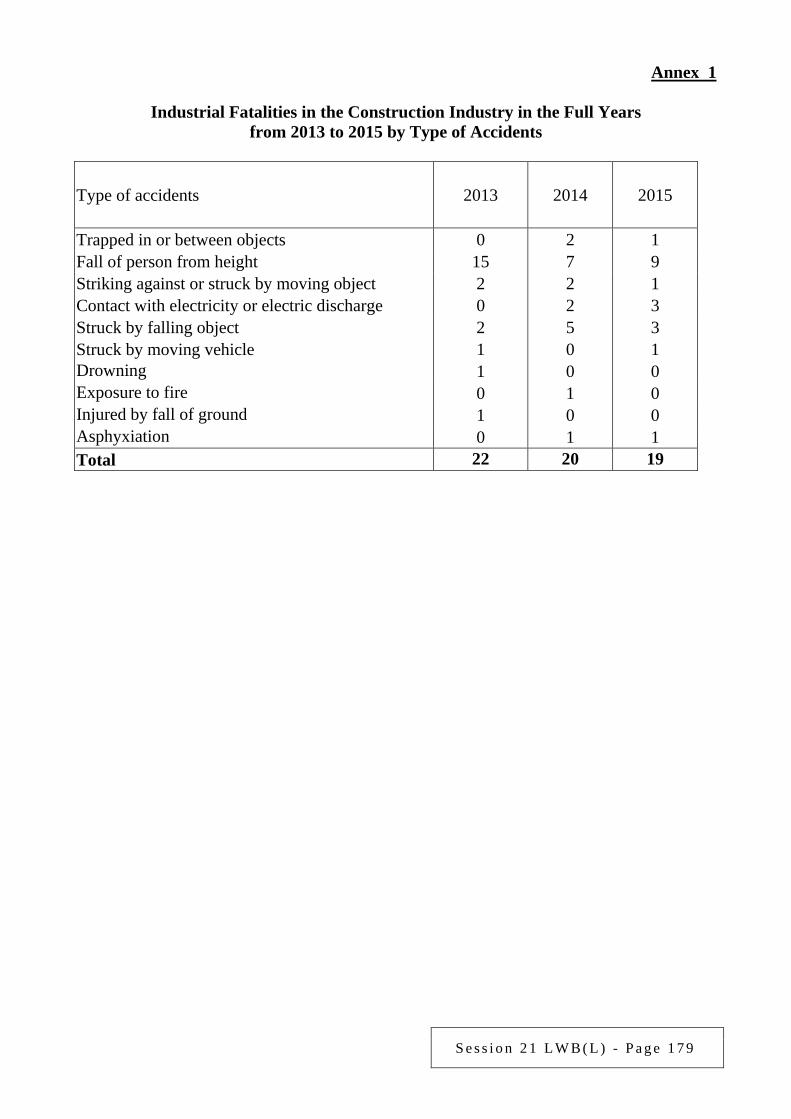
S e s s i o n 2 1 L W B ( L ) - P a g e 1 7 9
Annex 1
Industrial Fatalities in the Construction Industry in the Full Years from 2013 to 2015 by Type of Accidents
Type of accidents 2013 2014 2015
Trapped in or between objects 0 2 1 Fall of person from height 15 7 9 Striking against or struck by moving object 2 2 1 Contact with electricity or electric discharge 0 2 3 Struck by falling object 2 5 3 Struck by moving vehicle 1 0 1 Drowning 1 0 0 Exposure to fire 0 1 0 Injured by fall of ground 1 0 0 Asphyxiation 0 1 1 Total 22 20 19
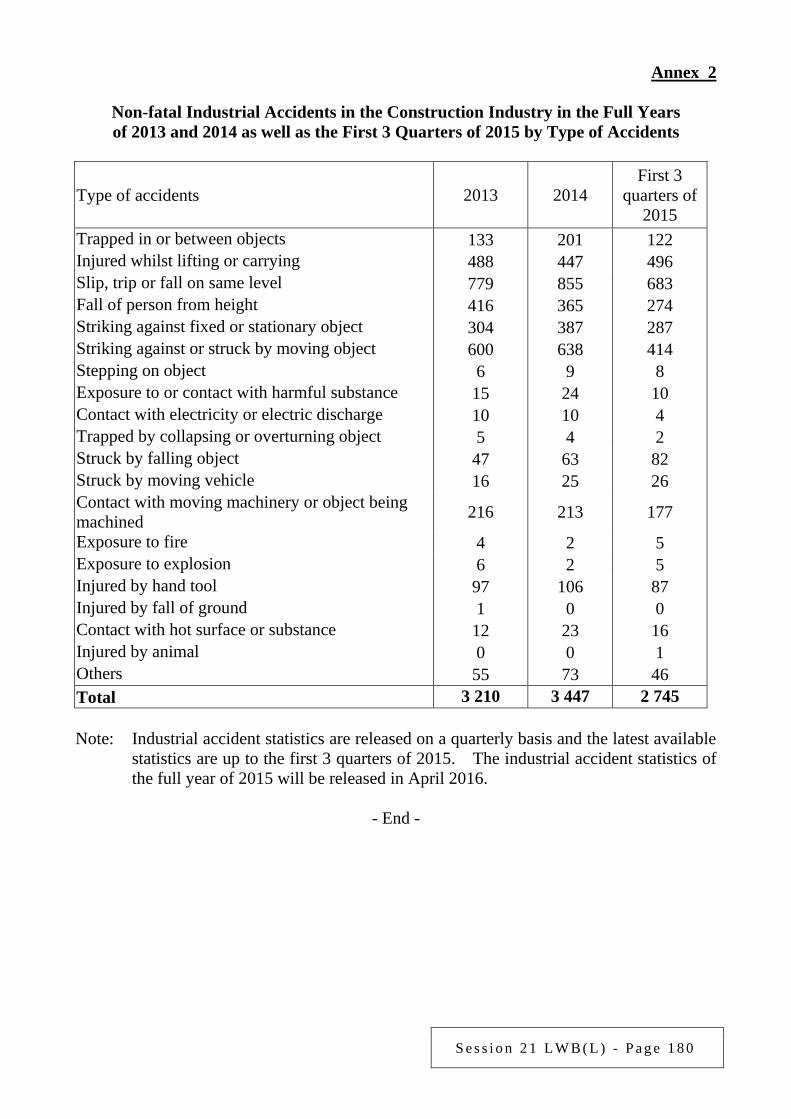
S e s s i o n 2 1 L W B ( L ) - P a g e 1 8 0
Annex 2
Non-fatal Industrial Accidents in the Construction Industry in the Full Years of 2013 and 2014 as well as the First 3 Quarters of 2015 by Type of Accidents
Type of accidents 2013 2014 First 3
quarters of 2015
Trapped in or between objects 133 201 122 Injured whilst lifting or carrying 488 447 496 Slip, trip or fall on same level 779 855 683 Fall of person from height 416 365 274 Striking against fixed or stationary object 304 387 287 Striking against or struck by moving object 600 638 414 Stepping on object 6 9 8 Exposure to or contact with harmful substance 15 24 10 Contact with electricity or electric discharge 10 10 4 Trapped by collapsing or overturning object 5 4 2 Struck by falling object 47 63 82 Struck by moving vehicle 16 25 26 Contact with moving machinery or object being machined 216 213 177
Exposure to fire 4 2 5 Exposure to explosion 6 2 5 Injured by hand tool 97 106 87 Injured by fall of ground 1 0 0 Contact with hot surface or substance 12 23 16 Injured by animal 0 0 1 Others 55 73 46 Total 3 210 3 447 2 745 Note: Industrial accident statistics are released on a quarterly basis and the latest available
statistics are up to the first 3 quarters of 2015. The industrial accident statistics of the full year of 2015 will be released in April 2016.
- End -
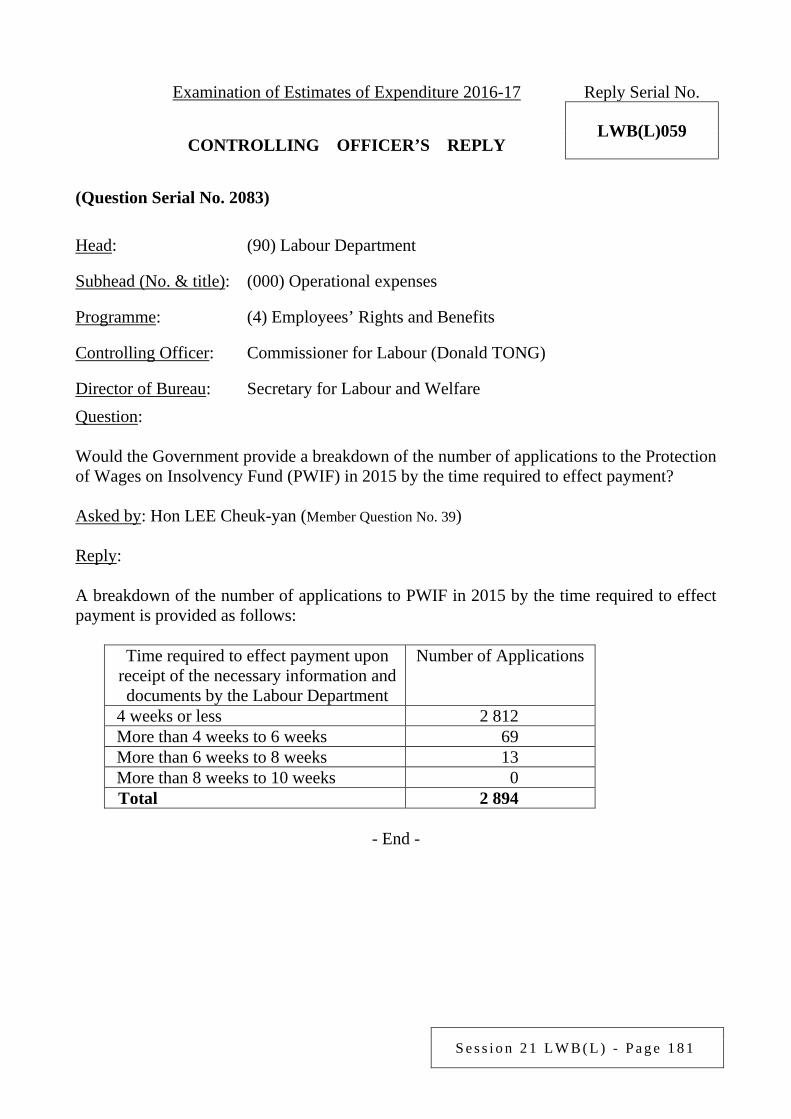
S e s s i o n 2 1 L W B ( L ) - P a g e 1 8 1
Examination of Estimates of Expenditure 2016-17 Reply Serial No.
LWB(L)059 CONTROLLING OFFICER’S REPLY (Question Serial No. 2083)
Head: (90) Labour Department
Subhead (No. & title): (000) Operational expenses
Programme: (4) Employees’ Rights and Benefits
Controlling Officer: Commissioner for Labour (Donald TONG)
Director of Bureau: Secretary for Labour and Welfare Question: Would the Government provide a breakdown of the number of applications to the Protection of Wages on Insolvency Fund (PWIF) in 2015 by the time required to effect payment? Asked by: Hon LEE Cheuk-yan (Member Question No. 39) Reply: A breakdown of the number of applications to PWIF in 2015 by the time required to effect payment is provided as follows:
Time required to effect payment upon receipt of the necessary information and documents by the Labour Department
Number of Applications
4 weeks or less 2 812 More than 4 weeks to 6 weeks 69 More than 6 weeks to 8 weeks 13 More than 8 weeks to 10 weeks 0 Total 2 894
- End -
S e s s i o n 2 1 L W B ( L ) - P a g e 1 8 2
Examination of Estimates of Expenditure 2016-17 Reply Serial No.
LWB(L)060 CONTROLLING OFFICER’S REPLY (Question Serial No. 2084)
Head: (90) Labour Department
Subhead (No. & title): (000) Operational expenses
Programme: (4) Employees’ Rights and Benefits
Controlling Officer: Commissioner for Labour (Donald TONG)
Director of Bureau: Secretary for Labour and Welfare Question: (a) Would the Government provide a breakdown of the employees’ compensation claims
processed in 2015 by industry? As at the end of 2015, how many cases were resolved? What was the amount of compensation involved?
(b) Would the Government provide a breakdown of the employees’ compensation cases
received by various branch offices of the Employees’ Compensation Division (ECD) in 2015?
Asked by: Hon LEE Cheuk-yan (Member Question No. 40) Reply: The information sought is provided as follows: (a) In 2015, the Labour Department (LD) processed a total of 51 917 employees’
compensation claims reported under the Employees’ Compensation Ordinance. Of these, 14 994 cases involved incapacitation of employees for not more than 3 days with no permanent incapacity. As the employers made direct payment of compensation to the employees in these cases, LD does not keep a breakdown of such claims by industry. For the remaining 36 923 cases, a breakdown by industry is provided below:
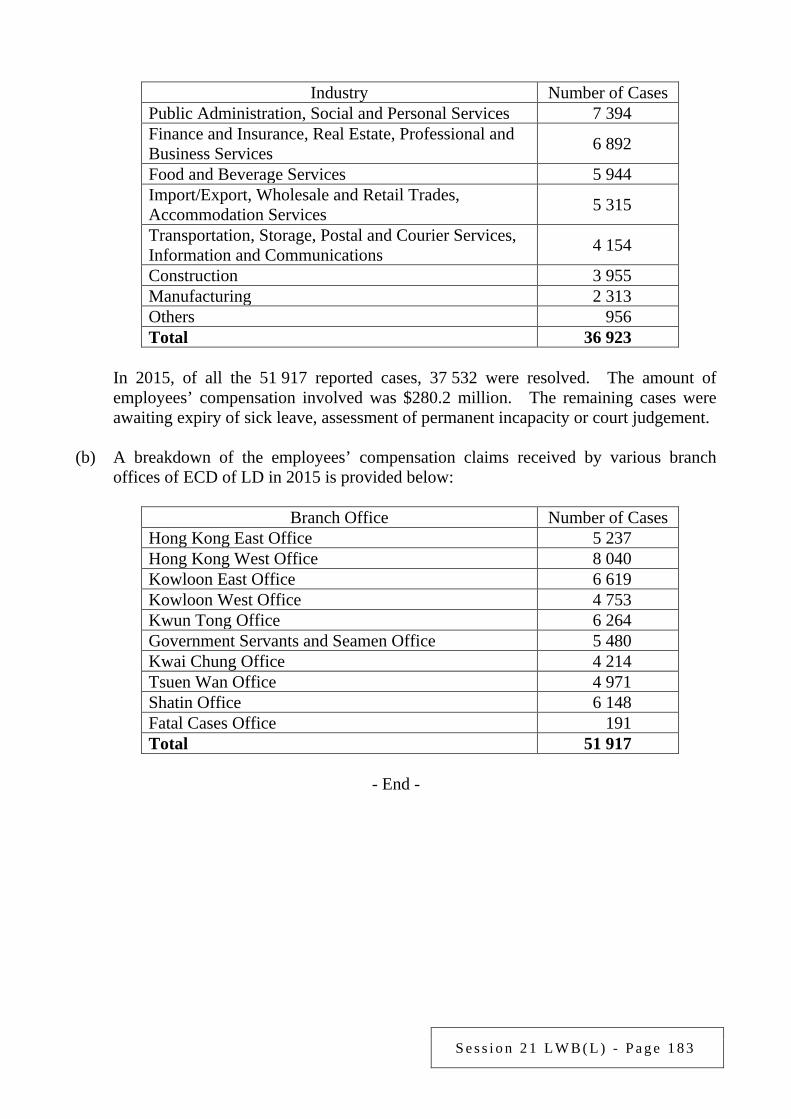
S e s s i o n 2 1 L W B ( L ) - P a g e 1 8 3
Industry Number of Cases
Public Administration, Social and Personal Services 7 394 Finance and Insurance, Real Estate, Professional and Business Services 6 892
Food and Beverage Services 5 944 Import/Export, Wholesale and Retail Trades, Accommodation Services 5 315
Transportation, Storage, Postal and Courier Services, Information and Communications 4 154
Construction 3 955 Manufacturing 2 313 Others 956 Total 36 923
In 2015, of all the 51 917 reported cases, 37 532 were resolved. The amount of employees’ compensation involved was $280.2 million. The remaining cases were awaiting expiry of sick leave, assessment of permanent incapacity or court judgement.
(b) A breakdown of the employees’ compensation claims received by various branch
offices of ECD of LD in 2015 is provided below:
Branch Office Number of Cases Hong Kong East Office 5 237 Hong Kong West Office 8 040 Kowloon East Office 6 619 Kowloon West Office 4 753 Kwun Tong Office 6 264 Government Servants and Seamen Office 5 480 Kwai Chung Office 4 214 Tsuen Wan Office 4 971 Shatin Office 6 148 Fatal Cases Office 191 Total 51 917
- End -
S e s s i o n 2 1 L W B ( L ) - P a g e 1 8 4
Examination of Estimates of Expenditure 2016-17 Reply Serial No.
LWB(L)061 CONTROLLING OFFICER’S REPLY (Question Serial No. 2085)
Head: (90) Labour Department
Subhead (No. & title): (000) Operational expenses
Programme: (4) Employees’ Rights and Benefits
Controlling Officer: Commissioner for Labour (Donald TONG)
Director of Bureau: Secretary for Labour and Welfare Question: Regarding Programme (4) Employees’ Rights and Benefits, would the Government provide: (a) breakdowns by industry and reason of the prosecutions taken out by the Labour
Department (LD) under this Programme in 2015 and, among which, the number of cases involving violation of the Statutory Minimum Wage (SMW) requirement;
(b) details of the convictions and penalties. Asked by: Hon LEE Cheuk-yan (Member Question No. 41) Reply: The information sought is provided as follows: (a) In 2015, a total of 1 903 prosecutions were taken out by LD and there were 1 609
convictions. A breakdown by industry is provided in the following table:
Industry 2015
No. of Prosecutions
No. of Convictions
Catering 208 192 Manufacturing 60 56 Construction 124 102 Import/Export Trade 221 170 Wholesale/Retail Trade 281 267 Hotels 4 2 Transport, Storage and Communications 316 289 Finance, Insurance, Real Estate and Business Services 456 338
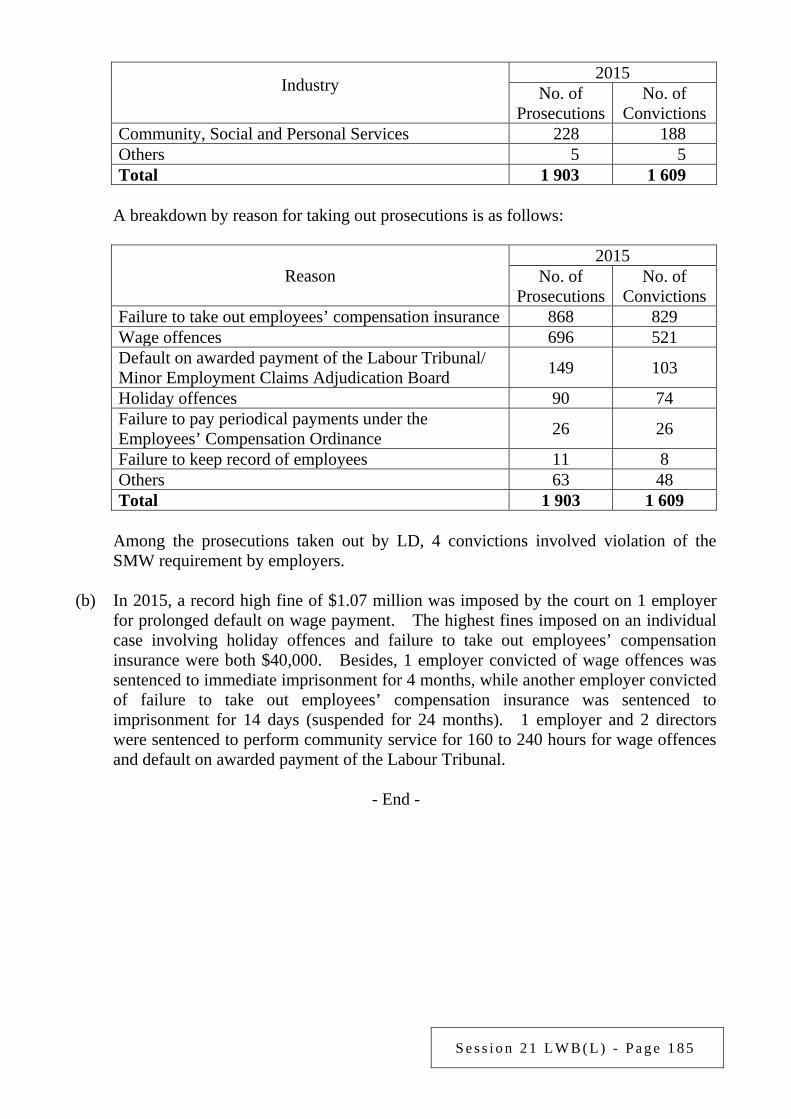
S e s s i o n 2 1 L W B ( L ) - P a g e 1 8 5
Industry 2015
No. of Prosecutions
No. of Convictions
Community, Social and Personal Services 228 188 Others 5 5 Total 1 903 1 609
A breakdown by reason for taking out prosecutions is as follows:
Reason 2015
No. of Prosecutions
No. of Convictions
Failure to take out employees’ compensation insurance 868 829 Wage offences 696 521 Default on awarded payment of the Labour Tribunal/ Minor Employment Claims Adjudication Board 149 103
Holiday offences 90 74 Failure to pay periodical payments under the Employees’ Compensation Ordinance 26 26
Failure to keep record of employees 11 8 Others 63 48 Total 1 903 1 609
Among the prosecutions taken out by LD, 4 convictions involved violation of the SMW requirement by employers.
(b) In 2015, a record high fine of $1.07 million was imposed by the court on 1 employer
for prolonged default on wage payment. The highest fines imposed on an individual case involving holiday offences and failure to take out employees’ compensation insurance were both $40,000. Besides, 1 employer convicted of wage offences was sentenced to immediate imprisonment for 4 months, while another employer convicted of failure to take out employees’ compensation insurance was sentenced to imprisonment for 14 days (suspended for 24 months). 1 employer and 2 directors were sentenced to perform community service for 160 to 240 hours for wage offences and default on awarded payment of the Labour Tribunal.
- End -
S e s s i o n 2 1 L W B ( L ) - P a g e 1 8 6
Examination of Estimates of Expenditure 2016-17 Reply Serial No.
LWB(L)062 CONTROLLING OFFICER’S REPLY (Question Serial No. 2874)
Head: (90) Labour Department
Subhead (No. & title): (000) Operational expenses
Programme: (1) Labour Relations
Controlling Officer: Commissioner for Labour (Donald TONG)
Director of Bureau: Secretary for Labour and Welfare Question: Article 4 of the International Labour Convention (ILC) No. 98 stipulates that necessary measures shall be taken to encourage and promote the determination of terms and conditions of employment by means of collective agreements between employers (or employers’ associations) and workers’ organisations. In this regard, would the Government advise this Committee of the following: (a) What measures did the Government take in 2015-16 to encourage and promote the use
of collective agreements (excluding negotiation between an employer and individual employees)? What was the expenditure involved?
(b) What measures does the Government plan to take in 2016-17 to encourage and
promote the use of collective agreements (excluding negotiation between an employer and individual employees)? What is the expenditure involved?
(c) Is the Government aware of the current application of collective agreements in Hong
Kong, including the employers (or employers’ associations) that have entered into collective agreements with workers’ organisations, the number of workers covered by the agreements, whether the agreements are legally binding and whether any terms of collective agreements have been incorporated into individual employment contracts? If not, will such information be collected systematically so that the public can assess the effectiveness of the Government’s implementation of Article 4 of ILC No. 98?
Asked by: Hon LEE Cheuk-yan (Member Question No. 26) Reply: The information sought is provided as follows:
S e s s i o n 2 1 L W B ( L ) - P a g e 1 8 7
(a) The Labour Department (LD) is committed to promoting voluntary and direct negotiation between employers and employees or their organisations. In 2015-16, LD continued to promote employer-employee communication and dialogue to human resources managers and corporate executives through 18 Human Resources Managers’ Clubs covering various trades and industries, so as to encourage enhancement of communication and constructive interaction between employers and employees or their organisations at enterprise level, with a view to fostering an environment conducive to, and cultivate an appreciation of the merits of, voluntary and direct negotiation. Furthermore, LD promoted workplace consultation among different enterprises through newsletters of the Human Resources Managers’ Clubs. LD also arranged a sharing session and organisation visit for representatives of trade associations, employers and workers’ unions of various industries to enhance communication and understanding among the parties concerned at industry level. The above activities formed an integral part of LD’s efforts in promoting harmonious labour relations, and the expenditure involved could not be separately identified.
(b) In 2016-17, LD will continue to organise various promotional activities such as talks
and sharing sessions to encourage employers and human resources practitioners to adopt good people management practices and maintain effective communication with their employees or employees’ organisations at enterprise level. At industry level, LD will also continue to strengthen cooperation and promote effective communication and dialogue amongst employers, employers’ associations and workers’ unions through 9 industry-based Tripartite Committees. The expenditure involved in these activities cannot be separately identified.
(c) As with employment contracts signed between employers and individual employees,
employers and employees or their organisations are not required by law to notify the Government of and provide information on the collective agreements that they have entered into. As such, the Government does not keep information on the number of collective agreements reached and the number of employees covered. As far as LD understands, some employers in trades like printing, construction, public buses, air transport, pig-slaughtering, elevator maintenance, food and beverage processing, etc. have signed agreements with employees or their organisations on issues related to the terms and conditions of employment. Collective agreements will be legally binding on both parties if the terms of the agreements are incorporated into individual employment contracts. In LD’s experience, it is common for the terms of the collective agreements reached at industry or enterprise level to form part of the terms of employment of the employees covered by the agreements.
- End -
S e s s i o n 2 1 L W B ( L ) - P a g e 1 8 8
Examination of Estimates of Expenditure 2016-17 Reply Serial No.
LWB(L)063 CONTROLLING OFFICER’S REPLY (Question Serial No. 0666)
Head: (90) Labour Department
Subhead (No. & title): ( )
Programme: (2) Employment Services
Controlling Officer: Commissioner for Labour (Donald TONG)
Director of Bureau: Secretary for Labour and Welfare Question: According to Government statistics, the unemployment rate of young people in Hong Kong has been 2 to 3 times higher than the overall unemployment rate over a long period of time, showing that young people in Hong Kong are facing quite acute employment difficulties. In this connection, would the Government advise this Committee: (a) of the measures taken to support the employment of young people and the related
expenditure in the past 3 years; (b) whether it will provide direct subsidies for the employment of young people in order to
provide more career choices for our younger generation to realise their potential, including stepping up sectoral publicity, enhancing training, and providing, among other things, cash incentive to encourage young people to join the workforce. If yes, what are the details? If not, what are the reasons?
Asked by: Dr Hon Priscilla LEUNG Mei-fun (Member Question No. 44) Reply: (a) Young people in many places, including Hong Kong, may encounter greater
difficulties in securing employment because they may not be as competitive in terms of educational attainment, training, work experience and job search skills. To help young people in Hong Kong secure employment, the Labour Department (LD) implements the Youth Employment and Training Programme (YETP) which provides comprehensive pre-employment and on-the-job training opportunities for young school leavers aged 15 to 24 with educational attainment at sub-degree level or below to enhance their employability and employment opportunities. Under YETP, customised career guidance and employment support services offered by professional social workers, pre-employment training, workplace attachment, on-the-job training and reimbursement of course and examination fees are provided to young people. In
S e s s i o n 2 1 L W B ( L ) - P a g e 1 8 9
2013-14 and 2014-15, the actual expenditures for implementing YETP were $66.4 million and $79.8 million respectively. In 2015-16, the estimated expenditure is $77.1 million.
(b) To encourage employers to provide young people with more employment
opportunities, employers who engage young people and offer them on-the-job training under YETP are entitled to a maximum monthly training allowance of $3,000 for 6 to 12 months per trainee engaged. Moreover, to encourage young people to participate in training and workplace attachment training, trainees who complete the training courses under YETP are entitled to a training allowance of $50 per day while trainees who complete the one-month attachment training are entitled to an allowance of $3,000. Over the on-the-job training period, trainees can apply for off-the-job vocational training allowance of up to $4,000.
Tailor-made training-cum-employment projects, organised in collaboration with
employers and training bodies, are one of the core services of YETP. Arrangements will be made for the trainees who have completed the specially designed pre-employment training to undergo on-the-job training offered by participating employers. These projects offer vacancies in various industries and meet the diversified needs and interests of young people. In 2014 and 2015, LD enhanced its collaboration with employers and various organisations under YETP and launched a number of pilot employment projects for industries such as retail, customer service, information technology, banking and hospitality. These projects are targeted at industries with recruitment needs, or cater to the employment needs of specific youth groups so as to enhance the employability and employment opportunities of young people with different backgrounds. At present, around 7 000 young people benefit from YETP each year. LD will continue to strengthen its promotional activities on all fronts with a view to canvassing more vacancies for organising more value-added projects and programmes for young people.
- End -
S e s s i o n 2 1 L W B ( L ) - P a g e 1 9 0
Examination of Estimates of Expenditure 2016-17 Reply Serial No.
LWB(L)064 CONTROLLING OFFICER’S REPLY (Question Serial No. 0754)
Head: (90) Labour Department
Subhead (No. & title): ( )
Programme: (1) Labour Relations (4) Employees’ Rights and Benefits
Controlling Officer: Commissioner for Labour (Donald TONG)
Director of Bureau: Secretary for Labour and Welfare Question: Please provide the work details, expenditure involved, number of beneficiaries, manpower and effectiveness in respect of the following areas of work of the Labour Department (LD) in each of the past 5 years, with breakdowns by year: (a) Work Incentive Transport Subsidy (WITS) Scheme (by household size); (b) Standard Working Hours (SWH) Committee; (c) processing employees’ compensation claims (by category of claims); and (d) combating wage offences. Asked by: Hon LEUNG Yiu-chung (Member Question No. 26) Reply: The information sought is provided as follows: (a) The WITS Scheme started receiving applications from October 2011 to help
low-income earners reduce their cost of travelling to and from work and encourage them to secure or stay in employment. Applicants may choose to apply for the subsidy on an individual or household basis since 2013. The annual expenditure and staff establishment (including civil service posts and non-civil service contract positions) for the WITS Scheme from 2011-12 onwards are provided below:
2011-12 2012-13 2013-14 2014-15 2015-16
Expenditure ($ million) 133.0 267.8 406.4 442.9
426.7 (revised estimate)
Staff establishment 298 298 328 328 328
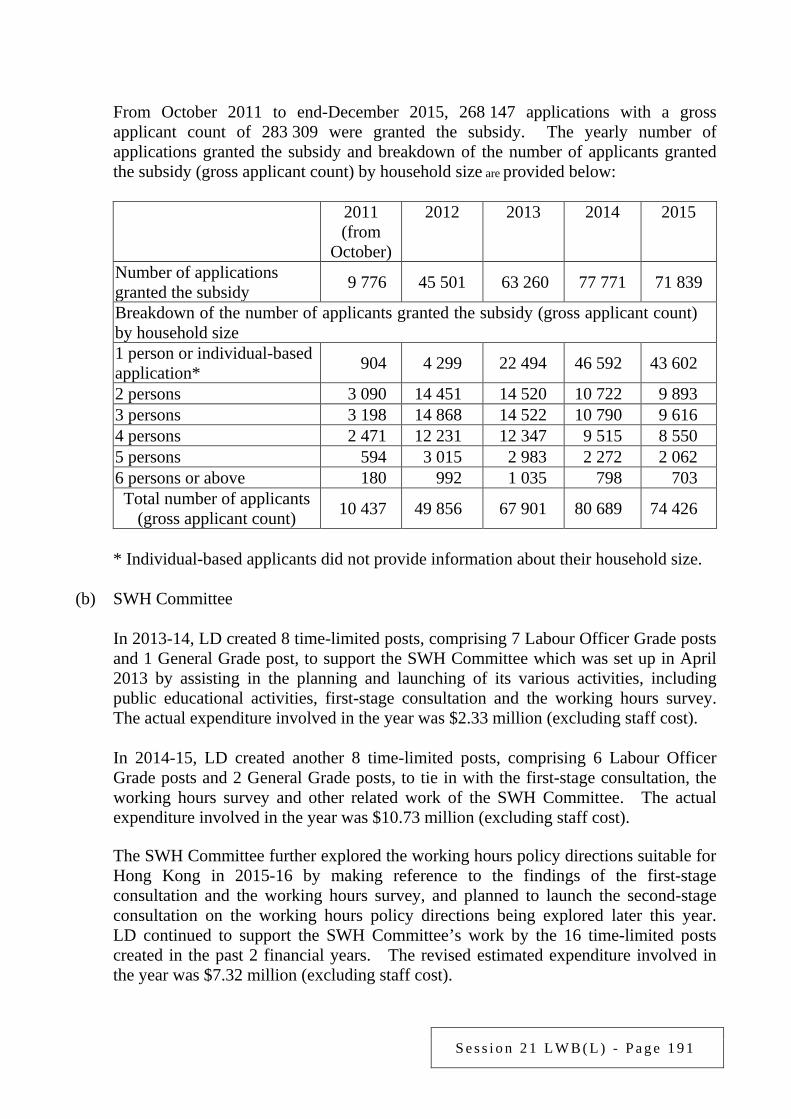
S e s s i o n 2 1 L W B ( L ) - P a g e 1 9 1
From October 2011 to end-December 2015, 268 147 applications with a gross applicant count of 283 309 were granted the subsidy. The yearly number of applications granted the subsidy and breakdown of the number of applicants granted the subsidy (gross applicant count) by household size are provided below:
2011 (from
October)
2012 2013 2014 2015
Number of applications granted the subsidy 9 776 45 501 63 260 77 771 71 839
Breakdown of the number of applicants granted the subsidy (gross applicant count) by household size 1 person or individual-based application* 904 4 299 22 494 46 592 43 602
2 persons 3 090 14 451 14 520 10 722 9 893 3 persons 3 198 14 868 14 522 10 790 9 616 4 persons 2 471 12 231 12 347 9 515 8 550 5 persons 594 3 015 2 983 2 272 2 062 6 persons or above 180 992 1 035 798 703 Total number of applicants
(gross applicant count) 10 437 49 856 67 901 80 689 74 426
* Individual-based applicants did not provide information about their household size. (b) SWH Committee
In 2013-14, LD created 8 time-limited posts, comprising 7 Labour Officer Grade posts and 1 General Grade post, to support the SWH Committee which was set up in April 2013 by assisting in the planning and launching of its various activities, including public educational activities, first-stage consultation and the working hours survey. The actual expenditure involved in the year was $2.33 million (excluding staff cost).
In 2014-15, LD created another 8 time-limited posts, comprising 6 Labour Officer Grade posts and 2 General Grade posts, to tie in with the first-stage consultation, the working hours survey and other related work of the SWH Committee. The actual expenditure involved in the year was $10.73 million (excluding staff cost).
The SWH Committee further explored the working hours policy directions suitable for Hong Kong in 2015-16 by making reference to the findings of the first-stage consultation and the working hours survey, and planned to launch the second-stage consultation on the working hours policy directions being explored later this year. LD continued to support the SWH Committee’s work by the 16 time-limited posts created in the past 2 financial years. The revised estimated expenditure involved in the year was $7.32 million (excluding staff cost).
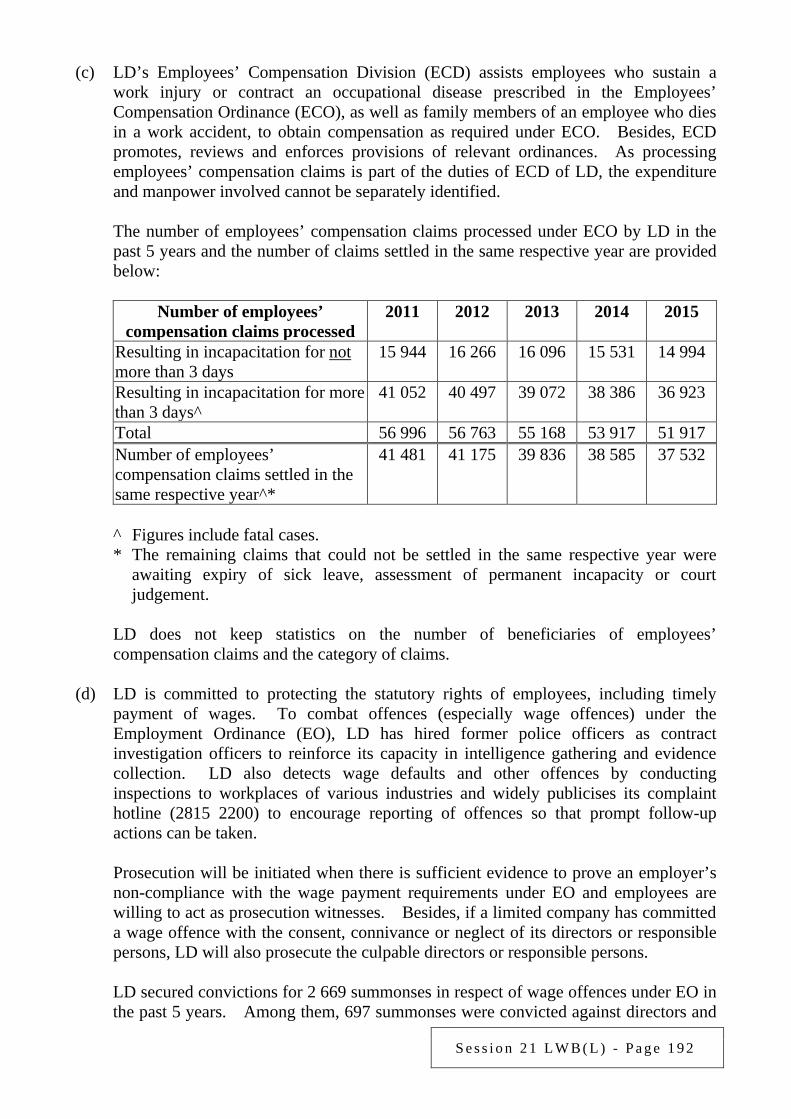
S e s s i o n 2 1 L W B ( L ) - P a g e 1 9 2
(c) LD’s Employees’ Compensation Division (ECD) assists employees who sustain a work injury or contract an occupational disease prescribed in the Employees’ Compensation Ordinance (ECO), as well as family members of an employee who dies in a work accident, to obtain compensation as required under ECO. Besides, ECD promotes, reviews and enforces provisions of relevant ordinances. As processing employees’ compensation claims is part of the duties of ECD of LD, the expenditure and manpower involved cannot be separately identified.
The number of employees’ compensation claims processed under ECO by LD in the past 5 years and the number of claims settled in the same respective year are provided below:
Number of employees’
compensation claims processed 2011 2012 2013 2014 2015
Resulting in incapacitation for not more than 3 days
15 944 16 266 16 096 15 531 14 994
Resulting in incapacitation for more than 3 days^
41 052 40 497 39 072 38 386 36 923
Total 56 996 56 763 55 168 53 917 51 917 Number of employees’ compensation claims settled in the same respective year^*
41 481 41 175 39 836 38 585 37 532
^ Figures include fatal cases. * The remaining claims that could not be settled in the same respective year were
awaiting expiry of sick leave, assessment of permanent incapacity or court judgement.
LD does not keep statistics on the number of beneficiaries of employees’ compensation claims and the category of claims.
(d) LD is committed to protecting the statutory rights of employees, including timely
payment of wages. To combat offences (especially wage offences) under the Employment Ordinance (EO), LD has hired former police officers as contract investigation officers to reinforce its capacity in intelligence gathering and evidence collection. LD also detects wage defaults and other offences by conducting inspections to workplaces of various industries and widely publicises its complaint hotline (2815 2200) to encourage reporting of offences so that prompt follow-up actions can be taken.
Prosecution will be initiated when there is sufficient evidence to prove an employer’s
non-compliance with the wage payment requirements under EO and employees are willing to act as prosecution witnesses. Besides, if a limited company has committed a wage offence with the consent, connivance or neglect of its directors or responsible persons, LD will also prosecute the culpable directors or responsible persons.
LD secured convictions for 2 669 summonses in respect of wage offences under EO in the past 5 years. Among them, 697 summonses were convicted against directors and
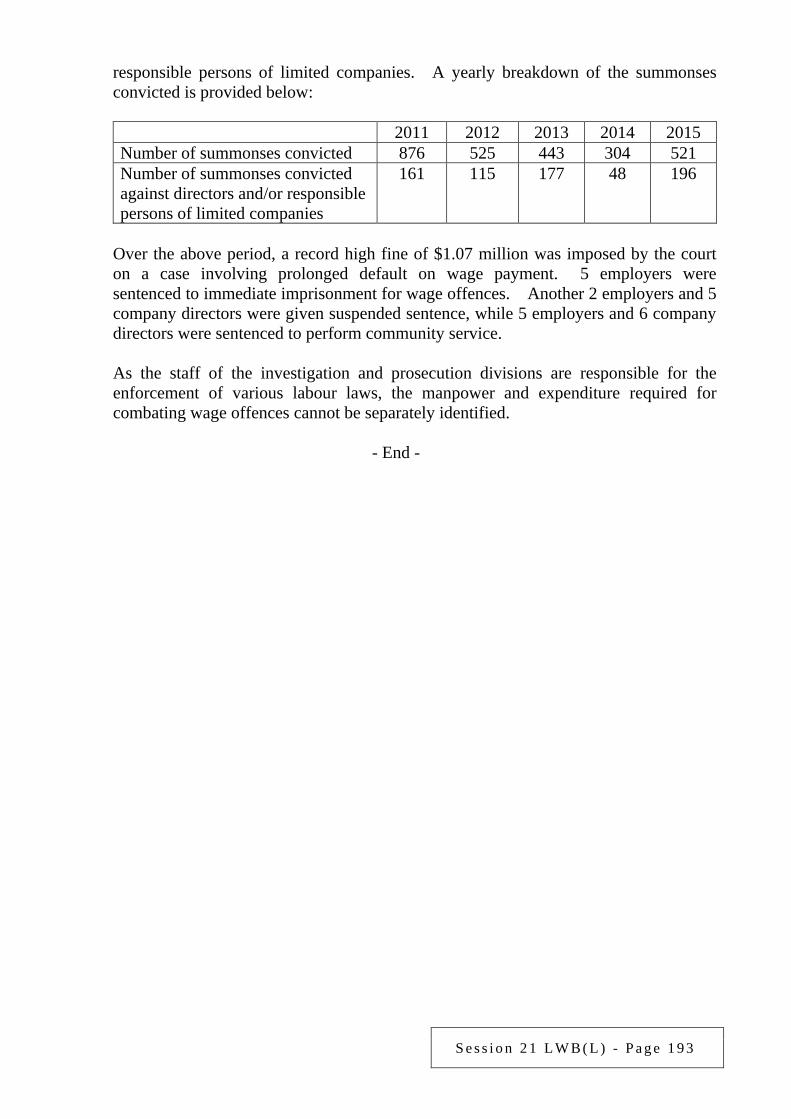
S e s s i o n 2 1 L W B ( L ) - P a g e 1 9 3
responsible persons of limited companies. A yearly breakdown of the summonses convicted is provided below:
2011 2012 2013 2014 2015 Number of summonses convicted 876 525 443 304 521 Number of summonses convicted against directors and/or responsible persons of limited companies
161 115 177 48 196
Over the above period, a record high fine of $1.07 million was imposed by the court on a case involving prolonged default on wage payment. 5 employers were sentenced to immediate imprisonment for wage offences. Another 2 employers and 5 company directors were given suspended sentence, while 5 employers and 6 company directors were sentenced to perform community service.
As the staff of the investigation and prosecution divisions are responsible for the enforcement of various labour laws, the manpower and expenditure required for combating wage offences cannot be separately identified.
- End -
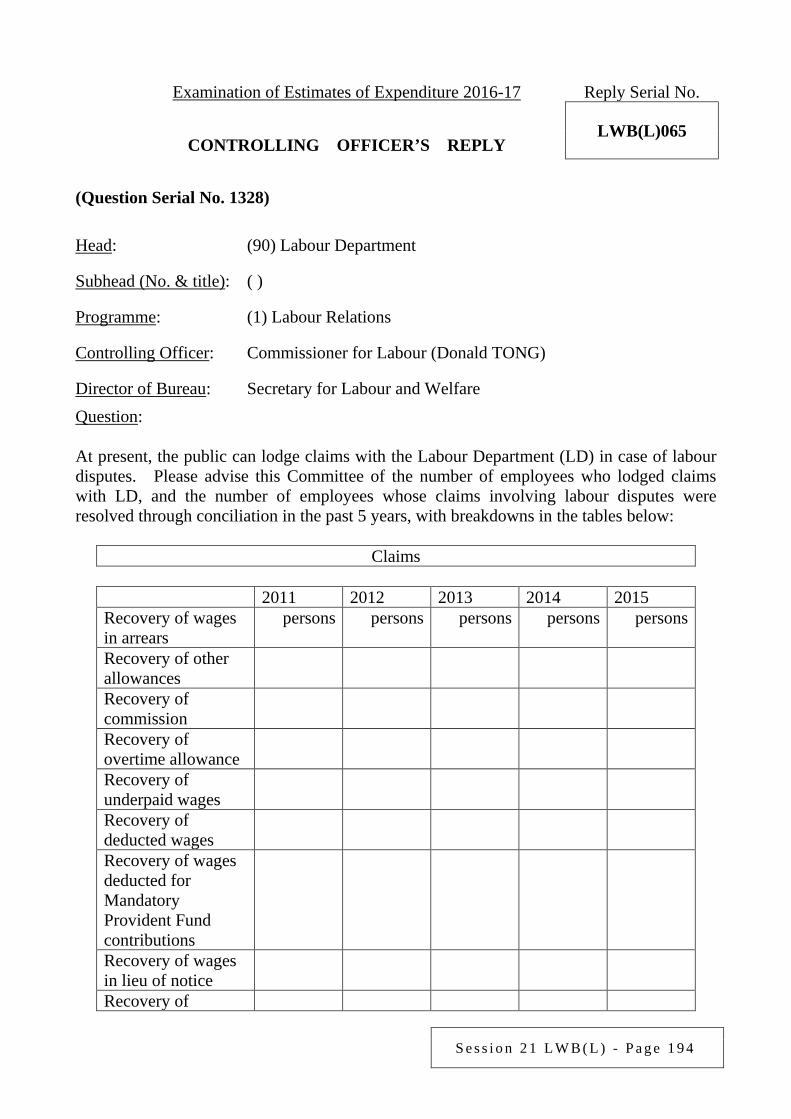
S e s s i o n 2 1 L W B ( L ) - P a g e 1 9 4
Examination of Estimates of Expenditure 2016-17 Reply Serial No.
LWB(L)065 CONTROLLING OFFICER’S REPLY (Question Serial No. 1328)
Head: (90) Labour Department
Subhead (No. & title): ( )
Programme: (1) Labour Relations
Controlling Officer: Commissioner for Labour (Donald TONG)
Director of Bureau: Secretary for Labour and Welfare Question: At present, the public can lodge claims with the Labour Department (LD) in case of labour disputes. Please advise this Committee of the number of employees who lodged claims with LD, and the number of employees whose claims involving labour disputes were resolved through conciliation in the past 5 years, with breakdowns in the tables below:
Claims
2011 2012 2013 2014 2015 Recovery of wages in arrears
persons persons persons persons persons
Recovery of other allowances
Recovery of commission
Recovery of overtime allowance
Recovery of underpaid wages
Recovery of deducted wages
Recovery of wages deducted for Mandatory Provident Fund contributions
Recovery of wages in lieu of notice
Recovery of
S e s s i o n 2 1 L W B ( L ) - P a g e 1 9 5
2011 2012 2013 2014 2015 statutory holiday pay Recovery of annual leave pay
Recovery of rest day pay
Recovery of severance payment/long service payment
Recovery of end of year payment
Recovery of sickness allowance
Recovery of maternity leave pay
Recovery of compensation under s.32P
Claims resolved through conciliation
2011 2012 2013 2014 2015 Recovery of wages in arrears
persons persons persons persons persons
Recovery of other allowances
Recovery of commission
Recovery of overtime allowance
Recovery of underpaid wages
Recovery of deducted wages
Recovery of wages deducted for Mandatory Provident Fund contributions
Recovery of wages in lieu of notice
Recovery of statutory holiday pay
Recovery of annual
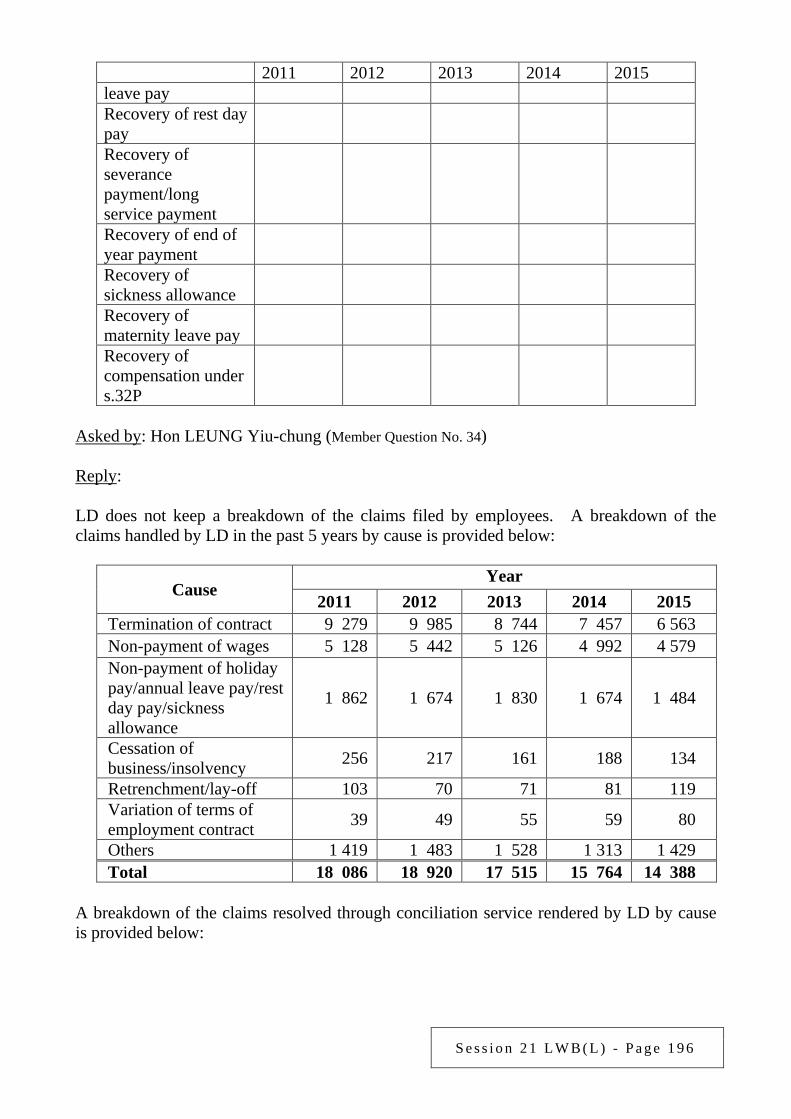
S e s s i o n 2 1 L W B ( L ) - P a g e 1 9 6
2011 2012 2013 2014 2015 leave pay Recovery of rest day pay
Recovery of severance payment/long service payment
Recovery of end of year payment
Recovery of sickness allowance
Recovery of maternity leave pay
Recovery of compensation under s.32P
Asked by: Hon LEUNG Yiu-chung (Member Question No. 34) Reply: LD does not keep a breakdown of the claims filed by employees. A breakdown of the claims handled by LD in the past 5 years by cause is provided below:
Cause Year
2011 2012 2013 2014 2015 Termination of contract 9 279 9 985 8 744 7 457 6 563 Non-payment of wages 5 128 5 442 5 126 4 992 4 579 Non-payment of holiday pay/annual leave pay/rest day pay/sickness allowance
1 862 1 674 1 830 1 674 1 484
Cessation of business/insolvency 256 217 161 188 134
Retrenchment/lay-off 103 70 71 81 119 Variation of terms of employment contract 39 49 55 59 80
Others 1 419 1 483 1 528 1 313 1 429 Total 18 086 18 920 17 515 15 764 14 388
A breakdown of the claims resolved through conciliation service rendered by LD by cause is provided below:
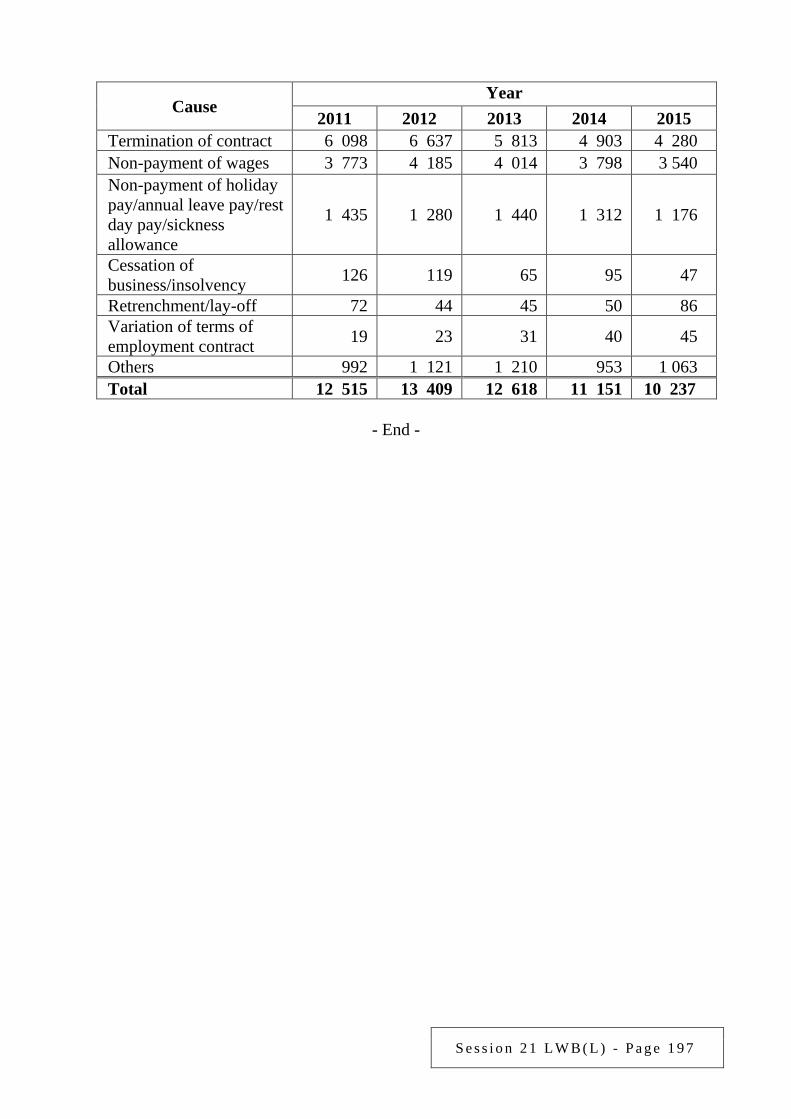
S e s s i o n 2 1 L W B ( L ) - P a g e 1 9 7
Cause Year
2011 2012 2013 2014 2015 Termination of contract 6 098 6 637 5 813 4 903 4 280 Non-payment of wages 3 773 4 185 4 014 3 798 3 540 Non-payment of holiday pay/annual leave pay/rest day pay/sickness allowance
1 435 1 280 1 440 1 312 1 176
Cessation of business/insolvency 126 119 65 95 47
Retrenchment/lay-off 72 44 45 50 86 Variation of terms of employment contract 19 23 31 40 45
Others 992 1 121 1 210 953 1 063 Total 12 515 13 409 12 618 11 151 10 237
- End -
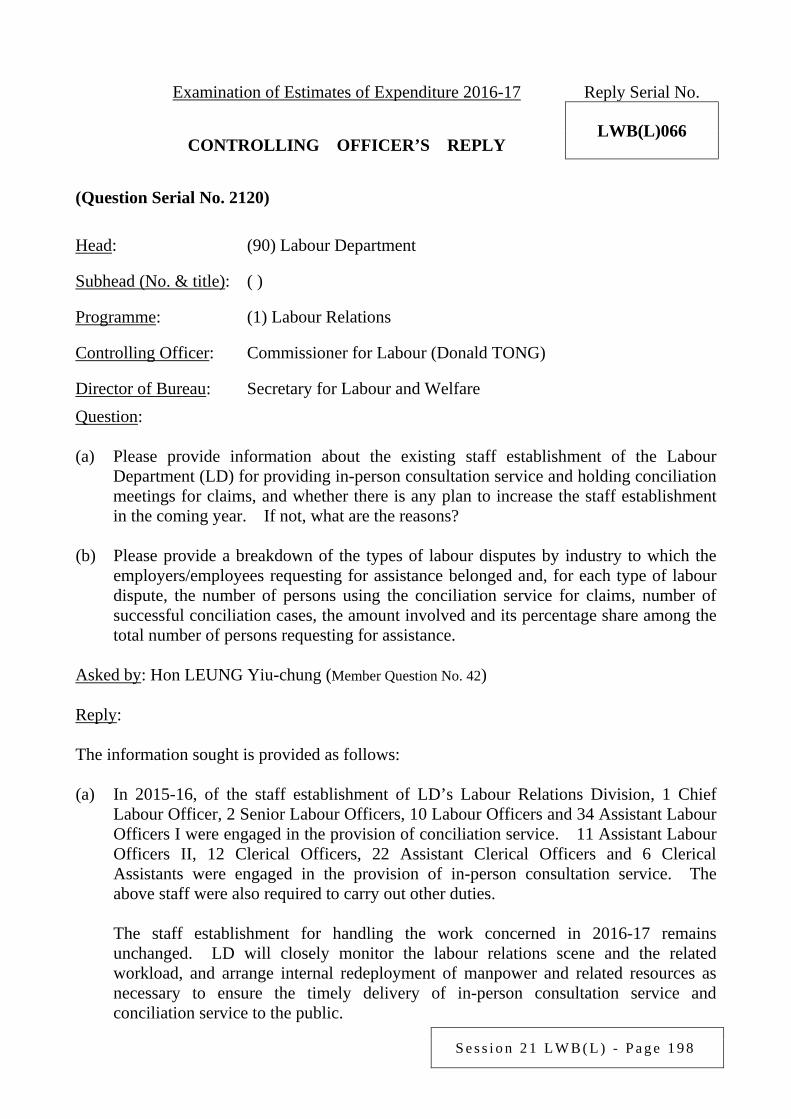
S e s s i o n 2 1 L W B ( L ) - P a g e 1 9 8
Examination of Estimates of Expenditure 2016-17 Reply Serial No.
LWB(L)066 CONTROLLING OFFICER’S REPLY (Question Serial No. 2120)
Head: (90) Labour Department
Subhead (No. & title): ( )
Programme: (1) Labour Relations
Controlling Officer: Commissioner for Labour (Donald TONG)
Director of Bureau: Secretary for Labour and Welfare Question: (a) Please provide information about the existing staff establishment of the Labour
Department (LD) for providing in-person consultation service and holding conciliation meetings for claims, and whether there is any plan to increase the staff establishment in the coming year. If not, what are the reasons?
(b) Please provide a breakdown of the types of labour disputes by industry to which the
employers/employees requesting for assistance belonged and, for each type of labour dispute, the number of persons using the conciliation service for claims, number of successful conciliation cases, the amount involved and its percentage share among the total number of persons requesting for assistance.
Asked by: Hon LEUNG Yiu-chung (Member Question No. 42) Reply: The information sought is provided as follows: (a) In 2015-16, of the staff establishment of LD’s Labour Relations Division, 1 Chief
Labour Officer, 2 Senior Labour Officers, 10 Labour Officers and 34 Assistant Labour Officers I were engaged in the provision of conciliation service. 11 Assistant Labour Officers II, 12 Clerical Officers, 22 Assistant Clerical Officers and 6 Clerical Assistants were engaged in the provision of in-person consultation service. The above staff were also required to carry out other duties.
The staff establishment for handling the work concerned in 2016-17 remains
unchanged. LD will closely monitor the labour relations scene and the related workload, and arrange internal redeployment of manpower and related resources as necessary to ensure the timely delivery of in-person consultation service and conciliation service to the public.
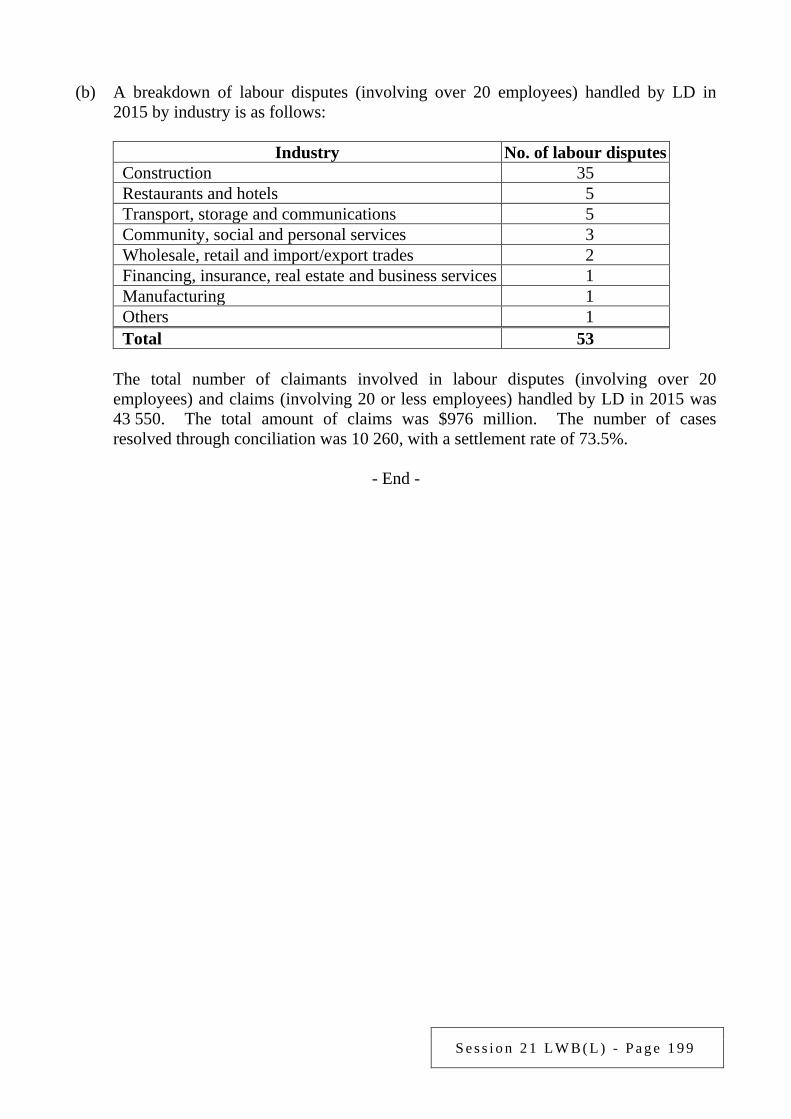
S e s s i o n 2 1 L W B ( L ) - P a g e 1 9 9
(b) A breakdown of labour disputes (involving over 20 employees) handled by LD in
2015 by industry is as follows:
Industry No. of labour disputes Construction 35 Restaurants and hotels 5 Transport, storage and communications 5 Community, social and personal services 3 Wholesale, retail and import/export trades 2 Financing, insurance, real estate and business services 1 Manufacturing 1 Others 1 Total 53
The total number of claimants involved in labour disputes (involving over 20
employees) and claims (involving 20 or less employees) handled by LD in 2015 was 43 550. The total amount of claims was $976 million. The number of cases resolved through conciliation was 10 260, with a settlement rate of 73.5%.
- End -
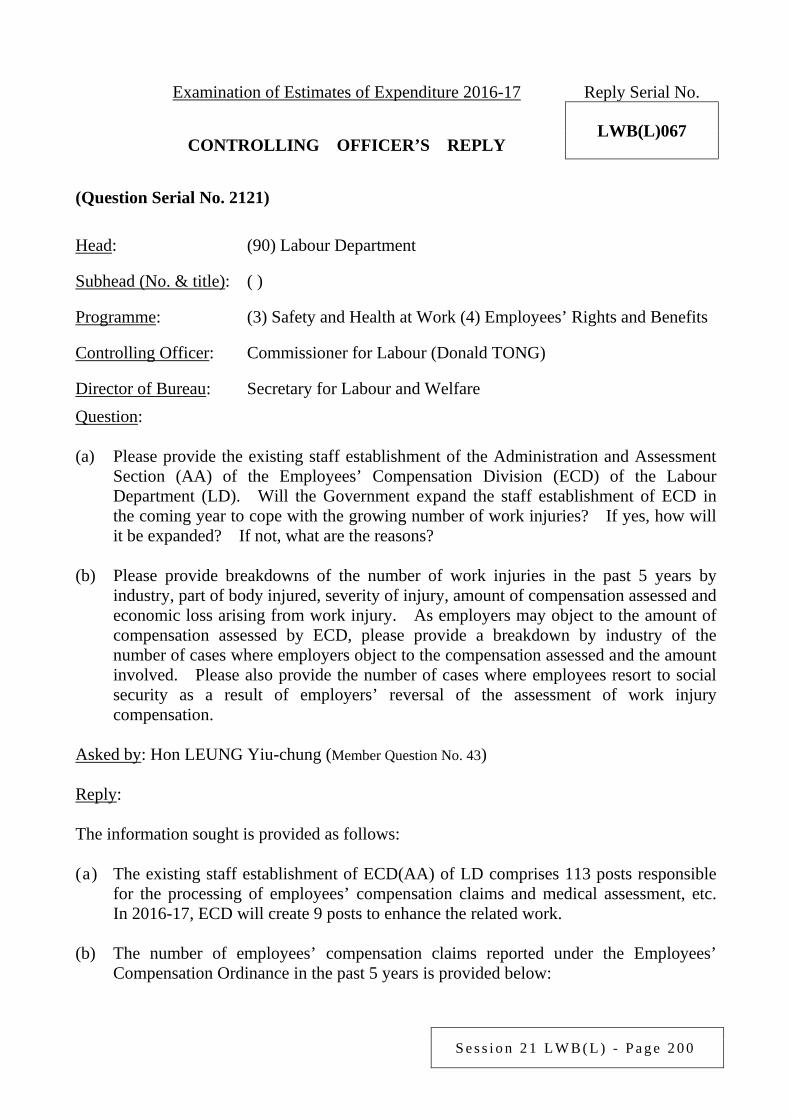
S e s s i o n 2 1 L W B ( L ) - P a g e 2 0 0
Examination of Estimates of Expenditure 2016-17 Reply Serial No.
LWB(L)067 CONTROLLING OFFICER’S REPLY (Question Serial No. 2121)
Head: (90) Labour Department
Subhead (No. & title): ( )
Programme: (3) Safety and Health at Work (4) Employees’ Rights and Benefits
Controlling Officer: Commissioner for Labour (Donald TONG)
Director of Bureau: Secretary for Labour and Welfare Question: (a) Please provide the existing staff establishment of the Administration and Assessment
Section (AA) of the Employees’ Compensation Division (ECD) of the Labour Department (LD). Will the Government expand the staff establishment of ECD in the coming year to cope with the growing number of work injuries? If yes, how will it be expanded? If not, what are the reasons?
(b) Please provide breakdowns of the number of work injuries in the past 5 years by
industry, part of body injured, severity of injury, amount of compensation assessed and economic loss arising from work injury. As employers may object to the amount of compensation assessed by ECD, please provide a breakdown by industry of the number of cases where employers object to the compensation assessed and the amount involved. Please also provide the number of cases where employees resort to social security as a result of employers’ reversal of the assessment of work injury compensation.
Asked by: Hon LEUNG Yiu-chung (Member Question No. 43) Reply: The information sought is provided as follows: (a) The existing staff establishment of ECD(AA) of LD comprises 113 posts responsible
for the processing of employees’ compensation claims and medical assessment, etc. In 2016-17, ECD will create 9 posts to enhance the related work.
(b) The number of employees’ compensation claims reported under the Employees’
Compensation Ordinance in the past 5 years is provided below:
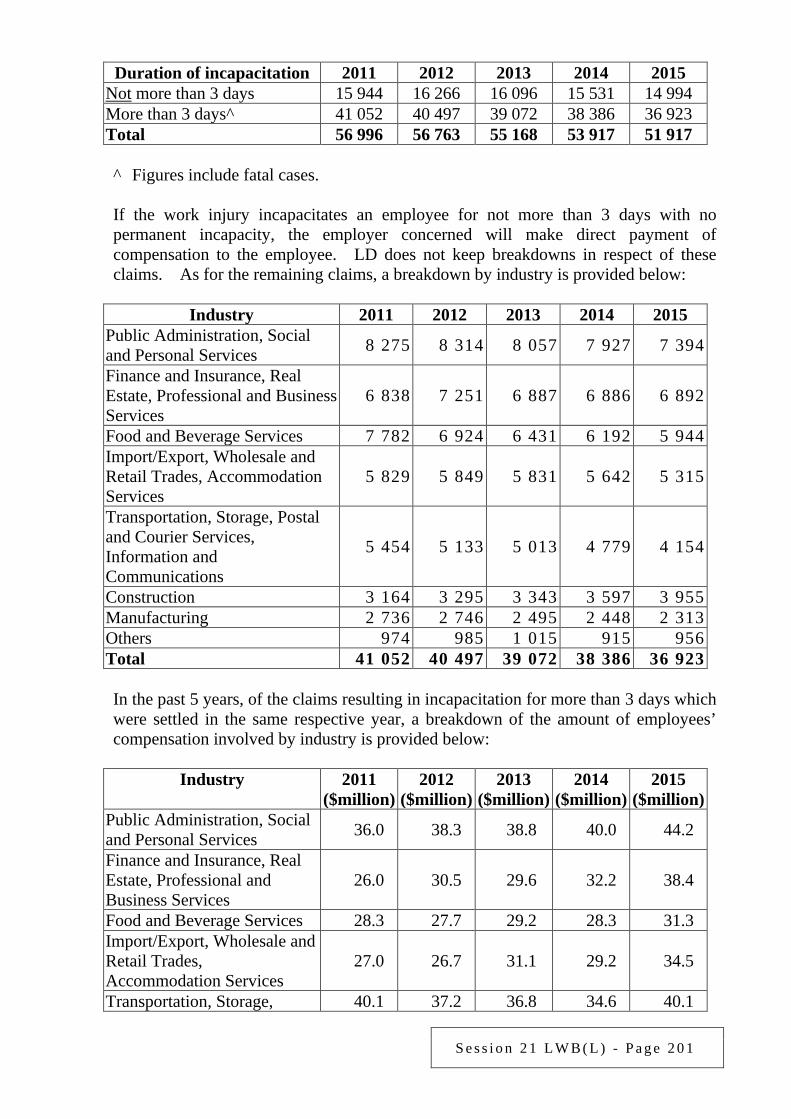
S e s s i o n 2 1 L W B ( L ) - P a g e 2 0 1
Duration of incapacitation 2011 2012 2013 2014 2015 Not more than 3 days 15 944 16 266 16 096 15 531 14 994 More than 3 days^ 41 052 40 497 39 072 38 386 36 923 Total 56 996 56 763 55 168 53 917 51 917
^ Figures include fatal cases. If the work injury incapacitates an employee for not more than 3 days with no
permanent incapacity, the employer concerned will make direct payment of compensation to the employee. LD does not keep breakdowns in respect of these claims. As for the remaining claims, a breakdown by industry is provided below:
Industry 2011 2012 2013 2014 2015
Public Administration, Social and Personal Services 8 275 8 314 8 057 7 927 7 394
Finance and Insurance, Real Estate, Professional and Business Services
6 838 7 251 6 887 6 886 6 892
Food and Beverage Services 7 782 6 924 6 431 6 192 5 944 Import/Export, Wholesale and Retail Trades, Accommodation Services
5 829 5 849 5 831 5 642 5 315
Transportation, Storage, Postal and Courier Services, Information and Communications
5 454 5 133 5 013 4 779 4 154
Construction 3 164 3 295 3 343 3 597 3 955 Manufacturing 2 736 2 746 2 495 2 448 2 313 Others 974 985 1 015 915 956 Total 41 052 40 497 39 072 38 386 36 923
In the past 5 years, of the claims resulting in incapacitation for more than 3 days which
were settled in the same respective year, a breakdown of the amount of employees’ compensation involved by industry is provided below:
Industry 2011
($million) 2012
($million) 2013
($million) 2014
($million) 2015
($million) Public Administration, Social and Personal Services 36.0 38.3 38.8 40.0 44.2
Finance and Insurance, Real Estate, Professional and Business Services
26.0 30.5 29.6 32.2 38.4
Food and Beverage Services 28.3 27.7 29.2 28.3 31.3 Import/Export, Wholesale and Retail Trades, Accommodation Services
27.0 26.7 31.1 29.2 34.5
Transportation, Storage, 40.1 37.2 36.8 34.6 40.1
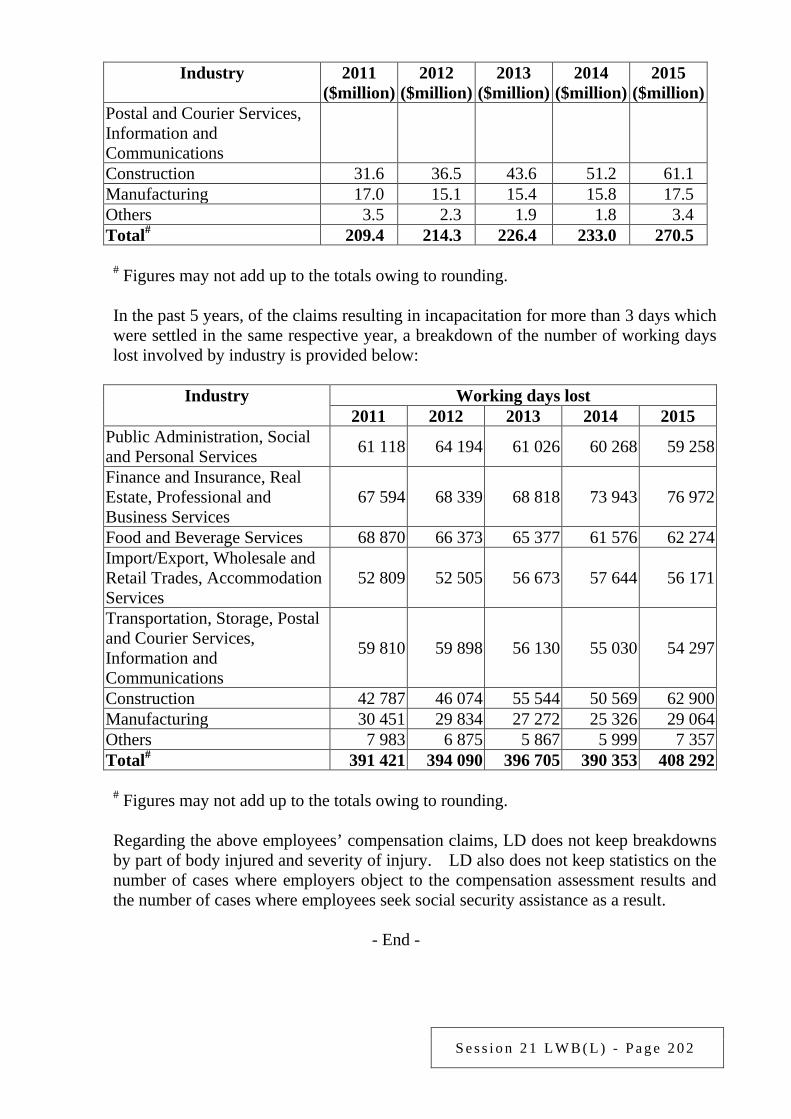
S e s s i o n 2 1 L W B ( L ) - P a g e 2 0 2
Industry 2011 ($million)
2012 ($million)
2013 ($million)
2014 ($million)
2015 ($million)
Postal and Courier Services, Information and Communications Construction 31.6 36.5 43.6 51.2 61.1 Manufacturing 17.0 15.1 15.4 15.8 17.5 Others 3.5 2.3 1.9 1.8 3.4 Total# 209.4 214.3 226.4 233.0 270.5
# Figures may not add up to the totals owing to rounding.
In the past 5 years, of the claims resulting in incapacitation for more than 3 days which
were settled in the same respective year, a breakdown of the number of working days lost involved by industry is provided below:
Industry Working days lost
2011 2012 2013 2014 2015 Public Administration, Social and Personal Services 61 118 64 194 61 026 60 268 59 258
Finance and Insurance, Real Estate, Professional and Business Services
67 594 68 339 68 818 73 943 76 972
Food and Beverage Services 68 870 66 373 65 377 61 576 62 274 Import/Export, Wholesale and Retail Trades, Accommodation Services
52 809 52 505 56 673 57 644 56 171
Transportation, Storage, Postal and Courier Services, Information and Communications
59 810 59 898 56 130 55 030 54 297
Construction 42 787 46 074 55 544 50 569 62 900 Manufacturing 30 451 29 834 27 272 25 326 29 064 Others 7 983 6 875 5 867 5 999 7 357 Total# 391 421 394 090 396 705 390 353 408 292
# Figures may not add up to the totals owing to rounding. Regarding the above employees’ compensation claims, LD does not keep breakdowns
by part of body injured and severity of injury. LD also does not keep statistics on the number of cases where employers object to the compensation assessment results and the number of cases where employees seek social security assistance as a result.
- End -
S e s s i o n 2 1 L W B ( L ) - P a g e 2 0 3
Examination of Estimates of Expenditure 2016-17 Reply Serial No.
LWB(L)068 CONTROLLING OFFICER’S REPLY (Question Serial No. 2123)
Head: (90) Labour Department
Subhead (No. & title): ( )
Programme: (4) Employees’ Rights and Benefits
Controlling Officer: Commissioner for Labour (Donald TONG)
Director of Bureau: Secretary for Labour and Welfare Question: In the 2016-17 financial year, will the Labour Department (LD) allocate resources, including manpower and provision, to study the feasibility of setting up a central employees’ compensation fund? If yes, what are the staff establishment and amount of provision involved? If not, what are the reasons? Asked by: Hon LEUNG Yiu-chung (Member Question No. 45) Reply: The existing no-fault employees’ compensation system is based mainly on the Employees’ Compensation Ordinance (ECO) under which employers are liable to pay compensation. At the same time, an employer must, in accordance with ECO, take out employees’ compensation insurance with an authorised insurance company. This is to ensure the employer’s ability to pay employees injured at work or family members of deceased employees the compensation as stipulated in ECO as well as the compensation awarded by court under common law. This mode of operation has been working well in affording employees’ compensation protection to employees injured at work or family members of deceased employees. LD has not allocated resources in 2016-17 to study the feasibility of setting up a central employees’ compensation fund.
- End -
S e s s i o n 2 1 L W B ( L ) - P a g e 2 0 4
Examination of Estimates of Expenditure 2016-17 Reply Serial No.
LWB(L)069 CONTROLLING OFFICER’S REPLY (Question Serial No. 2124)
Head: (90) Labour Department
Subhead (No. & title): ( )
Programme: (3) Safety and Health at Work
Controlling Officer: Commissioner for Labour (Donald TONG)
Director of Bureau: Secretary for Labour and Welfare Question: Under this Programme, the Labour Department (LD) strengthens enforcement against industries or establishments with poor performance records and launches enforcement campaigns targeted at specific risks or accident-prone work situations. In this connection, has LD expanded its staff establishment to cope with the increase in the number of inspections? If yes, how is it expanded? If not, what are the reasons? Asked by: Hon LEUNG Yiu-chung (Member Question No. 46) Reply: In 2016-17, there will be a net increase of 16 posts in LD to step up efforts in inspections and enforcement as well as publicity and promotion focusing on occupational safety and health (OSH). The manpower involved in the inspections and special enforcement campaigns focusing on OSH cannot be separately identified.
- End -
S e s s i o n 2 1 L W B ( L ) - P a g e 2 0 5
Examination of Estimates of Expenditure 2016-17 Reply Serial No.
LWB(L)070 CONTROLLING OFFICER’S REPLY (Question Serial No. 2125)
Head: (90) Labour Department
Subhead (No. & title): ( )
Programme: (4) Employees’ Rights and Benefits
Controlling Officer: Commissioner for Labour (Donald TONG)
Director of Bureau: Secretary for Labour and Welfare Question: Under this Programme, the Standard Working Hours (SWH) Committee is responsible for following up the Government’s Policy Study on SWH. In this regard, please provide a breakdown of the SWH Committee’s expenditure since April 2013 by type of expenditure. What is the SWH Committee’s estimated expenditure for 2016-17? Asked by: Hon LEUNG Yiu-chung (Member Question No. 47) Reply: The actual expenditures of the Labour Department for supporting the SWH Committee and its related work in 2013-14 and 2014-15 were $2.33 million and $10.73 million respectively. The revised estimated expenditure in 2015-16 was $7.32 million, and the estimated expenditure for 2016-17 is $7.82 million. The above expenditure, excluding staff cost, was spent on supporting the SWH Committee’s work, including public educational and promotional activities, first-stage consultation, working hours survey and other related work.
- End -
S e s s i o n 2 1 L W B ( L ) - P a g e 2 0 6
Examination of Estimates of Expenditure 2016-17 Reply Serial No.
LWB(L)071 CONTROLLING OFFICER’S REPLY (Question Serial No. 2126)
Head: (90) Labour Department
Subhead (No. & title): ( )
Programme: (4) Employees’ Rights and Benefits
Controlling Officer: Commissioner for Labour (Donald TONG)
Director of Bureau: Secretary for Labour and Welfare Question: Under this Programme, the Labour Department (LD) assigns field labour inspectors to conduct inspections to workplaces and other premises to safeguard the working environment of the workers. What are the standards of the enforcement carried out by the field labour inspectors against adverse working environment? Please provide a breakdown by industry of the prosecutions taken or warnings issued in respect of adverse working environment and the respective standards violated. Asked by: Hon LEUNG Yiu-chung (Member Question No. 48) Reply: Labour inspectors of LD conduct surprise inspections to establishments of various industries to check employers’ compliance with labour laws such as the Employment Ordinance, Employees’ Compensation Ordinance and Minimum Wage Ordinance, and investigate complaints to protect the statutory rights and benefits of employees. Taking enforcement action in respect of the working environment does not fall within the scope of responsibilities of labour inspectors.
- End -
S e s s i o n 2 1 L W B ( L ) - P a g e 2 0 7
Examination of Estimates of Expenditure 2016-17 Reply Serial No.
LWB(L)072 CONTROLLING OFFICER’S REPLY (Question Serial No. 2127)
Head: (90) Labour Department
Subhead (No. & title): ( )
Programme: (1) Labour Relations
Controlling Officer: Commissioner for Labour (Donald TONG)
Director of Bureau: Secretary for Labour and Welfare Question: Under this Programme, the Labour Department (LD) is responsible for the administration of trade unions. In this regard, what was the expenditure incurred by LD on encouraging workers to establish trade unions for the protection of workers’ rights and benefits in the past 5 financial years? What was the amount of subsidy granted to support the ongoing operation of existing trade unions? Asked by: Hon LEUNG Yiu-chung (Member Question No. 49) Reply: The Registry of Trade Unions (RTU) established under LD is responsible for the administration of the Trade Unions Ordinance and the Trade Union Registration Regulations, with a view to assisting trade unions in managing union affairs in accordance with the laws and their respective constitutions (i.e. union rules). RTU has been rendering assistance to those who intend to form trade unions by offering advice on the preparation of union rules and the relevant procedures. In addition, RTU from time to time organises courses, such as briefing sessions on trade union management and legislations as well as bookkeeping courses, to familiarise trade unionists with the relevant legislations and the key to trade union management, so as to enhance the management of union affairs. As these activities are an integral part of RTU’s work in the administration of trade unions, the expenditure involved cannot be separately identified. RTU does not grant subsidies for the formation of trade unions or the operation of existing trade unions.
- End -
S e s s i o n 2 1 L W B ( L ) - P a g e 2 0 8
Examination of Estimates of Expenditure 2016-17 Reply Serial No.
LWB(L)073 CONTROLLING OFFICER’S REPLY (Question Serial No. 2243)
Head: (90) Labour Department
Subhead (No. & title): ( )
Programme: (2) Employment Services
Controlling Officer: Commissioner for Labour (Donald TONG)
Director of Bureau: Secretary for Labour and Welfare Question: It is mentioned under Matters Requiring Special Attention in 2016-17 that a dedicated employment information e-platform will be established for job seekers with higher education, in particular local residents who receive higher education outside Hong Kong as well as overseas talents. (a) Would the Government provide data and information on the establishment of the
e-platform? Are there any criteria and mechanisms to screen the job seekers with higher education?
(b) What are the estimated expenditure and manpower involved, the target number of job
seekers and the performance indicators? Asked by: Hon Martin LIAO Cheung-kong (Member Question No. 46) Reply: The information sought is provided as follows: (a) To strengthen employment support for persons with higher education, in particular
Hong Kong students who are educated in overseas tertiary institutes, the second generation of Hong Kong emigrants who are interested in working in Hong Kong, as well as persons from overseas with higher academic/professional qualifications, the Labour Department (LD) will set up a dedicated employment information e-platform in the fourth quarter of 2016. The e-platform will enhance their understanding of the Hong Kong labour market as well as facilitating their search and application for suitable job openings through the new dedicated webpage. The aim of the e-platform is to provide employment information. There will not be any mechanism to screen the academic qualifications of the users.

S e s s i o n 2 1 L W B ( L ) - P a g e 2 0 9
(b) There will be 3 additional staff in LD to take forward the above new initiative for 3
years starting from 2016-17. The estimated expenditure for 2016-17 is $1.35 million (excluding staff cost). As the number of e-platform service users will be affected by many factors, including the prevailing labour market situation, the number of users cannot be estimated at this stage. After the introduction of this new measure, LD will monitor the usage and the data of the e-platform to assess its effectiveness.
- End -

S e s s i o n 2 1 L W B ( L ) - P a g e 2 1 0
Examination of Estimates of Expenditure 2016-17 Reply Serial No.
LWB(L)074 CONTROLLING OFFICER’S REPLY (Question Serial No. 0350)
Head: (90) Labour Department
Subhead (No. & title): ( )
Programme: (2) Employment Services
Controlling Officer: Commissioner for Labour (Donald TONG)
Director of Bureau: Secretary for Labour and Welfare Question: It is stated in paragraph 147 of the Budget Speech that the Government will enhance the Supplementary Labour Scheme (SLS) to alleviate the delays and cost overruns caused by labour shortage. In this connection, would the Government provide the following information: (a) A breakdown by trade in the construction industry with severe labour shortage and
acute ageing problems of the industry practitioners; (b) Given that the Government implemented enhancement measures in April 2014 to
expedite the preparatory work of public sector works contractors in the SLS applications for importing workers for the trades with labour shortage, please provide (i) the number of such applications received by the Government so far and, for each application approved, (ii) the names of the contractors, (iii) the work locations, (iv) the number of imported workers applied for, and (v) the number of imported workers approved (with a breakdown by trade); and
(c) Have joint efforts been made with the industry to forecast the manpower supply and
demand in the construction industry in the coming 5 years? If yes, what are the details? If not, what are the reasons?
Asked by: Ir Dr Hon LO Wai-kwok (Member Question No. 4) Reply: The information sought is provided as follows: (a) and (c) Based on information provided by the Development Bureau, the construction
industry is facing the problems of an ageing workforce and shortage of skilled workers. According to information from the Construction Industry Council
S e s s i o n 2 1 L W B ( L ) - P a g e 2 1 1
(CIC), more than 50% of the skilled workers registered under the Construction Workers Registration Ordinance (CWRO) were aged 50 or above as at the end of December 2015. The Government and the industry review the manpower situation of construction workers from time to time. According to the latest report on manpower forecast for construction workers released by CIC at the end of 2015, the construction industry will require about 10 000 to 15 000 additional skilled workers from 2016 to 2020.
Regarding individual trades, CIC set up in 2014 the Task Force on Short-term
Labour Supply (Task Force) comprising representatives of the relevant trade associations and labour unions. After thorough discussion and detailed consideration of the relevant manpower studies (including CIC’s report on manpower forecast), surveys and training schemes, the Task Force has identified 26 trades with manpower shortage. The list of these 26 trades and the average age of the relevant skilled workers registered (as at the end of 2015) are at Annex 1.
(b) On the premise of according priority to local workers in employment and
safeguarding their wage levels, the Government launched in 2014 enhancement measures under SLS to expedite the preparatory work for SLS applications for public sector works projects involving the above trades with manpower shortage. From April 2014 to February 2016, the Labour Department (LD) received 32 applications in relation to the above enhancement measures, of which 11 were approved. The total number of imported workers applied for in these 11 applications was 719 and the number of imported workers approved was 585. A breakdown of the number of imported workers approved by the above trades with manpower shortage is at Annex 2. Having regard to the principle of confidentiality in the processing of applications under SLS, LD cannot provide information on the names of contractors and the work locations involved.
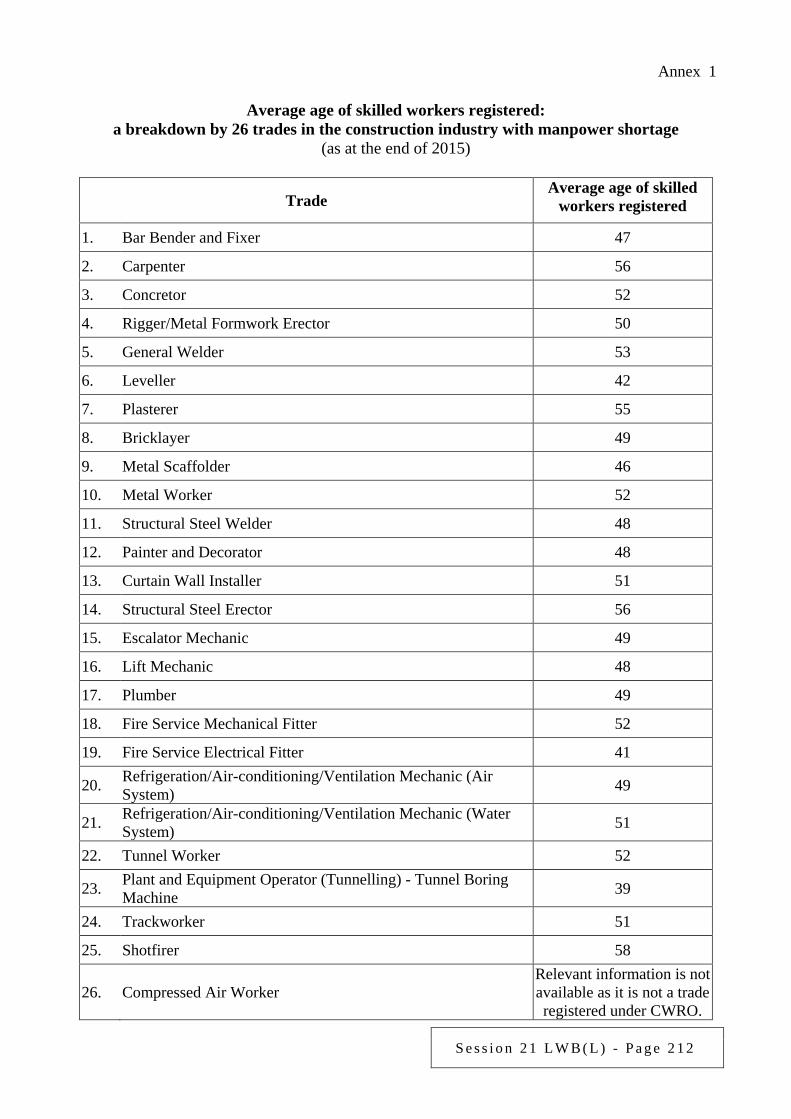
S e s s i o n 2 1 L W B ( L ) - P a g e 2 1 2
Annex 1
Average age of skilled workers registered: a breakdown by 26 trades in the construction industry with manpower shortage
(as at the end of 2015)
Trade Average age of skilled
workers registered
1. Bar Bender and Fixer 47
2. Carpenter 56
3. Concretor 52
4. Rigger/Metal Formwork Erector 50
5. General Welder 53
6. Leveller 42
7. Plasterer 55
8. Bricklayer 49
9. Metal Scaffolder 46
10. Metal Worker 52
11. Structural Steel Welder 48
12. Painter and Decorator 48
13. Curtain Wall Installer 51
14. Structural Steel Erector 56
15. Escalator Mechanic 49
16. Lift Mechanic 48
17. Plumber 49
18. Fire Service Mechanical Fitter 52
19. Fire Service Electrical Fitter 41
20. Refrigeration/Air-conditioning/Ventilation Mechanic (Air System) 49
21. Refrigeration/Air-conditioning/Ventilation Mechanic (Water System) 51
22. Tunnel Worker 52
23. Plant and Equipment Operator (Tunnelling) - Tunnel Boring Machine 39
24. Trackworker 51
25. Shotfirer 58
26. Compressed Air Worker Relevant information is not available as it is not a trade registered under CWRO.
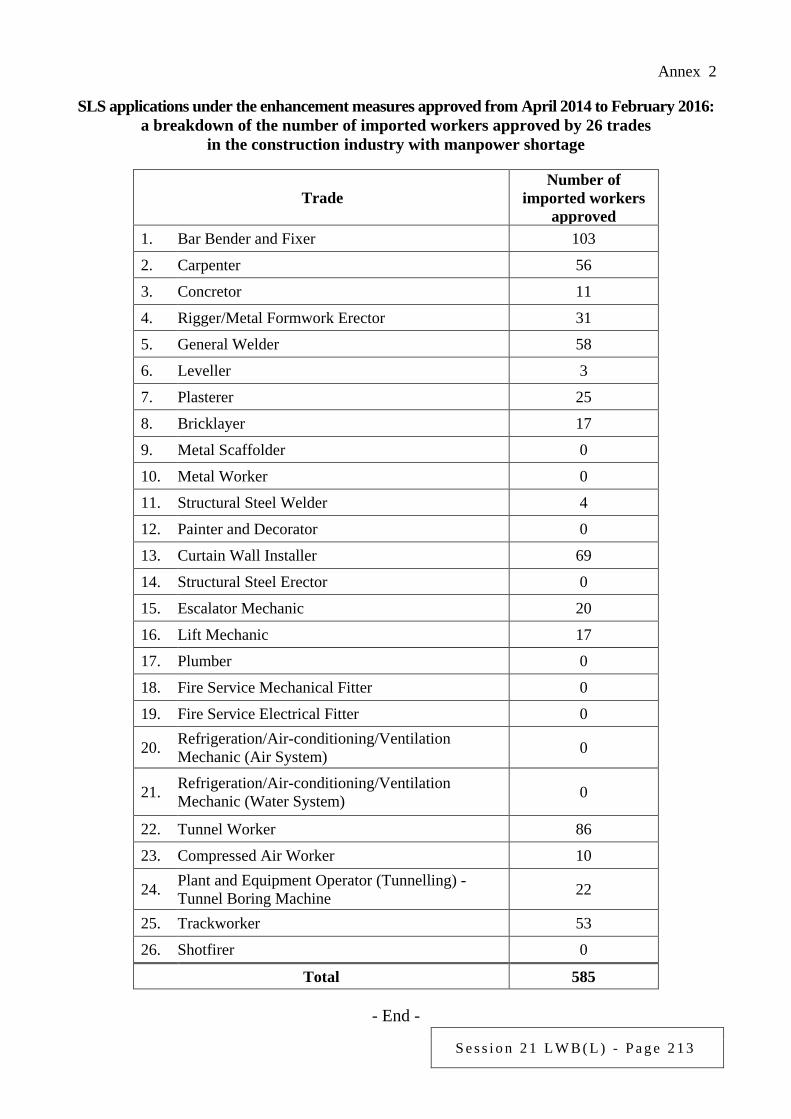
S e s s i o n 2 1 L W B ( L ) - P a g e 2 1 3
Annex 2
SLS applications under the enhancement measures approved from April 2014 to February 2016: a breakdown of the number of imported workers approved by 26 trades
in the construction industry with manpower shortage
Trade Number of
imported workers approved
1. Bar Bender and Fixer 103
2. Carpenter 56
3. Concretor 11
4. Rigger/Metal Formwork Erector 31
5. General Welder 58
6. Leveller 3
7. Plasterer 25
8. Bricklayer 17
9. Metal Scaffolder 0
10. Metal Worker 0
11. Structural Steel Welder 4
12. Painter and Decorator 0
13. Curtain Wall Installer 69
14. Structural Steel Erector 0
15. Escalator Mechanic 20
16. Lift Mechanic 17
17. Plumber 0
18. Fire Service Mechanical Fitter 0
19. Fire Service Electrical Fitter 0
20. Refrigeration/Air-conditioning/Ventilation Mechanic (Air System) 0
21. Refrigeration/Air-conditioning/Ventilation Mechanic (Water System) 0
22. Tunnel Worker 86
23. Compressed Air Worker 10
24. Plant and Equipment Operator (Tunnelling) - Tunnel Boring Machine 22
25. Trackworker 53
26. Shotfirer 0
Total 585
- End -
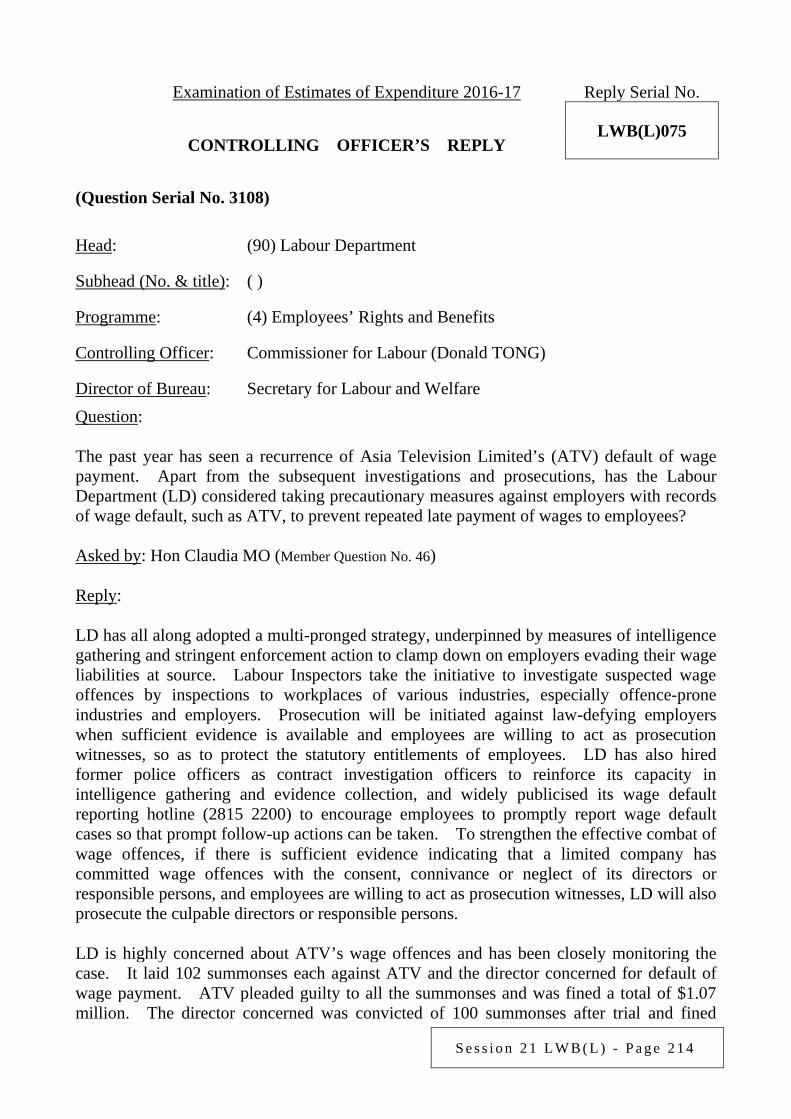
S e s s i o n 2 1 L W B ( L ) - P a g e 2 1 4
Examination of Estimates of Expenditure 2016-17 Reply Serial No.
LWB(L)075 CONTROLLING OFFICER’S REPLY (Question Serial No. 3108)
Head: (90) Labour Department
Subhead (No. & title): ( )
Programme: (4) Employees’ Rights and Benefits
Controlling Officer: Commissioner for Labour (Donald TONG)
Director of Bureau: Secretary for Labour and Welfare Question: The past year has seen a recurrence of Asia Television Limited’s (ATV) default of wage payment. Apart from the subsequent investigations and prosecutions, has the Labour Department (LD) considered taking precautionary measures against employers with records of wage default, such as ATV, to prevent repeated late payment of wages to employees? Asked by: Hon Claudia MO (Member Question No. 46) Reply: LD has all along adopted a multi-pronged strategy, underpinned by measures of intelligence gathering and stringent enforcement action to clamp down on employers evading their wage liabilities at source. Labour Inspectors take the initiative to investigate suspected wage offences by inspections to workplaces of various industries, especially offence-prone industries and employers. Prosecution will be initiated against law-defying employers when sufficient evidence is available and employees are willing to act as prosecution witnesses, so as to protect the statutory entitlements of employees. LD has also hired former police officers as contract investigation officers to reinforce its capacity in intelligence gathering and evidence collection, and widely publicised its wage default reporting hotline (2815 2200) to encourage employees to promptly report wage default cases so that prompt follow-up actions can be taken. To strengthen the effective combat of wage offences, if there is sufficient evidence indicating that a limited company has committed wage offences with the consent, connivance or neglect of its directors or responsible persons, and employees are willing to act as prosecution witnesses, LD will also prosecute the culpable directors or responsible persons. LD is highly concerned about ATV’s wage offences and has been closely monitoring the case. It laid 102 summonses each against ATV and the director concerned for default of wage payment. ATV pleaded guilty to all the summonses and was fined a total of $1.07 million. The director concerned was convicted of 100 summonses after trial and fined

S e s s i o n 2 1 L W B ( L ) - P a g e 2 1 5
$150,000. LD will actively follow up the investigation of the allegation regarding ATV’s suspected wage offences. Further prosecution actions will be instituted if sufficient evidence is found and employees are willing to act as witnesses.
- End -
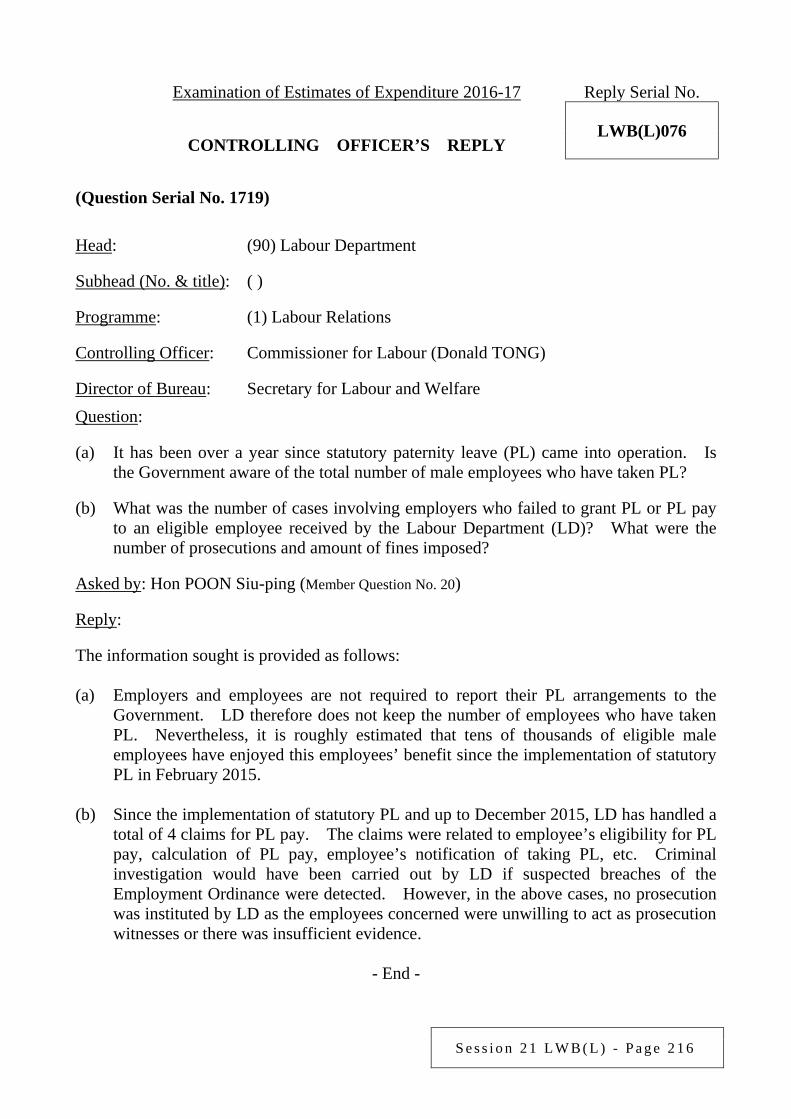
S e s s i o n 2 1 L W B ( L ) - P a g e 2 1 6
Examination of Estimates of Expenditure 2016-17 Reply Serial No.
LWB(L)076 CONTROLLING OFFICER’S REPLY (Question Serial No. 1719)
Head: (90) Labour Department
Subhead (No. & title): ( )
Programme: (1) Labour Relations
Controlling Officer: Commissioner for Labour (Donald TONG)
Director of Bureau: Secretary for Labour and Welfare Question: (a) It has been over a year since statutory paternity leave (PL) came into operation. Is
the Government aware of the total number of male employees who have taken PL? (b) What was the number of cases involving employers who failed to grant PL or PL pay
to an eligible employee received by the Labour Department (LD)? What were the number of prosecutions and amount of fines imposed?
Asked by: Hon POON Siu-ping (Member Question No. 20) Reply: The information sought is provided as follows: (a) Employers and employees are not required to report their PL arrangements to the
Government. LD therefore does not keep the number of employees who have taken PL. Nevertheless, it is roughly estimated that tens of thousands of eligible male employees have enjoyed this employees’ benefit since the implementation of statutory PL in February 2015.
(b) Since the implementation of statutory PL and up to December 2015, LD has handled a
total of 4 claims for PL pay. The claims were related to employee’s eligibility for PL pay, calculation of PL pay, employee’s notification of taking PL, etc. Criminal investigation would have been carried out by LD if suspected breaches of the Employment Ordinance were detected. However, in the above cases, no prosecution was instituted by LD as the employees concerned were unwilling to act as prosecution witnesses or there was insufficient evidence.
- End -
S e s s i o n 2 1 L W B ( L ) - P a g e 2 1 7
Examination of Estimates of Expenditure 2016-17 Reply Serial No.
LWB(L)077 CONTROLLING OFFICER’S REPLY (Question Serial No. 2350)
Head: (90) Labour Department
Subhead (No. & title): ( )
Programme: (2) Employment Services
Controlling Officer: Commissioner for Labour (Donald TONG)
Director of Bureau: Secretary for Labour and Welfare Question: The Government implemented enhancement measures under the Supplementary Labour Scheme (SLS) last year to allow public sector works contractors to apply for the importation of skilled workers to work across various public sector works projects. What are the numbers of applications received, imported workers involved, as well as applications and workers approved so far? Asked by: Hon POON Siu-ping (Member Question No. 42) Reply: On the premise of according priority to local workers in employment and safeguarding their wage levels, the Government launched flexibility enhancement measures under SLS for public sector works projects in May 2015, which hopefully would generate synergy effects to more effectively utilise the productivity of imported workers who were given prior approval by the Labour Department (LD) to work on specified public sector works contracts under the same contractor. From May 2015 to February 2016, LD received 3 applications from public sector works contractors for importation of skilled workers to work across more than 1 specified public sector works contract under the same contractor. The applications applying for the importation of a total of 625 workers are being processed by LD.
- End -
S e s s i o n 2 1 L W B ( L ) - P a g e 2 1 8
Examination of Estimates of Expenditure 2016-17 Reply Serial No.
LWB(L)078 CONTROLLING OFFICER’S REPLY (Question Serial No. 2351)
Head: (90) Labour Department
Subhead (No. & title): ( )
Programme: (3) Safety and Health at Work
Controlling Officer: Commissioner for Labour (Donald TONG)
Director of Bureau: Secretary for Labour and Welfare Question: The number of investigations/surveys/examinations/assessments/clinical consultations on occupational health conducted by the Labour Department (LD) decreased from 25 286 in 2013 to 22 164 in 2014, and further to only 21 592 in 2015, which failed to meet the target. Please give reasons for the decrease and provide the respective numbers of investigations, surveys, examinations, assessments and clinical consultations on occupational health conducted in the past 3 years in the table below.
2013 2014 2015 Investigations on occupational health conducted Surveys on occupational health conducted Examinations on occupational health conducted Assessments on occupational health conducted Clinical consultations on occupational health conducted
Asked by: Hon POON Siu-ping (Member Question No. 44) Reply: The respective numbers of investigations, surveys, examinations, assessments and clinical consultations on occupational health conducted by LD in 2013, 2014 and 2015 are provided in the table below:
2013 2014 2015 Investigations on occupational health conducted 2 884 3 093 3 433 Surveys on occupational health conducted 6 577 6 258 5 978 Examinations on occupational health conducted 1 692 1 929 1 639 Assessments on occupational health conducted 2 278 488 1 488 Clinical consultations on occupational health conducted 11 855 10 396 9 054
Total 25 286 22 164 21 592
S e s s i o n 2 1 L W B ( L ) - P a g e 2 1 9
The decrease in the overall numbers in 2015 as listed above was mainly due to relocation of the Kwun Tong Occupational Health Clinic (KTOHC) to its present location in March 2015 under the Kwun Tong Redevelopment Project. The number of consultation rooms in KTOHC had to be reduced before and after relocation. As a result, the number of clinical consultations conducted in 2015 was less than that in 2014. Besides, the frequency of examinations on occupational health varies according to the needs of workers. For example, workers who had received biennial occupational health examinations in 2014 did not have to be examined again in 2015.
- End -
S e s s i o n 2 1 L W B ( L ) - P a g e 2 2 0
Examination of Estimates of Expenditure 2016-17 Reply Serial No.
LWB(L)079 CONTROLLING OFFICER’S REPLY (Question Serial No. 2352)
Head: (90) Labour Department
Subhead (No. & title): ( )
Programme: (3) Safety and Health at Work
Controlling Officer: Commissioner for Labour (Donald TONG)
Director of Bureau: Secretary for Labour and Welfare Question: (a) What are the details of the intensification of systematic preventive and enforcement
efforts by the Labour Department (LD) to tackle fall-from-height hazards and other work hazards in the construction sector?
(b) What are the safety enhancement initiatives to be launched by LD? Asked by: Hon POON Siu-ping (Member Question No. 45) Reply: The information sought is provided as follows: (a) In addition to carrying out routine inspections as well as educational and publicity
work, LD will intensify the following systemic preventive and enforcement measures in 2016-17 to tackle fall-from-height hazards and other work hazards posed to workers in construction works (including major works projects and renovation, maintenance, alteration and addition works):
(i) containing work risks at source by targeting systemic work risks such as
work-at-height, lifting operations and electrical work, including enhancing liaison with major works project proponents and asking them to urge their contractors to strengthen site safety management systems in respect of high-risk processes and enhance safety audits of major works projects;
(ii) strengthening the analysis of underlying systemic risks of serious construction
accidents, instituting targeted inspections and enforcement actions, organising thematic seminars on work safety and formulating codes of practice on work safety; and
S e s s i o n 2 1 L W B ( L ) - P a g e 2 2 1
(iii) collaborating with trade associations, workers’ unions, professional bodies, related organisations and other government departments to explore measures to enhance work-at-height safety. The measures include encouraging more contractors and workers to use standard-conforming mobile working platforms and requiring workers to use safety helmets with chin straps, so as to further protect workers’ safety while working at height.
(b) LD will continue to adopt a multi-pronged strategy to enhance occupational safety and
health in various industries through inspection and enforcement, education and training as well as publicity and promotion. LD will also launch special enforcement operations targeting high-risk processes, such as work-at-height, lifting operations and electrical work. In respect of publicity, education and promotion, LD will, in collaboration with the Occupational Safety and Health Council, major trade associations and the workers’ unions concerned, organise promotional campaigns to enhance the occupational safety and health awareness of employers and employees in various industries through training courses, seminars, roving exhibitions, out-reaching promotional visits, television and radio Announcements in the Public Interest, occupational safety and health messages publicised on newspapers and LD’s webpages, and compilation and updating of safety guidelines. LD will also conduct inspections and promotions for different industries and workplaces in accordance with the risks of the industries and work processes involved.
- End -
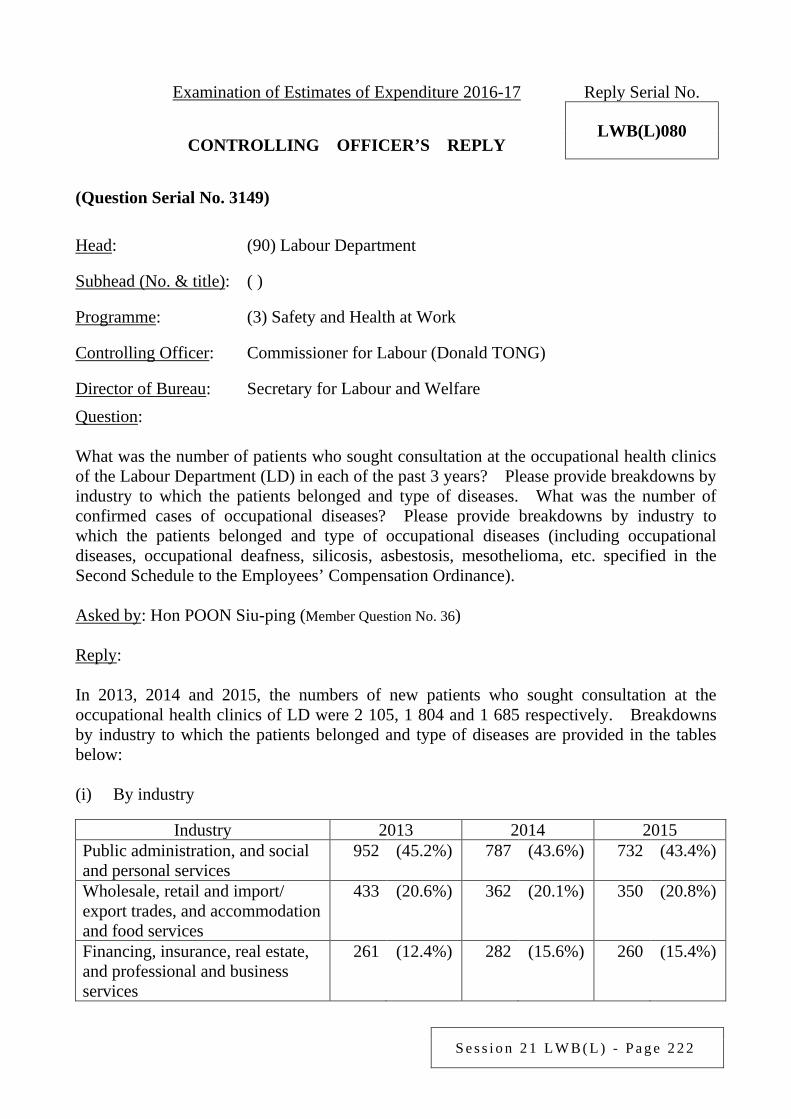
S e s s i o n 2 1 L W B ( L ) - P a g e 2 2 2
Examination of Estimates of Expenditure 2016-17 Reply Serial No.
LWB(L)080 CONTROLLING OFFICER’S REPLY (Question Serial No. 3149)
Head: (90) Labour Department
Subhead (No. & title): ( )
Programme: (3) Safety and Health at Work
Controlling Officer: Commissioner for Labour (Donald TONG)
Director of Bureau: Secretary for Labour and Welfare Question: What was the number of patients who sought consultation at the occupational health clinics of the Labour Department (LD) in each of the past 3 years? Please provide breakdowns by industry to which the patients belonged and type of diseases. What was the number of confirmed cases of occupational diseases? Please provide breakdowns by industry to which the patients belonged and type of occupational diseases (including occupational diseases, occupational deafness, silicosis, asbestosis, mesothelioma, etc. specified in the Second Schedule to the Employees’ Compensation Ordinance). Asked by: Hon POON Siu-ping (Member Question No. 36) Reply: In 2013, 2014 and 2015, the numbers of new patients who sought consultation at the occupational health clinics of LD were 2 105, 1 804 and 1 685 respectively. Breakdowns by industry to which the patients belonged and type of diseases are provided in the tables below: (i) By industry
Industry 2013 2014 2015 Public administration, and social and personal services
952 (45.2%) 787 (43.6%) 732 (43.4%)
Wholesale, retail and import/ export trades, and accommodation and food services
433 (20.6%) 362 (20.1%) 350 (20.8%)
Financing, insurance, real estate, and professional and business services
261 (12.4%) 282 (15.6%) 260 (15.4%)
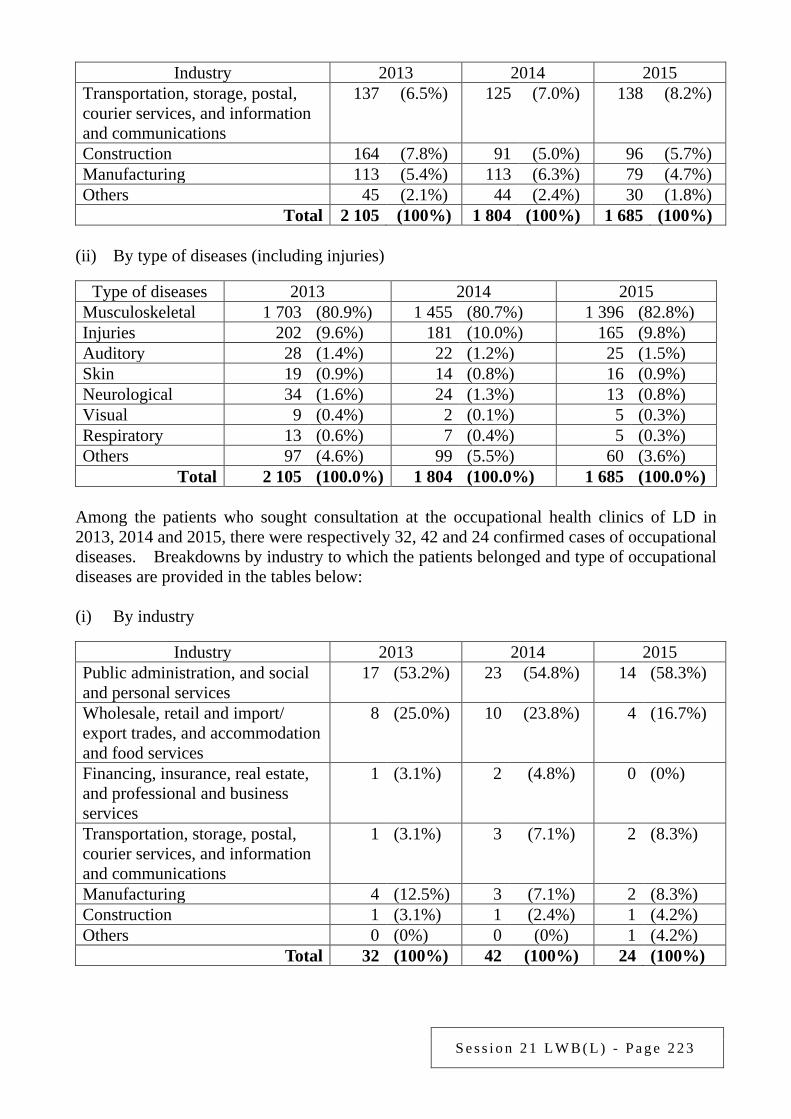
S e s s i o n 2 1 L W B ( L ) - P a g e 2 2 3
Industry 2013 2014 2015 Transportation, storage, postal, courier services, and information and communications
137 (6.5%) 125 (7.0%) 138 (8.2%)
Construction 164 (7.8%) 91 (5.0%) 96 (5.7%) Manufacturing 113 (5.4%) 113 (6.3%) 79 (4.7%) Others 45 (2.1%) 44 (2.4%) 30 (1.8%)
Total 2 105 (100%) 1 804 (100%) 1 685 (100%) (ii) By type of diseases (including injuries)
Type of diseases 2013 2014 2015 Musculoskeletal 1 703 (80.9%) 1 455 (80.7%) 1 396 (82.8%) Injuries 202 (9.6%) 181 (10.0%) 165 (9.8%) Auditory 28 (1.4%) 22 (1.2%) 25 (1.5%) Skin 19 (0.9%) 14 (0.8%) 16 (0.9%) Neurological 34 (1.6%) 24 (1.3%) 13 (0.8%) Visual 9 (0.4%) 2 (0.1%) 5 (0.3%) Respiratory 13 (0.6%) 7 (0.4%) 5 (0.3%) Others 97 (4.6%) 99 (5.5%) 60 (3.6%)
Total 2 105 (100.0%) 1 804 (100.0%) 1 685 (100.0%) Among the patients who sought consultation at the occupational health clinics of LD in 2013, 2014 and 2015, there were respectively 32, 42 and 24 confirmed cases of occupational diseases. Breakdowns by industry to which the patients belonged and type of occupational diseases are provided in the tables below: (i) By industry
Industry 2013 2014 2015 Public administration, and social and personal services
17 (53.2%) 23 (54.8%) 14 (58.3%)
Wholesale, retail and import/ export trades, and accommodation and food services
8 (25.0%) 10 (23.8%) 4 (16.7%)
Financing, insurance, real estate, and professional and business services
1 (3.1%) 2 (4.8%) 0 (0%)
Transportation, storage, postal, courier services, and information and communications
1 (3.1%) 3 (7.1%) 2 (8.3%)
Manufacturing 4 (12.5%) 3 (7.1%) 2 (8.3%) Construction 1 (3.1%) 1 (2.4%) 1 (4.2%) Others 0 (0%) 0 (0%) 1 (4.2%)
Total 32 (100%) 42 (100%) 24 (100%)
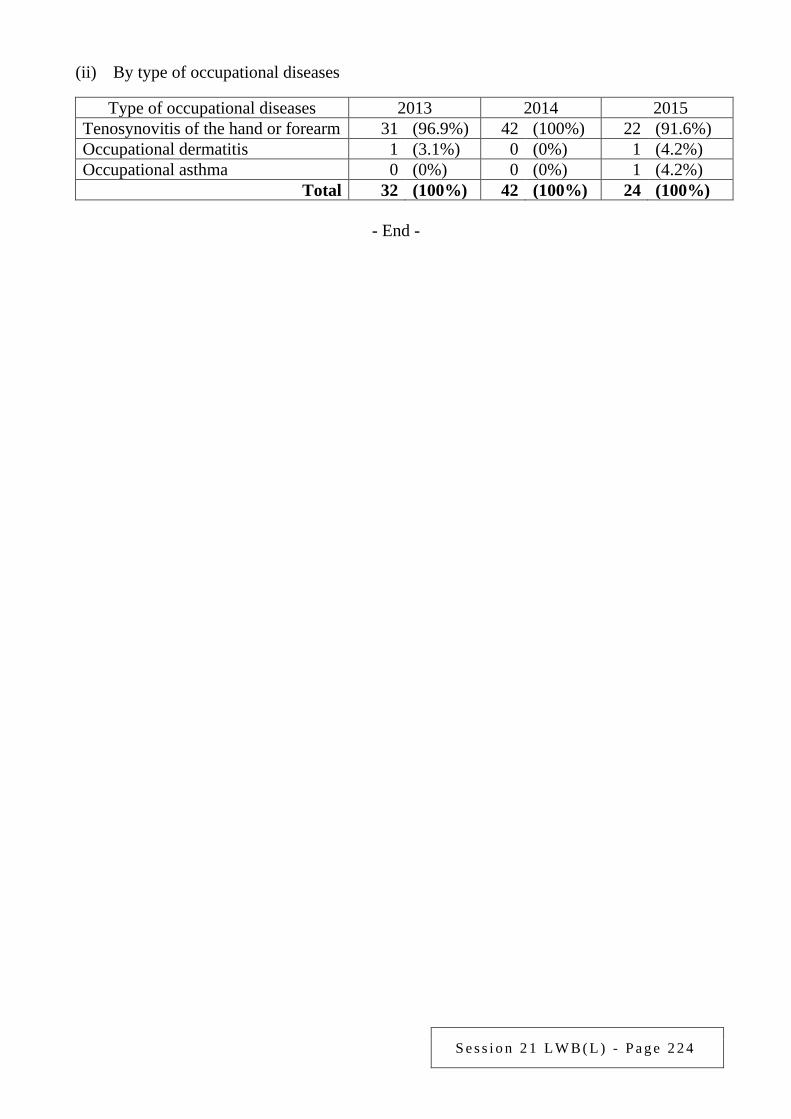
S e s s i o n 2 1 L W B ( L ) - P a g e 2 2 4
(ii) By type of occupational diseases
Type of occupational diseases 2013 2014 2015 Tenosynovitis of the hand or forearm 31 (96.9%) 42 (100%) 22 (91.6%) Occupational dermatitis 1 (3.1%) 0 (0%) 1 (4.2%) Occupational asthma 0 (0%) 0 (0%) 1 (4.2%)
Total 32 (100%) 42 (100%) 24 (100%)
- End -
S e s s i o n 2 1 L W B ( L ) - P a g e 2 2 5
Examination of Estimates of Expenditure 2016-17 Reply Serial No.
LWB(L)081 CONTROLLING OFFICER’S REPLY (Question Serial No. 3150)
Head: (90) Labour Department
Subhead (No. & title): ( )
Programme: (4) Employees’ Rights and Benefits
Controlling Officer: Commissioner for Labour (Donald TONG)
Director of Bureau: Secretary for Labour and Welfare Question: The Labour Department (LD) is responsible for processing employees’ compensation claims. The Audit Commission stated in its report published in April 2015 that there was room for improvement by LD in processing cases as 7 470 cases received by the Employees’ Compensation Division (ECD) between 2009 and 2013 had not yet been settled as at September 2014 and the average time taken by the Employees Compensation Assistance Fund Board (ECAFB) to process an application was 5.7 months. The Audit Commission also recommended that LD should expedite the processing of the outstanding employees’ compensation claims and take measures to shorten the time taken for processing applications for the Employees Compensation Assistance Fund (ECAF). What specific measures have been taken by LD to improve the processing of employees’ compensation claims? Has any target been set to shorten the processing time? Asked by: Hon POON Siu-ping (Member Question No. 39) Reply: As the time taken by LD to process employees’ compensation claims mainly depends on the merits of each case (including whether the condition of the employee is suitable for medical assessment, whether a claim requires the court’s adjudication, whether more than one medical speciality is involved in handling the injuries etc.), it is impracticable to set a single target for the time required to process employees’ compensation claims. On the other hand, ECAFB processes ECAF applications in accordance with the Employees Compensation Assistance Ordinance. ECAFB cannot set a specific target for the processing time required for individual cases as it depends on the actual circumstances of each case. LD endeavours to expedite the processing of employees’ compensation claims. It is now reviewing the medical clearance procedures and exploring feasible measures with a view to shortening the waiting time for assessment by the Employees’ Compensation (Ordinary
S e s s i o n 2 1 L W B ( L ) - P a g e 2 2 6
Assessment) Boards (OABs). In addition, LD has been making use of computer-generated reports since August 2015 to closely monitor the no-show rate of injured employees at OABs to better utilise the appointment quotas. LD will continue to review the existing mechanism to improve the processing of employees’ compensation claims. Meanwhile, ECAFB has commenced enhancement of its computer system to build up a more comprehensive database on ECAF applications so as to monitor case development and take timely actions to expedite the processing of applications. In addition, ECAFB plans to employ 1 in-house lawyer to give timely legal advice on the processing of cases, which will enhance case management efficiency.
- End -
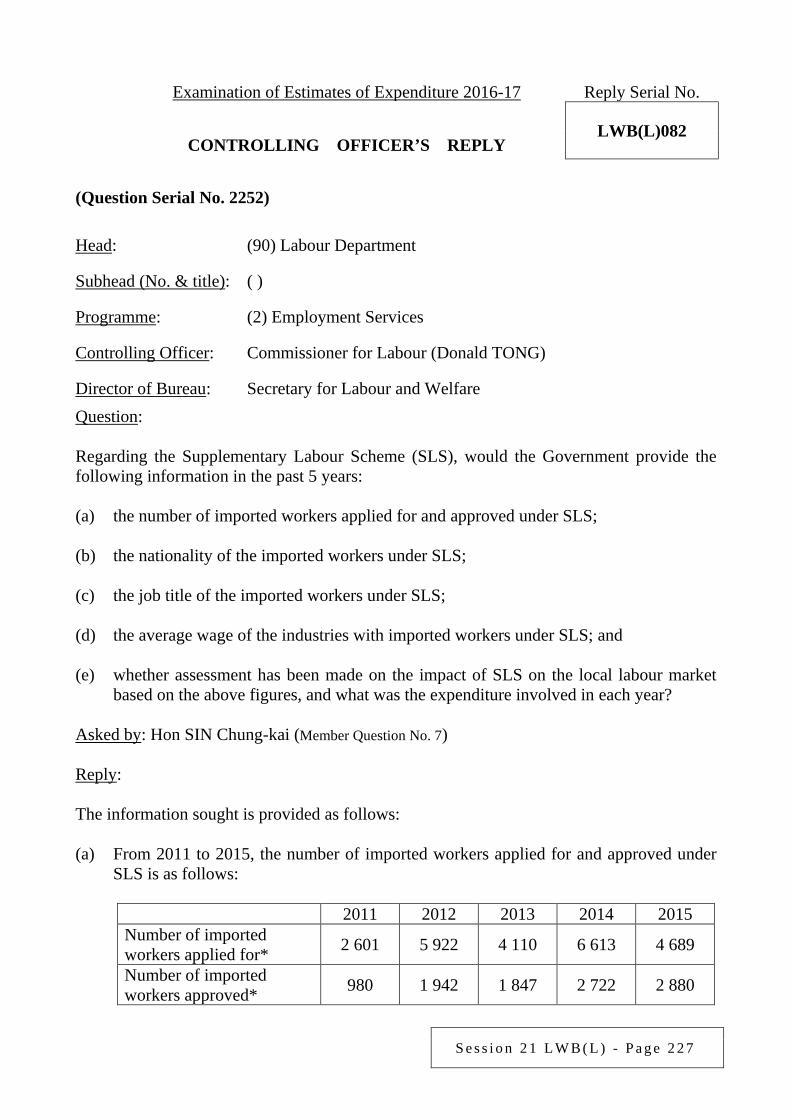
S e s s i o n 2 1 L W B ( L ) - P a g e 2 2 7
Examination of Estimates of Expenditure 2016-17 Reply Serial No.
LWB(L)082 CONTROLLING OFFICER’S REPLY (Question Serial No. 2252)
Head: (90) Labour Department
Subhead (No. & title): ( )
Programme: (2) Employment Services
Controlling Officer: Commissioner for Labour (Donald TONG)
Director of Bureau: Secretary for Labour and Welfare Question: Regarding the Supplementary Labour Scheme (SLS), would the Government provide the following information in the past 5 years: (a) the number of imported workers applied for and approved under SLS; (b) the nationality of the imported workers under SLS; (c) the job title of the imported workers under SLS; (d) the average wage of the industries with imported workers under SLS; and (e) whether assessment has been made on the impact of SLS on the local labour market
based on the above figures, and what was the expenditure involved in each year? Asked by: Hon SIN Chung-kai (Member Question No. 7) Reply: The information sought is provided as follows: (a) From 2011 to 2015, the number of imported workers applied for and approved under
SLS is as follows:
2011 2012 2013 2014 2015 Number of imported workers applied for* 2 601 5 922 4 110 6 613 4 689
Number of imported workers approved* 980 1 942 1 847 2 722 2 880
S e s s i o n 2 1 L W B ( L ) - P a g e 2 2 8
* Applications received towards year-end may be approved in the following year, and hence the number of imported workers approved each year does not necessarily fully reflect the approval results of the applications for importation of workers in the year.
(b) According to information provided by the Immigration Department (ImmD), a
breakdown of the number of imported workers in Hong Kong under SLS from 2011 to 2015 by nationality is at Annex 1.
(c) Breakdowns of the number of imported workers approved from 2011 to 2015 by job
title are at Annexes 2 to 6. (d) The Labour Department (LD) does not keep a breakdown by industry of the average
wage of imported workers approved. (e) The Government has all along been closely monitoring the manpower demand and
supply for different industries, strengthening training initiatives and attracting new entrants. On the premise of according priority in employment to local workers, importation of labour is allowed on an appropriate, limited and targeted basis to relieve the manpower shortage in individual industries. Employers facing genuine difficulties in local recruitment can apply for importation of skilled workers on a limited scale under SLS, thereby addressing the manpower needs of individual industries with labour shortage. According to information provided by ImmD, as at end of 2015, there were a total of 4 169 imported workers working in Hong Kong under SLS, representing 0.1% of the labour force of about 3.93 million in Hong Kong from October to December 2015.
SLS is primarily administered by the Supplementary Labour Division (SLD) of LD.
Expenditure of SLD (excluding staff cost) from 2011-12 to 2015-16 is as follows:
2011-12
2012-13
2013-14
2014-15
2015-16 (Revised Estimate)
$140,000 $140,000 $110,000Note 1 $150,000Note 2 $240,000 Note 1: Excluding a one-off computer purchase at $50,000. Note 2: Excluding a one-off computer system enhancement at $200,000.
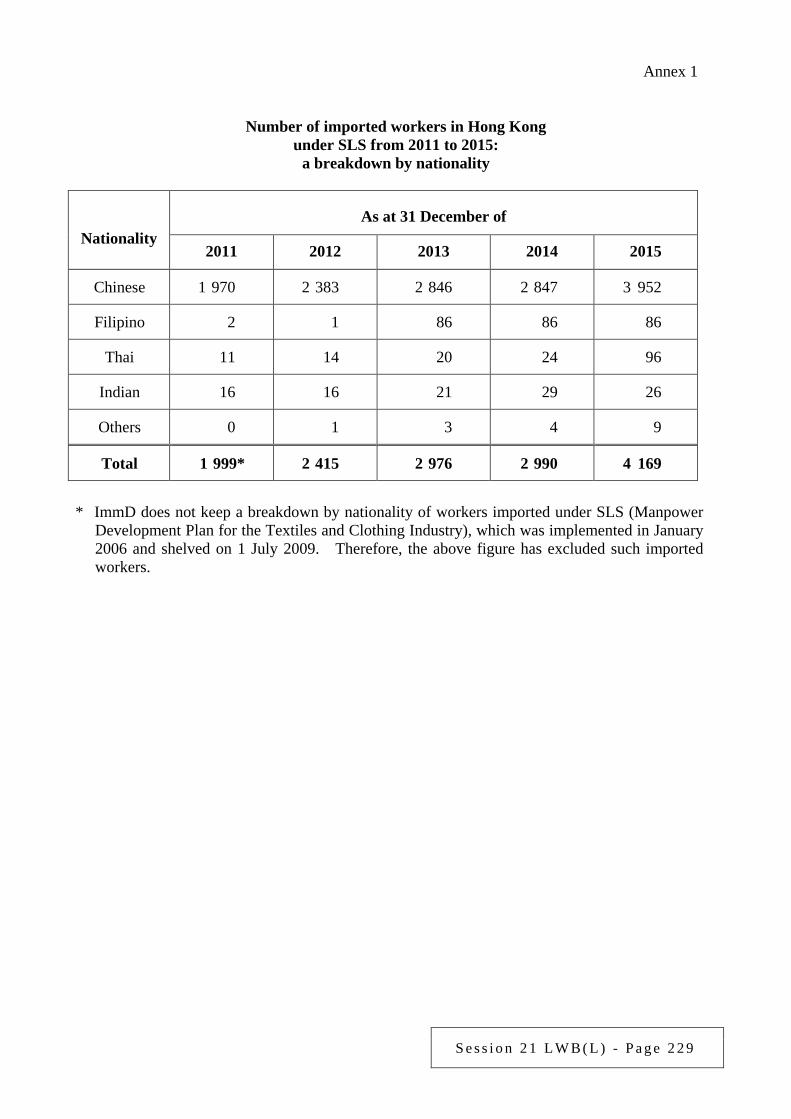
S e s s i o n 2 1 L W B ( L ) - P a g e 2 2 9
Annex 1
Number of imported workers in Hong Kong under SLS from 2011 to 2015:
a breakdown by nationality
Nationality As at 31 December of
2011 2012 2013 2014 2015
Chinese 1 970 2 383 2 846 2 847 3 952
Filipino 2 1 86 86 86
Thai 11 14 20 24 96
Indian 16 16 21 29 26
Others 0 1 3 4 9
Total 1 999* 2 415 2 976 2 990 4 169
* ImmD does not keep a breakdown by nationality of workers imported under SLS (Manpower
Development Plan for the Textiles and Clothing Industry), which was implemented in January 2006 and shelved on 1 July 2009. Therefore, the above figure has excluded such imported workers.
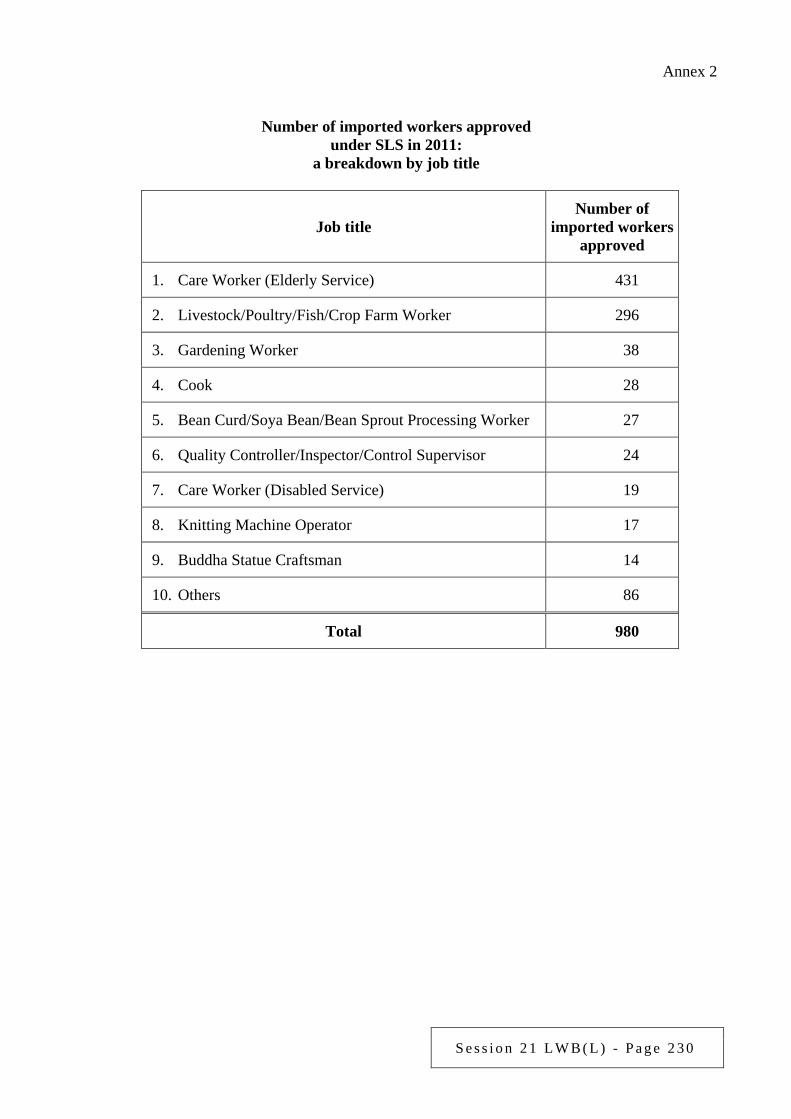
S e s s i o n 2 1 L W B ( L ) - P a g e 2 3 0
Annex 2
Number of imported workers approved under SLS in 2011:
a breakdown by job title
Job title Number of
imported workers approved
1. Care Worker (Elderly Service) 431
2. Livestock/Poultry/Fish/Crop Farm Worker 296
3. Gardening Worker 38
4. Cook 28
5. Bean Curd/Soya Bean/Bean Sprout Processing Worker 27
6. Quality Controller/Inspector/Control Supervisor 24
7. Care Worker (Disabled Service) 19
8. Knitting Machine Operator 17
9. Buddha Statue Craftsman 14
10. Others 86
Total 980
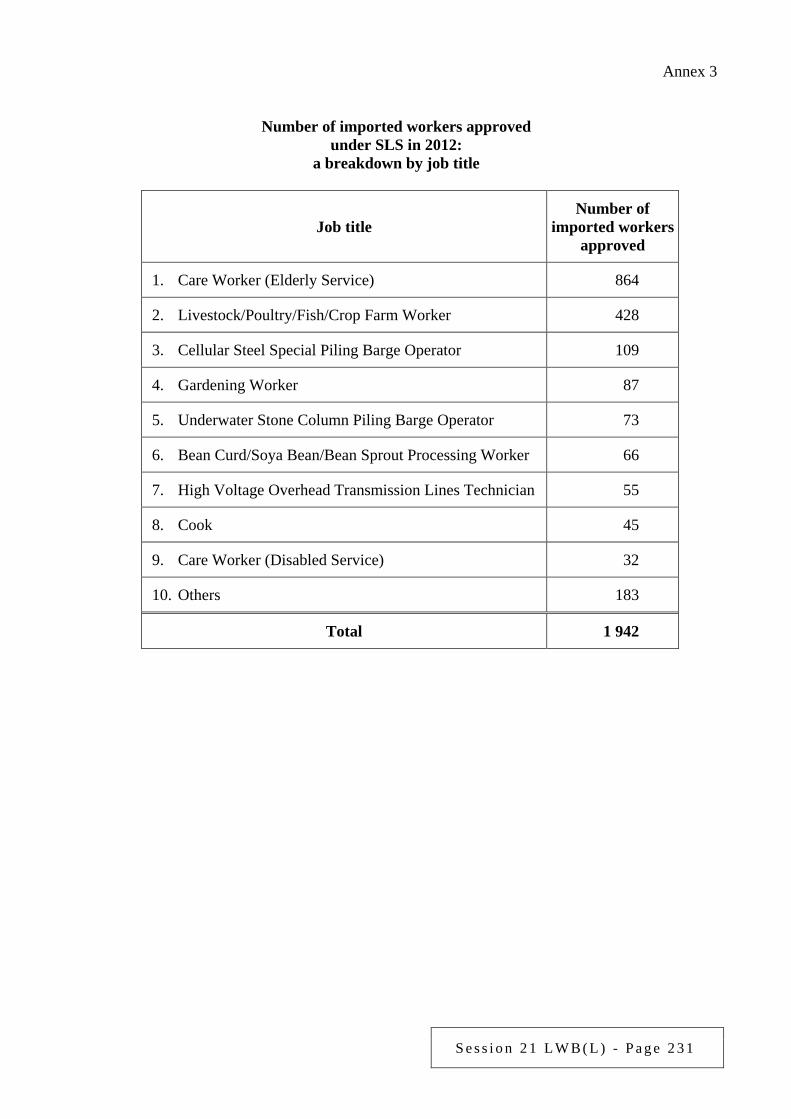
S e s s i o n 2 1 L W B ( L ) - P a g e 2 3 1
Annex 3
Number of imported workers approved under SLS in 2012:
a breakdown by job title
Job title Number of
imported workers approved
1. Care Worker (Elderly Service) 864
2. Livestock/Poultry/Fish/Crop Farm Worker 428
3. Cellular Steel Special Piling Barge Operator 109
4. Gardening Worker 87
5. Underwater Stone Column Piling Barge Operator 73
6. Bean Curd/Soya Bean/Bean Sprout Processing Worker 66
7. High Voltage Overhead Transmission Lines Technician 55
8. Cook 45
9. Care Worker (Disabled Service) 32
10. Others 183
Total 1 942
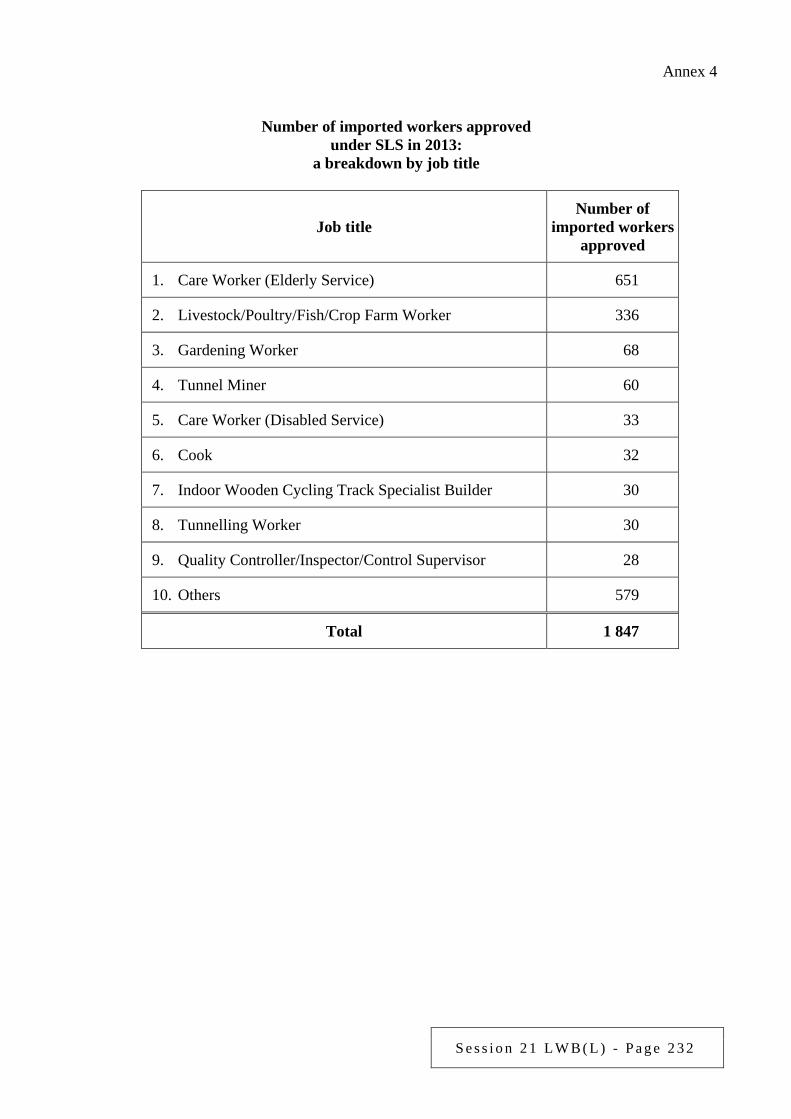
S e s s i o n 2 1 L W B ( L ) - P a g e 2 3 2
Annex 4
Number of imported workers approved under SLS in 2013:
a breakdown by job title
Job title Number of
imported workers approved
1. Care Worker (Elderly Service) 651
2. Livestock/Poultry/Fish/Crop Farm Worker 336
3. Gardening Worker 68
4. Tunnel Miner 60
5. Care Worker (Disabled Service) 33
6. Cook 32
7. Indoor Wooden Cycling Track Specialist Builder 30
8. Tunnelling Worker 30
9. Quality Controller/Inspector/Control Supervisor 28
10. Others 579
Total 1 847
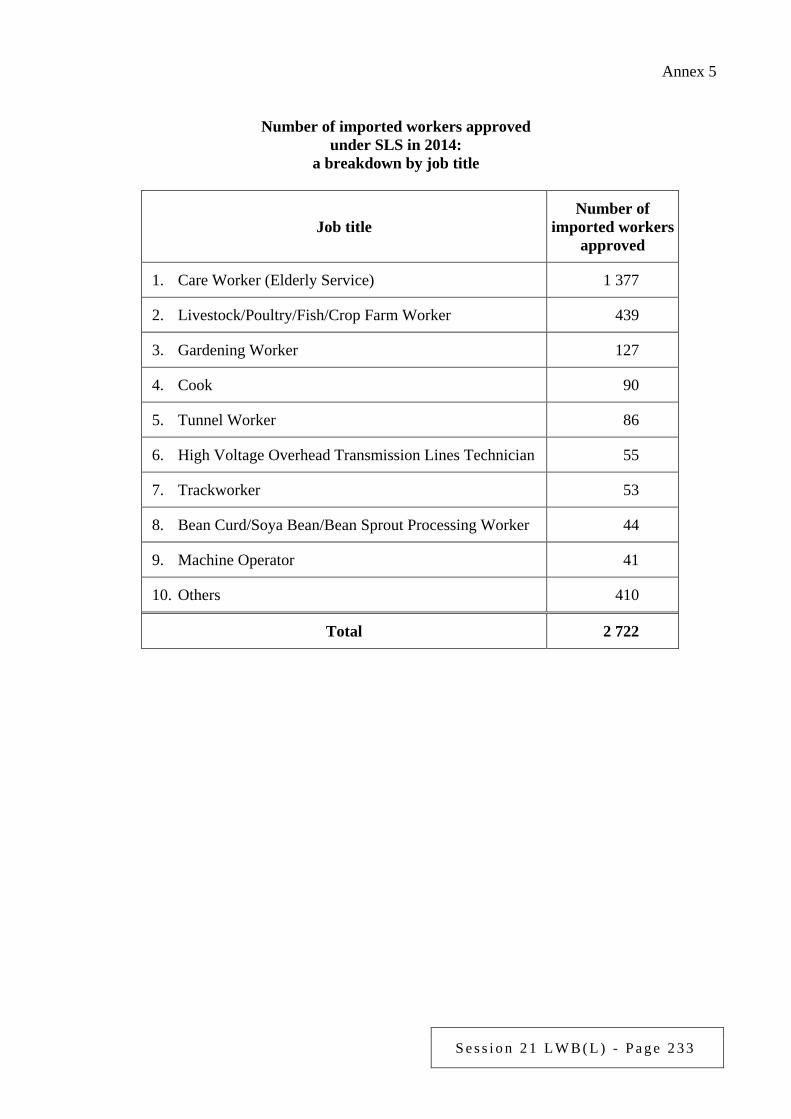
S e s s i o n 2 1 L W B ( L ) - P a g e 2 3 3
Annex 5
Number of imported workers approved under SLS in 2014:
a breakdown by job title
Job title Number of
imported workers approved
1. Care Worker (Elderly Service) 1 377
2. Livestock/Poultry/Fish/Crop Farm Worker 439
3. Gardening Worker 127
4. Cook 90
5. Tunnel Worker 86
6. High Voltage Overhead Transmission Lines Technician 55
7. Trackworker 53
8. Bean Curd/Soya Bean/Bean Sprout Processing Worker 44
9. Machine Operator 41
10. Others 410
Total 2 722
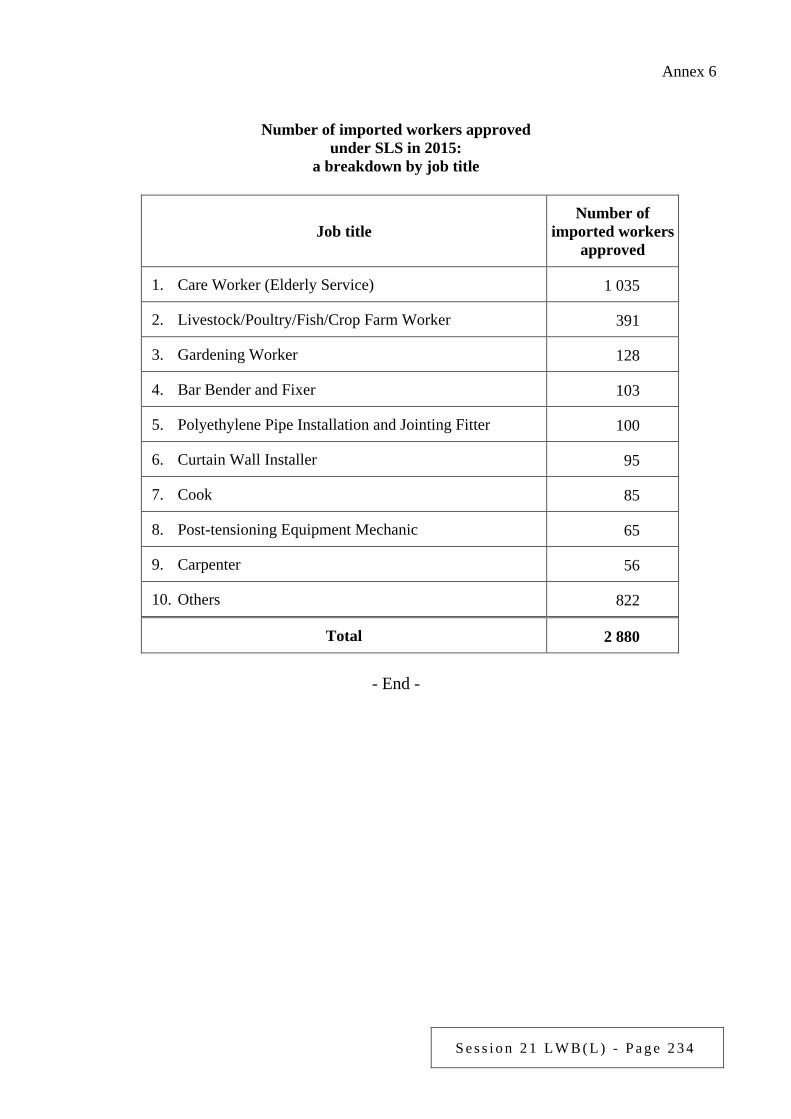
S e s s i o n 2 1 L W B ( L ) - P a g e 2 3 4
Annex 6
Number of imported workers approved under SLS in 2015:
a breakdown by job title
Job title Number of
imported workers approved
1. Care Worker (Elderly Service) 1 035
2. Livestock/Poultry/Fish/Crop Farm Worker 391
3. Gardening Worker 128
4. Bar Bender and Fixer 103
5. Polyethylene Pipe Installation and Jointing Fitter 100
6. Curtain Wall Installer 95
7. Cook 85
8. Post-tensioning Equipment Mechanic 65
9. Carpenter 56
10. Others 822
Total 2 880
- End -
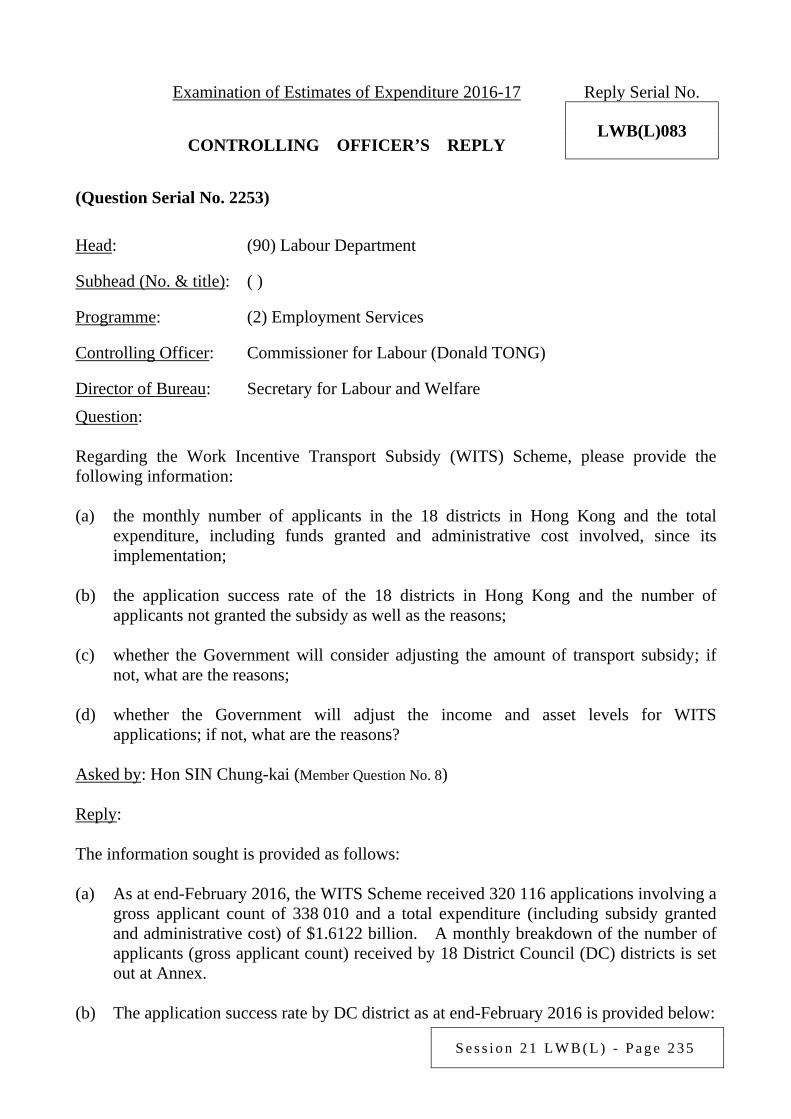
S e s s i o n 2 1 L W B ( L ) - P a g e 2 3 5
Examination of Estimates of Expenditure 2016-17 Reply Serial No.
LWB(L)083 CONTROLLING OFFICER’S REPLY (Question Serial No. 2253)
Head: (90) Labour Department
Subhead (No. & title): ( )
Programme: (2) Employment Services
Controlling Officer: Commissioner for Labour (Donald TONG)
Director of Bureau: Secretary for Labour and Welfare Question: Regarding the Work Incentive Transport Subsidy (WITS) Scheme, please provide the following information: (a) the monthly number of applicants in the 18 districts in Hong Kong and the total
expenditure, including funds granted and administrative cost involved, since its implementation;
(b) the application success rate of the 18 districts in Hong Kong and the number of
applicants not granted the subsidy as well as the reasons; (c) whether the Government will consider adjusting the amount of transport subsidy; if
not, what are the reasons; (d) whether the Government will adjust the income and asset levels for WITS
applications; if not, what are the reasons? Asked by: Hon SIN Chung-kai (Member Question No. 8) Reply: The information sought is provided as follows: (a) As at end-February 2016, the WITS Scheme received 320 116 applications involving a
gross applicant count of 338 010 and a total expenditure (including subsidy granted and administrative cost) of $1.6122 billion. A monthly breakdown of the number of applicants (gross applicant count) received by 18 District Council (DC) districts is set out at Annex.
(b) The application success rate by DC district as at end-February 2016 is provided below:
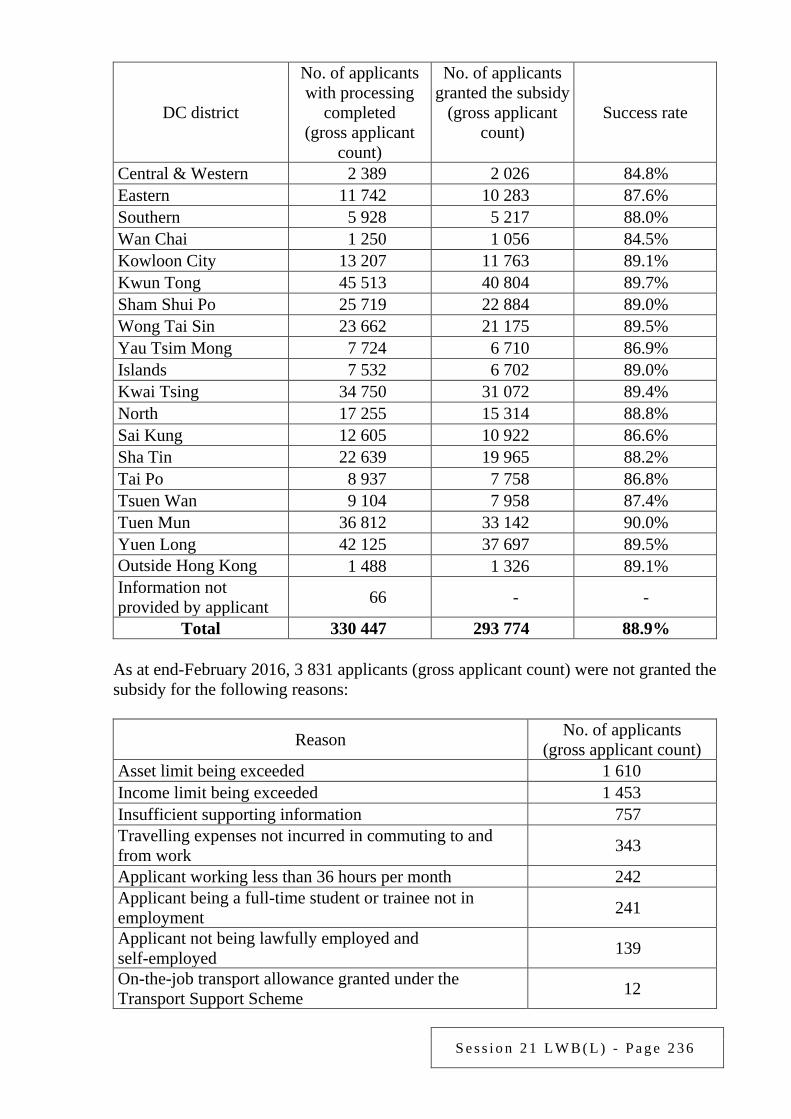
S e s s i o n 2 1 L W B ( L ) - P a g e 2 3 6
DC district
No. of applicants with processing
completed (gross applicant
count)
No. of applicants granted the subsidy
(gross applicant count)
Success rate
Central & Western 2 389 2 026 84.8% Eastern 11 742 10 283 87.6% Southern 5 928 5 217 88.0% Wan Chai 1 250 1 056 84.5% Kowloon City 13 207 11 763 89.1% Kwun Tong 45 513 40 804 89.7% Sham Shui Po 25 719 22 884 89.0% Wong Tai Sin 23 662 21 175 89.5% Yau Tsim Mong 7 724 6 710 86.9% Islands 7 532 6 702 89.0% Kwai Tsing 34 750 31 072 89.4% North 17 255 15 314 88.8% Sai Kung 12 605 10 922 86.6% Sha Tin 22 639 19 965 88.2% Tai Po 8 937 7 758 86.8% Tsuen Wan 9 104 7 958 87.4% Tuen Mun 36 812 33 142 90.0% Yuen Long 42 125 37 697 89.5% Outside Hong Kong 1 488 1 326 89.1% Information not provided by applicant 66 - -
Total 330 447 293 774 88.9% As at end-February 2016, 3 831 applicants (gross applicant count) were not granted the
subsidy for the following reasons:
Reason No. of applicants (gross applicant count)
Asset limit being exceeded 1 610 Income limit being exceeded 1 453 Insufficient supporting information 757 Travelling expenses not incurred in commuting to and from work 343
Applicant working less than 36 hours per month 242 Applicant being a full-time student or trainee not in employment 241
Applicant not being lawfully employed and self-employed 139
On-the-job transport allowance granted under the Transport Support Scheme 12
S e s s i o n 2 1 L W B ( L ) - P a g e 2 3 7
More than 1 reason may be applicable to the same gross applicant count.
(c) The Labour Department is conducting a comprehensive review of the WITS Scheme,
covering its objectives, eligibility criteria, level of subsidy rate, modus operandi and effectiveness.
(d) The income and asset limits of the WITS Scheme are adjusted in February every year
under the adjustment mechanism.
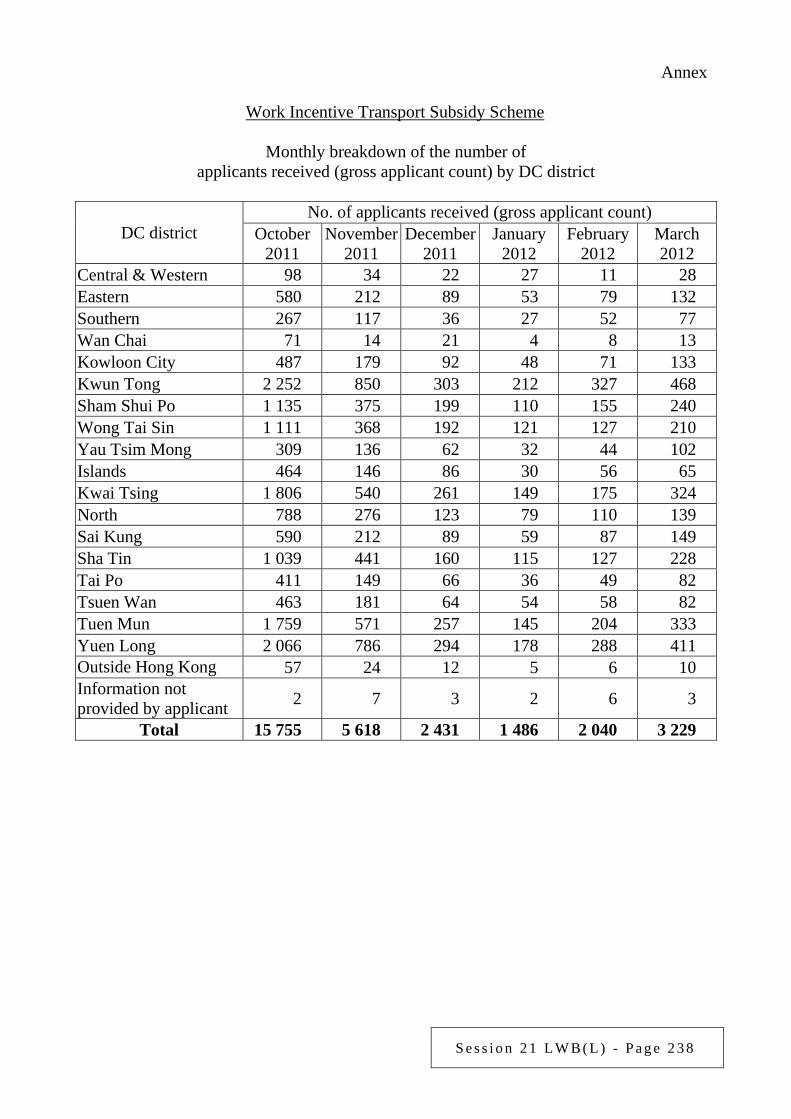
S e s s i o n 2 1 L W B ( L ) - P a g e 2 3 8
Annex
Work Incentive Transport Subsidy Scheme
Monthly breakdown of the number of applicants received (gross applicant count) by DC district
DC district No. of applicants received (gross applicant count)
October 2011
November 2011
December 2011
January 2012
February 2012
March 2012
Central & Western 98 34 22 27 11 28 Eastern 580 212 89 53 79 132 Southern 267 117 36 27 52 77 Wan Chai 71 14 21 4 8 13 Kowloon City 487 179 92 48 71 133 Kwun Tong 2 252 850 303 212 327 468 Sham Shui Po 1 135 375 199 110 155 240 Wong Tai Sin 1 111 368 192 121 127 210 Yau Tsim Mong 309 136 62 32 44 102 Islands 464 146 86 30 56 65 Kwai Tsing 1 806 540 261 149 175 324 North 788 276 123 79 110 139 Sai Kung 590 212 89 59 87 149 Sha Tin 1 039 441 160 115 127 228 Tai Po 411 149 66 36 49 82 Tsuen Wan 463 181 64 54 58 82 Tuen Mun 1 759 571 257 145 204 333 Yuen Long 2 066 786 294 178 288 411 Outside Hong Kong 57 24 12 5 6 10 Information not provided by applicant 2 7 3 2 6 3
Total 15 755 5 618 2 431 1 486 2 040 3 229
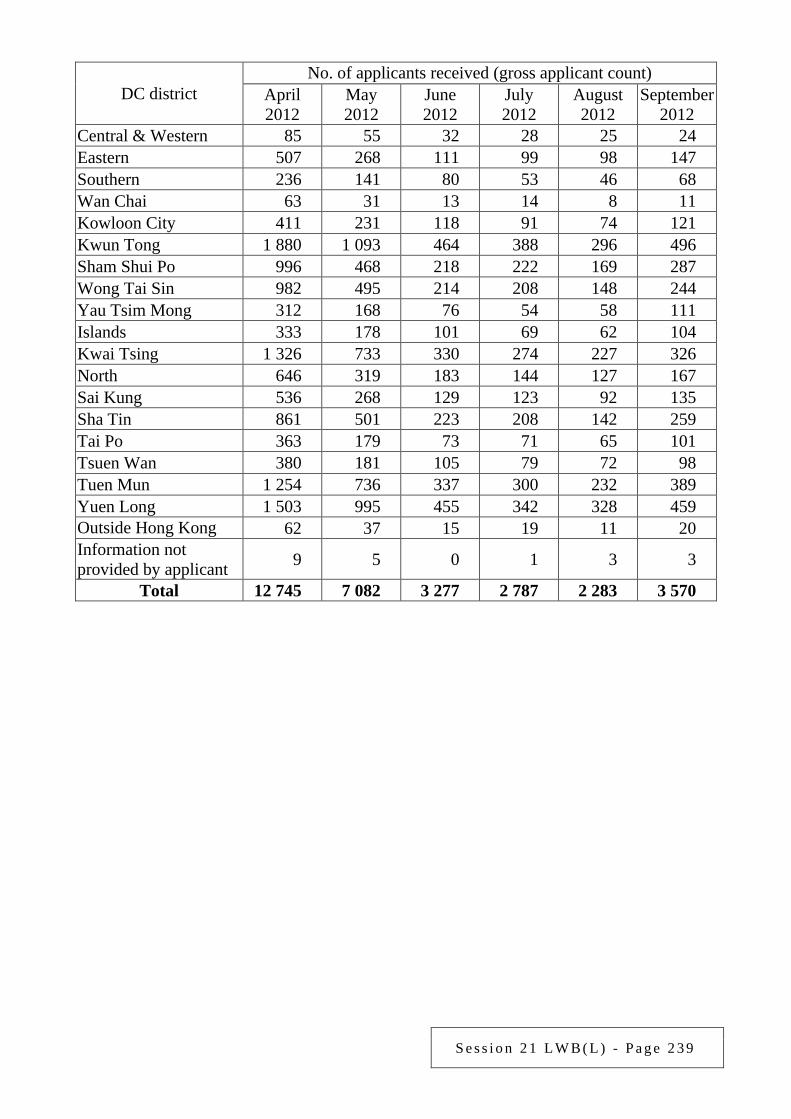
S e s s i o n 2 1 L W B ( L ) - P a g e 2 3 9
DC district No. of applicants received (gross applicant count)
April 2012
May 2012
June 2012
July 2012
August 2012
September 2012
Central & Western 85 55 32 28 25 24 Eastern 507 268 111 99 98 147 Southern 236 141 80 53 46 68 Wan Chai 63 31 13 14 8 11 Kowloon City 411 231 118 91 74 121 Kwun Tong 1 880 1 093 464 388 296 496 Sham Shui Po 996 468 218 222 169 287 Wong Tai Sin 982 495 214 208 148 244 Yau Tsim Mong 312 168 76 54 58 111 Islands 333 178 101 69 62 104 Kwai Tsing 1 326 733 330 274 227 326 North 646 319 183 144 127 167 Sai Kung 536 268 129 123 92 135 Sha Tin 861 501 223 208 142 259 Tai Po 363 179 73 71 65 101 Tsuen Wan 380 181 105 79 72 98 Tuen Mun 1 254 736 337 300 232 389 Yuen Long 1 503 995 455 342 328 459 Outside Hong Kong 62 37 15 19 11 20 Information not provided by applicant 9 5 0 1 3 3
Total 12 745 7 082 3 277 2 787 2 283 3 570

S e s s i o n 2 1 L W B ( L ) - P a g e 2 4 0
DC district No. of applicants received (gross applicant count)
October 2012
November 2012
December 2012
January 2013
February 2013
March 2013
Central & Western 76 37 29 35 18 27 Eastern 397 220 133 148 86 138 Southern 188 108 56 90 44 61 Wan Chai 42 35 15 19 9 6 Kowloon City 375 195 119 165 75 150 Kwun Tong 1 547 845 512 634 258 585 Sham Shui Po 825 473 331 376 182 290 Wong Tai Sin 737 435 232 289 155 263 Yau Tsim Mong 276 146 73 110 73 112 Islands 250 151 83 101 51 86 Kwai Tsing 1 164 580 385 413 216 331 North 535 323 176 249 130 181 Sai Kung 408 201 127 166 79 146 Sha Tin 707 405 241 259 164 303 Tai Po 289 174 82 103 70 119 Tsuen Wan 303 165 123 109 52 100 Tuen Mun 1 148 537 404 439 211 392 Yuen Long 1 216 668 440 503 239 468 Outside Hong Kong 47 30 18 20 10 20 Information not provided by applicant 4 2 2 3 2 2
Total 10 534 5 730 3 581 4 231 2 124 3 780
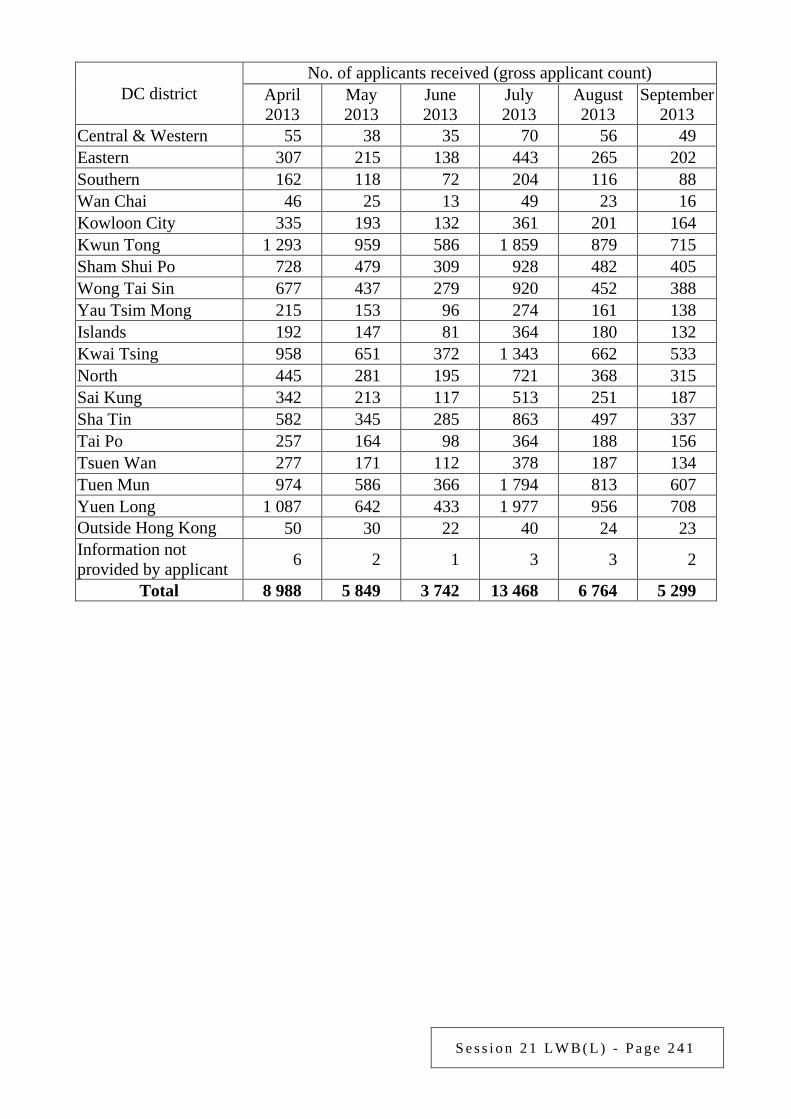
S e s s i o n 2 1 L W B ( L ) - P a g e 2 4 1
DC district No. of applicants received (gross applicant count)
April 2013
May 2013
June 2013
July 2013
August 2013
September 2013
Central & Western 55 38 35 70 56 49 Eastern 307 215 138 443 265 202 Southern 162 118 72 204 116 88 Wan Chai 46 25 13 49 23 16 Kowloon City 335 193 132 361 201 164 Kwun Tong 1 293 959 586 1 859 879 715 Sham Shui Po 728 479 309 928 482 405 Wong Tai Sin 677 437 279 920 452 388 Yau Tsim Mong 215 153 96 274 161 138 Islands 192 147 81 364 180 132 Kwai Tsing 958 651 372 1 343 662 533 North 445 281 195 721 368 315 Sai Kung 342 213 117 513 251 187 Sha Tin 582 345 285 863 497 337 Tai Po 257 164 98 364 188 156 Tsuen Wan 277 171 112 378 187 134 Tuen Mun 974 586 366 1 794 813 607 Yuen Long 1 087 642 433 1 977 956 708 Outside Hong Kong 50 30 22 40 24 23 Information not provided by applicant 6 2 1 3 3 2
Total 8 988 5 849 3 742 13 468 6 764 5 299
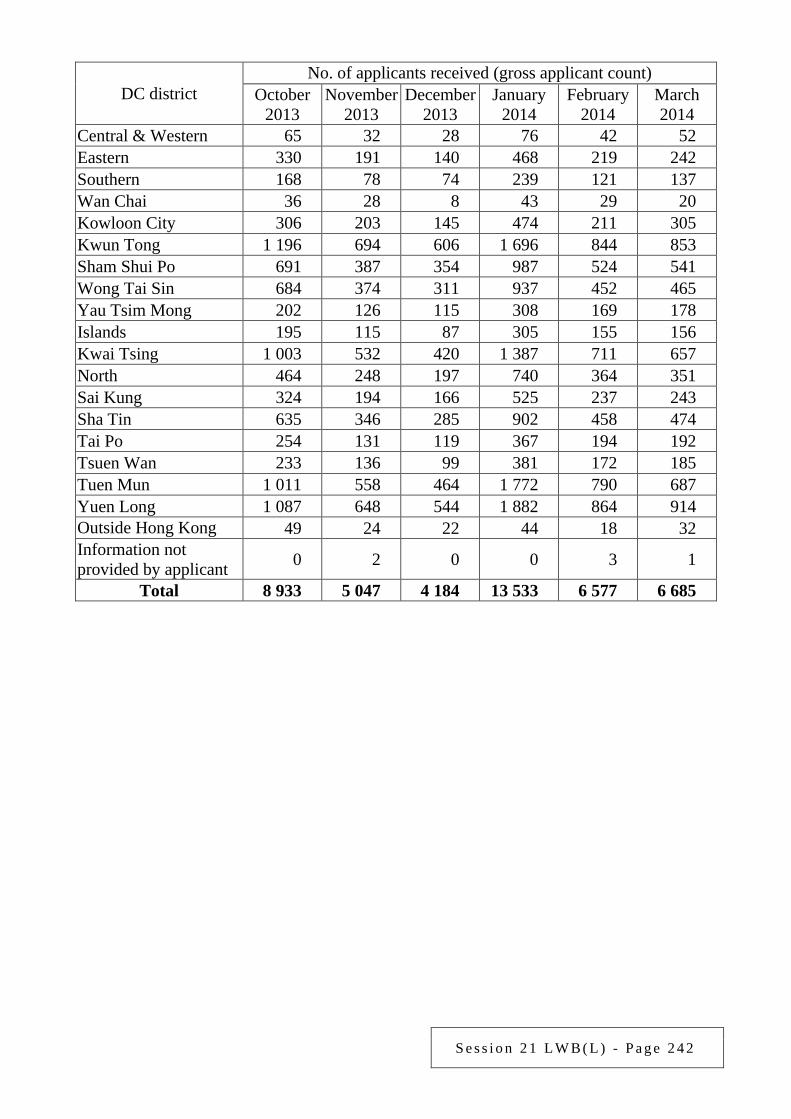
S e s s i o n 2 1 L W B ( L ) - P a g e 2 4 2
DC district No. of applicants received (gross applicant count)
October 2013
November 2013
December 2013
January 2014
February 2014
March 2014
Central & Western 65 32 28 76 42 52 Eastern 330 191 140 468 219 242 Southern 168 78 74 239 121 137 Wan Chai 36 28 8 43 29 20 Kowloon City 306 203 145 474 211 305 Kwun Tong 1 196 694 606 1 696 844 853 Sham Shui Po 691 387 354 987 524 541 Wong Tai Sin 684 374 311 937 452 465 Yau Tsim Mong 202 126 115 308 169 178 Islands 195 115 87 305 155 156 Kwai Tsing 1 003 532 420 1 387 711 657 North 464 248 197 740 364 351 Sai Kung 324 194 166 525 237 243 Sha Tin 635 346 285 902 458 474 Tai Po 254 131 119 367 194 192 Tsuen Wan 233 136 99 381 172 185 Tuen Mun 1 011 558 464 1 772 790 687 Yuen Long 1 087 648 544 1 882 864 914 Outside Hong Kong 49 24 22 44 18 32 Information not provided by applicant 0 2 0 0 3 1
Total 8 933 5 047 4 184 13 533 6 577 6 685
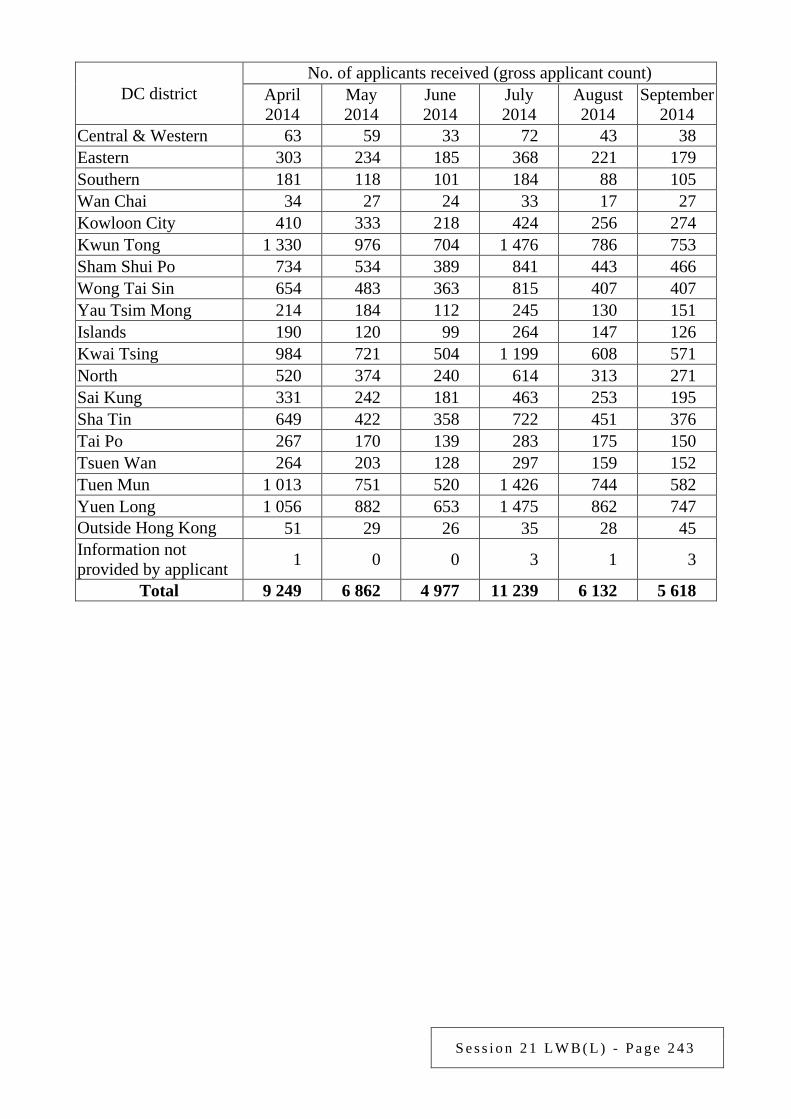
S e s s i o n 2 1 L W B ( L ) - P a g e 2 4 3
DC district No. of applicants received (gross applicant count)
April 2014
May 2014
June 2014
July 2014
August 2014
September 2014
Central & Western 63 59 33 72 43 38 Eastern 303 234 185 368 221 179 Southern 181 118 101 184 88 105 Wan Chai 34 27 24 33 17 27 Kowloon City 410 333 218 424 256 274 Kwun Tong 1 330 976 704 1 476 786 753 Sham Shui Po 734 534 389 841 443 466 Wong Tai Sin 654 483 363 815 407 407 Yau Tsim Mong 214 184 112 245 130 151 Islands 190 120 99 264 147 126 Kwai Tsing 984 721 504 1 199 608 571 North 520 374 240 614 313 271 Sai Kung 331 242 181 463 253 195 Sha Tin 649 422 358 722 451 376 Tai Po 267 170 139 283 175 150 Tsuen Wan 264 203 128 297 159 152 Tuen Mun 1 013 751 520 1 426 744 582 Yuen Long 1 056 882 653 1 475 862 747 Outside Hong Kong 51 29 26 35 28 45 Information not provided by applicant 1 0 0 3 1 3
Total 9 249 6 862 4 977 11 239 6 132 5 618
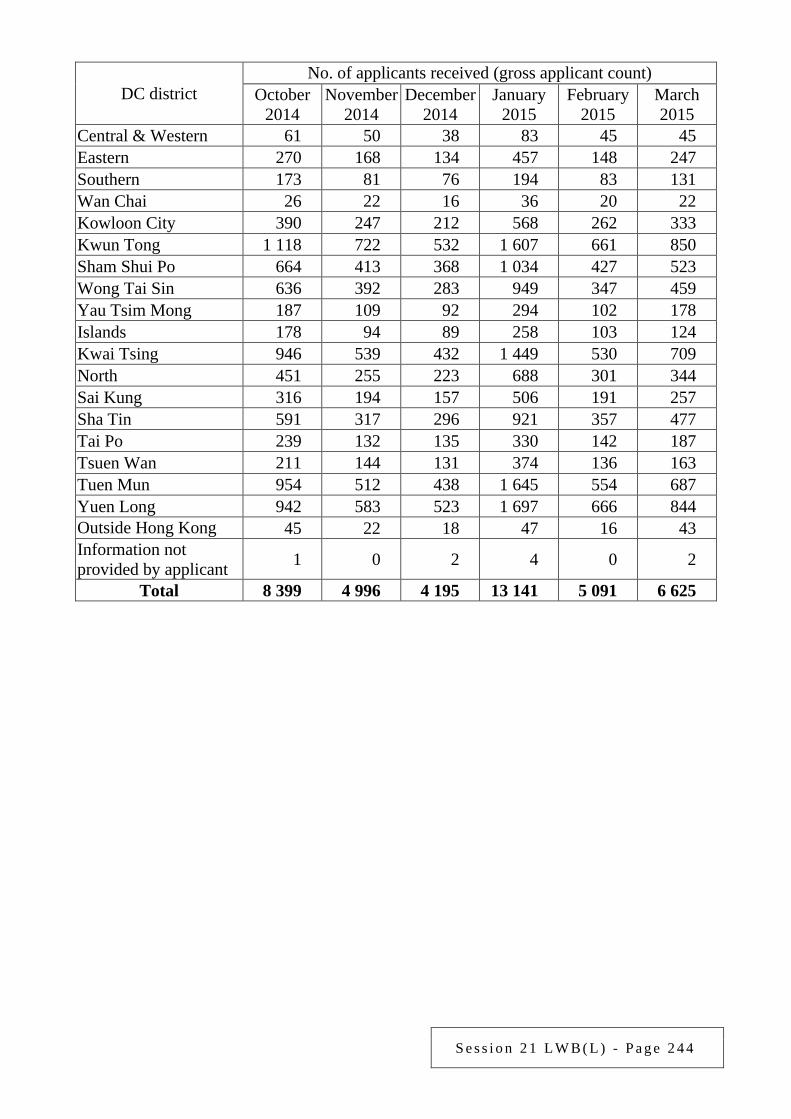
S e s s i o n 2 1 L W B ( L ) - P a g e 2 4 4
DC district No. of applicants received (gross applicant count)
October 2014
November 2014
December 2014
January 2015
February 2015
March 2015
Central & Western 61 50 38 83 45 45 Eastern 270 168 134 457 148 247 Southern 173 81 76 194 83 131 Wan Chai 26 22 16 36 20 22 Kowloon City 390 247 212 568 262 333 Kwun Tong 1 118 722 532 1 607 661 850 Sham Shui Po 664 413 368 1 034 427 523 Wong Tai Sin 636 392 283 949 347 459 Yau Tsim Mong 187 109 92 294 102 178 Islands 178 94 89 258 103 124 Kwai Tsing 946 539 432 1 449 530 709 North 451 255 223 688 301 344 Sai Kung 316 194 157 506 191 257 Sha Tin 591 317 296 921 357 477 Tai Po 239 132 135 330 142 187 Tsuen Wan 211 144 131 374 136 163 Tuen Mun 954 512 438 1 645 554 687 Yuen Long 942 583 523 1 697 666 844 Outside Hong Kong 45 22 18 47 16 43 Information not provided by applicant 1 0 2 4 0 2
Total 8 399 4 996 4 195 13 141 5 091 6 625
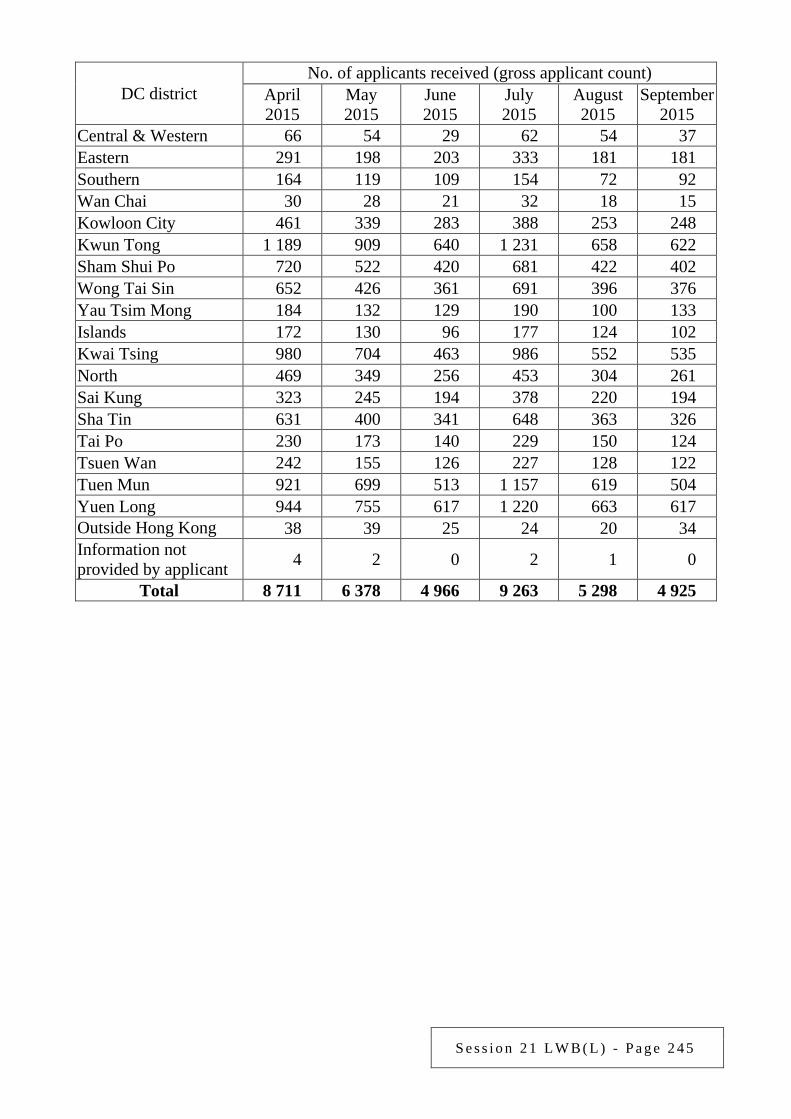
S e s s i o n 2 1 L W B ( L ) - P a g e 2 4 5
DC district No. of applicants received (gross applicant count)
April 2015
May 2015
June 2015
July 2015
August 2015
September 2015
Central & Western 66 54 29 62 54 37 Eastern 291 198 203 333 181 181 Southern 164 119 109 154 72 92 Wan Chai 30 28 21 32 18 15 Kowloon City 461 339 283 388 253 248 Kwun Tong 1 189 909 640 1 231 658 622 Sham Shui Po 720 522 420 681 422 402 Wong Tai Sin 652 426 361 691 396 376 Yau Tsim Mong 184 132 129 190 100 133 Islands 172 130 96 177 124 102 Kwai Tsing 980 704 463 986 552 535 North 469 349 256 453 304 261 Sai Kung 323 245 194 378 220 194 Sha Tin 631 400 341 648 363 326 Tai Po 230 173 140 229 150 124 Tsuen Wan 242 155 126 227 128 122 Tuen Mun 921 699 513 1 157 619 504 Yuen Long 944 755 617 1 220 663 617 Outside Hong Kong 38 39 25 24 20 34 Information not provided by applicant 4 2 0 2 1 0
Total 8 711 6 378 4 966 9 263 5 298 4 925
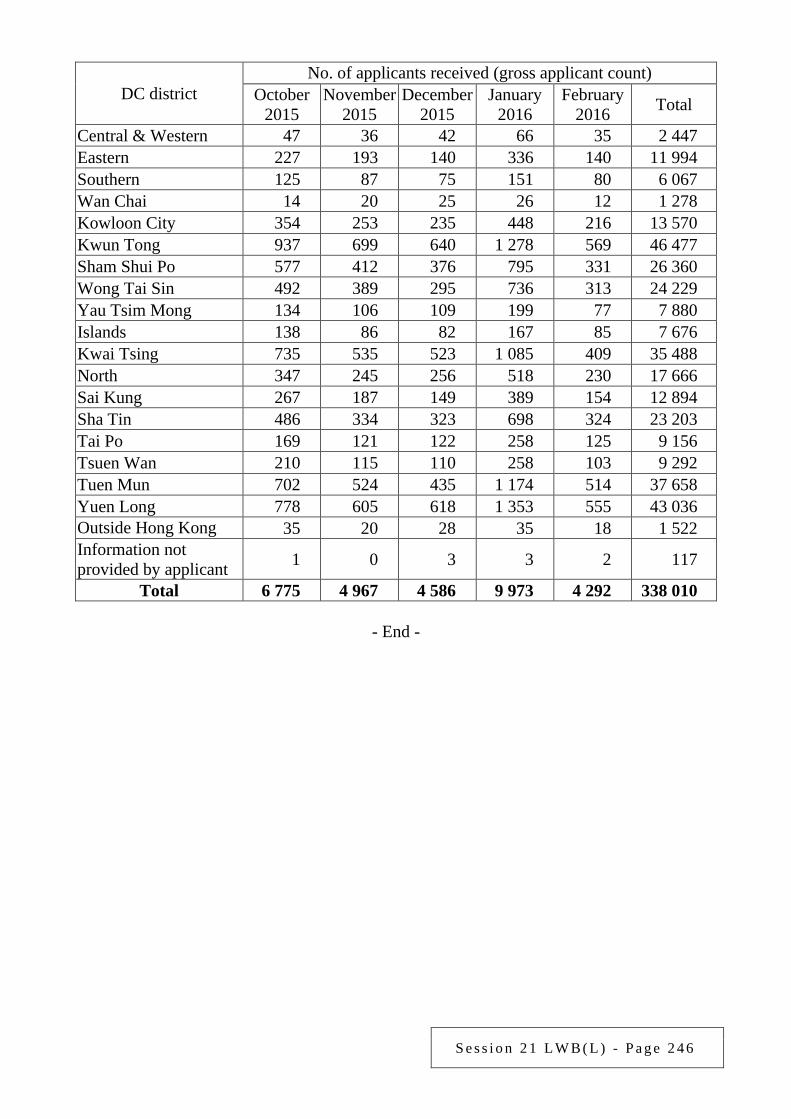
S e s s i o n 2 1 L W B ( L ) - P a g e 2 4 6
DC district No. of applicants received (gross applicant count)
October 2015
November 2015
December 2015
January 2016
February 2016 Total
Central & Western 47 36 42 66 35 2 447 Eastern 227 193 140 336 140 11 994 Southern 125 87 75 151 80 6 067 Wan Chai 14 20 25 26 12 1 278 Kowloon City 354 253 235 448 216 13 570 Kwun Tong 937 699 640 1 278 569 46 477 Sham Shui Po 577 412 376 795 331 26 360 Wong Tai Sin 492 389 295 736 313 24 229 Yau Tsim Mong 134 106 109 199 77 7 880 Islands 138 86 82 167 85 7 676 Kwai Tsing 735 535 523 1 085 409 35 488 North 347 245 256 518 230 17 666 Sai Kung 267 187 149 389 154 12 894 Sha Tin 486 334 323 698 324 23 203 Tai Po 169 121 122 258 125 9 156 Tsuen Wan 210 115 110 258 103 9 292 Tuen Mun 702 524 435 1 174 514 37 658 Yuen Long 778 605 618 1 353 555 43 036 Outside Hong Kong 35 20 28 35 18 1 522 Information not provided by applicant 1 0 3 3 2 117
Total 6 775 4 967 4 586 9 973 4 292 338 010
- End -
S e s s i o n 2 1 L W B ( L ) - P a g e 2 4 7
Examination of Estimates of Expenditure 2016-17 Reply Serial No.
LWB(L)084 CONTROLLING OFFICER’S REPLY (Question Serial No. 2254)
Head: (90) Labour Department
Subhead (No. & title): ( )
Programme: (4) Employees’ Rights and Benefits
Controlling Officer: Commissioner for Labour (Donald TONG)
Director of Bureau: Secretary for Labour and Welfare Question: Regarding Statutory Minimum Wage (SMW), please provide the following information: (a) the number of inspections conducted by the Government in the past 3 years; (b) the number of non-compliance cases detected by the Government in the past 3 years; (c) the number of warnings issued, prosecutions taken out and convictions secured by the
Government in the past 3 years. Will additional resources be allocated to conduct more educational work or inspections in light of the figures? If not, what are the reasons?
Asked by: Hon SIN Chung-kai (Member Question No. 9) Reply: The information sought is provided as follows: (a) From 2013 to 2015, the Labour Department (LD) conducted 127 294 workplace
inspections to establishments of various industries to check employers’ compliance with labour laws such as the Minimum Wage Ordinance (MWO).
(b) Over the above period, including reported cases, 34 cases involving suspected
violation of MWO were detected. Subsequent follow-up actions on all such cases confirmed that employees of most cases had received SMW or had recovered the shortfall in wages.
(c) Over the above period, LD issued 6 warnings to employers suspected to have
contravened MWO and secured 7 convictions for contravention of MWO. Since the implementation of SMW in May 2011, the state of compliance with MWO has been

S e s s i o n 2 1 L W B ( L ) - P a g e 2 4 8
satisfactory. LD will continue to carry out publicity activities and workplace inspections, and will flexibly deploy resources to strengthen the related work as and when necessary.
- End -
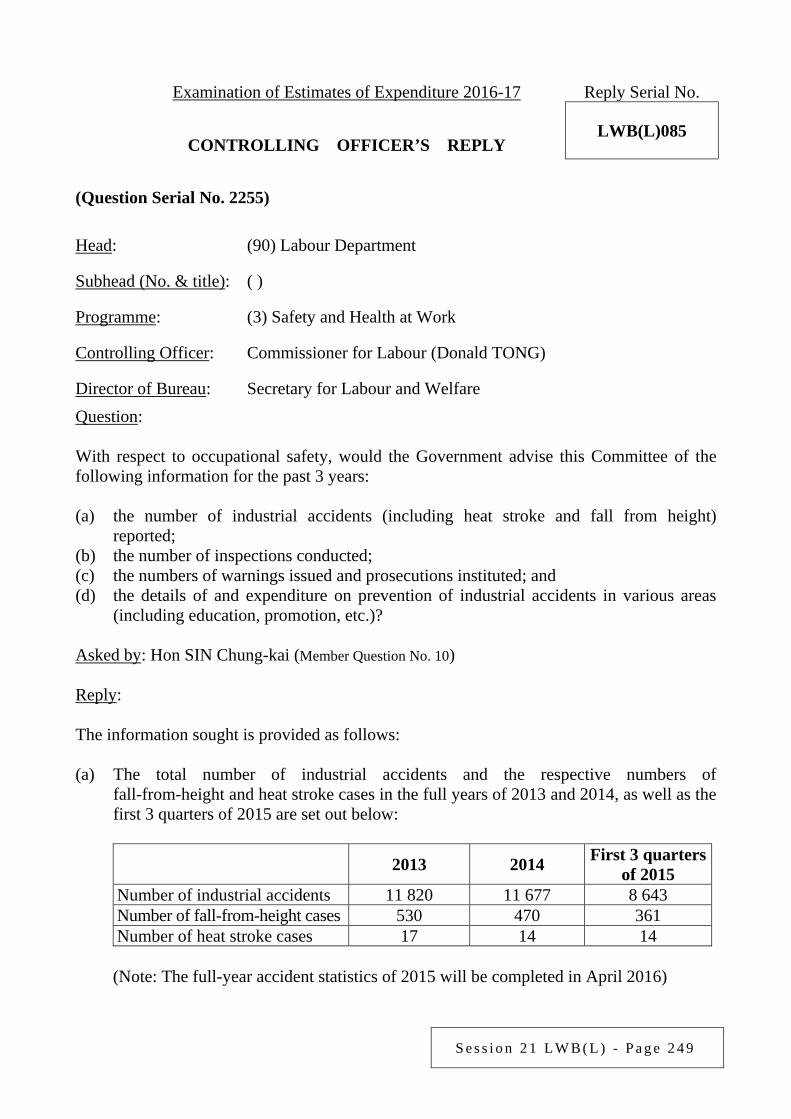
S e s s i o n 2 1 L W B ( L ) - P a g e 2 4 9
Examination of Estimates of Expenditure 2016-17 Reply Serial No.
LWB(L)085 CONTROLLING OFFICER’S REPLY (Question Serial No. 2255)
Head: (90) Labour Department
Subhead (No. & title): ( )
Programme: (3) Safety and Health at Work
Controlling Officer: Commissioner for Labour (Donald TONG)
Director of Bureau: Secretary for Labour and Welfare Question: With respect to occupational safety, would the Government advise this Committee of the following information for the past 3 years: (a) the number of industrial accidents (including heat stroke and fall from height)
reported; (b) the number of inspections conducted; (c) the numbers of warnings issued and prosecutions instituted; and (d) the details of and expenditure on prevention of industrial accidents in various areas
(including education, promotion, etc.)? Asked by: Hon SIN Chung-kai (Member Question No. 10) Reply: The information sought is provided as follows: (a) The total number of industrial accidents and the respective numbers of
fall-from-height and heat stroke cases in the full years of 2013 and 2014, as well as the first 3 quarters of 2015 are set out below:
2013 2014 First 3 quarters of 2015
Number of industrial accidents 11 820 11 677 8 643 Number of fall-from-height cases 530 470 361 Number of heat stroke cases 17 14 14
(Note: The full-year accident statistics of 2015 will be completed in April 2016)
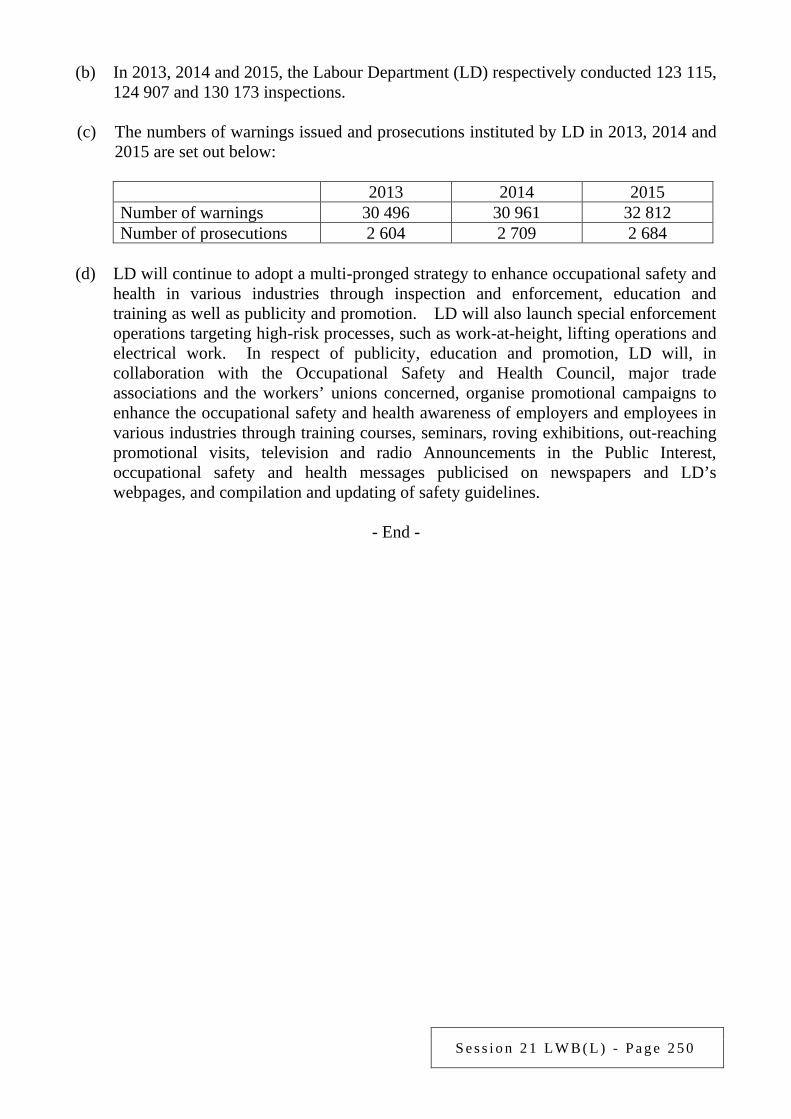
S e s s i o n 2 1 L W B ( L ) - P a g e 2 5 0
(b) In 2013, 2014 and 2015, the Labour Department (LD) respectively conducted 123 115, 124 907 and 130 173 inspections.
(c) The numbers of warnings issued and prosecutions instituted by LD in 2013, 2014 and
2015 are set out below:
2013 2014 2015 Number of warnings 30 496 30 961 32 812 Number of prosecutions 2 604 2 709 2 684
(d) LD will continue to adopt a multi-pronged strategy to enhance occupational safety and
health in various industries through inspection and enforcement, education and training as well as publicity and promotion. LD will also launch special enforcement operations targeting high-risk processes, such as work-at-height, lifting operations and electrical work. In respect of publicity, education and promotion, LD will, in collaboration with the Occupational Safety and Health Council, major trade associations and the workers’ unions concerned, organise promotional campaigns to enhance the occupational safety and health awareness of employers and employees in various industries through training courses, seminars, roving exhibitions, out-reaching promotional visits, television and radio Announcements in the Public Interest, occupational safety and health messages publicised on newspapers and LD’s webpages, and compilation and updating of safety guidelines.
- End -
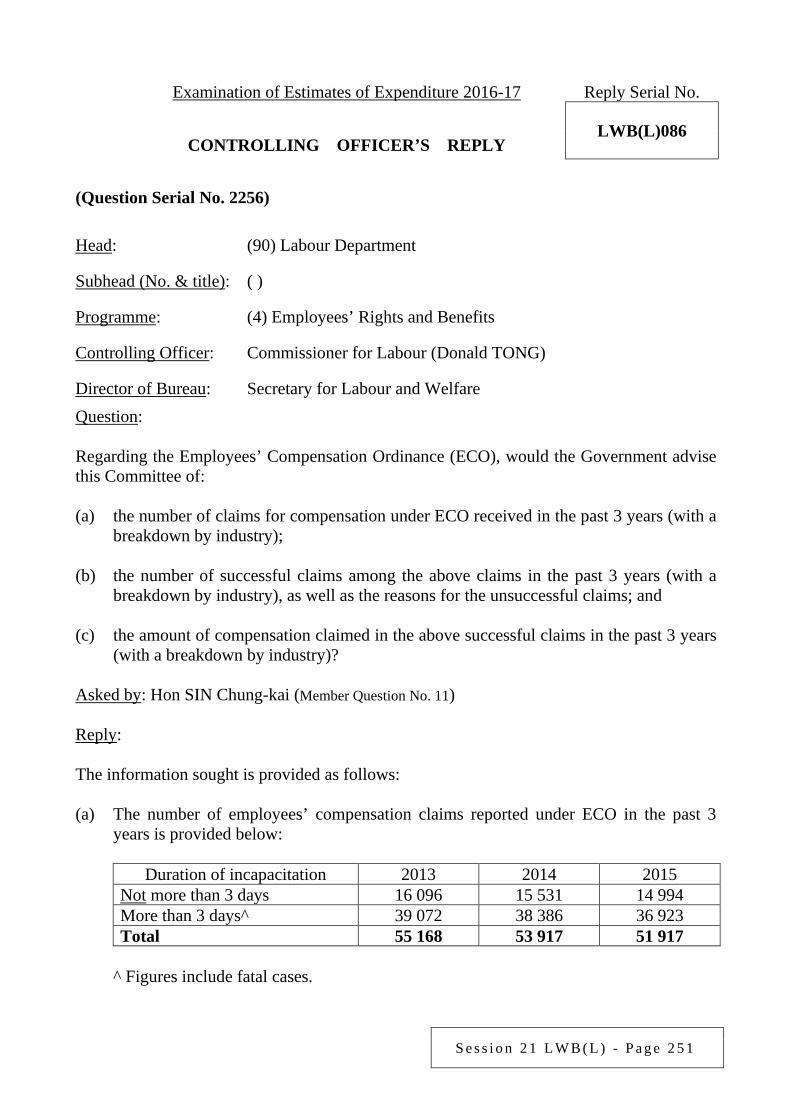
S e s s i o n 2 1 L W B ( L ) - P a g e 2 5 1
Examination of Estimates of Expenditure 2016-17 Reply Serial No.
LWB(L)086 CONTROLLING OFFICER’S REPLY (Question Serial No. 2256)
Head: (90) Labour Department
Subhead (No. & title): ( )
Programme: (4) Employees’ Rights and Benefits
Controlling Officer: Commissioner for Labour (Donald TONG)
Director of Bureau: Secretary for Labour and Welfare Question: Regarding the Employees’ Compensation Ordinance (ECO), would the Government advise this Committee of: (a) the number of claims for compensation under ECO received in the past 3 years (with a
breakdown by industry); (b) the number of successful claims among the above claims in the past 3 years (with a
breakdown by industry), as well as the reasons for the unsuccessful claims; and (c) the amount of compensation claimed in the above successful claims in the past 3 years
(with a breakdown by industry)? Asked by: Hon SIN Chung-kai (Member Question No. 11) Reply: The information sought is provided as follows: (a) The number of employees’ compensation claims reported under ECO in the past 3
years is provided below:
Duration of incapacitation 2013 2014 2015 Not more than 3 days 16 096 15 531 14 994 More than 3 days^ 39 072 38 386 36 923 Total 55 168 53 917 51 917
^ Figures include fatal cases.
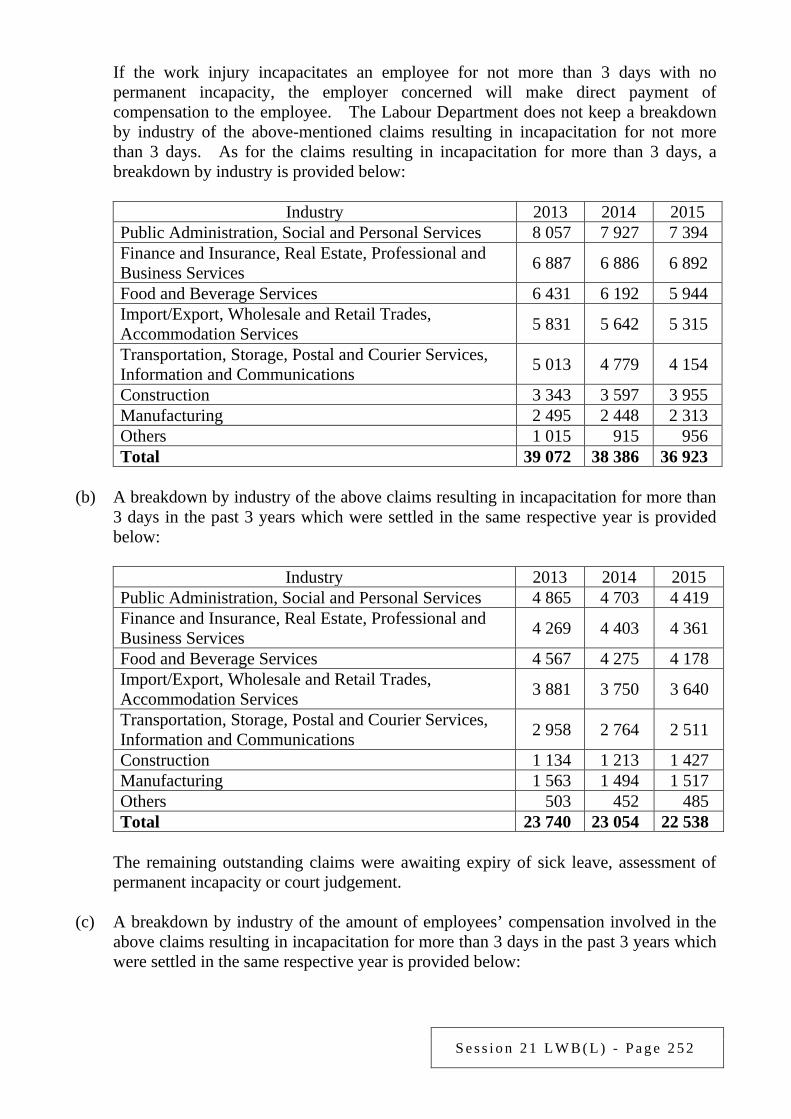
S e s s i o n 2 1 L W B ( L ) - P a g e 2 5 2
If the work injury incapacitates an employee for not more than 3 days with no permanent incapacity, the employer concerned will make direct payment of compensation to the employee. The Labour Department does not keep a breakdown by industry of the above-mentioned claims resulting in incapacitation for not more than 3 days. As for the claims resulting in incapacitation for more than 3 days, a breakdown by industry is provided below:
Industry 2013 2014 2015
Public Administration, Social and Personal Services 8 057 7 927 7 394 Finance and Insurance, Real Estate, Professional and Business Services 6 887 6 886 6 892
Food and Beverage Services 6 431 6 192 5 944 Import/Export, Wholesale and Retail Trades, Accommodation Services 5 831 5 642 5 315
Transportation, Storage, Postal and Courier Services, Information and Communications 5 013 4 779 4 154
Construction 3 343 3 597 3 955 Manufacturing 2 495 2 448 2 313 Others 1 015 915 956 Total 39 072 38 386 36 923
(b) A breakdown by industry of the above claims resulting in incapacitation for more than
3 days in the past 3 years which were settled in the same respective year is provided below:
Industry 2013 2014 2015
Public Administration, Social and Personal Services 4 865 4 703 4 419 Finance and Insurance, Real Estate, Professional and Business Services 4 269 4 403 4 361
Food and Beverage Services 4 567 4 275 4 178 Import/Export, Wholesale and Retail Trades, Accommodation Services 3 881 3 750 3 640
Transportation, Storage, Postal and Courier Services, Information and Communications 2 958 2 764 2 511
Construction 1 134 1 213 1 427 Manufacturing 1 563 1 494 1 517 Others 503 452 485 Total 23 740 23 054 22 538
The remaining outstanding claims were awaiting expiry of sick leave, assessment of
permanent incapacity or court judgement. (c) A breakdown by industry of the amount of employees’ compensation involved in the
above claims resulting in incapacitation for more than 3 days in the past 3 years which were settled in the same respective year is provided below:
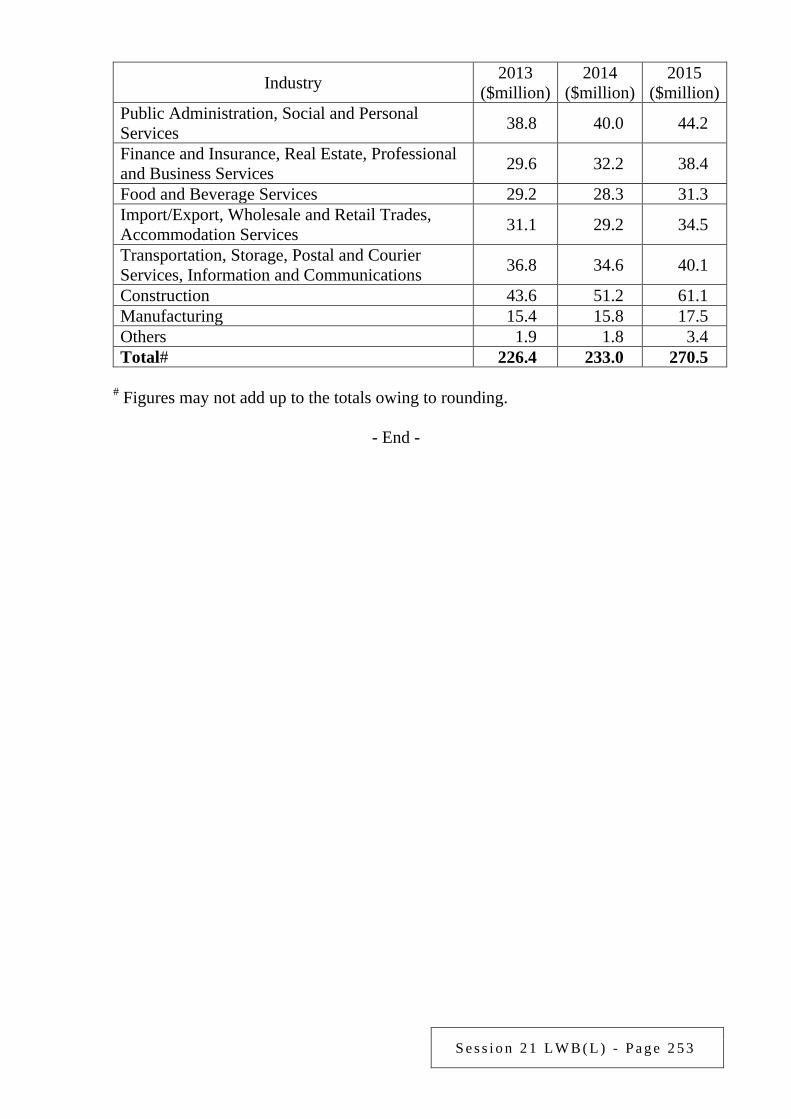
S e s s i o n 2 1 L W B ( L ) - P a g e 2 5 3
Industry 2013 ($million)
2014 ($million)
2015 ($million)
Public Administration, Social and Personal Services 38.8 40.0 44.2
Finance and Insurance, Real Estate, Professional and Business Services 29.6 32.2 38.4
Food and Beverage Services 29.2 28.3 31.3 Import/Export, Wholesale and Retail Trades, Accommodation Services 31.1 29.2 34.5
Transportation, Storage, Postal and Courier Services, Information and Communications 36.8 34.6 40.1
Construction 43.6 51.2 61.1 Manufacturing 15.4 15.8 17.5 Others 1.9 1.8 3.4 Total# 226.4 233.0 270.5
# Figures may not add up to the totals owing to rounding.
- End -

S e s s i o n 2 1 L W B ( L ) - P a g e 2 5 4
Examination of Estimates of Expenditure 2016-17 Reply Serial No.
LWB(L)087 CONTROLLING OFFICER’S REPLY (Question Serial No. 2257)
Head: (90) Labour Department
Subhead (No. & title): ( )
Programme: (4) Employees’ Rights and Benefits
Controlling Officer: Commissioner for Labour (Donald TONG)
Director of Bureau: Secretary for Labour and Welfare Question: With respect to the productivity assessment mechanism for persons with disabilities under the Minimum Wage Ordinance (Cap. 608) (MWO), would the Government advise this Committee of: (a) the number of persons with disabilities undergoing the productivity assessment since
the implementation of Statutory Minimum Wage (SMW) (calculated on a yearly basis);
(b) the respective numbers of persons whose assessed degree of productivity are in the
lower quartile, at the median, at the average level and in the upper quartile (with a breakdown by industry); and
(c) whether the Government has considered offering subsidy to persons with disabilities
so that they can receive the minimum wage? Has the Government assessed the number of recipients if the measure is implemented? What is the expenditure involved?
Asked by: Hon SIN Chung-kai (Member Question No. 12) Reply: The information sought is provided as follows: (a) Since the implementation of SMW in May 2011 and up to February 2016, a total of
507 assessments were completed under MWO. The yearly breakdown is as follows:
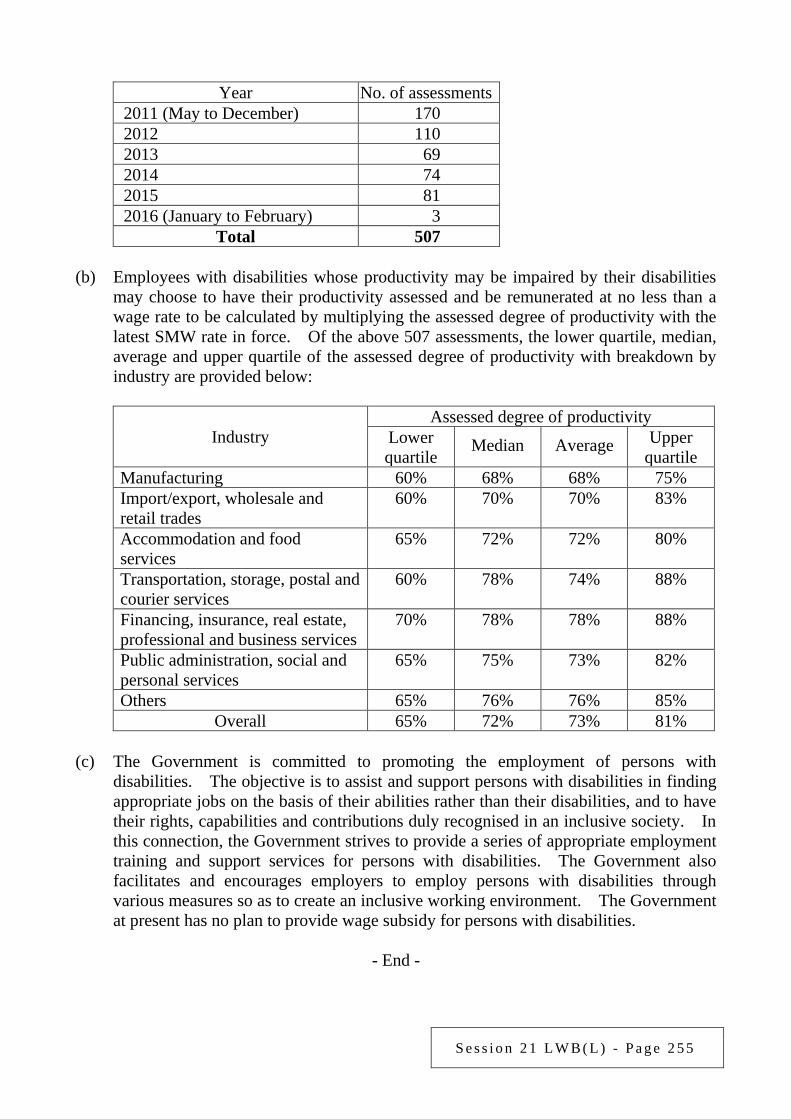
S e s s i o n 2 1 L W B ( L ) - P a g e 2 5 5
Year No. of assessments
2011 (May to December) 170 2012 110 2013 69 2014 74 2015 81 2016 (January to February) 3
Total 507 (b) Employees with disabilities whose productivity may be impaired by their disabilities
may choose to have their productivity assessed and be remunerated at no less than a wage rate to be calculated by multiplying the assessed degree of productivity with the latest SMW rate in force. Of the above 507 assessments, the lower quartile, median, average and upper quartile of the assessed degree of productivity with breakdown by industry are provided below:
Industry Assessed degree of productivity
Lower quartile
Median Average Upper quartile
Manufacturing 60% 68% 68% 75% Import/export, wholesale and retail trades
60% 70% 70% 83%
Accommodation and food services
65% 72% 72% 80%
Transportation, storage, postal and courier services
60% 78% 74% 88%
Financing, insurance, real estate, professional and business services
70% 78% 78% 88%
Public administration, social and personal services
65% 75% 73% 82%
Others 65% 76% 76% 85% Overall 65% 72% 73% 81%
(c) The Government is committed to promoting the employment of persons with
disabilities. The objective is to assist and support persons with disabilities in finding appropriate jobs on the basis of their abilities rather than their disabilities, and to have their rights, capabilities and contributions duly recognised in an inclusive society. In this connection, the Government strives to provide a series of appropriate employment training and support services for persons with disabilities. The Government also facilitates and encourages employers to employ persons with disabilities through various measures so as to create an inclusive working environment. The Government at present has no plan to provide wage subsidy for persons with disabilities.
- End -
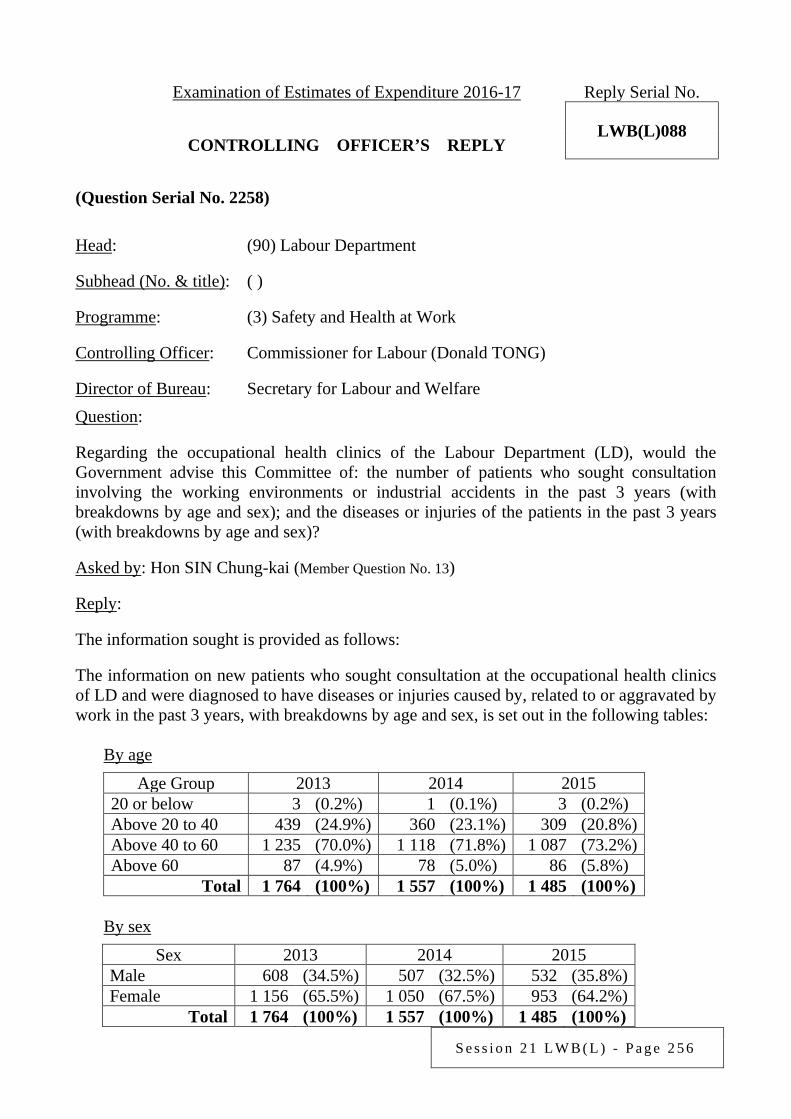
S e s s i o n 2 1 L W B ( L ) - P a g e 2 5 6
Examination of Estimates of Expenditure 2016-17 Reply Serial No.
LWB(L)088 CONTROLLING OFFICER’S REPLY (Question Serial No. 2258)
Head: (90) Labour Department
Subhead (No. & title): ( )
Programme: (3) Safety and Health at Work
Controlling Officer: Commissioner for Labour (Donald TONG)
Director of Bureau: Secretary for Labour and Welfare Question: Regarding the occupational health clinics of the Labour Department (LD), would the Government advise this Committee of: the number of patients who sought consultation involving the working environments or industrial accidents in the past 3 years (with breakdowns by age and sex); and the diseases or injuries of the patients in the past 3 years (with breakdowns by age and sex)? Asked by: Hon SIN Chung-kai (Member Question No. 13) Reply: The information sought is provided as follows: The information on new patients who sought consultation at the occupational health clinics of LD and were diagnosed to have diseases or injuries caused by, related to or aggravated by work in the past 3 years, with breakdowns by age and sex, is set out in the following tables:
By age
Age Group 2013 2014 2015 20 or below 3 (0.2%) 1 (0.1%) 3 (0.2%) Above 20 to 40 439 (24.9%) 360 (23.1%) 309 (20.8%) Above 40 to 60 1 235 (70.0%) 1 118 (71.8%) 1 087 (73.2%) Above 60 87 (4.9%) 78 (5.0%) 86 (5.8%)
Total 1 764 (100%) 1 557 (100%) 1 485 (100%)
By sex
Sex 2013 2014 2015 Male 608 (34.5%) 507 (32.5%) 532 (35.8%) Female 1 156 (65.5%) 1 050 (67.5%) 953 (64.2%)
Total 1 764 (100%) 1 557 (100%) 1 485 (100%)
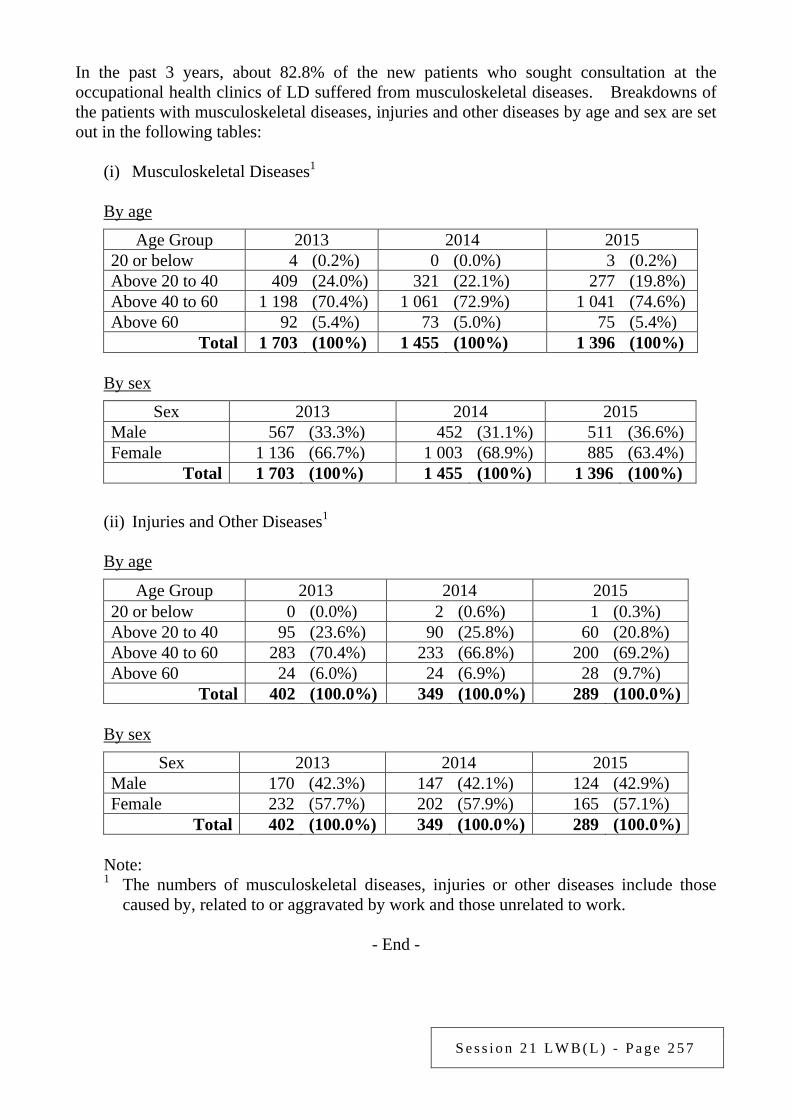
S e s s i o n 2 1 L W B ( L ) - P a g e 2 5 7
In the past 3 years, about 82.8% of the new patients who sought consultation at the occupational health clinics of LD suffered from musculoskeletal diseases. Breakdowns of the patients with musculoskeletal diseases, injuries and other diseases by age and sex are set out in the following tables:
(i) Musculoskeletal Diseases1
By age
Age Group 2013 2014 2015 20 or below 4 (0.2%) 0 (0.0%) 3 (0.2%) Above 20 to 40 409 (24.0%) 321 (22.1%) 277 (19.8%) Above 40 to 60 1 198 (70.4%) 1 061 (72.9%) 1 041 (74.6%) Above 60 92 (5.4%) 73 (5.0%) 75 (5.4%)
Total 1 703 (100%) 1 455 (100%) 1 396 (100%)
By sex
Sex 2013 2014 2015 Male 567 (33.3%) 452 (31.1%) 511 (36.6%) Female 1 136 (66.7%) 1 003 (68.9%) 885 (63.4%)
Total 1 703 (100%) 1 455 (100%) 1 396 (100%) (ii) Injuries and Other Diseases1
By age
Age Group 2013 2014 2015 20 or below 0 (0.0%) 2 (0.6%) 1 (0.3%) Above 20 to 40 95 (23.6%) 90 (25.8%) 60 (20.8%) Above 40 to 60 283 (70.4%) 233 (66.8%) 200 (69.2%) Above 60 24 (6.0%) 24 (6.9%) 28 (9.7%)
Total 402 (100.0%) 349 (100.0%) 289 (100.0%)
By sex
Sex 2013 2014 2015 Male 170 (42.3%) 147 (42.1%) 124 (42.9%) Female 232 (57.7%) 202 (57.9%) 165 (57.1%)
Total 402 (100.0%) 349 (100.0%) 289 (100.0%) Note: 1 The numbers of musculoskeletal diseases, injuries or other diseases include those
caused by, related to or aggravated by work and those unrelated to work.
- End -
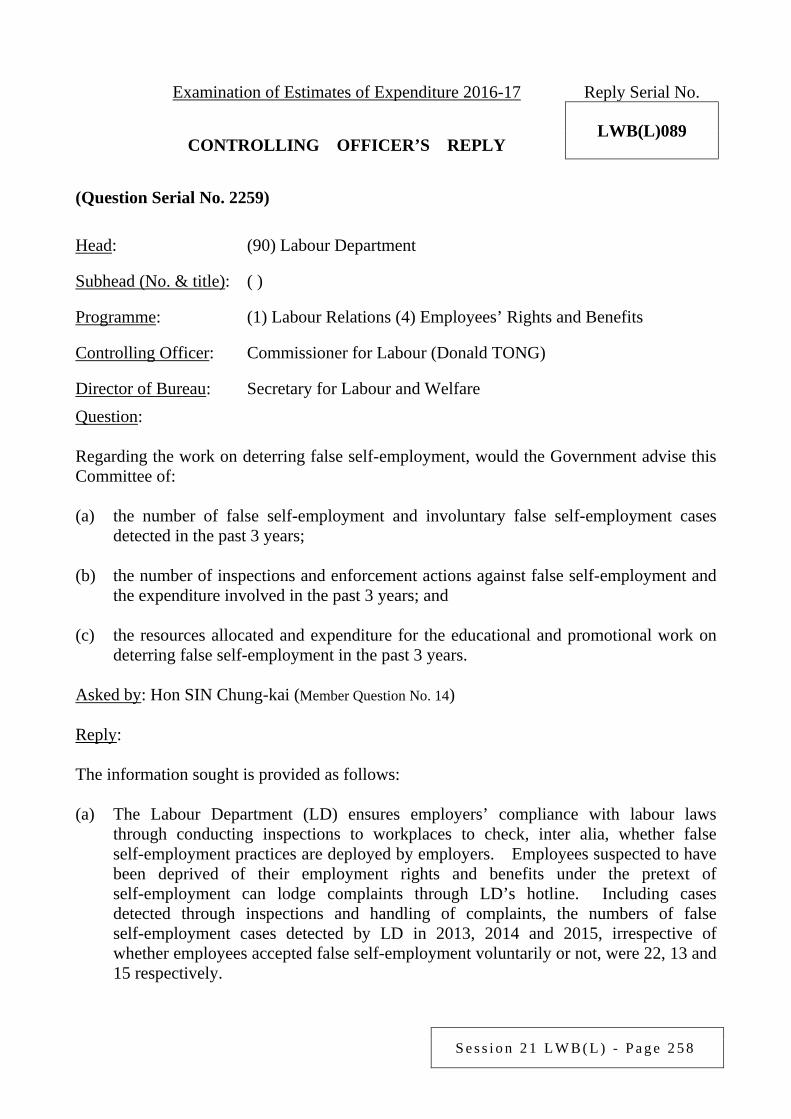
S e s s i o n 2 1 L W B ( L ) - P a g e 2 5 8
Examination of Estimates of Expenditure 2016-17 Reply Serial No.
LWB(L)089 CONTROLLING OFFICER’S REPLY (Question Serial No. 2259)
Head: (90) Labour Department
Subhead (No. & title): ( )
Programme: (1) Labour Relations (4) Employees’ Rights and Benefits
Controlling Officer: Commissioner for Labour (Donald TONG)
Director of Bureau: Secretary for Labour and Welfare Question: Regarding the work on deterring false self-employment, would the Government advise this Committee of: (a) the number of false self-employment and involuntary false self-employment cases
detected in the past 3 years; (b) the number of inspections and enforcement actions against false self-employment and
the expenditure involved in the past 3 years; and (c) the resources allocated and expenditure for the educational and promotional work on
deterring false self-employment in the past 3 years. Asked by: Hon SIN Chung-kai (Member Question No. 14) Reply: The information sought is provided as follows: (a) The Labour Department (LD) ensures employers’ compliance with labour laws
through conducting inspections to workplaces to check, inter alia, whether false self-employment practices are deployed by employers. Employees suspected to have been deprived of their employment rights and benefits under the pretext of self-employment can lodge complaints through LD’s hotline. Including cases detected through inspections and handling of complaints, the numbers of false self-employment cases detected by LD in 2013, 2014 and 2015, irrespective of whether employees accepted false self-employment voluntarily or not, were 22, 13 and 15 respectively.
S e s s i o n 2 1 L W B ( L ) - P a g e 2 5 9
(b) In 2013, 2014 and 2015, LD respectively conducted 151 912, 146 991 and 143 037 inspections to workplaces to check, inter alia, whether there were false self-employment practices. As Labour Inspectors were responsible for the enforcement of various labour laws, the staff cost on tackling false self-employment could not be separately identified.
(c) In the past 3 years, LD carried out a series of educational and promotional activities to
enhance public awareness of the differences in the rights and benefits between an employee and a self-employed person. The activities mainly included broadcasting television and radio Announcements in the Public Interest, distributing leaflets and promotional materials, displaying posters, issuing feature articles, placing advertisements in the public transport network and periodicals of trade union federations, and promoting relevant messages at large-scale seminars and roving exhibitions. The expenditures involved in 2013-14, 2014-15 and 2015-16 were $454,000, $483,000 and $454,000 respectively.
- End -
S e s s i o n 2 1 L W B ( L ) - P a g e 2 6 0
Examination of Estimates of Expenditure 2016-17 Reply Serial No.
LWB(L)090 CONTROLLING OFFICER’S REPLY (Question Serial No. 2260)
Head: (90) Labour Department
Subhead (No. & title): ( )
Programme: (4) Employees’ Rights and Benefits
Controlling Officer: Commissioner for Labour (Donald TONG)
Director of Bureau: Secretary for Labour and Welfare Question: What is the estimated expenditure of the Standard Working Hours (SWH) Committee in 2016-17? What will be its main work in 2016-17? Will the work cover the examination of the legislative details of SWH? When will the legislative timetable be available? Asked by: Hon SIN Chung-kai (Member Question No. 15) Reply: In 2016-17, the estimated expenditure of the Labour Department for supporting the SWH Committee and its related work is $7.82 million (excluding staff cost). The SWH Committee plans to launch the second-stage consultation on the working hours policy directions before the end of April 2016 to collect views from the public and relevant organisations for its reference in preparing a report for submission to the Government afterwards.
- End -
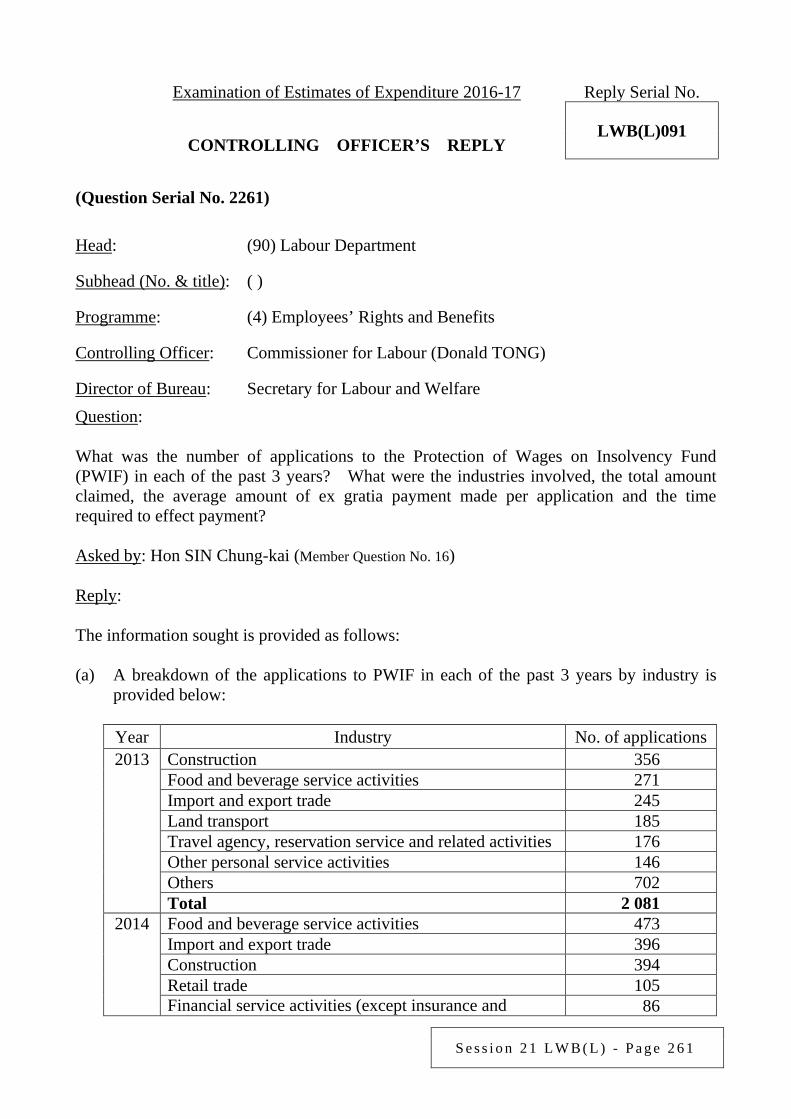
S e s s i o n 2 1 L W B ( L ) - P a g e 2 6 1
Examination of Estimates of Expenditure 2016-17 Reply Serial No.
LWB(L)091 CONTROLLING OFFICER’S REPLY (Question Serial No. 2261)
Head: (90) Labour Department
Subhead (No. & title): ( )
Programme: (4) Employees’ Rights and Benefits
Controlling Officer: Commissioner for Labour (Donald TONG)
Director of Bureau: Secretary for Labour and Welfare Question: What was the number of applications to the Protection of Wages on Insolvency Fund (PWIF) in each of the past 3 years? What were the industries involved, the total amount claimed, the average amount of ex gratia payment made per application and the time required to effect payment? Asked by: Hon SIN Chung-kai (Member Question No. 16) Reply: The information sought is provided as follows: (a) A breakdown of the applications to PWIF in each of the past 3 years by industry is
provided below:
Year Industry No. of applications 2013 Construction 356
Food and beverage service activities 271 Import and export trade 245 Land transport 185 Travel agency, reservation service and related activities 176 Other personal service activities 146 Others 702 Total 2 081
2014 Food and beverage service activities 473 Import and export trade 396 Construction 394 Retail trade 105 Financial service activities (except insurance and 86
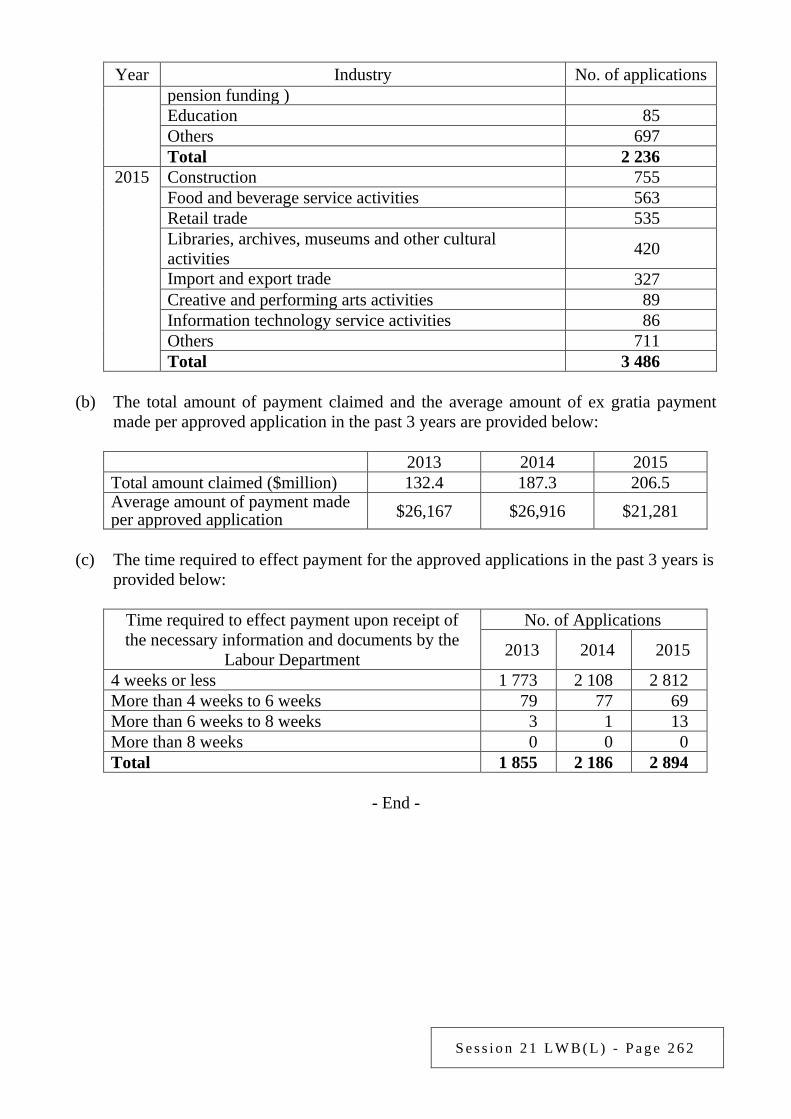
S e s s i o n 2 1 L W B ( L ) - P a g e 2 6 2
Year Industry No. of applications pension funding ) Education 85 Others 697 Total 2 236
2015 Construction 755 Food and beverage service activities 563 Retail trade 535 Libraries, archives, museums and other cultural activities 420
Import and export trade 327 Creative and performing arts activities 89 Information technology service activities 86 Others 711 Total 3 486
(b) The total amount of payment claimed and the average amount of ex gratia payment
made per approved application in the past 3 years are provided below:
2013 2014 2015 Total amount claimed ($million) 132.4 187.3 206.5 Average amount of payment made per approved application $26,167 $26,916 $21,281
(c) The time required to effect payment for the approved applications in the past 3 years is
provided below:
Time required to effect payment upon receipt of the necessary information and documents by the
Labour Department
No. of Applications
2013 2014 2015
4 weeks or less 1 773 2 108 2 812 More than 4 weeks to 6 weeks 79 77 69 More than 6 weeks to 8 weeks 3 1 13 More than 8 weeks 0 0 0 Total 1 855 2 186 2 894
- End -
S e s s i o n 2 1 L W B ( L ) - P a g e 2 6 3
Examination of Estimates of Expenditure 2016-17 Reply Serial No.
LWB(L)092 CONTROLLING OFFICER’S REPLY (Question Serial No. 2262)
Head: (90) Labour Department
Subhead (No. & title): ( )
Programme: (4) Employees’ Rights and Benefits
Controlling Officer: Commissioner for Labour (Donald TONG)
Director of Bureau: Secretary for Labour and Welfare Question: The Government stated that targeted operations were mounted by the Labour Department (LD) with the Police and the Immigration Department (ImmD) to combat illegal employment for protecting the job opportunities of local workers. LD also launched publicity programmes to enhance public awareness of the serious consequences of employing illegal workers. Please provide the following information: (a) What were the details of the specific work and expenditure involved in the targeted
operations and publicity programmes in 2015-16? (b) What are the details of the specific work and estimated expenditure for the targeted
operations and publicity programmes in 2016-17? (c) Will the Government assess the effectiveness of the operations? If yes, what are the
details? If not, what are the reasons? Asked by: Hon SIN Chung-kai (Member Question No. 17) Reply: The information sought is provided as follows: (a) In 2015, LD mounted 210 joint operations with the Police and ImmD to raid
establishments suspected to have been involved in illegal employment. LD also enhanced public awareness of the serious consequences of employing illegal workers through publicity campaigns, and encouraged the reporting of suspected offences through the mass media, advertisements on public transport, etc.
As the labour inspectors involved were responsible for the enforcement of various
labour laws, the staff cost on combating illegal employment cannot be separately
S e s s i o n 2 1 L W B ( L ) - P a g e 2 6 4
identified. The estimated expenditure on publicity against illegal employment in 2015-16 is $207,000.
(b) In 2016-17, LD will continue to mount intelligence-based joint operations with other
law enforcement departments and launch territory-wide publicity activities through various channels to combat illegal employment. LD has earmarked $220,000 for the related publicity work.
(c) Combating illegal employment is an ongoing effort of LD. LD will regularly review
the effectiveness of the enforcement actions, including intelligence collection and joint operations with other law enforcement departments against suspected establishments.
- End -
S e s s i o n 2 1 L W B ( L ) - P a g e 2 6 5
Examination of Estimates of Expenditure 2016-17 Reply Serial No.
LWB(L)093 CONTROLLING OFFICER’S REPLY (Question Serial No. 2263)
Head: (90) Labour Department
Subhead (No. & title): ( )
Programme: (1) Labour Relations
Controlling Officer: Commissioner for Labour (Donald TONG)
Director of Bureau: Secretary for Labour and Welfare Question: Has the Government conducted any survey on the number of employees who are granted 17 days of statutory holidays and its percentage share in the total number of employees? Will the Government conduct any study to review the number of statutory holidays or introduce relevant legislation in 2016-17? If yes, what are the expenditure involved and specific details? If not, what are the reasons? Will the Government undertake to proceed with legislation within a certain period of time? Asked by: Hon SIN Chung-kai (Member Question No. 18) Reply: In the second quarter of 2011, the Census and Statistics Department conducted a survey on statutory holidays and general holidays taken by employees in Hong Kong. The findings showed that, out of 2.757 million employees in Hong Kong, 2.3435 million (85.0%) who were employed under a continuous contract for more than 3 months were entitled to 12 days of paid statutory holidays. Among the 2.3435 million employees, 1.3654 million employees were taking general holidays, representing 49.5% of the total number of employees. In 2015, the Labour Department (LD) reported the above survey findings to the Labour Advisory Board (LAB) and the Legislative Council Panel on Manpower. The issue of increasing the number of statutory holidays was discussed at several LAB meetings and LD listened to the views of members. The issue is still under discussion by LAB. The Government will carefully consider the way forward after a consensus has been reached by LAB. The study on statutory holidays is conducted by existing staff among their other duties, and the expenditure involved cannot be separately identified.
- End -
S e s s i o n 2 1 L W B ( L ) - P a g e 2 6 6
Examination of Estimates of Expenditure 2016-17 Reply Serial No.
LWB(L)094 CONTROLLING OFFICER’S REPLY (Question Serial No. 2264)
Head: (90) Labour Department
Subhead (No. & title): ( )
Programme: (2) Employment Services
Controlling Officer: Commissioner for Labour (Donald TONG)
Director of Bureau: Secretary for Labour and Welfare Question: The Labour Department (LD) provides free employment service to all job seekers. It provides assistance and counselling services to the unemployed and persons with disabilities; career guidance, pre-employment and on-the-job-training to young people; and the labour market information to all job seekers, including new arrivals and ethnic minorities. Please provide the following information: the number of users of the free employment service in 2015-16; the expenditure involved; their placement rates after receiving the service; whether funds and manpower will be set aside to cope with a sudden surge in service demand; and the estimated number of service users in 2016-17 and the financial provision for the service? Asked by: Hon SIN Chung-kai (Member Question No. 19) Reply: In 2015, a total of 69 941 job seekers registered for free employment services, including 67 221 able-bodied job seekers and 2 720 job seekers with disabilities. At present, about 99% of the vacancies advertised through LD are displayed with employers’ contact details. Job seekers can approach the employers and make job applications direct at job fairs or through the Interactive Employment Service website without registration with LD. In 2015, LD secured about 150 748 placements for job seekers, including about 148 347 placements for able-bodied job seekers and 2 401 placements for job seekers with disabilities. In addition, in the 2014/15 programme year (September 2014 to August 2015) of the Youth Employment and Training Programme (YETP), 6 741 trainees were enrolled and received pre-employment training, workplace attachment, on-the-job training and personalised career guidance, and 3 207 trainees were placed into on-the-job training vacancies. LD conducted a trainee development survey for trainees of the 2014/15 programme year which showed that 83.5% of the trainees were in employment.
S e s s i o n 2 1 L W B ( L ) - P a g e 2 6 7
In 2015-16, the estimated expenditure for providing the full range of employment services was $348.5 million. It is estimated that in 2016, 69 700 job seekers will register for free employment services, including 67 000 able-bodied job seekers and 2 700 job seekers with disabilities. As for YETP, it is estimated that 7 000 trainees will be enrolled in the 2015/16 programme year. The estimated expenditure for providing the full range of employment services in 2016-17 is $406.2 million. In the event of a sudden surge in service demand from job seekers, LD will consider deploying resources as appropriate to respond to their needs.
- End -
S e s s i o n 2 1 L W B ( L ) - P a g e 2 6 8
Examination of Estimates of Expenditure 2016-17 Reply Serial No.
LWB(L)095 CONTROLLING OFFICER’S REPLY (Question Serial No. 2266)
Head: (90) Labour Department
Subhead (No. & title): ( )
Programme: (4) Employees’ Rights and Benefits
Controlling Officer: Commissioner for Labour (Donald TONG)
Director of Bureau: Secretary for Labour and Welfare Question: What was the total number of wage default cases received in the past 3 years? What were the details? What were the longest period of wage default and the amount involved? What was the average time taken from investigation to conviction for the offence cases? Among these cases, what was the highest penalty imposed by the court? Has the Government assessed whether the relevant legislation has sufficient deterrent effect to prevent other employers from defaulting on wage payment? Asked by: Hon SIN Chung-kai (Member Question No. 24) Reply: In 2013, 2014 and 2015, the numbers of labour disputes, claims and reported cases related to wage default handled by the Labour Department (LD) were 5 545, 5 409 and 5 023 respectively. LD does not keep information on the period and amount of wage default. A significant number of the labour disputes, claims and reported cases involved disputes on facts or law points and might not necessarily involve wage offences under the Employment Ordinance (EO). If LD detects any suspected wage offences under EO in the course of conciliation, the employees concerned will be invited to provide further information and investigation will be initiated. LD will initiate prosecution after seeking legal advice if there is sufficient evidence for suspected wage offences and the employees concerned are willing to act as prosecution witnesses. The time required for investigation and prosecution of offences is determined by a number of factors, such as the complexity of individual cases, the number of defendants and witnesses involved, whether there is conflicting evidence among the parties, the plea of the defendants, etc. The exact time required for investigation and prosecution varies from case to case and cannot be generalised.
S e s s i o n 2 1 L W B ( L ) - P a g e 2 6 9
According to EO, an employer who wilfully and without reasonable excuse fails to pay wages and/or termination payments when they become due is liable to prosecution. If such offence is committed with the consent, connivance or neglect of the company director or responsible person, the director or responsible person is liable to prosecution and, upon conviction, to a maximum fine of $350,000 and imprisonment for 3 years. From 2013 to 2015, LD issued a total of 1 708 summonses in respect of wage offences, of which 1 268 were convicted. During these 3 years, a record high fine of $1.07 million was imposed by the court on a case involving prolonged default on wage payment. Besides, 3 employers convicted of wage offences were sentenced to immediate imprisonment, with 4 months’ imprisonment being the highest term, while 1 employer and 3 company directors were given a suspended sentence. 1 employer and 5 company directors were also sentenced to community service orders.
- End -
S e s s i o n 2 1 L W B ( L ) - P a g e 2 7 0
Examination of Estimates of Expenditure 2016-17 Reply Serial No.
LWB(L)096 CONTROLLING OFFICER’S REPLY (Question Serial No. 2267)
Head: (90) Labour Department
Subhead (No. & title): ( )
Programme: (2) Employment Services
Controlling Officer: Commissioner for Labour (Donald TONG)
Director of Bureau: Secretary for Labour and Welfare Question: Regarding the enhancement measures under the Supplementary Labour Scheme (SLS), would the Government advise this Committee of: (a) the number of applications under SLS in the past year, and the number of workers and
nationalities involved; (b) the works projects and contractors involved in the applications; (c) the median wage of the workers? Asked by: Hon SIN Chung-kai (Member Question No. 26) Reply: The information sought is provided as follows: (a) On the premise of according priority to local workers in employment and safeguarding
their wage levels, the Government launched enhancement measures under SLS for public sector works projects in April 2014 and May 2015. The measures included expediting the preparatory work for SLS applications involving 26 trades in the construction industry with manpower shortage; and hopefully generating synergy effects for more effective utilisation of the productivity of imported workers under specified public sector works contract under the same contractor. In 2015, the Labour Department (LD) received 9 applications in relation to the above enhancement measures, applying for the importation of a total of 1 065 workers. As employers do not have to provide information on the nationality of prospective imported workers in the SLS applications, LD does not keep breakdowns by nationality of imported workers applied for.
S e s s i o n 2 1 L W B ( L ) - P a g e 2 7 1
(b) Having regard to the principle of confidentiality in the processing of applications under SLS, LD cannot provide information on the works projects and contractors involved.
(c) Under SLS, imported workers must be remunerated at not less than the median
monthly wage of the relevant job title as published by the Census and Statistics Department or the monthly wage of the 26 trades in the construction industry with manpower shortage as promulgated by the Construction Industry Council, whichever is higher. The 9 applications mentioned in (a) above involved 20 job titles, and their respective median monthly wages are at Annex.
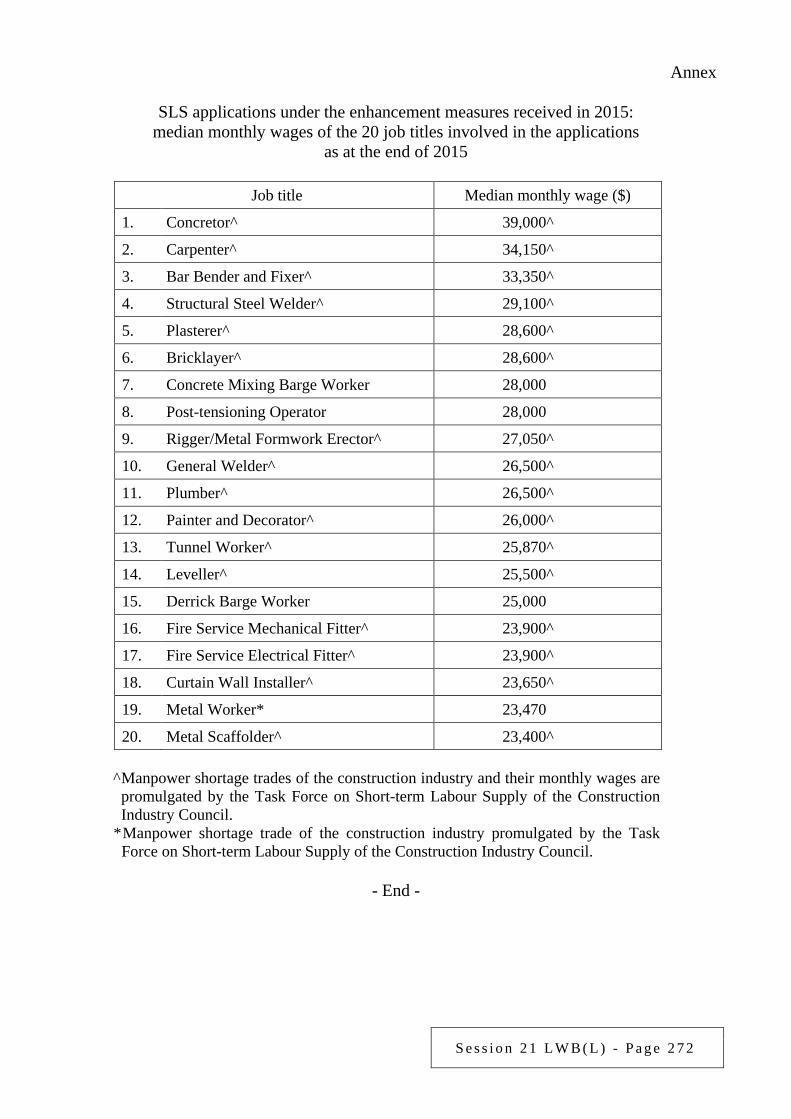
S e s s i o n 2 1 L W B ( L ) - P a g e 2 7 2
Annex
SLS applications under the enhancement measures received in 2015: median monthly wages of the 20 job titles involved in the applications
as at the end of 2015
Job title Median monthly wage ($)
1. Concretor^ 39,000^
2. Carpenter^ 34,150^
3. Bar Bender and Fixer^ 33,350^
4. Structural Steel Welder^ 29,100^
5. Plasterer^ 28,600^
6. Bricklayer^ 28,600^
7. Concrete Mixing Barge Worker 28,000
8. Post-tensioning Operator 28,000
9. Rigger/Metal Formwork Erector^ 27,050^
10. General Welder^ 26,500^
11. Plumber^ 26,500^
12. Painter and Decorator^ 26,000^
13. Tunnel Worker^ 25,870^
14. Leveller^ 25,500^
15. Derrick Barge Worker 25,000
16. Fire Service Mechanical Fitter^ 23,900^
17. Fire Service Electrical Fitter^ 23,900^
18. Curtain Wall Installer^ 23,650^
19. Metal Worker* 23,470
20. Metal Scaffolder^ 23,400^
^ Manpower shortage trades of the construction industry and their monthly wages are promulgated by the Task Force on Short-term Labour Supply of the Construction Industry Council.
* Manpower shortage trade of the construction industry promulgated by the Task Force on Short-term Labour Supply of the Construction Industry Council.
- End -
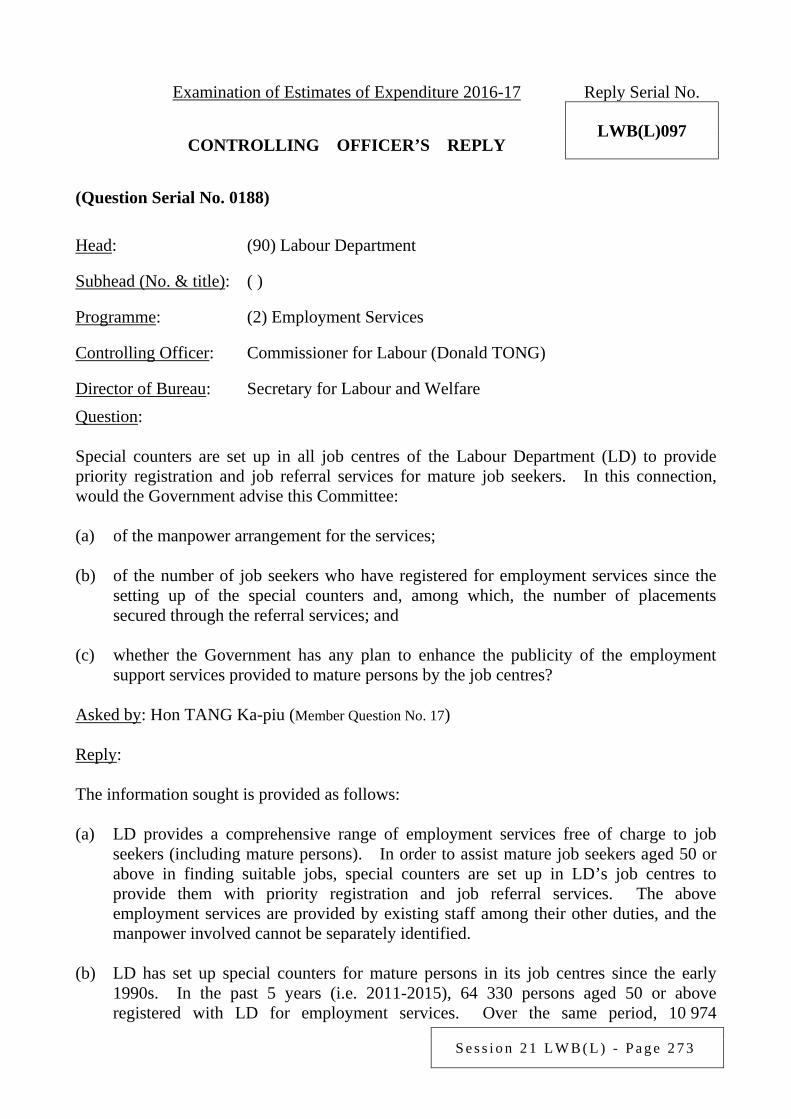
S e s s i o n 2 1 L W B ( L ) - P a g e 2 7 3
Examination of Estimates of Expenditure 2016-17 Reply Serial No.
LWB(L)097 CONTROLLING OFFICER’S REPLY (Question Serial No. 0188)
Head: (90) Labour Department
Subhead (No. & title): ( )
Programme: (2) Employment Services
Controlling Officer: Commissioner for Labour (Donald TONG)
Director of Bureau: Secretary for Labour and Welfare Question: Special counters are set up in all job centres of the Labour Department (LD) to provide priority registration and job referral services for mature job seekers. In this connection, would the Government advise this Committee: (a) of the manpower arrangement for the services; (b) of the number of job seekers who have registered for employment services since the
setting up of the special counters and, among which, the number of placements secured through the referral services; and
(c) whether the Government has any plan to enhance the publicity of the employment
support services provided to mature persons by the job centres? Asked by: Hon TANG Ka-piu (Member Question No. 17) Reply: The information sought is provided as follows: (a) LD provides a comprehensive range of employment services free of charge to job
seekers (including mature persons). In order to assist mature job seekers aged 50 or above in finding suitable jobs, special counters are set up in LD’s job centres to provide them with priority registration and job referral services. The above employment services are provided by existing staff among their other duties, and the manpower involved cannot be separately identified.
(b) LD has set up special counters for mature persons in its job centres since the early
1990s. In the past 5 years (i.e. 2011-2015), 64 330 persons aged 50 or above registered with LD for employment services. Over the same period, 10 974
S e s s i o n 2 1 L W B ( L ) - P a g e 2 7 4
placements were secured for persons aged 50 or above through LD’s referral services. Apart from such referral services, job seekers (including mature persons) usually make direct application to employers who advertise their vacancies via LD. Currently, around 99% of the vacancies advertised through LD are open for direct application by job seekers.
(c) In 2016-17, LD will continue to promote the thematic job fairs organised for
middle-aged and mature persons through a number of publicity channels, including short message service, websites, radios, newspapers and advertisements on the MTR, as well as distributing posters and leaflets to non-governmental organisations, training bodies, trade unions and Public Enquiry Service Centres of the Home Affairs Department. LD will also strengthen the liaison and cooperation with the non-governmental organisations serving mature persons, and continue to make use of the dedicated webpage set up for mature persons under the Interactive Employment Service website to promote LD’s employment services and special employment programmes, and encourage mature persons having employment needs to use LD’s services.
- End -

S e s s i o n 2 1 L W B ( L ) - P a g e 2 7 5
Examination of Estimates of Expenditure 2016-17 Reply Serial No.
LWB(L)098 CONTROLLING OFFICER’S REPLY (Question Serial No. 0189)
Head: (90) Labour Department
Subhead (No. & title): ( )
Programme: (2) Employment Services
Controlling Officer: Commissioner for Labour (Donald TONG)
Director of Bureau: Secretary for Labour and Welfare Question: Regarding the state of the construction industry, would the Government advise this Committee of: (a) the number of job vacancies in the construction industry in the past 2 years (with
breakdowns by year and job title); (b) the number of employed persons in the construction industry in the past 2 years (with
breakdowns by year, gender, age group, mode of employment and job title); (c) the number of underemployed persons and the underemployment rate in the
construction industry in the past 2 years (with breakdowns by year, gender, age group and job title);
(d) the number of unemployed persons and the unemployment rate in the construction
industry in the past 2 years (with breakdowns by year and job title); (e) the wage index, median wage and its year-on-year rate of change in the construction
industry in the past 2 years (with breakdowns by year and job title); (f) the number of imported workers applied for and approved in the construction industry
in the past 2 years (with breakdowns by year, job title and wage level); and (g) the additional manpower that the Construction Industry Recruitment Centre (CIRC)
could recruit for the industry and the approach to assess its effectiveness? Asked by: Hon TANG Ka-piu (Member Question No. 18) Reply:
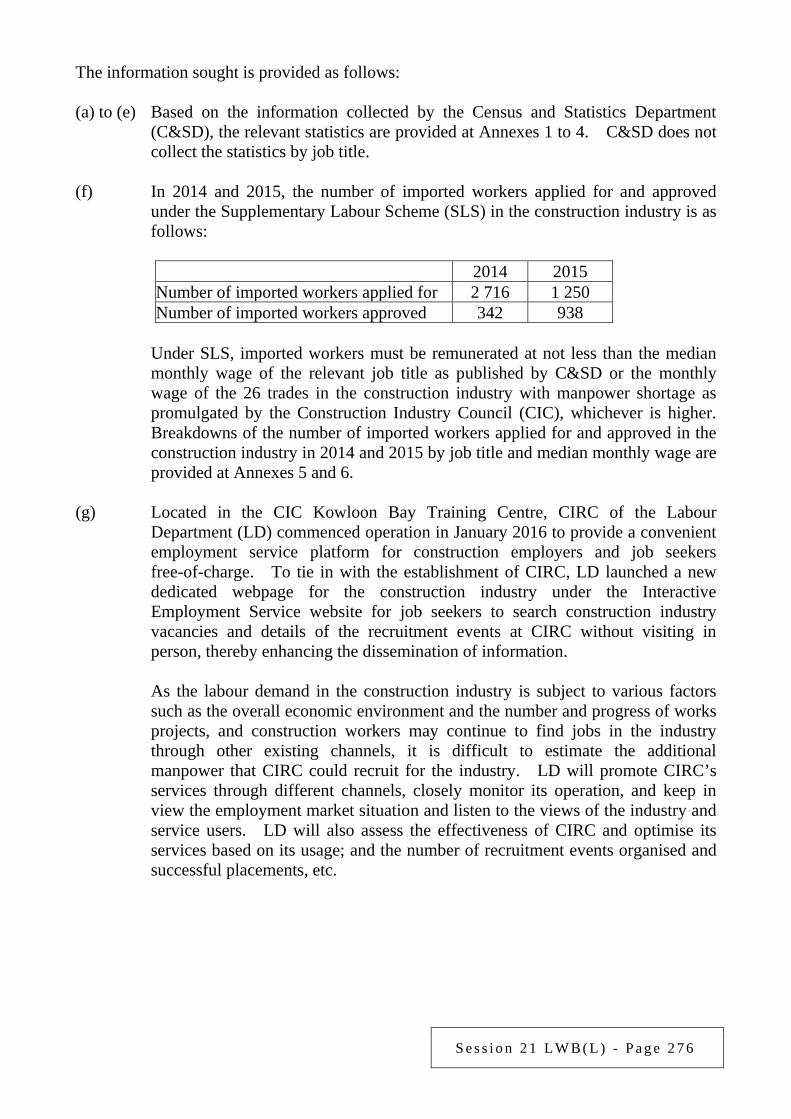
S e s s i o n 2 1 L W B ( L ) - P a g e 2 7 6
The information sought is provided as follows: (a) to (e) Based on the information collected by the Census and Statistics Department
(C&SD), the relevant statistics are provided at Annexes 1 to 4. C&SD does not collect the statistics by job title.
(f) In 2014 and 2015, the number of imported workers applied for and approved
under the Supplementary Labour Scheme (SLS) in the construction industry is as follows:
2014 2015 Number of imported workers applied for 2 716 1 250 Number of imported workers approved 342 938
Under SLS, imported workers must be remunerated at not less than the median
monthly wage of the relevant job title as published by C&SD or the monthly wage of the 26 trades in the construction industry with manpower shortage as promulgated by the Construction Industry Council (CIC), whichever is higher. Breakdowns of the number of imported workers applied for and approved in the construction industry in 2014 and 2015 by job title and median monthly wage are provided at Annexes 5 and 6.
(g) Located in the CIC Kowloon Bay Training Centre, CIRC of the Labour
Department (LD) commenced operation in January 2016 to provide a convenient employment service platform for construction employers and job seekers free-of-charge. To tie in with the establishment of CIRC, LD launched a new dedicated webpage for the construction industry under the Interactive Employment Service website for job seekers to search construction industry vacancies and details of the recruitment events at CIRC without visiting in person, thereby enhancing the dissemination of information.
As the labour demand in the construction industry is subject to various factors
such as the overall economic environment and the number and progress of works projects, and construction workers may continue to find jobs in the industry through other existing channels, it is difficult to estimate the additional manpower that CIRC could recruit for the industry. LD will promote CIRC’s services through different channels, closely monitor its operation, and keep in view the employment market situation and listen to the views of the industry and service users. LD will also assess the effectiveness of CIRC and optimise its services based on its usage; and the number of recruitment events organised and successful placements, etc.
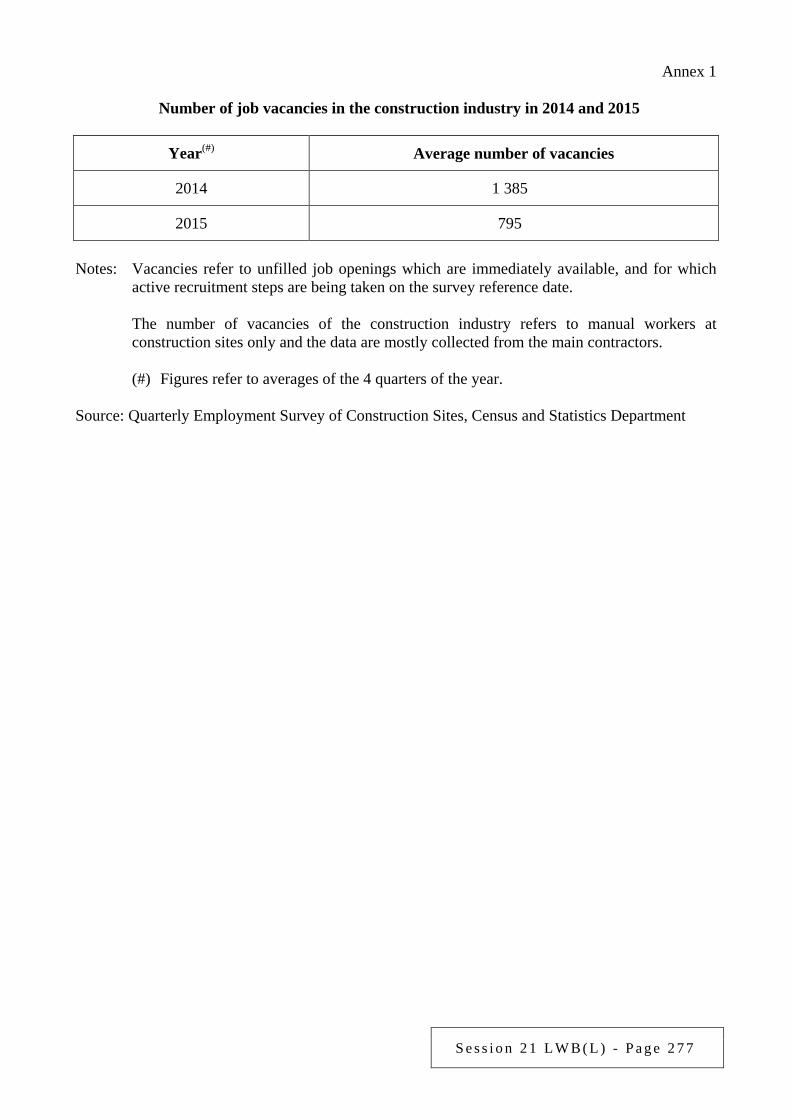
S e s s i o n 2 1 L W B ( L ) - P a g e 2 7 7
Annex 1
Number of job vacancies in the construction industry in 2014 and 2015
Year(#) Average number of vacancies
2014 1 385
2015 795
Notes: Vacancies refer to unfilled job openings which are immediately available, and for which
active recruitment steps are being taken on the survey reference date.
The number of vacancies of the construction industry refers to manual workers at construction sites only and the data are mostly collected from the main contractors.
(#) Figures refer to averages of the 4 quarters of the year.
Source: Quarterly Employment Survey of Construction Sites, Census and Statistics Department
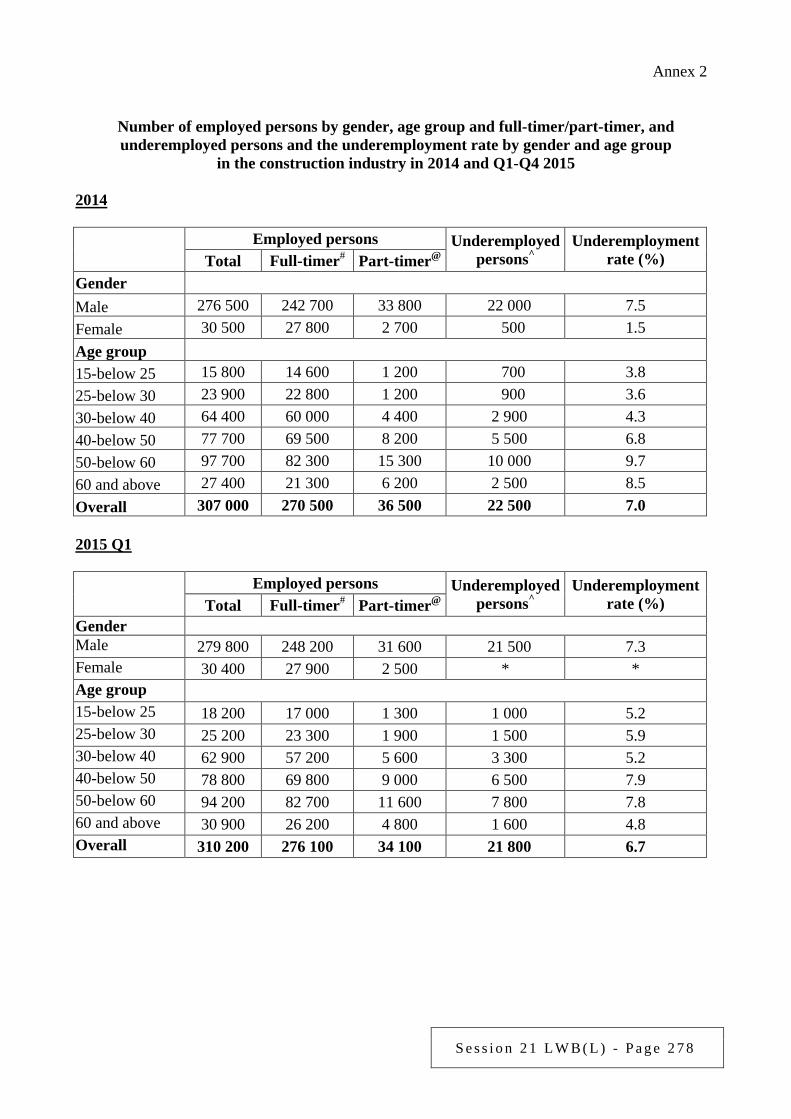
S e s s i o n 2 1 L W B ( L ) - P a g e 2 7 8
Annex 2
Number of employed persons by gender, age group and full-timer/part-timer, and underemployed persons and the underemployment rate by gender and age group
in the construction industry in 2014 and Q1-Q4 2015 2014
Employed persons Underemployed
persons^ Underemployment
rate (%) Total Full-timer# Part-timer@ Gender Male 276 500 242 700 33 800 22 000 7.5 Female 30 500 27 800 2 700 500 1.5 Age group 15-below 25 15 800 14 600 1 200 700 3.8 25-below 30 23 900 22 800 1 200 900 3.6 30-below 40 64 400 60 000 4 400 2 900 4.3 40-below 50 77 700 69 500 8 200 5 500 6.8 50-below 60 97 700 82 300 15 300 10 000 9.7 60 and above 27 400 21 300 6 200 2 500 8.5 Overall 307 000 270 500 36 500 22 500 7.0 2015 Q1 Employed persons Underemployed
persons^ Underemployment
rate (%) Total Full-timer# Part-timer@ Gender Male 279 800 248 200 31 600 21 500 7.3 Female 30 400 27 900 2 500 * * Age group 15-below 25 18 200 17 000 1 300 1 000 5.2 25-below 30 25 200 23 300 1 900 1 500 5.9 30-below 40 62 900 57 200 5 600 3 300 5.2 40-below 50 78 800 69 800 9 000 6 500 7.9 50-below 60 94 200 82 700 11 600 7 800 7.8 60 and above 30 900 26 200 4 800 1 600 4.8 Overall 310 200 276 100 34 100 21 800 6.7
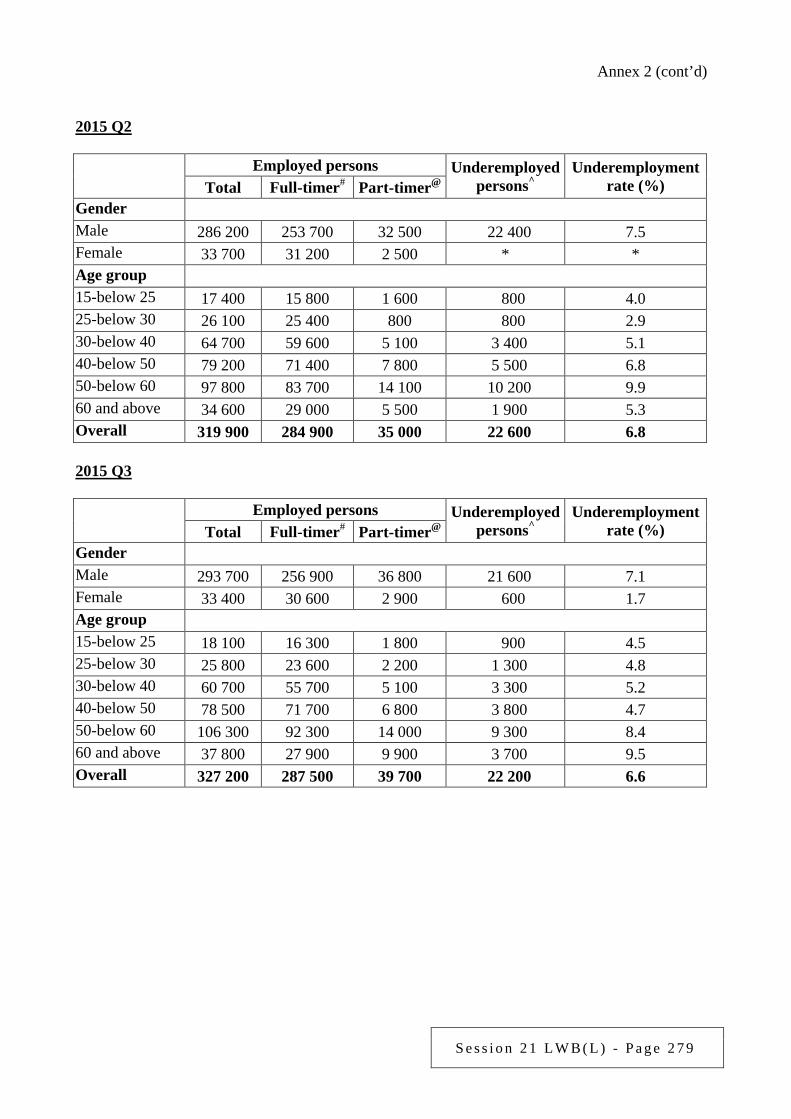
S e s s i o n 2 1 L W B ( L ) - P a g e 2 7 9
Annex 2 (cont’d)
2015 Q2 Employed persons Underemployed
persons^ Underemployment
rate (%) Total Full-timer# Part-timer@ Gender Male 286 200 253 700 32 500 22 400 7.5 Female 33 700 31 200 2 500 * * Age group 15-below 25 17 400 15 800 1 600 800 4.0 25-below 30 26 100 25 400 800 800 2.9 30-below 40 64 700 59 600 5 100 3 400 5.1 40-below 50 79 200 71 400 7 800 5 500 6.8 50-below 60 97 800 83 700 14 100 10 200 9.9 60 and above 34 600 29 000 5 500 1 900 5.3 Overall 319 900 284 900 35 000 22 600 6.8 2015 Q3
Employed persons Underemployed
persons^ Underemployment
rate (%) Total Full-timer# Part-timer@ Gender Male 293 700 256 900 36 800 21 600 7.1 Female 33 400 30 600 2 900 600 1.7 Age group 15-below 25 18 100 16 300 1 800 900 4.5 25-below 30 25 800 23 600 2 200 1 300 4.8 30-below 40 60 700 55 700 5 100 3 300 5.2 40-below 50 78 500 71 700 6 800 3 800 4.7 50-below 60 106 300 92 300 14 000 9 300 8.4 60 and above 37 800 27 900 9 900 3 700 9.5 Overall 327 200 287 500 39 700 22 200 6.6
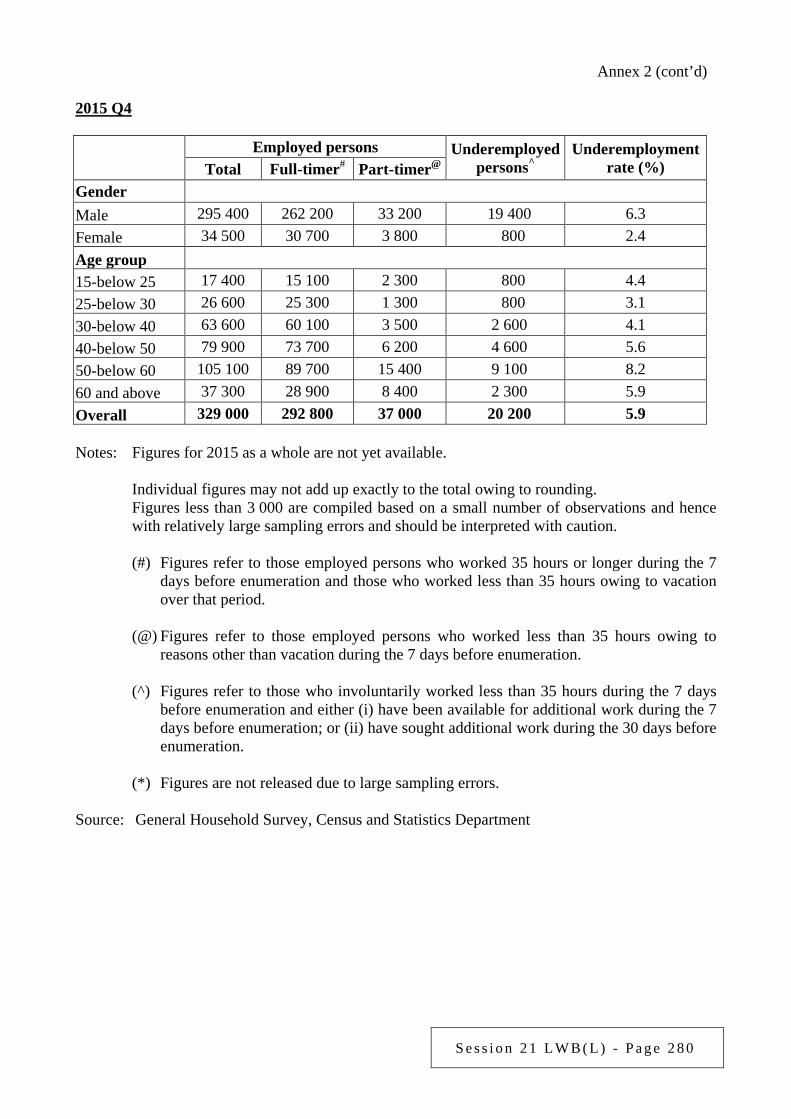
S e s s i o n 2 1 L W B ( L ) - P a g e 2 8 0
Annex 2 (cont’d)
2015 Q4
Employed persons Underemployed
persons^ Underemployment
rate (%) Total Full-timer# Part-timer@ Gender Male 295 400 262 200 33 200 19 400 6.3 Female 34 500 30 700 3 800 800 2.4 Age group 15-below 25 17 400 15 100 2 300 800 4.4 25-below 30 26 600 25 300 1 300 800 3.1 30-below 40 63 600 60 100 3 500 2 600 4.1 40-below 50 79 900 73 700 6 200 4 600 5.6 50-below 60 105 100 89 700 15 400 9 100 8.2 60 and above 37 300 28 900 8 400 2 300 5.9 Overall 329 000 292 800 37 000 20 200 5.9 Notes: Figures for 2015 as a whole are not yet available.
Individual figures may not add up exactly to the total owing to rounding. Figures less than 3 000 are compiled based on a small number of observations and hence with relatively large sampling errors and should be interpreted with caution. (#) Figures refer to those employed persons who worked 35 hours or longer during the 7
days before enumeration and those who worked less than 35 hours owing to vacation over that period.
(@) Figures refer to those employed persons who worked less than 35 hours owing to
reasons other than vacation during the 7 days before enumeration. (^) Figures refer to those who involuntarily worked less than 35 hours during the 7 days
before enumeration and either (i) have been available for additional work during the 7 days before enumeration; or (ii) have sought additional work during the 30 days before enumeration.
(*) Figures are not released due to large sampling errors.
Source: General Household Survey, Census and Statistics Department
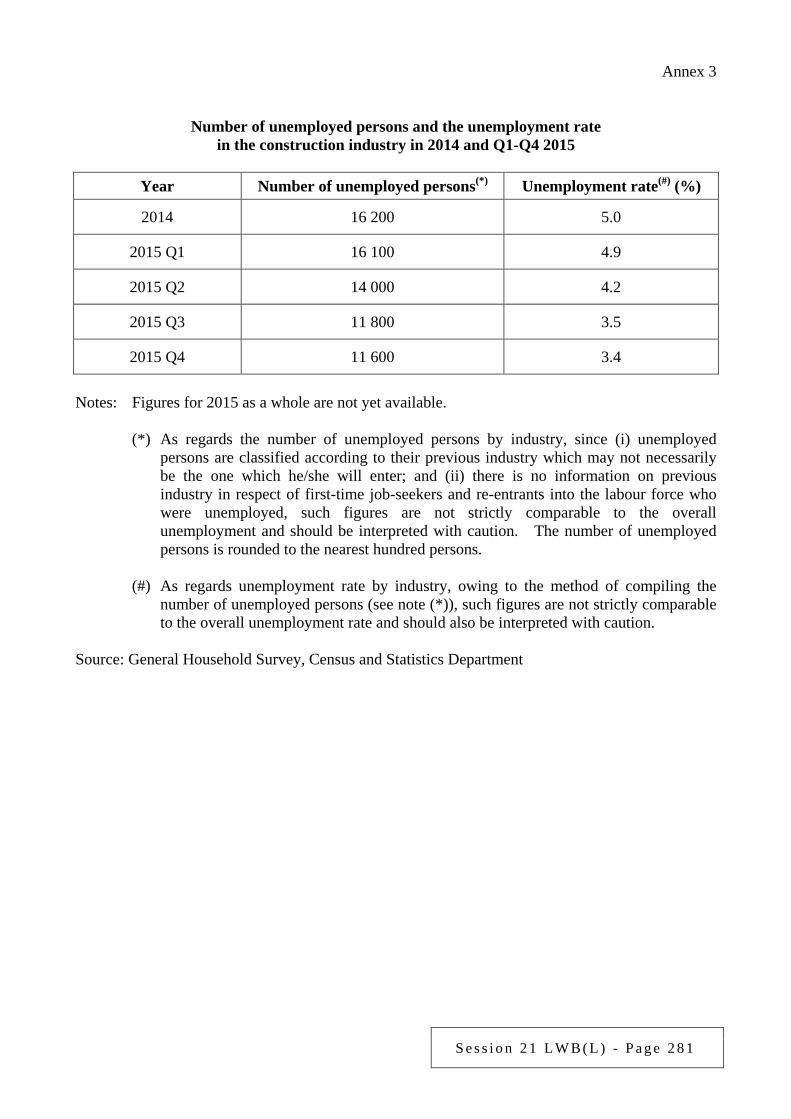
S e s s i o n 2 1 L W B ( L ) - P a g e 2 8 1
Annex 3
Number of unemployed persons and the unemployment rate
in the construction industry in 2014 and Q1-Q4 2015
Year Number of unemployed persons(*) Unemployment rate(#) (%)
2014 16 200 5.0
2015 Q1 16 100 4.9
2015 Q2 14 000 4.2
2015 Q3 11 800 3.5
2015 Q4 11 600 3.4
Notes: Figures for 2015 as a whole are not yet available.
(*) As regards the number of unemployed persons by industry, since (i) unemployed persons are classified according to their previous industry which may not necessarily be the one which he/she will enter; and (ii) there is no information on previous industry in respect of first-time job-seekers and re-entrants into the labour force who were unemployed, such figures are not strictly comparable to the overall unemployment and should be interpreted with caution. The number of unemployed persons is rounded to the nearest hundred persons.
(#) As regards unemployment rate by industry, owing to the method of compiling the
number of unemployed persons (see note (*)), such figures are not strictly comparable to the overall unemployment rate and should also be interpreted with caution.
Source: General Household Survey, Census and Statistics Department
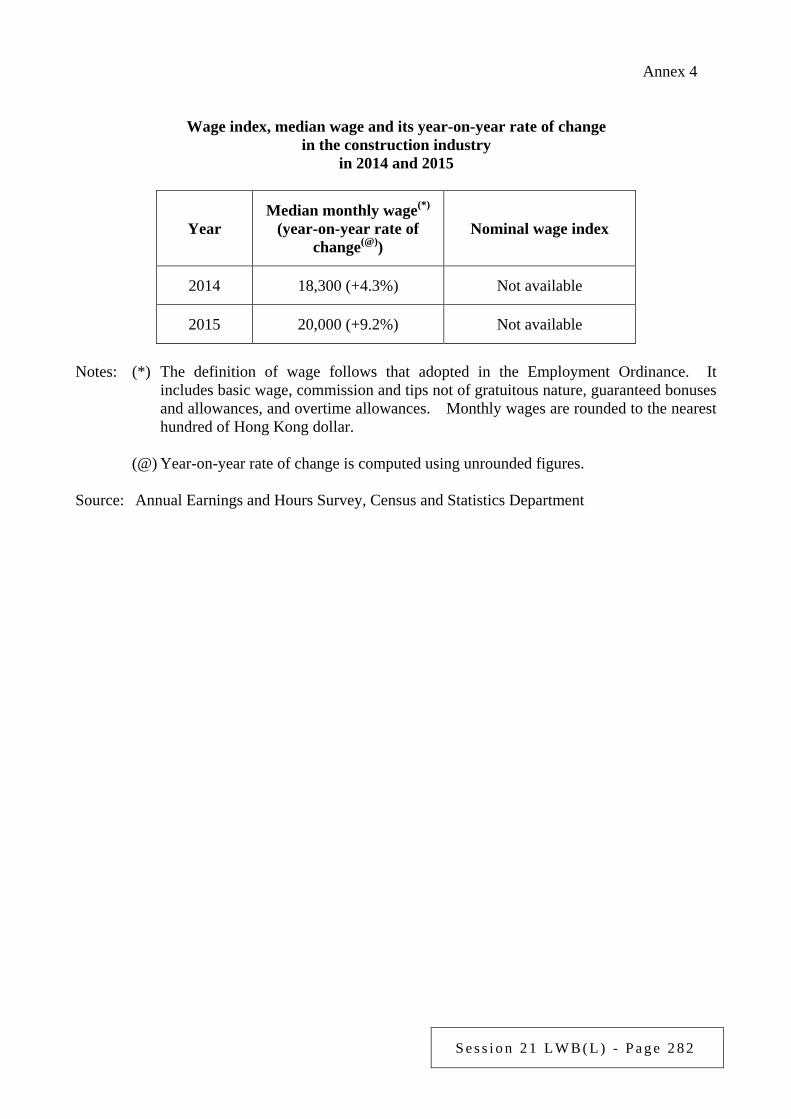
S e s s i o n 2 1 L W B ( L ) - P a g e 2 8 2
Annex 4
Wage index, median wage and its year-on-year rate of change
in the construction industry in 2014 and 2015
Year Median monthly wage(*)
(year-on-year rate of change(@))
Nominal wage index
2014 18,300 (+4.3%) Not available
2015 20,000 (+9.2%) Not available
Notes: (*) The definition of wage follows that adopted in the Employment Ordinance. It
includes basic wage, commission and tips not of gratuitous nature, guaranteed bonuses and allowances, and overtime allowances. Monthly wages are rounded to the nearest hundred of Hong Kong dollar.
(@) Year-on-year rate of change is computed using unrounded figures.
Source: Annual Earnings and Hours Survey, Census and Statistics Department
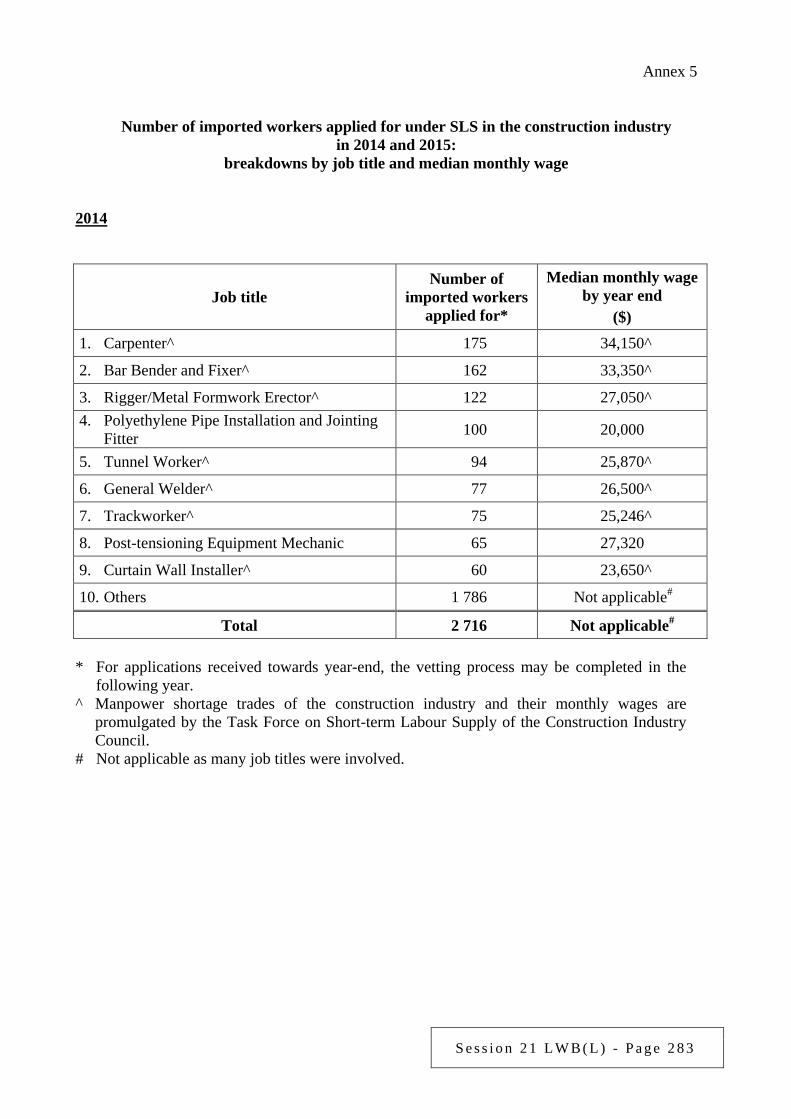
S e s s i o n 2 1 L W B ( L ) - P a g e 2 8 3
Annex 5
Number of imported workers applied for under SLS in the construction industry in 2014 and 2015:
breakdowns by job title and median monthly wage 2014
Job title Number of
imported workers applied for*
Median monthly wage by year end
($) 1. Carpenter^ 175 34,150^
2. Bar Bender and Fixer^ 162 33,350^
3. Rigger/Metal Formwork Erector^ 122 27,050^ 4. Polyethylene Pipe Installation and Jointing
Fitter 100 20,000
5. Tunnel Worker^ 94 25,870^
6. General Welder^ 77 26,500^
7. Trackworker^ 75 25,246^
8. Post-tensioning Equipment Mechanic 65 27,320
9. Curtain Wall Installer^ 60 23,650^
10. Others 1 786 Not applicable#
Total 2 716 Not applicable# * For applications received towards year-end, the vetting process may be completed in the
following year. ^ Manpower shortage trades of the construction industry and their monthly wages are
promulgated by the Task Force on Short-term Labour Supply of the Construction Industry Council.
# Not applicable as many job titles were involved.
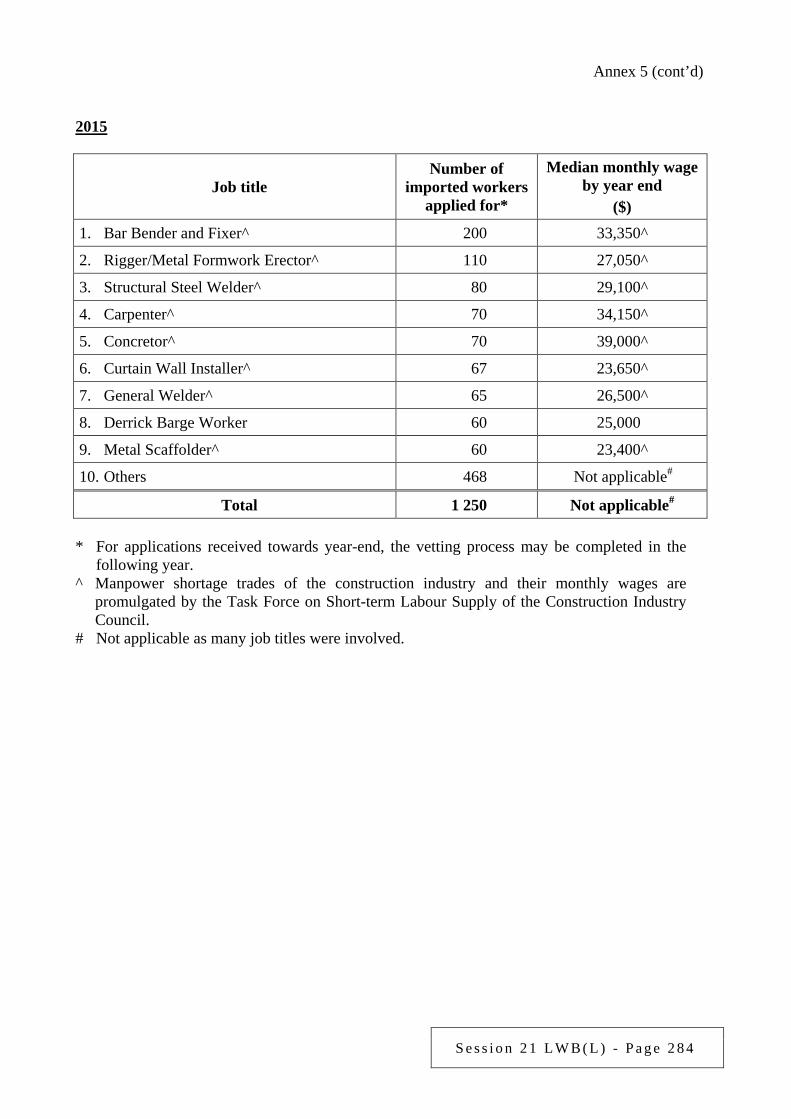
S e s s i o n 2 1 L W B ( L ) - P a g e 2 8 4
Annex 5 (cont’d) 2015
Job title Number of
imported workers applied for*
Median monthly wage by year end
($) 1. Bar Bender and Fixer^ 200 33,350^
2. Rigger/Metal Formwork Erector^ 110 27,050^
3. Structural Steel Welder^ 80 29,100^
4. Carpenter^ 70 34,150^
5. Concretor^ 70 39,000^
6. Curtain Wall Installer^ 67 23,650^
7. General Welder^ 65 26,500^
8. Derrick Barge Worker 60 25,000
9. Metal Scaffolder^ 60 23,400^
10. Others 468 Not applicable#
Total 1 250 Not applicable# * For applications received towards year-end, the vetting process may be completed in the
following year. ^ Manpower shortage trades of the construction industry and their monthly wages are
promulgated by the Task Force on Short-term Labour Supply of the Construction Industry Council.
# Not applicable as many job titles were involved.
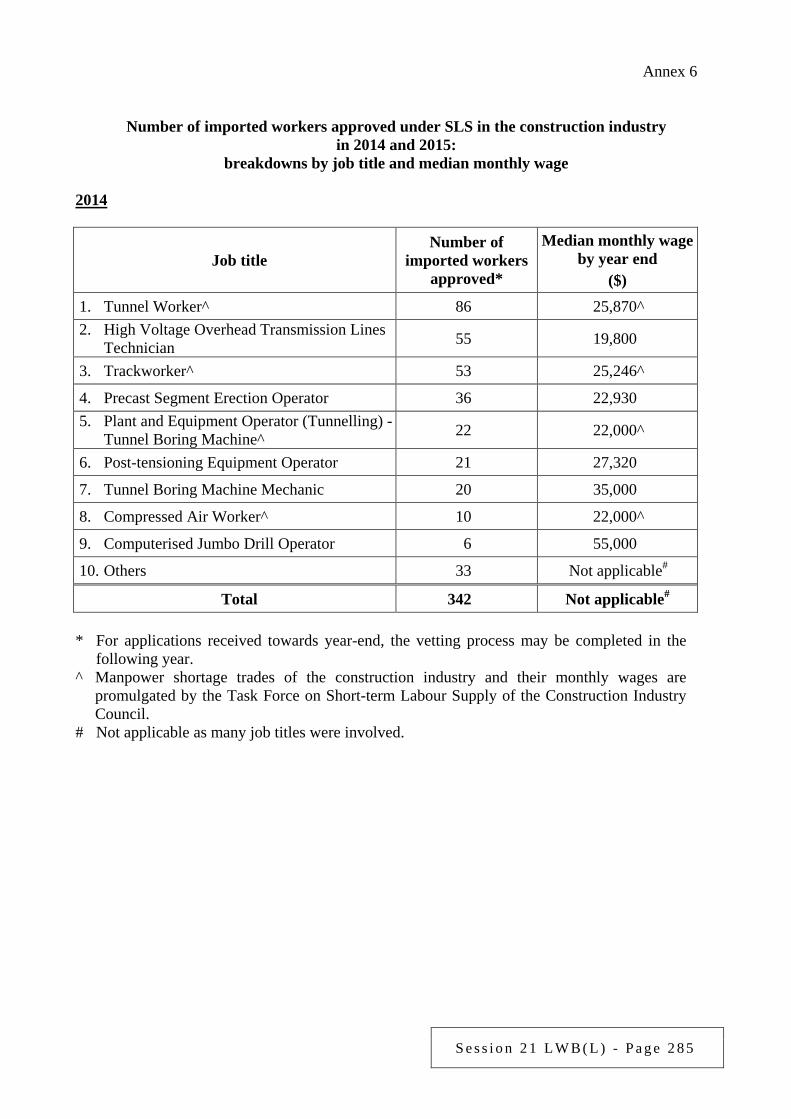
S e s s i o n 2 1 L W B ( L ) - P a g e 2 8 5
Annex 6
Number of imported workers approved under SLS in the construction industry in 2014 and 2015:
breakdowns by job title and median monthly wage
2014
Job title Number of
imported workers approved*
Median monthly wage by year end
($) 1. Tunnel Worker^ 86 25,870^ 2. High Voltage Overhead Transmission Lines
Technician 55 19,800
3. Trackworker^ 53 25,246^
4. Precast Segment Erection Operator 36 22,930 5. Plant and Equipment Operator (Tunnelling) -
Tunnel Boring Machine^ 22 22,000^
6. Post-tensioning Equipment Operator 21 27,320
7. Tunnel Boring Machine Mechanic 20 35,000
8. Compressed Air Worker^ 10 22,000^
9. Computerised Jumbo Drill Operator 6 55,000
10. Others 33 Not applicable#
Total 342 Not applicable# * For applications received towards year-end, the vetting process may be completed in the
following year. ^ Manpower shortage trades of the construction industry and their monthly wages are
promulgated by the Task Force on Short-term Labour Supply of the Construction Industry Council.
# Not applicable as many job titles were involved.
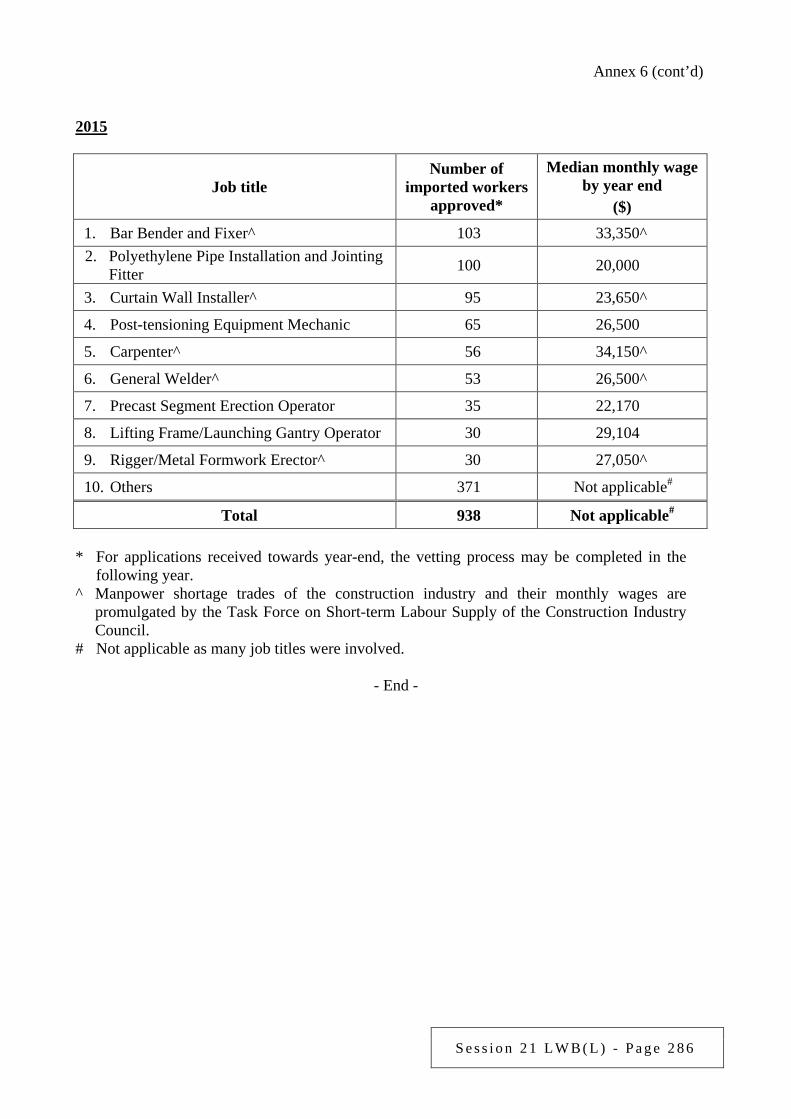
S e s s i o n 2 1 L W B ( L ) - P a g e 2 8 6
Annex 6 (cont’d) 2015
Job title Number of
imported workers approved*
Median monthly wage by year end
($) 1. Bar Bender and Fixer^ 103 33,350^ 2. Polyethylene Pipe Installation and Jointing
Fitter 100 20,000
3. Curtain Wall Installer^ 95 23,650^
4. Post-tensioning Equipment Mechanic 65 26,500
5. Carpenter^ 56 34,150^
6. General Welder^ 53 26,500^
7. Precast Segment Erection Operator 35 22,170
8. Lifting Frame/Launching Gantry Operator 30 29,104
9. Rigger/Metal Formwork Erector^ 30 27,050^
10. Others 371 Not applicable#
Total 938 Not applicable# * For applications received towards year-end, the vetting process may be completed in the
following year. ^ Manpower shortage trades of the construction industry and their monthly wages are
promulgated by the Task Force on Short-term Labour Supply of the Construction Industry Council.
# Not applicable as many job titles were involved.
- End -
S e s s i o n 2 1 L W B ( L ) - P a g e 2 8 7
Examination of Estimates of Expenditure 2016-17 Reply Serial No.
LWB(L)099 CONTROLLING OFFICER’S REPLY (Question Serial No. 0190)
Head: (90) Labour Department
Subhead (No. & title): ( )
Programme: (2) Employment Services
Controlling Officer: Commissioner for Labour (Donald TONG)
Director of Bureau: Secretary for Labour and Welfare Question: Please provide breakdowns of the numbers of applications received and approved under the Supplementary Labour Scheme (SLS) by the Labour Department in the past 3 years by industry, job title, working hours and wage level. Asked by: Hon TANG Ka-piu (Member Question No. 19) Reply: In 2013, 2014 and 2015, employers applied to import 4 110, 6 613 and 4 689 workers respectively under SLS. The corresponding numbers of imported workers approved were 1 847, 2 722 and 2 880. Breakdowns of the number of imported workers applied for and approved by industry, job title and wage level are at Annexes 1 to 5. The majority of imported workers under SLS have a normal working time of either 8 or 9 hours per working day.
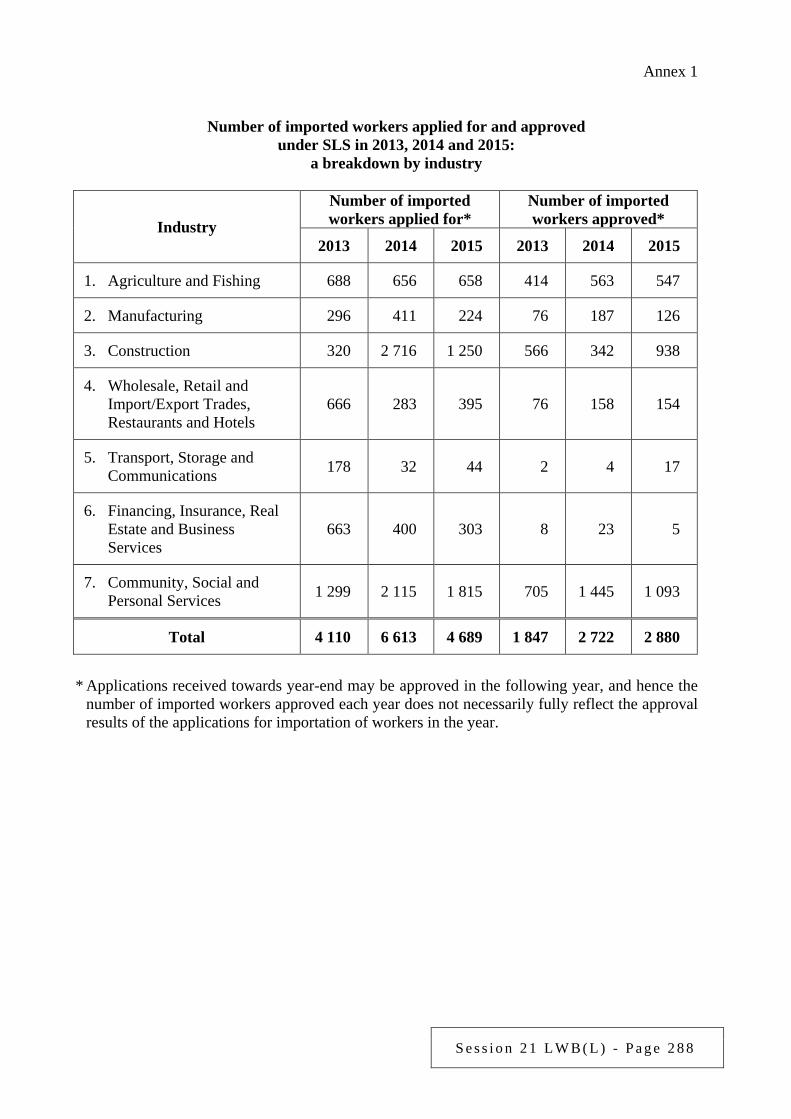
S e s s i o n 2 1 L W B ( L ) - P a g e 2 8 8
Annex 1
Number of imported workers applied for and approved under SLS in 2013, 2014 and 2015:
a breakdown by industry
Industry
Number of imported workers applied for*
Number of imported workers approved*
2013 2014 2015 2013 2014 2015
1. Agriculture and Fishing 688 656 658 414 563 547
2. Manufacturing 296 411 224 76 187 126
3. Construction 320 2 716 1 250 566 342 938
4. Wholesale, Retail and Import/Export Trades, Restaurants and Hotels
666 283 395 76 158 154
5. Transport, Storage and Communications 178 32 44 2 4 17
6. Financing, Insurance, Real Estate and Business Services
663 400 303 8 23 5
7. Community, Social and Personal Services 1 299 2 115 1 815 705 1 445 1 093
Total 4 110 6 613 4 689 1 847 2 722 2 880
* Applications received towards year-end may be approved in the following year, and hence the
number of imported workers approved each year does not necessarily fully reflect the approval results of the applications for importation of workers in the year.
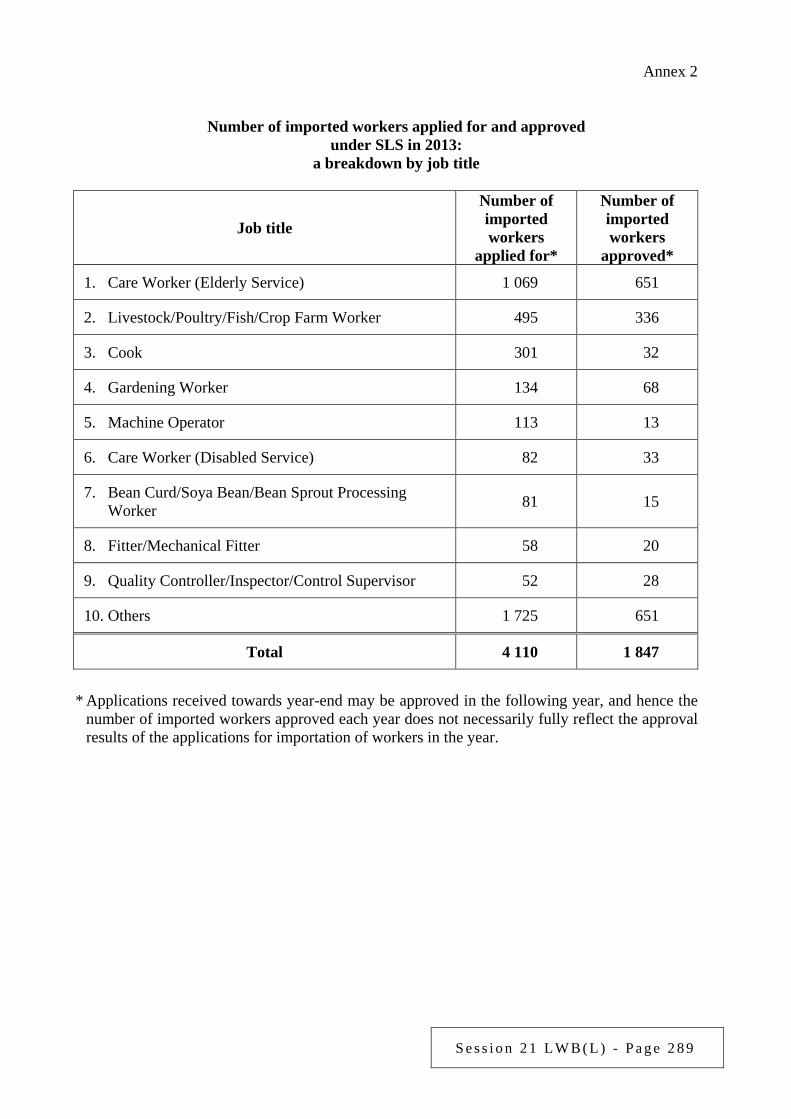
S e s s i o n 2 1 L W B ( L ) - P a g e 2 8 9
Annex 2
Number of imported workers applied for and approved under SLS in 2013:
a breakdown by job title
Job title
Number of imported workers
applied for*
Number of imported workers
approved*
1. Care Worker (Elderly Service) 1 069 651
2. Livestock/Poultry/Fish/Crop Farm Worker 495 336
3. Cook 301 32
4. Gardening Worker 134 68
5. Machine Operator 113 13
6. Care Worker (Disabled Service) 82 33
7. Bean Curd/Soya Bean/Bean Sprout Processing Worker 81 15
8. Fitter/Mechanical Fitter 58 20
9. Quality Controller/Inspector/Control Supervisor 52 28
10. Others 1 725 651
Total 4 110 1 847
* Applications received towards year-end may be approved in the following year, and hence the
number of imported workers approved each year does not necessarily fully reflect the approval results of the applications for importation of workers in the year.
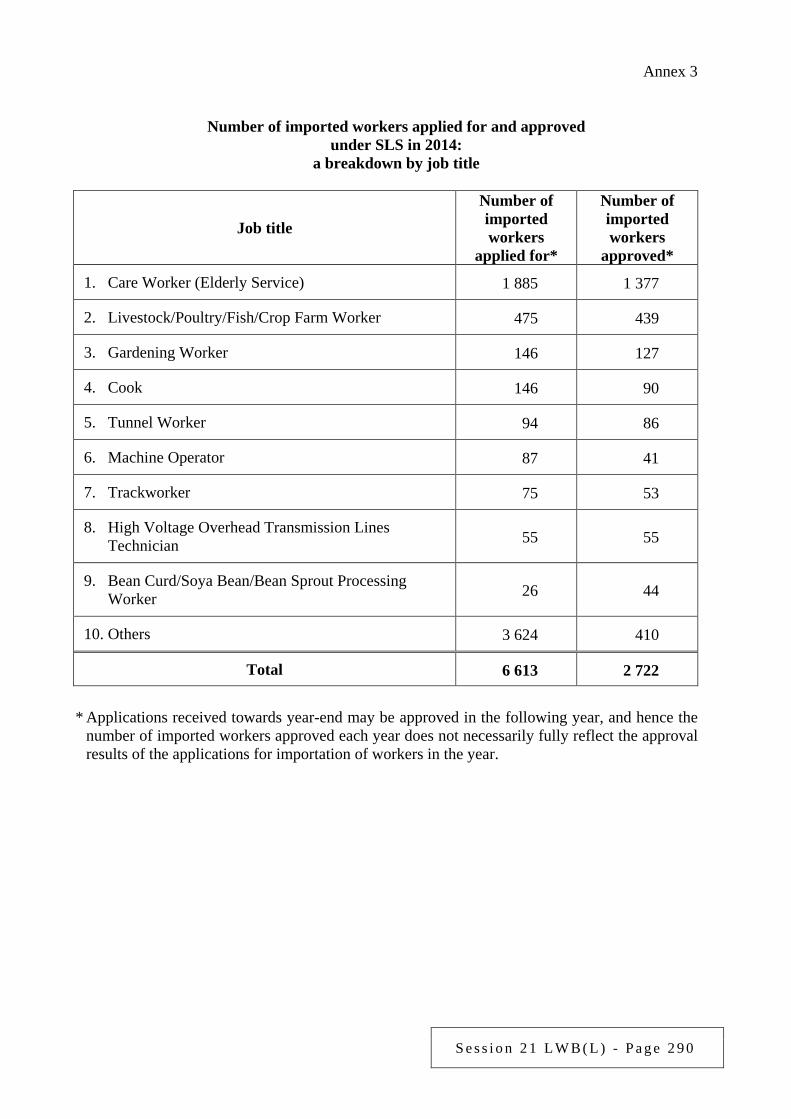
S e s s i o n 2 1 L W B ( L ) - P a g e 2 9 0
Annex 3
Number of imported workers applied for and approved under SLS in 2014:
a breakdown by job title
Job title
Number of imported workers
applied for*
Number of imported workers
approved*
1. Care Worker (Elderly Service) 1 885 1 377
2. Livestock/Poultry/Fish/Crop Farm Worker 475 439
3. Gardening Worker 146 127
4. Cook 146 90
5. Tunnel Worker 94 86
6. Machine Operator 87 41
7. Trackworker 75 53
8. High Voltage Overhead Transmission Lines Technician 55 55
9. Bean Curd/Soya Bean/Bean Sprout Processing Worker 26 44
10. Others 3 624 410
Total 6 613 2 722
* Applications received towards year-end may be approved in the following year, and hence the
number of imported workers approved each year does not necessarily fully reflect the approval results of the applications for importation of workers in the year.
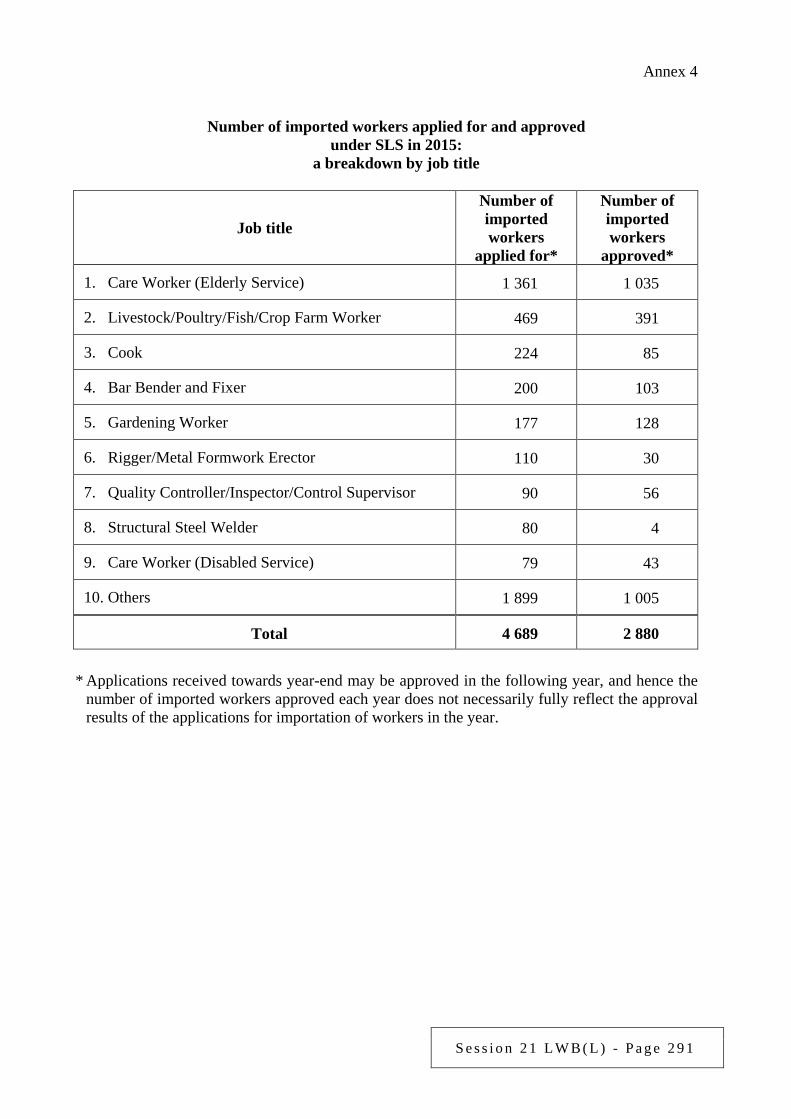
S e s s i o n 2 1 L W B ( L ) - P a g e 2 9 1
Annex 4
Number of imported workers applied for and approved under SLS in 2015:
a breakdown by job title
Job title
Number of imported workers
applied for*
Number of imported workers
approved*
1. Care Worker (Elderly Service) 1 361 1 035
2. Livestock/Poultry/Fish/Crop Farm Worker 469 391
3. Cook 224 85
4. Bar Bender and Fixer 200 103
5. Gardening Worker 177 128
6. Rigger/Metal Formwork Erector 110 30
7. Quality Controller/Inspector/Control Supervisor 90 56
8. Structural Steel Welder 80 4
9. Care Worker (Disabled Service) 79 43
10. Others 1 899 1 005
Total 4 689 2 880
* Applications received towards year-end may be approved in the following year, and hence the
number of imported workers approved each year does not necessarily fully reflect the approval results of the applications for importation of workers in the year.
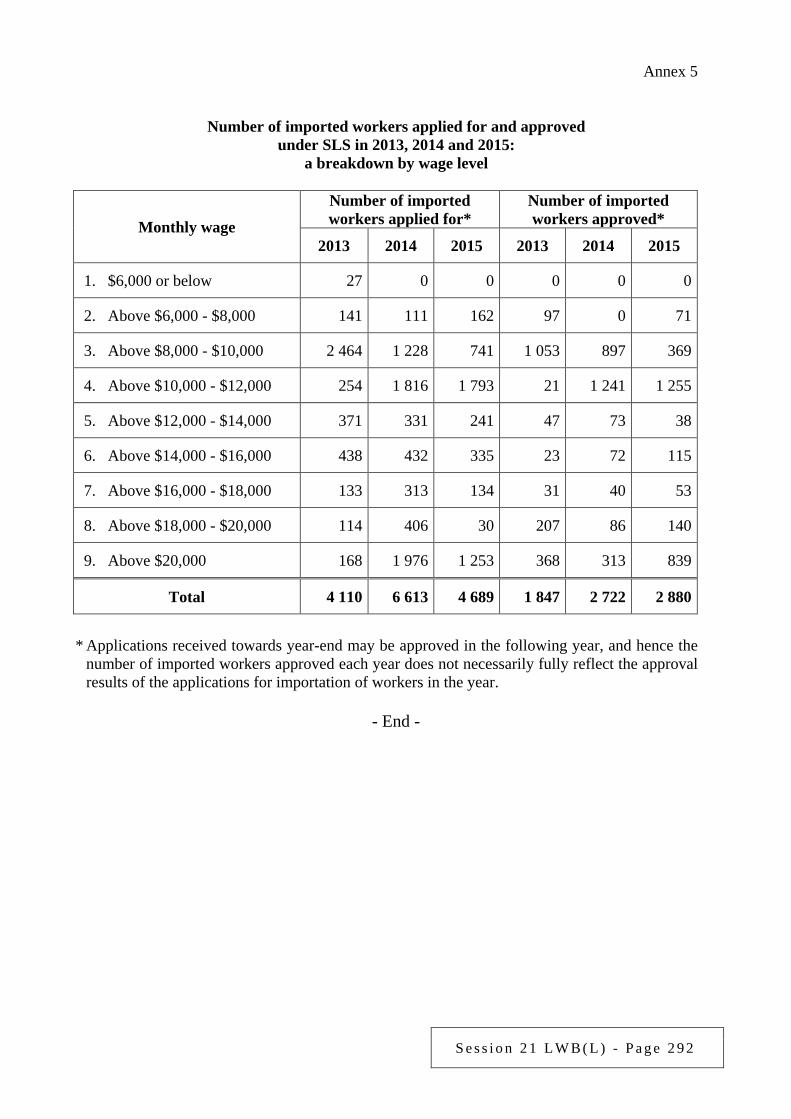
S e s s i o n 2 1 L W B ( L ) - P a g e 2 9 2
Annex 5
Number of imported workers applied for and approved under SLS in 2013, 2014 and 2015:
a breakdown by wage level
Monthly wage
Number of imported workers applied for*
Number of imported workers approved*
2013 2014 2015 2013 2014 2015
1. $6,000 or below 27 0 0 0 0 0
2. Above $6,000 - $8,000 141 111 162 97 0 71
3. Above $8,000 - $10,000 2 464 1 228 741 1 053 897 369
4. Above $10,000 - $12,000 254 1 816 1 793 21 1 241 1 255
5. Above $12,000 - $14,000 371 331 241 47 73 38
6. Above $14,000 - $16,000 438 432 335 23 72 115
7. Above $16,000 - $18,000 133 313 134 31 40 53
8. Above $18,000 - $20,000 114 406 30 207 86 140
9. Above $20,000 168 1 976 1 253 368 313 839
Total 4 110 6 613 4 689 1 847 2 722 2 880
* Applications received towards year-end may be approved in the following year, and hence the
number of imported workers approved each year does not necessarily fully reflect the approval results of the applications for importation of workers in the year.
- End -
S e s s i o n 2 1 L W B ( L ) - P a g e 2 9 3
Examination of Estimates of Expenditure 2016-17 Reply Serial No.
LWB(L)100 CONTROLLING OFFICER’S REPLY (Question Serial No. 0191)
Head: (90) Labour Department
Subhead (No. & title): (700) General non-recurrent
Programme: (2) Employment Services
Controlling Officer: Commissioner for Labour (Donald TONG)
Director of Bureau: Secretary for Labour and Welfare Question: Regarding the implementation of the Work Incentive Transport Subsidy (WITS) Scheme, would the Government advise this Committee of: (a) the numbers of individual-based applications and household-based applications
received in the past year; the number of successful applicants and its percentage share in the total number of applicants, with breakdowns by gender, age, household size, residential district, industry, job title, monthly wage and rate of subsidy granted;
(b) the time of completion of the comprehensive review of the WITS Scheme and of
official announcement of the findings; and (c) the publicity work planned and the estimated expenditure for the promotion of the
WITS Scheme in 2016-17? Asked by: Hon TANG Ka-piu (Member Question No. 20) Reply: The information sought is provided as follows: (a) In 2015, the WITS Scheme received 78 278 applications, including 46 968
individual-based applications and 31 310 household-based applications. Over the same period, the Labour Department (LD) completed processing of 77 514 applications with a gross applicant count of 80 293. Of these, 74 426 were granted the subsidy, representing 92.7% of the applicants with processing completed (gross applicant count). Breakdowns of the number of applicants who were granted the subsidy and its percentage share in the number of applicants with processing completed (gross applicant count) by gender, age, household size, residential district, industry, occupation, monthly wage and rate of subsidy granted are set out at Annex.
S e s s i o n 2 1 L W B ( L ) - P a g e 2 9 4
(b) LD is conducting a comprehensive review of the WITS Scheme which is expected to
be completed in the second quarter of this year. The review findings will then be reported to the Legislative Council Panel on Manpower.
(c) In 2016-17, LD will continue to organise publicity activities to promote the WITS
Scheme. The estimated expenditure is $1 million. The activities include: broadcasting television and radio Announcements in the Public Interest; distributing/displaying promotional leaflets and posters; advertising in newspapers and publications of target organisations; publicising in LD’s job fairs, exhibitions and briefings for stakeholders; and displaying banners for outdoor publicity, etc.
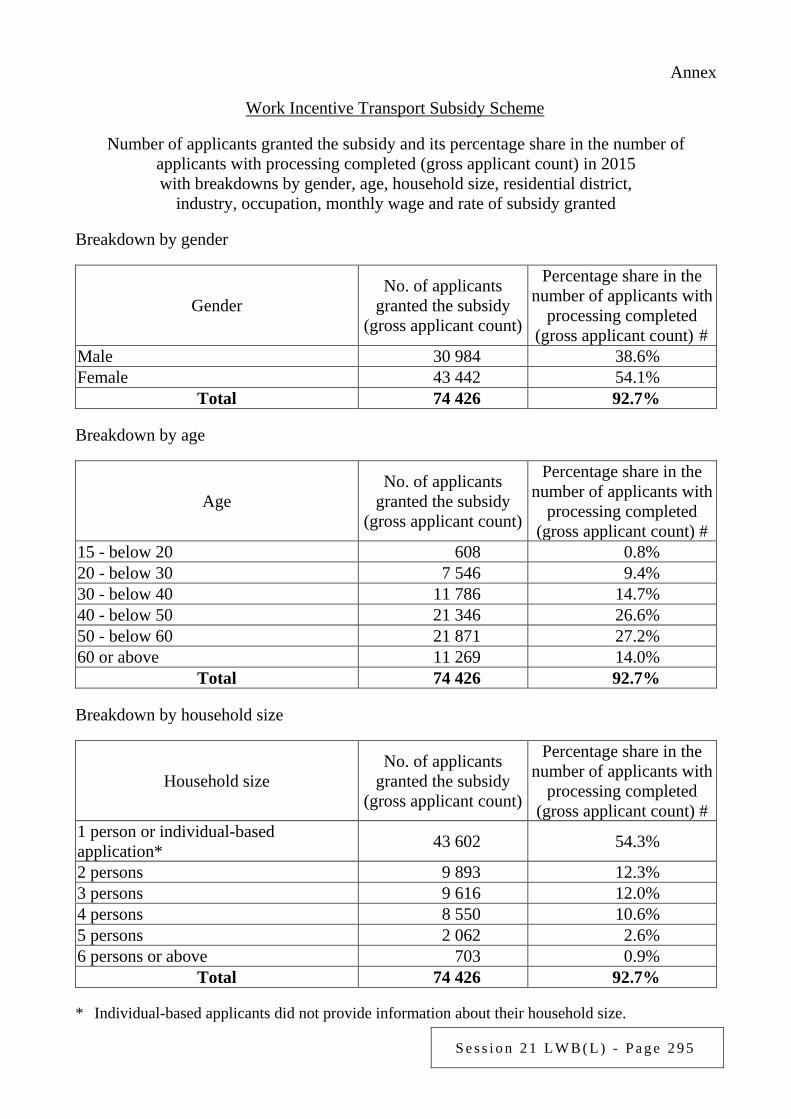
S e s s i o n 2 1 L W B ( L ) - P a g e 2 9 5
Annex
Work Incentive Transport Subsidy Scheme
Number of applicants granted the subsidy and its percentage share in the number of applicants with processing completed (gross applicant count) in 2015 with breakdowns by gender, age, household size, residential district,
industry, occupation, monthly wage and rate of subsidy granted Breakdown by gender
Gender No. of applicants
granted the subsidy (gross applicant count)
Percentage share in the number of applicants with
processing completed (gross applicant count) #
Male 30 984 38.6% Female 43 442 54.1%
Total 74 426 92.7% Breakdown by age
Age No. of applicants
granted the subsidy (gross applicant count)
Percentage share in the number of applicants with
processing completed (gross applicant count) #
15 - below 20 608 0.8% 20 - below 30 7 546 9.4% 30 - below 40 11 786 14.7% 40 - below 50 21 346 26.6% 50 - below 60 21 871 27.2% 60 or above 11 269 14.0%
Total 74 426 92.7% Breakdown by household size
Household size No. of applicants
granted the subsidy (gross applicant count)
Percentage share in the number of applicants with
processing completed (gross applicant count) #
1 person or individual-based application* 43 602 54.3%
2 persons 9 893 12.3% 3 persons 9 616 12.0% 4 persons 8 550 10.6% 5 persons 2 062 2.6% 6 persons or above 703 0.9%
Total 74 426 92.7% * Individual-based applicants did not provide information about their household size.
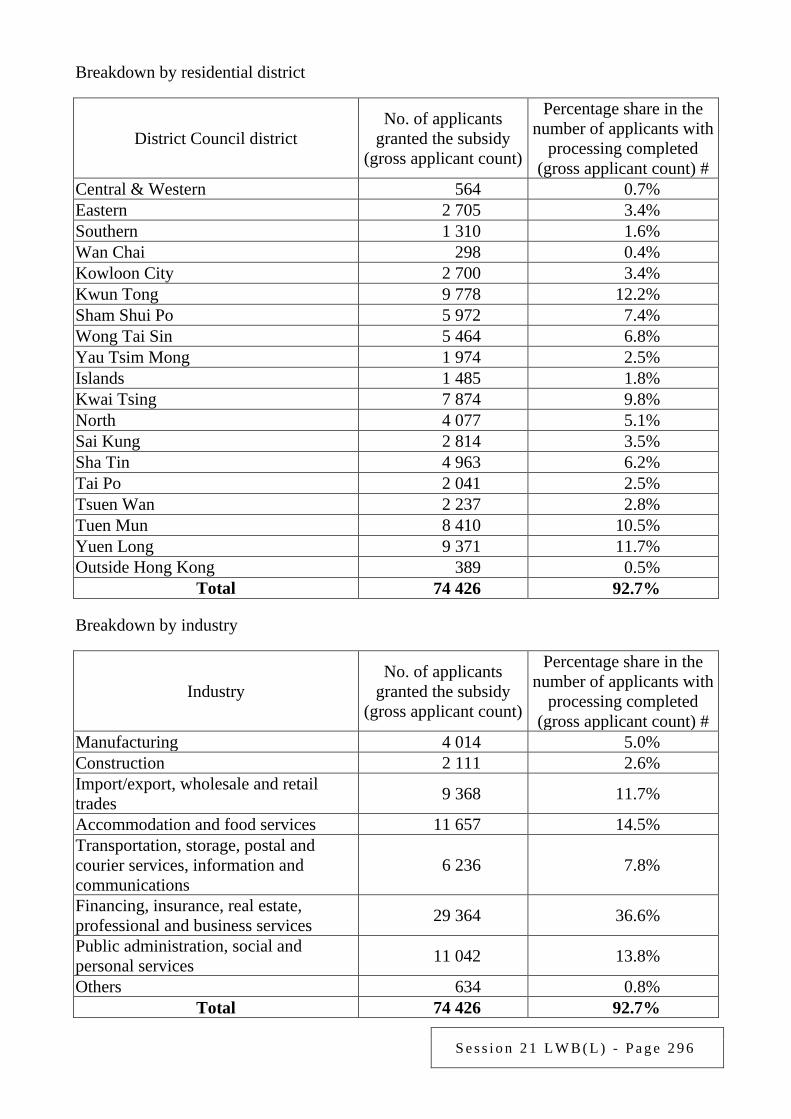
S e s s i o n 2 1 L W B ( L ) - P a g e 2 9 6
Breakdown by residential district
District Council district No. of applicants
granted the subsidy (gross applicant count)
Percentage share in the number of applicants with
processing completed (gross applicant count) #
Central & Western 564 0.7% Eastern 2 705 3.4% Southern 1 310 1.6% Wan Chai 298 0.4% Kowloon City 2 700 3.4% Kwun Tong 9 778 12.2% Sham Shui Po 5 972 7.4% Wong Tai Sin 5 464 6.8% Yau Tsim Mong 1 974 2.5% Islands 1 485 1.8% Kwai Tsing 7 874 9.8% North 4 077 5.1% Sai Kung 2 814 3.5% Sha Tin 4 963 6.2% Tai Po 2 041 2.5% Tsuen Wan 2 237 2.8% Tuen Mun 8 410 10.5% Yuen Long 9 371 11.7% Outside Hong Kong 389 0.5%
Total 74 426 92.7% Breakdown by industry
Industry No. of applicants
granted the subsidy (gross applicant count)
Percentage share in the number of applicants with
processing completed (gross applicant count) #
Manufacturing 4 014 5.0% Construction 2 111 2.6% Import/export, wholesale and retail trades 9 368 11.7%
Accommodation and food services 11 657 14.5% Transportation, storage, postal and courier services, information and communications
6 236 7.8%
Financing, insurance, real estate, professional and business services 29 364 36.6%
Public administration, social and personal services 11 042 13.8%
Others 634 0.8% Total 74 426 92.7%
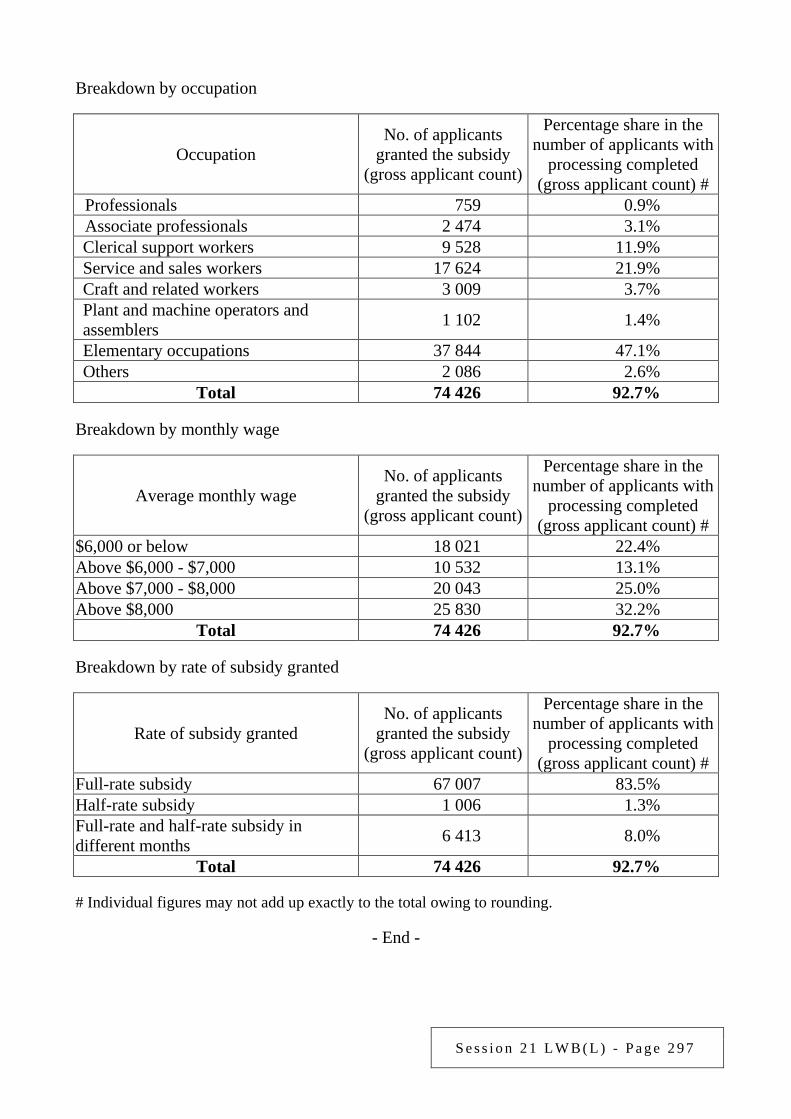
S e s s i o n 2 1 L W B ( L ) - P a g e 2 9 7
Breakdown by occupation
Occupation No. of applicants
granted the subsidy (gross applicant count)
Percentage share in the number of applicants with
processing completed (gross applicant count) #
Professionals 759 0.9% Associate professionals 2 474 3.1% Clerical support workers 9 528 11.9% Service and sales workers 17 624 21.9% Craft and related workers 3 009 3.7% Plant and machine operators and assemblers 1 102 1.4%
Elementary occupations 37 844 47.1% Others 2 086 2.6%
Total 74 426 92.7% Breakdown by monthly wage
Average monthly wage No. of applicants
granted the subsidy (gross applicant count)
Percentage share in the number of applicants with
processing completed (gross applicant count) #
$6,000 or below 18 021 22.4% Above $6,000 - $7,000 10 532 13.1% Above $7,000 - $8,000 20 043 25.0% Above $8,000 25 830 32.2%
Total 74 426 92.7% Breakdown by rate of subsidy granted
Rate of subsidy granted No. of applicants
granted the subsidy (gross applicant count)
Percentage share in the number of applicants with
processing completed (gross applicant count) #
Full-rate subsidy 67 007 83.5% Half-rate subsidy 1 006 1.3% Full-rate and half-rate subsidy in different months 6 413 8.0%
Total 74 426 92.7% # Individual figures may not add up exactly to the total owing to rounding.
- End -
S e s s i o n 2 1 L W B ( L ) - P a g e 2 9 8
Examination of Estimates of Expenditure 2016-17 Reply Serial No.
LWB(L)101 CONTROLLING OFFICER’S REPLY (Question Serial No. 2276)
Head: (90) Labour Department
Subhead (No. & title): ( )
Programme: (1) Labour Relations
Controlling Officer: Commissioner for Labour (Donald TONG)
Director of Bureau: Secretary for Labour and Welfare Question: Regarding the handling of labour disputes and claims, would the Government advise this Committee of: (a) the respective numbers of labour disputes and claims handled by the Labour
Department (LD) in 2015; (b) the respective numbers of labour disputes and claims for which conciliation service
was not rendered by LD in 2015 because the employers concerned were insolvent or could not be reached; and
(c) the total number of claimants as well as the total amount of claims involved in labour
disputes and claims in 2015? Asked by: Hon TANG Ka-piu (Member Question No. 71) Reply: The information sought is provided as follows: (a) The numbers of labour disputes (i.e. cases involving over 20 employees) and claims
(i.e. cases involving 20 or less employees) handled by LD in 2015 were 53 and 14 388 respectively.
(b) The numbers of labour disputes and claims for which conciliation service was not
rendered by LD in 2015 because the employers concerned were insolvent or could not be reached were 14 and 465 respectively.
(c) The total number of claimants as well as the total amount of claims involved in labour
disputes and claims in 2015 are as follows:
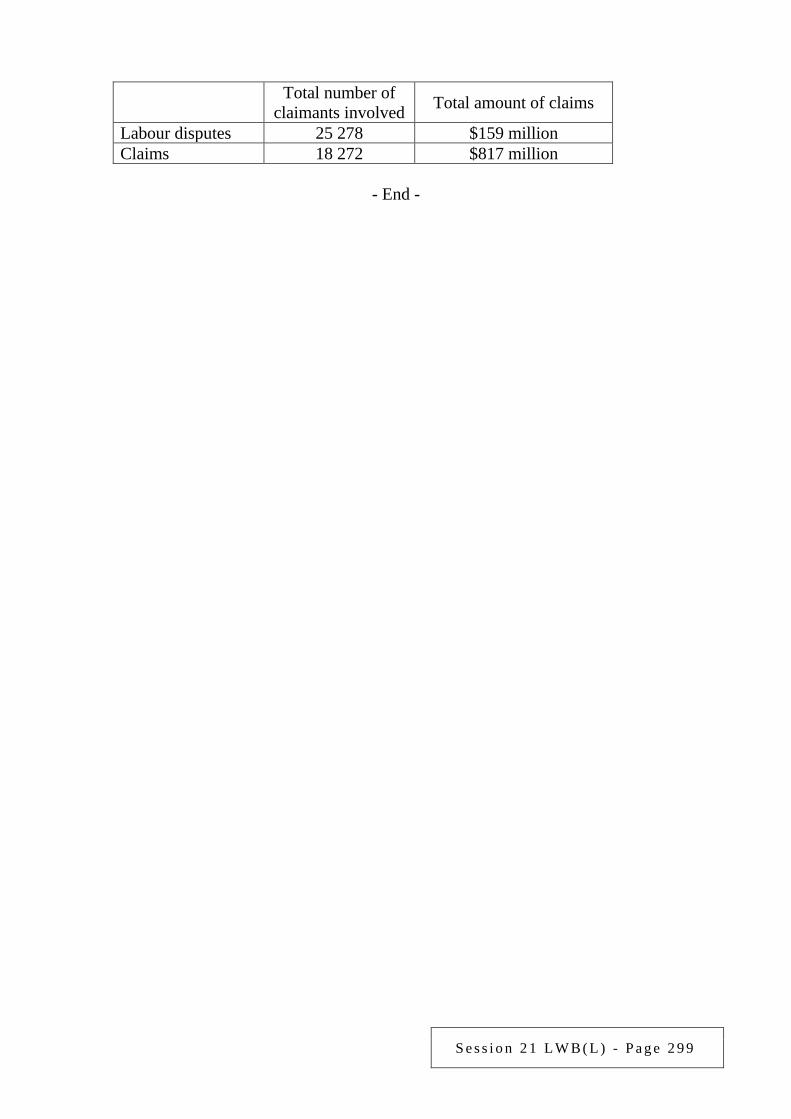
S e s s i o n 2 1 L W B ( L ) - P a g e 2 9 9
Total number of
claimants involved Total amount of claims
Labour disputes 25 278 $159 million Claims 18 272 $817 million
- End -
S e s s i o n 2 1 L W B ( L ) - P a g e 3 0 0
Examination of Estimates of Expenditure 2016-17 Reply Serial No.
LWB(L)102 CONTROLLING OFFICER’S REPLY (Question Serial No. 2277)
Head: (90) Labour Department
Subhead (No. & title): ( )
Programme: (2) Employment Services
Controlling Officer: Commissioner for Labour (Donald TONG)
Director of Bureau: Secretary for Labour and Welfare Question: Regarding the placement position of new arrival job seekers from the Mainland, would the Government provide the following information: (a) the total number of new arrival job seekers from the Mainland registered in 2015 (with
breakdowns by gender, age, residential district and length of residence in Hong Kong); (b) the number of new arrival job seekers from the Mainland with placements secured
through the referral services of the Labour Department (LD) in 2015 (with breakdowns by gender, age, residential district, length of residence in Hong Kong, industry, occupation, mode of employment and wage level); and
(c) whether new measures have been formulated for 2016-17 to enhance employment
support for new arrivals from the Mainland? Asked by: Hon TANG Ka-piu (Member Question No. 72) Reply: The information sought is provided as follows: (a) In 2015, 4 132 new arrival job seekers from the Mainland registered with LD for
employment services. Breakdowns by gender, age, residential district and length of residence in Hong Kong are at Annex 1.
(b) In 2015, 803 placements were secured for new arrival job seekers from the Mainland
through LD’s referral services. LD does not keep a breakdown of the placements by mode of employment. Breakdowns by gender, age, residential district, length of residence in Hong Kong, industry, occupation and wage level are at Annex 2. Job seekers may be placed into employment either through the referral of LD or by direct
S e s s i o n 2 1 L W B ( L ) - P a g e 3 0 1
application to employers who advertise their vacancies via LD. Currently, about 99% of the vacancies advertised through LD are open for direct application by job seekers.
(c) In addition to LD’s general employment services and facilities available for new
arrivals from the Mainland, special counters are set up in all LD job centres to provide them with job referral services. Resource corners are also set up in the job centres, and tailor-made employment briefings are regularly organised to provide employment information to help them better understand the local labour market situation and improve job search skills. New arrival job seekers from the Mainland may also meet the employment officers in job centres to obtain job search advice and information on training/retraining courses, and/or to receive career aptitude assessment as appropriate. Those who have difficulties finding jobs are also encouraged to participate in various employment programmes to enhance their employability. In 2016-17, LD will continue to strengthen collaboration with non-governmental organisations providing services to new arrivals from the Mainland and encourage these organisations to refer the new arrivals from the Mainland with employment needs to LD for employment services at job centres. At the same time, LD will also continue to proactively promote large-scale and district-based job fairs to new arrival job seekers from the Mainland and encourage their participation so as to increase their employment opportunities.
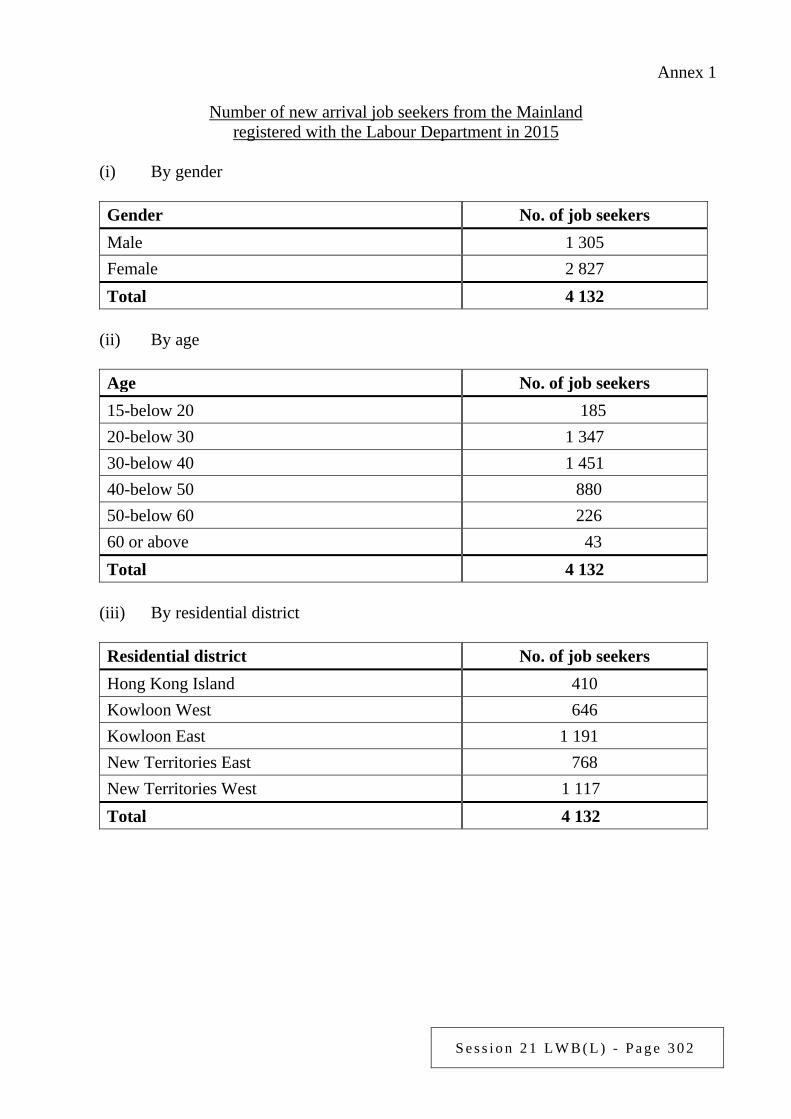
S e s s i o n 2 1 L W B ( L ) - P a g e 3 0 2
Annex 1
Number of new arrival job seekers from the Mainland registered with the Labour Department in 2015
(i) By gender
Gender No. of job seekers Male 1 305 Female 2 827 Total 4 132
(ii) By age
Age No. of job seekers 15-below 20 185 20-below 30 1 347 30-below 40 1 451 40-below 50 880 50-below 60 226 60 or above 43 Total 4 132
(iii) By residential district
Residential district No. of job seekers Hong Kong Island 410 Kowloon West 646 Kowloon East 1 191 New Territories East 768 New Territories West 1 117 Total 4 132
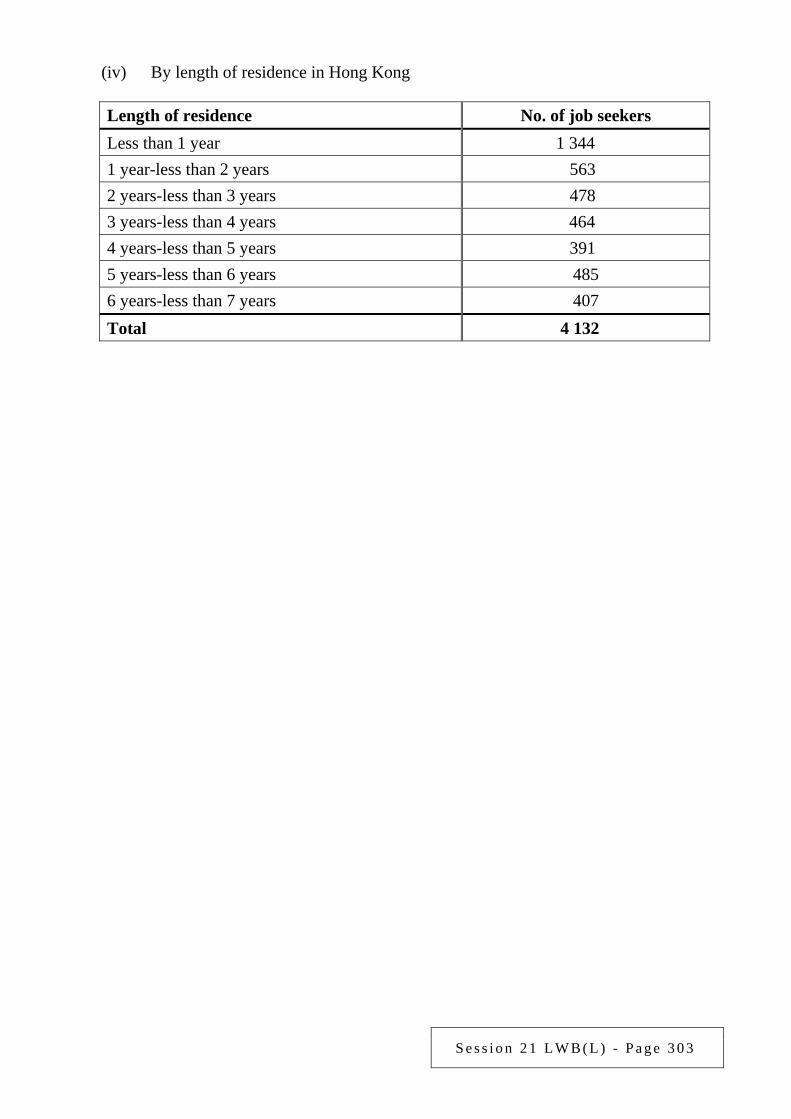
S e s s i o n 2 1 L W B ( L ) - P a g e 3 0 3
(iv) By length of residence in Hong Kong
Length of residence No. of job seekers Less than 1 year 1 344 1 year-less than 2 years 563 2 years-less than 3 years 478 3 years-less than 4 years 464 4 years-less than 5 years 391 5 years-less than 6 years 485 6 years-less than 7 years 407 Total 4 132
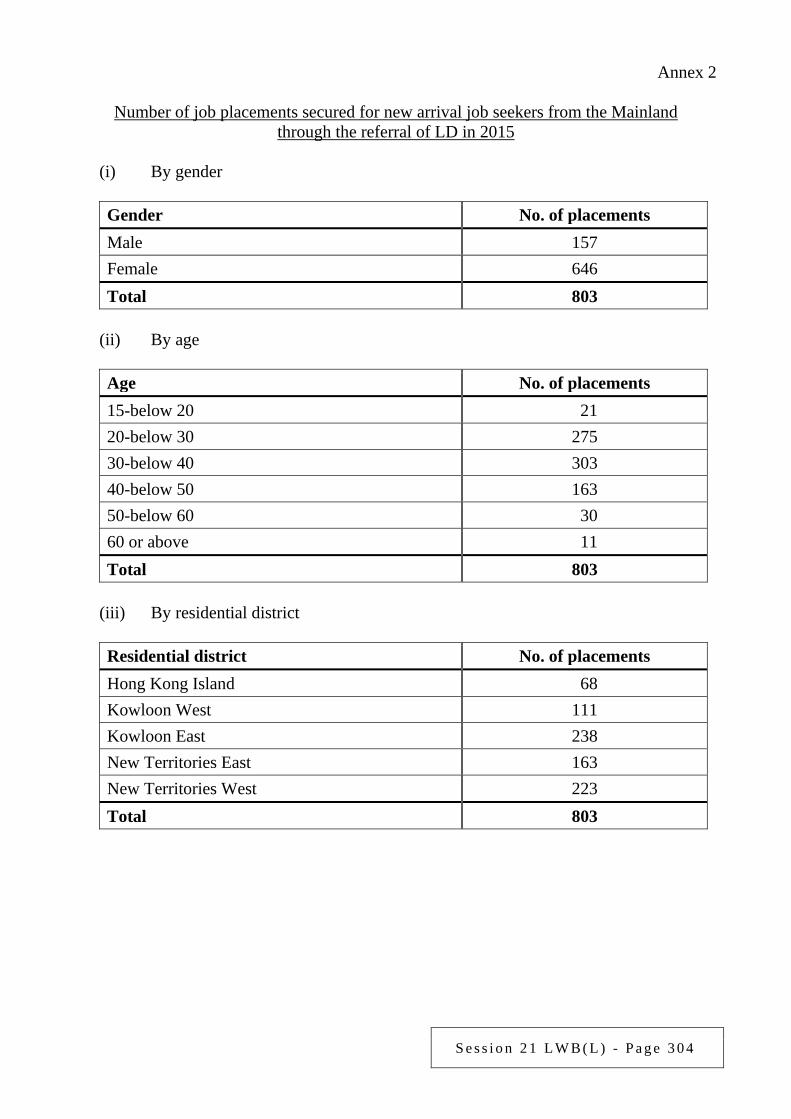
S e s s i o n 2 1 L W B ( L ) - P a g e 3 0 4
Annex 2
Number of job placements secured for new arrival job seekers from the Mainland through the referral of LD in 2015
(i) By gender
Gender No. of placements Male 157 Female 646 Total 803
(ii) By age
Age No. of placements 15-below 20 21 20-below 30 275 30-below 40 303 40-below 50 163 50-below 60 30 60 or above 11 Total 803
(iii) By residential district
Residential district No. of placements Hong Kong Island 68 Kowloon West 111 Kowloon East 238 New Territories East 163 New Territories West 223 Total 803
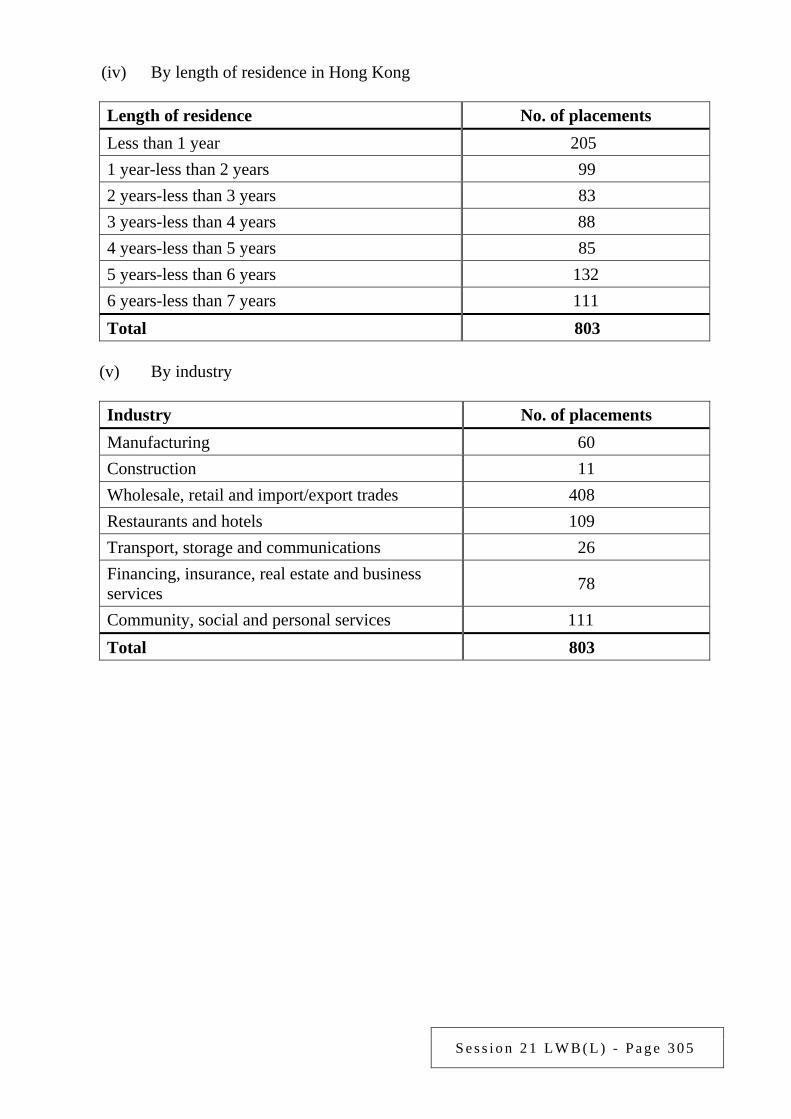
S e s s i o n 2 1 L W B ( L ) - P a g e 3 0 5
(iv) By length of residence in Hong Kong
Length of residence No. of placements Less than 1 year 205 1 year-less than 2 years 99 2 years-less than 3 years 83 3 years-less than 4 years 88 4 years-less than 5 years 85 5 years-less than 6 years 132 6 years-less than 7 years 111 Total 803
(v) By industry
Industry No. of placements Manufacturing 60 Construction 11 Wholesale, retail and import/export trades 408 Restaurants and hotels 109 Transport, storage and communications 26 Financing, insurance, real estate and business services 78
Community, social and personal services 111 Total 803
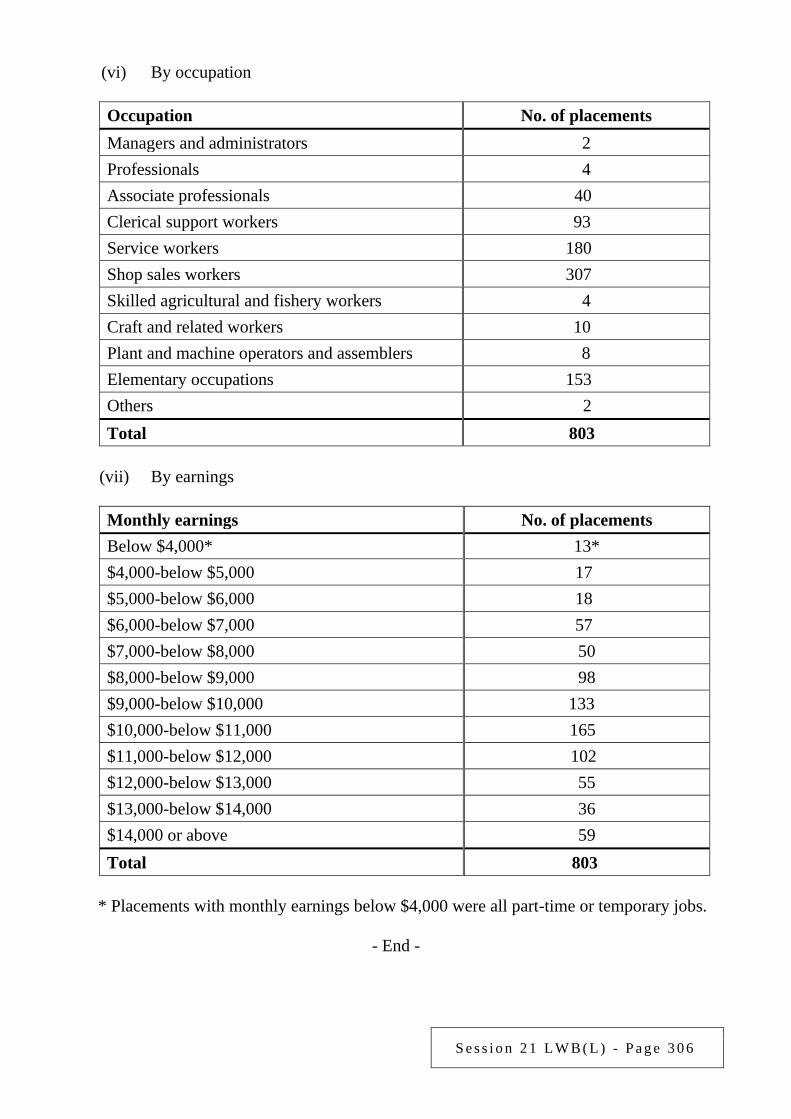
S e s s i o n 2 1 L W B ( L ) - P a g e 3 0 6
(vi) By occupation
Occupation No. of placements Managers and administrators 2 Professionals 4 Associate professionals 40 Clerical support workers 93 Service workers 180 Shop sales workers 307 Skilled agricultural and fishery workers 4 Craft and related workers 10 Plant and machine operators and assemblers 8 Elementary occupations 153 Others 2 Total 803
(vii) By earnings
Monthly earnings No. of placements Below $4,000* 13* $4,000-below $5,000 17 $5,000-below $6,000 18 $6,000-below $7,000 57 $7,000-below $8,000 50 $8,000-below $9,000 98 $9,000-below $10,000 133 $10,000-below $11,000 165 $11,000-below $12,000 102 $12,000-below $13,000 55 $13,000-below $14,000 36 $14,000 or above 59 Total 803
* Placements with monthly earnings below $4,000 were all part-time or temporary jobs.
- End -
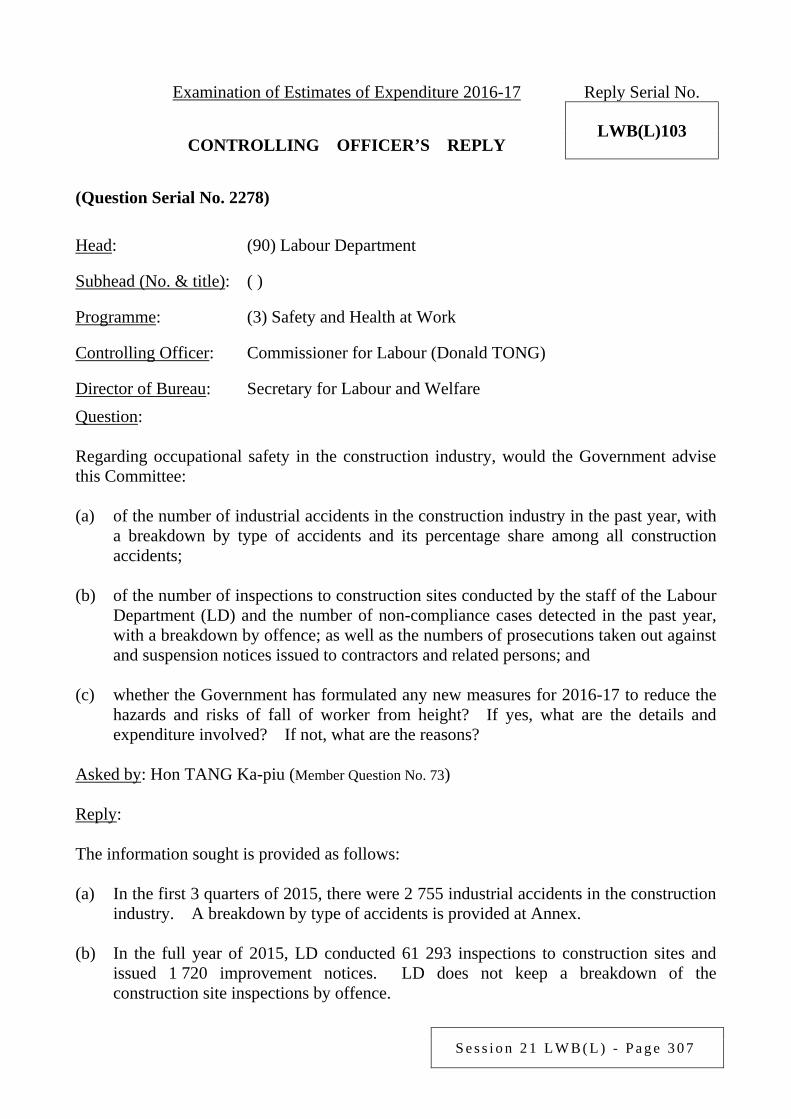
S e s s i o n 2 1 L W B ( L ) - P a g e 3 0 7
Examination of Estimates of Expenditure 2016-17 Reply Serial No.
LWB(L)103 CONTROLLING OFFICER’S REPLY (Question Serial No. 2278)
Head: (90) Labour Department
Subhead (No. & title): ( )
Programme: (3) Safety and Health at Work
Controlling Officer: Commissioner for Labour (Donald TONG)
Director of Bureau: Secretary for Labour and Welfare Question: Regarding occupational safety in the construction industry, would the Government advise this Committee: (a) of the number of industrial accidents in the construction industry in the past year, with
a breakdown by type of accidents and its percentage share among all construction accidents;
(b) of the number of inspections to construction sites conducted by the staff of the Labour
Department (LD) and the number of non-compliance cases detected in the past year, with a breakdown by offence; as well as the numbers of prosecutions taken out against and suspension notices issued to contractors and related persons; and
(c) whether the Government has formulated any new measures for 2016-17 to reduce the
hazards and risks of fall of worker from height? If yes, what are the details and expenditure involved? If not, what are the reasons?
Asked by: Hon TANG Ka-piu (Member Question No. 73) Reply: The information sought is provided as follows: (a) In the first 3 quarters of 2015, there were 2 755 industrial accidents in the construction
industry. A breakdown by type of accidents is provided at Annex. (b) In the full year of 2015, LD conducted 61 293 inspections to construction sites and
issued 1 720 improvement notices. LD does not keep a breakdown of the construction site inspections by offence.
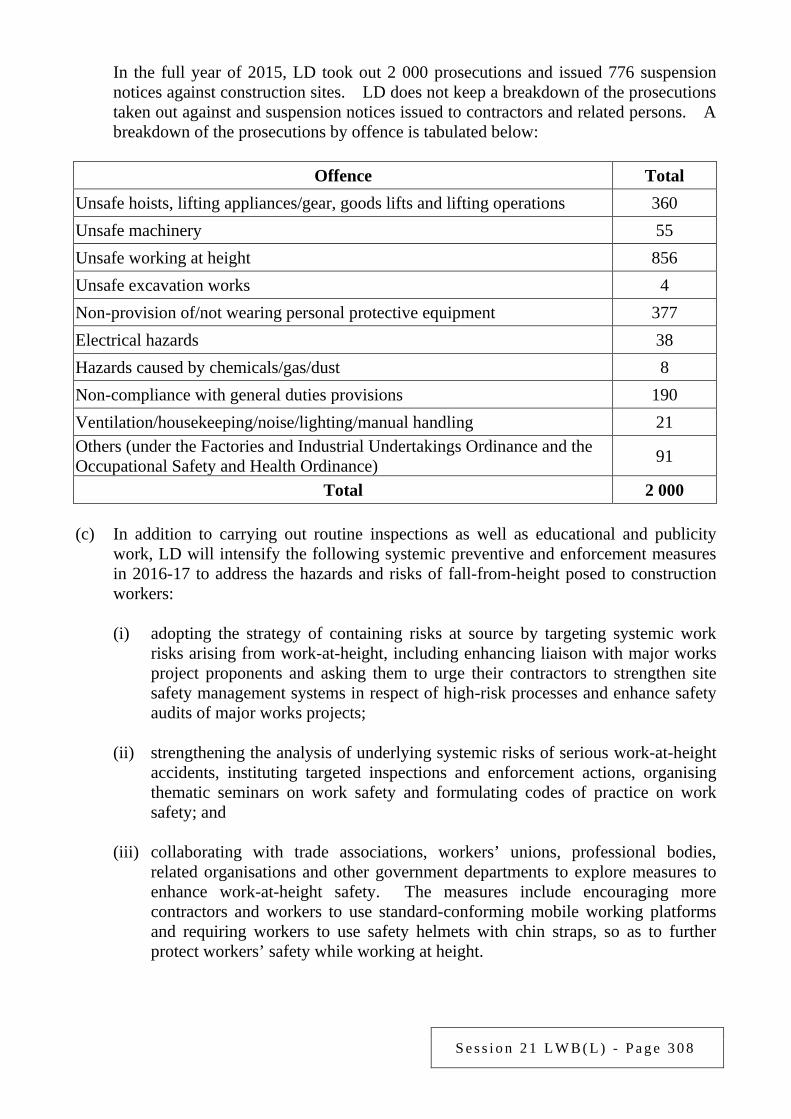
S e s s i o n 2 1 L W B ( L ) - P a g e 3 0 8
In the full year of 2015, LD took out 2 000 prosecutions and issued 776 suspension notices against construction sites. LD does not keep a breakdown of the prosecutions taken out against and suspension notices issued to contractors and related persons. A breakdown of the prosecutions by offence is tabulated below:
Offence Total
Unsafe hoists, lifting appliances/gear, goods lifts and lifting operations 360 Unsafe machinery 55 Unsafe working at height 856 Unsafe excavation works 4 Non-provision of/not wearing personal protective equipment 377 Electrical hazards 38 Hazards caused by chemicals/gas/dust 8 Non-compliance with general duties provisions 190 Ventilation/housekeeping/noise/lighting/manual handling 21 Others (under the Factories and Industrial Undertakings Ordinance and the Occupational Safety and Health Ordinance) 91
Total 2 000 (c) In addition to carrying out routine inspections as well as educational and publicity
work, LD will intensify the following systemic preventive and enforcement measures in 2016-17 to address the hazards and risks of fall-from-height posed to construction workers:
(i) adopting the strategy of containing risks at source by targeting systemic work
risks arising from work-at-height, including enhancing liaison with major works project proponents and asking them to urge their contractors to strengthen site safety management systems in respect of high-risk processes and enhance safety audits of major works projects;
(ii) strengthening the analysis of underlying systemic risks of serious work-at-height
accidents, instituting targeted inspections and enforcement actions, organising thematic seminars on work safety and formulating codes of practice on work safety; and
(iii) collaborating with trade associations, workers’ unions, professional bodies,
related organisations and other government departments to explore measures to enhance work-at-height safety. The measures include encouraging more contractors and workers to use standard-conforming mobile working platforms and requiring workers to use safety helmets with chin straps, so as to further protect workers’ safety while working at height.

S e s s i o n 2 1 L W B ( L ) - P a g e 3 0 9
The above preventive and enforcement work focusing on occupational safety of the construction industry is an integral part of LD’s work, and the expenditure involved cannot be separately identified.
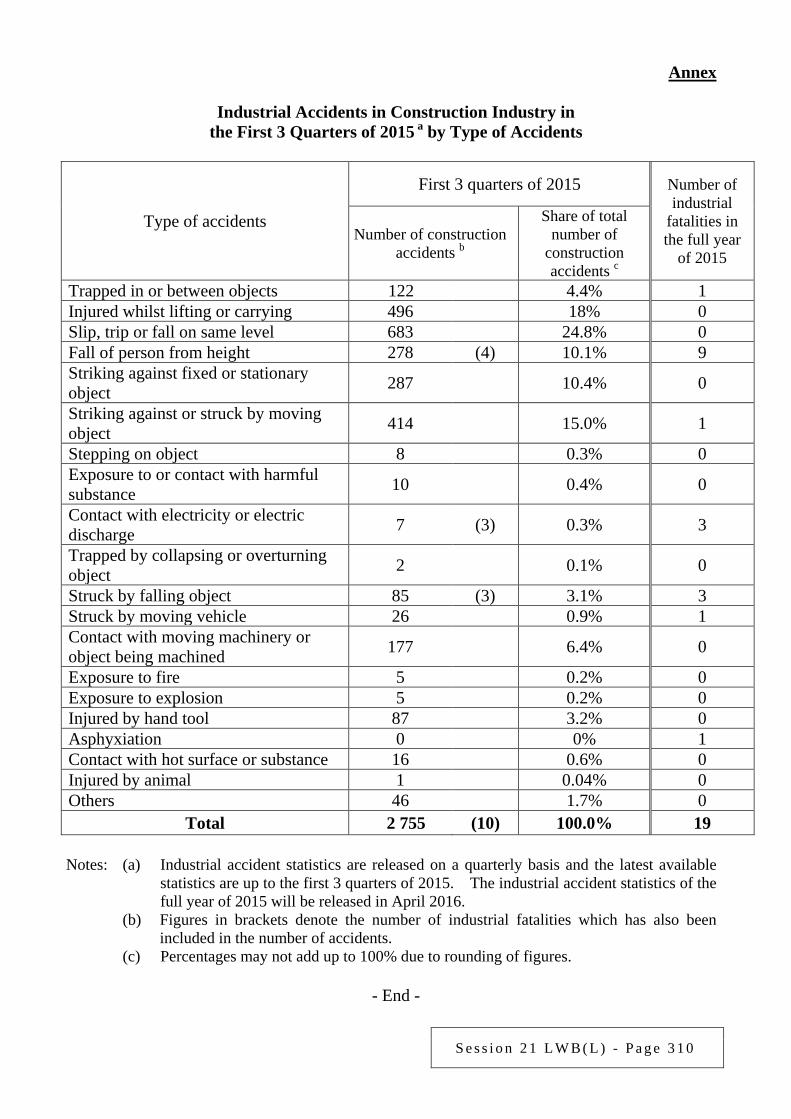
S e s s i o n 2 1 L W B ( L ) - P a g e 3 1 0
Annex
Industrial Accidents in Construction Industry in the First 3 Quarters of 2015 a by Type of Accidents
Type of accidents
First 3 quarters of 2015 Number of industrial
fatalities in the full year
of 2015 Number of construction
accidents b
Share of total number of
construction accidents c
Trapped in or between objects 122 4.4% 1 Injured whilst lifting or carrying 496 18% 0 Slip, trip or fall on same level 683 24.8% 0 Fall of person from height 278 (4) 10.1% 9 Striking against fixed or stationary object 287 10.4% 0
Striking against or struck by moving object 414 15.0% 1
Stepping on object 8 0.3% 0 Exposure to or contact with harmful substance 10 0.4% 0
Contact with electricity or electric discharge 7 (3) 0.3% 3
Trapped by collapsing or overturning object 2 0.1% 0
Struck by falling object 85 (3) 3.1% 3 Struck by moving vehicle 26 0.9% 1 Contact with moving machinery or object being machined 177 6.4% 0
Exposure to fire 5 0.2% 0 Exposure to explosion 5 0.2% 0 Injured by hand tool 87 3.2% 0 Asphyxiation 0 0% 1 Contact with hot surface or substance 16 0.6% 0 Injured by animal 1 0.04% 0 Others 46 1.7% 0
Total 2 755 (10) 100.0% 19
Notes: (a) Industrial accident statistics are released on a quarterly basis and the latest available statistics are up to the first 3 quarters of 2015. The industrial accident statistics of the full year of 2015 will be released in April 2016.
(b) Figures in brackets denote the number of industrial fatalities which has also been included in the number of accidents.
(c) Percentages may not add up to 100% due to rounding of figures.
- End -
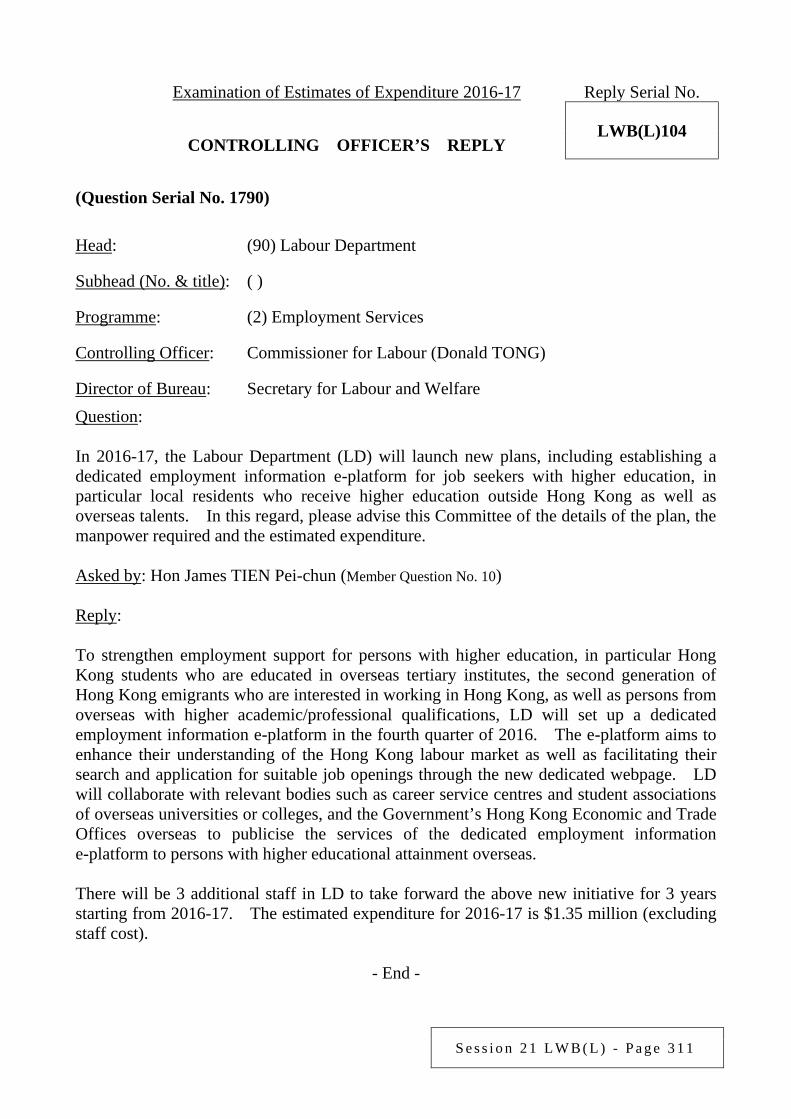
S e s s i o n 2 1 L W B ( L ) - P a g e 3 1 1
Examination of Estimates of Expenditure 2016-17 Reply Serial No.
LWB(L)104 CONTROLLING OFFICER’S REPLY (Question Serial No. 1790)
Head: (90) Labour Department
Subhead (No. & title): ( )
Programme: (2) Employment Services
Controlling Officer: Commissioner for Labour (Donald TONG)
Director of Bureau: Secretary for Labour and Welfare Question: In 2016-17, the Labour Department (LD) will launch new plans, including establishing a dedicated employment information e-platform for job seekers with higher education, in particular local residents who receive higher education outside Hong Kong as well as overseas talents. In this regard, please advise this Committee of the details of the plan, the manpower required and the estimated expenditure. Asked by: Hon James TIEN Pei-chun (Member Question No. 10) Reply: To strengthen employment support for persons with higher education, in particular Hong Kong students who are educated in overseas tertiary institutes, the second generation of Hong Kong emigrants who are interested in working in Hong Kong, as well as persons from overseas with higher academic/professional qualifications, LD will set up a dedicated employment information e-platform in the fourth quarter of 2016. The e-platform aims to enhance their understanding of the Hong Kong labour market as well as facilitating their search and application for suitable job openings through the new dedicated webpage. LD will collaborate with relevant bodies such as career service centres and student associations of overseas universities or colleges, and the Government’s Hong Kong Economic and Trade Offices overseas to publicise the services of the dedicated employment information e-platform to persons with higher educational attainment overseas. There will be 3 additional staff in LD to take forward the above new initiative for 3 years starting from 2016-17. The estimated expenditure for 2016-17 is $1.35 million (excluding staff cost).
- End -

S e s s i o n 2 1 L W B ( L ) - P a g e 3 1 2
Examination of Estimates of Expenditure 2016-17 Reply Serial No.
LWB(L)105 CONTROLLING OFFICER’S REPLY (Question Serial No. 1791)
Head: (90) Labour Department
Subhead (No. & title): ( )
Programme: (3) Safety and Health at Work
Controlling Officer: Commissioner for Labour (Donald TONG)
Director of Bureau: Secretary for Labour and Welfare Question: For 2016-17, the Labour Department (LD) plans to intensify systematic preventive and enforcement efforts to tackle fall-from-height hazards and other work hazards in the construction sector, including major works projects and renovation, maintenance, alteration and addition (RMAA) works. In this connection, would the Government advise this Committee of: (a) the respective numbers of fatalities relating to infrastructure projects and the public
housing programme in each of the past 5 years in table form; and (b) the specific details, estimated operating expenses and manpower for the preventive and
enforcement measures under the new plan? Asked by: Hon James TIEN Pei-chun (Member Question No. 11) Reply: The information sought is provided as follows: (a) LD does not keep information on industrial accidents relating to infrastructure
projects. The respective numbers of industrial fatalities that occurred on new works sites in the public sector and under the public housing programme in the full years from 2011 to 2015 are tabulated below:
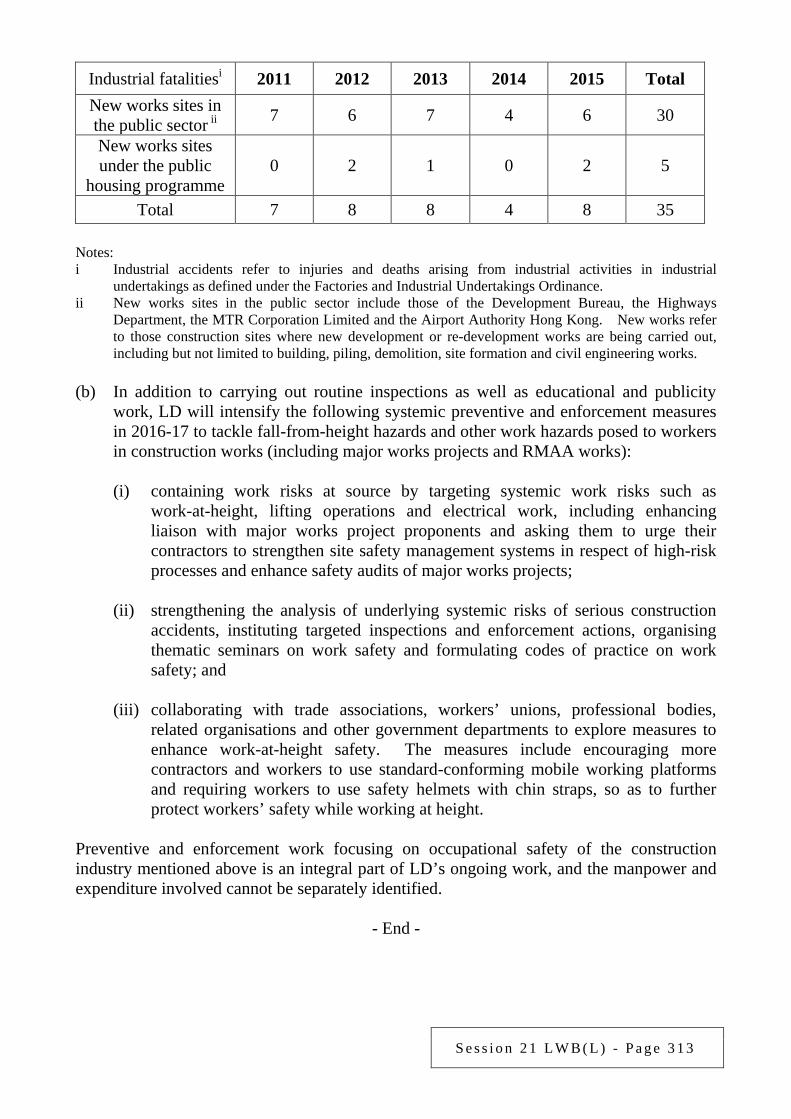
S e s s i o n 2 1 L W B ( L ) - P a g e 3 1 3
Industrial fatalitiesi 2011 2012 2013 2014 2015 Total New works sites in the public sector ii 7 6 7 4 6 30
New works sites under the public
housing programme 0 2 1 0 2 5
Total 7 8 8 4 8 35 Notes: i Industrial accidents refer to injuries and deaths arising from industrial activities in industrial
undertakings as defined under the Factories and Industrial Undertakings Ordinance. ii New works sites in the public sector include those of the Development Bureau, the Highways
Department, the MTR Corporation Limited and the Airport Authority Hong Kong. New works refer to those construction sites where new development or re-development works are being carried out, including but not limited to building, piling, demolition, site formation and civil engineering works.
(b) In addition to carrying out routine inspections as well as educational and publicity
work, LD will intensify the following systemic preventive and enforcement measures in 2016-17 to tackle fall-from-height hazards and other work hazards posed to workers in construction works (including major works projects and RMAA works):
(i) containing work risks at source by targeting systemic work risks such as
work-at-height, lifting operations and electrical work, including enhancing liaison with major works project proponents and asking them to urge their contractors to strengthen site safety management systems in respect of high-risk processes and enhance safety audits of major works projects;
(ii) strengthening the analysis of underlying systemic risks of serious construction
accidents, instituting targeted inspections and enforcement actions, organising thematic seminars on work safety and formulating codes of practice on work safety; and
(iii) collaborating with trade associations, workers’ unions, professional bodies,
related organisations and other government departments to explore measures to enhance work-at-height safety. The measures include encouraging more contractors and workers to use standard-conforming mobile working platforms and requiring workers to use safety helmets with chin straps, so as to further protect workers’ safety while working at height.
Preventive and enforcement work focusing on occupational safety of the construction industry mentioned above is an integral part of LD’s ongoing work, and the manpower and expenditure involved cannot be separately identified.
- End -
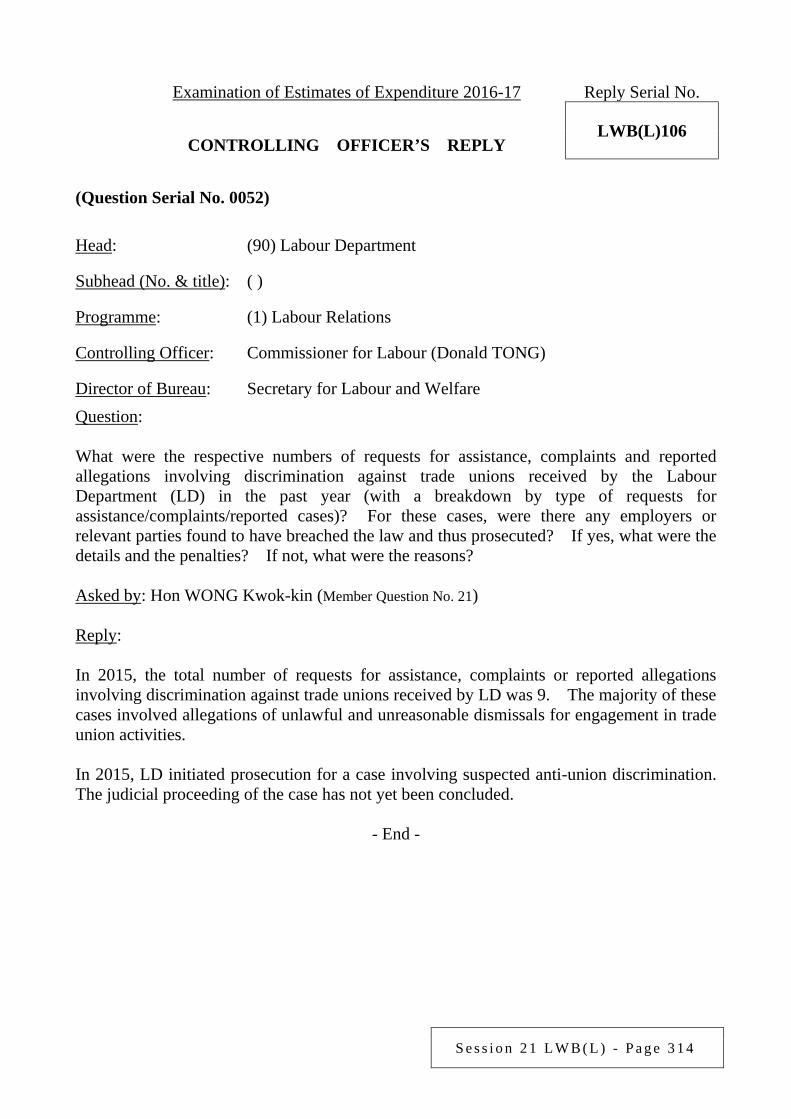
S e s s i o n 2 1 L W B ( L ) - P a g e 3 1 4
Examination of Estimates of Expenditure 2016-17 Reply Serial No.
LWB(L)106 CONTROLLING OFFICER’S REPLY (Question Serial No. 0052)
Head: (90) Labour Department
Subhead (No. & title): ( )
Programme: (1) Labour Relations
Controlling Officer: Commissioner for Labour (Donald TONG)
Director of Bureau: Secretary for Labour and Welfare Question: What were the respective numbers of requests for assistance, complaints and reported allegations involving discrimination against trade unions received by the Labour Department (LD) in the past year (with a breakdown by type of requests for assistance/complaints/reported cases)? For these cases, were there any employers or relevant parties found to have breached the law and thus prosecuted? If yes, what were the details and the penalties? If not, what were the reasons? Asked by: Hon WONG Kwok-kin (Member Question No. 21) Reply: In 2015, the total number of requests for assistance, complaints or reported allegations involving discrimination against trade unions received by LD was 9. The majority of these cases involved allegations of unlawful and unreasonable dismissals for engagement in trade union activities. In 2015, LD initiated prosecution for a case involving suspected anti-union discrimination. The judicial proceeding of the case has not yet been concluded.
- End -
S e s s i o n 2 1 L W B ( L ) - P a g e 3 1 5
Examination of Estimates of Expenditure 2016-17 Reply Serial No.
LWB(L)107 CONTROLLING OFFICER’S REPLY (Question Serial No. 0054)
Head: (90) Labour Department
Subhead (No. & title): ( )
Programme: (1) Labour Relations
Controlling Officer: Commissioner for Labour (Donald TONG)
Director of Bureau: Secretary for Labour and Welfare Question: Regarding the implementation of statutory paternity leave (PL), would the Government provide the following information: (a) What are the number of employees who have benefited from this policy and the
number of paid leave days taken since the commencement of the legislation? (b) What were the specific work and total expenditure involved in promoting statutory PL
in 2015-16? Has the Government formulated any new publicity measures and made an estimate for 2016-17?
(c) When will the Government review the implementation of the legislation, which has
come into operation for 1 year? What are the coverage and manpower arrangement for the review?
Asked by: Hon WONG Kwok-kin (Member Question No. 18) Reply: The information sought is provided as follows: (a) Employers and employees are not required to report their PL arrangements to the
Government. The Labour Department (LD) therefore does not keep the number of employees who have taken PL and the number of paid leave days taken. Nevertheless, it is roughly estimated that tens of thousands of eligible male employees might have enjoyed this employees’ benefit.
(b) Relevant publicity efforts to tie in with the implementation of statutory PL in 2015-16
included: widely distributing leaflets, displaying posters at various locations, promoting relevant messages through LD’s homepage, issuing press releases,
S e s s i o n 2 1 L W B ( L ) - P a g e 3 1 6
broadcasting radio Announcement in the Public Interest, placing advertisements in the public transport network and periodicals of major employers’ associations and trade union federations, organising briefings for the public, promoting relevant messages by staging roving exhibitions in different districts, and carrying out promotion through employers’ network of 9 industry-based Tripartite Committees and 18 Human Resources Managers’ Clubs covering various trades and industries. The total actual expenditure was about $600,000. In 2016-17, LD will continue to publicise the stipulations of statutory PL through various channels and a range of educational and promotional activities, so as to enhance the awareness and understanding of this statutory employment benefit amongst employers, employees and related parties. The estimated expenditure is about $400,000.
(c) It has been one year since statutory PL came into operation. LD will review the
implementation of the legislation and draw up the scope of the review. The related work will be undertaken by the existing staff of LD among their other duties. The manpower involved cannot be separately identified.
- End -
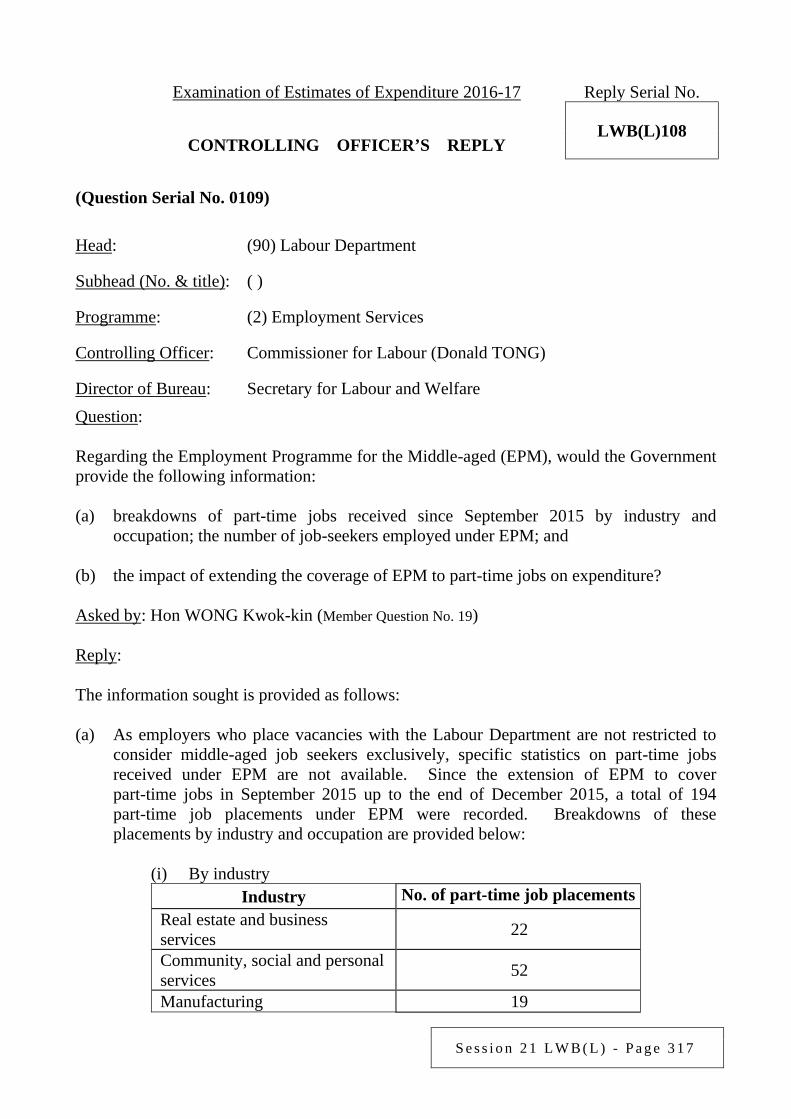
S e s s i o n 2 1 L W B ( L ) - P a g e 3 1 7
Examination of Estimates of Expenditure 2016-17 Reply Serial No.
LWB(L)108 CONTROLLING OFFICER’S REPLY (Question Serial No. 0109)
Head: (90) Labour Department
Subhead (No. & title): ( )
Programme: (2) Employment Services
Controlling Officer: Commissioner for Labour (Donald TONG)
Director of Bureau: Secretary for Labour and Welfare Question: Regarding the Employment Programme for the Middle-aged (EPM), would the Government provide the following information: (a) breakdowns of part-time jobs received since September 2015 by industry and
occupation; the number of job-seekers employed under EPM; and (b) the impact of extending the coverage of EPM to part-time jobs on expenditure? Asked by: Hon WONG Kwok-kin (Member Question No. 19) Reply: The information sought is provided as follows: (a) As employers who place vacancies with the Labour Department are not restricted to
consider middle-aged job seekers exclusively, specific statistics on part-time jobs received under EPM are not available. Since the extension of EPM to cover part-time jobs in September 2015 up to the end of December 2015, a total of 194 part-time job placements under EPM were recorded. Breakdowns of these placements by industry and occupation are provided below:
(i) By industry
Industry No. of part-time job placements Real estate and business services 22
Community, social and personal services 52
Manufacturing 19
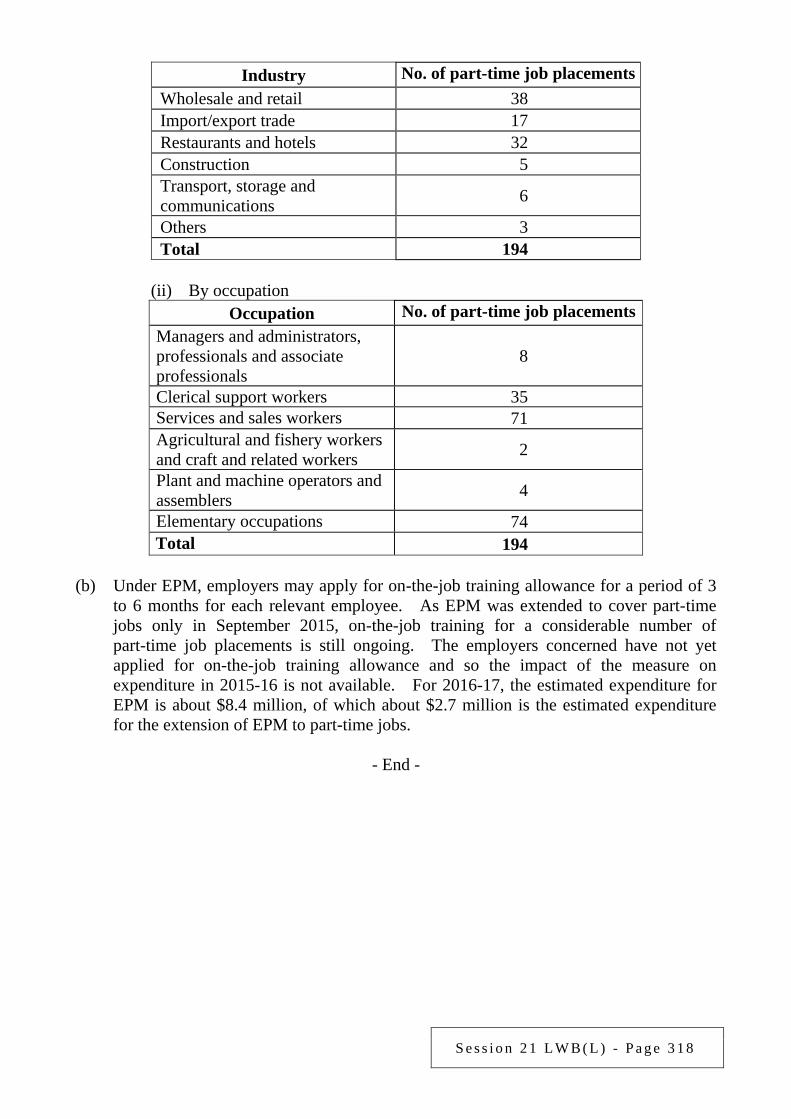
S e s s i o n 2 1 L W B ( L ) - P a g e 3 1 8
Industry No. of part-time job placements Wholesale and retail 38 Import/export trade 17 Restaurants and hotels 32 Construction 5 Transport, storage and communications 6
Others 3 Total 194
(ii) By occupation
Occupation No. of part-time job placements Managers and administrators, professionals and associate professionals
8
Clerical support workers 35 Services and sales workers 71 Agricultural and fishery workers and craft and related workers 2
Plant and machine operators and assemblers 4
Elementary occupations 74 Total 194
(b) Under EPM, employers may apply for on-the-job training allowance for a period of 3
to 6 months for each relevant employee. As EPM was extended to cover part-time jobs only in September 2015, on-the-job training for a considerable number of part-time job placements is still ongoing. The employers concerned have not yet applied for on-the-job training allowance and so the impact of the measure on expenditure in 2015-16 is not available. For 2016-17, the estimated expenditure for EPM is about $8.4 million, of which about $2.7 million is the estimated expenditure for the extension of EPM to part-time jobs.
- End -
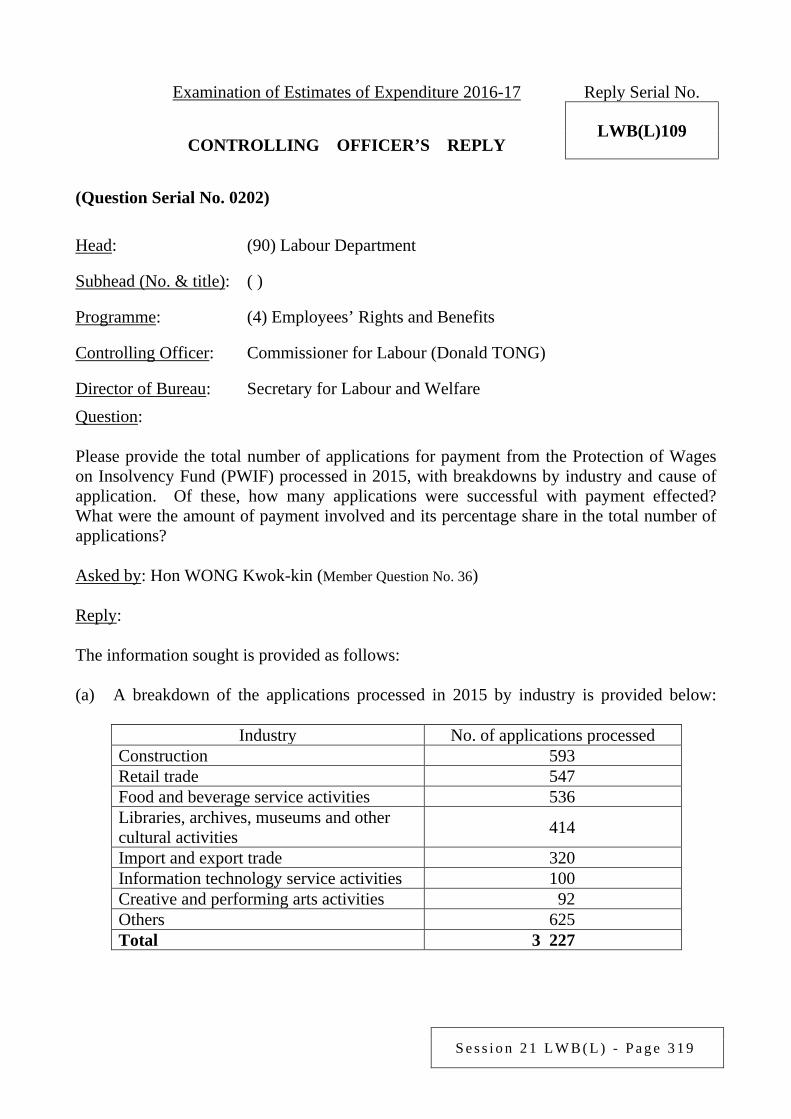
S e s s i o n 2 1 L W B ( L ) - P a g e 3 1 9
Examination of Estimates of Expenditure 2016-17 Reply Serial No.
LWB(L)109 CONTROLLING OFFICER’S REPLY (Question Serial No. 0202)
Head: (90) Labour Department
Subhead (No. & title): ( )
Programme: (4) Employees’ Rights and Benefits
Controlling Officer: Commissioner for Labour (Donald TONG)
Director of Bureau: Secretary for Labour and Welfare Question: Please provide the total number of applications for payment from the Protection of Wages on Insolvency Fund (PWIF) processed in 2015, with breakdowns by industry and cause of application. Of these, how many applications were successful with payment effected? What were the amount of payment involved and its percentage share in the total number of applications? Asked by: Hon WONG Kwok-kin (Member Question No. 36) Reply: The information sought is provided as follows: (a) A breakdown of the applications processed in 2015 by industry is provided below:
Industry No. of applications processed
Construction 593 Retail trade 547 Food and beverage service activities 536 Libraries, archives, museums and other cultural activities 414
Import and export trade 320 Information technology service activities 100 Creative and performing arts activities 92 Others 625 Total 3 227
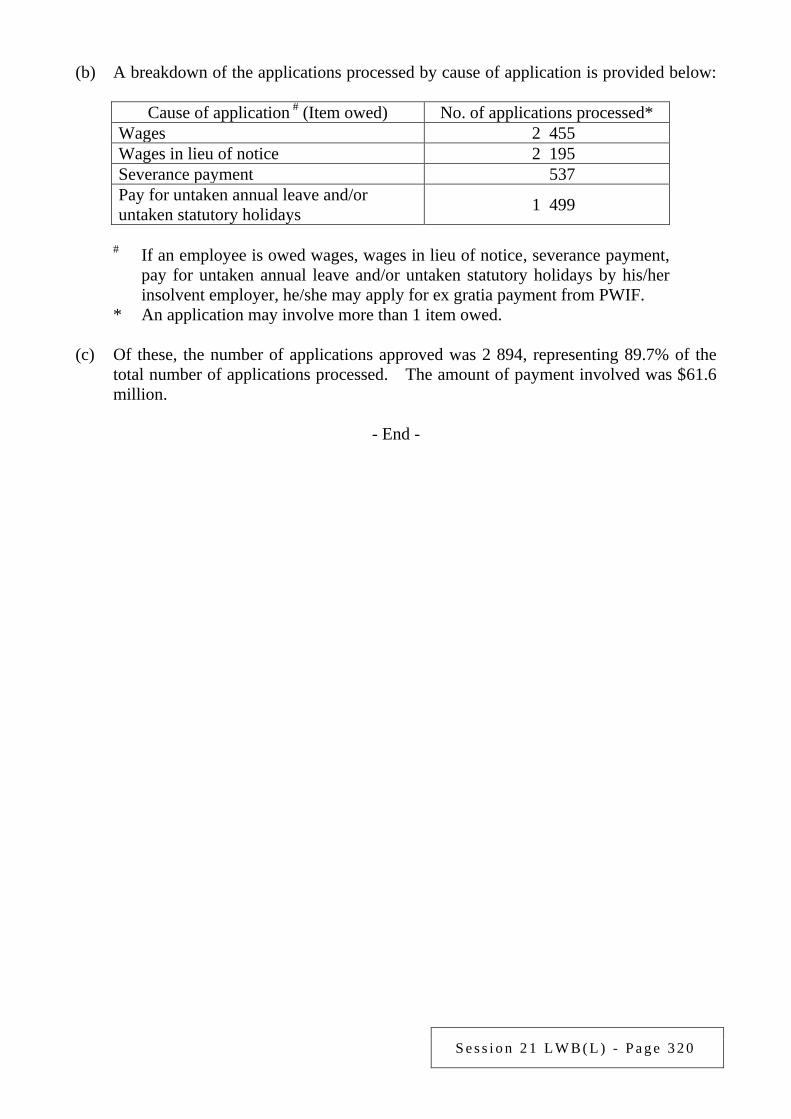
S e s s i o n 2 1 L W B ( L ) - P a g e 3 2 0
(b) A breakdown of the applications processed by cause of application is provided below:
Cause of application # (Item owed) No. of applications processed* Wages 2 455 Wages in lieu of notice 2 195 Severance payment 537 Pay for untaken annual leave and/or untaken statutory holidays 1 499
# If an employee is owed wages, wages in lieu of notice, severance payment, pay for untaken annual leave and/or untaken statutory holidays by his/her insolvent employer, he/she may apply for ex gratia payment from PWIF.
* An application may involve more than 1 item owed. (c) Of these, the number of applications approved was 2 894, representing 89.7% of the
total number of applications processed. The amount of payment involved was $61.6 million.
- End -
S e s s i o n 2 1 L W B ( L ) - P a g e 3 2 1
Examination of Estimates of Expenditure 2016-17 Reply Serial No.
LWB(L)110 CONTROLLING OFFICER’S REPLY (Question Serial No. 0203)
Head: (90) Labour Department
Subhead (No. & title): ( )
Programme: (1) Labour Relations
Controlling Officer: Commissioner for Labour (Donald TONG)
Director of Bureau: Secretary for Labour and Welfare Question: In 2016-17, apart from launching a new set of television and radio Announcements in the Public Interest (APIs), what specific work will the Government undertake to step up promotion on the importance of family-friendly employment practices (FFEP)? What is the estimated expenditure involved? Is there any plan to introduce legislation as soon as possible on the alignment of statutory holidays with general holidays at 17 days? If yes, what are the details and the timetable? If not, what are the reasons? Asked by: Hon WONG Kwok-kin (Member Question No. 37) Reply: In 2016-17, apart from producing a new set of television and radio APIs to step up promotion of FFEP, the Labour Department (LD) will continue to disseminate relevant information to the community and encourage employers to adopt FFEP at workplaces through a wide range of publicity channels and various educational and promotional activities such as publications, large-scale seminars, roving exhibitions, newspaper feature articles, periodicals of major employers’ associations and trade union federations, public transport network as well as regular meetings and exchanges with business executives and human resources managers. The estimated expenditure is about $1.1 million. The Government is aware of the labour sector’s common wish to increase the number of statutory holidays on a par with that of general holidays, while the business sector in general is very concerned about the possible impact of the increase in the number of statutory holidays on employers, especially small and medium-sized enterprises which represent 98% of the enterprises in Hong Kong, and families employing over 340 000 foreign domestic helpers. In 2015, LD reported the findings of the survey conducted by the Census and Statistics Department on employees taking statutory holidays and general holidays in Hong Kong to the Labour Advisory Board (LAB) and the Legislative Council Panel on Manpower, and discussed the issue and listened to the views of members at several LAB

S e s s i o n 2 1 L W B ( L ) - P a g e 3 2 2
meetings. The issue is still under discussion by LAB. The Government will carefully consider the way forward after a consensus has been reached by LAB.
- End -
S e s s i o n 2 1 L W B ( L ) - P a g e 3 2 3
Examination of Estimates of Expenditure 2016-17 Reply Serial No.
LWB(L)111 CONTROLLING OFFICER’S REPLY (Question Serial No. 0204)
Head: (90) Labour Department
Subhead (No. & title): ( )
Programme: (2) Employment Services
Controlling Officer: Commissioner for Labour (Donald TONG)
Director of Bureau: Secretary for Labour and Welfare Question: Regarding the implementation of the Employment Services Ambassador Programme for Ethnic Minorities, would the Government advise this Committee: (a) of the number of young people of ethnic minorities who have benefited from the
Programme since its launch, with breakdowns by gender, age, ethnic origin, residential district, industry and participation status (opted out/participating/completed/others); the amount involved for providing on-the-job training; and
(b) whether the Government has any plan to step up the promotional work and increase
the quota offered under the Programme in 2016-17? If yes, what are the details and the expenditure involved? If not, what are the reasons?
Asked by: Hon WONG Kwok-kin (Member Question No. 39) Reply: The information sought is provided as follows: (a) To strengthen the employment services for ethnic minorities, the Labour Department
(LD) has launched since September 2014 the Employment Services Ambassador Programme for Ethnic Minorities (ESAP), under which trainees of the Youth Employment and Training Programme who can communicate in ethnic minority languages are employed as employment services ambassadors (ESAs) for 6 months. All trainees are young people aged 15 to 24 and are assigned to work in LD’s job centres or industry-based recruitment centres. Since the launch of ESAP, LD has employed 63 trainees as ethnic minority ESAs, 15 of whom have just reported for duty in March 2016 and are receiving on-the-job training. Of the remaining 48 trainees, 39 have successfully completed the six-month on-the-job training. The other 9 trainees resigned before contract expiry to take up other jobs, pursue further studies or
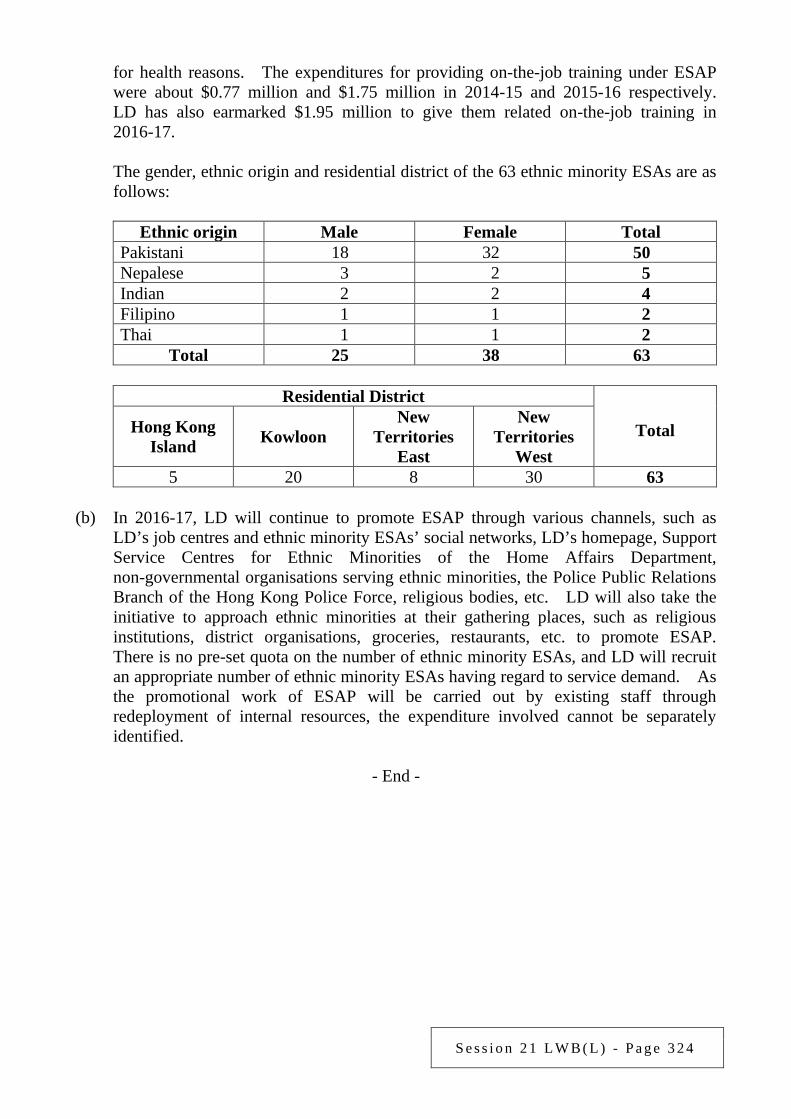
S e s s i o n 2 1 L W B ( L ) - P a g e 3 2 4
for health reasons. The expenditures for providing on-the-job training under ESAP were about $0.77 million and $1.75 million in 2014-15 and 2015-16 respectively. LD has also earmarked $1.95 million to give them related on-the-job training in 2016-17.
The gender, ethnic origin and residential district of the 63 ethnic minority ESAs are as
follows:
Ethnic origin Male Female Total Pakistani 18 32 50 Nepalese 3 2 5 Indian 2 2 4 Filipino 1 1 2 Thai 1 1 2
Total 25 38 63
Residential District
Total Hong Kong Island Kowloon
New Territories
East
New Territories
West 5 20 8 30 63
(b) In 2016-17, LD will continue to promote ESAP through various channels, such as
LD’s job centres and ethnic minority ESAs’ social networks, LD’s homepage, Support Service Centres for Ethnic Minorities of the Home Affairs Department, non-governmental organisations serving ethnic minorities, the Police Public Relations Branch of the Hong Kong Police Force, religious bodies, etc. LD will also take the initiative to approach ethnic minorities at their gathering places, such as religious institutions, district organisations, groceries, restaurants, etc. to promote ESAP. There is no pre-set quota on the number of ethnic minority ESAs, and LD will recruit an appropriate number of ethnic minority ESAs having regard to service demand. As the promotional work of ESAP will be carried out by existing staff through redeployment of internal resources, the expenditure involved cannot be separately identified.
- End -
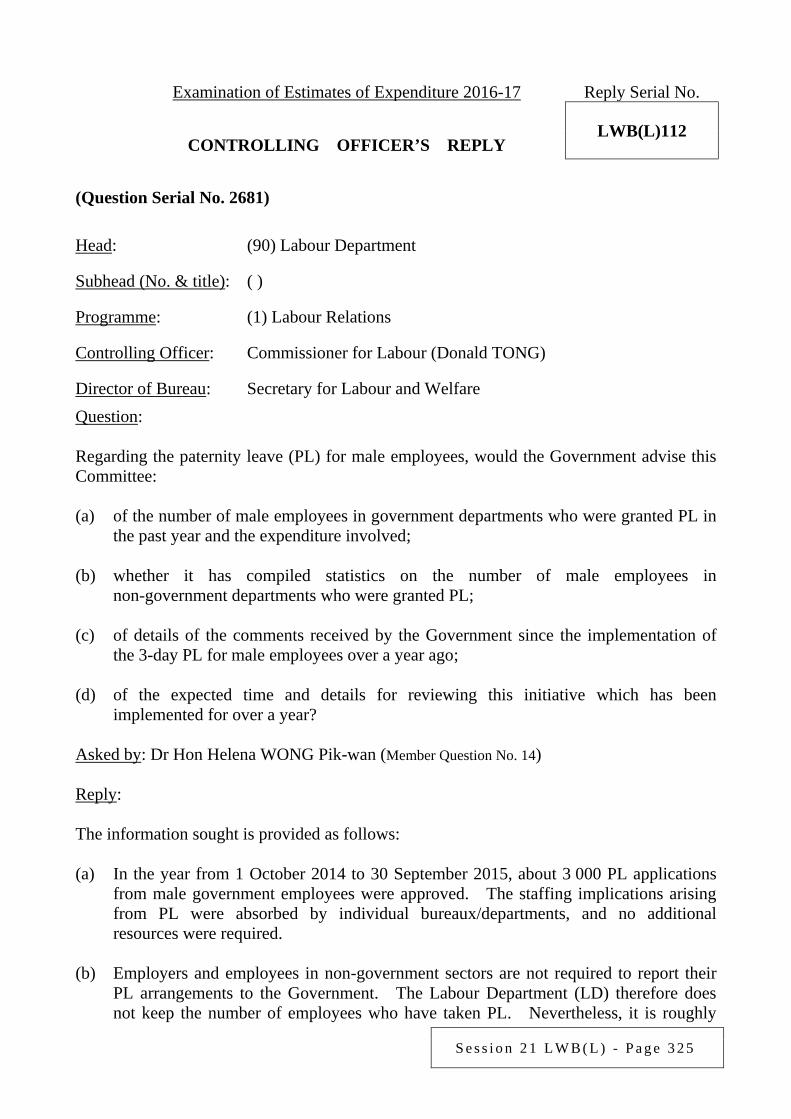
S e s s i o n 2 1 L W B ( L ) - P a g e 3 2 5
Examination of Estimates of Expenditure 2016-17 Reply Serial No.
LWB(L)112 CONTROLLING OFFICER’S REPLY (Question Serial No. 2681)
Head: (90) Labour Department
Subhead (No. & title): ( )
Programme: (1) Labour Relations
Controlling Officer: Commissioner for Labour (Donald TONG)
Director of Bureau: Secretary for Labour and Welfare Question: Regarding the paternity leave (PL) for male employees, would the Government advise this Committee: (a) of the number of male employees in government departments who were granted PL in
the past year and the expenditure involved; (b) whether it has compiled statistics on the number of male employees in
non-government departments who were granted PL; (c) of details of the comments received by the Government since the implementation of
the 3-day PL for male employees over a year ago; (d) of the expected time and details for reviewing this initiative which has been
implemented for over a year? Asked by: Dr Hon Helena WONG Pik-wan (Member Question No. 14) Reply: The information sought is provided as follows: (a) In the year from 1 October 2014 to 30 September 2015, about 3 000 PL applications
from male government employees were approved. The staffing implications arising from PL were absorbed by individual bureaux/departments, and no additional resources were required.
(b) Employers and employees in non-government sectors are not required to report their
PL arrangements to the Government. The Labour Department (LD) therefore does not keep the number of employees who have taken PL. Nevertheless, it is roughly
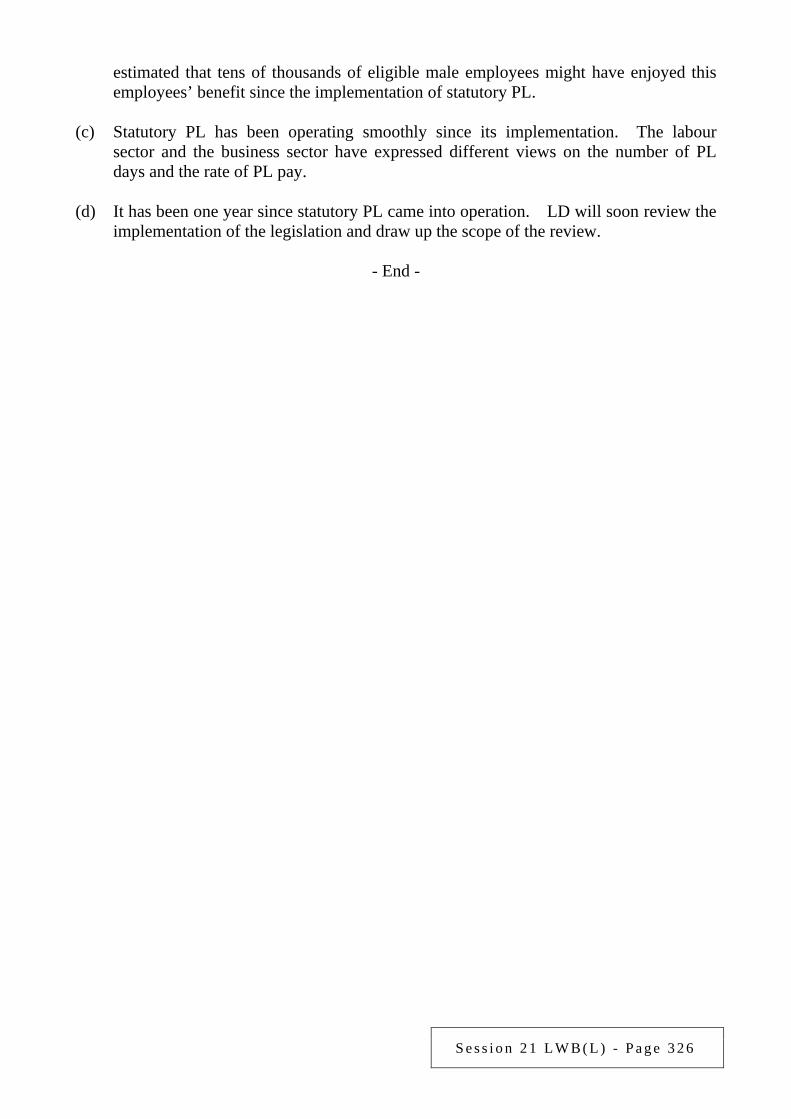
S e s s i o n 2 1 L W B ( L ) - P a g e 3 2 6
estimated that tens of thousands of eligible male employees might have enjoyed this employees’ benefit since the implementation of statutory PL.
(c) Statutory PL has been operating smoothly since its implementation. The labour
sector and the business sector have expressed different views on the number of PL days and the rate of PL pay.
(d) It has been one year since statutory PL came into operation. LD will soon review the
implementation of the legislation and draw up the scope of the review.
- End -
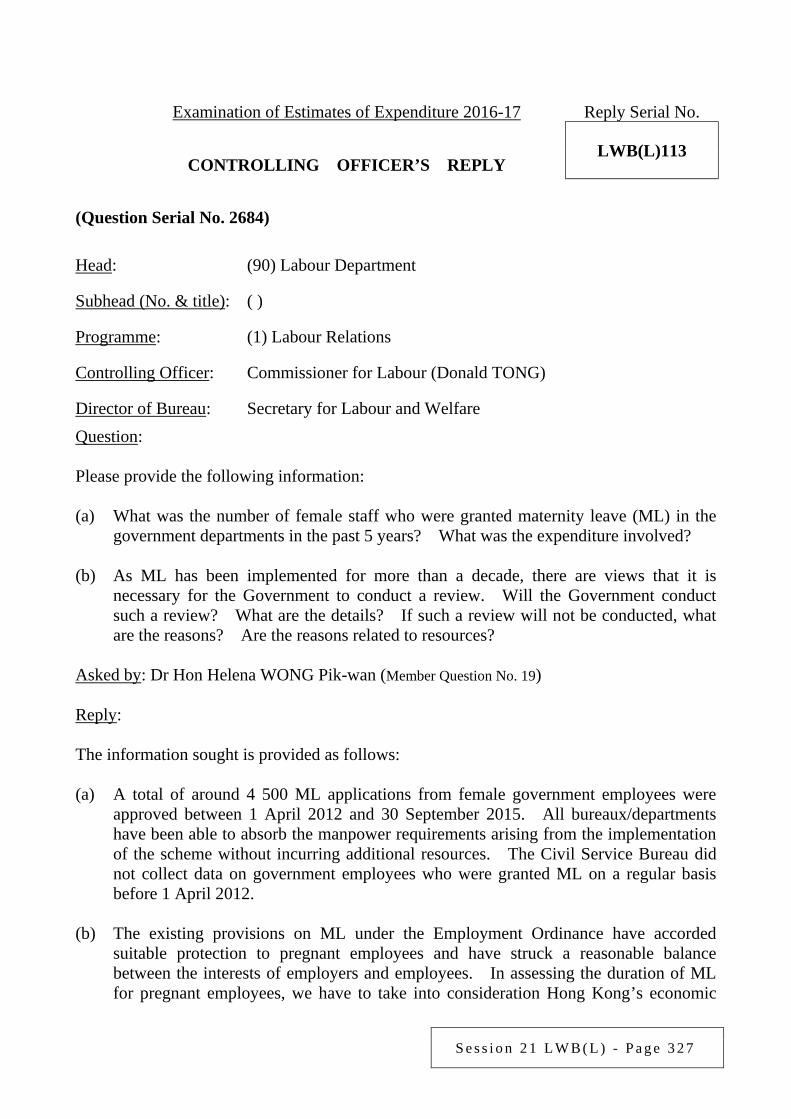
S e s s i o n 2 1 L W B ( L ) - P a g e 3 2 7
Examination of Estimates of Expenditure 2016-17 Reply Serial No.
LWB(L)113 CONTROLLING OFFICER’S REPLY (Question Serial No. 2684)
Head: (90) Labour Department
Subhead (No. & title): ( )
Programme: (1) Labour Relations
Controlling Officer: Commissioner for Labour (Donald TONG)
Director of Bureau: Secretary for Labour and Welfare Question: Please provide the following information: (a) What was the number of female staff who were granted maternity leave (ML) in the
government departments in the past 5 years? What was the expenditure involved? (b) As ML has been implemented for more than a decade, there are views that it is
necessary for the Government to conduct a review. Will the Government conduct such a review? What are the details? If such a review will not be conducted, what are the reasons? Are the reasons related to resources?
Asked by: Dr Hon Helena WONG Pik-wan (Member Question No. 19) Reply: The information sought is provided as follows: (a) A total of around 4 500 ML applications from female government employees were
approved between 1 April 2012 and 30 September 2015. All bureaux/departments have been able to absorb the manpower requirements arising from the implementation of the scheme without incurring additional resources. The Civil Service Bureau did not collect data on government employees who were granted ML on a regular basis before 1 April 2012.
(b) The existing provisions on ML under the Employment Ordinance have accorded
suitable protection to pregnant employees and have struck a reasonable balance between the interests of employers and employees. In assessing the duration of ML for pregnant employees, we have to take into consideration Hong Kong’s economic

S e s s i o n 2 1 L W B ( L ) - P a g e 3 2 8
development and whether there is consensus in the community on the subject. At present, the Government has no plan to conduct a review.
- End -

S e s s i o n 2 1 L W B ( L ) - P a g e 3 2 9
Examination of Estimates of Expenditure 2016-17 Reply Serial No.
LWB(L)114 CONTROLLING OFFICER’S REPLY (Question Serial No. 2408)
Head: (141) Government Secretariat: Labour and Welfare Bureau
Subhead (No. & title): ()
Programme: (7) Subvention: Vocational Training Council (Vocational Training)
Controlling Officer: Permanent Secretary for Labour and Welfare (Miss Annie TAM)
Director of Bureau: Secretary for Labour and Welfare Question: Under this Programme, the Government indicates that the Vocational Training Council will continue to implement the traineeship scheme for the service industries (the Scheme) in 2016-17. In this regard, would the Government please inform this Committee of the following: (a) the breakdown by year and industry of the number of training places, number of
applicants, enrolment, enrolment rates and number of trainees completing the Scheme each year from the implementation of the Scheme till now; and
(b) how the Government will enhance the publicity and promotion in 2016-17 to attract more persons who intend to work in the service industries to participate in the Scheme; and whether the Government will consider extending the Scheme to other service industries; if yes, the details and the industries as well as the expenditure involved; if no, the reasons?
Asked by: Hon CHAN Yuen-han (Member Question No. 50) Reply:
The information sought is provided as follows: (a) A breakdown by industry of the number of places offered, enrolment and number of
trainees completing the training each year since the implementation of the traineeship scheme for the service industries (the Scheme) is set out at Annex.
(b) The Vocational Training Council (VTC) reviews the publicity of the Scheme every
year and plans for the next year. In 2016-17, the following publicity and promotion for the Scheme will be conducted:
S e s s i o n 2 1 L W B ( L ) - P a g e 3 3 0
(i) hold promotional talks and experiential workshops on relevant industries. Secondary schools and non-profit-making organisations in the territory will be invited to the events. Talks may also be held at schools in various districts to introduce the Scheme;
(ii) participate in job fairs and education exhibitions, together with articles and
advertisements in recruitment magazines, stage performances in the exhibitions and distribution of free gift to attract visitors to the booths and encourage enrolment;
(iii) publish advertisements in free newspapers;
(iv) produce interesting promotional video clips and information notes for posting on
the Facebook page of the Scheme, and set up a Whatsapp account for enquiries;
(v) update the promotional leaflets, posters and website of the Scheme; and
(vi) distribute leaflets to residential estates by post, and display banners in public areas of various districts.
In the 2014/15 academic year, VTC extended the Scheme to the retail industry and the elderly care services industry. According to the assessment report of VTC in 2015, response to the Scheme for the 2 industries was lukewarm. Therefore, VTC stopped offering traineeship for these 2 industries under the Scheme from 2016 onwards, while the Scheme for the beauty care industry and hairdressing industry is not affected. VTC will maintain communications with stakeholders of different industries to explore the feasibility of extending the Scheme to other suitable industries.
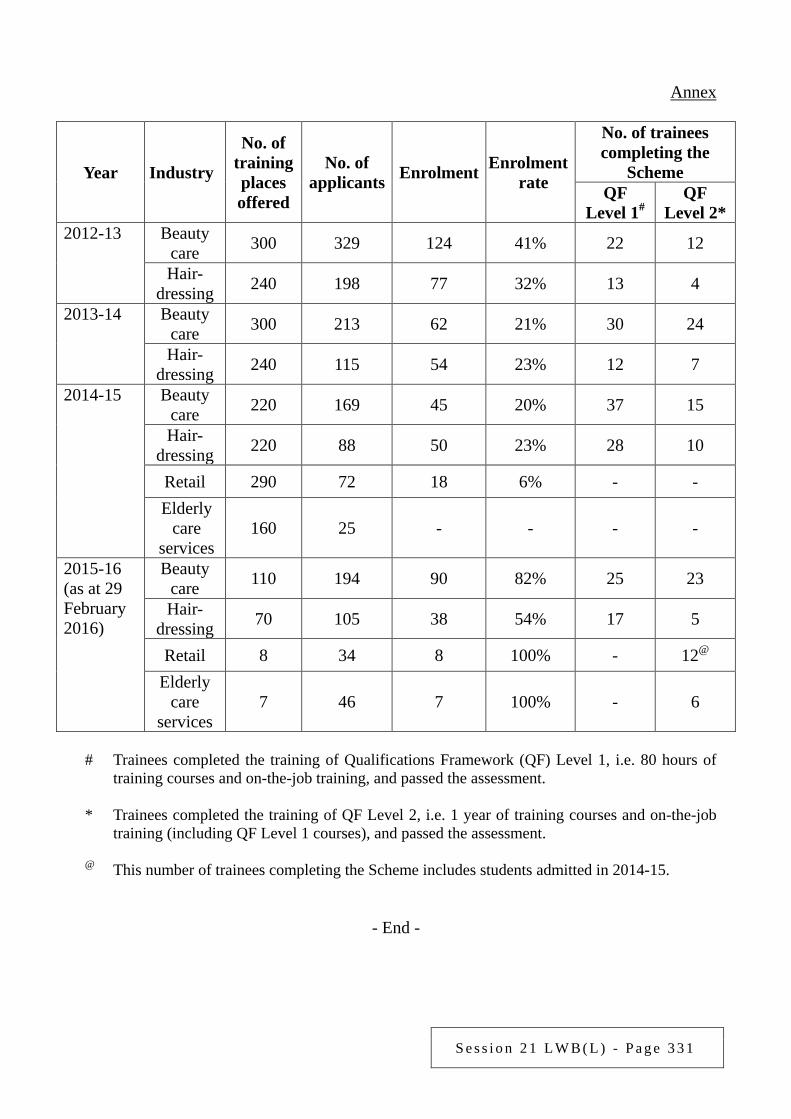
S e s s i o n 2 1 L W B ( L ) - P a g e 3 3 1
Annex
Year Industry
No. of training places offered
No. of applicants Enrolment Enrolment
rate
No. of trainees completing the
Scheme QF
Level 1# QF
Level 2* 2012-13 Beauty
care 300 329 124 41% 22 12
Hair- dressing 240 198 77 32% 13 4
2013-14 Beauty care 300 213 62 21% 30 24
Hair- dressing 240 115 54 23% 12 7
2014-15 Beauty care 220 169 45 20% 37 15
Hair- dressing 220 88 50 23% 28 10
Retail 290 72 18 6% - - Elderly
care services
160 25 - - - -
2015-16 (as at 29 February 2016)
Beauty care 110 194 90 82% 25 23
Hair- dressing 70 105 38 54% 17 5
Retail 8 34 8 100% - 12@ Elderly
care services
7 46 7 100% - 6
# Trainees completed the training of Qualifications Framework (QF) Level 1, i.e. 80 hours of
training courses and on-the-job training, and passed the assessment. * Trainees completed the training of QF Level 2, i.e. 1 year of training courses and on-the-job
training (including QF Level 1 courses), and passed the assessment. @ This number of trainees completing the Scheme includes students admitted in 2014-15.
- End -
S e s s i o n 2 1 L W B ( L ) - P a g e 3 3 2
Examination of Estimates of Expenditure 2016-17 Reply Serial No.
LWB(L)115 CONTROLLING OFFICER’S REPLY (Question Serial No. 1383)
Head: (141) Government Secretariat: Labour and Welfare Bureau
Subhead (No. & title): ()
Programme: (4) Manpower Development
Controlling Officer: Permanent Secretary for Labour and Welfare (Miss Annie TAM)
Director of Bureau: Secretary for Labour and Welfare Question: Regarding the operation of the Continuing Education Fund (CEF), will the Bureau provide the following information: (a) The number of reimbursable courses under CEF in 2016-17 by academic qualification
to be awarded and of course domain.
(b) The number of applications received and approved under CEF and the amount of fund disbursed in 2015-16 by course domain and academic qualification to be awarded.
(c) Whether the Bureau has studied the need to review CEF by raising the ceiling of the
amount of subsidy receivable by each applicant and extending the period of 4 years within which applicants must submit all claims as required so as to encourage young people to pursue continuing education?
Asked by: Dr Hon CHIANG Lai-wan (Member Question No. 15) Reply: The information sought is provided as follows:
(a)&(b) As at 31 January 2016, there were 7 941 reimbursable courses under the
Continuing Education Fund (CEF). The number of courses by course domain and by academic qualification to be awarded, numbers of application received and approved, as well as the amount of disbursement are set out in the tables below –
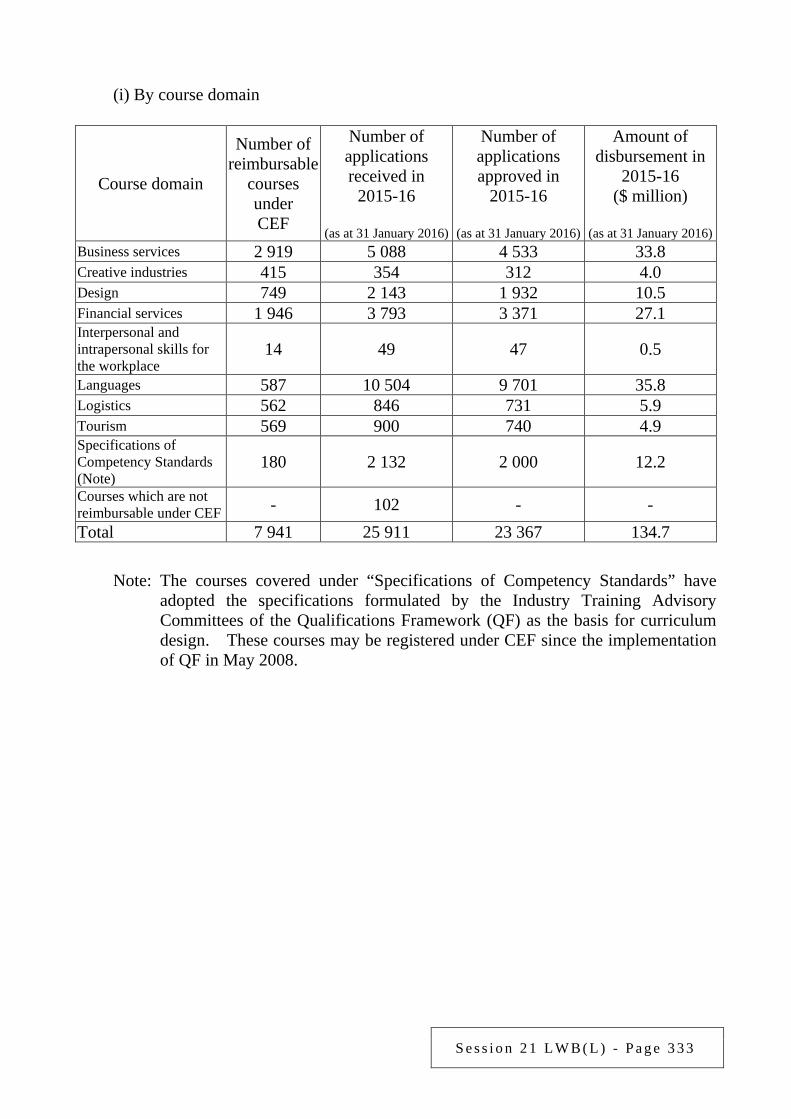
S e s s i o n 2 1 L W B ( L ) - P a g e 3 3 3
(i) By course domain
Course domain
Number of reimbursable
courses under CEF
Number of applications received in
2015-16
(as at 31 January 2016)
Number of applications approved in
2015-16
(as at 31 January 2016)
Amount of disbursement in
2015-16 ($ million)
(as at 31 January 2016)
Business services 2 919 5 088 4 533 33.8 Creative industries 415 354 312 4.0 Design 749 2 143 1 932 10.5 Financial services 1 946 3 793 3 371 27.1 Interpersonal and intrapersonal skills for the workplace
14 49 47 0.5
Languages 587 10 504 9 701 35.8 Logistics 562 846 731 5.9 Tourism 569 900 740 4.9 Specifications of Competency Standards (Note)
180 2 132 2 000 12.2
Courses which are not reimbursable under CEF - 102 - - Total 7 941 25 911 23 367 134.7
Note: The courses covered under “Specifications of Competency Standards” have
adopted the specifications formulated by the Industry Training Advisory Committees of the Qualifications Framework (QF) as the basis for curriculum design. These courses may be registered under CEF since the implementation of QF in May 2008.
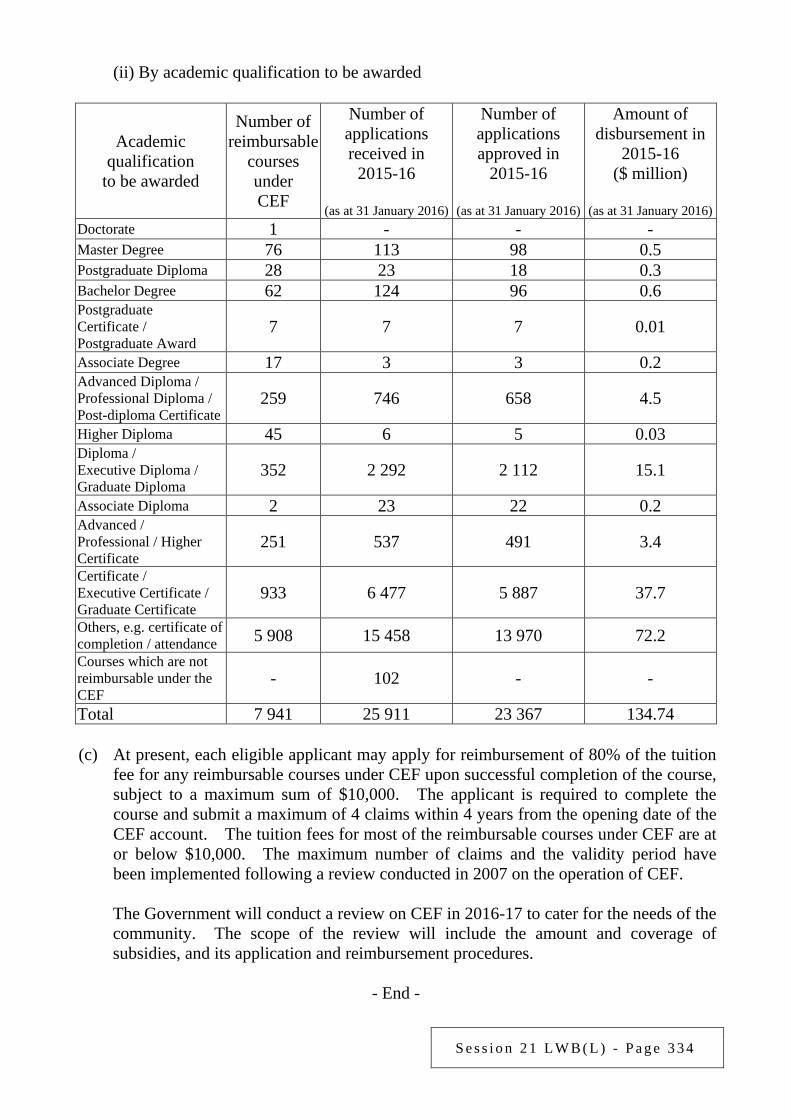
S e s s i o n 2 1 L W B ( L ) - P a g e 3 3 4
(ii) By academic qualification to be awarded
Academic qualification
to be awarded
Number of reimbursable
courses under CEF
Number of applications received in
2015-16
(as at 31 January 2016)
Number of applications approved in
2015-16
(as at 31 January 2016)
Amount of disbursement in
2015-16 ($ million)
(as at 31 January 2016)
Doctorate 1 - - - Master Degree 76 113 98 0.5 Postgraduate Diploma 28 23 18 0.3 Bachelor Degree 62 124 96 0.6 Postgraduate Certificate / Postgraduate Award
7 7 7 0.01
Associate Degree 17 3 3 0.2 Advanced Diploma / Professional Diploma / Post-diploma Certificate
259 746 658 4.5
Higher Diploma 45 6 5 0.03 Diploma / Executive Diploma / Graduate Diploma
352 2 292 2 112 15.1
Associate Diploma 2 23 22 0.2 Advanced / Professional / Higher Certificate
251 537 491 3.4
Certificate / Executive Certificate / Graduate Certificate
933 6 477 5 887 37.7
Others, e.g. certificate of completion / attendance 5 908 15 458 13 970 72.2 Courses which are not reimbursable under the CEF
- 102 - -
Total 7 941 25 911 23 367 134.74 (c) At present, each eligible applicant may apply for reimbursement of 80% of the tuition
fee for any reimbursable courses under CEF upon successful completion of the course, subject to a maximum sum of $10,000. The applicant is required to complete the course and submit a maximum of 4 claims within 4 years from the opening date of the CEF account. The tuition fees for most of the reimbursable courses under CEF are at or below $10,000. The maximum number of claims and the validity period have been implemented following a review conducted in 2007 on the operation of CEF.
The Government will conduct a review on CEF in 2016-17 to cater for the needs of the community. The scope of the review will include the amount and coverage of subsidies, and its application and reimbursement procedures.
- End -
S e s s i o n 2 1 L W B ( L ) - P a g e 3 3 5
Examination of Estimates of Expenditure 2016-17 Reply Serial No.
LWB(L)116 CONTROLLING OFFICER’S REPLY (Question Serial No. 1396)
Head: (141) Government Secretariat: Labour and Welfare Bureau
Subhead (No. & title): ()
Programme: (7) Subvention: Vocational Training Council (Vocational Training)
Controlling Officer: Permanent Secretary for Labour and Welfare (Miss Annie TAM)
Director of Bureau: Secretary for Labour and Welfare Question: Regarding the traineeship scheme implemented by the Vocational Training Council since end-2011, please provide information on the implementation of the scheme (including the number of participants and participating employers, the effectiveness assessment of the scheme) and the expenditure as well as manpower involved. Asked by: Dr Hon CHIANG Lai-wan (Member Question No. 28) Reply: The Vocational Training Council (VTC) launched the traineeship scheme for the service industries (the Scheme) in end-2011 on a pilot basis. Modelling on the apprenticeship scheme, it introduced and applied the mode of training-cum-work to the beauty care industry and hairdressing industry. The Scheme was extended to the retail industry and elderly care services industry in mid-2014 to provide relevant on-the-job training and vocational education for young people, as well as continue to supply manpower for these industries. As at 29 February 2016, the accumulated number of trainees and employers having participated in the Scheme were 573 and 259 respectively. VTC assesses the effectiveness of the Scheme every year and reviews the Scheme with stakeholders regularly through, inter alia, questionnaires to collect trainees’ feedback on the courses, as well as sharing sessions for and consultation with the employers. The assessment criteria include stakeholders’ satisfaction with the Scheme, whether the Scheme can alleviate the manpower shortage problem and whether the courses match with the skills required in the industries. In general, the stakeholders are satisfied with the effectiveness of the Scheme for the beauty care industry and hairdressing industry. According to the assessment report of VTC in 2015, response to the Scheme for the retail industry and elderly care services industry was lukewarm. Therefore, VTC stopped offering traineeship for these 2 industries under the Scheme from 2016 onwards, while the Scheme for the beauty care industry and hairdressing industry is not affected.

S e s s i o n 2 1 L W B ( L ) - P a g e 3 3 6
In 2016-17, the estimated expenditure of the Scheme is about $9.4 million, and 12 teaching and administrative staff members are involved.
- End -
S e s s i o n 2 1 L W B ( L ) - P a g e 3 3 7
Examination of Estimates of Expenditure 2016-17 Reply Serial No.
LWB(L)117 CONTROLLING OFFICER’S REPLY (Question Serial No. 1403)
Head: (141) Government Secretariat: Labour and Welfare Bureau
Subhead (No. & title): ()
Programme: (4) Manpower Development
Controlling Officer: Permanent Secretary for Labour and Welfare (Miss Annie TAM)
Director of Bureau: Secretary for Labour and Welfare Question: The Employees Retraining Board (ERB) launched the “Modular Certificates Accumulation Scheme” in 2015 to facilitate women who are not able to take full-time training courses to study. Please provide the details of the scheme, and the expenditure and staff establishment involved. Asked by: Dr Hon CHIANG Lai-wan (Member Question No. 35) Reply: In 2015-16, the Employees Retaining Board (ERB) launched the “Modular Certificates Accumulation Scheme” with the “Foundation Certificate in Post-natal Care Worker Training” course on a pilot basis. Upon successful completion of 4 specified half-day or evening courses (i.e. Foundation Certificate in Post-natal Care (part-time), Foundation Certificate in Infant Care (part-time), Foundation Certificate in Personal Attributes (part-time) and Foundation Certificate in Job Search Skills (part-time)), trainees may apply to the training bodies concerned for a certificate bearing a qualification equivalent to the full-time “Foundation Certificate in Post-natal Care Worker Training” course. The scheme encourages members of the public (including women) who are not able to pursue ERB courses on a full-time basis owing to their family commitments to make flexible study arrangement and acquire recognised qualifications. The manpower and expenditure involved in the scheme are absorbed within the overall budget of ERB and cannot be separately identified.
- End -
S e s s i o n 2 1 L W B ( L ) - P a g e 3 3 8
Examination of Estimates of Expenditure 2016-17 Reply Serial No.
LWB(L)118 CONTROLLING OFFICER’S REPLY (Question Serial No. 0479)
Head: (141) Government Secretariat: Labour and Welfare Bureau
Subhead (No. & title): ()
Programme: (4) Manpower Development
Controlling Officer: Permanent Secretary for Labour and Welfare (Miss Annie TAM)
Director of Bureau: Secretary for Labour and Welfare Question: Regarding the approval of the Employees Retraining Board for training bodies to run training courses, would the Government provide this Committee with the figures for the 4 financial years from 2013-14 to 2016-17 pertaining to the number of approved training courses and the amount of funding allocated to each training body? Asked by: Hon Frederick FUNG Kin-kee (Member Question No. 3) Reply: The number of training courses approved by the Employees Retraining Board from 2013-14 to 2016-17 is at Annex I. The amount of funding allocated to each training body in the past 3 years (2013-14 to 2015-16) is at Annex II. The funding allocated to each training body depends on the successful organisation of training courses and the number of training places taken up. As details of the training courses to be organised by individual training body in 2016-17 are still being finalised, the amount of funding for each training body is not available at this stage.
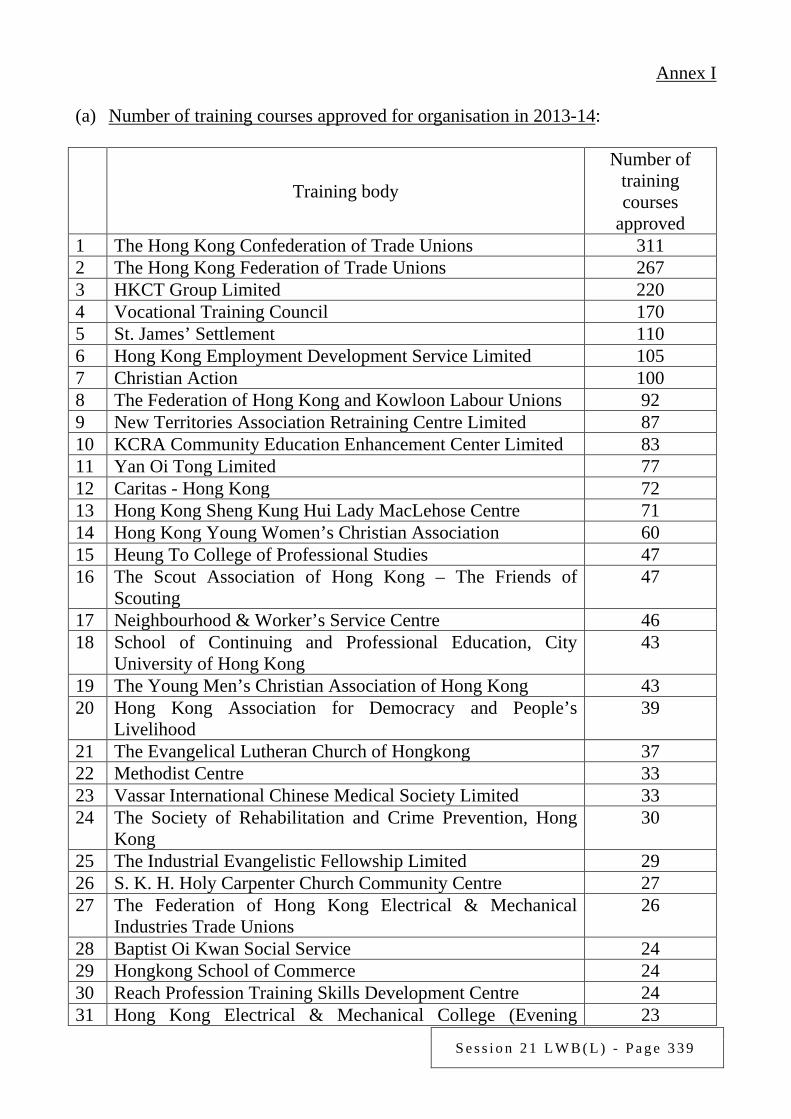
S e s s i o n 2 1 L W B ( L ) - P a g e 3 3 9
Annex I (a) Number of training courses approved for organisation in 2013-14:
Training body
Number of training courses
approved 1 The Hong Kong Confederation of Trade Unions 311 2 The Hong Kong Federation of Trade Unions 267 3 HKCT Group Limited 220 4 Vocational Training Council 170 5 St. James’ Settlement 110 6 Hong Kong Employment Development Service Limited 105 7 Christian Action 100 8 The Federation of Hong Kong and Kowloon Labour Unions 92 9 New Territories Association Retraining Centre Limited 87 10 KCRA Community Education Enhancement Center Limited 83 11 Yan Oi Tong Limited 77 12 Caritas - Hong Kong 72 13 Hong Kong Sheng Kung Hui Lady MacLehose Centre 71 14 Hong Kong Young Women’s Christian Association 60 15 Heung To College of Professional Studies 47 16 The Scout Association of Hong Kong – The Friends of
Scouting 47
17 Neighbourhood & Worker’s Service Centre 46 18 School of Continuing and Professional Education, City
University of Hong Kong 43
19 The Young Men’s Christian Association of Hong Kong 43 20 Hong Kong Association for Democracy and People’s
Livelihood 39
21 The Evangelical Lutheran Church of Hongkong 37 22 Methodist Centre 33 23 Vassar International Chinese Medical Society Limited 33 24 The Society of Rehabilitation and Crime Prevention, Hong
Kong 30
25 The Industrial Evangelistic Fellowship Limited 29 26 S. K. H. Holy Carpenter Church Community Centre 27 27 The Federation of Hong Kong Electrical & Mechanical
Industries Trade Unions 26
28 Baptist Oi Kwan Social Service 24 29 Hongkong School of Commerce 24 30 Reach Profession Training Skills Development Centre 24 31 Hong Kong Electrical & Mechanical College (Evening 23
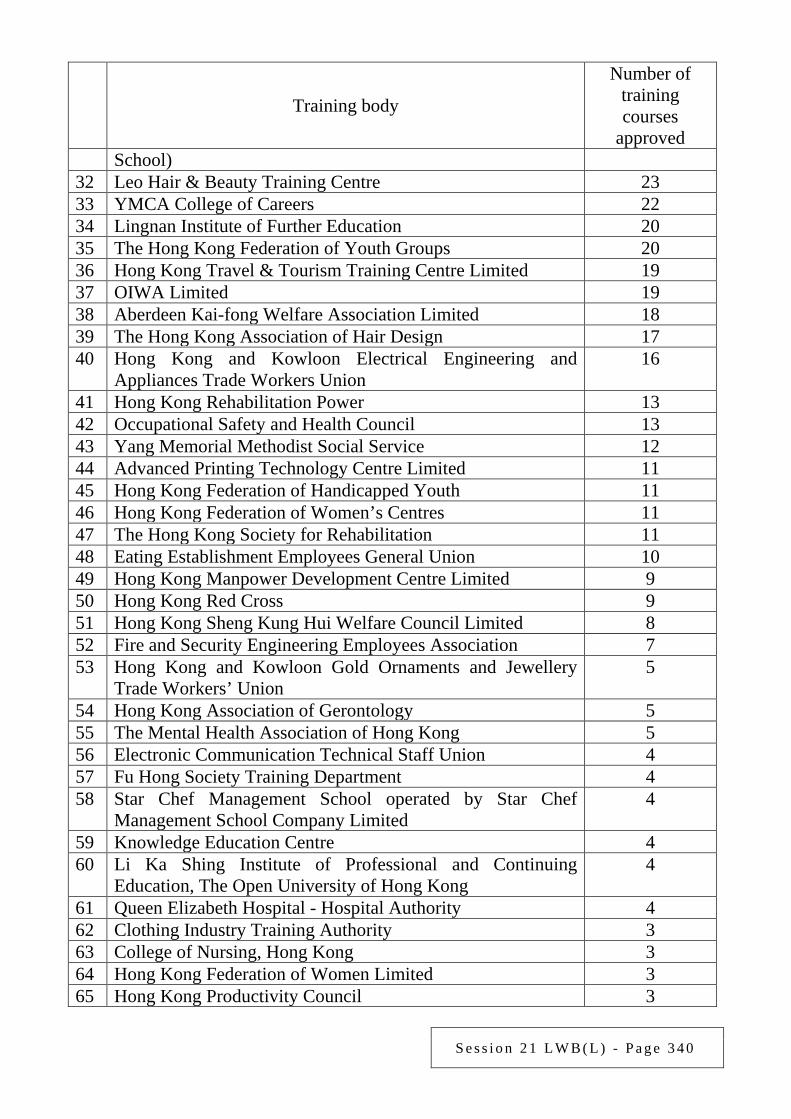
S e s s i o n 2 1 L W B ( L ) - P a g e 3 4 0
Training body
Number of training courses
approved School)
32 Leo Hair & Beauty Training Centre 23 33 YMCA College of Careers 22 34 Lingnan Institute of Further Education 20 35 The Hong Kong Federation of Youth Groups 20 36 Hong Kong Travel & Tourism Training Centre Limited 19 37 OIWA Limited 19 38 Aberdeen Kai-fong Welfare Association Limited 18 39 The Hong Kong Association of Hair Design 17 40 Hong Kong and Kowloon Electrical Engineering and
Appliances Trade Workers Union 16
41 Hong Kong Rehabilitation Power 13 42 Occupational Safety and Health Council 13 43 Yang Memorial Methodist Social Service 12 44 Advanced Printing Technology Centre Limited 11 45 Hong Kong Federation of Handicapped Youth 11 46 Hong Kong Federation of Women’s Centres 11 47 The Hong Kong Society for Rehabilitation 11 48 Eating Establishment Employees General Union 10 49 Hong Kong Manpower Development Centre Limited 9 50 Hong Kong Red Cross 9 51 Hong Kong Sheng Kung Hui Welfare Council Limited 8 52 Fire and Security Engineering Employees Association 7 53 Hong Kong and Kowloon Gold Ornaments and Jewellery
Trade Workers’ Union 5
54 Hong Kong Association of Gerontology 5 55 The Mental Health Association of Hong Kong 5 56 Electronic Communication Technical Staff Union 4 57 Fu Hong Society Training Department 4 58 Star Chef Management School operated by Star Chef
Management School Company Limited 4
59 Knowledge Education Centre 4 60 Li Ka Shing Institute of Professional and Continuing
Education, The Open University of Hong Kong 4
61 Queen Elizabeth Hospital - Hospital Authority 4 62 Clothing Industry Training Authority 3 63 College of Nursing, Hong Kong 3 64 Hong Kong Federation of Women Limited 3 65 Hong Kong Productivity Council 3
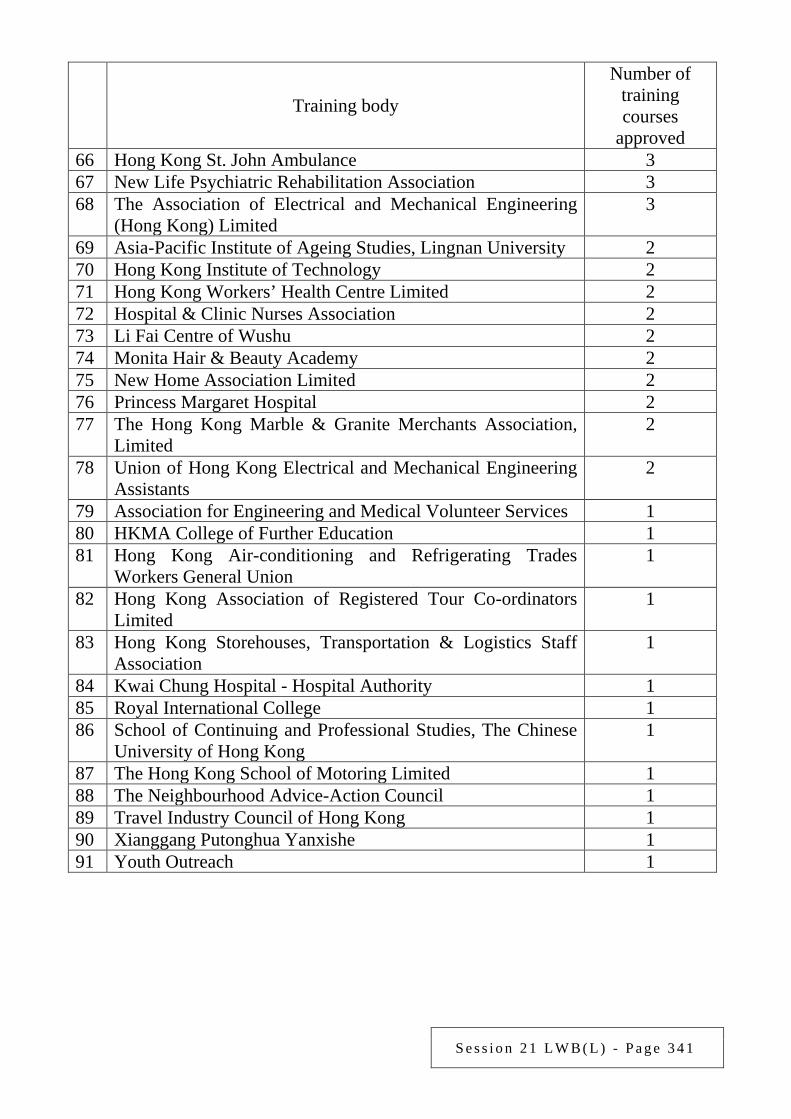
S e s s i o n 2 1 L W B ( L ) - P a g e 3 4 1
Training body
Number of training courses
approved 66 Hong Kong St. John Ambulance 3 67 New Life Psychiatric Rehabilitation Association 3 68 The Association of Electrical and Mechanical Engineering
(Hong Kong) Limited 3
69 Asia-Pacific Institute of Ageing Studies, Lingnan University 2 70 Hong Kong Institute of Technology 2 71 Hong Kong Workers’ Health Centre Limited 2 72 Hospital & Clinic Nurses Association 2 73 Li Fai Centre of Wushu 2 74 Monita Hair & Beauty Academy 2 75 New Home Association Limited 2 76 Princess Margaret Hospital 2 77 The Hong Kong Marble & Granite Merchants Association,
Limited 2
78 Union of Hong Kong Electrical and Mechanical Engineering Assistants
2
79 Association for Engineering and Medical Volunteer Services 1 80 HKMA College of Further Education 1 81 Hong Kong Air-conditioning and Refrigerating Trades
Workers General Union 1
82 Hong Kong Association of Registered Tour Co-ordinators Limited
1
83 Hong Kong Storehouses, Transportation & Logistics Staff Association
1
84 Kwai Chung Hospital - Hospital Authority 1 85 Royal International College 1 86 School of Continuing and Professional Studies, The Chinese
University of Hong Kong 1
87 The Hong Kong School of Motoring Limited 1 88 The Neighbourhood Advice-Action Council 1 89 Travel Industry Council of Hong Kong 1 90 Xianggang Putonghua Yanxishe 1 91 Youth Outreach 1
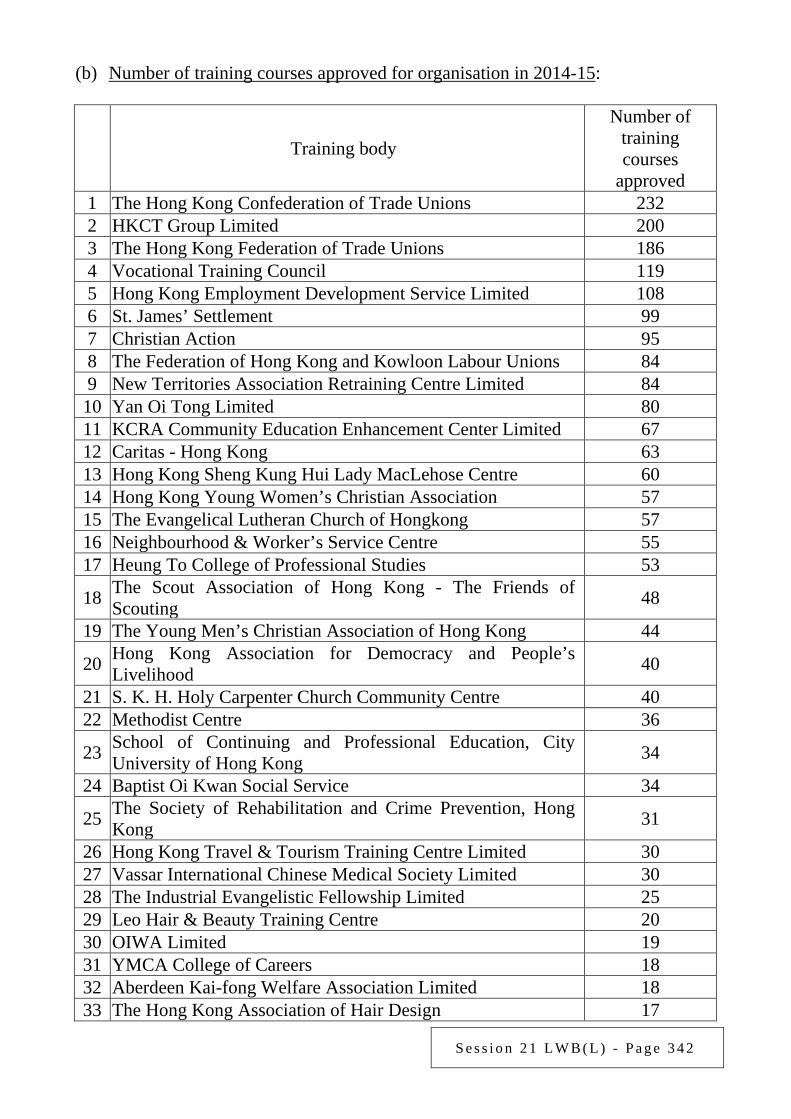
S e s s i o n 2 1 L W B ( L ) - P a g e 3 4 2
(b) Number of training courses approved for organisation in 2014-15:
Training body
Number of training courses
approved 1 The Hong Kong Confederation of Trade Unions 232 2 HKCT Group Limited 200 3 The Hong Kong Federation of Trade Unions 186 4 Vocational Training Council 119 5 Hong Kong Employment Development Service Limited 108 6 St. James’ Settlement 99 7 Christian Action 95 8 The Federation of Hong Kong and Kowloon Labour Unions 84 9 New Territories Association Retraining Centre Limited 84 10 Yan Oi Tong Limited 80 11 KCRA Community Education Enhancement Center Limited 67 12 Caritas - Hong Kong 63 13 Hong Kong Sheng Kung Hui Lady MacLehose Centre 60 14 Hong Kong Young Women’s Christian Association 57 15 The Evangelical Lutheran Church of Hongkong 57 16 Neighbourhood & Worker’s Service Centre 55 17 Heung To College of Professional Studies 53
18 The Scout Association of Hong Kong - The Friends of Scouting 48
19 The Young Men’s Christian Association of Hong Kong 44
20 Hong Kong Association for Democracy and People’s Livelihood 40
21 S. K. H. Holy Carpenter Church Community Centre 40 22 Methodist Centre 36
23 School of Continuing and Professional Education, City University of Hong Kong 34
24 Baptist Oi Kwan Social Service 34
25 The Society of Rehabilitation and Crime Prevention, Hong Kong 31
26 Hong Kong Travel & Tourism Training Centre Limited 30 27 Vassar International Chinese Medical Society Limited 30 28 The Industrial Evangelistic Fellowship Limited 25 29 Leo Hair & Beauty Training Centre 20 30 OIWA Limited 19 31 YMCA College of Careers 18 32 Aberdeen Kai-fong Welfare Association Limited 18 33 The Hong Kong Association of Hair Design 17
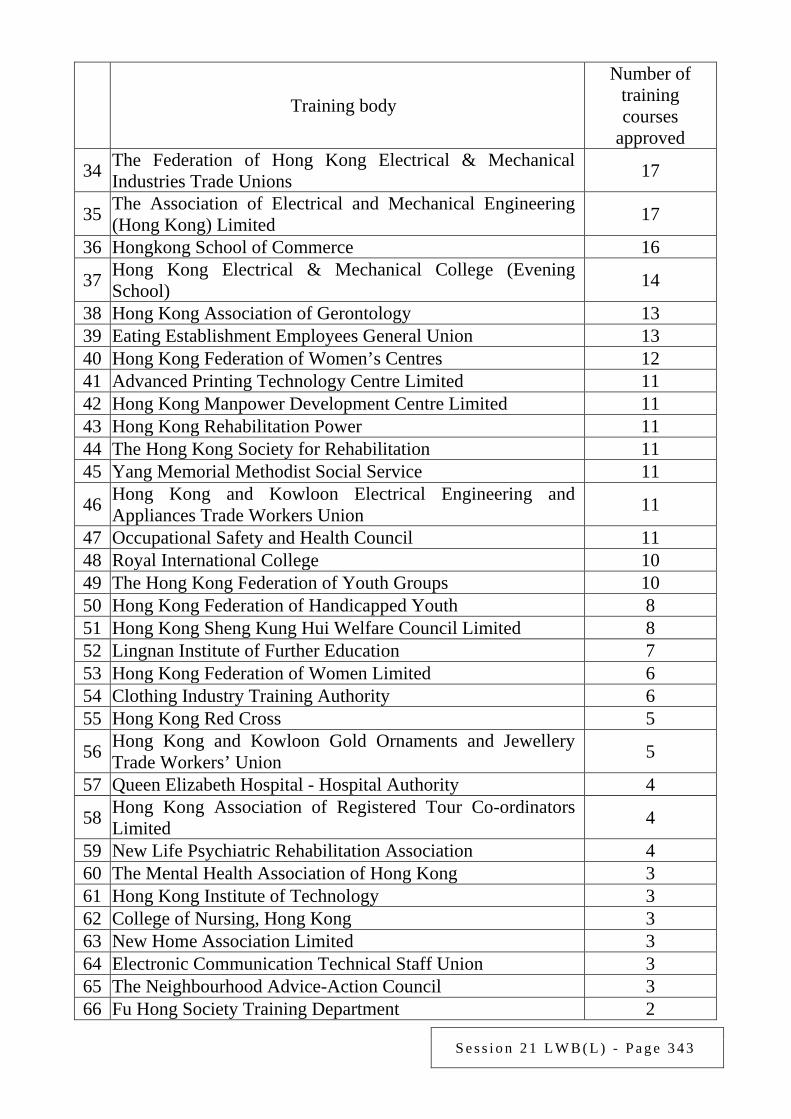
S e s s i o n 2 1 L W B ( L ) - P a g e 3 4 3
Training body
Number of training courses
approved
34 The Federation of Hong Kong Electrical & Mechanical Industries Trade Unions 17
35 The Association of Electrical and Mechanical Engineering (Hong Kong) Limited 17
36 Hongkong School of Commerce 16
37 Hong Kong Electrical & Mechanical College (Evening School) 14
38 Hong Kong Association of Gerontology 13 39 Eating Establishment Employees General Union 13 40 Hong Kong Federation of Women’s Centres 12 41 Advanced Printing Technology Centre Limited 11 42 Hong Kong Manpower Development Centre Limited 11 43 Hong Kong Rehabilitation Power 11 44 The Hong Kong Society for Rehabilitation 11 45 Yang Memorial Methodist Social Service 11
46 Hong Kong and Kowloon Electrical Engineering and Appliances Trade Workers Union 11
47 Occupational Safety and Health Council 11 48 Royal International College 10 49 The Hong Kong Federation of Youth Groups 10 50 Hong Kong Federation of Handicapped Youth 8 51 Hong Kong Sheng Kung Hui Welfare Council Limited 8 52 Lingnan Institute of Further Education 7 53 Hong Kong Federation of Women Limited 6 54 Clothing Industry Training Authority 6 55 Hong Kong Red Cross 5
56 Hong Kong and Kowloon Gold Ornaments and Jewellery Trade Workers’ Union 5
57 Queen Elizabeth Hospital - Hospital Authority 4
58 Hong Kong Association of Registered Tour Co-ordinators Limited 4
59 New Life Psychiatric Rehabilitation Association 4 60 The Mental Health Association of Hong Kong 3 61 Hong Kong Institute of Technology 3 62 College of Nursing, Hong Kong 3 63 New Home Association Limited 3 64 Electronic Communication Technical Staff Union 3 65 The Neighbourhood Advice-Action Council 3 66 Fu Hong Society Training Department 2
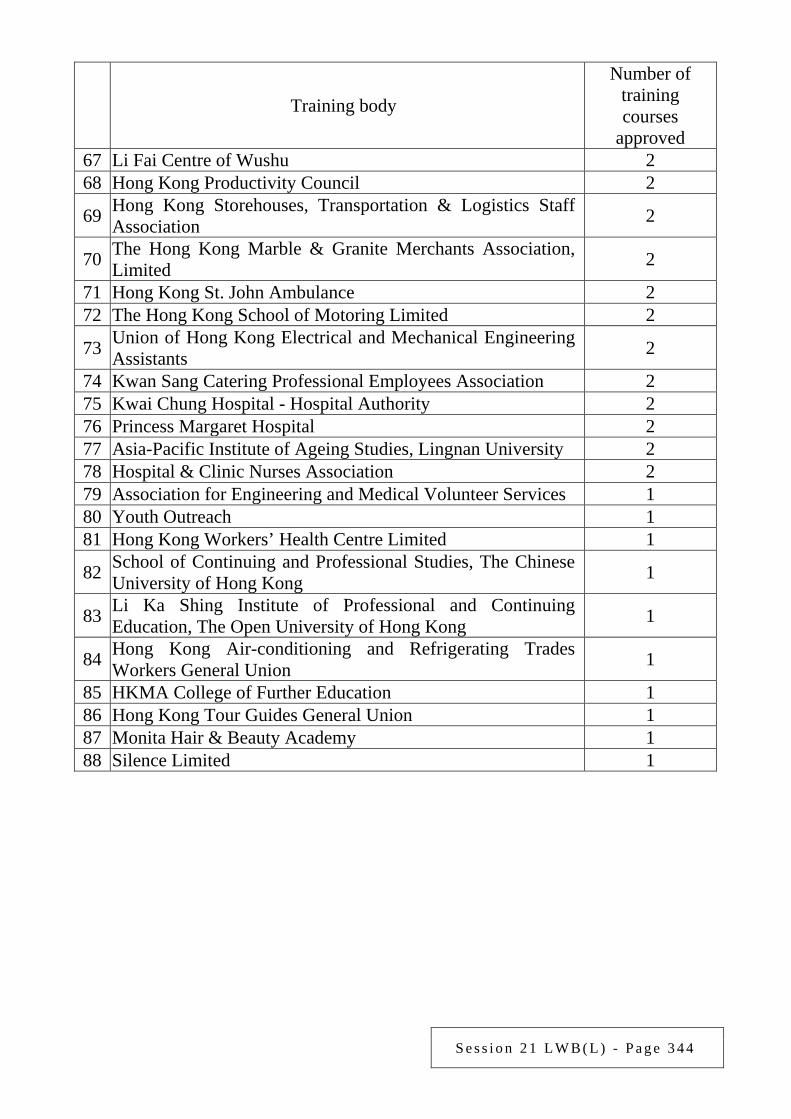
S e s s i o n 2 1 L W B ( L ) - P a g e 3 4 4
Training body
Number of training courses
approved 67 Li Fai Centre of Wushu 2 68 Hong Kong Productivity Council 2
69 Hong Kong Storehouses, Transportation & Logistics Staff Association 2
70 The Hong Kong Marble & Granite Merchants Association, Limited 2
71 Hong Kong St. John Ambulance 2 72 The Hong Kong School of Motoring Limited 2
73 Union of Hong Kong Electrical and Mechanical Engineering Assistants 2
74 Kwan Sang Catering Professional Employees Association 2 75 Kwai Chung Hospital - Hospital Authority 2 76 Princess Margaret Hospital 2 77 Asia-Pacific Institute of Ageing Studies, Lingnan University 2 78 Hospital & Clinic Nurses Association 2 79 Association for Engineering and Medical Volunteer Services 1 80 Youth Outreach 1 81 Hong Kong Workers’ Health Centre Limited 1
82 School of Continuing and Professional Studies, The Chinese University of Hong Kong 1
83 Li Ka Shing Institute of Professional and Continuing Education, The Open University of Hong Kong 1
84 Hong Kong Air-conditioning and Refrigerating Trades Workers General Union 1
85 HKMA College of Further Education 1 86 Hong Kong Tour Guides General Union 1 87 Monita Hair & Beauty Academy 1 88 Silence Limited 1
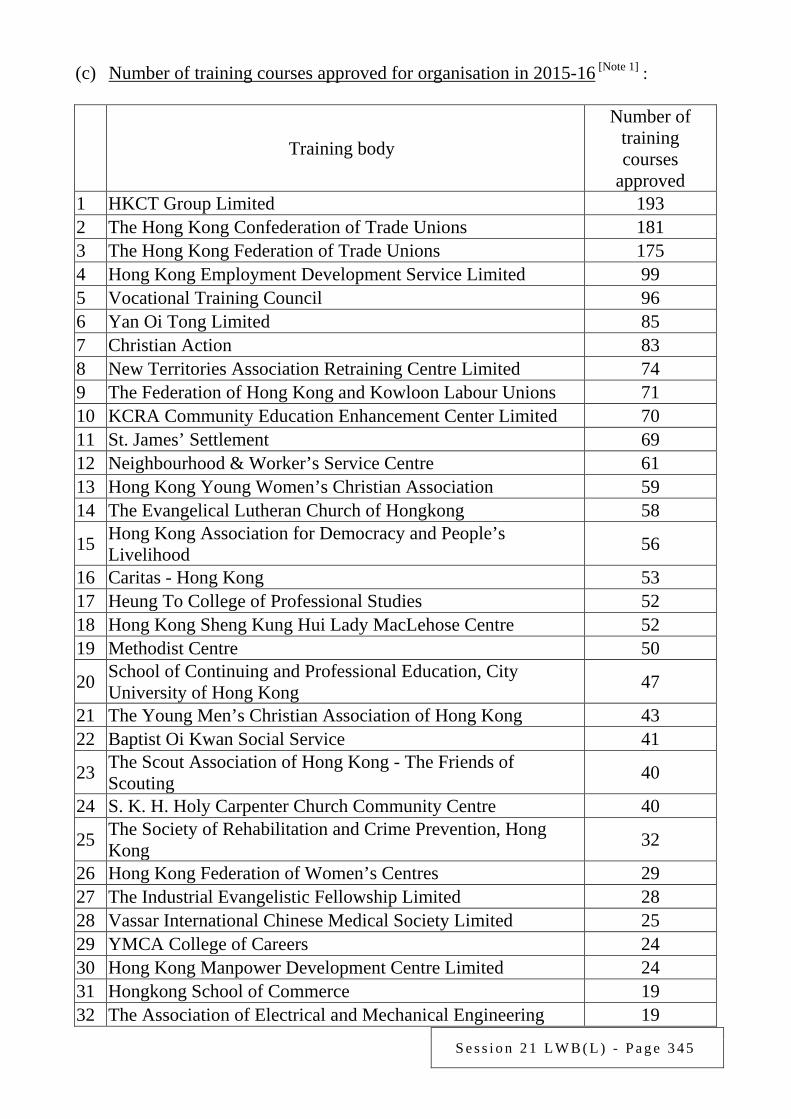
S e s s i o n 2 1 L W B ( L ) - P a g e 3 4 5
(c) Number of training courses approved for organisation in 2015-16 [Note 1] :
Training body
Number of training courses
approved 1 HKCT Group Limited 193 2 The Hong Kong Confederation of Trade Unions 181 3 The Hong Kong Federation of Trade Unions 175 4 Hong Kong Employment Development Service Limited 99 5 Vocational Training Council 96 6 Yan Oi Tong Limited 85 7 Christian Action 83 8 New Territories Association Retraining Centre Limited 74 9 The Federation of Hong Kong and Kowloon Labour Unions 71 10 KCRA Community Education Enhancement Center Limited 70 11 St. James’ Settlement 69 12 Neighbourhood & Worker’s Service Centre 61 13 Hong Kong Young Women’s Christian Association 59 14 The Evangelical Lutheran Church of Hongkong 58
15 Hong Kong Association for Democracy and People’s Livelihood 56
16 Caritas - Hong Kong 53 17 Heung To College of Professional Studies 52 18 Hong Kong Sheng Kung Hui Lady MacLehose Centre 52 19 Methodist Centre 50
20 School of Continuing and Professional Education, City University of Hong Kong 47
21 The Young Men’s Christian Association of Hong Kong 43 22 Baptist Oi Kwan Social Service 41
23 The Scout Association of Hong Kong - The Friends of Scouting 40
24 S. K. H. Holy Carpenter Church Community Centre 40
25 The Society of Rehabilitation and Crime Prevention, Hong Kong 32
26 Hong Kong Federation of Women’s Centres 29 27 The Industrial Evangelistic Fellowship Limited 28 28 Vassar International Chinese Medical Society Limited 25 29 YMCA College of Careers 24 30 Hong Kong Manpower Development Centre Limited 24 31 Hongkong School of Commerce 19 32 The Association of Electrical and Mechanical Engineering 19
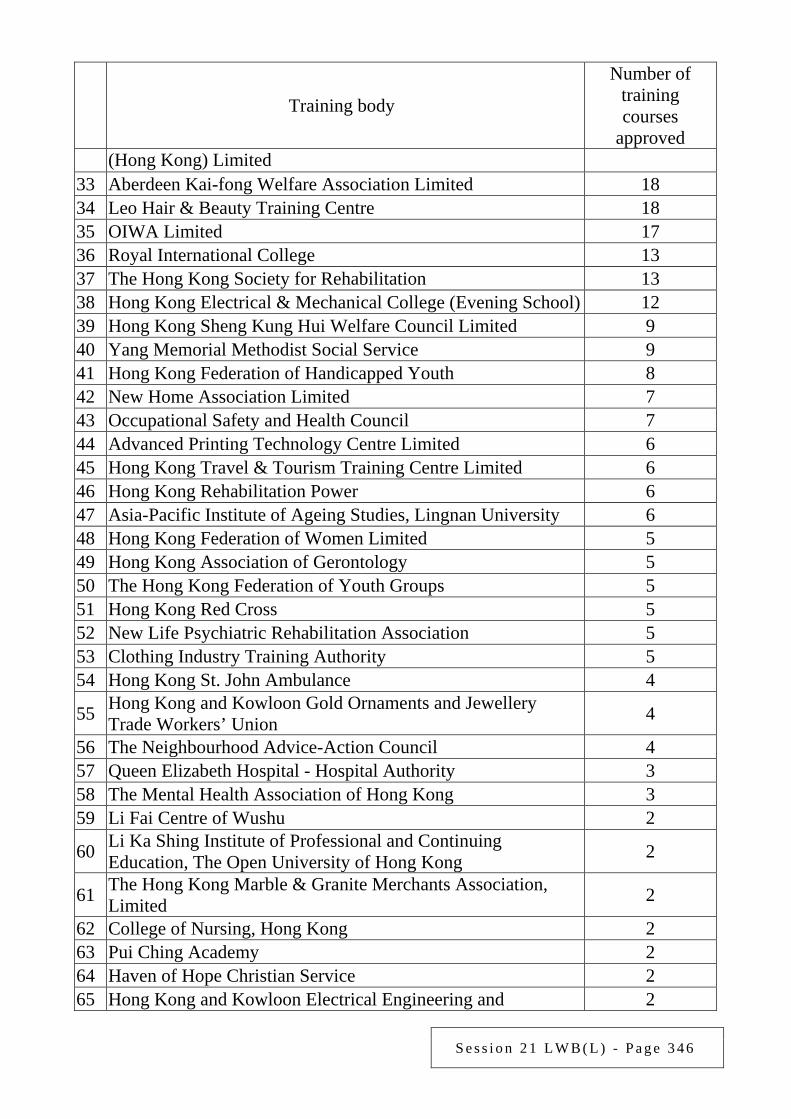
S e s s i o n 2 1 L W B ( L ) - P a g e 3 4 6
Training body
Number of training courses
approved (Hong Kong) Limited
33 Aberdeen Kai-fong Welfare Association Limited 18 34 Leo Hair & Beauty Training Centre 18 35 OIWA Limited 17 36 Royal International College 13 37 The Hong Kong Society for Rehabilitation 13 38 Hong Kong Electrical & Mechanical College (Evening School) 12 39 Hong Kong Sheng Kung Hui Welfare Council Limited 9 40 Yang Memorial Methodist Social Service 9 41 Hong Kong Federation of Handicapped Youth 8 42 New Home Association Limited 7 43 Occupational Safety and Health Council 7 44 Advanced Printing Technology Centre Limited 6 45 Hong Kong Travel & Tourism Training Centre Limited 6 46 Hong Kong Rehabilitation Power 6 47 Asia-Pacific Institute of Ageing Studies, Lingnan University 6 48 Hong Kong Federation of Women Limited 5 49 Hong Kong Association of Gerontology 5 50 The Hong Kong Federation of Youth Groups 5 51 Hong Kong Red Cross 5 52 New Life Psychiatric Rehabilitation Association 5 53 Clothing Industry Training Authority 5 54 Hong Kong St. John Ambulance 4
55 Hong Kong and Kowloon Gold Ornaments and Jewellery Trade Workers’ Union 4
56 The Neighbourhood Advice-Action Council 4 57 Queen Elizabeth Hospital - Hospital Authority 3 58 The Mental Health Association of Hong Kong 3 59 Li Fai Centre of Wushu 2
60 Li Ka Shing Institute of Professional and Continuing Education, The Open University of Hong Kong 2
61 The Hong Kong Marble & Granite Merchants Association, Limited 2
62 College of Nursing, Hong Kong 2 63 Pui Ching Academy 2 64 Haven of Hope Christian Service 2 65 Hong Kong and Kowloon Electrical Engineering and 2
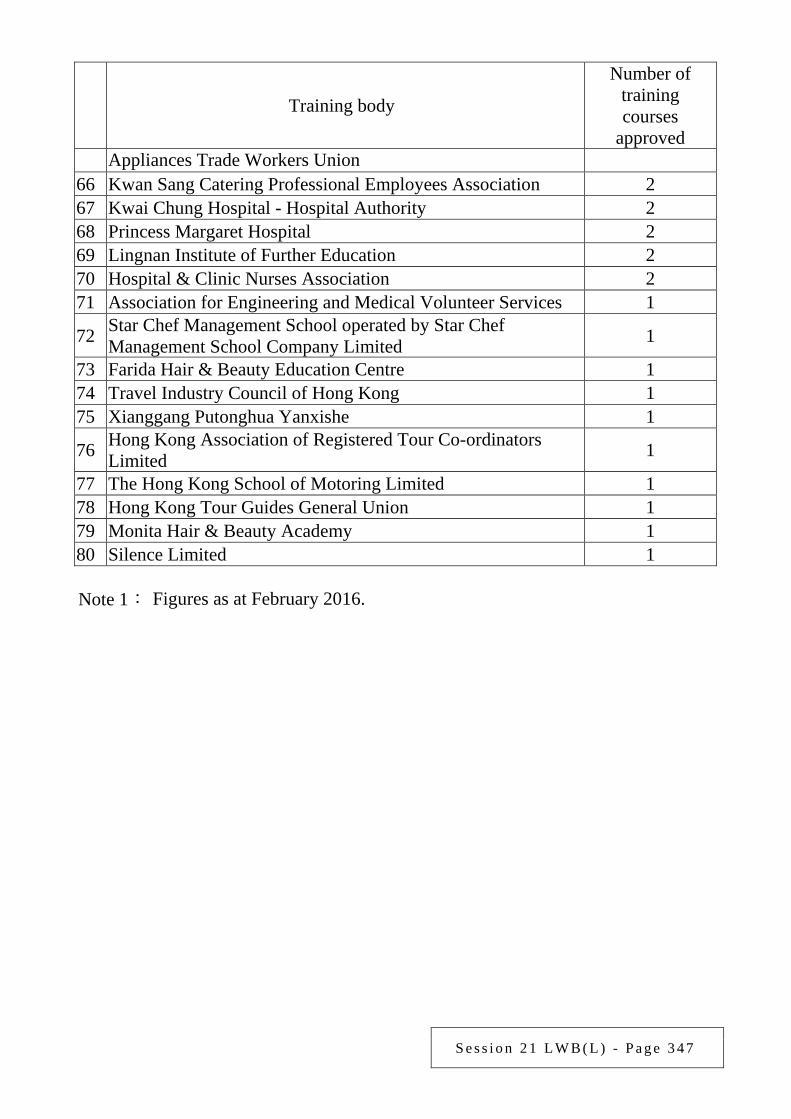
S e s s i o n 2 1 L W B ( L ) - P a g e 3 4 7
Training body
Number of training courses
approved Appliances Trade Workers Union
66 Kwan Sang Catering Professional Employees Association 2 67 Kwai Chung Hospital - Hospital Authority 2 68 Princess Margaret Hospital 2 69 Lingnan Institute of Further Education 2 70 Hospital & Clinic Nurses Association 2 71 Association for Engineering and Medical Volunteer Services 1
72 Star Chef Management School operated by Star Chef Management School Company Limited 1
73 Farida Hair & Beauty Education Centre 1 74 Travel Industry Council of Hong Kong 1 75 Xianggang Putonghua Yanxishe 1
76 Hong Kong Association of Registered Tour Co-ordinators Limited 1
77 The Hong Kong School of Motoring Limited 1 78 Hong Kong Tour Guides General Union 1 79 Monita Hair & Beauty Academy 1 80 Silence Limited 1 Note 1: Figures as at February 2016.
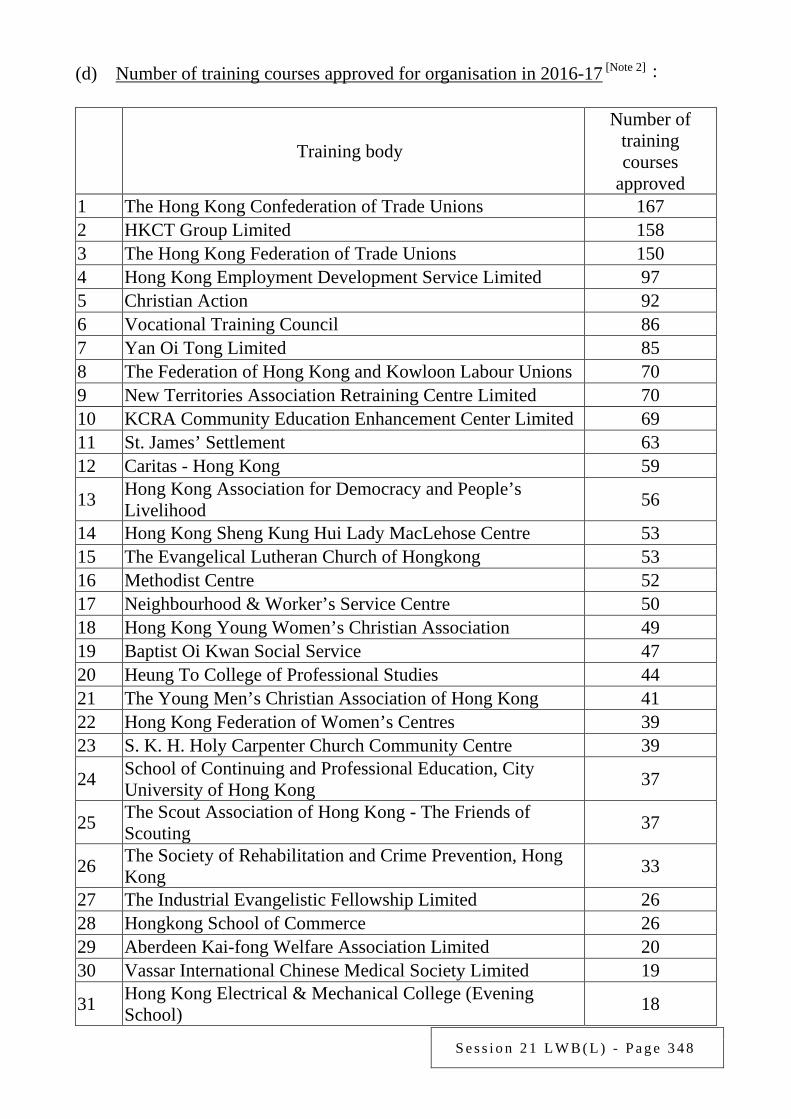
S e s s i o n 2 1 L W B ( L ) - P a g e 3 4 8
(d) Number of training courses approved for organisation in 2016-17 [Note 2]:
Training body
Number of training courses
approved 1 The Hong Kong Confederation of Trade Unions 167 2 HKCT Group Limited 158 3 The Hong Kong Federation of Trade Unions 150 4 Hong Kong Employment Development Service Limited 97 5 Christian Action 92 6 Vocational Training Council 86 7 Yan Oi Tong Limited 85 8 The Federation of Hong Kong and Kowloon Labour Unions 70 9 New Territories Association Retraining Centre Limited 70 10 KCRA Community Education Enhancement Center Limited 69 11 St. James’ Settlement 63 12 Caritas - Hong Kong 59
13 Hong Kong Association for Democracy and People’s Livelihood 56
14 Hong Kong Sheng Kung Hui Lady MacLehose Centre 53 15 The Evangelical Lutheran Church of Hongkong 53 16 Methodist Centre 52 17 Neighbourhood & Worker’s Service Centre 50 18 Hong Kong Young Women’s Christian Association 49 19 Baptist Oi Kwan Social Service 47 20 Heung To College of Professional Studies 44 21 The Young Men’s Christian Association of Hong Kong 41 22 Hong Kong Federation of Women’s Centres 39 23 S. K. H. Holy Carpenter Church Community Centre 39
24 School of Continuing and Professional Education, City University of Hong Kong 37
25 The Scout Association of Hong Kong - The Friends of Scouting 37
26 The Society of Rehabilitation and Crime Prevention, Hong Kong 33
27 The Industrial Evangelistic Fellowship Limited 26 28 Hongkong School of Commerce 26 29 Aberdeen Kai-fong Welfare Association Limited 20 30 Vassar International Chinese Medical Society Limited 19
31 Hong Kong Electrical & Mechanical College (Evening School) 18
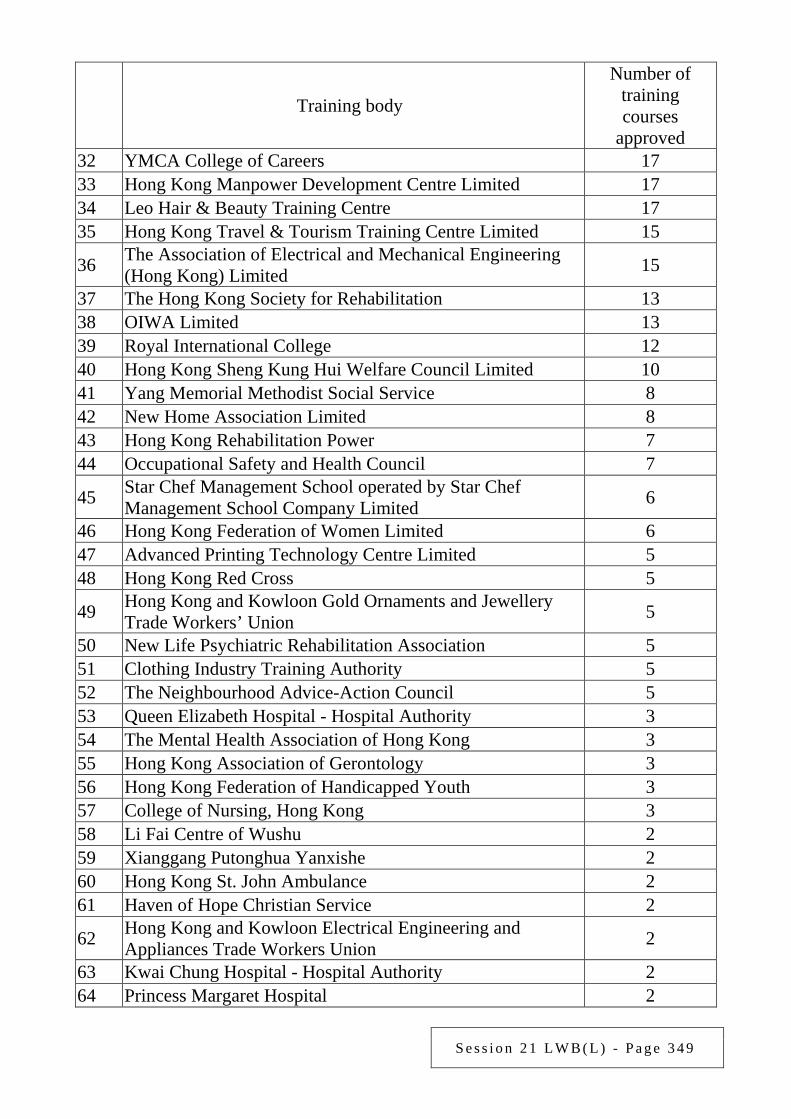
S e s s i o n 2 1 L W B ( L ) - P a g e 3 4 9
Training body
Number of training courses
approved 32 YMCA College of Careers 17 33 Hong Kong Manpower Development Centre Limited 17 34 Leo Hair & Beauty Training Centre 17 35 Hong Kong Travel & Tourism Training Centre Limited 15
36 The Association of Electrical and Mechanical Engineering (Hong Kong) Limited 15
37 The Hong Kong Society for Rehabilitation 13 38 OIWA Limited 13 39 Royal International College 12 40 Hong Kong Sheng Kung Hui Welfare Council Limited 10 41 Yang Memorial Methodist Social Service 8 42 New Home Association Limited 8 43 Hong Kong Rehabilitation Power 7 44 Occupational Safety and Health Council 7
45 Star Chef Management School operated by Star Chef Management School Company Limited 6
46 Hong Kong Federation of Women Limited 6 47 Advanced Printing Technology Centre Limited 5 48 Hong Kong Red Cross 5
49 Hong Kong and Kowloon Gold Ornaments and Jewellery Trade Workers’ Union 5
50 New Life Psychiatric Rehabilitation Association 5 51 Clothing Industry Training Authority 5 52 The Neighbourhood Advice-Action Council 5 53 Queen Elizabeth Hospital - Hospital Authority 3 54 The Mental Health Association of Hong Kong 3 55 Hong Kong Association of Gerontology 3 56 Hong Kong Federation of Handicapped Youth 3 57 College of Nursing, Hong Kong 3 58 Li Fai Centre of Wushu 2 59 Xianggang Putonghua Yanxishe 2 60 Hong Kong St. John Ambulance 2 61 Haven of Hope Christian Service 2
62 Hong Kong and Kowloon Electrical Engineering and Appliances Trade Workers Union 2
63 Kwai Chung Hospital - Hospital Authority 2 64 Princess Margaret Hospital 2
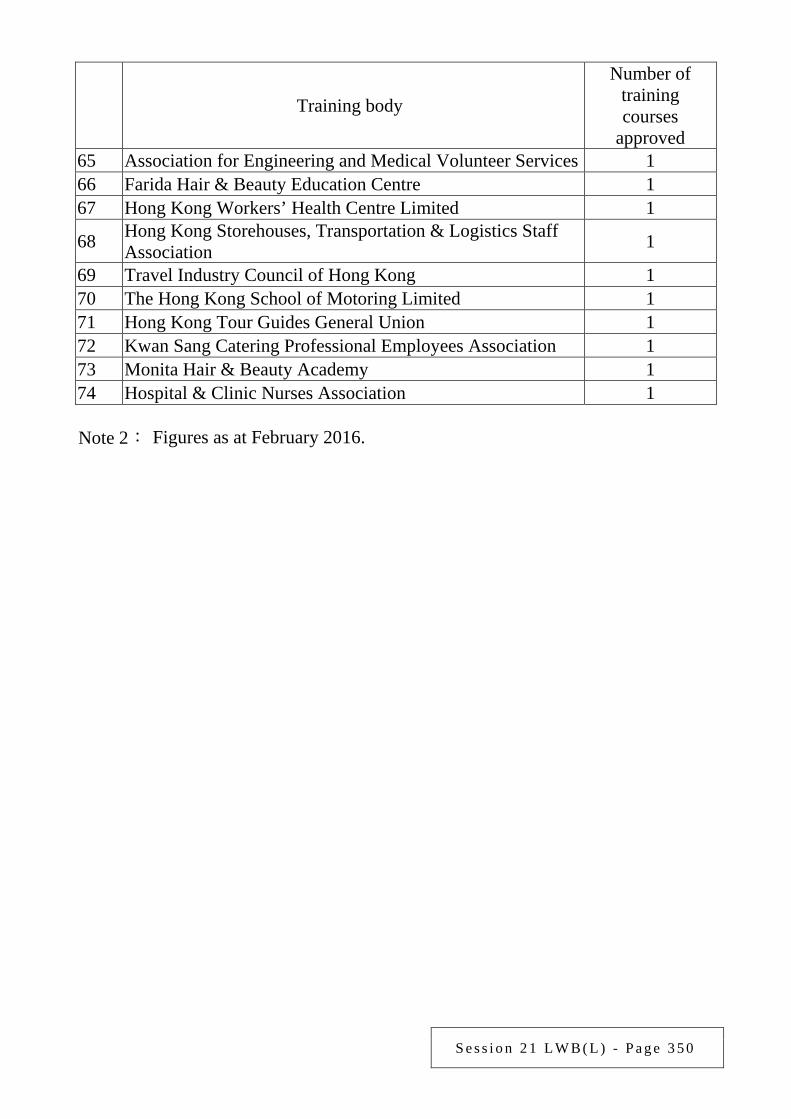
S e s s i o n 2 1 L W B ( L ) - P a g e 3 5 0
Training body
Number of training courses
approved 65 Association for Engineering and Medical Volunteer Services 1 66 Farida Hair & Beauty Education Centre 1 67 Hong Kong Workers’ Health Centre Limited 1
68 Hong Kong Storehouses, Transportation & Logistics Staff Association 1
69 Travel Industry Council of Hong Kong 1 70 The Hong Kong School of Motoring Limited 1 71 Hong Kong Tour Guides General Union 1 72 Kwan Sang Catering Professional Employees Association 1 73 Monita Hair & Beauty Academy 1 74 Hospital & Clinic Nurses Association 1 Note 2: Figures as at February 2016.
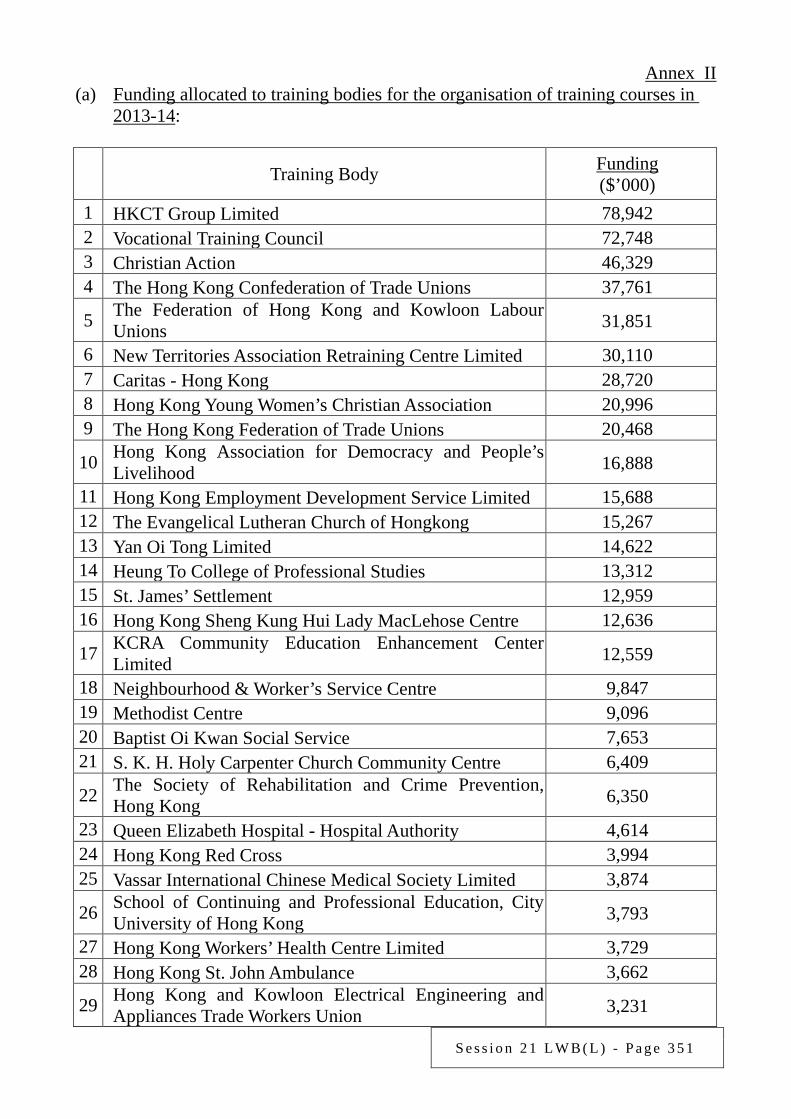
S e s s i o n 2 1 L W B ( L ) - P a g e 3 5 1
Annex II (a) Funding allocated to training bodies for the organisation of training courses in
2013-14:
Training Body Funding ($’000)
1 HKCT Group Limited 78,942 2 Vocational Training Council 72,748 3 Christian Action 46,329 4 The Hong Kong Confederation of Trade Unions 37,761
5 The Federation of Hong Kong and Kowloon Labour Unions 31,851
6 New Territories Association Retraining Centre Limited 30,110 7 Caritas - Hong Kong 28,720 8 Hong Kong Young Women’s Christian Association 20,996 9 The Hong Kong Federation of Trade Unions 20,468
10 Hong Kong Association for Democracy and People’s Livelihood 16,888
11 Hong Kong Employment Development Service Limited 15,688 12 The Evangelical Lutheran Church of Hongkong 15,267 13 Yan Oi Tong Limited 14,622 14 Heung To College of Professional Studies 13,312 15 St. James’ Settlement 12,959 16 Hong Kong Sheng Kung Hui Lady MacLehose Centre 12,636
17 KCRA Community Education Enhancement Center Limited 12,559
18 Neighbourhood & Worker’s Service Centre 9,847 19 Methodist Centre 9,096 20 Baptist Oi Kwan Social Service 7,653 21 S. K. H. Holy Carpenter Church Community Centre 6,409
22 The Society of Rehabilitation and Crime Prevention, Hong Kong 6,350
23 Queen Elizabeth Hospital - Hospital Authority 4,614 24 Hong Kong Red Cross 3,994 25 Vassar International Chinese Medical Society Limited 3,874
26 School of Continuing and Professional Education, City University of Hong Kong 3,793
27 Hong Kong Workers’ Health Centre Limited 3,729 28 Hong Kong St. John Ambulance 3,662
29 Hong Kong and Kowloon Electrical Engineering and Appliances Trade Workers Union 3,231
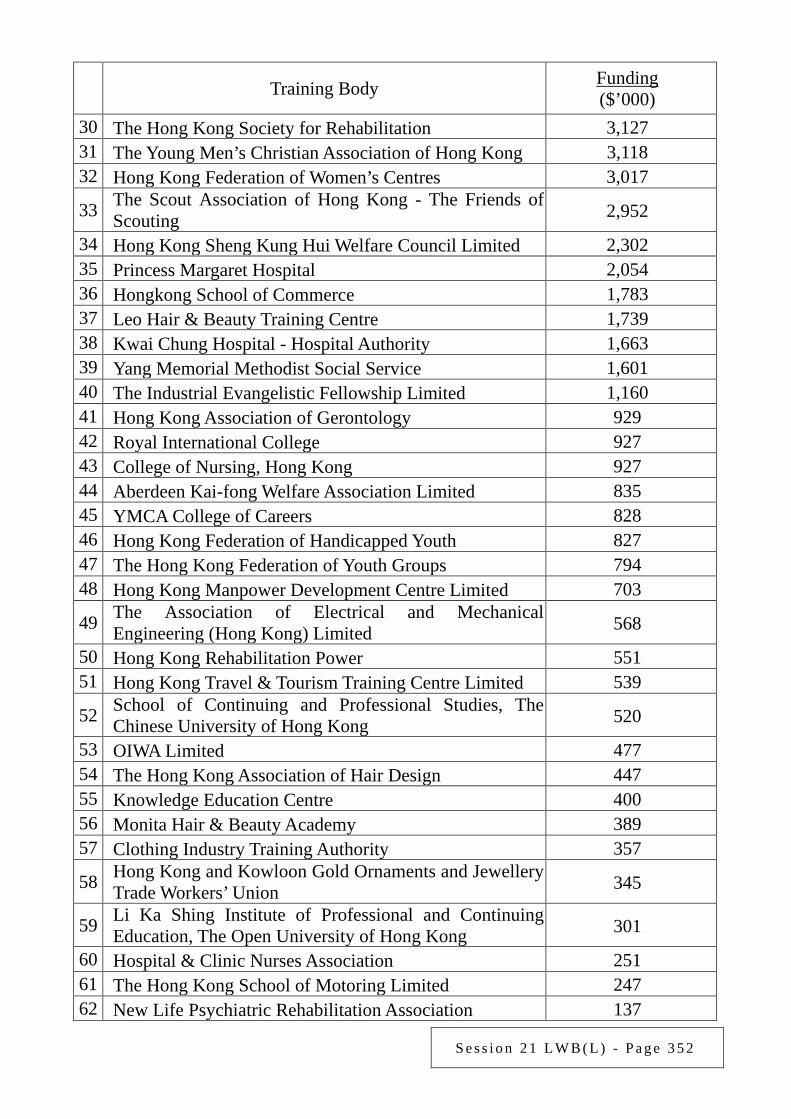
S e s s i o n 2 1 L W B ( L ) - P a g e 3 5 2
Training Body Funding ($’000)
30 The Hong Kong Society for Rehabilitation 3,127 31 The Young Men’s Christian Association of Hong Kong 3,118 32 Hong Kong Federation of Women’s Centres 3,017
33 The Scout Association of Hong Kong - The Friends of Scouting 2,952
34 Hong Kong Sheng Kung Hui Welfare Council Limited 2,302 35 Princess Margaret Hospital 2,054 36 Hongkong School of Commerce 1,783 37 Leo Hair & Beauty Training Centre 1,739 38 Kwai Chung Hospital - Hospital Authority 1,663 39 Yang Memorial Methodist Social Service 1,601 40 The Industrial Evangelistic Fellowship Limited 1,160 41 Hong Kong Association of Gerontology 929 42 Royal International College 927 43 College of Nursing, Hong Kong 927 44 Aberdeen Kai-fong Welfare Association Limited 835 45 YMCA College of Careers 828 46 Hong Kong Federation of Handicapped Youth 827 47 The Hong Kong Federation of Youth Groups 794 48 Hong Kong Manpower Development Centre Limited 703
49 The Association of Electrical and Mechanical Engineering (Hong Kong) Limited 568
50 Hong Kong Rehabilitation Power 551 51 Hong Kong Travel & Tourism Training Centre Limited 539
52 School of Continuing and Professional Studies, The Chinese University of Hong Kong 520
53 OIWA Limited 477 54 The Hong Kong Association of Hair Design 447 55 Knowledge Education Centre 400 56 Monita Hair & Beauty Academy 389 57 Clothing Industry Training Authority 357
58 Hong Kong and Kowloon Gold Ornaments and Jewellery Trade Workers’ Union 345
59 Li Ka Shing Institute of Professional and Continuing Education, The Open University of Hong Kong 301
60 Hospital & Clinic Nurses Association 251 61 The Hong Kong School of Motoring Limited 247 62 New Life Psychiatric Rehabilitation Association 137
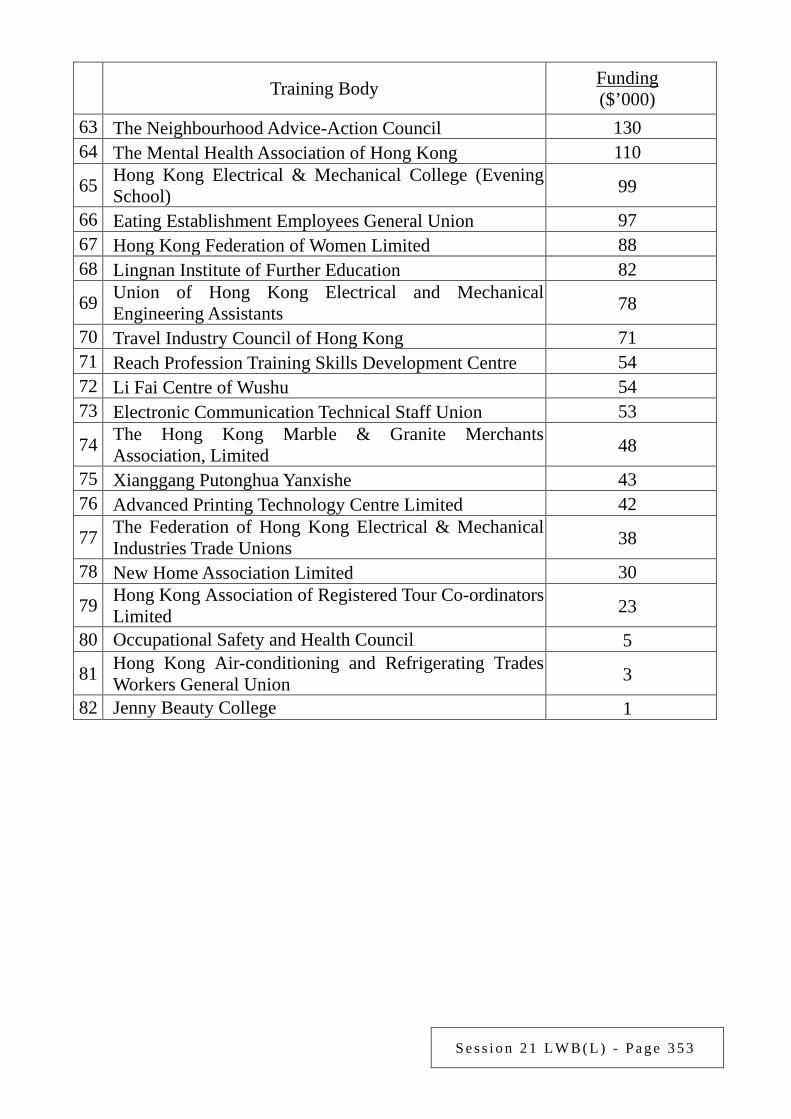
S e s s i o n 2 1 L W B ( L ) - P a g e 3 5 3
Training Body Funding ($’000)
63 The Neighbourhood Advice-Action Council 130 64 The Mental Health Association of Hong Kong 110
65 Hong Kong Electrical & Mechanical College (Evening School) 99
66 Eating Establishment Employees General Union 97 67 Hong Kong Federation of Women Limited 88 68 Lingnan Institute of Further Education 82
69 Union of Hong Kong Electrical and Mechanical Engineering Assistants 78
70 Travel Industry Council of Hong Kong 71 71 Reach Profession Training Skills Development Centre 54 72 Li Fai Centre of Wushu 54 73 Electronic Communication Technical Staff Union 53
74 The Hong Kong Marble & Granite Merchants Association, Limited 48
75 Xianggang Putonghua Yanxishe 43 76 Advanced Printing Technology Centre Limited 42
77 The Federation of Hong Kong Electrical & Mechanical Industries Trade Unions 38
78 New Home Association Limited 30
79 Hong Kong Association of Registered Tour Co-ordinators Limited 23
80 Occupational Safety and Health Council 5
81 Hong Kong Air-conditioning and Refrigerating Trades Workers General Union 3
82 Jenny Beauty College 1
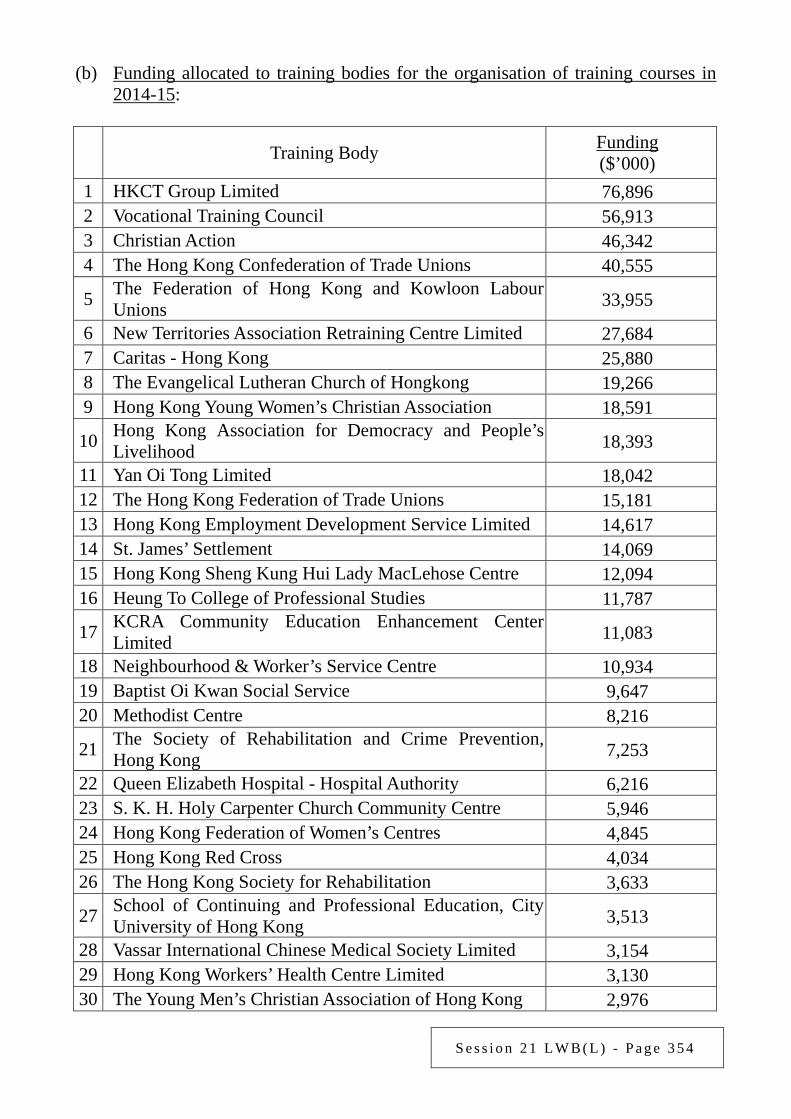
S e s s i o n 2 1 L W B ( L ) - P a g e 3 5 4
(b) Funding allocated to training bodies for the organisation of training courses in 2014-15:
Training Body Funding ($’000)
1 HKCT Group Limited 76,896 2 Vocational Training Council 56,913 3 Christian Action 46,342 4 The Hong Kong Confederation of Trade Unions 40,555
5 The Federation of Hong Kong and Kowloon Labour Unions 33,955
6 New Territories Association Retraining Centre Limited 27,684 7 Caritas - Hong Kong 25,880 8 The Evangelical Lutheran Church of Hongkong 19,266 9 Hong Kong Young Women’s Christian Association 18,591
10 Hong Kong Association for Democracy and People’s Livelihood 18,393
11 Yan Oi Tong Limited 18,042 12 The Hong Kong Federation of Trade Unions 15,181 13 Hong Kong Employment Development Service Limited 14,617 14 St. James’ Settlement 14,069 15 Hong Kong Sheng Kung Hui Lady MacLehose Centre 12,094 16 Heung To College of Professional Studies 11,787
17 KCRA Community Education Enhancement Center Limited 11,083
18 Neighbourhood & Worker’s Service Centre 10,934 19 Baptist Oi Kwan Social Service 9,647 20 Methodist Centre 8,216
21 The Society of Rehabilitation and Crime Prevention, Hong Kong 7,253
22 Queen Elizabeth Hospital - Hospital Authority 6,216 23 S. K. H. Holy Carpenter Church Community Centre 5,946 24 Hong Kong Federation of Women’s Centres 4,845 25 Hong Kong Red Cross 4,034 26 The Hong Kong Society for Rehabilitation 3,633
27 School of Continuing and Professional Education, City University of Hong Kong 3,513
28 Vassar International Chinese Medical Society Limited 3,154 29 Hong Kong Workers’ Health Centre Limited 3,130 30 The Young Men’s Christian Association of Hong Kong 2,976
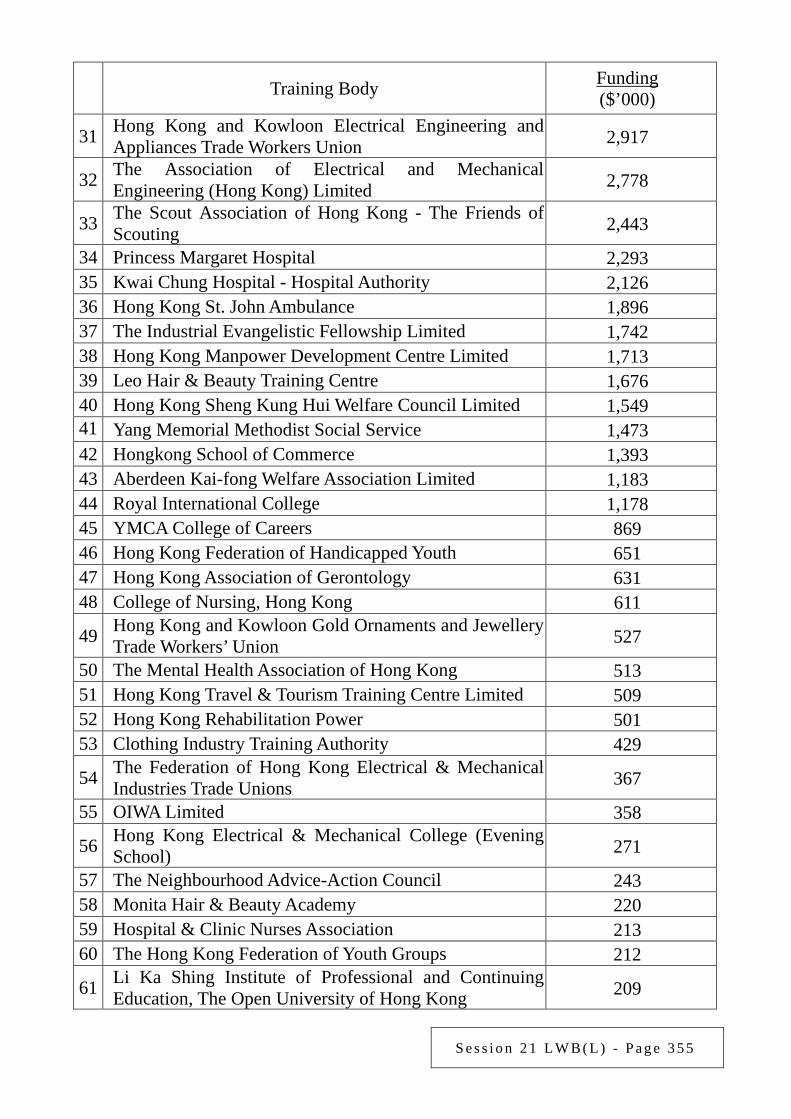
S e s s i o n 2 1 L W B ( L ) - P a g e 3 5 5
Training Body Funding ($’000)
31 Hong Kong and Kowloon Electrical Engineering and Appliances Trade Workers Union 2,917
32 The Association of Electrical and Mechanical Engineering (Hong Kong) Limited 2,778
33 The Scout Association of Hong Kong - The Friends of Scouting 2,443
34 Princess Margaret Hospital 2,293 35 Kwai Chung Hospital - Hospital Authority 2,126 36 Hong Kong St. John Ambulance 1,896 37 The Industrial Evangelistic Fellowship Limited 1,742 38 Hong Kong Manpower Development Centre Limited 1,713 39 Leo Hair & Beauty Training Centre 1,676 40 Hong Kong Sheng Kung Hui Welfare Council Limited 1,549 41 Yang Memorial Methodist Social Service 1,473 42 Hongkong School of Commerce 1,393 43 Aberdeen Kai-fong Welfare Association Limited 1,183 44 Royal International College 1,178 45 YMCA College of Careers 869 46 Hong Kong Federation of Handicapped Youth 651 47 Hong Kong Association of Gerontology 631 48 College of Nursing, Hong Kong 611
49 Hong Kong and Kowloon Gold Ornaments and Jewellery Trade Workers’ Union 527
50 The Mental Health Association of Hong Kong 513 51 Hong Kong Travel & Tourism Training Centre Limited 509 52 Hong Kong Rehabilitation Power 501 53 Clothing Industry Training Authority 429
54 The Federation of Hong Kong Electrical & Mechanical Industries Trade Unions 367
55 OIWA Limited 358
56 Hong Kong Electrical & Mechanical College (Evening School) 271
57 The Neighbourhood Advice-Action Council 243 58 Monita Hair & Beauty Academy 220 59 Hospital & Clinic Nurses Association 213 60 The Hong Kong Federation of Youth Groups 212
61 Li Ka Shing Institute of Professional and Continuing Education, The Open University of Hong Kong 209
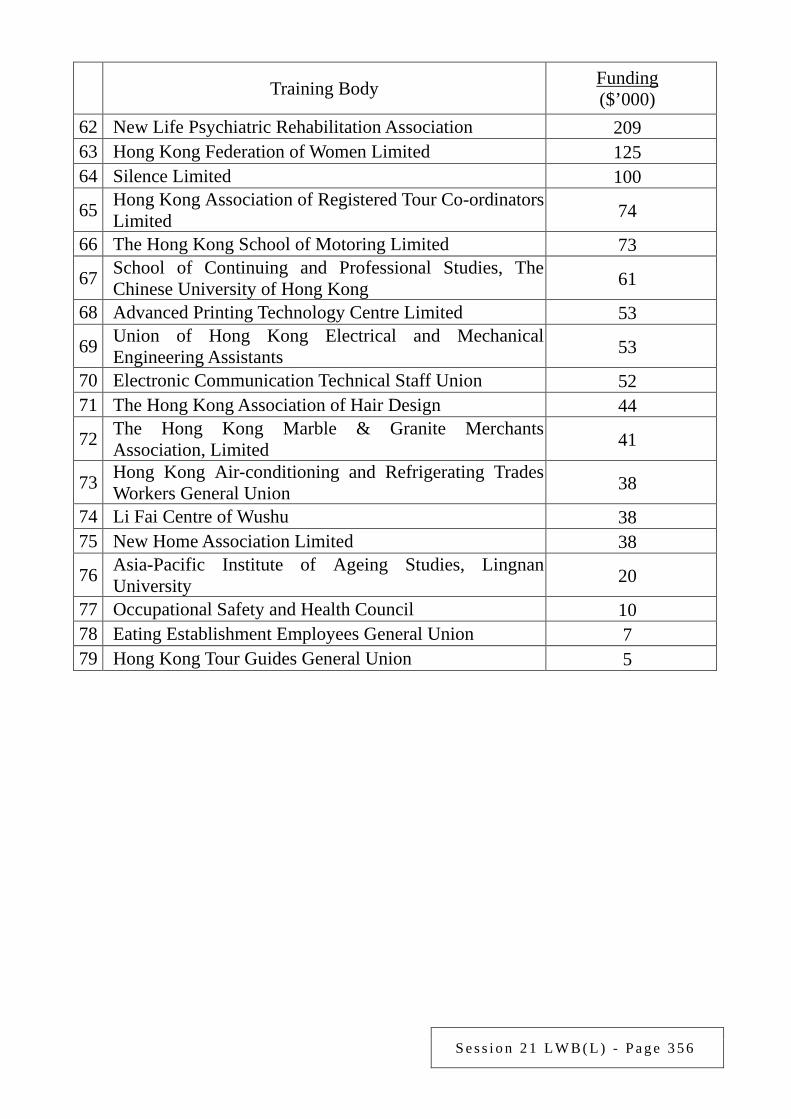
S e s s i o n 2 1 L W B ( L ) - P a g e 3 5 6
Training Body Funding ($’000)
62 New Life Psychiatric Rehabilitation Association 209 63 Hong Kong Federation of Women Limited 125 64 Silence Limited 100
65 Hong Kong Association of Registered Tour Co-ordinators Limited 74
66 The Hong Kong School of Motoring Limited 73
67 School of Continuing and Professional Studies, The Chinese University of Hong Kong 61
68 Advanced Printing Technology Centre Limited 53
69 Union of Hong Kong Electrical and Mechanical Engineering Assistants 53
70 Electronic Communication Technical Staff Union 52 71 The Hong Kong Association of Hair Design 44
72 The Hong Kong Marble & Granite Merchants Association, Limited 41
73 Hong Kong Air-conditioning and Refrigerating Trades Workers General Union 38
74 Li Fai Centre of Wushu 38 75 New Home Association Limited 38
76 Asia-Pacific Institute of Ageing Studies, Lingnan University 20
77 Occupational Safety and Health Council 10 78 Eating Establishment Employees General Union 7 79 Hong Kong Tour Guides General Union 5
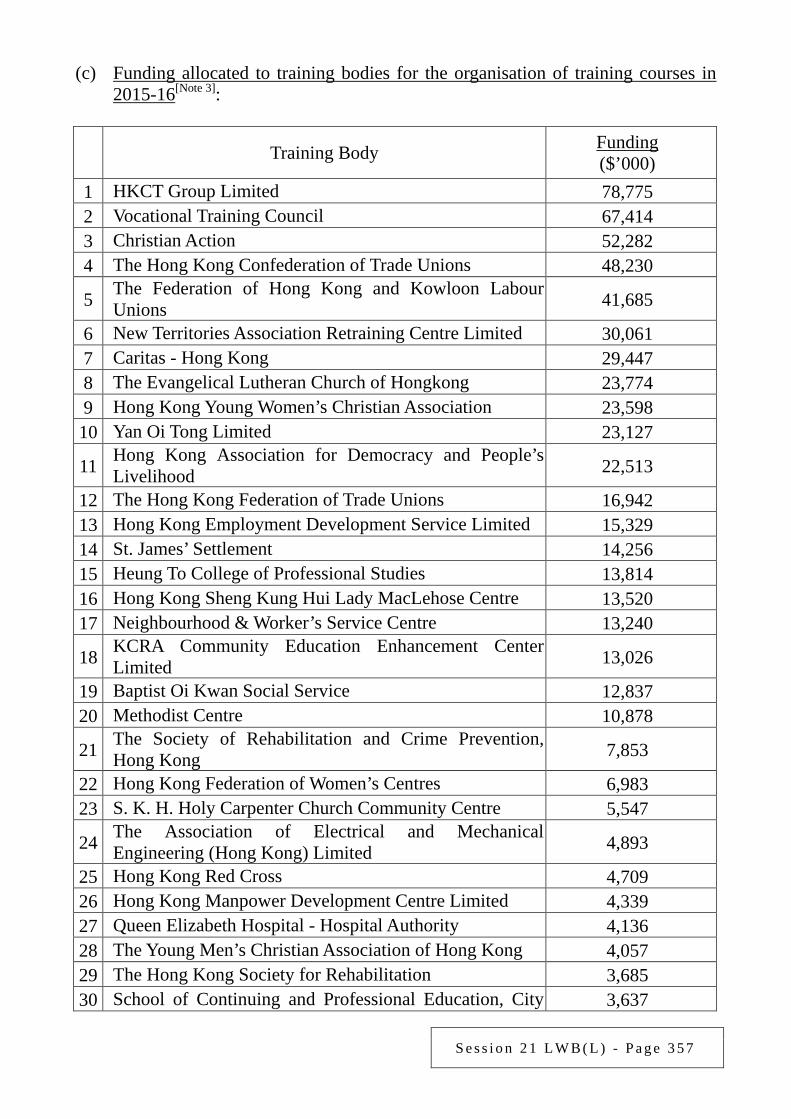
S e s s i o n 2 1 L W B ( L ) - P a g e 3 5 7
(c) Funding allocated to training bodies for the organisation of training courses in 2015-16[Note 3]:
Training Body Funding ($’000)
1 HKCT Group Limited 78,775 2 Vocational Training Council 67,414 3 Christian Action 52,282 4 The Hong Kong Confederation of Trade Unions 48,230
5 The Federation of Hong Kong and Kowloon Labour Unions 41,685
6 New Territories Association Retraining Centre Limited 30,061 7 Caritas - Hong Kong 29,447 8 The Evangelical Lutheran Church of Hongkong 23,774 9 Hong Kong Young Women’s Christian Association 23,598 10 Yan Oi Tong Limited 23,127
11 Hong Kong Association for Democracy and People’s Livelihood 22,513
12 The Hong Kong Federation of Trade Unions 16,942 13 Hong Kong Employment Development Service Limited 15,329 14 St. James’ Settlement 14,256 15 Heung To College of Professional Studies 13,814 16 Hong Kong Sheng Kung Hui Lady MacLehose Centre 13,520 17 Neighbourhood & Worker’s Service Centre 13,240
18 KCRA Community Education Enhancement Center Limited 13,026
19 Baptist Oi Kwan Social Service 12,837 20 Methodist Centre 10,878
21 The Society of Rehabilitation and Crime Prevention, Hong Kong 7,853
22 Hong Kong Federation of Women’s Centres 6,983 23 S. K. H. Holy Carpenter Church Community Centre 5,547
24 The Association of Electrical and Mechanical Engineering (Hong Kong) Limited 4,893
25 Hong Kong Red Cross 4,709 26 Hong Kong Manpower Development Centre Limited 4,339 27 Queen Elizabeth Hospital - Hospital Authority 4,136 28 The Young Men’s Christian Association of Hong Kong 4,057 29 The Hong Kong Society for Rehabilitation 3,685 30 School of Continuing and Professional Education, City 3,637
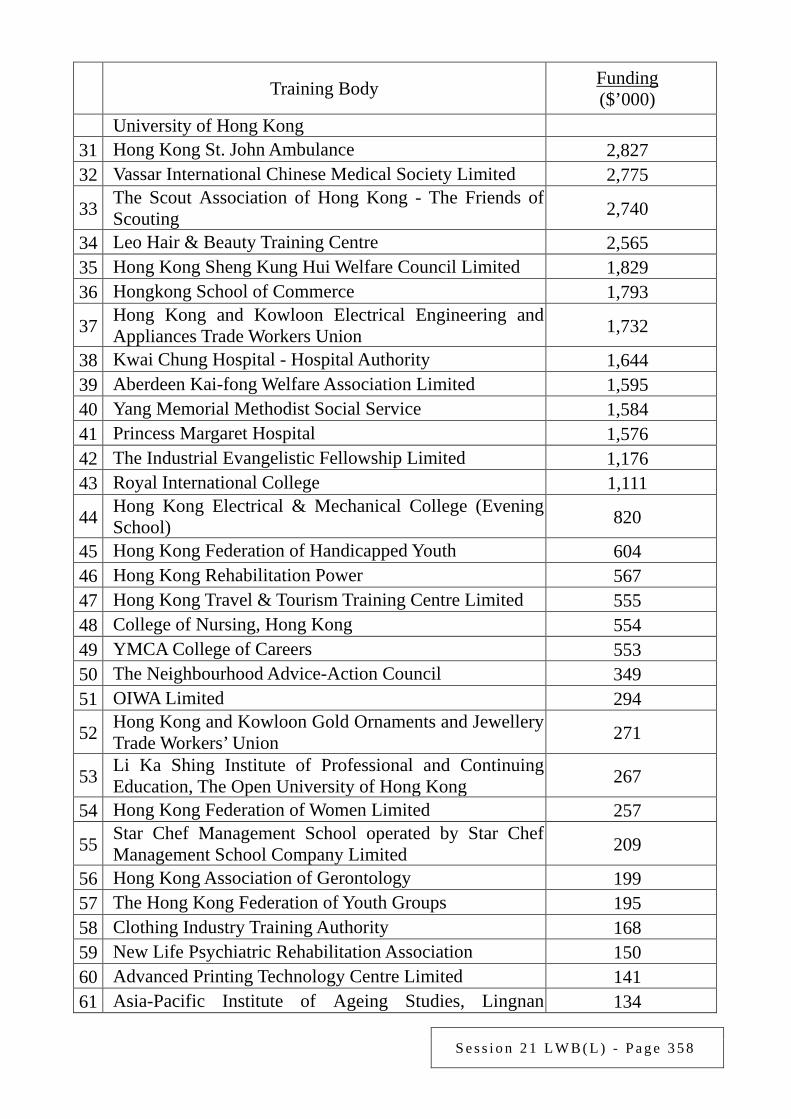
S e s s i o n 2 1 L W B ( L ) - P a g e 3 5 8
Training Body Funding ($’000)
University of Hong Kong 31 Hong Kong St. John Ambulance 2,827 32 Vassar International Chinese Medical Society Limited 2,775
33 The Scout Association of Hong Kong - The Friends of Scouting 2,740
34 Leo Hair & Beauty Training Centre 2,565 35 Hong Kong Sheng Kung Hui Welfare Council Limited 1,829 36 Hongkong School of Commerce 1,793
37 Hong Kong and Kowloon Electrical Engineering and Appliances Trade Workers Union 1,732
38 Kwai Chung Hospital - Hospital Authority 1,644 39 Aberdeen Kai-fong Welfare Association Limited 1,595 40 Yang Memorial Methodist Social Service 1,584 41 Princess Margaret Hospital 1,576 42 The Industrial Evangelistic Fellowship Limited 1,176 43 Royal International College 1,111
44 Hong Kong Electrical & Mechanical College (Evening School) 820
45 Hong Kong Federation of Handicapped Youth 604 46 Hong Kong Rehabilitation Power 567 47 Hong Kong Travel & Tourism Training Centre Limited 555 48 College of Nursing, Hong Kong 554 49 YMCA College of Careers 553 50 The Neighbourhood Advice-Action Council 349 51 OIWA Limited 294
52 Hong Kong and Kowloon Gold Ornaments and Jewellery Trade Workers’ Union 271
53 Li Ka Shing Institute of Professional and Continuing Education, The Open University of Hong Kong 267
54 Hong Kong Federation of Women Limited 257
55 Star Chef Management School operated by Star Chef Management School Company Limited 209
56 Hong Kong Association of Gerontology 199 57 The Hong Kong Federation of Youth Groups 195 58 Clothing Industry Training Authority 168 59 New Life Psychiatric Rehabilitation Association 150 60 Advanced Printing Technology Centre Limited 141 61 Asia-Pacific Institute of Ageing Studies, Lingnan 134
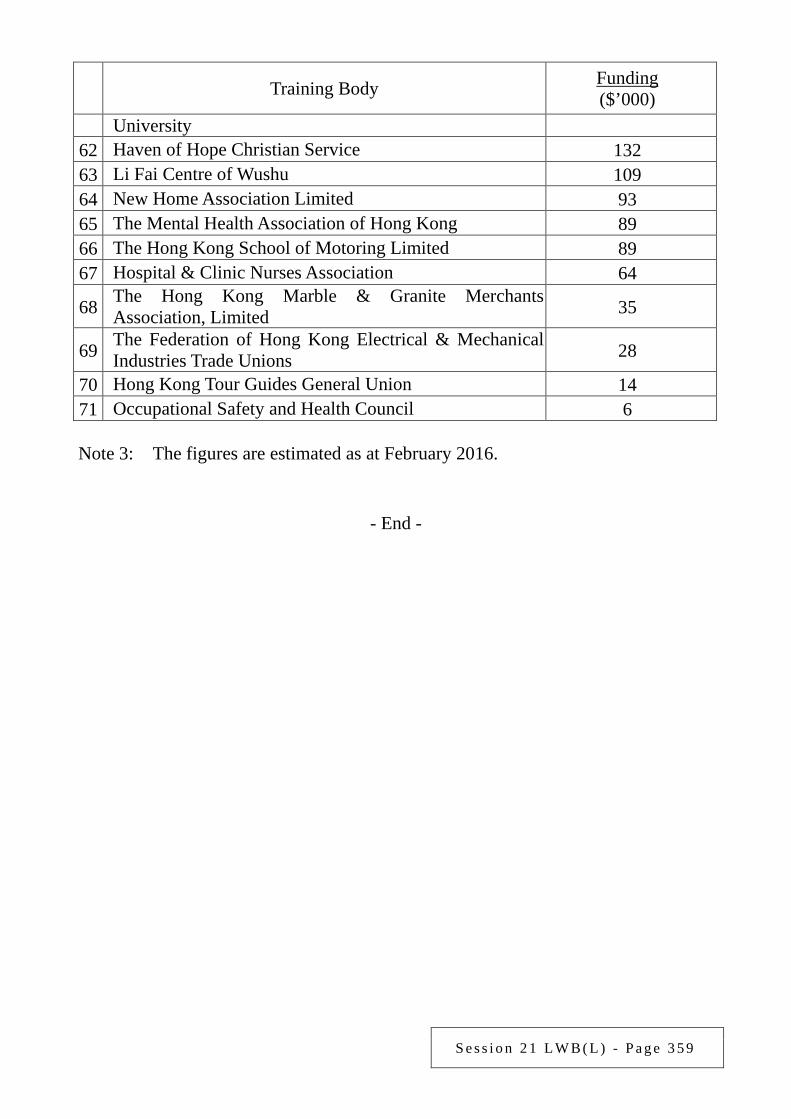
S e s s i o n 2 1 L W B ( L ) - P a g e 3 5 9
Training Body Funding ($’000)
University 62 Haven of Hope Christian Service 132 63 Li Fai Centre of Wushu 109 64 New Home Association Limited 93 65 The Mental Health Association of Hong Kong 89 66 The Hong Kong School of Motoring Limited 89 67 Hospital & Clinic Nurses Association 64
68 The Hong Kong Marble & Granite Merchants Association, Limited 35
69 The Federation of Hong Kong Electrical & Mechanical Industries Trade Unions 28
70 Hong Kong Tour Guides General Union 14 71 Occupational Safety and Health Council 6 Note 3: The figures are estimated as at February 2016.
- End -

S e s s i o n 2 1 L W B ( L ) - P a g e 3 6 0
Examination of Estimates of Expenditure 2016-17 Reply Serial No.
LWB(L)119 CONTROLLING OFFICER’S REPLY (Question Serial No. 0385)
Head: (141) Government Secretariat: Labour and Welfare Bureau
Subhead (No. & title): ()
Programme: (7) Subvention: Vocational Training Council (Vocational Training)
Controlling Officer: Permanent Secretary for Labour and Welfare (Miss Annie TAM)
Director of Bureau: Secretary for Labour and Welfare Question: As regards the Apprenticeship Ordinance (the Ordinance), would the Government inform this Committee of: (1) the trades currently specified under the Ordinance; (2) the number of apprentices registered under the designated trades in the past 3 years; (3) the number of apprentices taking courses in various trades in the past 3 years; and (4) as the Ordinance has been implemented for many years, will the Government conduct
a review of it? If not, what are the reasons? Asked by: Hon Albert HO Chun-yan (Member Question No. 24) Reply: The information sought is provided as follows: (1) and (2) There are 45 designated trades specified under the Apprenticeship
Ordinance (Cap. 47) (the Ordinance). It is stipulated in the Ordinance that an employer employing a young person aged between 14 and under 19 in a designated trade must enter into an apprenticeship contract with the young person and register the contract with the Director of Apprenticeship. According to the Ordinance, a person who is aged 19 or above or who is employed in a non-designated trade may also enter into a registered apprenticeship contract with the employer and register the contract voluntarily. Table 1 sets out the number of registered apprentices in each designated trade in the past 3 years (i.e. 2013-14, 2014-15 and 2015-16).
(3) Table 2 sets out the total number of registered apprentices in each sector (including designated and non-designated trades) in the past 3 years (i.e. 2013-14, 2014-15 and 2015-16).
(4) The Government launched the Pilot Training and Support Scheme (the

S e s s i o n 2 1 L W B ( L ) - P a g e 3 6 1
Scheme) through the Vocational Training Council (VTC) in academic year 2014/15 under the framework of the Ordinance to enhance the existing Apprenticeship Scheme. Through integration of workplace and school training, the Scheme enables students to acquire career-related skills and knowledge, and helps them better understand their career and study progression pathways. Given positive response from participating trainees and employers, the Government will extend the Scheme to benefit new entrants to the VTC in academic years 2016/17 and 2017/18, raising the total number of student beneficiaries to 4 000. The Government has no plan to review the Ordinance at this stage.
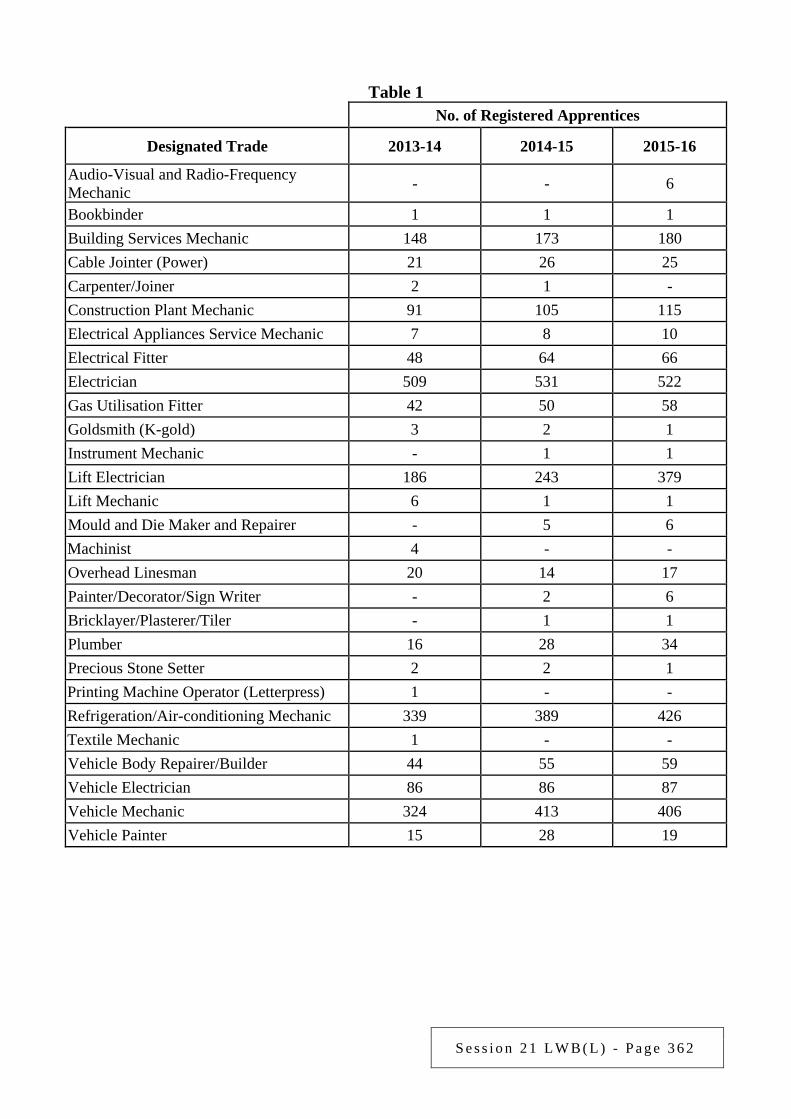
S e s s i o n 2 1 L W B ( L ) - P a g e 3 6 2
Table 1
No. of Registered Apprentices
Designated Trade 2013-14 2014-15 2015-16
Audio-Visual and Radio-Frequency Mechanic - - 6
Bookbinder 1 1 1 Building Services Mechanic 148 173 180 Cable Jointer (Power) 21 26 25 Carpenter/Joiner 2 1 - Construction Plant Mechanic 91 105 115 Electrical Appliances Service Mechanic 7 8 10 Electrical Fitter 48 64 66 Electrician 509 531 522 Gas Utilisation Fitter 42 50 58 Goldsmith (K-gold) 3 2 1 Instrument Mechanic - 1 1 Lift Electrician 186 243 379 Lift Mechanic 6 1 1 Mould and Die Maker and Repairer - 5 6 Machinist 4 - - Overhead Linesman 20 14 17 Painter/Decorator/Sign Writer - 2 6 Bricklayer/Plasterer/Tiler - 1 1 Plumber 16 28 34 Precious Stone Setter 2 2 1 Printing Machine Operator (Letterpress) 1 - - Refrigeration/Air-conditioning Mechanic 339 389 426 Textile Mechanic 1 - - Vehicle Body Repairer/Builder 44 55 59 Vehicle Electrician 86 86 87 Vehicle Mechanic 324 413 406 Vehicle Painter 15 28 19
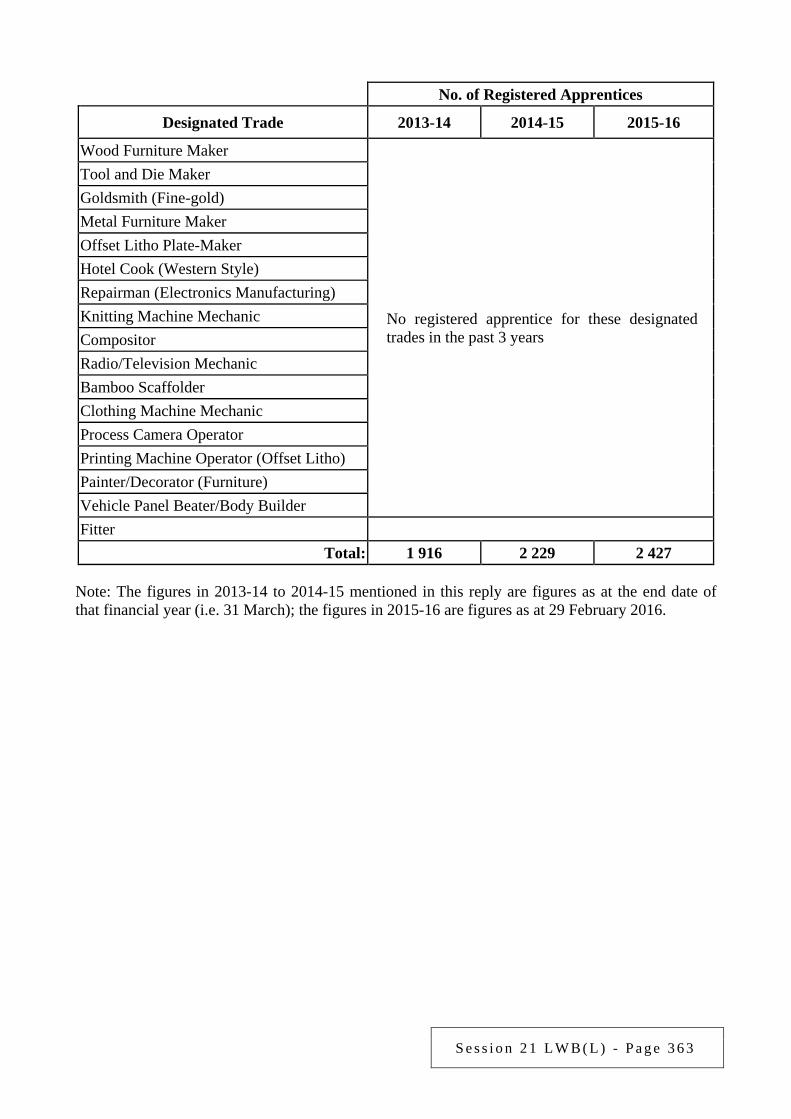
S e s s i o n 2 1 L W B ( L ) - P a g e 3 6 3
No. of Registered Apprentices
Designated Trade 2013-14 2014-15 2015-16
Wood Furniture Maker
No registered apprentice for these designated trades in the past 3 years
Tool and Die Maker Goldsmith (Fine-gold) Metal Furniture Maker Offset Litho Plate-Maker Hotel Cook (Western Style) Repairman (Electronics Manufacturing) Knitting Machine Mechanic Compositor Radio/Television Mechanic Bamboo Scaffolder Clothing Machine Mechanic Process Camera Operator Printing Machine Operator (Offset Litho) Painter/Decorator (Furniture) Vehicle Panel Beater/Body Builder Fitter
Total: 1 916 2 229 2 427 Note: The figures in 2013-14 to 2014-15 mentioned in this reply are figures as at the end date of that financial year (i.e. 31 March); the figures in 2015-16 are figures as at 29 February 2016.
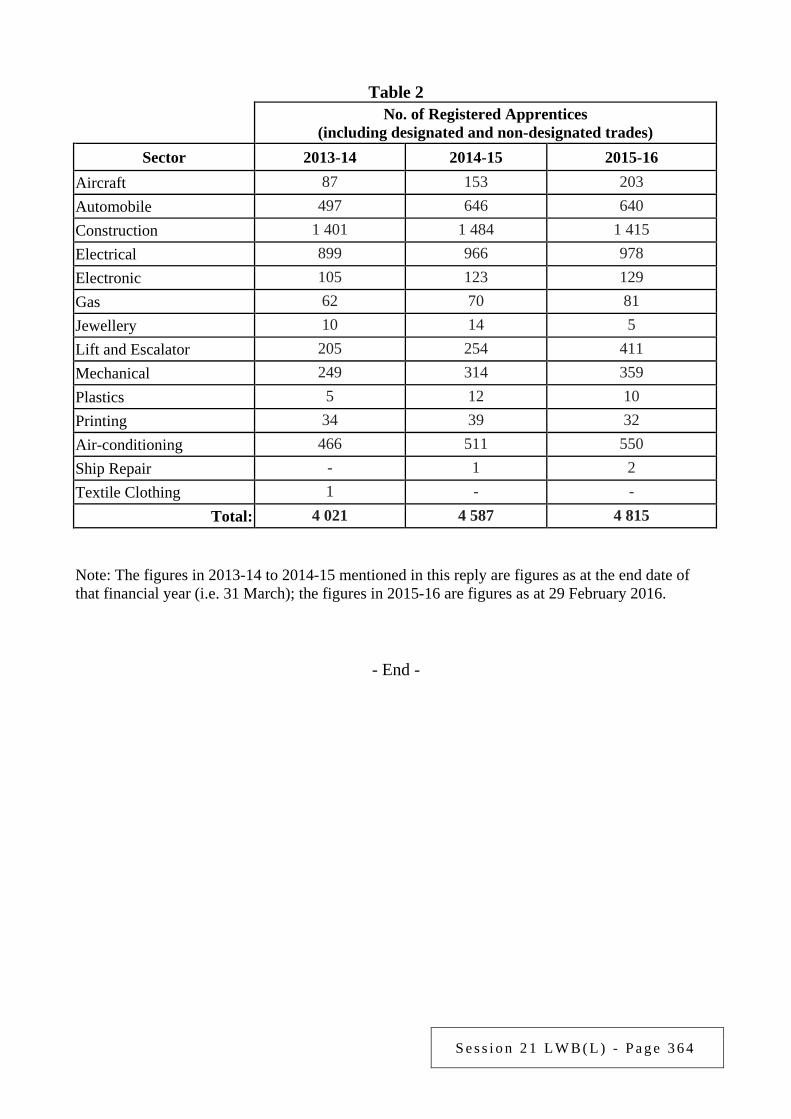
S e s s i o n 2 1 L W B ( L ) - P a g e 3 6 4
Table 2
No. of Registered Apprentices
(including designated and non-designated trades) Sector 2013-14 2014-15 2015-16
Aircraft 87 153 203 Automobile 497 646 640 Construction 1 401 1 484 1 415 Electrical 899 966 978 Electronic 105 123 129 Gas 62 70 81 Jewellery 10 14 5 Lift and Escalator 205 254 411 Mechanical 249 314 359 Plastics 5 12 10 Printing 34 39 32 Air-conditioning 466 511 550 Ship Repair - 1 2 Textile Clothing 1 - -
Total: 4 021 4 587 4 815
Note: The figures in 2013-14 to 2014-15 mentioned in this reply are figures as at the end date of that financial year (i.e. 31 March); the figures in 2015-16 are figures as at 29 February 2016.
- End -

S e s s i o n 2 1 L W B ( L ) - P a g e 3 6 5
Examination of Estimates of Expenditure 2016-17 Reply Serial No.
LWB(L)120 CONTROLLING OFFICER’S REPLY (Question Serial No. 2574)
Head: (141) Government Secretariat: Labour and Welfare Bureau
Subhead (No. & title): ( )
Programme: (7) Subvention: Vocational Training Council (Vocational Training)
Controlling Officer: Permanent Secretary for Labour and Welfare (Miss Annie TAM)
Director of Bureau: Secretary for Labour and Welfare Question: Regarding the implementation of the Apprenticeship Ordinance (Cap. 47) (the Ordinance), would the Government please advise this Committee on: (a) the number of employers participating in the Apprenticeship Scheme and that of
registered apprentices in 2014-15 and 2015-16 respectively (with breakdowns by designated trade and non-designated trade);
(b) the number of registered apprentices in all the designated trades under the Ordinance up to now (with breakdowns by gender, age and trade);
(c) the number of non-designated trades participating in the Apprenticeship Scheme under the Ordinance up to now and the number of apprentices involved (with breakdowns by gender, age and trade);
(d) the number of apprentices who have completed training under the Apprenticeship Scheme in 2014-15 and 2015-16; the number of apprentices who continued to work in their original trades and their percentage share in the total number of apprentices in employment; and
(e) will the Government set aside funds in 2016-17 for reviewing the implementation and applicability of the Ordinance; if yes, the details and timetable of the review; if not, the reasons for that?
Asked by: Hon KWOK Wai-keung (Member Question No. 50) Reply: The information sought is provided as follows:
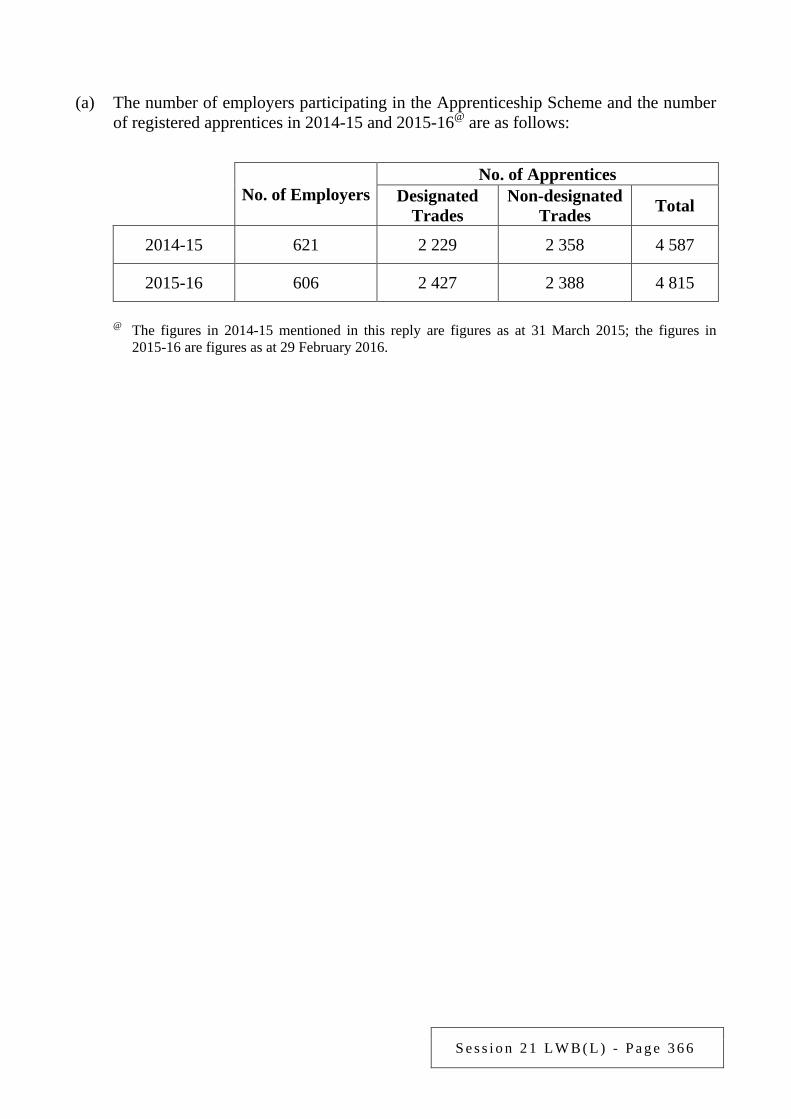
S e s s i o n 2 1 L W B ( L ) - P a g e 3 6 6
(a) The number of employers participating in the Apprenticeship Scheme and the number
of registered apprentices in 2014-15 and 2015-16@ are as follows:
No. of Employers No. of Apprentices
Designated
Trades Non-designated
Trades Total
2014-15 621 2 229 2 358 4 587
2015-16 606 2 427 2 388 4 815
@ The figures in 2014-15 mentioned in this reply are figures as at 31 March 2015; the figures in 2015-16 are figures as at 29 February 2016.
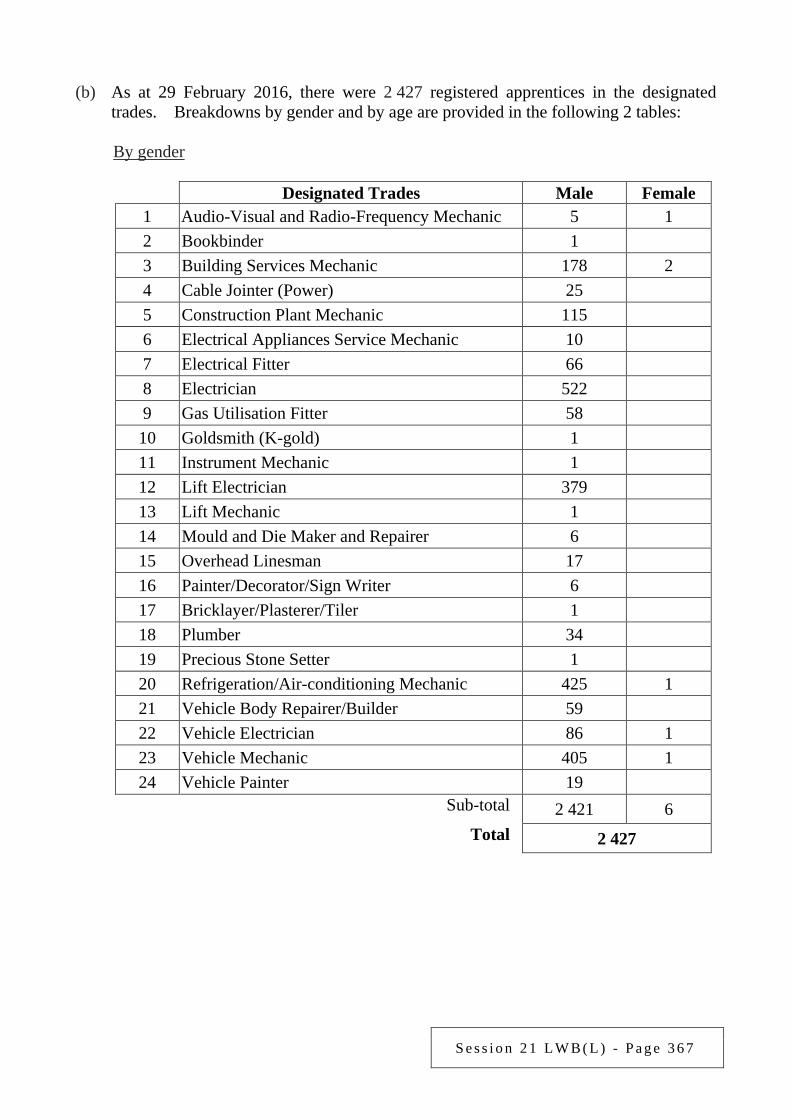
S e s s i o n 2 1 L W B ( L ) - P a g e 3 6 7
(b) As at 29 February 2016, there were 2 427 registered apprentices in the designated
trades. Breakdowns by gender and by age are provided in the following 2 tables:
By gender
Designated Trades Male Female 1 Audio-Visual and Radio-Frequency Mechanic 5 1 2 Bookbinder 1 3 Building Services Mechanic 178 2 4 Cable Jointer (Power) 25 5 Construction Plant Mechanic 115 6 Electrical Appliances Service Mechanic 10 7 Electrical Fitter 66 8 Electrician 522 9 Gas Utilisation Fitter 58 10 Goldsmith (K-gold) 1 11 Instrument Mechanic 1 12 Lift Electrician 379 13 Lift Mechanic 1 14 Mould and Die Maker and Repairer 6 15 Overhead Linesman 17 16 Painter/Decorator/Sign Writer 6 17 Bricklayer/Plasterer/Tiler 1 18 Plumber 34 19 Precious Stone Setter 1 20 Refrigeration/Air-conditioning Mechanic 425 1 21 Vehicle Body Repairer/Builder 59 22 Vehicle Electrician 86 1 23 Vehicle Mechanic 405 1 24 Vehicle Painter 19
Sub-total 2 421 6
Total 2 427
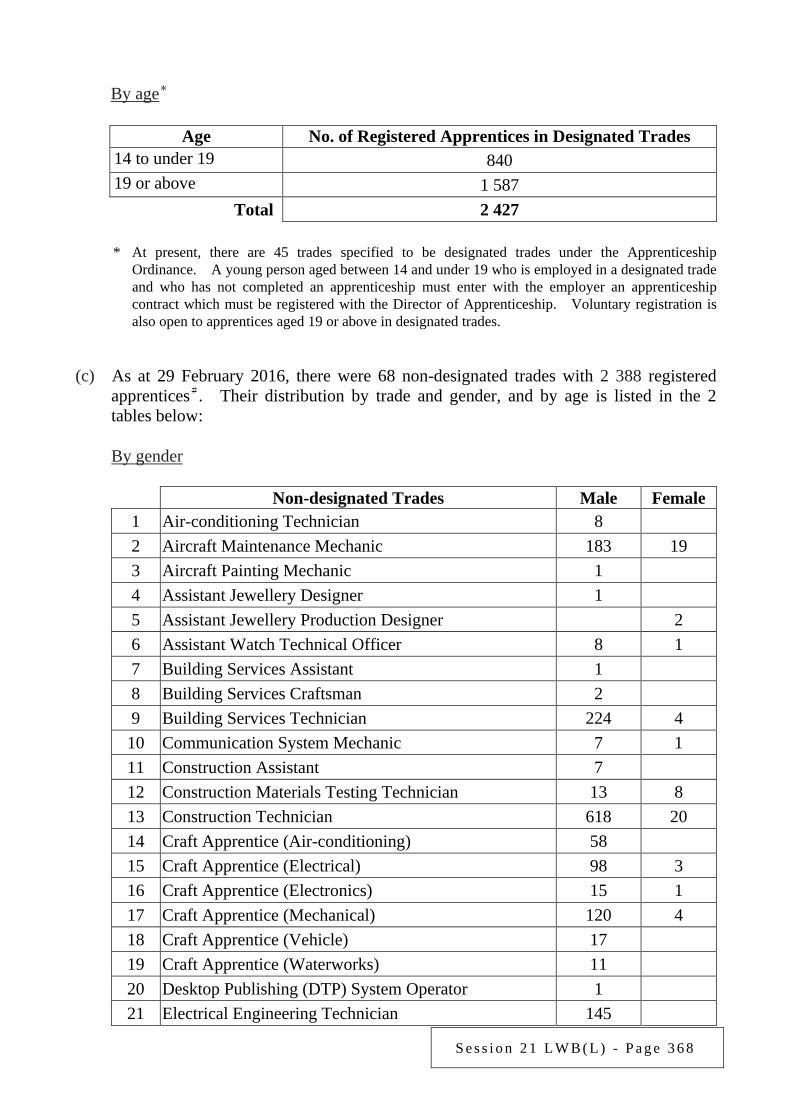
S e s s i o n 2 1 L W B ( L ) - P a g e 3 6 8
By age*
Age No. of Registered Apprentices in Designated Trades 14 to under 19 840 19 or above 1 587
Total 2 427 * At present, there are 45 trades specified to be designated trades under the Apprenticeship
Ordinance. A young person aged between 14 and under 19 who is employed in a designated trade and who has not completed an apprenticeship must enter with the employer an apprenticeship contract which must be registered with the Director of Apprenticeship. Voluntary registration is also open to apprentices aged 19 or above in designated trades.
(c) As at 29 February 2016, there were 68 non-designated trades with 2 388 registered
apprentices#. Their distribution by trade and gender, and by age is listed in the 2 tables below:
By gender
Non-designated Trades Male Female 1 Air-conditioning Technician 8 2 Aircraft Maintenance Mechanic 183 19 3 Aircraft Painting Mechanic 1 4 Assistant Jewellery Designer 1 5 Assistant Jewellery Production Designer 2 6 Assistant Watch Technical Officer 8 1 7 Building Services Assistant 1 8 Building Services Craftsman 2 9 Building Services Technician 224 4 10 Communication System Mechanic 7 1 11 Construction Assistant 7 12 Construction Materials Testing Technician 13 8 13 Construction Technician 618 20 14 Craft Apprentice (Air-conditioning) 58 15 Craft Apprentice (Electrical) 98 3 16 Craft Apprentice (Electronics) 15 1 17 Craft Apprentice (Mechanical) 120 4 18 Craft Apprentice (Vehicle) 17 19 Craft Apprentice (Waterworks) 11 20 Desktop Publishing (DTP) System Operator 1 21 Electrical Engineering Technician 145
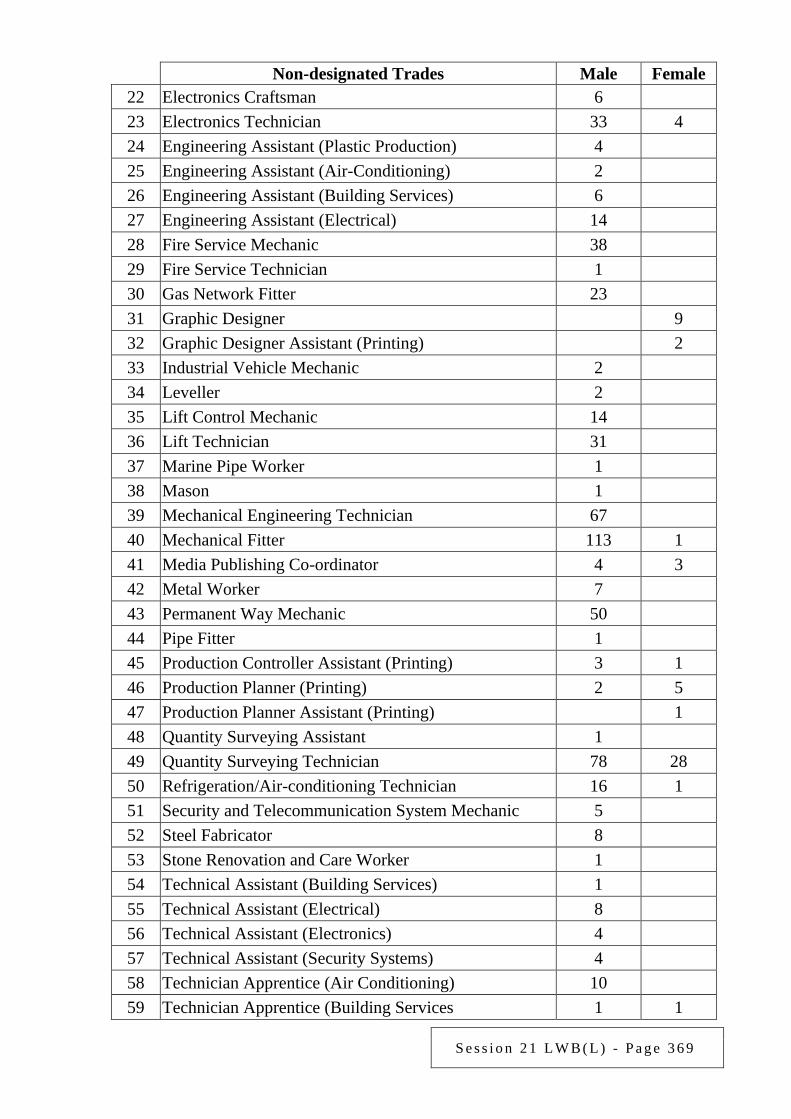
S e s s i o n 2 1 L W B ( L ) - P a g e 3 6 9
Non-designated Trades Male Female 22 Electronics Craftsman 6 23 Electronics Technician 33 4 24 Engineering Assistant (Plastic Production) 4 25 Engineering Assistant (Air-Conditioning) 2 26 Engineering Assistant (Building Services) 6 27 Engineering Assistant (Electrical) 14 28 Fire Service Mechanic 38 29 Fire Service Technician 1 30 Gas Network Fitter 23 31 Graphic Designer 9 32 Graphic Designer Assistant (Printing) 2 33 Industrial Vehicle Mechanic 2 34 Leveller 2 35 Lift Control Mechanic 14 36 Lift Technician 31 37 Marine Pipe Worker 1 38 Mason 1 39 Mechanical Engineering Technician 67 40 Mechanical Fitter 113 1 41 Media Publishing Co-ordinator 4 3 42 Metal Worker 7 43 Permanent Way Mechanic 50 44 Pipe Fitter 1 45 Production Controller Assistant (Printing) 3 1 46 Production Planner (Printing) 2 5 47 Production Planner Assistant (Printing) 1 48 Quantity Surveying Assistant 1 49 Quantity Surveying Technician 78 28 50 Refrigeration/Air-conditioning Technician 16 1 51 Security and Telecommunication System Mechanic 5 52 Steel Fabricator 8 53 Stone Renovation and Care Worker 1 54 Technical Assistant (Building Services) 1 55 Technical Assistant (Electrical) 8 56 Technical Assistant (Electronics) 4 57 Technical Assistant (Security Systems) 4 58 Technician Apprentice (Air Conditioning) 10 59 Technician Apprentice (Building Services 1 1
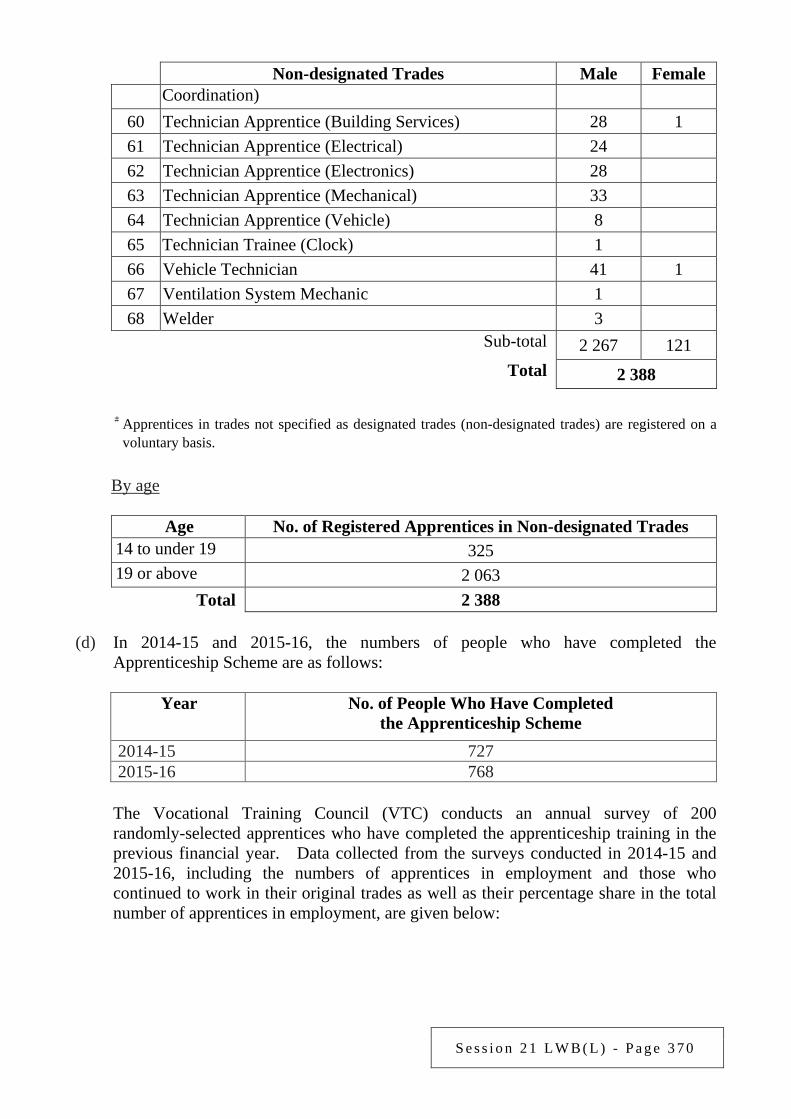
S e s s i o n 2 1 L W B ( L ) - P a g e 3 7 0
Non-designated Trades Male Female Coordination)
60 Technician Apprentice (Building Services) 28 1 61 Technician Apprentice (Electrical) 24 62 Technician Apprentice (Electronics) 28 63 Technician Apprentice (Mechanical) 33 64 Technician Apprentice (Vehicle) 8 65 Technician Trainee (Clock) 1 66 Vehicle Technician 41 1 67 Ventilation System Mechanic 1 68 Welder 3
Sub-total 2 267 121
Total 2 388
# Apprentices in trades not specified as designated trades (non-designated trades) are registered on a voluntary basis.
By age
Age No. of Registered Apprentices in Non-designated Trades
14 to under 19 325 19 or above 2 063
Total 2 388 (d) In 2014-15 and 2015-16, the numbers of people who have completed the
Apprenticeship Scheme are as follows:
Year No. of People Who Have Completed the Apprenticeship Scheme
2014-15 727 2015-16 768
The Vocational Training Council (VTC) conducts an annual survey of 200 randomly-selected apprentices who have completed the apprenticeship training in the previous financial year. Data collected from the surveys conducted in 2014-15 and 2015-16, including the numbers of apprentices in employment and those who continued to work in their original trades as well as their percentage share in the total number of apprentices in employment, are given below:
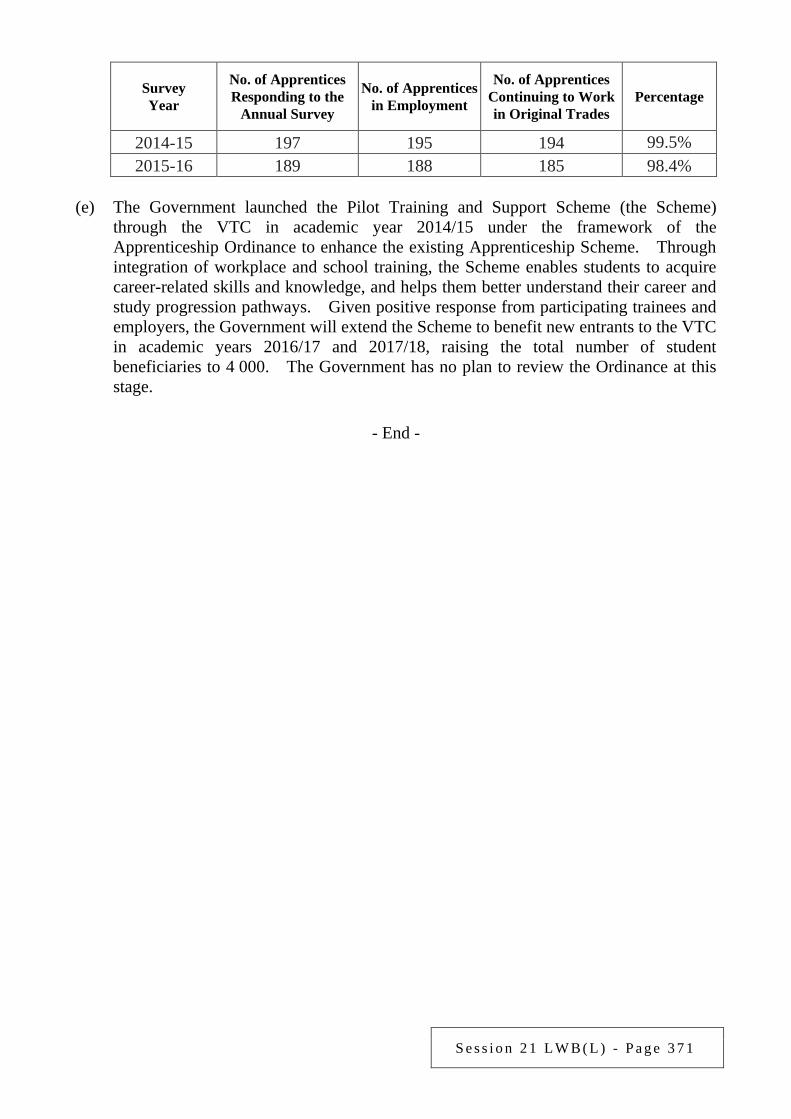
S e s s i o n 2 1 L W B ( L ) - P a g e 3 7 1
Survey Year
No. of Apprentices Responding to the
Annual Survey
No. of Apprentices in Employment
No. of Apprentices Continuing to Work in Original Trades
Percentage
2014-15 197 195 194 99.5%
2015-16 189 188 185 98.4% (e) The Government launched the Pilot Training and Support Scheme (the Scheme)
through the VTC in academic year 2014/15 under the framework of the Apprenticeship Ordinance to enhance the existing Apprenticeship Scheme. Through integration of workplace and school training, the Scheme enables students to acquire career-related skills and knowledge, and helps them better understand their career and study progression pathways. Given positive response from participating trainees and employers, the Government will extend the Scheme to benefit new entrants to the VTC in academic years 2016/17 and 2017/18, raising the total number of student beneficiaries to 4 000. The Government has no plan to review the Ordinance at this stage.
- End -
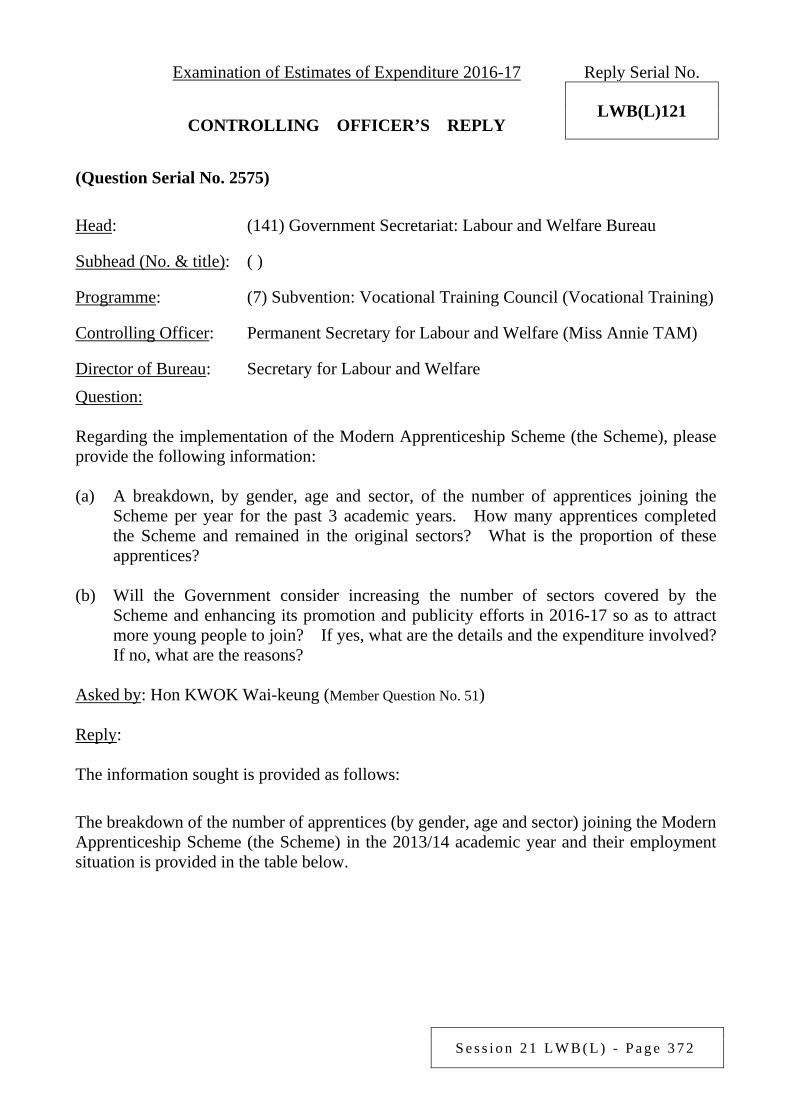
S e s s i o n 2 1 L W B ( L ) - P a g e 3 7 2
Examination of Estimates of Expenditure 2016-17 Reply Serial No.
LWB(L)121 CONTROLLING OFFICER’S REPLY (Question Serial No. 2575)
Head: (141) Government Secretariat: Labour and Welfare Bureau
Subhead (No. & title): ( )
Programme: (7) Subvention: Vocational Training Council (Vocational Training)
Controlling Officer: Permanent Secretary for Labour and Welfare (Miss Annie TAM)
Director of Bureau: Secretary for Labour and Welfare Question: Regarding the implementation of the Modern Apprenticeship Scheme (the Scheme), please provide the following information: (a) A breakdown, by gender, age and sector, of the number of apprentices joining the
Scheme per year for the past 3 academic years. How many apprentices completed the Scheme and remained in the original sectors? What is the proportion of these apprentices?
(b) Will the Government consider increasing the number of sectors covered by the Scheme and enhancing its promotion and publicity efforts in 2016-17 so as to attract more young people to join? If yes, what are the details and the expenditure involved? If no, what are the reasons?
Asked by: Hon KWOK Wai-keung (Member Question No. 51) Reply: The information sought is provided as follows: The breakdown of the number of apprentices (by gender, age and sector) joining the Modern Apprenticeship Scheme (the Scheme) in the 2013/14 academic year and their employment situation is provided in the table below.
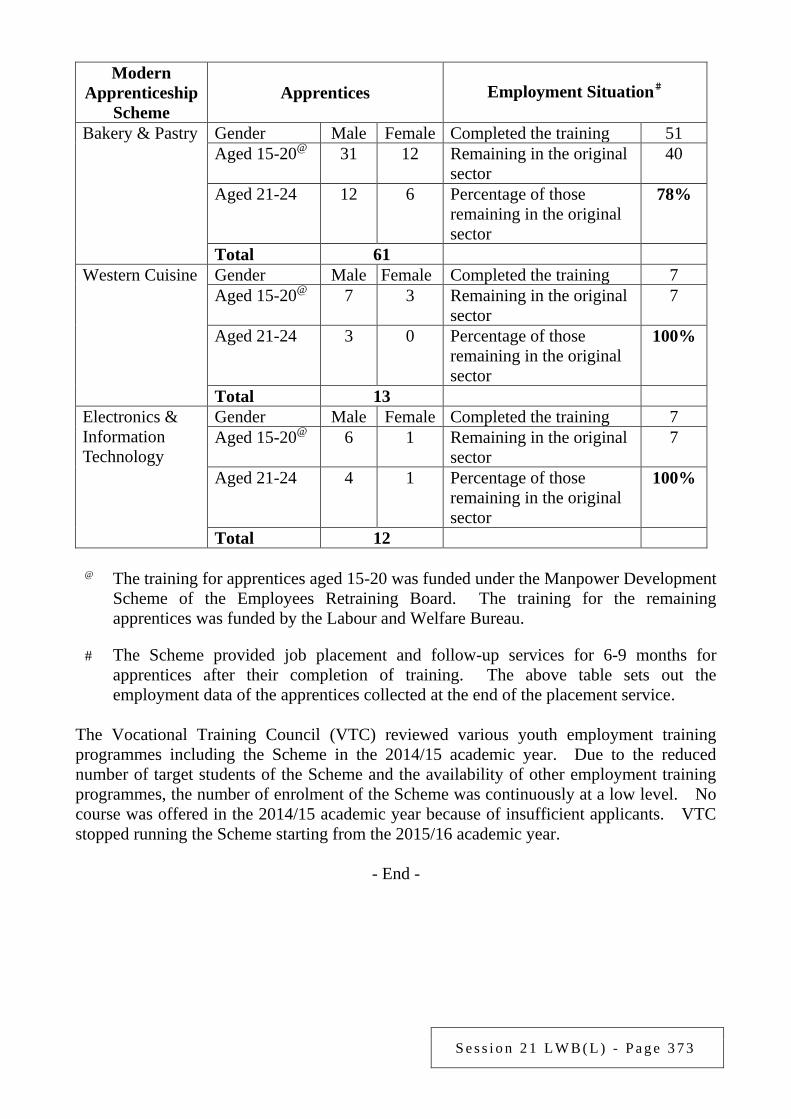
S e s s i o n 2 1 L W B ( L ) - P a g e 3 7 3
Modern Apprenticeship
Scheme Apprentices Employment Situation#
Bakery & Pastry Gender Male Female Completed the training 51 Aged 15-20@ 31 12 Remaining in the original
sector 40
Aged 21-24 12 6 Percentage of those remaining in the original sector
78%
Total 61 Western Cuisine Gender Male Female Completed the training 7
Aged 15-20@ 7 3 Remaining in the original sector
7
Aged 21-24 3 0 Percentage of those remaining in the original sector
100%
Total 13 Electronics & Information Technology
Gender Male Female Completed the training 7 Aged 15-20@ 6 1 Remaining in the original
sector 7
Aged 21-24 4 1 Percentage of those remaining in the original sector
100%
Total 12
@ The training for apprentices aged 15-20 was funded under the Manpower Development Scheme of the Employees Retraining Board. The training for the remaining apprentices was funded by the Labour and Welfare Bureau.
# The Scheme provided job placement and follow-up services for 6-9 months for
apprentices after their completion of training. The above table sets out the employment data of the apprentices collected at the end of the placement service.
The Vocational Training Council (VTC) reviewed various youth employment training programmes including the Scheme in the 2014/15 academic year. Due to the reduced number of target students of the Scheme and the availability of other employment training programmes, the number of enrolment of the Scheme was continuously at a low level. No course was offered in the 2014/15 academic year because of insufficient applicants. VTC stopped running the Scheme starting from the 2015/16 academic year.
- End -
S e s s i o n 2 1 L W B ( L ) - P a g e 3 7 4
Examination of Estimates of Expenditure 2016-17 Reply Serial No.
LWB(L)122 CONTROLLING OFFICER’S REPLY (Question Serial No. 2271)
Head: (141) Government Secretariat: Labour and Welfare Bureau
Subhead (No. & title): ( )
Programme: (4) Manpower Development
Controlling Officer: Permanent Secretary for Labour and Welfare (Miss Annie TAM)
Director of Bureau: Secretary for Labour and Welfare Question: It is mentioned in the Matters Requiring Special Attention in 2016-17 that operation of the Continuing Education Fund will be monitored. (1) Will the Government inform this Committee of the number of staff deployed by the
Office of the Continuing Education Fund in 2015-16 for conducting surprise inspections, the number of surprise inspections conducted, the course providers inspected and the expenditure on manpower incurred for the year?
(2) On verification of students’ attendance records, course assessment results and applications for course fee reimbursement, how many cases were found to be in breach of the conditions of approval, such as improper marketing behaviour? In respect of the course providers implicated, what are the types of courses offered, the sum involved and the number of students affected? How many of their courses were cancelled? How many cases required formal investigation by law enforcement agencies?
Asked by: Hon Martin LIAO Cheung-kong (Member Question No. 48) Reply: The information sought is provided as follows: (1) Information concerning the surprise inspections of course providers conducted by the
Office of the Continuing Education Fund (OCEF) in 2015-16 (as at 31 January 2016), including the number of staff deployed, the number of inspections conducted, the number of course providers involved and the manpower expenditure incurred, is provided below –
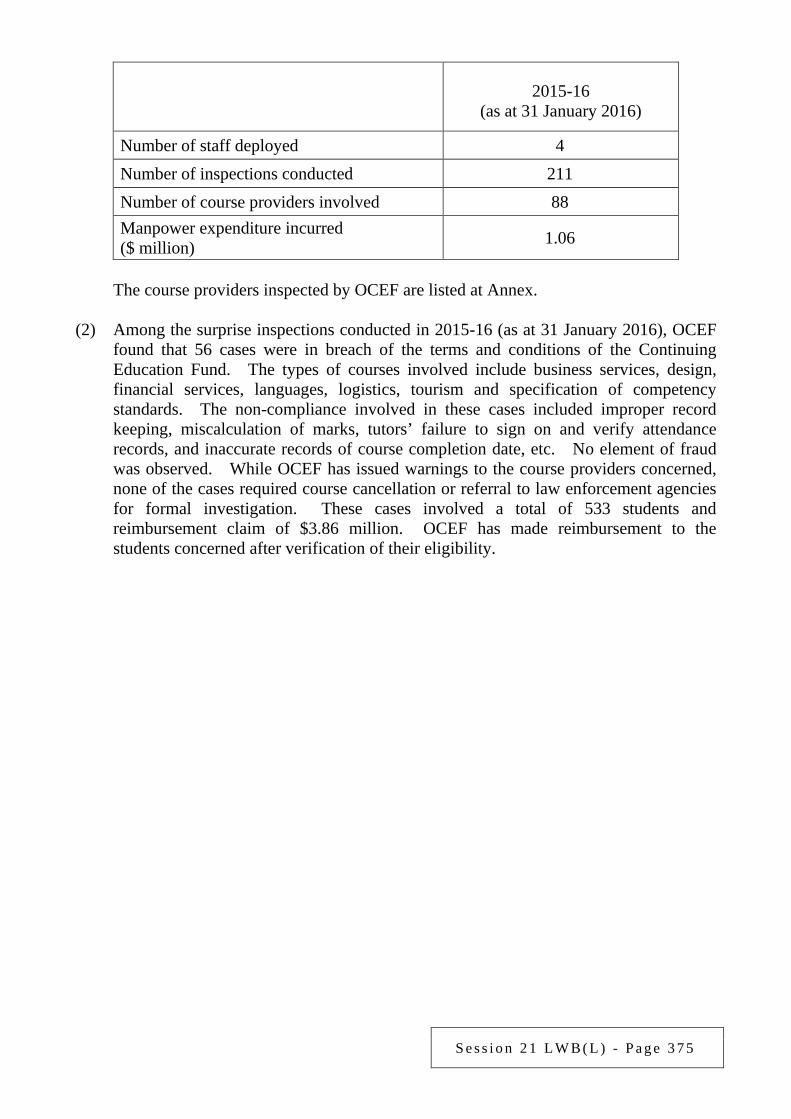
S e s s i o n 2 1 L W B ( L ) - P a g e 3 7 5
2015-16 (as at 31 January 2016)
Number of staff deployed 4 Number of inspections conducted 211 Number of course providers involved 88 Manpower expenditure incurred ($ million) 1.06
The course providers inspected by OCEF are listed at Annex. (2) Among the surprise inspections conducted in 2015-16 (as at 31 January 2016), OCEF
found that 56 cases were in breach of the terms and conditions of the Continuing Education Fund. The types of courses involved include business services, design, financial services, languages, logistics, tourism and specification of competency standards. The non-compliance involved in these cases included improper record keeping, miscalculation of marks, tutors’ failure to sign on and verify attendance records, and inaccurate records of course completion date, etc. No element of fraud was observed. While OCEF has issued warnings to the course providers concerned, none of the cases required course cancellation or referral to law enforcement agencies for formal investigation. These cases involved a total of 533 students and reimbursement claim of $3.86 million. OCEF has made reimbursement to the students concerned after verification of their eligibility.
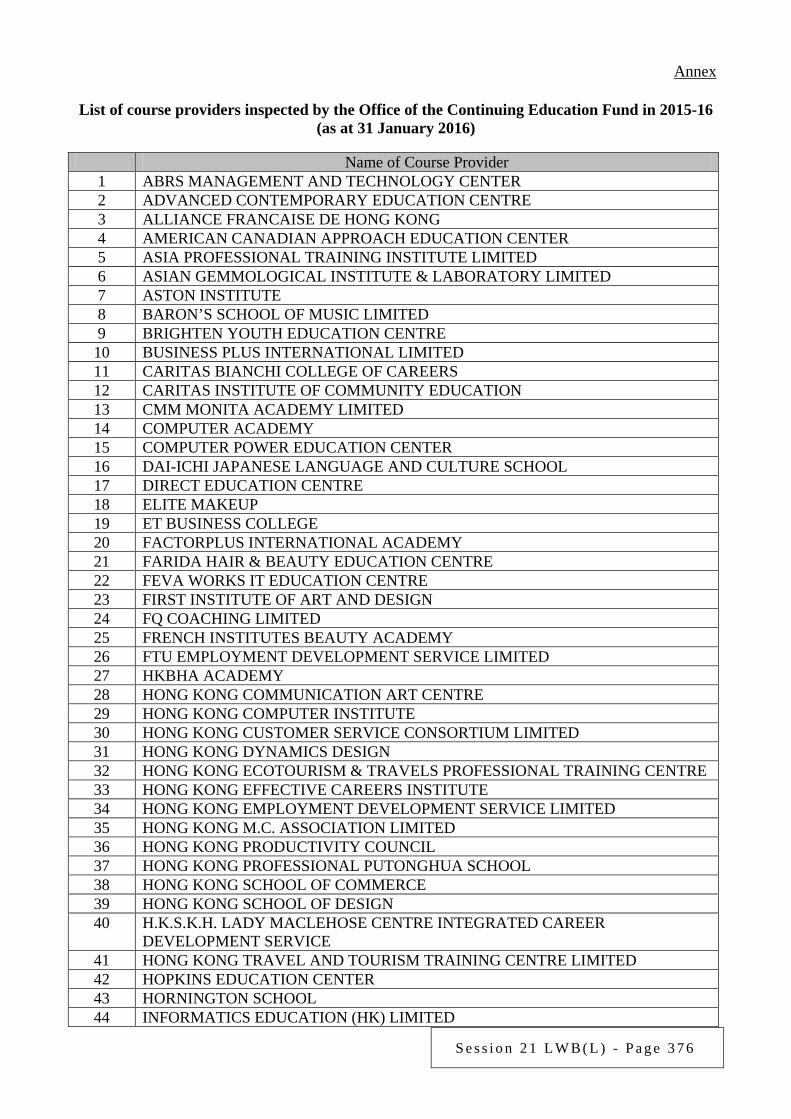
S e s s i o n 2 1 L W B ( L ) - P a g e 3 7 6
Annex
List of course providers inspected by the Office of the Continuing Education Fund in 2015-16 (as at 31 January 2016)
Name of Course Provider 1 ABRS MANAGEMENT AND TECHNOLOGY CENTER 2 ADVANCED CONTEMPORARY EDUCATION CENTRE 3 ALLIANCE FRANCAISE DE HONG KONG 4 AMERICAN CANADIAN APPROACH EDUCATION CENTER 5 ASIA PROFESSIONAL TRAINING INSTITUTE LIMITED 6 ASIAN GEMMOLOGICAL INSTITUTE & LABORATORY LIMITED 7 ASTON INSTITUTE 8 BARON’S SCHOOL OF MUSIC LIMITED 9 BRIGHTEN YOUTH EDUCATION CENTRE 10 BUSINESS PLUS INTERNATIONAL LIMITED 11 CARITAS BIANCHI COLLEGE OF CAREERS 12 CARITAS INSTITUTE OF COMMUNITY EDUCATION 13 CMM MONITA ACADEMY LIMITED 14 COMPUTER ACADEMY 15 COMPUTER POWER EDUCATION CENTER 16 DAI-ICHI JAPANESE LANGUAGE AND CULTURE SCHOOL 17 DIRECT EDUCATION CENTRE 18 ELITE MAKEUP 19 ET BUSINESS COLLEGE 20 FACTORPLUS INTERNATIONAL ACADEMY 21 FARIDA HAIR & BEAUTY EDUCATION CENTRE 22 FEVA WORKS IT EDUCATION CENTRE 23 FIRST INSTITUTE OF ART AND DESIGN 24 FQ COACHING LIMITED 25 FRENCH INSTITUTES BEAUTY ACADEMY 26 FTU EMPLOYMENT DEVELOPMENT SERVICE LIMITED 27 HKBHA ACADEMY 28 HONG KONG COMMUNICATION ART CENTRE 29 HONG KONG COMPUTER INSTITUTE 30 HONG KONG CUSTOMER SERVICE CONSORTIUM LIMITED 31 HONG KONG DYNAMICS DESIGN 32 HONG KONG ECOTOURISM & TRAVELS PROFESSIONAL TRAINING CENTRE 33 HONG KONG EFFECTIVE CAREERS INSTITUTE 34 HONG KONG EMPLOYMENT DEVELOPMENT SERVICE LIMITED 35 HONG KONG M.C. ASSOCIATION LIMITED 36 HONG KONG PRODUCTIVITY COUNCIL 37 HONG KONG PROFESSIONAL PUTONGHUA SCHOOL 38 HONG KONG SCHOOL OF COMMERCE 39 HONG KONG SCHOOL OF DESIGN 40 H.K.S.K.H. LADY MACLEHOSE CENTRE INTEGRATED CAREER
DEVELOPMENT SERVICE 41 HONG KONG TRAVEL AND TOURISM TRAINING CENTRE LIMITED 42 HOPKINS EDUCATION CENTER 43 HORNINGTON SCHOOL 44 INFORMATICS EDUCATION (HK) LIMITED
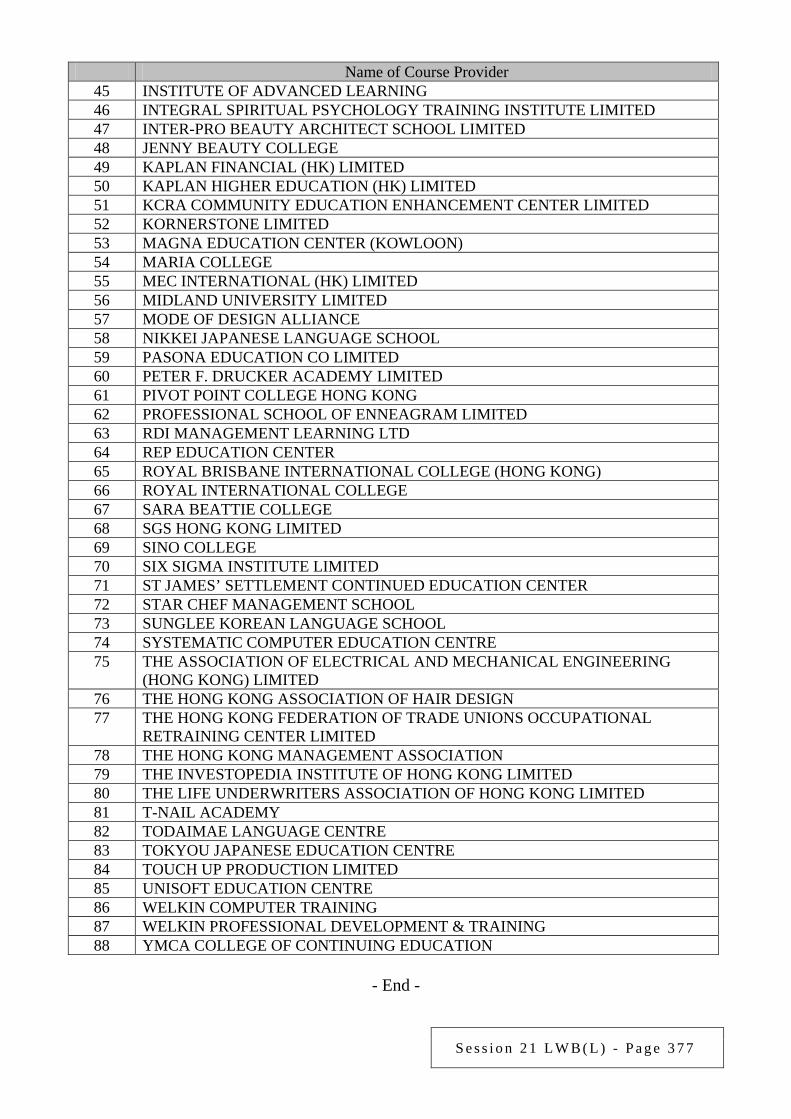
S e s s i o n 2 1 L W B ( L ) - P a g e 3 7 7
Name of Course Provider 45 INSTITUTE OF ADVANCED LEARNING 46 INTEGRAL SPIRITUAL PSYCHOLOGY TRAINING INSTITUTE LIMITED 47 INTER-PRO BEAUTY ARCHITECT SCHOOL LIMITED 48 JENNY BEAUTY COLLEGE 49 KAPLAN FINANCIAL (HK) LIMITED 50 KAPLAN HIGHER EDUCATION (HK) LIMITED 51 KCRA COMMUNITY EDUCATION ENHANCEMENT CENTER LIMITED 52 KORNERSTONE LIMITED 53 MAGNA EDUCATION CENTER (KOWLOON) 54 MARIA COLLEGE 55 MEC INTERNATIONAL (HK) LIMITED 56 MIDLAND UNIVERSITY LIMITED 57 MODE OF DESIGN ALLIANCE 58 NIKKEI JAPANESE LANGUAGE SCHOOL 59 PASONA EDUCATION CO LIMITED 60 PETER F. DRUCKER ACADEMY LIMITED 61 PIVOT POINT COLLEGE HONG KONG 62 PROFESSIONAL SCHOOL OF ENNEAGRAM LIMITED 63 RDI MANAGEMENT LEARNING LTD 64 REP EDUCATION CENTER 65 ROYAL BRISBANE INTERNATIONAL COLLEGE (HONG KONG) 66 ROYAL INTERNATIONAL COLLEGE 67 SARA BEATTIE COLLEGE 68 SGS HONG KONG LIMITED 69 SINO COLLEGE 70 SIX SIGMA INSTITUTE LIMITED 71 ST JAMES’ SETTLEMENT CONTINUED EDUCATION CENTER 72 STAR CHEF MANAGEMENT SCHOOL 73 SUNGLEE KOREAN LANGUAGE SCHOOL 74 SYSTEMATIC COMPUTER EDUCATION CENTRE 75 THE ASSOCIATION OF ELECTRICAL AND MECHANICAL ENGINEERING
(HONG KONG) LIMITED 76 THE HONG KONG ASSOCIATION OF HAIR DESIGN 77 THE HONG KONG FEDERATION OF TRADE UNIONS OCCUPATIONAL
RETRAINING CENTER LIMITED 78 THE HONG KONG MANAGEMENT ASSOCIATION 79 THE INVESTOPEDIA INSTITUTE OF HONG KONG LIMITED 80 THE LIFE UNDERWRITERS ASSOCIATION OF HONG KONG LIMITED 81 T-NAIL ACADEMY 82 TODAIMAE LANGUAGE CENTRE 83 TOKYOU JAPANESE EDUCATION CENTRE 84 TOUCH UP PRODUCTION LIMITED 85 UNISOFT EDUCATION CENTRE 86 WELKIN COMPUTER TRAINING 87 WELKIN PROFESSIONAL DEVELOPMENT & TRAINING 88 YMCA COLLEGE OF CONTINUING EDUCATION
- End -

S e s s i o n 2 1 L W B ( L ) - P a g e 3 7 8
Examination of Estimates of Expenditure 2016-17 Reply Serial No.
LWB(L)123 CONTROLLING OFFICER’S REPLY (Question Serial No. 0343)
Head: (141) Government Secretariat: Labour and Welfare Bureau
Subhead (No. & title): ()
Programme: (4) Manpower Development
Controlling Officer: Permanent Secretary for Labour and Welfare (Miss Annie TAM)
Director of Bureau: Secretary for Labour and Welfare Question: The Financial Secretary said that a pilot scheme would be implemented to provide tuition fee subsidy for three cohorts of students admitted to designated professional part-time programmes offered by the Vocational Training Council starting from the next academic year, and that programmes in the disciplines of construction, engineering and technology would be covered. In this connection, in order to encourage continuing education, will the Government also review the application conditions of the Continuing Education Fund, including raising the reimbursement ceiling from HK$10,000 to, say, HK$25,000, and adding courses in professional disciplines such as engineering and technology to the Reimbursable Course List? If yes, the details; if not, the reasons. Asked by: Ir Dr Hon LO Wai-kwok (Member Question No. 3) Reply: The Government will conduct a review on the Continuing Education Fund in 2016-17 to cater for the needs of the community. The scope of the review will include the amount and coverage of subsidies, and its application and reimbursement procedures.
- End -
S e s s i o n 2 1 L W B ( L ) - P a g e 3 7 9
Examination of Estimates of Expenditure 2016-17 Reply Serial No.
LWB(L)124 CONTROLLING OFFICER’S REPLY (Question Serial No. 1718)
Head: (141) Government Secretariat: Labour and Welfare Bureau
Subhead (No. & title): ( )
Programme: (7) Subvention: Vocational Training Council (Vocational Training)
Controlling Officer: Permanent Secretary for Labour and Welfare (Miss Annie TAM)
Director of Bureau: Secretary for Labour and Welfare Question: The estimated subvention to the Vocational Training Council (Vocational Training) for 2016-17 is 1.3% less than the original estimate for 2015-16. Regarding the reduction in estimate, please list the areas involved and the reasons. Asked by: Hon POON Siu-ping (Member Question No. 18) Reply: The estimated subvention to the Vocational Training Council (Vocational Training) for 2016-17 is 1.3% less than the original estimate for 2015-16 mainly due to the reduced number of planned training places under the traineeship scheme for the service industries in 2016-17.
- End -

S e s s i o n 2 1 L W B ( L ) - P a g e 3 8 0
Examination of Estimates of Expenditure 2016-17 Reply Serial No.
LWB(L)125 CONTROLLING OFFICER’S REPLY (Question Serial No. 3214)
Head: (141) Government Secretariat: Labour and Welfare Bureau
Subhead (No. & title): ( )
Programme: (4) Manpower Development
Controlling Officer: Permanent Secretary for Labour and Welfare (Miss Annie TAM)
Director of Bureau: Secretary for Labour and Welfare Question: Regarding the operation of the Continuing Education Fund (CEF), would the Government provide this Committee with the following information? (a) Details on the number of CEF beneficiaries and amount of subsidies in the past 2
years, with a breakdown by age group, academic qualification to be awarded and course domain.
(b) The measures and expenditure pertaining to the publicity and promotion of CEF in the
past 2 years; and the estimated expenditure for 2016-17. (c) Whether an increase of CEF subsidy ceiling will be considered; if yes, the details; if
not; the reasons. Asked by: Hon Michael TIEN Puk-sun (Member Question No. 51) Reply: The information sought is provided as follows: (a) A detailed breakdown of the number of beneficiaries of the Continuing Education
Fund (CEF) and the amount of subsidies disbursed in the past 2 years by age group, academic qualification to be awarded and course domain is provided at Annex.
(b) The Government encourages members of the public to apply for CEF through various
publicity channels, such as the website of the Office of the Continuing Education Fund and CEF course providers. The expenditure pertaining to the publicity and promotion of CEF in 2014-15 and 2015-16 (as at 31 January 2016) was $120,000 and $210,000 respectively. The estimated expenditure for 2016-17 is $150,000.

S e s s i o n 2 1 L W B ( L ) - P a g e 3 8 1
(c) At present, each CEF applicant may apply for reimbursement of 80% of the tuition fees for any reimbursable courses under CEF upon successful completion of the course, subject to a maximum sum of $10,000. The tuition fees for most of the reimbursable courses under CEF are at or below $10,000.
The Government will conduct a review on CEF in 2016-17 to cater for the needs of the
community. The scope of the review will include the amount and coverage of subsidies, and its application and reimbursement procedures.
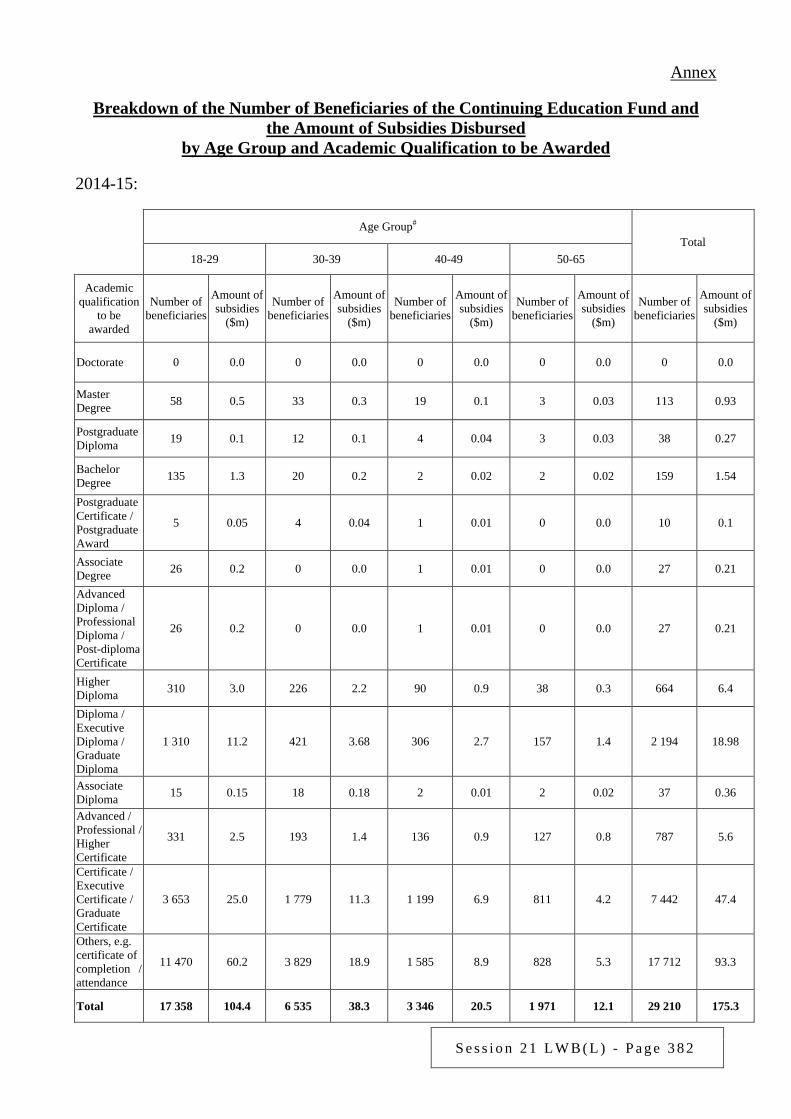
S e s s i o n 2 1 L W B ( L ) - P a g e 3 8 2
Annex
Breakdown of the Number of Beneficiaries of the Continuing Education Fund and the Amount of Subsidies Disbursed
by Age Group and Academic Qualification to be Awarded
2014-15:
Age Group# Total
18-29 30-39 40-49 50-65
Academic qualification
to be awarded
Number of beneficiaries
Amount of subsidies
($m)
Number of beneficiaries
Amount of subsidies
($m)
Number of beneficiaries
Amount of subsidies
($m)
Number of beneficiaries
Amount of subsidies
($m)
Number of beneficiaries
Amount of subsidies
($m)
Doctorate 0 0.0 0 0.0 0 0.0 0 0.0 0 0.0
Master Degree
58 0.5 33 0.3 19 0.1 3 0.03 113 0.93
Postgraduate Diploma
19 0.1 12 0.1 4 0.04 3 0.03 38 0.27
Bachelor Degree
135 1.3 20 0.2 2 0.02 2 0.02 159 1.54
Postgraduate Certificate / Postgraduate Award
5 0.05 4 0.04 1 0.01 0 0.0 10 0.1
Associate Degree
26 0.2 0 0.0 1 0.01 0 0.0 27 0.21
Advanced Diploma / Professional Diploma / Post-diploma Certificate
26 0.2 0 0.0 1 0.01 0 0.0 27 0.21
Higher Diploma
310 3.0 226 2.2 90 0.9 38 0.3 664 6.4
Diploma / Executive Diploma / Graduate Diploma
1 310 11.2 421 3.68 306 2.7 157 1.4 2 194 18.98
Associate Diploma 15 0.15 18 0.18 2 0.01 2 0.02 37 0.36
Advanced / Professional / Higher Certificate
331 2.5 193 1.4 136 0.9 127 0.8 787 5.6
Certificate / Executive Certificate / Graduate Certificate
3 653 25.0 1 779 11.3 1 199 6.9 811 4.2 7 442 47.4
Others, e.g. certificate of completion / attendance
11 470 60.2 3 829 18.9 1 585 8.9 828 5.3 17 712 93.3
Total 17 358 104.4 6 535 38.3 3 346 20.5 1 971 12.1 29 210 175.3
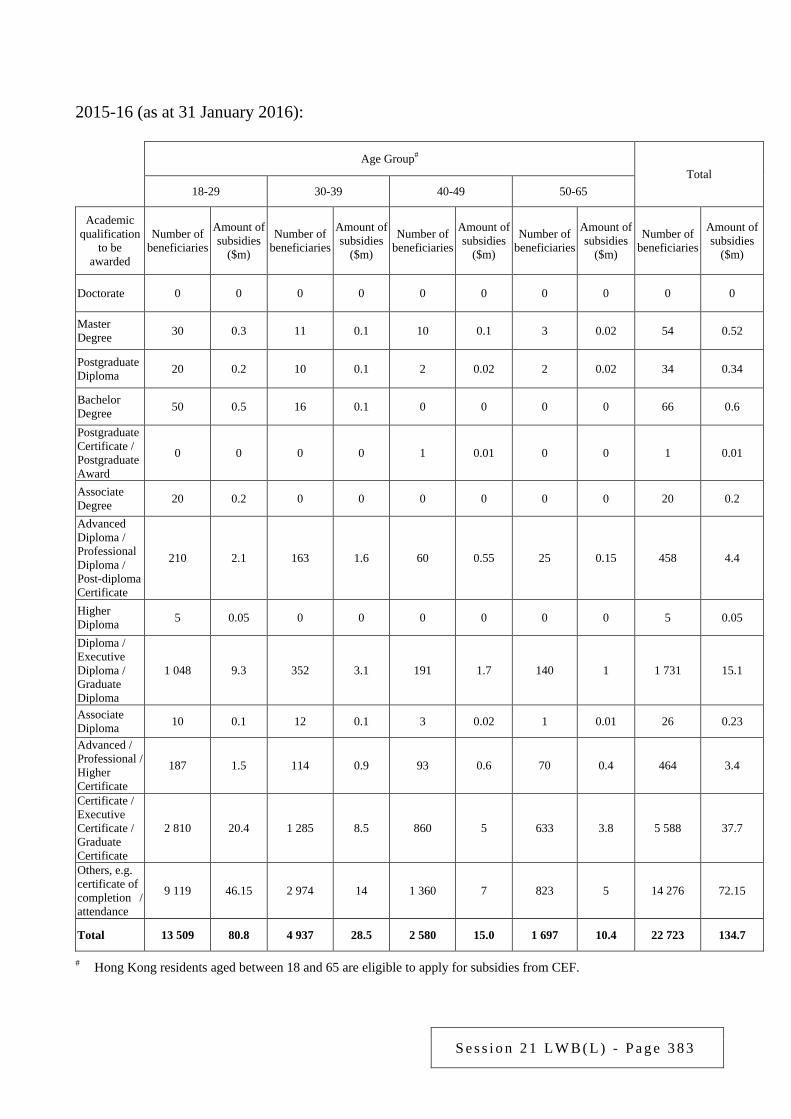
S e s s i o n 2 1 L W B ( L ) - P a g e 3 8 3
2015-16 (as at 31 January 2016):
Age Group# Total
18-29 30-39 40-49 50-65
Academic qualification
to be awarded
Number of beneficiaries
Amount of subsidies
($m)
Number of beneficiaries
Amount of subsidies
($m)
Number of beneficiaries
Amount of subsidies
($m)
Number of beneficiaries
Amount of subsidies
($m)
Number of beneficiaries
Amount of subsidies
($m)
Doctorate 0 0 0 0 0 0 0 0 0 0
Master Degree
30 0.3 11 0.1 10 0.1 3 0.02 54 0.52
Postgraduate Diploma
20 0.2 10 0.1 2 0.02 2 0.02 34 0.34
Bachelor Degree
50 0.5 16 0.1 0 0 0 0 66 0.6
Postgraduate Certificate / Postgraduate Award
0 0 0 0 1 0.01 0 0 1 0.01
Associate Degree
20 0.2 0 0 0 0 0 0 20 0.2
Advanced Diploma / Professional Diploma / Post-diploma Certificate
210 2.1 163 1.6 60 0.55 25 0.15 458 4.4
Higher Diploma
5 0.05 0 0 0 0 0 0 5 0.05
Diploma / Executive Diploma / Graduate Diploma
1 048 9.3 352 3.1 191 1.7 140 1 1 731 15.1
Associate Diploma 10 0.1 12 0.1 3 0.02 1 0.01 26 0.23
Advanced / Professional / Higher Certificate
187 1.5 114 0.9 93 0.6 70 0.4 464 3.4
Certificate / Executive Certificate / Graduate Certificate
2 810 20.4 1 285 8.5 860 5 633 3.8 5 588 37.7
Others, e.g. certificate of completion / attendance
9 119 46.15 2 974 14 1 360 7 823 5 14 276 72.15
Total 13 509 80.8 4 937 28.5 2 580 15.0 1 697 10.4 22 723 134.7
# Hong Kong residents aged between 18 and 65 are eligible to apply for subsidies from CEF.
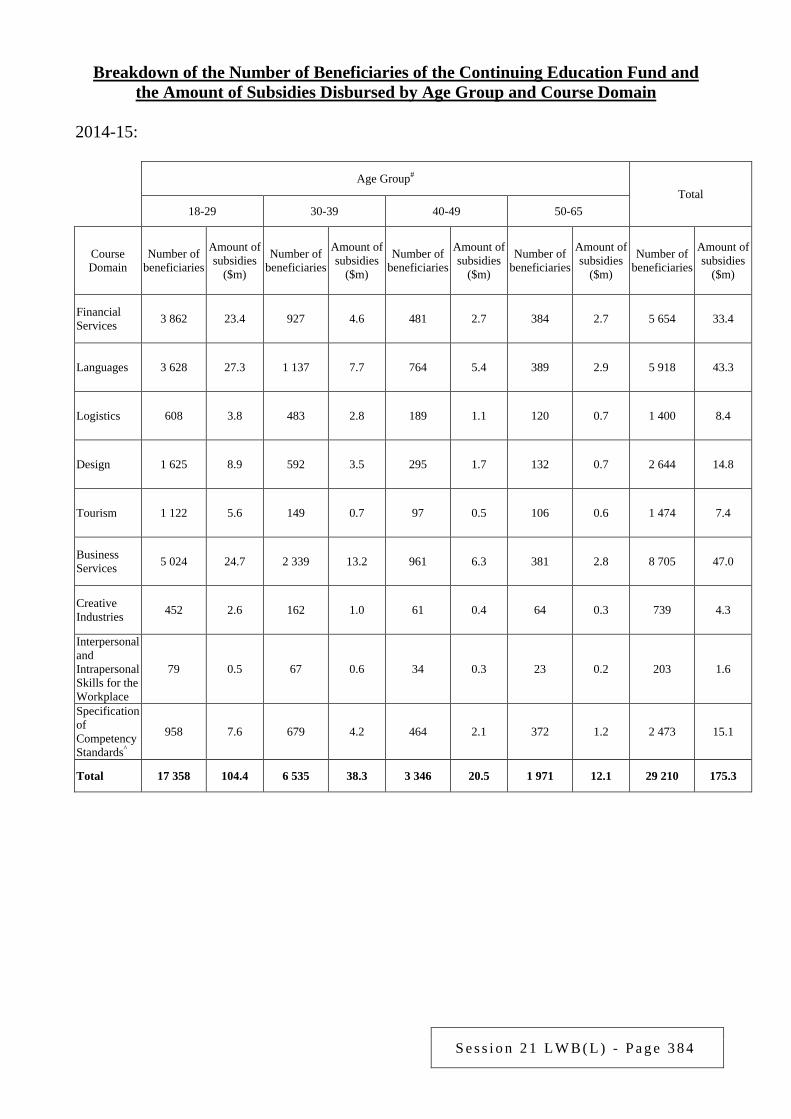
S e s s i o n 2 1 L W B ( L ) - P a g e 3 8 4
Breakdown of the Number of Beneficiaries of the Continuing Education Fund and the Amount of Subsidies Disbursed by Age Group and Course Domain
2014-15:
Age Group#
Total 18-29 30-39 40-49 50-65
Course Domain
Number of beneficiaries
Amount of subsidies
($m)
Number of beneficiaries
Amount of subsidies
($m)
Number of beneficiaries
Amount of subsidies
($m)
Number of beneficiaries
Amount of subsidies
($m)
Number of beneficiaries
Amount of subsidies
($m)
Financial Services 3 862 23.4 927 4.6 481 2.7 384 2.7 5 654 33.4
Languages 3 628 27.3 1 137 7.7 764 5.4 389 2.9 5 918 43.3
Logistics 608 3.8 483 2.8 189 1.1 120 0.7 1 400 8.4
Design 1 625 8.9 592 3.5 295 1.7 132 0.7 2 644 14.8
Tourism 1 122 5.6 149 0.7 97 0.5 106 0.6 1 474 7.4
Business Services 5 024 24.7 2 339 13.2 961 6.3 381 2.8 8 705 47.0
Creative Industries 452 2.6 162 1.0 61 0.4 64 0.3 739 4.3
Interpersonal and Intrapersonal Skills for the Workplace
79 0.5 67 0.6 34 0.3 23 0.2 203 1.6
Specification of Competency Standards^
958 7.6 679 4.2 464 2.1 372 1.2 2 473 15.1
Total 17 358 104.4 6 535 38.3 3 346 20.5 1 971 12.1 29 210 175.3
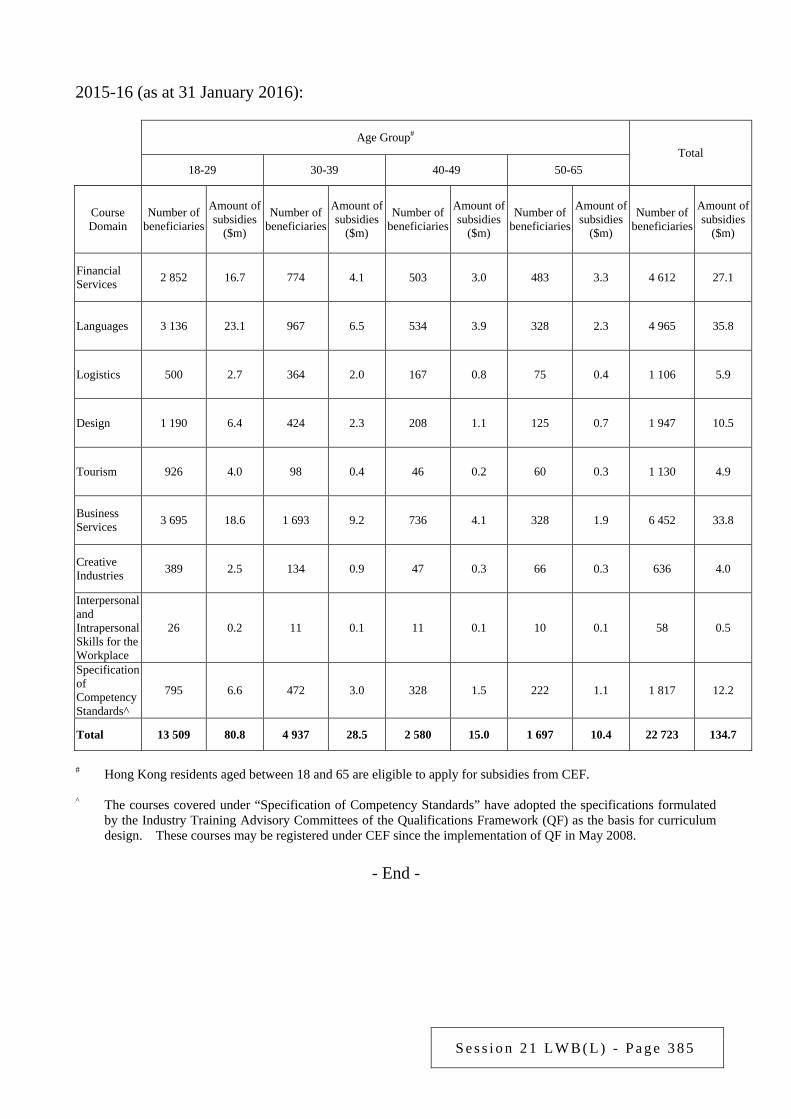
S e s s i o n 2 1 L W B ( L ) - P a g e 3 8 5
2015-16 (as at 31 January 2016):
Age Group# Total
18-29 30-39 40-49 50-65
Course Domain
Number of beneficiaries
Amount of subsidies
($m)
Number of beneficiaries
Amount of subsidies
($m)
Number of beneficiaries
Amount of subsidies
($m)
Number of beneficiaries
Amount of subsidies
($m)
Number of beneficiaries
Amount of subsidies
($m)
Financial Services 2 852 16.7 774 4.1 503 3.0 483 3.3 4 612 27.1
Languages 3 136 23.1 967 6.5 534 3.9 328 2.3 4 965 35.8
Logistics 500 2.7 364 2.0 167 0.8 75 0.4 1 106 5.9
Design 1 190 6.4 424 2.3 208 1.1 125 0.7 1 947 10.5
Tourism 926 4.0 98 0.4 46 0.2 60 0.3 1 130 4.9
Business Services 3 695 18.6 1 693 9.2 736 4.1 328 1.9 6 452 33.8
Creative Industries 389 2.5 134 0.9 47 0.3 66 0.3 636 4.0
Interpersonal and Intrapersonal Skills for the Workplace
26 0.2 11 0.1 11 0.1 10 0.1 58 0.5
Specification of Competency Standards^
795 6.6 472 3.0 328 1.5 222 1.1 1 817 12.2
Total 13 509 80.8 4 937 28.5 2 580 15.0 1 697 10.4 22 723 134.7
# Hong Kong residents aged between 18 and 65 are eligible to apply for subsidies from CEF. ^ The courses covered under “Specification of Competency Standards” have adopted the specifications formulated
by the Industry Training Advisory Committees of the Qualifications Framework (QF) as the basis for curriculum design. These courses may be registered under CEF since the implementation of QF in May 2008.
- End -
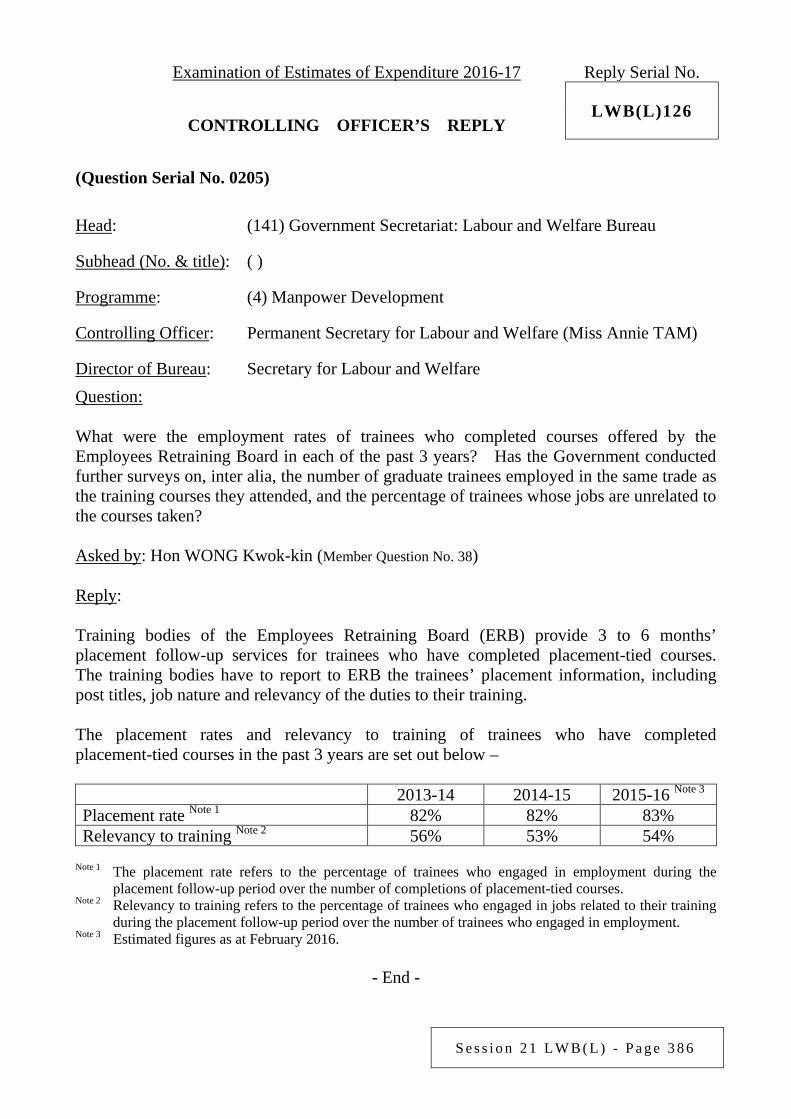
S e s s i o n 2 1 L W B ( L ) - P a g e 3 8 6
Examination of Estimates of Expenditure 2016-17 Reply Serial No.
LWB(L)126 CONTROLLING OFFICER’S REPLY (Question Serial No. 0205)
Head: (141) Government Secretariat: Labour and Welfare Bureau
Subhead (No. & title): ( )
Programme: (4) Manpower Development
Controlling Officer: Permanent Secretary for Labour and Welfare (Miss Annie TAM)
Director of Bureau: Secretary for Labour and Welfare Question: What were the employment rates of trainees who completed courses offered by the Employees Retraining Board in each of the past 3 years? Has the Government conducted further surveys on, inter alia, the number of graduate trainees employed in the same trade as the training courses they attended, and the percentage of trainees whose jobs are unrelated to the courses taken? Asked by: Hon WONG Kwok-kin (Member Question No. 38) Reply: Training bodies of the Employees Retraining Board (ERB) provide 3 to 6 months’ placement follow-up services for trainees who have completed placement-tied courses. The training bodies have to report to ERB the trainees’ placement information, including post titles, job nature and relevancy of the duties to their training. The placement rates and relevancy to training of trainees who have completed placement-tied courses in the past 3 years are set out below – 2013-14 2014-15 2015-16 Note 3 Placement rate Note 1 82% 82% 83% Relevancy to training Note 2 56% 53% 54%
Note 1 The placement rate refers to the percentage of trainees who engaged in employment during the placement follow-up period over the number of completions of placement-tied courses.
Note 2 Relevancy to training refers to the percentage of trainees who engaged in jobs related to their training during the placement follow-up period over the number of trainees who engaged in employment.
Note 3 Estimated figures as at February 2016.
- End -
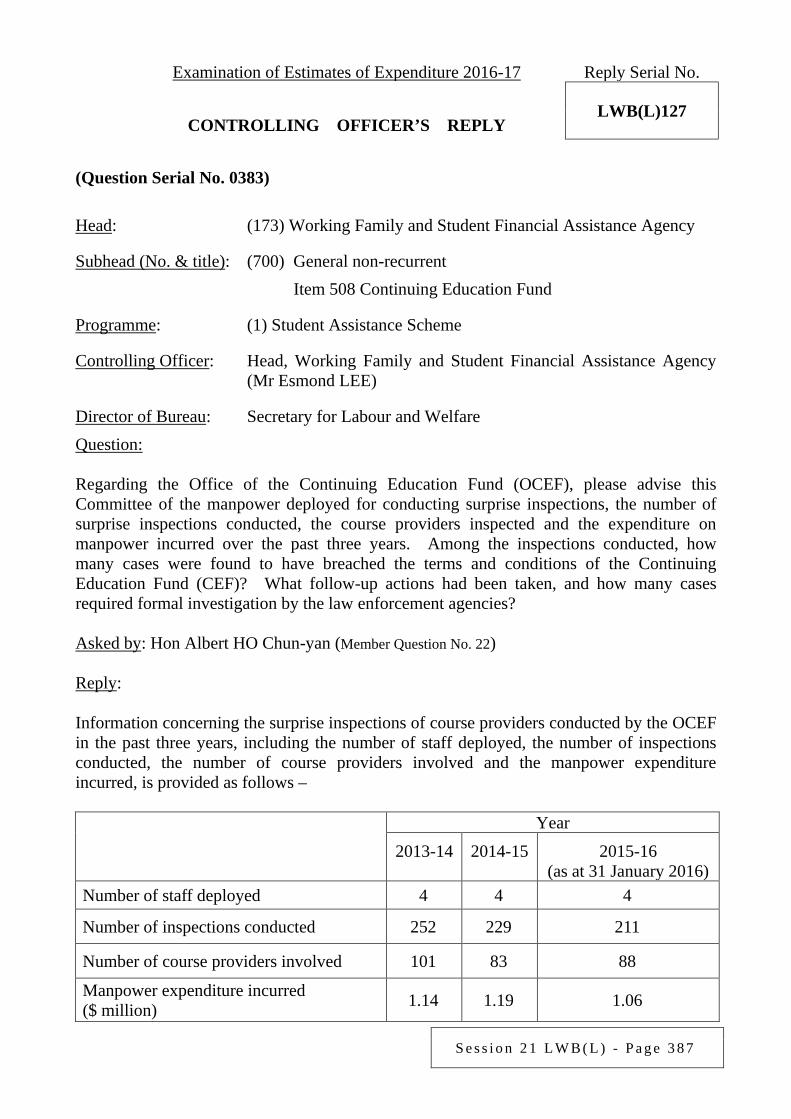
S e s s i o n 2 1 L W B ( L ) - P a g e 3 8 7
Examination of Estimates of Expenditure 2016-17 Reply Serial No.
LWB(L)127 CONTROLLING OFFICER’S REPLY (Question Serial No. 0383)
Head: (173) Working Family and Student Financial Assistance Agency
Subhead (No. & title): (700) General non-recurrent Item 508 Continuing Education Fund
Programme: (1) Student Assistance Scheme
Controlling Officer: Head, Working Family and Student Financial Assistance Agency (Mr Esmond LEE)
Director of Bureau: Secretary for Labour and Welfare Question: Regarding the Office of the Continuing Education Fund (OCEF), please advise this Committee of the manpower deployed for conducting surprise inspections, the number of surprise inspections conducted, the course providers inspected and the expenditure on manpower incurred over the past three years. Among the inspections conducted, how many cases were found to have breached the terms and conditions of the Continuing Education Fund (CEF)? What follow-up actions had been taken, and how many cases required formal investigation by the law enforcement agencies? Asked by: Hon Albert HO Chun-yan (Member Question No. 22) Reply: Information concerning the surprise inspections of course providers conducted by the OCEF in the past three years, including the number of staff deployed, the number of inspections conducted, the number of course providers involved and the manpower expenditure incurred, is provided as follows –
Year
2013-14 2014-15 2015-16 (as at 31 January 2016)
Number of staff deployed 4 4 4
Number of inspections conducted 252 229 211
Number of course providers involved 101 83 88
Manpower expenditure incurred ($ million)
1.14 1.19 1.06

S e s s i o n 2 1 L W B ( L ) - P a g e 3 8 8
The course providers inspected by the OCEF are listed at Annex. Among the surprise inspections conducted, the OCEF found that 71, 43 and 56 cases were in breach of the terms and conditions of the CEF in 2013-14, 2014-15 and 2015-16 (as at 31 January 2016) respectively. The non-compliance involved in these cases included improper record keeping, miscalculation of marks, tutor’s failure to sign on and verify attendance records, and inaccurate records of course completion date, etc. No element of fraud was observed. None of the cases required referral to law enforcement agencies. The OCEF had issued warnings to the course providers concerned.
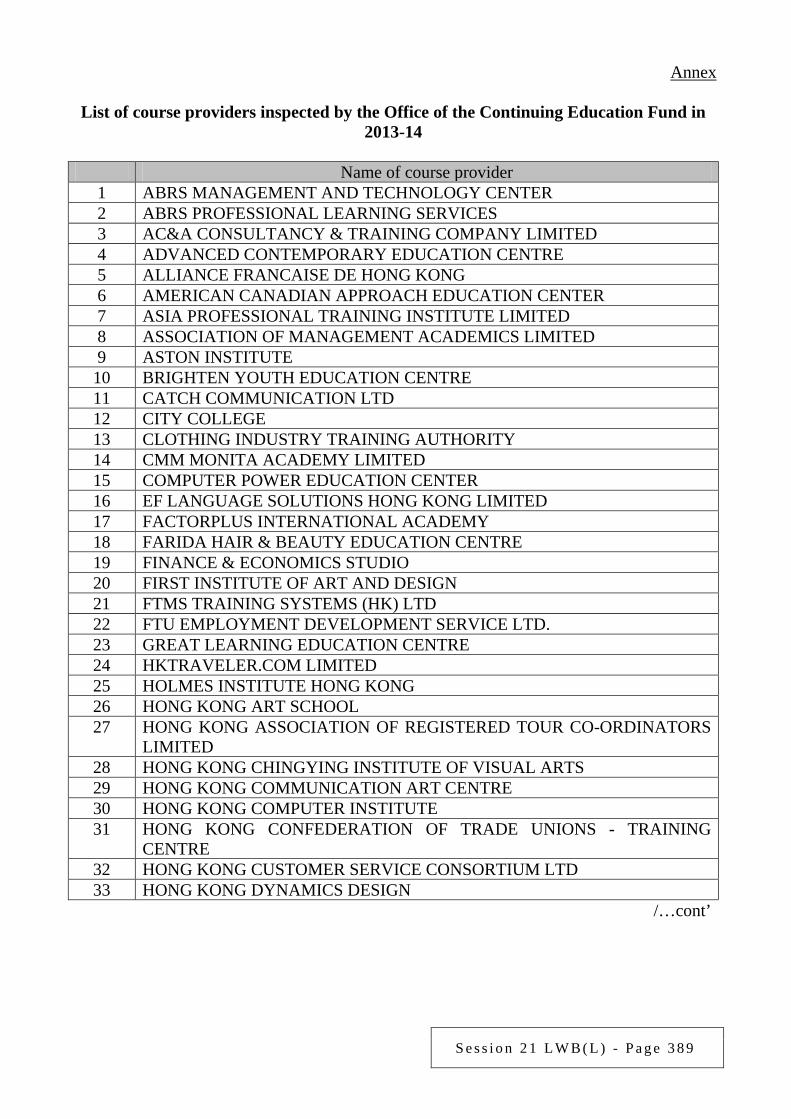
S e s s i o n 2 1 L W B ( L ) - P a g e 3 8 9
Annex List of course providers inspected by the Office of the Continuing Education Fund in
2013-14
Name of course provider 1 ABRS MANAGEMENT AND TECHNOLOGY CENTER 2 ABRS PROFESSIONAL LEARNING SERVICES 3 AC&A CONSULTANCY & TRAINING COMPANY LIMITED 4 ADVANCED CONTEMPORARY EDUCATION CENTRE 5 ALLIANCE FRANCAISE DE HONG KONG 6 AMERICAN CANADIAN APPROACH EDUCATION CENTER 7 ASIA PROFESSIONAL TRAINING INSTITUTE LIMITED 8 ASSOCIATION OF MANAGEMENT ACADEMICS LIMITED 9 ASTON INSTITUTE
10 BRIGHTEN YOUTH EDUCATION CENTRE 11 CATCH COMMUNICATION LTD 12 CITY COLLEGE 13 CLOTHING INDUSTRY TRAINING AUTHORITY 14 CMM MONITA ACADEMY LIMITED 15 COMPUTER POWER EDUCATION CENTER 16 EF LANGUAGE SOLUTIONS HONG KONG LIMITED 17 FACTORPLUS INTERNATIONAL ACADEMY 18 FARIDA HAIR & BEAUTY EDUCATION CENTRE 19 FINANCE & ECONOMICS STUDIO 20 FIRST INSTITUTE OF ART AND DESIGN 21 FTMS TRAINING SYSTEMS (HK) LTD 22 FTU EMPLOYMENT DEVELOPMENT SERVICE LTD. 23 GREAT LEARNING EDUCATION CENTRE 24 HKTRAVELER.COM LIMITED 25 HOLMES INSTITUTE HONG KONG 26 HONG KONG ART SCHOOL 27 HONG KONG ASSOCIATION OF REGISTERED TOUR CO-ORDINATORS
LIMITED 28 HONG KONG CHINGYING INSTITUTE OF VISUAL ARTS 29 HONG KONG COMMUNICATION ART CENTRE 30 HONG KONG COMPUTER INSTITUTE 31 HONG KONG CONFEDERATION OF TRADE UNIONS - TRAINING
CENTRE 32 HONG KONG CUSTOMER SERVICE CONSORTIUM LTD 33 HONG KONG DYNAMICS DESIGN
/…cont’
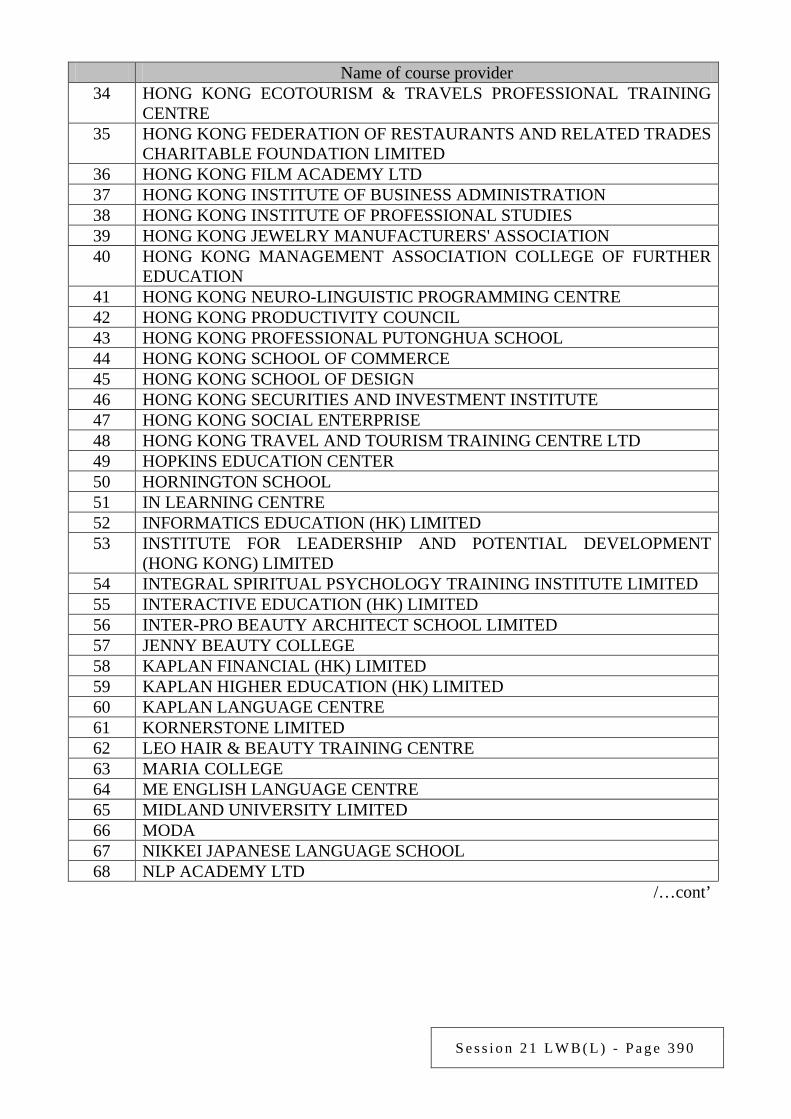
S e s s i o n 2 1 L W B ( L ) - P a g e 3 9 0
Name of course provider 34 HONG KONG ECOTOURISM & TRAVELS PROFESSIONAL TRAINING
CENTRE 35 HONG KONG FEDERATION OF RESTAURANTS AND RELATED TRADES
CHARITABLE FOUNDATION LIMITED 36 HONG KONG FILM ACADEMY LTD 37 HONG KONG INSTITUTE OF BUSINESS ADMINISTRATION 38 HONG KONG INSTITUTE OF PROFESSIONAL STUDIES 39 HONG KONG JEWELRY MANUFACTURERS' ASSOCIATION 40 HONG KONG MANAGEMENT ASSOCIATION COLLEGE OF FURTHER
EDUCATION 41 HONG KONG NEURO-LINGUISTIC PROGRAMMING CENTRE 42 HONG KONG PRODUCTIVITY COUNCIL 43 HONG KONG PROFESSIONAL PUTONGHUA SCHOOL 44 HONG KONG SCHOOL OF COMMERCE 45 HONG KONG SCHOOL OF DESIGN 46 HONG KONG SECURITIES AND INVESTMENT INSTITUTE 47 HONG KONG SOCIAL ENTERPRISE 48 HONG KONG TRAVEL AND TOURISM TRAINING CENTRE LTD 49 HOPKINS EDUCATION CENTER 50 HORNINGTON SCHOOL 51 IN LEARNING CENTRE 52 INFORMATICS EDUCATION (HK) LIMITED 53 INSTITUTE FOR LEADERSHIP AND POTENTIAL DEVELOPMENT
(HONG KONG) LIMITED 54 INTEGRAL SPIRITUAL PSYCHOLOGY TRAINING INSTITUTE LIMITED 55 INTERACTIVE EDUCATION (HK) LIMITED 56 INTER-PRO BEAUTY ARCHITECT SCHOOL LIMITED 57 JENNY BEAUTY COLLEGE 58 KAPLAN FINANCIAL (HK) LIMITED 59 KAPLAN HIGHER EDUCATION (HK) LIMITED 60 KAPLAN LANGUAGE CENTRE 61 KORNERSTONE LIMITED 62 LEO HAIR & BEAUTY TRAINING CENTRE 63 MARIA COLLEGE 64 ME ENGLISH LANGUAGE CENTRE 65 MIDLAND UNIVERSITY LIMITED 66 MODA 67 NIKKEI JAPANESE LANGUAGE SCHOOL 68 NLP ACADEMY LTD
/…cont’
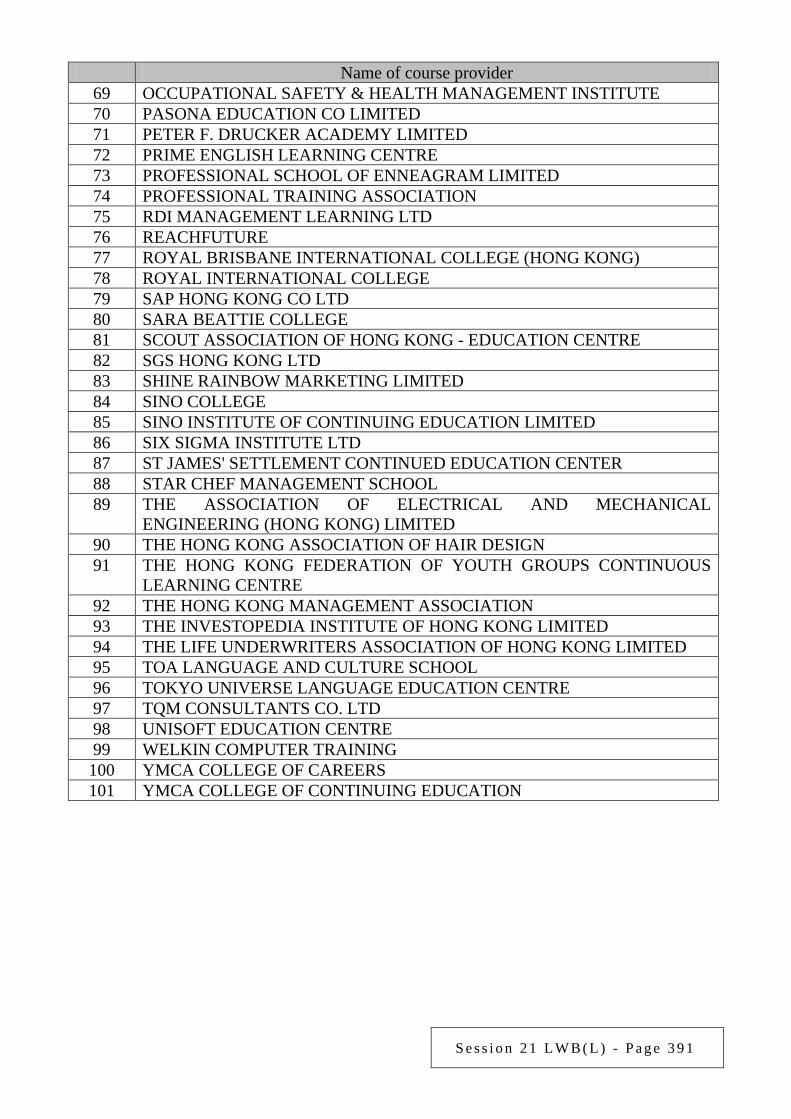
S e s s i o n 2 1 L W B ( L ) - P a g e 3 9 1
Name of course provider 69 OCCUPATIONAL SAFETY & HEALTH MANAGEMENT INSTITUTE 70 PASONA EDUCATION CO LIMITED 71 PETER F. DRUCKER ACADEMY LIMITED 72 PRIME ENGLISH LEARNING CENTRE 73 PROFESSIONAL SCHOOL OF ENNEAGRAM LIMITED 74 PROFESSIONAL TRAINING ASSOCIATION 75 RDI MANAGEMENT LEARNING LTD 76 REACHFUTURE 77 ROYAL BRISBANE INTERNATIONAL COLLEGE (HONG KONG) 78 ROYAL INTERNATIONAL COLLEGE 79 SAP HONG KONG CO LTD 80 SARA BEATTIE COLLEGE 81 SCOUT ASSOCIATION OF HONG KONG - EDUCATION CENTRE 82 SGS HONG KONG LTD 83 SHINE RAINBOW MARKETING LIMITED 84 SINO COLLEGE 85 SINO INSTITUTE OF CONTINUING EDUCATION LIMITED 86 SIX SIGMA INSTITUTE LTD 87 ST JAMES' SETTLEMENT CONTINUED EDUCATION CENTER 88 STAR CHEF MANAGEMENT SCHOOL 89 THE ASSOCIATION OF ELECTRICAL AND MECHANICAL
ENGINEERING (HONG KONG) LIMITED 90 THE HONG KONG ASSOCIATION OF HAIR DESIGN 91 THE HONG KONG FEDERATION OF YOUTH GROUPS CONTINUOUS
LEARNING CENTRE 92 THE HONG KONG MANAGEMENT ASSOCIATION 93 THE INVESTOPEDIA INSTITUTE OF HONG KONG LIMITED 94 THE LIFE UNDERWRITERS ASSOCIATION OF HONG KONG LIMITED 95 TOA LANGUAGE AND CULTURE SCHOOL 96 TOKYO UNIVERSE LANGUAGE EDUCATION CENTRE 97 TQM CONSULTANTS CO. LTD 98 UNISOFT EDUCATION CENTRE 99 WELKIN COMPUTER TRAINING 100 YMCA COLLEGE OF CAREERS 101 YMCA COLLEGE OF CONTINUING EDUCATION
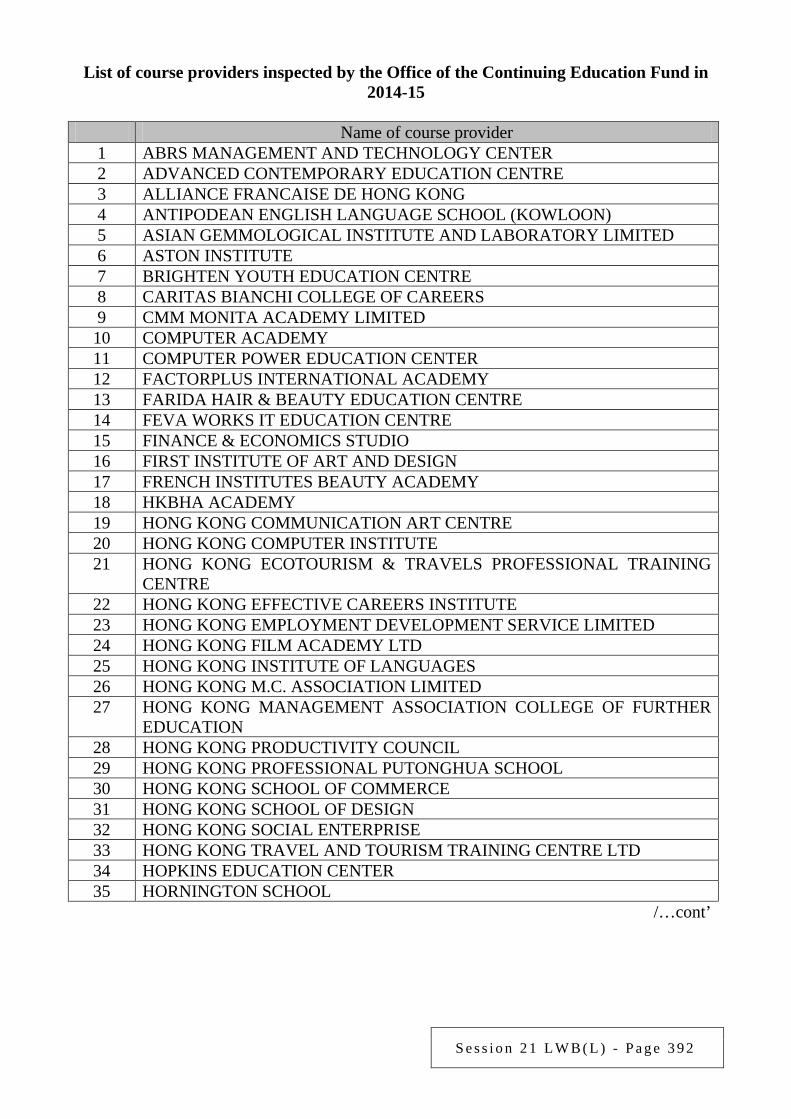
S e s s i o n 2 1 L W B ( L ) - P a g e 3 9 2
List of course providers inspected by the Office of the Continuing Education Fund in 2014-15
Name of course provider 1 ABRS MANAGEMENT AND TECHNOLOGY CENTER 2 ADVANCED CONTEMPORARY EDUCATION CENTRE 3 ALLIANCE FRANCAISE DE HONG KONG 4 ANTIPODEAN ENGLISH LANGUAGE SCHOOL (KOWLOON) 5 ASIAN GEMMOLOGICAL INSTITUTE AND LABORATORY LIMITED 6 ASTON INSTITUTE 7 BRIGHTEN YOUTH EDUCATION CENTRE 8 CARITAS BIANCHI COLLEGE OF CAREERS 9 CMM MONITA ACADEMY LIMITED
10 COMPUTER ACADEMY 11 COMPUTER POWER EDUCATION CENTER 12 FACTORPLUS INTERNATIONAL ACADEMY 13 FARIDA HAIR & BEAUTY EDUCATION CENTRE 14 FEVA WORKS IT EDUCATION CENTRE 15 FINANCE & ECONOMICS STUDIO 16 FIRST INSTITUTE OF ART AND DESIGN 17 FRENCH INSTITUTES BEAUTY ACADEMY 18 HKBHA ACADEMY 19 HONG KONG COMMUNICATION ART CENTRE 20 HONG KONG COMPUTER INSTITUTE 21 HONG KONG ECOTOURISM & TRAVELS PROFESSIONAL TRAINING
CENTRE 22 HONG KONG EFFECTIVE CAREERS INSTITUTE 23 HONG KONG EMPLOYMENT DEVELOPMENT SERVICE LIMITED 24 HONG KONG FILM ACADEMY LTD 25 HONG KONG INSTITUTE OF LANGUAGES 26 HONG KONG M.C. ASSOCIATION LIMITED 27 HONG KONG MANAGEMENT ASSOCIATION COLLEGE OF FURTHER
EDUCATION 28 HONG KONG PRODUCTIVITY COUNCIL 29 HONG KONG PROFESSIONAL PUTONGHUA SCHOOL 30 HONG KONG SCHOOL OF COMMERCE 31 HONG KONG SCHOOL OF DESIGN 32 HONG KONG SOCIAL ENTERPRISE 33 HONG KONG TRAVEL AND TOURISM TRAINING CENTRE LTD 34 HOPKINS EDUCATION CENTER 35 HORNINGTON SCHOOL
/…cont’
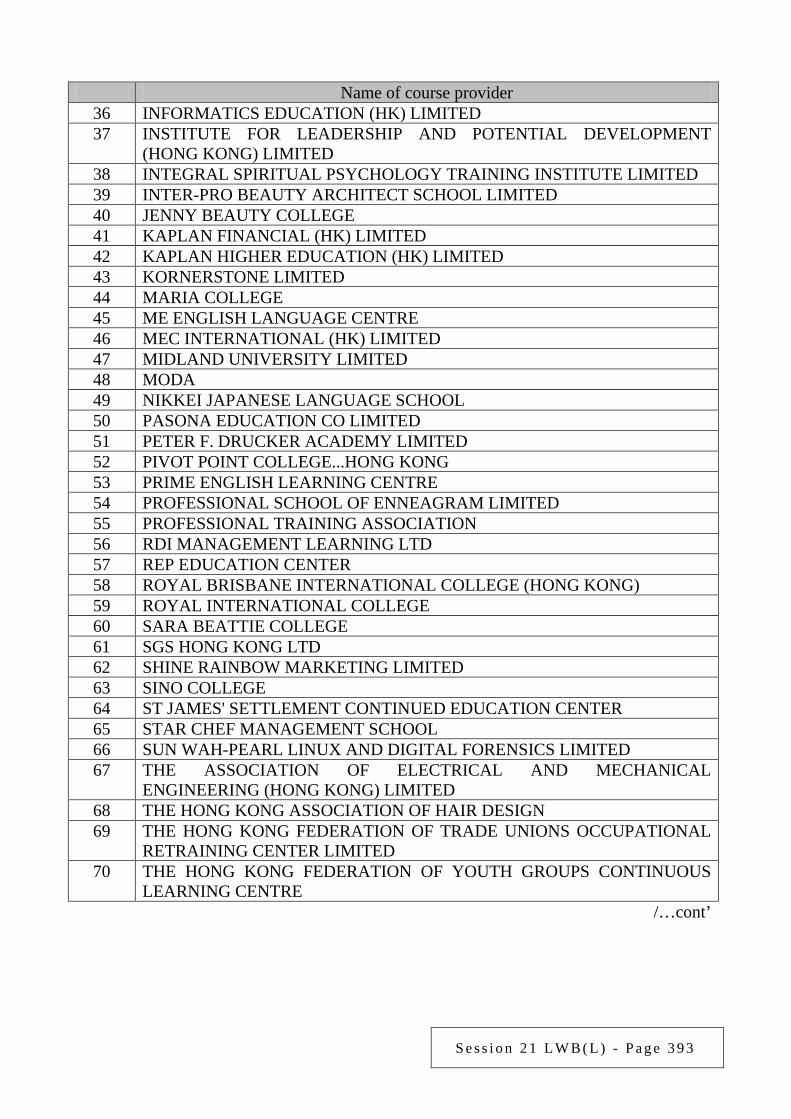
S e s s i o n 2 1 L W B ( L ) - P a g e 3 9 3
Name of course provider
36 INFORMATICS EDUCATION (HK) LIMITED 37 INSTITUTE FOR LEADERSHIP AND POTENTIAL DEVELOPMENT
(HONG KONG) LIMITED 38 INTEGRAL SPIRITUAL PSYCHOLOGY TRAINING INSTITUTE LIMITED 39 INTER-PRO BEAUTY ARCHITECT SCHOOL LIMITED 40 JENNY BEAUTY COLLEGE 41 KAPLAN FINANCIAL (HK) LIMITED 42 KAPLAN HIGHER EDUCATION (HK) LIMITED 43 KORNERSTONE LIMITED 44 MARIA COLLEGE 45 ME ENGLISH LANGUAGE CENTRE 46 MEC INTERNATIONAL (HK) LIMITED 47 MIDLAND UNIVERSITY LIMITED 48 MODA 49 NIKKEI JAPANESE LANGUAGE SCHOOL 50 PASONA EDUCATION CO LIMITED 51 PETER F. DRUCKER ACADEMY LIMITED 52 PIVOT POINT COLLEGE...HONG KONG 53 PRIME ENGLISH LEARNING CENTRE 54 PROFESSIONAL SCHOOL OF ENNEAGRAM LIMITED 55 PROFESSIONAL TRAINING ASSOCIATION 56 RDI MANAGEMENT LEARNING LTD 57 REP EDUCATION CENTER 58 ROYAL BRISBANE INTERNATIONAL COLLEGE (HONG KONG) 59 ROYAL INTERNATIONAL COLLEGE 60 SARA BEATTIE COLLEGE 61 SGS HONG KONG LTD 62 SHINE RAINBOW MARKETING LIMITED 63 SINO COLLEGE 64 ST JAMES' SETTLEMENT CONTINUED EDUCATION CENTER 65 STAR CHEF MANAGEMENT SCHOOL 66 SUN WAH-PEARL LINUX AND DIGITAL FORENSICS LIMITED 67 THE ASSOCIATION OF ELECTRICAL AND MECHANICAL
ENGINEERING (HONG KONG) LIMITED 68 THE HONG KONG ASSOCIATION OF HAIR DESIGN 69 THE HONG KONG FEDERATION OF TRADE UNIONS OCCUPATIONAL
RETRAINING CENTER LIMITED 70 THE HONG KONG FEDERATION OF YOUTH GROUPS CONTINUOUS
LEARNING CENTRE /…cont’
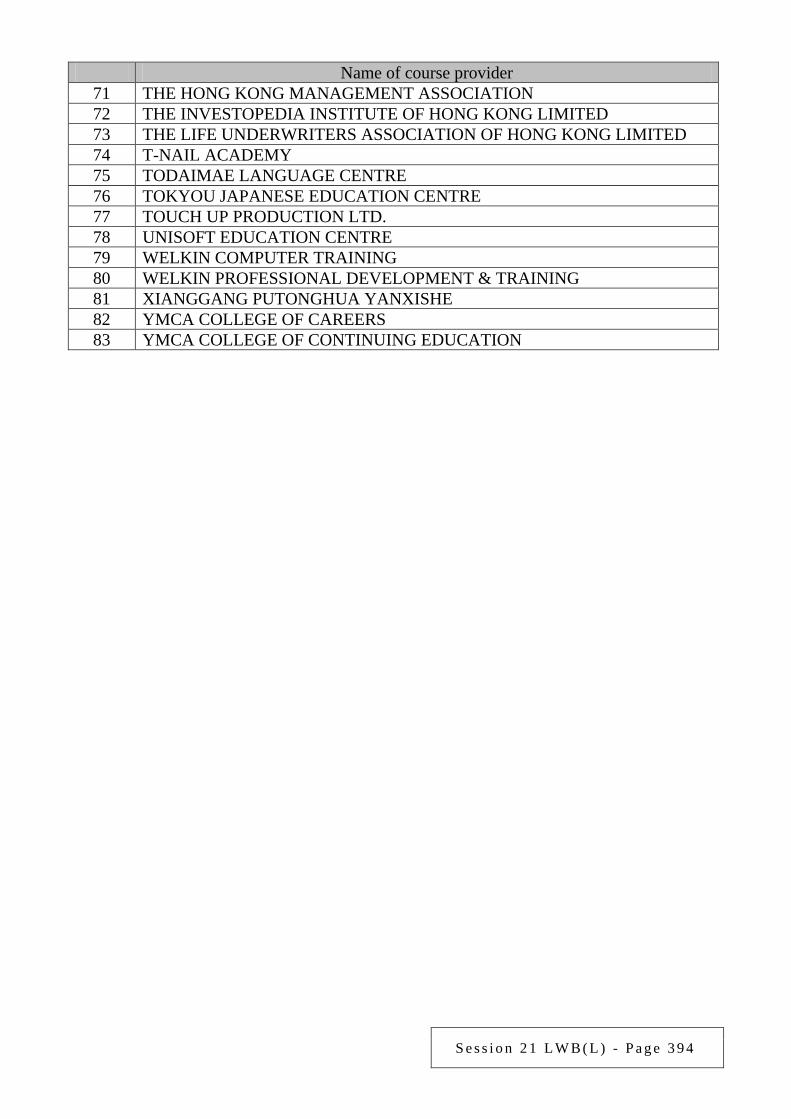
S e s s i o n 2 1 L W B ( L ) - P a g e 3 9 4
Name of course provider 71 THE HONG KONG MANAGEMENT ASSOCIATION 72 THE INVESTOPEDIA INSTITUTE OF HONG KONG LIMITED 73 THE LIFE UNDERWRITERS ASSOCIATION OF HONG KONG LIMITED 74 T-NAIL ACADEMY 75 TODAIMAE LANGUAGE CENTRE 76 TOKYOU JAPANESE EDUCATION CENTRE 77 TOUCH UP PRODUCTION LTD. 78 UNISOFT EDUCATION CENTRE 79 WELKIN COMPUTER TRAINING 80 WELKIN PROFESSIONAL DEVELOPMENT & TRAINING 81 XIANGGANG PUTONGHUA YANXISHE 82 YMCA COLLEGE OF CAREERS 83 YMCA COLLEGE OF CONTINUING EDUCATION
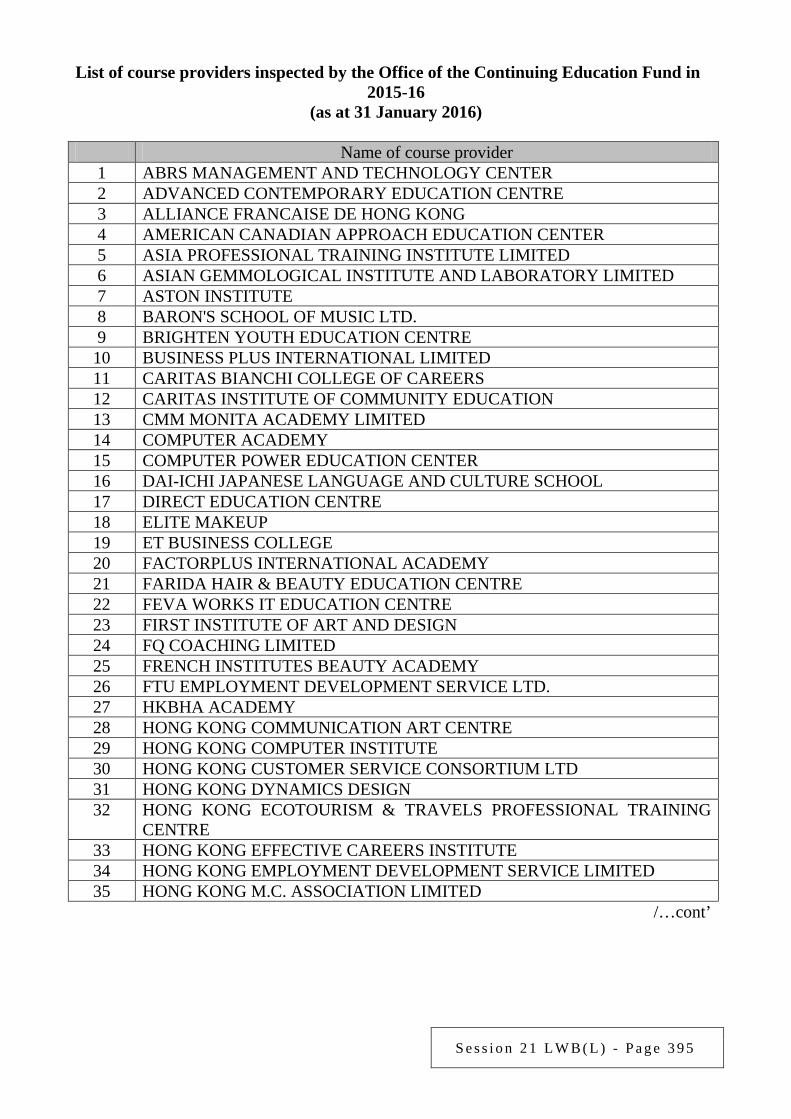
S e s s i o n 2 1 L W B ( L ) - P a g e 3 9 5
List of course providers inspected by the Office of the Continuing Education Fund in 2015-16
(as at 31 January 2016)
Name of course provider 1 ABRS MANAGEMENT AND TECHNOLOGY CENTER 2 ADVANCED CONTEMPORARY EDUCATION CENTRE 3 ALLIANCE FRANCAISE DE HONG KONG 4 AMERICAN CANADIAN APPROACH EDUCATION CENTER 5 ASIA PROFESSIONAL TRAINING INSTITUTE LIMITED 6 ASIAN GEMMOLOGICAL INSTITUTE AND LABORATORY LIMITED 7 ASTON INSTITUTE 8 BARON'S SCHOOL OF MUSIC LTD. 9 BRIGHTEN YOUTH EDUCATION CENTRE
10 BUSINESS PLUS INTERNATIONAL LIMITED 11 CARITAS BIANCHI COLLEGE OF CAREERS 12 CARITAS INSTITUTE OF COMMUNITY EDUCATION 13 CMM MONITA ACADEMY LIMITED 14 COMPUTER ACADEMY 15 COMPUTER POWER EDUCATION CENTER 16 DAI-ICHI JAPANESE LANGUAGE AND CULTURE SCHOOL 17 DIRECT EDUCATION CENTRE 18 ELITE MAKEUP 19 ET BUSINESS COLLEGE 20 FACTORPLUS INTERNATIONAL ACADEMY 21 FARIDA HAIR & BEAUTY EDUCATION CENTRE 22 FEVA WORKS IT EDUCATION CENTRE 23 FIRST INSTITUTE OF ART AND DESIGN 24 FQ COACHING LIMITED 25 FRENCH INSTITUTES BEAUTY ACADEMY 26 FTU EMPLOYMENT DEVELOPMENT SERVICE LTD. 27 HKBHA ACADEMY 28 HONG KONG COMMUNICATION ART CENTRE 29 HONG KONG COMPUTER INSTITUTE 30 HONG KONG CUSTOMER SERVICE CONSORTIUM LTD 31 HONG KONG DYNAMICS DESIGN 32 HONG KONG ECOTOURISM & TRAVELS PROFESSIONAL TRAINING
CENTRE 33 HONG KONG EFFECTIVE CAREERS INSTITUTE 34 HONG KONG EMPLOYMENT DEVELOPMENT SERVICE LIMITED 35 HONG KONG M.C. ASSOCIATION LIMITED
/…cont’
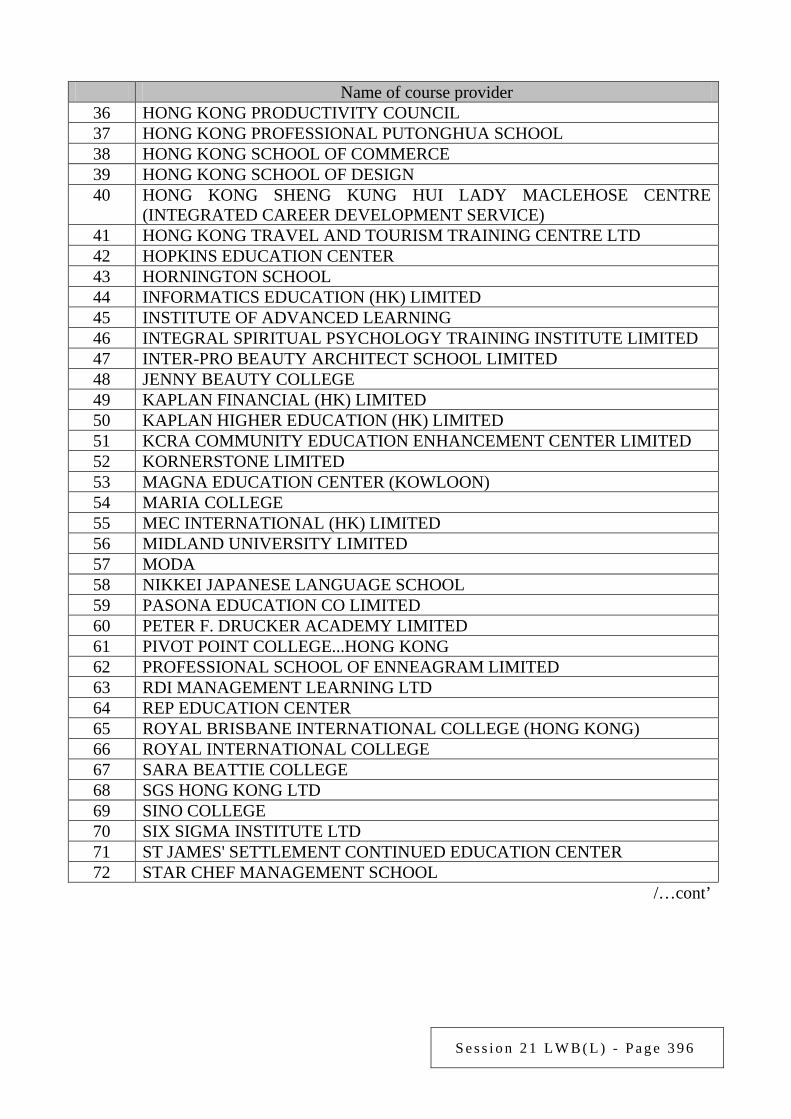
S e s s i o n 2 1 L W B ( L ) - P a g e 3 9 6
Name of course provider
36 HONG KONG PRODUCTIVITY COUNCIL 37 HONG KONG PROFESSIONAL PUTONGHUA SCHOOL 38 HONG KONG SCHOOL OF COMMERCE 39 HONG KONG SCHOOL OF DESIGN 40 HONG KONG SHENG KUNG HUI LADY MACLEHOSE CENTRE
(INTEGRATED CAREER DEVELOPMENT SERVICE) 41 HONG KONG TRAVEL AND TOURISM TRAINING CENTRE LTD 42 HOPKINS EDUCATION CENTER 43 HORNINGTON SCHOOL 44 INFORMATICS EDUCATION (HK) LIMITED 45 INSTITUTE OF ADVANCED LEARNING 46 INTEGRAL SPIRITUAL PSYCHOLOGY TRAINING INSTITUTE LIMITED 47 INTER-PRO BEAUTY ARCHITECT SCHOOL LIMITED 48 JENNY BEAUTY COLLEGE 49 KAPLAN FINANCIAL (HK) LIMITED 50 KAPLAN HIGHER EDUCATION (HK) LIMITED 51 KCRA COMMUNITY EDUCATION ENHANCEMENT CENTER LIMITED 52 KORNERSTONE LIMITED 53 MAGNA EDUCATION CENTER (KOWLOON) 54 MARIA COLLEGE 55 MEC INTERNATIONAL (HK) LIMITED 56 MIDLAND UNIVERSITY LIMITED 57 MODA 58 NIKKEI JAPANESE LANGUAGE SCHOOL 59 PASONA EDUCATION CO LIMITED 60 PETER F. DRUCKER ACADEMY LIMITED 61 PIVOT POINT COLLEGE...HONG KONG 62 PROFESSIONAL SCHOOL OF ENNEAGRAM LIMITED 63 RDI MANAGEMENT LEARNING LTD 64 REP EDUCATION CENTER 65 ROYAL BRISBANE INTERNATIONAL COLLEGE (HONG KONG) 66 ROYAL INTERNATIONAL COLLEGE 67 SARA BEATTIE COLLEGE 68 SGS HONG KONG LTD 69 SINO COLLEGE 70 SIX SIGMA INSTITUTE LTD 71 ST JAMES' SETTLEMENT CONTINUED EDUCATION CENTER 72 STAR CHEF MANAGEMENT SCHOOL
/…cont’
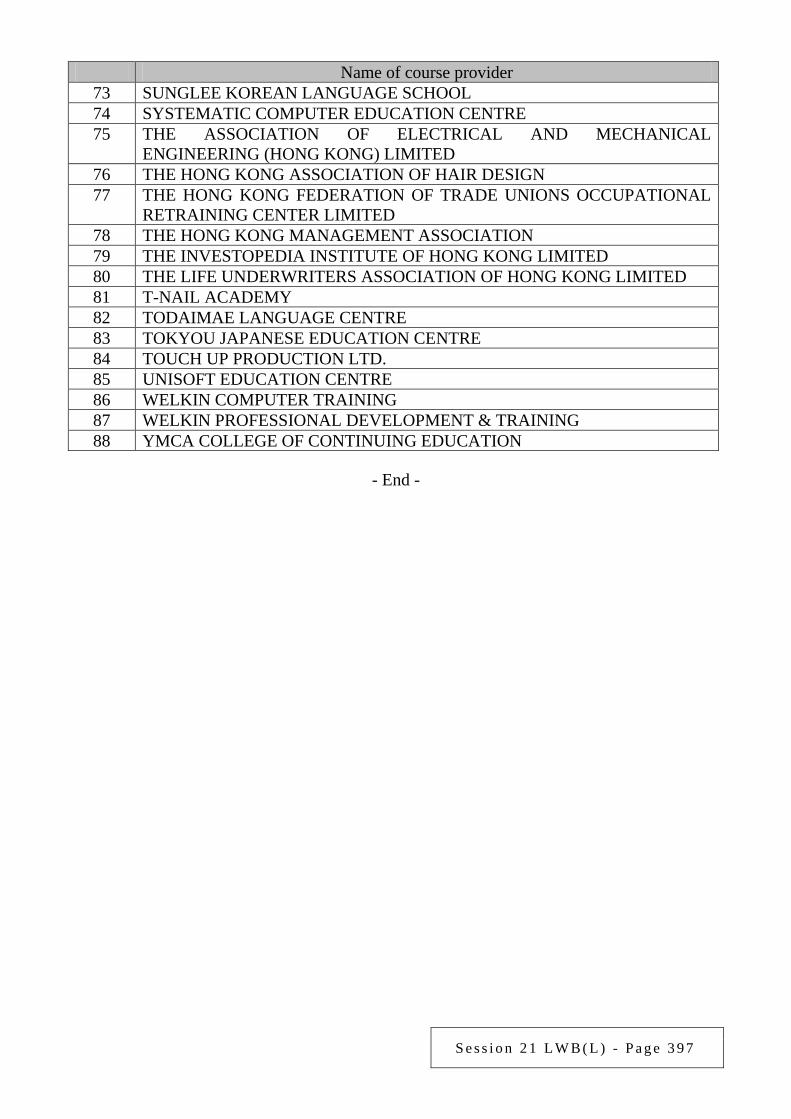
S e s s i o n 2 1 L W B ( L ) - P a g e 3 9 7
Name of course provider 73 SUNGLEE KOREAN LANGUAGE SCHOOL 74 SYSTEMATIC COMPUTER EDUCATION CENTRE 75 THE ASSOCIATION OF ELECTRICAL AND MECHANICAL
ENGINEERING (HONG KONG) LIMITED 76 THE HONG KONG ASSOCIATION OF HAIR DESIGN 77 THE HONG KONG FEDERATION OF TRADE UNIONS OCCUPATIONAL
RETRAINING CENTER LIMITED 78 THE HONG KONG MANAGEMENT ASSOCIATION 79 THE INVESTOPEDIA INSTITUTE OF HONG KONG LIMITED 80 THE LIFE UNDERWRITERS ASSOCIATION OF HONG KONG LIMITED 81 T-NAIL ACADEMY 82 TODAIMAE LANGUAGE CENTRE 83 TOKYOU JAPANESE EDUCATION CENTRE 84 TOUCH UP PRODUCTION LTD. 85 UNISOFT EDUCATION CENTRE 86 WELKIN COMPUTER TRAINING 87 WELKIN PROFESSIONAL DEVELOPMENT & TRAINING 88 YMCA COLLEGE OF CONTINUING EDUCATION
- End -

S e s s i o n 2 1 L W B ( L ) - P a g e 3 9 8
Examination of Estimates of Expenditure 2016-17 Reply Serial No.
LWB(L)128 CONTROLLING OFFICER’S REPLY (Question Serial No. 2182)
Head: (173) Working Family and Student Financial Assistance Agency
Subhead (No. & title): (700) General non-recurrent Item 508 Continuing Education Fund
Programme: (1) Student Assistance Scheme
Controlling Officer: Head, Working Family and Student Financial Assistance Agency (Mr Esmond LEE)
Director of Bureau: Secretary for Labour and Welfare Question: In the past five years, how many people have applied for subsidies under the Continuing Education Fund (CEF)? How much money was involved? How many people in Hong Kong have opened a CEF account and have exhausted the subsidy ceiling of HK$10,000 or submitted four claims for reimbursement? Will the Government consider raising the subsidy ceiling or the number of claims and what are the reasons? Asked by: Hon LEUNG Kwok-hung (Member Question No. 2039) Reply: In the past five years (from 1 April 2011 to 31 January 2016), the Office of the Continuing Education Fund received a total of 130 258 applications for tuition fees reimbursement. 126 785 applicants were granted approval for reimbursement, involving an amount of around $970 million. At present, each CEF applicant may apply for reimbursement of 80% of the tuition fees of any CEF reimbursable course upon successful completion of the course, subject to a maximum sum of $10,000. The tuition fees of the majority of CEF reimbursable courses are at or below $10,000. Furthermore, the CEF applicants may submit a maximum of four claims for reimbursement. Since the establishment of the CEF in mid 2002, approval has been given for 719 089 applicants to open a CEF account, of which 264 849 applicants have exhausted the subsidy ceiling of $10,000 or submitted four claims for reimbursement. The Government will conduct a review on the CEF in 2016-17 to meet the needs of the community. The review will cover the amount and coverage of the financial assistance, and application and reimbursement matters, etc.
- End -
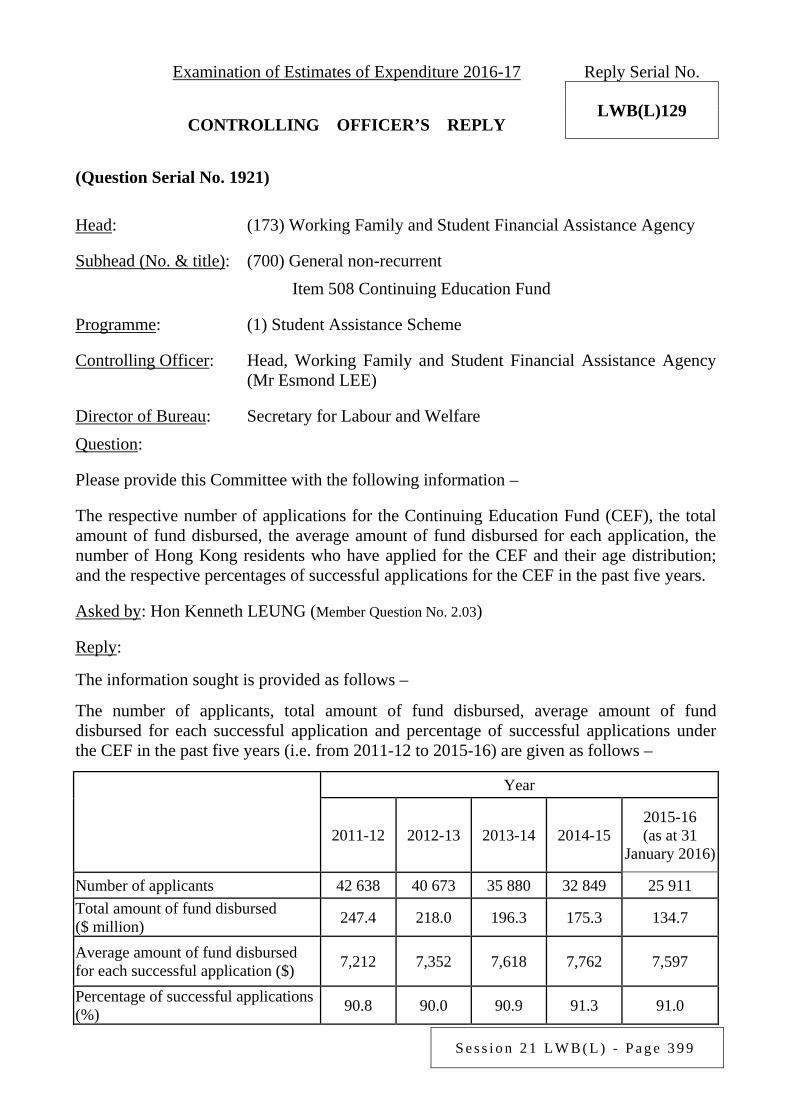
S e s s i o n 2 1 L W B ( L ) - P a g e 3 9 9
Examination of Estimates of Expenditure 2016-17 Reply Serial No.
LWB(L)129 CONTROLLING OFFICER’S REPLY (Question Serial No. 1921)
Head: (173) Working Family and Student Financial Assistance Agency
Subhead (No. & title): (700) General non-recurrent Item 508 Continuing Education Fund
Programme: (1) Student Assistance Scheme
Controlling Officer: Head, Working Family and Student Financial Assistance Agency (Mr Esmond LEE)
Director of Bureau: Secretary for Labour and Welfare Question: Please provide this Committee with the following information – The respective number of applications for the Continuing Education Fund (CEF), the total amount of fund disbursed, the average amount of fund disbursed for each application, the number of Hong Kong residents who have applied for the CEF and their age distribution; and the respective percentages of successful applications for the CEF in the past five years. Asked by: Hon Kenneth LEUNG (Member Question No. 2.03) Reply:
The information sought is provided as follows –
The number of applicants, total amount of fund disbursed, average amount of fund disbursed for each successful application and percentage of successful applications under the CEF in the past five years (i.e. from 2011-12 to 2015-16) are given as follows –
Year
2011-12 2012-13 2013-14 2014-15 2015-16 (as at 31
January 2016)
Number of applicants 42 638 40 673 35 880 32 849 25 911 Total amount of fund disbursed ($ million) 247.4 218.0 196.3 175.3 134.7
Average amount of fund disbursed for each successful application ($) 7,212 7,352 7,618 7,762 7,597
Percentage of successful applications (%) 90.8 90.0 90.9 91.3 91.0
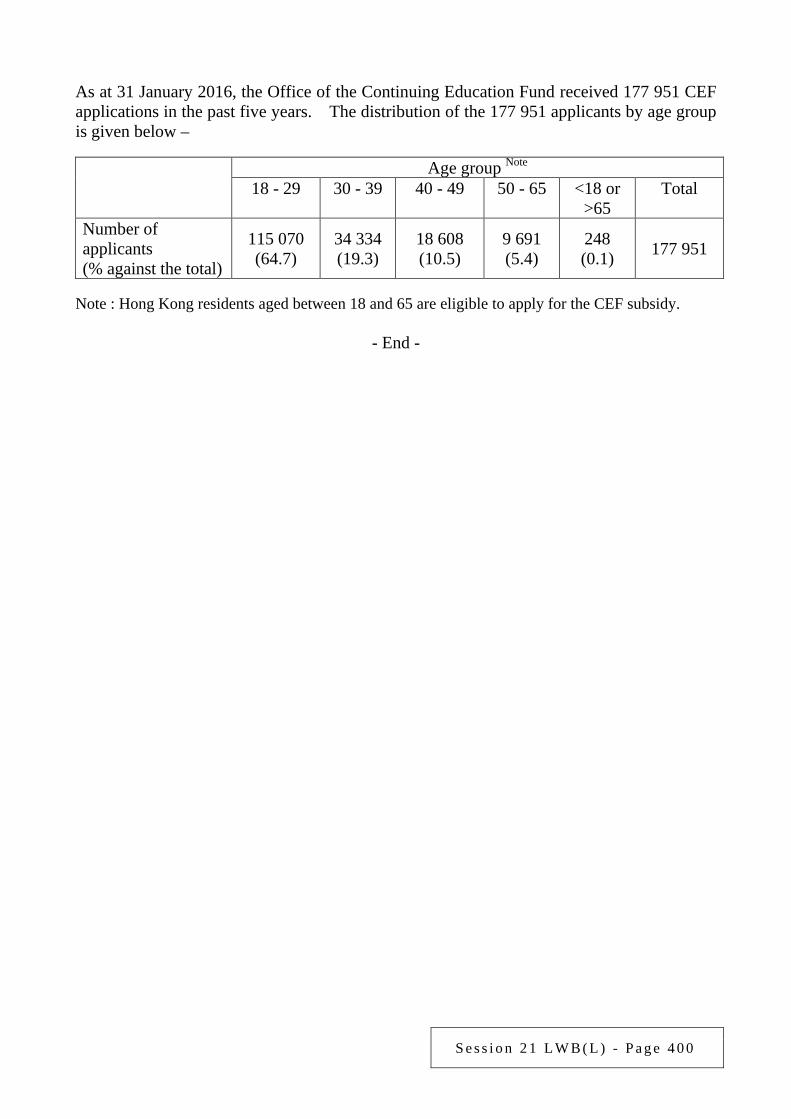
S e s s i o n 2 1 L W B ( L ) - P a g e 4 0 0
As at 31 January 2016, the Office of the Continuing Education Fund received 177 951 CEF applications in the past five years. The distribution of the 177 951 applicants by age group is given below –
Age group Note
18 - 29 30 - 39 40 - 49 50 - 65 <18 or >65
Total
Number of applicants (% against the total)
115 070 (64.7)
34 334 (19.3)
18 608 (10.5)
9 691 (5.4)
248 (0.1) 177 951
Note : Hong Kong residents aged between 18 and 65 are eligible to apply for the CEF subsidy.
- End -
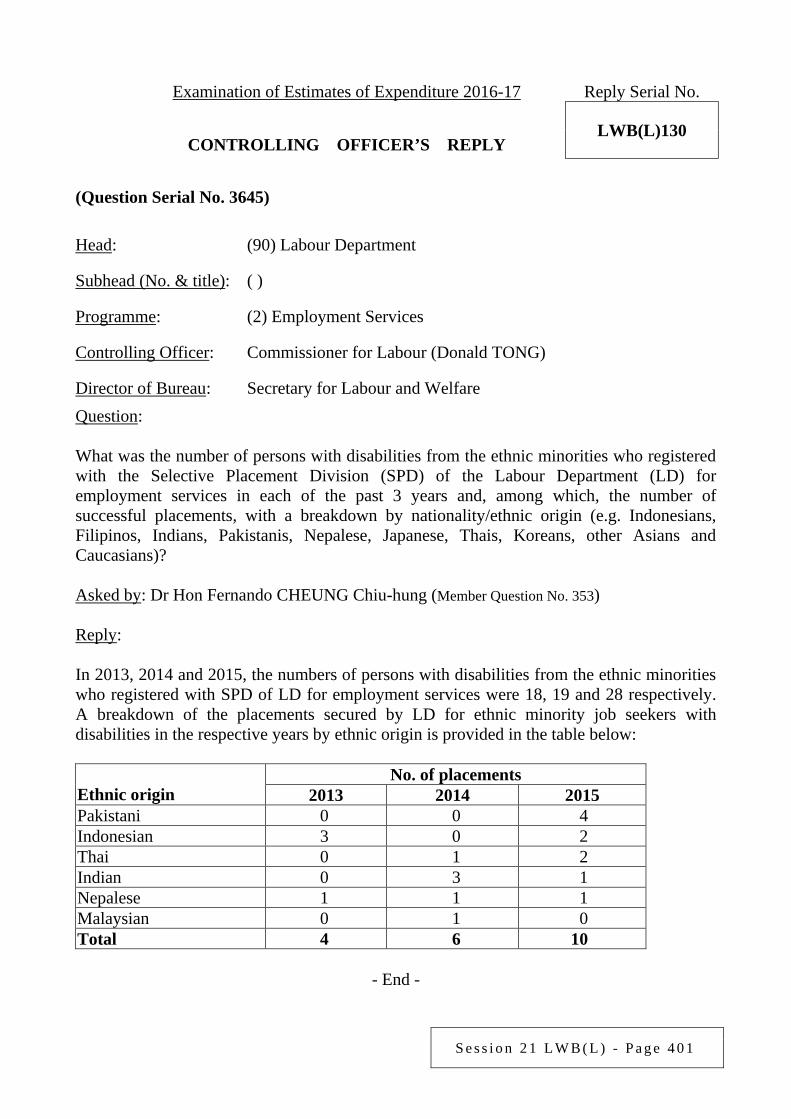
S e s s i o n 2 1 L W B ( L ) - P a g e 4 0 1
Examination of Estimates of Expenditure 2016-17 Reply Serial No.
LWB(L)130 CONTROLLING OFFICER’S REPLY (Question Serial No. 3645)
Head: (90) Labour Department
Subhead (No. & title): ( )
Programme: (2) Employment Services
Controlling Officer: Commissioner for Labour (Donald TONG)
Director of Bureau: Secretary for Labour and Welfare Question: What was the number of persons with disabilities from the ethnic minorities who registered with the Selective Placement Division (SPD) of the Labour Department (LD) for employment services in each of the past 3 years and, among which, the number of successful placements, with a breakdown by nationality/ethnic origin (e.g. Indonesians, Filipinos, Indians, Pakistanis, Nepalese, Japanese, Thais, Koreans, other Asians and Caucasians)? Asked by: Dr Hon Fernando CHEUNG Chiu-hung (Member Question No. 353) Reply: In 2013, 2014 and 2015, the numbers of persons with disabilities from the ethnic minorities who registered with SPD of LD for employment services were 18, 19 and 28 respectively. A breakdown of the placements secured by LD for ethnic minority job seekers with disabilities in the respective years by ethnic origin is provided in the table below: Ethnic origin
No. of placements 2013 2014 2015
Pakistani 0 0 4 Indonesian 3 0 2 Thai 0 1 2 Indian 0 3 1 Nepalese 1 1 1 Malaysian 0 1 0 Total 4 6 10
- End -
S e s s i o n 2 1 L W B ( L ) - P a g e 4 0 2
Examination of Estimates of Expenditure 2016-17 Reply Serial No.
LWB(L)131 CONTROLLING OFFICER’S REPLY (Question Serial No. 3677)
Head: (90) Labour Department
Subhead (No. & title): ( )
Programme: (3) Safety and Health at Work
Controlling Officer: Commissioner for Labour (Donald TONG)
Director of Bureau: Secretary for Labour and Welfare Question: How does the Government monitor the compliance with relevant requirements under the Occupational Safety and Health Ordinance (OSHO) by cleansing services contractors of government departments? Asked by: Dr Hon Fernando CHEUNG Chiu-hung (Member Question No. 261) Reply: Under OSHO (Cap. 509), an employer (including contractors of the Government’s outsourced cleansing services) must, so far as reasonably practicable, ensure the occupational safety and health (OSH) at work of all of his/her employees. Staff of the Labour Department from time to time conduct surprise inspections on OSH to different workplaces (including those of the contractors of the Government’s outsourced cleansing services) and launch special enforcement campaigns targeted at high-risk processes (such as use of hazardous chemicals) to deter work practices contravening work safety requirements. Breaches of OSH requirements detected will be dealt with according to the laws and, where necessary, be reported to the departments which engage the outsourced cleansing services contractors concerned for follow-up action.
- End -
S e s s i o n 2 1 L W B ( L ) - P a g e 4 0 3
Examination of Estimates of Expenditure 2016-17 Reply Serial No.
LWB(L)132 CONTROLLING OFFICER’S REPLY (Question Serial No. 3679)
Head: (90) Labour Department
Subhead (No. & title): ( )
Programme: (3) Safety and Health at Work
Controlling Officer: Commissioner for Labour (Donald TONG)
Director of Bureau: Secretary for Labour and Welfare Question: How many reports of work injury sustained by non-skilled workers under cleansing services contracts were received by the Government in each of the past 5 years? What were the parts of body injured and the reasons for injury? If figures are available, please provide a breakdown by department. What were the details of the Government’s follow-up on such complaints? If figures are not available, what are the reasons? Will such figures be available in future? Asked by: Dr Hon Fernando CHEUNG Chiu-hung (Member Question No. 264) Reply: As reports of work injury do not record whether cleansing services contracts of government departments are involved, the Labour Department (LD) does not keep breakdown figures of accidents related to cleansing services contracts and other relevant information. LD devises enforcement, publicity and promotion strategies according to the overall occupational safety and health performance of different industries, such as pest control and cleansing services; and there is currently no plan to collect breakdown figures on government service contractors.
- End -
S e s s i o n 2 1 L W B ( L ) - P a g e 4 0 4
Examination of Estimates of Expenditure 2016-17 Reply Serial No.
LWB(L)133 CONTROLLING OFFICER’S REPLY (Question Serial No. 3680)
Head: (90) Labour Department
Subhead (No. & title): ( )
Programme: (3) Safety and Health at Work
Controlling Officer: Commissioner for Labour (Donald TONG)
Director of Bureau: Secretary for Labour and Welfare Question: How many cases of suspected breaches of the Occupational Safety and Health Ordinance (OSHO) and relevant regulations by cleansing services contractors were received by the Government in each of the past 5 years? Please provide breakdowns by department, nature of suspected breaches and successfully prosecuted case and reason, as well as details of convictions and penalties of the prosecutions taken out. If figures are not available, what are the reasons? Will such figures be available in future? Asked by: Dr Hon Fernando CHEUNG Chiu-hung (Member Question No. 267) Reply: The Labour Department (LD) does not keep the number of cases of suspected breaches of OSHO and relevant regulations by cleansing services contractors of government departments, or the relevant information requested in the above question. LD devises enforcement, publicity and promotion strategies according to the overall occupational safety and health performance of different industries, such as pest control and cleansing services; and there is currently no plan to collect breakdown figures on government service contractors.
- End -
S e s s i o n 2 1 L W B ( L ) - P a g e 4 0 5
Examination of Estimates of Expenditure 2016-17 Reply Serial No.
LWB(L)134 CONTROLLING OFFICER’S REPLY (Question Serial No. 5967)
Head: (90) Labour Department
Subhead (No. & title): ( )
Programme: (1) Labour Relations
Controlling Officer: Commissioner for Labour (Donald TONG)
Director of Bureau: Secretary for Labour and Welfare Question: Regarding the employees who worked for less than 4 weeks continuously for their employers and/or did not work at least 18 hours per week, and those engaged under short-term contracts of less than 3 months (collectively known as casual workers), (a) please provide breakdowns of the following data by employment contracts of short
duration, short working hours and less than 3 months: (i) ethnic minorities; (ii) new arrivals with less than 7 years’ residence; (iii) family carers; (iv) single parents; (v) persons with disabilities and/or those receiving disability allowances; (vi) employees working across districts and the percentage share of their travelling
expenses to their income; (vii) number of children in their household; (viii) percentage share of their income to the household income; (ix) percentage of those living in public housing estates, rental housing and
self-owned properties; (x) those with their family receiving Comprehensive Social Security Assistance; (xi) those not making Mandatory Provident Fund contribution; and (xii) the amount of loans approved to casual workers with post-secondary degrees and
their average amount of debts; and (b) if the information requested in (a) is not available, will the Government consider
studying the above casual workers’ characteristics for a more comprehensive analysis? Asked by: Dr Hon Fernando CHEUNG Chiu-hung (Member Question No. 176) Reply:

S e s s i o n 2 1 L W B ( L ) - P a g e 4 0 6
The Labour Department and the Census and Statistics Department do not have the data requested in (a). The Government will continue to review from time to time the need to collect various data and information.
- End -
S e s s i o n 2 1 L W B ( L ) - P a g e 4 0 7
Examination of Estimates of Expenditure 2016-17 Reply Serial No.
LWB(L)135 CONTROLLING OFFICER’S REPLY (Question Serial No. 5982)
Head: (90) Labour Department
Subhead (No. & title): ( )
Programme: (2) Employment Services
Controlling Officer: Commissioner for Labour (Donald TONG)
Director of Bureau: Secretary for Labour and Welfare Question: Would the Government provide the annual expenditure and staff establishment of the Selective Placement Division (SPD), and the number of placements secured for job seekers with disabilities by the Division in each of the past 5 years? Asked by: Dr Hon Fernando CHEUNG Chiu-hung (Member Question No. 46) Reply: The annual expenditure and staff establishment of SPD of the Labour Department, and the number of placements secured for job seekers with disabilities by SPD in each of the past 5 years are set out below: Annual expenditure (including staff cost)
Year Actual expenditure 2010-11 $24.26 million 2011-12 $27.84 million 2012-13 $29.29 million 2013-14 $32.51 million 2014-15 $35.88 million
Staff establishment
Grade
Number of staff 2010-11* 2011-12* 2012-13* 2013-14* 2014-15*
Labour Officer Grade staff 22 25 25 26 26 Clerical Grade staff 10 10 10 10 10 Non-civil service contract staff 2 3 2 4 2 Total 34 38 37 40 38
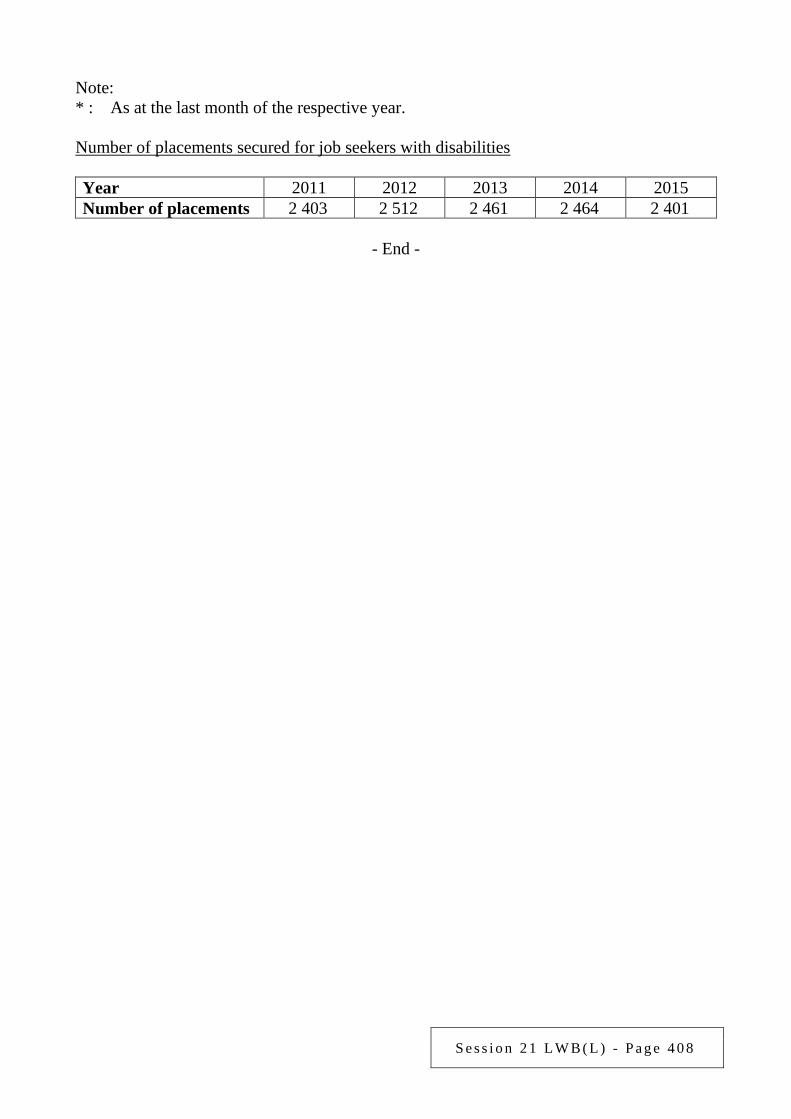
S e s s i o n 2 1 L W B ( L ) - P a g e 4 0 8
Note: * : As at the last month of the respective year. Number of placements secured for job seekers with disabilities Year 2011 2012 2013 2014 2015 Number of placements 2 403 2 512 2 461 2 464 2 401
- End -
S e s s i o n 2 1 L W B ( L ) - P a g e 4 0 9
Examination of Estimates of Expenditure 2016-17 Reply Serial No.
LWB(L)136 CONTROLLING OFFICER’S REPLY (Question Serial No. 6025)
Head: (90) Labour Department
Subhead (No. & title): ( )
Programme: (2) Employment Services
Controlling Officer: Commissioner for Labour (Donald TONG)
Director of Bureau: Secretary for Labour and Welfare Question: (a) What was the number of able-bodied job seekers registered with the Labour
Department (LD) and, among which, the number of placements secured in each of the past 3 years?
(b) What was the number of persons with disabilities from the ethnic minorities who
registered with the Selective Placement Division (SPD) of LD for employment services in each of the past 3 years and, among which, the number of those who succeeded in securing employment, with a breakdown by nationality/ethnic origin (e.g. Indonesians, Filipinos, Indians, Pakistanis, Nepalese, Japanese, Thais, Koreans, other Asians and Caucasians)?
Based on the number of successful placements mentioned in (a) and (b) above, has LD conducted a review or study on whether its services could assist job seekers in securing employment? If yes, what were the results? If not, what were the reasons? Will the Government consider conducting a review or study in future and what are the reasons? Asked by: Dr Hon Fernando CHEUNG Chiu-hung (Member Question No. 357) Reply: The information sought is provided as follows: (a) In the past 3 years (i.e. 2013, 2014 and 2015), 82 748, 75 314 and 67 221 able-bodied
job seekers respectively registered for the employment services of LD. At present, about 99% of the vacancies advertised through LD are displayed with employers’ contact details. Job seekers can make job applications direct to the employers at job fairs or through the Interactive Employment Service website without registering with LD or requesting its referral. In 2013, 2014 and 2015, LD secured 156 727, 151 536 and 148 347 placements for able-bodied job seekers respectively.
S e s s i o n 2 1 L W B ( L ) - P a g e 4 1 0
(b) In the past 3 years (i.e. 2013, 2014 and 2015), the numbers of persons with disabilities from the ethnic minorities who registered with SPD of LD for employment services were 18, 19 and 28 respectively. A breakdown of the placements secured by LD for ethnic minority job seekers with disabilities in the respective years by ethnic origin is provided in the table below:
Ethnic origin
No. of placements 2013 2014 2015
Pakistani 0 0 4 Indonesian 3 0 2 Thai 0 1 2 Indian 0 3 1 Nepalese 1 1 1 Malaysian 0 1 0 Total 4 6 10
LD from time to time reviews and enhances the effectiveness of its employment services for able-bodied job seekers and ethnic minority job seekers with disabilities so as to provide them with appropriate services. For example, for able-bodied job seekers, LD enhances the information and functions provided on the Interactive Employment Service website and mobile applications, having regard to the needs of job seekers. Moreover, vacancy search terminals are installed at various locations of the territory to assist job seekers in searching employment and vacancy information and using simple job matching service, so as to facilitate the dissemination of employment information and enhance the employment opportunities of job seekers. For job seekers with employment difficulties, they can meet the employment officers in job centres to obtain personalised employment advisory service or participate in LD’s employment programmes to enhance their employability. To strengthen employment support for job seekers with higher education, in particular Hong Kong students who are educated in overseas tertiary institutes, the second generation of Hong Kong emigrants who are interested in working in Hong Kong, as well as persons from overseas with higher academic/professional qualifications, LD will set up a dedicated employment information e-platform in the fourth quarter of 2016 to enhance their understanding of the Hong Kong labour market and facilitate their search and application for suitable job openings through the new dedicated webpage. Local job seekers with higher academic qualifications may also use this webpage. Moreover, having regard to the needs of ethnic minority job seekers with disabilities in career choice and job search, LD will reach out to employers of various industries to canvass suitable vacancies for them and assist them in securing employment. To enhance the employability of persons with disabilities, LD will also continue to implement the Work Orientation and Placement Scheme which encourages employers to employ persons with disabilities (including persons with disabilities from the ethnic minorities) through the provision of an allowance. To strengthen employment support for job seekers with disabilities, LD will launch a 2-year pilot scheme in 2016, under which a non-governmental organisation will be engaged to provide support to job seekers with disabilities (including persons with disabilities from the ethnic minorities) in need of counselling service.
- End -
S e s s i o n 2 1 L W B ( L ) - P a g e 4 1 1
Examination of Estimates of Expenditure 2016-17 Reply Serial No.
LWB(L)137 CONTROLLING OFFICER’S REPLY (Question Serial No. 6751)
Head: (90) Labour Department
Subhead (No. & title): ( )
Programme: (2) Employment Services
Controlling Officer: Commissioner for Labour (Donald TONG)
Director of Bureau: Secretary for Labour and Welfare Question: What was the number of able-bodied job seekers registered with the Labour Department (LD) and, among which, the number of placements secured in each of the past 3 years? Asked by: Dr Hon Fernando CHEUNG Chiu-hung (Member Question No. 344) Reply: In the past 3 years (i.e. 2013, 2014 and 2015), 82 748, 75 314 and 67 221 able-bodied job seekers respectively registered for the employment services of LD. At present, about 99% of the vacancies advertised through LD are displayed with employers’ contact details. Job seekers can make job applications direct to the employers at job fairs or through the Interactive Employment Service website without registering with LD or requesting its referral. In 2013, 2014 and 2015, LD secured 156 727, 151 536 and 148 347 placements for able-bodied job seekers respectively.
- End -
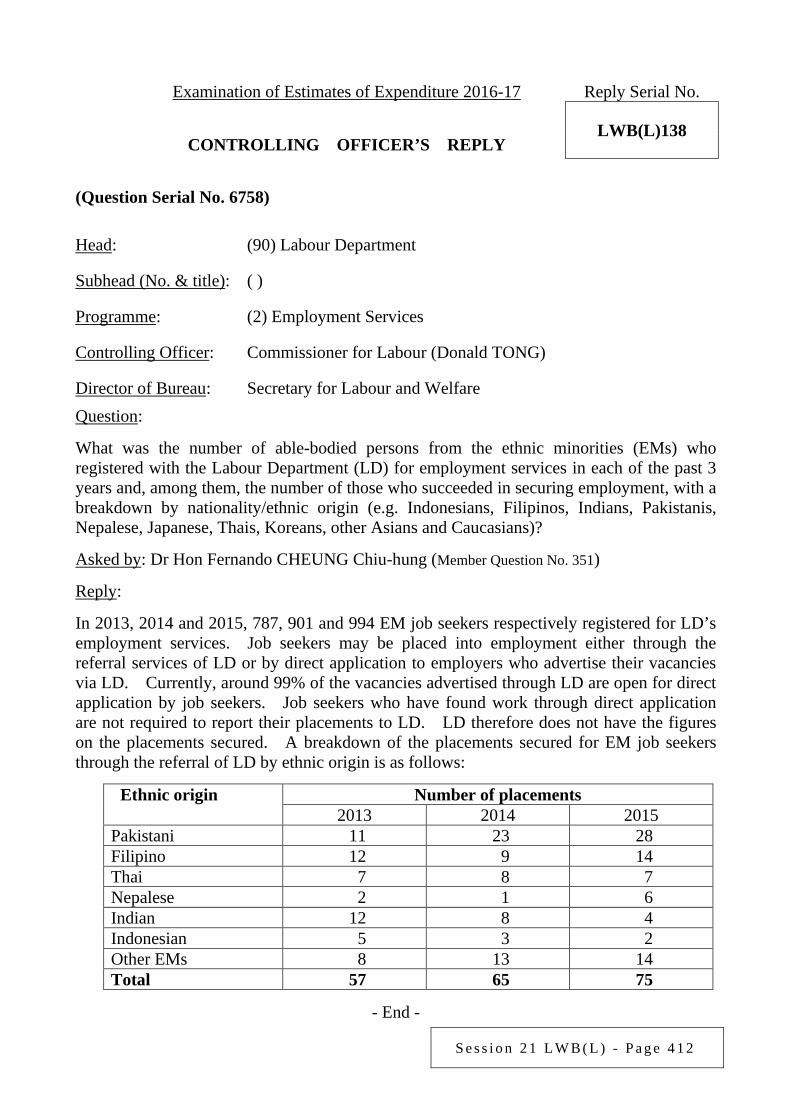
S e s s i o n 2 1 L W B ( L ) - P a g e 4 1 2
Examination of Estimates of Expenditure 2016-17 Reply Serial No.
LWB(L)138 CONTROLLING OFFICER’S REPLY (Question Serial No. 6758)
Head: (90) Labour Department
Subhead (No. & title): ( )
Programme: (2) Employment Services
Controlling Officer: Commissioner for Labour (Donald TONG)
Director of Bureau: Secretary for Labour and Welfare Question: What was the number of able-bodied persons from the ethnic minorities (EMs) who registered with the Labour Department (LD) for employment services in each of the past 3 years and, among them, the number of those who succeeded in securing employment, with a breakdown by nationality/ethnic origin (e.g. Indonesians, Filipinos, Indians, Pakistanis, Nepalese, Japanese, Thais, Koreans, other Asians and Caucasians)? Asked by: Dr Hon Fernando CHEUNG Chiu-hung (Member Question No. 351) Reply: In 2013, 2014 and 2015, 787, 901 and 994 EM job seekers respectively registered for LD’s employment services. Job seekers may be placed into employment either through the referral services of LD or by direct application to employers who advertise their vacancies via LD. Currently, around 99% of the vacancies advertised through LD are open for direct application by job seekers. Job seekers who have found work through direct application are not required to report their placements to LD. LD therefore does not have the figures on the placements secured. A breakdown of the placements secured for EM job seekers through the referral of LD by ethnic origin is as follows:
Ethnic origin Number of placements 2013 2014 2015
Pakistani 11 23 28 Filipino 12 9 14 Thai 7 8 7 Nepalese 2 1 6 Indian 12 8 4 Indonesian 5 3 2 Other EMs 8 13 14 Total 57 65 75
- End -
S e s s i o n 2 1 L W B ( L ) - P a g e 4 1 3
Examination of Estimates of Expenditure 2016-17 Reply Serial No.
LWB(L)139 CONTROLLING OFFICER’S REPLY (Question Serial No. 6764)
Head: (90) Labour Department
Subhead (No. & title): ( )
Programme: (2) Employment Services
Controlling Officer: Commissioner for Labour (Donald TONG)
Director of Bureau: Secretary for Labour and Welfare Question: (a) Does the Labour Department (LD) have any plan to conduct a review on the
Employment Services Ambassador Programme for Ethnic Minorities (ESAP)? If a review has been conducted, what are the findings? If a review is being planned, what are the timing and indicators of the review? If there is no such plan, what are the reasons?
(b) According to some of the groups serving ethnic minorities (EMs), a number of EM job
seekers indicated that the employment services ambassadors (ESAs) for EMs, who were the trainees under the Youth Employment and Training Programme (YETP), failed to assist service users in their job search due to a lack of experience. They also indicated that LD’s existing employment officers failed to understand the needs of EM job seekers due to cultural barriers. Will LD employ experienced employment officers for EMs or set up a dedicated employment services division for EMs so as to assist them in securing employment more effectively? If yes, what are the details? If not, what are the reasons?
Asked by: Dr Hon Fernando CHEUNG Chiu-hung (Member Question No. 359) Reply: The information sought is provided as follows:
(a) Since September 2014, LD has launched the ESAP and employed trainees capable of communicating in EM languages under YETP as ESAs for 6 months. LD has reviewed the effectiveness of the programme on the basis of practical operating experience and data as well as information such as the employment situation of ESAs after on-the-job training. It was found that the responses to the programme were positive. LD has therefore continued to implement the programme and employed 63 trainees, including 15 trainees who were enrolled in phase 4 of the programme and
S e s s i o n 2 1 L W B ( L ) - P a g e 4 1 4
reported duty in March 2016. Having regard to service demand, LD will continue to recruit an appropriate number of EM ESAs to provide services at job centres and industry-based recruitment centres.
(b) LD’s 13 job centres are located across the territory to facilitate the use of employment
services by job seekers (including EMs) living in various districts. Each job centre provides EM job seekers with targeted employment services, such as special counters, resource corners and tailor-made employment briefings. At present, job centres provide employment services for EM job seekers of different ethnic origins with various employment needs through EM ESAs and employment officers as well as the interpretation services offered by non-governmental organisations (NGOs) when necessary. EM ESAs are mainly responsible for receiving EM job seekers, and assisting in handling general enquiries from EM job seekers on LD’s employment services, helping them use the various facilities in job centres/industry-based recruitment centres, and rendering on-site assistance in job fairs. Meanwhile, EM job seekers can meet the employment officers for interviews if they need more in-depth personalised employment advisory service. Employment officers familiar with the local employment market situation will give job search advice, provide information on the employment market and training/retraining courses, and assist them in receiving career aptitude assessment as appropriate. LD has made arrangements with NGOs to provide telephone simultaneous interpretation services, as necessary, for EM job seekers who speak neither Chinese nor English.
To raise the sensitivity of frontline staff to EM culture, LD has invited NGOs familiar
with their culture to organise talks on EM customs and culture as well as skills in communicating with EMs. Moreover, LD will arrange regular training on anti-discrimination legislation for its staff and procure books on serving EM communities for circulation, in order to enhance staff’s understanding of and skills in rendering services to EMs. Meanwhile, the staff at job centres/recruitment centres also get to know the EMs better through collaborating and getting along with EM ESAs of different ethnic origins in their daily work. LD will continue to enhance the employment services for EM job seekers through the existing network of job centres, coupled with appropriate training and the collaboration of EM ESAs.
- End -
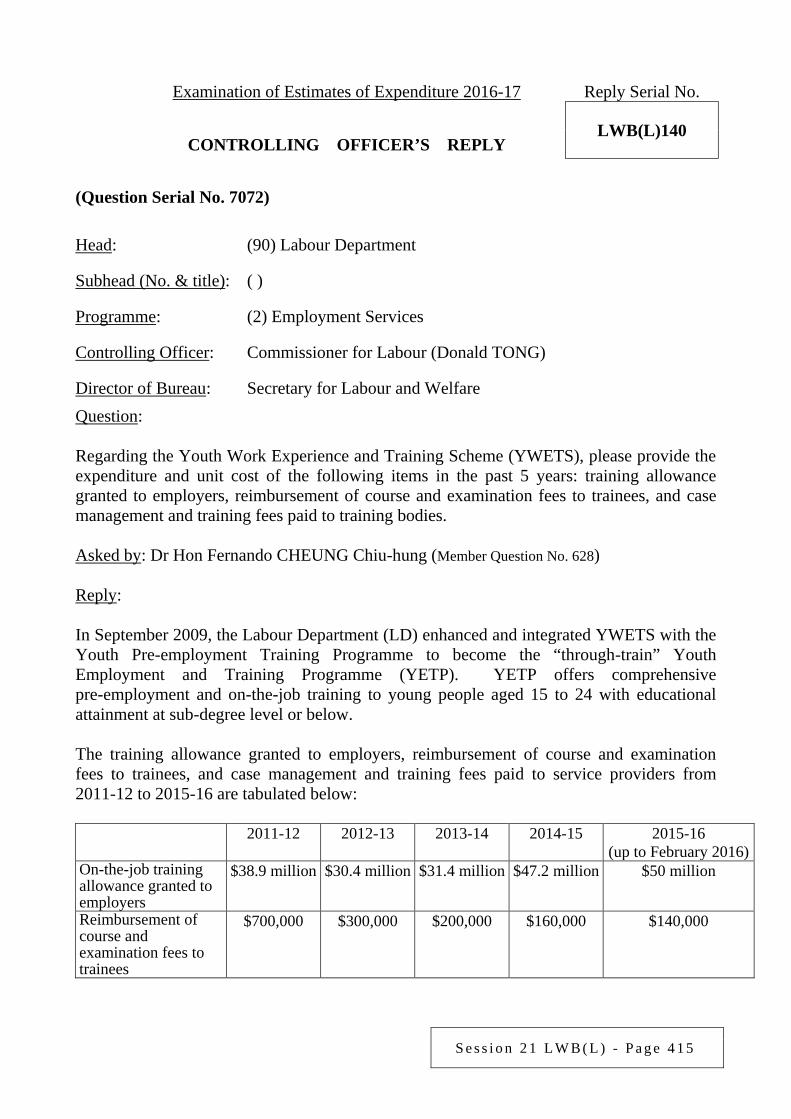
S e s s i o n 2 1 L W B ( L ) - P a g e 4 1 5
Examination of Estimates of Expenditure 2016-17 Reply Serial No.
LWB(L)140 CONTROLLING OFFICER’S REPLY (Question Serial No. 7072)
Head: (90) Labour Department
Subhead (No. & title): ( )
Programme: (2) Employment Services
Controlling Officer: Commissioner for Labour (Donald TONG)
Director of Bureau: Secretary for Labour and Welfare Question: Regarding the Youth Work Experience and Training Scheme (YWETS), please provide the expenditure and unit cost of the following items in the past 5 years: training allowance granted to employers, reimbursement of course and examination fees to trainees, and case management and training fees paid to training bodies. Asked by: Dr Hon Fernando CHEUNG Chiu-hung (Member Question No. 628) Reply: In September 2009, the Labour Department (LD) enhanced and integrated YWETS with the Youth Pre-employment Training Programme to become the “through-train” Youth Employment and Training Programme (YETP). YETP offers comprehensive pre-employment and on-the-job training to young people aged 15 to 24 with educational attainment at sub-degree level or below. The training allowance granted to employers, reimbursement of course and examination fees to trainees, and case management and training fees paid to service providers from 2011-12 to 2015-16 are tabulated below: 2011-12 2012-13 2013-14 2014-15
2015-16
(up to February 2016) On-the-job training allowance granted to employers
$38.9 million $30.4 million $31.4 million
$47.2 million $50 million
Reimbursement of course and examination fees to trainees
$700,000 $300,000 $200,000
$160,000 $140,000
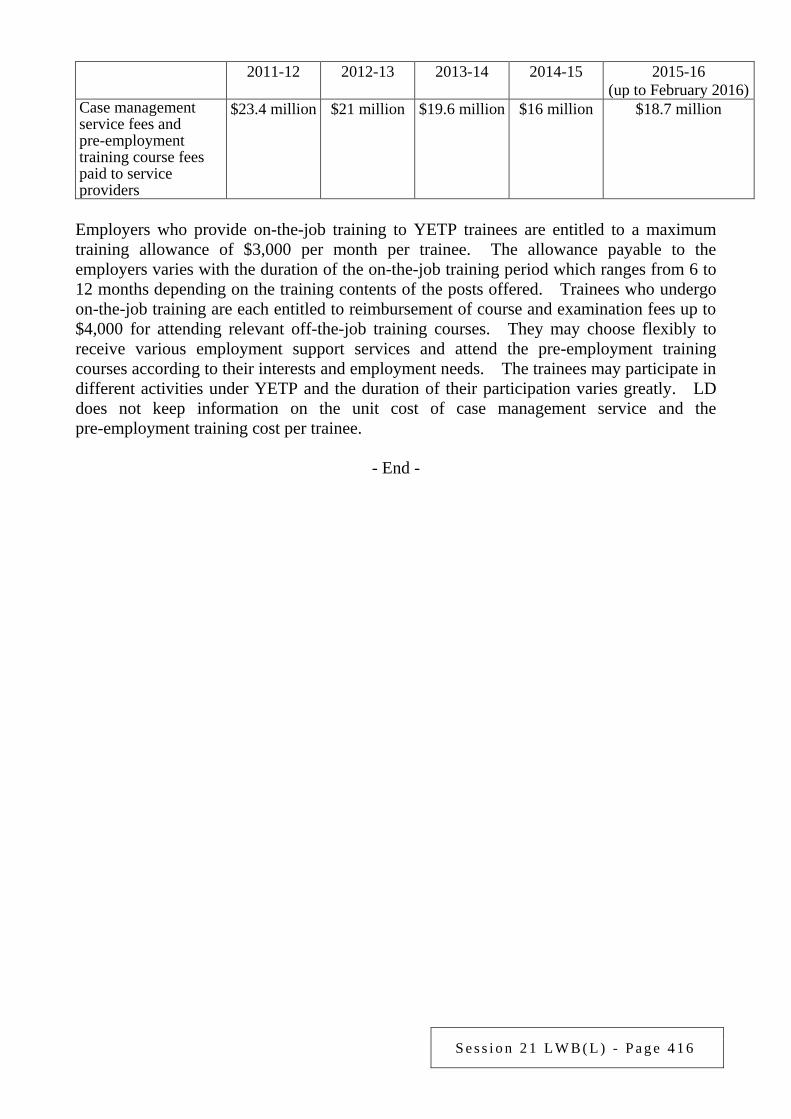
S e s s i o n 2 1 L W B ( L ) - P a g e 4 1 6
2011-12 2012-13 2013-14 2014-15
2015-16 (up to February 2016)
Case management service fees and pre-employment training course fees paid to service providers
$23.4 million $21 million $19.6 million $16 million $18.7 million
Employers who provide on-the-job training to YETP trainees are entitled to a maximum training allowance of $3,000 per month per trainee. The allowance payable to the employers varies with the duration of the on-the-job training period which ranges from 6 to 12 months depending on the training contents of the posts offered. Trainees who undergo on-the-job training are each entitled to reimbursement of course and examination fees up to $4,000 for attending relevant off-the-job training courses. They may choose flexibly to receive various employment support services and attend the pre-employment training courses according to their interests and employment needs. The trainees may participate in different activities under YETP and the duration of their participation varies greatly. LD does not keep information on the unit cost of case management service and the pre-employment training cost per trainee.
- End -
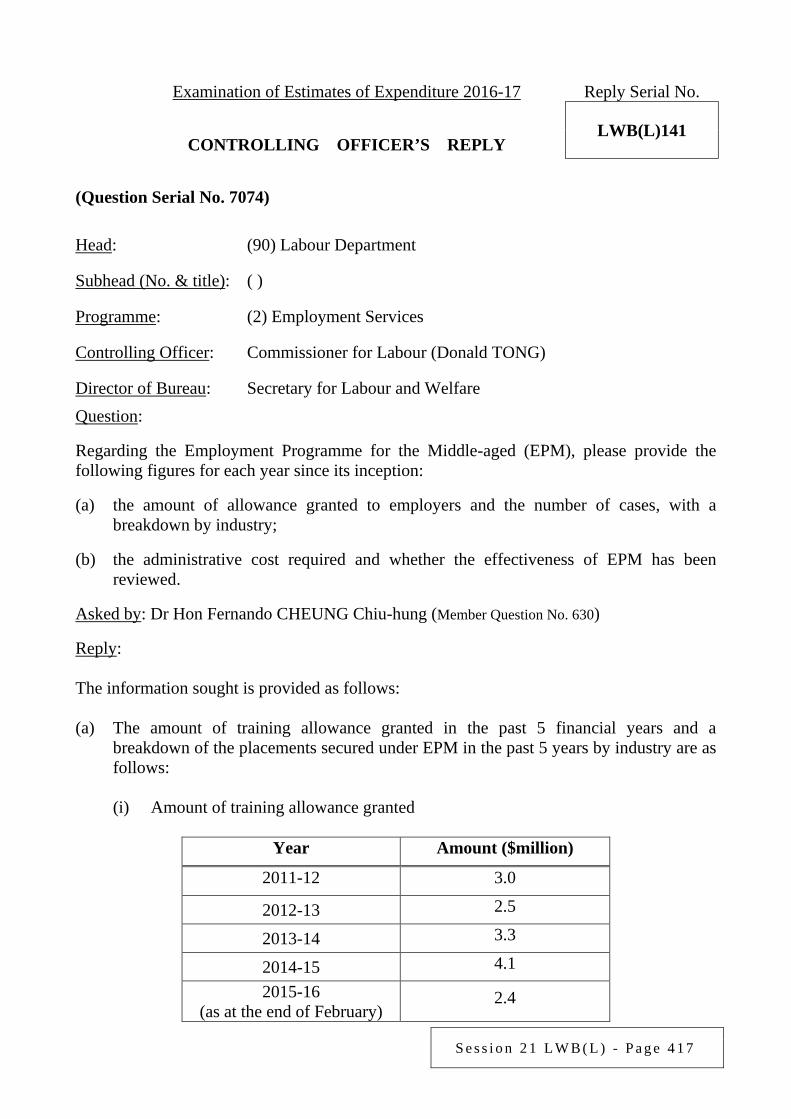
S e s s i o n 2 1 L W B ( L ) - P a g e 4 1 7
Examination of Estimates of Expenditure 2016-17 Reply Serial No.
LWB(L)141 CONTROLLING OFFICER’S REPLY (Question Serial No. 7074)
Head: (90) Labour Department
Subhead (No. & title): ( )
Programme: (2) Employment Services
Controlling Officer: Commissioner for Labour (Donald TONG)
Director of Bureau: Secretary for Labour and Welfare Question: Regarding the Employment Programme for the Middle-aged (EPM), please provide the following figures for each year since its inception: (a) the amount of allowance granted to employers and the number of cases, with a
breakdown by industry; (b) the administrative cost required and whether the effectiveness of EPM has been
reviewed. Asked by: Dr Hon Fernando CHEUNG Chiu-hung (Member Question No. 630) Reply: The information sought is provided as follows: (a) The amount of training allowance granted in the past 5 financial years and a
breakdown of the placements secured under EPM in the past 5 years by industry are as follows:
(i) Amount of training allowance granted
Year Amount ($million)
2011-12 3.0
2012-13 2.5
2013-14 3.3
2014-15 4.1
2015-16 (as at the end of February)
2.4
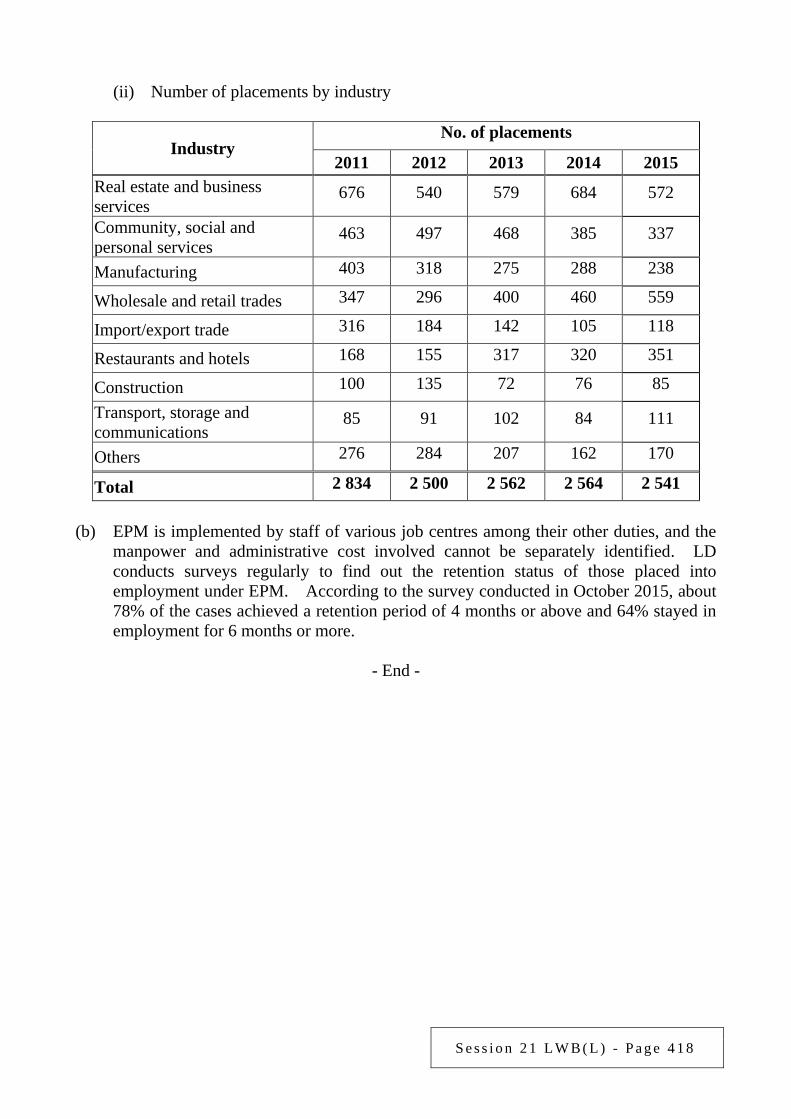
S e s s i o n 2 1 L W B ( L ) - P a g e 4 1 8
(ii) Number of placements by industry
Industry No. of placements
2011 2012 2013 2014 2015 Real estate and business services
676 540 579 684 572
Community, social and personal services
463 497 468 385 337
Manufacturing 403 318 275 288 238
Wholesale and retail trades 347 296 400 460 559
Import/export trade 316 184 142 105 118
Restaurants and hotels 168 155 317 320 351
Construction 100 135 72 76 85
Transport, storage and communications
85 91 102 84 111
Others 276 284 207 162 170
Total 2 834 2 500 2 562 2 564 2 541 (b) EPM is implemented by staff of various job centres among their other duties, and the
manpower and administrative cost involved cannot be separately identified. LD conducts surveys regularly to find out the retention status of those placed into employment under EPM. According to the survey conducted in October 2015, about 78% of the cases achieved a retention period of 4 months or above and 64% stayed in employment for 6 months or more.
- End -
S e s s i o n 2 1 L W B ( L ) - P a g e 4 1 9
Examination of Estimates of Expenditure 2016-17 Reply Serial No.
LWB(L)142 CONTROLLING OFFICER’S REPLY (Question Serial No. 7171)
Head: (90) Labour Department
Subhead (No. & title): ( )
Programme: (4) Employees’ Rights and Benefits
Controlling Officer: Commissioner for Labour (Donald TONG)
Director of Bureau: Secretary for Labour and Welfare Question: (a) Regarding the publicity and educational work relating to foreign domestic helpers
(FDHs), please provide the expenditure involved and specific details in the past 5 years.
(b) Please provide the estimated expenditure and specific details of the publicity and
educational work in the coming year. Asked by: Dr Hon Fernando CHEUNG Chiu-hung (Member Question No. 778) Reply: The information sought is provided as follows: (a) The Labour Department (LD) organises from time to time publicity and educational
activities targeting FDHs and their employers to assist them in understanding their respective rights and obligations under the Employment Ordinance (EO) and the Standard Employment Contract, as well as the consequences of non-compliance, etc. In the past 5 years, besides producing practical guides, leaflets and posters in a number of FDHs’ mother languages, and widely distributing relevant publications at places including the airport (for newly-arrived FDHs through non-government organisations), the consulates concerned and offices of various government departments, LD also uploaded these publicity materials and videos on FDHs’ rights to its website for public viewing. Moreover, LD staged roving exhibitions, placed advertisements in local Indonesian and Filipino newspapers usually read by FDHs and broadcast television and radio Announcements in the Public Interest (APIs) to provide relevant information. In addition to the promotion of employment rights, LD added to its publicity materials such information as methods to deal with situations of intrusion of personal safety and channels for lodging complaints, and widely distributed information cards with points to note for FDHs working in Hong Kong, in order to
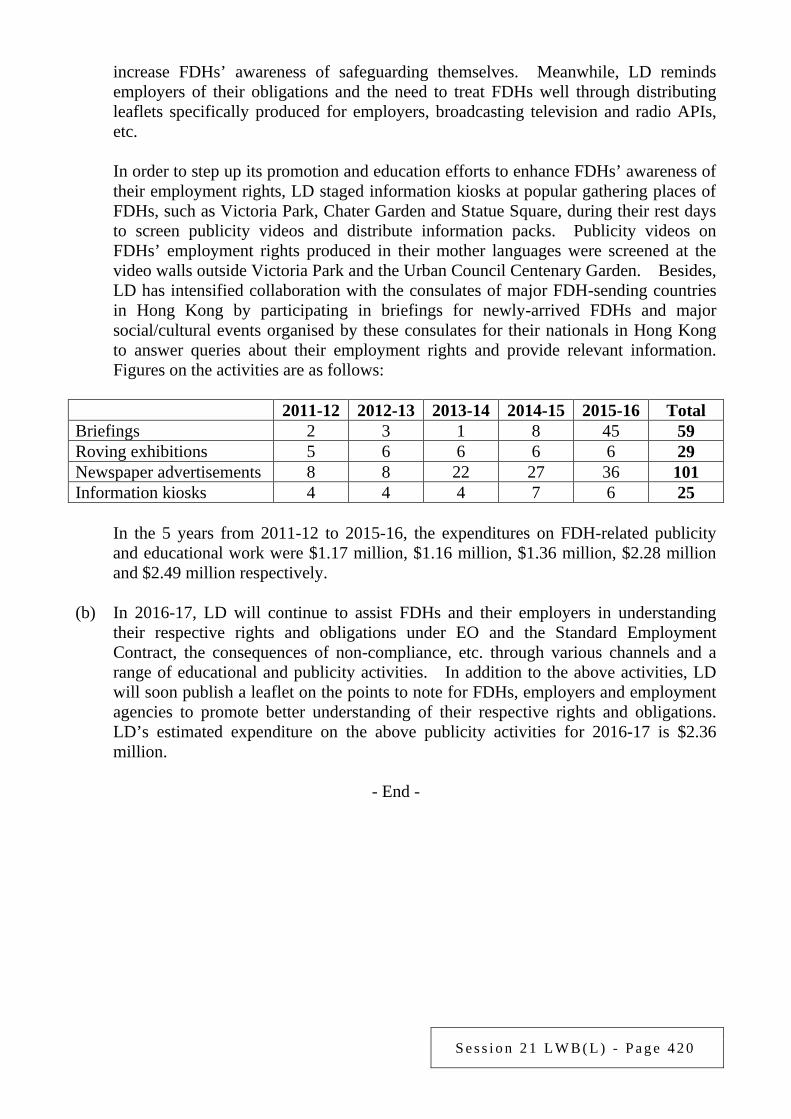
S e s s i o n 2 1 L W B ( L ) - P a g e 4 2 0
increase FDHs’ awareness of safeguarding themselves. Meanwhile, LD reminds employers of their obligations and the need to treat FDHs well through distributing leaflets specifically produced for employers, broadcasting television and radio APIs, etc.
In order to step up its promotion and education efforts to enhance FDHs’ awareness of
their employment rights, LD staged information kiosks at popular gathering places of FDHs, such as Victoria Park, Chater Garden and Statue Square, during their rest days to screen publicity videos and distribute information packs. Publicity videos on FDHs’ employment rights produced in their mother languages were screened at the video walls outside Victoria Park and the Urban Council Centenary Garden. Besides, LD has intensified collaboration with the consulates of major FDH-sending countries in Hong Kong by participating in briefings for newly-arrived FDHs and major social/cultural events organised by these consulates for their nationals in Hong Kong to answer queries about their employment rights and provide relevant information. Figures on the activities are as follows:
2011-12 2012-13 2013-14 2014-15 2015-16 Total Briefings 2 3 1 8 45 59 Roving exhibitions 5 6 6 6 6 29 Newspaper advertisements 8 8 22 27 36 101 Information kiosks 4 4 4 7 6 25
In the 5 years from 2011-12 to 2015-16, the expenditures on FDH-related publicity and educational work were $1.17 million, $1.16 million, $1.36 million, $2.28 million and $2.49 million respectively.
(b) In 2016-17, LD will continue to assist FDHs and their employers in understanding
their respective rights and obligations under EO and the Standard Employment Contract, the consequences of non-compliance, etc. through various channels and a range of educational and publicity activities. In addition to the above activities, LD will soon publish a leaflet on the points to note for FDHs, employers and employment agencies to promote better understanding of their respective rights and obligations. LD’s estimated expenditure on the above publicity activities for 2016-17 is $2.36 million.
- End -
S e s s i o n 2 1 L W B ( L ) - P a g e 4 2 1
Examination of Estimates of Expenditure 2016-17 Reply Serial No.
LWB(L)143 CONTROLLING OFFICER’S REPLY (Question Serial No. 5576)
Head: (90) Labour Department
Subhead (No. & title): (002) Allowances
Programme: (2) Employment Services
Controlling Officer: Commissioner for Labour (Donald TONG)
Director of Bureau: Secretary for Labour and Welfare Question: As mentioned in Head 90 of the 2016-17 Budget, the Labour Department (LD) provides labour market information to ethnic minorities (EMs). In this connection, would the Government advise this Committee: (a) how LD facilitates EMs’ access to information; (b) of the number of cases in which LD’s services were provided to EMs in 2014-15 and
2015-16; and the number of translation and interpretation services used by LD in providing services to them;
(c) of the number of successful placements for EMs among these requests for assistance; (d) of the overall placement rate in the corresponding period of 2014-15? Asked by: Hon CHEUNG Kwok-che (Member Question No. 751) Reply: The information sought is provided as follows: (a) LD canvasses suitable vacancies for EMs on an ongoing basis. Key information
(e.g. post title, industry, working hours, salary, district of work, educational requirements and application procedures) on all vacancies advertised through LD is translated and shown in Chinese and English on the Interactive Employment Service (iES) website, its mobile applications and vacancy search terminals installed at various locations of the territory. A dedicated webpage in English is set up under the iES website to provide employment information to EM job seekers who do not understand Chinese. Apart from a brief introduction on the tailor-made employment services for EMs provided by LD, the dedicated webpage
S e s s i o n 2 1 L W B ( L ) - P a g e 4 2 2
also posts vacancies which are open to applicants with no or little knowledge of Chinese (with all information shown in English), successful employment stories of EMs and information on large-scale and district-based inclusive job fairs.
EM job seekers are also welcome to visit LD’s 13 job centres throughout the
territory or call the Telephone Employment Service to enquire about the details of the vacancies and request for job referrals where necessary. Services are provided by LD staff in Chinese and English. Resource corners are also set up in all job centres to provide employment information to EM job seekers. Tailor-made employment briefings for EMs are regularly organised by job centres to help them understand the latest employment market situation and improve job search skills. Besides, EMs may also meet employment officers for in-depth interviews to obtain personalised job search advice, employment market information and information on training/retraining courses according to their individual needs. LD has also made arrangements with non-governmental organisations (NGOs) to provide telephone simultaneous interpretation service, as necessary, for EM job seekers who speak neither Chinese nor English.
In 2016-17, LD will continue to organise large-scale and district-based inclusive
job fairs in order to enhance the employment opportunities of EMs and facilitate the dissemination of employment information. Job seekers, including EMs, may submit job applications and attend interviews on the spot. Training bodies and social service organisations are also invited to provide information on the courses and support services available to EMs at the inclusive job fairs, so as to assist them in enhancing their job skills. LD will also continue to collaborate with NGOs serving EMs to provide simultaneous interpretation service to EM job seekers at the venues.
In order to promote wider awareness of LD’s employment services among EM job
seekers, relevant publicity materials are translated into English and 6 EM languages (including Hindi, Bahasa Indonesia, Nepali, Tagalog, Thai and Urdu) for distribution through different channels, such as the Support Service Centres for Ethnic Minorities of the Home Affairs Department, the Registration of Persons Office of the Immigration Department, NGOs serving EMs, religious bodies and community networks of the Police Community Relations Office of the Hong Kong Police Force. The electronic version of these materials is uploaded to the Multi-language Platform on the GovHK website and the dedicated webpage for EM job seekers under the iES website for public viewing. The job centres have also established liaison with EM organisations, NGOs serving EMs, religious bodies and schools in their respective districts to disseminate employment information regularly.
(b) In 2014 and 2015, there were respectively 901 and 994 EM job seekers registered
for LD’s employment services. Over the same period, the staff of job centres briefed 313 and 1 467 EM job seekers on the interpretation service and, in light of their needs, arranged interpretation service on 16 and 15 occasions respectively.
S e s s i o n 2 1 L W B ( L ) - P a g e 4 2 3
(c)-(d) In 2014 and 2015, the numbers of placements secured for EM job seekers through LD’s referral services were 65 and 75 respectively. Job seekers may be placed into employment either through the referral services of LD or by direct application to employers who advertise their vacancies via LD. Currently, around 99% of the vacancies advertised through LD are open for direct application by job seekers. Job seekers, including EMs, who have found work through direct application, are not required to report their placements to LD. Therefore, LD does not have figures on the placement rate.
- End -
S e s s i o n 2 1 L W B ( L ) - P a g e 4 2 4
Examination of Estimates of Expenditure 2016-17 Reply Serial No.
LWB(L)144 CONTROLLING OFFICER’S REPLY (Question Serial No. 6522)
Head: (90) Labour Department
Subhead (No. & title): ( )
Programme: (4) Employees’ Rights and Benefits
Controlling Officer: Commissioner for Labour (Donald TONG)
Director of Bureau: Secretary for Labour and Welfare Question: What was the number of employees with disabilities undergoing the productivity assessment of employees with disabilities under the Statutory Minimum Wage (SMW) regime in the past 3 years (with a breakdown by type of disabilities)? What were the numbers of approved assessors conducting the above assessments and assessments conducted each year? What were the assessment results (with a breakdown by degree of productivity) after the above assessments were completed? Asked by: Hon CHEUNG Kwok-che (Member Question No. 1102) Reply: The numbers of employees with disabilities who completed the productivity assessment under the SMW regime, approved assessors conducting these assessments and assessments conducted in 2013, 2014 and 2015 are provided as follows: 2013 2014 2015 No. of employees with disabilities* 68 70 79 No. of approved assessors* 45 53 47 No. of assessments 69 74 81
* Some employees/assessors were involved in more than 1 assessment. A breakdown of the above numbers of employees by type of disabilities is provided as follows:
S e s s i o n 2 1 L W B ( L ) - P a g e 4 2 5
Type of disabilities No. of employees^ 2013 2014 2015
Intellectual disability 52 41 63 Mental illness 12 21 11 Autism 12 5 8 Speech impairment 5 2 4 Physical disability 2 5 3 Hearing impairment 2 1 3 Visceral disability/chronic illness - 5 3 Attention deficit/hyperactivity disorder 1 - - Specific learning difficulties 1 - - Visual impairment - 1 - ^ Some employees had more than 1 type of disabilities.
A breakdown of the above assessments by degree of productivity in the assessment results is provided as follows:
Degree of productivity No. of assessments 2013 2014 2015
50% or below 2 1 - Above 50% - 60% 7 11 6 Above 60% - 70% 27 14 23 Above 70% - 80% 21 24 28 Above 80% - 90% 11 16 19 Above 90% - 100% 1 8 5
Total 69 74 81
- End -
S e s s i o n 2 1 L W B ( L ) - P a g e 4 2 6
Examination of Estimates of Expenditure 2016-17 Reply Serial No.
LWB(L)145 CONTROLLING OFFICER’S REPLY (Question Serial No. 3978)
Head: (90) Labour Department
Subhead (No. & title): (700) General non-recurrent
Programme: (2) Employment Services
Controlling Officer: Commissioner for Labour (Donald TONG)
Director of Bureau: Secretary for Labour and Welfare Question: The Work Incentive Transport Subsidy (WITS) Scheme of the Labour Department has provided applicants the option of applying for the subsidy on an individual or household basis since 2013. Please provide a yearly breakdown of the number of applications and the amount of subsidy granted by individual-based application and household-based application. Asked by: Hon Albert HO Chun-yan (Member Question No. 53) Reply: A breakdown of the numbers of applications received and applications granted the subsidy; as well as the amounts of subsidy granted under the WITS Scheme by individual-based application and household-based application in 2013, 2014 and 2015 is tabulated below:
Year No. of applications*/ Amount of subsidy granted
Individual-based application
Household-based application Total
2013^
No. of applications received 23 436 44 686 68 122 No. of applications granted the subsidy 18 808 44 452 63 260
Amount of subsidy granted ($million) 66.3 213.9 280.2
2014
No. of applications received 51 803 33 175 84 978 No. of applications granted the subsidy 46 576 31 195 77 771
Amount of subsidy granted ($million) 191.8 156.6 348.4
S e s s i o n 2 1 L W B ( L ) - P a g e 4 2 7
Year No. of applications*/ Amount of subsidy granted
Individual-based application
Household-based application Total
2015
No. of applications received 46 968 31 310 78 278 No. of applications granted the subsidy 43 602 28 237 71 839
Amount of subsidy granted ($million) 181.9 146.0 327.9
* Applications received towards year-end may be approved in the following year; and
hence the number of applications granted the subsidy each year does not necessarily reflect the approval results of the applications received in the year.
^ Individual-based applications could be submitted in July 2013 at the earliest for
retrospective subsidy payment from January 2013.
- End -
S e s s i o n 2 1 L W B ( L ) - P a g e 4 2 8
Examination of Estimates of Expenditure 2016-17 Reply Serial No.
LWB(L)146 CONTROLLING OFFICER’S REPLY (Question Serial No. 7202)
Head: (90) Labour Department
Subhead (No. & title): ( )
Programme: (4) Employees’ Rights and Benefits
Controlling Officer: Commissioner for Labour (Donald TONG)
Director of Bureau: Secretary for Labour and Welfare Question: What measures does the Government take to enhance foreign domestic helpers’ (FDHs) understanding of their statutory and contractual rights and obligations? A previous survey showed that FDHs mainly approached consulates and trade unions to get access to the relevant information. What measures does the Government take to reinforce its role in enhancing FDHs’ understanding of the Government’s work? What is the expenditure involved? Asked by: Hon Emily LAU Wai-hing (Member Question No. 23) Reply: The Labour Department (LD) organises from time to time publicity and educational activities targeting FDHs and their employers to assist them in understanding their respective rights and obligations under the Employment Ordinance and the Standard Employment Contract, as well as the consequences of non-compliance, etc. These promotional activities include: production of practical guides, leaflets and posters in a number of FDHs’ mother languages and wide distribution of relevant publications at places including the airport (for newly-arrived FDHs through non-government organisations), the consulates concerned and offices of various government departments. These publicity materials and videos on FDHs’ rights are also uploaded to LD’s website for public viewing. Meanwhile, LD reminds employers of their obligations and the need to treat FDHs well through distributing leaflets specifically for employers and broadcasting television and radio Announcements in the Public Interest (APIs). Since 2014, LD has stepped up its publicity and education efforts to further enhance FDHs’ understanding of their employment rights. Apart from staging roving exhibitions and placing advertisements in local Indonesian and Filipino newspapers usually read by FDHs, LD has increased the frequency of staging information kiosks at popular gathering places of FDHs, such as Victoria Park, Chater Garden and Statue Square, during their rest days to
S e s s i o n 2 1 L W B ( L ) - P a g e 4 2 9
screen publicity videos and distribute information packs. It has also arranged publicity videos on FDHs’ employment rights produced in their mother languages to be screened on the video walls outside Victoria Park and the Urban Council Centenary Park. At the same time, LD has added to its APIs such information as methods to deal with situations of intrusion of personal safety and channels for lodging complaints, so as to increase FDHs’ awareness of safeguarding themselves. Apart from the above activities, LD has also intensified collaboration with the consulates of major FDH-sending countries in Hong Kong by frequently participating in briefings for newly-arrived FDHs and major social/cultural events organised by these consulates for their nationals in Hong Kong to promote among FDHs key information on their employment rights and Government channels for seeking redress. LD also distributes information packs, booklets and information cards with points to note to FDHs working in Hong Kong. Besides, the Government has established a regular liaison mechanism with the consulates concerned for information sharing and coordination of related educational and publicity activities. In 2016-17, LD will continue to carry out the above publicity activities and the estimated expenditure is $2.36 million (excluding staff cost). LD will soon publish and distribute a leaflet on the points to note for FDHs, employers and employment agencies to promote better understanding of their respective rights and obligations.
- End -
S e s s i o n 2 1 L W B ( L ) - P a g e 4 3 0
Examination of Estimates of Expenditure 2016-17 Reply Serial No.
LWB(L)147 CONTROLLING OFFICER’S REPLY (Question Serial No. 7203)
Head: (90) Labour Department
Subhead (No. & title): ( )
Programme: (4) Employees’ Rights and Benefits
Controlling Officer: Commissioner for Labour (Donald TONG)
Director of Bureau: Secretary for Labour and Welfare Question: Regarding intermediaries for foreign domestic helpers (FDHs), would the Government advise this Committee of: (a) the number of intermediaries for FDHs in the past 3 years; (b) the number of complaints against intermediaries for FDHs and, of which, the number
of complaints lodged by FDHs in the past 3 years; (c) the number of inspections to intermediaries for FDHs and, of which, the number of
proactive inspections conducted in the past 3 years; (d) details of the non-compliance cases detected in the above inspections in the past 3
years; (e) the number of prosecutions taken out against intermediaries for FDHs for breaches of
regulations and details of the charges in the past 3 years; (f) the manpower for conducting investigations and inspections to intermediaries for
FDHs in the past 3 years; whether the Government has assessed the adequacy of the existing manpower in handling the cases; and whether it will consider employing additional manpower to address the problem?
Asked by: Hon Emily LAU Wai-hing (Member Question No. 24) Reply: The information sought is provided as follows:
S e s s i o n 2 1 L W B ( L ) - P a g e 4 3 1
(a), (b), (c)&(e): 2013 2014 2015
(a) Number of employment agencies (EAs) which provide FDHs placement service
1 253 1 307 1 342
(b) Number of complaints against EAs which provide FDHs placement service*
194 170 176
(c) Number of inspections to EAs which provide FDHs placement service *
1 013
1 352
1 348
(e) Number of successful prosecutions taken out against EAs which provide FDHs placement service
4
3 11
The breaches involved overcharging of commission from FDHs, unlicensed operation of EAs, failure to display the licence and the schedule specifying the maximum commission which may be received from job seekers, and failure to notify the Labour Department of changes in management within specified time.
* The Labour Department (LD) does not keep a breakdown by identity of complainants or
the number of proactive inspections conducted. (d) In the past 3 years, the breaches of regulations detected by LD’s Employment
Agencies Administration (EAA) during inspections to EAs which provided FDHs placement service mainly included overcharging of commission from FDHs, unlicensed operation of EAs, failure to display the licence and the schedule specifying the maximum commission which may be received from job seekers and failure to maintain proper records.
(f) In 2013-14, 2014-15 and 2015-16, there were respectively 5, 8 and 11 Labour Officer
Grade staff in EAA responsible for the administration of Part XII of the Employment Ordinance and Employment Agency Regulations, and/or other duties such as drafting a code of practice for EAs. LD will review the manpower arrangement as appropriate. In 2016-17, 4 Labour Officer Grade staff will be added to EAA to tighten regulation on EAs.
- End -
S e s s i o n 2 1 L W B ( L ) - P a g e 4 3 2
Examination of Estimates of Expenditure 2016-17 Reply Serial No.
LWB(L)148 CONTROLLING OFFICER’S REPLY (Question Serial No. 7204)
Head: (90) Labour Department
Subhead (No. & title): ( )
Programme: (4) Employees’ Rights and Benefits
Controlling Officer: Commissioner for Labour (Donald TONG)
Director of Bureau: Secretary for Labour and Welfare Question: What were the numbers and details of activities organised by the Government in the past 3 years to promote the rights of foreign domestic helpers (FDHs)? What were the manpower and expenditure involved? Were visits made directly to employment agencies or parks to seek their views? Given the increasing number of FDHs coming to work in Hong Kong, has the Government assessed if there is adequate manpower to handle the promotional work? Will it consider employing additional manpower in this respect? Asked by: Hon Emily LAU Wai-hing (Member Question No. 46) Reply: The Labour Department (LD) organises from time to time publicity and educational activities targeting FDHs and their employers to assist them in understanding their respective rights and obligations under the Employment Ordinance and the Standard Employment Contract, as well as the consequences of non-compliance, etc. In the past 3 years, LD produced practical guides, leaflets and posters in a number of FDHs’ mother languages and widely distributed relevant publications at places including the airport (for newly-arrived FDHs through non-government organisations), the consulates concerned and offices of various government departments. These publicity materials and videos on FDHs’ rights were also uploaded to LD’s website for public viewing. In addition, LD staged roving exhibitions, placed advertisements in local Indonesian and Filipino newspapers usually read by FDHs, and broadcast television and radio Announcements in the Public Interest. At the same time, LD added to its publicity materials such information as methods to deal with situations of intrusion of personal safety and channels for lodging complaints, so as to increase FDHs’ awareness of safeguarding themselves. In order to step up its promotion and education efforts to enhance FDHs’ understanding of their employment rights, LD staged information kiosks at popular gathering places of FDHs, such as Victoria Park, Chater Garden and Statue Square, during their rest days to screen
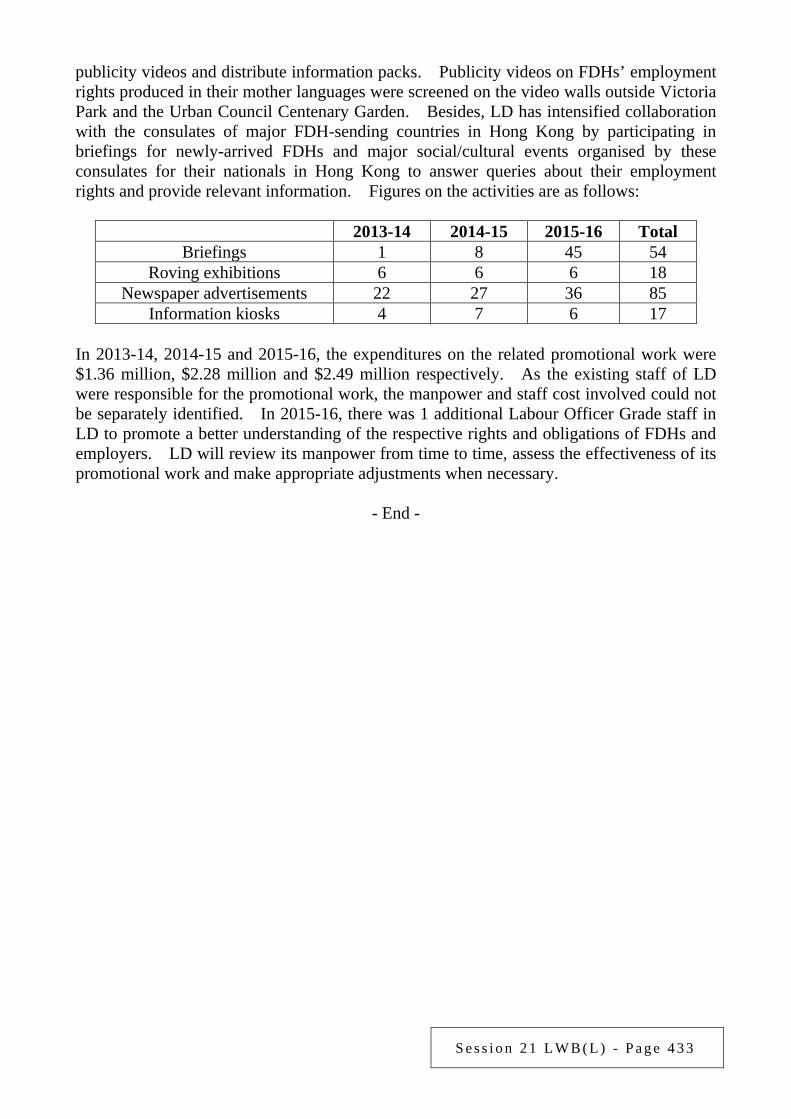
S e s s i o n 2 1 L W B ( L ) - P a g e 4 3 3
publicity videos and distribute information packs. Publicity videos on FDHs’ employment rights produced in their mother languages were screened on the video walls outside Victoria Park and the Urban Council Centenary Garden. Besides, LD has intensified collaboration with the consulates of major FDH-sending countries in Hong Kong by participating in briefings for newly-arrived FDHs and major social/cultural events organised by these consulates for their nationals in Hong Kong to answer queries about their employment rights and provide relevant information. Figures on the activities are as follows:
2013-14 2014-15 2015-16 Total Briefings 1 8 45 54
Roving exhibitions 6 6 6 18 Newspaper advertisements 22 27 36 85
Information kiosks 4 7 6 17 In 2013-14, 2014-15 and 2015-16, the expenditures on the related promotional work were $1.36 million, $2.28 million and $2.49 million respectively. As the existing staff of LD were responsible for the promotional work, the manpower and staff cost involved could not be separately identified. In 2015-16, there was 1 additional Labour Officer Grade staff in LD to promote a better understanding of the respective rights and obligations of FDHs and employers. LD will review its manpower from time to time, assess the effectiveness of its promotional work and make appropriate adjustments when necessary.
- End -
S e s s i o n 2 1 L W B ( L ) - P a g e 4 3 4
Examination of Estimates of Expenditure 2016-17 Reply Serial No.
LWB(L)149 CONTROLLING OFFICER’S REPLY (Question Serial No. 7205)
Head: (90) Labour Department
Subhead (No. & title): ( )
Programme: (4) Employees’ Rights and Benefits
Controlling Officer: Commissioner for Labour (Donald TONG)
Director of Bureau: Secretary for Labour and Welfare Question: In the past 3 years, how many complaints against foreign domestic helpers (FDHs) and their intermediaries were received from employers? What were their percentage share in the total number of complaints? What were the manpower and expenditure involved in handling the related matters? Will the Government allocate additional resources to handle complaints lodged by employers against FDHs and their intermediaries? If yes, what are the details? Asked by: Hon Emily LAU Wai-hing (Member Question No. 47) Reply: In 2013, 2014 and 2015, the Employment Agencies Administration (EAA) of the Labour Department received respectively 194, 170 and 176 complaints against employment agencies (EAs) that provided placement service for FDHs, representing 89%, 93% and 87% of the total number of complaints respectively. EAA does not keep a breakdown by identity of complainants or the statistics on complaints lodged by employers against FDHs. In 2013-14, 2014-15 and 2015-16, there were respectively 5, 8 and 11 Labour Officer Grade staff in EAA. They are responsible for the administration of Part XII of the Employment Ordinance and the Employment Agency Regulations through conducting inspections to EAs and investigating complaints, as well as other duties such as drafting a code of practice for EAs, and hence the manpower and expenditure involved cannot be separately identified. In 2016-17, 4 Labour Officer Grade staff will be added to EAA to tighten regulation on EAs.
- End -

S e s s i o n 2 1 L W B ( L ) - P a g e 4 3 5
Examination of Estimates of Expenditure 2016-17 Reply Serial No.
LWB(L)150 CONTROLLING OFFICER’S REPLY (Question Serial No. 4449)
Head: (90) Labour Department
Subhead (No. & title): (000) Operational expenses
Programme: (3) Safety and Health at Work
Controlling Officer: Commissioner for Labour (Donald TONG)
Director of Bureau: Secretary for Labour and Welfare Question: Under this Programme, there will be a net increase of 19 posts this year. Would the Government advise whether the duties of these new posts will include publicity and enforcement targeting outdoor workplaces with a higher risk of heat stroke? Please provide in table form the estimates on the above work for this year: (a) the manpower, staff establishment, and salary and staff benefits involved in carrying
out the work; (b) the work details and expenditure involved; (c) the number of prosecutions and successful convictions last year. Asked by: Hon LEUNG Kwok-hung (Member Question No. 124) Reply: There will be a net increase of 16 posts in the Labour Department (LD) in 2016-17 to step up efforts in inspections and enforcement as well as publicity and promotion in respect of occupational safety and health (OSH), including publicity and enforcement targeting outdoor workplaces with a higher risk of heat stroke. Other information sought is provided as follows: (a) Publicity and enforcement work on heat stroke prevention is an integral part of LD’s
ongoing OSH work, and the manpower involved cannot be separately identified. (b) In 2016-17, LD will, in collaboration with the Occupational Safety and Health
Council, as well as the relevant workers’ unions and contractors, launch a promotional campaign on heat stroke prevention, targeting sectors which require outdoor work and
S e s s i o n 2 1 L W B ( L ) - P a g e 4 3 6
have a higher risk of heat stroke (such as the construction, cleansing and transport industries). The campaign will include television Announcements in the Public Interest, outreach promotional visits, educational video shows on mobile advertising media, radio broadcast and health talks. The estimated expenditure for the campaign is $1.52 million. LD will also step up inspections to the relevant workplaces in hot season, targeting work processes with a higher risk of heat stroke, including outdoor cleansing work, construction works and transportation work such as airport baggage handling and container handling. The relevant inspection work is an integral part of LD’s ongoing OSH work, and the estimated expenditure involved cannot be separately identified.
(c) LD issued 27 warnings and 1 improvement notice in relation to heat stroke prevention
in 2015. No prosecution was taken out.
- End -

S e s s i o n 2 1 L W B ( L ) - P a g e 4 3 7
Examination of Estimates of Expenditure 2016-17 Reply Serial No.
LWB(L)151 CONTROLLING OFFICER’S REPLY (Question Serial No. 4450)
Head: (90) Labour Department
Subhead (No. & title): (000) Operational expenses
Programme: (4) Employees’ Rights and Benefits
Controlling Officer: Commissioner for Labour (Donald TONG)
Director of Bureau: Secretary for Labour and Welfare Question: One of the work items under this Programme is to provide support for the Standard Working Hours (SWH) Committee. I would like to know: (a) the manpower, staff establishment, and salary and staff benefits involved in carrying
out the work in this year; (b) the details of the work plan and expenditure involved in this year; (c) the arrangements for the above manpower upon expiry of the 3-year term in this year. Asked by: Hon LEUNG Kwok-hung (Member Question No. 125) Reply: The information sought is provided as follows: (a) In 2015-16, the Labour Department (LD) created 16 time-limited posts, comprising 13
Labour Officer Grade posts and 3 General Grade posts, to support the SWH Committee and its related work. The annual salaries (at mid-point) of these posts were $10.80 million. Incumbents of these posts are entitled to staff benefits specified in their terms of appointment and the relevant government rules and regulations.
(b) The SWH Committee is preparing a consultation document on the working hours
policy directions being explored. The second-stage consultation is planned to be launched before the end of April 2016 to collect views from the public and relevant organisations for the SWH Committee’s reference in preparing its report for submission to the Government. LD’s revised estimated expenditure for supporting the SWH Committee and its related work in 2015-16 is $7.32 million (excluding staff cost).

S e s s i o n 2 1 L W B ( L ) - P a g e 4 3 8
(c) LD plans to retain the above 16 time-limited posts in 2016-17 to support the SWH
Committee’s remaining work and follow up on its report.
- End -
S e s s i o n 2 1 L W B ( L ) - P a g e 4 3 9
Examination of Estimates of Expenditure 2016-17 Reply Serial No.
LWB(L)152 CONTROLLING OFFICER’S REPLY (Question Serial No. 4451)
Head: (90) Labour Department
Subhead (No. & title): (000) Operational expenses
Programme: (4) Employees’ Rights and Benefits
Controlling Officer: Commissioner for Labour (Donald TONG)
Director of Bureau: Secretary for Labour and Welfare Question: Targeted operations are mounted by the Labour Department (LD) with the Police and the Immigration Department (ImmD) to combat illegal employment for protecting the job opportunities of local workers. Regarding the work targeting illegal imported workers and employers of illegal workers, please provide: (a) the manpower, staff establishment, and salary and staff benefits involved in carrying
out the work; (b) the total number of inspections conducted last year; (c) a comparison of the numbers of prosecutions taken out and successful convictions
secured against employers and illegal workers in 2014-15 and last year; (d) the nationalities of the illegal workers prosecuted. Asked by: Hon LEUNG Kwok-hung (Member Question No. 126) Reply: The information sought is provided as follows: (a) Combating illegal employment is part of the duties of labour inspectors who are
also responsible for the enforcement of various labour laws. The manpower, staff establishment, salary and staff benefits involved cannot be separately identified.
(b) In 2015, LD mounted 210 joint operations with the Police and ImmD to raid
establishments suspected to have been involved in illegal employment.

S e s s i o n 2 1 L W B ( L ) - P a g e 4 4 0
(c)&(d) Detected cases of illegal employment will be referred to ImmD or the Police for further follow-up. As the investigations and/or prosecutions are undertaken by other law enforcement departments, LD does not have statistics on the prosecution cases and the nationalities of the illegal workers concerned.
- End -
S e s s i o n 2 1 L W B ( L ) - P a g e 4 4 1
Examination of Estimates of Expenditure 2016-17 Reply Serial No.
LWB(L)153 CONTROLLING OFFICER’S REPLY (Question Serial No. 4452)
Head: (90) Labour Department
Subhead (No. & title): (000) Operational expenses
Programme: Not specified
Controlling Officer: Commissioner for Labour (Donald TONG)
Director of Bureau: Secretary for Labour and Welfare Question: The estimate for this year’s general departmental expenses will increase by 18.9% from $263 million to $313 million. Please give reasons for the increase in expenses. Why is last year’s revised expenditure 12.9% lower than the original estimate? Asked by: Hon LEUNG Kwok-hung (Member Question No. 127) Reply: The general departmental expenses of the Labour Department (LD) in 2015-16 have been revised from the original estimate of $303 million to $263 million (a decrease of 12.9%). This is mainly owing to the lower-than-expected expenses on employment programmes, such as a decrease in the number of trainees enrolled under the Youth Employment and Training Programme (YETP). The estimate for the general departmental expenses of LD in 2016-17 is $313 million, representing an increase of 18.9% over the revised estimate for 2015-16. It mainly covers the provision earmarked for enhancing LD’s services and responding to increasing public demand for its services, such as exploring with employers and various organisations to offer a variety of services under YETP so as to provide more young people with appropriate pre-employment training, on-the-job training and employment support services.
- End -
S e s s i o n 2 1 L W B ( L ) - P a g e 4 4 2
Examination of Estimates of Expenditure 2016-17 Reply Serial No.
LWB(L)154 CONTROLLING OFFICER’S REPLY (Question Serial No. 4453)
Head: (90) Labour Department
Subhead (No. & title): ( )
Programme: (3) Safety and Health at Work
Controlling Officer: Commissioner for Labour (Donald TONG)
Director of Bureau: Secretary for Labour and Welfare Question: The Labour Department (LD) strengthens enforcement against industries or establishments with poor safety performance records. In addition to regular surprise inspections, please set out in table form the industries with poor safety performance records, the number of establishments with poor records in the respective industries, as well as the number of special enforcement campaigns launched, prosecutions taken out and convictions secured in the past year. Asked by: Hon LEUNG Kwok-hung (Member Question No. 128) Reply: The construction industry records the highest rate and number of fatal industrial accidents, while the food and beverage services account for the largest number of industrial accidents. The numbers of special enforcement campaigns targeted at these two industries launched by LD in 2015 are provided in the table below:
Industry No. of special enforcement campaigns launched in 2015
Construction 8 Food and beverage services 4
The numbers of prosecutions taken out and convictions secured by LD against employers in the construction industry and food and beverage services in 2015 are provided in the table below:
Industry No. of prosecutions taken out in 2015
No. of convictions secured in 2015*
Construction 2 000 1 384 Food and beverage services 288 265
S e s s i o n 2 1 L W B ( L ) - P a g e 4 4 3
Note: * The trial procedures involved in the prosecutions taken out in 2015
may not be completed in the same year. As a result, the number of convictions secured in 2015 does not correspond to the number of prosecutions taken out in the same year.
LD does not keep the number of establishments with poor safety performance records in the respective industries.
- End -
S e s s i o n 2 1 L W B ( L ) - P a g e 4 4 4
Examination of Estimates of Expenditure 2016-17 Reply Serial No.
LWB(L)155 CONTROLLING OFFICER’S REPLY (Question Serial No. 4755)
Head: (90) Labour Department
Subhead (No. & title): ( )
Programme: (2) Employment Services
Controlling Officer: Commissioner for Labour (Donald TONG)
Director of Bureau: Secretary for Labour and Welfare Question: As mentioned under Matters Requiring Special Attention in 2016-17 in Volume I of the Budget on Page 687, a dedicated employment information e-platform will be established for job seekers with higher education. Regarding the above plan, would the Government provide: (a) the timetable for implementing the plan; (b) the purpose of the plan (please explain clearly the definition of “higher education”
mentioned in Paragraph 14 in Volume I of the Budget on Page 687); (c) the reasons for implementing the plan; (d) the specific details of the plan (for example, if a mobile application for the e-platform
will be provided under the plan, please set out the services under the plan and the channels for providing the services);
(e) the initial cost for the e-platform, including the staff establishment (please set out the
ranks of the staff required, specific details and scope of work, number of staff and their salaries) and other estimated expenditure;
(f) the operating cost of the e-platform, including the staff establishment (please set out
the ranks of the staff required, specific details and scope of work, number of staff and their salaries) and other estimated expenditure;
(g) the anticipated number of beneficiaries of the plan? Asked by: Hon MA Fung-kwok (Member Question No. 58) Reply:
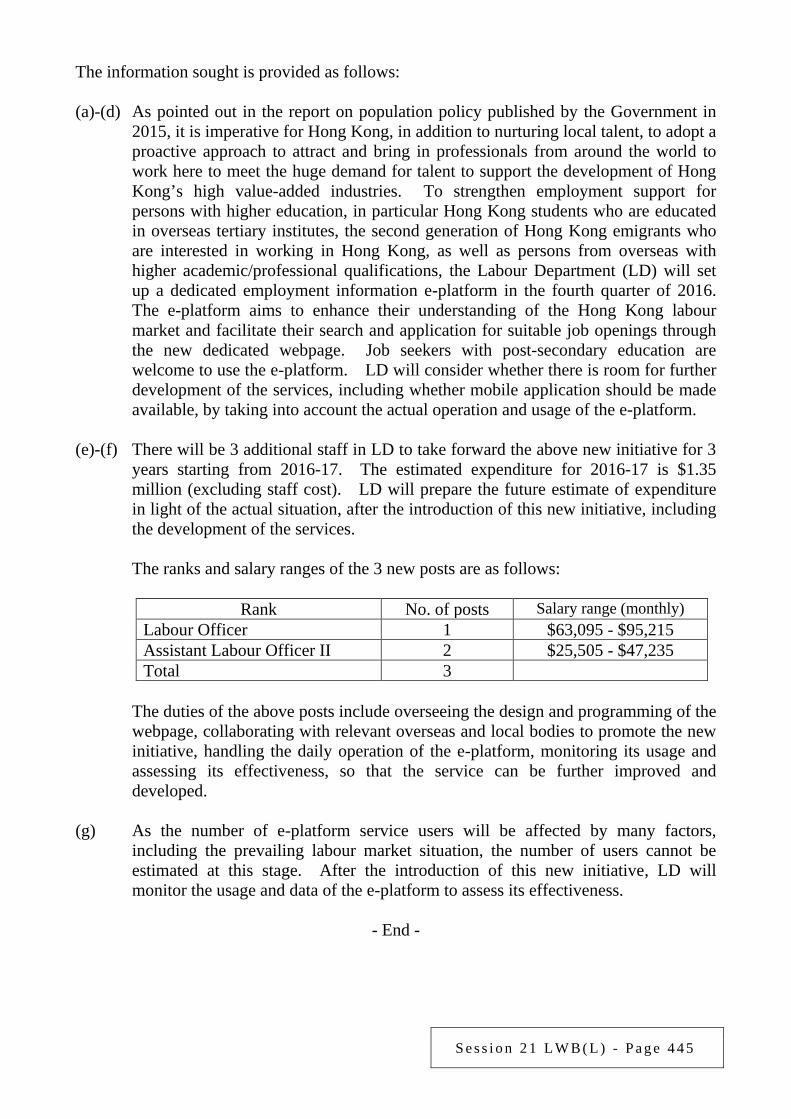
S e s s i o n 2 1 L W B ( L ) - P a g e 4 4 5
The information sought is provided as follows: (a)-(d) As pointed out in the report on population policy published by the Government in
2015, it is imperative for Hong Kong, in addition to nurturing local talent, to adopt a proactive approach to attract and bring in professionals from around the world to work here to meet the huge demand for talent to support the development of Hong Kong’s high value-added industries. To strengthen employment support for persons with higher education, in particular Hong Kong students who are educated in overseas tertiary institutes, the second generation of Hong Kong emigrants who are interested in working in Hong Kong, as well as persons from overseas with higher academic/professional qualifications, the Labour Department (LD) will set up a dedicated employment information e-platform in the fourth quarter of 2016. The e-platform aims to enhance their understanding of the Hong Kong labour market and facilitate their search and application for suitable job openings through the new dedicated webpage. Job seekers with post-secondary education are welcome to use the e-platform. LD will consider whether there is room for further development of the services, including whether mobile application should be made available, by taking into account the actual operation and usage of the e-platform.
(e)-(f) There will be 3 additional staff in LD to take forward the above new initiative for 3
years starting from 2016-17. The estimated expenditure for 2016-17 is $1.35 million (excluding staff cost). LD will prepare the future estimate of expenditure in light of the actual situation, after the introduction of this new initiative, including the development of the services.
The ranks and salary ranges of the 3 new posts are as follows:
Rank No. of posts Salary range (monthly) Labour Officer 1 $63,095 - $95,215 Assistant Labour Officer II 2 $25,505 - $47,235 Total 3
The duties of the above posts include overseeing the design and programming of the
webpage, collaborating with relevant overseas and local bodies to promote the new initiative, handling the daily operation of the e-platform, monitoring its usage and assessing its effectiveness, so that the service can be further improved and developed.
(g) As the number of e-platform service users will be affected by many factors,
including the prevailing labour market situation, the number of users cannot be estimated at this stage. After the introduction of this new initiative, LD will monitor the usage and data of the e-platform to assess its effectiveness.
- End -
S e s s i o n 2 1 L W B ( L ) - P a g e 4 4 6
Examination of Estimates of Expenditure 2016-17 Reply Serial No.
LWB(L)156 CONTROLLING OFFICER’S REPLY (Question Serial No. 4756)
Head: (90) Labour Department
Subhead (No. & title): ( )
Programme: (2) Employment Services
Controlling Officer: Commissioner for Labour (Donald TONG)
Director of Bureau: Secretary for Labour and Welfare Question: As mentioned in the second bullet point of paragraph 14 on page 687 of Volume I of the Estimates, the Government will engage a non-governmental organisation (NGO) under a pilot scheme to help job seekers with disabilities in need of counselling service. Regarding the above pilot scheme, please provide the following information: (a) the implementation timetable for the pilot scheme; (b) the scope and specific details of the counselling service to be provided under the pilot
scheme; (c) the reasons for engaging an NGO to provide supporting counselling services; (d) the staff establishment and estimated expenditure required for the pilot scheme; (e) the expected number of beneficiaries of the pilot scheme; (f) the assessment method, criteria or indicator for the effectiveness of the pilot scheme; (g) the next step to be taken if the pilot scheme achieves positive results. Asked by: Hon MA Fung-kwok (Member Question No. 59) Reply: The information sought is provided as follows: (a)-(c) To strengthen employment support for persons with disabilities who are fit for
open employment, the Labour Department (LD) will launch a 2-year pilot scheme, under which an NGO with relevant professional knowledge and experience in
S e s s i o n 2 1 L W B ( L ) - P a g e 4 4 7
counselling will be engaged to provide needy job seekers with disabilities with intensive psychological/emotional counselling. LD hopes that the counselling service can relieve persons with disabilities of emotional disturbances arising from their disabilities and personal or family problems, so that they can concentrate on job search and adapt to the new job as soon as possible, thereby realising their full potential at work. The scheme is expected to be launched in the third quarter of 2016.
(d) The pilot scheme will be implemented by LD’s existing staff. The estimated
expenditure for procurement of counselling service from the NGO for the 2-year pilot scheme is about $500,000.
(e) It is estimated that about 130 job seekers with disabilities registered with LD for
employment services are in need of the counselling service each year under the pilot scheme.
(f)-(g) Upon completion of the pilot scheme, LD will conduct a review on different
aspects, including factors such as feedback from persons with disabilities who have received the counselling service and the service performance in alleviating their emotional problems, so as to assess the effectiveness of the pilot scheme. LD will map out the way forward in light of the review findings.
- End -
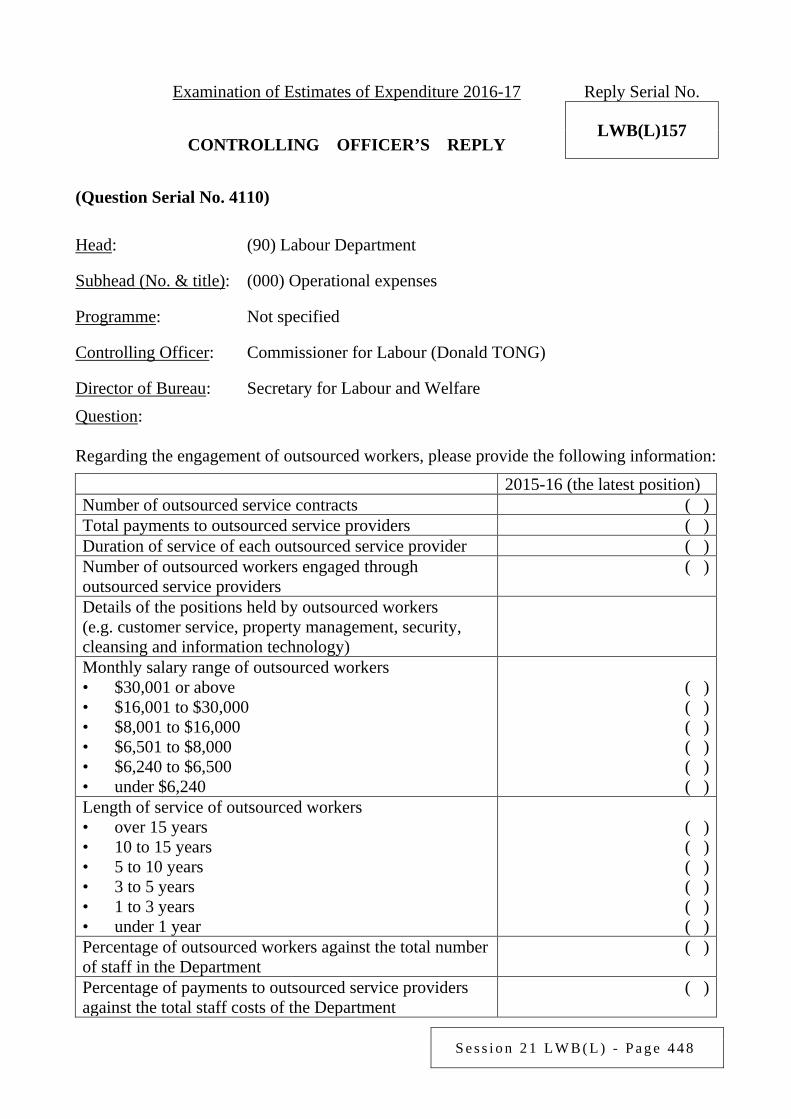
S e s s i o n 2 1 L W B ( L ) - P a g e 4 4 8
Examination of Estimates of Expenditure 2016-17 Reply Serial No.
LWB(L)157 CONTROLLING OFFICER’S REPLY (Question Serial No. 4110)
Head: (90) Labour Department
Subhead (No. & title): (000) Operational expenses
Programme: Not specified
Controlling Officer: Commissioner for Labour (Donald TONG)
Director of Bureau: Secretary for Labour and Welfare Question: Regarding the engagement of outsourced workers, please provide the following information:
2015-16 (the latest position) Number of outsourced service contracts ( ) Total payments to outsourced service providers ( ) Duration of service of each outsourced service provider ( ) Number of outsourced workers engaged through outsourced service providers
( )
Details of the positions held by outsourced workers (e.g. customer service, property management, security, cleansing and information technology)
Monthly salary range of outsourced workers • $30,001 or above • $16,001 to $30,000 • $8,001 to $16,000 • $6,501 to $8,000 • $6,240 to $6,500 • under $6,240
( ) ( ) ( ) ( ) ( ) ( )
Length of service of outsourced workers • over 15 years • 10 to 15 years • 5 to 10 years • 3 to 5 years • 1 to 3 years • under 1 year
( ) ( ) ( ) ( ) ( ) ( )
Percentage of outsourced workers against the total number of staff in the Department
( )
Percentage of payments to outsourced service providers against the total staff costs of the Department
( )
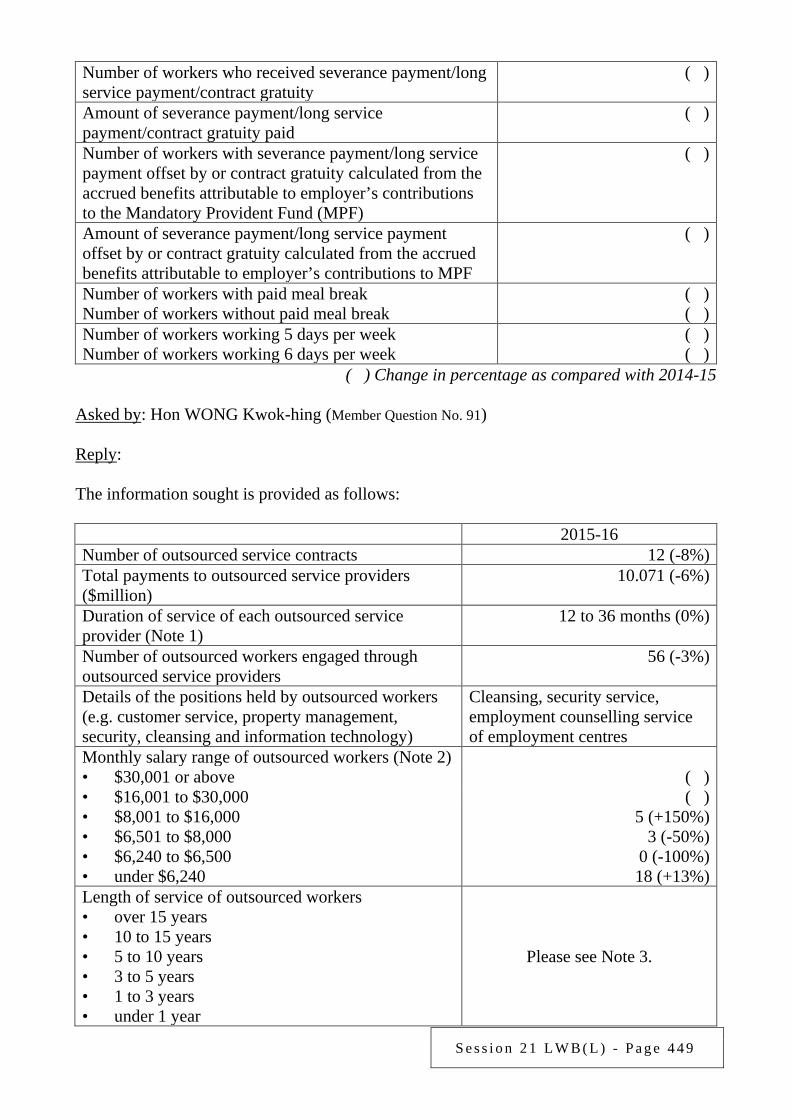
S e s s i o n 2 1 L W B ( L ) - P a g e 4 4 9
Number of workers who received severance payment/long service payment/contract gratuity
( )
Amount of severance payment/long service payment/contract gratuity paid
( )
Number of workers with severance payment/long service payment offset by or contract gratuity calculated from the accrued benefits attributable to employer’s contributions to the Mandatory Provident Fund (MPF)
( )
Amount of severance payment/long service payment offset by or contract gratuity calculated from the accrued benefits attributable to employer’s contributions to MPF
( )
Number of workers with paid meal break Number of workers without paid meal break
( ) ( )
Number of workers working 5 days per week Number of workers working 6 days per week
( ) ( )
( ) Change in percentage as compared with 2014-15 Asked by: Hon WONG Kwok-hing (Member Question No. 91) Reply: The information sought is provided as follows: 2015-16 Number of outsourced service contracts 12 (-8%) Total payments to outsourced service providers ($million)
10.071 (-6%)
Duration of service of each outsourced service provider (Note 1)
12 to 36 months (0%)
Number of outsourced workers engaged through outsourced service providers
56 (-3%)
Details of the positions held by outsourced workers (e.g. customer service, property management, security, cleansing and information technology)
Cleansing, security service, employment counselling service of employment centres
Monthly salary range of outsourced workers (Note 2) • $30,001 or above ( ) • $16,001 to $30,000 ( ) • $8,001 to $16,000 5 (+150%) • $6,501 to $8,000 3 (-50%) • $6,240 to $6,500 0 (-100%) • under $6,240 18 (+13%) Length of service of outsourced workers • over 15 years • 10 to 15 years • 5 to 10 years • 3 to 5 years • 1 to 3 years • under 1 year
Please see Note 3.
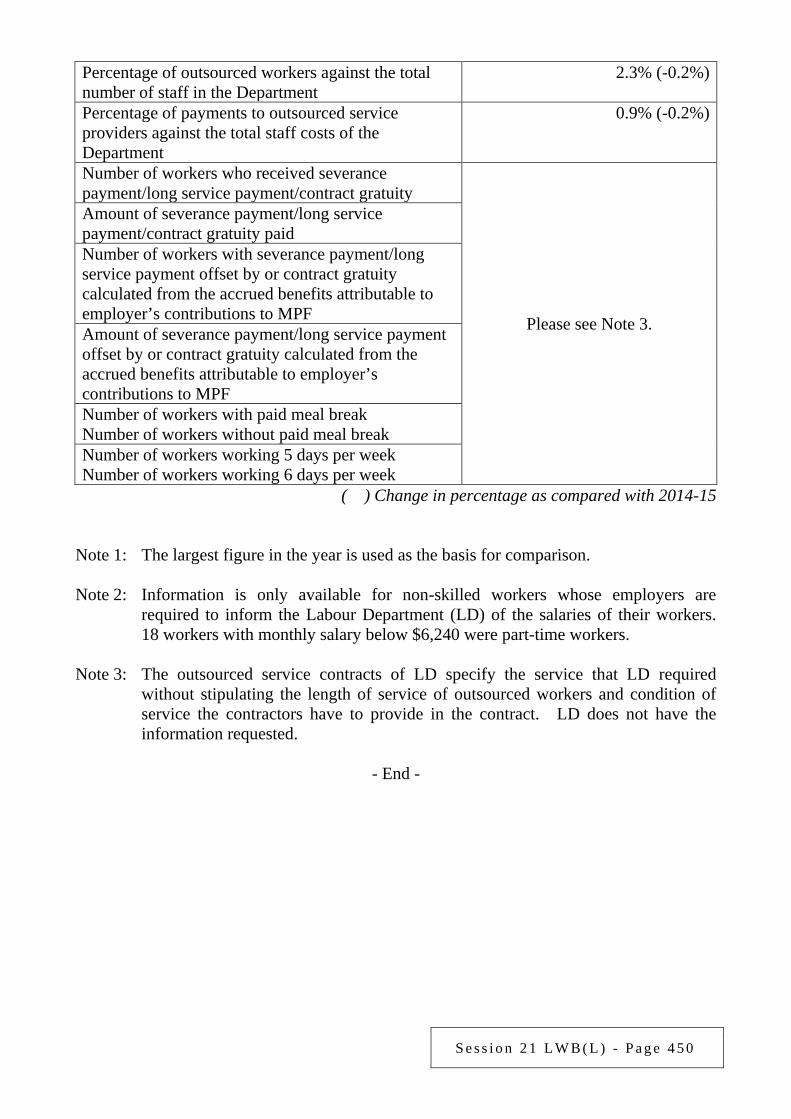
S e s s i o n 2 1 L W B ( L ) - P a g e 4 5 0
Percentage of outsourced workers against the total number of staff in the Department
2.3% (-0.2%)
Percentage of payments to outsourced service providers against the total staff costs of the Department
0.9% (-0.2%)
Number of workers who received severance payment/long service payment/contract gratuity
Please see Note 3.
Amount of severance payment/long service payment/contract gratuity paid Number of workers with severance payment/long service payment offset by or contract gratuity calculated from the accrued benefits attributable to employer’s contributions to MPF Amount of severance payment/long service payment offset by or contract gratuity calculated from the accrued benefits attributable to employer’s contributions to MPF Number of workers with paid meal break Number of workers without paid meal break Number of workers working 5 days per week Number of workers working 6 days per week
( ) Change in percentage as compared with 2014-15 Note 1: The largest figure in the year is used as the basis for comparison. Note 2: Information is only available for non-skilled workers whose employers are
required to inform the Labour Department (LD) of the salaries of their workers. 18 workers with monthly salary below $6,240 were part-time workers.
Note 3: The outsourced service contracts of LD specify the service that LD required
without stipulating the length of service of outsourced workers and condition of service the contractors have to provide in the contract. LD does not have the information requested.
- End -

S e s s i o n 2 1 L W B ( L ) - P a g e 4 5 1
Examination of Estimates of Expenditure 2016-17 Reply Serial No.
LWB(L)158 CONTROLLING OFFICER’S REPLY (Question Serial No. 4111)
Head: (90) Labour Department
Subhead (No. & title): (000) Operational expenses
Programme: Not specified
Controlling Officer: Commissioner for Labour (Donald TONG)
Director of Bureau: Secretary for Labour and Welfare Question: Regarding the engagement of agency workers, please provide the following information:
2015-16 (the latest position) Number of contracts with employment agencies ( ) Contract sum paid to each employment agency ( ) Duration of service of each employment agency ( ) Number of agency workers ( ) Details of the positions held by agency workers Monthly salary range of agency workers • $30,001 or above • $16,001 to $30,000 • $8,001 to $16,000 • $6,501 to $8,000 • $6,240 to $6,500 • under $6,240
( ) ( ) ( ) ( ) ( ) ( )
Length of service of agency workers • over 15 years • 10 to 15 years • 5 to 10 years • 3 to 5 years • 1 to 3 years • under 1 year
( ) ( ) ( ) ( ) ( ) ( )
Percentage of agency workers against the total number of staff in the Department
( )
Percentage of payments to employment agencies against the total staff costs of the Department
( )
Number of workers who received severance payment/long service payment/contract gratuity
( )
Amount of severance payment/long service ( )
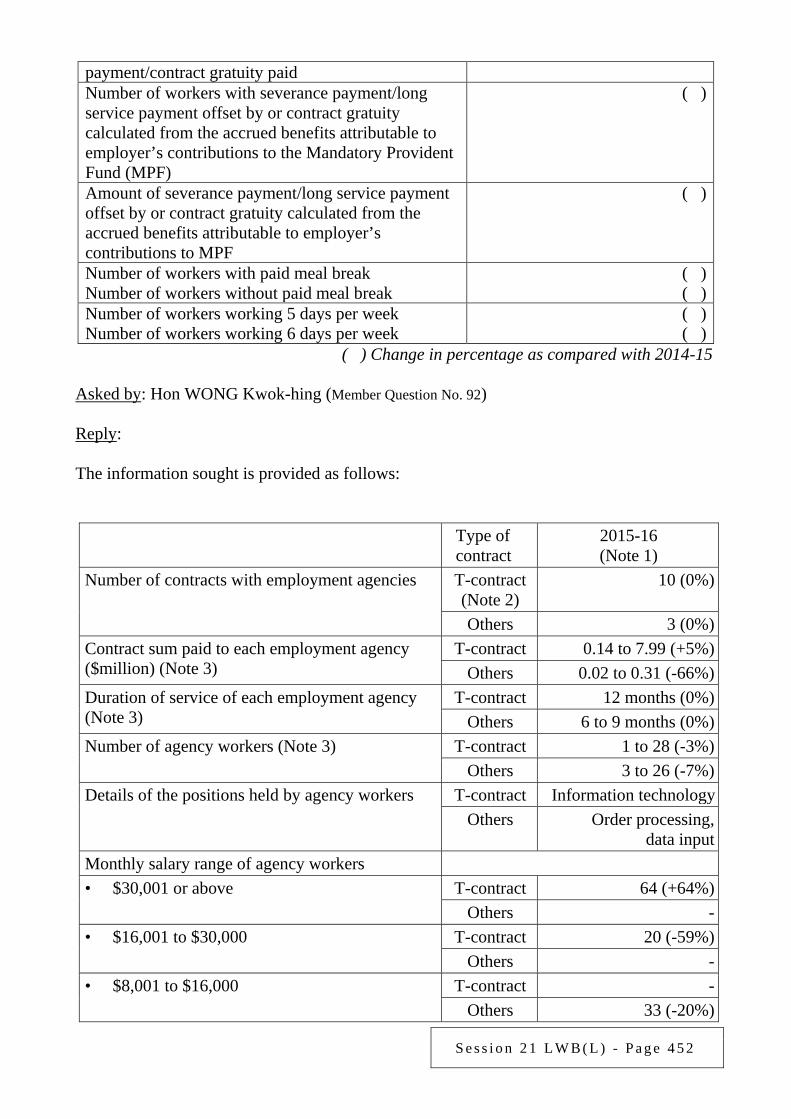
S e s s i o n 2 1 L W B ( L ) - P a g e 4 5 2
payment/contract gratuity paid Number of workers with severance payment/long service payment offset by or contract gratuity calculated from the accrued benefits attributable to employer’s contributions to the Mandatory Provident Fund (MPF)
( )
Amount of severance payment/long service payment offset by or contract gratuity calculated from the accrued benefits attributable to employer’s contributions to MPF
( )
Number of workers with paid meal break Number of workers without paid meal break
( ) ( )
Number of workers working 5 days per week Number of workers working 6 days per week
( ) ( )
( ) Change in percentage as compared with 2014-15
Asked by: Hon WONG Kwok-hing (Member Question No. 92) Reply: The information sought is provided as follows:
Type of contract
2015-16 (Note 1)
Number of contracts with employment agencies T-contract (Note 2)
10 (0%)
Others 3 (0%) Contract sum paid to each employment agency ($million) (Note 3)
T-contract 0.14 to 7.99 (+5%) Others 0.02 to 0.31 (-66%)
Duration of service of each employment agency (Note 3)
T-contract 12 months (0%) Others 6 to 9 months (0%)
Number of agency workers (Note 3) T-contract 1 to 28 (-3%) Others 3 to 26 (-7%)
Details of the positions held by agency workers T-contract Information technology Others Order processing,
data input Monthly salary range of agency workers • $30,001 or above T-contract 64 (+64%)
Others - • $16,001 to $30,000 T-contract 20 (-59%)
Others - • $8,001 to $16,000 T-contract -
Others 33 (-20%)
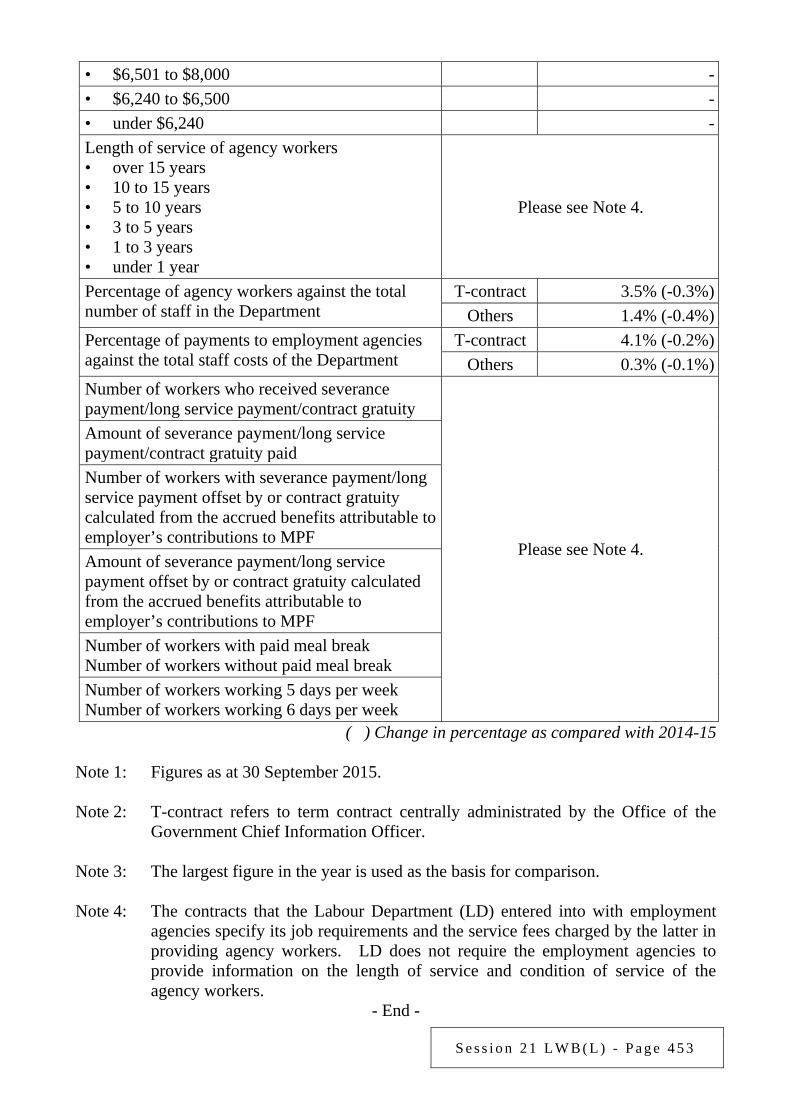
S e s s i o n 2 1 L W B ( L ) - P a g e 4 5 3
• $6,501 to $8,000 - • $6,240 to $6,500 - • under $6,240 - Length of service of agency workers • over 15 years • 10 to 15 years • 5 to 10 years • 3 to 5 years • 1 to 3 years • under 1 year
Please see Note 4.
Percentage of agency workers against the total number of staff in the Department
T-contract 3.5% (-0.3%) Others 1.4% (-0.4%)
Percentage of payments to employment agencies against the total staff costs of the Department
T-contract 4.1% (-0.2%) Others 0.3% (-0.1%)
Number of workers who received severance payment/long service payment/contract gratuity
Please see Note 4.
Amount of severance payment/long service payment/contract gratuity paid Number of workers with severance payment/long service payment offset by or contract gratuity calculated from the accrued benefits attributable to employer’s contributions to MPF Amount of severance payment/long service payment offset by or contract gratuity calculated from the accrued benefits attributable to employer’s contributions to MPF Number of workers with paid meal break Number of workers without paid meal break Number of workers working 5 days per week Number of workers working 6 days per week
( ) Change in percentage as compared with 2014-15 Note 1: Figures as at 30 September 2015. Note 2: T-contract refers to term contract centrally administrated by the Office of the
Government Chief Information Officer. Note 3: The largest figure in the year is used as the basis for comparison. Note 4: The contracts that the Labour Department (LD) entered into with employment
agencies specify its job requirements and the service fees charged by the latter in providing agency workers. LD does not require the employment agencies to provide information on the length of service and condition of service of the agency workers.
- End -
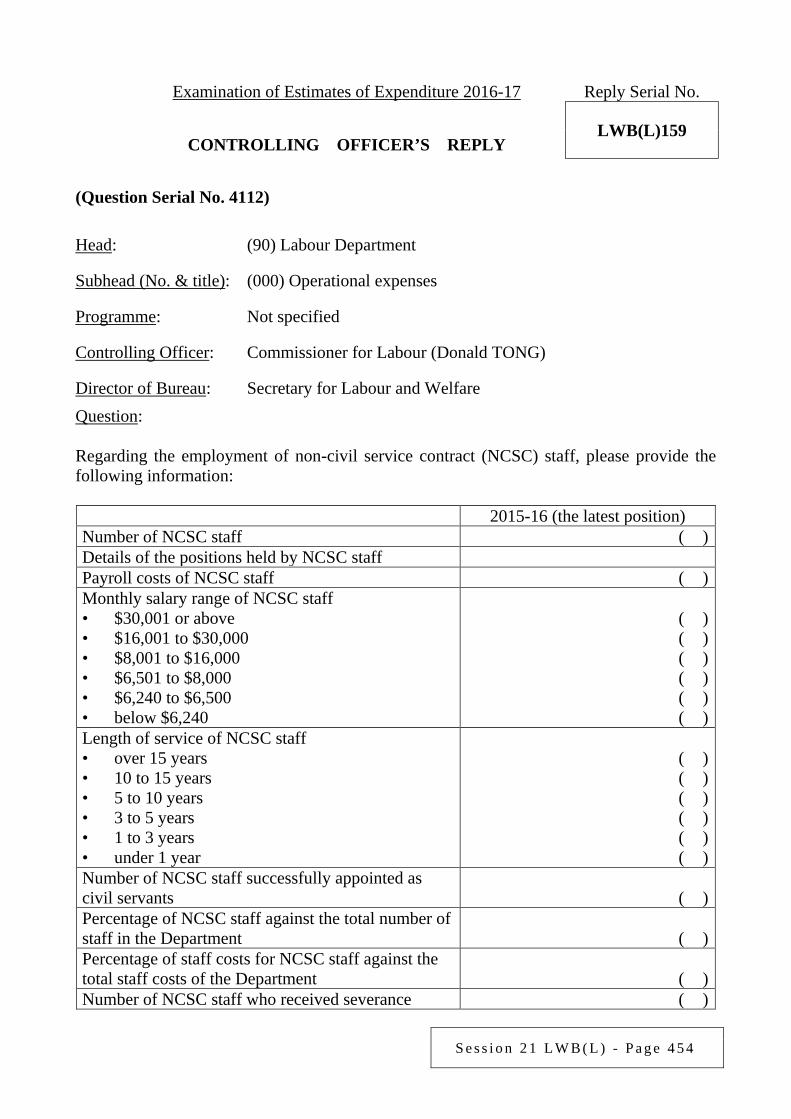
S e s s i o n 2 1 L W B ( L ) - P a g e 4 5 4
Examination of Estimates of Expenditure 2016-17 Reply Serial No.
LWB(L)159 CONTROLLING OFFICER’S REPLY (Question Serial No. 4112)
Head: (90) Labour Department
Subhead (No. & title): (000) Operational expenses
Programme: Not specified
Controlling Officer: Commissioner for Labour (Donald TONG)
Director of Bureau: Secretary for Labour and Welfare Question: Regarding the employment of non-civil service contract (NCSC) staff, please provide the following information: 2015-16 (the latest position) Number of NCSC staff ( ) Details of the positions held by NCSC staff Payroll costs of NCSC staff ( ) Monthly salary range of NCSC staff • $30,001 or above • $16,001 to $30,000 • $8,001 to $16,000 • $6,501 to $8,000 • $6,240 to $6,500 • below $6,240
( ) ( ) ( ) ( ) ( ) ( )
Length of service of NCSC staff • over 15 years • 10 to 15 years • 5 to 10 years • 3 to 5 years • 1 to 3 years • under 1 year
( ) ( ) ( ) ( )
( ) ( )
Number of NCSC staff successfully appointed as civil servants ( ) Percentage of NCSC staff against the total number of staff in the Department ( ) Percentage of staff costs for NCSC staff against the total staff costs of the Department ( ) Number of NCSC staff who received severance ( )
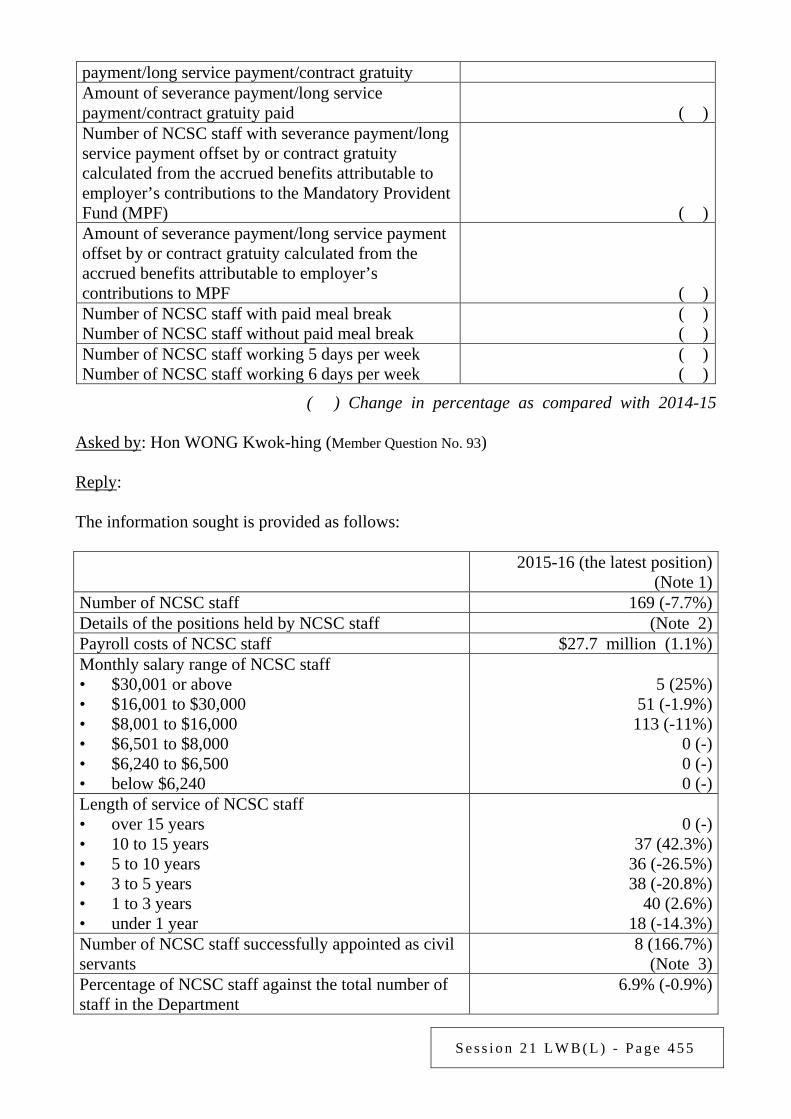
S e s s i o n 2 1 L W B ( L ) - P a g e 4 5 5
payment/long service payment/contract gratuity Amount of severance payment/long service payment/contract gratuity paid ( ) Number of NCSC staff with severance payment/long service payment offset by or contract gratuity calculated from the accrued benefits attributable to employer’s contributions to the Mandatory Provident Fund (MPF) ( ) Amount of severance payment/long service payment offset by or contract gratuity calculated from the accrued benefits attributable to employer’s contributions to MPF ( ) Number of NCSC staff with paid meal break Number of NCSC staff without paid meal break
( ) ( )
Number of NCSC staff working 5 days per week Number of NCSC staff working 6 days per week
( ) ( )
( ) Change in percentage as compared with 2014-15 Asked by: Hon WONG Kwok-hing (Member Question No. 93) Reply: The information sought is provided as follows: 2015-16 (the latest position)
(Note 1) Number of NCSC staff 169 (-7.7%) Details of the positions held by NCSC staff (Note 2) Payroll costs of NCSC staff $27.7 million (1.1%) Monthly salary range of NCSC staff • $30,001 or above • $16,001 to $30,000 • $8,001 to $16,000 • $6,501 to $8,000 • $6,240 to $6,500 • below $6,240
5 (25%)
51 (-1.9%) 113 (-11%)
0 (-) 0 (-) 0 (-)
Length of service of NCSC staff • over 15 years • 10 to 15 years • 5 to 10 years • 3 to 5 years • 1 to 3 years • under 1 year
0 (-)
37 (42.3%) 36 (-26.5%) 38 (-20.8%) 40 (2.6%)
18 (-14.3%) Number of NCSC staff successfully appointed as civil servants
8 (166.7%) (Note 3)
Percentage of NCSC staff against the total number of staff in the Department
6.9% (-0.9%)
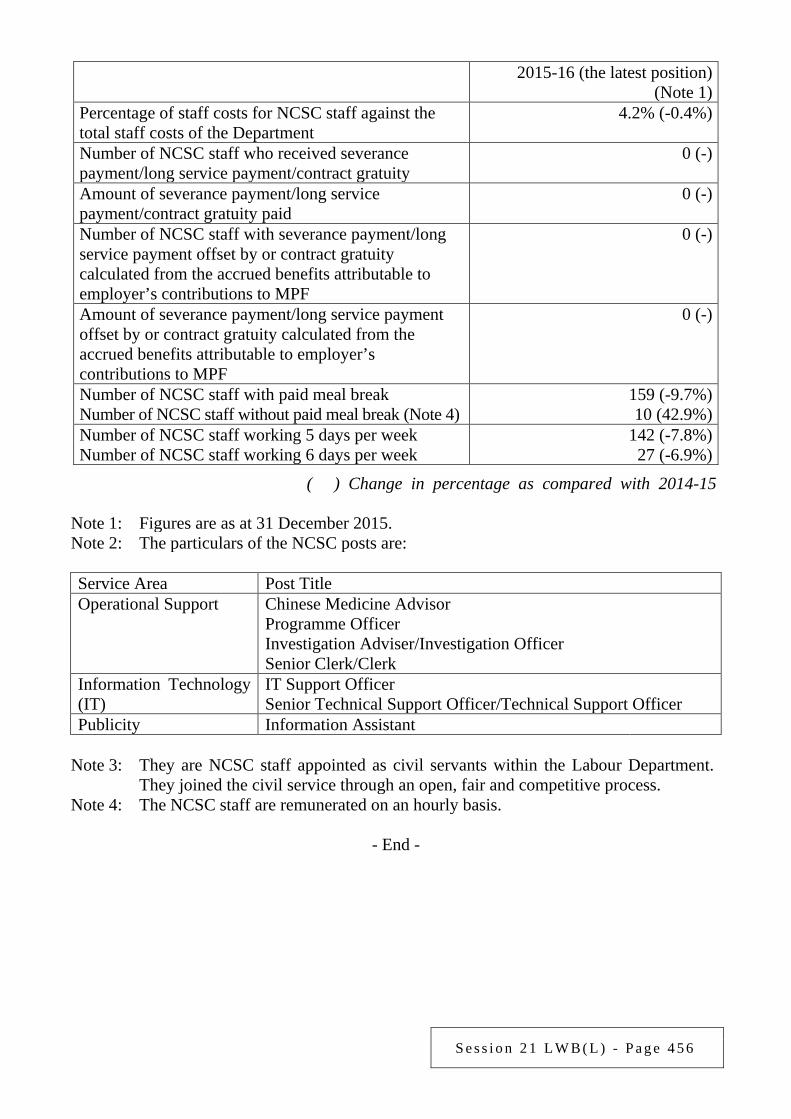
S e s s i o n 2 1 L W B ( L ) - P a g e 4 5 6
2015-16 (the latest position) (Note 1)
Percentage of staff costs for NCSC staff against the total staff costs of the Department
4.2% (-0.4%)
Number of NCSC staff who received severance payment/long service payment/contract gratuity
0 (-)
Amount of severance payment/long service payment/contract gratuity paid
0 (-)
Number of NCSC staff with severance payment/long service payment offset by or contract gratuity calculated from the accrued benefits attributable to employer’s contributions to MPF
0 (-)
Amount of severance payment/long service payment offset by or contract gratuity calculated from the accrued benefits attributable to employer’s contributions to MPF
0 (-)
Number of NCSC staff with paid meal break Number of NCSC staff without paid meal break (Note 4)
159 (-9.7%) 10 (42.9%)
Number of NCSC staff working 5 days per week Number of NCSC staff working 6 days per week
142 (-7.8%) 27 (-6.9%)
( ) Change in percentage as compared with 2014-15
Note 1: Figures are as at 31 December 2015. Note 2: The particulars of the NCSC posts are: Service Area Post Title Operational Support Chinese Medicine Advisor
Programme Officer Investigation Adviser/Investigation Officer Senior Clerk/Clerk
Information Technology (IT)
IT Support Officer Senior Technical Support Officer/Technical Support Officer
Publicity Information Assistant
Note 3: They are NCSC staff appointed as civil servants within the Labour Department. They joined the civil service through an open, fair and competitive process.
Note 4: The NCSC staff are remunerated on an hourly basis.
- End -
S e s s i o n 2 1 L W B ( L ) - P a g e 4 5 7
Examination of Estimates of Expenditure 2016-17 Reply Serial No.
LWB(L)160 CONTROLLING OFFICER’S REPLY (Question Serial No. 7214)
Head: (90) Labour Department
Subhead (No. & title): ( )
Programme: (1) Labour Relations (2) Employment Services
Controlling Officer: Commissioner for Labour (Donald TONG)
Director of Bureau: Secretary for Labour and Welfare Question: Please provide a breakdown of the number of vacancies open to persons aged 50 or above in the market in each of the past 3 years by industry and job title. If such figures are not available, will the Government consider allocating additional resources, conducting relevant surveys and updating those figures yearly, so as to have an understanding of the effectiveness of the publicity for elderly employment, the incentive for enterprises and employers to employ mature persons, and whether there are enough vacancies in the market for mature employees to choose, in order to support them to stay in the employment market? Asked by: Hon WONG Kwok-kin (Member Question No. 20) Reply: At present, employers can adopt various channels, either separately or concurrently, to recruit staff. The free recruitment service of the Labour Department (LD) is only one of the channels, and therefore the vacancies received do not necessarily reflect the overall labour market situation. Besides, employers who use the recruitment service are requested by LD to fulfil the statutory requirements and follow the relevant codes of practice against discrimination in employment. If LD finds any age restriction or discriminatory terms or requirements in vetting the vacancy information submitted by employers, it will not accept or display such vacancies unless the terms or requirements are based on genuine job needs. LD generally does not advertise vacancies with an age restriction and does not keep information on job openings for persons aged 50 or above. In addition, to attract mature persons to stay in or return to the employment market, LD has encouraged employers, through various publicity channels and a range of educational and promotional activities, to adopt friendly employment practices for mature persons at workplaces, having regard to the individual circumstances of their enterprises. LD will also collect feedback from various stakeholders from time to time to help assess the

S e s s i o n 2 1 L W B ( L ) - P a g e 4 5 8
effectiveness of its promotional work for friendly employment practices for mature persons and adjust the promotional strategy.
- End -
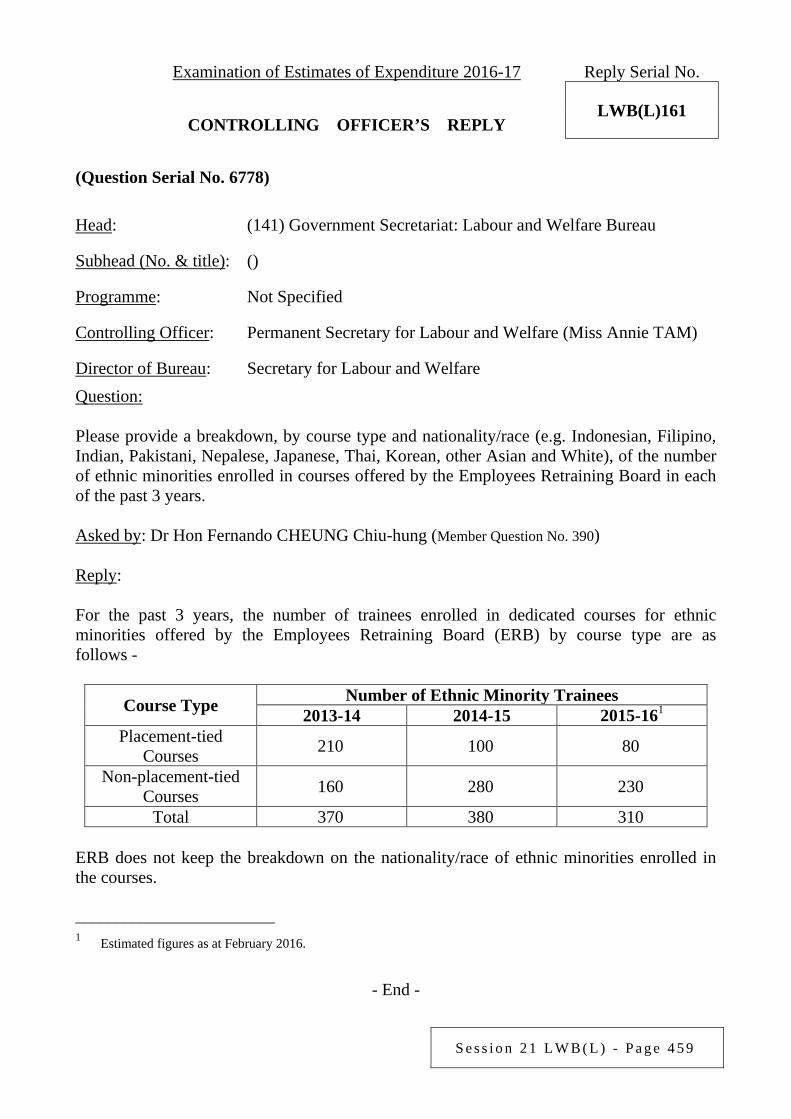
S e s s i o n 2 1 L W B ( L ) - P a g e 4 5 9
Examination of Estimates of Expenditure 2016-17 Reply Serial No.
LWB(L)161 CONTROLLING OFFICER’S REPLY (Question Serial No. 6778)
Head: (141) Government Secretariat: Labour and Welfare Bureau
Subhead (No. & title): ()
Programme: Not Specified
Controlling Officer: Permanent Secretary for Labour and Welfare (Miss Annie TAM)
Director of Bureau: Secretary for Labour and Welfare Question: Please provide a breakdown, by course type and nationality/race (e.g. Indonesian, Filipino, Indian, Pakistani, Nepalese, Japanese, Thai, Korean, other Asian and White), of the number of ethnic minorities enrolled in courses offered by the Employees Retraining Board in each of the past 3 years. Asked by: Dr Hon Fernando CHEUNG Chiu-hung (Member Question No. 390) Reply: For the past 3 years, the number of trainees enrolled in dedicated courses for ethnic minorities offered by the Employees Retraining Board (ERB) by course type are as follows -
Course Type Number of Ethnic Minority Trainees 2013-14 2014-15 2015-161
Placement-tied Courses 210 100 80
Non-placement-tied Courses 160 280 230
Total 370 380 310 ERB does not keep the breakdown on the nationality/race of ethnic minorities enrolled in the courses. _________________________ 1 Estimated figures as at February 2016.
- End -
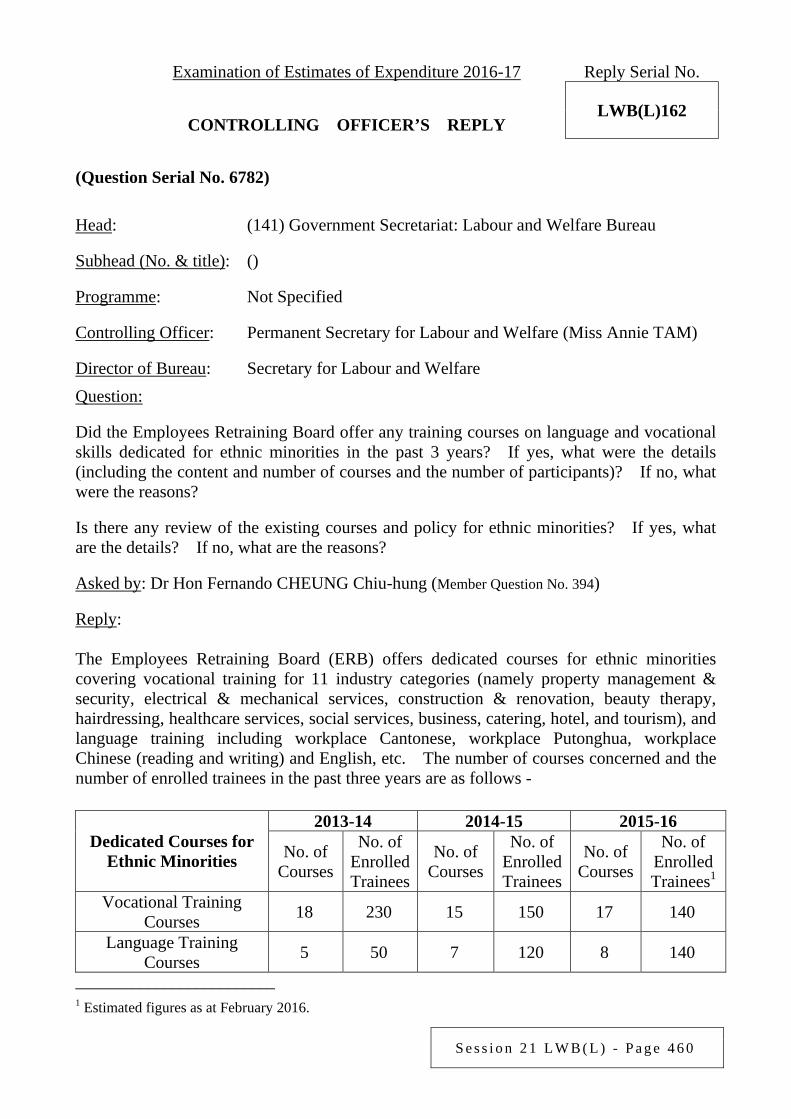
S e s s i o n 2 1 L W B ( L ) - P a g e 4 6 0
Examination of Estimates of Expenditure 2016-17 Reply Serial No.
LWB(L)162 CONTROLLING OFFICER’S REPLY (Question Serial No. 6782)
Head: (141) Government Secretariat: Labour and Welfare Bureau
Subhead (No. & title): ()
Programme: Not Specified
Controlling Officer: Permanent Secretary for Labour and Welfare (Miss Annie TAM)
Director of Bureau: Secretary for Labour and Welfare Question: Did the Employees Retraining Board offer any training courses on language and vocational skills dedicated for ethnic minorities in the past 3 years? If yes, what were the details (including the content and number of courses and the number of participants)? If no, what were the reasons? Is there any review of the existing courses and policy for ethnic minorities? If yes, what are the details? If no, what are the reasons? Asked by: Dr Hon Fernando CHEUNG Chiu-hung (Member Question No. 394) Reply: The Employees Retraining Board (ERB) offers dedicated courses for ethnic minorities covering vocational training for 11 industry categories (namely property management & security, electrical & mechanical services, construction & renovation, beauty therapy, hairdressing, healthcare services, social services, business, catering, hotel, and tourism), and language training including workplace Cantonese, workplace Putonghua, workplace Chinese (reading and writing) and English, etc. The number of courses concerned and the number of enrolled trainees in the past three years are as follows -
Dedicated Courses for Ethnic Minorities
2013-14 2014-15 2015-16
No. of Courses
No. of Enrolled Trainees
No. of Courses
No. of Enrolled Trainees
No. of Courses
No. of Enrolled Trainees1
Vocational Training Courses 18 230 15 150 17 140
Language Training Courses 5 50 7 120 8 140
_________________________ 1 Estimated figures as at February 2016.
S e s s i o n 2 1 L W B ( L ) - P a g e 4 6 1
Furthermore, ERB offers dedicated training courses for ethnic minorities on generic skills including the application of information technology, interpersonal and job search skills, etc. ERB reviews from time to time the training courses and services for ethnic minorities, and in the process takes into consideration the opinions of the stakeholders, including the findings of trainee opinion surveys. ERB also holds regular meetings with the Focus Group on Training for Ethnic Minorities to identify training and employment needs of ethnic minorities, and to discuss ways to enhance the effectiveness of promotion to ethnic minorities. The focus group comprises representatives of ethnic minority groups, social services organisations, training bodies, employers and relevant government bodies.
- End -

S e s s i o n 2 1 L W B ( L ) - P a g e 4 6 2
Examination of Estimates of Expenditure 2016-17 Reply Serial No.
LWB(L)163 CONTROLLING OFFICER’S REPLY (Question Serial No. 3472)
Head: (141) Government Secretariat: Labour and Welfare Bureau
Subhead (No. & title): ( )
Programme: (4) Manpower Development
Controlling Officer: Permanent Secretary for Labour and Welfare (Miss Annie TAM)
Director of Bureau: Secretary for Labour and Welfare Question: Regarding the estimated expenditure of the Continuing Education Fund (CEF), will the Government provide the following information: (a) the expenditure of the CEF in the past 3 years and the estimated expenditure for
2016-17; (b) the number of applicants under the CEF in the past 3 years; (c) the number of existing reimbursable courses and the number of such courses in
relation to information and communications technology (ICT); (d) the average tuition fees of the existing reimbursable courses in relation to ICT; and (e) whether it has reviewed the upper limit of CEF subsidy. If yes, what are the figures?
If no, what are the reasons? Asked by: Hon Charles Peter MOK (Member Question No. 115) Reply: The information sought is provided as follows - (a) In 2013-14, 2014-15 and 2015-16 (as at 31 January 2016), the expenditure of the
Continuing Education Fund (CEF) was $210 million, $190 million and $140 million respectively. The estimated expenditure for 2016-17 is $180 million.
(b) In 2013-14, 2014-15 and 2015-16 (as at 31 January 2016), the number of applications
received by the Office of CEF was 35 880, 32 849 and 25 911 respectively.
S e s s i o n 2 1 L W B ( L ) - P a g e 4 6 3
(c) As at 31 January 2016, a total of 7 941 courses were reimbursable under CEF (reimbursable courses). These courses included those falling within 8 specified domains1 and those designed in accordance with the Specification of Competency Standards (SCSs) under the Qualifications Framework. Among the courses designed based on SCSs, 4 of them were related to information and communications technology (ICT).
(d) The average tuition fee of the above 4 ICT-related reimbursable courses is $12,200. (e) At present, each eligible applicant may apply for reimbursement of 80% of the tuition
fee for any reimbursable courses under CEF upon successful completion of the course, subject to a maximum sum of $10,000. The tuition fees for most of the reimbursable courses under CEF are at or below $10,000. The Government will conduct a review on CEF in 2016-17 to cater for the needs of the community. The scope of the review will include the amount and coverage of subsidies, and its application and reimbursement procedures.
_________________________ 1 i.e. business services, financial services, logistics, tourism, creative industries, design, languages, as well as
interpersonal and intrapersonal skills for the workplace.
- End -
S e s s i o n 2 1 L W B ( L ) - P a g e 4 6 4
Examination of Estimates of Expenditure 2016-17 Reply Serial No.
LWB(L)164 CONTROLLING OFFICER’S REPLY (Question Serial No. 4633)
Head: (141) Government Secretariat: Labour and Welfare Bureau
Subhead (No. & title): ()
Programme: (4) Manpower Development
Controlling Officer: Permanent Secretary for Labour and Welfare (Miss Annie TAM)
Director of Bureau: Secretary for Labour and Welfare Question: The Labour and Welfare Bureau indicates that it will continue to monitor the operation of the Continuing Education Fund and the implementation of the Manpower Development Scheme of the Employees Retraining Board in 2016-17. In this regard, how does the Government evaluate the cost-effectiveness of these two measures? Was there any review and enhancement on the measures in the past 3 years? If yes, the details? If not, the reasons? Asked by: Hon James TIEN Pei-chun (Member Question No. 65) Reply:
Regarding the Continuing Education Fund (CEF), the Labour and Welfare Bureau (LWB) has been working in collaboration with the Office of CEF and the Hong Kong Council for Accreditation of Academic and Vocational Qualifications to monitor its operation, including its use, supervision of CEF courses, applications and claims, etc. to ensure that it meets the needs of the community. Enhancement measures have been introduced in the past 3 years to improve the administration, such as the launch of an on-line checking service for CEF accounts, simplification of application forms, and extension of service hours of the drop-in box for application forms. Regarding the Employees Retraining Board (ERB), LWB, as the housekeeping bureau, gives guidance to ERB on its direction and examines its annual programme of activities and budget. As one of the board members of ERB, the LWB’s representative participates in the meetings of ERB and its committees. This facilitates LWB in overseeing and assessing the work of ERB in implementing the Manpower Development Scheme, which provides local residents aged 15 or above with education level at sub-degree or below with a variety of market-driven and employment-oriented training courses and services.

S e s s i o n 2 1 L W B ( L ) - P a g e 4 6 5
Over the past 3 years, LWB and ERB have updated the Memorandum of Administrative Arrangements to streamline the administrative arrangements like financial and personnel management. In the light of the market needs of the past 3 years, ERB continues to develop training courses with employment potential and introduces serial courses for various sectors to provide more training choices for serving employees and people between jobs. In addition, ERB has developed new dedicated courses and support services for groups with special needs, including mature persons, women, new arrivals, ethnic minorities, rehabilitated offenders, persons with disabilities and persons who have recovered from work injuries.
- End -


![UNARY NEGATION 1. Introduction Vardi [46] raised the ... - arXiv](https://static.fdokumen.com/doc/165x107/63175313f68b807f8803968f/unary-negation-1-introduction-vardi-46-raised-the-arxiv.jpg)