Page 1 of 162
162
Tap Tube-Well Other Owned Rented Rent free 2 3 4 5 6 7 8 9 10 19 Comilla Zila Total 1048984 5.6 89.3 5.1 74.9 91.3 7.4 1.3 19 1 Comilla Zila 884576 2.3 92.5 5.2 71.8 96.0 2.8 1.3 19 2 Comilla Zila 138065 24.5 71.2 4.3 92.7 64.3 34.2 1.5 19 3 Comilla Zila 26343 16.1 79.8 4.0 86.5 75.4 22.3 2.3 19 09 Barura Upazila Total 82440 0.9 95.0 4.0 61.5 97.4 1.7 0.9 19 09 1 Barura Upazila 72692 0.8 95.3 4.0 59.8 98.4 0.7 0.9 19 09 2 Barura Upazila 9748 2.3 93.2 4.6 74.2 90.0 9.0 1.0 Barura Paurashava 19 09 01 Ward No-01 Total 897 1.0 98.0 1.0 68.5 99.1 0.0 0.9 19 09 01 080 2 *Bagmara 350 0.6 97.4 2.0 68.9 100.0 0.0 0.0 19 09 01 124 2 *Belbhoj 332 1.8 98.2 0.0 56.0 98.2 0.0 1.8 19 09 01 300 2 *Hobirgaon 125 0.0 100.0 0.0 88.0 98.4 0.0 1.6 19 09 01 820 2 *Saudmara 50 0.0 96.0 4.0 80.0 100.0 0.0 0.0 19 09 01 908 2 *Somargaon 40 2.5 97.5 0.0 92.5 100.0 0.0 0.0 19 09 02 Ward No-02 Total 1085 7.7 91.3 0.9 91.2 74.0 25.2 0.8 19 09 02 107 2 *Barura (Part) 291 24.7 75.3 0.0 97.9 34.4 63.6 2.1 19 09 02 943 2 *Tolagram 794 1.5 97.2 1.3 88.7 88.5 11.1 0.4 19 09 03 Ward No-03 Total 1496 7.1 92.5 0.4 91.4 63.8 34.0 2.3 19 09 03 107 2 *Barura (Part-2) 1496 7.1 92.5 0.4 91.4 63.8 34.0 2.3 19 09 04 Ward No-04 Total 1042 0.1 85.4 14.5 35.9 98.7 0.3 1.1 19 09 04 280 2 *Dakshin Panch Pukuria 86 1.2 98.8 0.0 5.8 98.8 0.0 1.2 19 09 04 516 2 *Kamedda 253 0.0 60.5 39.5 39.1 99.2 0.4 0.4 19 09 04 600 2 *Nayantala 445 0.0 93.7 6.3 45.4 98.4 0.4 1.1 19 09 04 655 2 *Paschim Baraia 31 0.0 100.0 0.0 41.9 96.8 0.0 3.2 19 09 04 720 2 *Salukia 227 0.0 89.9 10.1 24.2 98.7 0.0 1.3 19 09 05 Ward No-05 Total 1101 0.2 96.4 3.5 64.2 95.1 3.3 1.6 19 09 05 360 2 *Latifpur 218 0.0 98.2 1.8 73.9 99.5 0.5 0.0 19 09 05 469 2 *Jinsar 421 0.2 99.8 0.0 55.8 91.2 7.4 1.4 19 09 05 550 2 *Kalinji Para 125 0.0 92.0 8.0 51.2 99.2 0.0 0.8 MZ / MH Vill RMO 1 Table C-15: Distribution of General Households by Source of Drinking Water, Electricity Connection and Housing Tenancy Status, by Residence and Community Administrative Unit Residence Community Number of Households Source of Drinking Water (%) Electricity Connection (%) Housing Tenancy (%) ZL UZ UN / WA RMO: 1 = Rural, 2 = Urban and 3 = Other Urban Page 1 of 162
-
Upload
khangminh22 -
Category
Documents
-
view
1 -
download
0
Transcript of Page 1 of 162

Tap Tube-Well Other Owned Rented Rent free
2 3 4 5 6 7 8 9 10
19 Comilla Zila Total 1048984 5.6 89.3 5.1 74.9 91.3 7.4 1.3
19 1 Comilla Zila 884576 2.3 92.5 5.2 71.8 96.0 2.8 1.3
19 2 Comilla Zila 138065 24.5 71.2 4.3 92.7 64.3 34.2 1.5
19 3 Comilla Zila 26343 16.1 79.8 4.0 86.5 75.4 22.3 2.3
19 09 Barura Upazila Total 82440 0.9 95.0 4.0 61.5 97.4 1.7 0.9
19 09 1 Barura Upazila 72692 0.8 95.3 4.0 59.8 98.4 0.7 0.9
19 09 2 Barura Upazila 9748 2.3 93.2 4.6 74.2 90.0 9.0 1.0
Barura Paurashava
19 09 01 Ward No-01 Total 897 1.0 98.0 1.0 68.5 99.1 0.0 0.9
19 09 01 080 2 *Bagmara 350 0.6 97.4 2.0 68.9 100.0 0.0 0.0
19 09 01 124 2 *Belbhoj 332 1.8 98.2 0.0 56.0 98.2 0.0 1.8
19 09 01 300 2 *Hobirgaon 125 0.0 100.0 0.0 88.0 98.4 0.0 1.6
19 09 01 820 2 *Saudmara 50 0.0 96.0 4.0 80.0 100.0 0.0 0.0
19 09 01 908 2 *Somargaon 40 2.5 97.5 0.0 92.5 100.0 0.0 0.0
19 09 02 Ward No-02 Total 1085 7.7 91.3 0.9 91.2 74.0 25.2 0.8
19 09 02 107 2 *Barura (Part) 291 24.7 75.3 0.0 97.9 34.4 63.6 2.1
19 09 02 943 2 *Tolagram 794 1.5 97.2 1.3 88.7 88.5 11.1 0.4
19 09 03 Ward No-03 Total 1496 7.1 92.5 0.4 91.4 63.8 34.0 2.3
19 09 03 107 2 *Barura (Part-2) 1496 7.1 92.5 0.4 91.4 63.8 34.0 2.3
19 09 04 Ward No-04 Total 1042 0.1 85.4 14.5 35.9 98.7 0.3 1.1
19 09 04 280 2 *Dakshin Panch Pukuria 86 1.2 98.8 0.0 5.8 98.8 0.0 1.2
19 09 04 516 2 *Kamedda 253 0.0 60.5 39.5 39.1 99.2 0.4 0.4
19 09 04 600 2 *Nayantala 445 0.0 93.7 6.3 45.4 98.4 0.4 1.1
19 09 04 655 2 *Paschim Baraia 31 0.0 100.0 0.0 41.9 96.8 0.0 3.2
19 09 04 720 2 *Salukia 227 0.0 89.9 10.1 24.2 98.7 0.0 1.3
19 09 05 Ward No-05 Total 1101 0.2 96.4 3.5 64.2 95.1 3.3 1.6
19 09 05 360 2 *Latifpur 218 0.0 98.2 1.8 73.9 99.5 0.5 0.0
19 09 05 469 2 *Jinsar 421 0.2 99.8 0.0 55.8 91.2 7.4 1.4
19 09 05 550 2 *Kalinji Para 125 0.0 92.0 8.0 51.2 99.2 0.0 0.8
MZ /
MHVill RMO
1
Table C-15: Distribution of General Households by Source of Drinking Water, Electricity Connection and Housing Tenancy Status, by Residence
and Community
Administrative Unit
Residence
Community
Number of
Households
Source of Drinking Water (%) Electricity
Connection
(%)
Housing Tenancy (%)
ZL UZUN /
WA
RMO: 1 = Rural, 2 = Urban and 3 = Other Urban Page 1 of 162

Tap Tube-Well Other Owned Rented Rent free
2 3 4 5 6 7 8 9 10
MZ /
MHVill RMO
1
Table C-15: Distribution of General Households by Source of Drinking Water, Electricity Connection and Housing Tenancy Status, by Residence
and Community
Administrative Unit
Residence
Community
Number of
Households
Source of Drinking Water (%) Electricity
Connection
(%)
Housing Tenancy (%)
ZL UZUN /
WA
19 09 05 830 2 *Shahar Padua 337 0.3 92.6 7.1 73.3 95.5 1.2 3.3
19 09 06 Ward No-06 Total 1195 0.1 90.0 10.0 74.2 99.0 0.8 0.2
19 09 06 310 2 *Kasmi 316 0.0 84.5 15.5 67.7 99.4 0.3 0.3
19 09 06 560 2 *Uttar Nishchintapur 77 0.0 100.0 0.0 94.8 100.0 0.0 0.0
19 09 06 610 2 *Puran Kadba 456 0.2 98.2 1.5 80.7 99.1 0.9 0.0
19 09 06 750 2 *Uttar Hurua 346 0.0 81.8 18.2 67.1 98.3 1.4 0.3
19 09 07 Ward No-07 Total 931 1.0 92.7 6.3 86.5 98.5 1.1 0.4
19 09 07 320 2 *Kashedda 476 1.1 91.6 7.4 84.0 99.2 0.2 0.6
19 09 07 938 2 *Susunda 455 0.9 93.8 5.3 89.0 97.8 2.0 0.2
19 09 08 Ward No-08 Total 1095 0.6 96.3 3.1 74.9 96.3 2.9 0.7
19 09 08 047 2 *Arjuntala 477 1.5 98.3 0.2 69.2 93.3 6.5 0.2
19 09 08 600 2 *Deora (East Part) 618 0.0 94.7 5.3 79.3 98.7 0.2 1.1
19 09 09 Ward No-09 Total 906 0.2 97.6 2.2 73.5 99.3 0.2 0.4
19 09 09 200 2 *Deora (West Part) 906 0.2 97.6 2.2 73.5 99.3 0.2 0.4
19 09 11 Adda Union Total 5270 0.6 99.0 0.5 71.8 99.1 0.6 0.3
19 09 11 008 1 *Adda 1381 0.4 99.5 0.1 75.5 98.3 1.7 0.0
19 09 11 008 01 1 Adda 1324 0.4 99.5 0.2 78.8 98.3 1.7 0.0
19 09 11 008 02 1 Kadirpar 35 0.0 100.0 0.0 0.0 100.0 0.0 0.0
19 09 11 008 03 1 Shola Pukuria 22 0.0 100.0 0.0 0.0 95.5 4.5 0.0
19 09 11 055 1 *Ashwadia 174 0.0 100.0 0.0 70.1 98.3 0.0 1.7
19 09 11 099 1 *Bara Putia 95 0.0 100.0 0.0 94.7 100.0 0.0 0.0
19 09 11 111 1 *Bejimara 47 0.0 100.0 0.0 59.6 100.0 0.0 0.0
19 09 11 150 1 *Bhateshwar 408 2.5 97.1 0.5 50.2 99.5 0.0 0.5
19 09 11 163 1 *Boalia 187 0.5 99.5 0.0 84.0 100.0 0.0 0.0
19 09 11 215 1 *Chhota Putia 76 0.0 100.0 0.0 100.0 100.0 0.0 0.0
19 09 11 254 1 *Dakshin Krishnapur 398 0.5 99.5 0.0 77.9 98.7 0.3 1.0
19 09 11 327 1 *Dighalia 127 2.4 97.6 0.0 32.3 100.0 0.0 0.0
19 09 11 542 1 *Kharul 219 0.0 100.0 0.0 54.8 99.1 0.5 0.5
19 09 11 542 01 1 Kharul 159 0.0 100.0 0.0 70.4 98.7 0.6 0.6
RMO: 1 = Rural, 2 = Urban and 3 = Other Urban Page 2 of 162

Tap Tube-Well Other Owned Rented Rent free
2 3 4 5 6 7 8 9 10
MZ /
MHVill RMO
1
Table C-15: Distribution of General Households by Source of Drinking Water, Electricity Connection and Housing Tenancy Status, by Residence
and Community
Administrative Unit
Residence
Community
Number of
Households
Source of Drinking Water (%) Electricity
Connection
(%)
Housing Tenancy (%)
ZL UZUN /
WA
19 09 11 542 02 1 Hariavita 60 0.0 100.0 0.0 13.3 100.0 0.0 0.0
19 09 11 547 1 *Khatla 334 0.9 99.1 0.0 70.1 99.7 0.3 0.0
19 09 11 547 01 1 Khatla 202 1.5 98.5 0.0 58.9 100.0 0.0 0.0
19 09 11 547 02 1 Kandirpar 132 0.0 100.0 0.0 87.1 99.2 0.8 0.0
19 09 11 706 1 *Paschim Baghmara 203 0.0 100.0 0.0 92.1 99.0 0.0 1.0
19 09 11 715 1 *Paschim Gobindapur 225 0.9 99.1 0.0 52.0 100.0 0.0 0.0
19 09 11 762 1 *Pilgiri 818 0.1 99.5 0.4 73.2 99.5 0.2 0.2
19 09 11 766 1 *Pombaish 389 0.5 95.1 4.4 75.3 99.7 0.0 0.3
19 09 11 994 1 *Chota Tulagaon 189 0.0 100.0 0.0 85.2 97.4 1.6 1.1
19 09 12 Adra Union Total 5154 1.1 91.4 7.5 48.7 98.8 0.3 0.9
19 09 12 012 1 *Adra Ramchandrapur 249 1.6 85.5 12.9 81.5 98.0 0.4 1.6
19 09 12 034 1 *Anaidkota 149 0.0 91.3 8.7 55.7 99.3 0.0 0.7
19 09 12 284 1 *Dakshin Rajapur 150 0.0 100.0 0.0 35.3 100.0 0.0 0.0
19 09 12 357 1 *Ekaberia 139 0.0 96.4 3.6 75.5 98.6 0.7 0.7
19 09 12 383 1 *Ganak Khuli 308 0.0 96.8 3.2 24.4 97.7 0.0 2.3
19 09 12 383 01 1 Ganak Khuli 166 0.0 99.4 0.6 22.3 96.4 0.0 3.6
19 09 12 383 02 1 Nowda 38 0.0 100.0 0.0 7.9 100.0 0.0 0.0
19 09 12 383 03 1 Rajnagar 104 0.0 91.3 8.7 33.7 99.0 0.0 1.0
19 09 12 417 1 *Harishpur 196 2.0 77.6 20.4 37.8 93.9 2.0 4.1
19 09 12 426 1 *Herpeti 197 1.0 99.0 0.0 54.3 98.5 0.0 1.5
19 09 12 499 1 *Kakairtala 553 2.0 67.6 30.4 46.1 99.1 0.4 0.5
19 09 12 499 01 1 Kakairtala 499 2.2 64.1 33.7 49.1 99.0 0.4 0.6
19 09 12 499 02 1 Kathalia 54 0.0 100.0 0.0 18.5 100.0 0.0 0.0
19 09 12 603 1 *Manduk 729 0.1 95.3 4.5 51.2 99.7 0.1 0.1
19 09 12 628 1 *Manoharpur 300 0.3 99.7 0.0 32.3 98.3 0.3 1.3
19 09 12 628 01 1 Manoharpur 91 1.1 98.9 0.0 73.6 98.9 1.1 0.0
19 09 12 628 02 1 Noagaon 209 0.0 100.0 0.0 14.4 98.1 0.0 1.9
19 09 12 650 1 *Nacharpar 77 0.0 100.0 0.0 68.8 98.7 0.0 1.3
19 09 12 659 1 *Nagirpar 71 8.5 91.5 0.0 73.2 100.0 0.0 0.0
RMO: 1 = Rural, 2 = Urban and 3 = Other Urban Page 3 of 162

Tap Tube-Well Other Owned Rented Rent free
2 3 4 5 6 7 8 9 10
MZ /
MHVill RMO
1
Table C-15: Distribution of General Households by Source of Drinking Water, Electricity Connection and Housing Tenancy Status, by Residence
and Community
Administrative Unit
Residence
Community
Number of
Households
Source of Drinking Water (%) Electricity
Connection
(%)
Housing Tenancy (%)
ZL UZUN /
WA
19 09 12 667 1 *Narendrapur 351 0.0 93.7 6.3 6.6 99.1 0.0 0.9
19 09 12 719 1 *Paschim Nalua 286 4.9 81.5 13.6 64.7 100.0 0.0 0.0
19 09 12 727 1 *Paschim Padua 59 0.0 98.3 1.7 83.1 100.0 0.0 0.0
19 09 12 732 1 *Paschim Satbaria 213 0.9 99.1 0.0 59.2 99.1 0.0 0.9
19 09 12 736 1 *Paschim Shola Pukharia 46 0.0 100.0 0.0 15.2 100.0 0.0 0.0
19 09 12 749 1 *Perpeti 700 1.1 95.9 3.0 52.7 98.7 0.9 0.4
19 09 12 749 01 1 Perpeti 667 1.2 95.7 3.1 53.5 98.7 0.9 0.4
19 09 12 749 02 1 Shaplola 33 0.0 100.0 0.0 36.4 100.0 0.0 0.0
19 09 12 775 1 *Pushkarinirpar 60 3.3 96.7 0.0 8.3 100.0 0.0 0.0
19 09 12 913 1 *Sonaimuri 321 0.6 99.1 0.3 67.3 98.8 0.3 0.9
19 09 12 913 01 1 Sonaimuri 275 0.7 98.9 0.4 76.4 98.5 0.4 1.1
19 09 12 913 02 1 Maish Pukuria 46 0.0 100.0 0.0 13.0 100.0 0.0 0.0
19 09 18 Aganagar Union Total 4956 1.3 93.1 5.6 63.9 98.6 0.2 1.1
19 09 18 017 1 *Aganagar 1224 3.6 96.3 0.1 67.6 99.5 0.4 0.1
19 09 18 017 01 1 Aganagar 912 4.6 95.3 0.1 65.0 99.5 0.5 0.0
19 09 18 017 02 1 Mirzanagar 312 0.6 99.4 0.0 75.0 99.7 0.0 0.3
19 09 18 086 1 *Bara Hatua 432 0.2 89.6 10.2 84.7 96.5 1.2 2.3
19 09 18 086 01 1 Bara Hatua 275 0.0 99.6 0.4 87.6 96.7 0.0 3.3
19 09 18 086 02 1 Gohalia 141 0.7 68.8 30.5 77.3 95.7 3.5 0.7
19 09 18 086 03 1 Chunarikhola 16 0.0 100.0 0.0 100.0 100.0 0.0 0.0
19 09 18 116 1 *Bijoypur 323 0.9 98.5 0.6 43.0 100.0 0.0 0.0
19 09 18 400 1 *Gohinkhali 239 0.4 99.6 0.0 88.7 87.4 0.0 12.6
19 09 18 400 01 1 Gohinkhali 189 0.5 99.5 0.0 87.8 84.1 0.0 15.9
19 09 18 400 02 1 Batakhali 50 0.0 100.0 0.0 92.0 100.0 0.0 0.0
19 09 18 430 1 *Jagadasar 939 1.2 93.5 5.3 77.5 98.6 0.2 1.2
19 09 18 430 01 1 Jagadasar 309 0.0 85.1 14.9 51.5 98.4 0.0 1.6
19 09 18 430 02 1 Baraipur 414 1.7 97.3 1.0 92.5 98.8 0.5 0.7
19 09 18 430 03 1 Sreepur 102 3.9 96.1 0.0 86.3 97.1 0.0 2.9
19 09 18 430 04 1 Atehora 114 0.0 100.0 0.0 86.0 100.0 0.0 0.0
RMO: 1 = Rural, 2 = Urban and 3 = Other Urban Page 4 of 162

Tap Tube-Well Other Owned Rented Rent free
2 3 4 5 6 7 8 9 10
MZ /
MHVill RMO
1
Table C-15: Distribution of General Households by Source of Drinking Water, Electricity Connection and Housing Tenancy Status, by Residence
and Community
Administrative Unit
Residence
Community
Number of
Households
Source of Drinking Water (%) Electricity
Connection
(%)
Housing Tenancy (%)
ZL UZUN /
WA
19 09 18 874 1 *Sarabati 1124 0.2 88.7 11.1 51.7 99.8 0.0 0.2
19 09 18 874 01 1 Sarabati 913 0.1 86.2 13.7 52.8 99.8 0.0 0.2
19 09 18 874 02 1 Murabhazal 211 0.5 99.5 0.0 46.9 100.0 0.0 0.0
19 09 18 900 1 *Singacho 213 0.9 95.3 3.8 91.5 99.5 0.0 0.5
19 09 18 982 1 *Uttar Rajapur 462 0.4 89.4 10.2 26.2 100.0 0.0 0.0
19 09 25 Bhabanipur Union Total 4774 1.3 92.6 6.0 60.2 98.3 0.7 1.0
19 09 25 030 1 *Amtali 110 0.9 99.1 0.0 5.5 100.0 0.0 0.0
19 09 25 030 01 1 Amtali 70 1.4 98.6 0.0 0.0 100.0 0.0 0.0
19 09 25 030 02 1 Khatakpur 40 0.0 100.0 0.0 15.0 100.0 0.0 0.0
19 09 25 077 1 *Bara Hagina 194 1.5 97.9 0.5 10.3 98.5 0.5 1.0
19 09 25 142 1 *Bhabanipur 256 5.1 91.8 3.1 80.9 97.3 0.4 2.3
19 09 25 189 1 *Chikti Para 86 0.0 100.0 0.0 55.8 100.0 0.0 0.0
19 09 25 202 1 *Chhota Haripur 28 0.0 100.0 0.0 7.1 100.0 0.0 0.0
19 09 25 353 1 *Egaragaon 777 0.3 91.1 8.6 69.0 99.6 0.3 0.1
19 09 25 439 1 *Jalgaon 381 2.9 90.6 6.6 52.8 95.5 1.0 3.4
19 09 25 460 1 *Jhikatia 142 0.7 99.3 0.0 76.1 100.0 0.0 0.0
19 09 25 529 1 *Karia 159 0.6 94.3 5.0 64.2 99.4 0.6 0.0
19 09 25 564 1 *Madhupur 55 0.0 100.0 0.0 3.6 98.2 1.8 0.0
19 09 25 671 1 *Natehar 166 0.0 100.0 0.0 60.8 98.8 0.0 1.2
19 09 25 680 1 *Narinda 277 0.0 78.3 21.7 37.2 98.9 0.4 0.7
19 09 25 771 1 *Pomtala 297 1.7 98.3 0.0 86.9 100.0 0.0 0.0
19 09 25 809 1 *Purba Padua 229 0.4 96.9 2.6 47.2 99.6 0.0 0.4
19 09 25 814 1 *Purba Panch Pukuria 155 1.9 91.6 6.5 38.7 98.7 1.3 0.0
19 09 25 818 1 *Purba Rasulpur 51 0.0 100.0 0.0 62.7 100.0 0.0 0.0
19 09 25 895 1 *Sikarpur 265 6.0 93.2 0.8 86.8 99.6 0.4 0.0
19 09 25 956 1 *Uttar Bhaiskhola 92 0.0 100.0 0.0 100.0 100.0 0.0 0.0
19 09 25 960 1 *Uttar Dighali 112 0.0 100.0 0.0 62.5 100.0 0.0 0.0
19 09 25 969 1 *Uttar Lakshmipur 865 0.8 87.6 11.6 65.7 95.5 2.1 2.4
19 09 25 969 01 1 Uttar Lakshmipur 348 0.0 87.4 12.6 61.8 98.0 0.0 2.0
RMO: 1 = Rural, 2 = Urban and 3 = Other Urban Page 5 of 162

Tap Tube-Well Other Owned Rented Rent free
2 3 4 5 6 7 8 9 10
MZ /
MHVill RMO
1
Table C-15: Distribution of General Households by Source of Drinking Water, Electricity Connection and Housing Tenancy Status, by Residence
and Community
Administrative Unit
Residence
Community
Number of
Households
Source of Drinking Water (%) Electricity
Connection
(%)
Housing Tenancy (%)
ZL UZUN /
WA
19 09 25 969 02 1 Taluk Para 232 0.0 100.0 0.0 65.9 94.0 3.0 3.0
19 09 25 969 03 1 Begartapur 177 0.6 68.4 31.1 53.1 90.4 5.6 4.0
19 09 25 969 04 1 Darganama 108 5.6 93.5 0.9 98.1 99.1 0.9 0.0
19 09 25 986 1 *Uttar Salukia 77 0.0 100.0 0.0 24.7 98.7 1.3 0.0
19 09 37 Deora Union Total 2579 0.3 97.4 2.3 53.4 98.8 0.2 1.0
19 09 37 155 1 *Bhuri 264 0.8 99.2 0.0 93.6 97.7 0.4 1.9
19 09 37 232 1 *Choori 335 0.0 94.6 5.4 60.9 99.1 0.3 0.6
19 09 37 370 1 *Fenua 68 0.0 100.0 0.0 19.1 100.0 0.0 0.0
19 09 37 452 1 *Jaguria 129 0.0 100.0 0.0 0.0 99.2 0.0 0.8
19 09 37 486 1 *Kasia Pukuria 573 0.9 94.2 4.9 49.6 99.7 0.2 0.2
19 09 37 521 1 *Kanchanpur 322 0.0 100.0 0.0 83.2 99.4 0.0 0.6
19 09 37 568 1 *Madhya Lakshmipur 539 0.0 99.6 0.4 42.7 99.6 0.2 0.2
19 09 37 723 1 *Paschim Nischintapur 159 0.6 99.4 0.0 64.8 96.2 0.0 3.8
19 09 37 835 1 *Rajpur 190 0.0 94.2 5.8 14.7 95.3 0.5 4.2
19 09 44 Galimpur Union Total 9551 0.6 95.1 4.4 46.7 98.7 0.3 1.0
19 09 44 064 1 *Bankara 402 1.0 87.6 11.4 55.5 99.3 0.2 0.5
19 09 44 064 01 1 Bankara 266 1.5 81.2 17.3 53.4 99.2 0.0 0.8
19 09 44 064 02 1 Bara Nischintapur 96 0.0 100.0 0.0 57.3 99.0 1.0 0.0
19 09 44 064 03 1 Shola Pukuria 40 0.0 100.0 0.0 65.0 100.0 0.0 0.0
19 09 44 103 1 *Bara Saoratali 137 0.0 100.0 0.0 0.0 100.0 0.0 0.0
19 09 44 120 1 *Beki 286 0.0 95.5 4.5 73.1 99.7 0.3 0.0
19 09 44 133 1 *Betua 62 0.0 93.5 6.5 0.0 98.4 0.0 1.6
19 09 44 206 1 *Chhota Lakshmipur 118 0.0 56.8 43.2 85.6 97.5 1.7 0.8
19 09 44 211 1 *Chhota Nischintapur 28 0.0 100.0 0.0 25.0 100.0 0.0 0.0
19 09 44 219 1 *Chhota Tulagaon 153 0.0 100.0 0.0 92.2 99.3 0.7 0.0
19 09 44 245 1 *Dakshin Bhaiskhola 39 0.0 84.6 15.4 2.6 100.0 0.0 0.0
19 09 44 288 1 *Dakshin Tulagaon 104 1.0 98.1 1.0 93.3 100.0 0.0 0.0
19 09 44 292 1 *Dalua 204 0.5 94.6 4.9 42.2 99.0 0.0 1.0
19 09 44 297 1 *Danishwar 588 0.5 89.8 9.7 25.3 99.0 0.3 0.7
RMO: 1 = Rural, 2 = Urban and 3 = Other Urban Page 6 of 162

Tap Tube-Well Other Owned Rented Rent free
2 3 4 5 6 7 8 9 10
MZ /
MHVill RMO
1
Table C-15: Distribution of General Households by Source of Drinking Water, Electricity Connection and Housing Tenancy Status, by Residence
and Community
Administrative Unit
Residence
Community
Number of
Households
Source of Drinking Water (%) Electricity
Connection
(%)
Housing Tenancy (%)
ZL UZUN /
WA
19 09 44 297 01 1 Danishwar 539 0.6 90.5 8.9 27.6 98.9 0.4 0.7
19 09 44 297 02 1 Paiya Para 49 0.0 81.6 18.4 0.0 100.0 0.0 0.0
19 09 44 374 1 *Galimpur 398 0.0 100.0 0.0 58.3 98.5 1.3 0.3
19 09 44 391 1 *Gazaria 120 0.0 100.0 0.0 28.3 57.5 0.0 42.5
19 09 44 396 1 *Ghoshpa 1427 0.7 98.5 0.8 60.2 99.6 0.0 0.4
19 09 44 396 01 1 Ghoshpa 1109 0.1 99.0 0.9 54.5 99.5 0.0 0.5
19 09 44 396 02 1 Kandi 16 0.0 100.0 0.0 18.8 100.0 0.0 0.0
19 09 44 396 03 1 Chalitatala 67 7.5 92.5 0.0 83.6 100.0 0.0 0.0
19 09 44 396 04 1 Chilunia 49 0.0 100.0 0.0 71.4 100.0 0.0 0.0
19 09 44 396 05 1 Medongi 36 0.0 100.0 0.0 88.9 100.0 0.0 0.0
19 09 44 396 06 1 Khataia 150 2.7 96.7 0.7 86.0 100.0 0.0 0.0
19 09 44 456 1 *Jhapua 418 0.7 99.3 0.0 33.3 100.0 0.0 0.0
19 09 44 456 01 1 Jhapua 246 1.2 98.8 0.0 53.7 100.0 0.0 0.0
19 09 44 456 02 1 Chhota Kaiani 172 0.0 100.0 0.0 4.1 100.0 0.0 0.0
19 09 44 478 1 *Jor Pukuria 259 0.8 96.5 2.7 43.6 99.6 0.4 0.0
19 09 44 491 1 *Kaiani 188 1.1 90.4 8.5 12.2 99.5 0.0 0.5
19 09 44 633 1 *Muggaon 1619 0.6 99.3 0.1 47.0 98.2 1.1 0.7
19 09 44 633 01 1 Muggaon 387 0.0 100.0 0.0 35.1 100.0 0.0 0.0
19 09 44 633 02 1 Shayalkhali 219 0.0 100.0 0.0 59.8 99.5 0.0 0.5
19 09 44 633 03 1 Chotra Pukuria 216 0.0 100.0 0.0 7.9 99.5 0.0 0.5
19 09 44 633 04 1 Bhauksar 797 1.3 98.6 0.1 59.8 96.6 2.3 1.1
19 09 44 702 1 *Paranpur 304 0.7 98.0 1.3 74.7 100.0 0.0 0.0
19 09 44 831 1 *Purba Shola Pukuria 90 0.0 100.0 0.0 1.1 100.0 0.0 0.0
19 09 44 844 1 *Ranaitala 108 0.0 100.0 0.0 21.3 99.1 0.0 0.9
19 09 44 848 1 *Rarhi 311 0.3 99.4 0.3 53.4 99.7 0.0 0.3
19 09 44 865 1 *Sakpur 1472 0.5 88.7 10.9 45.0 99.5 0.0 0.5
19 09 44 865 01 1 Sakpur 1275 0.5 86.9 12.5 50.5 99.5 0.0 0.5
19 09 44 865 02 1 Boalia 85 0.0 100.0 0.0 0.0 100.0 0.0 0.0
19 09 44 865 03 1 Chhota Sakpur 112 0.0 100.0 0.0 17.0 99.1 0.0 0.9
RMO: 1 = Rural, 2 = Urban and 3 = Other Urban Page 7 of 162

Tap Tube-Well Other Owned Rented Rent free
2 3 4 5 6 7 8 9 10
MZ /
MHVill RMO
1
Table C-15: Distribution of General Households by Source of Drinking Water, Electricity Connection and Housing Tenancy Status, by Residence
and Community
Administrative Unit
Residence
Community
Number of
Households
Source of Drinking Water (%) Electricity
Connection
(%)
Housing Tenancy (%)
ZL UZUN /
WA
19 09 44 870 1 *Samaspur 231 0.0 98.3 1.7 29.4 97.8 0.0 2.2
19 09 44 882 1 *Shyampur 58 0.0 74.1 25.9 8.6 100.0 0.0 0.0
19 09 44 921 1 *Sreepur 163 4.3 95.7 0.0 57.1 100.0 0.0 0.0
19 09 44 947 1 *Tarabaria 160 0.0 100.0 0.0 25.6 98.8 0.0 1.3
19 09 44 947 01 1 Tarabaria 88 0.0 100.0 0.0 30.7 100.0 0.0 0.0
19 09 44 947 02 1 Ashwadia 72 0.0 100.0 0.0 19.4 97.2 0.0 2.8
19 09 44 951 1 *Tara Pukharia 104 0.0 90.4 9.6 1.9 100.0 0.0 0.0
19 09 50 Chitadda Union Total 4093 0.3 95.3 4.4 54.2 99.1 0.1 0.8
19 09 50 228 1 *Chitadda 1493 0.3 96.7 3.0 44.8 98.5 0.3 1.3
19 09 50 228 01 1 Chitadda 503 1.0 90.7 8.3 41.2 98.2 0.4 1.4
19 09 50 228 02 1 Baghmara 28 0.0 96.4 3.6 10.7 100.0 0.0 0.0
19 09 50 228 03 1 Makandapur 597 0.0 99.7 0.3 45.2 99.7 0.2 0.2
19 09 50 228 04 1 Batbari 365 0.0 100.0 0.0 51.8 96.7 0.3 3.0
19 09 50 581 1 *Mohammadpur 279 0.0 93.9 6.1 62.4 97.8 0.0 2.2
19 09 50 641 1 *Muriara 842 0.1 97.3 2.6 45.8 99.5 0.0 0.5
19 09 50 641 01 1 Muriara 463 0.2 97.4 2.4 83.4 99.8 0.0 0.2
19 09 50 641 02 1 Bhangoa 318 0.0 97.5 2.5 0.0 99.1 0.0 0.9
19 09 50 641 03 1 Itakhola 61 0.0 95.1 4.9 0.0 100.0 0.0 0.0
19 09 50 684 1 *Odda 1323 0.5 92.7 6.7 66.1 99.8 0.1 0.1
19 09 50 684 01 1 Dakshin Odda 555 0.0 99.3 0.7 49.5 99.8 0.2 0.0
19 09 50 684 02 1 Uttar Odda 430 0.7 92.1 7.2 77.2 99.8 0.0 0.2
19 09 50 684 03 1 Paduar Para 77 0.0 58.4 41.6 93.5 100.0 0.0 0.0
19 09 50 684 04 1 Noapara 261 1.5 90.0 8.4 75.1 100.0 0.0 0.0
19 09 50 689 1 *Paschim Ilashpur 156 0.0 95.5 4.5 72.4 98.1 0.0 1.9
19 09 56 Jalam Union Total 5608 0.5 96.2 3.4 63.1 98.1 0.8 1.1
19 09 56 129 1 *Beolain 548 0.2 92.7 7.1 53.5 98.9 0.7 0.4
19 09 56 129 01 1 Beolain 518 0.2 92.3 7.5 56.6 98.8 0.8 0.4
19 09 56 129 02 1 Kandarpar 30 0.0 100.0 0.0 0.0 100.0 0.0 0.0
19 09 56 180 1 *Chengachail 83 0.0 100.0 0.0 43.4 98.8 0.0 1.2
RMO: 1 = Rural, 2 = Urban and 3 = Other Urban Page 8 of 162

Tap Tube-Well Other Owned Rented Rent free
2 3 4 5 6 7 8 9 10
MZ /
MHVill RMO
1
Table C-15: Distribution of General Households by Source of Drinking Water, Electricity Connection and Housing Tenancy Status, by Residence
and Community
Administrative Unit
Residence
Community
Number of
Households
Source of Drinking Water (%) Electricity
Connection
(%)
Housing Tenancy (%)
ZL UZUN /
WA
19 09 56 193 1 *Chhota Barera 464 0.2 91.2 8.6 69.6 98.9 0.0 1.1
19 09 56 193 01 1 Chhota Barera 296 0.0 86.5 13.5 79.7 100.0 0.0 0.0
19 09 56 193 02 1 Jogimahai 125 0.0 100.0 0.0 44.0 96.0 0.0 4.0
19 09 56 193 03 1 Baria 43 2.3 97.7 0.0 74.4 100.0 0.0 0.0
19 09 56 314 1 *Deuatali 580 0.2 99.8 0.0 36.0 99.0 0.0 1.0
19 09 56 361 1 *Faridpur 71 1.4 97.2 1.4 12.7 100.0 0.0 0.0
19 09 56 366 1 *Fenua 107 3.7 96.3 0.0 80.4 99.1 0.0 0.9
19 09 56 435 1 *Jalam 1978 0.7 94.8 4.5 70.3 96.3 1.9 1.9
19 09 56 435 01 1 Jalam 599 1.5 95.7 2.8 79.1 95.5 3.2 1.3
19 09 56 435 02 1 Hazarpar 134 0.7 99.3 0.0 76.1 90.3 9.0 0.7
19 09 56 435 03 1 Shail Char 200 0.5 99.0 0.5 75.0 97.0 3.0 0.0
19 09 56 435 04 1 Khalapar 228 0.4 99.6 0.0 76.3 97.8 0.0 2.2
19 09 56 435 05 1 Kanail 176 0.0 90.9 9.1 60.8 98.9 0.0 1.1
19 09 56 435 06 1 Noadda 296 0.0 99.0 1.0 58.8 98.0 0.0 2.0
19 09 56 435 07 1 Bil Pukuria 192 0.0 100.0 0.0 68.2 92.7 0.0 7.3
19 09 56 435 08 1 Medda 153 0.7 65.4 34.0 51.0 99.3 0.0 0.7
19 09 56 585 1 *Mahidpur 911 0.4 97.5 2.1 66.4 99.7 0.0 0.3
19 09 56 904 1 *Singur 355 0.0 99.7 0.3 56.1 99.7 0.0 0.3
19 09 56 904 01 1 Singur 324 0.0 99.7 0.3 57.4 99.7 0.0 0.3
19 09 56 904 02 1 Suacho 31 0.0 100.0 0.0 41.9 100.0 0.0 0.0
19 09 56 917 1 *Sosaia 511 0.2 99.8 0.0 75.5 98.2 0.8 1.0
19 09 56 917 01 1 Sosaia 359 0.0 100.0 0.0 73.0 97.8 1.1 1.1
19 09 56 917 02 1 Shola Pukuria 87 0.0 100.0 0.0 78.2 98.9 0.0 1.1
19 09 56 917 03 1 Jogi Pukuria 65 1.5 98.5 0.0 86.2 100.0 0.0 0.0
19 09 63 Uttar Khosbas Union Total 6784 0.5 96.6 3.0 68.5 98.1 1.1 0.7
19 09 63 004 1 *Adampur 785 0.5 99.5 0.0 60.8 97.8 0.9 1.3
19 09 63 004 01 1 Adampur 379 0.0 100.0 0.0 76.3 97.6 0.5 1.8
19 09 63 004 02 1 Payalgucha 313 1.3 98.7 0.0 60.1 97.4 1.6 1.0
19 09 63 004 03 1 Derarpar 93 0.0 100.0 0.0 0.0 100.0 0.0 0.0
RMO: 1 = Rural, 2 = Urban and 3 = Other Urban Page 9 of 162

Tap Tube-Well Other Owned Rented Rent free
2 3 4 5 6 7 8 9 10
MZ /
MHVill RMO
1
Table C-15: Distribution of General Households by Source of Drinking Water, Electricity Connection and Housing Tenancy Status, by Residence
and Community
Administrative Unit
Residence
Community
Number of
Households
Source of Drinking Water (%) Electricity
Connection
(%)
Housing Tenancy (%)
ZL UZUN /
WA
19 09 63 043 1 *Arifpur 1247 0.2 86.4 13.4 55.3 99.3 0.2 0.6
19 09 63 043 01 1 Arifpur 863 0.3 82.0 17.6 61.1 99.9 0.0 0.1
19 09 63 043 02 1 Maksipur 384 0.0 96.1 3.9 42.4 97.9 0.5 1.6
19 09 63 194 1 *Gopalnagar 716 0.1 97.5 2.4 68.4 93.7 5.3 1.0
19 09 63 194 01 1 Gopalnagar 539 0.2 96.7 3.2 60.5 91.7 7.1 1.3
19 09 63 194 02 1 Katakhola 177 0.0 100.0 0.0 92.7 100.0 0.0 0.0
19 09 63 241 1 *Latifpur (Adamser) 97 0.0 100.0 0.0 84.5 96.9 3.1 0.0
19 09 63 646 1 *Nabipur 655 0.0 100.0 0.0 73.7 99.5 0.0 0.5
19 09 63 646 01 1 Nabipur 484 0.0 100.0 0.0 89.5 99.6 0.0 0.4
19 09 63 646 02 1 Dadishar 78 0.0 100.0 0.0 64.1 100.0 0.0 0.0
19 09 63 646 03 1 Karia 93 0.0 100.0 0.0 0.0 98.9 0.0 1.1
19 09 63 663 1 *Narasinghpur 551 0.2 98.9 0.9 92.4 99.8 0.2 0.0
19 09 63 663 01 1 Narasinghpur 84 0.0 100.0 0.0 100.0 100.0 0.0 0.0
19 09 63 663 02 1 Banshtali 211 0.5 99.5 0.0 93.8 99.5 0.5 0.0
19 09 63 663 03 1 Alitala 256 0.0 98.0 2.0 88.7 100.0 0.0 0.0
19 09 63 742 1 *Peor Dakshin 1116 0.4 99.6 0.0 73.2 98.7 0.4 1.0
19 09 63 742 01 1 Shahapur 186 1.6 98.4 0.0 77.4 99.5 0.5 0.0
19 09 63 742 02 1 Bagabari 125 0.0 100.0 0.0 96.0 97.6 0.8 1.6
19 09 63 742 03 1 Kemtali 295 0.0 100.0 0.0 94.6 98.3 0.3 1.4
19 09 63 742 04 1 Gogarpar 138 0.7 99.3 0.0 62.3 100.0 0.0 0.0
19 09 63 742 05 1 Hazi Para 51 0.0 100.0 0.0 60.8 100.0 0.0 0.0
19 09 63 742 06 1 Dewan Nagar 321 0.0 100.0 0.0 48.9 98.1 0.3 1.6
19 09 63 796 1 *Purba Illashpur 993 1.5 98.3 0.2 65.7 97.9 1.6 0.5
19 09 63 796 01 1 Purba Illashpur 480 1.9 98.1 0.0 50.0 97.9 1.7 0.4
19 09 63 796 02 1 Jalalpur 109 2.8 96.3 0.9 53.2 100.0 0.0 0.0
19 09 63 796 03 1 Khosbas 404 0.7 99.0 0.2 87.6 97.3 2.0 0.7
19 09 63 815 1 *Purba Hossainpur 145 0.0 100.0 0.0 80.0 98.6 0.7 0.7
19 09 63 839 1 *Rammohan 22 0.0 95.5 4.5 100.0 77.3 18.2 4.5
19 09 63 973 1 *Uttar Narayanpur 457 0.7 96.9 2.4 68.1 98.9 0.4 0.7
RMO: 1 = Rural, 2 = Urban and 3 = Other Urban Page 10 of 162

Tap Tube-Well Other Owned Rented Rent free
2 3 4 5 6 7 8 9 10
MZ /
MHVill RMO
1
Table C-15: Distribution of General Households by Source of Drinking Water, Electricity Connection and Housing Tenancy Status, by Residence
and Community
Administrative Unit
Residence
Community
Number of
Households
Source of Drinking Water (%) Electricity
Connection
(%)
Housing Tenancy (%)
ZL UZUN /
WA
19 09 63 973 01 1 Uttar Narayanpur 260 1.2 94.6 4.2 54.2 98.1 0.8 1.2
19 09 63 973 02 1 Rahimpur 93 0.0 100.0 0.0 98.9 100.0 0.0 0.0
19 09 63 973 03 1 Noapara 104 0.0 100.0 0.0 75.0 100.0 0.0 0.0
19 09 69 Dakshin Khosbas Union Total 4851 0.3 97.4 2.3 50.3 98.7 0.4 0.9
19 09 69 081 1 *Bara Haripur 863 0.2 95.0 4.8 43.5 97.5 0.9 1.6
19 09 69 081 01 1 Bara Haripur 693 0.3 99.6 0.1 50.2 97.5 1.0 1.4
19 09 69 081 02 1 Sriram Pur 170 0.0 76.5 23.5 15.9 97.1 0.6 2.4
19 09 69 094 1 *Bara Maheshpur 2188 0.3 99.5 0.2 55.3 98.8 0.3 0.9
19 09 69 094 01 1 Maheshpur 1186 0.3 99.5 0.2 61.8 98.6 0.4 1.0
19 09 69 094 02 1 Kalmuri 189 1.1 98.9 0.0 38.1 99.5 0.0 0.5
19 09 69 094 03 1 Badrarpar 110 0.0 100.0 0.0 0.0 100.0 0.0 0.0
19 09 69 094 04 1 Hossainpur 393 0.0 100.0 0.0 60.8 98.2 0.0 1.8
19 09 69 094 05 1 Jangalia 310 0.0 99.4 0.6 53.2 99.7 0.3 0.0
19 09 69 167 1 *Chalia 192 0.0 100.0 0.0 2.1 98.4 0.5 1.0
19 09 69 223 1 *Chhuricho 142 0.0 100.0 0.0 76.8 100.0 0.0 0.0
19 09 69 447 1 *Joynagar 160 0.0 100.0 0.0 24.4 97.5 0.0 2.5
19 09 69 551 1 *Khagua 32 0.0 100.0 0.0 50.0 96.9 3.1 0.0
19 09 69 572 1 *Mugji 1077 0.5 97.1 2.4 47.4 99.5 0.1 0.4
19 09 69 572 01 1 Mugji 903 0.3 99.3 0.3 39.9 99.7 0.0 0.3
19 09 69 572 02 1 Rajamara 174 1.1 85.6 13.2 86.8 98.9 0.6 0.6
19 09 69 887 1 *Shialdhair 197 0.5 79.2 20.3 90.9 99.5 0.0 0.5
19 09 75 Uttar Payalgachha Union Total 4939 1.0 94.7 4.3 61.6 97.3 2.0 0.7
19 09 75 146 1 *Bharul 132 1.5 97.0 1.5 63.6 98.5 0.0 1.5
19 09 75 159 1 *Bishnupur 355 0.6 99.4 0.0 45.4 99.7 0.0 0.3
19 09 75 159 01 1 Bishnupur 325 0.6 99.4 0.0 40.3 99.7 0.0 0.3
19 09 75 159 02 1 Shola Pukuria 30 0.0 100.0 0.0 100.0 100.0 0.0 0.0
19 09 75 224 1 *Dakshin Hossainpur 183 0.0 90.2 9.8 77.0 95.6 0.0 4.4
19 09 75 267 1 *Dakshin Narayanpur 79 0.0 64.6 35.4 30.4 100.0 0.0 0.0
19 09 75 275 1 *Dakshin Padua 134 1.5 97.0 1.5 59.7 99.3 0.0 0.7
RMO: 1 = Rural, 2 = Urban and 3 = Other Urban Page 11 of 162
Tap Tube-Well Other Owned Rented Rent free
2 3 4 5 6 7 8 9 10
MZ /
MHVill RMO
1
Table C-15: Distribution of General Households by Source of Drinking Water, Electricity Connection and Housing Tenancy Status, by Residence
and Community
Administrative Unit
Residence
Community
Number of
Households
Source of Drinking Water (%) Electricity
Connection
(%)
Housing Tenancy (%)
ZL UZUN /
WA
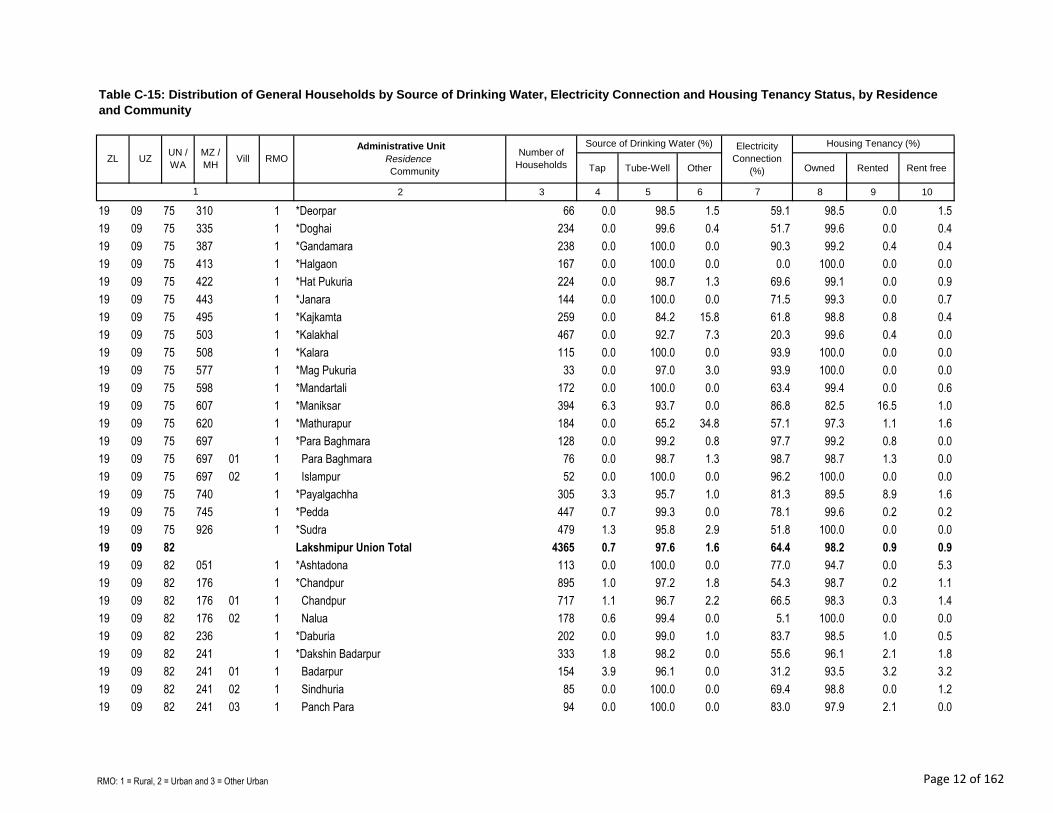
19 09 75 310 1 *Deorpar 66 0.0 98.5 1.5 59.1 98.5 0.0 1.5
19 09 75 335 1 *Doghai 234 0.0 99.6 0.4 51.7 99.6 0.0 0.4
19 09 75 387 1 *Gandamara 238 0.0 100.0 0.0 90.3 99.2 0.4 0.4
19 09 75 413 1 *Halgaon 167 0.0 100.0 0.0 0.0 100.0 0.0 0.0
19 09 75 422 1 *Hat Pukuria 224 0.0 98.7 1.3 69.6 99.1 0.0 0.9
19 09 75 443 1 *Janara 144 0.0 100.0 0.0 71.5 99.3 0.0 0.7
19 09 75 495 1 *Kajkamta 259 0.0 84.2 15.8 61.8 98.8 0.8 0.4
19 09 75 503 1 *Kalakhal 467 0.0 92.7 7.3 20.3 99.6 0.4 0.0
19 09 75 508 1 *Kalara 115 0.0 100.0 0.0 93.9 100.0 0.0 0.0
19 09 75 577 1 *Mag Pukuria 33 0.0 97.0 3.0 93.9 100.0 0.0 0.0
19 09 75 598 1 *Mandartali 172 0.0 100.0 0.0 63.4 99.4 0.0 0.6
19 09 75 607 1 *Maniksar 394 6.3 93.7 0.0 86.8 82.5 16.5 1.0
19 09 75 620 1 *Mathurapur 184 0.0 65.2 34.8 57.1 97.3 1.1 1.6
19 09 75 697 1 *Para Baghmara 128 0.0 99.2 0.8 97.7 99.2 0.8 0.0
19 09 75 697 01 1 Para Baghmara 76 0.0 98.7 1.3 98.7 98.7 1.3 0.0
19 09 75 697 02 1 Islampur 52 0.0 100.0 0.0 96.2 100.0 0.0 0.0
19 09 75 740 1 *Payalgachha 305 3.3 95.7 1.0 81.3 89.5 8.9 1.6
19 09 75 745 1 *Pedda 447 0.7 99.3 0.0 78.1 99.6 0.2 0.2
19 09 75 926 1 *Sudra 479 1.3 95.8 2.9 51.8 100.0 0.0 0.0
19 09 82 Lakshmipur Union Total 4365 0.7 97.6 1.6 64.4 98.2 0.9 0.9
19 09 82 051 1 *Ashtadona 113 0.0 100.0 0.0 77.0 94.7 0.0 5.3
19 09 82 176 1 *Chandpur 895 1.0 97.2 1.8 54.3 98.7 0.2 1.1
19 09 82 176 01 1 Chandpur 717 1.1 96.7 2.2 66.5 98.3 0.3 1.4
19 09 82 176 02 1 Nalua 178 0.6 99.4 0.0 5.1 100.0 0.0 0.0
19 09 82 236 1 *Daburia 202 0.0 99.0 1.0 83.7 98.5 1.0 0.5
19 09 82 241 1 *Dakshin Badarpur 333 1.8 98.2 0.0 55.6 96.1 2.1 1.8
19 09 82 241 01 1 Badarpur 154 3.9 96.1 0.0 31.2 93.5 3.2 3.2
19 09 82 241 02 1 Sindhuria 85 0.0 100.0 0.0 69.4 98.8 0.0 1.2
19 09 82 241 03 1 Panch Para 94 0.0 100.0 0.0 83.0 97.9 2.1 0.0
RMO: 1 = Rural, 2 = Urban and 3 = Other Urban Page 12 of 162
Tap Tube-Well Other Owned Rented Rent free
2 3 4 5 6 7 8 9 10
MZ /
MHVill RMO
1
Table C-15: Distribution of General Households by Source of Drinking Water, Electricity Connection and Housing Tenancy Status, by Residence
and Community
Administrative Unit
Residence
Community
Number of
Households
Source of Drinking Water (%) Electricity
Connection
(%)
Housing Tenancy (%)
ZL UZUN /
WA
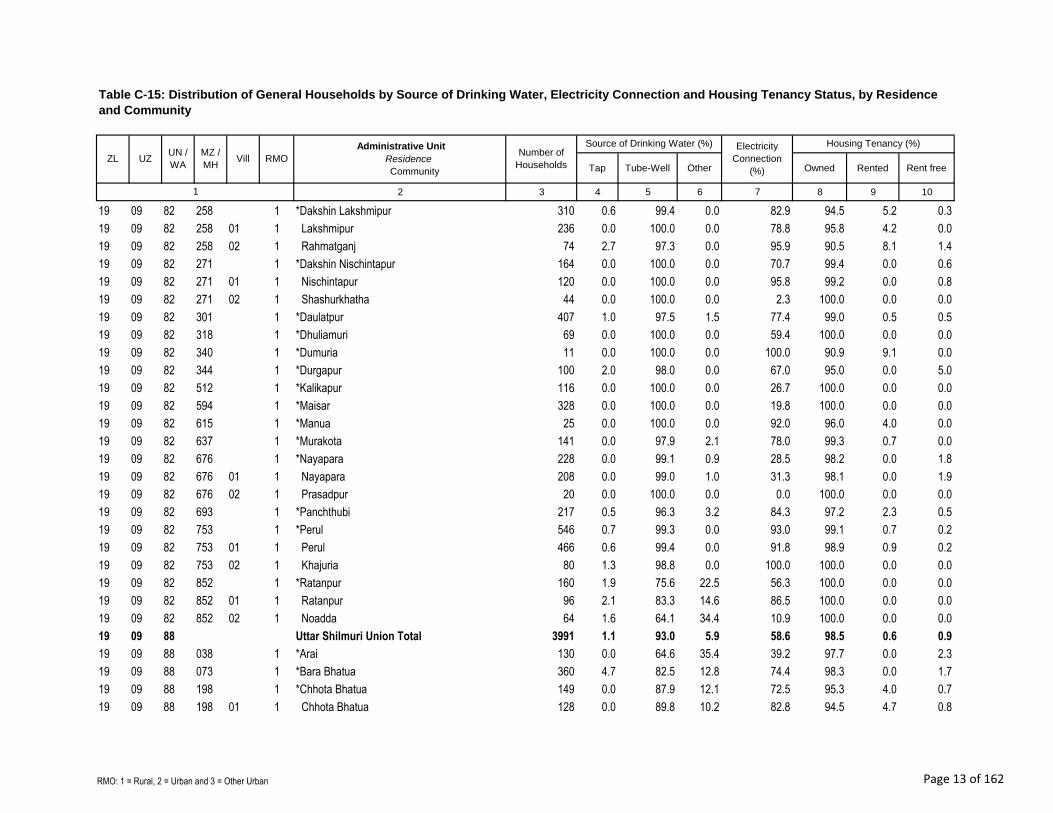
19 09 82 258 1 *Dakshin Lakshmipur 310 0.6 99.4 0.0 82.9 94.5 5.2 0.3
19 09 82 258 01 1 Lakshmipur 236 0.0 100.0 0.0 78.8 95.8 4.2 0.0
19 09 82 258 02 1 Rahmatganj 74 2.7 97.3 0.0 95.9 90.5 8.1 1.4
19 09 82 271 1 *Dakshin Nischintapur 164 0.0 100.0 0.0 70.7 99.4 0.0 0.6
19 09 82 271 01 1 Nischintapur 120 0.0 100.0 0.0 95.8 99.2 0.0 0.8
19 09 82 271 02 1 Shashurkhatha 44 0.0 100.0 0.0 2.3 100.0 0.0 0.0
19 09 82 301 1 *Daulatpur 407 1.0 97.5 1.5 77.4 99.0 0.5 0.5
19 09 82 318 1 *Dhuliamuri 69 0.0 100.0 0.0 59.4 100.0 0.0 0.0
19 09 82 340 1 *Dumuria 11 0.0 100.0 0.0 100.0 90.9 9.1 0.0
19 09 82 344 1 *Durgapur 100 2.0 98.0 0.0 67.0 95.0 0.0 5.0
19 09 82 512 1 *Kalikapur 116 0.0 100.0 0.0 26.7 100.0 0.0 0.0
19 09 82 594 1 *Maisar 328 0.0 100.0 0.0 19.8 100.0 0.0 0.0
19 09 82 615 1 *Manua 25 0.0 100.0 0.0 92.0 96.0 4.0 0.0
19 09 82 637 1 *Murakota 141 0.0 97.9 2.1 78.0 99.3 0.7 0.0
19 09 82 676 1 *Nayapara 228 0.0 99.1 0.9 28.5 98.2 0.0 1.8
19 09 82 676 01 1 Nayapara 208 0.0 99.0 1.0 31.3 98.1 0.0 1.9
19 09 82 676 02 1 Prasadpur 20 0.0 100.0 0.0 0.0 100.0 0.0 0.0
19 09 82 693 1 *Panchthubi 217 0.5 96.3 3.2 84.3 97.2 2.3 0.5
19 09 82 753 1 *Perul 546 0.7 99.3 0.0 93.0 99.1 0.7 0.2
19 09 82 753 01 1 Perul 466 0.6 99.4 0.0 91.8 98.9 0.9 0.2
19 09 82 753 02 1 Khajuria 80 1.3 98.8 0.0 100.0 100.0 0.0 0.0
19 09 82 852 1 *Ratanpur 160 1.9 75.6 22.5 56.3 100.0 0.0 0.0
19 09 82 852 01 1 Ratanpur 96 2.1 83.3 14.6 86.5 100.0 0.0 0.0
19 09 82 852 02 1 Noadda 64 1.6 64.1 34.4 10.9 100.0 0.0 0.0
19 09 88 Uttar Shilmuri Union Total 3991 1.1 93.0 5.9 58.6 98.5 0.6 0.9
19 09 88 038 1 *Arai 130 0.0 64.6 35.4 39.2 97.7 0.0 2.3
19 09 88 073 1 *Bara Bhatua 360 4.7 82.5 12.8 74.4 98.3 0.0 1.7
19 09 88 198 1 *Chhota Bhatua 149 0.0 87.9 12.1 72.5 95.3 4.0 0.7
19 09 88 198 01 1 Chhota Bhatua 128 0.0 89.8 10.2 82.8 94.5 4.7 0.8
RMO: 1 = Rural, 2 = Urban and 3 = Other Urban Page 13 of 162

Tap Tube-Well Other Owned Rented Rent free
2 3 4 5 6 7 8 9 10
MZ /
MHVill RMO
1
Table C-15: Distribution of General Households by Source of Drinking Water, Electricity Connection and Housing Tenancy Status, by Residence
and Community
Administrative Unit
Residence
Community
Number of
Households
Source of Drinking Water (%) Electricity
Connection
(%)
Housing Tenancy (%)
ZL UZUN /
WA
19 09 88 198 02 1 Dari Bhatua 21 0.0 76.2 23.8 9.5 100.0 0.0 0.0
19 09 88 323 1 *Dighalgaon 553 1.6 86.1 12.3 54.8 98.7 0.4 0.9
19 09 88 331 1 *Dimdol 497 0.0 95.8 4.2 73.0 98.2 0.6 1.2
19 09 88 331 01 1 Dimdol 318 0.0 96.2 3.8 84.0 97.5 0.9 1.6
19 09 88 331 02 1 Dighali 130 0.0 100.0 0.0 60.8 100.0 0.0 0.0
19 09 88 331 03 1 Khondakar Hurua 49 0.0 81.6 18.4 34.7 98.0 0.0 2.0
19 09 88 379 1 *Gamarua 333 2.4 93.4 4.2 61.0 99.4 0.0 0.6
19 09 88 465 1 *Jibanpur 494 0.0 98.8 1.2 61.1 99.0 0.0 1.0
19 09 88 473 1 *Jogi Pukuria 108 0.0 100.0 0.0 58.3 99.1 0.0 0.9
19 09 88 482 1 *Joykamta 481 0.6 98.8 0.6 52.2 99.2 0.0 0.8
19 09 88 788 1 *Purba Gobindapur 150 0.0 100.0 0.0 46.7 99.3 0.0 0.7
19 09 88 788 01 1 Purab Gobindapur 100 0.0 100.0 0.0 34.0 99.0 0.0 1.0
19 09 88 788 02 1 Alokdia 50 0.0 100.0 0.0 72.0 100.0 0.0 0.0
19 09 88 801 1 *Purba Nalua 333 0.6 95.8 3.6 48.9 99.1 0.6 0.3
19 09 88 822 1 *Purba Satbaria 195 2.6 97.4 0.0 56.4 96.4 3.6 0.0
19 09 88 930 1 *Sultanpur 168 0.0 100.0 0.0 36.3 97.6 2.4 0.0
19 09 88 990 1 *Uttar Shola Pukuria 40 0.0 100.0 0.0 60.0 97.5 0.0 2.5
19 09 94 Dakshin Shilmuri Union Total 5777 1.2 94.9 3.9 73.6 97.0 1.6 1.4
19 09 94 021 1 *Akusar 277 0.0 97.5 2.5 72.6 99.6 0.0 0.4
19 09 94 025 1 *Amratali 228 7.5 90.4 2.2 78.1 89.5 9.6 0.9
19 09 94 060 1 *Balua 604 0.2 93.9 6.0 81.8 99.2 0.0 0.8
19 09 94 060 01 1 Balua 303 0.3 87.8 11.9 75.2 98.7 0.0 1.3
19 09 94 060 02 1 Khairat Para 89 0.0 100.0 0.0 69.7 98.9 0.0 1.1
19 09 94 060 03 1 Shilmuri 212 0.0 100.0 0.0 96.2 100.0 0.0 0.0
19 09 94 068 1 *Banshpur 330 0.0 96.4 3.6 83.0 98.5 0.0 1.5
19 09 94 090 1 *Bara Lakshmipur 725 0.3 96.6 3.2 75.2 97.7 0.1 2.2
19 09 94 090 01 1 Bara Lakshimpur 351 0.0 93.4 6.6 72.9 97.4 0.3 2.3
19 09 94 090 02 1 Joyag 374 0.5 99.5 0.0 77.3 97.9 0.0 2.1
19 09 94 137 1 *Bhabgram 97 22.7 77.3 0.0 90.7 93.8 6.2 0.0
RMO: 1 = Rural, 2 = Urban and 3 = Other Urban Page 14 of 162

Tap Tube-Well Other Owned Rented Rent free
2 3 4 5 6 7 8 9 10
MZ /
MHVill RMO
1
Table C-15: Distribution of General Households by Source of Drinking Water, Electricity Connection and Housing Tenancy Status, by Residence
and Community
Administrative Unit
Residence
Community
Number of
Households
Source of Drinking Water (%) Electricity
Connection
(%)
Housing Tenancy (%)
ZL UZUN /
WA
19 09 94 172 1 *Chandipur 152 0.0 100.0 0.0 67.8 100.0 0.0 0.0
19 09 94 172 01 1 Chandipur 122 0.0 100.0 0.0 62.3 100.0 0.0 0.0
19 09 94 172 02 1 Baycha Pukuria 30 0.0 100.0 0.0 90.0 100.0 0.0 0.0
19 09 94 185 1 *Chengahata 379 2.6 86.8 10.6 67.8 93.4 3.4 3.2
19 09 94 402 1 *Keshonpar(Part) 81 1.2 98.8 0.0 86.4 95.1 2.5 2.5
19 09 94 525 1 *Kanupur 131 0.0 100.0 0.0 74.0 96.9 0.8 2.3
19 09 94 555 1 *Lagnasar 920 0.5 97.3 2.2 88.9 94.5 4.0 1.5
19 09 94 590 1 *Maij Pukhuria 20 5.0 95.0 0.0 70.0 90.0 0.0 10.0
19 09 94 611 1 *Manohara 231 0.0 88.3 11.7 43.3 100.0 0.0 0.0
19 09 94 624 1 *Matiara 138 0.0 100.0 0.0 29.0 100.0 0.0 0.0
19 09 94 654 1 *Nasaratpur 168 4.2 64.9 31.0 61.3 98.2 0.0 1.8
19 09 94 758 1 *Phalkamuri 224 0.9 99.1 0.0 78.1 98.7 0.9 0.4
19 09 94 783 1 *Purba Baraia 30 0.0 100.0 0.0 80.0 83.3 0.0 16.7
19 09 94 805 1 *Purba Narayanpur 62 1.6 98.4 0.0 66.1 95.2 3.2 1.6
19 09 94 827 1 *Purba Shilmuri 87 0.0 100.0 0.0 58.6 96.6 0.0 3.4
19 09 94 861 1 *Sailcho 198 0.0 100.0 0.0 87.9 98.5 0.5 1.0
19 09 94 861 01 1 Sailcho 175 0.0 100.0 0.0 88.6 98.3 0.6 1.1
19 09 94 861 02 1 Hugli 23 0.0 100.0 0.0 82.6 100.0 0.0 0.0
19 09 94 891 1 *Sialora 344 0.6 99.1 0.3 51.5 100.0 0.0 0.0
19 09 94 934 1 *Sundar Doul 351 0.0 100.0 0.0 64.1 97.7 0.9 1.4
19 09 94 934 01 1 Sundar Doul 191 0.0 100.0 0.0 62.3 96.9 0.5 2.6
19 09 94 934 02 1 Rampur 109 0.0 100.0 0.0 72.5 98.2 1.8 0.0
19 09 94 934 03 1 Bakusar 51 0.0 100.0 0.0 52.9 100.0 0.0 0.0
19 15 Brahmanpara Upazila Total 37995 0.9 96.7 2.4 73.7 97.4 1.6 1.1
19 15 1 Brahmanpara Upazila 36842 0.6 97.2 2.2 73.2 98.2 0.7 1.1
19 15 3 Brahmanpara Upazila 1153 10.9 81.0 8.1 90.9 71.0 27.5 1.5
19 15 18 Brahman Para Union Total 4808 2.7 94.9 2.5 85.8 91.8 7.4 0.8
19 15 18 1 Brahman Para Union 3655 0.1 99.2 0.7 84.2 98.4 1.1 0.6
19 15 18 3 Brahman Para Union 1153 10.9 81.0 8.1 90.9 71.0 27.5 1.5
RMO: 1 = Rural, 2 = Urban and 3 = Other Urban Page 15 of 162

Tap Tube-Well Other Owned Rented Rent free
2 3 4 5 6 7 8 9 10
MZ /
MHVill RMO
1
Table C-15: Distribution of General Households by Source of Drinking Water, Electricity Connection and Housing Tenancy Status, by Residence
and Community
Administrative Unit
Residence
Community
Number of
Households
Source of Drinking Water (%) Electricity
Connection
(%)
Housing Tenancy (%)
ZL UZUN /
WA
19 15 18 159 3 *Brahman Para 756 16.0 80.4 3.6 91.3 68.9 29.8 1.3
19 15 18 218 1 *Dagra Para 901 0.1 99.6 0.3 71.5 96.6 2.2 1.2
19 15 18 218 01 1 Dagra Para 332 0.0 100.0 0.0 64.8 99.4 0.3 0.3
19 15 18 218 02 1 Kalpabash 569 0.2 99.3 0.5 75.4 94.9 3.3 1.8
19 15 18 378 3 *Dirghabhumi 397 1.3 82.1 16.6 90.2 75.1 23.2 1.8
19 15 18 497 1 *Mahalakshmi Para 1006 0.2 97.7 2.1 84.3 99.2 0.4 0.4
19 15 18 636 1 *Naighar 869 0.0 99.9 0.1 97.8 99.9 0.0 0.1
19 15 18 656 1 *Nandi Para 879 0.0 100.0 0.0 83.6 97.7 1.7 0.6
19 15 18 656 01 1 Nandi Para 229 0.0 100.0 0.0 82.5 92.1 6.1 1.7
19 15 18 656 02 1 Dhanya Daul 650 0.0 100.0 0.0 84.0 99.7 0.2 0.2
19 15 30 Dulalpur Union Total 4095 0.7 96.3 3.0 65.4 99.1 0.3 0.6
19 15 30 099 1 *Bejora 730 1.6 94.1 4.2 70.8 98.4 0.7 1.0
19 15 30 375 1 *Gopalnagar 1090 1.1 95.2 3.7 70.9 99.4 0.0 0.6
19 15 30 388 1 *Dulalpur 1488 0.3 99.4 0.3 50.7 99.0 0.6 0.4
19 15 30 388 01 1 Dulalpur 930 0.3 99.5 0.2 58.1 98.6 0.9 0.5
19 15 30 388 02 1 Balina 558 0.2 99.3 0.5 38.5 99.6 0.2 0.2
19 15 30 625 1 *Nalla 787 0.3 94.0 5.7 80.3 99.6 0.0 0.4
19 15 44 Chandla Union Total 4185 0.3 98.3 1.4 75.7 97.7 1.1 1.2
19 15 44 039 1 *Bara Dhusia 1045 0.4 97.3 2.3 72.2 98.6 0.7 0.8
19 15 44 199 1 *Chhota Dhusia 356 0.0 100.0 0.0 89.3 100.0 0.0 0.0
19 15 44 238 1 *Dakshin Chandla 2238 0.4 98.1 1.6 73.2 97.5 1.0 1.5
19 15 44 238 01 1 Chandla Parba 903 0.3 99.7 0.0 52.8 98.9 0.4 0.7
19 15 44 238 02 1 Dakshin Chandla 561 0.4 95.5 4.1 86.5 93.9 3.0 3.0
19 15 44 238 03 1 Purba Chandla 774 0.4 98.1 1.6 87.5 98.6 0.1 1.3
19 15 44 318 1 *Dhalgram 546 0.0 100.0 0.0 83.5 94.9 3.5 1.6
19 15 50 Sidlai Union Total 4396 0.1 97.6 2.3 45.4 99.3 0.4 0.3
19 15 50 119 1 *Berakhola 541 0.7 99.1 0.2 54.3 100.0 0.0 0.0
19 15 50 358 1 *Dighirpar 293 0.0 82.3 17.7 1.0 100.0 0.0 0.0
19 15 50 477 1 *Laruchu 461 0.0 100.0 0.0 43.0 99.3 0.2 0.4
RMO: 1 = Rural, 2 = Urban and 3 = Other Urban Page 16 of 162

Tap Tube-Well Other Owned Rented Rent free
2 3 4 5 6 7 8 9 10
MZ /
MHVill RMO
1
Table C-15: Distribution of General Households by Source of Drinking Water, Electricity Connection and Housing Tenancy Status, by Residence
and Community
Administrative Unit
Residence
Community
Number of
Households
Source of Drinking Water (%) Electricity
Connection
(%)
Housing Tenancy (%)
ZL UZUN /
WA
19 15 50 696 1 *Purba Pomkara 611 0.0 100.0 0.0 9.2 99.2 0.0 0.8
19 15 50 796 1 *Sidlai 2490 0.0 98.1 1.9 58.0 99.0 0.7 0.3
19 15 56 Madhabpur Union Total 5862 0.3 98.2 1.4 82.4 97.6 1.0 1.4
19 15 56 437 1 *Kandughar 816 0.0 99.6 0.4 85.9 99.1 0.4 0.5
19 15 56 517 1 *Makimpur 925 0.1 96.8 3.1 85.9 97.4 0.3 2.3
19 15 56 577 1 *Mangochh 268 0.0 99.6 0.4 58.2 98.1 0.0 1.9
19 15 56 716 1 *Rajabari 177 0.0 99.4 0.6 84.7 99.4 0.0 0.6
19 15 56 736 1 *Ranigachh 290 1.4 93.4 5.2 83.4 98.3 0.7 1.0
19 15 56 776 1 *Shaitsala 928 0.9 95.7 3.4 84.5 98.5 0.5 1.0
19 15 56 835 1 *Uttar Chandla 1407 0.1 99.9 0.0 75.7 98.8 0.2 1.0
19 15 56 835 01 1 Uttar Chandla 661 0.0 100.0 0.0 76.2 98.8 0.5 0.8
19 15 56 835 02 1 Barani 337 0.3 99.7 0.0 77.2 98.5 0.0 1.5
19 15 56 835 03 1 Jamtali 409 0.0 100.0 0.0 73.6 99.0 0.0 1.0
19 15 56 895 1 *Uttar Madhabpur 790 0.4 99.4 0.3 90.4 94.4 3.8 1.8
19 15 56 915 1 *Uttar Mirpur 261 1.1 98.9 0.0 86.6 91.2 4.2 4.6
19 15 62 Malapara Union Total 3287 1.9 94.0 4.2 72.3 98.6 0.2 1.2
19 15 62 009 1 *Asadnagar 530 1.7 98.3 0.0 98.1 99.4 0.2 0.4
19 15 62 014 1 *Alua Chandipur 1373 3.0 92.4 4.7 86.3 98.7 0.2 1.1
19 15 62 169 1 *Chand Para 120 0.0 100.0 0.0 0.0 100.0 0.0 0.0
19 15 62 560 1 *Mala Para 173 0.6 99.4 0.0 94.2 99.4 0.6 0.0
19 15 62 700 1 *Paschim Manoharpur 357 2.8 86.8 10.4 85.2 99.4 0.0 0.6
19 15 62 941 1 *Uttar Krishnapur 78 0.0 100.0 0.0 15.4 100.0 0.0 0.0
19 15 62 966 1 *Uttar Ramnagar 656 0.0 94.5 5.5 29.4 96.6 0.0 3.4
19 15 82 Sahebabad Union Total 3992 1.4 92.6 5.9 76.3 98.6 0.8 0.7
19 15 82 183 1 *Chhatiani 467 0.0 84.6 15.4 66.8 99.6 0.2 0.2
19 15 82 410 1 *Jiran Naya Para 758 2.1 86.0 11.9 76.5 99.9 0.0 0.1
19 15 82 830 1 *Sahebabad 1719 1.9 97.1 1.0 84.8 97.4 1.5 1.1
19 15 82 830 01 1 Sahebabad 1303 1.8 96.9 1.4 84.0 97.0 1.8 1.2
19 15 82 830 02 1 Nagarpar 416 2.2 97.8 0.0 87.5 98.6 0.7 0.7
RMO: 1 = Rural, 2 = Urban and 3 = Other Urban Page 17 of 162

Tap Tube-Well Other Owned Rented Rent free
2 3 4 5 6 7 8 9 10
MZ /
MHVill RMO
1
Table C-15: Distribution of General Households by Source of Drinking Water, Electricity Connection and Housing Tenancy Status, by Residence
and Community
Administrative Unit
Residence
Community
Number of
Households
Source of Drinking Water (%) Electricity
Connection
(%)
Housing Tenancy (%)
ZL UZUN /
WA
19 15 82 879 1 *Takai 864 0.7 92.7 6.6 65.5 99.3 0.0 0.7
19 15 82 883 1 *Tatera 184 1.6 98.4 0.0 69.6 98.4 1.6 0.0
19 15 88 Shashidal Union Total 7370 0.4 98.8 0.8 78.8 97.3 0.9 1.8
19 15 88 019 1 *Asabari 416 0.0 100.0 0.0 89.7 97.8 0.2 1.9
19 15 88 079 1 *Begamabad 80 0.0 100.0 0.0 30.0 98.8 1.3 0.0
19 15 88 258 1 *Dakshin Shashidal 356 1.4 98.0 0.6 85.7 97.8 0.8 1.4
19 15 88 278 1 *Dakshin Tetabhumi 708 0.0 99.7 0.3 70.1 96.0 0.3 3.7
19 15 88 298 1 *Deosh 896 0.2 98.2 1.6 65.7 98.7 0.2 1.1
19 15 88 298 01 1 Deosh 228 0.0 100.0 0.0 81.1 98.7 0.9 0.4
19 15 88 298 02 1 Sajghar 330 0.6 99.1 0.3 60.0 97.9 0.0 2.1
19 15 88 298 03 1 Chubash 338 0.0 96.2 3.8 60.9 99.4 0.0 0.6
19 15 88 537 1 *Malliker Dighi 243 4.1 95.9 0.0 93.4 95.9 0.8 3.3
19 15 88 557 1 *Manara 263 1.5 95.8 2.7 85.6 98.5 1.1 0.4
19 15 88 616 1 *Nagaish 1456 0.1 98.8 1.2 80.8 99.1 0.2 0.7
19 15 88 616 01 1 Dakshin Nagaish 1341 0.1 98.7 1.3 81.4 99.0 0.2 0.7
19 15 88 616 02 1 Uttar Nagaish 115 0.0 100.0 0.0 73.9 100.0 0.0 0.0
19 15 88 815 1 *Uttar Bagra 536 0.4 99.6 0.0 84.9 95.3 3.9 0.7
19 15 88 935 1 *Uttar Narayanpur 218 1.4 98.6 0.0 76.1 98.2 0.0 1.8
19 15 88 955 1 *Uttar Shashidal 926 0.1 98.2 1.7 92.8 96.3 2.1 1.6
19 15 88 975 1 *Uttar Shibpur 669 0.0 99.9 0.1 82.4 96.7 0.4 2.8
19 15 88 975 01 1 Ramchandrapur 409 0.0 100.0 0.0 76.3 100.0 0.0 0.0
19 15 88 975 02 1 Ganganagar 260 0.0 99.6 0.4 91.9 91.5 1.2 7.3
19 15 88 995 1 *Uttar Tetabhumi 603 0.0 100.0 0.0 59.2 95.5 0.7 3.8
19 18 Burichang Upazila Total 58194 6.1 89.8 4.0 89.8 91.9 6.0 2.1
19 18 1 Burichang Upazila 55738 5.3 90.5 4.2 89.5 92.6 5.3 2.1
19 18 3 Burichang Upazila 2456 24.8 74.4 0.8 96.6 75.3 22.6 2.1
19 18 11 Baksimail Union Total 6127 1.2 92.6 6.3 84.3 97.2 0.5 2.3
19 18 11 048 1 *Baksimail 1115 1.1 98.8 0.1 77.0 98.6 0.0 1.4
19 18 11 067 1 *Bara Anandapur 632 1.4 88.4 10.1 72.5 94.1 0.5 5.4
RMO: 1 = Rural, 2 = Urban and 3 = Other Urban Page 18 of 162

Tap Tube-Well Other Owned Rented Rent free
2 3 4 5 6 7 8 9 10
MZ /
MHVill RMO
1
Table C-15: Distribution of General Households by Source of Drinking Water, Electricity Connection and Housing Tenancy Status, by Residence
and Community
Administrative Unit
Residence
Community
Number of
Households
Source of Drinking Water (%) Electricity
Connection
(%)
Housing Tenancy (%)
ZL UZUN /
WA
19 18 11 120 1 *Bhairabpur 31 0.0 90.3 9.7 96.8 100.0 0.0 0.0
19 18 11 198 1 *Chhota Haripur 132 0.0 97.0 3.0 84.8 95.5 0.0 4.5
19 18 11 205 1 *Dakshin Madhabpur 54 0.0 94.4 5.6 100.0 100.0 0.0 0.0
19 18 11 210 1 *Dharmanagar 100 0.0 100.0 0.0 73.0 98.0 0.0 2.0
19 18 11 391 1 *Jamtala 179 0.0 100.0 0.0 97.2 97.8 0.0 2.2
19 18 11 396 1 *Jangalbari 191 4.7 95.3 0.0 97.9 99.5 0.0 0.5
19 18 11 434 1 *Kali Krishnanagar 334 0.6 99.4 0.0 40.1 96.4 0.3 3.3
19 18 11 444 1 *Kanchanpur 75 0.0 100.0 0.0 96.0 98.7 0.0 1.3
19 18 11 483 1 *Kharera 262 0.0 65.6 34.4 97.3 95.0 1.5 3.4
19 18 11 485 1 *Khodaitali (Uttar Kalikapur) 176 0.0 74.4 25.6 84.7 98.3 0.0 1.7
19 18 11 485 01 1 Purba Khodaitali 105 0.0 57.1 42.9 78.1 97.1 0.0 2.9
19 18 11 485 02 1 Paschim Khodaitali 71 0.0 100.0 0.0 94.4 100.0 0.0 0.0
19 18 11 492 1 *Kodalia (Gadanagar) 243 0.0 88.1 11.9 90.5 98.4 0.0 1.6
19 18 11 492 01 1 Gadanagar 64 0.0 100.0 0.0 87.5 100.0 0.0 0.0
19 18 11 492 02 1 Kodalia 179 0.0 83.8 16.2 91.6 97.8 0.0 2.2
19 18 11 521 1 *Lohaimuri 116 0.0 100.0 0.0 87.9 96.6 0.9 2.6
19 18 11 584 1 *Masara 119 0.0 100.0 0.0 99.2 98.3 0.0 1.7
19 18 11 597 1 *Mirpur 322 5.3 83.2 11.5 85.4 97.2 0.0 2.8
19 18 11 613 1 *Manoharpur 71 2.8 95.8 1.4 100.0 87.3 7.0 5.6
19 18 11 656 1 *Paharpur 413 2.4 75.3 22.3 93.2 99.5 0.0 0.5
19 18 11 671 1 *Palti Rajapur 104 0.0 100.0 0.0 78.8 100.0 0.0 0.0
19 18 11 685 1 *Paschim Aggapur 413 1.7 95.4 2.9 96.4 97.1 1.5 1.5
19 18 11 748 1 *Pitambar 282 0.0 100.0 0.0 89.7 96.1 0.4 3.5
19 18 11 763 1 *Purba Aggapur (Chinia) 118 0.0 100.0 0.0 99.2 99.2 0.0 0.8
19 18 11 772 1 *Purba Kalikapur 351 0.0 100.0 0.0 94.0 95.7 2.3 2.0
19 18 11 816 1 *Saidergaon 37 0.0 94.6 5.4 78.4 94.6 0.0 5.4
19 18 11 898 1 *Uttar Balarampur 166 2.4 97.6 0.0 88.0 97.6 0.0 2.4
19 18 11 980 1 *Uttar Sreemantapur 91 0.0 100.0 0.0 89.0 97.8 1.1 1.1
19 18 12 Bharella Union Total 8536 2.8 93.1 4.1 88.3 93.1 3.4 3.5
RMO: 1 = Rural, 2 = Urban and 3 = Other Urban Page 19 of 162

Tap Tube-Well Other Owned Rented Rent free
2 3 4 5 6 7 8 9 10
MZ /
MHVill RMO
1
Table C-15: Distribution of General Households by Source of Drinking Water, Electricity Connection and Housing Tenancy Status, by Residence
and Community
Administrative Unit
Residence
Community
Number of
Households
Source of Drinking Water (%) Electricity
Connection
(%)
Housing Tenancy (%)
ZL UZUN /
WA
19 18 12 053 1 *Baladkuria 573 2.6 94.2 3.1 84.8 87.6 0.2 12.2
19 18 12 053 01 1 Kusumpur 363 0.6 95.0 4.4 79.6 98.9 0.0 1.1
19 18 12 053 02 1 Dayarampur 210 6.2 92.9 1.0 93.8 68.1 0.5 31.4
19 18 12 130 1 *Bharella 952 1.1 94.7 4.2 91.9 97.4 0.5 2.1
19 18 12 188 1 *Chhota Chhikatia 189 3.7 90.5 5.8 89.4 98.9 0.0 1.1
19 18 12 309 1 *Etbarpur 393 3.8 96.2 0.0 90.3 97.2 1.0 1.8
19 18 12 313 1 *Gakshur 366 7.7 52.7 39.6 81.1 64.8 33.1 2.2
19 18 12 318 1 *Garacho 313 1.3 98.7 0.0 82.7 97.4 0.0 2.6
19 18 12 347 1 *Hasnabad 170 0.0 100.0 0.0 90.6 98.8 0.0 1.2
19 18 12 454 1 *Kansanagar 702 3.4 93.7 2.8 92.3 85.0 13.8 1.1
19 18 12 550 1 *Majlishpur 73 0.0 100.0 0.0 78.1 95.9 0.0 4.1
19 18 12 594 1 *Matlar Char 82 2.4 97.6 0.0 95.1 97.6 0.0 2.4
19 18 12 647 1 *Naracho 153 2.6 96.7 0.7 97.4 98.0 0.7 1.3
19 18 12 681 1 *Parowara 799 4.1 94.2 1.6 87.5 87.4 1.9 10.8
19 18 12 695 1 *Paschim Gobindapur 243 1.6 97.9 0.4 97.9 99.6 0.0 0.4
19 18 12 710 1 *Paschim Ramchandrapur 867 2.0 97.6 0.5 90.3 99.3 0.0 0.7
19 18 12 714 1 *Paschim Rampur 848 0.9 99.1 0.0 94.9 94.7 2.2 3.1
19 18 12 729 1 *Paschim Singha 779 5.4 88.2 6.4 81.8 94.1 3.3 2.6
19 18 12 734 1 *Paschim Sobharampur 527 0.6 98.9 0.6 72.7 95.8 0.4 3.8
19 18 12 874 1 *Sundram 507 5.1 86.6 8.3 91.5 99.0 0.2 0.8
19 18 31 Burichang Union Total 7228 12.6 87.0 0.4 91.3 90.6 8.1 1.3
19 18 31 1 Burichang Union 4772 6.3 93.5 0.2 88.6 98.5 0.6 0.9
19 18 31 3 Burichang Union 2456 24.8 74.4 0.8 96.6 75.3 22.6 2.1
19 18 31 072 3 *Bara Bijoypur (Burichang) 2456 24.8 74.4 0.8 96.6 75.3 22.6 2.1
19 18 31 082 1 *Bara Haripur 629 4.3 95.7 0.0 92.4 97.3 0.2 2.5
19 18 31 371 1 *Jadupur 272 0.4 99.6 0.0 87.9 98.5 0.4 1.1
19 18 31 376 1 *Jagatpur 1814 1.3 98.4 0.3 91.8 99.1 0.5 0.4
19 18 31 400 1 *Jabain 277 5.8 94.2 0.0 88.1 96.4 1.1 2.5
19 18 31 787 1 *Purnamati 1208 16.6 83.4 0.1 80.5 98.8 0.9 0.3
RMO: 1 = Rural, 2 = Urban and 3 = Other Urban Page 20 of 162

Tap Tube-Well Other Owned Rented Rent free
2 3 4 5 6 7 8 9 10
MZ /
MHVill RMO
1
Table C-15: Distribution of General Households by Source of Drinking Water, Electricity Connection and Housing Tenancy Status, by Residence
and Community
Administrative Unit
Residence
Community
Number of
Households
Source of Drinking Water (%) Electricity
Connection
(%)
Housing Tenancy (%)
ZL UZUN /
WA
19 18 31 888 1 *Agage Anandapur 572 5.9 93.7 0.3 92.0 98.3 0.5 1.2
19 18 63 Mainamati Union Total 9157 14.5 83.5 2.0 95.1 77.9 20.0 2.2
19 18 63 024 1 *Bagilara 112 1.8 98.2 0.0 97.3 99.1 0.9 0.0
19 18 63 033 1 *Baj Baher Char 226 0.0 100.0 0.0 95.6 99.6 0.0 0.4
19 18 63 038 1 *Bajehora 171 4.1 85.4 10.5 80.7 100.0 0.0 0.0
19 18 63 043 1 *Bajehora (Kismat) 191 8.4 84.8 6.8 84.8 99.0 0.0 1.0
19 18 63 159 1 *Binandiar Char 492 2.2 87.2 10.6 97.4 95.7 3.7 0.6
19 18 63 159 01 1 Binandiar Char 110 4.5 52.7 42.7 91.8 94.5 5.5 0.0
19 18 63 159 02 1 Gandal 133 0.8 99.2 0.0 100.0 93.2 5.3 1.5
19 18 63 159 03 1 Jumur 249 2.0 96.0 2.0 98.4 97.6 2.0 0.4
19 18 63 173 1 *Chandsar 169 1.2 98.8 0.0 97.0 97.6 1.2 1.2
19 18 63 206 1 *Dakshin Mirpur 178 0.0 95.5 4.5 96.6 94.4 0.6 5.1
19 18 63 255 1 *Debpur 80 8.8 91.3 0.0 90.0 91.3 3.8 5.0
19 18 63 342 1 *Harindhara 204 0.0 100.0 0.0 94.6 94.1 0.0 5.9
19 18 63 352 1 *Hossainpur 64 3.1 73.4 23.4 76.6 96.9 1.6 1.6
19 18 63 375 1 *Hossainpur Arzi 98 0.0 100.0 0.0 99.0 93.9 2.0 4.1
19 18 63 381 1 *Jalalpur 80 0.0 100.0 0.0 95.0 96.3 0.0 3.8
19 18 63 405 1 *Jiapur 266 0.4 98.5 1.1 82.0 96.2 1.1 2.6
19 18 63 415 1 *Kachharitala 358 6.7 92.5 0.8 83.5 86.0 10.3 3.6
19 18 63 415 01 1 Kachharitala 202 8.4 90.1 1.5 77.2 94.1 3.5 2.5
19 18 63 415 02 1 Ganaspur 130 4.6 95.4 0.0 96.2 71.5 23.1 5.4
19 18 63 415 03 1 Narpar 26 3.8 96.2 0.0 69.2 96.2 0.0 3.8
19 18 63 429 1 *Kalakachua 547 0.4 99.6 0.0 92.1 87.4 9.9 2.7
19 18 63 463 1 *Kanthalia 151 1.3 98.7 0.0 99.3 98.0 0.0 2.0
19 18 63 536 1 *Mainamati 65 0.0 80.0 20.0 96.9 78.5 21.5 0.0
19 18 63 540 1 *Mainpur 125 0.0 100.0 0.0 97.6 83.2 16.8 0.0
19 18 63 637 1 *Namtala 538 1.5 98.3 0.2 94.4 98.0 0.0 2.0
19 18 63 637 01 1 Namtala 335 1.8 97.9 0.3 96.1 99.1 0.0 0.9
19 18 63 637 02 1 Badua Para 203 1.0 99.0 0.0 91.6 96.1 0.0 3.9
RMO: 1 = Rural, 2 = Urban and 3 = Other Urban Page 21 of 162

Tap Tube-Well Other Owned Rented Rent free
2 3 4 5 6 7 8 9 10
MZ /
MHVill RMO
1
Table C-15: Distribution of General Households by Source of Drinking Water, Electricity Connection and Housing Tenancy Status, by Residence
and Community
Administrative Unit
Residence
Community
Number of
Households
Source of Drinking Water (%) Electricity
Connection
(%)
Housing Tenancy (%)
ZL UZUN /
WA
19 18 63 666 1 *Paik Para 112 0.9 99.1 0.0 89.3 99.1 0.9 0.0
19 18 63 719 1 *Paschim Sharippur 97 2.1 97.9 0.0 90.7 68.0 17.5 14.4
19 18 63 738 1 *Paschim Sreepur 44 0.0 93.2 6.8 93.2 38.6 61.4 0.0
19 18 63 782 1 *Purba Sharippur 116 3.4 96.6 0.0 98.3 57.8 35.3 6.9
19 18 63 801 1 *Roypur 64 0.0 100.0 0.0 98.4 100.0 0.0 0.0
19 18 63 803 1 *Rampal 1205 28.7 70.2 1.1 97.4 54.6 43.3 2.1
19 18 63 803 01 1 Rampal 437 8.7 88.6 2.7 94.7 69.6 29.3 1.1
19 18 63 803 02 1 Farizpur 768 40.1 59.8 0.1 99.0 46.1 51.3 2.6
19 18 63 811 1 *Saha Daulatpur 2672 29.9 68.6 1.5 98.2 60.7 37.9 1.4
19 18 63 811 01 1 Saha Daulatpur 968 8.8 89.2 2.1 96.4 87.0 10.0 3.0
19 18 63 811 02 1 Gus Nagar 990 40.0 58.8 1.2 99.4 38.3 61.6 0.1
19 18 63 811 03 1 Narayansar 462 29.0 69.5 1.5 98.7 65.2 33.3 1.5
19 18 63 811 04 1 Karimabad 252 73.4 26.6 0.0 99.2 39.3 60.3 0.4
19 18 63 821 1 *Samaspur (Kismat) 434 14.1 85.0 0.9 96.8 85.0 10.6 4.4
19 18 63 864 1 *Sinduria Para 178 15.2 84.8 0.0 99.4 97.2 2.2 0.6
19 18 63 994 1 *Yakubpur 120 1.7 98.3 0.0 94.2 98.3 0.0 1.7
19 18 69 Mokam Union Total 9385 3.0 92.1 5.0 92.2 92.4 6.2 1.5
19 18 69 004 1 *Abidpur 1148 3.5 91.1 5.4 89.5 96.8 2.4 0.8
19 18 69 086 1 *Baheri Para 244 2.9 83.6 13.5 88.9 98.4 0.0 1.6
19 18 69 091 1 *Barair 360 4.7 83.1 12.2 86.1 98.3 0.6 1.1
19 18 69 135 1 *Bharikota 298 2.3 81.9 15.8 95.6 99.7 0.0 0.3
19 18 69 294 1 *Dubair Char 939 1.6 93.6 4.8 92.2 93.3 5.3 1.4
19 18 69 294 01 1 Dubair Char 302 1.0 96.0 3.0 96.0 87.1 11.6 1.3
19 18 69 294 02 1 Saha Dilerbagh 249 0.4 86.3 13.3 81.9 98.4 0.4 1.2
19 18 69 294 03 1 Changachha 388 2.8 96.4 0.8 95.9 94.8 3.6 1.5
19 18 69 386 1 *Jalam 30 10.0 90.0 0.0 100.0 100.0 0.0 0.0
19 18 69 425 1 *Kakiar Char 501 2.8 94.6 2.6 95.2 92.0 6.4 1.6
19 18 69 468 1 *Kedarpur 1280 0.9 99.1 0.0 88.2 95.0 3.5 1.5
19 18 69 468 01 1 Kedarpur 82 0.0 100.0 0.0 92.7 100.0 0.0 0.0
RMO: 1 = Rural, 2 = Urban and 3 = Other Urban Page 22 of 162

Tap Tube-Well Other Owned Rented Rent free
2 3 4 5 6 7 8 9 10
MZ /
MHVill RMO
1
Table C-15: Distribution of General Households by Source of Drinking Water, Electricity Connection and Housing Tenancy Status, by Residence
and Community
Administrative Unit
Residence
Community
Number of
Households
Source of Drinking Water (%) Electricity
Connection
(%)
Housing Tenancy (%)
ZL UZUN /
WA
19 18 69 468 02 1 Halgaon 136 0.0 100.0 0.0 80.1 97.1 0.7 2.2
19 18 69 468 03 1 Panchkita 341 0.0 100.0 0.0 83.9 98.8 0.0 1.2
19 18 69 468 04 1 Rupti 148 0.0 100.0 0.0 87.8 99.3 0.0 0.7
19 18 69 468 05 1 Parihal Para 573 2.1 97.9 0.0 92.1 90.4 7.7 1.9
19 18 69 497 1 *Korpai 1554 2.3 93.8 3.9 92.7 90.3 8.4 1.2
19 18 69 497 01 1 Korpai 1192 3.0 91.9 5.0 92.0 91.5 7.0 1.4
19 18 69 497 02 1 Nayakamta 362 0.0 100.0 0.0 94.8 86.5 13.0 0.6
19 18 69 516 1 *Lodhan 78 0.0 100.0 0.0 100.0 97.4 0.0 2.6
19 18 69 569 1 *Manghata 265 1.5 81.9 16.6 91.7 98.5 0.0 1.5
19 18 69 569 01 1 Manghata 132 0.8 98.5 0.8 97.7 97.0 0.0 3.0
19 18 69 569 02 1 Loar Char 133 2.3 65.4 32.3 85.7 100.0 0.0 0.0
19 18 69 589 1 *Mithalma 327 2.4 92.7 4.9 93.0 99.1 0.0 0.9
19 18 69 608 1 *Mokam 562 8.2 91.3 0.5 98.4 74.4 22.8 2.8
19 18 69 608 01 1 Mokam 275 12.4 86.9 0.7 98.9 78.2 16.7 5.1
19 18 69 608 02 1 Madhabpur 287 4.2 95.5 0.3 97.9 70.7 28.6 0.7
19 18 69 652 1 *Nimsar 505 5.1 94.7 0.2 97.4 76.6 20.2 3.2
19 18 69 652 01 1 Nimsar 424 5.0 94.8 0.2 97.6 74.5 24.1 1.4
19 18 69 652 02 1 Shyampur 81 6.2 93.8 0.0 96.3 87.7 0.0 12.3
19 18 69 690 1 *Paschim Durgapur 280 11.1 84.3 4.6 94.3 91.1 7.1 1.8
19 18 69 705 1 *Paschim Monipur 357 2.8 92.4 4.8 85.7 87.4 9.2 3.4
19 18 69 848 1 *Paschim Sikarpur 657 0.2 89.6 10.2 96.5 98.3 1.1 0.6
19 18 72 Pir Jatrapur Union Total 4367 2.2 94.6 3.2 90.1 98.7 0.3 1.0
19 18 72 028 1 *Baher Char 125 4.0 88.8 7.2 73.6 93.6 0.0 6.4
19 18 72 246 1 *Dakshin Shyampur 463 0.6 99.4 0.0 90.9 99.8 0.0 0.2
19 18 72 246 01 1 Dakshin Shyampur 321 0.6 99.4 0.0 90.3 99.7 0.0 0.3
19 18 72 246 02 1 Baria 142 0.7 99.3 0.0 92.3 100.0 0.0 0.0
19 18 72 333 1 *Goshaipur 139 0.0 97.1 2.9 98.6 99.3 0.0 0.7
19 18 72 458 1 *Kanthanagar 493 7.7 74.8 17.4 91.3 98.0 0.4 1.6
19 18 72 487 1 *Kishorenagar 16 12.5 87.5 0.0 93.8 81.3 0.0 18.8
RMO: 1 = Rural, 2 = Urban and 3 = Other Urban Page 23 of 162

Tap Tube-Well Other Owned Rented Rent free
2 3 4 5 6 7 8 9 10
MZ /
MHVill RMO
1
Table C-15: Distribution of General Households by Source of Drinking Water, Electricity Connection and Housing Tenancy Status, by Residence
and Community
Administrative Unit
Residence
Community
Number of
Households
Source of Drinking Water (%) Electricity
Connection
(%)
Housing Tenancy (%)
ZL UZUN /
WA
19 18 72 502 1 *Kumalla 175 1.7 93.7 4.6 84.6 98.9 0.0 1.1
19 18 72 806 1 *Sadakpur 1042 1.3 98.6 0.1 94.9 99.6 0.2 0.2
19 18 72 840 1 *Sreepur (Samantapur) 181 4.4 95.6 0.0 85.6 97.2 1.1 1.7
19 18 72 912 1 *Uttar Gobindapur 715 2.1 96.5 1.4 87.6 99.0 0.1 0.8
19 18 72 922 1 *Uttar Gopinathpur 341 1.5 98.2 0.3 97.4 98.2 0.3 1.5
19 18 72 932 1 *Uttar Jatrapur 401 0.2 99.8 0.0 79.1 99.0 0.5 0.5
19 18 72 985 1 *Uttar Shyampur 276 1.1 91.3 7.6 91.3 98.2 0.4 1.4
19 18 75 Rajapur Union Total 6080 0.5 97.4 2.1 82.2 96.6 0.9 2.5
19 18 75 059 1 *Bareshwar 1050 1.6 92.4 6.0 75.2 98.4 0.3 1.3
19 18 75 139 1 *Bhabermura 129 0.0 100.0 0.0 86.8 95.3 0.0 4.7
19 18 75 179 1 *Charnal 611 0.3 99.7 0.0 81.2 95.6 0.2 4.3
19 18 75 248 1 *Dakshingaon 327 0.0 89.6 10.4 90.8 96.9 1.8 1.2
19 18 75 338 1 *Dhareshwar 90 0.0 97.8 2.2 60.0 98.9 0.0 1.1
19 18 75 398 1 *Gilatala 186 0.0 100.0 0.0 65.6 97.8 0.0 2.2
19 18 75 417 1 *Haidrabad 40 0.0 100.0 0.0 100.0 95.0 0.0 5.0
19 18 75 457 1 *Laribagh 534 0.2 99.8 0.0 75.8 97.8 0.6 1.7
19 18 75 597 1 *Nabiabad 51 0.0 100.0 0.0 100.0 100.0 0.0 0.0
19 18 75 666 1 *Paikota 109 0.0 100.0 0.0 63.3 93.6 0.0 6.4
19 18 75 676 1 *Panchara 636 0.0 100.0 0.0 89.5 98.6 0.0 1.4
19 18 75 716 1 *Sankochail 845 0.0 100.0 0.0 92.0 94.0 3.9 2.1
19 18 75 726 1 *Rajapur 1112 0.7 96.7 2.6 79.6 95.8 0.4 3.9
19 18 75 855 1 *Uttargaon 360 0.0 99.7 0.3 92.5 96.7 0.8 2.5
19 18 94 Sholanal Union Total 7314 8.3 82.4 9.3 91.3 96.1 1.5 2.4
19 18 94 057 1 *Balikhara 242 1.7 97.5 0.8 94.2 97.1 0.0 2.9
19 18 94 111 1 *Berajal Kadamtali 101 5.0 95.0 0.0 99.0 99.0 0.0 1.0
19 18 94 125 1 *Bhanti 179 4.5 95.5 0.0 93.9 97.2 1.1 1.7
19 18 94 144 1 *Bhorasar 332 19.0 79.8 1.2 88.6 74.1 14.5 11.4
19 18 94 149 1 *Bhabanipur 119 10.1 50.4 39.5 88.2 91.6 4.2 4.2
19 18 94 154 1 *Bhurbhuria 363 0.0 100.0 0.0 95.9 99.4 0.0 0.6
RMO: 1 = Rural, 2 = Urban and 3 = Other Urban Page 24 of 162

Tap Tube-Well Other Owned Rented Rent free
2 3 4 5 6 7 8 9 10
MZ /
MHVill RMO
1
Table C-15: Distribution of General Households by Source of Drinking Water, Electricity Connection and Housing Tenancy Status, by Residence
and Community
Administrative Unit
Residence
Community
Number of
Households
Source of Drinking Water (%) Electricity
Connection
(%)
Housing Tenancy (%)
ZL UZUN /
WA
19 18 94 202 1 *Chowgura 212 9.0 91.0 0.0 92.9 97.6 0.0 2.4
19 18 94 280 1 *Dighir Char Aganagar 165 3.6 96.4 0.0 96.4 96.4 1.8 1.8
19 18 94 323 1 *Gazipur 437 8.0 73.2 18.8 90.8 95.9 2.5 1.6
19 18 94 362 1 *Ichhapur 543 14.5 85.1 0.4 96.5 97.2 1.3 1.5
19 18 94 367 1 *Indrabati 201 6.0 87.6 6.5 90.0 98.5 0.0 1.5
19 18 94 420 1 *Kahetara 140 2.1 97.9 0.0 97.9 99.3 0.0 0.7
19 18 94 439 1 *Kamarkhara 216 5.6 61.1 33.3 83.3 98.6 0.0 1.4
19 18 94 473 1 *Kosaium 191 4.7 84.8 10.5 92.1 95.8 0.0 4.2
19 18 94 478 1 *Kharatia 691 9.7 86.3 4.1 88.7 98.1 0.7 1.2
19 18 94 526 1 *Madhya Ramnagar 176 11.9 42.6 45.5 95.5 95.5 0.0 4.5
19 18 94 545 1 *Mahishmara 370 11.6 88.4 0.0 92.4 96.5 1.1 2.4
19 18 94 603 1 *Mithilapur 236 0.4 99.6 0.0 80.1 97.0 0.0 3.0
19 18 94 695 1 *Purba Gobindapur 101 27.7 51.5 20.8 100.0 96.0 4.0 0.0
19 18 94 724 1 *Purba Sikarpur 351 3.4 79.5 17.1 87.2 95.4 2.0 2.6
19 18 94 743 1 *Payat 354 8.8 59.6 31.6 93.2 96.9 1.1 2.0
19 18 94 758 1 *Purba Hora 531 2.8 88.3 8.9 87.2 98.9 0.0 1.1
19 18 94 845 1 *Sholanal 435 6.9 86.9 6.2 85.3 97.5 1.6 0.9
19 18 94 850 1 *Shibrampur 390 18.5 81.0 0.5 95.9 96.4 1.3 2.3
19 18 94 859 1 *Shimul Khara 127 15.7 70.9 13.4 98.4 95.3 0.0 4.7
19 18 94 869 1 *Sonaisar 111 0.0 63.1 36.9 90.1 92.8 0.9 6.3
19 27 Chandina Upazila Total 69588 1.5 93.3 5.1 66.3 95.3 3.8 0.9
19 27 1 Chandina Upazila 60000 0.5 94.3 5.3 62.5 98.2 0.9 0.8
19 27 2 Chandina Upazila 9261 8.3 87.2 4.5 90.6 76.4 22.3 1.2
19 27 3 Chandina Upazila 327 0.0 98.2 1.8 85.3 100.0 0.0 0.0
Chandina Paurashava
19 27 01 Ward No-01 Total 1420 16.1 83.8 0.1 98.7 69.7 30.1 0.1
19 27 01 400 2 *Kachuar Par 71 1.4 98.6 0.0 97.2 100.0 0.0 0.0
19 27 01 584 2 *Moharanga Mahallah 974 16.3 83.6 0.1 98.8 67.8 32.1 0.1
19 27 01 642 2 *Uttar Belashar(Part) 375 18.4 81.6 0.0 98.9 69.1 30.7 0.3
RMO: 1 = Rural, 2 = Urban and 3 = Other Urban Page 25 of 162
Tap Tube-Well Other Owned Rented Rent free
2 3 4 5 6 7 8 9 10
MZ /
MHVill RMO
1
Table C-15: Distribution of General Households by Source of Drinking Water, Electricity Connection and Housing Tenancy Status, by Residence
and Community
Administrative Unit
Residence
Community
Number of
Households
Source of Drinking Water (%) Electricity
Connection
(%)
Housing Tenancy (%)
ZL UZUN /
WA
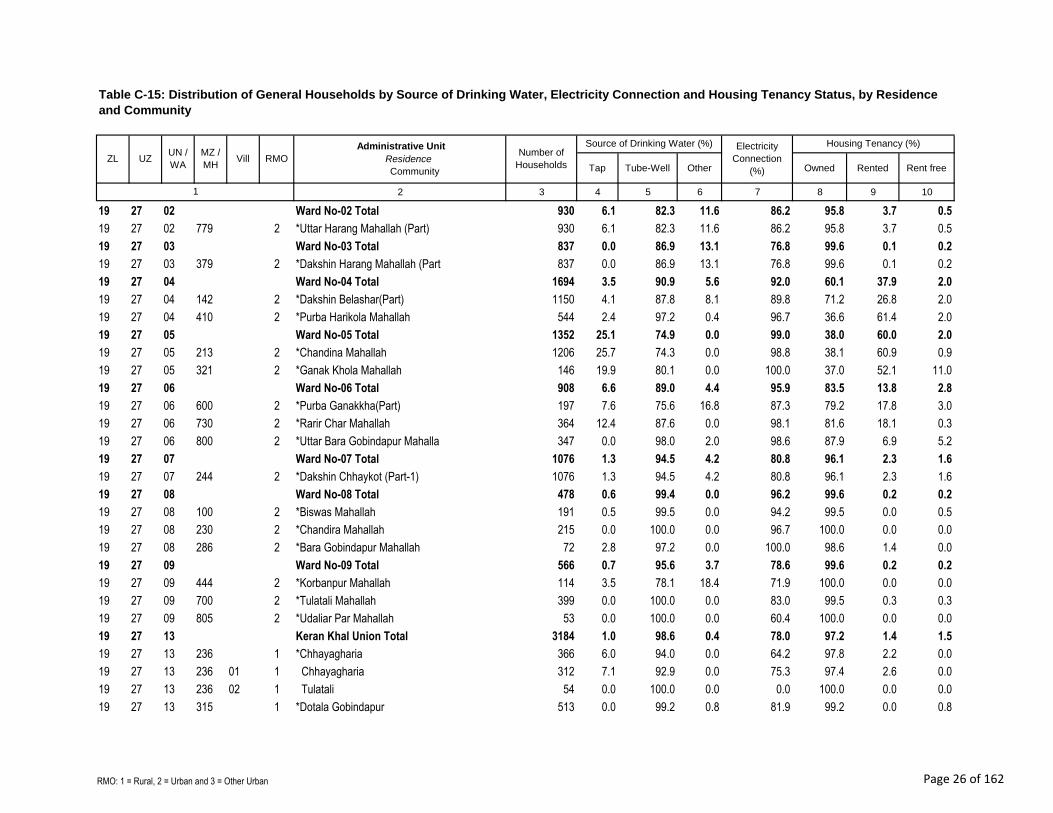
19 27 02 Ward No-02 Total 930 6.1 82.3 11.6 86.2 95.8 3.7 0.5
19 27 02 779 2 *Uttar Harang Mahallah (Part) 930 6.1 82.3 11.6 86.2 95.8 3.7 0.5
19 27 03 Ward No-03 Total 837 0.0 86.9 13.1 76.8 99.6 0.1 0.2
19 27 03 379 2 *Dakshin Harang Mahallah (Part 837 0.0 86.9 13.1 76.8 99.6 0.1 0.2
19 27 04 Ward No-04 Total 1694 3.5 90.9 5.6 92.0 60.1 37.9 2.0
19 27 04 142 2 *Dakshin Belashar(Part) 1150 4.1 87.8 8.1 89.8 71.2 26.8 2.0
19 27 04 410 2 *Purba Harikola Mahallah 544 2.4 97.2 0.4 96.7 36.6 61.4 2.0
19 27 05 Ward No-05 Total 1352 25.1 74.9 0.0 99.0 38.0 60.0 2.0
19 27 05 213 2 *Chandina Mahallah 1206 25.7 74.3 0.0 98.8 38.1 60.9 0.9
19 27 05 321 2 *Ganak Khola Mahallah 146 19.9 80.1 0.0 100.0 37.0 52.1 11.0
19 27 06 Ward No-06 Total 908 6.6 89.0 4.4 95.9 83.5 13.8 2.8
19 27 06 600 2 *Purba Ganakkha(Part) 197 7.6 75.6 16.8 87.3 79.2 17.8 3.0
19 27 06 730 2 *Rarir Char Mahallah 364 12.4 87.6 0.0 98.1 81.6 18.1 0.3
19 27 06 800 2 *Uttar Bara Gobindapur Mahalla 347 0.0 98.0 2.0 98.6 87.9 6.9 5.2
19 27 07 Ward No-07 Total 1076 1.3 94.5 4.2 80.8 96.1 2.3 1.6
19 27 07 244 2 *Dakshin Chhaykot (Part-1) 1076 1.3 94.5 4.2 80.8 96.1 2.3 1.6
19 27 08 Ward No-08 Total 478 0.6 99.4 0.0 96.2 99.6 0.2 0.2
19 27 08 100 2 *Biswas Mahallah 191 0.5 99.5 0.0 94.2 99.5 0.0 0.5
19 27 08 230 2 *Chandira Mahallah 215 0.0 100.0 0.0 96.7 100.0 0.0 0.0
19 27 08 286 2 *Bara Gobindapur Mahallah 72 2.8 97.2 0.0 100.0 98.6 1.4 0.0
19 27 09 Ward No-09 Total 566 0.7 95.6 3.7 78.6 99.6 0.2 0.2
19 27 09 444 2 *Korbanpur Mahallah 114 3.5 78.1 18.4 71.9 100.0 0.0 0.0
19 27 09 700 2 *Tulatali Mahallah 399 0.0 100.0 0.0 83.0 99.5 0.3 0.3
19 27 09 805 2 *Udaliar Par Mahallah 53 0.0 100.0 0.0 60.4 100.0 0.0 0.0
19 27 13 Keran Khal Union Total 3184 1.0 98.6 0.4 78.0 97.2 1.4 1.5
19 27 13 236 1 *Chhayagharia 366 6.0 94.0 0.0 64.2 97.8 2.2 0.0
19 27 13 236 01 1 Chhayagharia 312 7.1 92.9 0.0 75.3 97.4 2.6 0.0
19 27 13 236 02 1 Tulatali 54 0.0 100.0 0.0 0.0 100.0 0.0 0.0
19 27 13 315 1 *Dotala Gobindapur 513 0.0 99.2 0.8 81.9 99.2 0.0 0.8
RMO: 1 = Rural, 2 = Urban and 3 = Other Urban Page 26 of 162
Tap Tube-Well Other Owned Rented Rent free
2 3 4 5 6 7 8 9 10
MZ /
MHVill RMO
1
Table C-15: Distribution of General Households by Source of Drinking Water, Electricity Connection and Housing Tenancy Status, by Residence
and Community
Administrative Unit
Residence
Community
Number of
Households
Source of Drinking Water (%) Electricity
Connection
(%)
Housing Tenancy (%)
ZL UZUN /
WA
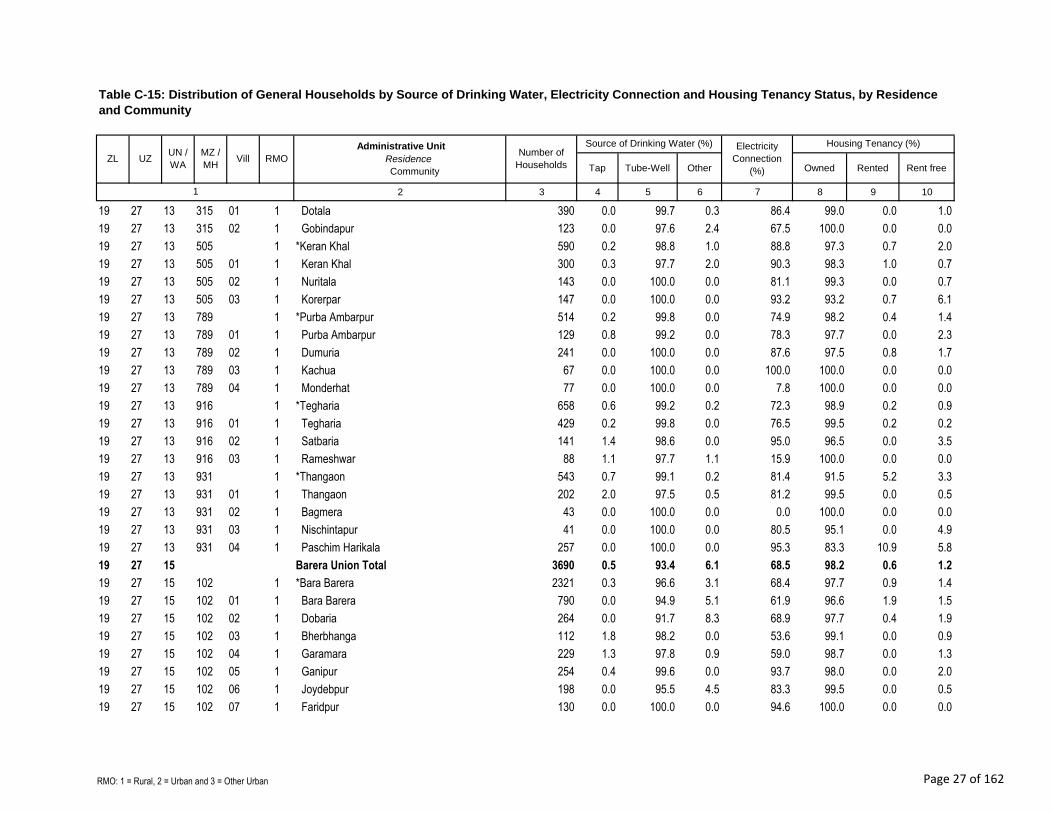
19 27 13 315 01 1 Dotala 390 0.0 99.7 0.3 86.4 99.0 0.0 1.0
19 27 13 315 02 1 Gobindapur 123 0.0 97.6 2.4 67.5 100.0 0.0 0.0
19 27 13 505 1 *Keran Khal 590 0.2 98.8 1.0 88.8 97.3 0.7 2.0
19 27 13 505 01 1 Keran Khal 300 0.3 97.7 2.0 90.3 98.3 1.0 0.7
19 27 13 505 02 1 Nuritala 143 0.0 100.0 0.0 81.1 99.3 0.0 0.7
19 27 13 505 03 1 Korerpar 147 0.0 100.0 0.0 93.2 93.2 0.7 6.1
19 27 13 789 1 *Purba Ambarpur 514 0.2 99.8 0.0 74.9 98.2 0.4 1.4
19 27 13 789 01 1 Purba Ambarpur 129 0.8 99.2 0.0 78.3 97.7 0.0 2.3
19 27 13 789 02 1 Dumuria 241 0.0 100.0 0.0 87.6 97.5 0.8 1.7
19 27 13 789 03 1 Kachua 67 0.0 100.0 0.0 100.0 100.0 0.0 0.0
19 27 13 789 04 1 Monderhat 77 0.0 100.0 0.0 7.8 100.0 0.0 0.0
19 27 13 916 1 *Tegharia 658 0.6 99.2 0.2 72.3 98.9 0.2 0.9
19 27 13 916 01 1 Tegharia 429 0.2 99.8 0.0 76.5 99.5 0.2 0.2
19 27 13 916 02 1 Satbaria 141 1.4 98.6 0.0 95.0 96.5 0.0 3.5
19 27 13 916 03 1 Rameshwar 88 1.1 97.7 1.1 15.9 100.0 0.0 0.0
19 27 13 931 1 *Thangaon 543 0.7 99.1 0.2 81.4 91.5 5.2 3.3
19 27 13 931 01 1 Thangaon 202 2.0 97.5 0.5 81.2 99.5 0.0 0.5
19 27 13 931 02 1 Bagmera 43 0.0 100.0 0.0 0.0 100.0 0.0 0.0
19 27 13 931 03 1 Nischintapur 41 0.0 100.0 0.0 80.5 95.1 0.0 4.9
19 27 13 931 04 1 Paschim Harikala 257 0.0 100.0 0.0 95.3 83.3 10.9 5.8
19 27 15 Barera Union Total 3690 0.5 93.4 6.1 68.5 98.2 0.6 1.2
19 27 15 102 1 *Bara Barera 2321 0.3 96.6 3.1 68.4 97.7 0.9 1.4
19 27 15 102 01 1 Bara Barera 790 0.0 94.9 5.1 61.9 96.6 1.9 1.5
19 27 15 102 02 1 Dobaria 264 0.0 91.7 8.3 68.9 97.7 0.4 1.9
19 27 15 102 03 1 Bherbhanga 112 1.8 98.2 0.0 53.6 99.1 0.0 0.9
19 27 15 102 04 1 Garamara 229 1.3 97.8 0.9 59.0 98.7 0.0 1.3
19 27 15 102 05 1 Ganipur 254 0.4 99.6 0.0 93.7 98.0 0.0 2.0
19 27 15 102 06 1 Joydebpur 198 0.0 95.5 4.5 83.3 99.5 0.0 0.5
19 27 15 102 07 1 Faridpur 130 0.0 100.0 0.0 94.6 100.0 0.0 0.0
RMO: 1 = Rural, 2 = Urban and 3 = Other Urban Page 27 of 162

Tap Tube-Well Other Owned Rented Rent free
2 3 4 5 6 7 8 9 10
MZ /
MHVill RMO
1
Table C-15: Distribution of General Households by Source of Drinking Water, Electricity Connection and Housing Tenancy Status, by Residence
and Community
Administrative Unit
Residence
Community
Number of
Households
Source of Drinking Water (%) Electricity
Connection
(%)
Housing Tenancy (%)
ZL UZUN /
WA
19 27 15 102 08 1 Lonakanda 176 0.0 100.0 0.0 84.7 100.0 0.0 0.0
19 27 15 102 09 1 Goatmeher 38 2.6 97.4 0.0 94.7 86.8 7.9 5.3
19 27 15 102 10 1 Narasingpur 130 0.0 100.0 0.0 7.7 95.4 1.5 3.1
19 27 15 229 1 *Chhatadda 469 1.3 74.4 24.3 68.7 99.4 0.0 0.6
19 27 15 229 01 1 Chhatadda 256 2.3 55.9 41.8 67.6 98.8 0.0 1.2
19 27 15 229 02 1 Kazipara 213 0.0 96.7 3.3 70.0 100.0 0.0 0.0
19 27 15 268 1 *Chiradda 503 0.8 91.8 7.4 68.8 99.6 0.0 0.4
19 27 15 750 1 *Paschim Ramchandrapur 397 0.0 99.5 0.5 68.8 98.0 0.3 1.8
19 27 15 750 01 1 Ramchandrapur 141 0.0 100.0 0.0 51.1 94.3 0.7 5.0
19 27 15 750 02 1 Tatera 256 0.0 99.2 0.8 78.5 100.0 0.0 0.0
19 27 20 Mahichal Union Total 4465 0.5 88.6 11.0 57.9 98.4 0.8 0.9
19 27 20 1 Mahichal Union 4138 0.5 87.8 11.7 55.7 98.2 0.8 0.9
19 27 20 3 Mahichal Union 327 0.0 98.2 1.8 85.3 100.0 0.0 0.0
19 27 20 078 3 *Bamatia 327 0.0 98.2 1.8 85.3 100.0 0.0 0.0
19 27 20 260 1 *Chhota Saoratali 96 0.0 100.0 0.0 0.0 100.0 0.0 0.0
19 27 20 363 1 *Ghatighara 245 0.0 71.8 28.2 14.7 99.2 0.0 0.8
19 27 20 608 1 *Manipur 125 0.0 98.4 1.6 1.6 98.4 0.0 1.6
19 27 20 608 01 1 Manipur 39 0.0 94.9 5.1 5.1 97.4 0.0 2.6
19 27 20 608 02 1 Paria 86 0.0 100.0 0.0 0.0 98.8 0.0 1.2
19 27 20 679 1 *Nij Mahichal 2613 0.7 89.8 9.6 61.3 97.9 1.1 1.0
19 27 20 679 01 1 Nij Mahichal 1129 0.8 83.2 16.0 71.9 96.8 2.4 0.8
19 27 20 679 02 1 Noapara 132 0.0 48.5 51.5 65.2 97.7 0.0 2.3
19 27 20 679 03 1 Haraldar 160 2.5 97.5 0.0 91.9 100.0 0.0 0.0
19 27 20 679 04 1 Tulakura 30 0.0 100.0 0.0 0.0 100.0 0.0 0.0
19 27 20 679 05 1 Habatia Para 79 1.3 98.7 0.0 39.2 100.0 0.0 0.0
19 27 20 679 06 1 Lararpar 59 0.0 100.0 0.0 39.0 96.6 0.0 3.4
19 27 20 679 07 1 Jinia 55 1.8 98.2 0.0 14.5 100.0 0.0 0.0
19 27 20 679 08 1 Bagmara 74 0.0 98.6 1.4 86.5 100.0 0.0 0.0
19 27 20 679 09 1 Tatuia 57 0.0 100.0 0.0 70.2 100.0 0.0 0.0
RMO: 1 = Rural, 2 = Urban and 3 = Other Urban Page 28 of 162
Tap Tube-Well Other Owned Rented Rent free
2 3 4 5 6 7 8 9 10
MZ /
MHVill RMO
1
Table C-15: Distribution of General Households by Source of Drinking Water, Electricity Connection and Housing Tenancy Status, by Residence
and Community
Administrative Unit
Residence
Community
Number of
Households
Source of Drinking Water (%) Electricity
Connection
(%)
Housing Tenancy (%)
ZL UZUN /
WA
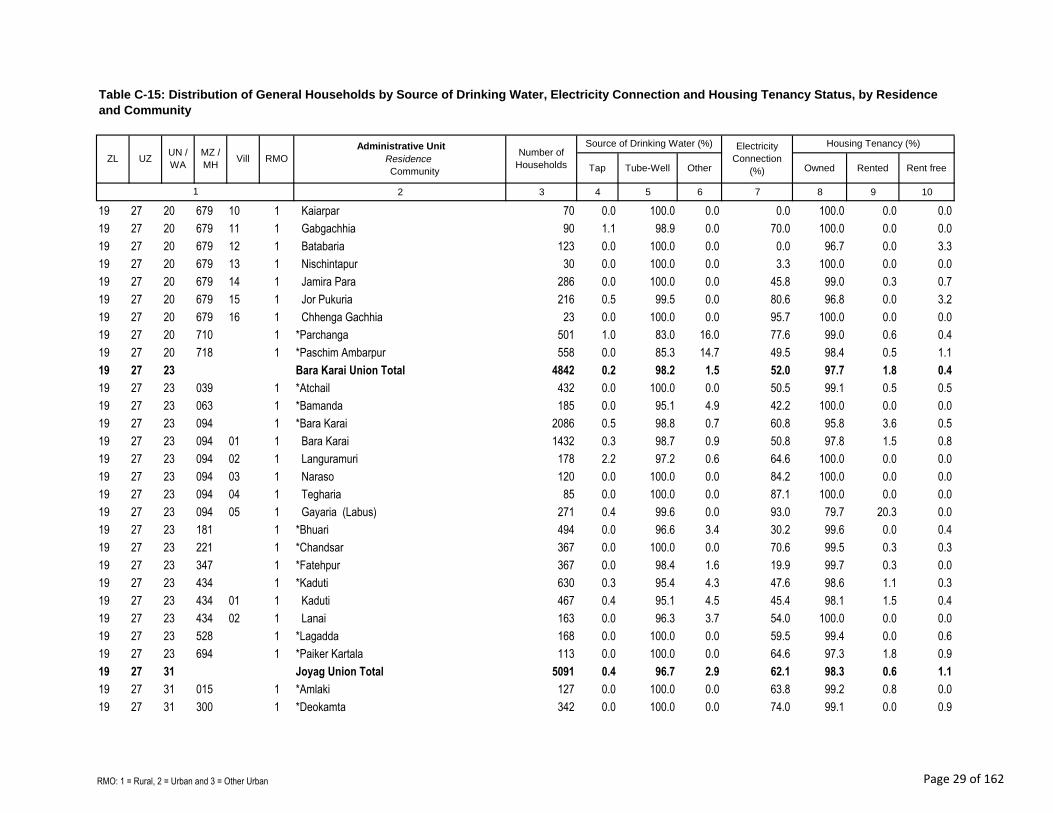
19 27 20 679 10 1 Kaiarpar 70 0.0 100.0 0.0 0.0 100.0 0.0 0.0
19 27 20 679 11 1 Gabgachhia 90 1.1 98.9 0.0 70.0 100.0 0.0 0.0
19 27 20 679 12 1 Batabaria 123 0.0 100.0 0.0 0.0 96.7 0.0 3.3
19 27 20 679 13 1 Nischintapur 30 0.0 100.0 0.0 3.3 100.0 0.0 0.0
19 27 20 679 14 1 Jamira Para 286 0.0 100.0 0.0 45.8 99.0 0.3 0.7
19 27 20 679 15 1 Jor Pukuria 216 0.5 99.5 0.0 80.6 96.8 0.0 3.2
19 27 20 679 16 1 Chhenga Gachhia 23 0.0 100.0 0.0 95.7 100.0 0.0 0.0
19 27 20 710 1 *Parchanga 501 1.0 83.0 16.0 77.6 99.0 0.6 0.4
19 27 20 718 1 *Paschim Ambarpur 558 0.0 85.3 14.7 49.5 98.4 0.5 1.1
19 27 23 Bara Karai Union Total 4842 0.2 98.2 1.5 52.0 97.7 1.8 0.4
19 27 23 039 1 *Atchail 432 0.0 100.0 0.0 50.5 99.1 0.5 0.5
19 27 23 063 1 *Bamanda 185 0.0 95.1 4.9 42.2 100.0 0.0 0.0
19 27 23 094 1 *Bara Karai 2086 0.5 98.8 0.7 60.8 95.8 3.6 0.5
19 27 23 094 01 1 Bara Karai 1432 0.3 98.7 0.9 50.8 97.8 1.5 0.8
19 27 23 094 02 1 Languramuri 178 2.2 97.2 0.6 64.6 100.0 0.0 0.0
19 27 23 094 03 1 Naraso 120 0.0 100.0 0.0 84.2 100.0 0.0 0.0
19 27 23 094 04 1 Tegharia 85 0.0 100.0 0.0 87.1 100.0 0.0 0.0
19 27 23 094 05 1 Gayaria (Labus) 271 0.4 99.6 0.0 93.0 79.7 20.3 0.0
19 27 23 181 1 *Bhuari 494 0.0 96.6 3.4 30.2 99.6 0.0 0.4
19 27 23 221 1 *Chandsar 367 0.0 100.0 0.0 70.6 99.5 0.3 0.3
19 27 23 347 1 *Fatehpur 367 0.0 98.4 1.6 19.9 99.7 0.3 0.0
19 27 23 434 1 *Kaduti 630 0.3 95.4 4.3 47.6 98.6 1.1 0.3
19 27 23 434 01 1 Kaduti 467 0.4 95.1 4.5 45.4 98.1 1.5 0.4
19 27 23 434 02 1 Lanai 163 0.0 96.3 3.7 54.0 100.0 0.0 0.0
19 27 23 528 1 *Lagadda 168 0.0 100.0 0.0 59.5 99.4 0.0 0.6
19 27 23 694 1 *Paiker Kartala 113 0.0 100.0 0.0 64.6 97.3 1.8 0.9
19 27 31 Joyag Union Total 5091 0.4 96.7 2.9 62.1 98.3 0.6 1.1
19 27 31 015 1 *Amlaki 127 0.0 100.0 0.0 63.8 99.2 0.8 0.0
19 27 31 300 1 *Deokamta 342 0.0 100.0 0.0 74.0 99.1 0.0 0.9
RMO: 1 = Rural, 2 = Urban and 3 = Other Urban Page 29 of 162
Tap Tube-Well Other Owned Rented Rent free
2 3 4 5 6 7 8 9 10
MZ /
MHVill RMO
1
Table C-15: Distribution of General Households by Source of Drinking Water, Electricity Connection and Housing Tenancy Status, by Residence
and Community
Administrative Unit
Residence
Community
Number of
Households
Source of Drinking Water (%) Electricity
Connection
(%)
Housing Tenancy (%)
ZL UZUN /
WA
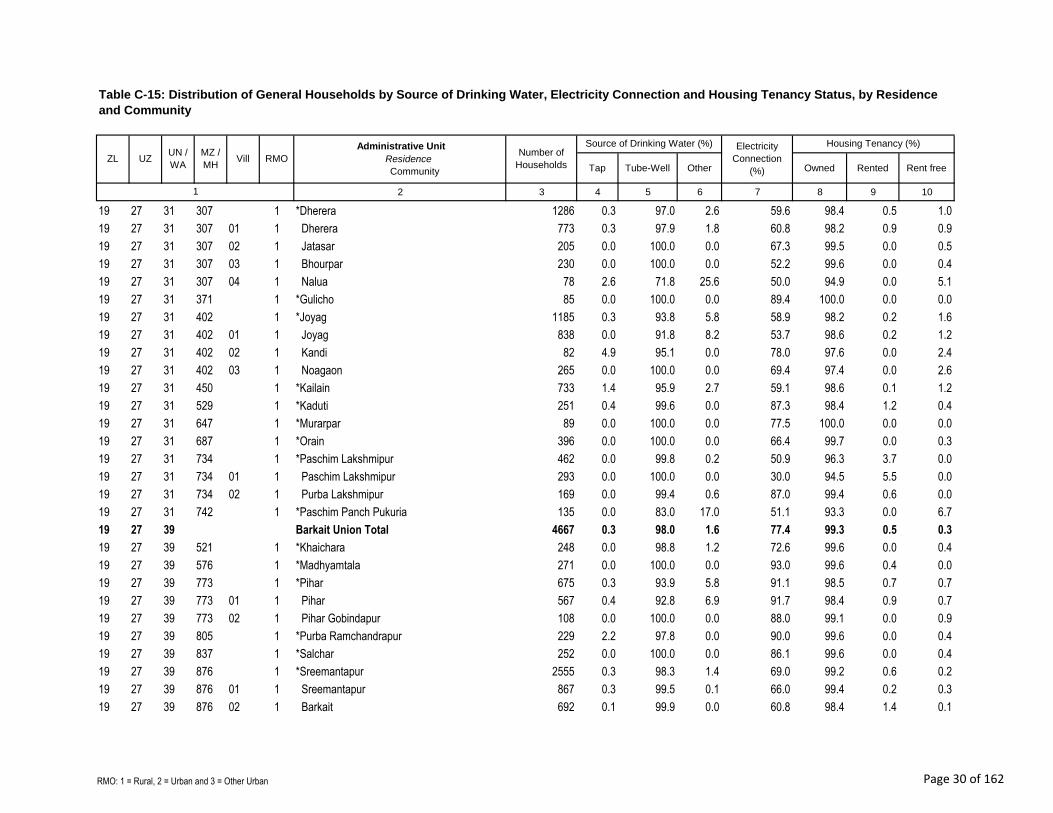
19 27 31 307 1 *Dherera 1286 0.3 97.0 2.6 59.6 98.4 0.5 1.0
19 27 31 307 01 1 Dherera 773 0.3 97.9 1.8 60.8 98.2 0.9 0.9
19 27 31 307 02 1 Jatasar 205 0.0 100.0 0.0 67.3 99.5 0.0 0.5
19 27 31 307 03 1 Bhourpar 230 0.0 100.0 0.0 52.2 99.6 0.0 0.4
19 27 31 307 04 1 Nalua 78 2.6 71.8 25.6 50.0 94.9 0.0 5.1
19 27 31 371 1 *Gulicho 85 0.0 100.0 0.0 89.4 100.0 0.0 0.0
19 27 31 402 1 *Joyag 1185 0.3 93.8 5.8 58.9 98.2 0.2 1.6
19 27 31 402 01 1 Joyag 838 0.0 91.8 8.2 53.7 98.6 0.2 1.2
19 27 31 402 02 1 Kandi 82 4.9 95.1 0.0 78.0 97.6 0.0 2.4
19 27 31 402 03 1 Noagaon 265 0.0 100.0 0.0 69.4 97.4 0.0 2.6
19 27 31 450 1 *Kailain 733 1.4 95.9 2.7 59.1 98.6 0.1 1.2
19 27 31 529 1 *Kaduti 251 0.4 99.6 0.0 87.3 98.4 1.2 0.4
19 27 31 647 1 *Murarpar 89 0.0 100.0 0.0 77.5 100.0 0.0 0.0
19 27 31 687 1 *Orain 396 0.0 100.0 0.0 66.4 99.7 0.0 0.3
19 27 31 734 1 *Paschim Lakshmipur 462 0.0 99.8 0.2 50.9 96.3 3.7 0.0
19 27 31 734 01 1 Paschim Lakshmipur 293 0.0 100.0 0.0 30.0 94.5 5.5 0.0
19 27 31 734 02 1 Purba Lakshmipur 169 0.0 99.4 0.6 87.0 99.4 0.6 0.0
19 27 31 742 1 *Paschim Panch Pukuria 135 0.0 83.0 17.0 51.1 93.3 0.0 6.7
19 27 39 Barkait Union Total 4667 0.3 98.0 1.6 77.4 99.3 0.5 0.3
19 27 39 521 1 *Khaichara 248 0.0 98.8 1.2 72.6 99.6 0.0 0.4
19 27 39 576 1 *Madhyamtala 271 0.0 100.0 0.0 93.0 99.6 0.4 0.0
19 27 39 773 1 *Pihar 675 0.3 93.9 5.8 91.1 98.5 0.7 0.7
19 27 39 773 01 1 Pihar 567 0.4 92.8 6.9 91.7 98.4 0.9 0.7
19 27 39 773 02 1 Pihar Gobindapur 108 0.0 100.0 0.0 88.0 99.1 0.0 0.9
19 27 39 805 1 *Purba Ramchandrapur 229 2.2 97.8 0.0 90.0 99.6 0.0 0.4
19 27 39 837 1 *Salchar 252 0.0 100.0 0.0 86.1 99.6 0.0 0.4
19 27 39 876 1 *Sreemantapur 2555 0.3 98.3 1.4 69.0 99.2 0.6 0.2
19 27 39 876 01 1 Sreemantapur 867 0.3 99.5 0.1 66.0 99.4 0.2 0.3
19 27 39 876 02 1 Barkait 692 0.1 99.9 0.0 60.8 98.4 1.4 0.1
RMO: 1 = Rural, 2 = Urban and 3 = Other Urban Page 30 of 162

Tap Tube-Well Other Owned Rented Rent free
2 3 4 5 6 7 8 9 10
MZ /
MHVill RMO
1
Table C-15: Distribution of General Households by Source of Drinking Water, Electricity Connection and Housing Tenancy Status, by Residence
and Community
Administrative Unit
Residence
Community
Number of
Households
Source of Drinking Water (%) Electricity
Connection
(%)
Housing Tenancy (%)
ZL UZUN /
WA
19 27 39 876 03 1 Shitalpur 118 0.0 100.0 0.0 33.9 99.2 0.0 0.8
19 27 39 876 04 1 Khirasar Mohanpur 221 0.5 94.1 5.4 92.8 99.1 0.9 0.0
19 27 39 876 05 1 Kismat Sreemantapur 162 1.9 88.9 9.3 82.1 100.0 0.0 0.0
19 27 39 876 06 1 Jurpuni 69 0.0 89.9 10.1 50.7 100.0 0.0 0.0
19 27 39 876 07 1 Tembulia 29 0.0 100.0 0.0 0.0 100.0 0.0 0.0
19 27 39 876 08 1 Mohanpur 310 0.0 100.0 0.0 89.4 100.0 0.0 0.0
19 27 39 876 09 1 Chandira 87 0.0 100.0 0.0 92.0 97.7 2.3 0.0
19 27 39 923 1 *Teonai 117 0.0 100.0 0.0 63.2 100.0 0.0 0.0
19 27 39 971 1 *Uttar Latifpur 320 0.3 99.7 0.0 95.3 100.0 0.0 0.0
19 27 47 Atbar Pur Union Total 1519 0.6 93.3 6.1 83.6 98.3 1.0 0.7
19 27 47 244 1 *Chhaykot 1519 0.6 93.3 6.1 83.6 98.3 1.0 0.7
19 27 47 244 01 1 Madushair 150 0.0 100.0 0.0 86.0 100.0 0.0 0.0
19 27 47 244 02 1 Baniachang 374 0.5 91.7 7.8 66.0 98.7 0.5 0.8
19 27 47 244 03 1 Atbarpur 995 0.7 92.9 6.4 89.8 97.9 1.3 0.8
19 27 55 Gallai Union Total 6079 0.3 94.3 5.4 37.1 98.7 0.7 0.6
19 27 55 118 1 *Basantapur 899 0.2 95.9 3.9 38.0 98.8 0.4 0.8
19 27 55 118 01 1 Basantapur 469 0.2 99.6 0.2 59.1 98.3 0.9 0.9
19 27 55 118 02 1 Bhuyan Para 221 0.5 84.6 14.9 12.2 100.0 0.0 0.0
19 27 55 118 03 1 Dharpar 46 0.0 100.0 0.0 78.3 95.7 0.0 4.3
19 27 55 118 04 1 Bhalar Char 60 0.0 98.3 1.7 1.7 100.0 0.0 0.0
19 27 55 118 05 1 Sonakandi 103 0.0 100.0 0.0 1.0 99.0 0.0 1.0
19 27 55 134 1 *Bauchail 45 0.0 84.4 15.6 46.7 97.8 0.0 2.2
19 27 55 276 1 *Darora 539 1.3 98.7 0.0 51.6 99.1 0.0 0.9
19 27 55 355 1 *Gallai 1813 0.1 97.7 2.2 36.9 97.8 1.8 0.4
19 27 55 355 01 1 Gallai 1087 0.2 96.2 3.6 49.9 96.4 2.9 0.6
19 27 55 355 02 1 Karia 97 0.0 100.0 0.0 0.0 100.0 0.0 0.0
19 27 55 355 03 1 Pachdhara 208 0.0 100.0 0.0 24.5 100.0 0.0 0.0
19 27 55 355 04 1 Khanaibari 56 0.0 98.2 1.8 28.6 100.0 0.0 0.0
19 27 55 355 05 1 Mirkala 275 0.0 100.0 0.0 9.8 99.6 0.0 0.4
RMO: 1 = Rural, 2 = Urban and 3 = Other Urban Page 31 of 162

Tap Tube-Well Other Owned Rented Rent free
2 3 4 5 6 7 8 9 10
MZ /
MHVill RMO
1
Table C-15: Distribution of General Households by Source of Drinking Water, Electricity Connection and Housing Tenancy Status, by Residence
and Community
Administrative Unit
Residence
Community
Number of
Households
Source of Drinking Water (%) Electricity
Connection
(%)
Housing Tenancy (%)
ZL UZUN /
WA
19 27 55 355 06 1 Horin Chaturi 90 0.0 100.0 0.0 36.7 100.0 0.0 0.0
19 27 55 473 1 *Kangai 1466 0.3 88.2 11.5 22.1 99.5 0.2 0.3
19 27 55 513 1 *Kesara 718 0.1 89.7 10.2 37.3 99.6 0.1 0.3
19 27 55 513 01 1 Kesara 503 0.0 95.6 4.4 28.8 100.0 0.0 0.0
19 27 55 513 02 1 Jarunda (Jurpunda) 215 0.5 75.8 23.7 57.2 98.6 0.5 0.9
19 27 55 955 1 *Uttar Hossainpur 599 0.0 99.2 0.8 58.8 98.0 0.3 1.7
19 27 55 955 01 1 Hossainpur 247 0.0 99.2 0.8 9.3 97.2 0.0 2.8
19 27 55 955 02 1 Bamuchail 161 0.0 100.0 0.0 88.8 98.1 0.0 1.9
19 27 55 955 03 1 Bamel) Bamuil 114 0.0 97.4 2.6 95.6 98.2 1.8 0.0
19 27 55 955 04 1 Padua 77 0.0 100.0 0.0 100.0 100.0 0.0 0.0
19 27 63 Dollai Nowabab Pur Union Total 4677 1.0 92.9 6.0 58.5 98.7 0.9 0.4
19 27 63 110 1 *Burimura 207 0.0 92.3 7.7 1.4 98.1 0.0 1.9
19 27 63 150 1 *Bhagura Para 350 2.3 88.0 9.7 59.4 98.6 0.6 0.9
19 27 63 157 1 *Bhararua 427 0.0 91.1 8.9 64.9 99.5 0.0 0.5
19 27 63 165 1 *Bherunia 123 0.0 100.0 0.0 60.2 100.0 0.0 0.0
19 27 63 189 1 *Bichainadar 472 0.0 100.0 0.0 53.0 99.2 0.8 0.0
19 27 63 284 1 *Dakshin Nurpur 143 2.1 97.9 0.0 25.9 94.4 5.6 0.0
19 27 63 442 1 *Kaikarai 739 0.4 98.0 1.6 63.5 99.1 0.5 0.4
19 27 63 465 1 *Kaliar Char 111 0.9 99.1 0.0 64.9 98.2 1.8 0.0
19 27 63 544 1 *Lona 289 0.0 100.0 0.0 64.4 99.3 0.3 0.3
19 27 63 655 1 *Natingi 335 9.0 47.8 43.3 65.1 94.9 3.9 1.2
19 27 63 726 1 *Paschim Kegala 233 0.0 100.0 0.0 60.9 100.0 0.0 0.0
19 27 63 797 1 *Purba Kegala 119 0.0 100.0 0.0 89.1 100.0 0.0 0.0
19 27 63 813 1 *Ranichara 553 0.7 99.3 0.0 76.1 99.6 0.2 0.2
19 27 63 829 1 *Sakoch 150 0.0 76.7 23.3 16.0 100.0 0.0 0.0
19 27 63 900 1 *Surikhola 426 0.0 99.8 0.2 58.9 97.9 1.4 0.7
19 27 71 Madhya Union Total 5199 0.8 92.1 7.1 73.0 95.3 3.4 1.3
19 27 71 047 1 *Bakhrabad 438 1.4 93.2 5.5 69.2 96.6 3.0 0.5
19 27 71 047 01 1 Bakhrabad 291 1.7 90.0 8.2 67.7 97.9 1.4 0.7
RMO: 1 = Rural, 2 = Urban and 3 = Other Urban Page 32 of 162

Tap Tube-Well Other Owned Rented Rent free
2 3 4 5 6 7 8 9 10
MZ /
MHVill RMO
1
Table C-15: Distribution of General Households by Source of Drinking Water, Electricity Connection and Housing Tenancy Status, by Residence
and Community
Administrative Unit
Residence
Community
Number of
Households
Source of Drinking Water (%) Electricity
Connection
(%)
Housing Tenancy (%)
ZL UZUN /
WA
19 27 71 047 02 1 Mirganj 147 0.7 99.3 0.0 72.1 93.9 6.1 0.0
19 27 71 426 1 *Jorpuni 206 0.0 86.9 13.1 57.3 100.0 0.0 0.0
19 27 71 497 1 *Kashimpur 558 0.0 92.7 7.3 42.8 96.1 0.0 3.9
19 27 71 497 01 1 Kashimpur 282 0.0 97.5 2.5 46.5 92.2 0.0 7.8
19 27 71 497 02 1 Gobindapur 48 0.0 100.0 0.0 35.4 100.0 0.0 0.0
19 27 71 497 03 1 Ramarpar 109 0.0 100.0 0.0 81.7 100.0 0.0 0.0
19 27 71 497 04 1 Mamudpur 119 0.0 71.4 28.6 1.7 100.0 0.0 0.0
19 27 71 536 1 *Kutambapur 1111 0.3 89.0 10.7 65.3 98.2 0.7 1.1
19 27 71 639 1 *Muradpur 341 0.0 99.7 0.3 94.4 98.8 0.6 0.6
19 27 71 663 1 *Nautala 1659 1.7 88.8 9.5 90.9 93.6 5.8 0.7
19 27 71 663 01 1 Nautala 1194 0.6 88.8 10.6 88.9 99.3 0.2 0.5
19 27 71 663 02 1 Kamar Para 113 0.0 100.0 0.0 96.5 99.1 0.0 0.9
19 27 71 663 03 1 Alirtek 110 0.0 100.0 0.0 92.7 96.4 0.0 3.6
19 27 71 663 04 1 Noapara 87 2.3 65.5 32.2 94.3 97.7 2.3 0.0
19 27 71 663 05 1 Madhya (Bazar) 155 12.9 85.8 1.3 98.7 40.6 59.4 0.0
19 27 71 781 1 *Ponshai 138 0.0 100.0 0.0 48.6 100.0 0.0 0.0
19 27 71 868 1 *Sonapur 546 0.9 99.1 0.0 72.5 86.1 10.8 3.1
19 27 71 868 01 1 Sonapur 222 2.3 97.7 0.0 95.9 75.2 24.8 0.0
19 27 71 868 02 1 Kalagaon 324 0.0 100.0 0.0 56.5 93.5 1.2 5.2
19 27 71 884 1 *Sreerampur 202 0.0 99.5 0.5 56.9 99.5 0.0 0.5
19 27 79 Maijkhar Union Total 9206 0.4 95.7 3.9 64.4 99.2 0.2 0.6
19 27 79 007 1 *Alikamora 678 0.0 89.5 10.5 49.1 99.6 0.3 0.1
19 27 79 023 1 *Aodhata 117 0.0 100.0 0.0 93.2 99.1 0.0 0.9
19 27 79 031 1 *Aoral 454 0.0 94.5 5.5 61.9 99.3 0.2 0.4
19 27 79 055 1 *Ballar Char 233 0.4 95.3 4.3 96.6 98.7 0.4 0.9
19 27 79 071 1 *Bamanikhola 354 0.0 83.6 16.4 39.3 99.4 0.0 0.6
19 27 79 173 1 *Bhomarkandi 545 0.2 99.8 0.0 76.1 99.8 0.0 0.2
19 27 79 197 1 *Birkhal 316 0.0 99.4 0.6 27.5 98.7 0.0 1.3
19 27 79 331 1 *Ewajbanda 120 0.0 98.3 1.7 79.2 99.2 0.8 0.0
RMO: 1 = Rural, 2 = Urban and 3 = Other Urban Page 33 of 162

Tap Tube-Well Other Owned Rented Rent free
2 3 4 5 6 7 8 9 10
MZ /
MHVill RMO
1
Table C-15: Distribution of General Households by Source of Drinking Water, Electricity Connection and Housing Tenancy Status, by Residence
and Community
Administrative Unit
Residence
Community
Number of
Households
Source of Drinking Water (%) Electricity
Connection
(%)
Housing Tenancy (%)
ZL UZUN /
WA
19 27 79 339 1 *Faoi 426 2.8 93.0 4.2 55.9 94.8 0.9 4.2
19 27 79 386 1 *Hari Para 109 0.0 100.0 0.0 19.3 99.1 0.0 0.9
19 27 79 410 1 *Jeruais 461 0.0 100.0 0.0 71.6 100.0 0.0 0.0
19 27 79 410 01 1 Jeruais 433 0.0 100.0 0.0 69.7 100.0 0.0 0.0
19 27 79 410 02 1 Baranath 28 0.0 100.0 0.0 100.0 100.0 0.0 0.0
19 27 79 458 1 *Kalemsar 259 0.4 99.2 0.4 71.4 99.6 0.4 0.0
19 27 79 481 1 *Kartala 468 0.2 99.8 0.0 90.4 99.8 0.0 0.2
19 27 79 481 01 1 Kartala 336 0.3 99.7 0.0 88.7 99.7 0.0 0.3
19 27 79 481 02 1 Bakser 132 0.0 100.0 0.0 94.7 100.0 0.0 0.0
19 27 79 489 1 *Kasarikhola 241 0.8 97.1 2.1 22.0 99.6 0.4 0.0
19 27 79 560 1 *Madharpur 224 0.0 100.0 0.0 91.1 100.0 0.0 0.0
19 27 79 592 1 *Maijkhara 979 0.8 94.6 4.6 54.5 99.3 0.2 0.5
19 27 79 592 01 1 Maijkhara 635 0.3 94.3 5.4 61.3 99.5 0.2 0.3
19 27 79 592 02 1 Chandiara 84 6.0 94.0 0.0 92.9 97.6 1.2 1.2
19 27 79 592 03 1 Sabnal 17 0.0 41.2 58.8 0.0 100.0 0.0 0.0
19 27 79 592 04 1 Titkot 94 1.1 97.9 1.1 6.4 97.9 0.0 2.1
19 27 79 592 05 1 Bherunia 72 0.0 100.0 0.0 69.4 100.0 0.0 0.0
19 27 79 592 06 1 Katalia 77 0.0 100.0 0.0 14.3 100.0 0.0 0.0
19 27 79 600 1 *Kamarkhola 323 0.3 99.7 0.0 83.6 99.4 0.3 0.3
19 27 79 615 1 *Mehar 1066 0.5 92.1 7.4 69.7 99.4 0.1 0.5
19 27 79 615 01 1 Mehar 713 0.4 93.0 6.6 76.9 99.6 0.1 0.3
19 27 79 615 02 1 Horina 195 0.5 84.1 15.4 34.4 99.0 0.0 1.0
19 27 79 615 03 1 Gazaria 116 0.0 98.3 1.7 79.3 100.0 0.0 0.0
19 27 79 615 04 1 Chhanbaria 42 2.4 97.6 0.0 85.7 97.6 0.0 2.4
19 27 79 702 1 *Panikhora 759 0.0 100.0 0.0 74.8 98.6 0.5 0.9
19 27 79 758 1 *Paschim Rasulpur 315 0.3 99.4 0.3 63.5 99.4 0.6 0.0
19 27 79 765 1 *Patnai 77 0.0 100.0 0.0 37.7 100.0 0.0 0.0
19 27 79 844 1 *Salucho 141 0.0 100.0 0.0 27.7 100.0 0.0 0.0
19 27 79 860 1 *Singadda 172 0.0 100.0 0.0 56.4 98.8 0.0 1.2
RMO: 1 = Rural, 2 = Urban and 3 = Other Urban Page 34 of 162

Tap Tube-Well Other Owned Rented Rent free
2 3 4 5 6 7 8 9 10
MZ /
MHVill RMO
1
Table C-15: Distribution of General Households by Source of Drinking Water, Electricity Connection and Housing Tenancy Status, by Residence
and Community
Administrative Unit
Residence
Community
Number of
Households
Source of Drinking Water (%) Electricity
Connection
(%)
Housing Tenancy (%)
ZL UZUN /
WA
19 27 79 908 1 *Tamta 240 0.4 82.1 17.5 76.7 100.0 0.0 0.0
19 27 79 947 1 *Uttar Badarpur 129 0.8 99.2 0.0 97.7 97.7 0.8 1.6
19 27 87 Batakash Union Total 3883 0.1 96.1 3.8 57.8 99.0 0.4 0.5
19 27 87 126 1 *Batakashi 614 0.0 89.1 10.9 6.2 99.2 0.0 0.8
19 27 87 252 1 *Chhota Maheshpur 15 0.0 80.0 20.0 0.0 100.0 0.0 0.0
19 27 87 394 1 *Hasimpur 183 0.0 95.6 4.4 0.5 100.0 0.0 0.0
19 27 87 623 1 *Mohanpur 897 0.2 93.3 6.5 60.2 99.0 0.6 0.4
19 27 87 623 01 1 Mohanpur 806 0.2 94.2 5.6 67.0 98.9 0.6 0.5
19 27 87 623 02 1 Nalpuni 91 0.0 85.7 14.3 0.0 100.0 0.0 0.0
19 27 87 631 1 *Muradnagar 410 0.0 99.3 0.7 68.0 99.5 0.2 0.2
19 27 87 631 01 1 Muradnagar 343 0.0 100.0 0.0 81.3 99.4 0.3 0.3
19 27 87 631 02 1 Rankhala 67 0.0 95.5 4.5 0.0 100.0 0.0 0.0
19 27 87 671 1 *Nazirpur 291 0.0 100.0 0.0 31.6 99.3 0.0 0.7
19 27 87 821 1 *Sabdalpur 408 0.0 98.3 1.7 99.0 98.3 1.5 0.2
19 27 87 852 1 *Satgaon 242 0.0 100.0 0.0 81.0 99.2 0.4 0.4
19 27 87 939 1 *Tircho 421 0.7 99.0 0.2 87.9 98.1 0.7 1.2
19 27 87 963 1 *Uttar Krishnapur 346 0.0 100.0 0.0 93.9 99.4 0.0 0.6
19 27 87 987 1 *Uttar Padua 56 0.0 100.0 0.0 0.0 100.0 0.0 0.0
19 27 94 Suhilpur Union Total 3825 0.6 84.9 14.5 69.6 98.0 0.1 2.0
19 27 94 205 1 *Bokhai 859 0.6 88.1 11.3 81.3 99.8 0.0 0.2
19 27 94 205 01 1 Krishnapur 374 0.5 81.8 17.6 82.4 99.5 0.0 0.5
19 27 94 205 02 1 Baraia 485 0.6 93.0 6.4 80.4 100.0 0.0 0.0
19 27 94 292 1 *Dalpara 185 4.9 95.1 0.0 97.8 98.9 0.0 1.1
19 27 94 418 1 *Jhagarbagh 1319 0.5 71.4 28.1 74.1 97.2 0.2 2.7
19 27 94 418 01 1 Shaleka 424 0.9 51.4 47.6 80.7 98.8 0.0 1.2
19 27 94 418 02 1 Bashakpur 454 0.0 78.9 21.1 54.6 96.3 0.4 3.3
19 27 94 418 03 1 Pipuya 414 0.5 82.4 17.1 93.5 96.6 0.0 3.4
19 27 94 418 04 1 Binodmuri 27 0.0 92.6 7.4 0.0 96.3 0.0 3.7
19 27 94 568 1 *Madhyagaon 70 0.0 100.0 0.0 1.4 100.0 0.0 0.0
RMO: 1 = Rural, 2 = Urban and 3 = Other Urban Page 35 of 162

Tap Tube-Well Other Owned Rented Rent free
2 3 4 5 6 7 8 9 10
MZ /
MHVill RMO
1
Table C-15: Distribution of General Households by Source of Drinking Water, Electricity Connection and Housing Tenancy Status, by Residence
and Community
Administrative Unit
Residence
Community
Number of
Households
Source of Drinking Water (%) Electricity
Connection
(%)
Housing Tenancy (%)
ZL UZUN /
WA
19 27 94 892 1 *Suhilpur 953 0.2 92.3 7.5 62.9 97.0 0.0 3.0
19 27 94 892 01 1 Suhilpur 742 0.3 92.3 7.4 68.7 96.4 0.0 3.6
19 27 94 892 02 1 Alipur 103 0.0 84.5 15.5 67.0 100.0 0.0 0.0
19 27 94 892 03 1 Ranipur 108 0.0 100.0 0.0 18.5 98.1 0.0 1.9
19 27 94 979 1 *Uttar Nurpur 225 0.0 95.1 4.9 20.9 100.0 0.0 0.0
19 27 94 979 01 1 Uttar Nurpur 186 0.0 94.1 5.9 4.3 100.0 0.0 0.0
19 27 94 979 02 1 Khob Baria 39 0.0 100.0 0.0 100.0 100.0 0.0 0.0
19 27 94 994 1 *Uzirpur 214 0.0 97.7 2.3 75.2 96.7 0.0 3.3
19 31 Chauddagram Upazila Total 87127 2.9 92.2 4.9 80.4 94.5 3.9 1.6
19 31 1 Chauddagram Upazila 79613 2.3 92.8 4.9 79.4 96.1 2.4 1.5
19 31 2 Chauddagram Upazila 7514 9.5 85.7 4.8 91.4 77.6 19.6 2.8
Chauddagram Paurashava
19 31 01 Ward No-01 Total 574 0.9 83.4 15.7 88.5 93.4 2.6 4.0
19 31 01 682 2 *Nabagram 240 2.1 76.3 21.7 83.3 90.8 1.7 7.5
19 31 01 897 2 *Sonakatia 334 0.0 88.6 11.4 92.2 95.2 3.3 1.5
19 31 02 Ward No-02 Total 624 1.1 95.2 3.7 93.4 81.9 16.8 1.3
19 31 02 518 2 *Kamalpur 323 2.2 93.5 4.3 93.2 68.7 30.3 0.9
19 31 02 738 2 *Panchmora 301 0.0 97.0 3.0 93.7 96.0 2.3 1.7
19 31 03 Ward No-03 Total 845 11.5 87.6 0.9 86.7 64.3 31.8 3.9
19 31 03 918 2 *Sreepur 845 11.5 87.6 0.9 86.7 64.3 31.8 3.9
19 31 04 Ward No-04 Total 679 24.6 72.6 2.8 96.0 58.8 39.8 1.5
19 31 04 199 2 *Chauddagram Bazar 411 20.4 79.1 0.5 95.4 43.3 55.5 1.2
19 31 04 586 2 *Kismat Sreepur 268 31.0 62.7 6.3 97.0 82.5 15.7 1.9
19 31 05 Ward No-05 Total 467 1.3 82.9 15.8 97.0 90.1 5.8 4.1
19 31 05 199 2 *Maidha Chandiskara 234 2.6 73.9 23.5 95.3 95.3 3.4 1.3
19 31 05 219 2 *Purba Chandiskara 233 0.0 91.8 8.2 98.7 85.0 8.2 6.9
19 31 06 Ward No-06 Total 1250 3.9 92.9 3.2 94.7 91.4 6.7 1.8
19 31 06 219 2 *Paschim Chandiskara 250 0.0 100.0 0.0 98.8 97.6 0.8 1.6
19 31 06 224 2 *Chatitala 162 0.0 91.4 8.6 93.8 99.4 0.6 0.0
RMO: 1 = Rural, 2 = Urban and 3 = Other Urban Page 36 of 162

Tap Tube-Well Other Owned Rented Rent free
2 3 4 5 6 7 8 9 10
MZ /
MHVill RMO
1
Table C-15: Distribution of General Households by Source of Drinking Water, Electricity Connection and Housing Tenancy Status, by Residence
and Community
Administrative Unit
Residence
Community
Number of
Households
Source of Drinking Water (%) Electricity
Connection
(%)
Housing Tenancy (%)
ZL UZUN /
WA
19 31 06 252 2 *Dakshin Falgunkara 281 0.4 98.9 0.7 88.3 96.1 0.4 3.6
19 31 06 756 2 *Paschim Dhanmuri 254 2.0 98.0 0.0 97.2 79.1 19.3 1.6
19 31 06 990 2 *Uttar Falgunkara 303 14.2 77.9 7.9 95.7 88.1 10.2 1.7
19 31 07 Ward No-07 Total 1091 15.2 80.5 4.3 93.3 72.9 24.2 2.9
19 31 07 066 2 *Baidyerkhil 275 0.0 100.0 0.0 96.0 82.2 16.4 1.5
19 31 07 197 2 *Chandipur 81 2.5 79.0 18.5 85.2 97.5 2.5 0.0
19 31 07 384 2 *Durgahata 68 4.4 61.8 33.8 72.1 61.8 13.2 25.0
19 31 07 453 2 *Joyanti Nagar 82 15.9 84.1 0.0 90.2 97.6 0.0 2.4
19 31 07 609 2 *Lakshmipur 380 38.9 58.7 2.4 99.7 47.1 52.4 0.5
19 31 07 785 2 *Purba Dhanmuri 101 0.0 100.0 0.0 84.2 86.1 8.9 5.0
19 31 07 842 2 *Senerkhil 104 0.0 100.0 0.0 94.2 98.1 0.0 1.9
19 31 08 Ward No-08 Total 1113 18.8 77.0 4.2 96.0 61.8 36.7 1.5
19 31 08 377 2 *Gamarbari 528 22.9 76.3 0.8 93.6 64.2 34.8 0.9
19 31 08 817 2 *Ramroygram 585 15.0 77.6 7.4 98.3 59.7 38.3 2.1
19 31 09 Ward No-09 Total 871 1.1 97.8 1.0 76.6 91.2 3.9 4.9
19 31 09 271 2 *Balijuri 116 2.6 94.8 2.6 69.8 94.0 3.4 2.6
19 31 09 705 2 *Nata Para 353 0.0 99.2 0.8 73.4 96.9 1.4 1.7
19 31 09 715 2 *Noapara 164 0.0 98.8 1.2 73.2 97.0 1.8 1.2
19 31 09 811 2 *Ramchandrapur 238 2.9 96.6 0.4 87.0 77.3 9.2 13.4
19 31 10 Alkara Union Total 6748 2.6 94.6 2.9 76.1 98.4 0.7 0.8
19 31 10 023 1 *Alkara 434 0.0 100.0 0.0 77.2 97.5 0.0 2.5
19 31 10 033 1 *Aspania 118 13.6 68.6 17.8 89.0 96.6 0.8 2.5
19 31 10 072 1 *Bakagram 604 0.0 99.8 0.2 66.1 98.2 0.2 1.7
19 31 10 076 1 *Bakjala 18 0.0 100.0 0.0 77.8 100.0 0.0 0.0
19 31 10 086 1 *Banderjala 355 1.7 91.8 6.5 38.6 99.2 0.8 0.0
19 31 10 148 1 *Bhajankara 270 0.0 100.0 0.0 68.5 97.4 1.1 1.5
19 31 10 175 1 *Borankara 93 3.2 86.0 10.8 94.6 100.0 0.0 0.0
19 31 10 234 1 *Chhinaimuri 158 4.4 95.6 0.0 93.7 100.0 0.0 0.0
19 31 10 277 1 *Damar Para 202 6.4 73.3 20.3 60.9 99.5 0.0 0.5
RMO: 1 = Rural, 2 = Urban and 3 = Other Urban Page 37 of 162

Tap Tube-Well Other Owned Rented Rent free
2 3 4 5 6 7 8 9 10
MZ /
MHVill RMO
1
Table C-15: Distribution of General Households by Source of Drinking Water, Electricity Connection and Housing Tenancy Status, by Residence
and Community
Administrative Unit
Residence
Community
Number of
Households
Source of Drinking Water (%) Electricity
Connection
(%)
Housing Tenancy (%)
ZL UZUN /
WA
19 31 10 287 1 *Dattasar 190 3.7 95.3 1.1 78.4 100.0 0.0 0.0
19 31 10 318 1 *Dhopakhila 254 0.8 99.2 0.0 90.6 100.0 0.0 0.0
19 31 10 351 1 *Futkara 81 0.0 97.5 2.5 70.4 95.1 1.2 3.7
19 31 10 376 1 *Ganaikara 112 0.0 100.0 0.0 65.2 99.1 0.9 0.0
19 31 10 416 1 *Jangalpur 84 4.8 95.2 0.0 89.3 98.8 1.2 0.0
19 31 10 490 1 *Kaichati 543 7.7 89.9 2.4 69.2 99.4 0.4 0.2
19 31 10 525 1 *Kandua 256 0.0 99.6 0.4 92.2 98.8 0.4 0.8
19 31 10 602 1 *Kulashar 349 10.6 84.8 4.6 80.5 96.6 2.6 0.9
19 31 10 607 1 *Kunja Sreepur 262 0.4 98.1 1.5 96.2 100.0 0.0 0.0
19 31 10 623 1 *Latimi 320 0.0 95.9 4.1 81.9 96.6 1.9 1.6
19 31 10 652 1 *Manipur 7 0.0 100.0 0.0 0.0 100.0 0.0 0.0
19 31 10 693 1 *Narayankuri 313 1.9 97.1 1.0 70.6 100.0 0.0 0.0
19 31 10 727 1 *Padua 83 0.0 100.0 0.0 96.4 95.2 3.6 1.2
19 31 10 754 1 *Paschim Dakra 256 4.3 91.8 3.9 91.0 99.2 0.8 0.0
19 31 10 758 1 *Paschim Lakshmipur 274 2.2 95.3 2.6 79.6 96.7 2.6 0.7
19 31 10 768 1 *Purba Lakshmi Charpur 183 0.0 96.7 3.3 64.5 98.4 1.1 0.5
19 31 10 783 1 *Purba Dakra 226 2.7 97.3 0.0 83.6 96.0 1.3 2.7
19 31 10 824 1 *Sadananda Nagar 13 0.0 100.0 0.0 92.3 100.0 0.0 0.0
19 31 10 869 1 *Satuchar 77 0.0 100.0 0.0 93.5 100.0 0.0 0.0
19 31 10 875 1 *Sahebnagar 88 0.0 87.5 12.5 90.9 100.0 0.0 0.0
19 31 10 885 1 *Silari 375 1.9 95.7 2.4 74.9 98.7 0.3 1.1
19 31 10 895 1 *Sonaicha 150 0.0 100.0 0.0 70.7 98.7 1.3 0.0
19 31 15 Batisha Union Total 5030 1.4 94.5 4.1 81.3 95.4 3.4 1.3
19 31 15 028 1 *Anandapur 26 0.0 88.5 11.5 0.0 76.9 0.0 23.1
19 31 15 046 1 *Atgram 242 0.0 99.6 0.4 66.5 96.7 3.3 0.0
19 31 15 115 1 *Basantapur 553 0.0 99.6 0.4 98.2 97.8 1.8 0.4
19 31 15 127 1 *Batisha 558 3.9 96.1 0.0 86.4 79.9 18.6 1.4
19 31 15 248 1 *Daiyara 243 0.0 100.0 0.0 95.1 97.5 1.6 0.8
19 31 15 250 1 *Dakshin Chandkara 201 0.5 98.0 1.5 75.1 96.0 2.5 1.5
RMO: 1 = Rural, 2 = Urban and 3 = Other Urban Page 38 of 162

Tap Tube-Well Other Owned Rented Rent free
2 3 4 5 6 7 8 9 10
MZ /
MHVill RMO
1
Table C-15: Distribution of General Households by Source of Drinking Water, Electricity Connection and Housing Tenancy Status, by Residence
and Community
Administrative Unit
Residence
Community
Number of
Households
Source of Drinking Water (%) Electricity
Connection
(%)
Housing Tenancy (%)
ZL UZUN /
WA
19 31 15 276 1 *Dalva 129 1.6 96.9 1.6 89.1 96.1 2.3 1.6
19 31 15 293 1 *Debipur 268 0.0 99.3 0.7 83.2 97.4 0.7 1.9
19 31 15 340 1 *Durgapur 198 0.0 77.8 22.2 63.1 97.5 1.5 1.0
19 31 15 439 1 *Jamkara 204 0.0 100.0 0.0 89.2 98.5 1.5 0.0
19 31 15 506 1 *Kuliara 164 0.0 90.2 9.8 84.8 96.3 2.4 1.2
19 31 15 512 1 *Kalikapur 503 0.0 97.8 2.2 51.3 94.0 3.4 2.6
19 31 15 514 1 *Kaliksar 168 14.3 85.7 0.0 83.3 99.4 0.6 0.0
19 31 15 627 1 *Ludiara 352 0.3 94.9 4.8 91.5 98.9 0.3 0.9
19 31 15 688 1 *Nankara Kismat 302 0.7 79.8 19.5 81.1 98.7 1.0 0.3
19 31 15 742 1 *Paragram 165 0.0 100.0 0.0 89.1 100.0 0.0 0.0
19 31 15 766 1 *Pathandi 183 0.5 99.5 0.0 90.2 99.5 0.0 0.5
19 31 15 901 1 *Sonapur 180 3.3 87.2 9.4 84.4 96.7 0.0 3.3
19 31 15 985 1 *Ulla Para 121 3.3 88.4 8.3 92.6 100.0 0.0 0.0
19 31 15 993 1 *Uttar Chandkara 270 2.6 90.0 7.4 73.3 97.0 0.4 2.6
19 31 19 Cheora Union Total 6306 1.8 93.5 4.8 77.3 95.8 2.3 1.9
19 31 19 138 1 *Berella 134 0.7 99.3 0.0 76.9 98.5 0.0 1.5
19 31 19 215 1 *Chapirtala 207 0.0 96.1 3.9 95.7 93.2 3.4 3.4
19 31 19 222 1 *Char Para 250 3.2 85.6 11.2 65.6 95.6 2.0 2.4
19 31 19 233 1 *Chhota Satbaria 58 0.0 93.1 6.9 93.1 100.0 0.0 0.0
19 31 19 242 1 *Chiara 347 2.9 96.3 0.9 79.0 87.6 4.6 7.8
19 31 19 244 1 *Chil Para 155 0.6 99.4 0.0 90.3 100.0 0.0 0.0
19 31 19 320 1 *Dhulkara 220 0.0 98.6 1.4 81.8 90.9 7.3 1.8
19 31 19 320 01 1 Dhulkara 130 0.0 98.5 1.5 74.6 90.0 7.7 2.3
19 31 19 320 02 1 Gopagram 49 0.0 98.0 2.0 87.8 100.0 0.0 0.0
19 31 19 320 03 1 Satgharia 41 0.0 100.0 0.0 97.6 82.9 14.6 2.4
19 31 19 322 1 *Dimatali 312 5.4 87.5 7.1 59.9 94.6 4.2 1.3
19 31 19 324 1 *Dinatpur 45 0.0 97.8 2.2 20.0 95.6 2.2 2.2
19 31 19 342 1 *Ektalia 28 7.1 89.3 3.6 100.0 89.3 10.7 0.0
19 31 19 349 1 *Fulgram 231 7.4 77.1 15.6 73.2 100.0 0.0 0.0
RMO: 1 = Rural, 2 = Urban and 3 = Other Urban Page 39 of 162

Tap Tube-Well Other Owned Rented Rent free
2 3 4 5 6 7 8 9 10
MZ /
MHVill RMO
1
Table C-15: Distribution of General Households by Source of Drinking Water, Electricity Connection and Housing Tenancy Status, by Residence
and Community
Administrative Unit
Residence
Community
Number of
Households
Source of Drinking Water (%) Electricity
Connection
(%)
Housing Tenancy (%)
ZL UZUN /
WA
19 31 19 385 1 *Ghoshtala 201 3.0 89.1 8.0 76.6 98.5 0.0 1.5
19 31 19 390 1 *Gunishkara 60 0.0 100.0 0.0 58.3 100.0 0.0 0.0
19 31 19 392 1 *Haldarmura 11 0.0 90.9 9.1 27.3 100.0 0.0 0.0
19 31 19 394 1 *Handa 162 3.1 71.0 25.9 50.0 99.4 0.0 0.6
19 31 19 400 1 *Hasti Mrita 101 0.0 99.0 1.0 55.4 98.0 0.0 2.0
19 31 19 457 1 *Jhatiarkhil 283 1.1 94.7 4.2 80.6 98.9 1.1 0.0
19 31 19 463 1 *Jinadkara 166 0.6 99.4 0.0 84.9 97.0 1.2 1.8
19 31 19 476 1 *Kabrua Kandirpar 231 0.4 99.6 0.0 82.7 91.3 7.8 0.9
19 31 19 476 01 1 Kabarua 127 0.8 99.2 0.0 83.5 99.2 0.8 0.0
19 31 19 476 02 1 Kandirpar 104 0.0 100.0 0.0 81.7 81.7 16.3 1.9
19 31 19 494 1 *Kaitara 86 0.0 100.0 0.0 75.6 94.2 0.0 5.8
19 31 19 529 1 *Kaparchatali 171 0.0 80.7 19.3 18.1 91.2 0.6 8.2
19 31 19 561 1 *Kharampur 37 0.0 100.0 0.0 10.8 94.6 2.7 2.7
19 31 19 594 1 *Kumardoga 62 0.0 96.8 3.2 79.0 96.8 1.6 1.6
19 31 19 598 1 *Krishnapur 26 0.0 100.0 0.0 100.0 100.0 0.0 0.0
19 31 19 707 1 *Netora 275 0.0 92.0 8.0 86.2 98.9 0.0 1.1
19 31 19 719 1 *Noapur 377 1.1 93.6 5.3 89.7 98.1 0.5 1.3
19 31 19 760 1 *Paschim Sangishwar 148 1.4 98.6 0.0 90.5 96.6 1.4 2.0
19 31 19 762 1 *Patadda 138 0.0 96.4 3.6 53.6 95.7 1.4 2.9
19 31 19 762 01 1 Patadda 94 0.0 95.7 4.3 36.2 93.6 2.1 4.3
19 31 19 762 02 1 Sonpur 44 0.0 97.7 2.3 90.9 100.0 0.0 0.0
19 31 19 793 1 *Purba Sangishwar 275 0.4 99.6 0.0 82.2 99.6 0.0 0.4
19 31 19 813 1 *Rampur 74 0.0 98.6 1.4 58.1 100.0 0.0 0.0
19 31 19 832 1 *Sakchi 105 2.9 97.1 0.0 92.4 97.1 0.0 2.9
19 31 19 834 1 *Saktala 310 0.6 96.8 2.6 75.8 97.4 0.0 2.6
19 31 19 848 1 *Sarpati 281 1.1 98.2 0.7 90.0 99.3 0.0 0.7
19 31 19 852 1 *Sastanagar 58 0.0 100.0 0.0 86.2 93.1 1.7 5.2
19 31 19 856 1 *Satbaria 96 19.8 78.1 2.1 95.8 96.9 1.0 2.1
19 31 19 934 1 *Sujatpur 170 0.0 98.8 1.2 92.9 99.4 0.0 0.6
RMO: 1 = Rural, 2 = Urban and 3 = Other Urban Page 40 of 162

Tap Tube-Well Other Owned Rented Rent free
2 3 4 5 6 7 8 9 10
MZ /
MHVill RMO
1
Table C-15: Distribution of General Households by Source of Drinking Water, Electricity Connection and Housing Tenancy Status, by Residence
and Community
Administrative Unit
Residence
Community
Number of
Households
Source of Drinking Water (%) Electricity
Connection
(%)
Housing Tenancy (%)
ZL UZUN /
WA
19 31 19 957 1 *Tayasar 117 0.0 99.1 0.9 93.2 99.1 0.9 0.0
19 31 19 961 1 *Teligram 298 2.0 89.9 8.1 87.6 83.2 16.1 0.7
19 31 38 Gholpasha Union Total 5490 3.5 91.7 4.8 78.8 95.2 2.0 2.8
19 31 38 025 1 *Amanganda 438 4.6 75.8 19.6 78.3 91.1 3.9 5.0
19 31 38 027 1 *Amiratpur 163 0.0 100.0 0.0 85.9 99.4 0.6 0.0
19 31 38 308 1 *Dhanusara 856 0.1 96.3 3.6 69.5 98.5 1.1 0.5
19 31 38 313 1 *Dakshin Babuchi 184 1.1 98.9 0.0 88.6 97.8 2.2 0.0
19 31 38 313 01 1 Dharmapur 101 2.0 98.0 0.0 86.1 100.0 0.0 0.0
19 31 38 313 02 1 Babuchi 83 0.0 100.0 0.0 91.6 95.2 4.8 0.0
19 31 38 373 1 *Gholpasha 115 2.6 97.4 0.0 60.0 99.1 0.0 0.9
19 31 38 387 1 *Guzra 157 10.8 84.1 5.1 85.4 96.2 3.2 0.6
19 31 38 420 1 *Jagamohanpur 231 0.0 93.9 6.1 90.9 97.0 0.9 2.2
19 31 38 473 1 *Jugirkhil 120 3.3 96.7 0.0 92.5 96.7 2.5 0.8
19 31 38 590 1 *Kismat Narayanpur 4 0.0 100.0 0.0 25.0 100.0 0.0 0.0
19 31 38 592 1 *Kumalla 146 1.4 95.9 2.7 98.6 97.9 1.4 0.7
19 31 38 676 1 *Morichatali 352 10.2 89.5 0.3 53.4 86.4 2.8 10.8
19 31 38 676 01 1 Morichatali 132 0.0 99.2 0.8 13.6 99.2 0.0 0.8
19 31 38 676 02 1 Sabek Para 120 5.0 95.0 0.0 83.3 88.3 5.8 5.8
19 31 38 676 03 1 Bir Chanda Nagar 100 30.0 70.0 0.0 70.0 67.0 3.0 30.0
19 31 38 695 1 *Narayanpur 600 0.3 89.3 10.3 86.5 98.7 0.2 1.2
19 31 38 695 01 1 Narayanpur 500 0.4 87.2 12.4 85.2 98.8 0.2 1.0
19 31 38 695 02 1 Goragora 100 0.0 100.0 0.0 93.0 98.0 0.0 2.0
19 31 38 717 1 *Noapara 358 14.0 84.6 1.4 89.9 91.1 3.6 5.3
19 31 38 717 01 1 Noapara 267 18.4 81.6 0.0 87.6 89.9 4.1 6.0
19 31 38 717 02 1 Mudipara 91 1.1 93.4 5.5 96.7 94.5 2.2 3.3
19 31 38 799 1 *Rajendrapur 263 11.8 87.8 0.4 72.2 87.8 11.4 0.8
19 31 38 799 01 1 Rajendrapur 113 23.9 75.2 0.9 76.1 74.3 24.8 0.9
19 31 38 799 02 1 Eashan Chandra Nagar 150 2.7 97.3 0.0 69.3 98.0 1.3 0.7
19 31 38 805 1 *Rajnagar 145 1.4 98.6 0.0 79.3 97.9 0.7 1.4
RMO: 1 = Rural, 2 = Urban and 3 = Other Urban Page 41 of 162

Tap Tube-Well Other Owned Rented Rent free
2 3 4 5 6 7 8 9 10
MZ /
MHVill RMO
1
Table C-15: Distribution of General Households by Source of Drinking Water, Electricity Connection and Housing Tenancy Status, by Residence
and Community
Administrative Unit
Residence
Community
Number of
Households
Source of Drinking Water (%) Electricity
Connection
(%)
Housing Tenancy (%)
ZL UZUN /
WA
19 31 38 809 1 *Ramchandrapur 193 1.6 94.3 4.1 91.7 99.0 0.5 0.5
19 31 38 819 1 *Rangamati 157 0.0 100.0 0.0 58.6 94.9 1.3 3.8
19 31 38 836 1 *Salukia 237 5.9 94.1 0.0 63.3 92.8 1.3 5.9
19 31 38 893 1 *Solakandi 120 0.0 100.0 0.0 92.5 99.2 0.0 0.8
19 31 38 930 1 *Subhapur 202 2.0 94.1 4.0 76.7 96.0 2.5 1.5
19 31 38 975 1 *Tula Puskarni 132 0.8 99.2 0.0 97.0 97.0 2.3 0.8
19 31 38 981 1 *Ujanmuri 119 0.0 100.0 0.0 94.1 97.5 0.0 2.5
19 31 38 989 1 *Uttar Babuchi 198 1.0 80.8 18.2 79.3 89.9 0.0 10.1
19 31 38 989 01 1 Babuchi 52 1.9 61.5 36.5 61.5 90.4 0.0 9.6
19 31 38 989 02 1 Said Pur 146 0.7 87.7 11.6 85.6 89.7 0.0 10.3
19 31 42 Gunabati Union Total 7064 1.9 94.8 3.3 78.8 96.7 2.6 0.8
19 31 42 009 1 *Agdia 330 1.8 79.7 18.5 83.0 97.6 0.0 2.4
19 31 42 013 1 *Akhirtala 38 0.0 94.7 5.3 86.8 100.0 0.0 0.0
19 31 42 070 1 *Bakethamjala 80 0.0 97.5 2.5 55.0 91.3 8.8 0.0
19 31 42 172 1 *Bishnupur 399 0.5 96.2 3.3 72.4 98.5 1.0 0.5
19 31 42 181 1 *Budhra 295 0.0 100.0 0.0 95.3 97.3 1.7 1.0
19 31 42 211 1 *Chapacho 580 3.3 92.6 4.1 74.0 84.0 14.1 1.9
19 31 42 213 1 *Chapalia Para 174 2.9 90.8 6.3 81.0 99.4 0.0 0.6
19 31 42 283 1 *Dasbaha 475 2.3 97.7 0.0 76.2 98.7 0.8 0.4
19 31 42 295 1 *Debepur 90 8.9 91.1 0.0 55.6 100.0 0.0 0.0
19 31 42 347 1 *Fuler Naori 258 0.8 99.2 0.0 94.2 99.6 0.4 0.0
19 31 42 353 1 *Gadanagar 104 0.0 96.2 3.8 62.5 99.0 0.0 1.0
19 31 42 355 1 *Gazaria 116 9.5 90.5 0.0 69.8 100.0 0.0 0.0
19 31 42 389 1 *Gunabati 131 0.8 99.2 0.0 97.7 90.8 7.6 1.5
19 31 42 459 1 *Jhikadda 419 3.3 96.7 0.0 81.1 99.8 0.0 0.2
19 31 42 496 1 *Kaitara 261 1.9 98.1 0.0 79.3 98.9 0.0 1.1
19 31 42 537 1 *Kartam 237 0.0 93.2 6.8 73.0 78.1 21.1 0.8
19 31 42 566 1 *Khatra 639 6.1 93.1 0.8 85.1 99.1 0.8 0.2
19 31 42 664 1 *Mayurpur 219 0.5 92.7 6.8 72.6 98.2 0.9 0.9
RMO: 1 = Rural, 2 = Urban and 3 = Other Urban Page 42 of 162

Tap Tube-Well Other Owned Rented Rent free
2 3 4 5 6 7 8 9 10
MZ /
MHVill RMO
1
Table C-15: Distribution of General Households by Source of Drinking Water, Electricity Connection and Housing Tenancy Status, by Residence
and Community
Administrative Unit
Residence
Community
Number of
Households
Source of Drinking Water (%) Electricity
Connection
(%)
Housing Tenancy (%)
ZL UZUN /
WA
19 31 42 699 1 *Narayanpur 102 0.0 100.0 0.0 53.9 96.1 3.9 0.0
19 31 42 736 1 *Parikot 279 0.7 93.9 5.4 61.3 100.0 0.0 0.0
19 31 42 774 1 *Pirijkara 108 0.0 100.0 0.0 83.3 99.1 0.9 0.0
19 31 42 801 1 *Rajballabhpur 812 0.0 95.7 4.3 85.1 99.5 0.2 0.2
19 31 42 803 1 *Rampur 327 0.0 98.2 1.8 82.0 97.9 0.0 2.1
19 31 42 910 1 *Sreepur 276 0.4 93.8 5.8 79.0 99.3 0.4 0.4
19 31 42 924 1 *Subarnapur 61 6.6 93.4 0.0 96.7 98.4 1.6 0.0
19 31 42 938 1 *Surikara 254 0.8 96.5 2.8 68.5 97.2 1.2 1.6
19 31 47 Jagannath Dighi Union Total 5089 1.8 95.6 2.6 78.3 96.1 2.1 1.7
19 31 47 015 1 *Akubpur 29 0.0 96.6 3.4 58.6 96.6 3.4 0.0
19 31 47 043 1 *Atakara 237 0.0 94.9 5.1 89.9 98.3 1.3 0.4
19 31 47 097 1 *Bara Pushkarini 135 2.2 93.3 4.4 70.4 98.5 0.0 1.5
19 31 47 105 1 *Bardain 165 1.8 97.0 1.2 75.2 89.7 9.7 0.6
19 31 47 144 1 *Bhagadda 69 0.0 100.0 0.0 79.7 97.1 1.4 1.4
19 31 47 164 1 *Bijoykara 394 1.0 99.0 0.0 77.4 94.7 2.8 2.5
19 31 47 263 1 *Dakshin Betiara 335 1.5 92.5 6.0 74.9 98.5 0.3 1.2
19 31 47 263 01 1 Dakshin Betiara 298 1.7 91.6 6.7 72.5 98.3 0.3 1.3
19 31 47 263 02 1 Kemtali 37 0.0 100.0 0.0 94.6 100.0 0.0 0.0
19 31 47 363 1 *Gangara 147 1.4 98.6 0.0 63.9 93.2 4.1 2.7
19 31 47 402 1 *Hatbaria 269 0.4 91.4 8.2 72.9 98.1 0.0 1.9
19 31 47 478 1 *Kachania 14 0.0 100.0 0.0 100.0 85.7 7.1 7.1
19 31 47 492 1 *Kairkhola 161 0.0 95.0 5.0 87.0 96.9 1.2 1.9
19 31 47 500 1 *Kakkara 225 1.3 96.0 2.7 80.0 94.2 2.7 3.1
19 31 47 519 1 *Kamarkara 77 0.0 96.1 3.9 85.7 98.7 1.3 0.0
19 31 47 553 1 *Kechkimura 283 0.4 99.6 0.0 90.1 97.2 0.4 2.5
19 31 47 553 01 1 Kechkimura 265 0.4 99.6 0.0 96.2 97.0 0.4 2.6
19 31 47 553 02 1 Adarshagram 18 0.0 100.0 0.0 0.0 100.0 0.0 0.0
19 31 47 571 1 *Khilla Para 82 0.0 100.0 0.0 8.5 95.1 4.9 0.0
19 31 47 588 1 *Kodalia 53 1.9 79.2 18.9 50.9 100.0 0.0 0.0
RMO: 1 = Rural, 2 = Urban and 3 = Other Urban Page 43 of 162

Tap Tube-Well Other Owned Rented Rent free
2 3 4 5 6 7 8 9 10
MZ /
MHVill RMO
1
Table C-15: Distribution of General Households by Source of Drinking Water, Electricity Connection and Housing Tenancy Status, by Residence
and Community
Administrative Unit
Residence
Community
Number of
Households
Source of Drinking Water (%) Electricity
Connection
(%)
Housing Tenancy (%)
ZL UZUN /
WA
19 31 47 658 1 *Markota 135 0.0 99.3 0.7 65.9 97.8 2.2 0.0
19 31 47 697 1 *Narayan Kara 230 0.0 100.0 0.0 82.2 95.2 4.3 0.4
19 31 47 713 1 *Noagram 325 5.8 94.2 0.0 88.6 97.5 0.6 1.8
19 31 47 770 1 *Payerkhola 289 5.5 89.6 4.8 88.9 87.9 5.5 6.6
19 31 47 821 1 *Ratanpur 142 3.5 95.1 1.4 25.4 96.5 0.7 2.8
19 31 47 828 1 *Sahapur 103 0.0 100.0 0.0 100.0 99.0 0.0 1.0
19 31 47 864 1 *Satgharia 165 0.6 99.4 0.0 67.9 97.6 1.2 1.2
19 31 47 867 1 *Satisak 71 0.0 93.0 7.0 84.5 100.0 0.0 0.0
19 31 47 903 1 *Sonapur 428 4.0 96.0 0.0 85.5 98.1 1.4 0.5
19 31 47 905 1 *Sonapur Kismat 3 0.0 100.0 0.0 100.0 100.0 0.0 0.0
19 31 47 936 1 *Sukchail 107 0.0 92.5 7.5 73.8 87.9 10.3 1.9
19 31 47 944 1 *Taligram 154 1.3 94.8 3.9 95.5 95.5 0.6 3.9
19 31 47 969 1 *Tilnari 32 0.0 100.0 0.0 56.3 100.0 0.0 0.0
19 31 47 991 1 *Uttar Betiara 230 3.9 94.3 1.7 87.4 99.1 0.9 0.0
19 31 52 Kalikapur Union Total 3972 0.0 94.4 5.6 80.8 95.0 2.0 2.9
19 31 52 001 1 *Abdullahpur 417 0.0 100.0 0.0 85.6 96.2 2.2 1.7
19 31 52 050 1 *Badarpur 343 0.0 88.9 11.1 42.6 98.3 0.3 1.5
19 31 52 050 01 1 1st Badarpur 57 0.0 91.2 8.8 7.0 100.0 0.0 0.0
19 31 52 050 02 1 2nd Badarpur 286 0.0 88.5 11.5 49.7 97.9 0.3 1.7
19 31 52 087 1 *Bangalmuri 208 0.0 100.0 0.0 76.0 100.0 0.0 0.0
19 31 52 166 1 *Bijoypur 117 0.0 98.3 1.7 100.0 100.0 0.0 0.0
19 31 52 189 1 *Chhapua (Bardanbari) 96 0.0 100.0 0.0 83.3 85.4 1.0 13.5
19 31 52 201 1 *Chand Pur 83 0.0 94.0 6.0 94.0 94.0 1.2 4.8
19 31 52 312 1 *Dharmapur 187 0.0 100.0 0.0 92.0 85.6 12.3 2.1
19 31 52 334 1 *Durgapur 115 0.0 95.7 4.3 89.6 96.5 1.7 1.7
19 31 52 435 1 *Jammura 468 0.0 99.4 0.6 96.2 91.7 7.7 0.6
19 31 52 435 01 1 Jammura 365 0.0 100.0 0.0 97.8 89.9 9.3 0.8
19 31 52 435 02 1 Kalikrishna Nagar 103 0.0 97.1 2.9 90.3 98.1 1.9 0.0
19 31 52 437 1 *Jampur 207 0.0 93.2 6.8 93.7 99.5 0.0 0.5
RMO: 1 = Rural, 2 = Urban and 3 = Other Urban Page 44 of 162

Tap Tube-Well Other Owned Rented Rent free
2 3 4 5 6 7 8 9 10
MZ /
MHVill RMO
1
Table C-15: Distribution of General Households by Source of Drinking Water, Electricity Connection and Housing Tenancy Status, by Residence
and Community
Administrative Unit
Residence
Community
Number of
Households
Source of Drinking Water (%) Electricity
Connection
(%)
Housing Tenancy (%)
ZL UZUN /
WA
19 31 52 510 1 *Kalikapur 286 0.0 99.0 1.0 78.0 98.3 0.3 1.4
19 31 52 539 1 *Kashipur 165 0.0 97.6 2.4 90.3 92.7 2.4 4.8
19 31 52 539 01 1 Kashipur 89 0.0 100.0 0.0 88.8 93.3 2.2 4.5
19 31 52 539 02 1 Jagamohanpur 76 0.0 94.7 5.3 92.1 92.1 2.6 5.3
19 31 52 580 1 *King Chapua 101 0.0 91.1 8.9 64.4 90.1 2.0 7.9
19 31 52 631 1 *Madda 110 0.0 88.2 11.8 99.1 100.0 0.0 0.0
19 31 52 711 1 *Nilakhi 47 0.0 100.0 0.0 100.0 40.4 0.0 59.6
19 31 52 721 1 *Noapur 252 0.0 89.7 10.3 65.9 97.6 0.4 2.0
19 31 52 744 1 *Paranpur 120 0.8 99.2 0.0 99.2 100.0 0.0 0.0
19 31 52 838 1 *Samaspur 331 0.0 72.8 27.2 70.1 95.5 0.0 4.5
19 31 52 838 01 1 Mohammadpur 52 0.0 13.5 86.5 0.0 100.0 0.0 0.0
19 31 52 838 02 1 Samaspur 279 0.0 83.9 16.1 83.2 94.6 0.0 5.4
19 31 52 865 1 *Satgharia 157 0.0 100.0 0.0 80.3 94.9 0.0 5.1
19 31 52 899 1 *Sonapur 132 0.0 93.9 6.1 76.5 99.2 0.0 0.8
19 31 52 914 1 *Sreepur 30 0.0 96.7 3.3 56.7 100.0 0.0 0.0
19 31 57 Kankapait Union Total 5366 2.3 93.0 4.7 82.7 97.0 1.2 1.8
19 31 57 003 1 *Agansail 97 12.4 84.5 3.1 87.6 99.0 0.0 1.0
19 31 57 041 1 *Atakara 228 0.4 99.6 0.0 76.8 97.8 2.2 0.0
19 31 57 117 1 *Bashkara 323 2.5 91.6 5.9 79.9 92.9 1.5 5.6
19 31 57 152 1 *Bhanushwar 60 0.0 98.3 1.7 81.7 100.0 0.0 0.0
19 31 57 162 1 *Bhulkara 212 0.0 97.2 2.8 92.0 100.0 0.0 0.0
19 31 57 183 1 *Buddin 240 0.0 97.5 2.5 87.9 96.7 2.5 0.8
19 31 57 205 1 *Chandrapur 166 1.2 98.8 0.0 86.1 100.0 0.0 0.0
19 31 57 289 1 *Daulatpur 89 0.0 76.4 23.6 57.3 94.4 2.2 3.4
19 31 57 338 1 *Durgapur 126 0.0 87.3 12.7 81.7 87.3 0.0 12.7
19 31 57 408 1 *Hingula 532 0.6 99.2 0.2 89.7 97.9 1.3 0.8
19 31 57 432 1 *Jakjoar 150 6.0 89.3 4.7 90.0 96.7 3.3 0.0
19 31 57 443 1 *Jangalpur 263 10.3 84.4 5.3 91.3 98.9 0.0 1.1
19 31 57 488 1 *Kagash 118 5.9 93.2 0.8 89.0 87.3 11.9 0.8
RMO: 1 = Rural, 2 = Urban and 3 = Other Urban Page 45 of 162

Tap Tube-Well Other Owned Rented Rent free
2 3 4 5 6 7 8 9 10
MZ /
MHVill RMO
1
Table C-15: Distribution of General Households by Source of Drinking Water, Electricity Connection and Housing Tenancy Status, by Residence
and Community
Administrative Unit
Residence
Community
Number of
Households
Source of Drinking Water (%) Electricity
Connection
(%)
Housing Tenancy (%)
ZL UZUN /
WA
19 31 57 516 1 *Kalkot 178 0.0 100.0 0.0 12.4 98.3 0.0 1.7
19 31 57 527 1 *Kankapait 307 2.0 91.9 6.2 90.9 97.4 1.3 1.3
19 31 57 535 1 *Karpati 387 5.2 94.1 0.8 80.1 99.2 0.5 0.3
19 31 57 604 1 *Kumarduga 184 0.0 81.0 19.0 87.0 97.3 0.0 2.7
19 31 57 625 1 *Lawlas 160 0.0 77.5 22.5 71.9 95.6 0.0 4.4
19 31 57 645 1 *Maliara 91 0.0 92.3 7.7 75.8 93.4 0.0 6.6
19 31 57 656 1 *Markota 150 2.7 96.7 0.7 89.3 96.0 1.3 2.7
19 31 57 660 1 *Maskara 257 0.0 99.2 0.8 89.5 98.8 0.8 0.4
19 31 57 725 1 *Padua 8 0.0 100.0 0.0 0.0 100.0 0.0 0.0
19 31 57 740 1 *Pannara 254 0.4 98.8 0.8 92.9 96.5 0.4 3.1
19 31 57 764 1 *Pathan Para 166 0.0 77.7 22.3 56.0 98.2 0.6 1.2
19 31 57 830 1 *Sajanpur 101 9.9 90.1 0.0 90.1 96.0 3.0 1.0
19 31 57 922 1 *Subarnapur 28 0.0 71.4 28.6 25.0 96.4 0.0 3.6
19 31 57 953 1 *Tarasail 491 2.4 96.3 1.2 94.5 98.0 1.0 1.0
19 31 61 Kashinagar Union Total 6563 4.1 80.3 15.7 84.4 97.3 0.8 1.9
19 31 61 005 1 *Agata Sahapur 10 0.0 60.0 40.0 60.0 100.0 0.0 0.0
19 31 61 019 1 *Alipur 681 3.1 89.6 7.3 86.2 94.0 2.6 3.4
19 31 61 037 1 *Ashwadia 625 6.2 80.5 13.3 82.4 96.8 0.2 3.0
19 31 61 082 1 *Balumuri 251 0.0 100.0 0.0 89.2 97.2 0.0 2.8
19 31 61 082 01 1 Uttar Balumuri 133 0.0 100.0 0.0 88.0 97.7 0.0 2.3
19 31 61 082 02 1 Dakshin Balumuri 118 0.0 100.0 0.0 90.7 96.6 0.0 3.4
19 31 61 093 1 *Bara Kachlai 147 12.2 59.9 27.9 84.4 97.3 0.0 2.7
19 31 61 107 1 *Bariaya 245 7.3 88.2 4.5 94.7 99.6 0.4 0.0
19 31 61 111 1 *Basantapur 159 1.3 98.7 0.0 96.2 100.0 0.0 0.0
19 31 61 208 1 *Brahmapur 13 7.7 92.3 0.0 100.0 100.0 0.0 0.0
19 31 61 304 1 *Dari Barenga 30 0.0 60.0 40.0 90.0 100.0 0.0 0.0
19 31 61 310 1 *Dharmapur 255 0.0 100.0 0.0 92.2 96.5 0.4 3.1
19 31 61 310 01 1 Dharmapur 153 0.0 100.0 0.0 86.9 94.1 0.7 5.2
19 31 61 310 02 1 Gopalnagar 102 0.0 100.0 0.0 100.0 100.0 0.0 0.0
RMO: 1 = Rural, 2 = Urban and 3 = Other Urban Page 46 of 162

Tap Tube-Well Other Owned Rented Rent free
2 3 4 5 6 7 8 9 10
MZ /
MHVill RMO
1
Table C-15: Distribution of General Households by Source of Drinking Water, Electricity Connection and Housing Tenancy Status, by Residence
and Community
Administrative Unit
Residence
Community
Number of
Households
Source of Drinking Water (%) Electricity
Connection
(%)
Housing Tenancy (%)
ZL UZUN /
WA
19 31 61 406 1 *Helalnagar 377 0.3 96.3 3.4 86.7 95.5 3.2 1.3
19 31 61 422 1 *Jagannathpur 29 0.0 96.6 3.4 82.8 100.0 0.0 0.0
19 31 61 447 1 *Jatrapur 348 0.3 87.4 12.4 70.7 93.1 4.9 2.0
19 31 61 467 1 *Joymangalpur 764 5.9 73.4 20.7 77.1 98.8 0.3 0.9
19 31 61 467 01 1 Joymangalpur 704 6.3 71.3 22.4 83.5 98.7 0.3 1.0
19 31 61 467 02 1 Chandinagar 60 1.7 98.3 0.0 1.7 100.0 0.0 0.0
19 31 61 469 1 *Jugirkandi 633 5.5 68.7 25.8 88.2 98.6 0.0 1.4
19 31 61 469 01 1 Jugirkandi 294 3.4 69.4 27.2 90.8 98.6 0.0 1.4
19 31 61 469 02 1 Hossainpur 330 7.0 67.9 25.2 85.8 98.5 0.0 1.5
19 31 61 469 03 1 Mohadebpur 9 22.2 77.8 0.0 88.9 100.0 0.0 0.0
19 31 61 547 1 *Katalia 161 6.8 91.9 1.2 96.9 95.7 0.0 4.3
19 31 61 615 1 *Lakshmipur 211 0.5 99.5 0.0 93.8 99.1 0.0 0.9
19 31 61 615 01 1 Lakshmipur 95 1.1 98.9 0.0 93.7 100.0 0.0 0.0
19 31 61 615 02 1 Manikantapur 49 0.0 100.0 0.0 89.8 95.9 0.0 4.1
19 31 61 615 03 1 Ballabhpur 67 0.0 100.0 0.0 97.0 100.0 0.0 0.0
19 31 61 641 1 *Majlishpur 149 0.0 98.7 1.3 94.6 98.0 0.0 2.0
19 31 61 709 1 *Nilake Bishnapur 99 0.0 38.4 61.6 73.7 100.0 0.0 0.0
19 31 61 775 1 *Purba Jagannathpur 6 0.0 100.0 0.0 100.0 100.0 0.0 0.0
19 31 61 783 1 *Purba Sahapur 34 0.0 100.0 0.0 100.0 100.0 0.0 0.0
19 31 61 807 1 *Ramchandrapur 593 4.0 47.9 48.1 73.7 98.3 0.0 1.7
19 31 61 815 1 *Rampur 34 0.0 100.0 0.0 100.0 70.6 0.0 29.4
19 31 61 826 1 *Sahapur Pachim 240 1.7 69.6 28.8 89.6 100.0 0.0 0.0
19 31 61 858 1 *Satbaria 315 14.3 75.9 9.8 93.0 98.1 0.3 1.6
19 31 61 877 1 *Shibpur 131 0.0 100.0 0.0 54.2 100.0 0.0 0.0
19 31 61 908 1 *Sreefultala 23 0.0 100.0 0.0 95.7 100.0 0.0 0.0
19 31 71 Munshirhat Union Total 6588 1.6 95.2 3.2 88.8 96.0 3.2 0.8
19 31 71 062 1 *Bahergara 347 2.9 96.5 0.6 97.4 99.1 0.3 0.6
19 31 71 068 1 *Bailpur 274 0.4 99.6 0.0 84.3 98.9 1.1 0.0
19 31 71 068 01 1 Bailpur 180 0.6 99.4 0.0 86.7 98.3 1.7 0.0
RMO: 1 = Rural, 2 = Urban and 3 = Other Urban Page 47 of 162

Tap Tube-Well Other Owned Rented Rent free
2 3 4 5 6 7 8 9 10
MZ /
MHVill RMO
1
Table C-15: Distribution of General Households by Source of Drinking Water, Electricity Connection and Housing Tenancy Status, by Residence
and Community
Administrative Unit
Residence
Community
Number of
Households
Source of Drinking Water (%) Electricity
Connection
(%)
Housing Tenancy (%)
ZL UZUN /
WA
19 31 71 068 02 1 Chhotakhil 94 0.0 100.0 0.0 79.8 100.0 0.0 0.0
19 31 71 089 1 *Bangpai 122 8.2 91.8 0.0 97.5 100.0 0.0 0.0
19 31 71 099 1 *Barais 453 0.2 98.9 0.9 92.7 97.8 0.9 1.3
19 31 71 109 1 *Basanda 366 0.0 99.2 0.8 95.4 97.3 2.2 0.5
19 31 71 113 1 *Basantapur 570 0.9 87.5 11.6 91.9 97.7 1.6 0.7
19 31 71 173 1 *Basubagh 120 0.0 90.0 10.0 86.7 99.2 0.8 0.0
19 31 71 232 1 *Chhatiani 463 3.2 93.3 3.5 68.3 99.8 0.0 0.2
19 31 71 256 1 *Dakra 350 1.1 97.7 1.1 81.1 97.4 0.3 2.3
19 31 71 301 1 *Derkota 371 5.1 89.8 5.1 77.1 98.4 1.3 0.3
19 31 71 449 1 *Jatrapur 140 0.0 99.3 0.7 99.3 98.6 0.0 1.4
19 31 71 471 1 *Jogirhat 392 0.0 100.0 0.0 95.4 97.7 2.0 0.3
19 31 71 521 1 *Kanakpur 123 0.0 100.0 0.0 100.0 67.5 31.7 0.8
19 31 71 557 1 *Keshna (Felna) 429 0.0 91.4 8.6 83.2 98.8 0.2 0.9
19 31 71 574 1 *Khiransal 244 0.0 99.6 0.4 93.0 97.5 2.5 0.0
19 31 71 578 1 *Kismat Bangbai 227 4.4 86.3 9.3 99.1 99.1 0.9 0.0
19 31 71 621 1 *Lanishwar 270 3.3 94.8 1.9 85.2 98.9 1.1 0.0
19 31 71 668 1 *Mestala 651 2.6 96.8 0.6 96.0 81.4 16.0 2.6
19 31 71 668 01 1 Mestala 288 0.0 98.6 1.4 93.1 74.0 21.5 4.5
19 31 71 668 02 1 Munshirhat 111 14.4 85.6 0.0 97.3 62.2 36.0 1.8
19 31 71 668 03 1 Lakshmipur 143 0.0 100.0 0.0 99.3 98.6 0.7 0.7
19 31 71 668 04 1 Anandapur 109 0.9 99.1 0.0 98.2 98.2 0.9 0.9
19 31 71 670 1 *Mithilla 126 1.6 96.0 2.4 73.0 98.4 0.0 1.6
19 31 71 772 1 *Pechaimuri 89 0.0 100.0 0.0 91.0 100.0 0.0 0.0
19 31 71 871 1 *Satyapur (Fulmuri) 215 0.0 97.2 2.8 93.0 98.1 1.4 0.5
19 31 71 889 1 *Subgraus (Singraish) 243 0.0 97.1 2.9 83.5 94.2 5.3 0.4
19 31 71 926 1 *Hariamura 3 0.0 100.0 0.0 33.3 100.0 0.0 0.0
19 31 85 Shubhapur Union Total 9208 0.7 96.7 2.6 68.1 98.6 0.5 0.9
19 31 85 007 1 *Agchar 83 0.0 100.0 0.0 0.0 96.4 0.0 3.6
19 31 85 048 1 *Atgharbagh 175 0.0 98.3 1.7 64.6 97.1 1.7 1.1
RMO: 1 = Rural, 2 = Urban and 3 = Other Urban Page 48 of 162

Tap Tube-Well Other Owned Rented Rent free
2 3 4 5 6 7 8 9 10
MZ /
MHVill RMO
1
Table C-15: Distribution of General Households by Source of Drinking Water, Electricity Connection and Housing Tenancy Status, by Residence
and Community
Administrative Unit
Residence
Community
Number of
Households
Source of Drinking Water (%) Electricity
Connection
(%)
Housing Tenancy (%)
ZL UZUN /
WA
19 31 85 054 1 *Batabaria 28 0.0 100.0 0.0 67.9 100.0 0.0 0.0
19 31 85 056 1 *Bagar Pushkarini 305 2.3 97.7 0.0 67.2 99.3 0.0 0.7
19 31 85 078 1 *Ballar Char 191 0.0 84.8 15.2 45.5 100.0 0.0 0.0
19 31 85 132 1 *Bijoypur 176 0.0 100.0 0.0 36.4 99.4 0.6 0.0
19 31 85 132 01 1 Bijoypur 100 0.0 100.0 0.0 24.0 99.0 1.0 0.0
19 31 85 132 02 1 Noapara 76 0.0 100.0 0.0 52.6 100.0 0.0 0.0
19 31 85 203 1 *Chandpur 335 2.7 97.3 0.0 98.8 98.2 0.3 1.5
19 31 85 275 1 *Dalua 183 0.0 100.0 0.0 84.7 100.0 0.0 0.0
19 31 85 304 1 *Dhanijkara 356 0.0 100.0 0.0 93.8 98.0 1.7 0.3
19 31 85 336 1 *Durgapur 282 0.4 99.6 0.0 72.3 99.6 0.0 0.4
19 31 85 344 1 *Fakirhat 501 1.2 96.6 2.2 61.1 99.0 0.6 0.4
19 31 85 365 1 *Gasbaria 200 0.0 77.0 23.0 66.0 95.5 0.5 4.0
19 31 85 375 1 *Gobindapur 223 0.9 94.2 4.9 79.4 99.1 0.0 0.9
19 31 85 404 1 *Hazari Para 921 0.0 99.8 0.2 55.2 97.8 0.5 1.6
19 31 85 404 01 1 Hazari Para 803 0.0 99.8 0.2 57.0 97.6 0.5 1.9
19 31 85 404 02 1 Halchow 118 0.0 100.0 0.0 42.4 99.2 0.8 0.0
19 31 85 475 1 *Jupua 272 6.3 83.1 10.7 66.9 100.0 0.0 0.0
19 31 85 480 1 *Kachari Para 165 0.0 100.0 0.0 63.6 99.4 0.0 0.6
19 31 85 482 1 *Kachia Pushkarni 180 0.0 86.1 13.9 81.1 98.9 0.0 1.1
19 31 85 484 1 *Kadair 503 0.0 100.0 0.0 77.7 96.2 1.6 2.2
19 31 85 486 1 *Kadghar Kalikapur 313 0.6 99.4 0.0 80.8 98.7 0.6 0.6
19 31 85 545 1 *Katpara 367 0.3 99.7 0.0 53.4 98.9 0.0 1.1
19 31 85 551 1 *Kayerdhari 185 0.0 100.0 0.0 88.1 98.4 0.0 1.6
19 31 85 570 1 *Khilla Para 47 2.1 89.4 8.5 46.8 100.0 0.0 0.0
19 31 85 600 1 *Krishnapur 234 2.1 97.9 0.0 59.4 99.6 0.0 0.4
19 31 85 729 1 *Padua Khamar Pushkarini 281 0.4 99.6 0.0 78.6 100.0 0.0 0.0
19 31 85 729 01 1 Khamar Pushkarini 144 0.7 99.3 0.0 64.6 100.0 0.0 0.0
19 31 85 729 02 1 Padua 137 0.0 100.0 0.0 93.4 100.0 0.0 0.0
19 31 85 731 1 *Paikpara 77 0.0 98.7 1.3 63.6 96.1 3.9 0.0
RMO: 1 = Rural, 2 = Urban and 3 = Other Urban Page 49 of 162

Tap Tube-Well Other Owned Rented Rent free
2 3 4 5 6 7 8 9 10
MZ /
MHVill RMO
1
Table C-15: Distribution of General Households by Source of Drinking Water, Electricity Connection and Housing Tenancy Status, by Residence
and Community
Administrative Unit
Residence
Community
Number of
Households
Source of Drinking Water (%) Electricity
Connection
(%)
Housing Tenancy (%)
ZL UZUN /
WA
19 31 85 748 1 *Pasakot 606 0.7 99.0 0.3 66.2 99.5 0.2 0.3
19 31 85 768 1 *Patkora 183 0.0 100.0 0.0 37.7 95.1 0.0 4.9
19 31 85 860 1 *Satbaria 295 0.0 86.1 13.9 56.9 96.3 2.7 1.0
19 31 85 926 1 *Shubhapur 479 0.2 99.8 0.0 76.0 99.0 0.4 0.6
19 31 85 963 1 *Telihati 376 0.3 99.7 0.0 65.7 99.7 0.3 0.0
19 31 85 973 1 *Tula Pushkarini 231 0.0 88.7 11.3 55.4 99.6 0.4 0.0
19 31 85 983 1 *Unkot 455 0.7 96.9 2.4 86.8 99.8 0.0 0.2
19 31 90 Sreepur Union Total 6099 0.7 97.0 2.2 81.4 98.6 0.6 0.8
19 31 90 052 1 *Bagaigram 332 0.0 98.2 1.8 90.4 99.4 0.3 0.3
19 31 90 054 1 *Bagair 202 0.0 99.5 0.5 84.2 97.0 0.5 2.5
19 31 90 080 1 *Baludhum 97 0.0 100.0 0.0 78.4 97.9 0.0 2.1
19 31 90 119 1 *Basuara 225 0.4 99.6 0.0 72.9 96.0 0.4 3.6
19 31 90 125 1 *Batara 170 0.6 96.5 2.9 92.4 99.4 0.6 0.0
19 31 90 146 1 *Bhaizkara 142 0.0 97.9 2.1 92.3 97.9 0.7 1.4
19 31 90 150 1 *Bhanga Pushkarini 222 3.2 89.6 7.2 75.7 98.2 0.9 0.9
19 31 90 156 1 *Bhitar Char 244 3.7 95.5 0.8 86.9 100.0 0.0 0.0
19 31 90 158 1 *Bhoai 88 0.0 100.0 0.0 69.3 98.9 0.0 1.1
19 31 90 228 1 *Cheoria 138 0.0 91.3 8.7 87.7 100.0 0.0 0.0
19 31 90 238 1 *Chhota Kashni 98 0.0 100.0 0.0 51.0 100.0 0.0 0.0
19 31 90 299 1 *Deokhar 151 0.0 100.0 0.0 78.1 100.0 0.0 0.0
19 31 90 328 1 *Dumuria 152 0.0 99.3 0.7 83.6 98.7 0.7 0.7
19 31 90 359 1 *Gandachi 177 0.0 92.7 7.3 84.7 100.0 0.0 0.0
19 31 90 381 1 *Gopalnagar 252 0.4 92.9 6.7 69.4 98.0 1.6 0.4
19 31 90 410 1 *Hasanpur 205 0.0 100.0 0.0 79.5 100.0 0.0 0.0
19 31 90 428 1 *Jagazaria 132 4.5 95.5 0.0 82.6 99.2 0.8 0.0
19 31 90 445 1 *Jaspur 152 0.0 100.0 0.0 82.9 100.0 0.0 0.0
19 31 90 498 1 *Kaiyani 172 0.0 94.8 5.2 78.5 100.0 0.0 0.0
19 31 90 543 1 *Kasnai 45 0.0 93.3 6.7 95.6 100.0 0.0 0.0
19 31 90 568 1 *Kheaish 231 1.7 97.4 0.9 85.3 99.6 0.0 0.4
RMO: 1 = Rural, 2 = Urban and 3 = Other Urban Page 50 of 162

Tap Tube-Well Other Owned Rented Rent free
2 3 4 5 6 7 8 9 10
MZ /
MHVill RMO
1
Table C-15: Distribution of General Households by Source of Drinking Water, Electricity Connection and Housing Tenancy Status, by Residence
and Community
Administrative Unit
Residence
Community
Number of
Households
Source of Drinking Water (%) Electricity
Connection
(%)
Housing Tenancy (%)
ZL UZUN /
WA
19 31 90 619 1 *Nalghar 468 0.0 98.9 1.1 78.6 96.6 2.8 0.6
19 31 90 648 1 *Mandari 361 2.8 97.2 0.0 87.5 99.4 0.0 0.6
19 31 90 701 1 *Narchar 206 0.0 100.0 0.0 90.3 96.1 1.9 1.9
19 31 90 723 1 *Padua 103 0.0 100.0 0.0 91.3 99.0 0.0 1.0
19 31 90 735 1 *Paikuta 172 0.0 100.0 0.0 80.8 98.3 0.0 1.7
19 31 90 778 1 *Paruara 180 0.0 100.0 0.0 89.4 100.0 0.0 0.0
19 31 90 791 1 *Purba Lohari 46 0.0 100.0 0.0 93.5 97.8 0.0 2.2
19 31 90 797 1 *Rajapur 168 3.6 95.8 0.6 85.7 99.4 0.6 0.0
19 31 90 808 1 *Sharifpur 112 0.0 99.1 0.9 89.3 96.4 0.0 3.6
19 31 90 916 1 *Sreepur 312 0.0 87.5 12.5 54.5 96.8 1.3 1.9
19 31 90 946 1 *Taltali 100 0.0 100.0 0.0 81.0 99.0 0.0 1.0
19 31 90 951 1 *Tara Pushkarini 81 0.0 100.0 0.0 86.4 100.0 0.0 0.0
19 31 90 971 1 *Trishkot 163 0.0 100.0 0.0 85.9 99.4 0.6 0.0
19 31 95 Ujirpur Union Total 6090 7.5 84.2 8.4 81.4 87.5 10.6 2.0
19 31 95 035 1 *Ashrafpur 245 4.9 81.6 13.5 92.7 84.1 15.1 0.8
19 31 95 136 1 *Belghar 160 24.4 75.6 0.0 88.8 77.5 20.6 1.9
19 31 95 177 1 *Brahmapur 793 3.3 93.7 3.0 93.3 55.4 42.6 2.0
19 31 95 177 01 1 Uttar Pratappur 155 11.6 87.7 0.6 89.7 63.9 36.1 0.0
19 31 95 177 02 1 Dakshin Pratappur 437 1.1 98.6 0.2 97.3 37.8 60.4 1.8
19 31 95 177 03 1 Balhara 201 1.5 87.6 10.9 87.6 87.1 9.0 4.0
19 31 95 187 1 *Chak Kalisha 176 9.7 89.8 0.6 91.5 99.4 0.6 0.0
19 31 95 187 01 1 Chak Kalisha 53 11.3 88.7 0.0 98.1 100.0 0.0 0.0
19 31 95 187 02 1 Ujirpur 46 19.6 78.3 2.2 89.1 100.0 0.0 0.0
19 31 95 187 03 1 Purba Belchar Ujirpur 77 2.6 97.4 0.0 88.3 98.7 1.3 0.0
19 31 95 207 1 *Chandsree 105 11.4 85.7 2.9 90.5 85.7 13.3 1.0
19 31 95 209 1 *Chandul 156 0.0 100.0 0.0 99.4 62.8 31.4 5.8
19 31 95 326 1 *Dul Samuddra 11 0.0 100.0 0.0 100.0 100.0 0.0 0.0
19 31 95 367 1 *Gashigram 449 11.1 86.9 2.0 93.3 76.2 22.0 1.8
19 31 95 398 1 *Hashimpur 501 9.2 79.8 11.0 71.5 98.6 0.0 1.4
RMO: 1 = Rural, 2 = Urban and 3 = Other Urban Page 51 of 162

Tap Tube-Well Other Owned Rented Rent free
2 3 4 5 6 7 8 9 10
MZ /
MHVill RMO
1
Table C-15: Distribution of General Households by Source of Drinking Water, Electricity Connection and Housing Tenancy Status, by Residence
and Community
Administrative Unit
Residence
Community
Number of
Households
Source of Drinking Water (%) Electricity
Connection
(%)
Housing Tenancy (%)
ZL UZUN /
WA
19 31 95 398 01 1 Koya 50 0.0 94.0 6.0 32.0 100.0 0.0 0.0
19 31 95 398 02 1 Bhatbari 206 18.0 58.7 23.3 93.2 100.0 0.0 0.0
19 31 95 398 03 1 Chak Lakshmipur 245 3.7 94.7 1.6 61.2 97.1 0.0 2.9
19 31 95 414 1 *Illashpur 120 1.7 97.5 0.8 99.2 100.0 0.0 0.0
19 31 95 418 1 *Jagamohanpur 316 11.7 67.1 21.2 89.2 82.9 15.5 1.6
19 31 95 426 1 *Jagatrampur (Rajandrapur) 119 0.0 98.3 1.7 1.7 99.2 0.0 0.8
19 31 95 433 1 *Jamirkot Durgapur 119 0.0 63.9 36.1 95.0 99.2 0.0 0.8
19 31 95 504 1 *Kali Krishnanagar 420 4.8 74.3 21.0 47.4 96.7 0.7 2.6
19 31 95 508 1 *Kalikapur 64 0.0 100.0 0.0 73.4 100.0 0.0 0.0
19 31 95 531 1 *Karaibon 136 5.1 94.9 0.0 84.6 100.0 0.0 0.0
19 31 95 549 1 *Kanthalia 199 0.0 77.9 22.1 7.5 99.0 0.0 1.0
19 31 95 584 1 *King Santoshpur 41 9.8 87.8 2.4 92.7 100.0 0.0 0.0
19 31 95 596 1 *Krishnapur 331 7.3 91.8 0.9 76.1 87.6 0.0 12.4
19 31 95 605 1 *Kumardoga 359 8.1 91.4 0.6 85.0 97.8 1.9 0.3
19 31 95 650 1 *Manikpur 299 16.4 52.5 31.1 96.3 96.7 1.3 2.0
19 31 95 781 1 *Purba Belghar 131 27.5 67.9 4.6 93.9 100.0 0.0 0.0
19 31 95 781 01 1 Purba Belghar 57 17.5 78.9 3.5 93.0 100.0 0.0 0.0
19 31 95 781 02 1 Batbari 40 32.5 60.0 7.5 95.0 100.0 0.0 0.0
19 31 95 781 03 1 Shibpur 34 38.2 58.8 2.9 94.1 100.0 0.0 0.0
19 31 95 789 1 *Purba Kashipur 325 3.1 87.7 9.2 89.2 96.9 2.8 0.3
19 31 95 789 01 1 Purba Kashipur 154 5.8 75.3 18.8 83.1 98.1 1.3 0.6
19 31 95 789 02 1 Suarkhil 171 0.6 98.8 0.6 94.7 95.9 4.1 0.0
19 31 95 795 1 *Rajapur 73 0.0 100.0 0.0 98.6 100.0 0.0 0.0
19 31 95 803 1 *Rajdarnagar 81 0.0 98.8 1.2 71.6 98.8 0.0 1.2
19 31 95 840 1 *Samuksar 143 1.4 98.6 0.0 93.0 97.9 0.7 1.4
19 31 95 844 1 *Santoshpur 90 17.8 78.9 3.3 94.4 98.9 0.0 1.1
19 31 95 891 1 *Sitalia 128 12.5 86.7 0.8 88.3 99.2 0.8 0.0
19 33 Comilla Sadar Dakshin Upazila Total 84376 9.0 85.8 5.3 91.3 89.0 9.5 1.5
19 33 1 Comilla Sadar Dakshin Upazila 63074 2.3 91.7 6.0 90.2 96.9 1.8 1.4
RMO: 1 = Rural, 2 = Urban and 3 = Other Urban Page 52 of 162

Tap Tube-Well Other Owned Rented Rent free
2 3 4 5 6 7 8 9 10
MZ /
MHVill RMO
1
Table C-15: Distribution of General Households by Source of Drinking Water, Electricity Connection and Housing Tenancy Status, by Residence
and Community
Administrative Unit
Residence
Community
Number of
Households
Source of Drinking Water (%) Electricity
Connection
(%)
Housing Tenancy (%)
ZL UZUN /
WA
19 33 2 Comilla Sadar Dakshin Upazila 19628 30.6 66.6 2.8 98.1 63.0 35.1 1.8
19 33 3 Comilla Sadar Dakshin Upazila 1674 5.5 87.5 7.0 54.0 95.4 0.3 4.3
Comilla Sadar Dakshin Paurashava
19 33 01 Ward No-01 Total 1820 2.1 96.8 1.0 95.9 89.8 7.1 3.1
19 33 01 271 2 *Dakshin Dhanaitari 163 0.0 100.0 0.0 95.1 100.0 0.0 0.0
19 33 01 272 2 *Madhyam Dhanaitari 84 0.0 100.0 0.0 97.6 98.8 0.0 1.2
19 33 01 348 2 *Lakshmipur 115 0.0 98.3 1.7 99.1 99.1 0.9 0.0
19 33 01 485 2 *Kamalapur 171 0.6 99.4 0.0 98.8 98.8 1.2 0.0
19 33 01 636 2 *Matiara 354 1.1 98.9 0.0 97.2 89.8 5.9 4.2
19 33 01 688 2 *Nowagram 257 0.0 99.6 0.4 84.0 84.0 4.3 11.7
19 33 01 731 2 *Pathankot 99 0.0 86.9 13.1 100.0 97.0 1.0 2.0
19 33 01 811 2 *Roypur 176 19.3 80.7 0.0 100.0 88.6 11.4 0.0
19 33 01 950 2 *Ulur Char 300 0.0 100.0 0.0 97.7 76.0 22.7 1.3
19 33 01 966 2 *Uttar Dhanaitari 101 0.0 97.0 3.0 97.0 90.1 5.0 5.0
19 33 02 Ward No-02 Total 933 2.6 91.0 6.4 98.4 92.1 6.1 1.8
19 33 02 165 2 *Dharmapur 67 0.0 95.5 4.5 98.5 100.0 0.0 0.0
19 33 02 183 2 *Chowara 282 0.0 98.6 1.4 98.2 80.9 17.4 1.8
19 33 02 222 2 *Lakshmipur 210 0.0 83.3 16.7 99.5 99.5 0.5 0.0
19 33 02 262 2 *Dayapur 115 20.0 73.0 7.0 94.8 88.7 3.5 7.8
19 33 02 304 2 *Dumaria 123 0.8 99.2 0.0 100.0 96.7 1.6 1.6
19 33 02 480 2 *Kalikinkarpur 38 0.0 78.9 21.1 97.4 97.4 0.0 2.6
19 33 02 848 2 *Saworatali 36 0.0 100.0 0.0 100.0 100.0 0.0 0.0
19 33 02 925 2 *Tarapaia 62 0.0 96.8 3.2 98.4 98.4 1.6 0.0
19 33 03 Ward No-03 Total 1340 14.3 70.4 15.2 94.9 84.0 10.7 5.2
19 33 03 091 2 *Bawband 156 27.6 68.6 3.8 99.4 77.6 18.6 3.8
19 33 03 122 2 *Changi 51 17.6 66.7 15.7 98.0 94.1 5.9 0.0
19 33 03 282 2 *Dhanishwar 178 24.2 74.7 1.1 96.6 84.3 13.5 2.2
19 33 03 292 2 *Dhanpur 130 23.1 66.9 10.0 99.2 94.6 5.4 0.0
19 33 03 361 2 *Goalmathan 272 9.9 89.7 0.4 98.9 88.2 11.4 0.4
RMO: 1 = Rural, 2 = Urban and 3 = Other Urban Page 53 of 162

Tap Tube-Well Other Owned Rented Rent free
2 3 4 5 6 7 8 9 10
MZ /
MHVill RMO
1
Table C-15: Distribution of General Households by Source of Drinking Water, Electricity Connection and Housing Tenancy Status, by Residence
and Community
Administrative Unit
Residence
Community
Number of
Households
Source of Drinking Water (%) Electricity
Connection
(%)
Housing Tenancy (%)
ZL UZUN /
WA
19 33 03 477 2 *Kalikapur 28 10.7 89.3 0.0 92.9 92.9 3.6 3.6
19 33 03 596 2 *Maheshpur 93 7.5 92.5 0.0 100.0 98.9 1.1 0.0
19 33 03 735 2 *Ballabhpur 339 7.1 59.9 33.0 85.0 74.3 11.2 14.5
19 33 03 757 2 *Rajendrapur 93 6.5 26.9 66.7 96.8 79.6 10.8 9.7
19 33 04 Ward No-04 Total 1819 8.9 86.6 4.5 98.8 71.5 27.5 0.9
19 33 04 267 2 *Dakshin Rasulpur(Dulu Para) 438 13.5 84.5 2.1 99.1 51.4 48.6 0.0
19 33 04 670 2 *Neora Saidpur 415 5.1 94.0 1.0 99.5 76.6 23.1 0.2
19 33 04 779 2 *Raja Para(Noapara) 684 10.8 79.7 9.5 97.7 92.8 5.3 1.9
19 33 04 970 2 *Uttar Rasulpur (Dulipara) 282 2.8 96.1 1.1 100.0 43.6 55.3 1.1
19 33 05 Ward No-05 Total 2035 21.6 75.7 2.7 98.6 65.8 33.0 1.2
19 33 05 517 2 *Kazi Para 285 24.9 67.7 7.4 99.3 91.9 7.4 0.7
19 33 05 547 2 *Dishabanda(Luxnabar) 791 6.8 91.5 1.6 97.9 87.9 10.1 2.0
19 33 05 952 2 *Unaisar 959 32.8 65.1 2.1 99.1 39.8 59.5 0.6
19 33 06 Ward No-06 Total 4336 54.4 45.1 0.5 99.0 37.5 61.4 1.2
19 33 06 027 2 *Asrafpur 2349 62.6 37.4 0.0 99.6 33.2 65.7 1.1
19 33 06 423 2 *Jangalia 189 30.2 68.3 1.6 95.8 64.6 33.9 1.6
19 33 06 765 2 *Saktala 1563 44.5 54.3 1.2 98.4 39.8 58.9 1.3
19 33 06 801 2 *Ramnagar 235 58.7 41.3 0.0 100.0 42.6 57.0 0.4
19 33 07 Ward No-07 Total 2947 29.0 70.1 1.0 98.6 61.5 37.5 1.0
19 33 07 059 2 *Durgapur 135 1.5 97.8 0.7 100.0 99.3 0.7 0.0
19 33 07 185 2 *Daiara 384 14.3 85.4 0.3 99.0 56.5 42.2 1.3
19 33 07 210 2 *Gopinathpur(Dakshin) 15 66.7 33.3 0.0 100.0 100.0 0.0 0.0
19 33 07 467 2 *Kachua 296 15.9 84.1 0.0 100.0 45.6 51.7 2.7
19 33 07 628 2 *Mustafapur 8 87.5 12.5 0.0 100.0 100.0 0.0 0.0
19 33 07 752 2 *Lakshmipur 188 3.7 96.3 0.0 98.4 61.2 38.3 0.5
19 33 07 881 2 *Sreemantapur 436 28.9 66.5 4.6 98.9 65.8 33.9 0.2
19 33 07 888 2 *Sreeballabhpur 941 42.2 57.6 0.2 98.4 53.3 45.8 0.9
19 33 07 975 2 *Uttar Hirapur 101 22.8 77.2 0.0 100.0 91.1 7.9 1.0
19 33 07 990 2 *Uttar Rampur 443 40.6 58.5 0.9 97.1 69.3 29.6 1.1
RMO: 1 = Rural, 2 = Urban and 3 = Other Urban Page 54 of 162

Tap Tube-Well Other Owned Rented Rent free
2 3 4 5 6 7 8 9 10
MZ /
MHVill RMO
1
Table C-15: Distribution of General Households by Source of Drinking Water, Electricity Connection and Housing Tenancy Status, by Residence
and Community
Administrative Unit
Residence
Community
Number of
Households
Source of Drinking Water (%) Electricity
Connection
(%)
Housing Tenancy (%)
ZL UZUN /
WA
19 33 08 Ward No-08 Total 1470 26.5 73.3 0.2 98.6 75.7 22.9 1.4
19 33 08 089 2 *Batabaria 149 36.2 63.8 0.0 99.3 61.7 34.2 4.0
19 33 08 143 2 *Chandpur 32 56.3 43.8 0.0 96.9 100.0 0.0 0.0
19 33 08 148 2 *Changine 532 47.4 52.1 0.6 99.1 63.3 35.3 1.3
19 33 08 450 2 *Joypur 366 4.4 95.6 0.0 99.2 92.6 6.8 0.5
19 33 08 623 2 *Monipur 156 0.0 100.0 0.0 99.4 96.2 2.6 1.3
19 33 08 631 2 *Math Puskarini 134 12.7 87.3 0.0 94.0 76.9 20.1 3.0
19 33 08 663 2 *Nandanpur 101 31.7 68.3 0.0 99.0 59.4 40.6 0.0
19 33 09 Ward No-09 Total 2928 53.0 44.5 2.5 98.1 53.2 44.1 2.7
19 33 09 064 2 *Bard 186 100.0 0.0 0.0 100.0 1.6 97.8 0.5
19 33 09 073 2 *Bdr (Bgo Kotbari (Part) 90 94.4 5.6 0.0 100.0 3.3 91.1 5.6
19 33 09 150 2 *Cadet College 86 100.0 0.0 0.0 100.0 0.0 82.6 17.4
19 33 09 190 2 *Dakshin Bagmara 764 54.6 45.4 0.0 99.6 51.7 47.6 0.7
19 33 09 331 2 *Ferojpur 42 26.2 73.8 0.0 100.0 66.7 33.3 0.0
19 33 09 443 2 *Rampur 542 70.1 29.2 0.7 97.6 35.8 62.7 1.5
19 33 09 819 2 *Salmanpur 1057 24.1 69.3 6.6 96.3 84.8 11.1 4.2
19 33 09 957 2 *Uttar Bagmara 161 82.0 18.0 0.0 99.4 24.2 75.8 0.0
19 33 12 Baghmara Union Total 6923 2.0 92.7 5.2 89.6 93.8 4.3 1.9
19 33 12 051 1 *Baghmara 351 2.8 90.6 6.6 81.8 87.7 8.3 4.0
19 33 12 051 01 1 Baghmara 265 3.8 95.8 0.4 84.2 87.9 10.2 1.9
19 33 12 051 02 1 Khil Para 86 0.0 74.4 25.6 74.4 87.2 2.3 10.5
19 33 12 083 1 *Bara Chengahata 376 2.1 97.1 0.8 98.7 86.4 12.0 1.6
19 33 12 103 1 *Baraia 67 0.0 97.0 3.0 88.1 100.0 0.0 0.0
19 33 12 107 1 *Baral 349 4.0 92.0 4.0 90.5 97.7 1.4 0.9
19 33 12 184 1 *Chand Kalmia 89 0.0 61.8 38.2 57.3 92.1 0.0 7.9
19 33 12 333 1 *Dutiapur 323 0.3 93.8 5.9 91.6 95.7 4.3 0.0
19 33 12 335 1 *Dattapur 450 3.8 94.4 1.8 92.0 96.0 2.7 1.3
19 33 12 358 1 *Ghaniakhali 110 0.0 100.0 0.0 82.7 98.2 0.9 0.9
19 33 12 423 1 *Jamalnagar 99 0.0 99.0 1.0 81.8 98.0 0.0 2.0
RMO: 1 = Rural, 2 = Urban and 3 = Other Urban Page 55 of 162

Tap Tube-Well Other Owned Rented Rent free
2 3 4 5 6 7 8 9 10
MZ /
MHVill RMO
1
Table C-15: Distribution of General Households by Source of Drinking Water, Electricity Connection and Housing Tenancy Status, by Residence
and Community
Administrative Unit
Residence
Community
Number of
Households
Source of Drinking Water (%) Electricity
Connection
(%)
Housing Tenancy (%)
ZL UZUN /
WA
19 33 12 433 1 *Joynagar 582 0.0 93.1 6.9 88.8 96.7 0.3 2.9
19 33 12 501 1 *Kesanpar 290 0.0 90.7 9.3 88.3 99.0 0.0 1.0
19 33 12 548 1 *Lolai 727 0.6 99.4 0.0 96.8 97.9 1.8 0.3
19 33 12 548 01 1 Lolai 166 1.8 98.2 0.0 95.8 100.0 0.0 0.0
19 33 12 548 02 1 Noara 272 0.4 99.6 0.0 99.3 100.0 0.0 0.0
19 33 12 548 03 1 Batia Para 57 0.0 100.0 0.0 98.2 100.0 0.0 0.0
19 33 12 548 04 1 Uttar Manoharpur 232 0.0 100.0 0.0 94.4 93.5 5.6 0.9
19 33 12 634 1 *Nagari Para 220 0.0 100.0 0.0 67.3 99.5 0.0 0.5
19 33 12 666 1 *Paschim Noagaon 103 15.5 76.7 7.8 93.2 99.0 0.0 1.0
19 33 12 720 1 *Paschim Noapara 5 0.0 100.0 0.0 80.0 100.0 0.0 0.0
19 33 12 751 1 *Pohankucha 229 0.4 99.6 0.0 98.3 99.1 0.9 0.0
19 33 12 830 1 *Saidpur 560 2.3 80.4 17.3 78.8 83.0 7.0 10.0
19 33 12 865 1 *Siduchi 256 4.7 89.5 5.9 96.5 100.0 0.0 0.0
19 33 12 948 1 *Uttar Askamta 273 2.6 96.3 1.1 95.6 99.6 0.0 0.4
19 33 12 948 01 1 Purba Askamta 124 1.6 96.8 1.6 95.2 99.2 0.0 0.8
19 33 12 948 02 1 Paschim Askamta 149 3.4 96.0 0.7 96.0 100.0 0.0 0.0
19 33 12 952 1 *Uttar Aswathatala 524 5.2 90.8 4.0 94.7 74.8 23.3 1.9
19 33 12 952 01 1 Purba Ashwathatala 210 0.0 98.6 1.4 93.3 85.7 14.3 0.0
19 33 12 952 02 1 Paschim Ashwathatala 314 8.6 85.7 5.7 95.5 67.5 29.3 3.2
19 33 12 959 1 *Uttar Chandpur 181 0.0 100.0 0.0 86.7 100.0 0.0 0.0
19 33 12 962 1 *Uttar Daulatpur 426 0.0 95.3 4.7 92.0 99.3 0.2 0.5
19 33 12 968 1 *Uttar Fatehpur 116 7.8 92.2 0.0 94.8 91.4 8.6 0.0
19 33 12 987 1 *Uttar Paik Para 217 0.9 86.2 12.9 85.7 99.1 0.0 0.9
19 33 24 Bara Para Union Total 6541 6.2 83.3 10.5 86.7 92.8 4.6 2.6
19 33 24 009 1 *Alokedia 185 22.7 65.4 11.9 95.7 100.0 0.0 0.0
19 33 24 056 1 *Bara Dharmapur 1361 4.5 83.0 12.5 73.9 85.5 8.9 5.6
19 33 24 056 01 1 Bara Dharmapur 976 4.3 81.8 13.9 68.8 86.3 8.0 5.7
19 33 24 056 02 1 Dharmapur 31 12.9 87.1 0.0 83.9 96.8 0.0 3.2
19 33 24 056 03 1 Durgapur 122 4.9 87.7 7.4 91.0 66.4 31.1 2.5
RMO: 1 = Rural, 2 = Urban and 3 = Other Urban Page 56 of 162

Tap Tube-Well Other Owned Rented Rent free
2 3 4 5 6 7 8 9 10
MZ /
MHVill RMO
1
Table C-15: Distribution of General Households by Source of Drinking Water, Electricity Connection and Housing Tenancy Status, by Residence
and Community
Administrative Unit
Residence
Community
Number of
Households
Source of Drinking Water (%) Electricity
Connection
(%)
Housing Tenancy (%)
ZL UZUN /
WA
19 33 24 056 04 1 Ratanpur 232 3.9 85.3 10.8 85.3 90.9 2.2 6.9
19 33 24 081 1 *Bara Para 433 8.3 83.1 8.5 86.8 94.9 1.6 3.5
19 33 24 136 1 *Chandipur 165 0.0 82.4 17.6 79.4 99.4 0.0 0.6
19 33 24 138 1 *Chandpur 92 32.6 67.4 0.0 96.7 96.7 3.3 0.0
19 33 24 155 1 *Chhangaon 411 1.7 73.2 25.1 87.3 98.8 0.2 1.0
19 33 24 170 1 *Chhota Durgapur 442 4.1 80.3 15.6 85.5 79.2 17.9 2.9
19 33 24 195 1 *Dakshin Bijoypur 519 1.0 90.4 8.7 96.1 98.1 0.4 1.5
19 33 24 195 01 1 Dakshin Bijoypur 175 2.3 87.4 10.3 97.7 98.9 0.0 1.1
19 33 24 195 02 1 Bhabanipur 54 0.0 100.0 0.0 100.0 100.0 0.0 0.0
19 33 24 195 03 1 Tenguria Para 53 0.0 100.0 0.0 96.2 96.2 3.8 0.0
19 33 24 195 04 1 Hareshpur 119 0.8 80.7 18.5 90.8 97.5 0.0 2.5
19 33 24 195 05 1 Gangkul 118 0.0 95.8 4.2 97.5 97.5 0.0 2.5
19 33 24 215 1 *Dakshin Jatrapur 165 10.3 86.7 3.0 95.2 97.6 1.8 0.6
19 33 24 245 1 *Dakshin Shibpur 349 0.9 88.5 10.6 76.8 81.1 11.7 7.2
19 33 24 319 1 *Durlabhpur 80 0.0 100.0 0.0 96.3 98.8 1.3 0.0
19 33 24 326 1 *Fazilpur 103 11.7 57.3 31.1 98.1 92.2 1.9 5.8
19 33 24 465 1 *Jor Puskarini 227 19.4 80.2 0.4 93.8 95.2 4.0 0.9
19 33 24 465 01 1 Jor Puskarni 120 21.7 77.5 0.8 97.5 93.3 5.8 0.8
19 33 24 465 02 1 Abdullahpur 107 16.8 83.2 0.0 89.7 97.2 1.9 0.9
19 33 24 511 1 *Kashimpur 36 0.0 100.0 0.0 97.2 94.4 0.0 5.6
19 33 24 571 1 *Lolbari 382 0.8 87.4 11.8 91.9 99.5 0.3 0.3
19 33 24 571 01 1 Lolbari 216 0.5 84.7 14.8 91.2 99.1 0.5 0.5
19 33 24 571 02 1 Paranpur 166 1.2 91.0 7.8 92.8 100.0 0.0 0.0
19 33 24 617 1 *Mangalmura 134 1.5 98.5 0.0 88.8 100.0 0.0 0.0
19 33 24 638 1 *Minnatnagar (Part) 304 0.0 99.0 1.0 96.4 99.3 0.0 0.7
19 33 24 646 1 *Mohanpur 114 28.9 71.1 0.0 98.2 93.0 7.0 0.0
19 33 24 789 1 *Rakasher Para 162 3.1 96.9 0.0 75.3 91.4 3.1 5.6
19 33 24 794 1 *Ramchandrapur 248 6.0 87.1 6.9 89.9 98.8 0.4 0.8
19 33 24 890 1 *Sreekamta 175 20.6 57.7 21.7 97.7 99.4 0.0 0.6
RMO: 1 = Rural, 2 = Urban and 3 = Other Urban Page 57 of 162

Tap Tube-Well Other Owned Rented Rent free
2 3 4 5 6 7 8 9 10
MZ /
MHVill RMO
1
Table C-15: Distribution of General Households by Source of Drinking Water, Electricity Connection and Housing Tenancy Status, by Residence
and Community
Administrative Unit
Residence
Community
Number of
Households
Source of Drinking Water (%) Electricity
Connection
(%)
Housing Tenancy (%)
ZL UZUN /
WA
19 33 24 895 1 *Sreenibas 195 6.2 79.0 14.9 82.1 91.8 7.7 0.5
19 33 24 940 1 *Tulatali 259 9.7 88.0 2.3 98.5 98.1 1.9 0.0
19 33 28 Belghar Union Total 7457 0.9 92.9 6.2 88.5 98.4 0.5 1.1
19 33 28 043 1 *Azabpur 679 1.2 79.5 19.3 83.5 95.7 0.6 3.7
19 33 28 043 01 1 Azabpur 306 0.3 79.4 20.3 84.0 99.0 0.0 1.0
19 33 28 043 02 1 Natpara 223 3.1 75.3 21.5 82.1 98.2 0.9 0.9
19 33 28 043 03 1 Betagaon 68 0.0 97.1 2.9 85.3 69.1 1.5 29.4
19 33 28 043 04 1 Juktikhola 82 0.0 76.8 23.2 84.1 98.8 1.2 0.0
19 33 28 143 1 *Bhatistala 131 0.0 99.2 0.8 90.8 98.5 0.0 1.5
19 33 28 161 1 *Bichhankhola 62 0.0 100.0 0.0 74.2 100.0 0.0 0.0
19 33 28 195 1 *Chaul Bhandar 292 1.4 79.1 19.5 82.9 97.3 0.3 2.4
19 33 28 213 1 *Chhota Ichhapur 399 0.8 98.2 1.0 81.7 98.7 0.3 1.0
19 33 28 308 1 *Dhanora 267 1.1 97.4 1.5 82.4 96.3 0.4 3.4
19 33 28 340 1 *Gaiyarbhanga 246 0.8 99.2 0.0 87.8 96.3 2.8 0.8
19 33 28 419 1 *Jalgaon 382 1.3 98.2 0.5 88.0 99.0 0.5 0.5
19 33 28 458 1 *Kaiara 183 0.5 76.5 23.0 78.1 97.8 0.0 2.2
19 33 28 471 1 *Kalora 531 0.4 99.2 0.4 95.9 99.8 0.2 0.0
19 33 28 471 01 1 Kalora 438 0.5 99.1 0.5 99.5 99.8 0.2 0.0
19 33 28 471 02 1 Ashodia 93 0.0 100.0 0.0 78.5 100.0 0.0 0.0
19 33 28 498 1 *Kedarduar 183 4.4 73.2 22.4 84.2 99.5 0.0 0.5
19 33 28 512 1 *Khil Para 264 2.7 97.3 0.0 96.2 99.6 0.0 0.4
19 33 28 625 1 *Mitalla 225 0.0 97.8 2.2 92.0 99.6 0.0 0.4
19 33 28 693 1 *Paroain 195 4.1 85.6 10.3 86.7 99.5 0.0 0.5
19 33 28 697 1 *Purba Sreepur 112 0.0 60.7 39.3 87.5 94.6 0.9 4.5
19 33 28 756 1 *Premnal 349 1.7 90.5 7.7 90.8 98.9 0.3 0.9
19 33 28 765 1 *Rajsa 144 0.7 99.3 0.0 90.3 100.0 0.0 0.0
19 33 28 774 1 *Ranicho 92 0.0 100.0 0.0 85.9 94.6 1.1 4.3
19 33 28 826 1 *Sadhur Kalamia 276 0.4 91.3 8.3 84.8 100.0 0.0 0.0
19 33 28 883 1 *Sondha 188 0.0 100.0 0.0 89.4 100.0 0.0 0.0
RMO: 1 = Rural, 2 = Urban and 3 = Other Urban Page 58 of 162

Tap Tube-Well Other Owned Rented Rent free
2 3 4 5 6 7 8 9 10
MZ /
MHVill RMO
1
Table C-15: Distribution of General Households by Source of Drinking Water, Electricity Connection and Housing Tenancy Status, by Residence
and Community
Administrative Unit
Residence
Community
Number of
Households
Source of Drinking Water (%) Electricity
Connection
(%)
Housing Tenancy (%)
ZL UZUN /
WA
19 33 28 907 1 *Tajer Bhomra 140 0.0 100.0 0.0 96.4 100.0 0.0 0.0
19 33 28 917 1 *Teli Para 133 0.0 100.0 0.0 91.7 97.7 0.8 1.5
19 33 28 930 1 *Tulatali 240 0.4 97.5 2.1 94.6 98.3 0.8 0.8
19 33 28 930 01 1 Tulatali 146 0.0 98.6 1.4 95.2 97.9 1.4 0.7
19 33 28 930 02 1 Nischintapur 94 1.1 95.7 3.2 93.6 98.9 0.0 1.1
19 33 28 932 1 *Tulatali Belghar 1179 0.3 95.6 4.2 90.7 99.4 0.1 0.5
19 33 28 932 01 1 Belghar 812 0.1 94.1 5.8 87.8 99.3 0.1 0.6
19 33 28 932 02 1 Tulatali 155 1.3 97.4 1.3 100.0 99.4 0.0 0.6
19 33 28 932 03 1 Barin 42 0.0 100.0 0.0 100.0 100.0 0.0 0.0
19 33 28 932 04 1 Mantala 70 0.0 100.0 0.0 92.9 100.0 0.0 0.0
19 33 28 932 05 1 Bhairabpur 100 0.0 100.0 0.0 94.0 100.0 0.0 0.0
19 33 28 941 1 *Udania 366 0.5 98.6 0.8 96.4 97.0 2.7 0.3
19 33 28 946 1 *Uttadda 199 1.0 98.5 0.5 78.4 98.5 0.5 1.0
19 33 31 Bholain (Dakshin) Union Total 5890 0.2 97.5 2.3 90.8 98.2 1.0 0.8
19 33 31 001 1 *Adampur 64 0.0 93.8 6.3 96.9 100.0 0.0 0.0
19 33 31 046 1 *Badarpur 77 0.0 100.0 0.0 85.7 100.0 0.0 0.0
19 33 31 053 1 *Bahadurpur 87 0.0 100.0 0.0 79.3 96.6 2.3 1.1
19 33 31 099 1 *Barahipur 112 0.9 99.1 0.0 96.4 93.8 2.7 3.6
19 33 31 116 1 *Bara Jadabpur 377 0.5 98.4 1.1 89.7 98.9 0.5 0.5
19 33 31 154 1 *Bhulain 333 0.0 97.9 2.1 86.5 98.5 0.9 0.6
19 33 31 159 1 *Bhuschi 488 0.4 98.6 1.0 94.7 98.4 0.4 1.2
19 33 31 159 01 1 Bhuschi 384 0.5 98.2 1.3 94.5 97.9 0.5 1.6
19 33 31 159 02 1 Nurpur 104 0.0 100.0 0.0 95.2 100.0 0.0 0.0
19 33 31 191 1 *Chauddadona 212 0.0 100.0 0.0 91.0 99.5 0.5 0.0
19 33 31 198 1 *Chenga Hata 122 0.0 100.0 0.0 91.8 95.9 4.1 0.0
19 33 31 217 1 *Dakshin Kalikapur 62 0.0 100.0 0.0 85.5 93.5 6.5 0.0
19 33 31 222 1 *Chhota Sharifpur 124 0.0 98.4 1.6 100.0 87.1 9.7 3.2
19 33 31 225 1 *Chhotatola 199 0.5 99.5 0.0 89.9 97.5 1.0 1.5
19 33 31 261 1 *Uttar Durgapur 38 0.0 100.0 0.0 63.2 97.4 0.0 2.6
RMO: 1 = Rural, 2 = Urban and 3 = Other Urban Page 59 of 162

Tap Tube-Well Other Owned Rented Rent free
2 3 4 5 6 7 8 9 10
MZ /
MHVill RMO
1
Table C-15: Distribution of General Households by Source of Drinking Water, Electricity Connection and Housing Tenancy Status, by Residence
and Community
Administrative Unit
Residence
Community
Number of
Households
Source of Drinking Water (%) Electricity
Connection
(%)
Housing Tenancy (%)
ZL UZUN /
WA
19 33 31 362 1 *Gosai Puskarini 235 0.0 100.0 0.0 97.4 97.9 2.1 0.0
19 33 31 367 1 *Golacho 151 0.7 98.0 1.3 76.8 98.0 1.3 0.7
19 33 31 392 1 *Haratali 57 0.0 100.0 0.0 98.2 100.0 0.0 0.0
19 33 31 424 1 *Jamira (Part) 277 0.0 100.0 0.0 91.0 98.9 0.7 0.4
19 33 31 428 1 *Jamua 193 0.0 94.8 5.2 88.6 100.0 0.0 0.0
19 33 31 446 1 *Kachir Pukuria 308 0.6 99.4 0.0 96.1 99.7 0.0 0.3
19 33 31 455 1 *Kagatita 111 0.9 99.1 0.0 95.5 99.1 0.0 0.9
19 33 31 561 1 *Madhya Nischintapur 34 2.9 79.4 17.6 88.2 100.0 0.0 0.0
19 33 31 584 1 *Magher Kalamia 346 0.3 99.7 0.0 92.5 98.6 0.9 0.6
19 33 31 607 1 *Mustafapur 128 0.0 100.0 0.0 90.6 98.4 0.8 0.8
19 33 31 675 1 *Palpara 256 0.0 100.0 0.0 100.0 98.4 0.4 1.2
19 33 31 681 1 *Panjab 201 0.0 93.5 6.5 79.1 99.5 0.0 0.5
19 33 31 690 1 *Parati 638 0.0 92.8 7.2 88.1 97.5 0.6 1.9
19 33 31 761 1 *Radhanagar 68 0.0 100.0 0.0 97.1 100.0 0.0 0.0
19 33 31 771 1 *Rampur Kismat 113 0.0 100.0 0.0 93.8 100.0 0.0 0.0
19 33 31 842 1 *Samaspur 150 0.0 82.7 17.3 82.7 98.7 0.7 0.7
19 33 31 953 1 *Uttar Batabaria 131 0.0 100.0 0.0 93.1 98.5 0.0 1.5
19 33 31 964 1 *Uttar Dumarua 109 0.0 100.0 0.0 100.0 100.0 0.0 0.0
19 33 31 984 1 *Uttar Nischintapur 89 0.0 89.9 10.1 83.1 98.9 1.1 0.0
19 33 33 Bholain (Uttar) Union Total 5508 1.4 93.3 5.3 83.9 98.7 0.3 1.0
19 33 33 017 1 *Amua 353 0.3 99.7 0.0 88.4 100.0 0.0 0.0
19 33 33 066 1 *Balipadua 238 0.4 98.7 0.8 77.3 95.4 0.4 4.2
19 33 33 102 1 *Uttar Baraipur 75 1.3 96.0 2.7 94.7 97.3 0.0 2.7
19 33 33 111 1 *Bara Solanda 217 2.8 85.3 12.0 94.9 99.1 0.5 0.5
19 33 33 112 1 *Baratala 428 0.0 97.0 3.0 73.8 99.5 0.2 0.2
19 33 33 125 1 *Betagaon 164 0.0 95.1 4.9 89.6 98.8 0.0 1.2
19 33 33 130 1 *Betua 212 7.5 82.1 10.4 94.3 99.5 0.0 0.5
19 33 33 130 01 1 Betua 54 7.4 87.0 5.6 100.0 98.1 0.0 1.9
19 33 33 130 02 1 Dapar 158 7.6 80.4 12.0 92.4 100.0 0.0 0.0
RMO: 1 = Rural, 2 = Urban and 3 = Other Urban Page 60 of 162
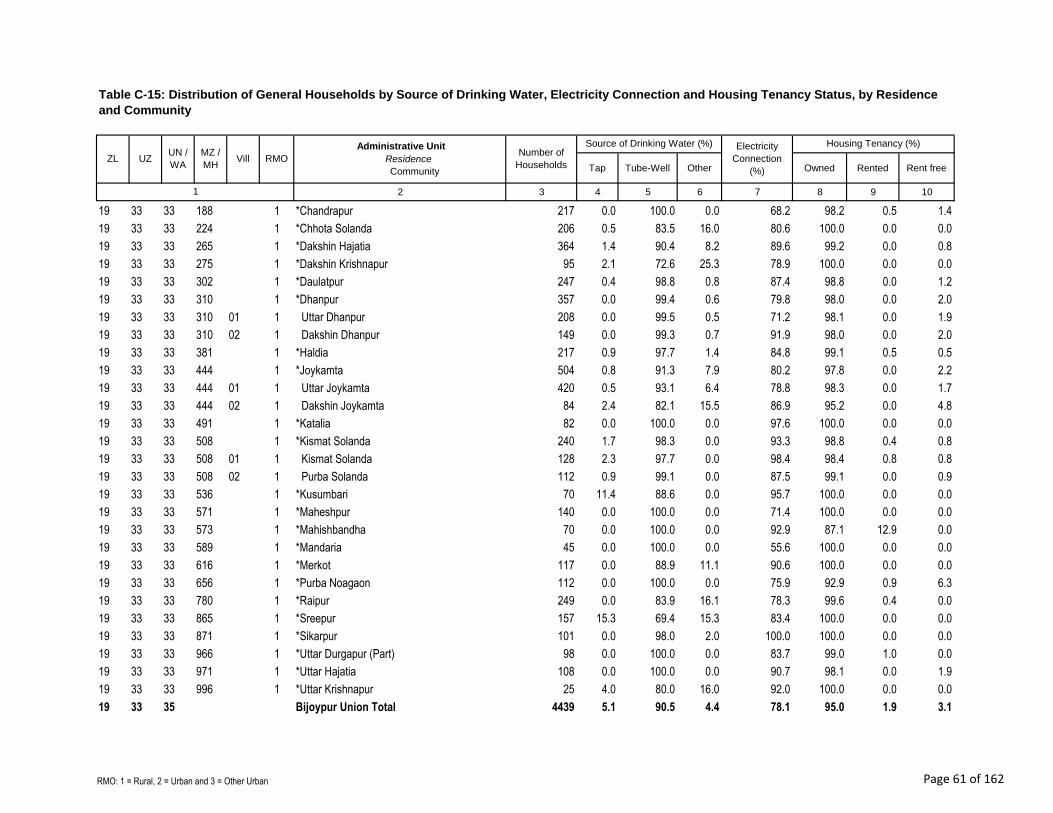
Tap Tube-Well Other Owned Rented Rent free
2 3 4 5 6 7 8 9 10
MZ /
MHVill RMO
1
Table C-15: Distribution of General Households by Source of Drinking Water, Electricity Connection and Housing Tenancy Status, by Residence
and Community
Administrative Unit
Residence
Community
Number of
Households
Source of Drinking Water (%) Electricity
Connection
(%)
Housing Tenancy (%)
ZL UZUN /
WA
19 33 33 188 1 *Chandrapur 217 0.0 100.0 0.0 68.2 98.2 0.5 1.4
19 33 33 224 1 *Chhota Solanda 206 0.5 83.5 16.0 80.6 100.0 0.0 0.0
19 33 33 265 1 *Dakshin Hajatia 364 1.4 90.4 8.2 89.6 99.2 0.0 0.8
19 33 33 275 1 *Dakshin Krishnapur 95 2.1 72.6 25.3 78.9 100.0 0.0 0.0
19 33 33 302 1 *Daulatpur 247 0.4 98.8 0.8 87.4 98.8 0.0 1.2
19 33 33 310 1 *Dhanpur 357 0.0 99.4 0.6 79.8 98.0 0.0 2.0
19 33 33 310 01 1 Uttar Dhanpur 208 0.0 99.5 0.5 71.2 98.1 0.0 1.9
19 33 33 310 02 1 Dakshin Dhanpur 149 0.0 99.3 0.7 91.9 98.0 0.0 2.0
19 33 33 381 1 *Haldia 217 0.9 97.7 1.4 84.8 99.1 0.5 0.5
19 33 33 444 1 *Joykamta 504 0.8 91.3 7.9 80.2 97.8 0.0 2.2
19 33 33 444 01 1 Uttar Joykamta 420 0.5 93.1 6.4 78.8 98.3 0.0 1.7
19 33 33 444 02 1 Dakshin Joykamta 84 2.4 82.1 15.5 86.9 95.2 0.0 4.8
19 33 33 491 1 *Katalia 82 0.0 100.0 0.0 97.6 100.0 0.0 0.0
19 33 33 508 1 *Kismat Solanda 240 1.7 98.3 0.0 93.3 98.8 0.4 0.8
19 33 33 508 01 1 Kismat Solanda 128 2.3 97.7 0.0 98.4 98.4 0.8 0.8
19 33 33 508 02 1 Purba Solanda 112 0.9 99.1 0.0 87.5 99.1 0.0 0.9
19 33 33 536 1 *Kusumbari 70 11.4 88.6 0.0 95.7 100.0 0.0 0.0
19 33 33 571 1 *Maheshpur 140 0.0 100.0 0.0 71.4 100.0 0.0 0.0
19 33 33 573 1 *Mahishbandha 70 0.0 100.0 0.0 92.9 87.1 12.9 0.0
19 33 33 589 1 *Mandaria 45 0.0 100.0 0.0 55.6 100.0 0.0 0.0
19 33 33 616 1 *Merkot 117 0.0 88.9 11.1 90.6 100.0 0.0 0.0
19 33 33 656 1 *Purba Noagaon 112 0.0 100.0 0.0 75.9 92.9 0.9 6.3
19 33 33 780 1 *Raipur 249 0.0 83.9 16.1 78.3 99.6 0.4 0.0
19 33 33 865 1 *Sreepur 157 15.3 69.4 15.3 83.4 100.0 0.0 0.0
19 33 33 871 1 *Sikarpur 101 0.0 98.0 2.0 100.0 100.0 0.0 0.0
19 33 33 966 1 *Uttar Durgapur (Part) 98 0.0 100.0 0.0 83.7 99.0 1.0 0.0
19 33 33 971 1 *Uttar Hajatia 108 0.0 100.0 0.0 90.7 98.1 0.0 1.9
19 33 33 996 1 *Uttar Krishnapur 25 4.0 80.0 16.0 92.0 100.0 0.0 0.0
19 33 35 Bijoypur Union Total 4439 5.1 90.5 4.4 78.1 95.0 1.9 3.1
RMO: 1 = Rural, 2 = Urban and 3 = Other Urban Page 61 of 162

Tap Tube-Well Other Owned Rented Rent free
2 3 4 5 6 7 8 9 10
MZ /
MHVill RMO
1
Table C-15: Distribution of General Households by Source of Drinking Water, Electricity Connection and Housing Tenancy Status, by Residence
and Community
Administrative Unit
Residence
Community
Number of
Households
Source of Drinking Water (%) Electricity
Connection
(%)
Housing Tenancy (%)
ZL UZUN /
WA
19 33 35 1 Bijoypur Union 2765 4.8 92.3 2.9 92.8 94.8 2.9 2.4
19 33 35 3 Bijoypur Union 1674 5.5 87.5 7.0 54.0 95.4 0.3 4.3
19 33 35 252 1 *Dharani Bandha 42 0.0 100.0 0.0 92.9 97.6 0.0 2.4
19 33 35 339 1 *Gabtali 214 0.5 96.3 3.3 97.7 99.1 0.0 0.9
19 33 35 368 1 *Ghosegaon 158 2.5 92.4 5.1 92.4 96.8 3.2 0.0
19 33 35 368 01 1 Ghosegaon 132 3.0 90.9 6.1 90.9 97.0 3.0 0.0
19 33 35 368 02 1 Ram Nagar 26 0.0 100.0 0.0 100.0 96.2 3.8 0.0
19 33 35 376 1 *Haratali 92 6.5 93.5 0.0 100.0 94.6 5.4 0.0
19 33 35 398 1 *Hossainpur 192 1.0 95.8 3.1 97.9 96.9 1.6 1.6
19 33 35 506 1 *Kashipur 98 0.0 100.0 0.0 90.8 99.0 0.0 1.0
19 33 35 524 1 *Kismat 245 4.5 95.5 0.0 98.8 99.6 0.0 0.4
19 33 35 539 1 *Krishnapur 138 5.1 94.9 0.0 100.0 84.1 15.2 0.7
19 33 35 564 3 *Lalmai 1674 5.5 87.5 7.0 54.0 95.4 0.3 4.3
19 33 35 564 01 3 Jammura 230 0.0 97.4 2.6 24.8 93.0 0.0 7.0
19 33 35 564 02 3 Bhangamura 104 0.0 100.0 0.0 7.7 82.7 0.0 17.3
19 33 35 564 03 3 Dhanmura 88 0.0 100.0 0.0 31.8 84.1 0.0 15.9
19 33 35 564 04 3 Sreebidya 190 15.3 84.7 0.0 54.7 98.4 0.5 1.1
19 33 35 564 05 3 Rajarkhola 394 13.7 61.2 25.1 66.5 97.2 0.5 2.3
19 33 35 564 06 3 Paschim Kachar 153 0.0 100.0 0.0 0.0 98.7 0.0 1.3
19 33 35 564 07 3 Chowdhurykhola 215 0.9 97.2 1.9 90.2 98.6 0.0 1.4
19 33 35 564 08 3 Baisnabmura 5 100.0 0.0 0.0 0.0 0.0 0.0 100.0
19 33 35 564 09 3 Lalmati 295 0.7 96.6 2.7 85.1 98.3 0.7 1.0
19 33 35 586 1 *Madhyam Bijoypur 690 2.5 92.8 4.8 83.6 91.3 3.0 5.7
19 33 35 853 1 *Sananda 275 14.9 79.3 5.8 93.1 95.3 0.4 4.4
19 33 35 856 1 *Saoratali 117 9.4 90.6 0.0 99.1 88.0 12.0 0.0
19 33 35 866 1 *Sudhanyapur 41 2.4 97.6 0.0 100.0 97.6 2.4 0.0
19 33 35 915 1 *Sultanpur 140 18.6 75.0 6.4 92.1 95.7 3.6 0.7
19 33 35 938 1 *Tulatali 46 4.3 95.7 0.0 100.0 100.0 0.0 0.0
19 33 35 960 1 *Uttar Bijoypur 277 1.4 98.6 0.0 92.8 97.1 1.4 1.4
RMO: 1 = Rural, 2 = Urban and 3 = Other Urban Page 62 of 162

Tap Tube-Well Other Owned Rented Rent free
2 3 4 5 6 7 8 9 10
MZ /
MHVill RMO
1
Table C-15: Distribution of General Households by Source of Drinking Water, Electricity Connection and Housing Tenancy Status, by Residence
and Community
Administrative Unit
Residence
Community
Number of
Households
Source of Drinking Water (%) Electricity
Connection
(%)
Housing Tenancy (%)
ZL UZUN /
WA
19 33 35 960 01 1 Noapara 89 1.1 98.9 0.0 94.4 100.0 0.0 0.0
19 33 35 960 02 1 Uttar Bijoypur 188 1.6 98.4 0.0 92.0 95.7 2.1 2.1
19 33 39 Chouara Union Total 4546 1.2 96.5 2.3 95.6 98.6 0.6 0.8
19 33 39 004 1 *Alampur 195 0.0 100.0 0.0 94.9 98.5 0.5 1.0
19 33 39 042 1 *Bamisa King 185 0.0 100.0 0.0 99.5 99.5 0.0 0.5
19 33 39 051 1 *Bara Bamisa 150 0.0 100.0 0.0 98.7 98.7 1.3 0.0
19 33 39 054 1 *Chikutia 285 3.5 88.4 8.1 94.0 99.3 0.4 0.4
19 33 39 054 01 1 Chikutia 76 7.9 64.5 27.6 98.7 100.0 0.0 0.0
19 33 39 054 02 1 Kodalia 209 1.9 97.1 1.0 92.3 99.0 0.5 0.5
19 33 39 080 1 *Bhubanpur 111 0.0 100.0 0.0 98.2 99.1 0.9 0.0
19 33 39 085 1 *Brahmanbaria 70 0.0 100.0 0.0 90.0 100.0 0.0 0.0
19 33 39 096 1 *Bhaiskhola 144 3.5 96.5 0.0 88.9 97.9 0.7 1.4
19 33 39 153 1 *Chasha Para 300 1.3 98.7 0.0 99.0 99.3 0.0 0.7
19 33 39 173 1 *Dakshin Gopalnagar 69 0.0 98.6 1.4 95.7 98.6 1.4 0.0
19 33 39 205 1 *Dakshin Dighalgaon 214 1.4 98.6 0.0 94.9 99.5 0.0 0.5
19 33 39 212 1 *Dakshin Hirapur 57 0.0 100.0 0.0 82.5 98.2 1.8 0.0
19 33 39 237 1 *Dakshin Rampur 268 0.7 99.3 0.0 98.1 98.5 1.1 0.4
19 33 39 247 1 *Sreemantapur 150 1.3 98.7 0.0 100.0 96.7 3.3 0.0
19 33 39 292 1 *Dhanpur 37 0.0 54.1 45.9 75.7 100.0 0.0 0.0
19 33 39 344 1 *Gazaria 166 0.0 91.6 8.4 95.8 98.8 0.6 0.6
19 33 39 386 1 *Hemjara 303 3.3 95.0 1.7 92.7 95.4 1.3 3.3
19 33 39 425 1 *Jangalpur 68 0.0 100.0 0.0 98.5 98.5 0.0 1.5
19 33 39 433 1 *Jashpur 65 0.0 100.0 0.0 98.5 100.0 0.0 0.0
19 33 39 594 1 *Mohammadpur 103 0.0 100.0 0.0 100.0 100.0 0.0 0.0
19 33 39 616 1 *Mangalpur 67 0.0 80.6 19.4 95.5 94.0 0.0 6.0
19 33 39 638 1 *Minnat Nagar(Part) 57 0.0 100.0 0.0 96.5 100.0 0.0 0.0
19 33 39 658 1 *Nalchar 78 2.6 91.0 6.4 91.0 100.0 0.0 0.0
19 33 39 660 1 *Nalchoa 64 20.3 68.8 10.9 92.2 93.8 4.7 1.6
19 33 39 732 1 *Pipulia 88 0.0 100.0 0.0 96.6 95.5 0.0 4.5
RMO: 1 = Rural, 2 = Urban and 3 = Other Urban Page 63 of 162

Tap Tube-Well Other Owned Rented Rent free
2 3 4 5 6 7 8 9 10
MZ /
MHVill RMO
1
Table C-15: Distribution of General Households by Source of Drinking Water, Electricity Connection and Housing Tenancy Status, by Residence
and Community
Administrative Unit
Residence
Community
Number of
Households
Source of Drinking Water (%) Electricity
Connection
(%)
Housing Tenancy (%)
ZL UZUN /
WA
19 33 39 794 1 *Ramchandrapur 97 0.0 100.0 0.0 97.9 99.0 0.0 1.0
19 33 39 844 1 *Satbaria 56 0.0 100.0 0.0 94.6 98.2 0.0 1.8
19 33 39 868 1 *Sidhaitali 73 0.0 95.9 4.1 68.5 100.0 0.0 0.0
19 33 39 876 1 *Sindua 223 0.0 100.0 0.0 98.2 100.0 0.0 0.0
19 33 39 878 1 *Sispur 108 0.0 100.0 0.0 98.1 100.0 0.0 0.0
19 33 39 943 1 *Tungirpar 435 0.0 100.0 0.0 95.2 99.8 0.0 0.2
19 33 39 943 01 1 Tungirpar 249 0.0 100.0 0.0 97.2 100.0 0.0 0.0
19 33 39 943 02 1 Uttar Tungirpar 186 0.0 100.0 0.0 92.5 99.5 0.0 0.5
19 33 39 961 1 *Uttar Gopalnagar 151 0.7 87.4 11.9 100.0 97.4 2.6 0.0
19 33 39 982 1 *Pratappur 109 0.9 99.1 0.0 100.0 99.1 0.0 0.9
19 33 58 Galiara Union Total 5991 1.5 96.7 1.8 95.6 98.3 0.6 1.1
19 33 58 037 1 *Balarampur 56 0.0 98.2 1.8 89.3 100.0 0.0 0.0
19 33 58 076 1 *Baraipur 77 0.0 98.7 1.3 85.7 96.1 1.3 2.6
19 33 58 106 1 *Bhatra Bhatera+Galiara 313 0.0 97.1 2.9 98.1 96.5 1.3 2.2
19 33 58 106 01 1 Bhatera 108 0.0 100.0 0.0 94.4 98.1 0.0 1.9
19 33 58 106 02 1 Galiara 205 0.0 95.6 4.4 100.0 95.6 2.0 2.4
19 33 58 131 1 *Comalla 27 0.0 100.0 0.0 92.6 96.3 0.0 3.7
19 33 58 207 1 *Dakshin Durgapur 158 0.0 100.0 0.0 88.6 99.4 0.0 0.6
19 33 58 217 1 *Kalikapur 13 0.0 100.0 0.0 100.0 100.0 0.0 0.0
19 33 58 230 1 *Rajapur-1 61 0.0 100.0 0.0 96.7 100.0 0.0 0.0
19 33 58 237 1 *Dakshin Rampur 208 0.0 100.0 0.0 91.8 99.5 0.0 0.5
19 33 58 264 1 *Debipur 119 0.0 96.6 3.4 99.2 100.0 0.0 0.0
19 33 58 274 1 *Dhanaijuri 131 0.0 100.0 0.0 96.2 100.0 0.0 0.0
19 33 58 291 1 *Dhanpur Mura Para 189 0.0 100.0 0.0 93.1 100.0 0.0 0.0
19 33 58 291 01 1 Dhanpur 51 0.0 100.0 0.0 100.0 100.0 0.0 0.0
19 33 58 291 02 1 Murapara 138 0.0 100.0 0.0 90.6 100.0 0.0 0.0
19 33 58 301 1 *Dhuli Para 187 0.0 84.5 15.5 98.4 99.5 0.5 0.0
19 33 58 323 1 *Dakshin Noapara 228 5.3 93.0 1.8 92.5 93.4 0.4 6.1
19 33 58 323 01 1 Dakshin Noapara 200 6.0 92.0 2.0 91.5 92.5 0.5 7.0
RMO: 1 = Rural, 2 = Urban and 3 = Other Urban Page 64 of 162

Tap Tube-Well Other Owned Rented Rent free
2 3 4 5 6 7 8 9 10
MZ /
MHVill RMO
1
Table C-15: Distribution of General Households by Source of Drinking Water, Electricity Connection and Housing Tenancy Status, by Residence
and Community
Administrative Unit
Residence
Community
Number of
Households
Source of Drinking Water (%) Electricity
Connection
(%)
Housing Tenancy (%)
ZL UZUN /
WA
19 33 58 323 02 1 Rajmangalpur 28 0.0 100.0 0.0 100.0 100.0 0.0 0.0
19 33 58 336 1 *Fultali 190 0.0 100.0 0.0 99.5 96.8 1.1 2.1
19 33 58 336 01 1 Fultali 115 0.0 100.0 0.0 99.1 94.8 1.7 3.5
19 33 58 336 02 1 Rajapur 75 0.0 100.0 0.0 100.0 100.0 0.0 0.0
19 33 58 356 1 *Gilatali 91 0.0 100.0 0.0 73.6 97.8 0.0 2.2
19 33 58 428 1 *Jangalpur (Purba) 267 0.4 99.6 0.0 95.9 98.9 0.0 1.1
19 33 58 430 1 *Jangalpur (Paschim) 90 0.0 98.9 1.1 85.6 97.8 2.2 0.0
19 33 58 433 1 *Jashpur-1 109 0.0 100.0 0.0 96.3 100.0 0.0 0.0
19 33 58 435 1 *Jashpur-2 99 0.0 100.0 0.0 89.9 96.0 0.0 4.0
19 33 58 452 1 *Joypur 52 0.0 100.0 0.0 90.4 92.3 3.8 3.8
19 33 58 470 1 *Kadamtali 44 0.0 100.0 0.0 95.5 95.5 0.0 4.5
19 33 58 497 1 *Kanishtala 240 2.9 97.1 0.0 98.3 98.3 1.3 0.4
19 33 58 522 1 *Kheais 42 0.0 100.0 0.0 100.0 100.0 0.0 0.0
19 33 58 534 1 *Krishnanagar 191 0.5 99.5 0.0 99.0 99.0 1.0 0.0
19 33 58 541 1 *Kundergora 145 0.0 100.0 0.0 100.0 97.9 0.0 2.1
19 33 58 574 1 *Madhya Krishnapur 94 0.0 100.0 0.0 100.0 100.0 0.0 0.0
19 33 58 594 1 *Mohammadpur 125 0.0 100.0 0.0 97.6 91.2 8.8 0.0
19 33 58 608 1 *Manoharpur 97 0.0 97.9 2.1 93.8 97.9 1.0 1.0
19 33 58 611 1 *Mandaria 83 0.0 100.0 0.0 98.8 95.2 2.4 2.4
19 33 58 618 1 *Manipur 83 0.0 100.0 0.0 100.0 100.0 0.0 0.0
19 33 58 678 1 *Nischintapur 83 0.0 98.8 1.2 94.0 97.6 1.2 1.2
19 33 58 690 1 *Noapara 98 1.0 99.0 0.0 100.0 100.0 0.0 0.0
19 33 58 693 1 *Paharpur 24 0.0 100.0 0.0 100.0 100.0 0.0 0.0
19 33 58 717 1 *Lakshmipur 165 15.2 58.2 26.7 94.5 100.0 0.0 0.0
19 33 58 755 1 *Purba Noapara 449 6.5 92.2 1.3 98.7 100.0 0.0 0.0
19 33 58 755 01 1 Khilpara 165 14.5 83.0 2.4 99.4 100.0 0.0 0.0
19 33 58 755 02 1 Balur Char 39 12.8 87.2 0.0 100.0 100.0 0.0 0.0
19 33 58 755 03 1 Bara Char 103 0.0 99.0 1.0 98.1 100.0 0.0 0.0
19 33 58 755 04 1 Meruali 109 0.0 100.0 0.0 97.2 100.0 0.0 0.0
RMO: 1 = Rural, 2 = Urban and 3 = Other Urban Page 65 of 162

Tap Tube-Well Other Owned Rented Rent free
2 3 4 5 6 7 8 9 10
MZ /
MHVill RMO
1
Table C-15: Distribution of General Households by Source of Drinking Water, Electricity Connection and Housing Tenancy Status, by Residence
and Community
Administrative Unit
Residence
Community
Number of
Households
Source of Drinking Water (%) Electricity
Connection
(%)
Housing Tenancy (%)
ZL UZUN /
WA
19 33 58 755 05 1 Nagarkandi 33 0.0 97.0 3.0 100.0 100.0 0.0 0.0
19 33 58 784 1 *Rajapur-2 201 0.5 96.0 3.5 93.5 100.0 0.0 0.0
19 33 58 796 1 *Ramdhanpur 135 0.0 100.0 0.0 98.5 97.0 1.5 1.5
19 33 58 841 1 *Sashirpar 20 0.0 100.0 0.0 95.0 100.0 0.0 0.0
19 33 58 852 1 *Shahapur 125 3.2 96.8 0.0 93.6 96.0 0.0 4.0
19 33 58 858 1 *Shawratali 71 7.0 93.0 0.0 100.0 100.0 0.0 0.0
19 33 58 898 1 *Subhanagar-1 97 0.0 100.0 0.0 97.9 100.0 0.0 0.0
19 33 58 900 1 *Subhanagar-2 310 0.3 99.7 0.0 94.5 99.0 0.3 0.6
19 33 58 903 1 *Subhapur 148 0.0 100.0 0.0 95.9 97.3 0.0 2.7
19 33 58 908 1 *Shobharampur 12 0.0 91.7 8.3 100.0 100.0 0.0 0.0
19 33 58 920 1 *Surjyanagar 179 0.0 100.0 0.0 95.5 97.8 0.0 2.2
19 33 58 990 1 *Uttar Rampur 65 0.0 100.0 0.0 98.5 100.0 0.0 0.0
19 33 73 Purba Jorekaran Union Total 4208 4.3 80.7 15.0 91.2 98.4 0.4 1.2
19 33 73 116 1 *Birahimpur 156 10.3 84.6 5.1 94.9 98.7 0.0 1.3
19 33 73 116 01 1 Birahimpur 119 13.4 79.8 6.7 93.3 98.3 0.0 1.7
19 33 73 116 02 1 Kanuarmokh 37 0.0 100.0 0.0 100.0 100.0 0.0 0.0
19 33 73 121 1 *Bishnupur 210 3.8 96.2 0.0 89.0 99.5 0.0 0.5
19 33 73 145 1 *Chhota Joynagar 83 0.0 100.0 0.0 96.4 98.8 0.0 1.2
19 33 73 193 1 *Dakshin Himmatpur 25 0.0 100.0 0.0 100.0 100.0 0.0 0.0
19 33 73 294 1 *Dharmanagar 65 10.8 40.0 49.2 90.8 100.0 0.0 0.0
19 33 73 299 1 *Dharmapur 166 27.7 71.1 1.2 96.4 98.8 0.0 1.2
19 33 73 334 1 *Frangirhat 189 4.8 81.5 13.8 92.6 99.5 0.5 0.0
19 33 73 351 1 *Gazipur 24 0.0 100.0 0.0 100.0 100.0 0.0 0.0
19 33 73 358 1 *Goalgaon 359 1.4 98.6 0.0 94.7 99.7 0.3 0.0
19 33 73 365 1 *Gobindapur 31 12.9 87.1 0.0 96.8 87.1 0.0 12.9
19 33 73 381 1 *Hasimpur 112 8.0 34.8 57.1 89.3 99.1 0.9 0.0
19 33 73 381 01 1 Hasimpur 33 24.2 39.4 36.4 97.0 97.0 3.0 0.0
19 33 73 381 02 1 Tara Puskurni 79 1.3 32.9 65.8 86.1 100.0 0.0 0.0
19 33 73 388 1 *Hilalnagar 6 0.0 100.0 0.0 100.0 100.0 0.0 0.0
RMO: 1 = Rural, 2 = Urban and 3 = Other Urban Page 66 of 162

Tap Tube-Well Other Owned Rented Rent free
2 3 4 5 6 7 8 9 10
MZ /
MHVill RMO
1
Table C-15: Distribution of General Households by Source of Drinking Water, Electricity Connection and Housing Tenancy Status, by Residence
and Community
Administrative Unit
Residence
Community
Number of
Households
Source of Drinking Water (%) Electricity
Connection
(%)
Housing Tenancy (%)
ZL UZUN /
WA
19 33 73 395 1 *Lakshmipur 83 19.3 80.7 0.0 74.7 98.8 0.0 1.2
19 33 73 405 1 *Jagapur 337 4.2 76.9 19.0 83.7 96.4 1.5 2.1
19 33 73 443 1 *Bara Joynagar 178 0.0 100.0 0.0 85.4 99.4 0.0 0.6
19 33 73 443 01 1 Joynagar 119 0.0 100.0 0.0 86.6 99.2 0.0 0.8
19 33 73 443 02 1 Jagatrampur 59 0.0 100.0 0.0 83.1 100.0 0.0 0.0
19 33 73 490 1 *Kamalpur 274 4.7 94.5 0.7 94.2 98.2 0.7 1.1
19 33 73 551 1 *Kuria Para 207 1.0 28.0 71.0 84.1 99.5 0.0 0.5
19 33 73 559 1 *Lalbagh 625 3.4 64.2 32.5 96.0 97.9 0.6 1.4
19 33 73 569 1 *Lampur 232 0.4 98.3 1.3 97.4 98.7 0.9 0.4
19 33 73 633 1 *Mathurapur 371 0.0 100.0 0.0 90.0 98.9 0.0 1.1
19 33 73 675 1 *Nirbhaypur 67 0.0 100.0 0.0 91.0 100.0 0.0 0.0
19 33 73 787 1 *Rajashpur 289 2.8 88.6 8.7 82.4 95.2 0.3 4.5
19 33 73 910 1 *Sudhanyapur 44 2.3 34.1 63.6 100.0 100.0 0.0 0.0
19 33 73 991 1 *Uttar Himmatpur 75 2.7 60.0 37.3 98.7 100.0 0.0 0.0
19 33 80 Paschim Jorekaran Union Total 4620 2.7 85.5 11.8 93.5 94.8 3.6 1.6
19 33 80 028 1 *Jogamohanpur 142 4.2 35.9 59.9 81.7 91.5 5.6 2.8
19 33 80 047 1 *Banipur 294 9.5 74.8 15.6 95.2 96.9 2.7 0.3
19 33 80 094 1 *Bhagalpur 133 7.5 92.5 0.0 82.7 98.5 1.5 0.0
19 33 80 103 1 *Bhat Para 376 0.0 100.0 0.0 94.1 94.7 4.0 1.3
19 33 80 175 1 *Kalikapur 155 0.6 97.4 1.9 86.5 81.3 2.6 16.1
19 33 80 175 01 1 Jorekaran 65 0.0 100.0 0.0 75.4 64.6 1.5 33.8
19 33 80 175 02 1 Kalikapur 47 2.1 95.7 2.1 93.6 91.5 6.4 2.1
19 33 80 175 03 1 King Ramchandrapur 43 0.0 95.3 4.7 95.3 95.3 0.0 4.7
19 33 80 205 1 *Krishnapur 122 0.8 98.4 0.8 100.0 97.5 2.5 0.0
19 33 80 215 1 *Rasulpur 111 0.0 100.0 0.0 87.4 97.3 2.7 0.0
19 33 80 225 1 *Pratappur 285 0.0 99.3 0.7 98.9 98.2 0.0 1.8
19 33 80 225 01 1 Dakshin Pratappur 174 0.0 98.9 1.1 99.4 100.0 0.0 0.0
19 33 80 225 02 1 Sultanpur 111 0.0 100.0 0.0 98.2 95.5 0.0 4.5
19 33 80 277 1 *Dhananjoy Nagar 64 0.0 46.9 53.1 98.4 100.0 0.0 0.0
RMO: 1 = Rural, 2 = Urban and 3 = Other Urban Page 67 of 162

Tap Tube-Well Other Owned Rented Rent free
2 3 4 5 6 7 8 9 10
MZ /
MHVill RMO
1
Table C-15: Distribution of General Households by Source of Drinking Water, Electricity Connection and Housing Tenancy Status, by Residence
and Community
Administrative Unit
Residence
Community
Number of
Households
Source of Drinking Water (%) Electricity
Connection
(%)
Housing Tenancy (%)
ZL UZUN /
WA
19 33 80 287 1 *Purba Dhanpur 319 0.6 96.6 2.8 92.8 98.1 0.3 1.6
19 33 80 301 1 *Dhuliara 147 0.0 88.4 11.6 94.6 96.6 0.7 2.7
19 33 80 311 1 *Duribatgram 249 8.8 83.9 7.2 98.4 91.2 5.6 3.2
19 33 80 346 1 *Gozarpur 96 0.0 97.9 2.1 97.9 95.8 4.2 0.0
19 33 80 378 1 *Harish Char 140 2.1 81.4 16.4 86.4 99.3 0.0 0.7
19 33 80 396 1 *Hossainpur 379 0.3 98.7 1.1 98.4 99.5 0.5 0.0
19 33 80 418 1 *Jammura 132 0.0 63.6 36.4 86.4 100.0 0.0 0.0
19 33 80 566 1 *Lalnagar 161 0.0 70.8 29.2 89.4 90.7 8.7 0.6
19 33 80 653 1 *Muradpur 63 0.0 100.0 0.0 100.0 95.2 0.0 4.8
19 33 80 705 1 *Paschim Bhatgram 186 3.8 89.8 6.5 98.4 96.2 2.7 1.1
19 33 80 737 1 *Purba Bhatgram 157 5.1 92.4 2.5 97.5 68.8 29.3 1.9
19 33 80 794 1 *Ramchandrapur 24 0.0 100.0 0.0 100.0 100.0 0.0 0.0
19 33 80 863 1 *Subarnapur 331 2.1 96.1 1.8 99.7 91.5 8.5 0.0
19 33 80 923 1 *Taltali 118 2.5 97.5 0.0 71.2 94.9 0.0 5.1
19 33 80 928 1 *Tarapur 104 0.0 100.0 0.0 95.2 93.3 6.7 0.0
19 33 80 930 1 *Telikona 79 0.0 43.0 57.0 84.8 98.7 0.0 1.3
19 33 80 947 1 *Ulain 253 10.3 35.6 54.2 92.1 99.6 0.0 0.4
19 33 83 Perul (Dakshin) Union Total 4304 2.0 94.3 3.6 85.6 98.6 0.7 0.8
19 33 83 249 1 *Dakshin Badarpur 92 0.0 100.0 0.0 84.8 100.0 0.0 0.0
19 33 83 301 1 *Darbesh Para 257 0.0 98.8 1.2 95.7 97.7 1.2 1.2
19 33 83 315 1 *Dhosaricho 407 3.4 94.8 1.7 85.0 98.3 0.2 1.5
19 33 83 338 1 *Fazilpur 80 0.0 100.0 0.0 60.0 100.0 0.0 0.0
19 33 83 351 1 *Gazaria 255 3.5 96.5 0.0 82.7 100.0 0.0 0.0
19 33 83 380 1 *Hadkara 111 0.0 47.7 52.3 46.8 99.1 0.0 0.9
19 33 83 417 1 *Jafarpur 176 0.0 100.0 0.0 96.6 99.4 0.6 0.0
19 33 83 476 1 *Kanaksree 708 3.7 92.1 4.2 91.5 98.2 0.7 1.1
19 33 83 505 1 *Khalilpur 96 2.1 97.9 0.0 83.3 96.9 3.1 0.0
19 33 83 552 1 *Ludhua 59 1.7 96.6 1.7 72.9 100.0 0.0 0.0
19 33 83 679 1 *Panch Pukuria 86 0.0 100.0 0.0 86.0 97.7 0.0 2.3
RMO: 1 = Rural, 2 = Urban and 3 = Other Urban Page 68 of 162

Tap Tube-Well Other Owned Rented Rent free
2 3 4 5 6 7 8 9 10
MZ /
MHVill RMO
1
Table C-15: Distribution of General Households by Source of Drinking Water, Electricity Connection and Housing Tenancy Status, by Residence
and Community
Administrative Unit
Residence
Community
Number of
Households
Source of Drinking Water (%) Electricity
Connection
(%)
Housing Tenancy (%)
ZL UZUN /
WA
19 33 83 744 1 *Perul 902 0.9 98.1 1.0 91.2 98.6 1.0 0.4
19 33 83 781 1 *Purba Alokdia 137 0.0 100.0 0.0 49.6 100.0 0.0 0.0
19 33 83 814 1 *Ramballabhpur 31 22.6 77.4 0.0 93.5 100.0 0.0 0.0
19 33 83 819 1 *Royduar 98 0.0 99.0 1.0 69.4 94.9 0.0 5.1
19 33 83 851 1 *Shashanpar 342 2.6 90.6 6.7 86.5 98.5 0.6 0.9
19 33 83 873 1 *Singaria 103 0.0 100.0 0.0 96.1 99.0 0.0 1.0
19 33 83 955 1 *Uttar Bhatora 260 4.2 86.2 9.6 79.6 98.5 1.5 0.0
19 33 83 964 1 *Uttar Shameshpur 104 1.0 99.0 0.0 94.2 100.0 0.0 0.0
19 33 87 Perul (Uttar) Union Total 4321 1.9 93.3 4.8 91.7 97.9 1.2 0.9
19 33 87 012 1 *Alishwar 416 0.2 99.3 0.5 90.1 96.4 1.7 1.9
19 33 87 039 1 *Atiti 293 1.4 98.3 0.3 85.3 99.7 0.0 0.3
19 33 87 084 1 *Bara Hargila 120 0.0 100.0 0.0 94.2 99.2 0.8 0.0
19 33 87 152 1 *Bhora 113 8.0 92.0 0.0 92.0 76.1 23.9 0.0
19 33 87 177 1 *Chak Nandi 110 0.0 100.0 0.0 98.2 100.0 0.0 0.0
19 33 87 206 1 *Chhilania 572 0.3 97.0 2.6 94.1 99.3 0.3 0.3
19 33 87 206 01 1 Kamekua 84 1.2 85.7 13.1 83.3 98.8 0.0 1.2
19 33 87 206 02 1 Khil Para 84 0.0 95.2 4.8 88.1 98.8 1.2 0.0
19 33 87 206 03 1 Uttar Chhilania 404 0.2 99.8 0.0 97.5 99.5 0.2 0.2
19 33 87 211 1 *Chhota Hargila 105 1.9 98.1 0.0 97.1 98.1 0.0 1.9
19 33 87 331 1 *Durlabhpur 118 0.0 89.8 10.2 96.6 99.2 0.0 0.8
19 33 87 389 1 *Hapania 92 0.0 100.0 0.0 92.4 100.0 0.0 0.0
19 33 87 426 1 *Jammura 176 0.6 78.4 21.0 84.7 99.4 0.0 0.6
19 33 87 464 1 *Kaksar 358 0.6 80.2 19.3 83.8 98.0 0.6 1.4
19 33 87 609 1 *Matainkot 577 0.3 99.3 0.3 92.7 98.6 0.0 1.4
19 33 87 688 1 *Para Daulatpur 25 0.0 100.0 0.0 92.0 96.0 0.0 4.0
19 33 87 799 1 *Purba Jagatpur 439 3.2 89.7 7.1 90.0 97.7 0.9 1.4
19 33 87 844 1 *Sanicho 185 7.0 92.4 0.5 97.3 95.1 2.2 2.7
19 33 87 860 1 *Sherpur 137 2.2 82.5 15.3 84.7 98.5 1.5 0.0
19 33 87 939 1 *Ujalia 62 25.8 74.2 0.0 100.0 100.0 0.0 0.0
RMO: 1 = Rural, 2 = Urban and 3 = Other Urban Page 69 of 162

Tap Tube-Well Other Owned Rented Rent free
2 3 4 5 6 7 8 9 10
MZ /
MHVill RMO
1
Table C-15: Distribution of General Households by Source of Drinking Water, Electricity Connection and Housing Tenancy Status, by Residence
and Community
Administrative Unit
Residence
Community
Number of
Households
Source of Drinking Water (%) Electricity
Connection
(%)
Housing Tenancy (%)
ZL UZUN /
WA
19 33 87 944 1 *Utsab Padua 296 0.0 93.9 6.1 98.6 99.0 1.0 0.0
19 33 87 957 1 *Uttar Birahimpur 54 16.7 83.3 0.0 98.1 100.0 0.0 0.0
19 33 87 960 1 *Uttar Charbari 73 2.7 97.3 0.0 94.5 100.0 0.0 0.0
19 36 Daudkandi Upazila Total 68701 5.0 89.5 5.5 80.8 89.9 8.9 1.2
19 36 1 Daudkandi Upazila 59408 2.6 91.4 6.0 78.6 93.8 5.0 1.2
19 36 2 Daudkandi Upazila 9293 20.5 77.1 2.5 94.6 64.7 33.7 1.5
Daudkandi Paurashava
19 36 01 Ward No-01 Total 636 0.3 98.6 1.1 95.0 99.5 0.2 0.3
19 36 01 739 2 *Daulatpur 271 0.0 100.0 0.0 100.0 100.0 0.0 0.0
19 36 01 742 2 *Nurpur 365 0.5 97.5 1.9 91.2 99.2 0.3 0.5
19 36 02 Ward No-02 Total 637 0.9 97.6 1.4 90.4 96.9 1.4 1.7
19 36 02 067 2 *Barogaon 184 0.0 96.2 3.8 88.0 96.7 0.0 3.3
19 36 02 739 2 *Krishnapur 204 1.5 98.5 0.0 94.6 98.5 0.5 1.0
19 36 02 761 2 *Paschim Hasanpur 90 0.0 97.8 2.2 76.7 98.9 1.1 0.0
19 36 02 987 2 *Uttar Sattanandi Purba Para 159 1.9 98.1 0.0 95.6 93.7 4.4 1.9
19 36 03 Ward No-03 Total 736 2.7 97.3 0.0 87.6 94.7 2.0 3.3
19 36 03 787 2 *Purba Hasanpur 277 3.2 96.8 0.0 90.3 96.0 2.2 1.8
19 36 03 907 2 *Taltali 308 1.6 98.4 0.0 80.8 91.2 2.9 5.8
19 36 03 965 2 *Uttar Hasanpur 151 4.0 96.0 0.0 96.7 99.3 0.0 0.7
19 36 04 Ward No-04 Total 2063 26.3 71.2 2.5 95.6 49.6 49.2 1.2
19 36 04 743 2 *Ojarbhanga 1502 32.6 65.6 1.9 97.0 41.3 57.3 1.4
19 36 04 987 2 *Uttar Sattanandi Paschim Para 561 9.6 86.1 4.3 91.8 71.8 27.5 0.7
19 36 05 Ward No-05 Total 1342 61.5 35.5 2.9 99.7 37.1 62.1 0.8
19 36 05 338 2 *Daudkandi (Shapara) 771 67.6 28.5 3.9 99.6 45.9 53.6 0.5
19 36 05 484 2 *Daudkandi Bazar(Joypur) 571 53.4 45.0 1.6 99.8 25.2 73.6 1.2
19 36 06 Ward No-06 Total 1125 19.5 79.5 1.1 95.4 45.3 51.1 3.6
19 36 06 338 2 *Donar Char 717 23.6 74.8 1.7 93.6 37.7 58.0 4.3
19 36 06 433 2 *Shabjikandi 408 12.3 87.7 0.0 98.5 58.8 39.0 2.2
19 36 07 Ward No-07 Total 1205 21.5 74.6 3.9 95.3 64.1 34.5 1.3
RMO: 1 = Rural, 2 = Urban and 3 = Other Urban Page 70 of 162

Tap Tube-Well Other Owned Rented Rent free
2 3 4 5 6 7 8 9 10
MZ /
MHVill RMO
1
Table C-15: Distribution of General Households by Source of Drinking Water, Electricity Connection and Housing Tenancy Status, by Residence
and Community
Administrative Unit
Residence
Community
Number of
Households
Source of Drinking Water (%) Electricity
Connection
(%)
Housing Tenancy (%)
ZL UZUN /
WA
19 36 07 080 2 *Bariakuri 35 0.0 100.0 0.0 94.3 74.3 22.9 2.9
19 36 07 382 2 *Dighirpar 322 0.9 98.4 0.6 97.5 96.6 2.8 0.6
19 36 07 743 2 *Maizpara 652 36.8 56.3 6.9 93.4 37.4 60.7 1.8
19 36 07 958 2 *Uttar Gazipur 144 10.4 89.6 0.0 97.2 97.9 1.4 0.7
19 36 07 982 2 *Uttar Sandi (Part) 52 1.9 98.1 0.0 100.0 98.1 1.9 0.0
19 36 08 Ward No-08 Total 910 2.0 96.2 1.9 88.9 69.9 29.3 0.8
19 36 08 484 2 *Dakshin Sattanandi 531 1.5 98.5 0.0 92.5 49.2 49.9 0.9
19 36 08 980 2 *Uttar Nasaraddi 379 2.6 92.9 4.5 83.9 98.9 0.5 0.5
19 36 09 Ward No-09 Total 639 1.3 91.2 7.5 97.5 98.4 0.8 0.8
19 36 09 215 2 *Daulatdi 301 0.7 91.7 7.6 96.3 97.7 1.3 1.0
19 36 09 291 2 *Dakshin Gazipur 92 5.4 67.4 27.2 94.6 97.8 1.1 1.1
19 36 09 425 2 *Kazirkona 141 0.0 100.0 0.0 100.0 100.0 0.0 0.0
19 36 09 630 2 *Nagarkandi 105 1.0 99.0 0.0 100.0 99.0 0.0 1.0
19 36 21 Daudkandi Uttar Union Total 3823 0.5 91.7 7.8 76.9 98.0 0.1 1.9
19 36 21 123 1 *Bhajra 813 0.2 98.5 1.2 58.4 97.5 0.0 2.5
19 36 21 123 01 1 Bhajra 451 0.0 97.8 2.2 30.2 99.1 0.0 0.9
19 36 21 123 02 1 Baher Char 362 0.6 99.4 0.0 93.6 95.6 0.0 4.4
19 36 21 225 1 *Char Lasti 15 0.0 53.3 46.7 6.7 93.3 0.0 6.7
19 36 21 230 1 *Char Nandanpur 161 0.0 80.1 19.9 89.4 98.8 1.2 0.0
19 36 21 236 1 *Char Satyadas 61 4.9 19.7 75.4 63.9 96.7 1.6 1.6
19 36 21 251 1 *Chengakandi 517 0.0 94.6 5.4 80.1 98.1 0.0 1.9
19 36 21 300 1 *Daudkandi 312 0.3 80.1 19.6 70.8 98.4 0.3 1.3
19 36 21 300 01 1 Natun Hasnabad 195 0.5 84.6 14.9 53.3 98.5 0.0 1.5
19 36 21 300 02 1 Char Charua 117 0.0 72.6 27.4 100.0 98.3 0.9 0.9
19 36 21 386 1 *Dim Char 1 0.0 0.0 100.0 0.0 100.0 0.0 0.0
19 36 21 415 1 *Ganga Prasad Latif 212 0.5 96.2 3.3 88.2 98.1 0.0 1.9
19 36 21 419 1 *Ganga Prasad Char 545 1.3 97.1 1.7 77.8 98.3 0.2 1.5
19 36 21 462 1 *Hasnabad 920 0.5 97.4 2.1 89.9 97.6 0.0 2.4
19 36 21 462 01 1 Kandergaon 119 1.7 84.0 14.3 79.8 100.0 0.0 0.0
RMO: 1 = Rural, 2 = Urban and 3 = Other Urban Page 71 of 162

Tap Tube-Well Other Owned Rented Rent free
2 3 4 5 6 7 8 9 10
MZ /
MHVill RMO
1
Table C-15: Distribution of General Households by Source of Drinking Water, Electricity Connection and Housing Tenancy Status, by Residence
and Community
Administrative Unit
Residence
Community
Number of
Households
Source of Drinking Water (%) Electricity
Connection
(%)
Housing Tenancy (%)
ZL UZUN /
WA
19 36 21 462 02 1 Uttar Hasnabad 120 2.5 97.5 0.0 88.3 95.8 0.0 4.2
19 36 21 462 03 1 Purba Hasnabad 162 0.0 100.0 0.0 94.4 98.8 0.0 1.2
19 36 21 462 04 1 Dakshin Hasnabad 109 0.0 98.2 1.8 69.7 99.1 0.0 0.9
19 36 21 462 05 1 Paschim Hasnabad 189 0.0 100.0 0.0 100.0 97.4 0.0 2.6
19 36 21 462 06 1 Bitikandi 221 0.0 100.0 0.0 94.1 95.9 0.0 4.1
19 36 21 699 1 *Nandanpur 266 0.0 70.7 29.3 77.8 98.9 0.0 1.1
19 36 25 Biteshwar Union Total 3617 1.0 92.2 6.7 63.8 97.7 1.4 0.8
19 36 25 149 1 *Biteshwar 1185 0.6 96.0 3.4 51.6 99.2 0.3 0.5
19 36 25 149 01 1 Khanerbari 120 1.7 98.3 0.0 61.7 98.3 0.0 1.7
19 36 25 149 02 1 Biteshwar 240 0.0 99.6 0.4 27.5 98.3 1.7 0.0
19 36 25 149 03 1 Tinpara 347 0.9 91.4 7.8 63.4 99.4 0.0 0.6
19 36 25 149 04 1 Birbagh Goali 332 0.6 96.1 3.3 62.3 99.7 0.0 0.3
19 36 25 149 05 1 Madla 146 0.0 99.3 0.7 30.1 99.3 0.0 0.7
19 36 25 189 1 *Chandra Sekhardi 345 1.7 77.1 21.2 69.9 98.6 0.0 1.4
19 36 25 287 1 *Dakshin Durgapur 161 0.0 100.0 0.0 93.2 99.4 0.6 0.0
19 36 25 353 1 *Dekrikhola 85 3.5 96.5 0.0 70.6 100.0 0.0 0.0
19 36 25 364 1 *Dhanua(Pachvita) 30 0.0 100.0 0.0 80.0 96.7 0.0 3.3
19 36 25 502 1 *Kadamtali 94 0.0 100.0 0.0 97.9 98.9 0.0 1.1
19 36 25 506 1 *Kadiarbhanga 108 3.7 64.8 31.5 89.8 96.3 3.7 0.0
19 36 25 528 1 *Kalasadhardia 207 0.0 100.0 0.0 100.0 99.5 0.0 0.5
19 36 25 528 01 1 Kalasadhardia 145 0.0 100.0 0.0 100.0 100.0 0.0 0.0
19 36 25 528 02 1 Patnekanda 18 0.0 100.0 0.0 100.0 100.0 0.0 0.0
19 36 25 528 03 1 Nayakandi 44 0.0 100.0 0.0 100.0 97.7 0.0 2.3
19 36 25 605 1 *Lezikayrapur 53 0.0 81.1 18.9 17.0 100.0 0.0 0.0
19 36 25 688 1 *Naiair 280 4.3 77.5 18.2 81.8 87.9 11.1 1.1
19 36 25 725 1 *Noadda 332 0.3 94.6 5.1 66.0 97.0 0.3 2.7
19 36 25 728 1 *Noagaon 708 0.6 96.8 2.7 51.8 97.9 1.6 0.6
19 36 25 728 01 1 Noagaon 416 0.7 94.7 4.6 66.8 98.8 1.0 0.2
19 36 25 728 02 1 Barakota 250 0.4 99.6 0.0 35.6 96.4 2.8 0.8
RMO: 1 = Rural, 2 = Urban and 3 = Other Urban Page 72 of 162

Tap Tube-Well Other Owned Rented Rent free
2 3 4 5 6 7 8 9 10
MZ /
MHVill RMO
1
Table C-15: Distribution of General Households by Source of Drinking Water, Electricity Connection and Housing Tenancy Status, by Residence
and Community
Administrative Unit
Residence
Community
Number of
Households
Source of Drinking Water (%) Electricity
Connection
(%)
Housing Tenancy (%)
ZL UZUN /
WA
19 36 25 728 03 1 Naowpara 42 0.0 100.0 0.0 0.0 97.6 0.0 2.4
19 36 25 841 1 *Sapara(Part)(Goshkandi) 29 0.0 100.0 0.0 3.4 100.0 0.0 0.0
19 36 30 Elliotganj Uttar Union Total 3795 0.6 97.8 1.7 83.9 98.1 1.3 0.5
19 36 30 018 1 *Atiakhola 184 0.0 97.3 2.7 89.1 99.5 0.5 0.0
19 36 30 025 1 *Autbag 642 0.2 97.0 2.8 89.6 99.7 0.0 0.3
19 36 30 025 01 1 Autbagh 328 0.0 99.4 0.6 86.6 99.7 0.0 0.3
19 36 30 025 02 1 Bhelanagar 314 0.3 94.6 5.1 92.7 99.7 0.0 0.3
19 36 30 131 1 *Bhaskhola 373 0.5 99.5 0.0 64.3 98.7 0.3 1.1
19 36 30 167 1 *Chair Para 359 0.8 93.6 5.6 88.0 98.1 0.0 1.9
19 36 30 368 1 *Dhanuakhola 96 0.0 100.0 0.0 85.4 100.0 0.0 0.0
19 36 30 459 1 *Haserkhola 288 0.0 96.2 3.8 80.2 100.0 0.0 0.0
19 36 30 590 1 *Kusiara 1075 1.3 97.8 0.9 86.2 99.3 0.5 0.3
19 36 30 590 01 1 Khoshkandi 458 0.0 99.6 0.4 91.0 99.3 0.2 0.4
19 36 30 590 02 1 Kusiara 470 3.0 97.0 0.0 82.1 99.1 0.9 0.0
19 36 30 590 03 1 Kalijug 147 0.0 94.6 5.4 84.4 99.3 0.0 0.7
19 36 30 677 1 *Nagarpar 92 0.0 100.0 0.0 50.0 100.0 0.0 0.0
19 36 30 867 1 *Singula 686 0.1 99.9 0.0 87.8 93.0 6.4 0.6
19 36 34 Elliotganj Dakshin Union Total 4363 4.0 91.4 4.6 83.4 93.4 4.5 2.0
19 36 34 145 1 *Birtala 471 0.8 98.1 1.1 84.9 85.8 9.8 4.5
19 36 34 153 1 *Bitman 189 0.5 99.5 0.0 98.9 99.5 0.0 0.5
19 36 34 284 1 *Dakshin Daulatpur 318 0.6 98.4 0.9 96.5 98.1 1.3 0.6
19 36 34 284 01 1 Daulatpur 247 0.4 98.4 1.2 98.8 97.6 1.6 0.8
19 36 34 284 02 1 Kutubpur 71 1.4 98.6 0.0 88.7 100.0 0.0 0.0
19 36 34 400 1 *Elliotganj 43 74.4 25.6 0.0 100.0 51.2 48.8 0.0
19 36 34 524 1 *Kalakopa 168 0.0 92.3 7.7 82.7 99.4 0.0 0.6
19 36 34 608 1 *Mobarakpur 148 0.7 98.6 0.7 94.6 73.0 15.5 11.5
19 36 34 634 1 *Malikhil 764 0.3 95.5 4.2 86.3 99.1 0.5 0.4
19 36 34 634 01 1 Malikhil 433 0.0 99.8 0.2 93.3 98.6 0.7 0.7
19 36 34 634 02 1 Malikhil Bakernagar 331 0.6 90.0 9.4 77.0 99.7 0.3 0.0
RMO: 1 = Rural, 2 = Urban and 3 = Other Urban Page 73 of 162
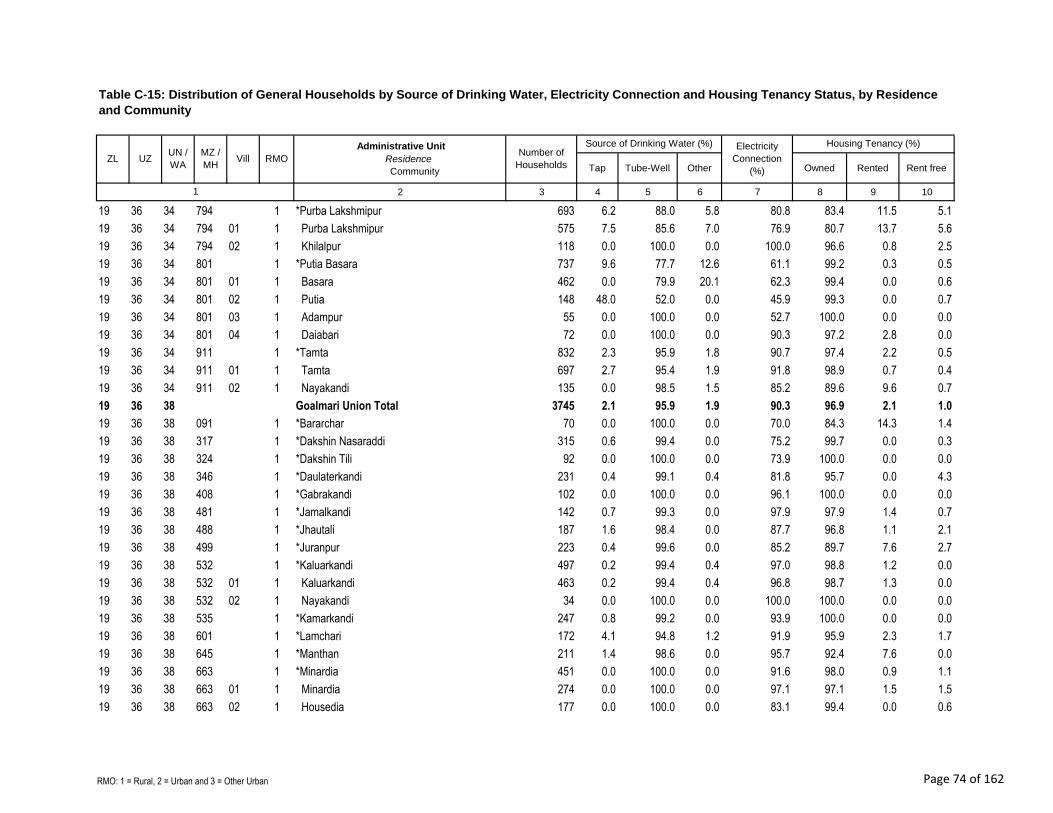
Tap Tube-Well Other Owned Rented Rent free
2 3 4 5 6 7 8 9 10
MZ /
MHVill RMO
1
Table C-15: Distribution of General Households by Source of Drinking Water, Electricity Connection and Housing Tenancy Status, by Residence
and Community
Administrative Unit
Residence
Community
Number of
Households
Source of Drinking Water (%) Electricity
Connection
(%)
Housing Tenancy (%)
ZL UZUN /
WA
19 36 34 794 1 *Purba Lakshmipur 693 6.2 88.0 5.8 80.8 83.4 11.5 5.1
19 36 34 794 01 1 Purba Lakshmipur 575 7.5 85.6 7.0 76.9 80.7 13.7 5.6
19 36 34 794 02 1 Khilalpur 118 0.0 100.0 0.0 100.0 96.6 0.8 2.5
19 36 34 801 1 *Putia Basara 737 9.6 77.7 12.6 61.1 99.2 0.3 0.5
19 36 34 801 01 1 Basara 462 0.0 79.9 20.1 62.3 99.4 0.0 0.6
19 36 34 801 02 1 Putia 148 48.0 52.0 0.0 45.9 99.3 0.0 0.7
19 36 34 801 03 1 Adampur 55 0.0 100.0 0.0 52.7 100.0 0.0 0.0
19 36 34 801 04 1 Daiabari 72 0.0 100.0 0.0 90.3 97.2 2.8 0.0
19 36 34 911 1 *Tamta 832 2.3 95.9 1.8 90.7 97.4 2.2 0.5
19 36 34 911 01 1 Tamta 697 2.7 95.4 1.9 91.8 98.9 0.7 0.4
19 36 34 911 02 1 Nayakandi 135 0.0 98.5 1.5 85.2 89.6 9.6 0.7
19 36 38 Goalmari Union Total 3745 2.1 95.9 1.9 90.3 96.9 2.1 1.0
19 36 38 091 1 *Bararchar 70 0.0 100.0 0.0 70.0 84.3 14.3 1.4
19 36 38 317 1 *Dakshin Nasaraddi 315 0.6 99.4 0.0 75.2 99.7 0.0 0.3
19 36 38 324 1 *Dakshin Tili 92 0.0 100.0 0.0 73.9 100.0 0.0 0.0
19 36 38 346 1 *Daulaterkandi 231 0.4 99.1 0.4 81.8 95.7 0.0 4.3
19 36 38 408 1 *Gabrakandi 102 0.0 100.0 0.0 96.1 100.0 0.0 0.0
19 36 38 481 1 *Jamalkandi 142 0.7 99.3 0.0 97.9 97.9 1.4 0.7
19 36 38 488 1 *Jhautali 187 1.6 98.4 0.0 87.7 96.8 1.1 2.1
19 36 38 499 1 *Juranpur 223 0.4 99.6 0.0 85.2 89.7 7.6 2.7
19 36 38 532 1 *Kaluarkandi 497 0.2 99.4 0.4 97.0 98.8 1.2 0.0
19 36 38 532 01 1 Kaluarkandi 463 0.2 99.4 0.4 96.8 98.7 1.3 0.0
19 36 38 532 02 1 Nayakandi 34 0.0 100.0 0.0 100.0 100.0 0.0 0.0
19 36 38 535 1 *Kamarkandi 247 0.8 99.2 0.0 93.9 100.0 0.0 0.0
19 36 38 601 1 *Lamchari 172 4.1 94.8 1.2 91.9 95.9 2.3 1.7
19 36 38 645 1 *Manthan 211 1.4 98.6 0.0 95.7 92.4 7.6 0.0
19 36 38 663 1 *Minardia 451 0.0 100.0 0.0 91.6 98.0 0.9 1.1
19 36 38 663 01 1 Minardia 274 0.0 100.0 0.0 97.1 97.1 1.5 1.5
19 36 38 663 02 1 Housedia 177 0.0 100.0 0.0 83.1 99.4 0.0 0.6
RMO: 1 = Rural, 2 = Urban and 3 = Other Urban Page 74 of 162

Tap Tube-Well Other Owned Rented Rent free
2 3 4 5 6 7 8 9 10
MZ /
MHVill RMO
1
Table C-15: Distribution of General Households by Source of Drinking Water, Electricity Connection and Housing Tenancy Status, by Residence
and Community
Administrative Unit
Residence
Community
Number of
Households
Source of Drinking Water (%) Electricity
Connection
(%)
Housing Tenancy (%)
ZL UZUN /
WA
19 36 38 710 1 *Nasaraddi Dhul 29 0.0 100.0 0.0 96.6 93.1 6.9 0.0
19 36 38 816 1 *Ramaitkandi(Part)( Goailmari) 382 15.4 66.8 17.8 91.4 95.5 3.7 0.8
19 36 38 860 1 *Sendi (Part) 258 0.0 100.0 0.0 95.7 98.4 0.0 1.6
19 36 38 991 1 *Uttar Tili 136 0.0 100.0 0.0 100.0 100.0 0.0 0.0
19 36 47 Jinglatali Union Total 3696 1.1 91.2 7.7 92.6 97.9 1.0 1.1
19 36 47 032 1 *Bahadurkhola 112 0.0 100.0 0.0 91.1 91.1 0.0 8.9
19 36 47 051 1 *Bania Para 138 0.0 98.6 1.4 95.7 97.8 0.0 2.2
19 36 47 185 1 *Chandra 305 0.0 93.4 6.6 80.3 97.7 0.7 1.6
19 36 47 200 1 *Char Chair Para 306 1.0 99.0 0.0 87.9 100.0 0.0 0.0
19 36 47 200 01 1 Bhati Char Para 67 1.5 98.5 0.0 82.1 100.0 0.0 0.0
19 36 47 200 02 1 Char Chara Para 239 0.8 99.2 0.0 89.5 100.0 0.0 0.0
19 36 47 233 1 *Char Raypur 122 2.5 13.9 83.6 95.1 97.5 0.0 2.5
19 36 47 280 1 *Dakshin Chander Char 140 0.0 100.0 0.0 89.3 100.0 0.0 0.0
19 36 47 375 1 *Dhitpur 203 2.0 96.6 1.5 99.0 98.5 0.5 1.0
19 36 47 411 1 *Gailar Char 196 4.6 95.4 0.0 99.5 99.0 0.0 1.0
19 36 47 437 1 *Uttar Gopchar 220 5.0 95.0 0.0 98.6 97.7 1.4 0.9
19 36 47 492 1 *Jinglatali 1317 0.3 88.2 11.5 95.0 98.0 1.6 0.4
19 36 47 492 01 1 Hatkhola 52 0.0 100.0 0.0 96.2 100.0 0.0 0.0
19 36 47 492 02 1 Itakhola 231 0.0 100.0 0.0 97.4 92.6 6.9 0.4
19 36 47 492 03 1 Kalyanpur 69 0.0 100.0 0.0 88.4 100.0 0.0 0.0
19 36 47 492 04 1 Jinglatali 965 0.4 83.9 15.6 94.8 99.1 0.5 0.4
19 36 47 823 1 *Ratanpur 239 2.1 97.1 0.8 95.8 99.6 0.0 0.4
19 36 47 830 1 *Raypur 398 0.0 98.7 1.3 85.4 95.2 2.8 2.0
19 36 47 830 01 1 Raypur Bazar 4 0.0 100.0 0.0 100.0 50.0 50.0 0.0
19 36 47 830 02 1 Raypur 382 0.0 98.7 1.3 88.0 95.5 2.4 2.1
19 36 47 830 03 1 Bahar 12 0.0 100.0 0.0 0.0 100.0 0.0 0.0
19 36 51 Gauripur Union Total 6227 11.4 85.7 2.9 94.3 71.0 27.1 1.8
19 36 51 298 1 *Dakshin Haripur 338 6.5 78.1 15.4 97.3 90.2 5.3 4.4
19 36 51 444 1 *Gauripur 1130 9.6 86.3 4.2 97.8 66.5 32.0 1.5
RMO: 1 = Rural, 2 = Urban and 3 = Other Urban Page 75 of 162

Tap Tube-Well Other Owned Rented Rent free
2 3 4 5 6 7 8 9 10
MZ /
MHVill RMO
1
Table C-15: Distribution of General Households by Source of Drinking Water, Electricity Connection and Housing Tenancy Status, by Residence
and Community
Administrative Unit
Residence
Community
Number of
Households
Source of Drinking Water (%) Electricity
Connection
(%)
Housing Tenancy (%)
ZL UZUN /
WA
19 36 51 444 01 1 Gauripur 361 1.1 90.6 8.3 96.4 90.9 7.2 1.9
19 36 51 444 02 1 Maitharkandi 207 24.2 75.8 0.0 96.1 60.9 39.1 0.0
19 36 51 444 03 1 Hat Chandina 330 13.9 85.8 0.3 99.7 34.2 63.3 2.4
19 36 51 444 04 1 Lakshmipur 232 3.4 89.7 6.9 98.7 79.3 19.8 0.9
19 36 51 596 1 *Nayagaon(Gauripur Bazar) 941 41.7 58.2 0.1 94.7 18.4 80.2 1.4
19 36 51 747 1 *Olan Para 490 0.2 99.6 0.2 94.3 98.0 1.4 0.6
19 36 51 747 01 1 Olan Para 251 0.4 99.2 0.4 91.2 98.8 1.2 0.0
19 36 51 747 02 1 Char Ramnagar 48 0.0 100.0 0.0 100.0 95.8 4.2 0.0
19 36 51 747 03 1 Ramnagar 191 0.0 100.0 0.0 96.9 97.4 1.0 1.6
19 36 51 772 1 *Pennai 3328 5.6 91.9 2.5 92.7 81.6 16.5 2.0
19 36 51 772 01 1 Char Mahammada 291 0.0 95.2 4.8 94.8 99.3 0.0 0.7
19 36 51 772 02 1 Hareala 170 2.4 94.7 2.9 71.8 99.4 0.0 0.6
19 36 51 772 03 1 Dayea Para 278 0.0 100.0 0.0 87.1 98.2 1.4 0.4
19 36 51 772 04 1 Paschim Hogalia 221 0.0 99.1 0.9 95.9 90.0 7.7 2.3
19 36 51 772 05 1 Purba Hogalia 148 0.0 100.0 0.0 99.3 37.2 60.1 2.7
19 36 51 772 06 1 Sarkarpur 578 0.3 96.5 3.1 90.1 93.1 5.5 1.4
19 36 51 772 07 1 Pennai 916 8.3 89.0 2.7 96.3 80.8 17.9 1.3
19 36 51 772 08 1 Sulpa Pennai 293 7.8 86.3 5.8 88.1 71.0 21.5 7.5
19 36 51 772 09 1 Angawara 433 18.9 80.8 0.2 98.2 56.4 41.3 2.3
19 36 64 Maruka Union Total 3894 0.4 91.8 7.8 50.5 98.6 0.8 0.6
19 36 64 127 1 *Bharan Para 278 1.1 90.6 8.3 1.1 99.3 0.0 0.7
19 36 64 174 1 *Chakratala 321 0.0 68.8 31.2 30.2 95.3 4.0 0.6
19 36 64 247 1 *Chasai 389 0.3 93.8 5.9 70.4 100.0 0.0 0.0
19 36 64 255 1 *Chhaydona 42 0.0 100.0 0.0 38.1 100.0 0.0 0.0
19 36 64 269 1 *Chinamura 273 1.1 98.5 0.4 70.3 98.2 1.1 0.7
19 36 64 295 1 *Dakshin Gopalpur 74 0.0 100.0 0.0 100.0 100.0 0.0 0.0
19 36 64 302 1 *Dakshin Krishnapur 241 0.0 86.3 13.7 58.1 95.9 3.3 0.8
19 36 64 302 01 1 Krishnapur 43 0.0 81.4 18.6 90.7 97.7 0.0 2.3
19 36 64 302 02 1 Uzarkhola 198 0.0 87.4 12.6 51.0 95.5 4.0 0.5
RMO: 1 = Rural, 2 = Urban and 3 = Other Urban Page 76 of 162

Tap Tube-Well Other Owned Rented Rent free
2 3 4 5 6 7 8 9 10
MZ /
MHVill RMO
1
Table C-15: Distribution of General Households by Source of Drinking Water, Electricity Connection and Housing Tenancy Status, by Residence
and Community
Administrative Unit
Residence
Community
Number of
Households
Source of Drinking Water (%) Electricity
Connection
(%)
Housing Tenancy (%)
ZL UZUN /
WA
19 36 64 360 1 *Dhaneswar 300 0.0 99.7 0.3 70.0 100.0 0.0 0.0
19 36 64 371 1 *Dharibon 256 0.4 77.0 22.7 73.0 99.6 0.4 0.0
19 36 64 379 1 *Dighalgaon 46 0.0 56.5 43.5 58.7 100.0 0.0 0.0
19 36 64 561 1 *Katara Para 170 2.9 96.5 0.6 71.8 98.2 0.0 1.8
19 36 64 583 1 *Khamar Para 105 0.0 97.1 2.9 40.0 97.1 0.0 2.9
19 36 64 641 1 *Mangair 138 0.0 97.1 2.9 20.3 98.6 0.0 1.4
19 36 64 648 1 *Maruka 550 0.7 92.5 6.7 34.4 99.5 0.4 0.2
19 36 64 714 1 *Nasipur 135 0.0 100.0 0.0 74.8 95.6 4.4 0.0
19 36 64 750 1 *Palpara 320 0.0 100.0 0.0 11.9 99.7 0.0 0.3
19 36 64 841 1 *Sapara(Part) 256 0.0 100.0 0.0 88.7 98.0 0.0 2.0
19 36 73 Mohammadpur Paschim Union Total 4185 0.4 89.4 10.2 64.9 96.1 2.1 1.8
19 36 73 021 1 *Atipara 385 0.0 90.4 9.6 46.8 98.4 0.3 1.3
19 36 73 109 1 *Behanhatta 140 2.1 97.9 0.0 68.6 68.6 29.3 2.1
19 36 73 244 1 *Charak Khola 274 0.0 60.6 39.4 76.6 98.9 0.0 1.1
19 36 73 328 1 *Darazkhola 115 0.0 63.5 36.5 57.4 97.4 1.7 0.9
19 36 73 389 1 *Doghar 124 0.8 88.7 10.5 89.5 100.0 0.0 0.0
19 36 73 546 1 *Kapariabari 30 0.0 100.0 0.0 46.7 100.0 0.0 0.0
19 36 73 579 1 *Khala Para 39 0.0 97.4 2.6 51.3 100.0 0.0 0.0
19 36 73 602 1 *Chhota Lakshmipur 169 0.0 100.0 0.0 82.8 90.5 4.1 5.3
19 36 73 626 1 *Malakhola 486 1.0 71.2 27.8 60.5 99.2 0.2 0.6
19 36 73 649 1 *Bara Mohammadpur 1175 0.4 95.6 4.0 55.9 94.0 2.0 3.9
19 36 73 649 01 1 Uttar Mohammadpur 527 0.8 90.5 8.7 62.6 94.7 3.8 1.5
19 36 73 649 02 1 Dhakur Pukurpar 63 0.0 100.0 0.0 6.3 98.4 0.0 1.6
19 36 73 649 03 1 Dakshin Mohammadpur 585 0.2 99.7 0.2 55.2 93.0 0.7 6.3
19 36 73 656 1 *Maurabari 179 0.0 100.0 0.0 89.4 99.4 0.0 0.6
19 36 73 707 1 *Narikeltala 113 0.9 85.8 13.3 88.5 95.6 2.7 1.8
19 36 73 769 1 *Paschim Malay 48 0.0 95.8 4.2 93.8 100.0 0.0 0.0
19 36 73 776 1 *Pepaiakandi 357 0.0 100.0 0.0 81.8 98.6 1.4 0.0
19 36 73 798 1 *Purba Malay 92 1.1 94.6 4.3 92.4 97.8 2.2 0.0
RMO: 1 = Rural, 2 = Urban and 3 = Other Urban Page 77 of 162

Tap Tube-Well Other Owned Rented Rent free
2 3 4 5 6 7 8 9 10
MZ /
MHVill RMO
1
Table C-15: Distribution of General Households by Source of Drinking Water, Electricity Connection and Housing Tenancy Status, by Residence
and Community
Administrative Unit
Residence
Community
Number of
Households
Source of Drinking Water (%) Electricity
Connection
(%)
Housing Tenancy (%)
ZL UZUN /
WA
19 36 73 827 1 *Roypur 237 0.0 100.0 0.0 34.2 100.0 0.0 0.0
19 36 73 856 1 *Sayestanagar 129 0.0 100.0 0.0 93.0 98.4 0.0 1.6
19 36 73 900 1 *Surerbag 93 1.1 74.2 24.7 50.5 98.9 0.0 1.1
19 36 82 Daulatpur (Purba Panchgachhia) Total 3783 0.8 88.1 11.1 80.5 98.7 0.7 0.6
19 36 82 040 1 *Baliardron 97 2.1 97.9 0.0 88.7 100.0 0.0 0.0
19 36 82 240 1 *Char Shahapur (Baluchar) 200 0.0 99.5 0.5 98.0 100.0 0.0 0.0
19 36 82 313 1 *Dakshin Narayandia 1909 0.6 82.2 17.2 86.0 99.3 0.2 0.5
19 36 82 313 01 1 Brahmandia 84 0.0 42.9 57.1 42.9 100.0 0.0 0.0
19 36 82 313 05 1 Sabahan 181 0.6 71.3 28.2 79.6 99.4 0.6 0.0
19 36 82 313 06 1 Maithardia 154 1.3 42.2 56.5 89.0 99.4 0.6 0.0
19 36 82 313 07 1 Mukundi 74 0.0 100.0 0.0 100.0 98.6 0.0 1.4
19 36 82 313 08 1 Sadardia 174 0.0 99.4 0.6 79.9 99.4 0.0 0.6
19 36 82 313 09 1 Kabi Chandradia 125 0.0 96.0 4.0 89.6 100.0 0.0 0.0
19 36 82 313 10 1 Ujhardia 13 0.0 92.3 7.7 100.0 100.0 0.0 0.0
19 36 82 313 11 1 Sambhurdia 177 1.7 96.6 1.7 88.1 97.7 1.1 1.1
19 36 82 313 12 1 Baishardia 29 3.4 82.8 13.8 79.3 96.6 0.0 3.4
19 36 82 313 13 1 Bhauria 119 0.0 90.8 9.2 72.3 98.3 0.0 1.7
19 36 82 313 14 1 Ketundi 295 0.0 76.9 23.1 92.9 99.7 0.0 0.3
19 36 82 313 15 1 Narandia 256 1.2 93.0 5.9 91.0 100.0 0.0 0.0
19 36 82 313 16 1 Rafardia 84 1.2 98.8 0.0 95.2 98.8 0.0 1.2
19 36 82 313 17 1 Manikdi 71 0.0 50.7 49.3 85.9 98.6 0.0 1.4
19 36 82 313 18 1 Paikar Char 73 0.0 100.0 0.0 100.0 100.0 0.0 0.0
19 36 82 349 1 *Daulatpur 337 0.9 91.7 7.4 94.7 99.1 0.3 0.6
19 36 82 349 01 1 Daulatpur 182 0.5 85.7 13.7 97.8 98.4 0.5 1.1
19 36 82 349 02 1 Denardia 46 4.3 95.7 0.0 95.7 100.0 0.0 0.0
19 36 82 349 03 1 Nayakandi 43 0.0 100.0 0.0 83.7 100.0 0.0 0.0
19 36 82 349 04 1 Chowdhury Para 66 0.0 100.0 0.0 92.4 100.0 0.0 0.0
19 36 82 433 1 *Golmukandi 3 0.0 100.0 0.0 0.0 100.0 0.0 0.0
19 36 82 539 1 *Kanachoa 281 0.0 99.6 0.4 17.8 92.5 7.1 0.4
RMO: 1 = Rural, 2 = Urban and 3 = Other Urban Page 78 of 162
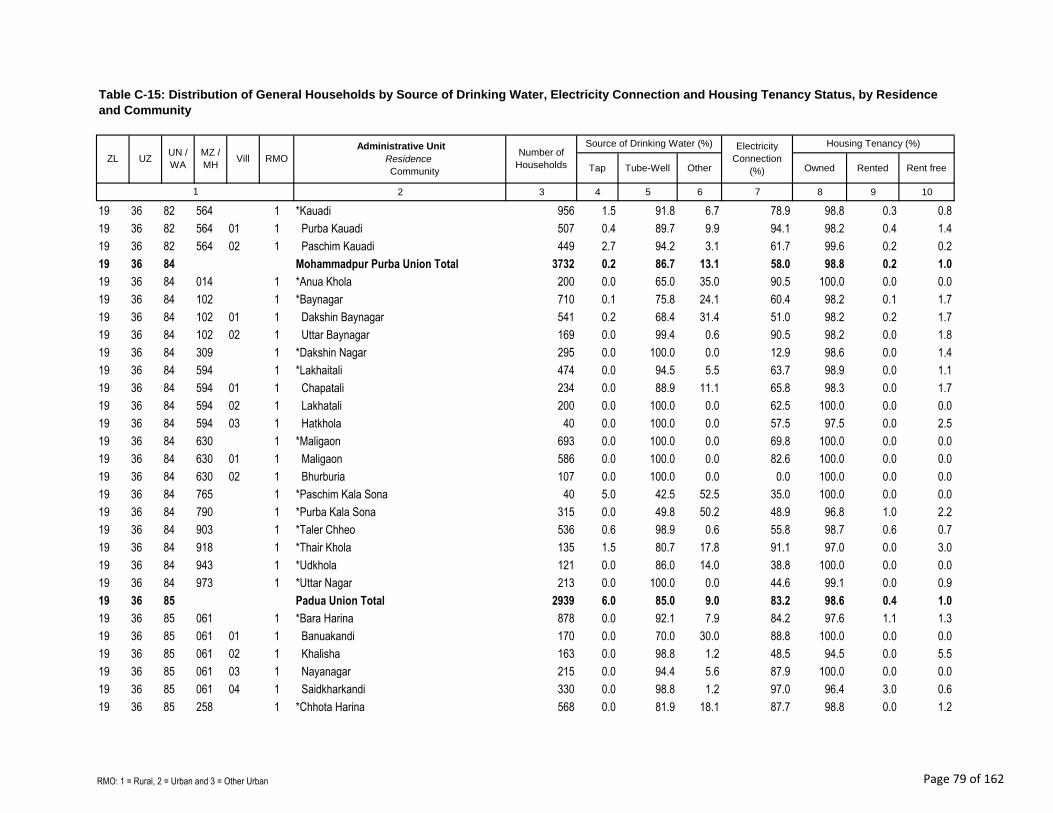
Tap Tube-Well Other Owned Rented Rent free
2 3 4 5 6 7 8 9 10
MZ /
MHVill RMO
1
Table C-15: Distribution of General Households by Source of Drinking Water, Electricity Connection and Housing Tenancy Status, by Residence
and Community
Administrative Unit
Residence
Community
Number of
Households
Source of Drinking Water (%) Electricity
Connection
(%)
Housing Tenancy (%)
ZL UZUN /
WA
19 36 82 564 1 *Kauadi 956 1.5 91.8 6.7 78.9 98.8 0.3 0.8
19 36 82 564 01 1 Purba Kauadi 507 0.4 89.7 9.9 94.1 98.2 0.4 1.4
19 36 82 564 02 1 Paschim Kauadi 449 2.7 94.2 3.1 61.7 99.6 0.2 0.2
19 36 84 Mohammadpur Purba Union Total 3732 0.2 86.7 13.1 58.0 98.8 0.2 1.0
19 36 84 014 1 *Anua Khola 200 0.0 65.0 35.0 90.5 100.0 0.0 0.0
19 36 84 102 1 *Baynagar 710 0.1 75.8 24.1 60.4 98.2 0.1 1.7
19 36 84 102 01 1 Dakshin Baynagar 541 0.2 68.4 31.4 51.0 98.2 0.2 1.7
19 36 84 102 02 1 Uttar Baynagar 169 0.0 99.4 0.6 90.5 98.2 0.0 1.8
19 36 84 309 1 *Dakshin Nagar 295 0.0 100.0 0.0 12.9 98.6 0.0 1.4
19 36 84 594 1 *Lakhaitali 474 0.0 94.5 5.5 63.7 98.9 0.0 1.1
19 36 84 594 01 1 Chapatali 234 0.0 88.9 11.1 65.8 98.3 0.0 1.7
19 36 84 594 02 1 Lakhatali 200 0.0 100.0 0.0 62.5 100.0 0.0 0.0
19 36 84 594 03 1 Hatkhola 40 0.0 100.0 0.0 57.5 97.5 0.0 2.5
19 36 84 630 1 *Maligaon 693 0.0 100.0 0.0 69.8 100.0 0.0 0.0
19 36 84 630 01 1 Maligaon 586 0.0 100.0 0.0 82.6 100.0 0.0 0.0
19 36 84 630 02 1 Bhurburia 107 0.0 100.0 0.0 0.0 100.0 0.0 0.0
19 36 84 765 1 *Paschim Kala Sona 40 5.0 42.5 52.5 35.0 100.0 0.0 0.0
19 36 84 790 1 *Purba Kala Sona 315 0.0 49.8 50.2 48.9 96.8 1.0 2.2
19 36 84 903 1 *Taler Chheo 536 0.6 98.9 0.6 55.8 98.7 0.6 0.7
19 36 84 918 1 *Thair Khola 135 1.5 80.7 17.8 91.1 97.0 0.0 3.0
19 36 84 943 1 *Udkhola 121 0.0 86.0 14.0 38.8 100.0 0.0 0.0
19 36 84 973 1 *Uttar Nagar 213 0.0 100.0 0.0 44.6 99.1 0.0 0.9
19 36 85 Padua Union Total 2939 6.0 85.0 9.0 83.2 98.6 0.4 1.0
19 36 85 061 1 *Bara Harina 878 0.0 92.1 7.9 84.2 97.6 1.1 1.3
19 36 85 061 01 1 Banuakandi 170 0.0 70.0 30.0 88.8 100.0 0.0 0.0
19 36 85 061 02 1 Khalisha 163 0.0 98.8 1.2 48.5 94.5 0.0 5.5
19 36 85 061 03 1 Nayanagar 215 0.0 94.4 5.6 87.9 100.0 0.0 0.0
19 36 85 061 04 1 Saidkharkandi 330 0.0 98.8 1.2 97.0 96.4 3.0 0.6
19 36 85 258 1 *Chhota Harina 568 0.0 81.9 18.1 87.7 98.8 0.0 1.2
RMO: 1 = Rural, 2 = Urban and 3 = Other Urban Page 79 of 162

Tap Tube-Well Other Owned Rented Rent free
2 3 4 5 6 7 8 9 10
MZ /
MHVill RMO
1
Table C-15: Distribution of General Households by Source of Drinking Water, Electricity Connection and Housing Tenancy Status, by Residence
and Community
Administrative Unit
Residence
Community
Number of
Households
Source of Drinking Water (%) Electricity
Connection
(%)
Housing Tenancy (%)
ZL UZUN /
WA
19 36 85 258 01 1 Padua 319 0.0 93.7 6.3 87.8 100.0 0.0 0.0
19 36 85 258 02 1 Satani 49 0.0 83.7 16.3 79.6 95.9 0.0 4.1
19 36 85 258 03 1 Sadarkandi 200 0.0 62.5 37.5 89.5 97.5 0.0 2.5
19 36 85 306 1 *Dakshin Mahishmari 314 0.0 100.0 0.0 35.0 99.7 0.0 0.3
19 36 85 510 1 *Khaiyakhali 70 2.9 24.3 72.9 88.6 98.6 0.0 1.4
19 36 85 674 1 *Mollakandi 94 0.0 100.0 0.0 100.0 97.9 0.0 2.1
19 36 85 721 1 *Nischintapur 238 0.4 98.7 0.8 94.5 98.7 0.4 0.8
19 36 85 721 01 1 Nischintapur 160 0.6 98.8 0.6 97.5 98.1 0.6 1.3
19 36 85 721 02 1 Manairkandi 78 0.0 98.7 1.3 88.5 100.0 0.0 0.0
19 36 85 816 1 *Ramaitkandi(Part) 306 55.9 39.9 4.2 88.9 99.0 0.0 1.0
19 36 85 816 01 1 Bhangar Char 80 0.0 92.5 7.5 83.8 100.0 0.0 0.0
19 36 85 816 02 1 Ramaitkandi 150 83.3 16.7 0.0 99.3 98.7 0.0 1.3
19 36 85 816 03 1 Faterkandi 76 60.5 30.3 9.2 73.7 98.7 0.0 1.3
19 36 85 878 1 *Sonakanda 188 0.0 94.1 5.9 94.7 98.9 0.0 1.1
19 36 85 947 1 *Ujhara 283 1.1 93.3 5.7 94.3 100.0 0.0 0.0
19 36 86 Panchgachhia Paschim Union Total 2875 0.3 96.8 2.9 59.2 99.2 0.0 0.8
19 36 86 105 1 *Bazarkhola 609 0.2 91.5 8.4 53.0 99.8 0.0 0.2
19 36 86 196 1 *Char Bazarkhola 25 0.0 100.0 0.0 0.0 100.0 0.0 0.0
19 36 86 448 1 *Harina Bhabanipur 469 0.4 99.6 0.0 32.0 99.8 0.0 0.2
19 36 86 448 01 1 Harina Bhabanipur 255 0.0 100.0 0.0 12.2 100.0 0.0 0.0
19 36 86 448 02 1 Harina Bazarkhola 214 0.9 99.1 0.0 55.6 99.5 0.0 0.5
19 36 86 754 1 *Panchgachhia 627 0.5 98.4 1.1 85.5 97.4 0.2 2.4
19 36 86 754 01 1 Nalchak 167 0.0 99.4 0.6 93.4 97.6 0.0 2.4
19 36 86 754 02 1 Panchgachhia 179 0.6 99.4 0.0 61.5 98.9 0.6 0.6
19 36 86 754 03 1 Sreekantadia 179 0.6 96.1 3.4 100.0 98.3 0.0 1.7
19 36 86 754 04 1 Sethardia 102 1.0 99.0 0.0 89.2 93.1 0.0 6.9
19 36 86 889 1 *Sreeroyer Char 279 0.0 98.9 1.1 64.9 99.6 0.0 0.4
19 36 86 889 01 1 Sreeroyer Char 239 0.0 98.7 1.3 59.0 99.6 0.0 0.4
19 36 86 889 02 1 Kirtankhola 40 0.0 100.0 0.0 100.0 100.0 0.0 0.0
RMO: 1 = Rural, 2 = Urban and 3 = Other Urban Page 80 of 162

Tap Tube-Well Other Owned Rented Rent free
2 3 4 5 6 7 8 9 10
MZ /
MHVill RMO
1
Table C-15: Distribution of General Households by Source of Drinking Water, Electricity Connection and Housing Tenancy Status, by Residence
and Community
Administrative Unit
Residence
Community
Number of
Households
Source of Drinking Water (%) Electricity
Connection
(%)
Housing Tenancy (%)
ZL UZUN /
WA
19 36 86 922 1 *Thetalia 332 0.6 96.1 3.3 40.4 99.1 0.0 0.9
19 36 86 922 01 1 Thetalia 173 0.6 93.6 5.8 9.8 99.4 0.0 0.6
19 36 86 922 02 1 Nayachar 159 0.6 98.7 0.6 73.6 98.7 0.0 1.3
19 36 86 936 1 *Tulatali 534 0.2 97.6 2.2 70.6 99.6 0.0 0.4
19 36 86 936 01 1 Tulatali 350 0.3 97.4 2.3 90.3 99.7 0.0 0.3
19 36 86 936 02 1 Jafarabad 184 0.0 97.8 2.2 33.2 99.5 0.0 0.5
19 36 90 Barapara Union Total 4049 1.3 94.2 4.5 89.6 93.9 5.7 0.4
19 36 90 010 1 *Amirabad 135 3.0 94.8 2.2 100.0 98.5 1.5 0.0
19 36 90 083 1 *Baraikandi 87 1.1 81.6 17.2 47.1 97.7 2.3 0.0
19 36 90 087 1 *Bara Para 178 0.0 99.4 0.6 84.3 88.2 10.7 1.1
19 36 90 112 1 *Bekisat Para 56 0.0 87.5 12.5 98.2 98.2 0.0 1.8
19 36 90 171 1 *Chair Para 85 0.0 88.2 11.8 94.1 94.1 4.7 1.2
19 36 90 182 1 *Chandipasha 65 1.5 52.3 46.2 96.9 100.0 0.0 0.0
19 36 90 395 1 *Durgapur 95 4.2 95.8 0.0 98.9 98.9 1.1 0.0
19 36 90 466 1 *Ichhapura 628 2.2 97.1 0.6 88.2 99.4 0.5 0.2
19 36 90 466 01 1 Ichhapura 567 2.5 97.2 0.4 92.4 99.3 0.5 0.2
19 36 90 466 02 1 Manikkandi 61 0.0 96.7 3.3 49.2 100.0 0.0 0.0
19 36 90 477 1 *Jagir Chandipasha 120 0.8 99.2 0.0 95.0 100.0 0.0 0.0
19 36 90 543 1 *Kanara 241 3.7 95.0 1.2 90.5 94.2 4.6 1.2
19 36 90 820 1 *Ranga Shimulia 265 0.0 99.6 0.4 94.7 100.0 0.0 0.0
19 36 90 852 1 *Satpara 1085 1.0 92.7 6.3 90.2 82.3 17.1 0.6
19 36 90 852 01 1 Satpara 480 0.2 97.3 2.5 86.3 89.0 11.0 0.0
19 36 90 852 02 1 Sabebad 93 1.1 98.9 0.0 98.9 81.7 15.1 3.2
19 36 90 852 03 1 Shola Para 512 1.8 87.3 10.9 92.4 76.2 23.2 0.6
19 36 90 892 1 *Sukipur 656 0.0 97.6 2.4 90.5 99.5 0.2 0.3
19 36 90 892 01 1 Sukipur 443 0.0 96.6 3.4 89.8 99.8 0.0 0.2
19 36 90 892 02 1 Dakkhola 111 0.0 99.1 0.9 87.4 100.0 0.0 0.0
19 36 90 892 03 1 Shibpur 102 0.0 100.0 0.0 97.1 98.0 1.0 1.0
19 36 90 925 1 *Tinchita 353 2.0 90.9 7.1 85.0 100.0 0.0 0.0
RMO: 1 = Rural, 2 = Urban and 3 = Other Urban Page 81 of 162

Tap Tube-Well Other Owned Rented Rent free
2 3 4 5 6 7 8 9 10
MZ /
MHVill RMO
1
Table C-15: Distribution of General Households by Source of Drinking Water, Electricity Connection and Housing Tenancy Status, by Residence
and Community
Administrative Unit
Residence
Community
Number of
Households
Source of Drinking Water (%) Electricity
Connection
(%)
Housing Tenancy (%)
ZL UZUN /
WA
19 36 94 Sundalpur Union Total 4685 3.1 96.0 0.9 91.3 88.5 10.2 1.3
19 36 94 120 1 *Bhagalpur 254 8.7 91.3 0.0 94.1 58.7 40.9 0.4
19 36 94 156 1 *Boilaldi 46 0.0 100.0 0.0 100.0 100.0 0.0 0.0
19 36 94 204 1 *Char Goali 129 0.0 100.0 0.0 97.7 98.4 0.0 1.6
19 36 94 266 1 *Chhota Mohammadpur 1226 6.0 93.9 0.2 95.4 75.7 22.0 2.3
19 36 94 266 01 1 Chhota Mohammadpur 621 0.3 99.4 0.3 95.7 98.7 0.2 1.1
19 36 94 266 02 1 Chandgaon 554 12.8 87.2 0.0 96.4 47.7 48.6 3.8
19 36 94 266 03 1 Rajar Hat 51 0.0 100.0 0.0 82.4 100.0 0.0 0.0
19 36 94 357 1 *Dhakargaon 627 1.1 98.9 0.0 94.1 94.4 4.9 0.6
19 36 94 422 1 *Gayaspur 653 1.5 95.6 2.9 91.6 97.9 1.1 1.1
19 36 94 422 01 1 Gayaspur 375 2.7 92.3 5.1 94.4 98.7 0.5 0.8
19 36 94 422 02 1 Mudafardi 146 0.0 100.0 0.0 96.6 98.6 1.4 0.0
19 36 94 422 03 1 Hamirdi 132 0.0 100.0 0.0 78.0 94.7 2.3 3.0
19 36 94 576 1 *Goalitin Para 777 2.6 95.4 2.1 86.6 99.4 0.3 0.4
19 36 94 576 01 1 Chakamkhola 136 1.5 90.4 8.1 83.8 99.3 0.0 0.7
19 36 94 576 02 1 Thakuramir Dighi 50 0.0 100.0 0.0 98.0 98.0 2.0 0.0
19 36 94 576 03 1 Bara Goali 471 3.8 95.5 0.6 88.3 99.6 0.0 0.4
19 36 94 576 04 1 Dari Goali 120 0.0 98.3 1.7 78.3 99.2 0.8 0.0
19 36 94 896 1 *Sundalpur 973 1.3 98.0 0.6 85.9 91.9 6.5 1.6
19 36 94 896 01 1 Sundalpur 679 1.8 97.5 0.7 82.8 90.9 7.4 1.8
19 36 94 896 02 1 Daspara 294 0.3 99.3 0.3 93.2 94.2 4.4 1.4
19 40 Debidwar Upazila Total 82453 2.2 93.9 4.0 69.4 94.2 4.9 0.9
19 40 1 Debidwar Upazila 70642 0.7 94.9 4.3 67.0 97.4 1.7 0.9
19 40 2 Debidwar Upazila 11811 10.6 87.6 1.8 84.0 74.8 24.2 1.1
Debidwar Paurashava
19 40 01 Ward No-01 Total 554 0.2 76.7 23.1 69.0 96.0 0.5 3.4
19 40 01 656 2 *Marichakandi 509 0.2 76.8 23.0 68.2 98.2 0.6 1.2
19 40 01 990 2 *Rajakhar Char 45 0.0 75.6 24.4 77.8 71.1 0.0 28.9
19 40 02 Ward No-02 Total 1621 0.8 98.3 0.9 85.2 92.3 6.0 1.7
RMO: 1 = Rural, 2 = Urban and 3 = Other Urban Page 82 of 162

Tap Tube-Well Other Owned Rented Rent free
2 3 4 5 6 7 8 9 10
MZ /
MHVill RMO
1
Table C-15: Distribution of General Households by Source of Drinking Water, Electricity Connection and Housing Tenancy Status, by Residence
and Community
Administrative Unit
Residence
Community
Number of
Households
Source of Drinking Water (%) Electricity
Connection
(%)
Housing Tenancy (%)
ZL UZUN /
WA
19 40 02 018 2 *West Aliabad 195 0.5 99.5 0.0 95.9 93.8 5.6 0.5
19 40 02 190 2 *Bhinglabari 1078 0.8 97.9 1.3 84.7 94.9 3.1 2.0
19 40 02 670 2 *Mirzanagar 348 0.9 99.1 0.0 80.7 83.3 15.5 1.1
19 40 03 Ward No-03 Total 862 0.1 94.5 5.3 48.8 99.0 0.6 0.5
19 40 03 987 2 *Paschim Fatehabad 862 0.1 94.5 5.3 48.8 99.0 0.6 0.5
19 40 04 Ward No-04 Total 1028 0.3 99.2 0.5 82.8 97.3 1.6 1.2
19 40 04 119 2 *Bara Alampur 722 0.4 98.9 0.7 84.2 97.1 2.1 0.8
19 40 04 218 2 *Binoypar 306 0.0 100.0 0.0 79.4 97.7 0.3 2.0
19 40 05 Ward No-05 Total 3100 27.6 72.4 0.0 97.4 37.7 61.4 0.9
19 40 05 217 2 *Bania Para 287 23.7 76.3 0.0 93.7 48.8 51.2 0.0
19 40 05 317 2 *Debidwar 2759 28.6 71.4 0.0 98.2 35.5 63.5 1.0
19 40 05 973 2 *Masuabad (South Gumti) 54 0.0 100.0 0.0 77.8 94.4 3.7 1.9
19 40 06 Ward No-06 Total 639 0.2 99.8 0.0 62.9 97.3 1.4 1.3
19 40 06 087 2 *Balibari 195 0.0 100.0 0.0 70.3 98.5 0.0 1.5
19 40 06 117 2 *Hamlabari 331 0.3 99.7 0.0 58.6 97.3 2.7 0.0
19 40 06 141 2 *Barera (Part) Char 113 0.0 100.0 0.0 62.8 95.6 0.0 4.4
19 40 07 Ward No-07 Total 688 0.3 99.7 0.0 81.8 97.8 1.2 1.0
19 40 07 190 2 *Sail Char 132 1.5 98.5 0.0 72.0 97.7 0.0 2.3
19 40 07 211 2 *Bijali Panjar 189 0.0 100.0 0.0 78.3 100.0 0.0 0.0
19 40 07 232 2 *Champanagar 367 0.0 100.0 0.0 87.2 96.7 2.2 1.1
19 40 08 Ward No-08 Total 1804 19.6 80.3 0.2 90.9 59.6 39.6 0.7
19 40 08 197 2 *Bhoshna 267 0.4 99.6 0.0 65.2 98.5 1.1 0.4
19 40 08 275 2 *Chhota Alampur 1243 28.1 71.7 0.2 97.5 42.8 56.3 0.9
19 40 08 444 2 *Gunaighar(Part) 294 1.0 99.0 0.0 86.1 95.6 4.1 0.3
19 40 09 Ward No-09 Total 1515 1.2 97.7 1.1 83.7 92.9 6.5 0.6
19 40 09 141 2 *Barera (Part) 1350 1.3 97.4 1.3 83.5 92.1 7.3 0.6
19 40 09 762 2 *Ponara (Part) 165 0.0 100.0 0.0 85.5 98.8 0.6 0.6
19 40 10 Bara Shalghar Union Total 3367 1.1 97.2 1.6 82.1 97.6 1.7 0.7
19 40 10 021 1 *Anantapur 346 0.0 100.0 0.0 74.9 99.7 0.0 0.3
RMO: 1 = Rural, 2 = Urban and 3 = Other Urban Page 83 of 162

Tap Tube-Well Other Owned Rented Rent free
2 3 4 5 6 7 8 9 10
MZ /
MHVill RMO
1
Table C-15: Distribution of General Households by Source of Drinking Water, Electricity Connection and Housing Tenancy Status, by Residence
and Community
Administrative Unit
Residence
Community
Number of
Households
Source of Drinking Water (%) Electricity
Connection
(%)
Housing Tenancy (%)
ZL UZUN /
WA
19 40 10 127 1 *Bara Shalghar 1204 1.5 96.5 2.0 87.4 96.9 1.9 1.2
19 40 10 282 1 *Chhota Shalghar 580 2.2 95.0 2.8 69.3 99.1 0.2 0.7
19 40 10 458 1 *Haripur 77 1.3 98.7 0.0 89.6 55.8 39.0 5.2
19 40 10 486 1 *Istagram 226 2.2 97.8 0.0 90.3 99.6 0.0 0.4
19 40 10 559 1 *Purba Bhabanipur 278 0.0 100.0 0.0 97.1 99.6 0.4 0.0
19 40 10 769 1 *Prajapati 360 0.3 99.7 0.0 75.0 100.0 0.0 0.0
19 40 10 846 1 *Sanchail 296 0.0 94.9 5.1 80.7 99.3 0.7 0.0
19 40 11 Isab Pur Union Total 3573 0.8 97.2 2.0 59.8 98.9 0.5 0.6
19 40 11 375 1 *Dakshin Maheshpur 879 0.6 99.4 0.0 64.2 99.7 0.2 0.1
19 40 11 479 1 *Isabpur 1037 1.1 96.0 2.9 81.3 98.7 0.4 0.9
19 40 11 684 1 *Mugsair 647 0.0 100.0 0.0 31.4 98.1 0.5 1.4
19 40 11 740 1 *Pairangkul 187 4.8 95.2 0.0 66.8 96.8 2.1 1.1
19 40 11 771 1 *Purba Nabipur 353 0.0 100.0 0.0 94.9 99.4 0.3 0.3
19 40 11 860 1 *Shibpur 470 0.6 90.4 8.9 14.3 99.1 0.6 0.2
19 40 17 Mohan Pur Union Total 5166 0.4 95.5 4.2 61.8 98.8 0.7 0.5
19 40 17 162 1 *Baura 300 1.7 87.3 11.0 55.3 99.7 0.3 0.0
19 40 17 162 01 1 Baura 180 0.6 99.4 0.0 70.6 99.4 0.6 0.0
19 40 17 162 02 1 Gadisail 120 3.3 69.2 27.5 32.5 100.0 0.0 0.0
19 40 17 169 1 *Bhaiserkot 888 1.0 90.1 8.9 58.2 98.8 0.8 0.5
19 40 17 204 1 *Bihar Mondal 983 0.1 95.5 4.4 71.1 99.2 0.0 0.8
19 40 17 289 1 *Chhotna 912 0.0 97.1 2.9 52.6 99.2 0.0 0.8
19 40 17 289 01 1 Chhotna 743 0.0 96.5 3.5 46.3 99.3 0.0 0.7
19 40 17 289 02 1 Himitsingh 66 0.0 100.0 0.0 75.8 100.0 0.0 0.0
19 40 17 289 03 1 Noapara 103 0.0 100.0 0.0 83.5 98.1 0.0 1.9
19 40 17 338 1 *Dohaitarka 17 0.0 100.0 0.0 0.0 100.0 0.0 0.0
19 40 17 620 1 *Kuruin 674 0.1 98.2 1.6 47.6 99.6 0.1 0.3
19 40 17 677 1 *Mohanpur 773 0.4 97.7 1.9 75.5 96.1 3.6 0.3
19 40 17 677 01 1 Mohanpur 658 0.0 99.8 0.2 81.3 98.8 1.1 0.2
19 40 17 677 02 1 Dhighir Pra 115 2.6 85.2 12.2 42.6 80.9 18.3 0.9
RMO: 1 = Rural, 2 = Urban and 3 = Other Urban Page 84 of 162
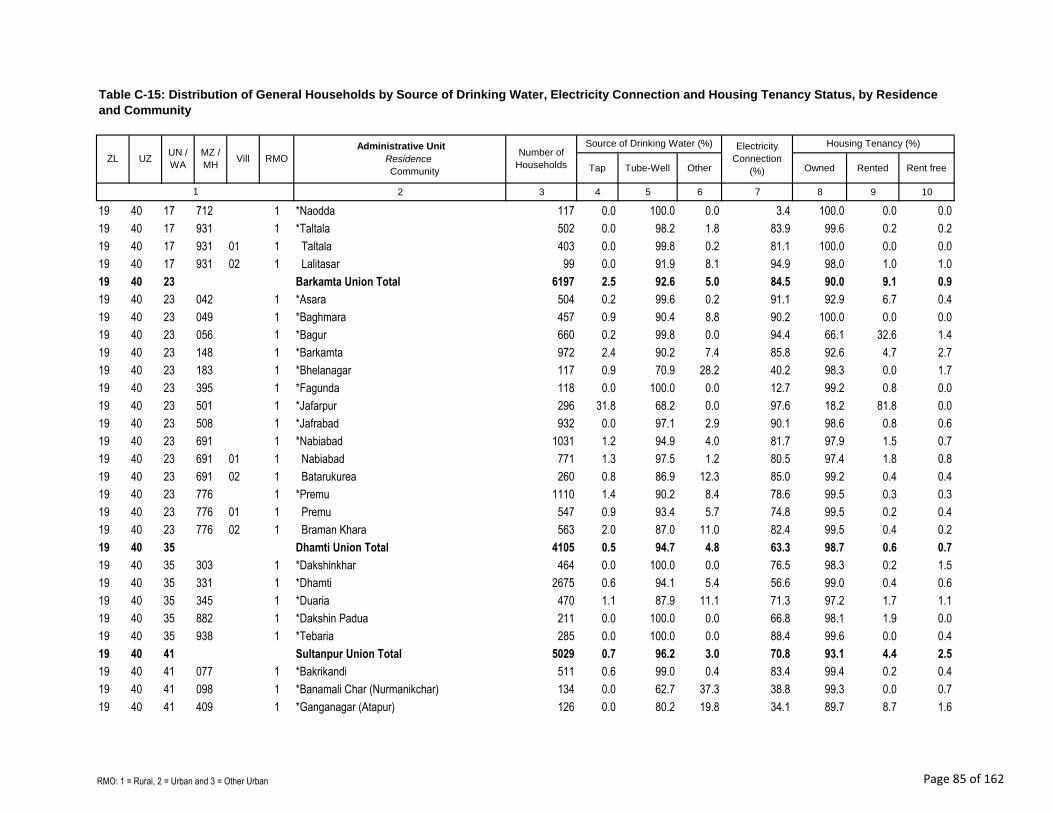
Tap Tube-Well Other Owned Rented Rent free
2 3 4 5 6 7 8 9 10
MZ /
MHVill RMO
1
Table C-15: Distribution of General Households by Source of Drinking Water, Electricity Connection and Housing Tenancy Status, by Residence
and Community
Administrative Unit
Residence
Community
Number of
Households
Source of Drinking Water (%) Electricity
Connection
(%)
Housing Tenancy (%)
ZL UZUN /
WA
19 40 17 712 1 *Naodda 117 0.0 100.0 0.0 3.4 100.0 0.0 0.0
19 40 17 931 1 *Taltala 502 0.0 98.2 1.8 83.9 99.6 0.2 0.2
19 40 17 931 01 1 Taltala 403 0.0 99.8 0.2 81.1 100.0 0.0 0.0
19 40 17 931 02 1 Lalitasar 99 0.0 91.9 8.1 94.9 98.0 1.0 1.0
19 40 23 Barkamta Union Total 6197 2.5 92.6 5.0 84.5 90.0 9.1 0.9
19 40 23 042 1 *Asara 504 0.2 99.6 0.2 91.1 92.9 6.7 0.4
19 40 23 049 1 *Baghmara 457 0.9 90.4 8.8 90.2 100.0 0.0 0.0
19 40 23 056 1 *Bagur 660 0.2 99.8 0.0 94.4 66.1 32.6 1.4
19 40 23 148 1 *Barkamta 972 2.4 90.2 7.4 85.8 92.6 4.7 2.7
19 40 23 183 1 *Bhelanagar 117 0.9 70.9 28.2 40.2 98.3 0.0 1.7
19 40 23 395 1 *Fagunda 118 0.0 100.0 0.0 12.7 99.2 0.8 0.0
19 40 23 501 1 *Jafarpur 296 31.8 68.2 0.0 97.6 18.2 81.8 0.0
19 40 23 508 1 *Jafrabad 932 0.0 97.1 2.9 90.1 98.6 0.8 0.6
19 40 23 691 1 *Nabiabad 1031 1.2 94.9 4.0 81.7 97.9 1.5 0.7
19 40 23 691 01 1 Nabiabad 771 1.3 97.5 1.2 80.5 97.4 1.8 0.8
19 40 23 691 02 1 Batarukurea 260 0.8 86.9 12.3 85.0 99.2 0.4 0.4
19 40 23 776 1 *Premu 1110 1.4 90.2 8.4 78.6 99.5 0.3 0.3
19 40 23 776 01 1 Premu 547 0.9 93.4 5.7 74.8 99.5 0.2 0.4
19 40 23 776 02 1 Braman Khara 563 2.0 87.0 11.0 82.4 99.5 0.4 0.2
19 40 35 Dhamti Union Total 4105 0.5 94.7 4.8 63.3 98.7 0.6 0.7
19 40 35 303 1 *Dakshinkhar 464 0.0 100.0 0.0 76.5 98.3 0.2 1.5
19 40 35 331 1 *Dhamti 2675 0.6 94.1 5.4 56.6 99.0 0.4 0.6
19 40 35 345 1 *Duaria 470 1.1 87.9 11.1 71.3 97.2 1.7 1.1
19 40 35 882 1 *Dakshin Padua 211 0.0 100.0 0.0 66.8 98.1 1.9 0.0
19 40 35 938 1 *Tebaria 285 0.0 100.0 0.0 88.4 99.6 0.0 0.4
19 40 41 Sultanpur Union Total 5029 0.7 96.2 3.0 70.8 93.1 4.4 2.5
19 40 41 077 1 *Bakrikandi 511 0.6 99.0 0.4 83.4 99.4 0.2 0.4
19 40 41 098 1 *Banamali Char (Nurmanikchar) 134 0.0 62.7 37.3 38.8 99.3 0.0 0.7
19 40 41 409 1 *Ganganagar (Atapur) 126 0.0 80.2 19.8 34.1 89.7 8.7 1.6
RMO: 1 = Rural, 2 = Urban and 3 = Other Urban Page 85 of 162

Tap Tube-Well Other Owned Rented Rent free
2 3 4 5 6 7 8 9 10
MZ /
MHVill RMO
1
Table C-15: Distribution of General Households by Source of Drinking Water, Electricity Connection and Housing Tenancy Status, by Residence
and Community
Administrative Unit
Residence
Community
Number of
Households
Source of Drinking Water (%) Electricity
Connection
(%)
Housing Tenancy (%)
ZL UZUN /
WA
19 40 41 529 1 *Kabilpur 154 0.0 100.0 0.0 82.5 84.4 1.3 14.3
19 40 41 543 1 *Kalamuria 1166 0.5 99.1 0.3 71.4 97.7 0.4 1.9
19 40 41 543 01 1 Kalamuria 78 0.0 100.0 0.0 3.8 97.4 2.6 0.0
19 40 41 543 02 1 Chhachra Pukuria 320 0.0 100.0 0.0 78.1 99.4 0.6 0.0
19 40 41 543 03 1 Saber Pukurpar 138 0.0 100.0 0.0 0.0 86.2 0.0 13.8
19 40 41 543 04 1 Sultanpur 568 1.1 98.2 0.7 91.7 99.3 0.2 0.5
19 40 41 543 05 1 Ram Dighirpar 62 0.0 100.0 0.0 93.5 100.0 0.0 0.0
19 40 41 613 1 *Kurchap 404 0.5 99.0 0.5 84.2 98.0 1.2 0.7
19 40 41 613 01 1 Kurchap 281 0.4 98.9 0.7 89.3 97.5 1.8 0.7
19 40 41 613 02 1 Inderpar 123 0.8 99.2 0.0 72.4 99.2 0.0 0.8
19 40 41 635 1 *Madhyanagar 338 0.0 100.0 0.0 81.7 100.0 0.0 0.0
19 40 41 783 1 *Radhanagar 443 0.7 87.8 11.5 46.5 90.3 0.0 9.7
19 40 41 811 1 *Safinagar 102 0.0 100.0 0.0 71.6 98.0 2.0 0.0
19 40 41 839 1 *Sanarnagar 740 2.4 95.0 2.6 89.6 70.8 25.4 3.8
19 40 41 839 01 1 Sanarnagar 370 0.0 100.0 0.0 81.4 63.5 31.1 5.4
19 40 41 839 02 1 Betua 137 0.0 100.0 0.0 100.0 94.9 4.4 0.7
19 40 41 839 03 1 Indarar Char 233 7.7 84.1 8.2 96.6 68.2 28.8 3.0
19 40 41 924 1 *Surpur 289 0.0 100.0 0.0 86.2 100.0 0.0 0.0
19 40 41 952 1 *Tulagaon 622 0.8 99.2 0.0 43.7 98.4 0.8 0.8
19 40 47 Fatehabad Union Total 7575 0.4 95.9 3.7 59.8 98.4 0.5 1.1
19 40 47 035 1 *Asanpur 134 0.0 98.5 1.5 62.7 98.5 0.0 1.5
19 40 47 225 1 *Bishnupur 334 0.0 100.0 0.0 32.9 99.1 0.0 0.9
19 40 47 246 1 *Chandpur 707 1.3 97.5 1.3 84.4 98.9 0.1 1.0
19 40 47 465 1 *Hetimpur 292 0.3 95.2 4.5 77.7 99.0 0.3 0.7
19 40 47 522 1 *Joypur 701 0.9 99.0 0.1 69.3 98.9 0.1 1.0
19 40 47 522 01 1 Joypur 339 0.3 99.4 0.3 86.4 97.6 0.3 2.1
19 40 47 522 02 1 Kamar Char 150 2.0 98.0 0.0 38.0 100.0 0.0 0.0
19 40 47 522 03 1 Barkanda 212 0.9 99.1 0.0 64.2 100.0 0.0 0.0
19 40 47 550 1 *Kalikapur 382 0.5 85.3 14.1 66.8 97.4 0.3 2.4
RMO: 1 = Rural, 2 = Urban and 3 = Other Urban Page 86 of 162

Tap Tube-Well Other Owned Rented Rent free
2 3 4 5 6 7 8 9 10
MZ /
MHVill RMO
1
Table C-15: Distribution of General Households by Source of Drinking Water, Electricity Connection and Housing Tenancy Status, by Residence
and Community
Administrative Unit
Residence
Community
Number of
Households
Source of Drinking Water (%) Electricity
Connection
(%)
Housing Tenancy (%)
ZL UZUN /
WA
19 40 47 550 01 1 Kalikapur 170 0.6 99.4 0.0 75.3 94.7 0.6 4.7
19 40 47 550 02 1 Noapara 212 0.5 74.1 25.5 59.9 99.5 0.0 0.5
19 40 47 578 1 *Khalilpur 329 0.3 90.3 9.4 75.7 94.8 1.8 3.3
19 40 47 592 1 *Kotna(Nababgang) 417 0.2 98.6 1.2 33.8 99.3 0.0 0.7
19 40 47 726 1 *Nurpur 388 0.0 95.4 4.6 94.8 99.0 0.0 1.0
19 40 47 774 1 *Purba Fatehabad 1292 0.2 99.8 0.1 56.0 96.5 1.9 1.6
19 40 47 780 1 *Purba Lakshmipur 468 0.6 98.5 0.9 69.7 99.1 0.0 0.9
19 40 47 818 1 *Saicha Para 1211 0.1 90.8 9.1 27.5 99.1 0.1 0.8
19 40 47 818 01 1 Saicha Para 959 0.0 96.2 3.8 19.7 99.2 0.1 0.7
19 40 47 818 02 1 Jaganathpur 252 0.4 70.2 29.4 57.1 98.8 0.0 1.2
19 40 47 910 1 *Sultanpur 570 0.4 94.7 4.9 90.2 98.9 0.4 0.7
19 40 47 973 1 *Wahedpur (Part) 350 0.3 99.1 0.6 33.1 100.0 0.0 0.0
19 40 53 Uttar Gunaighar Union Total 3808 0.6 90.0 9.5 72.6 99.2 0.3 0.4
19 40 53 070 1 *Bakasar 626 0.3 99.7 0.0 58.9 99.4 0.2 0.5
19 40 53 070 01 1 Bakasar 276 0.4 99.6 0.0 84.4 99.6 0.4 0.0
19 40 53 070 02 1 Unjuti 261 0.0 100.0 0.0 24.5 99.2 0.0 0.8
19 40 53 070 03 1 Chasharpar 89 1.1 98.9 0.0 80.9 98.9 0.0 1.1
19 40 53 105 1 *Bangori 649 1.2 96.5 2.3 77.0 99.4 0.2 0.5
19 40 53 268 1 *Chhepara 1251 0.6 75.4 24.1 74.6 99.5 0.3 0.2
19 40 53 268 01 1 Chhepara 408 0.0 67.4 32.6 59.6 99.8 0.2 0.0
19 40 53 268 02 1 Dalahash 460 1.3 83.7 15.0 76.5 99.3 0.4 0.2
19 40 53 268 03 1 Gazaria 383 0.3 73.9 25.8 88.3 99.5 0.3 0.3
19 40 53 444 1 *Gunaighar (Part) 1277 0.4 96.2 3.4 74.9 98.8 0.5 0.6
19 40 53 444 01 1 Gunaighar (Part) 1097 0.5 95.9 3.6 73.6 98.6 0.6 0.7
19 40 53 444 02 1 Rampur 180 0.0 97.8 2.2 82.8 100.0 0.0 0.0
19 40 53 804 1 *Ranpagal 5 0.0 100.0 0.0 100.0 100.0 0.0 0.0
19 40 59 Dakshin Gunaighar Union Total 4171 0.5 92.3 7.2 52.9 99.1 0.4 0.5
19 40 59 084 1 *Ballabhpur 533 0.0 99.8 0.2 36.4 99.4 0.0 0.6
19 40 59 112 1 *Bankot 287 0.3 81.5 18.1 36.6 98.6 0.0 1.4
RMO: 1 = Rural, 2 = Urban and 3 = Other Urban Page 87 of 162

Tap Tube-Well Other Owned Rented Rent free
2 3 4 5 6 7 8 9 10
MZ /
MHVill RMO
1
Table C-15: Distribution of General Households by Source of Drinking Water, Electricity Connection and Housing Tenancy Status, by Residence
and Community
Administrative Unit
Residence
Community
Number of
Households
Source of Drinking Water (%) Electricity
Connection
(%)
Housing Tenancy (%)
ZL UZUN /
WA
19 40 59 564 1 *Kansarikhola 397 0.3 76.6 23.2 36.3 100.0 0.0 0.0
19 40 59 628 1 *Madhumura 209 0.5 99.5 0.0 78.9 99.5 0.0 0.5
19 40 59 663 1 *Masikara 646 1.2 95.8 2.9 66.9 98.6 1.4 0.0
19 40 59 733 1 *Padmakot 829 0.5 88.8 10.7 56.6 98.9 0.6 0.5
19 40 59 733 01 1 Padmakot 613 0.7 86.3 13.1 57.1 98.7 0.8 0.5
19 40 59 733 02 1 Ganeshpur 216 0.0 95.8 4.2 55.1 99.5 0.0 0.5
19 40 59 762 1 *Ponara (Part) 135 0.0 72.6 27.4 80.0 98.5 0.7 0.7
19 40 59 832 1 *Saktala 307 0.0 97.7 2.3 75.2 99.0 0.7 0.3
19 40 59 959 1 *Ujanijora 828 0.7 99.0 0.2 43.4 99.3 0.1 0.6
19 40 59 959 01 1 Ujanijora 402 0.7 99.3 0.0 48.0 99.0 0.0 1.0
19 40 59 959 02 1 Ujanikandi 183 0.0 100.0 0.0 14.8 98.9 0.5 0.5
19 40 59 959 03 1 Hapurkara 243 1.2 97.9 0.8 57.2 100.0 0.0 0.0
19 40 65 Jafarganj Union Total 4986 1.1 90.7 8.3 68.2 96.7 1.8 1.5
19 40 65 028 1 *Arazinagar 40 0.0 100.0 0.0 100.0 90.0 5.0 5.0
19 40 65 063 1 *Baje Bakhar 204 0.0 100.0 0.0 12.7 99.0 0.5 0.5
19 40 65 155 1 *Barur 1004 1.2 87.5 11.3 66.7 99.7 0.2 0.1
19 40 65 155 01 1 Barur 736 0.7 87.9 11.4 58.4 100.0 0.0 0.0
19 40 65 155 02 1 Biralla 268 2.6 86.6 10.8 89.6 98.9 0.7 0.4
19 40 65 239 1 *Chandina 209 0.0 99.0 1.0 69.9 92.8 5.3 1.9
19 40 65 254 1 *Chandranagar 66 0.0 100.0 0.0 16.7 100.0 0.0 0.0
19 40 65 261 1 *Char Bakhar 593 1.0 97.0 2.0 84.8 98.1 1.0 0.8
19 40 65 301 1 *Dakshin Narayanpur 138 0.0 99.3 0.7 88.4 94.2 4.3 1.4
19 40 65 472 1 *Hossainpur 617 0.5 99.4 0.2 77.8 99.4 0.3 0.3
19 40 65 493 1 *Jafarganj 1233 1.8 76.6 21.7 66.1 90.8 4.6 4.5
19 40 65 493 01 1 Jafarganj 671 2.2 79.0 18.8 76.8 84.5 7.6 7.9
19 40 65 493 02 1 Ganganagar 340 2.1 77.9 20.0 79.7 97.6 1.8 0.6
19 40 65 493 03 1 Raghurampur 222 0.0 67.1 32.9 13.1 99.5 0.0 0.5
19 40 65 585 1 *Khayrabad 463 1.7 94.6 3.7 65.2 99.8 0.0 0.2
19 40 65 698 1 *Nagar 18 0.0 100.0 0.0 100.0 100.0 0.0 0.0
RMO: 1 = Rural, 2 = Urban and 3 = Other Urban Page 88 of 162

Tap Tube-Well Other Owned Rented Rent free
2 3 4 5 6 7 8 9 10
MZ /
MHVill RMO
1
Table C-15: Distribution of General Households by Source of Drinking Water, Electricity Connection and Housing Tenancy Status, by Residence
and Community
Administrative Unit
Residence
Community
Number of
Households
Source of Drinking Water (%) Electricity
Connection
(%)
Housing Tenancy (%)
ZL UZUN /
WA
19 40 65 755 1 *Pirojpur 204 0.0 100.0 0.0 77.9 99.5 0.0 0.5
19 40 65 852 1 *Purba Aliabad 118 1.7 98.3 0.0 92.4 96.6 2.5 0.8
19 40 65 945 1 *Tepushkarini 79 0.0 100.0 0.0 1.3 100.0 0.0 0.0
19 40 71 Elahabad Union Total 5200 0.3 97.6 2.0 66.1 98.9 0.7 0.5
19 40 71 091 1 *Bamnisar 65 0.0 100.0 0.0 83.1 100.0 0.0 0.0
19 40 71 324 1 *Dhalkhar Para 215 2.8 80.5 16.7 82.3 95.3 4.2 0.5
19 40 71 388 1 *Elahabad 1494 0.3 96.4 3.3 54.3 99.5 0.1 0.3
19 40 71 402 1 *Fultali 585 0.7 98.3 1.0 87.0 97.9 2.1 0.0
19 40 71 437 1 *Gaursar 167 0.6 98.2 1.2 63.5 96.4 0.0 3.6
19 40 71 451 1 *Harasar 80 0.0 100.0 0.0 0.0 100.0 0.0 0.0
19 40 71 536 1 *Kachisair 336 0.3 99.7 0.0 95.2 96.7 2.4 0.9
19 40 71 606 1 *Kurakhal 349 0.3 99.7 0.0 57.0 99.7 0.3 0.0
19 40 71 642 1 *Magh Puskarini 1180 0.1 99.2 0.7 69.2 99.3 0.2 0.5
19 40 71 642 01 1 Magh Puskarini 209 0.0 99.5 0.5 72.2 99.0 0.0 1.0
19 40 71 642 02 1 Mohammadpur 971 0.1 99.2 0.7 68.5 99.4 0.2 0.4
19 40 71 748 1 *Payabari 196 0.0 100.0 0.0 79.6 100.0 0.0 0.0
19 40 71 867 1 *Singarikhola 129 0.0 100.0 0.0 51.2 97.7 0.0 2.3
19 40 71 889 1 *Sreepur 137 0.0 100.0 0.0 90.5 100.0 0.0 0.0
19 40 71 896 1 *Subhapur 267 0.0 98.9 1.1 36.3 100.0 0.0 0.0
19 40 77 Rajamehar Union Total 4461 0.6 96.0 3.4 61.5 98.9 0.4 0.6
19 40 77 296 1 *Chulash 257 0.8 88.3 10.9 88.3 100.0 0.0 0.0
19 40 77 416 1 *Gobindapur 185 0.0 100.0 0.0 53.0 98.4 0.0 1.6
19 40 77 649 1 *Maricha 570 0.4 99.6 0.0 67.2 99.8 0.2 0.0
19 40 77 797 1 *Rajamehar 2738 0.8 95.4 3.8 62.1 98.6 0.5 0.8
19 40 77 797 01 1 Rajamehar 1858 0.3 98.2 1.5 60.1 98.3 0.8 0.9
19 40 77 797 02 1 Gangchar 276 2.5 71.0 26.4 65.6 98.9 0.0 1.1
19 40 77 797 03 1 Gangtiara 203 0.5 99.0 0.5 56.2 99.5 0.0 0.5
19 40 77 797 04 1 Chatuli 401 2.2 97.0 0.7 71.8 99.5 0.2 0.2
19 40 77 825 1 *Saidpur 411 0.0 100.0 0.0 70.1 99.5 0.2 0.2
RMO: 1 = Rural, 2 = Urban and 3 = Other Urban Page 89 of 162

Tap Tube-Well Other Owned Rented Rent free
2 3 4 5 6 7 8 9 10
MZ /
MHVill RMO
1
Table C-15: Distribution of General Households by Source of Drinking Water, Electricity Connection and Housing Tenancy Status, by Residence
and Community
Administrative Unit
Residence
Community
Number of
Households
Source of Drinking Water (%) Electricity
Connection
(%)
Housing Tenancy (%)
ZL UZUN /
WA
19 40 77 825 01 1 Saidpur 262 0.0 100.0 0.0 56.9 99.6 0.4 0.0
19 40 77 825 02 1 Batura 149 0.0 100.0 0.0 93.3 99.3 0.0 0.7
19 40 77 966 1 *Ukhari 300 0.0 94.0 6.0 15.7 98.7 0.7 0.7
19 40 83 Bhani Union Total 5003 0.3 98.2 1.5 79.3 98.2 0.8 0.9
19 40 83 014 1 *Asadnagar 405 0.0 100.0 0.0 77.5 99.0 0.5 0.5
19 40 83 134 1 *Barat 246 0.0 100.0 0.0 72.8 95.5 4.5 0.0
19 40 83 176 1 *Bhani 1365 0.2 95.1 4.7 80.0 98.8 0.7 0.5
19 40 83 176 01 1 Phultali 211 0.0 99.1 0.9 76.3 98.6 0.0 1.4
19 40 83 176 02 1 Itakhola 57 0.0 100.0 0.0 40.4 98.2 1.8 0.0
19 40 83 176 03 1 Burarpar 71 0.0 91.5 8.5 52.1 100.0 0.0 0.0
19 40 83 176 04 1 Tribidda 40 0.0 100.0 0.0 70.0 97.5 2.5 0.0
19 40 83 176 05 1 Kataksar 71 0.0 100.0 0.0 88.7 95.8 4.2 0.0
19 40 83 176 06 1 Bhani 679 0.4 91.3 8.2 81.4 98.8 0.7 0.4
19 40 83 176 07 1 Rampur 179 0.0 100.0 0.0 96.6 100.0 0.0 0.0
19 40 83 176 08 1 Andirpar 57 0.0 100.0 0.0 94.7 98.2 0.0 1.8
19 40 83 310 1 *Dariapur 160 0.0 100.0 0.0 79.4 98.8 0.6 0.6
19 40 83 599 1 *Khiraikandi 360 0.3 99.7 0.0 84.4 99.4 0.3 0.3
19 40 83 719 1 *Noagaon 221 0.5 99.5 0.0 81.9 99.5 0.0 0.5
19 40 83 853 1 *Shaitala 604 0.0 98.5 1.5 80.3 95.9 0.0 4.1
19 40 83 917 1 *Surjyapur 1642 0.7 99.3 0.1 78.1 98.4 1.0 0.6
19 40 83 917 01 1 Surjyapur 476 0.4 99.4 0.2 75.6 96.8 1.5 1.7
19 40 83 917 02 1 Khadghar 539 0.0 100.0 0.0 89.6 99.8 0.2 0.0
19 40 83 917 03 1 Saharpar 264 2.7 97.3 0.0 52.3 98.1 1.9 0.0
19 40 83 917 04 1 Pachrangi 133 1.5 98.5 0.0 93.2 97.0 2.3 0.8
19 40 83 917 05 1 Radhanagar 138 0.0 100.0 0.0 81.2 99.3 0.0 0.7
19 40 83 917 06 1 Baraimura 92 0.0 100.0 0.0 71.7 100.0 0.0 0.0
19 40 89 Rasulpur Union Total 4059 0.8 91.1 8.1 62.2 98.8 0.4 0.8
19 40 89 423 1 *Gopalnagar 2617 0.6 92.7 6.6 59.6 98.6 0.4 1.0
19 40 89 423 01 1 Gopalnagar 1085 0.6 98.8 0.6 49.6 99.1 0.1 0.8
RMO: 1 = Rural, 2 = Urban and 3 = Other Urban Page 90 of 162

Tap Tube-Well Other Owned Rented Rent free
2 3 4 5 6 7 8 9 10
MZ /
MHVill RMO
1
Table C-15: Distribution of General Households by Source of Drinking Water, Electricity Connection and Housing Tenancy Status, by Residence
and Community
Administrative Unit
Residence
Community
Number of
Households
Source of Drinking Water (%) Electricity
Connection
(%)
Housing Tenancy (%)
ZL UZUN /
WA
19 40 89 423 02 1 Rasulpur 1191 0.7 85.4 13.9 74.6 97.8 0.8 1.3
19 40 89 423 03 1 Jinaia 341 0.6 99.1 0.3 39.3 100.0 0.0 0.0
19 40 89 430 1 *Gopalpur 315 1.3 88.9 9.8 73.3 99.7 0.3 0.0
19 40 89 430 01 1 Gopalpur 199 0.5 85.4 14.1 62.8 100.0 0.0 0.0
19 40 89 430 02 1 Binandapur 50 6.0 94.0 0.0 88.0 98.0 2.0 0.0
19 40 89 430 03 1 Hazratpur 66 0.0 95.5 4.5 93.9 100.0 0.0 0.0
19 40 89 515 1 *Jibanpur 479 2.3 82.5 15.2 67.8 98.3 0.6 1.0
19 40 89 515 01 1 Jibanpur 371 3.0 77.4 19.7 69.3 98.9 0.0 1.1
19 40 89 515 02 1 Noakandi 108 0.0 100.0 0.0 63.0 96.3 2.8 0.9
19 40 89 571 1 *Khaiar 648 0.2 92.1 7.7 63.0 99.7 0.0 0.3
19 40 95 Subil Union Total 3942 0.3 98.6 1.1 57.9 98.9 0.1 1.0
19 40 95 007 1 *Abdullapur 825 0.0 100.0 0.0 39.3 99.0 0.2 0.7
19 40 95 007 01 1 Abdullapur 181 0.0 100.0 0.0 76.8 97.2 1.1 1.7
19 40 95 007 02 1 Jinnatpur 149 0.0 100.0 0.0 74.5 100.0 0.0 0.0
19 40 95 007 03 1 Burirpar 495 0.0 100.0 0.0 14.9 99.4 0.0 0.6
19 40 95 557 1 *Kanibil 71 0.0 100.0 0.0 74.6 100.0 0.0 0.0
19 40 95 705 1 *Narayanpur 290 2.1 97.9 0.0 85.5 98.6 0.0 1.4
19 40 95 705 01 1 Narayanpur 271 2.2 97.8 0.0 84.9 99.3 0.0 0.7
19 40 95 705 02 1 Ramnagar 19 0.0 100.0 0.0 94.7 89.5 0.0 10.5
19 40 95 894 1 *Paschim Pumpara 124 0.0 71.8 28.2 41.9 96.0 0.0 4.0
19 40 95 903 1 *Subil 920 0.0 100.0 0.0 30.0 98.2 0.2 1.6
19 40 95 903 01 1 Subil 581 0.0 100.0 0.0 33.7 98.1 0.3 1.5
19 40 95 903 02 1 Raghabpur 339 0.0 100.0 0.0 23.6 98.2 0.0 1.8
19 40 95 973 1 *Wahedpur 1712 0.4 99.2 0.4 77.6 99.5 0.0 0.5
19 40 95 973 01 1 Wahedpur 817 0.2 99.4 0.4 81.9 99.5 0.0 0.5
19 40 95 973 02 1 Shibnagar 513 0.6 99.4 0.0 88.9 99.8 0.0 0.2
19 40 95 973 03 1 Masuabad 20 0.0 100.0 0.0 30.0 100.0 0.0 0.0
19 40 95 973 04 1 Noakandi 103 0.0 99.0 1.0 13.6 99.0 0.0 1.0
19 40 95 973 05 1 Hadipur 51 0.0 100.0 0.0 94.1 100.0 0.0 0.0
RMO: 1 = Rural, 2 = Urban and 3 = Other Urban Page 91 of 162

Tap Tube-Well Other Owned Rented Rent free
2 3 4 5 6 7 8 9 10
MZ /
MHVill RMO
1
Table C-15: Distribution of General Households by Source of Drinking Water, Electricity Connection and Housing Tenancy Status, by Residence
and Community
Administrative Unit
Residence
Community
Number of
Households
Source of Drinking Water (%) Electricity
Connection
(%)
Housing Tenancy (%)
ZL UZUN /
WA
19 40 95 973 06 1 Rajapur 31 0.0 100.0 0.0 58.1 93.5 0.0 6.5
19 40 95 973 07 1 Sayedpur 80 0.0 96.3 3.8 95.0 100.0 0.0 0.0
19 40 95 973 08 1 Khalpar 16 12.5 87.5 0.0 75.0 100.0 0.0 0.0
19 40 95 973 09 1 Potiya Para 81 0.0 100.0 0.0 35.8 100.0 0.0 0.0
19 54 Homna Upazila Total 40325 1.4 92.2 6.4 86.0 95.9 3.1 1.0
19 54 1 Homna Upazila 34444 0.8 93.0 6.2 84.9 98.1 0.8 1.0
19 54 2 Homna Upazila 5881 5.0 87.7 7.4 92.3 82.9 16.0 1.1
Homna Paurashava
19 54 01 Ward No-01 Total 358 1.1 94.4 4.5 91.3 99.7 0.0 0.3
19 54 01 063 2 *Bahirkhola 125 3.2 95.2 1.6 94.4 100.0 0.0 0.0
19 54 01 518 2 *Kararkandi 233 0.0 94.0 6.0 89.7 99.6 0.0 0.4
19 54 02 Ward No-02 Total 825 0.1 90.2 9.7 90.2 97.7 1.7 0.6
19 54 02 042 2 *Baghmara (Part) 825 0.1 90.2 9.7 90.2 97.7 1.7 0.6
19 54 03 Ward No-03 Total 695 2.3 97.1 0.6 92.2 83.5 14.2 2.3
19 54 03 412 2 *Homna (Part) 515 1.7 97.7 0.6 91.8 78.8 19.0 2.1
19 54 03 698 2 *Paschim Baidyerkandi (Haripur 180 3.9 95.6 0.6 93.3 96.7 0.6 2.8
19 54 04 Ward No-04 Total 1134 19.6 80.2 0.3 99.6 47.2 51.2 1.6
19 54 04 042 2 *Baghmara (Part) 120 0.0 99.2 0.8 99.2 93.3 5.0 1.7
19 54 04 412 2 *Homna (Part) 1014 21.9 77.9 0.2 99.6 41.7 56.7 1.6
19 54 05 Ward No-05 Total 710 5.8 93.0 1.3 94.6 70.1 29.0 0.8
19 54 05 412 2 *Homna (Part) 710 5.8 93.0 1.3 94.6 70.1 29.0 0.8
19 54 06 Ward No-06 Total 471 0.6 79.0 20.4 87.7 89.2 8.5 2.3
19 54 06 078 2 *Charergaon 144 0.0 47.2 52.8 88.9 96.5 0.0 3.5
19 54 06 878 2 *Sreepatir Char (Part) 327 0.9 93.0 6.1 87.2 85.9 12.2 1.8
19 54 07 Ward No-07 Total 561 0.7 96.1 3.2 93.0 99.5 0.4 0.2
19 54 07 878 2 *Sreepatir Char (Part) 561 0.7 96.1 3.2 93.0 99.5 0.4 0.2
19 54 08 Ward No-08 Total 647 0.2 68.3 31.5 83.6 99.1 0.2 0.8
19 54 08 878 2 *Sreepatir Char (Part) 647 0.2 68.3 31.5 83.6 99.1 0.2 0.8
19 54 09 Ward No-09 Total 480 0.0 99.2 0.8 91.7 100.0 0.0 0.0
RMO: 1 = Rural, 2 = Urban and 3 = Other Urban Page 92 of 162

Tap Tube-Well Other Owned Rented Rent free
2 3 4 5 6 7 8 9 10
MZ /
MHVill RMO
1
Table C-15: Distribution of General Households by Source of Drinking Water, Electricity Connection and Housing Tenancy Status, by Residence
and Community
Administrative Unit
Residence
Community
Number of
Households
Source of Drinking Water (%) Electricity
Connection
(%)
Housing Tenancy (%)
ZL UZUN /
WA
19 54 09 178 2 *Lathia 480 0.0 99.2 0.8 91.7 100.0 0.0 0.0
19 54 15 Asadpur Union Total 4255 0.3 97.5 2.2 81.3 99.2 0.2 0.6
19 54 15 031 1 *Asadpur 827 0.6 94.9 4.5 86.9 98.5 0.4 1.1
19 54 15 031 01 1 Asadpur 155 0.6 97.4 1.9 98.1 99.4 0.6 0.0
19 54 15 031 02 1 Munshikandi 107 0.0 98.1 1.9 73.8 99.1 0.9 0.0
19 54 15 031 03 1 Darikandi 112 0.0 100.0 0.0 88.4 99.1 0.0 0.9
19 54 15 031 04 1 Nayagaon 189 1.6 98.4 0.0 87.3 97.9 0.5 1.6
19 54 15 031 05 1 Chetpur 264 0.4 87.5 12.1 84.8 98.1 0.0 1.9
19 54 15 275 1 *Datterkandi 113 0.0 99.1 0.9 94.7 99.1 0.0 0.9
19 54 15 296 1 *Dayrakandi 310 0.0 100.0 0.0 76.5 99.7 0.0 0.3
19 54 15 296 01 1 Char Kuria 194 0.0 100.0 0.0 68.0 100.0 0.0 0.0
19 54 15 296 02 1 Dayrakandi 116 0.0 100.0 0.0 90.5 99.1 0.0 0.9
19 54 15 349 1 *Ghaniar Char 1496 0.2 98.8 1.0 82.0 99.7 0.1 0.3
19 54 15 349 01 1 Najarpur 146 0.0 100.0 0.0 89.7 100.0 0.0 0.0
19 54 15 349 02 1 Khoda Dadpur 453 0.4 96.5 3.1 86.1 99.6 0.0 0.4
19 54 15 349 03 1 Ghaniar Char 897 0.1 99.8 0.1 78.6 99.7 0.1 0.2
19 54 15 508 1 *Kalagachhia 858 0.2 97.0 2.8 85.7 99.4 0.1 0.5
19 54 15 508 01 1 Kalagachhia 359 0.3 97.8 1.9 88.3 99.2 0.3 0.6
19 54 15 508 02 1 Kriparampur 212 0.0 92.0 8.0 93.4 100.0 0.0 0.0
19 54 15 508 03 1 Krishnapur 287 0.3 99.7 0.0 76.7 99.3 0.0 0.7
19 54 15 719 1 *Pathaliakandi 308 0.0 99.7 0.3 72.1 98.1 0.3 1.6
19 54 15 899 1 *Tebhagia 256 0.8 98.0 1.2 53.5 98.0 0.8 1.2
19 54 15 994 1 *Uzanerkandi 87 0.0 83.9 16.1 86.2 100.0 0.0 0.0
19 54 20 Bhasania Union Total 3937 0.2 92.2 7.6 86.1 99.6 0.2 0.2
19 54 20 137 1 *Bhasania 1511 0.3 91.3 8.4 88.9 99.9 0.1 0.1
19 54 20 137 01 1 Umdrabad 380 0.5 85.0 14.5 77.4 99.5 0.3 0.3
19 54 20 137 02 1 Krishnapur 262 0.0 84.7 15.3 80.9 100.0 0.0 0.0
19 54 20 137 03 1 Dari Bhasania 261 0.4 99.6 0.0 95.4 100.0 0.0 0.0
19 54 20 137 04 1 Biti Bhasania 108 0.9 70.4 28.7 92.6 100.0 0.0 0.0
RMO: 1 = Rural, 2 = Urban and 3 = Other Urban Page 93 of 162

Tap Tube-Well Other Owned Rented Rent free
2 3 4 5 6 7 8 9 10
MZ /
MHVill RMO
1
Table C-15: Distribution of General Households by Source of Drinking Water, Electricity Connection and Housing Tenancy Status, by Residence
and Community
Administrative Unit
Residence
Community
Number of
Households
Source of Drinking Water (%) Electricity
Connection
(%)
Housing Tenancy (%)
ZL UZUN /
WA
19 54 20 137 05 1 Ishwarpur 37 0.0 100.0 0.0 100.0 100.0 0.0 0.0
19 54 20 137 06 1 Kazirgaon 92 0.0 100.0 0.0 98.9 100.0 0.0 0.0
19 54 20 137 07 1 Manadarkandi 97 0.0 100.0 0.0 94.8 100.0 0.0 0.0
19 54 20 137 08 1 Shibpur 231 0.0 99.6 0.4 97.8 100.0 0.0 0.0
19 54 20 137 09 1 Alampur 43 0.0 100.0 0.0 97.7 100.0 0.0 0.0
19 54 20 190 1 *Chandir Char 91 0.0 97.8 2.2 57.1 95.6 0.0 4.4
19 54 20 550 1 *Kriparampur 87 0.0 100.0 0.0 83.9 100.0 0.0 0.0
19 54 20 709 1 *Paschim Kashipur 820 0.0 99.9 0.1 84.9 99.3 0.5 0.2
19 54 20 709 01 1 Nayakandi 118 0.0 99.2 0.8 84.7 100.0 0.0 0.0
19 54 20 709 02 1 Kashipur 590 0.0 100.0 0.0 89.7 99.0 0.7 0.3
19 54 20 709 03 1 Joynagar 25 0.0 100.0 0.0 52.0 100.0 0.0 0.0
19 54 20 709 04 1 Mohanpur 87 0.0 100.0 0.0 62.1 100.0 0.0 0.0
19 54 20 740 1 *Raghunathpur 788 0.6 79.8 19.5 93.3 99.7 0.3 0.0
19 54 20 740 01 1 Islampur 108 0.9 85.2 13.9 91.7 100.0 0.0 0.0
19 54 20 740 02 1 Gopalnagar 103 3.9 95.1 1.0 96.1 100.0 0.0 0.0
19 54 20 740 03 1 Titia 337 0.0 59.3 40.7 97.0 99.4 0.6 0.0
19 54 20 740 04 1 Raghunathpur 240 0.0 99.6 0.4 87.5 100.0 0.0 0.0
19 54 20 889 1 *Tatuakandi 640 0.0 97.5 2.5 76.6 99.7 0.0 0.3
19 54 20 889 01 1 Tatuakandi 68 0.0 100.0 0.0 100.0 100.0 0.0 0.0
19 54 20 889 02 1 Dahargop 121 0.0 100.0 0.0 0.8 99.2 0.0 0.8
19 54 20 889 03 1 Kurarkandi 38 0.0 100.0 0.0 100.0 100.0 0.0 0.0
19 54 20 889 04 1 Madhabpur 184 0.0 100.0 0.0 89.1 100.0 0.0 0.0
19 54 20 889 05 1 Shyampur 229 0.0 93.0 7.0 95.6 99.6 0.0 0.4
19 54 22 Dulal Pur Union Total 4507 0.4 90.0 9.7 75.7 97.3 1.2 1.5
19 54 22 010 1 *Algir Char 62 0.0 95.2 4.8 93.5 100.0 0.0 0.0
19 54 22 052 1 *Baher Kalamina 156 0.0 94.9 5.1 82.7 97.4 2.6 0.0
19 54 22 105 1 *Bara Daulatpur (Dighirpar) 12 0.0 75.0 25.0 100.0 100.0 0.0 0.0
19 54 22 158 1 *Bhiti Kalamina 549 0.4 52.3 47.4 86.3 96.9 0.0 3.1
19 54 22 158 01 1 Bhiti Kalamina 538 0.4 52.0 47.6 88.1 96.8 0.0 3.2
RMO: 1 = Rural, 2 = Urban and 3 = Other Urban Page 94 of 162

Tap Tube-Well Other Owned Rented Rent free
2 3 4 5 6 7 8 9 10
MZ /
MHVill RMO
1
Table C-15: Distribution of General Households by Source of Drinking Water, Electricity Connection and Housing Tenancy Status, by Residence
and Community
Administrative Unit
Residence
Community
Number of
Households
Source of Drinking Water (%) Electricity
Connection
(%)
Housing Tenancy (%)
ZL UZUN /
WA
19 54 22 158 02 1 Kawertek 11 0.0 63.6 36.4 0.0 100.0 0.0 0.0
19 54 22 201 1 *Char Mithaibhanga 356 0.0 100.0 0.0 82.6 99.4 0.0 0.6
19 54 22 222 1 *Chhota Ghagutia 98 0.0 98.0 2.0 83.7 99.0 1.0 0.0
19 54 22 232 1 *Chhota Kalamina 71 0.0 100.0 0.0 100.0 100.0 0.0 0.0
19 54 22 285 1 *Daulatpur 799 0.0 91.5 8.5 49.4 97.1 0.1 2.8
19 54 22 285 01 1 Daulatpur 616 0.0 89.0 11.0 43.8 96.4 0.2 3.4
19 54 22 285 02 1 Araliakandi 183 0.0 100.0 0.0 68.3 99.5 0.0 0.5
19 54 22 306 1 *Dulalpur 389 1.0 98.5 0.5 78.7 93.3 4.9 1.8
19 54 22 306 01 1 Dulalpur 278 0.0 99.3 0.7 75.5 91.0 6.5 2.5
19 54 22 306 02 1 Pathalikandi Part-1 (Kashipur) 111 3.6 96.4 0.0 86.5 99.1 0.9 0.0
19 54 22 455 1 *Joynagar 205 1.0 99.0 0.0 90.2 98.0 0.5 1.5
19 54 22 486 1 *Jhagrar Char 501 0.0 97.2 2.8 51.9 98.2 0.2 1.6
19 54 22 497 1 *Kacharikandi 111 3.6 96.4 0.0 87.4 99.1 0.9 0.0
19 54 22 603 1 *Mangalerkandi 597 0.7 90.3 9.0 84.1 99.5 0.2 0.3
19 54 22 603 01 1 Mangalerkandi 394 1.0 85.3 13.7 87.3 99.5 0.0 0.5
19 54 22 603 02 1 Purbakandi 103 0.0 100.0 0.0 80.6 100.0 0.0 0.0
19 54 22 603 03 1 Chanderkandi 100 0.0 100.0 0.0 75.0 99.0 1.0 0.0
19 54 22 762 1 *Rajnagar 40 2.5 92.5 5.0 90.0 82.5 12.5 5.0
19 54 22 793 1 *Saplezi 428 0.0 96.3 3.7 89.3 94.9 4.4 0.7
19 54 22 793 01 1 Saplezi 192 0.0 91.7 8.3 85.9 91.1 8.9 0.0
19 54 22 793 02 1 Chandipur 236 0.0 100.0 0.0 91.9 97.9 0.8 1.3
19 54 22 942 1 *Uttar Baidyerkandi 133 0.0 97.7 2.3 97.7 97.7 0.0 2.3
19 54 25 Joypur Union Total 2341 0.6 96.6 2.8 87.3 99.3 0.5 0.2
19 54 25 021 1 *Ananthpur 387 0.8 94.6 4.7 84.5 99.2 0.0 0.8
19 54 25 021 01 1 Ananthpur 293 1.0 92.8 6.1 88.1 99.3 0.0 0.7
19 54 25 021 02 1 Kandailhati 94 0.0 100.0 0.0 73.4 98.9 0.0 1.1
19 54 25 476 1 *Joypur 515 0.2 95.0 4.9 97.1 99.8 0.0 0.2
19 54 25 476 01 1 Joypur 344 0.3 92.4 7.3 98.0 100.0 0.0 0.0
19 54 25 476 02 1 Mirja Nagar 171 0.0 100.0 0.0 95.3 99.4 0.0 0.6
RMO: 1 = Rural, 2 = Urban and 3 = Other Urban Page 95 of 162

Tap Tube-Well Other Owned Rented Rent free
2 3 4 5 6 7 8 9 10
MZ /
MHVill RMO
1
Table C-15: Distribution of General Households by Source of Drinking Water, Electricity Connection and Housing Tenancy Status, by Residence
and Community
Administrative Unit
Residence
Community
Number of
Households
Source of Drinking Water (%) Electricity
Connection
(%)
Housing Tenancy (%)
ZL UZUN /
WA
19 54 25 539 1 *Kondakarchar 87 0.0 89.7 10.3 100.0 100.0 0.0 0.0
19 54 25 730 1 *Purba Kashipur 957 0.8 98.5 0.6 77.1 98.6 1.3 0.1
19 54 25 730 01 1 Purba Kashipur 203 0.0 98.5 1.5 93.6 100.0 0.0 0.0
19 54 25 730 02 1 Sreepur 532 1.1 98.5 0.4 75.8 97.7 2.1 0.2
19 54 25 730 03 1 Dorikandi 160 1.3 98.8 0.0 90.6 99.4 0.6 0.0
19 54 25 730 04 1 Pirijpur 62 0.0 98.4 1.6 0.0 100.0 0.0 0.0
19 54 25 751 1 *Rajapur 395 0.3 97.7 2.0 99.2 100.0 0.0 0.0
19 54 25 751 01 1 Rajapur 277 0.4 99.3 0.4 99.3 100.0 0.0 0.0
19 54 25 751 02 1 Abdullahpur 118 0.0 94.1 5.9 99.2 100.0 0.0 0.0
19 54 28 Chander Char Union Total 4768 1.1 87.1 11.8 83.1 95.9 2.9 1.2
19 54 28 243 1 *Dakshin Balukandi 185 0.0 73.5 26.5 73.0 98.4 0.5 1.1
19 54 28 254 1 *Dakshin Nager Char 4 0.0 100.0 0.0 100.0 100.0 0.0 0.0
19 54 28 592 1 *Maij Char 283 1.1 70.3 28.6 65.7 98.2 0.0 1.8
19 54 28 772 1 *Ramkrishnapur 2088 1.6 88.1 10.3 86.8 92.8 5.9 1.3
19 54 28 772 01 1 Ramkrishnapur 397 0.8 92.9 6.3 88.4 90.7 7.3 2.0
19 54 28 772 02 1 Aralia 427 0.9 92.3 6.8 91.6 82.4 17.3 0.2
19 54 28 772 03 1 Akhandapur 194 6.7 90.7 2.6 90.2 90.2 8.2 1.5
19 54 28 772 04 1 Ramnagar 114 7.9 67.5 24.6 80.7 98.2 1.8 0.0
19 54 28 772 05 1 Sreenagar 285 0.7 99.3 0.0 77.2 99.6 0.0 0.4
19 54 28 772 06 1 Banshgari 101 1.0 42.6 56.4 79.2 99.0 0.0 1.0
19 54 28 772 07 1 Tatuakandi 232 0.0 100.0 0.0 89.2 94.8 0.4 4.7
19 54 28 772 08 1 Padua Rampur 47 0.0 53.2 46.8 93.6 97.9 2.1 0.0
19 54 28 772 09 1 Talimnagar 162 0.6 71.6 27.8 76.5 98.1 0.6 1.2
19 54 28 772 10 1 Chandpur 129 0.0 96.9 3.1 100.0 100.0 0.0 0.0
19 54 28 783 1 *Rampur 147 0.7 99.3 0.0 88.4 99.3 0.0 0.7
19 54 28 867 1 *Sobharampur 318 0.0 54.7 45.3 81.4 94.3 1.9 3.8
19 54 28 952 1 *Uttar Chander Char 1598 0.9 94.5 4.6 80.9 99.0 0.4 0.6
19 54 28 952 01 1 Chander Char 364 1.1 98.9 0.0 90.9 99.5 0.0 0.5
19 54 28 952 02 1 Tatuar Char 175 0.0 89.1 10.9 86.3 98.9 0.6 0.6
RMO: 1 = Rural, 2 = Urban and 3 = Other Urban Page 96 of 162

Tap Tube-Well Other Owned Rented Rent free
2 3 4 5 6 7 8 9 10
MZ /
MHVill RMO
1
Table C-15: Distribution of General Households by Source of Drinking Water, Electricity Connection and Housing Tenancy Status, by Residence
and Community
Administrative Unit
Residence
Community
Number of
Households
Source of Drinking Water (%) Electricity
Connection
(%)
Housing Tenancy (%)
ZL UZUN /
WA
19 54 28 952 03 1 Bak Sitarampur 346 0.3 84.1 15.6 89.6 99.4 0.6 0.0
19 54 28 952 04 1 Sitarampur 161 1.2 98.1 0.6 57.8 99.4 0.0 0.6
19 54 28 952 05 1 Paratali 182 0.5 99.5 0.0 87.4 100.0 0.0 0.0
19 54 28 952 06 1 Nayakandi 65 3.1 96.9 0.0 81.5 92.3 1.5 6.2
19 54 28 952 07 1 Sobharampur 305 1.3 98.7 0.0 64.3 98.7 0.7 0.7
19 54 28 984 1 *Uttar Nager Char 145 0.7 99.3 0.0 99.3 100.0 0.0 0.0
19 54 47 Ghagutia Union Total 3554 0.7 91.7 7.6 88.0 98.4 0.3 1.4
19 54 47 116 1 *Bara Ghagutia 2375 0.6 89.7 9.6 90.7 98.4 0.2 1.5
19 54 47 116 01 1 Bhabanipur 42 0.0 95.2 4.8 92.9 100.0 0.0 0.0
19 54 47 116 02 1 Ghagotia 395 0.5 94.9 4.6 91.9 98.7 0.8 0.5
19 54 47 116 03 1 Dakshin Nala Dakshin 338 2.1 76.6 21.3 97.0 98.5 0.0 1.5
19 54 47 116 04 1 Madhabpur 297 0.0 100.0 0.0 91.2 98.7 0.0 1.3
19 54 47 116 05 1 Nurullapur 135 0.0 100.0 0.0 68.9 100.0 0.0 0.0
19 54 47 116 06 1 Faterkandi 119 2.5 97.5 0.0 90.8 89.9 0.0 10.1
19 54 47 116 07 1 Rampur 254 0.0 100.0 0.0 86.2 98.8 0.0 1.2
19 54 47 116 08 1 Sharifpur 99 0.0 57.6 42.4 86.9 93.9 0.0 6.1
19 54 47 116 09 1 Alipur 498 0.6 99.0 0.4 94.8 99.4 0.0 0.6
19 54 47 116 10 1 Kuralikandi 198 0.0 53.0 47.0 87.9 99.5 0.5 0.0
19 54 47 264 1 *Dari Char 877 0.6 94.6 4.8 80.5 98.1 0.6 1.4
19 54 47 264 01 1 Dari Char 533 0.6 94.4 5.1 71.3 97.2 0.6 2.3
19 54 47 264 02 1 Chunar Char 216 0.0 100.0 0.0 92.1 99.1 0.9 0.0
19 54 47 264 03 1 Nayagaon 128 1.6 86.7 11.7 99.2 100.0 0.0 0.0
19 54 47 328 1 *Durgapur 302 1.7 98.3 0.0 88.4 99.7 0.0 0.3
19 54 50 Garmora Union Total 3070 1.9 96.3 1.8 90.2 98.8 0.8 0.4
19 54 50 359 1 *Garmora (Ander Manik) 102 0.0 100.0 0.0 98.0 98.0 0.0 2.0
19 54 50 624 1 *Mirsikari 481 0.4 99.6 0.0 94.6 98.3 0.8 0.8
19 54 50 624 01 1 Mirsikari 288 0.0 100.0 0.0 94.4 97.6 1.0 1.4
19 54 50 624 02 1 Hujurkandi 193 1.0 99.0 0.0 94.8 99.5 0.5 0.0
19 54 50 648 1 *Narayanpur 169 0.6 98.8 0.6 98.2 99.4 0.0 0.6
RMO: 1 = Rural, 2 = Urban and 3 = Other Urban Page 97 of 162

Tap Tube-Well Other Owned Rented Rent free
2 3 4 5 6 7 8 9 10
MZ /
MHVill RMO
1
Table C-15: Distribution of General Households by Source of Drinking Water, Electricity Connection and Housing Tenancy Status, by Residence
and Community
Administrative Unit
Residence
Community
Number of
Households
Source of Drinking Water (%) Electricity
Connection
(%)
Housing Tenancy (%)
ZL UZUN /
WA
19 54 50 677 1 *Monipur 2318 2.4 95.3 2.3 88.3 98.8 0.9 0.2
19 54 50 677 01 1 Uttar Monipur 337 7.1 92.9 0.0 100.0 99.4 0.6 0.0
19 54 50 677 02 1 Dakhin Monipur 607 4.4 88.6 6.9 90.9 99.5 0.0 0.5
19 54 50 677 03 1 Faterkandi 234 0.4 99.6 0.0 47.4 99.6 0.4 0.0
19 54 50 677 04 1 Kalipur 170 1.8 94.1 4.1 86.5 100.0 0.0 0.0
19 54 50 677 05 1 Uttar Bar Garmora 461 0.0 100.0 0.0 95.4 100.0 0.0 0.0
19 54 50 677 06 1 Dakhin Bar Garmora 167 0.6 99.4 0.0 90.4 97.0 2.4 0.6
19 54 50 677 07 1 Choto Garmora 342 0.0 98.5 1.5 90.4 95.3 4.4 0.3
19 54 76 Mathabanga Union Total 4029 0.6 98.4 1.0 88.5 97.3 0.5 2.3
19 54 76 084 1 *Banda Dulali 53 0.0 100.0 0.0 90.6 100.0 0.0 0.0
19 54 76 127 1 *Bhangar Char 286 1.0 99.0 0.0 81.1 93.7 0.0 6.3
19 54 76 169 1 *Bijoynagar 322 0.0 100.0 0.0 95.7 100.0 0.0 0.0
19 54 76 211 1 *Chhoblakandi Mathabhanga 640 1.3 96.4 2.3 88.8 97.7 0.3 2.0
19 54 76 317 1 *Dumuria 325 0.3 99.7 0.0 92.0 99.1 0.0 0.9
19 54 76 338 1 *Darigaon 270 0.0 100.0 0.0 97.0 100.0 0.0 0.0
19 54 76 370 1 *Goalbanda 84 0.0 100.0 0.0 72.6 47.6 16.7 35.7
19 54 76 381 1 *Goaribhanga 567 0.0 100.0 0.0 91.5 98.8 0.5 0.7
19 54 76 423 1 *Ichapasha 30 6.7 93.3 0.0 53.3 100.0 0.0 0.0
19 54 76 433 1 *Jagannathkandi Mathabhanga 453 0.0 99.1 0.9 92.1 98.2 0.0 1.8
19 54 76 444 1 *Joydebpur 357 1.7 95.5 2.8 83.8 99.2 0.0 0.8
19 54 76 645 1 *Munshi Mathabhanga 293 1.7 98.3 0.0 78.8 98.0 0.0 2.0
19 54 76 963 1 *Uttar Haripur 78 0.0 85.9 14.1 80.8 94.9 0.0 5.1
19 54 76 973 1 *Uttar Mahishmari 271 0.0 100.0 0.0 90.0 99.3 0.0 0.7
19 54 85 Nilakhi Union Total 3983 1.6 90.7 7.8 88.0 98.7 0.4 0.9
19 54 85 402 1 *Habati Char 6 0.0 16.7 83.3 50.0 100.0 0.0 0.0
19 54 85 582 1 *Madhyakandi 431 0.0 99.8 0.2 94.9 98.6 0.9 0.5
19 54 85 582 01 1 Madhyakandi 160 0.0 99.4 0.6 88.1 96.3 2.5 1.3
19 54 85 582 02 1 Bhabanipur 271 0.0 100.0 0.0 98.9 100.0 0.0 0.0
19 54 85 666 1 *Naya Char 310 0.6 95.5 3.9 93.5 98.1 1.0 1.0
RMO: 1 = Rural, 2 = Urban and 3 = Other Urban Page 98 of 162

Tap Tube-Well Other Owned Rented Rent free
2 3 4 5 6 7 8 9 10
MZ /
MHVill RMO
1
Table C-15: Distribution of General Households by Source of Drinking Water, Electricity Connection and Housing Tenancy Status, by Residence
and Community
Administrative Unit
Residence
Community
Number of
Households
Source of Drinking Water (%) Electricity
Connection
(%)
Housing Tenancy (%)
ZL UZUN /
WA
19 54 85 666 01 1 Naya Char 100 1.0 92.0 7.0 83.0 97.0 1.0 2.0
19 54 85 666 02 1 Kalakandi 210 0.5 97.1 2.4 98.6 98.6 1.0 0.5
19 54 85 677 1 *Nilakhi 2767 2.1 89.8 8.1 87.9 98.7 0.3 1.0
19 54 85 677 01 1 Purba Nilakhi 449 0.2 99.8 0.0 99.3 99.6 0.4 0.0
19 54 85 677 02 1 Paschim Nilakhi 665 7.8 91.9 0.3 89.3 98.3 0.8 0.9
19 54 85 677 03 1 Lalbagh 76 0.0 100.0 0.0 78.9 100.0 0.0 0.0
19 54 85 677 04 1 Pirijpur 23 0.0 100.0 0.0 95.7 100.0 0.0 0.0
19 54 85 677 05 1 Miras 364 0.3 79.9 19.8 92.6 98.4 0.0 1.6
19 54 85 677 06 1 Champaknagar 150 0.0 100.0 0.0 100.0 99.3 0.0 0.7
19 54 85 677 07 1 Itabhara 425 0.2 86.8 12.9 74.1 99.8 0.0 0.2
19 54 85 677 08 1 Babarkandi 278 0.4 98.9 0.7 90.6 95.7 0.7 3.6
19 54 85 677 09 1 Ulukandi 73 0.0 58.9 41.1 61.6 98.6 0.0 1.4
19 54 85 677 10 1 Ajodhanagar 145 0.7 88.3 11.0 86.2 100.0 0.0 0.0
19 54 85 677 11 1 Shyamnagar 119 1.7 58.8 39.5 73.1 98.3 0.0 1.7
19 54 85 910 1 *Ubdi 141 0.0 52.5 47.5 58.9 99.3 0.0 0.7
19 54 85 931 1 *Upar Char 328 0.6 99.4 0.0 87.8 98.8 0.3 0.9
19 67 Comilla Adarsha Sadar Upazila Total 104353 30.0 65.9 4.1 97.3 61.9 36.4 1.7
19 67 1 Comilla Adarsha Sadar Upazila 46245 17.0 80.0 3.1 95.9 79.9 18.2 1.9
19 67 2 Comilla Adarsha Sadar Upazila 45818 44.3 50.6 5.0 99.0 43.3 55.5 1.3
19 67 3 Comilla Adarsha Sadar Upazila 12290 25.9 70.0 4.1 96.5 63.9 33.5 2.7
Comilla Paurashava
19 67 01 Ward No-01 Total 1577 33.7 51.2 15.2 99.2 63.2 36.4 0.4
19 67 01 199 2 *Bhat Para 536 14.0 68.1 17.9 99.1 75.6 23.7 0.7
19 67 01 223 2 *Bishnupur 1041 43.8 42.5 13.7 99.3 56.8 42.9 0.3
19 67 02 Ward No-02 Total 1361 61.3 30.0 8.7 99.6 50.8 48.8 0.4
19 67 02 298 2 *Chotara (Part) 1256 58.4 32.1 9.5 99.5 55.0 44.5 0.5
19 67 02 338 2 *Comilla Central Jail 105 95.2 4.8 0.0 100.0 0.0 100.0 0.0
19 67 03 Ward No-03 Total 4396 73.8 25.5 0.7 99.5 35.3 63.9 0.8
19 67 03 522 2 *Kaliajuri 2229 64.2 34.6 1.2 99.4 45.5 53.5 1.0
RMO: 1 = Rural, 2 = Urban and 3 = Other Urban Page 99 of 162

Tap Tube-Well Other Owned Rented Rent free
2 3 4 5 6 7 8 9 10
MZ /
MHVill RMO
1
Table C-15: Distribution of General Households by Source of Drinking Water, Electricity Connection and Housing Tenancy Status, by Residence
and Community
Administrative Unit
Residence
Community
Number of
Households
Source of Drinking Water (%) Electricity
Connection
(%)
Housing Tenancy (%)
ZL UZUN /
WA
19 67 03 771 2 *Rachcourse+Police Line 1778 91.8 8.0 0.2 99.6 21.5 78.1 0.4
19 67 03 845 2 *Shashangachha (Part) 389 46.0 53.7 0.3 99.2 39.8 59.1 1.0
19 67 04 Ward No-04 Total 1805 44.9 54.3 0.8 99.3 55.8 42.8 1.4
19 67 04 472 2 *Islampur 421 68.6 31.4 0.0 100.0 41.8 56.3 1.9
19 67 04 572 2 *Kaptan Bazar 1384 37.6 61.3 1.1 99.1 60.0 38.7 1.3
19 67 05 Ward No-05 Total 2237 61.3 7.7 30.9 99.7 44.1 53.7 2.1
19 67 05 373 2 *Gangchar (Part) 726 87.2 2.9 9.9 99.4 43.4 55.1 1.5
19 67 05 435 2 *Goal Patti 346 10.1 4.3 85.5 100.0 34.7 64.7 0.6
19 67 05 621 2 *Mugultuli 311 47.6 10.9 41.5 99.7 60.8 38.6 0.6
19 67 05 748 2 *Puratan Chuduri Para 479 82.7 12.9 4.4 99.8 40.3 54.9 4.8
19 67 05 796 2 *Razgong 254 19.7 11.8 68.5 99.6 46.5 52.4 1.2
19 67 05 820 2 *Razbari 121 90.9 9.1 0.0 100.0 43.0 51.2 5.8
19 67 06 Ward No-06 Total 2531 62.0 32.4 5.7 99.4 41.2 58.2 0.6
19 67 06 248 2 *Chand Pur (Part) 392 84.9 14.0 1.0 100.0 39.0 60.2 0.8
19 67 06 273 2 *Chak Bazar 588 50.3 36.9 12.8 99.1 36.1 62.6 1.4
19 67 06 373 2 *Gangchar (Part) 236 62.7 26.7 10.6 97.9 50.0 49.6 0.4
19 67 06 429 2 *Gonga Gong 371 83.6 15.9 0.5 100.0 56.9 42.9 0.3
19 67 06 920 2 *Subapur (Part) 944 51.0 45.0 4.0 99.5 36.9 62.9 0.2
19 67 07 Ward No-07 Total 2784 17.4 80.6 1.9 99.2 34.3 64.3 1.4
19 67 07 099 2 *Ashoktala (Part) 1263 24.9 74.5 0.6 99.1 34.0 63.4 2.6
19 67 07 447 2 *Gobindapur 1521 11.2 85.7 3.0 99.3 34.6 65.0 0.5
19 67 08 Ward No-08 Total 3001 25.4 74.6 0.0 99.6 32.7 66.3 1.0
19 67 08 099 2 *Ashoktala (Part) 123 0.0 100.0 0.0 100.0 52.0 43.1 4.9
19 67 08 384 2 *Second Kandirpar 2524 17.6 82.4 0.0 99.5 31.1 68.0 0.9
19 67 08 387 2 *First Kandirpar (Part) 354 89.5 10.5 0.0 100.0 37.6 62.4 0.0
19 67 09 Ward No-09 Total 1411 29.3 69.7 1.1 99.8 30.3 68.4 1.3
19 67 09 124 2 *Bagichagaon (Part) 1411 29.3 69.7 1.1 99.8 30.3 68.4 1.3
19 67 10 Ward No-10 Total 3487 27.7 71.0 1.3 99.7 27.0 69.8 3.2
19 67 10 124 2 *Bagichagaon (Part) 1799 22.7 75.2 2.1 99.8 29.6 68.6 1.7
RMO: 1 = Rural, 2 = Urban and 3 = Other Urban Page 100 of 162

Tap Tube-Well Other Owned Rented Rent free
2 3 4 5 6 7 8 9 10
MZ /
MHVill RMO
1
Table C-15: Distribution of General Households by Source of Drinking Water, Electricity Connection and Housing Tenancy Status, by Residence
and Community
Administrative Unit
Residence
Community
Number of
Households
Source of Drinking Water (%) Electricity
Connection
(%)
Housing Tenancy (%)
ZL UZUN /
WA
19 67 10 298 2 *Chotara (Part) 94 92.6 4.3 3.2 100.0 21.3 62.8 16.0
19 67 10 374 2 *First Kandirpar (Part-1) 783 20.2 79.7 0.1 99.6 24.3 73.1 2.7
19 67 10 497 2 *Jhautala (1st Kandirpar) 621 33.0 66.8 0.2 99.7 25.4 72.8 1.8
19 67 10 646 2 *Manoharpur (Part) 190 56.3 41.6 2.1 99.5 22.1 60.5 17.4
19 67 11 Ward No-11 Total 1634 40.1 59.0 0.9 99.9 35.7 61.8 2.6
19 67 11 646 2 *Monoharpur 1634 40.1 59.0 0.9 99.9 35.7 61.8 2.6
19 67 12 Ward No-12 Total 2175 14.9 77.1 8.0 99.4 44.4 55.0 0.6
19 67 12 149 2 *Bazrapur (Part) 1247 8.7 91.1 0.2 99.0 41.1 58.3 0.6
19 67 12 720 2 *Uttar Charta 928 23.4 58.3 18.3 99.9 48.7 50.5 0.8
19 67 13 Ward No-13 Total 3304 52.5 39.9 7.6 99.1 51.3 48.0 0.7
19 67 13 298 2 *Dakshin Charta 3304 52.5 39.9 7.6 99.1 51.3 48.0 0.7
19 67 14 Ward No-14 Total 2143 40.9 57.3 1.8 98.2 50.3 49.4 0.3
19 67 14 696 2 *Muradpur (Part) 2143 40.9 57.3 1.8 98.2 50.3 49.4 0.3
19 67 15 Ward No-15 Total 2242 41.0 54.9 4.1 99.3 58.6 40.8 0.7
19 67 15 597 2 *Bazrapur (Kashari Patty) 755 56.6 38.3 5.2 99.5 59.6 40.1 0.3
19 67 15 671 2 *Maulavi Para 1146 23.2 72.2 4.6 99.2 61.6 38.0 0.4
19 67 15 696 2 *Muradpur (Part) 341 66.3 33.7 0.0 99.4 46.0 51.6 2.3
19 67 16 Ward No-16 Total 2404 15.1 75.7 9.2 95.1 64.4 34.8 0.9
19 67 16 870 2 *Sangraish 1921 13.1 75.8 11.1 94.2 66.5 32.6 0.9
19 67 16 970 2 *Tikkarchar 483 23.4 75.2 1.4 98.8 55.9 43.5 0.6
19 67 17 Ward No-17 Total 2584 51.1 47.0 1.9 98.6 56.2 40.1 3.7
19 67 17 780 2 *Patharia Para 619 27.0 73.0 0.0 98.5 55.4 44.4 0.2
19 67 17 945 2 *Sujanagar 865 46.7 52.5 0.8 99.2 43.7 45.8 10.5
19 67 17 985 2 *Telikona (Muradpur) 1100 68.2 28.1 3.7 98.1 66.4 33.3 0.4
19 67 18 Ward No-18 Total 3145 48.7 47.5 3.8 97.9 50.4 48.7 0.9
19 67 18 396 2 *Hazratpara (Muradpur) 505 21.2 76.0 2.8 90.1 53.1 45.7 1.2
19 67 18 428 2 *Housing Estate (Nurpur) 1230 76.8 21.8 1.4 99.4 30.5 68.1 1.4
19 67 18 721 2 *Katabil (Muradpur) 428 14.5 85.0 0.5 99.3 65.7 34.3 0.0
19 67 18 749 2 *Nurpur 982 42.7 48.7 8.7 99.3 67.3 32.3 0.4
RMO: 1 = Rural, 2 = Urban and 3 = Other Urban Page 101 of 162

Tap Tube-Well Other Owned Rented Rent free
2 3 4 5 6 7 8 9 10
MZ /
MHVill RMO
1
Table C-15: Distribution of General Households by Source of Drinking Water, Electricity Connection and Housing Tenancy Status, by Residence
and Community
Administrative Unit
Residence
Community
Number of
Households
Source of Drinking Water (%) Electricity
Connection
(%)
Housing Tenancy (%)
ZL UZUN /
WA
19 67 22 Amratali Union Total 7724 12.0 83.9 4.1 95.6 95.0 2.5 2.5
19 67 22 012 1 *Amratali 580 2.8 94.5 2.8 93.8 95.7 1.0 3.3
19 67 22 012 01 1 Amratali 311 2.9 92.0 5.1 90.7 93.2 1.9 4.8
19 67 22 012 02 1 Char Para 43 0.0 100.0 0.0 100.0 100.0 0.0 0.0
19 67 22 012 03 1 Dutiar Dighirpar 226 3.1 96.9 0.0 96.9 98.2 0.0 1.8
19 67 22 044 1 *Banasua (Atra) 599 9.8 90.0 0.2 94.0 91.7 4.3 4.0
19 67 22 044 01 1 Bara Atra 264 9.8 89.8 0.4 95.1 93.6 4.9 1.5
19 67 22 044 02 1 Chhota Atra 335 9.9 90.1 0.0 93.1 90.1 3.9 6.0
19 67 22 049 1 *Bansh Mangal 133 4.5 95.5 0.0 97.7 91.7 5.3 3.0
19 67 22 240 1 *Dakshin Rasulpur 254 31.9 68.1 0.0 99.6 97.6 2.0 0.4
19 67 22 240 01 1 Dakshin Rasulpur 227 33.5 66.5 0.0 99.6 97.4 2.2 0.4
19 67 22 240 02 1 Lakshmipur 27 18.5 81.5 0.0 100.0 100.0 0.0 0.0
19 67 22 321 1 *Elaspur 156 8.3 91.7 0.0 95.5 92.3 0.6 7.1
19 67 22 341 1 *Gabtali 57 0.0 100.0 0.0 82.5 98.2 0.0 1.8
19 67 22 400 1 *Icharpar 546 7.1 92.9 0.0 96.9 97.1 1.1 1.8
19 67 22 400 01 1 Icharpar 67 14.9 85.1 0.0 92.5 98.5 0.0 1.5
19 67 22 400 02 1 Bhubanghar 394 6.3 93.7 0.0 97.0 96.7 1.3 2.0
19 67 22 400 03 1 Krishnapur 85 4.7 95.3 0.0 100.0 97.6 1.2 1.2
19 67 22 415 1 *Jambari 412 2.4 97.6 0.0 99.3 99.8 0.0 0.2
19 67 22 433 1 *Jashpur 185 8.6 91.4 0.0 98.4 94.6 3.8 1.6
19 67 22 502 1 *Karunapur 142 5.6 94.4 0.0 93.7 99.3 0.7 0.0
19 67 22 525 1 *Katanisar (Ramnagar) 186 25.8 63.4 10.8 96.8 96.8 0.0 3.2
19 67 22 525 01 1 Katanisar 116 28.4 58.6 12.9 94.8 94.8 0.0 5.2
19 67 22 525 02 1 Ramnagar 28 21.4 75.0 3.6 100.0 100.0 0.0 0.0
19 67 22 525 03 1 Maulvinagar 42 21.4 69.0 9.5 100.0 100.0 0.0 0.0
19 67 22 579 1 *Madhyam Majhigachha 671 10.4 88.2 1.3 97.3 96.0 3.7 0.3
19 67 22 601 1 *Maheshpur 117 2.6 97.4 0.0 98.3 98.3 0.9 0.9
19 67 22 603 1 *Maheshpur Kismat 82 12.2 87.8 0.0 100.0 98.8 0.0 1.2
19 67 22 621 1 *Manipur 80 1.3 98.8 0.0 87.5 90.0 0.0 10.0
RMO: 1 = Rural, 2 = Urban and 3 = Other Urban Page 102 of 162

Tap Tube-Well Other Owned Rented Rent free
2 3 4 5 6 7 8 9 10
MZ /
MHVill RMO
1
Table C-15: Distribution of General Households by Source of Drinking Water, Electricity Connection and Housing Tenancy Status, by Residence
and Community
Administrative Unit
Residence
Community
Number of
Households
Source of Drinking Water (%) Electricity
Connection
(%)
Housing Tenancy (%)
ZL UZUN /
WA
19 67 22 641 1 *Mirza Nagar 60 16.7 65.0 18.3 91.7 100.0 0.0 0.0
19 67 22 673 1 *Nij Banasua 209 34.9 64.6 0.5 97.6 76.6 21.1 2.4
19 67 22 749 1 *Purba Krishnapur 235 2.1 89.4 8.5 97.9 93.6 0.4 6.0
19 67 22 774 1 *Raghurampur 252 8.7 73.4 17.9 95.2 97.6 1.2 1.2
19 67 22 774 01 1 Raghurampur 136 11.8 88.2 0.0 97.1 98.5 0.7 0.7
19 67 22 774 02 1 Tailkupi 116 5.2 56.0 38.8 93.1 96.6 1.7 1.7
19 67 22 806 1 *U.Rasulpur 661 15.3 68.2 16.5 92.3 96.5 0.2 3.3
19 67 22 806 01 1 U.Rasulpur 571 15.1 65.8 19.1 91.2 97.4 0.2 2.5
19 67 22 806 02 1 Zarianagar 90 16.7 83.3 0.0 98.9 91.1 0.0 8.9
19 67 22 809 1 *Ratnabati 360 13.9 85.8 0.3 94.7 95.3 4.2 0.6
19 67 22 824 1 *Salukmora 40 20.0 62.5 17.5 87.5 100.0 0.0 0.0
19 67 22 871 1 *Simpur 612 24.7 74.5 0.8 98.7 93.8 4.1 2.1
19 67 22 871 01 1 Simpur 493 26.4 73.6 0.0 98.8 93.3 4.5 2.2
19 67 22 871 02 1 Pandanagar 119 17.6 78.2 4.2 98.3 95.8 2.5 1.7
19 67 22 873 1 *Simra Baleshwar 408 12.0 88.0 0.0 98.8 93.9 1.5 4.7
19 67 22 873 01 1 Baleshwar 177 9.6 90.4 0.0 97.7 94.9 0.0 5.1
19 67 22 873 02 1 Simra 170 15.3 84.7 0.0 100.0 95.9 0.0 4.1
19 67 22 873 03 1 Kalkharpar 61 9.8 90.2 0.0 98.4 85.2 9.8 4.9
19 67 22 945 1 *Ujirpur 203 5.9 76.4 17.7 95.1 90.6 1.5 7.9
19 67 22 945 01 1 Dhoghar 74 2.7 48.6 48.6 98.6 100.0 0.0 0.0
19 67 22 945 02 1 Chhotrakhil 129 7.8 92.2 0.0 93.0 85.3 2.3 12.4
19 67 22 980 1 *Uttar Majhigachha 397 11.6 88.2 0.3 93.5 94.7 3.0 2.3
19 67 22 980 01 1 Uttar Majhigachha 306 14.4 85.3 0.3 93.8 93.8 3.9 2.3
19 67 22 980 02 1 Piartali 91 2.2 97.8 0.0 92.3 97.8 0.0 2.2
19 67 22 987 1 *Uttar Rampur 87 20.7 40.2 39.1 65.5 100.0 0.0 0.0
19 67 51 Dakshin Durgapur Union Total 10060 28.0 69.6 2.4 97.9 60.5 38.0 1.5
19 67 51 017 1 *Amudpur 42 11.9 88.1 0.0 92.9 42.9 57.1 0.0
19 67 51 066 1 *Bara Alampur 388 7.7 92.0 0.3 98.5 87.6 11.6 0.8
19 67 51 118 1 *Bishnupur 97 15.5 77.3 7.2 85.6 92.8 6.2 1.0
RMO: 1 = Rural, 2 = Urban and 3 = Other Urban Page 103 of 162

Tap Tube-Well Other Owned Rented Rent free
2 3 4 5 6 7 8 9 10
MZ /
MHVill RMO
1
Table C-15: Distribution of General Households by Source of Drinking Water, Electricity Connection and Housing Tenancy Status, by Residence
and Community
Administrative Unit
Residence
Community
Number of
Households
Source of Drinking Water (%) Electricity
Connection
(%)
Housing Tenancy (%)
ZL UZUN /
WA
19 67 51 133 1 *Champaknagar 1832 17.2 81.4 1.4 99.0 55.0 43.3 1.6
19 67 51 163 1 *Chhota Alampur 400 58.3 40.5 1.3 99.0 46.5 53.5 0.0
19 67 51 193 1 *Dakshin Balarampur 686 16.3 82.5 1.2 98.8 75.4 21.4 3.2
19 67 51 230 1 *Dakshin Rajapur 487 16.0 71.9 12.1 97.5 75.8 22.6 1.6
19 67 51 230 01 1 Rajapur 206 16.5 69.4 14.1 98.1 79.1 19.9 1.0
19 67 51 230 02 1 Khetashar 281 15.7 73.7 10.7 97.2 73.3 24.6 2.1
19 67 51 257 1 *Daulatpur 2136 34.6 64.1 1.3 97.6 46.5 51.7 1.8
19 67 51 284 1 *Dhanpur 190 3.7 86.8 9.5 88.4 85.3 12.1 2.6
19 67 51 297 1 *Dharmapur 1294 46.6 52.6 0.8 99.3 39.2 60.7 0.1
19 67 51 373 1 *Hadgora 35 54.3 45.7 0.0 97.1 74.3 11.4 14.3
19 67 51 410 1 *Jagurjuli 52 42.3 57.7 0.0 100.0 61.5 25.0 13.5
19 67 51 475 1 *Kalikapur 204 59.8 40.2 0.0 99.0 64.2 35.3 0.5
19 67 51 509 1 *Kashinathpur 449 17.4 76.2 6.5 99.3 83.3 14.9 1.8
19 67 51 537 1 *Krishnapur 158 22.2 77.8 0.0 98.7 80.4 16.5 3.2
19 67 51 591 1 *Madinagar 303 10.2 75.6 14.2 89.1 89.1 8.9 2.0
19 67 51 622 1 *Noapara 577 23.9 75.4 0.7 99.5 79.4 20.6 0.0
19 67 51 725 1 *Rajendrapur 270 58.1 40.0 1.9 98.9 36.7 63.0 0.4
19 67 51 777 1 *Rahimpur 147 15.6 84.4 0.0 97.3 72.1 23.8 4.1
19 67 51 804 1 *Rangapur 107 20.6 79.4 0.0 99.1 94.4 3.7 1.9
19 67 51 891 1 *Sreedharpur 206 16.0 84.0 0.0 93.2 83.0 16.5 0.5
19 67 65 Jagannathpur Union Total 10327 12.0 82.7 5.3 96.1 80.2 17.2 2.6
19 67 65 024 1 *Aranyapur 653 1.5 98.3 0.2 93.6 96.6 1.8 1.5
19 67 65 032 1 *Bajgadda 173 24.3 71.1 4.6 96.5 91.9 5.2 2.9
19 67 65 084 1 *Bara Para 1483 22.7 73.8 3.4 98.9 54.3 43.3 2.4
19 67 65 084 01 1 Bara Para 768 35.5 63.3 1.2 98.7 51.7 44.8 3.5
19 67 65 084 02 1 Krishnapur 575 7.5 86.3 6.3 99.5 59.7 39.5 0.9
19 67 65 084 03 1 Durgapur 140 15.0 80.7 4.3 97.1 46.4 50.7 2.9
19 67 65 099 1 *Bhatkeshar 142 0.0 100.0 0.0 93.7 94.4 0.0 5.6
19 67 65 111 1 *Bhutua 125 10.4 89.6 0.0 99.2 84.8 11.2 4.0
RMO: 1 = Rural, 2 = Urban and 3 = Other Urban Page 104 of 162

Tap Tube-Well Other Owned Rented Rent free
2 3 4 5 6 7 8 9 10
MZ /
MHVill RMO
1
Table C-15: Distribution of General Households by Source of Drinking Water, Electricity Connection and Housing Tenancy Status, by Residence
and Community
Administrative Unit
Residence
Community
Number of
Households
Source of Drinking Water (%) Electricity
Connection
(%)
Housing Tenancy (%)
ZL UZUN /
WA
19 67 65 150 1 *Chapapur 963 26.8 73.1 0.1 99.0 61.9 37.1 1.0
19 67 65 150 01 1 Chapapur 576 39.4 60.6 0.0 98.3 58.2 41.5 0.3
19 67 65 150 02 1 Balutupa 387 8.0 91.7 0.3 100.0 67.4 30.5 2.1
19 67 65 160 1 *Anandapur 397 3.0 97.0 0.0 90.4 93.2 2.3 4.5
19 67 65 249 1 *Dauderkhara 62 0.0 74.2 25.8 93.5 93.5 3.2 3.2
19 67 65 259 1 *Daulatpur 559 14.1 75.0 10.9 97.7 79.6 16.8 3.6
19 67 65 289 1 *Dhanpur 225 2.2 69.3 28.4 96.0 86.2 10.7 3.1
19 67 65 348 1 *Gazipur 536 4.9 73.9 21.3 80.2 92.7 3.0 4.3
19 67 65 353 1 *Ghilatali 151 10.6 77.5 11.9 95.4 94.0 4.0 2.0
19 67 65 376 1 *Durlabhpur 186 15.1 83.9 1.1 98.9 94.6 2.2 3.2
19 67 65 455 1 *Jhakani Para 505 4.0 96.0 0.0 96.2 88.7 9.3 2.0
19 67 65 460 1 *Jagannathpur 474 4.4 94.3 1.3 99.2 83.5 14.6 1.9
19 67 65 462 1 *Jora Meher 146 2.1 97.9 0.0 96.6 96.6 1.4 2.1
19 67 65 477 1 *Kalikapur 227 9.7 84.1 6.2 98.2 93.8 0.4 5.7
19 67 65 487 1 *Kamalpur 197 3.6 94.9 1.5 97.5 97.0 1.5 1.5
19 67 65 499 1 *Kartikpur 56 1.8 83.9 14.3 100.0 100.0 0.0 0.0
19 67 65 512 1 *Katak Bazar 129 8.5 91.5 0.0 100.0 93.0 3.1 3.9
19 67 65 542 1 *Krishnapur 125 4.8 95.2 0.0 96.8 96.0 2.4 1.6
19 67 65 544 1 *Khamar Krishnapur 143 4.9 95.1 0.0 99.3 79.0 18.2 2.8
19 67 65 546 1 *Kuchaitali 788 15.2 84.6 0.1 99.5 55.5 42.6 1.9
19 67 65 606 1 *Managram 146 13.7 86.3 0.0 100.0 82.2 15.1 2.7
19 67 65 665 1 *Nasrail 155 0.0 100.0 0.0 99.4 94.8 0.6 4.5
19 67 65 680 1 *Noapara Paschim 120 0.0 100.0 0.0 95.8 88.3 9.2 2.5
19 67 65 689 1 *Purba Sreepur 67 1.5 98.5 0.0 100.0 100.0 0.0 0.0
19 67 65 754 1 *Noapara Purba 62 0.0 100.0 0.0 91.9 91.9 4.8 3.2
19 67 65 759 1 *Ramchandrapur 81 14.8 85.2 0.0 100.0 81.5 16.0 2.5
19 67 65 772 1 *Raghupur 155 28.4 71.6 0.0 100.0 94.2 5.2 0.6
19 67 65 799 1 *Rajmangalpur 362 2.8 57.7 39.5 87.0 89.5 8.0 2.5
19 67 65 814 1 *Sahapur 173 2.3 93.1 4.6 89.6 95.4 0.0 4.6
RMO: 1 = Rural, 2 = Urban and 3 = Other Urban Page 105 of 162

Tap Tube-Well Other Owned Rented Rent free
2 3 4 5 6 7 8 9 10
MZ /
MHVill RMO
1
Table C-15: Distribution of General Households by Source of Drinking Water, Electricity Connection and Housing Tenancy Status, by Residence
and Community
Administrative Unit
Residence
Community
Number of
Households
Source of Drinking Water (%) Electricity
Connection
(%)
Housing Tenancy (%)
ZL UZUN /
WA
19 67 65 846 1 *Sawara 95 15.8 58.9 25.3 96.8 97.9 0.0 2.1
19 67 65 883 1 *Sreemantapur Haripur 159 54.1 45.9 0.0 98.1 98.7 1.3 0.0
19 67 65 933 1 *Tetaiara 307 2.0 98.0 0.0 95.4 93.5 3.3 3.3
19 67 68 Kalir Bazar Union Total 9210 2.9 95.9 1.2 93.6 95.3 3.1 1.5
19 67 68 1 Kalir Bazar Union 8298 3.0 95.7 1.3 94.0 95.2 3.3 1.5
19 67 68 3 Kalir Bazar Union 912 2.0 98.0 0.0 90.2 96.7 1.2 2.1
19 67 68 126 1 *Budhair 834 15.1 83.8 1.1 96.4 82.0 16.7 1.3
19 67 68 126 01 1 Budhair 298 26.2 70.8 3.0 96.0 70.8 26.8 2.3
19 67 68 126 02 1 Olipur 302 5.3 94.7 0.0 98.0 98.0 1.0 1.0
19 67 68 126 03 1 Gopalshar 234 13.7 86.3 0.0 94.9 75.6 23.9 0.4
19 67 68 185 1 *Daiara 95 1.1 98.9 0.0 94.7 98.9 0.0 1.1
19 67 68 269 1 *Dhainakhola 1045 4.0 95.7 0.3 96.7 98.1 0.8 1.1
19 67 68 269 01 1 Dhainakhola 791 4.7 95.2 0.1 96.8 97.9 1.0 1.1
19 67 68 269 02 1 Belun Nagar 162 0.0 98.8 1.2 96.3 98.8 0.0 1.2
19 67 68 269 03 1 Chhangaon 92 5.4 94.6 0.0 95.7 98.9 0.0 1.1
19 67 68 329 1 *Fenua 153 0.7 99.3 0.0 91.5 99.3 0.7 0.0
19 67 68 383 3 *Hatigara 658 1.8 98.2 0.0 88.4 97.3 1.5 1.2
19 67 68 383 01 3 Hatigara 262 3.4 96.6 0.0 92.7 95.0 3.1 1.9
19 67 68 383 02 3 Jangalia 178 1.7 98.3 0.0 84.8 99.4 0.0 0.6
19 67 68 383 03 3 Ujirpur 218 0.0 100.0 0.0 86.2 98.2 0.9 0.9
19 67 68 482 1 *Kamalapur 506 1.8 98.2 0.0 95.8 97.4 0.6 2.0
19 67 68 482 01 1 Kamalapur 413 1.9 98.1 0.0 95.4 97.3 0.7 1.9
19 67 68 482 02 1 Chhamuarpar 93 1.1 98.9 0.0 97.8 97.8 0.0 2.2
19 67 68 626 1 *Mustafapur 46 4.3 95.7 0.0 95.7 95.7 4.3 0.0
19 67 68 650 1 *Monshasan 762 0.3 99.3 0.4 97.6 98.3 1.2 0.5
19 67 68 650 01 1 Monshasan 566 0.4 99.1 0.5 98.2 97.9 1.4 0.7
19 67 68 650 02 1 Kamcr Bagh 196 0.0 100.0 0.0 95.9 99.5 0.5 0.0
19 67 68 695 1 *Pakamora 358 0.3 88.5 11.2 86.0 98.9 0.0 1.1
19 67 68 700 1 *Paschim Anandapur 444 0.7 99.3 0.0 96.4 95.9 1.1 2.9
RMO: 1 = Rural, 2 = Urban and 3 = Other Urban Page 106 of 162

Tap Tube-Well Other Owned Rented Rent free
2 3 4 5 6 7 8 9 10
MZ /
MHVill RMO
1
Table C-15: Distribution of General Households by Source of Drinking Water, Electricity Connection and Housing Tenancy Status, by Residence
and Community
Administrative Unit
Residence
Community
Number of
Households
Source of Drinking Water (%) Electricity
Connection
(%)
Housing Tenancy (%)
ZL UZUN /
WA
19 67 68 702 1 *Paschim Ballabhpur 832 0.7 99.3 0.0 95.1 96.8 1.3 1.9
19 67 68 702 01 1 Paschim Ballabhpur 699 0.3 99.7 0.0 95.7 96.4 1.3 2.3
19 67 68 702 02 1 Budnag 133 3.0 97.0 0.0 91.7 98.5 1.5 0.0
19 67 68 710 1 *Paschim Jashpur 896 1.7 98.2 0.1 92.5 93.8 4.9 1.3
19 67 68 710 01 1 Jashpur 382 0.3 99.7 0.0 92.4 99.2 0.0 0.8
19 67 68 710 02 1 Kalir Bazar 99 8.1 91.9 0.0 99.0 74.7 25.3 0.0
19 67 68 710 03 1 Kumar Puskarini 226 0.0 100.0 0.0 89.4 89.4 8.4 2.2
19 67 68 710 04 1 Bakhrabad 189 3.2 96.3 0.5 93.1 97.9 0.0 2.1
19 67 68 715 1 *Paschim Krishnapur 345 0.9 99.1 0.0 92.5 99.7 0.0 0.3
19 67 68 727 3 *Saktala 254 2.4 97.6 0.0 94.9 95.3 0.4 4.3
19 67 68 727 01 3 Saktala 108 0.0 100.0 0.0 96.3 93.5 0.9 5.6
19 67 68 727 02 3 Dhanuais 146 4.1 95.9 0.0 93.8 96.6 0.0 3.4
19 67 68 747 1 *Purba Jangalia 224 0.0 100.0 0.0 92.0 99.6 0.4 0.0
19 67 68 816 1 *Saidpur 957 3.0 94.5 2.5 92.4 93.9 3.4 2.6
19 67 68 816 01 1 Saidpur 783 3.3 93.6 3.1 93.2 92.6 4.2 3.2
19 67 68 816 02 1 Bejbari 174 1.7 98.3 0.0 88.5 100.0 0.0 0.0
19 67 68 970 1 *Dighalgaon 489 0.6 93.5 5.9 92.6 93.9 3.9 2.2
19 67 68 970 01 1 Dighalgaon 171 0.6 99.4 0.0 99.4 96.5 3.5 0.0
19 67 68 970 02 1 Roycho 318 0.6 90.3 9.1 89.0 92.5 4.1 3.5
19 67 68 986 1 *Uttar Kachar 312 0.6 98.7 0.6 84.9 98.7 0.3 1.0
19 67 68 986 01 1 Uttar Lalmai Kachar 104 0.0 100.0 0.0 88.5 97.1 0.0 2.9
19 67 68 986 02 1 Dakshin Lalmaika Char 208 1.0 98.1 1.0 83.2 99.5 0.5 0.0
19 67 90 Panchthubi Union Total 10028 26.1 71.8 2.1 95.4 75.1 23.3 1.5
19 67 90 1 Panchthubi Union 9836 26.6 71.3 2.1 95.5 74.7 23.8 1.5
19 67 90 3 Panchthubi Union 192 2.1 97.9 0.0 90.6 97.4 0.0 2.6
19 67 90 064 1 *Bara Kalikapur 295 5.4 80.7 13.9 90.5 97.3 0.3 2.4
19 67 90 064 01 1 Kalikapur 230 3.9 87.8 8.3 89.6 97.4 0.4 2.2
19 67 90 064 02 1 Ramchandrapur 65 10.8 55.4 33.8 93.8 96.9 0.0 3.1
19 67 90 076 1 *Baraipur 99 9.1 66.7 24.2 71.7 99.0 0.0 1.0
RMO: 1 = Rural, 2 = Urban and 3 = Other Urban Page 107 of 162
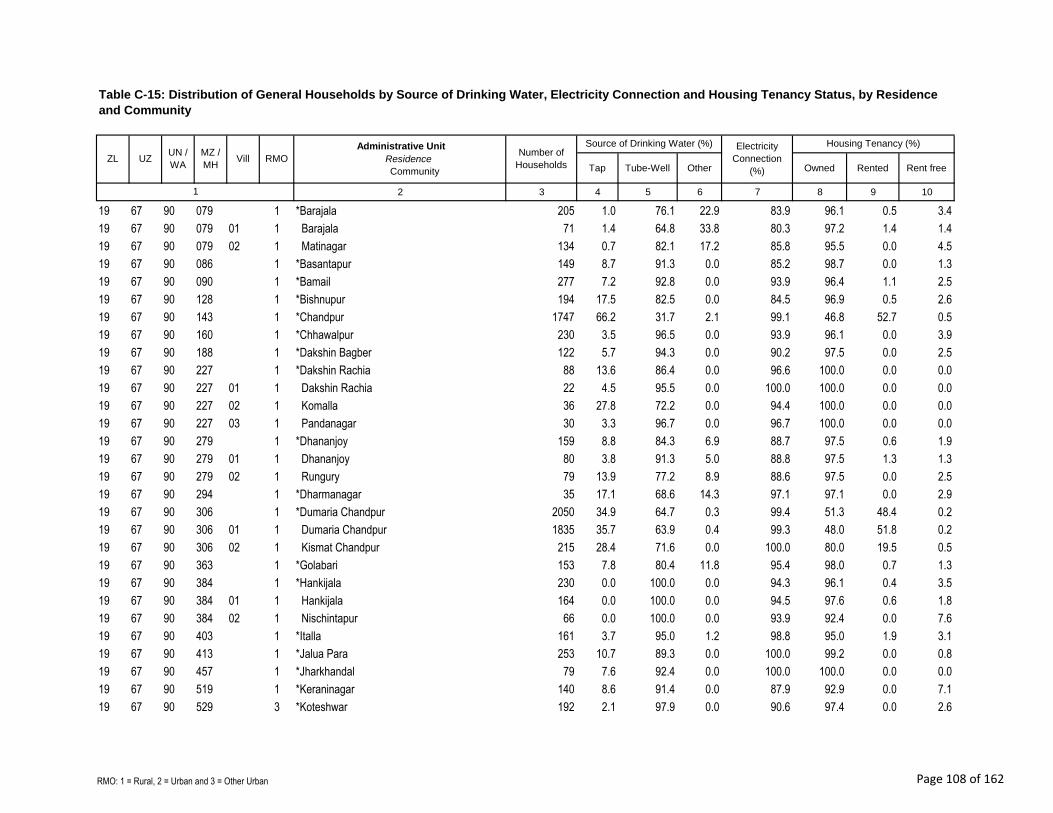
Tap Tube-Well Other Owned Rented Rent free
2 3 4 5 6 7 8 9 10
MZ /
MHVill RMO
1
Table C-15: Distribution of General Households by Source of Drinking Water, Electricity Connection and Housing Tenancy Status, by Residence
and Community
Administrative Unit
Residence
Community
Number of
Households
Source of Drinking Water (%) Electricity
Connection
(%)
Housing Tenancy (%)
ZL UZUN /
WA
19 67 90 079 1 *Barajala 205 1.0 76.1 22.9 83.9 96.1 0.5 3.4
19 67 90 079 01 1 Barajala 71 1.4 64.8 33.8 80.3 97.2 1.4 1.4
19 67 90 079 02 1 Matinagar 134 0.7 82.1 17.2 85.8 95.5 0.0 4.5
19 67 90 086 1 *Basantapur 149 8.7 91.3 0.0 85.2 98.7 0.0 1.3
19 67 90 090 1 *Bamail 277 7.2 92.8 0.0 93.9 96.4 1.1 2.5
19 67 90 128 1 *Bishnupur 194 17.5 82.5 0.0 84.5 96.9 0.5 2.6
19 67 90 143 1 *Chandpur 1747 66.2 31.7 2.1 99.1 46.8 52.7 0.5
19 67 90 160 1 *Chhawalpur 230 3.5 96.5 0.0 93.9 96.1 0.0 3.9
19 67 90 188 1 *Dakshin Bagber 122 5.7 94.3 0.0 90.2 97.5 0.0 2.5
19 67 90 227 1 *Dakshin Rachia 88 13.6 86.4 0.0 96.6 100.0 0.0 0.0
19 67 90 227 01 1 Dakshin Rachia 22 4.5 95.5 0.0 100.0 100.0 0.0 0.0
19 67 90 227 02 1 Komalla 36 27.8 72.2 0.0 94.4 100.0 0.0 0.0
19 67 90 227 03 1 Pandanagar 30 3.3 96.7 0.0 96.7 100.0 0.0 0.0
19 67 90 279 1 *Dhananjoy 159 8.8 84.3 6.9 88.7 97.5 0.6 1.9
19 67 90 279 01 1 Dhananjoy 80 3.8 91.3 5.0 88.8 97.5 1.3 1.3
19 67 90 279 02 1 Rungury 79 13.9 77.2 8.9 88.6 97.5 0.0 2.5
19 67 90 294 1 *Dharmanagar 35 17.1 68.6 14.3 97.1 97.1 0.0 2.9
19 67 90 306 1 *Dumaria Chandpur 2050 34.9 64.7 0.3 99.4 51.3 48.4 0.2
19 67 90 306 01 1 Dumaria Chandpur 1835 35.7 63.9 0.4 99.3 48.0 51.8 0.2
19 67 90 306 02 1 Kismat Chandpur 215 28.4 71.6 0.0 100.0 80.0 19.5 0.5
19 67 90 363 1 *Golabari 153 7.8 80.4 11.8 95.4 98.0 0.7 1.3
19 67 90 384 1 *Hankijala 230 0.0 100.0 0.0 94.3 96.1 0.4 3.5
19 67 90 384 01 1 Hankijala 164 0.0 100.0 0.0 94.5 97.6 0.6 1.8
19 67 90 384 02 1 Nischintapur 66 0.0 100.0 0.0 93.9 92.4 0.0 7.6
19 67 90 403 1 *Italla 161 3.7 95.0 1.2 98.8 95.0 1.9 3.1
19 67 90 413 1 *Jalua Para 253 10.7 89.3 0.0 100.0 99.2 0.0 0.8
19 67 90 457 1 *Jharkhandal 79 7.6 92.4 0.0 100.0 100.0 0.0 0.0
19 67 90 519 1 *Keraninagar 140 8.6 91.4 0.0 87.9 92.9 0.0 7.1
19 67 90 529 3 *Koteshwar 192 2.1 97.9 0.0 90.6 97.4 0.0 2.6
RMO: 1 = Rural, 2 = Urban and 3 = Other Urban Page 108 of 162

Tap Tube-Well Other Owned Rented Rent free
2 3 4 5 6 7 8 9 10
MZ /
MHVill RMO
1
Table C-15: Distribution of General Households by Source of Drinking Water, Electricity Connection and Housing Tenancy Status, by Residence
and Community
Administrative Unit
Residence
Community
Number of
Households
Source of Drinking Water (%) Electricity
Connection
(%)
Housing Tenancy (%)
ZL UZUN /
WA
19 67 90 640 1 *Mirpur 116 10.3 89.7 0.0 98.3 98.3 0.0 1.7
19 67 90 697 1 *Panchthubi 267 10.5 89.5 0.0 95.5 93.6 0.4 6.0
19 67 90 720 1 *Paschim Majhigachha 393 6.4 93.6 0.0 98.5 89.3 9.9 0.8
19 67 90 814 1 *Sahapur 166 6.6 93.4 0.0 81.9 98.8 0.0 1.2
19 67 90 821 1 *Saldhar 422 2.1 97.6 0.2 93.6 88.9 5.5 5.7
19 67 90 836 1 *Sharifpur 300 6.0 93.0 1.0 87.0 97.7 0.7 1.7
19 67 90 903 1 *Subhapur 625 47.2 50.7 2.1 99.8 56.6 42.9 0.5
19 67 90 905 1 *Subarnapur 242 21.1 78.9 0.0 98.8 97.9 1.2 0.8
19 67 90 955 1 *Uttar Bagber 118 3.4 96.6 0.0 89.8 100.0 0.0 0.0
19 67 90 977 1 *Uttar Jagannath 67 14.9 85.1 0.0 94.0 100.0 0.0 0.0
19 67 90 985 1 *Uttar Rachaia 143 7.0 93.0 0.0 81.8 98.6 0.0 1.4
19 67 90 994 1 *Sreepur 311 20.3 79.7 0.0 97.4 73.3 25.7 1.0
19 67 94 Uttar Durgapur Union Total 11186 28.3 67.2 4.5 97.1 60.6 36.7 2.7
19 67 94 3 Uttar Durgapur Union 11186 28.3 67.2 4.5 97.1 60.6 36.7 2.7
19 67 94 007 3 *Alekhar Char 968 29.8 65.1 5.2 95.8 69.5 24.7 5.8
19 67 94 014 3 *Amtali 1087 50.3 46.8 2.9 93.9 39.0 55.5 5.5
19 67 94 014 01 3 Nischintpur 666 56.6 43.4 0.0 99.7 22.2 77.8 0.0
19 67 94 014 02 3 Kachiatali 87 21.8 57.5 20.7 66.7 85.1 3.4 11.5
19 67 94 014 03 3 Amtali 334 45.2 50.9 3.9 89.5 60.5 24.6 15.0
19 67 94 022 3 *Araiura 2218 13.4 84.4 2.3 97.3 69.2 28.0 2.8
19 67 94 029 3 *Badarpur 849 6.8 88.0 5.2 95.9 62.5 36.0 1.4
19 67 94 029 01 3 Badarpur 565 9.6 82.7 7.8 94.7 62.7 35.2 2.1
19 67 94 029 02 3 Mura Para 284 1.4 98.6 0.0 98.2 62.3 37.7 0.0
19 67 94 071 3 *Baradail 545 29.0 54.1 16.9 98.5 81.1 18.5 0.4
19 67 94 071 01 3 Uttar Bar Adail 290 27.6 44.1 28.3 97.6 90.7 9.0 0.3
19 67 94 071 02 3 Dakshin Baradail 255 30.6 65.5 3.9 99.6 70.2 29.4 0.4
19 67 94 371 3 *Gunanandi 1513 41.3 57.7 1.0 99.3 55.7 43.8 0.5
19 67 94 371 01 3 Gunanandi 769 46.7 51.9 1.4 99.3 52.5 46.8 0.7
19 67 94 371 02 3 Sahebnagar 593 36.1 63.7 0.2 99.2 55.0 45.0 0.0
RMO: 1 = Rural, 2 = Urban and 3 = Other Urban Page 109 of 162

Tap Tube-Well Other Owned Rented Rent free
2 3 4 5 6 7 8 9 10
MZ /
MHVill RMO
1
Table C-15: Distribution of General Households by Source of Drinking Water, Electricity Connection and Housing Tenancy Status, by Residence
and Community
Administrative Unit
Residence
Community
Number of
Households
Source of Drinking Water (%) Electricity
Connection
(%)
Housing Tenancy (%)
ZL UZUN /
WA
19 67 94 371 03 3 Anandashar 151 34.4 63.6 2.0 100.0 74.8 23.2 2.0
19 67 94 532 3 *Krishnanagar 330 23.0 77.0 0.0 100.0 85.5 14.2 0.3
19 67 94 826 3 *Samajaddipur 118 51.7 48.3 0.0 100.0 69.5 30.5 0.0
19 67 94 831 3 *Sankarpur 305 18.4 81.0 0.7 99.3 64.6 34.4 1.0
19 67 94 835 3 *Sreepur 10 60.0 40.0 0.0 100.0 90.0 10.0 0.0
19 67 94 845 3 *Shasangachha (Part) 1833 44.8 54.6 0.7 99.6 42.8 56.1 1.0
19 67 94 972 3 *Uttar Durgapur (Part) 1410 12.2 73.2 14.6 93.4 69.4 24.9 5.7
19 67 98 Comilla Cantt Total 1597 100.0 0.0 0.0 98.9 1.3 97.9 0.8
19 67 98 998 2 *Comilla Cantt. 1597 100.0 0.0 0.0 98.9 1.3 97.9 0.8
19 72 Laksam Upazila Total 56910 4.4 89.3 6.4 77.5 92.9 5.9 1.2
19 72 1 Laksam Upazila 42955 0.7 92.3 7.0 72.1 98.6 0.6 0.8
19 72 2 Laksam Upazila 13955 15.7 79.9 4.4 94.2 75.2 22.4 2.4
Laksam Paurashava
19 72 01 Ward No-01 Total 1743 19.6 77.3 3.2 94.5 57.1 41.3 1.7
19 72 01 632 2 *Misree 790 23.8 74.6 1.6 96.5 48.6 48.9 2.5
19 72 01 652 2 *Nasarat Pur 679 21.5 77.0 1.5 91.6 62.7 36.1 1.2
19 72 01 875 2 *Sreepur 274 2.6 85.8 11.7 96.0 67.5 32.1 0.4
19 72 02 Ward No-02 Total 1332 13.7 86.1 0.2 94.1 79.4 15.5 5.0
19 72 02 092 2 *Bain Chatia 112 2.7 97.3 0.0 100.0 100.0 0.0 0.0
19 72 02 105 2 *Bara Tupa 319 53.9 46.1 0.0 84.3 28.8 51.4 19.7
19 72 02 283 2 *Duriya Bishnapur 197 1.0 99.0 0.0 94.4 88.3 11.2 0.5
19 72 02 522 2 *Kundra 320 0.9 98.8 0.3 98.8 98.1 1.9 0.0
19 72 02 680 2 *Paikpara 384 0.8 99.0 0.3 96.4 95.3 3.9 0.8
19 72 03 Ward No-03 Total 1105 1.4 89.4 9.1 95.3 97.9 1.7 0.4
19 72 03 255 2 *Binoye 360 0.0 98.9 1.1 91.9 98.6 0.6 0.8
19 72 03 392 2 *Gopal Pur 279 3.9 78.5 17.6 98.9 99.3 0.7 0.0
19 72 03 480 2 *Kumardoga 202 1.5 94.1 4.5 92.1 96.5 3.0 0.5
19 72 03 864 2 *Seurain 264 0.8 84.5 14.8 98.5 96.6 3.4 0.0
19 72 04 Ward No-04 Total 1475 29.6 64.5 5.8 92.1 60.3 36.6 3.1
RMO: 1 = Rural, 2 = Urban and 3 = Other Urban Page 110 of 162

Tap Tube-Well Other Owned Rented Rent free
2 3 4 5 6 7 8 9 10
MZ /
MHVill RMO
1
Table C-15: Distribution of General Households by Source of Drinking Water, Electricity Connection and Housing Tenancy Status, by Residence
and Community
Administrative Unit
Residence
Community
Number of
Households
Source of Drinking Water (%) Electricity
Connection
(%)
Housing Tenancy (%)
ZL UZUN /
WA
19 72 04 220 2 *Daulatganj 186 10.2 76.3 13.4 99.5 44.1 49.5 6.5
19 72 04 760 2 *Peayara Pur 268 0.0 78.7 21.3 73.9 89.6 4.9 5.6
19 72 04 839 2 *Uttar Laksam 1021 40.9 58.7 0.4 95.5 55.6 42.6 1.8
19 72 05 Ward No-05 Total 1863 18.9 77.7 3.4 95.3 71.0 27.9 1.2
19 72 05 725 2 *Uttar Paschhim Gaon 1863 18.9 77.7 3.4 95.3 71.0 27.9 1.2
19 72 06 Ward No-06 Total 1757 17.5 78.3 4.2 93.5 78.0 19.1 2.9
19 72 06 190 2 *Batha Khali 528 3.8 96.0 0.2 93.2 97.9 0.8 1.3
19 72 06 225 2 *Dakshin Pascim Gaon 1106 25.9 67.5 6.5 95.5 66.3 29.9 3.8
19 72 06 400 2 *Kachiamura 123 0.8 99.2 0.0 76.4 98.4 0.0 1.6
19 72 07 Ward No-07 Total 1561 6.9 83.6 9.5 91.8 81.4 17.1 1.5
19 72 07 272 2 *Dhamaicha 195 1.5 98.5 0.0 93.8 90.8 5.6 3.6
19 72 07 348 2 *Fateh Pur 554 15.2 81.2 3.6 94.8 57.0 41.2 1.8
19 72 07 380 2 *Gazimura 812 2.5 81.7 15.9 89.3 95.7 3.4 0.9
19 72 08 Ward No-08 Total 1826 23.8 72.2 3.9 96.0 72.3 25.9 1.8
19 72 08 260 2 *Dakshin Laksam 287 43.9 55.1 1.0 100.0 74.6 24.0 1.4
19 72 08 323 2 *Gandamara 227 0.4 99.6 0.0 94.3 90.3 8.4 1.3
19 72 08 378 2 *Gunti 498 0.6 90.0 9.4 92.2 96.4 0.6 3.0
19 72 08 584 2 *Madhya Laksam 489 54.6 44.6 0.8 100.0 35.0 64.2 0.8
19 72 08 722 2 *Purba Lakshm 325 11.7 82.8 5.5 93.5 76.9 20.9 2.2
19 72 09 Ward No-09 Total 1293 0.8 98.5 0.8 94.9 91.6 4.0 4.3
19 72 09 180 2 *Bozpara 215 1.9 98.1 0.0 94.9 92.6 3.7 3.7
19 72 09 600 2 *Kadra 283 1.8 98.2 0.0 98.6 80.2 9.2 10.6
19 72 09 688 2 *Shatbaria 370 0.3 98.9 0.8 94.9 91.4 4.6 4.1
19 72 09 980 2 *Uttarkul 425 0.0 98.4 1.6 92.5 99.1 0.2 0.7
19 72 17 Bakai Union Total 8210 1.1 92.6 6.3 81.6 98.1 0.9 1.0
19 72 17 026 1 *Asara 147 0.0 100.0 0.0 92.5 99.3 0.7 0.0
19 72 17 062 1 *Bakai 642 0.3 94.4 5.3 88.3 99.7 0.2 0.2
19 72 17 102 1 *Baraigon 256 0.0 100.0 0.0 78.9 99.2 0.0 0.8
19 72 17 102 01 1 Baraigon 190 0.0 100.0 0.0 80.0 100.0 0.0 0.0
RMO: 1 = Rural, 2 = Urban and 3 = Other Urban Page 111 of 162

Tap Tube-Well Other Owned Rented Rent free
2 3 4 5 6 7 8 9 10
MZ /
MHVill RMO
1
Table C-15: Distribution of General Households by Source of Drinking Water, Electricity Connection and Housing Tenancy Status, by Residence
and Community
Administrative Unit
Residence
Community
Number of
Households
Source of Drinking Water (%) Electricity
Connection
(%)
Housing Tenancy (%)
ZL UZUN /
WA
19 72 17 102 02 1 Debipur 66 0.0 100.0 0.0 75.8 97.0 0.0 3.0
19 72 17 132 1 *Bhabak Para 939 2.8 91.8 5.4 82.4 98.7 0.2 1.1
19 72 17 132 01 1 Guchakara 113 0.9 92.9 6.2 78.8 95.6 0.9 3.5
19 72 17 132 02 1 Sangurpur 160 9.4 90.6 0.0 90.0 100.0 0.0 0.0
19 72 17 132 03 1 Bhabak Para 666 1.5 91.9 6.6 81.2 98.9 0.2 0.9
19 72 17 164 1 *Bijra 776 0.4 96.8 2.8 81.3 92.4 5.8 1.8
19 72 17 164 01 1 Chhota Bijra 225 0.0 98.2 1.8 92.4 99.6 0.0 0.4
19 72 17 164 02 1 Bara Bijra 404 0.5 95.0 4.5 78.0 86.6 11.1 2.2
19 72 17 164 03 1 Faloua 147 0.7 99.3 0.0 73.5 97.3 0.0 2.7
19 72 17 218 1 *Chhota Rajapur 28 0.0 100.0 0.0 67.9 92.9 0.0 7.1
19 72 17 252 1 *Dakshin Birahimpur 24 0.0 100.0 0.0 62.5 95.8 0.0 4.2
19 72 17 328 1 *Dupchar 181 0.0 91.2 8.8 87.8 98.9 0.6 0.6
19 72 17 397 1 *Harish Char 156 11.5 88.5 0.0 82.7 93.6 1.3 5.1
19 72 17 403 1 *Hatilota 185 2.7 90.3 7.0 74.6 100.0 0.0 0.0
19 72 17 435 1 *Joysree 292 1.0 92.1 6.8 89.0 98.6 0.7 0.7
19 72 17 448 1 *Kachraish 102 1.0 99.0 0.0 77.5 100.0 0.0 0.0
19 72 17 457 1 *Kagghar 42 0.0 2.4 97.6 4.8 100.0 0.0 0.0
19 72 17 462 1 *Kaitra 541 0.2 95.9 3.9 83.0 99.3 0.6 0.2
19 72 17 482 1 *Kapastala 630 0.6 86.0 13.3 83.8 97.3 1.0 1.7
19 72 17 503 1 *Khaiakhali 49 0.0 4.1 95.9 38.8 98.0 0.0 2.0
19 72 17 519 1 *Kowar 452 1.3 93.6 5.1 74.1 99.6 0.0 0.4
19 72 17 523 1 *Kotaisa 244 1.6 84.4 13.9 24.2 99.6 0.0 0.4
19 72 17 523 01 1 Kotaisa 231 1.7 89.2 9.1 25.5 99.6 0.0 0.4
19 72 17 523 02 1 Parakandi 13 0.0 0.0 100.0 0.0 100.0 0.0 0.0
19 72 17 555 1 *Madhur Char 175 0.6 99.4 0.0 73.1 97.7 0.6 1.7
19 72 17 579 1 *Majlishpur 118 2.5 97.5 0.0 93.2 96.6 0.8 2.5
19 72 17 582 1 *Mali Baurtala 141 2.1 97.9 0.0 75.9 100.0 0.0 0.0
19 72 17 627 1 *Mohanpur 193 0.0 98.4 1.6 92.2 99.5 0.0 0.5
19 72 17 677 1 *Panch Para 199 0.0 100.0 0.0 81.4 99.0 0.0 1.0
RMO: 1 = Rural, 2 = Urban and 3 = Other Urban Page 112 of 162

Tap Tube-Well Other Owned Rented Rent free
2 3 4 5 6 7 8 9 10
MZ /
MHVill RMO
1
Table C-15: Distribution of General Households by Source of Drinking Water, Electricity Connection and Housing Tenancy Status, by Residence
and Community
Administrative Unit
Residence
Community
Number of
Households
Source of Drinking Water (%) Electricity
Connection
(%)
Housing Tenancy (%)
ZL UZUN /
WA
19 72 17 697 1 *Paschim Alokdia 91 0.0 100.0 0.0 93.4 98.9 0.0 1.1
19 72 17 779 1 *Rasulpur 155 0.0 100.0 0.0 99.4 99.4 0.0 0.6
19 72 17 867 1 *Sikari Para 239 0.4 84.9 14.6 80.3 97.1 2.1 0.8
19 72 17 916 1 *Tarapur 151 1.3 98.7 0.0 96.7 98.7 0.7 0.7
19 72 17 937 1 *Udhair 81 0.0 100.0 0.0 34.6 97.5 0.0 2.5
19 72 17 950 1 *Uttar Ashwadia 277 1.4 94.9 3.6 95.7 98.2 1.1 0.7
19 72 17 969 1 *Uttar Gazipur 271 0.4 96.7 3.0 95.2 100.0 0.0 0.0
19 72 17 973 1 *Uttar Hajipur 221 1.4 74.7 24.0 91.9 98.6 0.0 1.4
19 72 17 986 1 *Uttar Nurpur 212 0.0 100.0 0.0 84.4 97.6 0.5 1.9
19 72 35 Gobindapur Union Total 4989 0.4 89.5 10.1 78.8 99.1 0.2 0.7
19 72 35 023 1 *Angaria 97 4.1 53.6 42.3 71.1 96.9 1.0 2.1
19 72 35 086 1 *Bara Ichhapur 915 0.2 90.9 8.9 88.0 99.7 0.0 0.3
19 72 35 086 01 1 Satghar 206 0.0 100.0 0.0 93.2 99.5 0.0 0.5
19 72 35 086 02 1 Ichhapur 709 0.3 88.3 11.4 86.5 99.7 0.0 0.3
19 72 35 129 1 *Betihati 206 0.5 99.5 0.0 84.5 100.0 0.0 0.0
19 72 35 140 1 *Bhatbaria (Part) 94 0.0 100.0 0.0 67.0 98.9 0.0 1.1
19 72 35 254 1 *Dakshin Chandpur 139 0.0 100.0 0.0 62.6 99.3 0.0 0.7
19 72 35 326 1 *Dughaia 326 0.3 92.0 7.7 78.5 99.4 0.0 0.6
19 72 35 354 1 *Gazirpar 266 0.4 99.6 0.0 59.0 100.0 0.0 0.0
19 72 35 570 1 *Mohammadpur 1159 0.3 92.2 7.4 84.6 98.3 0.6 1.1
19 72 35 613 1 *Mella 195 0.0 85.1 14.9 65.6 99.5 0.5 0.0
19 72 35 614 1 *Menjia Para 165 0.0 100.0 0.0 89.7 100.0 0.0 0.0
19 72 35 674 1 *Palkat 170 0.0 91.8 8.2 59.4 98.8 0.0 1.2
19 72 35 702 1 *Paschim Chandpur 110 0.0 70.9 29.1 69.1 99.1 0.0 0.9
19 72 35 797 1 *Purba Gobindapur 324 0.3 78.1 21.6 72.2 99.4 0.0 0.6
19 72 35 801 1 *Purba Lakshmipur 193 0.5 93.3 6.2 93.3 99.0 0.0 1.0
19 72 35 862 1 *Sibakhala 77 3.9 87.0 9.1 80.5 97.4 0.0 2.6
19 72 35 898 1 *Sreerampur 140 0.0 100.0 0.0 94.3 99.3 0.0 0.7
19 72 35 914 1 *Tarapaia 217 0.5 88.9 10.6 77.9 99.1 0.0 0.9
RMO: 1 = Rural, 2 = Urban and 3 = Other Urban Page 113 of 162

Tap Tube-Well Other Owned Rented Rent free
2 3 4 5 6 7 8 9 10
MZ /
MHVill RMO
1
Table C-15: Distribution of General Households by Source of Drinking Water, Electricity Connection and Housing Tenancy Status, by Residence
and Community
Administrative Unit
Residence
Community
Number of
Households
Source of Drinking Water (%) Electricity
Connection
(%)
Housing Tenancy (%)
ZL UZUN /
WA
19 72 35 982 1 *Uttar Narayanpur 196 0.5 55.6 43.9 55.6 100.0 0.0 0.0
19 72 52 Laksam Union Total 4528 0.6 95.5 4.0 64.4 98.7 0.2 1.0
19 72 52 025 1 *Asagi 82 0.0 100.0 0.0 81.7 95.1 0.0 4.9
19 72 52 324 1 *Dombaria 2628 0.2 98.2 1.6 67.3 98.7 0.2 1.1
19 72 52 324 01 1 Dakshin Narpati 537 0.0 100.0 0.0 76.4 99.1 0.2 0.7
19 72 52 324 02 1 Daspara 214 0.0 100.0 0.0 33.2 99.5 0.0 0.5
19 72 52 324 03 1 Shab Para 161 2.5 97.5 0.0 73.9 95.0 0.0 5.0
19 72 52 324 04 1 Uttar Narpati 391 0.3 92.1 7.7 65.5 98.2 0.0 1.8
19 72 52 324 05 1 Jogi Para 343 0.0 99.7 0.3 60.6 98.8 0.0 1.2
19 72 52 324 06 1 Sharifpur 110 0.0 100.0 0.0 97.3 100.0 0.0 0.0
19 72 52 324 07 1 Paisasi 159 0.0 100.0 0.0 35.2 98.7 0.0 1.3
19 72 52 324 08 1 Khilla Para 37 0.0 100.0 0.0 24.3 100.0 0.0 0.0
19 72 52 324 09 1 Gainar Dohura 100 0.0 100.0 0.0 72.0 98.0 0.0 2.0
19 72 52 324 10 1 Dighirpar 93 0.0 89.2 10.8 82.8 100.0 0.0 0.0
19 72 52 324 11 1 Tali Para 116 0.0 100.0 0.0 100.0 100.0 0.0 0.0
19 72 52 324 12 1 Kairpar 31 0.0 93.5 6.5 45.2 93.5 6.5 0.0
19 72 52 324 13 1 Dombaria 132 0.0 100.0 0.0 89.4 100.0 0.0 0.0
19 72 52 324 14 1 Noapara 55 0.0 100.0 0.0 69.1 100.0 0.0 0.0
19 72 52 324 15 1 Kuni Narpati 67 0.0 100.0 0.0 71.6 100.0 0.0 0.0
19 72 52 324 16 1 Daulat Para 82 0.0 100.0 0.0 61.0 97.6 2.4 0.0
19 72 52 337 1 *Elaich 700 1.6 79.0 19.4 59.3 99.7 0.3 0.0
19 72 52 559 1 *Madhya Chandpur 175 2.9 97.1 0.0 49.1 93.7 0.6 5.7
19 72 52 575 1 *Mainpur 85 3.5 96.5 0.0 84.7 100.0 0.0 0.0
19 72 52 740 1 *Pechra 275 0.0 100.0 0.0 72.4 98.9 0.0 1.1
19 72 52 745 1 *Phulgaon 403 0.2 99.8 0.0 43.2 99.0 0.7 0.2
19 72 52 910 1 *Tanti Para 180 0.0 100.0 0.0 75.0 100.0 0.0 0.0
19 72 63 Mudafarganj Union Total 7651 0.8 90.8 8.5 66.1 98.8 0.8 0.4
19 72 63 041 1 *Auspara 427 0.5 84.1 15.5 30.0 99.8 0.0 0.2
19 72 63 068 1 *Bamanda 446 0.0 95.7 4.3 74.4 98.9 0.9 0.2
RMO: 1 = Rural, 2 = Urban and 3 = Other Urban Page 114 of 162

Tap Tube-Well Other Owned Rented Rent free
2 3 4 5 6 7 8 9 10
MZ /
MHVill RMO
1
Table C-15: Distribution of General Households by Source of Drinking Water, Electricity Connection and Housing Tenancy Status, by Residence
and Community
Administrative Unit
Residence
Community
Number of
Households
Source of Drinking Water (%) Electricity
Connection
(%)
Housing Tenancy (%)
ZL UZUN /
WA
19 72 63 077 1 *Bara Baurtala 251 0.0 100.0 0.0 93.2 99.6 0.4 0.0
19 72 63 172 1 *Boalia 91 0.0 100.0 0.0 12.1 100.0 0.0 0.0
19 72 63 216 1 *Chhota Paranpur 111 0.0 92.8 7.2 82.0 100.0 0.0 0.0
19 72 63 281 1 *Dakshin Noapara 262 2.3 97.3 0.4 55.3 96.6 1.1 2.3
19 72 63 281 01 1 Dakshin Noapara 142 4.2 95.8 0.0 74.6 95.1 1.4 3.5
19 72 63 281 02 1 Uttar Noapara 120 0.0 99.2 0.8 32.5 98.3 0.8 0.8
19 72 63 306 1 *Dhankuia 193 0.0 81.3 18.7 77.2 100.0 0.0 0.0
19 72 63 320 1 *Dimatali 106 0.0 99.1 0.9 94.3 98.1 0.0 1.9
19 72 63 383 1 *Haldia 60 0.0 100.0 0.0 76.7 95.0 3.3 1.7
19 72 63 430 1 *Janardanpur 206 0.5 90.8 8.7 77.2 99.0 0.0 1.0
19 72 63 453 1 *Kagaia 775 0.5 83.9 15.6 47.1 99.9 0.0 0.1
19 72 63 453 01 1 Kagaia 487 0.0 81.1 18.9 29.2 99.8 0.0 0.2
19 72 63 453 02 1 Nakbatia 288 1.4 88.5 10.1 77.4 100.0 0.0 0.0
19 72 63 492 1 *Kanthalia 168 0.0 69.0 31.0 27.4 98.8 0.0 1.2
19 72 63 631 1 *Mudafarganj 1397 2.1 92.3 5.6 81.7 97.3 2.6 0.1
19 72 63 631 01 1 Mudafarganj 112 13.4 86.6 0.0 100.0 75.0 25.0 0.0
19 72 63 631 02 1 Nagar Para 272 0.0 98.9 1.1 86.4 99.6 0.4 0.0
19 72 63 631 03 1 Chiknia 904 1.5 94.6 3.9 78.8 99.0 0.8 0.2
19 72 63 631 04 1 Khata Para 109 0.0 63.3 36.7 75.2 100.0 0.0 0.0
19 72 63 695 1 *Pasapur 727 0.6 90.5 8.9 73.3 98.3 0.1 1.5
19 72 63 715 1 *Paschim Jagatpur 163 0.0 100.0 0.0 2.5 99.4 0.0 0.6
19 72 63 717 1 *Paschim Kandirpar 37 0.0 86.5 13.5 0.0 100.0 0.0 0.0
19 72 63 718 1 *Paschim Lakshmipur 213 0.5 74.6 24.9 98.1 95.3 4.7 0.0
19 72 63 724 1 *Paschim Rajapur 180 1.1 97.8 1.1 55.0 100.0 0.0 0.0
19 72 63 747 1 *Phulhara 402 0.0 99.0 1.0 70.9 99.8 0.2 0.0
19 72 63 787 1 *Sree Anga 1341 0.7 90.4 8.9 67.6 99.7 0.2 0.1
19 72 63 787 01 1 Sree Anga 1155 0.0 90.0 10.0 65.5 99.9 0.1 0.0
19 72 63 787 02 1 Hamirabagh 186 4.8 92.5 2.7 80.6 98.4 1.1 0.5
19 72 63 856 1 *Uttar Satbaria 95 0.0 100.0 0.0 78.9 100.0 0.0 0.0
RMO: 1 = Rural, 2 = Urban and 3 = Other Urban Page 115 of 162

Tap Tube-Well Other Owned Rented Rent free
2 3 4 5 6 7 8 9 10
MZ /
MHVill RMO
1
Table C-15: Distribution of General Households by Source of Drinking Water, Electricity Connection and Housing Tenancy Status, by Residence
and Community
Administrative Unit
Residence
Community
Number of
Households
Source of Drinking Water (%) Electricity
Connection
(%)
Housing Tenancy (%)
ZL UZUN /
WA
19 72 77 Kandirpar Union Total 7448 0.5 93.5 6.0 74.0 98.2 0.9 1.0
19 72 77 019 1 *Amuda 163 1.8 98.2 0.0 97.5 99.4 0.6 0.0
19 72 77 136 1 *Bhakarda 611 0.2 95.3 4.6 68.4 98.7 0.5 0.8
19 72 77 136 01 1 Bhakarda 377 0.3 94.4 5.3 65.8 98.4 0.5 1.1
19 72 77 136 02 1 Ray Pur 234 0.0 96.6 3.4 72.6 99.1 0.4 0.4
19 72 77 147 1 *Bhimpur 83 0.0 100.0 0.0 65.1 100.0 0.0 0.0
19 72 77 181 1 *Chandgaon 216 0.9 88.4 10.6 70.8 98.1 0.9 0.9
19 72 77 186 1 *Chandrapur 65 0.0 98.5 1.5 80.0 84.6 6.2 9.2
19 72 77 200 1 *Chhangaon 505 1.8 95.6 2.6 84.6 99.0 0.6 0.4
19 72 77 236 1 *Chunati 147 0.7 85.7 13.6 76.2 94.6 2.7 2.7
19 72 77 247 1 *Ashwathatala 436 0.9 83.5 15.6 82.3 93.3 4.6 2.1
19 72 77 293 1 *Satbaria 114 0.0 71.9 28.1 43.0 97.4 0.0 2.6
19 72 77 385 1 *Hamirabagh 387 0.3 93.0 6.7 82.7 96.9 1.3 1.8
19 72 77 414 1 *Iruain 1054 0.8 93.5 5.8 60.6 99.1 0.4 0.5
19 72 77 414 01 1 Iruain 781 0.9 91.3 7.8 71.6 99.1 0.5 0.4
19 72 77 414 02 1 Tangirpar 273 0.4 99.6 0.0 29.3 99.3 0.0 0.7
19 72 77 500 1 *Kemtali 448 0.0 99.8 0.2 77.2 97.8 0.4 1.8
19 72 77 500 01 1 Kemtali 294 0.0 100.0 0.0 86.1 96.9 0.3 2.7
19 72 77 500 02 1 Noapara 154 0.0 99.4 0.6 60.4 99.4 0.6 0.0
19 72 77 516 1 *Khunta 364 0.5 99.5 0.0 95.3 98.6 0.8 0.5
19 72 77 521 1 *Komadda 375 1.1 81.6 17.3 82.9 98.7 0.5 0.8
19 72 77 629 1 *Manoharpur 209 0.0 86.6 13.4 81.3 99.5 0.5 0.0
19 72 77 636 1 *Nair Para 628 0.3 92.0 7.6 61.5 98.2 1.0 0.8
19 72 77 636 01 1 Nair Para 323 0.0 98.1 1.9 79.9 98.1 1.5 0.3
19 72 77 636 02 1 Changachal 186 0.0 100.0 0.0 61.8 98.9 0.0 1.1
19 72 77 636 03 1 Shola Puskarani 94 2.1 55.3 42.6 0.0 97.9 1.1 1.1
19 72 77 636 04 1 Nischintapur 25 0.0 92.0 8.0 52.0 96.0 0.0 4.0
19 72 77 638 1 *Nalua 39 0.0 100.0 0.0 0.0 94.9 0.0 5.1
19 72 77 709 1 *Paschim Fatehpur 90 0.0 100.0 0.0 100.0 100.0 0.0 0.0
RMO: 1 = Rural, 2 = Urban and 3 = Other Urban Page 116 of 162

Tap Tube-Well Other Owned Rented Rent free
2 3 4 5 6 7 8 9 10
MZ /
MHVill RMO
1
Table C-15: Distribution of General Households by Source of Drinking Water, Electricity Connection and Housing Tenancy Status, by Residence
and Community
Administrative Unit
Residence
Community
Number of
Households
Source of Drinking Water (%) Electricity
Connection
(%)
Housing Tenancy (%)
ZL UZUN /
WA
19 72 77 754 1 *Purba Dumurua 81 0.0 76.5 23.5 93.8 96.3 0.0 3.7
19 72 77 769 1 *Ramchandrapur 142 0.0 97.9 2.1 85.9 99.3 0.0 0.7
19 72 77 776 1 *Ranucho 94 0.0 100.0 0.0 80.9 100.0 0.0 0.0
19 72 77 837 1 *Salehpur 518 0.0 98.1 1.9 65.6 99.0 0.4 0.6
19 72 77 874 1 *Singjor 332 0.6 98.8 0.6 74.4 99.4 0.6 0.0
19 72 77 934 1 *Tutiganga 120 0.0 100.0 0.0 45.0 99.2 0.0 0.8
19 72 77 978 1 *Uttar Kandirpar 227 0.0 100.0 0.0 90.3 99.6 0.0 0.4
19 72 84 Ajgara Union Total 5590 0.6 93.7 5.7 66.9 99.1 0.1 0.9
19 72 84 005 1 *Ajgara 203 0.0 98.5 1.5 82.8 99.0 0.0 1.0
19 72 84 014 1 *Amduar 677 1.2 94.1 4.7 77.5 99.9 0.0 0.1
19 72 84 014 01 1 Amduar 253 0.8 91.3 7.9 85.4 100.0 0.0 0.0
19 72 84 014 02 1 Naoti 424 1.4 95.8 2.8 72.9 99.8 0.0 0.2
19 72 84 116 1 *Barbam 472 1.1 98.9 0.0 59.1 99.6 0.0 0.4
19 72 84 233 1 *Chilain 440 0.9 99.1 0.0 56.4 100.0 0.0 0.0
19 72 84 243 1 *Askamta 192 2.6 67.2 30.2 56.8 100.0 0.0 0.0
19 72 84 256 1 *Dakshin Charbaria 585 0.0 99.5 0.5 57.3 99.8 0.0 0.2
19 72 84 356 1 *Ghatar 439 1.6 77.4 21.0 73.1 99.3 0.2 0.5
19 72 84 467 1 *Kaliacho 240 1.3 76.7 22.1 59.6 95.4 0.4 4.2
19 72 84 475 1 *Koamarda 132 0.0 89.4 10.6 85.6 100.0 0.0 0.0
19 72 84 528 1 *Krishnapur 593 0.3 97.5 2.2 70.5 97.0 0.0 3.0
19 72 84 550 1 *Lolai 166 0.0 99.4 0.6 44.6 97.0 0.0 3.0
19 72 84 557 1 *Madhya Batabaria 139 0.0 100.0 0.0 82.0 97.8 0.0 2.2
19 72 84 684 1 *Paotali 189 0.0 95.2 4.8 54.0 99.5 0.5 0.0
19 72 84 706 1 *Daulatpur 120 0.0 100.0 0.0 90.0 100.0 0.0 0.0
19 72 84 805 1 *Purba Noagaon 217 0.0 100.0 0.0 53.9 99.5 0.5 0.0
19 72 84 812 1 *Purba Sahapur 269 0.0 100.0 0.0 55.8 99.6 0.4 0.0
19 72 84 882 1 *Shola Pukuria 42 0.0 100.0 0.0 92.9 100.0 0.0 0.0
19 72 84 901 1 *Sukhtala 475 0.2 91.8 8.0 78.7 99.2 0.0 0.8
19 72 84 901 01 1 Ukhtala 303 0.0 100.0 0.0 80.9 99.7 0.0 0.3
RMO: 1 = Rural, 2 = Urban and 3 = Other Urban Page 117 of 162
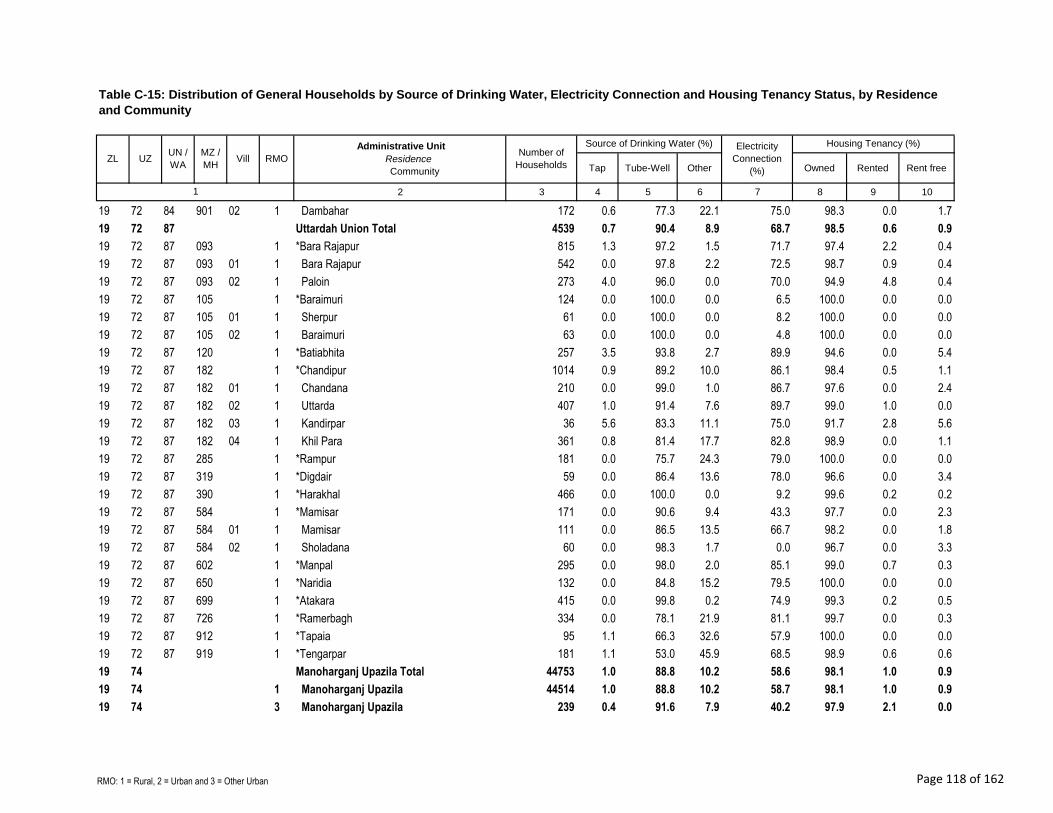
Tap Tube-Well Other Owned Rented Rent free
2 3 4 5 6 7 8 9 10
MZ /
MHVill RMO
1
Table C-15: Distribution of General Households by Source of Drinking Water, Electricity Connection and Housing Tenancy Status, by Residence
and Community
Administrative Unit
Residence
Community
Number of
Households
Source of Drinking Water (%) Electricity
Connection
(%)
Housing Tenancy (%)
ZL UZUN /
WA
19 72 84 901 02 1 Dambahar 172 0.6 77.3 22.1 75.0 98.3 0.0 1.7
19 72 87 Uttardah Union Total 4539 0.7 90.4 8.9 68.7 98.5 0.6 0.9
19 72 87 093 1 *Bara Rajapur 815 1.3 97.2 1.5 71.7 97.4 2.2 0.4
19 72 87 093 01 1 Bara Rajapur 542 0.0 97.8 2.2 72.5 98.7 0.9 0.4
19 72 87 093 02 1 Paloin 273 4.0 96.0 0.0 70.0 94.9 4.8 0.4
19 72 87 105 1 *Baraimuri 124 0.0 100.0 0.0 6.5 100.0 0.0 0.0
19 72 87 105 01 1 Sherpur 61 0.0 100.0 0.0 8.2 100.0 0.0 0.0
19 72 87 105 02 1 Baraimuri 63 0.0 100.0 0.0 4.8 100.0 0.0 0.0
19 72 87 120 1 *Batiabhita 257 3.5 93.8 2.7 89.9 94.6 0.0 5.4
19 72 87 182 1 *Chandipur 1014 0.9 89.2 10.0 86.1 98.4 0.5 1.1
19 72 87 182 01 1 Chandana 210 0.0 99.0 1.0 86.7 97.6 0.0 2.4
19 72 87 182 02 1 Uttarda 407 1.0 91.4 7.6 89.7 99.0 1.0 0.0
19 72 87 182 03 1 Kandirpar 36 5.6 83.3 11.1 75.0 91.7 2.8 5.6
19 72 87 182 04 1 Khil Para 361 0.8 81.4 17.7 82.8 98.9 0.0 1.1
19 72 87 285 1 *Rampur 181 0.0 75.7 24.3 79.0 100.0 0.0 0.0
19 72 87 319 1 *Digdair 59 0.0 86.4 13.6 78.0 96.6 0.0 3.4
19 72 87 390 1 *Harakhal 466 0.0 100.0 0.0 9.2 99.6 0.2 0.2
19 72 87 584 1 *Mamisar 171 0.0 90.6 9.4 43.3 97.7 0.0 2.3
19 72 87 584 01 1 Mamisar 111 0.0 86.5 13.5 66.7 98.2 0.0 1.8
19 72 87 584 02 1 Sholadana 60 0.0 98.3 1.7 0.0 96.7 0.0 3.3
19 72 87 602 1 *Manpal 295 0.0 98.0 2.0 85.1 99.0 0.7 0.3
19 72 87 650 1 *Naridia 132 0.0 84.8 15.2 79.5 100.0 0.0 0.0
19 72 87 699 1 *Atakara 415 0.0 99.8 0.2 74.9 99.3 0.2 0.5
19 72 87 726 1 *Ramerbagh 334 0.0 78.1 21.9 81.1 99.7 0.0 0.3
19 72 87 912 1 *Tapaia 95 1.1 66.3 32.6 57.9 100.0 0.0 0.0
19 72 87 919 1 *Tengarpar 181 1.1 53.0 45.9 68.5 98.9 0.6 0.6
19 74 Manoharganj Upazila Total 44753 1.0 88.8 10.2 58.6 98.1 1.0 0.9
19 74 1 Manoharganj Upazila 44514 1.0 88.8 10.2 58.7 98.1 1.0 0.9
19 74 3 Manoharganj Upazila 239 0.4 91.6 7.9 40.2 97.9 2.1 0.0
RMO: 1 = Rural, 2 = Urban and 3 = Other Urban Page 118 of 162

Tap Tube-Well Other Owned Rented Rent free
2 3 4 5 6 7 8 9 10
MZ /
MHVill RMO
1
Table C-15: Distribution of General Households by Source of Drinking Water, Electricity Connection and Housing Tenancy Status, by Residence
and Community
Administrative Unit
Residence
Community
Number of
Households
Source of Drinking Water (%) Electricity
Connection
(%)
Housing Tenancy (%)
ZL UZUN /
WA
19 74 13 Baishgaon Union Total 4631 0.7 83.4 15.9 52.9 98.7 0.5 0.8
19 74 13 1 Baishgaon Union 4392 0.7 82.9 16.3 53.6 98.7 0.4 0.9
19 74 13 3 Baishgaon Union 239 0.4 91.6 7.9 40.2 97.9 2.1 0.0
19 74 13 021 1 *Andirpar 106 0.0 100.0 0.0 19.8 100.0 0.0 0.0
19 74 13 034 1 *Atakora 105 0.0 33.3 66.7 69.5 100.0 0.0 0.0
19 74 13 050 1 *Baghchatal 31 0.0 100.0 0.0 32.3 100.0 0.0 0.0
19 74 13 056 1 *Bara Sharifpur 203 2.0 98.0 0.0 75.4 98.0 2.0 0.0
19 74 13 060 1 *Baishgaon 936 0.5 82.4 17.1 51.2 99.9 0.1 0.0
19 74 13 173 1 *Burpista 180 2.2 95.6 2.2 44.4 100.0 0.0 0.0
19 74 13 175 1 *Chadda 100 2.0 79.0 19.0 66.0 98.0 0.0 2.0
19 74 13 234 1 *Chilua 109 0.9 78.9 20.2 72.5 98.2 0.0 1.8
19 74 13 238 1 *Dabaria 118 0.0 100.0 0.0 0.0 100.0 0.0 0.0
19 74 13 240 1 *Dadghar 123 1.6 76.4 22.0 41.5 99.2 0.0 0.8
19 74 13 261 1 *Dakshin Durgapur 326 0.3 74.2 25.5 59.8 98.5 0.3 1.2
19 74 13 279 1 *Dakshin Noagaon 362 0.6 96.4 3.0 21.3 96.1 0.0 3.9
19 74 13 406 1 *Hawra 380 0.0 99.7 0.3 32.4 98.4 0.5 1.1
19 74 13 421 1 *Jalipur 194 0.0 51.5 48.5 68.6 97.9 0.5 1.5
19 74 13 496 1 *Keari 195 0.5 71.8 27.7 72.8 94.9 2.1 3.1
19 74 13 537 1 *Lachra 18 0.0 100.0 0.0 11.1 100.0 0.0 0.0
19 74 13 588 3 *Mandargaon 239 0.4 91.6 7.9 40.2 97.9 2.1 0.0
19 74 13 731 1 *Purba Taltala 109 0.0 93.6 6.4 63.3 99.1 0.9 0.0
19 74 13 738 1 *Pearatali 181 0.0 48.6 51.4 63.0 100.0 0.0 0.0
19 74 13 749 1 *Phul Pukuria 133 6.0 85.0 9.0 66.2 98.5 0.8 0.8
19 74 13 833 1 *Saktala 277 0.4 80.9 18.8 85.2 99.3 0.4 0.4
19 74 13 935 1 *Udaish 206 0.0 95.6 4.4 80.1 99.5 0.5 0.0
19 74 17 Bipulasar Union Total 4305 2.2 87.0 10.7 66.2 97.4 1.9 0.7
19 74 17 064 1 *Bakra 285 0.0 95.4 4.6 40.4 98.9 0.0 1.1
19 74 17 163 1 *Bihara 236 0.0 78.8 21.2 26.7 100.0 0.0 0.0
19 74 17 170 1 *Bipulasar 265 4.2 86.8 9.1 86.0 94.7 4.2 1.1
RMO: 1 = Rural, 2 = Urban and 3 = Other Urban Page 119 of 162

Tap Tube-Well Other Owned Rented Rent free
2 3 4 5 6 7 8 9 10
MZ /
MHVill RMO
1
Table C-15: Distribution of General Households by Source of Drinking Water, Electricity Connection and Housing Tenancy Status, by Residence
and Community
Administrative Unit
Residence
Community
Number of
Households
Source of Drinking Water (%) Electricity
Connection
(%)
Housing Tenancy (%)
ZL UZUN /
WA
19 74 17 432 1 *Jaora 888 0.9 84.2 14.9 82.8 98.9 0.0 1.1
19 74 17 432 01 1 Jaora East 507 0.8 86.8 12.4 88.8 99.4 0.0 0.6
19 74 17 432 02 1 Jaora West 381 1.0 80.8 18.1 74.8 98.2 0.0 1.8
19 74 17 478 1 *Kanchi 1071 6.5 90.0 3.5 84.9 92.7 6.4 0.8
19 74 17 478 01 1 North Kanchi 578 0.0 98.6 1.4 84.9 99.1 0.5 0.3
19 74 17 478 02 1 South Kanchi 263 26.2 71.9 1.9 91.6 73.8 24.7 1.5
19 74 17 478 03 1 Chhota Kanchi 230 0.4 89.1 10.4 77.0 98.3 0.4 1.3
19 74 17 489 1 *Kashipur 216 0.0 95.4 4.6 80.1 99.1 0.0 0.9
19 74 17 735 1 *Patiala 181 3.9 96.1 0.0 85.1 98.9 1.1 0.0
19 74 17 831 1 *Saikchail 1163 0.0 83.1 16.9 40.8 99.7 0.1 0.3
19 74 31 Hasnabad Union Total 3430 0.3 93.5 6.2 39.0 99.2 0.3 0.5
19 74 31 010 1 *Alinakipur 40 0.0 90.0 10.0 52.5 100.0 0.0 0.0
19 74 31 032 1 *Asiadari 415 1.0 94.2 4.8 57.3 99.3 0.2 0.5
19 74 31 048 1 *Baduara 555 0.2 93.3 6.5 32.1 99.6 0.2 0.2
19 74 31 329 1 *Dakshin Sreepur 131 0.0 96.2 3.8 0.0 100.0 0.0 0.0
19 74 31 399 1 *Hasnabad 202 0.0 81.2 18.8 74.8 98.5 1.0 0.5
19 74 31 439 1 *Jinarag 156 0.0 91.7 8.3 37.8 98.1 1.3 0.6
19 74 31 473 1 *Kamalpur 120 0.0 99.2 0.8 0.0 98.3 0.0 1.7
19 74 31 487 1 *Kasai 208 0.0 100.0 0.0 70.2 100.0 0.0 0.0
19 74 31 586 1 *Manara 219 0.0 90.0 10.0 79.5 98.2 1.4 0.5
19 74 31 600 1 *Manipur 200 0.0 99.5 0.5 35.0 99.5 0.0 0.5
19 74 31 652 1 *Narpaiya 302 0.0 98.0 2.0 14.2 98.3 0.0 1.7
19 74 31 657 1 *Naotala 237 0.0 99.6 0.4 0.8 99.2 0.0 0.8
19 74 31 659 1 *Nayanpur 112 0.0 75.9 24.1 4.5 99.1 0.9 0.0
19 74 31 661 1 *Niamatpur 112 0.0 100.0 0.0 0.0 100.0 0.0 0.0
19 74 31 663 1 *Nishachora 25 0.0 80.0 20.0 20.0 96.0 0.0 4.0
19 74 31 708 1 *Paschim Taltala 135 4.4 71.1 24.4 74.8 99.3 0.0 0.7
19 74 31 770 1 *Ramdebpur 163 0.0 100.0 0.0 52.8 100.0 0.0 0.0
19 74 31 855 1 *Satgharia 98 0.0 100.0 0.0 58.2 100.0 0.0 0.0
RMO: 1 = Rural, 2 = Urban and 3 = Other Urban Page 120 of 162

Tap Tube-Well Other Owned Rented Rent free
2 3 4 5 6 7 8 9 10
MZ /
MHVill RMO
1
Table C-15: Distribution of General Households by Source of Drinking Water, Electricity Connection and Housing Tenancy Status, by Residence
and Community
Administrative Unit
Residence
Community
Number of
Households
Source of Drinking Water (%) Electricity
Connection
(%)
Housing Tenancy (%)
ZL UZUN /
WA
19 74 42 Jhalam (Uttar) Union Total 3875 0.6 86.2 13.3 62.6 98.7 0.2 1.1
19 74 42 071 1 *Banglaish 364 0.5 92.0 7.4 13.7 98.6 0.5 0.8
19 74 42 089 1 *Bara Keshtala 574 0.9 86.8 12.4 89.2 99.8 0.2 0.0
19 74 42 197 1 *Chauraish 370 0.0 79.2 20.8 86.2 99.5 0.5 0.0
19 74 42 202 1 *Chhanua 355 0.3 93.8 5.9 26.8 99.2 0.3 0.6
19 74 42 231 1 *Chikutia 205 0.0 100.0 0.0 88.8 100.0 0.0 0.0
19 74 42 304 1 *Debpur 290 1.4 98.3 0.3 73.8 100.0 0.0 0.0
19 74 42 311 1 *Dhikchanda 211 0.0 75.8 24.2 11.4 94.3 0.0 5.7
19 74 42 394 1 *Haria Hossainpur 116 0.9 96.6 2.6 87.1 98.3 0.0 1.7
19 74 42 543 1 *Lalchandpur 237 0.0 68.8 31.2 82.3 92.8 0.0 7.2
19 74 42 568 1 *Mahajanpur 36 5.6 94.4 0.0 94.4 100.0 0.0 0.0
19 74 42 611 1 *Mehaldarkot 171 0.0 42.7 57.3 70.8 98.2 0.0 1.8
19 74 42 641 1 *Naogaon 292 0.3 82.2 17.5 40.1 100.0 0.0 0.0
19 74 42 704 1 *Paschim Daiara 239 0.0 99.2 0.8 86.6 99.6 0.0 0.4
19 74 42 711 1 *Paschim Gobindapur 219 2.7 79.9 17.4 69.9 99.5 0.0 0.5
19 74 42 754 1 *Pratappur 196 0.0 100.0 0.0 51.5 98.0 1.0 1.0
19 74 45 Jhalam (Dakshin) Union Total 4270 0.3 86.2 13.5 57.6 97.9 1.6 0.4
19 74 45 044 1 *Bachair 308 0.0 84.4 15.6 54.5 100.0 0.0 0.0
19 74 45 087 1 *Bara Jadabpur 219 0.0 100.0 0.0 81.7 100.0 0.0 0.0
19 74 45 141 1 *Bhatgaon 132 0.0 90.2 9.8 69.7 100.0 0.0 0.0
19 74 45 188 1 *Chapani Keshtala 200 0.0 93.5 6.5 68.5 99.0 0.5 0.5
19 74 45 190 1 *Chapni 107 0.0 100.0 0.0 57.0 100.0 0.0 0.0
19 74 45 437 1 *Jhalam 529 0.0 89.0 11.0 66.9 96.4 3.6 0.0
19 74 45 494 1 *Kautala 231 0.0 86.6 13.4 34.2 98.7 0.9 0.4
19 74 45 518 1 *Khurua 219 0.0 77.6 22.4 48.4 98.6 0.5 0.9
19 74 45 546 1 *Laulahari 179 0.6 91.6 7.8 65.4 97.2 1.7 1.1
19 74 45 622 1 *Mirzapur 685 0.0 82.5 17.5 44.8 98.0 1.6 0.4
19 74 45 645 1 *Naraharipur 328 1.5 93.0 5.5 72.3 99.7 0.3 0.0
19 74 45 668 1 *Dakshin Noapara 72 0.0 87.5 12.5 34.7 94.4 5.6 0.0
RMO: 1 = Rural, 2 = Urban and 3 = Other Urban Page 121 of 162

Tap Tube-Well Other Owned Rented Rent free
2 3 4 5 6 7 8 9 10
MZ /
MHVill RMO
1
Table C-15: Distribution of General Households by Source of Drinking Water, Electricity Connection and Housing Tenancy Status, by Residence
and Community
Administrative Unit
Residence
Community
Number of
Households
Source of Drinking Water (%) Electricity
Connection
(%)
Housing Tenancy (%)
ZL UZUN /
WA
19 74 45 753 1 *Pomgaon 772 0.0 84.8 15.2 57.0 97.2 1.6 1.3
19 74 45 753 01 1 North Pamsaon 495 0.0 87.7 12.3 61.8 97.8 1.4 0.8
19 74 45 753 02 1 South Pomgaon 277 0.0 79.8 20.2 48.4 96.0 1.8 2.2
19 74 45 857 1 *Sat Pukuria 289 2.1 67.8 30.1 54.7 94.5 5.5 0.0
19 74 53 Khila Union Total 4159 0.7 95.7 3.6 60.5 97.7 1.3 0.9
19 74 53 069 1 *Banduain 553 0.2 99.5 0.4 57.1 99.1 0.4 0.5
19 74 53 069 01 1 Banduain 403 0.2 99.5 0.2 52.1 98.8 0.5 0.7
19 74 53 069 02 1 Ullah Para 76 0.0 98.7 1.3 82.9 100.0 0.0 0.0
19 74 53 069 03 1 Panch Pukuria 74 0.0 100.0 0.0 58.1 100.0 0.0 0.0
19 74 53 138 1 *Bharanikhanda 256 0.4 98.8 0.8 62.9 99.6 0.4 0.0
19 74 53 297 1 *Darachon 117 0.0 100.0 0.0 89.7 100.0 0.0 0.0
19 74 53 322 1 *Disabandha 752 0.7 89.5 9.8 44.5 94.5 4.1 1.3
19 74 53 401 1 *Hatiamuri 203 1.0 95.6 3.4 52.7 98.0 0.0 2.0
19 74 53 510 1 *Khila 252 1.6 87.7 10.7 73.8 92.9 6.0 1.2
19 74 53 545 1 *Latsar 187 0.0 94.7 5.3 70.6 99.5 0.0 0.5
19 74 53 701 1 *Purba Batabaria 526 0.8 98.3 1.0 68.8 99.4 0.2 0.4
19 74 53 701 01 1 Paschim Batabaria 280 1.4 96.8 1.8 76.4 99.3 0.4 0.4
19 74 53 701 02 1 Purba Batabaria 246 0.0 100.0 0.0 60.2 99.6 0.0 0.4
19 74 53 853 1 *Sateshwar 512 0.0 100.0 0.0 81.4 98.6 0.2 1.2
19 74 53 859 1 *Shalipur 141 0.0 100.0 0.0 92.2 97.2 2.8 0.0
19 74 53 869 1 *Sikchail 226 0.0 98.7 1.3 52.7 97.3 0.0 2.7
19 74 53 905 1 *Taherpur 434 2.8 92.6 4.6 33.6 99.1 0.0 0.9
19 74 59 Lakshmanpur Union Total 3168 1.5 86.3 12.2 60.1 97.2 1.4 1.4
19 74 59 127 1 *Betia Para 244 2.0 95.1 2.9 68.4 95.1 0.4 4.5
19 74 59 272 1 *Dakshin Kandirpar 16 0.0 93.8 6.3 93.8 100.0 0.0 0.0
19 74 59 276 1 *Dakshin Narayanpur 435 0.2 61.6 38.2 46.0 98.9 0.2 0.9
19 74 59 342 1 *Gajia Para 138 0.0 100.0 0.0 13.8 100.0 0.0 0.0
19 74 59 509 1 *Kharkharia 213 2.8 75.6 21.6 63.8 96.2 0.9 2.8
19 74 59 541 1 *Lakshmanpur 968 3.8 94.7 1.4 72.7 94.3 4.1 1.5
RMO: 1 = Rural, 2 = Urban and 3 = Other Urban Page 122 of 162

Tap Tube-Well Other Owned Rented Rent free
2 3 4 5 6 7 8 9 10
MZ /
MHVill RMO
1
Table C-15: Distribution of General Households by Source of Drinking Water, Electricity Connection and Housing Tenancy Status, by Residence
and Community
Administrative Unit
Residence
Community
Number of
Households
Source of Drinking Water (%) Electricity
Connection
(%)
Housing Tenancy (%)
ZL UZUN /
WA
19 74 59 541 01 1 Lakshmanpur 457 2.0 97.6 0.4 77.7 94.5 4.4 1.1
19 74 59 541 02 1 Jalkandi 114 18.4 81.6 0.0 89.5 82.5 16.7 0.9
19 74 59 541 03 1 Banughar 309 2.3 93.9 3.9 66.3 96.8 0.3 2.9
19 74 59 541 04 1 Ramanandi 88 0.0 100.0 0.0 47.7 100.0 0.0 0.0
19 74 59 595 1 *Manduara 222 0.0 86.5 13.5 58.1 99.1 0.0 0.9
19 74 59 597 1 *Manduri 18 0.0 55.6 44.4 16.7 100.0 0.0 0.0
19 74 59 604 1 *Maraha Majhiakhali 720 0.0 87.8 12.2 54.6 98.9 0.1 1.0
19 74 59 604 01 1 Maraha 630 0.0 86.2 13.8 61.6 98.7 0.2 1.1
19 74 59 604 02 1 Majhiakhali 90 0.0 98.9 1.1 5.6 100.0 0.0 0.0
19 74 59 848 1 *Sapura 103 0.0 81.6 18.4 77.7 100.0 0.0 0.0
19 74 59 878 1 *Soari 91 0.0 92.3 7.7 64.8 100.0 0.0 0.0
19 74 63 Maisatua Union Total 4251 1.9 88.0 10.1 61.5 98.7 0.5 0.8
19 74 63 016 1 *Amtali 123 0.0 62.6 37.4 77.2 100.0 0.0 0.0
19 74 63 030 1 *Ashirpar 182 0.0 100.0 0.0 87.4 98.9 1.1 0.0
19 74 63 118 1 *Basaia 215 0.5 99.1 0.5 38.6 98.1 0.9 0.9
19 74 63 119 1 *Paschim Batabaria 145 0.0 100.0 0.0 77.9 97.9 0.7 1.4
19 74 63 209 1 *Chhota Chatitala 102 0.0 99.0 1.0 92.2 98.0 0.0 2.0
19 74 63 229 1 *Chiktia 75 0.0 100.0 0.0 81.3 98.7 0.0 1.3
19 74 63 267 1 *Dakshin Hajipur 244 0.0 100.0 0.0 93.9 99.6 0.0 0.4
19 74 63 277 1 *Dakshin Nischintapur 128 0.0 100.0 0.0 3.1 100.0 0.0 0.0
19 74 63 290 1 *Dakshin Shamserpur 163 1.8 98.2 0.0 87.1 98.2 0.0 1.8
19 74 63 344 1 *Gajra Para 158 0.0 91.8 8.2 84.2 97.5 0.6 1.9
19 74 63 345 1 *Gandamara 53 0.0 100.0 0.0 9.4 100.0 0.0 0.0
19 74 63 363 1 *Goaliara 202 0.5 85.6 13.9 51.0 99.0 0.0 1.0
19 74 63 405 1 *Hatirpar 431 0.7 75.6 23.7 65.4 97.7 1.9 0.5
19 74 63 415 1 *Islampur 247 0.0 72.1 27.9 84.2 98.4 1.2 0.4
19 74 63 507 1 *Khanatua 410 0.7 97.6 1.7 75.1 99.3 0.0 0.7
19 74 63 577 1 *Maisatua 642 0.2 86.3 13.6 34.4 98.4 0.0 1.6
19 74 63 618 1 *Merua 150 2.0 90.7 7.3 89.3 97.3 2.0 0.7
RMO: 1 = Rural, 2 = Urban and 3 = Other Urban Page 123 of 162

Tap Tube-Well Other Owned Rented Rent free
2 3 4 5 6 7 8 9 10
MZ /
MHVill RMO
1
Table C-15: Distribution of General Households by Source of Drinking Water, Electricity Connection and Housing Tenancy Status, by Residence
and Community
Administrative Unit
Residence
Community
Number of
Households
Source of Drinking Water (%) Electricity
Connection
(%)
Housing Tenancy (%)
ZL UZUN /
WA
19 74 63 708 1 *Paschim Dumurua 125 0.0 100.0 0.0 96.0 100.0 0.0 0.0
19 74 63 736 1 *Paschim Sreepur 161 40.4 57.8 1.9 69.6 100.0 0.0 0.0
19 74 63 778 1 *Rashidpur 174 0.0 100.0 0.0 0.0 98.9 1.1 0.0
19 74 63 817 1 *Uttar Taltala 121 0.0 48.8 51.2 5.8 100.0 0.0 0.0
19 74 70 Nather Petua Union Total 3971 2.2 89.8 8.0 82.5 96.0 2.8 1.2
19 74 70 091 1 *Bara Paranpur 134 0.7 99.3 0.0 91.8 100.0 0.0 0.0
19 74 70 148 1 *Bhogai 1569 1.6 92.3 6.1 83.2 99.2 0.4 0.4
19 74 70 148 01 1 Bhogai 1308 1.6 95.1 3.3 81.5 99.0 0.5 0.5
19 74 70 148 02 1 Kandi 261 1.5 78.2 20.3 91.6 100.0 0.0 0.0
19 74 70 168 1 *Binoyghar 1407 3.5 86.3 10.2 79.4 94.3 3.6 2.1
19 74 70 168 01 1 Ganipur 199 9.5 89.9 0.5 86.4 71.9 19.1 9.0
19 74 70 168 02 1 Binoyghar 745 1.2 86.2 12.6 80.3 98.3 0.8 0.9
19 74 70 168 03 1 Batachho 360 5.8 82.2 11.9 80.6 98.6 0.3 1.1
19 74 70 168 04 1 Alocudia 53 0.0 94.3 5.7 92.5 96.2 3.8 0.0
19 74 70 168 05 1 Noapari 50 0.0 94.0 6.0 16.0 92.0 8.0 0.0
19 74 70 313 1 *Dhopamuri 133 2.3 97.0 0.8 86.5 97.0 2.3 0.8
19 74 70 647 1 *Nararpar 211 0.9 99.1 0.0 75.4 99.1 0.0 0.9
19 74 70 654 1 *Nather Petua 383 2.1 88.3 9.7 91.9 84.6 13.6 1.8
19 74 70 900 1 *Suchia Para 134 0.0 69.4 30.6 77.6 99.3 0.0 0.7
19 74 82 Sarashpur Union Total 4411 0.5 90.9 8.6 39.1 98.7 0.2 1.1
19 74 82 008 1 *Alok Para 81 0.0 97.5 2.5 24.7 100.0 0.0 0.0
19 74 82 078 1 *Bara Chandpur 429 0.7 98.8 0.5 47.1 99.5 0.0 0.5
19 74 82 145 1 *Bhaupur 1067 1.4 86.8 11.8 58.2 98.5 0.4 1.1
19 74 82 145 01 1 Bhaupur 962 1.6 85.3 13.1 63.1 98.3 0.4 1.2
19 74 82 145 02 1 Moricha 105 0.0 100.0 0.0 13.3 100.0 0.0 0.0
19 74 82 250 1 *Dakshin Batabaria 257 0.4 86.4 13.2 8.9 98.1 0.0 1.9
19 74 82 259 1 *Dakshin Dumaria 309 0.0 86.4 13.6 0.3 100.0 0.0 0.0
19 74 82 371 1 *Gopirala 113 0.0 100.0 0.0 6.2 100.0 0.0 0.0
19 74 82 374 1 *Ghotora 191 0.0 86.4 13.6 16.2 99.5 0.0 0.5
RMO: 1 = Rural, 2 = Urban and 3 = Other Urban Page 124 of 162

Tap Tube-Well Other Owned Rented Rent free
2 3 4 5 6 7 8 9 10
MZ /
MHVill RMO
1
Table C-15: Distribution of General Households by Source of Drinking Water, Electricity Connection and Housing Tenancy Status, by Residence
and Community
Administrative Unit
Residence
Community
Number of
Households
Source of Drinking Water (%) Electricity
Connection
(%)
Housing Tenancy (%)
ZL UZUN /
WA
19 74 82 727 1 *Paschim Sahapur 706 0.1 95.6 4.2 38.5 98.2 0.4 1.4
19 74 82 727 01 1 Sahapur 427 0.0 94.8 5.2 57.4 97.4 0.7 1.9
19 74 82 727 02 1 Pachruhai 129 0.0 100.0 0.0 15.5 98.4 0.0 1.6
19 74 82 727 03 1 Aochia 68 1.5 98.5 0.0 5.9 100.0 0.0 0.0
19 74 82 727 04 1 Chodda Dohna 82 0.0 90.2 9.8 3.7 100.0 0.0 0.0
19 74 82 822 1 *Rudrapur 194 0.0 88.1 11.9 26.8 96.9 0.0 3.1
19 74 82 849 1 *Shoroshpur 608 0.0 85.9 14.1 42.6 98.8 0.2 1.0
19 74 82 849 01 1 Shoroshpur 535 0.0 83.9 16.1 45.6 99.1 0.2 0.7
19 74 82 849 02 1 Kismat 73 0.0 100.0 0.0 20.5 97.3 0.0 2.7
19 74 82 858 1 *Shatora 316 0.0 97.2 2.8 51.9 99.4 0.0 0.6
19 74 82 889 1 *Sreedharpur 140 0.0 100.0 0.0 52.1 97.1 0.7 2.1
19 74 94 Uttar Hawla Union Total 4282 0.2 90.6 9.2 62.4 98.9 0.2 0.9
19 74 94 109 1 *Barallah 3050 0.3 92.6 7.1 67.1 98.8 0.2 1.0
19 74 94 109 01 1 Uttar Fenua 282 0.4 91.1 8.5 75.2 99.6 0.0 0.4
19 74 94 109 02 1 Dakhin Fenua 424 0.0 97.2 2.8 73.6 98.3 0.2 1.4
19 74 94 109 03 1 Barallah Uttar 454 0.0 94.1 5.9 61.7 99.1 0.2 0.7
19 74 94 109 04 1 Ulupara 153 0.7 79.1 20.3 84.3 100.0 0.0 0.0
19 74 94 109 05 1 Koiar Par 92 0.0 72.8 27.2 51.1 100.0 0.0 0.0
19 74 94 109 06 1 Gozaria 37 0.0 100.0 0.0 0.0 100.0 0.0 0.0
19 74 94 109 07 1 Katuni Para 191 0.0 92.7 7.3 73.3 100.0 0.0 0.0
19 74 94 109 08 1 Hatimara Purba 462 0.9 98.9 0.2 82.7 96.1 0.6 3.2
19 74 94 109 09 1 Hatimara Paschim 242 0.0 86.0 14.0 75.2 98.8 0.0 1.2
19 74 94 109 10 1 Ulupara Dakhin 197 0.0 94.4 5.6 31.5 100.0 0.0 0.0
19 74 94 109 11 1 Barallah Dakhin 130 1.5 90.8 7.7 49.2 100.0 0.0 0.0
19 74 94 109 12 1 Indry 155 0.0 94.2 5.8 66.5 99.4 0.0 0.6
19 74 94 109 13 1 Kowli Para 194 0.0 89.7 10.3 63.4 99.5 0.0 0.5
19 74 94 109 14 1 Jorpara 37 0.0 100.0 0.0 29.7 97.3 0.0 2.7
19 74 94 923 1 *Thengarbam 231 0.0 69.3 30.7 0.0 99.6 0.4 0.0
19 74 94 947 1 *Chotta Uttar Hawla 199 0.0 90.5 9.5 76.4 99.0 1.0 0.0
RMO: 1 = Rural, 2 = Urban and 3 = Other Urban Page 125 of 162

Tap Tube-Well Other Owned Rented Rent free
2 3 4 5 6 7 8 9 10
MZ /
MHVill RMO
1
Table C-15: Distribution of General Households by Source of Drinking Water, Electricity Connection and Housing Tenancy Status, by Residence
and Community
Administrative Unit
Residence
Community
Number of
Households
Source of Drinking Water (%) Electricity
Connection
(%)
Housing Tenancy (%)
ZL UZUN /
WA
19 74 94 948 1 *Bara Uttar Hawla 802 0.1 89.0 10.8 59.1 99.0 0.1 0.9
19 74 94 948 01 1 Uttar Hawla Uttar 309 0.3 89.0 10.7 63.8 99.0 0.0 1.0
19 74 94 948 02 1 Uttar Hawla Dakhin 462 0.0 88.3 11.7 56.7 98.9 0.2 0.9
19 74 94 948 03 1 Hajra Muri 31 0.0 100.0 0.0 48.4 100.0 0.0 0.0
19 75 Meghna Upazila Total 21596 0.6 93.9 5.5 77.1 98.3 0.8 0.9
19 75 1 Meghna Upazila 20339 0.5 93.8 5.7 76.0 98.5 0.7 0.9
19 75 3 Meghna Upazila 1257 2.1 96.6 1.3 93.7 96.7 2.1 1.3
19 75 12 Barakanda Union Total 4492 0.4 94.6 5.0 64.9 98.2 0.6 1.2
19 75 12 065 1 *Bara Lakshmipur 936 0.0 99.8 0.2 37.8 97.8 0.3 1.9
19 75 12 065 01 1 Dakshin Baorkhola 533 0.0 99.6 0.4 60.8 98.1 0.2 1.7
19 75 12 065 02 1 Kashipur 47 0.0 100.0 0.0 0.0 100.0 0.0 0.0
19 75 12 065 03 1 Dari Mirzanagar 87 0.0 100.0 0.0 0.0 98.9 0.0 1.1
19 75 12 065 04 1 Ataullakandi 53 0.0 100.0 0.0 0.0 94.3 0.0 5.7
19 75 12 065 05 1 Dharmapur 52 0.0 100.0 0.0 0.0 98.1 0.0 1.9
19 75 12 065 06 1 Omrakandi 76 0.0 100.0 0.0 0.0 92.1 2.6 5.3
19 75 12 065 07 1 Bharatpur 88 0.0 100.0 0.0 34.1 100.0 0.0 0.0
19 75 12 455 1 *Haripur 677 0.9 79.2 19.9 85.7 99.9 0.0 0.1
19 75 12 586 1 *Khirachak 235 0.0 100.0 0.0 0.0 99.6 0.0 0.4
19 75 12 586 01 1 Khirachak 185 0.0 100.0 0.0 0.0 99.5 0.0 0.5
19 75 12 586 02 1 Kashergaon 50 0.0 100.0 0.0 0.0 100.0 0.0 0.0
19 75 12 703 1 *Narayanpur 1342 0.1 98.8 1.0 65.1 96.3 1.6 2.2
19 75 12 703 01 1 Farazikandi 46 0.0 100.0 0.0 67.4 93.5 4.3 2.2
19 75 12 703 02 1 Durgapur (Rampur) 131 0.0 100.0 0.0 59.5 84.0 1.5 14.5
19 75 12 703 03 1 Barakandi 724 0.3 97.9 1.8 72.4 96.5 2.3 1.1
19 75 12 703 04 1 Kandergaon 237 0.0 100.0 0.0 82.7 99.6 0.0 0.4
19 75 12 703 05 1 Bakshikanda 204 0.0 99.5 0.5 22.1 100.0 0.0 0.0
19 75 12 863 1 *Shibnagar 1024 0.4 97.5 2.1 82.0 99.2 0.3 0.5
19 75 12 863 01 1 Shibnagar 174 0.6 99.4 0.0 96.0 98.3 1.1 0.6
19 75 12 863 02 1 Algi 148 0.0 100.0 0.0 68.9 100.0 0.0 0.0
RMO: 1 = Rural, 2 = Urban and 3 = Other Urban Page 126 of 162

Tap Tube-Well Other Owned Rented Rent free
2 3 4 5 6 7 8 9 10
MZ /
MHVill RMO
1
Table C-15: Distribution of General Households by Source of Drinking Water, Electricity Connection and Housing Tenancy Status, by Residence
and Community
Administrative Unit
Residence
Community
Number of
Households
Source of Drinking Water (%) Electricity
Connection
(%)
Housing Tenancy (%)
ZL UZUN /
WA
19 75 12 863 03 1 Char Narayanpur 35 0.0 97.1 2.9 68.6 97.1 0.0 2.9
19 75 12 863 04 1 Baidyanathpur 202 0.0 90.6 9.4 92.6 99.0 0.0 1.0
19 75 12 863 05 1 Changak Kandi 90 0.0 100.0 0.0 0.0 100.0 0.0 0.0
19 75 12 863 06 1 Uttar Bhorkhola 375 0.8 98.7 0.5 96.0 99.5 0.3 0.3
19 75 12 874 1 *Sonakanda 278 2.5 79.5 18.0 96.8 99.6 0.0 0.4
19 75 19 Chandanpur Union Total 2377 1.0 98.2 0.8 94.6 98.6 1.2 0.3
19 75 19 815 1 *Sapmara Chandanpur 940 1.1 98.6 0.3 96.2 97.3 2.6 0.1
19 75 19 815 01 1 Chandanpur 500 1.4 98.6 0.0 97.2 95.2 4.6 0.2
19 75 19 815 02 1 Bara Sapmara 210 0.5 99.5 0.0 99.5 100.0 0.0 0.0
19 75 19 815 03 1 Chhota Sapmara 132 1.5 96.2 2.3 97.0 100.0 0.0 0.0
19 75 19 815 04 1 Gopalnagar 98 0.0 100.0 0.0 82.7 99.0 1.0 0.0
19 75 19 846 1 *Satani 268 2.2 96.6 1.1 98.5 99.6 0.4 0.0
19 75 19 857 1 *Sener Char 1169 0.6 98.2 1.2 92.5 99.3 0.3 0.4
19 75 19 857 01 1 Tulatali 428 1.2 98.6 0.2 98.6 99.5 0.2 0.2
19 75 19 857 02 1 Shibnagar 345 0.3 99.7 0.0 93.6 98.6 0.6 0.9
19 75 19 857 03 1 Raghunathpur 204 0.0 94.1 5.9 93.1 99.5 0.0 0.5
19 75 19 857 04 1 Kacharikandi 192 0.5 99.0 0.5 76.0 100.0 0.0 0.0
19 75 21 Chalibhanga Union Total 2417 0.1 87.9 12.0 53.5 98.9 0.0 1.0
19 75 21 148 1 *Bhasania Dharichar 502 0.0 69.1 30.9 83.5 96.8 0.0 3.2
19 75 21 148 01 1 Nalchar 292 0.0 80.5 19.5 87.7 94.5 0.0 5.5
19 75 21 148 02 1 Faraji Kandi 210 0.0 53.3 46.7 77.6 100.0 0.0 0.0
19 75 21 179 1 *Chalibhanga 601 0.0 93.8 6.2 87.9 99.5 0.2 0.3
19 75 21 825 1 *Sapmara Charergaon 500 0.0 86.8 13.2 0.0 99.8 0.0 0.2
19 75 21 825 01 1 Maishar Char 254 0.0 76.0 24.0 0.0 99.6 0.0 0.4
19 75 21 825 02 1 Baraia Kandi 246 0.0 98.0 2.0 0.0 100.0 0.0 0.0
19 75 21 857 1 *Senerchar (Part) 814 0.2 95.8 3.9 42.6 99.3 0.0 0.7
19 75 21 857 01 1 Titir Char 468 0.4 94.0 5.6 74.1 98.9 0.0 1.1
19 75 21 857 02 1 Ramprasader Char 346 0.0 98.3 1.7 0.0 99.7 0.0 0.3
19 75 43 Gobindapur Union Total 4210 1.2 94.6 4.2 84.3 98.2 0.9 1.0
RMO: 1 = Rural, 2 = Urban and 3 = Other Urban Page 127 of 162

Tap Tube-Well Other Owned Rented Rent free
2 3 4 5 6 7 8 9 10
MZ /
MHVill RMO
1
Table C-15: Distribution of General Households by Source of Drinking Water, Electricity Connection and Housing Tenancy Status, by Residence
and Community
Administrative Unit
Residence
Community
Number of
Households
Source of Drinking Water (%) Electricity
Connection
(%)
Housing Tenancy (%)
ZL UZUN /
WA
19 75 43 1 Gobindapur Union 2953 0.8 93.7 5.5 80.3 98.8 0.4 0.8
19 75 43 3 Gobindapur Union 1257 2.1 96.6 1.3 93.7 96.7 2.1 1.3
19 75 43 054 1 *Alipur 629 0.2 99.7 0.2 95.4 100.0 0.0 0.0
19 75 43 054 01 1 Alipur 56 0.0 100.0 0.0 100.0 100.0 0.0 0.0
19 75 43 054 02 1 Hizaltola 163 0.0 100.0 0.0 93.3 100.0 0.0 0.0
19 75 43 054 03 1 Dakshinkandi 354 0.0 100.0 0.0 95.5 100.0 0.0 0.0
19 75 43 054 04 1 Chaolaghat 56 1.8 96.4 1.8 96.4 100.0 0.0 0.0
19 75 43 138 1 *Binodpur 182 0.0 44.0 56.0 49.5 100.0 0.0 0.0
19 75 43 138 01 1 Binodpur 114 0.0 62.3 37.7 21.1 100.0 0.0 0.0
19 75 43 138 02 1 Char Binodpur 68 0.0 13.2 86.8 97.1 100.0 0.0 0.0
19 75 43 160 1 *Brahman Char 736 0.1 97.0 2.9 77.2 99.5 0.1 0.4
19 75 43 160 01 1 Brahman Char 40 2.5 87.5 10.0 92.5 100.0 0.0 0.0
19 75 43 160 02 1 Balur Char 199 0.0 100.0 0.0 87.9 98.5 0.0 1.5
19 75 43 160 03 1 Noagaon 404 0.0 96.8 3.2 87.9 99.8 0.2 0.0
19 75 43 160 04 1 Char Noagaon 93 0.0 95.7 4.3 1.1 100.0 0.0 0.0
19 75 43 164 1 *Buriar Char 334 3.0 96.4 0.6 94.0 96.7 1.2 2.1
19 75 43 229 3 *Char Pathalia 1257 2.1 96.6 1.3 93.7 96.7 2.1 1.3
19 75 43 229 01 3 Char Pathalia 89 2.2 97.8 0.0 97.8 98.9 0.0 1.1
19 75 43 229 02 3 Mahaskhola 106 0.0 92.5 7.5 90.6 95.3 0.9 3.8
19 75 43 229 03 3 Ramnagar 325 4.0 93.5 2.5 88.3 93.2 4.6 2.2
19 75 43 229 04 3 Joynagar 248 0.8 99.2 0.0 96.8 98.4 0.8 0.8
19 75 43 229 05 3 Gobindapur 248 2.0 98.0 0.0 94.0 98.0 1.2 0.8
19 75 43 229 06 3 Hasnabad 241 2.1 97.9 0.0 97.5 97.9 2.1 0.0
19 75 43 335 1 *Darikandi 190 0.0 98.4 1.6 94.7 95.3 3.2 1.6
19 75 43 557 1 *Karimabad 63 0.0 100.0 0.0 100.0 98.4 0.0 1.6
19 75 43 623 1 *Mozidpur 243 0.0 91.8 8.2 17.3 98.8 0.0 1.2
19 75 43 881 1 *Sonar Char 576 2.1 95.8 2.1 89.4 98.8 0.0 1.2
19 75 53 Luter Char Union Total 2398 0.3 86.2 13.4 74.3 99.1 0.2 0.7
19 75 53 066 1 *Bazani Bari 223 0.0 81.2 18.8 91.9 100.0 0.0 0.0
RMO: 1 = Rural, 2 = Urban and 3 = Other Urban Page 128 of 162

Tap Tube-Well Other Owned Rented Rent free
2 3 4 5 6 7 8 9 10
MZ /
MHVill RMO
1
Table C-15: Distribution of General Households by Source of Drinking Water, Electricity Connection and Housing Tenancy Status, by Residence
and Community
Administrative Unit
Residence
Community
Number of
Households
Source of Drinking Water (%) Electricity
Connection
(%)
Housing Tenancy (%)
ZL UZUN /
WA
19 75 53 066 01 1 Kandergaon 146 0.0 71.2 28.8 99.3 100.0 0.0 0.0
19 75 53 066 02 1 New Kandergaon 77 0.0 100.0 0.0 77.9 100.0 0.0 0.0
19 75 53 116 1 *Bagai Nilokhi 79 0.0 77.2 22.8 73.4 100.0 0.0 0.0
19 75 53 615 1 *Laksmipur 364 0.0 98.6 1.4 20.3 99.5 0.0 0.5
19 75 53 758 1 *Paschim Balarampur 356 1.1 76.7 22.2 81.7 98.9 0.3 0.8
19 75 53 758 01 1 Mamudpur 216 0.0 70.4 29.6 75.0 100.0 0.0 0.0
19 75 53 758 02 1 Naya Mamud Pur 140 2.9 86.4 10.7 92.1 97.1 0.7 2.1
19 75 53 807 1 *P.Char Kanthalia 247 0.0 70.4 29.6 91.5 99.2 0.0 0.8
19 75 53 849 1 *Satghariakandi (Satbaria) 110 0.0 26.4 73.6 48.2 100.0 0.0 0.0
19 75 53 870 1 *Sona Char 1019 0.4 97.3 2.4 85.8 98.7 0.4 0.9
19 75 53 870 01 1 Dari Luter Char(I) 268 0.0 98.5 1.5 83.6 97.4 0.0 2.6
19 75 53 870 02 1 Sekher Gaon 419 1.0 96.7 2.4 88.8 99.0 0.5 0.5
19 75 53 870 03 1 Luter Char 332 0.0 97.0 3.0 83.7 99.4 0.6 0.0
19 75 71 Maniker Char Union Total 2690 1.0 94.5 4.5 92.1 96.6 2.3 1.1
19 75 71 048 1 *Sapmara 208 0.0 99.0 1.0 98.6 100.0 0.0 0.0
19 75 71 415 1 *Maniker Char 1091 0.5 96.6 2.9 91.4 93.5 4.9 1.6
19 75 71 415 01 1 Maniker Char 334 0.0 100.0 0.0 99.1 95.8 3.6 0.6
19 75 71 415 02 1 Sikir Goan 203 0.0 100.0 0.0 97.5 83.7 12.3 3.9
19 75 71 415 03 1 Mataber Kandi 138 3.6 96.4 0.0 81.9 94.2 5.8 0.0
19 75 71 415 04 1 Uttar Bausia 34 0.0 100.0 0.0 97.1 82.4 17.6 0.0
19 75 71 415 05 1 Purba Nayagaon 32 0.0 100.0 0.0 81.3 100.0 0.0 0.0
19 75 71 415 06 1 Bara Naya Gaon 183 0.0 92.3 7.7 76.5 97.8 0.5 1.6
19 75 71 415 07 1 Madhabpur 118 0.0 88.1 11.9 94.9 97.5 0.8 1.7
19 75 71 415 08 1 Ujan Char Nayagaon 49 0.0 91.8 8.2 89.8 93.9 2.0 4.1
19 75 71 465 1 *Joypur 222 0.0 86.5 13.5 94.6 95.9 1.8 2.3
19 75 71 571 1 *Lastimaanika 1169 1.9 93.2 4.9 91.1 99.1 0.3 0.7
19 75 71 571 01 1 Kashipur 120 0.0 100.0 0.0 100.0 100.0 0.0 0.0
19 75 71 571 02 1 Barahazari 190 0.5 88.9 10.5 97.9 99.5 0.0 0.5
19 75 71 571 03 1 Changa Kandi 120 0.0 100.0 0.0 92.5 98.3 1.7 0.0
RMO: 1 = Rural, 2 = Urban and 3 = Other Urban Page 129 of 162

Tap Tube-Well Other Owned Rented Rent free
2 3 4 5 6 7 8 9 10
MZ /
MHVill RMO
1
Table C-15: Distribution of General Households by Source of Drinking Water, Electricity Connection and Housing Tenancy Status, by Residence
and Community
Administrative Unit
Residence
Community
Number of
Households
Source of Drinking Water (%) Electricity
Connection
(%)
Housing Tenancy (%)
ZL UZUN /
WA
19 75 71 571 04 1 Rajitpur 32 0.0 100.0 0.0 100.0 100.0 0.0 0.0
19 75 71 571 05 1 Karimabad 92 8.7 91.3 0.0 90.2 98.9 0.0 1.1
19 75 71 571 06 1 Lastimanika 60 8.3 91.7 0.0 100.0 100.0 0.0 0.0
19 75 71 571 07 1 Amirabad 224 0.0 99.6 0.4 92.9 98.2 0.4 1.3
19 75 71 571 08 1 Jalar Para 70 0.0 100.0 0.0 100.0 100.0 0.0 0.0
19 75 71 571 09 1 Ballaverkandi 117 6.0 94.0 0.0 43.6 98.3 0.0 1.7
19 75 71 571 10 1 Jalar Par Nayagaon 144 0.7 74.3 25.0 100.0 99.3 0.0 0.7
19 75 95 Radhanagar Union Total 3012 0.1 99.0 0.9 78.9 99.1 0.1 0.7
19 75 95 074 1 *Balarampur 582 0.0 99.8 0.2 92.4 99.5 0.0 0.5
19 75 95 074 01 1 Batthali 91 0.0 100.0 0.0 98.9 100.0 0.0 0.0
19 75 95 074 02 1 Taltali 186 0.0 100.0 0.0 90.3 99.5 0.0 0.5
19 75 95 074 03 1 Mollahkandi 305 0.0 99.7 0.3 91.8 99.3 0.0 0.7
19 75 95 561 1 *Lakshmankhola 1039 0.1 99.1 0.8 76.9 99.2 0.0 0.8
19 75 95 561 01 1 Ratanpur 153 0.0 94.8 5.2 15.7 98.0 0.0 2.0
19 75 95 561 02 1 Takhurkandi 75 0.0 100.0 0.0 0.0 100.0 0.0 0.0
19 75 95 561 03 1 Lakshmankhola 600 0.2 99.8 0.0 95.8 99.3 0.0 0.7
19 75 95 561 04 1 Dullabdhi 140 0.0 100.0 0.0 94.3 100.0 0.0 0.0
19 75 95 561 05 1 Khatalia 71 0.0 100.0 0.0 95.8 98.6 0.0 1.4
19 75 95 635 1 *Mugar Char 909 0.2 97.9 1.9 80.4 98.3 0.4 1.2
19 75 95 635 01 1 Radhanagar 409 0.2 95.6 4.2 78.2 97.8 0.5 1.7
19 75 95 635 02 1 Mugar Char 500 0.2 99.8 0.0 82.2 98.8 0.4 0.8
19 75 95 688 1 *Pararbanda 370 0.0 100.0 0.0 83.2 100.0 0.0 0.0
19 75 95 836 1 *Sapmara Nalia Para 112 0.0 100.0 0.0 0.9 100.0 0.0 0.0
19 81 Muradnagar Upazila Total 101556 0.8 94.7 4.5 58.9 95.5 2.9 1.6
19 81 1 Muradnagar Upazila 95315 0.7 94.8 4.5 58.2 96.2 2.3 1.6
19 81 3 Muradnagar Upazila 6241 2.8 92.6 4.6 70.4 86.0 12.6 1.5
19 81 10 Akubpur Union Total 6881 0.6 94.6 4.9 58.6 95.5 1.8 2.7
19 81 10 006 1 *Akubpur 734 0.0 97.8 2.2 57.8 97.7 1.0 1.4
19 81 10 039 1 *Bailghar 945 1.0 93.7 5.4 68.8 96.8 1.6 1.6
RMO: 1 = Rural, 2 = Urban and 3 = Other Urban Page 130 of 162

Tap Tube-Well Other Owned Rented Rent free
2 3 4 5 6 7 8 9 10
MZ /
MHVill RMO
1
Table C-15: Distribution of General Households by Source of Drinking Water, Electricity Connection and Housing Tenancy Status, by Residence
and Community
Administrative Unit
Residence
Community
Number of
Households
Source of Drinking Water (%) Electricity
Connection
(%)
Housing Tenancy (%)
ZL UZUN /
WA
19 81 10 039 01 1 Bailghar 795 1.0 92.6 6.4 64.8 98.5 0.1 1.4
19 81 10 039 02 1 Rajabari 150 0.7 99.3 0.0 90.0 88.0 9.3 2.7
19 81 10 325 1 *Gazipur 788 1.1 94.0 4.8 71.7 95.4 2.2 2.4
19 81 10 325 01 1 Gazipur 670 0.6 93.7 5.7 77.6 95.8 1.6 2.5
19 81 10 325 02 1 Jangal 118 4.2 95.8 0.0 38.1 93.2 5.1 1.7
19 81 10 364 1 *Hirakashi 353 0.0 99.7 0.3 46.2 98.9 0.3 0.8
19 81 10 461 1 *Kashimpur 1530 1.2 96.6 2.2 72.8 95.6 2.5 2.0
19 81 10 461 01 1 Kashimpur 1339 1.4 96.1 2.5 70.2 95.1 2.8 2.2
19 81 10 461 02 1 Bakhya 191 0.0 100.0 0.0 91.1 99.0 0.5 0.5
19 81 10 585 1 *Metanghar 2531 0.1 92.1 7.7 44.0 94.0 1.7 4.3
19 81 10 585 01 1 Metanghar 824 0.1 99.2 0.7 40.4 86.2 4.7 9.1
19 81 10 585 02 1 Ghorashal 166 0.0 96.4 3.6 50.6 97.0 1.2 1.8
19 81 10 585 03 1 Karaibari 506 0.0 100.0 0.0 62.1 99.2 0.2 0.6
19 81 10 585 04 1 Kurerpar 373 0.0 90.6 9.4 70.8 98.7 0.3 1.1
19 81 10 585 05 1 Hosnabad 156 0.0 77.6 22.4 23.7 95.5 0.0 4.5
19 81 10 585 06 1 Pandughar 506 0.4 77.1 22.5 16.0 96.4 0.0 3.6
19 81 11 Andikot Union Total 5909 0.8 95.4 3.8 55.3 97.7 0.4 1.9
19 81 11 019 1 *Andikot 643 1.1 96.1 2.8 55.2 92.1 0.5 7.5
19 81 11 065 1 *Balibari 151 0.0 100.0 0.0 19.9 98.7 0.7 0.7
19 81 11 091 1 *Bareshwar 194 0.0 100.0 0.0 53.1 99.5 0.0 0.5
19 81 11 214 1 *Dalpa 2025 0.1 96.6 3.3 46.9 98.6 0.0 1.4
19 81 11 214 01 1 Dalpa 809 0.1 98.6 1.2 66.9 99.1 0.0 0.9
19 81 11 214 02 1 Deura 846 0.1 93.1 6.7 30.9 97.6 0.1 2.2
19 81 11 214 03 1 Fulghar 370 0.0 100.0 0.0 40.0 99.5 0.0 0.5
19 81 11 318 1 *Gangerkot 469 1.3 93.2 5.5 81.0 98.5 0.0 1.5
19 81 11 344 1 *Haidarabad 1403 1.6 90.9 7.4 48.5 98.1 1.3 0.6
19 81 11 344 01 1 Haidarabad 944 2.0 88.9 9.1 44.6 97.5 1.8 0.7
19 81 11 344 02 1 Sonarampur 218 1.8 96.3 1.8 66.1 99.5 0.0 0.5
19 81 11 344 03 1 Kaysar 126 0.0 100.0 0.0 79.4 99.2 0.8 0.0
RMO: 1 = Rural, 2 = Urban and 3 = Other Urban Page 131 of 162

Tap Tube-Well Other Owned Rented Rent free
2 3 4 5 6 7 8 9 10
MZ /
MHVill RMO
1
Table C-15: Distribution of General Households by Source of Drinking Water, Electricity Connection and Housing Tenancy Status, by Residence
and Community
Administrative Unit
Residence
Community
Number of
Households
Source of Drinking Water (%) Electricity
Connection
(%)
Housing Tenancy (%)
ZL UZUN /
WA
19 81 11 344 04 1 Ganipur 115 0.0 87.8 12.2 13.9 100.0 0.0 0.0
19 81 11 377 1 *Islampur 327 0.6 96.0 3.4 81.0 99.4 0.0 0.6
19 81 11 383 1 *Jadda 697 0.7 99.3 0.0 71.9 97.1 0.4 2.4
19 81 11 383 01 1 Jadda 481 0.8 99.2 0.0 84.4 96.0 0.6 3.3
19 81 11 383 02 1 Jangal 216 0.5 99.5 0.0 44.0 99.5 0.0 0.5
19 81 13 Purba Bangara Union Total 3280 0.4 91.3 8.3 61.1 96.9 1.7 1.3
19 81 13 177 1 *Dakshin Bangara 786 0.0 90.7 9.3 61.1 92.5 4.1 3.4
19 81 13 240 1 *Daulatpur 1215 0.6 93.1 6.3 61.5 98.3 0.8 0.9
19 81 13 240 01 1 Shimanarpar 252 0.0 91.3 8.7 72.2 98.4 0.4 1.2
19 81 13 240 02 1 Daulatpur 732 1.0 91.7 7.4 62.3 99.2 0.4 0.4
19 81 13 240 03 1 Jogirkhil 231 0.0 99.6 0.4 47.2 95.2 2.6 2.2
19 81 13 481 1 *Khamargaon 586 0.7 99.1 0.2 67.6 99.7 0.2 0.2
19 81 13 546 1 *Maklishpur 305 0.3 82.6 17.0 59.0 98.0 0.3 1.6
19 81 13 682 1 *Uttar Bishnupur 388 0.0 82.0 18.0 52.1 96.6 3.4 0.0
19 81 13 682 01 1 Benikhola 94 0.0 100.0 0.0 37.2 100.0 0.0 0.0
19 81 13 682 02 1 Bishnupur 294 0.0 76.2 23.8 56.8 95.6 4.4 0.0
19 81 18 Paschim Bangara Union Total 3619 0.2 90.8 9.0 39.7 98.9 0.2 0.9
19 81 18 266 1 *Dhanapatikhola 778 0.0 94.1 5.9 20.7 98.1 0.0 1.9
19 81 18 266 01 1 Dhanapatikhola 546 0.0 91.6 8.4 29.3 97.8 0.0 2.2
19 81 18 266 02 1 Kalaraia 232 0.0 100.0 0.0 0.4 98.7 0.0 1.3
19 81 18 331 1 *Gazipur 241 0.0 50.2 49.8 18.3 98.3 0.8 0.8
19 81 18 422 1 *Kagatua 441 0.0 98.4 1.6 6.6 99.3 0.2 0.5
19 81 18 526 1 *Kurakhal Kurundi 658 0.0 98.0 2.0 47.3 99.4 0.2 0.5
19 81 18 526 01 1 Kurakhal 448 0.0 99.6 0.4 57.1 99.8 0.2 0.0
19 81 18 526 02 1 Kurundi 210 0.0 94.8 5.2 26.2 98.6 0.0 1.4
19 81 18 858 1 *Sonatala 871 0.5 88.5 11.0 45.9 99.2 0.0 0.8
19 81 18 858 01 1 Kudalkata 193 1.6 95.3 3.1 56.5 97.4 0.0 2.6
19 81 18 858 02 1 Mirzapur 110 0.0 89.1 10.9 35.5 98.2 0.0 1.8
19 81 18 858 03 1 Noagaon 233 0.0 70.8 29.2 0.0 100.0 0.0 0.0
RMO: 1 = Rural, 2 = Urban and 3 = Other Urban Page 132 of 162

Tap Tube-Well Other Owned Rented Rent free
2 3 4 5 6 7 8 9 10
MZ /
MHVill RMO
1
Table C-15: Distribution of General Households by Source of Drinking Water, Electricity Connection and Housing Tenancy Status, by Residence
and Community
Administrative Unit
Residence
Community
Number of
Households
Source of Drinking Water (%) Electricity
Connection
(%)
Housing Tenancy (%)
ZL UZUN /
WA
19 81 18 858 04 1 Kalipura 230 0.4 95.2 4.3 67.8 100.0 0.0 0.0
19 81 18 858 05 1 Panjir Par 105 0.0 100.0 0.0 91.4 100.0 0.0 0.0
19 81 18 915 1 *Uttar Dighirpar 630 0.3 92.5 7.1 77.8 98.9 0.5 0.6
19 81 22 Chapitala Union Total 2913 0.1 98.0 2.0 65.1 97.8 1.2 1.1
19 81 22 162 1 *Dakshin Chapitala 1580 0.1 96.5 3.4 66.3 96.8 2.0 1.3
19 81 22 494 1 *Khapura 534 0.0 100.0 0.0 67.2 99.1 0.6 0.4
19 81 22 494 01 1 Khapura 415 0.0 100.0 0.0 70.4 99.3 0.7 0.0
19 81 22 494 02 1 Ulumuira 119 0.0 100.0 0.0 56.3 98.3 0.0 1.7
19 81 22 623 1 *Sreerampur 297 0.0 99.3 0.7 54.5 98.0 0.0 2.0
19 81 22 721 1 *Uttar Pushkarinirpar 502 0.0 99.8 0.2 65.1 99.4 0.0 0.6
19 81 27 Darora Union Total 3620 0.1 97.8 2.1 39.6 98.3 0.8 0.9
19 81 27 197 1 *Dakshin Dighirpar 175 0.0 100.0 0.0 6.9 97.7 0.0 2.3
19 81 27 210 1 *Dakshin Pushkarinirpar 94 0.0 80.9 19.1 6.4 93.6 5.3 1.1
19 81 27 227 1 *Darora 503 0.0 100.0 0.0 68.6 94.4 4.4 1.2
19 81 27 429 1 *Kajiatal 1708 0.2 96.6 3.2 57.7 99.4 0.0 0.6
19 81 27 429 01 1 Pukurpar 72 0.0 100.0 0.0 90.3 100.0 0.0 0.0
19 81 27 429 02 1 Ratan Nagar 49 2.0 98.0 0.0 6.1 100.0 0.0 0.0
19 81 27 429 03 1 Sobdulkanda 60 0.0 100.0 0.0 11.7 100.0 0.0 0.0
19 81 27 429 04 1 Dakshin Kajiatal 851 0.1 96.6 3.3 71.2 99.6 0.0 0.4
19 81 27 429 05 1 Uttar Kajiatal 676 0.1 95.9 4.0 45.0 98.8 0.0 1.2
19 81 27 468 1 *Kemtali 147 0.0 100.0 0.0 1.4 100.0 0.0 0.0
19 81 27 734 1 *Palasuta 837 0.0 99.5 0.5 9.4 98.8 0.2 1.0
19 81 27 734 01 1 Palasuta 649 0.0 99.4 0.6 8.5 98.6 0.3 1.1
19 81 27 734 02 1 Nayakandi 153 0.0 100.0 0.0 15.7 99.3 0.0 0.7
19 81 27 734 03 1 Haterpar 35 0.0 100.0 0.0 0.0 100.0 0.0 0.0
19 81 27 786 1 *Putiajuri 98 1.0 99.0 0.0 0.0 100.0 0.0 0.0
19 81 27 808 1 *Uttar Padua 58 0.0 100.0 0.0 8.6 98.3 0.0 1.7
19 81 31 Chhaliakandi Union Total 3373 0.6 98.5 0.9 57.1 97.1 0.5 2.4
19 81 31 130 1 *Borar Char 373 0.3 99.7 0.0 65.7 98.1 0.3 1.6
RMO: 1 = Rural, 2 = Urban and 3 = Other Urban Page 133 of 162

Tap Tube-Well Other Owned Rented Rent free
2 3 4 5 6 7 8 9 10
MZ /
MHVill RMO
1
Table C-15: Distribution of General Households by Source of Drinking Water, Electricity Connection and Housing Tenancy Status, by Residence
and Community
Administrative Unit
Residence
Community
Number of
Households
Source of Drinking Water (%) Electricity
Connection
(%)
Housing Tenancy (%)
ZL UZUN /
WA
19 81 31 143 1 *Byaser Para 115 0.0 100.0 0.0 0.0 94.8 0.0 5.2
19 81 31 182 1 *Chhaliakandi 1125 1.1 98.8 0.1 70.8 94.0 1.2 4.9
19 81 31 182 01 1 Chhaliakandi 937 1.3 98.6 0.1 67.3 92.7 1.4 5.9
19 81 31 182 02 1 Dakshin Chhaliakandi 188 0.0 100.0 0.0 87.8 100.0 0.0 0.0
19 81 31 234 1 *Daular Char 107 0.9 99.1 0.0 29.9 100.0 0.0 0.0
19 81 31 273 1 *Diakola 27 0.0 100.0 0.0 0.0 100.0 0.0 0.0
19 81 31 371 1 *Dakshin Ampal 360 0.3 99.7 0.0 43.9 99.7 0.3 0.0
19 81 31 578 1 *Melan Char 62 0.0 100.0 0.0 17.7 88.7 0.0 11.3
19 81 31 767 1 *Patuatuli 26 0.0 100.0 0.0 0.0 100.0 0.0 0.0
19 81 31 929 1 *Subilar Char 404 0.0 92.3 7.7 56.7 99.8 0.0 0.2
19 81 31 929 01 1 Subilar Char 288 0.0 100.0 0.0 71.5 99.7 0.0 0.3
19 81 31 929 02 1 Chengatali 20 0.0 80.0 20.0 85.0 100.0 0.0 0.0
19 81 31 929 03 1 Balu Char 74 0.0 63.5 36.5 8.1 100.0 0.0 0.0
19 81 31 929 04 1 Sonkordi 22 0.0 100.0 0.0 0.0 100.0 0.0 0.0
19 81 31 976 1 *Uttar Ampal 774 0.6 99.4 0.0 58.8 99.0 0.3 0.8
19 81 31 976 01 1 Niamatkandi 417 0.7 99.3 0.0 84.2 98.8 0.5 0.7
19 81 31 976 02 1 Uttar Ampal 231 0.4 99.6 0.0 45.0 100.0 0.0 0.0
19 81 31 976 03 1 Bagalkhala 126 0.8 99.2 0.0 0.0 97.6 0.0 2.4
19 81 36 Dhamghar Union Total 7361 0.4 97.5 2.1 61.2 97.9 0.9 1.2
19 81 36 026 1 *Aralia 506 1.4 98.6 0.0 74.5 96.6 1.2 2.2
19 81 36 026 01 1 Aralia 280 1.1 98.9 0.0 62.5 99.3 0.7 0.0
19 81 36 026 02 1 Ghaituli 226 1.8 98.2 0.0 89.4 93.4 1.8 4.9
19 81 36 117 1 *Bhubanghar 599 0.0 100.0 0.0 48.2 91.8 3.8 4.3
19 81 36 253 1 *Dhamghar 1208 1.2 97.2 1.7 63.1 97.8 0.9 1.3
19 81 36 487 1 *Khandail 383 0.0 86.4 13.6 79.6 98.7 0.0 1.3
19 81 36 513 1 *Krishnapur 628 0.0 92.0 8.0 62.1 98.9 0.6 0.5
19 81 36 604 1 *Mugsair 318 0.0 100.0 0.0 75.2 98.7 0.3 0.9
19 81 36 637 1 *Nahal 463 0.6 99.4 0.0 54.6 99.1 0.6 0.2
19 81 36 637 01 1 Nahal 388 0.8 99.2 0.0 62.1 99.2 0.5 0.3
RMO: 1 = Rural, 2 = Urban and 3 = Other Urban Page 134 of 162
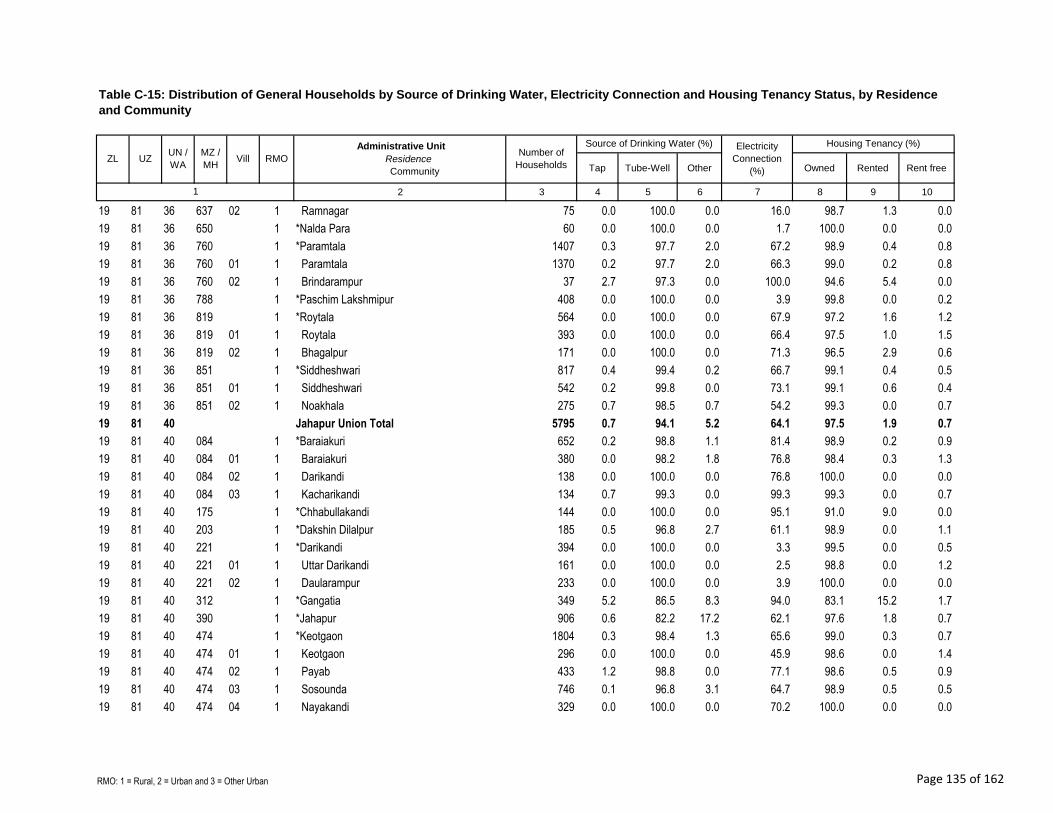
Tap Tube-Well Other Owned Rented Rent free
2 3 4 5 6 7 8 9 10
MZ /
MHVill RMO
1
Table C-15: Distribution of General Households by Source of Drinking Water, Electricity Connection and Housing Tenancy Status, by Residence
and Community
Administrative Unit
Residence
Community
Number of
Households
Source of Drinking Water (%) Electricity
Connection
(%)
Housing Tenancy (%)
ZL UZUN /
WA
19 81 36 637 02 1 Ramnagar 75 0.0 100.0 0.0 16.0 98.7 1.3 0.0
19 81 36 650 1 *Nalda Para 60 0.0 100.0 0.0 1.7 100.0 0.0 0.0
19 81 36 760 1 *Paramtala 1407 0.3 97.7 2.0 67.2 98.9 0.4 0.8
19 81 36 760 01 1 Paramtala 1370 0.2 97.7 2.0 66.3 99.0 0.2 0.8
19 81 36 760 02 1 Brindarampur 37 2.7 97.3 0.0 100.0 94.6 5.4 0.0
19 81 36 788 1 *Paschim Lakshmipur 408 0.0 100.0 0.0 3.9 99.8 0.0 0.2
19 81 36 819 1 *Roytala 564 0.0 100.0 0.0 67.9 97.2 1.6 1.2
19 81 36 819 01 1 Roytala 393 0.0 100.0 0.0 66.4 97.5 1.0 1.5
19 81 36 819 02 1 Bhagalpur 171 0.0 100.0 0.0 71.3 96.5 2.9 0.6
19 81 36 851 1 *Siddheshwari 817 0.4 99.4 0.2 66.7 99.1 0.4 0.5
19 81 36 851 01 1 Siddheshwari 542 0.2 99.8 0.0 73.1 99.1 0.6 0.4
19 81 36 851 02 1 Noakhala 275 0.7 98.5 0.7 54.2 99.3 0.0 0.7
19 81 40 Jahapur Union Total 5795 0.7 94.1 5.2 64.1 97.5 1.9 0.7
19 81 40 084 1 *Baraiakuri 652 0.2 98.8 1.1 81.4 98.9 0.2 0.9
19 81 40 084 01 1 Baraiakuri 380 0.0 98.2 1.8 76.8 98.4 0.3 1.3
19 81 40 084 02 1 Darikandi 138 0.0 100.0 0.0 76.8 100.0 0.0 0.0
19 81 40 084 03 1 Kacharikandi 134 0.7 99.3 0.0 99.3 99.3 0.0 0.7
19 81 40 175 1 *Chhabullakandi 144 0.0 100.0 0.0 95.1 91.0 9.0 0.0
19 81 40 203 1 *Dakshin Dilalpur 185 0.5 96.8 2.7 61.1 98.9 0.0 1.1
19 81 40 221 1 *Darikandi 394 0.0 100.0 0.0 3.3 99.5 0.0 0.5
19 81 40 221 01 1 Uttar Darikandi 161 0.0 100.0 0.0 2.5 98.8 0.0 1.2
19 81 40 221 02 1 Daularampur 233 0.0 100.0 0.0 3.9 100.0 0.0 0.0
19 81 40 312 1 *Gangatia 349 5.2 86.5 8.3 94.0 83.1 15.2 1.7
19 81 40 390 1 *Jahapur 906 0.6 82.2 17.2 62.1 97.6 1.8 0.7
19 81 40 474 1 *Keotgaon 1804 0.3 98.4 1.3 65.6 99.0 0.3 0.7
19 81 40 474 01 1 Keotgaon 296 0.0 100.0 0.0 45.9 98.6 0.0 1.4
19 81 40 474 02 1 Payab 433 1.2 98.8 0.0 77.1 98.6 0.5 0.9
19 81 40 474 03 1 Sosounda 746 0.1 96.8 3.1 64.7 98.9 0.5 0.5
19 81 40 474 04 1 Nayakandi 329 0.0 100.0 0.0 70.2 100.0 0.0 0.0
RMO: 1 = Rural, 2 = Urban and 3 = Other Urban Page 135 of 162

Tap Tube-Well Other Owned Rented Rent free
2 3 4 5 6 7 8 9 10
MZ /
MHVill RMO
1
Table C-15: Distribution of General Households by Source of Drinking Water, Electricity Connection and Housing Tenancy Status, by Residence
and Community
Administrative Unit
Residence
Community
Number of
Households
Source of Drinking Water (%) Electricity
Connection
(%)
Housing Tenancy (%)
ZL UZUN /
WA
19 81 40 780 1 *Puniatan 30 0.0 86.7 13.3 26.7 100.0 0.0 0.0
19 81 40 812 1 *Ranimuri 484 0.2 85.3 14.5 73.3 99.6 0.0 0.4
19 81 40 838 1 *Satmora 847 0.9 98.1 0.9 56.9 97.4 2.4 0.2
19 81 40 838 01 1 Satmora 596 0.2 98.7 1.2 41.3 99.7 0.0 0.3
19 81 40 838 02 1 Ballabhdi 251 2.8 96.8 0.4 94.0 92.0 8.0 0.0
19 81 45 Jatrapur Union Total 4186 0.1 98.8 1.1 43.4 98.4 0.3 1.3
19 81 45 403 1 *Jatrapur 1207 0.2 99.8 0.0 42.6 96.9 0.9 2.2
19 81 45 403 01 1 Jatrapur 1076 0.2 99.8 0.0 47.7 96.5 1.0 2.5
19 81 45 403 02 1 Singaria 131 0.8 99.2 0.0 0.8 100.0 0.0 0.0
19 81 45 598 1 *Mochagara 1558 0.0 99.9 0.1 42.0 99.0 0.1 0.9
19 81 45 598 01 1 Mochagara 1243 0.0 99.8 0.2 39.9 98.8 0.1 1.1
19 81 45 598 02 1 Kashipur 99 0.0 100.0 0.0 35.4 100.0 0.0 0.0
19 81 45 598 03 1 Dari Para 216 0.0 100.0 0.0 57.4 100.0 0.0 0.0
19 81 45 675 1 *Paschim Bhabanipur 876 0.0 99.8 0.2 50.5 99.0 0.0 1.0
19 81 45 675 01 1 Bhabanipur 335 0.0 99.4 0.6 17.0 98.2 0.0 1.8
19 81 45 675 02 1 Silampur 240 0.0 100.0 0.0 74.6 99.2 0.0 0.8
19 81 45 675 03 1 Shola Pukuria 221 0.0 100.0 0.0 60.2 99.5 0.0 0.5
19 81 45 675 04 1 Silimpurer Kunda 80 0.0 100.0 0.0 91.3 100.0 0.0 0.0
19 81 45 793 1 *Raghurampur 545 0.0 92.3 7.7 37.6 99.4 0.0 0.6
19 81 49 Kamalla Union Total 3691 0.4 95.6 3.9 66.6 98.0 0.4 1.6
19 81 49 013 1 *Algi 315 0.3 65.7 34.0 91.4 98.4 0.0 1.6
19 81 49 448 1 *Kamalla 1819 0.4 99.2 0.4 63.2 97.1 0.6 2.3
19 81 49 448 01 1 Kamalla 1565 0.4 99.1 0.4 65.0 96.7 0.7 2.6
19 81 49 448 02 1 Raznagar 254 0.0 100.0 0.0 52.0 99.6 0.0 0.4
19 81 49 455 1 *Kamar Char 1557 0.5 97.5 2.0 65.5 99.0 0.3 0.8
19 81 49 455 01 1 Kamar Char 583 0.3 95.9 3.8 64.5 98.5 0.7 0.9
19 81 49 455 02 1 Noagaon 398 0.0 97.7 2.3 76.6 99.0 0.0 1.0
19 81 49 455 03 1 Ashanpur 119 0.8 99.2 0.0 88.2 100.0 0.0 0.0
19 81 49 455 04 1 Neamatpur 457 1.1 98.9 0.0 51.2 99.3 0.0 0.7
RMO: 1 = Rural, 2 = Urban and 3 = Other Urban Page 136 of 162

Tap Tube-Well Other Owned Rented Rent free
2 3 4 5 6 7 8 9 10
MZ /
MHVill RMO
1
Table C-15: Distribution of General Households by Source of Drinking Water, Electricity Connection and Housing Tenancy Status, by Residence
and Community
Administrative Unit
Residence
Community
Number of
Households
Source of Drinking Water (%) Electricity
Connection
(%)
Housing Tenancy (%)
ZL UZUN /
WA
19 81 54 Muradnagar Union Total 7149 1.4 91.6 6.9 58.0 93.7 5.1 1.2
19 81 54 1 Muradnagar Union 3931 0.1 90.3 9.6 45.3 99.0 0.4 0.6
19 81 54 3 Muradnagar Union 3218 3.0 93.3 3.6 73.5 87.3 10.8 1.9
19 81 54 078 1 *Bara Alirchar 750 0.0 85.9 14.1 43.6 99.3 0.0 0.7
19 81 54 078 01 1 Uttar Alirchar 525 0.0 79.8 20.2 62.3 99.2 0.0 0.8
19 81 54 078 02 1 Dakshin Alirchar 225 0.0 100.0 0.0 0.0 99.6 0.0 0.4
19 81 54 188 1 *Chhota Alirchar 12 0.0 100.0 0.0 100.0 100.0 0.0 0.0
19 81 54 260 1 *Dhanirampur 686 0.1 89.5 10.3 68.8 98.1 1.3 0.6
19 81 54 260 01 1 Ramjanerkanda 73 0.0 100.0 0.0 83.6 100.0 0.0 0.0
19 81 54 260 02 1 Dhanirampur 613 0.2 88.3 11.6 67.0 97.9 1.5 0.7
19 81 54 572 1 *Matkir Char 388 0.0 95.6 4.4 2.1 99.7 0.0 0.3
19 81 54 572 01 1 Matkir Char 230 0.0 100.0 0.0 3.5 99.6 0.0 0.4
19 81 54 572 02 1 Rampur 158 0.0 89.2 10.8 0.0 100.0 0.0 0.0
19 81 54 611 3 *Muradnagar 3171 2.9 93.4 3.7 73.4 87.3 10.8 1.9
19 81 54 611 01 3 Muradnagar 1292 5.3 92.3 2.5 87.4 71.2 25.6 3.2
19 81 54 611 02 3 Madda Nagara 299 0.3 99.3 0.3 68.6 96.3 1.0 2.7
19 81 54 611 03 3 Karimpur 402 0.2 96.8 3.0 66.4 98.8 0.0 1.2
19 81 54 611 04 3 Herarer Kanda 319 1.9 98.1 0.0 61.8 98.4 1.6 0.0
19 81 54 611 05 3 Dilalpur 506 2.6 93.9 3.6 51.2 98.2 0.4 1.4
19 81 54 611 06 3 Yusubnagar 353 0.6 84.1 15.3 76.8 100.0 0.0 0.0
19 81 54 630 1 *Nagerkandi 416 0.0 68.8 31.3 22.8 98.8 0.7 0.5
19 81 54 630 01 1 Nagerkandi 229 0.0 99.1 0.9 5.7 99.6 0.4 0.0
19 81 54 630 02 1 Damuria 187 0.0 31.6 68.4 43.9 97.9 1.1 1.1
19 81 54 681 1 *Paschim Ghorashal 574 0.3 97.6 2.1 83.8 98.1 0.3 1.6
19 81 54 681 01 1 Paschim Ghorashal 562 0.4 98.2 1.4 85.6 98.0 0.4 1.6
19 81 54 681 02 1 Khudra Ghorashal 12 0.0 66.7 33.3 0.0 100.0 0.0 0.0
19 81 54 864 1 *Sonaulla 528 0.2 99.2 0.6 55.9 99.2 0.2 0.6
19 81 54 864 01 1 Purba Sonaulla 196 0.0 99.5 0.5 0.0 99.0 0.0 1.0
19 81 54 864 02 1 Paschim Sonaulla 207 0.5 98.6 1.0 89.9 99.5 0.5 0.0
RMO: 1 = Rural, 2 = Urban and 3 = Other Urban Page 137 of 162

Tap Tube-Well Other Owned Rented Rent free
2 3 4 5 6 7 8 9 10
MZ /
MHVill RMO
1
Table C-15: Distribution of General Households by Source of Drinking Water, Electricity Connection and Housing Tenancy Status, by Residence
and Community
Administrative Unit
Residence
Community
Number of
Households
Source of Drinking Water (%) Electricity
Connection
(%)
Housing Tenancy (%)
ZL UZUN /
WA
19 81 54 864 03 1 Karkatia 125 0.0 100.0 0.0 87.2 99.2 0.0 0.8
19 81 54 942 1 *Sureshwardi 577 0.0 93.1 6.9 15.9 100.0 0.0 0.0
19 81 54 942 01 1 Imandikandi 75 0.0 100.0 0.0 93.3 100.0 0.0 0.0
19 81 54 942 02 1 Sureshwardi 47 0.0 100.0 0.0 0.0 100.0 0.0 0.0
19 81 54 942 03 1 Sonapur 375 0.0 99.5 0.5 2.4 100.0 0.0 0.0
19 81 54 942 04 1 Manik Kandi 80 0.0 52.5 47.5 16.3 100.0 0.0 0.0
19 81 54 955 3 *Tetaitala 47 14.9 85.1 0.0 80.9 85.1 14.9 0.0
19 81 58 Purba Nabipur Union Total 5850 1.3 96.6 2.1 67.4 89.6 9.3 1.1
19 81 58 056 1 *Bakharnagar 3010 0.3 97.5 2.2 54.1 97.3 1.4 1.3
19 81 58 056 01 1 Bakharnagar 2479 0.1 97.3 2.5 49.5 98.0 1.2 0.8
19 81 58 056 02 1 Gokulnagar 531 1.1 98.5 0.4 75.1 94.0 2.6 3.4
19 81 58 338 1 *Gunjar 1860 0.6 97.6 1.8 74.7 97.0 2.0 1.0
19 81 58 624 1 *Nagarpar 980 5.5 91.9 2.6 94.3 51.8 47.1 1.0
19 81 63 Paschim Nabipur Union Total 5449 4.1 92.7 3.2 72.9 78.7 19.1 2.1
19 81 63 1 Paschim Nabipur Union 2426 5.9 93.8 0.3 80.1 71.5 24.9 3.6
19 81 63 3 Paschim Nabipur Union 3023 2.5 91.8 5.6 67.2 84.6 14.5 1.0
19 81 63 520 1 *Kulubari 556 0.4 99.3 0.4 70.9 98.4 1.4 0.2
19 81 63 520 01 1 Kulubari 391 0.5 99.5 0.0 77.7 98.0 1.8 0.3
19 81 63 520 02 1 Padua 165 0.0 98.8 1.2 54.5 99.4 0.6 0.0
19 81 63 669 1 *Noakandi 187 0.0 100.0 0.0 15.5 72.7 0.0 27.3
19 81 63 694 3 *Paschim Nabipur 1102 0.9 96.2 2.9 67.1 93.7 5.6 0.6
19 81 63 694 01 3 Nabipur 956 1.0 95.7 3.2 66.7 94.5 4.9 0.6
19 81 63 694 02 3 Husentala 64 0.0 100.0 0.0 93.8 75.0 23.4 1.6
19 81 63 694 03 3 Nabipur Kanda 82 0.0 98.8 1.2 50.0 100.0 0.0 0.0
19 81 63 799 3 *Rahimpur 1921 3.5 89.3 7.2 67.2 79.3 19.5 1.2
19 81 63 799 01 3 Rahimpur 828 0.6 92.3 7.1 55.2 95.2 4.3 0.5
19 81 63 799 02 3 Ramdani Mura 89 0.0 100.0 0.0 95.5 73.0 27.0 0.0
19 81 63 799 03 3 Chowdhury Kandi 70 0.0 100.0 0.0 45.7 94.3 5.7 0.0
19 81 63 799 04 3 Kismat Rahimpur 68 5.9 91.2 2.9 91.2 88.2 11.8 0.0
RMO: 1 = Rural, 2 = Urban and 3 = Other Urban Page 138 of 162

Tap Tube-Well Other Owned Rented Rent free
2 3 4 5 6 7 8 9 10
MZ /
MHVill RMO
1
Table C-15: Distribution of General Households by Source of Drinking Water, Electricity Connection and Housing Tenancy Status, by Residence
and Community
Administrative Unit
Residence
Community
Number of
Households
Source of Drinking Water (%) Electricity
Connection
(%)
Housing Tenancy (%)
ZL UZUN /
WA
19 81 63 799 05 3 Nemaikandi 458 12.7 85.4 2.0 92.4 36.9 60.3 2.8
19 81 63 799 06 3 Darikandi Rahimpur 96 0.0 84.4 15.6 49.0 74.0 24.0 2.1
19 81 63 799 07 3 Bahoramkanda 101 0.0 47.5 52.5 45.5 100.0 0.0 0.0
19 81 63 799 08 3 Sebanipur 211 0.0 100.0 0.0 65.9 96.2 1.9 1.9
19 81 63 962 1 *Trish 1683 8.4 91.3 0.3 90.3 62.5 35.4 2.1
19 81 63 962 01 1 Uttar Trish 552 5.8 93.5 0.7 91.3 64.3 34.4 1.3
19 81 63 962 02 1 Dakshin Trish 229 0.0 100.0 0.0 86.9 99.6 0.0 0.4
19 81 63 962 03 1 Paia Pathar 533 2.3 97.7 0.0 86.9 57.8 40.7 1.5
19 81 63 962 04 1 Companigaon 277 35.4 64.3 0.4 96.0 28.9 64.6 6.5
19 81 63 962 05 1 Malishair 92 0.0 100.0 0.0 95.7 88.0 10.9 1.1
19 81 67 Paharpur Union Total 4024 0.3 91.0 8.7 50.1 98.3 0.9 0.7
19 81 67 071 1 *Banshkait 353 0.0 99.4 0.6 32.6 98.6 0.8 0.6
19 81 67 110 1 *Bhiti Panch Pukharia 1115 0.2 94.8 5.0 40.4 98.0 1.2 0.8
19 81 67 110 01 1 Bhiti Panch Pukharia 563 0.0 90.1 9.9 51.9 98.0 0.5 1.4
19 81 67 110 02 1 Lakshmipur 238 0.0 100.0 0.0 3.4 100.0 0.0 0.0
19 81 67 110 03 1 Madhabpur 161 0.0 100.0 0.0 16.8 99.4 0.0 0.6
19 81 67 110 04 1 Fakir Para 44 0.0 100.0 0.0 90.9 100.0 0.0 0.0
19 81 67 110 05 1 Jalu Para 109 1.8 98.2 0.0 77.1 90.8 9.2 0.0
19 81 67 728 1 *Paharpur 1491 0.7 93.2 6.1 62.2 98.1 1.3 0.7
19 81 67 728 01 1 Paharpur 946 1.0 97.4 1.7 60.4 97.9 1.6 0.5
19 81 67 728 02 1 Maja Para 50 0.0 100.0 0.0 42.0 100.0 0.0 0.0
19 81 67 728 03 1 Utrain 133 0.0 77.4 22.6 88.7 98.5 0.0 1.5
19 81 67 728 04 1 Dekrirpar 129 0.0 99.2 0.8 97.7 95.3 3.1 1.6
19 81 67 728 05 1 Kalamuria 95 0.0 100.0 0.0 64.2 100.0 0.0 0.0
19 81 67 728 06 1 Kurarpar 79 1.3 43.0 55.7 39.2 98.7 0.0 1.3
19 81 67 728 07 1 Baluachana 59 0.0 100.0 0.0 0.0 100.0 0.0 0.0
19 81 67 741 1 *Panch Pukuria 255 0.0 89.8 10.2 72.5 97.6 0.4 2.0
19 81 67 936 1 *Suranandi 471 0.0 73.7 26.3 60.1 98.7 0.4 0.8
19 81 67 936 01 1 Suranandi 200 0.0 97.5 2.5 81.5 99.5 0.5 0.0
RMO: 1 = Rural, 2 = Urban and 3 = Other Urban Page 139 of 162

Tap Tube-Well Other Owned Rented Rent free
2 3 4 5 6 7 8 9 10
MZ /
MHVill RMO
1
Table C-15: Distribution of General Households by Source of Drinking Water, Electricity Connection and Housing Tenancy Status, by Residence
and Community
Administrative Unit
Residence
Community
Number of
Households
Source of Drinking Water (%) Electricity
Connection
(%)
Housing Tenancy (%)
ZL UZUN /
WA
19 81 67 936 02 1 Sormakanda 271 0.0 56.1 43.9 44.3 98.2 0.4 1.5
19 81 67 968 1 *Urishwar 339 0.0 84.7 15.3 16.2 100.0 0.0 0.0
19 81 72 Babuti Para Union Total 4509 2.5 94.1 3.5 66.1 98.3 1.0 0.6
19 81 72 032 1 *Babuti Para 1588 1.4 97.0 1.6 69.3 99.1 0.6 0.3
19 81 72 032 01 1 Babuti Para 1101 1.6 96.1 2.3 69.9 99.0 0.7 0.3
19 81 72 032 02 1 Boyeskhola 45 0.0 100.0 0.0 53.3 100.0 0.0 0.0
19 81 72 032 03 1 Telua Mainka 167 1.8 98.2 0.0 52.1 98.8 0.0 1.2
19 81 72 032 04 1 Natun Babuti Para 60 1.7 98.3 0.0 73.3 98.3 1.7 0.0
19 81 72 032 05 1 Naya Pushkurini 215 0.5 99.5 0.0 81.9 100.0 0.0 0.0
19 81 72 208 1 *Daiara 456 1.3 95.8 2.9 71.9 99.6 0.0 0.4
19 81 72 208 01 1 Daiara 353 1.4 94.9 3.7 89.5 99.4 0.0 0.6
19 81 72 208 02 1 Tepukuria 103 1.0 99.0 0.0 11.7 100.0 0.0 0.0
19 81 72 305 1 *Gandra 630 0.5 98.7 0.8 50.6 99.5 0.2 0.3
19 81 72 533 1 *Lajair 976 2.0 90.7 7.3 61.6 96.2 2.7 1.1
19 81 72 533 01 1 Lajair 498 4.0 93.4 2.6 77.3 93.6 5.0 1.4
19 81 72 533 02 1 Darani Para 355 0.0 83.7 16.3 60.8 98.9 0.3 0.8
19 81 72 533 03 1 Ashadnagar 123 0.0 100.0 0.0 0.0 99.2 0.0 0.8
19 81 72 656 1 *Narasinghapur 121 0.0 100.0 0.0 59.5 99.2 0.0 0.8
19 81 72 754 1 *Panti 317 0.0 100.0 0.0 62.8 99.4 0.3 0.3
19 81 72 754 01 1 Panti 265 0.0 100.0 0.0 75.1 99.2 0.4 0.4
19 81 72 754 02 1 Dhargaji 52 0.0 100.0 0.0 0.0 100.0 0.0 0.0
19 81 72 806 1 *Rampur 421 14.3 75.8 10.0 85.7 96.2 2.1 1.7
19 81 72 806 01 1 Rampur 154 0.0 100.0 0.0 86.4 94.8 3.9 1.3
19 81 72 806 02 1 Kaladumur 267 22.5 61.8 15.7 85.4 97.0 1.1 1.9
19 81 76 Purba Purbadhair Union Total 3077 0.9 94.5 4.5 60.8 98.8 0.2 1.0
19 81 76 284 1 *Dakshin Chapair 47 0.0 85.1 14.9 42.6 100.0 0.0 0.0
19 81 76 370 1 *Hirapur 439 0.9 91.1 8.0 82.7 98.9 0.0 1.1
19 81 76 396 1 *Janghar 585 0.3 99.5 0.2 70.4 98.8 0.3 0.9
19 81 76 500 1 *Khoshghar 902 0.7 91.8 7.5 68.7 99.0 0.1 0.9
RMO: 1 = Rural, 2 = Urban and 3 = Other Urban Page 140 of 162

Tap Tube-Well Other Owned Rented Rent free
2 3 4 5 6 7 8 9 10
MZ /
MHVill RMO
1
Table C-15: Distribution of General Households by Source of Drinking Water, Electricity Connection and Housing Tenancy Status, by Residence
and Community
Administrative Unit
Residence
Community
Number of
Households
Source of Drinking Water (%) Electricity
Connection
(%)
Housing Tenancy (%)
ZL UZUN /
WA
19 81 76 500 01 1 Khoshghar 800 0.5 91.0 8.5 64.8 98.9 0.1 1.0
19 81 76 500 02 1 Joynagar 102 2.0 98.0 0.0 100.0 100.0 0.0 0.0
19 81 76 507 1 *Korbanpur 1023 1.6 96.9 1.6 42.5 98.3 0.3 1.4
19 81 76 689 1 *Uttar Chapair 81 0.0 84.0 16.0 27.2 100.0 0.0 0.0
19 81 81 Paschim Purbadhair Union Total 3369 0.6 89.9 9.5 46.2 97.6 0.6 1.9
19 81 81 247 1 *Daulbari 180 0.0 51.7 48.3 41.7 93.9 0.0 6.1
19 81 81 299 1 *Elkhal 594 0.8 91.2 7.9 45.1 98.3 0.2 1.5
19 81 81 357 1 *Hatas 842 0.2 94.2 5.6 38.5 96.3 0.5 3.2
19 81 81 357 01 1 Hatas 603 0.2 92.4 7.5 40.0 95.7 0.7 3.6
19 81 81 357 02 1 Kadamtali 72 1.4 98.6 0.0 51.4 100.0 0.0 0.0
19 81 81 357 03 1 Khyakhali 167 0.0 98.8 1.2 27.5 97.0 0.0 3.0
19 81 81 552 1 *Malipara 195 0.0 70.3 29.7 36.4 98.5 0.0 1.5
19 81 81 617 1 *Nabiabad 693 1.4 97.1 1.4 61.3 97.8 1.7 0.4
19 81 81 643 1 *Nairpar 105 1.0 99.0 0.0 32.4 96.2 1.9 1.9
19 81 81 686 1 *Purbadhair 548 0.0 99.6 0.4 46.7 99.1 0.0 0.9
19 81 81 702 1 *Uttar Maheshpur 212 0.5 66.5 33.0 49.5 98.6 0.0 1.4
19 81 85 Uttar Ramchandrapur Union Total 3656 0.5 95.6 3.9 65.8 90.8 7.1 2.1
19 81 85 058 1 *Bakhrabad 2645 0.6 95.3 4.0 78.3 88.1 9.7 2.2
19 81 85 058 01 1 Ramchandrapur Bazar 242 0.0 98.3 1.7 97.5 62.4 33.1 4.5
19 81 85 058 02 1 Alalerkandi 47 0.0 95.7 4.3 93.6 100.0 0.0 0.0
19 81 85 058 03 1 Sarerpar 99 0.0 56.6 43.4 25.3 96.0 0.0 4.0
19 81 85 058 04 1 Aminnagar 198 0.0 98.5 1.5 96.0 95.5 3.0 1.5
19 81 85 058 05 1 Uttar Bakhrabad 327 2.1 96.6 1.2 87.8 87.2 9.8 3.1
19 81 85 058 06 1 Dakshin Bakhrabad 417 0.5 92.6 7.0 78.9 74.8 22.8 2.4
19 81 85 058 07 1 Khane Para 174 0.0 100.0 0.0 89.7 87.4 12.6 0.0
19 81 85 058 08 1 Sonakandi 73 0.0 100.0 0.0 19.2 91.8 5.5 2.7
19 81 85 058 09 1 Temoria 129 0.0 96.1 3.9 75.2 88.4 3.9 7.8
19 81 85 058 10 1 Mahutikanda 120 0.0 99.2 0.8 5.8 100.0 0.0 0.0
19 81 85 058 11 1 Sahebnagar 234 0.0 100.0 0.0 59.0 97.9 0.9 1.3
RMO: 1 = Rural, 2 = Urban and 3 = Other Urban Page 141 of 162

Tap Tube-Well Other Owned Rented Rent free
2 3 4 5 6 7 8 9 10
MZ /
MHVill RMO
1
Table C-15: Distribution of General Households by Source of Drinking Water, Electricity Connection and Housing Tenancy Status, by Residence
and Community
Administrative Unit
Residence
Community
Number of
Households
Source of Drinking Water (%) Electricity
Connection
(%)
Housing Tenancy (%)
ZL UZUN /
WA
19 81 85 058 12 1 Ramchandrapur 336 2.4 94.3 3.3 93.8 95.5 3.3 1.2
19 81 85 058 13 1 Kanthaliakandi 249 0.0 98.0 2.0 93.2 100.0 0.0 0.0
19 81 85 136 1 *Brahman Chapitala 1011 0.0 96.3 3.7 33.1 97.8 0.1 2.1
19 81 90 Dakshin Ramchandrapur Union Total 3392 0.1 89.9 10.1 59.8 96.9 0.3 2.8
19 81 90 195 1 *Chhota Kaijuri 300 0.0 100.0 0.0 48.0 90.7 0.7 8.7
19 81 90 290 1 *Dakshin Dighaldi 343 0.0 87.8 12.2 59.2 94.2 0.0 5.8
19 81 90 290 01 1 Teguria 32 0.0 68.8 31.3 87.5 87.5 0.0 12.5
19 81 90 290 02 1 Paschim Dighaldi 117 0.0 72.6 27.4 50.4 98.3 0.0 1.7
19 81 90 290 03 1 Dighaldi 194 0.0 100.0 0.0 59.8 92.8 0.0 7.2
19 81 90 351 1 *Harpakna 362 0.0 99.7 0.3 77.3 98.3 0.6 1.1
19 81 90 409 1 *Kachharikandi 1308 0.0 85.9 14.1 60.8 97.9 0.2 1.9
19 81 90 409 01 1 Baher Char 434 0.0 69.1 30.9 71.0 98.2 0.0 1.8
19 81 90 409 02 1 Darikandi 133 0.0 66.9 33.1 57.9 99.2 0.0 0.8
19 81 90 409 03 1 Joynagar 117 0.0 100.0 0.0 53.0 94.9 0.0 5.1
19 81 90 409 04 1 Kamalkandi 120 0.0 100.0 0.0 16.7 98.3 0.0 1.7
19 81 90 409 05 1 Jasamantapur 133 0.0 95.5 4.5 72.9 93.2 2.3 4.5
19 81 90 409 06 1 Kacharikandi 167 0.0 100.0 0.0 69.5 100.0 0.0 0.0
19 81 90 409 07 1 Pathaliakandi 20 0.0 100.0 0.0 40.0 100.0 0.0 0.0
19 81 90 409 08 1 Dhanerkandi 86 0.0 100.0 0.0 34.9 100.0 0.0 0.0
19 81 90 409 09 1 Uttarkandi 98 0.0 100.0 0.0 78.6 98.0 0.0 2.0
19 81 90 416 1 *Kadamtali 158 0.6 59.5 39.9 86.7 99.4 0.0 0.6
19 81 90 559 1 *Manik-Di 63 1.6 90.5 7.9 49.2 92.1 0.0 7.9
19 81 90 565 1 *Mustafapur 660 0.0 92.9 7.1 59.5 97.7 0.5 1.8
19 81 90 565 01 1 Kayjuri 195 0.0 100.0 0.0 62.6 98.5 0.5 1.0
19 81 90 565 02 1 Mustafapur 381 0.0 97.1 2.9 67.2 96.9 0.5 2.6
19 81 90 565 03 1 Bahadurpur 84 0.0 57.1 42.9 17.9 100.0 0.0 0.0
19 81 90 591 1 *Mirzapur 198 0.0 100.0 0.0 22.2 99.0 0.0 1.0
19 81 91 Tanki Union Total 3601 0.1 92.7 7.3 69.5 97.6 0.2 2.3
19 81 91 045 1 *Baira Alinagar 715 0.3 87.3 12.4 81.8 97.3 0.1 2.5
RMO: 1 = Rural, 2 = Urban and 3 = Other Urban Page 142 of 162

Tap Tube-Well Other Owned Rented Rent free
2 3 4 5 6 7 8 9 10
MZ /
MHVill RMO
1
Table C-15: Distribution of General Households by Source of Drinking Water, Electricity Connection and Housing Tenancy Status, by Residence
and Community
Administrative Unit
Residence
Community
Number of
Households
Source of Drinking Water (%) Electricity
Connection
(%)
Housing Tenancy (%)
ZL UZUN /
WA
19 81 91 045 01 1 Baira 596 0.0 85.7 14.3 80.4 97.3 0.2 2.5
19 81 91 045 02 1 Alinagar 72 0.0 100.0 0.0 98.6 100.0 0.0 0.0
19 81 91 045 03 1 Lalpur 47 4.3 87.2 8.5 74.5 93.6 0.0 6.4
19 81 91 052 1 *Bailabari (Bakharnagar)(Part0 240 0.0 98.8 1.3 90.0 99.2 0.0 0.8
19 81 91 149 1 *Chainpur 754 0.0 94.3 5.7 40.1 94.4 0.4 5.2
19 81 91 149 01 1 Chainpur 602 0.0 92.9 7.1 49.5 93.4 0.5 6.1
19 81 91 149 02 1 Sonarampur 152 0.0 100.0 0.0 2.6 98.7 0.0 1.3
19 81 91 162 1 *Dakshin Chapitala(Part) 235 0.0 99.1 0.9 98.7 100.0 0.0 0.0
19 81 91 279 1 *Duira 182 0.0 100.0 0.0 70.3 98.4 0.0 1.6
19 81 91 539 1 *Majur 198 0.0 100.0 0.0 94.9 99.0 1.0 0.0
19 81 91 539 01 1 Majur 120 0.0 100.0 0.0 94.2 99.2 0.8 0.0
19 81 91 539 02 1 Bara Pukuria 78 0.0 100.0 0.0 96.2 98.7 1.3 0.0
19 81 91 592 1 *Purba Ghorasal 191 0.0 55.0 45.0 67.5 100.0 0.0 0.0
19 81 91 592 01 1 Purba Ghorasal 105 0.0 52.4 47.6 72.4 100.0 0.0 0.0
19 81 91 592 02 1 Jamalpur 86 0.0 58.1 41.9 61.6 100.0 0.0 0.0
19 81 91 649 1 *Tanki 1086 0.0 96.4 3.6 66.5 98.2 0.0 1.8
19 81 91 649 01 1 Tanki 1024 0.0 98.3 1.7 68.2 98.0 0.0 2.0
19 81 91 649 02 1 Kamalpur 62 0.0 64.5 35.5 38.7 100.0 0.0 0.0
19 81 94 Sreekail Union Total 6852 0.4 98.1 1.4 57.7 96.0 1.8 2.2
19 81 94 104 1 *Bhanganagar 185 0.5 99.5 0.0 3.8 98.9 0.0 1.1
19 81 94 123 1 *Bhutail 518 0.0 100.0 0.0 56.9 97.9 0.4 1.7
19 81 94 123 01 1 Bhutail 477 0.0 100.0 0.0 59.7 98.1 0.4 1.5
19 81 94 123 02 1 Manoharabad 41 0.0 100.0 0.0 24.4 95.1 0.0 4.9
19 81 94 156 1 *Chandanail 898 0.8 99.2 0.0 63.6 96.1 0.8 3.1
19 81 94 156 01 1 Chandanail 649 0.5 99.5 0.0 53.8 94.8 1.1 4.2
19 81 94 156 02 1 Sahebnagar 249 1.6 98.4 0.0 89.2 99.6 0.0 0.4
19 81 94 169 1 *Charibaria 239 0.4 99.2 0.4 52.7 91.2 0.0 8.8
19 81 94 169 01 1 Charibaria 213 0.5 99.5 0.0 51.6 90.1 0.0 9.9
19 81 94 169 02 1 Isapur 26 0.0 96.2 3.8 61.5 100.0 0.0 0.0
RMO: 1 = Rural, 2 = Urban and 3 = Other Urban Page 143 of 162
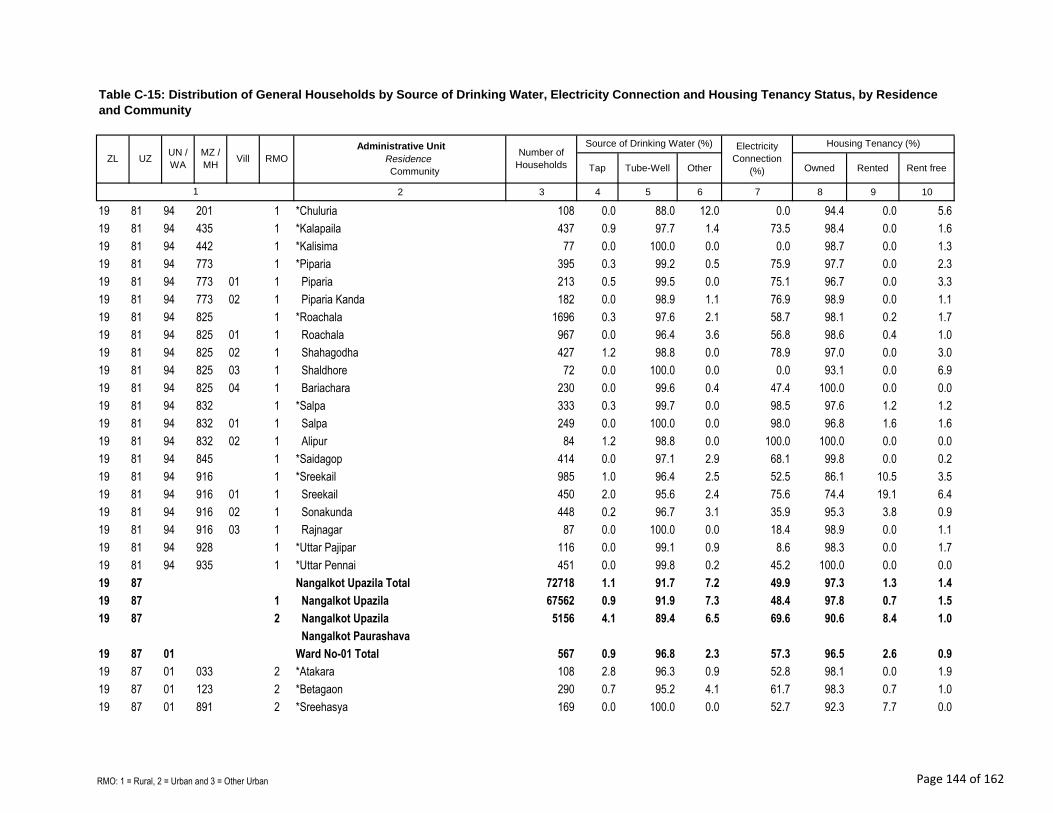
Tap Tube-Well Other Owned Rented Rent free
2 3 4 5 6 7 8 9 10
MZ /
MHVill RMO
1
Table C-15: Distribution of General Households by Source of Drinking Water, Electricity Connection and Housing Tenancy Status, by Residence
and Community
Administrative Unit
Residence
Community
Number of
Households
Source of Drinking Water (%) Electricity
Connection
(%)
Housing Tenancy (%)
ZL UZUN /
WA
19 81 94 201 1 *Chuluria 108 0.0 88.0 12.0 0.0 94.4 0.0 5.6
19 81 94 435 1 *Kalapaila 437 0.9 97.7 1.4 73.5 98.4 0.0 1.6
19 81 94 442 1 *Kalisima 77 0.0 100.0 0.0 0.0 98.7 0.0 1.3
19 81 94 773 1 *Piparia 395 0.3 99.2 0.5 75.9 97.7 0.0 2.3
19 81 94 773 01 1 Piparia 213 0.5 99.5 0.0 75.1 96.7 0.0 3.3
19 81 94 773 02 1 Piparia Kanda 182 0.0 98.9 1.1 76.9 98.9 0.0 1.1
19 81 94 825 1 *Roachala 1696 0.3 97.6 2.1 58.7 98.1 0.2 1.7
19 81 94 825 01 1 Roachala 967 0.0 96.4 3.6 56.8 98.6 0.4 1.0
19 81 94 825 02 1 Shahagodha 427 1.2 98.8 0.0 78.9 97.0 0.0 3.0
19 81 94 825 03 1 Shaldhore 72 0.0 100.0 0.0 0.0 93.1 0.0 6.9
19 81 94 825 04 1 Bariachara 230 0.0 99.6 0.4 47.4 100.0 0.0 0.0
19 81 94 832 1 *Salpa 333 0.3 99.7 0.0 98.5 97.6 1.2 1.2
19 81 94 832 01 1 Salpa 249 0.0 100.0 0.0 98.0 96.8 1.6 1.6
19 81 94 832 02 1 Alipur 84 1.2 98.8 0.0 100.0 100.0 0.0 0.0
19 81 94 845 1 *Saidagop 414 0.0 97.1 2.9 68.1 99.8 0.0 0.2
19 81 94 916 1 *Sreekail 985 1.0 96.4 2.5 52.5 86.1 10.5 3.5
19 81 94 916 01 1 Sreekail 450 2.0 95.6 2.4 75.6 74.4 19.1 6.4
19 81 94 916 02 1 Sonakunda 448 0.2 96.7 3.1 35.9 95.3 3.8 0.9
19 81 94 916 03 1 Rajnagar 87 0.0 100.0 0.0 18.4 98.9 0.0 1.1
19 81 94 928 1 *Uttar Pajipar 116 0.0 99.1 0.9 8.6 98.3 0.0 1.7
19 81 94 935 1 *Uttar Pennai 451 0.0 99.8 0.2 45.2 100.0 0.0 0.0
19 87 Nangalkot Upazila Total 72718 1.1 91.7 7.2 49.9 97.3 1.3 1.4
19 87 1 Nangalkot Upazila 67562 0.9 91.9 7.3 48.4 97.8 0.7 1.5
19 87 2 Nangalkot Upazila 5156 4.1 89.4 6.5 69.6 90.6 8.4 1.0
Nangalkot Paurashava
19 87 01 Ward No-01 Total 567 0.9 96.8 2.3 57.3 96.5 2.6 0.9
19 87 01 033 2 *Atakara 108 2.8 96.3 0.9 52.8 98.1 0.0 1.9
19 87 01 123 2 *Betagaon 290 0.7 95.2 4.1 61.7 98.3 0.7 1.0
19 87 01 891 2 *Sreehasya 169 0.0 100.0 0.0 52.7 92.3 7.7 0.0
RMO: 1 = Rural, 2 = Urban and 3 = Other Urban Page 144 of 162

Tap Tube-Well Other Owned Rented Rent free
2 3 4 5 6 7 8 9 10
MZ /
MHVill RMO
1
Table C-15: Distribution of General Households by Source of Drinking Water, Electricity Connection and Housing Tenancy Status, by Residence
and Community
Administrative Unit
Residence
Community
Number of
Households
Source of Drinking Water (%) Electricity
Connection
(%)
Housing Tenancy (%)
ZL UZUN /
WA
19 87 02 Ward No-02 Total 479 1.7 72.2 26.1 43.0 98.3 0.4 1.3
19 87 02 258 2 *Dakshin Daulatpur 123 1.6 84.6 13.8 45.5 99.2 0.8 0.0
19 87 02 643 2 *Naugoda 356 1.7 68.0 30.3 42.1 98.0 0.3 1.7
19 87 03 Ward No-03 Total 970 7.8 91.3 0.8 82.6 74.5 25.5 0.0
19 87 03 376 2 *Gotrasal Paschim 166 3.0 96.4 0.6 69.9 88.0 12.0 0.0
19 87 03 396 2 *Haripur Paschim 509 12.2 87.0 0.8 83.7 72.1 27.9 0.0
19 87 03 790 2 *Purba Daiara 295 3.1 95.9 1.0 87.8 71.2 28.8 0.0
19 87 04 Ward No-04 Total 538 13.9 77.1 8.9 76.4 83.5 16.0 0.6
19 87 04 396 2 *Haripur Purba 538 13.9 77.1 8.9 76.4 83.5 16.0 0.6
19 87 05 Ward No-05 Total 629 1.3 98.3 0.5 79.8 99.2 0.5 0.3
19 87 05 193 2 *Chaughari 315 1.0 98.1 1.0 73.3 99.0 0.3 0.6
19 87 05 242 2 *Daudpur 314 1.6 98.4 0.0 86.3 99.4 0.6 0.0
19 87 06 Ward No-06 Total 591 5.2 84.4 10.3 61.6 84.1 13.0 2.9
19 87 06 245 2 *Ashwadia 132 1.5 58.3 40.2 48.5 98.5 0.0 1.5
19 87 06 376 2 *Gotrasal Purba 170 0.0 100.0 0.0 35.3 75.9 18.2 5.9
19 87 06 640 2 *Nangalkot 289 10.0 87.2 2.8 83.0 82.4 15.9 1.7
19 87 07 Ward No-07 Total 454 1.5 91.0 7.5 81.1 99.1 0.2 0.7
19 87 07 269 2 *Jor Pukuria 109 0.0 100.0 0.0 92.7 98.2 0.9 0.9
19 87 07 555 2 *Kendra 146 0.7 76.0 23.3 72.6 98.6 0.0 1.4
19 87 07 590 2 *Mandra 199 3.0 97.0 0.0 80.9 100.0 0.0 0.0
19 87 08 Ward No-08 Total 338 0.0 91.1 8.9 58.9 95.9 0.3 3.8
19 87 08 168 2 *Bisara 170 0.0 100.0 0.0 58.8 96.5 0.0 3.5
19 87 08 912 2 *Sreekamta 168 0.0 82.1 17.9 58.9 95.2 0.6 4.2
19 87 09 Ward No-09 Total 590 0.5 97.5 2.0 70.2 99.7 0.2 0.2
19 87 09 129 2 *Batupara 383 0.3 96.6 3.1 69.7 99.7 0.3 0.0
19 87 09 316 2 *Dhatishwar 207 1.0 99.0 0.0 71.0 99.5 0.0 0.5
19 87 11 Adra Union Total 6948 0.6 85.2 14.2 41.5 99.3 0.2 0.5
19 87 11 003 1 *Adra 976 0.2 86.0 13.8 19.5 99.4 0.2 0.4
19 87 11 037 1 *Atiabari 312 0.0 100.0 0.0 0.0 99.4 0.0 0.6
RMO: 1 = Rural, 2 = Urban and 3 = Other Urban Page 145 of 162

Tap Tube-Well Other Owned Rented Rent free
2 3 4 5 6 7 8 9 10
MZ /
MHVill RMO
1
Table C-15: Distribution of General Households by Source of Drinking Water, Electricity Connection and Housing Tenancy Status, by Residence
and Community
Administrative Unit
Residence
Community
Number of
Households
Source of Drinking Water (%) Electricity
Connection
(%)
Housing Tenancy (%)
ZL UZUN /
WA
19 87 11 121 1 *Belghar 498 0.8 80.5 18.7 72.9 99.6 0.0 0.4
19 87 11 155 1 *Bhulain 430 0.2 86.0 13.7 33.0 98.8 0.2 0.9
19 87 11 185 1 *Bara Chatitala 603 0.0 86.2 13.8 36.8 98.8 0.3 0.8
19 87 11 265 1 *Kakairtala 316 0.9 82.9 16.1 55.1 99.4 0.0 0.6
19 87 11 274 1 *Merkot 990 1.0 75.9 23.1 54.2 99.6 0.0 0.4
19 87 11 274 01 1 Merkot 803 0.4 82.1 17.6 50.8 99.6 0.0 0.4
19 87 11 274 02 1 Ludua 187 3.7 49.2 47.1 69.0 99.5 0.0 0.5
19 87 11 283 1 *Dakshin Padua 270 0.4 63.3 36.3 18.5 97.4 0.4 2.2
19 87 11 286 1 *Saktali 697 0.3 90.2 9.5 9.9 100.0 0.0 0.0
19 87 11 372 1 *Gorkata 192 0.5 74.0 25.5 44.8 100.0 0.0 0.0
19 87 11 466 1 *Kalacho 258 1.2 98.1 0.8 55.0 100.0 0.0 0.0
19 87 11 566 1 *Maghua 169 0.6 98.2 1.2 24.3 99.4 0.0 0.6
19 87 11 758 1 *Pujkara 752 0.3 93.9 5.9 71.3 99.1 0.3 0.7
19 87 11 926 1 *Tuguria 485 1.9 81.9 16.3 67.8 99.0 1.0 0.0
19 87 11 926 01 1 S.Tuguria 294 2.4 74.5 23.1 57.1 98.6 1.4 0.0
19 87 11 926 02 1 B.Tuguria 191 1.0 93.2 5.8 84.3 99.5 0.5 0.0
19 87 17 Bangodda Union Total 4859 2.6 91.0 6.4 65.8 95.1 3.1 1.7
19 87 17 073 1 *Bangodda 1066 0.9 97.4 1.7 73.2 92.5 5.5 2.0
19 87 17 073 01 1 Uttar Dakshin Bangodda 787 1.1 98.0 0.9 81.6 91.0 6.4 2.7
19 87 17 073 02 1 Nimuri 105 1.0 96.2 2.9 41.0 100.0 0.0 0.0
19 87 17 073 03 1 Angalkhor 174 0.0 95.4 4.6 54.6 94.8 5.2 0.0
19 87 17 220 1 *Chhota Sangiswar 139 0.0 100.0 0.0 89.2 100.0 0.0 0.0
19 87 17 299 1 *Darachu 236 0.0 89.0 11.0 68.6 98.3 0.8 0.8
19 87 17 347 1 *Gandhachi 501 1.6 86.4 12.0 59.1 88.8 9.0 2.2
19 87 17 410 1 *Hesiara 319 1.6 98.1 0.3 10.7 99.7 0.3 0.0
19 87 17 449 1 *Kadba 562 1.4 86.8 11.7 72.6 97.3 0.9 1.8
19 87 17 449 01 1 Uttar Dakshin Kadba 217 0.5 97.7 1.8 83.9 99.5 0.0 0.5
19 87 17 449 02 1 Noapara 97 5.2 82.5 12.4 79.4 95.9 4.1 0.0
19 87 17 449 03 1 Kadba 248 0.8 79.0 20.2 60.1 96.0 0.4 3.6
RMO: 1 = Rural, 2 = Urban and 3 = Other Urban Page 146 of 162

Tap Tube-Well Other Owned Rented Rent free
2 3 4 5 6 7 8 9 10
MZ /
MHVill RMO
1
Table C-15: Distribution of General Households by Source of Drinking Water, Electricity Connection and Housing Tenancy Status, by Residence
and Community
Administrative Unit
Residence
Community
Number of
Households
Source of Drinking Water (%) Electricity
Connection
(%)
Housing Tenancy (%)
ZL UZUN /
WA
19 87 17 485 1 *Karer Bhomra 141 0.0 100.0 0.0 70.2 99.3 0.0 0.7
19 87 17 692 1 *Parikot 529 9.1 79.0 11.9 77.5 91.3 5.3 3.4
19 87 17 803 1 *Purba Nasaratpur 186 3.2 84.9 11.8 91.4 97.3 1.6 1.1
19 87 17 806 1 *Purba Nurpur 374 8.0 85.0 7.0 74.1 95.5 1.1 3.5
19 87 17 806 01 1 Purba Nurpur 257 11.7 80.9 7.4 67.7 97.3 0.0 2.7
19 87 17 806 02 1 Sonaberi 117 0.0 94.0 6.0 88.0 91.5 3.4 5.1
19 87 17 808 1 *Purba Padua 63 0.0 93.7 6.3 1.6 100.0 0.0 0.0
19 87 17 810 1 *Purba Ramerbagh 180 0.0 98.3 1.7 56.1 96.1 1.7 2.2
19 87 17 824 1 *Rupberi 93 0.0 100.0 0.0 81.7 98.9 1.1 0.0
19 87 17 903 1 *Shyampur 470 1.9 93.4 4.7 55.3 99.4 0.0 0.6
19 87 34 Bakshaganj Union Total 4379 0.6 96.3 3.1 27.2 98.0 1.1 0.9
19 87 34 011 1 *Aziara 112 8.0 92.0 0.0 93.8 92.0 2.7 5.4
19 87 34 044 1 *Austogram(Atgaon) 802 0.0 98.9 1.1 5.1 99.5 0.1 0.4
19 87 34 044 01 1 Atgram 488 0.0 100.0 0.0 3.9 99.6 0.0 0.4
19 87 34 044 02 1 Dariatgaon 136 0.0 94.9 5.1 16.2 99.3 0.7 0.0
19 87 34 044 03 1 Manikganj 80 0.0 97.5 2.5 0.0 100.0 0.0 0.0
19 87 34 044 04 1 Kakirpar 98 0.0 100.0 0.0 0.0 99.0 0.0 1.0
19 87 34 060 1 *Bagra 227 0.9 96.0 3.1 29.5 98.2 0.0 1.8
19 87 34 074 1 *Bakihati 213 0.0 88.3 11.7 83.6 100.0 0.0 0.0
19 87 34 101 1 *Barakali 402 0.0 85.3 14.7 32.8 98.0 0.5 1.5
19 87 34 101 01 1 Barakali 235 0.0 88.5 11.5 49.8 99.1 0.4 0.4
19 87 34 101 02 1 Gondapur 73 0.0 100.0 0.0 19.2 95.9 1.4 2.7
19 87 34 101 03 1 Kadamtali 94 0.0 66.0 34.0 1.1 96.8 0.0 3.2
19 87 34 103 1 *Barara 552 1.1 98.4 0.5 23.6 93.5 5.3 1.3
19 87 34 103 01 1 Boura 195 0.0 100.0 0.0 27.7 99.5 0.0 0.5
19 87 34 103 02 1 Bakshaganj 67 6.0 94.0 0.0 83.6 70.1 26.9 3.0
19 87 34 103 03 1 Chonua 89 0.0 96.6 3.4 22.5 96.6 2.2 1.1
19 87 34 103 04 1 Tetaia 138 1.4 98.6 0.0 0.0 97.1 2.2 0.7
19 87 34 103 05 1 Banabaria 63 0.0 100.0 0.0 0.0 87.3 9.5 3.2
RMO: 1 = Rural, 2 = Urban and 3 = Other Urban Page 147 of 162

Tap Tube-Well Other Owned Rented Rent free
2 3 4 5 6 7 8 9 10
MZ /
MHVill RMO
1
Table C-15: Distribution of General Households by Source of Drinking Water, Electricity Connection and Housing Tenancy Status, by Residence
and Community
Administrative Unit
Residence
Community
Number of
Households
Source of Drinking Water (%) Electricity
Connection
(%)
Housing Tenancy (%)
ZL UZUN /
WA
19 87 34 258 1 *Aliara 380 0.5 98.9 0.5 33.2 100.0 0.0 0.0
19 87 34 265 1 *Chandpur 363 0.0 100.0 0.0 4.1 99.7 0.0 0.3
19 87 34 265 01 1 Chandpur 261 0.0 100.0 0.0 5.4 99.6 0.0 0.4
19 87 34 265 02 1 Tegerpar 102 0.0 100.0 0.0 1.0 100.0 0.0 0.0
19 87 34 269 1 *Manaipur 616 0.5 95.3 4.2 22.2 98.2 0.5 1.3
19 87 34 269 01 1 Dakshin Manaipur 381 0.5 92.7 6.8 13.4 98.4 0.5 1.0
19 87 34 269 02 1 Malongchar 171 0.6 99.4 0.0 50.3 98.2 0.6 1.2
19 87 34 269 03 1 Bash Denga 64 0.0 100.0 0.0 0.0 96.9 0.0 3.1
19 87 34 273 1 *Dakshin Subhapur 451 0.2 98.9 0.9 17.1 99.3 0.0 0.7
19 87 34 590 1 *Kokali 261 1.9 98.1 0.0 70.1 95.8 3.4 0.8
19 87 43 Dhalua Union Total 6307 1.3 93.1 5.6 40.4 98.2 0.9 0.8
19 87 43 130 1 *Bayra 723 2.5 82.0 15.5 34.7 98.8 0.3 1.0
19 87 43 138 1 *Beralla 21 0.0 100.0 0.0 0.0 100.0 0.0 0.0
19 87 43 216 1 *Char Jamurail 98 1.0 99.0 0.0 71.4 99.0 0.0 1.0
19 87 43 216 01 1 Char Jamurail 78 1.3 98.7 0.0 87.2 98.7 0.0 1.3
19 87 43 216 02 1 Labaitoba 20 0.0 100.0 0.0 10.0 100.0 0.0 0.0
19 87 43 226 1 *Chawkari 513 1.9 91.0 7.0 77.2 97.5 1.6 1.0
19 87 43 226 01 1 Chawkari 431 1.4 90.3 8.4 80.5 98.1 1.6 0.2
19 87 43 226 02 1 Japanandi 82 4.9 95.1 0.0 59.8 93.9 1.2 4.9
19 87 43 230 1 *Chhatarkandi 10 0.0 100.0 0.0 0.0 100.0 0.0 0.0
19 87 43 240 1 *Chiara 715 0.4 99.4 0.1 42.1 99.4 0.3 0.3
19 87 43 261 1 *Badarpur 571 1.9 94.2 3.9 64.1 96.7 2.5 0.9
19 87 43 279 1 *Damchhatra 32 0.0 93.8 6.3 6.3 96.9 3.1 0.0
19 87 43 302 1 *Dhalua 323 2.5 87.3 10.2 36.2 96.3 3.7 0.0
19 87 43 330 1 *Durba Pukurua 65 0.0 84.6 15.4 26.2 98.5 1.5 0.0
19 87 43 383 1 *Gormura 130 4.6 95.4 0.0 12.3 100.0 0.0 0.0
19 87 43 383 01 1 Gormura 94 6.4 93.6 0.0 17.0 100.0 0.0 0.0
19 87 43 383 02 1 Bara Barulla 36 0.0 100.0 0.0 0.0 100.0 0.0 0.0
19 87 43 412 1 *Hugli 47 0.0 100.0 0.0 0.0 100.0 0.0 0.0
RMO: 1 = Rural, 2 = Urban and 3 = Other Urban Page 148 of 162

Tap Tube-Well Other Owned Rented Rent free
2 3 4 5 6 7 8 9 10
MZ /
MHVill RMO
1
Table C-15: Distribution of General Households by Source of Drinking Water, Electricity Connection and Housing Tenancy Status, by Residence
and Community
Administrative Unit
Residence
Community
Number of
Households
Source of Drinking Water (%) Electricity
Connection
(%)
Housing Tenancy (%)
ZL UZUN /
WA
19 87 43 576 1 *Kinara 385 0.3 99.5 0.3 40.3 99.2 0.8 0.0
19 87 43 635 1 *Maghua 268 0.0 95.5 4.5 9.3 99.3 0.4 0.4
19 87 43 643 1 *Makimpur 138 2.9 97.1 0.0 96.4 98.6 0.0 1.4
19 87 43 654 1 *Mannara 429 1.6 90.7 7.7 19.1 96.5 1.6 1.9
19 87 43 672 1 *Mogra 360 0.6 80.8 18.6 66.4 98.9 0.3 0.8
19 87 43 672 01 1 Mogra 265 0.8 74.0 25.3 58.5 98.9 0.4 0.8
19 87 43 672 02 1 Chhota Baralia 95 0.0 100.0 0.0 88.4 98.9 0.0 1.1
19 87 43 686 1 *Naluakandi 31 6.5 93.5 0.0 48.4 100.0 0.0 0.0
19 87 43 750 1 *Pasai 384 0.8 99.0 0.3 13.5 98.7 0.3 1.0
19 87 43 881 1 *Sihar 423 0.2 99.8 0.0 41.4 98.6 0.7 0.7
19 87 43 881 01 1 Sihar 228 0.4 99.6 0.0 72.8 97.8 1.3 0.9
19 87 43 881 02 1 Putijala 132 0.0 100.0 0.0 6.8 99.2 0.0 0.8
19 87 43 881 03 1 Mantali 63 0.0 100.0 0.0 0.0 100.0 0.0 0.0
19 87 43 883 1 *Sijiara 188 2.1 85.1 12.8 18.1 97.3 1.1 1.6
19 87 43 887 1 *Singaria 126 0.0 100.0 0.0 30.2 98.4 0.0 1.6
19 87 43 987 1 *Urkuti 327 0.0 100.0 0.0 19.3 97.9 0.0 2.1
19 87 51 Daulkhar Union Total 8216 0.8 94.5 4.7 50.6 98.6 0.5 0.9
19 87 51 039 1 *Ashwadia 413 2.2 97.8 0.0 84.3 98.5 0.2 1.2
19 87 51 084 1 *Bam 695 1.4 87.3 11.2 49.6 98.1 0.6 1.3
19 87 51 084 01 1 Bam Batabaria 133 0.0 69.9 30.1 0.0 96.2 0.0 3.8
19 87 51 084 02 1 Hajir Bam 191 2.1 93.2 4.7 69.1 96.9 1.6 1.6
19 87 51 084 03 1 Kajir Bam 124 0.0 100.0 0.0 62.9 99.2 0.0 0.8
19 87 51 084 04 1 Antir Bam 18 0.0 44.4 55.6 0.0 94.4 5.6 0.0
19 87 51 084 05 1 Bagaia 22 0.0 50.0 50.0 59.1 100.0 0.0 0.0
19 87 51 084 06 1 Majumdar Para 129 4.7 89.9 5.4 55.0 100.0 0.0 0.0
19 87 51 084 07 1 Bhuiyen Para 78 0.0 98.7 1.3 65.4 100.0 0.0 0.0
19 87 51 123 1 *Batabaria 236 2.5 97.0 0.4 86.0 97.9 1.7 0.4
19 87 51 160 1 *Bholakot 317 0.3 96.2 3.5 84.9 100.0 0.0 0.0
19 87 51 160 01 1 Bholakot 241 0.4 99.2 0.4 88.4 100.0 0.0 0.0
RMO: 1 = Rural, 2 = Urban and 3 = Other Urban Page 149 of 162

Tap Tube-Well Other Owned Rented Rent free
2 3 4 5 6 7 8 9 10
MZ /
MHVill RMO
1
Table C-15: Distribution of General Households by Source of Drinking Water, Electricity Connection and Housing Tenancy Status, by Residence
and Community
Administrative Unit
Residence
Community
Number of
Households
Source of Drinking Water (%) Electricity
Connection
(%)
Housing Tenancy (%)
ZL UZUN /
WA
19 87 51 160 02 1 Chanderpar 76 0.0 86.8 13.2 73.7 100.0 0.0 0.0
19 87 51 267 1 *Dakshin Lakshmipur 391 1.3 98.7 0.0 66.2 98.7 0.3 1.0
19 87 51 291 1 *Daulkhar 1273 1.4 94.9 3.7 59.7 97.9 1.4 0.7
19 87 51 291 01 1 Daulkhar 443 2.3 97.5 0.2 79.0 97.1 2.5 0.5
19 87 51 291 02 1 Biharkandi 102 0.0 98.0 2.0 50.0 98.0 0.0 2.0
19 87 51 291 03 1 Aytpara 215 1.4 97.7 0.9 49.3 98.6 0.5 0.9
19 87 51 291 04 1 Khil Para 151 0.0 100.0 0.0 59.6 98.7 0.7 0.7
19 87 51 291 05 1 Sonachaka 119 3.4 64.7 31.9 11.8 100.0 0.0 0.0
19 87 51 291 06 1 Kekaiya 119 0.8 99.2 0.0 74.8 95.8 4.2 0.0
19 87 51 291 07 1 Daulkhar Naracho 67 0.0 94.0 6.0 53.7 98.5 0.0 1.5
19 87 51 291 08 1 Maidarkua Naracho 57 0.0 100.0 0.0 42.1 98.2 0.0 1.8
19 87 51 297 1 *Deobhandar 489 0.2 94.7 5.1 40.9 99.2 0.0 0.8
19 87 51 297 01 1 Holakua 36 0.0 100.0 0.0 19.4 97.2 0.0 2.8
19 87 51 297 02 1 Deobhandar 355 0.3 92.7 7.0 44.8 99.2 0.0 0.8
19 87 51 297 03 1 Beatola 98 0.0 100.0 0.0 34.7 100.0 0.0 0.0
19 87 51 451 1 *Joyag 163 0.6 99.4 0.0 35.0 100.0 0.0 0.0
19 87 51 465 1 *Jiniara 628 0.2 97.3 2.5 17.7 99.2 0.0 0.8
19 87 51 465 01 1 Jiniara 207 0.5 92.8 6.8 3.9 100.0 0.0 0.0
19 87 51 465 02 1 Bashuthai 174 0.0 98.9 1.1 19.0 98.9 0.0 1.1
19 87 51 465 03 1 Maharpar 101 0.0 100.0 0.0 0.0 100.0 0.0 0.0
19 87 51 465 04 1 Jiniara Naracho 146 0.0 100.0 0.0 47.9 97.9 0.0 2.1
19 87 51 523 1 *Kandal 814 0.6 97.7 1.7 69.4 99.0 0.4 0.6
19 87 51 523 01 1 Dakshin Kandal 210 0.0 100.0 0.0 23.3 100.0 0.0 0.0
19 87 51 523 02 1 Uttar Kandal 604 0.8 96.9 2.3 85.4 98.7 0.5 0.8
19 87 51 541 1 *Kashipur 1026 0.5 97.8 1.8 27.9 98.9 0.6 0.5
19 87 51 541 01 1 Paschim Kashipur 654 0.8 96.5 2.8 30.6 99.2 0.5 0.3
19 87 51 541 02 1 Purba Kashipur 372 0.0 100.0 0.0 23.1 98.4 0.8 0.8
19 87 51 629 1 *Machhimpur 242 0.0 83.5 16.5 34.3 94.2 0.0 5.8
19 87 51 629 01 1 Machhimpur 168 0.0 76.2 23.8 22.0 92.9 0.0 7.1
RMO: 1 = Rural, 2 = Urban and 3 = Other Urban Page 150 of 162

Tap Tube-Well Other Owned Rented Rent free
2 3 4 5 6 7 8 9 10
MZ /
MHVill RMO
1
Table C-15: Distribution of General Households by Source of Drinking Water, Electricity Connection and Housing Tenancy Status, by Residence
and Community
Administrative Unit
Residence
Community
Number of
Households
Source of Drinking Water (%) Electricity
Connection
(%)
Housing Tenancy (%)
ZL UZUN /
WA
19 87 51 629 02 1 Ullakhali 74 0.0 100.0 0.0 62.2 97.3 0.0 2.7
19 87 51 680 1 *Murgaon 348 0.9 90.8 8.3 46.0 99.7 0.0 0.3
19 87 51 690 1 *Narayan Bhatua 428 0.2 84.8 15.0 57.7 98.1 0.0 1.9
19 87 51 733 1 *Paikot 451 0.0 90.7 9.3 22.0 99.6 0.0 0.4
19 87 51 733 01 1 Paikot 275 0.0 100.0 0.0 33.5 100.0 0.0 0.0
19 87 51 733 02 1 Chugara 68 0.0 82.4 17.6 2.9 100.0 0.0 0.0
19 87 51 733 03 1 Paikot Satabaria 42 0.0 78.6 21.4 0.0 95.2 0.0 4.8
19 87 51 733 04 1 Chilania 66 0.0 68.2 31.8 7.6 100.0 0.0 0.0
19 87 51 907 1 *Sondail 302 0.0 99.0 1.0 54.6 97.7 0.7 1.7
19 87 57 Hesakhal Union Total 4004 0.2 90.6 9.1 32.8 99.0 0.3 0.7
19 87 57 007 1 *Ajia Para 311 0.0 95.8 4.2 28.9 100.0 0.0 0.0
19 87 57 179 1 *Chak Ralodi 74 0.0 98.6 1.4 0.0 97.3 0.0 2.7
19 87 57 408 1 *Hesakhal 1304 0.2 93.7 6.1 36.1 98.5 0.3 1.2
19 87 57 412 1 *Hiajora 396 0.8 93.9 5.3 51.5 99.2 0.3 0.5
19 87 57 534 1 *Kurkuta 272 0.0 70.6 29.4 40.1 99.6 0.0 0.4
19 87 57 620 1 *Metua 183 0.0 81.4 18.6 44.8 100.0 0.0 0.0
19 87 57 686 1 *Papacho 66 0.0 100.0 0.0 1.5 100.0 0.0 0.0
19 87 57 736 1 *Patoar 667 0.6 86.1 13.3 40.0 99.0 0.1 0.9
19 87 57 835 1 *Sakuntala 144 0.0 100.0 0.0 1.4 99.3 0.7 0.0
19 87 57 943 1 *Urukchall 587 0.2 91.8 8.0 15.2 98.8 1.0 0.2
19 87 60 Jodda Union Total 8119 0.3 91.0 8.6 39.6 95.8 0.3 3.9
19 87 60 035 1 *Atghara 254 1.6 98.4 0.0 59.8 98.4 0.0 1.6
19 87 60 055 1 *Bahura 217 0.0 88.9 11.1 94.5 99.5 0.5 0.0
19 87 60 057 1 *Baiara 716 0.1 99.4 0.4 10.9 97.9 0.6 1.5
19 87 60 134 1 *Bhabanipur 378 0.0 90.7 9.3 49.2 99.7 0.0 0.3
19 87 60 294 1 *Damurpar 301 0.0 88.0 12.0 51.8 96.7 1.0 2.3
19 87 60 317 1 *Dhuriara 246 0.0 100.0 0.0 7.7 100.0 0.0 0.0
19 87 60 360 1 *Ghoramaydan 628 0.8 95.1 4.1 53.8 93.0 0.2 6.8
19 87 60 365 1 *Goharua 457 0.0 99.6 0.4 60.8 97.4 0.7 2.0
RMO: 1 = Rural, 2 = Urban and 3 = Other Urban Page 151 of 162

Tap Tube-Well Other Owned Rented Rent free
2 3 4 5 6 7 8 9 10
MZ /
MHVill RMO
1
Table C-15: Distribution of General Households by Source of Drinking Water, Electricity Connection and Housing Tenancy Status, by Residence
and Community
Administrative Unit
Residence
Community
Number of
Households
Source of Drinking Water (%) Electricity
Connection
(%)
Housing Tenancy (%)
ZL UZUN /
WA
19 87 60 365 01 1 Goharua 357 0.0 99.7 0.3 69.7 97.5 0.6 2.0
19 87 60 365 02 1 Manik Mura 100 0.0 99.0 1.0 29.0 97.0 1.0 2.0
19 87 60 387 1 *Hangara 307 0.0 93.2 6.8 4.9 97.7 0.0 2.3
19 87 60 387 01 1 Hangara 226 0.0 99.6 0.4 6.6 98.2 0.0 1.8
19 87 60 387 02 1 Padua 81 0.0 75.3 24.7 0.0 96.3 0.0 3.7
19 87 60 441 1 *Jodda 371 0.0 98.1 1.9 26.7 97.6 0.8 1.6
19 87 60 460 1 *Kairash 143 0.0 60.8 39.2 13.3 97.9 0.7 1.4
19 87 60 484 1 *Karapati 434 1.8 89.2 9.0 62.2 92.2 0.0 7.8
19 87 60 484 01 1 Karpati 265 0.8 93.6 5.7 64.5 96.6 0.0 3.4
19 87 60 484 02 1 Duaria 169 3.6 82.2 14.2 58.6 85.2 0.0 14.8
19 87 60 593 1 *Mandra 512 0.2 85.2 14.6 72.5 95.9 0.4 3.7
19 87 60 593 01 1 Mandra 328 0.0 77.1 22.9 70.1 98.5 0.3 1.2
19 87 60 593 02 1 Ashirpar 184 0.5 99.5 0.0 76.6 91.3 0.5 8.2
19 87 60 649 1 *Narayankot 333 0.6 82.6 16.8 63.1 90.4 0.3 9.3
19 87 60 665 1 *Nischintapur 478 0.0 96.0 4.0 61.7 99.6 0.4 0.0
19 87 60 683 1 *Pankara 376 0.0 84.6 15.4 17.8 94.4 0.5 5.1
19 87 60 686 1 *Hasanpur 146 2.1 50.7 47.3 51.4 97.3 0.0 2.7
19 87 60 690 1 *Noapara 544 0.2 98.7 1.1 5.5 95.8 0.6 3.7
19 87 60 690 01 1 Paschim Noapara 426 0.2 98.6 1.2 7.0 98.8 0.2 0.9
19 87 60 690 02 1 Ialia 118 0.0 99.2 0.8 0.0 84.7 1.7 13.6
19 87 60 763 1 *Raja Para 183 0.0 100.0 0.0 59.6 100.0 0.0 0.0
19 87 60 783 1 *Sankarpur 284 0.0 68.7 31.3 10.2 98.2 0.4 1.4
19 87 60 892 1 *Sreehasya 647 0.5 89.3 10.2 31.2 86.2 0.0 13.8
19 87 60 909 1 *Tanibhanga 93 0.0 100.0 0.0 4.3 100.0 0.0 0.0
19 87 60 921 1 *Thalla Para 71 0.0 78.9 21.1 8.5 93.0 1.4 5.6
19 87 69 Mokara Union Total 6231 1.0 94.3 4.6 71.5 98.3 0.7 1.0
19 87 69 017 1 *Aliara 268 0.4 98.9 0.7 89.6 98.5 0.7 0.7
19 87 69 058 1 *Baghmara 146 0.0 94.5 5.5 63.7 99.3 0.7 0.0
19 87 69 091 1 *Bara Fatehpur 266 2.3 89.1 8.6 66.5 98.1 0.8 1.1
RMO: 1 = Rural, 2 = Urban and 3 = Other Urban Page 152 of 162

Tap Tube-Well Other Owned Rented Rent free
2 3 4 5 6 7 8 9 10
MZ /
MHVill RMO
1
Table C-15: Distribution of General Households by Source of Drinking Water, Electricity Connection and Housing Tenancy Status, by Residence
and Community
Administrative Unit
Residence
Community
Number of
Households
Source of Drinking Water (%) Electricity
Connection
(%)
Housing Tenancy (%)
ZL UZUN /
WA
19 87 69 093 1 *Uttar Madanpur 184 0.0 100.0 0.0 15.2 100.0 0.0 0.0
19 87 69 154 1 *Bhasanlonga 116 0.0 100.0 0.0 86.2 99.1 0.9 0.0
19 87 69 170 1 *Bishnupur 491 0.8 89.4 9.8 75.4 99.8 0.0 0.2
19 87 69 191 1 *Chandais 95 1.1 98.9 0.0 44.2 100.0 0.0 0.0
19 87 69 195 1 *Chandgara 311 0.0 89.4 10.6 42.8 95.5 0.6 3.9
19 87 69 220 1 *Charithupa 80 0.0 100.0 0.0 78.8 100.0 0.0 0.0
19 87 69 236 1 *Chhota Fatehpur 76 0.0 100.0 0.0 60.5 98.7 0.0 1.3
19 87 69 379 1 *Gomkot 612 0.2 98.4 1.5 70.8 98.4 0.3 1.3
19 87 69 502 1 *Kalem 198 0.5 99.5 0.0 72.7 99.5 0.5 0.0
19 87 69 533 1 *Karakot 150 0.7 99.3 0.0 94.7 100.0 0.0 0.0
19 87 69 559 1 *Keshtala 232 3.9 95.7 0.4 75.0 97.4 0.0 2.6
19 87 69 564 1 *Khatacho 181 2.2 65.2 32.6 54.1 97.8 0.0 2.2
19 87 69 633 1 *Madda 102 0.0 100.0 0.0 77.5 96.1 0.0 3.9
19 87 69 639 1 *Majhi Para 206 0.5 72.8 26.7 85.9 100.0 0.0 0.0
19 87 69 666 1 *Mayura 146 2.7 95.9 1.4 91.1 96.6 0.0 3.4
19 87 69 674 1 *Mokara 400 4.0 95.3 0.8 96.8 97.8 1.8 0.5
19 87 69 678 1 *Murashwar 346 0.3 97.7 2.0 75.1 99.1 0.0 0.9
19 87 69 703 1 *Narua 179 0.0 87.7 12.3 72.6 97.2 0.0 2.8
19 87 69 746 1 *Parkara 209 0.0 97.1 2.9 77.5 98.6 1.4 0.0
19 87 69 776 1 *Pochhair 297 3.4 96.6 0.0 77.8 99.0 0.3 0.7
19 87 69 787 1 *Purba Hasanpur 132 0.0 99.2 0.8 80.3 92.4 7.6 0.0
19 87 69 879 1 *Siali Marucho 179 0.6 97.8 1.7 7.3 100.0 0.0 0.0
19 87 69 940 1 *Surpur 82 0.0 97.6 2.4 79.3 86.6 13.4 0.0
19 87 69 948 1 *Tapaiya 54 0.0 98.1 1.9 14.8 94.4 1.9 3.7
19 87 69 955 1 *Tatua 131 0.8 99.2 0.0 85.5 100.0 0.0 0.0
19 87 69 965 1 *Telip 256 1.2 97.7 1.2 98.4 100.0 0.0 0.0
19 87 69 967 1 *Telpai 106 0.0 100.0 0.0 52.8 98.1 1.9 0.0
19 87 73 Mokrabpur Union Total 3947 0.1 88.2 11.7 33.8 97.5 0.2 2.3
19 87 73 075 1 *Bannaghar 453 0.2 99.6 0.2 9.1 99.8 0.0 0.2
RMO: 1 = Rural, 2 = Urban and 3 = Other Urban Page 153 of 162

Tap Tube-Well Other Owned Rented Rent free
2 3 4 5 6 7 8 9 10
MZ /
MHVill RMO
1
Table C-15: Distribution of General Households by Source of Drinking Water, Electricity Connection and Housing Tenancy Status, by Residence
and Community
Administrative Unit
Residence
Community
Number of
Households
Source of Drinking Water (%) Electricity
Connection
(%)
Housing Tenancy (%)
ZL UZUN /
WA
19 87 73 157 1 *Bhulua Para 394 0.0 80.2 19.8 32.7 88.1 0.0 11.9
19 87 73 480 1 *Kankaz 238 0.0 87.4 12.6 51.7 93.3 2.1 4.6
19 87 73 580 1 *Mokrabpur 1017 0.1 99.0 0.9 33.8 98.6 0.2 1.2
19 87 73 606 1 *Mairagaon 171 0.0 100.0 0.0 63.7 100.0 0.0 0.0
19 87 73 787 1 *Bhatara 316 0.0 100.0 0.0 13.6 97.8 0.0 2.2
19 87 73 828 1 *Sahedapur 250 0.4 99.2 0.4 5.2 98.0 0.0 2.0
19 87 73 925 1 *Tua 391 0.0 62.9 37.1 60.6 98.2 0.0 1.8
19 87 73 928 1 *Tulagaon 717 0.1 72.5 27.3 41.3 99.7 0.1 0.1
19 87 80 Peria Union Total 5434 0.5 91.3 8.2 49.0 97.9 0.3 1.7
19 87 80 028 1 *Asarkota 425 0.7 86.4 12.9 49.9 97.2 1.4 1.4
19 87 80 095 1 *Bara Sangishwar 250 1.6 97.6 0.8 80.8 98.4 0.4 1.2
19 87 80 204 1 *Chhegoria 217 1.4 82.0 16.6 37.3 99.5 0.0 0.5
19 87 80 207 1 *Chhota Chandpur 340 0.0 100.0 0.0 16.2 88.5 0.3 11.2
19 87 80 349 1 *Gangaraia 144 1.4 88.9 9.7 0.7 100.0 0.0 0.0
19 87 80 442 1 *Jogi Pukuria 203 0.0 81.3 18.7 1.5 100.0 0.0 0.0
19 87 80 514 1 *Khorarpar 185 0.5 88.1 11.4 40.5 98.9 0.5 0.5
19 87 80 554 1 *Madhabpur 428 0.5 96.5 3.0 34.8 99.8 0.2 0.0
19 87 80 632 1 *Munshir Kalamia 236 0.0 79.2 20.8 43.6 94.9 0.4 4.7
19 87 80 742 1 *Peria 229 0.9 99.1 0.0 65.5 96.5 0.4 3.1
19 87 80 792 1 *Purba Daulatpur 368 0.0 90.8 9.2 84.2 98.9 0.0 1.1
19 87 80 792 01 1 Daulatpur 262 0.0 91.6 8.4 84.7 99.2 0.0 0.8
19 87 80 792 02 1 Motuia 106 0.0 88.7 11.3 83.0 98.1 0.0 1.9
19 87 80 840 1 *Salukia 68 0.0 100.0 0.0 82.4 98.5 0.0 1.5
19 87 80 864 1 *Shibpur 214 0.0 87.4 12.6 66.8 96.3 0.0 3.7
19 87 80 894 1 *Sreephalia 301 0.0 99.7 0.3 68.1 100.0 0.0 0.0
19 87 80 894 01 1 Sreephalia 217 0.0 99.5 0.5 84.8 100.0 0.0 0.0
19 87 80 894 02 1 Kuia 84 0.0 100.0 0.0 25.0 100.0 0.0 0.0
19 87 80 975 1 *Uttar Jor Pukuria 323 1.5 88.5 9.9 69.7 98.8 0.0 1.2
19 87 80 977 1 *Kakairtala 250 0.0 88.4 11.6 30.4 96.8 2.0 1.2
RMO: 1 = Rural, 2 = Urban and 3 = Other Urban Page 154 of 162

Tap Tube-Well Other Owned Rented Rent free
2 3 4 5 6 7 8 9 10
MZ /
MHVill RMO
1
Table C-15: Distribution of General Households by Source of Drinking Water, Electricity Connection and Housing Tenancy Status, by Residence
and Community
Administrative Unit
Residence
Community
Number of
Households
Source of Drinking Water (%) Electricity
Connection
(%)
Housing Tenancy (%)
ZL UZUN /
WA
19 87 80 989 1 *Uttar Saktali 1253 0.5 91.9 7.6 49.2 99.2 0.2 0.6
19 87 80 989 01 1 Saktali 471 0.4 99.6 0.0 66.9 99.8 0.2 0.0
19 87 80 989 02 1 Mogua 212 0.0 60.4 39.6 0.0 99.1 0.5 0.5
19 87 80 989 03 1 Bara Fulgaon 114 0.9 99.1 0.0 0.9 100.0 0.0 0.0
19 87 80 989 04 1 Chand Puduia 81 0.0 97.5 2.5 69.1 96.3 0.0 3.7
19 87 80 989 05 1 Chatiari 120 0.8 99.2 0.0 83.3 100.0 0.0 0.0
19 87 80 989 06 1 Rudra Choma 105 1.9 98.1 0.0 65.7 99.0 0.0 1.0
19 87 80 989 07 1 Assdia 150 0.0 94.0 6.0 50.7 98.0 0.0 2.0
19 87 86 Roykot Union Total 7547 1.0 93.3 5.7 65.0 97.9 0.8 1.3
19 87 86 021 1 *Alipur 173 2.9 79.2 17.9 78.6 98.3 1.2 0.6
19 87 86 134 1 *Beldaa 249 0.4 98.8 0.8 81.9 99.6 0.0 0.4
19 87 86 142 1 *Betagaon 300 0.3 96.3 3.3 34.3 99.3 0.0 0.7
19 87 86 193 1 *Chanderbagh 427 0.0 96.3 3.7 78.9 96.0 0.5 3.5
19 87 86 193 01 1 Chanderbagh 61 0.0 83.6 16.4 1.6 88.5 3.3 8.2
19 87 86 193 02 1 Pipadya 226 0.0 97.3 2.7 88.5 96.5 0.0 3.5
19 87 86 193 03 1 Bekamalia 140 0.0 100.0 0.0 97.1 98.6 0.0 1.4
19 87 86 218 1 *Charijania 263 0.4 77.9 21.7 24.7 95.4 1.5 3.0
19 87 86 254 1 *Dakshin Sharifpur 117 3.4 82.1 14.5 69.2 97.4 0.9 1.7
19 87 86 285 1 *Dasnara 103 9.7 71.8 18.4 67.0 88.3 10.7 1.0
19 87 86 369 1 *Ghasial 70 4.3 95.7 0.0 100.0 100.0 0.0 0.0
19 87 86 430 1 *Jagnasala 139 0.0 93.5 6.5 0.0 99.3 0.0 0.7
19 87 86 455 1 *Jhatia Para 223 0.9 98.2 0.9 89.7 89.2 7.6 3.1
19 87 86 461 1 *Jhikotia 756 0.9 91.9 7.1 78.6 99.2 0.3 0.5
19 87 86 461 01 1 Basanda 415 0.0 87.5 12.5 76.1 100.0 0.0 0.0
19 87 86 461 02 1 Bara Mantali 264 1.5 98.5 0.0 78.8 98.9 0.8 0.4
19 87 86 461 03 1 Chhota Mantali 77 3.9 93.5 2.6 90.9 96.1 0.0 3.9
19 87 86 562 1 *Kharghar 262 0.0 98.1 1.9 90.8 99.6 0.0 0.4
19 87 86 611 1 *Lakshmi Padua 474 1.3 86.7 12.0 64.3 98.7 0.2 1.1
19 87 86 611 01 1 Lakshmi Padua 234 0.9 82.9 16.2 60.3 97.9 0.0 2.1
RMO: 1 = Rural, 2 = Urban and 3 = Other Urban Page 155 of 162

Tap Tube-Well Other Owned Rented Rent free
2 3 4 5 6 7 8 9 10
MZ /
MHVill RMO
1
Table C-15: Distribution of General Households by Source of Drinking Water, Electricity Connection and Housing Tenancy Status, by Residence
and Community
Administrative Unit
Residence
Community
Number of
Households
Source of Drinking Water (%) Electricity
Connection
(%)
Housing Tenancy (%)
ZL UZUN /
WA
19 87 86 611 02 1 Dargah 89 3.4 96.6 0.0 78.7 100.0 0.0 0.0
19 87 86 611 03 1 Chupuya 151 0.7 86.8 12.6 62.3 99.3 0.7 0.0
19 87 86 637 1 *Mahini 1235 1.9 93.2 4.9 80.0 98.0 0.9 1.1
19 87 86 637 01 1 Uttar Mahini 389 0.0 91.5 8.5 73.3 99.5 0.5 0.0
19 87 86 637 02 1 Dakshin Mahini 365 4.7 95.3 0.0 86.0 95.6 1.1 3.3
19 87 86 637 03 1 Khilla Para 77 0.0 100.0 0.0 97.4 98.7 0.0 1.3
19 87 86 637 04 1 Kukurikhil 233 2.6 96.6 0.9 88.0 98.7 1.3 0.0
19 87 86 637 05 1 Chagari Para 171 0.0 84.8 15.2 63.7 98.2 1.2 0.6
19 87 86 647 1 *Mali Para 255 1.2 82.7 16.1 71.8 98.4 0.4 1.2
19 87 86 684 1 *Nagari Para 251 0.0 100.0 0.0 3.2 100.0 0.0 0.0
19 87 86 691 1 *Narayandia 111 0.0 100.0 0.0 100.0 100.0 0.0 0.0
19 87 86 752 1 *Paschim Bampara 411 1.0 93.7 5.4 39.2 100.0 0.0 0.0
19 87 86 779 1 *Purba Bampara 434 0.2 98.8 0.9 41.2 97.9 0.5 1.6
19 87 86 822 1 *Roykot 593 0.3 99.5 0.2 89.0 97.0 0.3 2.7
19 87 86 862 1 *Satemalia 29 0.0 93.1 6.9 69.0 100.0 0.0 0.0
19 87 86 920 1 *Sreerampur 239 1.3 98.7 0.0 68.2 97.9 1.7 0.4
19 87 86 942 1 *Shyamarkhil 175 1.7 98.3 0.0 70.3 99.4 0.6 0.0
19 87 86 977 1 *Tulatali 258 0.0 93.0 7.0 14.0 96.5 0.0 3.5
19 87 94 Satbaria Union Total 1571 2.8 94.5 2.7 52.0 97.7 0.8 1.5
19 87 94 271 1 *Dakshin Satbaria 1408 2.9 94.0 3.1 48.3 97.4 0.9 1.6
19 87 94 271 01 1 Uttar Satbaria 501 1.4 98.6 0.0 42.1 99.4 0.2 0.4
19 87 94 271 02 1 Dakshin Satbaria 377 3.7 94.4 1.9 71.9 98.9 0.8 0.3
19 87 94 271 03 1 Purba Satbaria 319 5.0 86.2 8.8 61.4 95.3 0.3 4.4
19 87 94 271 04 1 Naiyara 134 2.2 91.8 6.0 0.7 91.0 6.0 3.0
19 87 94 271 05 1 Sajanpur 77 1.3 98.7 0.0 1.3 97.4 0.0 2.6
19 87 94 950 1 *Tapoban 163 1.8 98.2 0.0 84.0 100.0 0.0 0.0
19 94 Titas Upazila Total 35899 2.3 94.0 3.7 81.8 96.4 2.2 1.3
19 94 1 Titas Upazila 35193 2.2 94.0 3.8 81.6 96.6 2.1 1.3
19 94 3 Titas Upazila 706 5.1 94.8 0.1 93.1 87.7 9.5 2.8
RMO: 1 = Rural, 2 = Urban and 3 = Other Urban Page 156 of 162

Tap Tube-Well Other Owned Rented Rent free
2 3 4 5 6 7 8 9 10
MZ /
MHVill RMO
1
Table C-15: Distribution of General Households by Source of Drinking Water, Electricity Connection and Housing Tenancy Status, by Residence
and Community
Administrative Unit
Residence
Community
Number of
Households
Source of Drinking Water (%) Electricity
Connection
(%)
Housing Tenancy (%)
ZL UZUN /
WA
19 94 10 Balarampur Union Total 4541 2.3 96.3 1.5 86.3 91.9 7.0 1.2
19 94 10 003 1 *Aichar Char 358 0.8 99.2 0.0 79.1 98.9 0.3 0.8
19 94 10 058 1 *Gazipur 640 2.7 97.3 0.0 94.1 84.5 14.1 1.4
19 94 10 273 1 *Dakshin Akalia 433 8.5 89.6 1.8 86.1 78.1 20.1 1.8
19 94 10 273 01 1 Dakshin Akalia 230 8.3 88.3 3.5 80.0 90.9 7.8 1.3
19 94 10 273 02 1 Madhay Akalia 203 8.9 91.1 0.0 93.1 63.5 34.0 2.5
19 94 10 513 1 *Kalai Gobindapur 1166 2.1 96.4 1.5 79.2 90.1 8.5 1.5
19 94 10 513 01 1 Kalai Gobindapur 636 2.0 97.5 0.5 76.6 83.6 14.8 1.6
19 94 10 513 02 1 Ulukandi 404 1.5 95.0 3.5 77.0 98.3 0.0 1.7
19 94 10 513 03 1 Panchgachha 126 4.8 95.2 0.0 100.0 96.0 4.0 0.0
19 94 10 637 1 *Manairkandi 172 4.7 95.3 0.0 95.3 93.0 7.0 0.0
19 94 10 681 1 *Nager Char 397 2.0 98.0 0.0 88.4 94.7 4.3 1.0
19 94 10 783 1 *Balarampur 845 0.2 94.8 5.0 88.9 98.8 0.2 0.9
19 94 10 783 01 1 Uttar Balarampur 321 0.0 98.1 1.9 95.3 99.4 0.0 0.6
19 94 10 783 02 1 Dakshin Balarampur 524 0.4 92.7 6.9 84.9 98.5 0.4 1.1
19 94 10 885 1 *Sreenarayankandi 322 0.3 99.7 0.0 85.1 98.1 0.6 1.2
19 94 10 885 01 1 Uttar Sreenarayankandi 202 0.0 100.0 0.0 76.7 98.5 0.5 1.0
19 94 10 885 02 1 Dakshin Sreenarayankandi 120 0.8 99.2 0.0 99.2 97.5 0.8 1.7
19 94 10 954 1 *Durgapur 208 1.0 99.0 0.0 95.2 97.1 2.9 0.0
19 94 10 954 01 1 Uttar Durgapur 90 1.1 98.9 0.0 88.9 93.3 6.7 0.0
19 94 10 954 02 1 Dakshin Durgapur 118 0.8 99.2 0.0 100.0 100.0 0.0 0.0
19 94 17 Bitikandi Union Total 5176 0.7 95.7 3.7 74.8 99.0 0.4 0.6
19 94 17 495 1 *Joar Gobindapur (Part) 3239 0.8 93.5 5.7 76.7 99.2 0.3 0.5
19 94 17 495 01 1 Harairkandi 239 0.0 100.0 0.0 89.5 99.2 0.0 0.8
19 94 17 495 02 1 Porakandi 253 1.2 98.8 0.0 89.7 99.6 0.0 0.4
19 94 17 495 03 1 Bhitikandi 73 1.4 98.6 0.0 65.8 97.3 0.0 2.7
19 94 17 495 04 1 Ghoskandi 151 0.0 100.0 0.0 22.5 100.0 0.0 0.0
19 94 17 495 05 1 Alinagar 191 0.0 100.0 0.0 85.9 100.0 0.0 0.0
19 94 17 495 06 1 Ratanpur 210 0.0 100.0 0.0 99.5 99.5 0.0 0.5
RMO: 1 = Rural, 2 = Urban and 3 = Other Urban Page 157 of 162

Tap Tube-Well Other Owned Rented Rent free
2 3 4 5 6 7 8 9 10
MZ /
MHVill RMO
1
Table C-15: Distribution of General Households by Source of Drinking Water, Electricity Connection and Housing Tenancy Status, by Residence
and Community
Administrative Unit
Residence
Community
Number of
Households
Source of Drinking Water (%) Electricity
Connection
(%)
Housing Tenancy (%)
ZL UZUN /
WA
19 94 17 495 07 1 Haripur 168 0.0 99.4 0.6 84.5 100.0 0.0 0.0
19 94 17 495 08 1 Uttar Daskandi 98 0.0 100.0 0.0 61.2 100.0 0.0 0.0
19 94 17 495 09 1 Darikandi 229 0.0 98.7 1.3 85.6 100.0 0.0 0.0
19 94 17 495 10 1 Kalipur 209 0.0 92.3 7.7 9.6 99.5 0.0 0.5
19 94 17 495 11 1 Shambhupur 120 0.0 100.0 0.0 100.0 99.2 0.0 0.8
19 94 17 495 12 1 Durgapur 75 0.0 96.0 4.0 92.0 97.3 0.0 2.7
19 94 17 495 13 1 Manik Kandi 423 0.7 90.1 9.2 89.8 99.3 0.2 0.5
19 94 17 495 14 1 Dularampur 396 3.5 78.3 18.2 71.2 97.0 2.3 0.8
19 94 17 495 15 1 Haidankandi 172 0.0 100.0 0.0 90.7 100.0 0.0 0.0
19 94 17 495 16 1 Jagatpur 122 4.1 95.1 0.8 84.4 99.2 0.0 0.8
19 94 17 495 17 1 Dhaksin Dash Kandi 110 0.9 53.6 45.5 54.5 100.0 0.0 0.0
19 94 17 612 1 *Machhimpur(Part) 868 0.7 98.7 0.6 84.3 98.8 0.3 0.8
19 94 17 612 01 1 Kadamtali 598 0.5 99.3 0.2 79.9 98.5 0.5 1.0
19 94 17 612 02 1 Narayanpur 270 1.1 97.4 1.5 94.1 99.6 0.0 0.4
19 94 17 805 1 *Raghunathpur Satani 491 0.0 100.0 0.0 29.9 97.8 1.0 1.2
19 94 17 805 01 1 Raghunathpur Satani 220 0.0 100.0 0.0 61.8 95.5 2.3 2.3
19 94 17 805 02 1 Kashipur 271 0.0 100.0 0.0 4.1 99.6 0.0 0.4
19 94 17 809 1 *Raghunathpur Nayani 578 0.2 99.8 0.0 87.9 98.8 0.5 0.7
19 94 35 Jagatpur Union Total 4101 2.5 94.4 3.1 86.9 96.0 2.1 1.9
19 94 35 094 1 *Batakandi 348 17.2 81.9 0.9 88.8 80.2 16.4 3.4
19 94 35 094 01 1 Batakandi 229 19.2 79.5 1.3 94.8 70.7 24.0 5.2
19 94 35 094 02 1 Amirabad 119 13.4 86.6 0.0 77.3 98.3 1.7 0.0
19 94 35 473 1 *Jagatpur 3538 1.1 97.3 1.6 87.0 97.8 0.8 1.4
19 94 35 473 01 1 Jatrabari 104 0.0 100.0 0.0 99.0 100.0 0.0 0.0
19 94 35 473 02 1 Bhati Para 339 0.0 100.0 0.0 95.9 100.0 0.0 0.0
19 94 35 473 03 1 Tulakandi 99 0.0 100.0 0.0 72.7 99.0 0.0 1.0
19 94 35 473 04 1 Dasani Para (1) 218 0.0 99.5 0.5 91.3 100.0 0.0 0.0
19 94 35 473 05 1 Gobindapur 218 0.5 93.1 6.4 95.9 98.2 0.0 1.8
19 94 35 473 06 1 Jagatpur 164 0.6 99.4 0.0 98.2 97.0 3.0 0.0
RMO: 1 = Rural, 2 = Urban and 3 = Other Urban Page 158 of 162
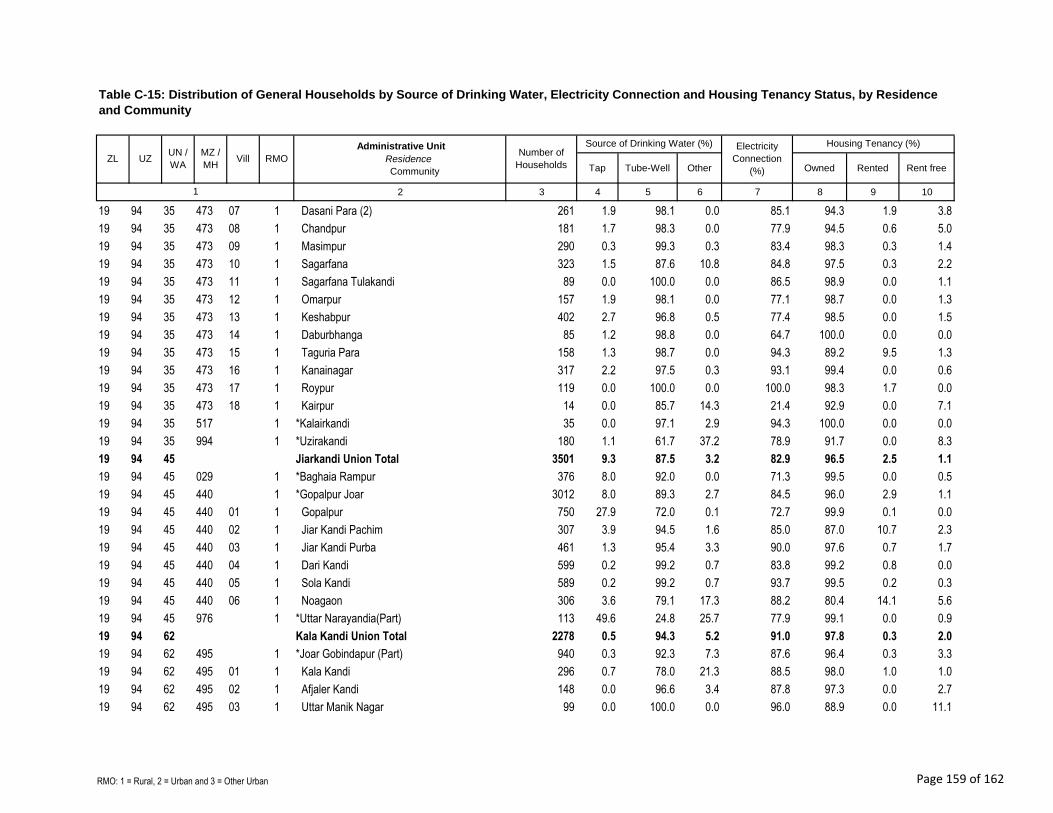
Tap Tube-Well Other Owned Rented Rent free
2 3 4 5 6 7 8 9 10
MZ /
MHVill RMO
1
Table C-15: Distribution of General Households by Source of Drinking Water, Electricity Connection and Housing Tenancy Status, by Residence
and Community
Administrative Unit
Residence
Community
Number of
Households
Source of Drinking Water (%) Electricity
Connection
(%)
Housing Tenancy (%)
ZL UZUN /
WA
19 94 35 473 07 1 Dasani Para (2) 261 1.9 98.1 0.0 85.1 94.3 1.9 3.8
19 94 35 473 08 1 Chandpur 181 1.7 98.3 0.0 77.9 94.5 0.6 5.0
19 94 35 473 09 1 Masimpur 290 0.3 99.3 0.3 83.4 98.3 0.3 1.4
19 94 35 473 10 1 Sagarfana 323 1.5 87.6 10.8 84.8 97.5 0.3 2.2
19 94 35 473 11 1 Sagarfana Tulakandi 89 0.0 100.0 0.0 86.5 98.9 0.0 1.1
19 94 35 473 12 1 Omarpur 157 1.9 98.1 0.0 77.1 98.7 0.0 1.3
19 94 35 473 13 1 Keshabpur 402 2.7 96.8 0.5 77.4 98.5 0.0 1.5
19 94 35 473 14 1 Daburbhanga 85 1.2 98.8 0.0 64.7 100.0 0.0 0.0
19 94 35 473 15 1 Taguria Para 158 1.3 98.7 0.0 94.3 89.2 9.5 1.3
19 94 35 473 16 1 Kanainagar 317 2.2 97.5 0.3 93.1 99.4 0.0 0.6
19 94 35 473 17 1 Roypur 119 0.0 100.0 0.0 100.0 98.3 1.7 0.0
19 94 35 473 18 1 Kairpur 14 0.0 85.7 14.3 21.4 92.9 0.0 7.1
19 94 35 517 1 *Kalairkandi 35 0.0 97.1 2.9 94.3 100.0 0.0 0.0
19 94 35 994 1 *Uzirakandi 180 1.1 61.7 37.2 78.9 91.7 0.0 8.3
19 94 45 Jiarkandi Union Total 3501 9.3 87.5 3.2 82.9 96.5 2.5 1.1
19 94 45 029 1 *Baghaia Rampur 376 8.0 92.0 0.0 71.3 99.5 0.0 0.5
19 94 45 440 1 *Gopalpur Joar 3012 8.0 89.3 2.7 84.5 96.0 2.9 1.1
19 94 45 440 01 1 Gopalpur 750 27.9 72.0 0.1 72.7 99.9 0.1 0.0
19 94 45 440 02 1 Jiar Kandi Pachim 307 3.9 94.5 1.6 85.0 87.0 10.7 2.3
19 94 45 440 03 1 Jiar Kandi Purba 461 1.3 95.4 3.3 90.0 97.6 0.7 1.7
19 94 45 440 04 1 Dari Kandi 599 0.2 99.2 0.7 83.8 99.2 0.8 0.0
19 94 45 440 05 1 Sola Kandi 589 0.2 99.2 0.7 93.7 99.5 0.2 0.3
19 94 45 440 06 1 Noagaon 306 3.6 79.1 17.3 88.2 80.4 14.1 5.6
19 94 45 976 1 *Uttar Narayandia(Part) 113 49.6 24.8 25.7 77.9 99.1 0.0 0.9
19 94 62 Kala Kandi Union Total 2278 0.5 94.3 5.2 91.0 97.8 0.3 2.0
19 94 62 495 1 *Joar Gobindapur (Part) 940 0.3 92.3 7.3 87.6 96.4 0.3 3.3
19 94 62 495 01 1 Kala Kandi 296 0.7 78.0 21.3 88.5 98.0 1.0 1.0
19 94 62 495 02 1 Afjaler Kandi 148 0.0 96.6 3.4 87.8 97.3 0.0 2.7
19 94 62 495 03 1 Uttar Manik Nagar 99 0.0 100.0 0.0 96.0 88.9 0.0 11.1
RMO: 1 = Rural, 2 = Urban and 3 = Other Urban Page 159 of 162

Tap Tube-Well Other Owned Rented Rent free
2 3 4 5 6 7 8 9 10
MZ /
MHVill RMO
1
Table C-15: Distribution of General Households by Source of Drinking Water, Electricity Connection and Housing Tenancy Status, by Residence
and Community
Administrative Unit
Residence
Community
Number of
Households
Source of Drinking Water (%) Electricity
Connection
(%)
Housing Tenancy (%)
ZL UZUN /
WA
19 94 62 495 04 1 Dakhin Manik Nagar 109 0.9 98.2 0.9 57.8 97.2 0.0 2.8
19 94 62 495 05 1 Khane Bari 46 0.0 100.0 0.0 100.0 87.0 0.0 13.0
19 94 62 495 06 1 Kala Chand Kandi 242 0.0 100.0 0.0 93.8 98.3 0.0 1.7
19 94 62 568 1 *Kauria Char 107 0.0 100.0 0.0 97.2 98.1 0.0 1.9
19 94 62 612 1 *Maachhimpur (Part) 1157 0.6 95.1 4.3 92.9 98.7 0.3 1.0
19 94 62 612 01 1 Machhimpur 759 0.8 92.6 6.6 92.4 98.6 0.3 1.2
19 94 62 612 02 1 Dari Machhimpur 398 0.3 99.7 0.0 94.0 99.0 0.3 0.8
19 94 62 666 1 *Mir Bahari 74 1.4 98.6 0.0 97.3 100.0 0.0 0.0
19 94 67 Karikandi Union Total 4093 2.6 91.8 5.7 87.6 93.8 4.8 1.4
19 94 67 1 Karikandi Union 3387 2.0 91.1 6.8 86.4 95.1 3.8 1.1
19 94 67 3 Karikandi Union 706 5.1 94.8 0.1 93.1 87.7 9.5 2.8
19 94 67 007 1 *Alirgaon 269 5.2 79.6 15.2 91.1 99.6 0.0 0.4
19 94 67 047 1 *Banda Rampur 898 4.8 81.7 13.5 92.3 87.2 11.0 1.8
19 94 67 142 1 *Biramkandi 154 0.6 93.5 5.8 90.3 100.0 0.0 0.0
19 94 67 521 1 *Kalakandi 485 0.2 98.8 1.0 87.0 95.3 3.9 0.8
19 94 67 550 1 *Kapaskandi 333 0.3 95.8 3.9 79.0 99.4 0.0 0.6
19 94 67 553 3 *Karaiakandi 706 5.1 94.8 0.1 93.1 87.7 9.5 2.8
19 94 67 692 1 *Nalchar Isabpur 315 0.3 99.7 0.0 74.0 98.7 0.0 1.3
19 94 67 692 01 1 Nalchar Isabpur 62 0.0 100.0 0.0 71.0 98.4 0.0 1.6
19 94 67 692 02 1 Isabpur 253 0.4 99.6 0.0 74.7 98.8 0.0 1.2
19 94 67 812 1 *Rajapur 506 0.2 99.8 0.0 90.9 99.8 0.0 0.2
19 94 67 812 01 1 Rajapur 347 0.0 100.0 0.0 87.6 99.7 0.0 0.3
19 94 67 812 02 1 Char Rajapur 159 0.6 99.4 0.0 98.1 100.0 0.0 0.0
19 94 67 929 1 *Titaia Rampur 378 1.9 87.0 11.1 88.9 95.2 3.2 1.6
19 94 67 929 01 1 Titaia Rampur 77 0.0 100.0 0.0 94.8 98.7 0.0 1.3
19 94 67 929 02 1 Akla Rampur 301 2.3 83.7 14.0 87.4 94.4 4.0 1.7
19 94 67 933 1 *Titas Nadir Natunchar 49 0.0 100.0 0.0 0.0 95.9 0.0 4.1
19 94 69 Majidpur Union Total 6068 2.2 91.4 6.4 83.3 97.5 0.4 2.1
19 94 69 043 1 *Baluakandi 414 0.5 88.4 11.1 90.1 99.0 0.0 1.0
RMO: 1 = Rural, 2 = Urban and 3 = Other Urban Page 160 of 162

Tap Tube-Well Other Owned Rented Rent free
2 3 4 5 6 7 8 9 10
MZ /
MHVill RMO
1
Table C-15: Distribution of General Households by Source of Drinking Water, Electricity Connection and Housing Tenancy Status, by Residence
and Community
Administrative Unit
Residence
Community
Number of
Households
Source of Drinking Water (%) Electricity
Connection
(%)
Housing Tenancy (%)
ZL UZUN /
WA
19 94 69 178 1 *Chanda Nager Char 236 0.4 99.6 0.0 82.6 88.1 2.1 9.7
19 94 69 215 1 *Char Kanthalia 218 1.4 95.4 3.2 99.1 99.5 0.0 0.5
19 94 69 331 1 *Darigaon 360 0.3 95.0 4.7 92.8 95.3 0.0 4.7
19 94 69 393 1 *Dudhghata 204 0.0 100.0 0.0 96.1 98.5 0.5 1.0
19 94 69 575 1 *Kakiakhali 285 0.0 96.5 3.5 93.7 99.6 0.0 0.4
19 94 69 597 1 *Lalpur 418 0.5 91.9 7.7 79.7 96.2 0.2 3.6
19 94 69 619 1 *Majidpur 875 11.0 88.9 0.1 86.6 98.4 0.3 1.3
19 94 69 652 1 *Matapi 931 1.0 99.0 0.0 79.6 96.0 1.5 2.5
19 94 69 652 01 1 Matapi 633 0.3 99.7 0.0 72.0 94.5 2.2 3.3
19 94 69 652 02 1 Shibpur 298 2.3 97.7 0.0 95.6 99.3 0.0 0.7
19 94 69 670 1 *Mohanpur 380 0.5 99.2 0.3 76.1 98.4 0.0 1.6
19 94 69 701 1 *Dakshin Satani 172 4.1 40.7 55.2 98.3 100.0 0.0 0.0
19 94 69 834 1 *Shah Briddi 510 0.4 92.0 7.6 79.0 98.0 0.0 2.0
19 94 69 838 1 *Sahapur 1065 0.7 86.0 13.3 73.1 98.6 0.0 1.4
19 94 77 Narayandia Union Total 3175 0.0 99.7 0.3 81.6 98.3 1.4 0.3
19 94 77 134 1 *Bhatibanda 139 0.0 100.0 0.0 84.2 100.0 0.0 0.0
19 94 77 976 1 *Uttar Narayandia(Part) 3036 0.0 99.7 0.3 81.5 98.3 1.4 0.3
19 94 77 976 01 1 Khalilabad 549 0.0 99.8 0.2 89.4 94.0 5.8 0.2
19 94 77 976 02 1 Dakhin Narayandia(Pubapar) 404 0.0 99.8 0.2 64.1 100.0 0.0 0.0
19 94 77 976 03 1 Dakhin Narayandia(Pachimpar) 357 0.3 99.7 0.0 65.5 98.9 0.6 0.6
19 94 77 976 04 1 Nayachar 116 0.0 100.0 0.0 1.7 97.4 1.7 0.9
19 94 77 976 05 1 Asmania 128 0.0 100.0 0.0 77.3 92.2 6.3 1.6
19 94 77 976 06 1 Baluakandi 273 0.0 100.0 0.0 96.0 99.6 0.0 0.4
19 94 77 976 07 1 Tulakandi 295 0.0 100.0 0.0 96.3 100.0 0.0 0.0
19 94 77 976 08 1 Tariakandi 174 0.0 100.0 0.0 90.8 100.0 0.0 0.0
19 94 77 976 09 1 Sonakandi 259 0.0 98.1 1.9 92.3 99.2 0.0 0.8
19 94 77 976 10 1 Nayakandi 257 0.0 100.0 0.0 96.9 100.0 0.0 0.0
19 94 77 976 11 1 Dukhaikandi 224 0.0 99.6 0.4 88.4 100.0 0.0 0.0
19 94 85 Satani Union Total 2966 0.4 96.8 2.9 61.1 97.7 0.7 1.6
RMO: 1 = Rural, 2 = Urban and 3 = Other Urban Page 161 of 162

Tap Tube-Well Other Owned Rented Rent free
2 3 4 5 6 7 8 9 10
MZ /
MHVill RMO
1
Table C-15: Distribution of General Households by Source of Drinking Water, Electricity Connection and Housing Tenancy Status, by Residence
and Community
Administrative Unit
Residence
Community
Number of
Households
Source of Drinking Water (%) Electricity
Connection
(%)
Housing Tenancy (%)
ZL UZUN /
WA
19 94 85 222 1 *Char Kumuria 414 0.0 99.5 0.5 67.4 99.0 0.0 1.0
19 94 85 222 01 1 Char Kumaria 213 0.0 100.0 0.0 63.8 98.6 0.0 1.4
19 94 85 222 02 1 Barkaunia 201 0.0 99.0 1.0 71.1 99.5 0.0 0.5
19 94 85 276 1 *Baidyerkandi 177 0.0 96.0 4.0 5.6 95.5 2.3 2.3
19 94 85 397 1 *Durlabhdi 164 0.0 98.2 1.8 44.5 98.2 1.2 0.6
19 94 85 397 01 1 Durlabhdi 91 0.0 100.0 0.0 75.8 100.0 0.0 0.0
19 94 85 397 02 1 Roypur 73 0.0 95.9 4.1 5.5 95.9 2.7 1.4
19 94 85 430 1 *Gobindapur 112 0.0 83.0 17.0 99.1 99.1 0.0 0.9
19 94 85 451 1 *Harinpur 66 0.0 100.0 0.0 30.3 98.5 0.0 1.5
19 94 85 659 1 *Mazamekandi 94 0.0 80.9 19.1 21.3 100.0 0.0 0.0
19 94 85 736 1 *Nayakandi 221 0.0 99.5 0.5 55.7 98.6 0.0 1.4
19 94 85 736 01 1 Nayakandi 165 0.0 99.4 0.6 55.2 98.8 0.0 1.2
19 94 85 736 02 1 Tatuakandi 56 0.0 100.0 0.0 57.1 98.2 0.0 1.8
19 94 85 779 1 *Puran Batakandi 131 0.0 100.0 0.0 81.7 97.7 1.5 0.8
19 94 85 845 1 *Saraswatir Char 266 0.0 94.0 6.0 42.9 97.0 0.0 3.0
19 94 85 845 01 1 Saraswatir Char (I) 109 0.0 85.3 14.7 54.1 93.6 0.0 6.4
19 94 85 845 02 1 Saraaswatir Char(2) 157 0.0 100.0 0.0 35.0 99.4 0.0 0.6
19 94 85 951 1 *Uttar Akalia 401 2.2 97.3 0.5 61.6 98.0 2.0 0.0
19 94 85 951 01 1 Uttar Akalia 236 3.4 96.6 0.0 85.2 97.0 3.0 0.0
19 94 85 951 02 1 Rambhadra 165 0.6 98.2 1.2 27.9 99.4 0.6 0.0
19 94 85 969 1 *Uttar Krishnapur 599 0.0 97.2 2.8 65.6 95.8 0.8 3.3
19 94 85 969 01 1 Uttar Krishnapur 133 0.0 97.0 3.0 95.5 96.2 0.8 3.0
19 94 85 969 02 1 Faridpur 153 0.0 100.0 0.0 0.0 93.5 0.0 6.5
19 94 85 969 03 1 Alampur 50 0.0 100.0 0.0 80.0 90.0 8.0 2.0
19 94 85 969 04 1 Mangalkandi 215 0.0 94.0 6.0 84.2 98.6 0.0 1.4
19 94 85 969 05 1 Raypur 48 0.0 100.0 0.0 93.8 95.8 0.0 4.2
19 94 85 984 1 *Uttar Satani 321 0.6 99.4 0.0 98.1 98.8 0.0 1.2
19 94 85 984 01 1 Satani (1) 111 0.0 100.0 0.0 100.0 100.0 0.0 0.0
19 94 85 984 02 1 Satani(2) 210 1.0 99.0 0.0 97.1 98.1 0.0 1.9
RMO: 1 = Rural, 2 = Urban and 3 = Other Urban Page 162 of 162