
p477.pdf - CIMNE Congress Bureau
10
11th World Congress on Computational Mechanics (WCCM XI) 5th European Conference on Computational Mechanics (ECCM V) 6th European Conference on Computational Fluid Dynamics (ECFD VI) E. Oñate, J. Oliver and A. Huerta (Eds) AN INVESTIGATION OF THE PERFORMANCE OF A POSITIVE DISPLACEMENT RECIPROCATING PUMP AT LOW PRESSURE NPSH INCORPORATING A THREE PHASE CAVITATION MODEL ALDO IANNNETTI * , MATTHEW T. STICKLAND † AND WILLIAM M. DEMPSTER † * Mechanical and Aerospace Engineering Department University of Strathclyde 16 Richmond Street, Glasgow G1 1XQ, Scotland, United Kingdom e-mail: [email protected] † Mechanical and Aerospace Engineering Department University of Strathclyde 16 Richmond Street, Glasgow G1 1XQ, Scotland, United Kingdom email: [email protected] † Mechanical and Aerospace Engineering Department University of Strathclyde 16 Richmond Street, Glasgow G1 1XQ, Scotland, United Kingdom email: [email protected] Key Words: Singhal et al. cavitation model, Multiphase flows, PD reciprocating pump, self- actuated valve model, moving mesh. Abstract. The full cavitation [1] multiphase CFD model of a positive displacement reciprocating pump is presented to investigate performance during the pumping cycle through 360° of the crank shaft rotation. This paper discusses the cavitation appearance and dynamics inside the pump chamber at 100kPa, 50kPa, 25kPa and 0kPa inlet gauge pressure and evaluates the Singhal et al. [1] cavitation model in conditions of incipient cavitation, partial cavitation and full cavitation. The paper also investigates the role of pump inlet valve inertia on cavitation dynamics. The transient CFD model takes into account a three phase flow composed of water, water vapour and 15 parts per million (ppm) of non-condensable ideal gas mass fraction, and utilizes the moving mesh technique to deal with the inlet and outlet valve dynamics. A User Defined Function (UDF) is utilized to couple the pressure field and the valve force and displacement-time histories so that the valves are “self-actuated”. A second UDF handles the compressibility model of water which is essential for high outlet pressure and to stabilize the simulation in the situation when the valves are both closed. The paper shows the feasibility of such a complete CFD model of a PD pump, equipped with the Singhal et Al. cavitation model, and its capability to assess the rate of phase change, the efficiency loss and the prediction the valve lift history.
-
Upload
khangminh22 -
Category
Documents
-
view
2 -
download
0
Transcript of p477.pdf - CIMNE Congress Bureau

11th World Congress on Computational Mechanics (WCCM XI)
5th European Conference on Computational Mechanics (ECCM V)
6th European Conference on Computational Fluid Dynamics (ECFD VI)
E. Oñate, J. Oliver and A. Huerta (Eds)
AN INVESTIGATION OF THE PERFORMANCE OF A POSITIVE
DISPLACEMENT RECIPROCATING PUMP AT LOW PRESSURE
NPSH INCORPORATING A THREE PHASE CAVITATION MODEL
ALDO IANNNETTI*
, MATTHEW T. STICKLAND†
AND WILLIAM M.
DEMPSTER†
* Mechanical and Aerospace Engineering Department
University of Strathclyde
16 Richmond Street, Glasgow G1 1XQ, Scotland, United Kingdom
e-mail: [email protected]
† Mechanical and Aerospace Engineering Department
University of Strathclyde
16 Richmond Street, Glasgow G1 1XQ, Scotland, United Kingdom
email: [email protected]
† Mechanical and Aerospace Engineering Department
University of Strathclyde
16 Richmond Street, Glasgow G1 1XQ, Scotland, United Kingdom
email: [email protected]
Key Words: Singhal et al. cavitation model, Multiphase flows, PD reciprocating pump, self-
actuated valve model, moving mesh.
Abstract. The full cavitation [1] multiphase CFD model of a positive displacement
reciprocating pump is presented to investigate performance during the pumping cycle through
360° of the crank shaft rotation. This paper discusses the cavitation appearance and dynamics
inside the pump chamber at 100kPa, 50kPa, 25kPa and 0kPa inlet gauge pressure and
evaluates the Singhal et al. [1] cavitation model in conditions of incipient cavitation, partial
cavitation and full cavitation. The paper also investigates the role of pump inlet valve inertia
on cavitation dynamics. The transient CFD model takes into account a three phase flow
composed of water, water vapour and 15 parts per million (ppm) of non-condensable ideal gas
mass fraction, and utilizes the moving mesh technique to deal with the inlet and outlet valve
dynamics. A User Defined Function (UDF) is utilized to couple the pressure field and the
valve force and displacement-time histories so that the valves are “self-actuated”. A second
UDF handles the compressibility model of water which is essential for high outlet pressure
and to stabilize the simulation in the situation when the valves are both closed. The paper
shows the feasibility of such a complete CFD model of a PD pump, equipped with the Singhal
et Al. cavitation model, and its capability to assess the rate of phase change, the efficiency
loss and the prediction the valve lift history.

Aldo Iannetti, Matthew T. Stickland and William M. Dempster.
2
1 INTRODUCTION
Technical literature usually classifies the cavitation phenomenon into three different
regimes as Opitz [2] pointed out and discussed, they are incipient cavitation, partial cavitation
and full cavitation. They are usually recognised by their different features and loss of
performance that they cause. In positive displacement (PD) reciprocating pumps the most
important external factors which lead to cavitation are usually the inlet pressure and the crank
angular velocity. Increasing the speed and/or decreasing the inlet pressure the pump can reach
conditions from incipient to full cavitation.
According to Opitz [2], [3] incipient cavitation occurs in a very short time at the beginning
of the inlet stroke when the inlet valve is still close and the chamber decompression creates a
wide zone of low pressure where bubbles are randomly distributed in the chamber and they do
not impact on the surfaces. According to other authors such as Franc [4] incipient cavitation is
a more general situation where the generation of bubbles is not sufficiently significant to
affect the main flow. All authors agree on the fact that incipient cavitation does not produce
damages to the device and it seems it does not affect the pump performance either. In fact, as
Pawan recalled [5], the Hydraulic Institute Standards fixed at 3% the maximum allowable loss
of volumetric efficiency and, incipient cavitation does not exceed that limit.
Partial cavitation [2] is characterized by complete bubble degeneration within the inlet
stroke. It can be classified further into the three sub-categories of incipient partial, advanced
partial and distinctive partial cavitation depending on the features and when they arise within
the inlet stroke. The full cavitation is characterised by the complete degeneration of the
vapour cavities at the beginning of the outlet stroke, a significant volumetric efficiency loss is
to be expected.
Many tools have been designed over the years to analyse the behaviour of PD pumps, from
analytic to experimental. Shu [6] and Edge [7], for instance worked on an analytic tool to
predict the performance of PD pumps while Opitz [2] more recently chose an experimental
approach. The work presented in this paper is CFD oriented because the authors believe CFD
techniques nowadays are ready to model the physics and functioning of PD pumps in
cavitation conditions.
To correctly simulate the features of the cavitation regimes, a CFD model of a PD
reciprocating pump should consider the independent movement of the valves which have to
be actuated by the pressure field rather than the analyst’s external action as explained in [8].
A self-actuated CFD model of the valves should also be equipped with a reliable cavitation
model which calculates the modified pressure field when the pump cavitates. It is very
important to have a comprehensive cavitation model as well as a multiphase model. In fact,
cavitation is affected by the grade of pureness of water i.e. the non-condensable gas mass
fraction dissolved in water as discussed by [9] and this has to be considered in the model. The
work which this paper presents aims at creating that comprehensive CFD model of one
chamber of a PD pump and demonstrating its feasibility and capability in predicting the
features among the different cavitation regimes and the loss of performance.
2 CFD MODEL
A complete pumping cycle composed of the inlet and outlet stroke of the pump represented

Aldo Iannetti, Matthew T. Stickland and William M. Dempster.
3
in figure 1 was simulated. The starting point of the simulation was the initial point of the inlet
stroke when the plunger was at its Top Dead Centre (TDC) position (see figure 1) with the
crank angle at 0°. From 0° to 180° the plunger performed the entire inlet stroke moving
backwards and reaching the Bottom Dead Centre position (BDC), it moved forward
compressing the chamber again in the crank angle ranges from 180° to 360°. The inlet valve
lifted off during the suction stroke as the decompression of the plunger caused a non-null
pressure forces to act on the valve, it returned back on the seat in the final part of the inlet
stroke as the pressure difference was restored, pushed by the spring. In a similar manner the
outlet valve opened when the forward stroke of the plunger created a pressure force
sufficiently high to exceed the outlet valve spring preload and returned on the seat when the
pressure was restored in the final part of the outlet stroke. The layering moving mesh
algorithm took care of the displacement history of the plunger as well as the lift history of the
valves. The plunger displacement was fixed by the reciprocating motion depending on the
crank angular velocity (130 rpm), crank diameter and connecting rod length. The inlet and
outlet valve’s lift was governed by a User Defined Function (UDF) as described by Iannetti
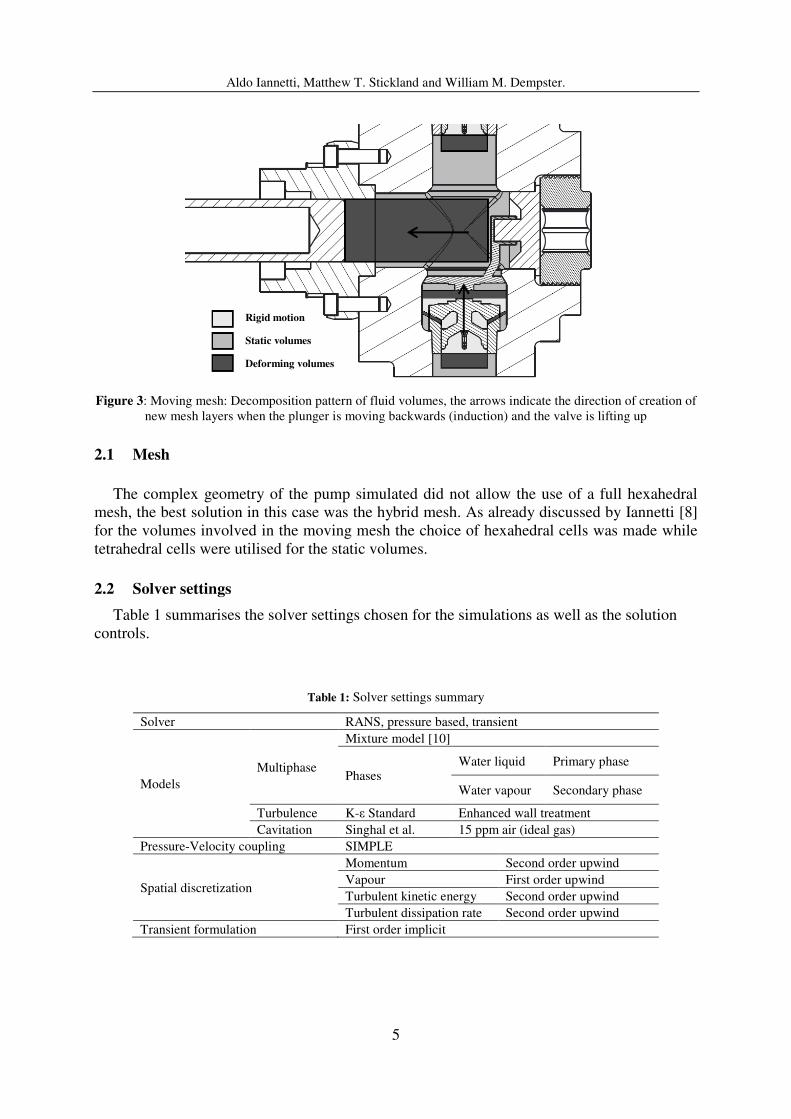
[8], figure 2 describes how the UDF worked. The fluid model was decomposed into the
pattern of sub-volumes shown in figure 3 in order to correctly handle the moving mesh
algorithms in a similar manner to that described by Iannetti [8]. The UDF also took into
account the spring stiffness characteristic curve and a further UDF dealing with the
compressibility model of water was also provided.
Figure 1: PD pump geometry and nomenclature, TDC and BDC plunger position
The new feature which was not present in the model discussed by Iannetti [8] that is a
1
3
2
4
5
6
Displacement
Volume
Final Plunger position (BDC)
180° crank rotation
3
7
8
1 Valve
2 Valve seat
3 Conic spring
4 Spring retainer
5 Inlet duct
6 Outlet Duct
7 Pump case
8 Plunger

Aldo Iannetti, Matthew T. Stickland and William M. Dempster.
4
peculiar feature of the work being presented in this paper is the Singhal et al. cavitation model
[1] which was used in conjunction with the mixture multiphase model [10]. This cavitation
model is usually called the “full” cavitation model because it takes into account all the first
order terms of the Rayleigh-Plesset equation [4] as well as the surface tension term. It also
takes into account the effects of the non-condensable gas.
Figure 2: A UDF which interacts with the RANS solver to govern the valve’s lift and the moving mesh
no
yes
Initialzation ( t=0):
• Chamber pressure = delivery pressure
• Valve lift =0
• Valve spring force = spring preload
t=t+∆t
Plunger position and mesh updating according to the reciprocating law
Fluid dynamics fields calculation via RANS
Calculating the valve pressure
forces and adding the spring forces
Integrating the valve dynamics
equation, calculating the new valve
lift and velocity
Updating the valve mesh according to the new lift value, updating the valve spring force
according to the spring stiffness characteristic
Pumping cycle over?
END
Aldo Iannetti, Matthew T. Stickland and William M. Dempster.
5
Figure 3: Moving mesh: Decomposition pattern of fluid volumes, the arrows indicate the direction of creation of
new mesh layers when the plunger is moving backwards (induction) and the valve is lifting up
2.1 Mesh
The complex geometry of the pump simulated did not allow the use of a full hexahedral
mesh, the best solution in this case was the hybrid mesh. As already discussed by Iannetti [8]
for the volumes involved in the moving mesh the choice of hexahedral cells was made while
tetrahedral cells were utilised for the static volumes.
2.2 Solver settings
Table 1 summarises the solver settings chosen for the simulations as well as the solution
controls.
Table 1: Solver settings summary
Solver RANS, pressure based, transient
Models
Multiphase
Mixture model [10]
Phases Water liquid Primary phase
Water vapour Secondary phase
Turbulence K-ε Standard Enhanced wall treatment
Cavitation Singhal et al. 15 ppm air (ideal gas)
Pressure-Velocity coupling SIMPLE
Spatial discretization
Momentum Second order upwind
Vapour First order upwind
Turbulent kinetic energy Second order upwind
Turbulent dissipation rate Second order upwind
Transient formulation First order implicit
Rigid motion
Static volumes
Deforming volumes

Aldo Iannetti, Matthew T. Stickland and William M. Dempster.
6
Under relaxation factors
Pressure 0.3
Momentum 0.7
Vapour 0.5
Turbulent kinetic energy 0.8
Turbulent dissipation rate 0.8
Residuals 10-3
Time step 0.125° crank rotation ≡ 1.6 x 10⁻⁴
s @130 rpm
Max Iteration per time step 35
UDFs Compressibility of water [8]
Valve dynamics, see Figure 2
2.3 Boundary conditions
To create the cases mentioned in the abstract, four different boundary conditions were
chosen. Since the model simulated the whole pumping cycle, inlet and outlet pressure
conditions were needed. For simplicity’s sake the hypothesis of using the same pressure at
inlet and outlet was used within each case as one can see in Table 2, the same plunger
displacement-time history was chosen for all cases. Figure 4 shows the plunger displacement
over crank rotation angle for the chosen shaft angular speed of 130 rpm.
Table 2: Inlet pressure, outlet pressure and plunger displacement boundary conditions
Case Pressure: function of the mass flow rate Plunger
Displacement Inlet pressure [kPaG] Outlet pressure [kPaG]
Case 1 0 0 see Figure 4
Case 2 25 25 see Figure 4
Case 3 50 50 see Figure 4
Case 4 100 100 see Figure 4
Figure 4: Boundary conditions, plunger displacement hystory
0
0.05
0.1
0.15
0.2
0.25
0 100 200 300
Plu
ng
er
dis
pla
ce
me
nt
[m]
Crank rotation [°]
SUCTION
STROKEDELIVERY
STROKE

Aldo Iannetti, Matthew T. Stickland and William M. Dempster.
7
3 RESULTS DISCUSSION
Figure 5 shows the chamber pressure history over crank rotation of all the four case being
discussed. To record the shown temporal trend a monitor point inside the chamber was
chosen, it was placed in the vicinity of the TDC position of the plunger and was considered
static throughout the pumping cycle. Figure 5 shows that case 1 and 2 approached the vapour
pressure, case 1 did this for a longer time (100°-170° of crank rotation) while case 2 varied
around the vapour pressure for a shorter time (roughly 110°-130° of crank rotation). This
resulted in the greater vapour generation as shown in Figure 6 which quantifies the vapour
fraction calculated on the plunger top surface for the four cases. The estimated peaks
occurring between 100° and 120° were 11% and 6% for case 1 and 2 respectively and this
confirmed the pressure trend of Figure 5, the longer the chamber pressure remained in the
vicinity of the vapour pressure the higher was the generation of vapour. Table 3 shows the
volumetric efficiencies of the cases 1 to 4, it also points out the relationship between the inlet
valve closing time and efficiency. The higher was the delay of the inlet valve closing the
higher was the volumetric efficiency loss. For case 1, Figure 6 together with the Table 3 data
demonstrates that the delay of the inlet valve closing was due to the presence a significant
amount of vapour in the last part of the inlet stroke, it implied that the initial part of the outlet
stroke was needed to compress the vapour and turn it back to liquid, this caused the loss in
volumetric efficiency. According to Opitz [2] one can say that case 1 describes a typical
situation of full cavitation. Furthermore, according to Opitz and Tackett [11] one can say that
case 2 describes the characteristic features of partial cavitation as the volumetric efficiency
loss was within the 3%.
Figures 5 and 6 show that case 4 chamber pressure remained safely distant from the vapour
pressure and a negligible amount of vapour was generated. This resulted in the lower inlet
valve closing time delay and the consequent smallest volumetric efficiency loss as highlighted
by Table 3. One can say that case 4 was not affected by cavitation. Case 3 showed an
intermediate behaviour, figure 5 shows that case 3 chamber pressure remains distant from the
vapour pressure limit but figure 6 shows a maximum vapour fraction of 3%, this is a piece of
evidence of the incipient cavitation situation. Although the monitor point recorded a pressure
sufficiently higher than the vapour pressure, localized zones exceeded the limit and a slightly
amount of vapour was generated, it was not sufficient to decrease the volumetric efficiency
and to delay the inlet valve closing time as one can see in Table 3. According to Franc [4]
case 3 describes an incipient cavitation situation.
Table 3: Volumetric efficiencies calculated relative to the standard condition (plunger stroke volumen multiplied
by the density of wáter at ambient pressure)
Inlet Max
pressure
[kPa]
Volumetric efficiency Vs
standard conditions [%]
Inlet valve closing time
[crank rotation °]
Case 1 0 93.36 205.3
Case 2 25 97.93 194.6
Case 3 50 98.26 185.8
Case 4 100 98.87 183.7

Aldo Iannetti, Matthew T. Stickland and William M. Dempster.
8
Figure 5: Chamber pressure-time histories, case 1 to 4. The pressure is monitored in a fixed point near the TDC
plunger position
Figure 6: Plunger surfaces mean vapour fraction, case 1 to 4
4 CONCLUSION
A set of four CFD test cases of a PD pump have been created. They were designed to show
the typical features of the cavitation condition of incipient, partial and full cavitation plus a
further case of null cavitation. The different cavitation regimes were achieved by decreasing
the inlet manifold pressure from 100kPa to 0 kPa. The CFD model utilized was a
comprehensive cavitation algorithm which included the effects of phase change and the
presence of non-condensable gas. The dynamic model of the valves simulated the connection
between the pressure field which was affected by the valve lift history and the valve dynamics
which depended on the pressure field. This correctly simulated the behaviour of the pump in
the full cavitation regime providing reliable information on its volumetric efficiency and on
0
0.05
0.1
0.15
0.2
0.25
0.3
-1.2E+05
-2.0E+04
8.0E+04
1.8E+05
2.8E+05
3.8E+05
4.8E+05
0 25 50 75 100 125 150 175 200 225 250 275 300 325 350
Plu
ng
er
dis
pla
ce
me
nt
[m]
Pr
es
su
re
[P
a]
Crank rotation [°]
0barG inlet
0.25 barg inlet
0.5 barg inlet
1 barg inlet
Vapour pressure
Plunger displacement
0
0.05
0.1
0.15
0.2
0.25
0.3
0
0.02
0.04
0.06
0.08
0.1
0.12
0 25 50 75 100 125 150 175 200 225
Plu
ng
er
dis
pla
ce
me
nt
[m]
Va
po
ur
vo
lum
e f
ra
cti
on
[-]
Crank rotation [°]
0 barG inlet
0.25 barG inlet
0.5 barG inlet
1 barG inlet
Plunger displacement

Aldo Iannetti, Matthew T. Stickland and William M. Dempster.
9
the generation of water vapour by cavitation prediction which can help the designers to extend
PD pump operational life.
REFERENCES
[1] A. K. Singhal, M. M. Athavale, H. Li, and Y. Jiang, “Mathematical Basis and
Validation of the Full Cavitation Model,” J. Fluids Eng., vol. 124, no. 3, p. 617, 2002.
[2] K. Opitz and E. Schlücker, “Detection of Cavitation Phenomena in Reciprocating
Pumps using a High-Speed Camera,” Chem. Eng. Technol., vol. 33, no. 10, pp. 1610–
1614, Jul. 2010.
[3] K. Opitz, E. Schlücker, and O. Schade, “Cavitation in reciprocating positive
displacement pumps,” in Twenty-seventh international pump users symposium, 2011,
pp. 27–33.
[4] J. P. Franc and J. M. Michel, Fundamental of Cavitation. Kluwer academic publishers,
2004, pp. 1–300.
[5] S. D. A. Pawan J. Singh, “Determination of NPSHR for reciprocating positive
displacemenmt pumps: a new approach,” in Proceedings of the thirteenth international
pump user symposium, 1996, pp. 131–139.
[6] J. Shu, C. R. Burrows, and K. A. Edge, “Pressure pulsations in reciprocating pump
piping systems Part 1 : modelling,” Proc Inst Mech Engrs, vol. 211 Part I, no. April,
pp. 229–237, 1997.
[7] K. a Edge, O. P. Boston, K. C. S. Xiao, K. C. M. J. Longvill, and K. C. C. R. Burrows,
“Pressure pulsations in reciprocating pump piping systems Part 2: experimental
investigations and model validation,” Proc. Inst. Mech. Eng. Part I J. Syst. Control
Eng., vol. 211, no. 3, pp. 239–250, Jan. 1997.
[8] A. Iannetti, M. Stickland, and W. Dempster, “A CFD model to evaluate the inlet stroke
performance of a positive displacement reciprocating plunger pump,” Proc. Inst. Mech.
Eng. Part A J. Power Energy, vol. In Press, 2014.
[9] T. Baur, J. Köngeter, and R. Leucker, “Effects of dissolved gas on cavitation inception
in free surface flows,” in Third International Symposium on Cavitation, 1998, no.
April.
[10] ANSYS, “ANSYS Fluent Theory Guide,” vol. 15317, no. November. ANSYS Fluent,
2011.

Aldo Iannetti, Matthew T. Stickland and William M. Dempster.
10
[11] H. H. Tackett, J. A. Cripe, and G. Dyson, “Positive displacement reciprocating pump
fundamentals- power and direct acting types.,” in Proceedings of the twenty-fourth
international pump user symposium, 2008, pp. 45–58.