Overview Pres - NextEnergy Capital
34
Interim Results Presentation 23 November 2020
-
Upload
khangminh22 -
Category
Documents
-
view
4 -
download
0
Transcript of Overview Pres - NextEnergy Capital

Interim Results Presentation
23 November 2020

2
Presented by NextEnergy Capital, Investment Adviser - Contents
1) Investment Update p.3
2) Financial Highlights p.15
3) Q&A - Appendix p.24

Investment Update
Staughton (50MW)BedfordshireEnergised December 2019

4
Investment Highlights
Generation vs. budget (+11.1%) translates into additional revenues of £6.0m during the period
£5.4m benefit from power price contract fixes vs baseload prices during the period
43MW of development work in progress for Anglian Water - power directly sold through private wire agreements
755MW total diversified capacity through 90 solar assets
8.5MW subsidy-free project High Garrett energised post the period-end taking the total installed capacity to 763MW
Issuance of £200m preference estimated to increase cashflows by £6.0m during the current financial year compared to a proforma debt financing
30 September 2020
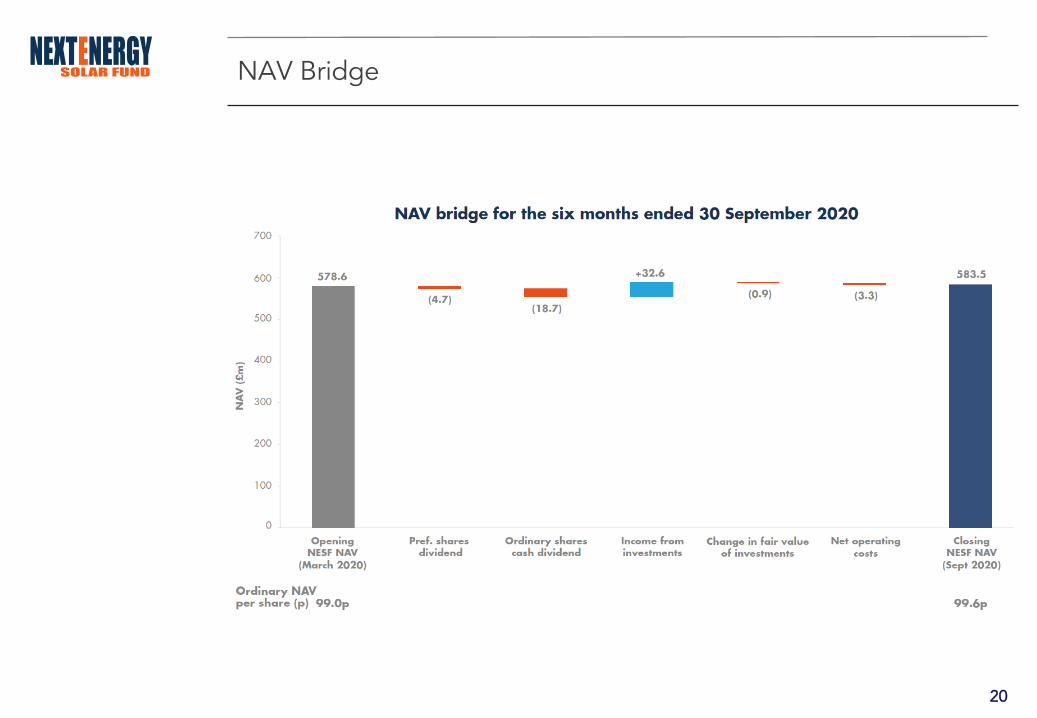
NAV – £583.5m
NAV/share – 99.6p
GAV – £994m
31 March 2020
NAV – £578.6m
NAV/share – 99.0p
GAV – £991m
5
Environmental, Social and Governance (ESG)
Notes: (1) www.gov.uk/government/statistics/energy-consumption-in-the-uk(2) greeninvestmentgroup.com/green-impact/green-investment-handbook(3) https://www.gov.uk/government/publications/new-car-carbon-dioxide-emissions
◼ NESF considers the three pillars of Climate Change, Biodiversity and Human Rights as an integral part of theinvestment process
◼ NESF is committed to supporting the UK Government in its ambitious objective of bringing all greenhouse gas emissions to net zero by 2050 and limiting global average temperature rise to 2OC from pre-industrial era levels
◼ NESF has contracted the Green Investment Group (“GIG”) to independently verify our positive impact on mitigating climate change
(1)
(2) (3)
6
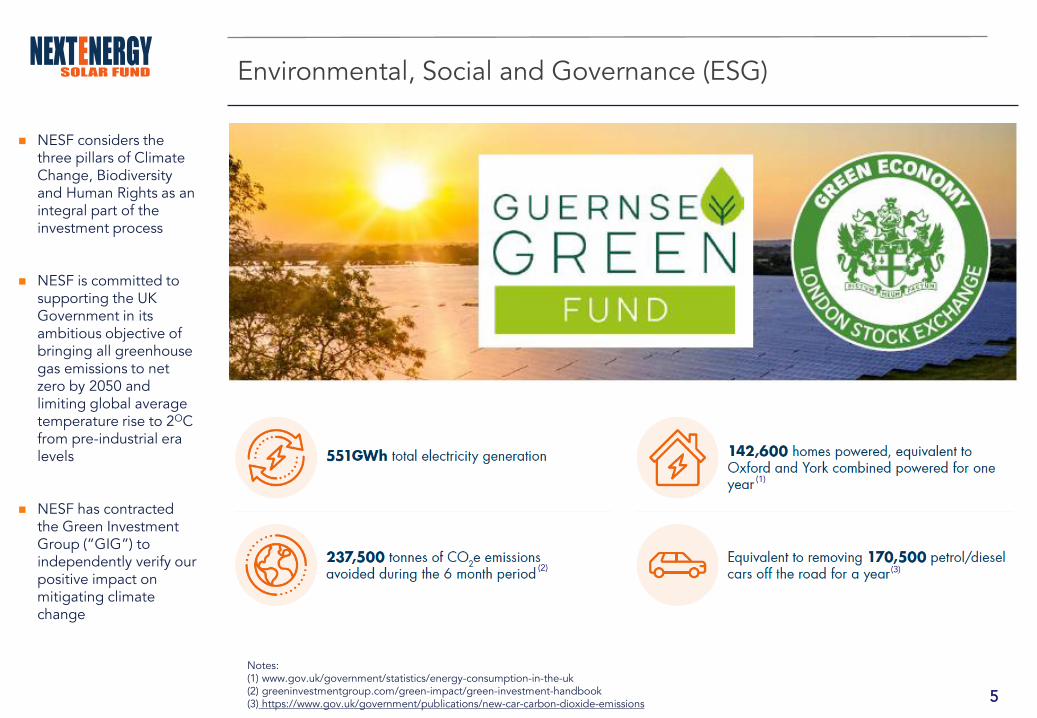
Operating Portfolio
◼ High Garrett, an 8.5MW extension to the 5MW ROC asset known as Kentishes acquired in 2016, was energised post the period end on 22 October 2020
◼ We are currently seeking to identify value creating opportunities in OECD countries in line with the amended Investment Policy to maximise shareholder returns and increase diversification
7
Continuous Operating Outperformance
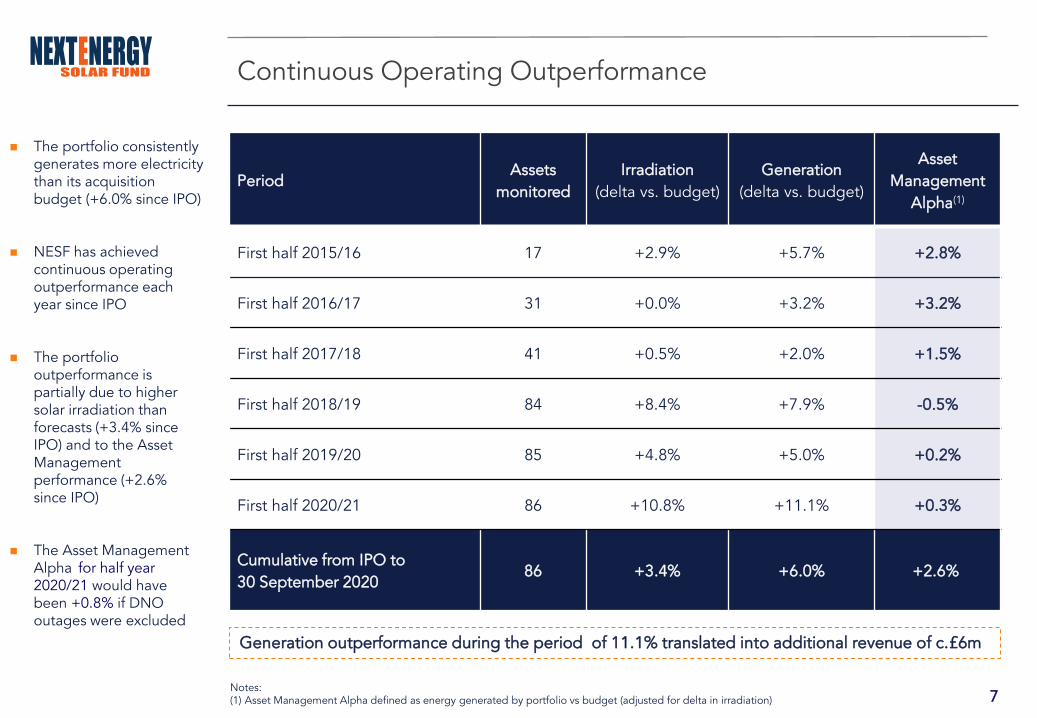
◼ The portfolio consistently generates more electricity than its acquisition budget (+6.0% since IPO)
◼ NESF has achieved continuous operating outperformance each year since IPO
◼ The portfolio outperformance is partially due to higher solar irradiation than forecasts (+3.4% since IPO) and to the Asset Management performance (+2.6% since IPO)
◼ The Asset Management Alpha for half year 2020/21 would have been +0.8% if DNO outages were excluded
Notes: (1) Asset Management Alpha defined as energy generated by portfolio vs budget (adjusted for delta in irradiation)
Generation outperformance during the period of 11.1% translated into additional revenue of c.£6m
PeriodAssets
monitored
Irradiation
(delta vs. budget)
Generation
(delta vs. budget)
Asset
Management
Alpha(1)
First half 2015/16 17 +2.9% +5.7% +2.8%
First half 2016/17 31 +0.0% +3.2% +3.2%
First half 2017/18 41 +0.5% +2.0% +1.5%
First half 2018/19 84 +8.4% +7.9% -0.5%
First half 2019/20 85 +4.8% +5.0% +0.2%
First half 2020/21 86 +10.8% +11.1% +0.3%
Cumulative from IPO to
30 September 202086 +3.4% +6.0% +2.6%

8
Historical Power Prices (12-month)
Historical UK Power Prices (£/MWh) (1)
(1) Source: N2EX – UK Baseload – day ahead(2) Source: Gestore del Mercato Elettrico S.p.A
◼ The Company’s flexible PPA framework locked in additional revenues of £5.4m from power price contract fixes vs baseload prices during the period
◼ UK power prices were declining into March 2020 as a result of lower gas prices and milder weather patterns
◼ In March 2020, the “oil price war” between the USA, Saudi Arabia and Russia and the first effects of the COVID-19 pandemic further impacted prices
◼ Power prices for the three forward seasons have picked up significantly from their lows in May 2020
Historical Italian Power Prices (€/MWh) (2)
9
Hedges from 1 July 2020 vs Forward Curve
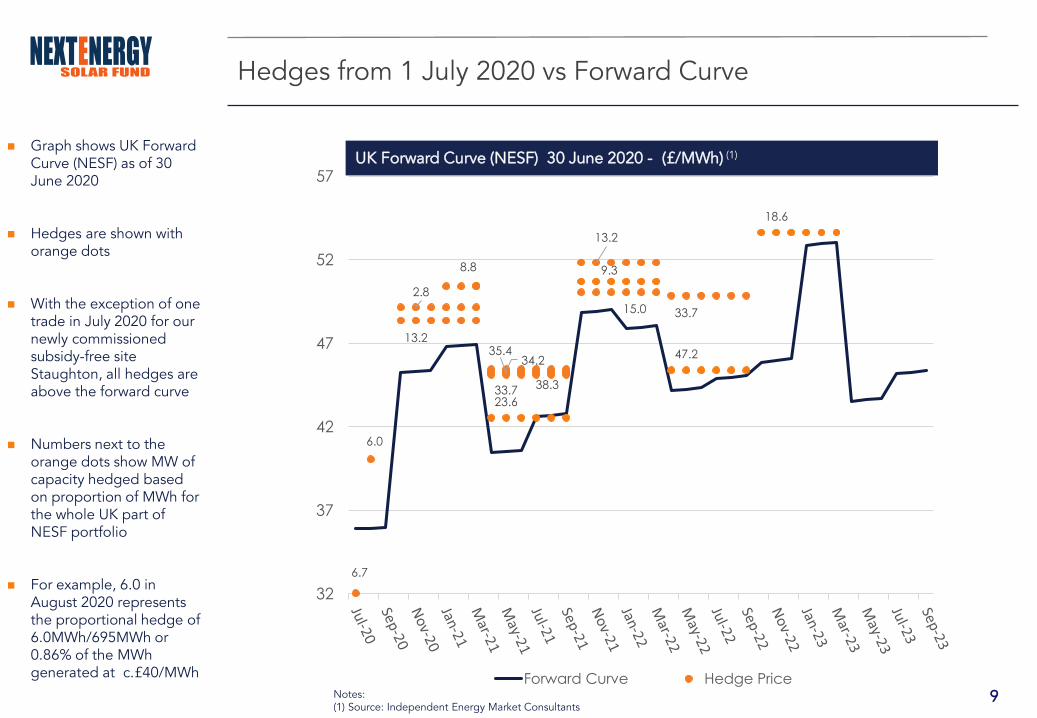
◼ Graph shows UK Forward Curve (NESF) as of 30 June 2020
◼ Hedges are shown with orange dots
◼ With the exception of one trade in July 2020 for our newly commissioned subsidy-free site Staughton, all hedges are above the forward curve
◼ Numbers next to the orange dots show MW of capacity hedged based on proportion of MWh for the whole UK part of NESF portfolio
◼ For example, 6.0 in August 2020 represents the proportional hedge of 6.0MWh/695MWh or 0.86% of the MWh generated at c.£40/MWh
6.7
6.0
8.8
38.3
15.0
2.8
34.2
23.6
9.3
47.2
18.6
13.2
33.7
13.2
33.7
35.4
32
37
42
47
52
57
Forward Curve Hedge Price
UK Forward Curve (NESF) 30 June 2020 - (£/MWh) (1)
Notes: (1) Source: Independent Energy Market Consultants
10
UK Forecast Power Prices (Real 2020)
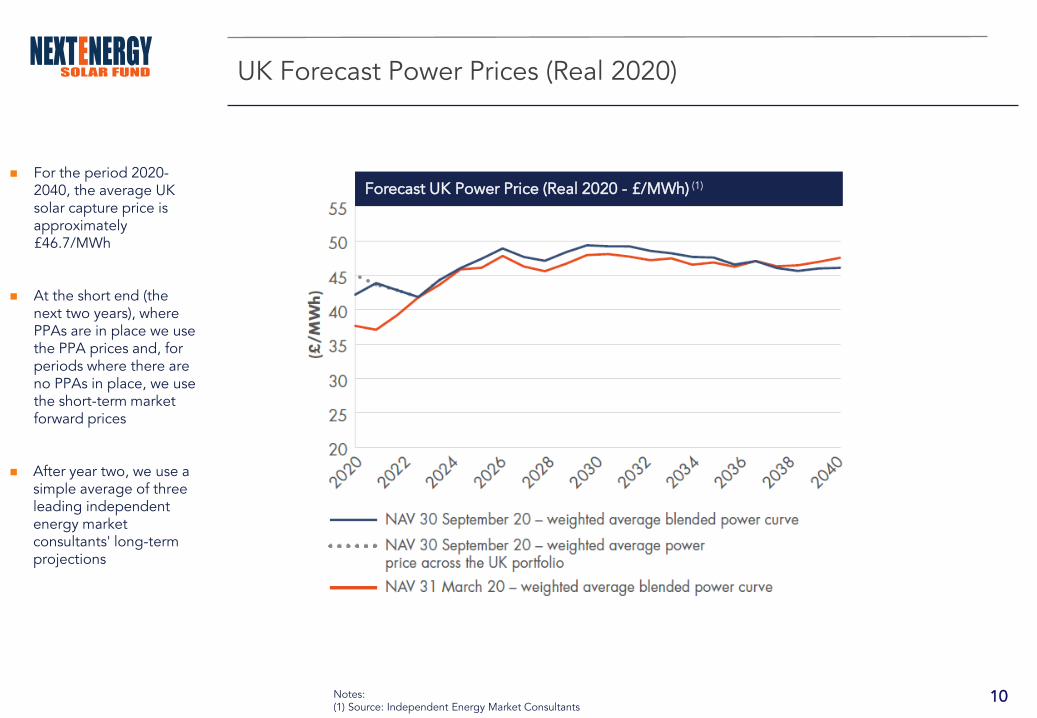
Notes: (1) Source: Independent Energy Market Consultants
◼ For the period 2020-2040, the average UK solar capture price is approximately £46.7/MWh
◼ At the short end (the next two years), where PPAs are in place we use the PPA prices and, for periods where there are no PPAs in place, we use the short-term market forward prices
◼ After year two, we use a simple average of three leading independent energy market consultants' long-term projections
Forecast UK Power Price (Real 2020 - £/MWh) (1)
11
Italy Forecast Power Prices (Real 2020)
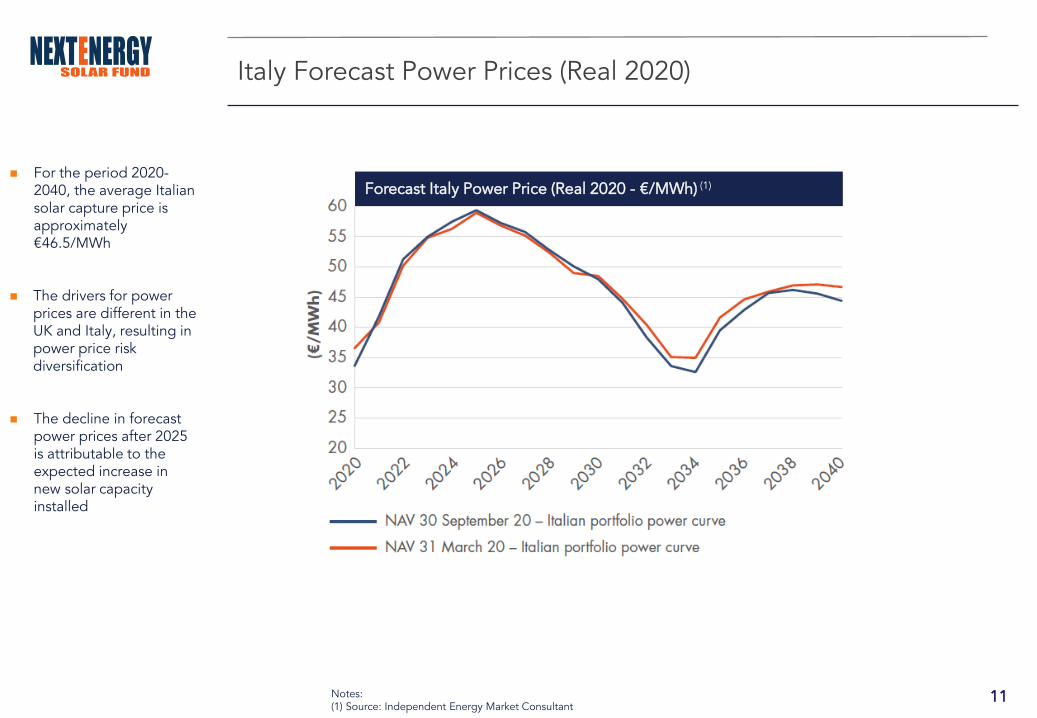
Notes: (1) Source: Independent Energy Market Consultant
◼ For the period 2020-2040, the average Italian solar capture price is approximately €46.5/MWh
◼ The drivers for power prices are different in the UK and Italy, resulting in power price risk diversification
◼ The decline in forecast power prices after 2025 is attributable to the expected increase in new solar capacity installed
Forecast Italy Power Price (Real 2020 - €/MWh) (1)
12
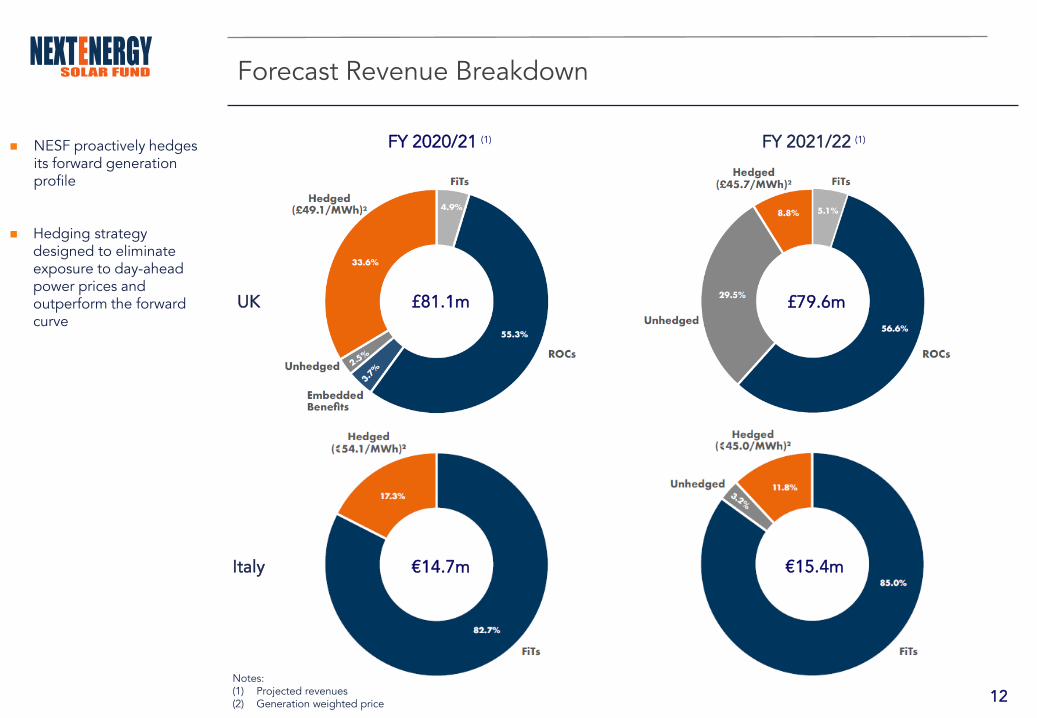
Forecast Revenue Breakdown
◼ NESF proactively hedges its forward generation profile
◼ Hedging strategy designed to eliminate exposure to day-ahead power prices and outperform the forward curve
UK
Italy
FY 2020/21 (1) FY 2021/22 (1)
Notes: (1) Projected revenues (2) Generation weighted price
€15.4m€14.7m
£81.1m £79.6m

13
Subsidy-free Asset Strategy
◼ NESF is targeting a subsidy-free portfolio of c.150MW
◼ The Anglian Water (43MW) projects have similar characteristics to subsidised assets and are therefore not included in the 150MW subsidy-free strategy
◼ The Company will consider divesting those subsidy-free project rights that are in excess of the current target of 150MW or that based on current assumptions would be unable to generate financial returns in line with the Company’s target
◼ Strensham and Llanwerndevelopment projects were disposed of in May 2020
◼ As at 30 September 2020 NESF has energised 55MW of subsidy-free assets (Hall Farm II andStaughton Airfield)
◼ Including High Garrett (8.5MW), which was energised on 22 October 2020, the total is 64MW
◼ The Company has sourced a further development pipeline of projects, significantly greater than itstarget of 150MW
◼ Such pipeline will provide a broad set of investment options from which NESF can select the mostattractive projects to construct and form part of its portfolio
High Garrett (8.5MW)
Hall Farm II (5.4MW) Staughton (50.0MW)

14
Optimise revenues and reduce operating expenses
Target a total of 150MW in subsidy-free solar plants
Strategic Focus 2020/21
❑ Investment Policy amended to allow up to 30% of GAV outside UK, significant value-adding opportunities currently being considered in attractive international markets
❑ NESF is best placed to deliver this strategy through its Operating Asset Manager - WiseEnergy
1
❑ Exploring corporate PPAs and direct-wire agreements to maximise revenue, and reduce power price risk
Focus on progressing our electricity sales strategy
2
Increase internationalisation
3
❑ Building upon our experience with Hall Farm II (5MW), Staughton (50MW) and High Garrett (8.5MW)
4
Extend the life of the remaining sites
❑ 35 assets have secured life extensions. A further 9 sites are targeted for FY2020/21
5

Hall Farm II (5.4MW)Leicestershire Energised August 2019
Financial Highlights
16
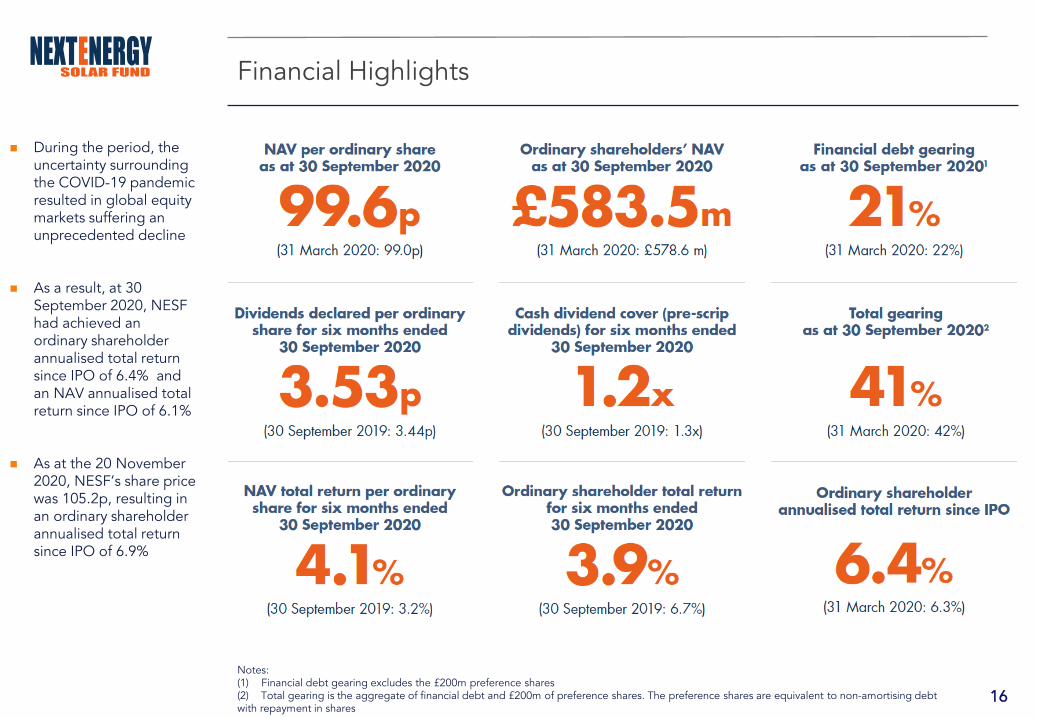
Financial Highlights
◼ During the period, the uncertainty surrounding the COVID-19 pandemic resulted in global equity markets suffering an unprecedented decline
◼ As a result, at 30 September 2020, NESF had achieved an ordinary shareholder annualised total return since IPO of 6.4% and an NAV annualised total return since IPO of 6.1%
◼ As at the 20 November 2020, NESF’s share price was 105.2p, resulting in an ordinary shareholder annualised total return since IPO of 6.9%
Notes: (1) Financial debt gearing excludes the £200m preference shares(2) Total gearing is the aggregate of financial debt and £200m of preference shares. The preference shares are equivalent to non-amortising debt with repayment in shares
17
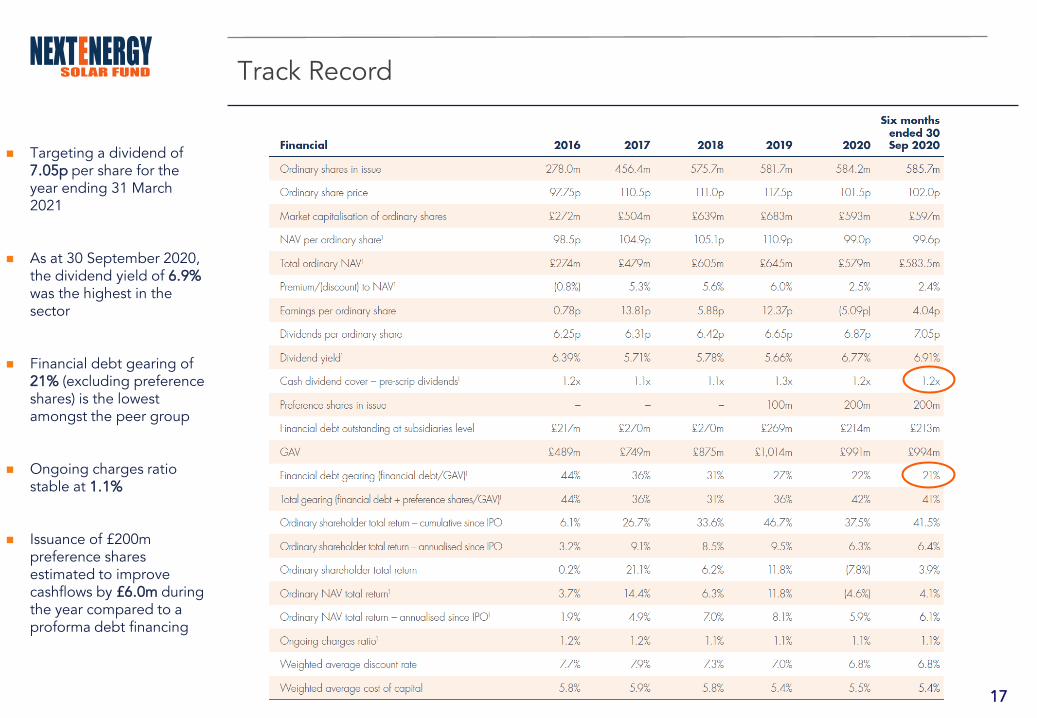
Track Record
◼ Targeting a dividend of 7.05p per share for the year ending 31 March 2021
◼ As at 30 September 2020, the dividend yield of 6.9% was the highest in the sector
◼ Financial debt gearing of 21% (excluding preference shares) is the lowest amongst the peer group
◼ Ongoing charges ratio stable at 1.1%
◼ Issuance of £200m preference shares estimated to improve cashflows by £6.0m during the year compared to a proforma debt financing

18
Valuation of Investment Portfolio
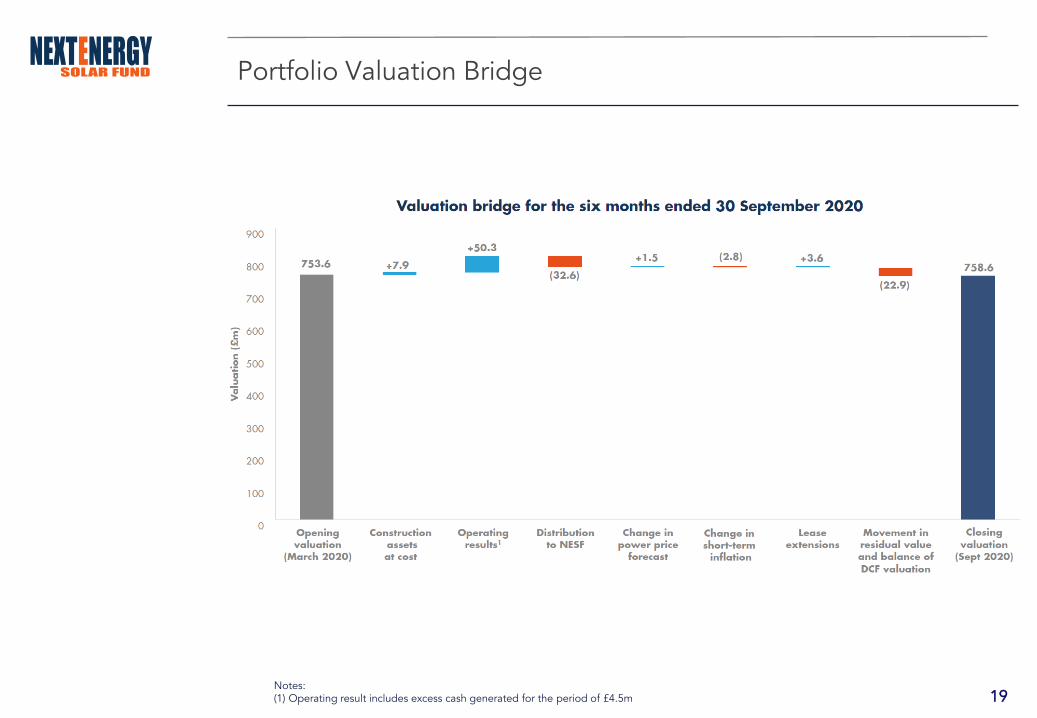
Valuation movements were driven by the following factors:
◼ The upward revisions in the UK forecasts for power prices provided by the three Consultants (31 March 2020: two Consultants), being 3.3% higher compared to the assumptions at 31 March 2020 (the Company uses the forecasts released by the Consultants up to the date of preparation of this Interim Report);
◼ The uplift arising from lease extensions;
◼ The operating results achieved by the Company’s solar assets;
◼ The downward revision of short-term inflation forecasts; and
◼ The cash dividends paid by the Company during the period and the Company’s operating costs.
Discount rates
◼ 6.25% unlevered discount rate for UK operating assets
◼ Levered discount rates of up to 7.25% (up to 1.0% risk premium)
◼ 7.75% unlevered discount rate for Italian operating assets implying 1.5% country risk premium
◼ 7.25% unlevered discount rate for subsidy-free operating assets implying 1.0% risk premium
◼ 1.0% risk premium for cash flows after 30 years where leases have been extended
◼ Weighted average discount rate of 6.8%
◼ Weighed average cost of capital of 5.4%
19
Portfolio Valuation Bridge
Notes: (1) Operating result includes excess cash generated for the period of £4.5m
20
NAV Bridge

21
Robust Dividend Cover
Notes:
(1) Cash income differs from the Income in the Statement of Comprehensive Income. This is because the Statement of Comprehensive Income is on an accruals basis. (2) Alternative Performance Measure
Dividends per Ordinary Share (p)
◼ The Board has concluded its review of the Company’s dividend policy. To the extent the Board considers it appropriate, we will each year target increasingthe total annual dividend paid to shareholders
◼ In deciding the total annual dividend, the Board will take into account: projected future power prices and associated price hedges; inflation in our markets; historic and budgeted technical and operational performance of our portfolio; and the appropriate ratio of ordinary earnings and cash cover to proposed dividend payments
◼ Target dividend of 7.05p per share for the year ending 31 March 2021 remains unchanged
Six months ended 30 September 2020 £’000
Pre-scrip dividends£’000
Cash income for period1,2 32,490
Net operating expenses for period (3,299)
Preference shares dividend (4,750)
Net cash income available for distribution 24,441
Ordinary shares dividend paid during period 20,344
Cash dividend cover2 1.2x
22
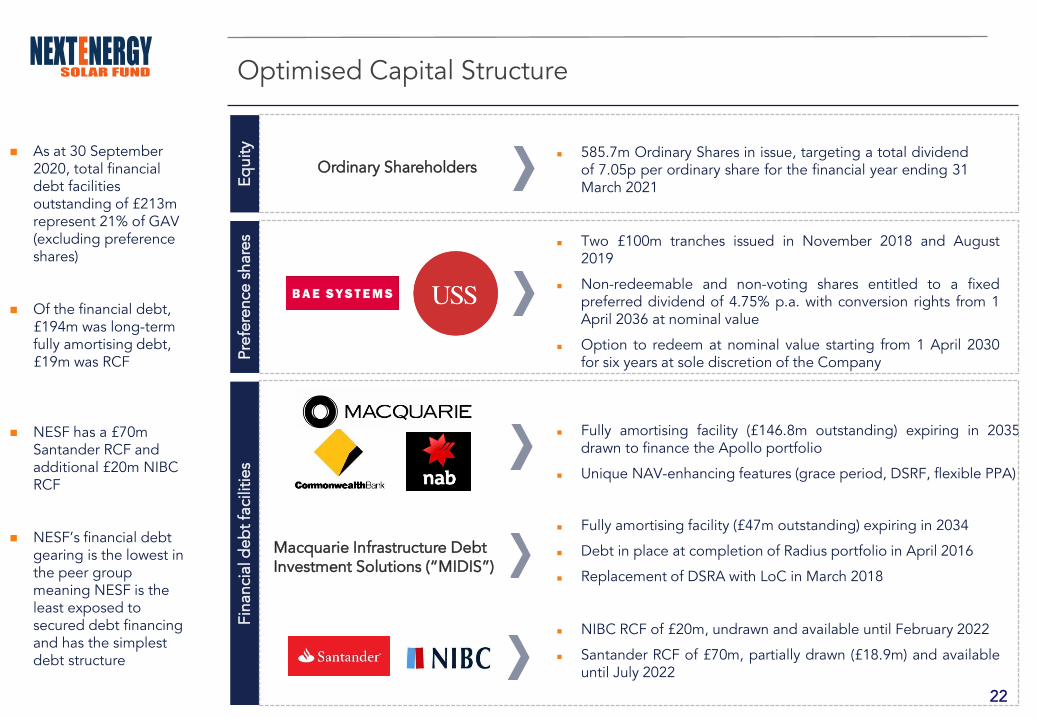
Optimised Capital Structure
Macquarie Infrastructure Debt Investment Solutions (“MIDIS”)
◼ Fully amortising facility (£47m outstanding) expiring in 2034
◼ Debt in place at completion of Radius portfolio in April 2016
◼ Replacement of DSRA with LoC in March 2018
◼ Fully amortising facility (£146.8m outstanding) expiring in 2035drawn to finance the Apollo portfolio
◼ Unique NAV-enhancing features (grace period, DSRF, flexible PPA)
◼ As at 30 September 2020, total financial debt facilities outstanding of £213m represent 21% of GAV (excluding preference shares)
◼ Of the financial debt, £194m was long-term fully amortising debt, £19m was RCF
◼ NESF has a £70m Santander RCF and additional £20m NIBC RCF
◼ NESF’s financial debt gearing is the lowest in the peer group meaning NESF is the least exposed to secured debt financing and has the simplest debt structure
◼ NIBC RCF of £20m, undrawn and available until February 2022
◼ Santander RCF of £70m, partially drawn (£18.9m) and availableuntil July 2022
Ordinary Shareholders ◼ 585.7m Ordinary Shares in issue, targeting a total dividend
of 7.05p per ordinary share for the financial year ending 31March 2021E
qu
ity
Fin
anci
al d
eb
t fa
cilit
ies
P
refe
rence
sh
ares
◼ Two £100m tranches issued in November 2018 and August2019
◼ Non-redeemable and non-voting shares entitled to a fixedpreferred dividend of 4.75% p.a. with conversion rights from 1April 2036 at nominal value
◼ Option to redeem at nominal value starting from 1 April 2030for six years at sole discretion of the Company
23
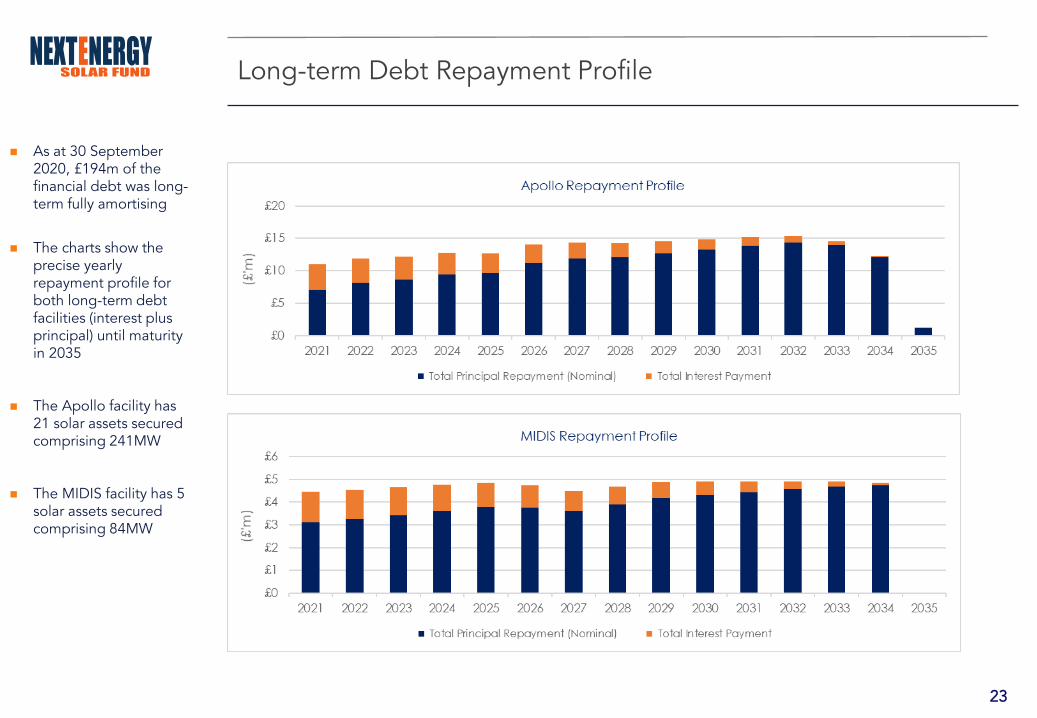
Long-term Debt Repayment Profile
◼ As at 30 September 2020, £194m of the financial debt was long-term fully amortising
◼ The charts show the precise yearly repayment profile for both long-term debt facilities (interest plus principal) until maturity in 2035
◼ The Apollo facility has 21 solar assets secured comprising 241MW
◼ The MIDIS facility has 5 solar assets secured comprising 84MW

Great Wilbraham (38MW)CambridgeshireEnergised March 2016
Q&A and Appendices
25
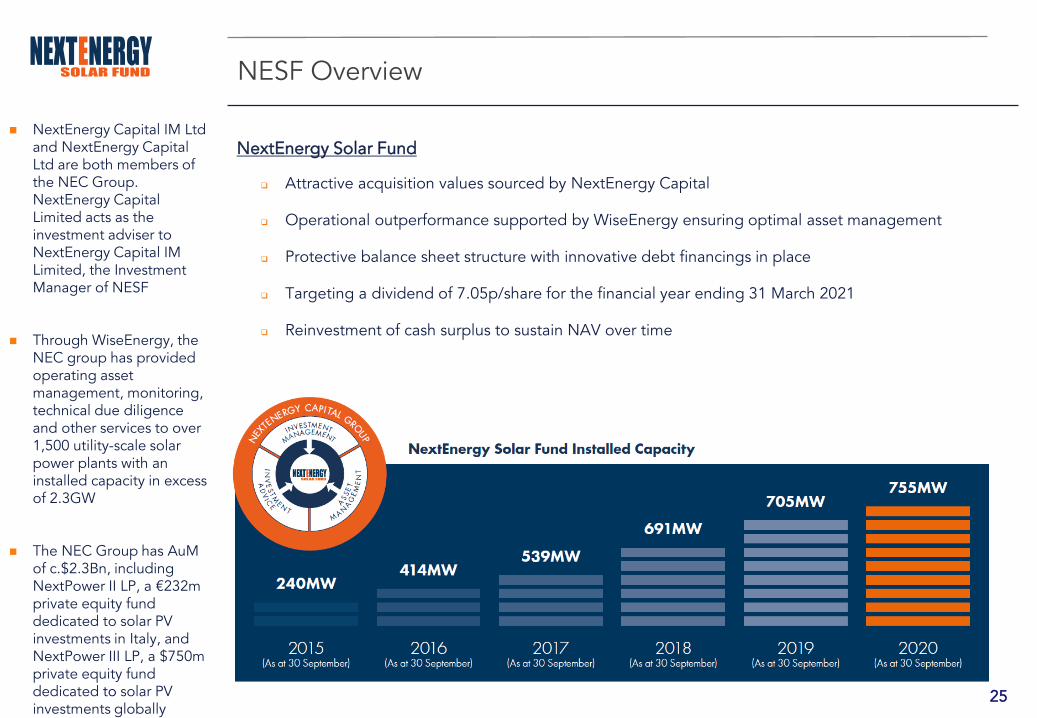
NextEnergy Solar Fund
❑ Attractive acquisition values sourced by NextEnergy Capital
❑ Operational outperformance supported by WiseEnergy ensuring optimal asset management
❑ Protective balance sheet structure with innovative debt financings in place
❑ Targeting a dividend of 7.05p/share for the financial year ending 31 March 2021
❑ Reinvestment of cash surplus to sustain NAV over time
NESF Overview
◼ NextEnergy Capital IM Ltd and NextEnergy Capital Ltd are both members of the NEC Group. NextEnergy Capital Limited acts as the investment adviser to NextEnergy Capital IM Limited, the Investment Manager of NESF
◼ Through WiseEnergy, the NEC group has provided operating asset management, monitoring, technical due diligence and other services to over 1,500 utility-scale solar power plants with an installed capacity in excess of 2.3GW
◼ The NEC Group has AuMof c.$2.3Bn, including NextPower II LP, a €232m private equity fund dedicated to solar PV investments in Italy, and NextPower III LP, a $750m private equity fund dedicated to solar PV investments globally
26
Ongoing COVID-19 Response
▪ The emergence of the COVID-19 pandemic in early 2020 presented an unprecedented operational challenge to NESF and its stakeholders
▪ In these extraordinary times, the NESF Board will continue to monitor closely the impacts of COVID-19 on the UK and Italian economies, and the effect they may have on the Company and its assets
▪ The Investment Adviser acted rapidly and migrated its global workforce to remote working and established a ‘COVID-19 Response Plan’
▪ They continue to monitor closely the impact of COVID-19 in the UK and Italy and will continue to work with the Board and the Company’s other key service providers and suppliers to anticipate and mitigate, where possible, arising risks
▪ The Asset Manager engaged with key portfolio operational counterparties to assess operational, financial and health and safety risks
▪ Plans put in place to minimise the risk of operational disruption due to O&M response capabilities or supply-chain problems
▪ Power price impact mitigated by short-term price fixing arrangements already in place
KEY SERVICE PROVIDERS and
SUPPLIERS
▪ The Company’s other key service providers and suppliers have also enabled their business continuity plans and continue to provide contracted services on a “business as usual” basis in all material respects
▪ The Asset Manager and Investment Adviser remain in close contact with them and continuously monitor and review their ability to perform in light of COVID-19 developments
27
Solis Portfolio
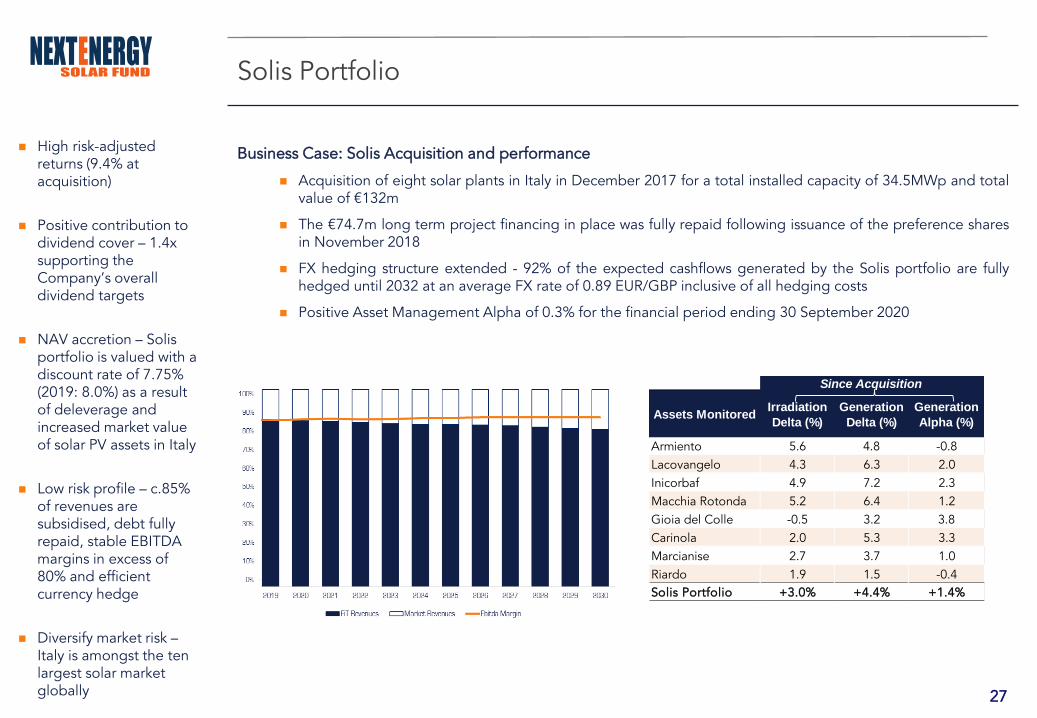
◼ High risk-adjusted returns (9.4% at acquisition)
◼ Positive contribution to dividend cover – 1.4x supporting the Company’s overall dividend targets
◼ NAV accretion – Solis portfolio is valued with a discount rate of 7.75% (2019: 8.0%) as a result of deleverage and increased market value of solar PV assets in Italy
◼ Low risk profile – c.85% of revenues are subsidised, debt fully repaid, stable EBITDA margins in excess of 80% and efficient currency hedge
◼ Diversify market risk –Italy is amongst the ten largest solar market globally
Business Case: Solis Acquisition and performance
◼ Acquisition of eight solar plants in Italy in December 2017 for a total installed capacity of 34.5MWp and totalvalue of €132m
◼ The €74.7m long term project financing in place was fully repaid following issuance of the preference sharesin November 2018
◼ FX hedging structure extended - 92% of the expected cashflows generated by the Solis portfolio are fullyhedged until 2032 at an average FX rate of 0.89 EUR/GBP inclusive of all hedging costs
◼ Positive Asset Management Alpha of 0.3% for the financial period ending 30 September 2020
Assets Monitored Irradiation
Delta (%)
Generation
Delta (%)
Generation
Alpha (%)
Armiento 5.6 4.8 -0.8
Lacovangelo 4.3 6.3 2.0
Inicorbaf 4.9 7.2 2.3
Macchia Rotonda 5.2 6.4 1.2
Gioia del Colle -0.5 3.2 3.8
Carinola 2.0 5.3 3.3
Marcianise 2.7 3.7 1.0
Riardo 1.9 1.5 -0.4
Solis Portfolio +3.0% +4.4% +1.4%
Since Acquisition
28
Biodiversity Overview
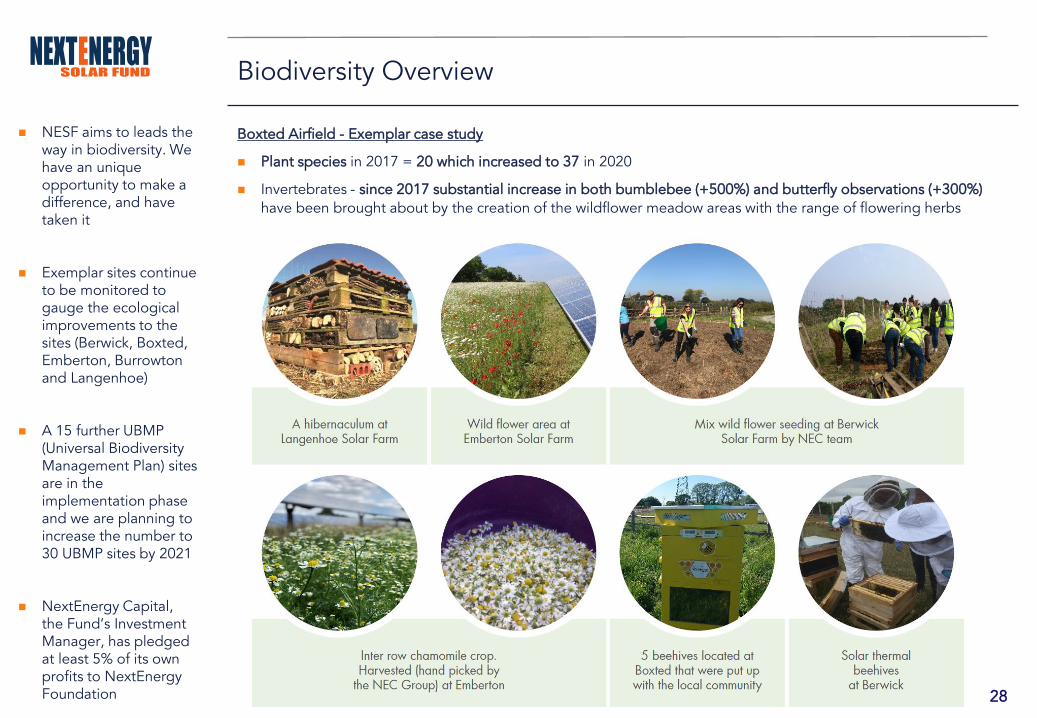
◼ NESF aims to leads the way in biodiversity. We have an unique opportunity to make a difference, and have taken it
◼ Exemplar sites continue to be monitored to gauge the ecological improvements to the sites (Berwick, Boxted, Emberton, Burrowtonand Langenhoe)
◼ A 15 further UBMP (Universal Biodiversity Management Plan) sites are in the implementation phase and we are planning to increase the number to 30 UBMP sites by 2021
◼ NextEnergy Capital, the Fund’s Investment Manager, has pledged at least 5% of its own profits to NextEnergy Foundation
Boxted Airfield - Exemplar case study
◼ Plant species in 2017 = 20 which increased to 37 in 2020
◼ Invertebrates - since 2017 substantial increase in both bumblebee (+500%) and butterfly observations (+300%) have been brought about by the creation of the wildflower meadow areas with the range of flowering herbs
29
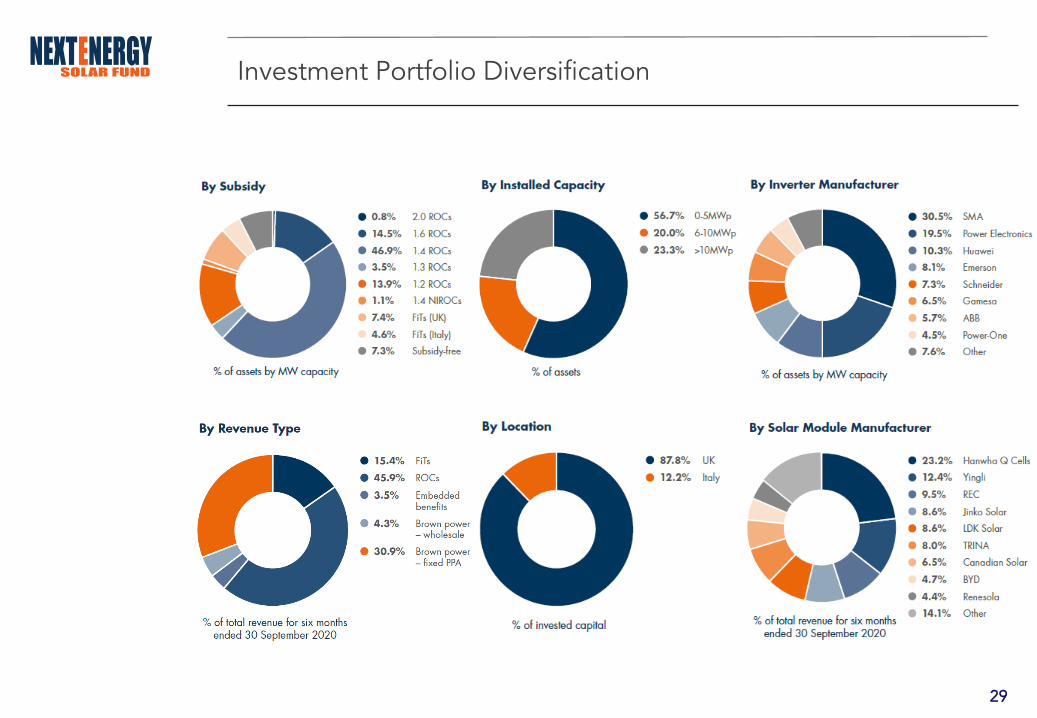
Investment Portfolio Diversification
30
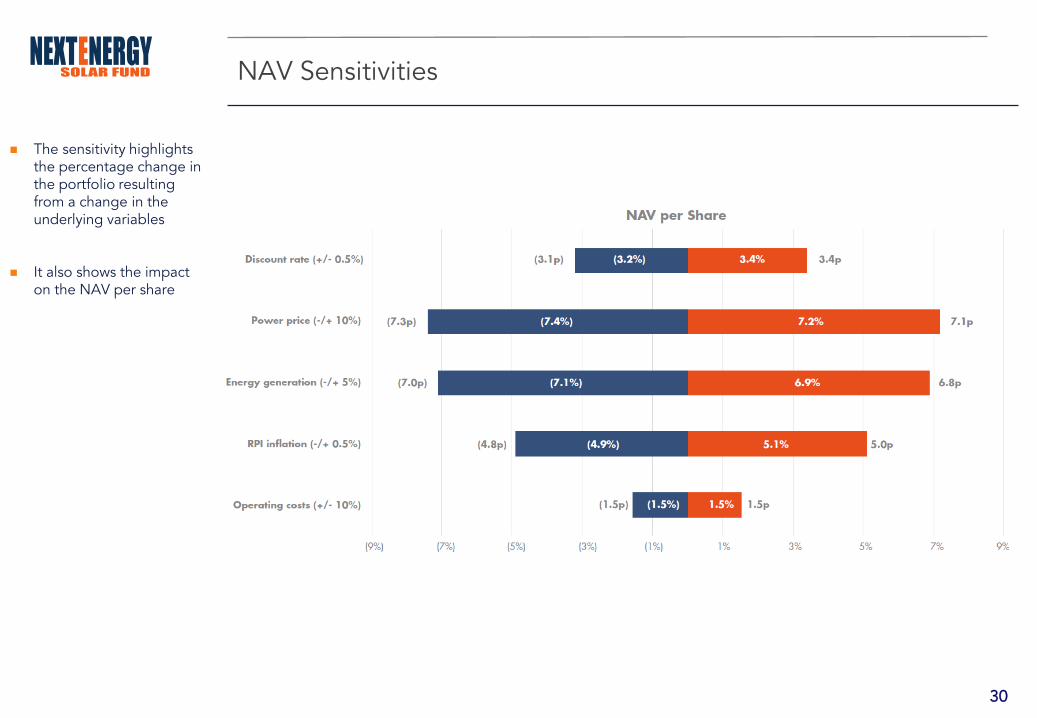
NAV Sensitivities
◼ The sensitivity highlights the percentage change in the portfolio resulting from a change in the underlying variables
◼ It also shows the impact on the NAV per share
31
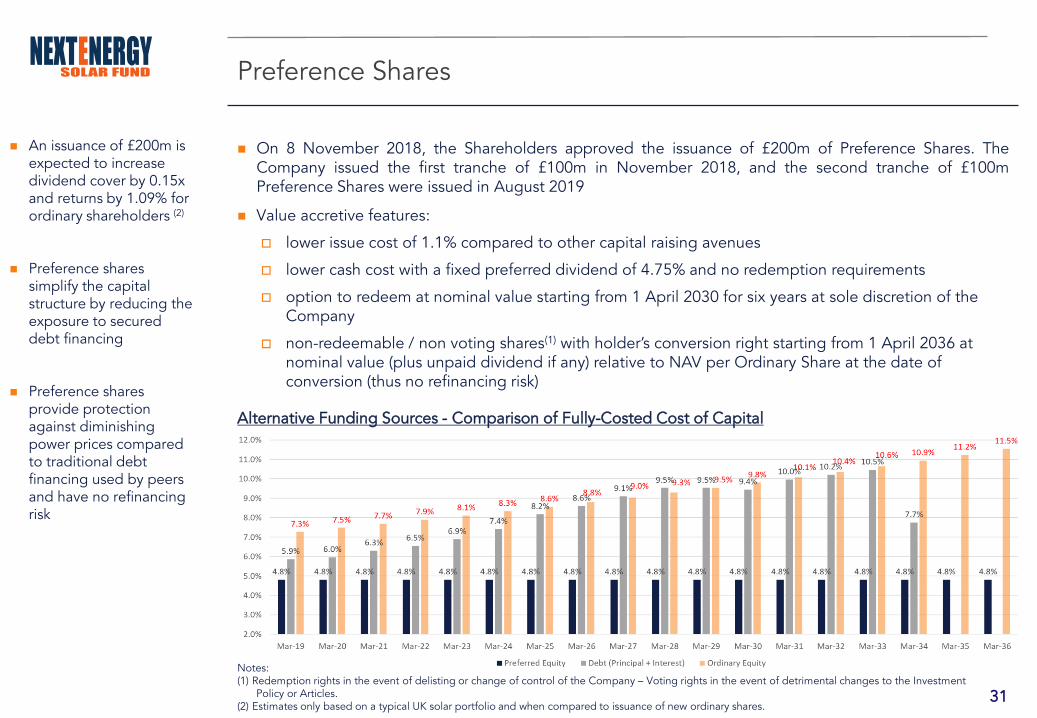
◼ On 8 November 2018, the Shareholders approved the issuance of £200m of Preference Shares. TheCompany issued the first tranche of £100m in November 2018, and the second tranche of £100mPreference Shares were issued in August 2019
◼ Value accretive features:
lower issue cost of 1.1% compared to other capital raising avenues
lower cash cost with a fixed preferred dividend of 4.75% and no redemption requirements
option to redeem at nominal value starting from 1 April 2030 for six years at sole discretion of the Company
non-redeemable / non voting shares(1) with holder’s conversion right starting from 1 April 2036 at nominal value (plus unpaid dividend if any) relative to NAV per Ordinary Share at the date of conversion (thus no refinancing risk)
Alternative Funding Sources - Comparison of Fully-Costed Cost of Capital
Preference Shares
◼ An issuance of £200m is expected to increase dividend cover by 0.15x and returns by 1.09% for ordinary shareholders (2)
◼ Preference shares simplify the capital structure by reducing the exposure to secured debt financing
◼ Preference shares provide protection against diminishing power prices compared to traditional debt financing used by peers and have no refinancing risk
Notes: (1) Redemption rights in the event of delisting or change of control of the Company – Voting rights in the event of detrimental changes to the Investment
Policy or Articles.(2) Estimates only based on a typical UK solar portfolio and when compared to issuance of new ordinary shares.

32
Summary of the Financial Debt outstanding
◼ Total debt outstanding at 30 September 2020 was £213m which represents a financial debt gearing of 21% (excluding £200m preference shares)
◼ The Santander RCF of £70m has been extended from July 2020 to July 2022
◼ Weighted average cost of debt is 3.1%
◼ NESH V entered into a 15 year FX hedging arrangement with Intesa over the expected dividends from the Solis portfolio. In March 2019, the hedging was increased to an additional c.€89m with an average forward exchange rate of 0.89 EUR/GBP including costs
Notes: 1) NESF has 325MW under long-term debt financing, 128MW under short-term debt financing and 302MW without debt financing2) LTV defined as ‘Debt outstanding / GAV’3) Long-term debt is fully amortised over the period secured assets receive subsidies (ROCs and others)4) Applicable rate represents the swap rate
33
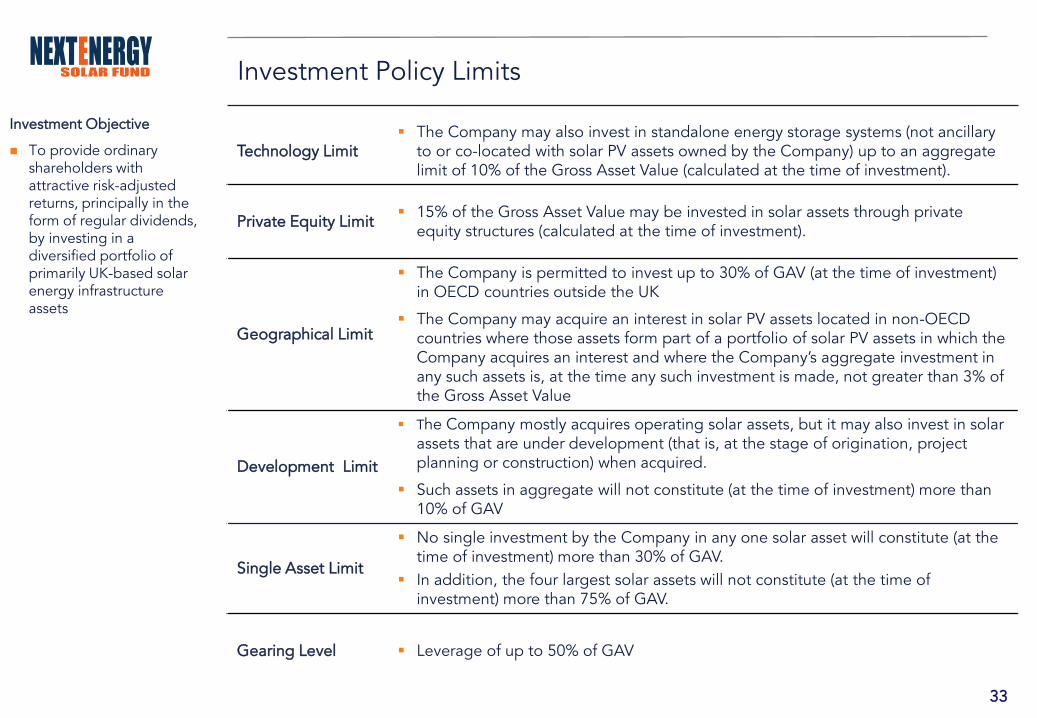
Investment Policy Limits
Technology Limit▪ The Company may also invest in standalone energy storage systems (not ancillary
to or co-located with solar PV assets owned by the Company) up to an aggregate limit of 10% of the Gross Asset Value (calculated at the time of investment).
Private Equity Limit ▪ 15% of the Gross Asset Value may be invested in solar assets through private
equity structures (calculated at the time of investment).
Geographical Limit
▪ The Company is permitted to invest up to 30% of GAV (at the time of investment) in OECD countries outside the UK
▪ The Company may acquire an interest in solar PV assets located in non-OECD countries where those assets form part of a portfolio of solar PV assets in which the Company acquires an interest and where the Company’s aggregate investment in any such assets is, at the time any such investment is made, not greater than 3% of the Gross Asset Value
Development Limit
▪ The Company mostly acquires operating solar assets, but it may also invest in solar assets that are under development (that is, at the stage of origination, project planning or construction) when acquired.
▪ Such assets in aggregate will not constitute (at the time of investment) more than 10% of GAV
Single Asset Limit
▪ No single investment by the Company in any one solar asset will constitute (at the time of investment) more than 30% of GAV.
▪ In addition, the four largest solar assets will not constitute (at the time of investment) more than 75% of GAV.
Gearing Level ▪ Leverage of up to 50% of GAV
Investment Objective
◼ To provide ordinary shareholders with attractive risk-adjusted returns, principally in the form of regular dividends, by investing in a diversified portfolio of primarily UK-based solar energy infrastructure assets

34
Important Notice
This document is issued by Next Energy Capital Limited (“NEC”), which is authorised and regulated by the UK Financial Conduct Authority (“FCA”) with registered number 471192. The contents of this document are strictly private andconfidential and accordingly may not be published, reproduced, copied ,transmitted or disclosed to any third party.
This document is an advertisement and not a prospectus. Investors should not purchase or subscribe for any transferable securities referred to in this document except on the basis of information in the prospectus dated 10 November 2014(and any supplement thereto) (the "Prospectus") published by NextEnergy Solar Fund Limited (the “Fund”) in connection with its placing programme to issue up to 250,000,000 ordinary shares ("Ordinary Shares") and/or C shares, which willbe admitted to the premium segment of the Official List of the Financial Conduct Authority (the "Official List") and to trading on London Stock Exchange plc's main market for listed securities (the "London Stock Exchange"), (together,“Admission”). A copy of the Prospectus is available from the Fund's website. This document is not an offer to sell, or a solicitation of an offer to acquire, securities in the United States or in any other jurisdiction. Neither this document nor anypart of it shall form the basis of or be relied on in connection with or act as an inducement to enter into any contract or commitment whatsoever.
The information contained in this document has been prepared in good faith but it is subject to updating, amendment, verification and completion. This document and any terms used herein are a broad outline of the Fund only and arefurnished on a confidential basis for the purpose of evaluating a potential investment in the Fund. This document is designed solely to assist exploratory discussions with a limited number of potential investors. Recipients of this documentwho intend to purchase or subscribe for shares in the Fund are reminded that any purchase or subscription must be made solely on the basis of the information contained in the Prospectus.
None of the Fund, NEC, Cenkos Securities, Shore Capital and Corporate Limited or Shore Capital Stockbrokers Limited or any of their respective directors, officers, employees, agents or advisers or any other person makes anyrepresentation, warranty or undertaking express or implied, as to the accuracy of completeness of the contents of this document, which has been prepared for background purposes. In particular, but without prejudice to the generality of theforegoing, past performance is no guarantee of and may not be indicative for future results and no representation or warranty is given as to the achievement or reasonableness of, and no reliance should be placed on, any assumptions,targets, forecasts, projections, estimates or prospects with regard to the anticipated future performance of the Fund or any other information herein. No responsibility or liability is accepted by any such person for the occurring orcompleteness of the contents of the document or for any errors, misstatements or omissions herein. The exclusion set out in this paragraph do not extent to an exclusion of liability for, or remedy in respect of, fraudulent misrepresentation.
The Fund is incorporated in Guernsey, Channel Islands and is a registered closed-ended investment scheme under the Protection of Investors (Bailiwick of Guernsey) Law, 1987, and the Registered Collective Investment Scheme Rules 2008.The Fund is not an Authorised Person under the UK Financial Services and Markets Act 2000 (“FSMA”) and, accordingly, will not be registered with the FCA. The Fund will therefore only be suitable for professional or experienced investors, orthose who have taken financial advice. Regulatory requirements which may be deemed necessary for the protection of retail or inexperienced investors do not apply to listed funds. By investing in the Fund you will be deemed to beacknowledging that you are a professional or experienced investor or have taken appropriate professional advice and accept the reduced requirements accordingly. You are wholly responsible for ensuring that all aspects of the Fund areacceptable to you. Investment in listed funds may involve special risks that could lead to a loss of all or a substantial portion of such investment. Unless you fully understand and accept the nature of the Fund and the potential risks associatedwith investing in it, you should not invest in the Fund.
An investment in the Fund will be suitable only for sophisticated investors who fully understand and are willing to accept high risks and lack of liquidity involved in the Fund's investment strategy. The Fund's investment practices, by theirnature, may be considered to involve a high degree of risk.
No information contained herein constitutes an offer, a solicitation or invitation to make an offer or recommendation, to acquire or dispose of interests in the Fund or other investment instruments, nor to effect any transaction, or to concludeany legal act of any kind whatsoever. Nothing contained herein constitutes financial, legal, tax, investment or other advice, nor should any investment or any other decisions be made solely based on the information set out herein.
The interests in and documents constituting the Fund are not the subject of any filing with, nor have the interests been approved or disapproved by, any governmental agency, regulatory authority or any national securities exchange.Accordingly, such interests in and documents constituting the Fund shall not be registered under the securities laws of any jurisdiction, other than as required to qualify for exemptions from supervision, registration, prospectus and reportingrequirements of such laws . The Fund and its management entity shall not be supervised, regulated or passed upon by any securities or investments regulatory body.
The information provided is confidential, for personal use and for informational purposes only, subject to changes without notice. It is not to be reproduced, duplicated, distributed, transmitted or used in whole or in part for any other purposeby any recipient hereof. Any recipient acting in the capacity of a discretionary investment manager must not distribute or transmit the whole or any part of this document to any of its clients or other third parties. Accordingly, no person hasbeen authorised to give any information or to make any statement regarding the Fund other than which is contained herein and, if given or made, such information or statement must not be relied upon as having been authorised.
The Fund has limited investment and trading history. Results can be positively or negatively affected by market conditions beyond the control of the Fund or any other person. The returns set out in this document are targets only. There is noguarantee that any returns set out in this document can be achieved or can be continued if achieved, nor that the Fund will make any distributions. There may be other additional risks, uncertainties and factors that could cause the returnsgenerated by the Fund to be materially lower than the returns set out in this document.
This document may include "forward-looking statements". All statements other than statements of historical facts included in this document, including, without limitation, those regarding the Fund's financial position, business strategy, plansand objectives of management for future operations (including development plans and objectives relating to the Fund's investments) are forward-looking statements. Forward-looking statements are subject to risks and uncertainties andaccordingly the Fund's actual future financial results and operational performance may differ materially from the results and performance expressed in, or implied by, the statements. These factors include but are not limited to thosedescribed in the Prospectus. These forward-looking statements speak only as at the date of this document. The Fund and NEC expressly disclaim any obligation or undertaking to update or revise any forward-looking statements containedherein to reflect actual results or any change in the assumptions, conditions or circumstances on which any such statements are based unless required to do so by FSMA, the Rules of the Financial Conduct Authority or other applicable laws,regulations or rules.