Oscillatory activity in the globus pallidus internus: Comparison between Parkinson’s disease and...
11
Author's personal copy Oscillatory activity in the globus pallidus internus: Comparison between Parkinson’s disease and dystonia Moran Weinberger a , William D. Hutchison a,b , Mahan Alavi a,b , Mojgan Hodaie b,c , Andres M. Lozano b,c , Elena Moro b,d , Jonathan O. Dostrovsky a,b,⇑ a Department of Physiology, University of Toronto, Toronto, ON, Canada b Toronto Western Research Institute, Toronto, ON, Canada c Division of Neurosurgery, Toronto Western Hospital, UHN, University of Toronto, Toronto, ON, Canada d Division of Neurology, Toronto Western Hospital, UHN, University of Toronto, Toronto, ON, Canada article info Article history: Accepted 4 July 2011 Available online 16 August 2011 Keywords: Basal ganglia GPi Microelectrode recordings Local field potential Oscillations highlights 30% of globus pallidus neurons in Parkinson’s disease patients have 11–30 Hz beta oscillatory activity. Globus pallidus firing is coherent with the local field potential (LFP) oscillatory activity in the beta range. In dystonia patients LFP and neuronal oscillatory activity frequency is 8–10 Hz and only 10% of neurons fire coherently. abstract Objective: Deep brain stimulation in the globus pallidus internus (GPi) is used to alleviate the motor symptoms of both Parkinson’s disease (PD) and dystonia. We tested the hypothesis that PD and dystonia are characterized by different temporal patterns of synchronized oscillations in the GPi, and that the dopaminergic loss in PD makes the basal ganglia more susceptible to oscillatory activity. Methods: Neuronal firing and local field potentials (LFPs) were simultaneously recorded from the GPi in four PD patients and seven dystonia patients using two independently driven microelectrodes. Results: In the PD patients, beta (11–30 Hz) oscillations were observed in the LFPs and the firing activity of 30% of the neurons was significantly coherent with the LFP. However, in the dystonia group, the peak frequency of LFP oscillations was lower (8–20 Hz) and there was a significantly smaller proportion of neurons (10%) firing in coherence with the LFP (P < 0.001). Conclusions: These findings suggest that synchronization of neuronal firing with LFP oscillations is a more prominent feature in PD than in dystonia. Significance: This study adds to the growing evidence that dopaminergic loss in PD may increase the sen- sitivity of the basal ganglia network to rhythmic oscillatory inputs. Ó 2011 International Federation of Clinical Neurophysiology. Published by Elsevier Ireland Ltd. All rights reserved. 1. Introduction Parkinson’s disease (PD) and dystonia are movement disorders associated with basal ganglia (BG) dysfunction. PD is a neurode- generative disorder, which is characterized by a severe loss of dopaminergic neurons in the substantia nigra pars compacta and motor symptoms such as rigidity and akinesia. Classical models of basal ganglia function are based on discharge rates in the BG structures and predict that in PD, the dramatic decrease in dopa- mine concentration in the striatum results in an increased activity in the output nuclei, the globus pallidus internus (GPi) and sub- stantia nigra pars reticulata, and over-inhibition of the thalamocor- tical drive (Albin et al., 1989; DeLong, 1990). Conversely, dystonia, which is characterized by sustained co-contractions of agonist and antagonist muscles that lead to abnormal posture and involuntary movements, is suggested to result from decreased basal ganglia output that, in turn, leads to decreased inhibition of thalamic activ- ity and consequently to increased excitability of the motor cortex (Vitek, 2002). These predictions of the so-called ‘rate model’ have been gener- ally confirmed in animal models of PD (Miller and DeLong, 1987; 1388-2457/$36.00 Ó 2011 International Federation of Clinical Neurophysiology. Published by Elsevier Ireland Ltd. All rights reserved. doi:10.1016/j.clinph.2011.07.029 ⇑ Corresponding author. Address: Department of Physiology, Medical Sciences Building 3302, 1 King’s College Circle, University of Toronto, Toronto, ON, Canada M5S 1A8. Tel.: +1 416 978 5289; fax: +1 416 978 4940. E-mail address: [email protected] (J.O. Dostrovsky). Clinical Neurophysiology 123 (2012) 358–368 Contents lists available at ScienceDirect Clinical Neurophysiology journal homepage: www.elsevier.com/locate/clinph
Transcript of Oscillatory activity in the globus pallidus internus: Comparison between Parkinson’s disease and...
Author's personal copy
Oscillatory activity in the globus pallidus internus: Comparison betweenParkinson’s disease and dystonia
Moran Weinberger a, William D. Hutchison a,b, Mahan Alavi a,b, Mojgan Hodaie b,c, Andres M. Lozano b,c,Elena Moro b,d, Jonathan O. Dostrovsky a,b,⇑aDepartment of Physiology, University of Toronto, Toronto, ON, Canadab Toronto Western Research Institute, Toronto, ON, CanadacDivision of Neurosurgery, Toronto Western Hospital, UHN, University of Toronto, Toronto, ON, CanadadDivision of Neurology, Toronto Western Hospital, UHN, University of Toronto, Toronto, ON, Canada
a r t i c l e i n f o
Article history:Accepted 4 July 2011Available online 16 August 2011
Keywords:Basal gangliaGPiMicroelectrode recordingsLocal field potentialOscillations
h i g h l i g h t s
� 30% of globus pallidus neurons in Parkinson’s disease patients have 11–30 Hz beta oscillatory activity.� Globus pallidus firing is coherent with the local field potential (LFP) oscillatory activity in the betarange.� In dystonia patients LFP and neuronal oscillatory activity frequency is 8–10 Hz and only 10% of neuronsfire coherently.
a b s t r a c t
Objective: Deep brain stimulation in the globus pallidus internus (GPi) is used to alleviate the motorsymptoms of both Parkinson’s disease (PD) and dystonia. We tested the hypothesis that PD and dystoniaare characterized by different temporal patterns of synchronized oscillations in the GPi, and that thedopaminergic loss in PD makes the basal ganglia more susceptible to oscillatory activity.Methods: Neuronal firing and local field potentials (LFPs) were simultaneously recorded from the GPi infour PD patients and seven dystonia patients using two independently driven microelectrodes.Results: In the PD patients, beta (11–30 Hz) oscillations were observed in the LFPs and the firing activityof �30% of the neurons was significantly coherent with the LFP. However, in the dystonia group, the peakfrequency of LFP oscillations was lower (8–20 Hz) and there was a significantly smaller proportion ofneurons (�10%) firing in coherence with the LFP (P < 0.001).Conclusions: These findings suggest that synchronization of neuronal firing with LFP oscillations is a moreprominent feature in PD than in dystonia.Significance: This study adds to the growing evidence that dopaminergic loss in PD may increase the sen-sitivity of the basal ganglia network to rhythmic oscillatory inputs.� 2011 International Federation of Clinical Neurophysiology. Published by Elsevier Ireland Ltd. All rights
reserved.
1. Introduction
Parkinson’s disease (PD) and dystonia are movement disordersassociated with basal ganglia (BG) dysfunction. PD is a neurode-generative disorder, which is characterized by a severe loss ofdopaminergic neurons in the substantia nigra pars compacta andmotor symptoms such as rigidity and akinesia. Classical modelsof basal ganglia function are based on discharge rates in the BG
structures and predict that in PD, the dramatic decrease in dopa-mine concentration in the striatum results in an increased activityin the output nuclei, the globus pallidus internus (GPi) and sub-stantia nigra pars reticulata, and over-inhibition of the thalamocor-tical drive (Albin et al., 1989; DeLong, 1990). Conversely, dystonia,which is characterized by sustained co-contractions of agonist andantagonist muscles that lead to abnormal posture and involuntarymovements, is suggested to result from decreased basal gangliaoutput that, in turn, leads to decreased inhibition of thalamic activ-ity and consequently to increased excitability of the motor cortex(Vitek, 2002).
These predictions of the so-called ‘rate model’ have been gener-ally confirmed in animal models of PD (Miller and DeLong, 1987;
1388-2457/$36.00 � 2011 International Federation of Clinical Neurophysiology. Published by Elsevier Ireland Ltd. All rights reserved.doi:10.1016/j.clinph.2011.07.029
⇑ Corresponding author. Address: Department of Physiology, Medical SciencesBuilding 3302, 1 King’s College Circle, University of Toronto, Toronto, ON, CanadaM5S 1A8. Tel.: +1 416 978 5289; fax: +1 416 978 4940.
E-mail address: [email protected] (J.O. Dostrovsky).
Clinical Neurophysiology 123 (2012) 358–368
Contents lists available at ScienceDirect
Clinical Neurophysiology
journal homepage: www.elsevier .com/locate /c l inph
Author's personal copy
Filion and Tremblay, 1991; Boraud et al., 1998) and are alsosupported by most recording studies in humans undergoing func-tional neurosurgery as a treatment for PD or dystonia (Lenz et al.,1998; Merello et al., 2004; Starr et al., 2005; Tang et al., 2007).However, the predicted rate changes have not been found in allstudies (Bergman et al., 1994; Wichmann et al., 1999; Lenz et al.,1999; Raz et al., 2000; Hutchison et al., 2003; Pessiglione et al.,2005), and the model fails to explain the paradoxical improvementin the motor symptoms of both PD and dystonia by lesion or high-frequency stimulation in the GPi (Marsden and Obeso, 1994; Loz-ano et al., 1997; Lang et al., 1997; Lozano, 2001; Vidailhet et al.,2005). Instead, there is increasing evidence for changes in theactivity patterns of basal ganglia neurons, which are associatedwith various basal ganglia-related neurological disorders.
In PD, the incidence of neuronal bursting activity in the globuspallidus and subthalamic nucleus (STN) is increased (Filion andTremblay, 1991; Hutchison et al., 1994; Boraud et al., 1998), mostoften in the context of increased synchronous neuronal and localfield potential (LFP) oscillatory activity in both the STN and GPi(Bergman et al., 1994, 1998; Nini et al., 1995; Raz et al., 2000; Mag-nin et al., 2000; Brown et al., 2001; Levy et al., 2002a,b; Foffaniet al., 2005). It has been shown that the oscillatory dischargesand LFPs observed in PD patients are rapidly reversed by treatmentwith dopaminergic medication (Brown et al., 2001; Priori et al.,2002; Levy et al., 2002a), and are positively correlated with the pa-tients’ response to the medication (Weinberger et al., 2006; Rayet al., 2008), suggesting that these oscillations might be a direct ef-fect of dopamine deficiency.
Oscillatory activity in the GPi has also been observed in patientswith generalized or focal dystonia (Silberstein et al., 2003; Starret al., 2005; Chen et al., 2006a,b). Thus, the paradoxical ameliora-tion of motor disabilities in PD and dystonia by GPi lesion or deepbrain stimulation (DBS) might be explained if the different symp-toms are dependent on abnormal, but different, patterns of syn-chronized oscillations in the basal ganglia circuits, so thateliminating this activity by lesion or DBS results in symptomaticimprovement. Indeed, Silberstein et al. (2003) have shown thatPD and dystonia are characterized by different oscillatory patterns.The LFPs recorded from the DBS electrodes implanted in the GPi re-vealed that in PD the dominant frequency of oscillation is between11 and 30 Hz, known as the beta range, whereas in dystonia thepower of LFP beta oscillations is weaker and there is increasedoscillatory activity in lower frequencies (4–10 Hz). In contrast tobeta oscillatory activity which is related to rigidity and akinesia(Kuhn et al., 2006, 2008; Chen et al., 2007; Ray et al., 2008), the4–10 Hz oscillations have been implicated in dyskinesias (Silber-stein et al., 2003, 2005; Foffani et al., 2005; Alonso-Frech et al.,2006; Chen et al., 2006a).
In PD patients, beta activity in the GPi is mainly evident in theLFPs recorded from the macroelectrodes used for therapeutic high-frequency stimulation of this region (Brown et al., 2001; Prioriet al., 2002; Silberstein et al., 2003, 2005). Although synchronizedbeta oscillatory neuronal firing in the GPi has been previously re-ported (Levy et al., 2002b; Tang et al., 2007), the relationship be-tween neuronal firing and the LFP in GPi in PD patients remainsto be elucidated. Previous studies in STN of PD patients have dem-onstrated a close association between oscillatory neuronal firingand the LFP in the beta frequencies (Kuhn et al., 2005; Weinbergeret al., 2006; Moran et al., 2008). This phenomenon was hypothe-sized to result from a greater sensitivity of basal ganglia neuronsto oscillatory inputs in the dopamine depleted state (Magill et al.,2001; Sharott et al., 2005; Baufreton et al., 2005; Walters et al.,2007). This hypothesis can be examined in the GPi by comparingthe relationship between neuronal firing and LFPs in PD and dysto-nia. This comparison is possible since the GPi is widely targeted to
treat dystonia (Vidailhet et al., 2005) and in some cases, levodopa-induced dyskinesias in PD patients (Krack et al., 1998).
In the present study, we investigated the relationship betweenneuronal discharges and the oscillatory local field potentials in theGPi in both PD and dystonia patients. The degree of association be-tween neuronal firing and the LFP, as well as the predominant fre-quency of oscillations, was compared between PD and dystonia. Inaddition, we investigated the changes in GPi oscillatory activityduring levodopa-induced dyskinesias in PD.
2. Methods
2.1. Patients
We studied four PD patients undergoing stereotactic neurosur-gery for the implantation of DBS electrodes in the left GPi (2 pa-tients) or unilateral pallidotomy (2 patients). These four patientswere the only PD patients who have been implanted in the GPiwithin the last 9 years in our center, since the STN has been our tar-get of choice for PD. There were two women and two men who, atthe time of operation were 40, 62, 63 and 70 years old and had a PDduration of 8, 16, 11 and 27 years, respectively. In two of these fourpatients the GPi was targeted because they were considered subop-timal candidates for STNDBS due to some cognitive decline and dis-abling levodopa-induced dyskinesia as the most importantsymptom. The other two patients had previously undergone bilat-eral STN DBS with insufficient benefits. For comparison purposes,we also studied one male and six females with primary dystonia(generalized, segmental or cervical) with a mean age (±SD) of57.9 ± 10 years and disease duration of 20.5 ± 15 years. Six of thedystonia patients had bilateral and one had unilateral GPi surgeryfor DBS; one patient had had a previous left pallidotomy.
Apart from local anesthetics, no sedatives or anesthetics (suchas propofol) were administered during or before surgery. Pre-surgical clinical assessments of all patients were performed bymovement disorder specialists at the Toronto Western Hospital.PD patients were assessed according to the motor part of the Uni-fied Parkinson’s Disease Rating Scale (UPDRS) (Fahn et al., 1987)before and after an acute levodopa challenge, whereas cervical dys-tonia patients were evaluated according to the Toronto WesternSpasmodic Torticollis Rating Scale (TWSTRS) (Comella et al.,1997) and segmental or generalized dystonia patients were ratedwith the Burke–Fahn–Marsden Dystonia Rating Scale (Burkeet al., 1985). Demographic and clinical details of the patients are gi-ven in Table 1.
The studies were performed with approval of the UniversityHealth Network Ethical Review Board, University of Toronto. Pa-tients gave written and informed consent before surgery.
2.2. Recordings
The recording procedures to localize the posteroventral GPi dur-ing stereotactic neurosurgery have been previously described(Hutchison et al., 1994; Lozano et al., 1996, 1998). Briefly, parasag-ittal trajectories were oriented at 20 mm from the midline. Micro-electrode trajectories usually started 15 mm above target so thatthe recordings often began within the GPe. This would then be fol-lowed by the internal medullary lamina, which lies between theGPe and GPi. This in an area of white matter and is therefore iden-tified by a significant decrease in overall activity. Occasionally,peripallidal ‘border’ cells, characterized by a highly regular firingpattern and slower rate, were encountered within the lamina andborders of GPi. In both the PD and dystonia cases, entry into theGPi was marked by an overall increase in background noise andhigh frequency discharges. The bottom of the GPi was determined
M. Weinberger et al. / Clinical Neurophysiology 123 (2012) 358–368 359
Author's personal copy
based on white matter (no spiking activity, decreased backgroundnoise) and identification of the optic tract, which lies close to theventral border of the GPi. The optic tract could be identified bymicrostimulation to elicit visual percepts and/or by using a flash-ing strobe light to elicit a visual evoked response in the microelec-trode recording. Sometimes it could be identified also by axonalelectrical activity with narrow spikes or a subtle increase in highfrequency noise. Another important anatomical landmark wasthe internal capsule that could be identified by stimulation-evokedtetanic contractions of contralateral muscles.
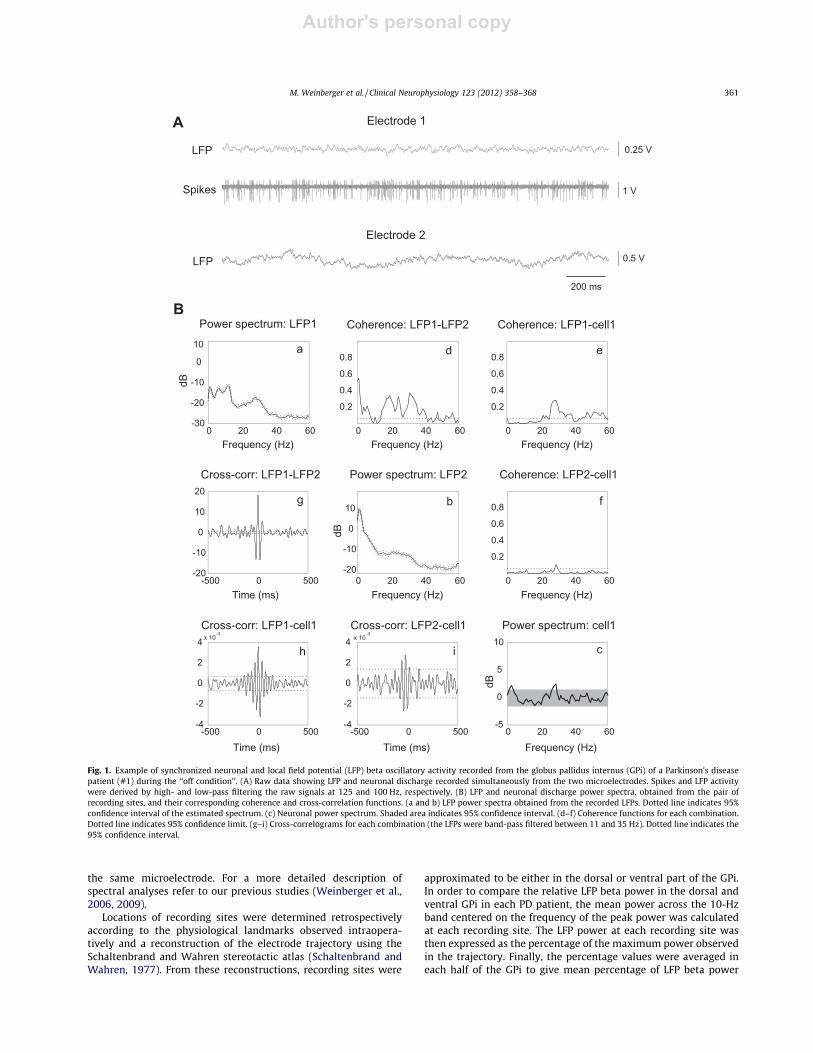
Monopolar extracellular recordings of neuronal firing and LFPswere obtained simultaneously using two independently driventungsten microelectrodes (about 25 lm tip length, axes 600 lmapart, �0.2-MX impedance at 1 kHz) as described previously (Levyet al., 2007). Recordings were amplified 5000–10,000 times and fil-tered at 10–5000 Hz (analog Butterworth filters: high-pass, onepole; low-pass, two poles; at 5 Hz amplitude was decreased byroughly 50%) using two Guideline System GS3000 (Axon Instru-ments, Union City, CA) amplifiers. During the recordings, signalswere monitored on a loudspeaker and displayed on a computerscreen. Recorded signals were digitized at 10 kHz and directlystored onto a computer hard drive with a CED 1401 data acquisi-tion system running Spike2 (Cambridge Electronic Design,Cambridge, UK). All recordings were performed in the resting statewhile the patients were awake and with local anesthesia. Patientswere not asked to perform any task and epochs with voluntarymovements were excluded. Limb movements were measuredusing electromyography (EMG) and/or triaxial accelerometers(with summated x–y–z signals) that were recorded simultaneouslywith the neuronal activity. An example of simultaneous GPirecordings of LFPs and neuronal discharge is shown in Fig. 1A.
The first PD patient (#1) was given 100 mg of levodopa (1 tabletof Sinemet�, levodopa/carbidopa 100/25) in the morning of sur-gery. Microelectrode recordings started approximately 2 h laterso that during the first trajectory, which lasted for about 1.5 h,the patient was in the ‘‘on condition’’ (i.e. less rigid and bradyki-netic when compared to ‘‘off condition’’) and displayed levodopa-induced dyskinesia (mostly in her right side of the body) almost
continuously during the recording session. During the secondmicroelectrode trajectory, which was performed at least 3.5 h afterthe last dose of levodopa, the effects of the medication were wear-ing-off and the patient presented with resting tremor, increasedrigidity and bradykinesia, and no-dyskinesia. This track was there-fore considered to be in the ‘‘off condition’’ state. The second PDpatient (#2) was given 100 mg of levodopa (1 tablet of Sinemet�)approximately 4 h before surgery to relieve the severity of heroff-dystonia. In this patient, only one microelectrode trajectorywas performed (see Table 1), during which the patient was rigidand bradykinetic and was therefore considered to be in the ‘‘offcondition’’. It should be noted that the ‘‘off condition’’ state of thesePD patients might differ from the practically-defined ‘‘off’’ state inwhich patients are withdrawn from their anti-Parkinsonian medi-cation for at least 12 h before surgery (also see Section 4.1). All thePD patients had one GPi trajectory each and were in the 12 h OFFmedication state. The seven dystonia patients were given anti-dystonic medications (usually benzodiazepines) prior to surgery.
2.3. Data analysis
Action potentials arising from single- or multi-units were dis-criminated using template-matching tools in Spike2 (CambridgeElectronic Design, Cambridge, UK). Only recordings P17 s(mean ± SD: 42 ± 25 s) that were obtained during periods withoutvoluntary movements (based on EMG and/or accelerometerrecordings and observations) or artifacts were analyzed. Bordercells were identified and excluded from the analyses. Spike timesand unfiltered LFP data were imported into MATLAB (version 7.1,The MathWorks, Natick, MA) and spectral analyses were per-formed. The frequency and power of oscillatory firing and LFPswere calculated using the discrete Fourier transform according toHalliday et al. (1995), and significant neuronal oscillations weredetected using shuffling of spike trains according to Rivlin-Etzionet al. (2006). In addition, coherence and cross-correlation analyses(Rosenberg et al., 1989; Halliday et al., 1995) were used to evaluatethe relationship between simultaneously recorded data fromseparate electrodes and between LFP and spike data recorded from
Table 1Demographic and clinical characteristics of the patients.
Patient # and disease Age(years)and sex
Diseaseduration(years)
Pre-op. motor scores:UPDRS on/off (PD)b
TWSTRS severity scaleor BFMDRS movementscale (dystonia)
Daily medications for themovement disorder
Side and number ofmicroelectrode trajectories withinGPi from which recordingsanalyzed
No. of GPineuronsanalyzed
% ofoscillatory/coherentneurons
1 – PD 70 F 27 34.5/80 Levodopa/carbidopa,amantadine, quetiapine,entacapone, lorazepam
L – on 17 12
L – off condition 31 422 – PDa 40 F 8 13.5/55.5 Levodopa/carbidopa,
pramipexole, amantidine,zoplicone
L – off condition 42 24
3 – PDa 62 M 16 22.5/56.5 Levodopa/carbidopa,pramipexole, clonazepam
L – off condition 8 3
4 – PD 63 M 11 19.5/41 Levodopa/carbidopa,amantadine, clozapine
L – off condition 13 8
5 – Generalizeddystonia
54 M 40 46 None R (�2) + L 36 19.5
6 – Segmental dystonia 57 F 11 23 None R + L 23 4.57 – Cervical dystonia 48 F 5 23 None R 15 08 – Cervical dystonia 73 F NA NA NA R + L 62 6.59 – Cervical dystonia 53 F 17 27 Trihexyphenydyl,
clonazepamR + L 50 8
10 – Cervical dystonia 50 F 8 24 Clonazepam, lorazepam R + L 71 15.511 – Cervical dystonia 70 F 40 28 Clonazepam R 16 12.5
NA – not available.a Patient had previous bilateral STN DBS.b Pre-operative UPDRS motor scores were assessed after 12-h anti-Parkinsonian medication withdrawal (the defined off) and 1 h after an acute levodopa challenge (on).
360 M. Weinberger et al. / Clinical Neurophysiology 123 (2012) 358–368
Author's personal copy
the same microelectrode. For a more detailed description ofspectral analyses refer to our previous studies (Weinberger et al.,2006, 2009).
Locations of recording sites were determined retrospectivelyaccording to the physiological landmarks observed intraopera-tively and a reconstruction of the electrode trajectory using theSchaltenbrand and Wahren stereotactic atlas (Schaltenbrand andWahren, 1977). From these reconstructions, recording sites were
approximated to be either in the dorsal or ventral part of the GPi.In order to compare the relative LFP beta power in the dorsal andventral GPi in each PD patient, the mean power across the 10-Hzband centered on the frequency of the peak power was calculatedat each recording site. The LFP power at each recording site wasthen expressed as the percentage of the maximum power observedin the trajectory. Finally, the percentage values were averaged ineach half of the GPi to give mean percentage of LFP beta power
0 20 40 60-30
-20
-10
0
10
Power spectrum: LFP1
Frequency (Hz) Frequency (Hz)Frequency (Hz)
dB
0 20 40 60
0.2
0.4
0.6
0.8
Coherence: LFP1-LFP2
-500 0 500-20
-10
0
10
20
Cross-corr: LFP1-LFP2
Time (ms)
0 20 40 60
0.2
0.4
0.6
0.8
Coherence: LFP1-cell1
-500 0 500-4
-2
0
2
4 x 10⁻³
Cross-corr: LFP1-cell1
Time (ms)
0 20 40 60-20
-10
0
10
Power spectrum: LFP2
Frequency (Hz) Frequency (Hz)
dB
0 20 40 60
0.2
0.4
0.6
0.8
Coherence: LFP2-cell1
-500 0 500-4
-2
0
2
4 x 10⁻³
Cross-corr: LFP2-cell1
Time (ms)
Power spectrum: cell1
Frequency (Hz)
dB
0 20 40 60-5
0
5
10
a
b
c
d
fg
h i
e
200 ms
Electrode 2
Electrode 1A
B
Spikes
LFP
LFP
1 V
0.25 V
0.5 V
Fig. 1. Example of synchronized neuronal and local field potential (LFP) beta oscillatory activity recorded from the globus pallidus internus (GPi) of a Parkinson’s diseasepatient (#1) during the ‘‘off condition’’. (A) Raw data showing LFP and neuronal discharge recorded simultaneously from the two microelectrodes. Spikes and LFP activitywere derived by high- and low-pass filtering the raw signals at 125 and 100 Hz, respectively. (B) LFP and neuronal discharge power spectra, obtained from the pair ofrecording sites, and their corresponding coherence and cross-correlation functions. (a and b) LFP power spectra obtained from the recorded LFPs. Dotted line indicates 95%confidence interval of the estimated spectrum. (c) Neuronal power spectrum. Shaded area indicates 95% confidence interval. (d–f) Coherence functions for each combination.Dotted line indicates 95% confidence limit. (g–i) Cross-correlograms for each combination (the LFPs were band-pass filtered between 11 and 35 Hz). Dotted line indicates the95% confidence interval.
M. Weinberger et al. / Clinical Neurophysiology 123 (2012) 358–368 361
Author's personal copy
in the dorsal and ventral GPi. This method of measuring LFP powerchanges in basal ganglia nuclei was used previously (Kuhn et al.,2005; Weinberger et al., 2006).
3. Results
We analyzed recordings from 94 GPi neurons along four tracksin the four PD patients in the ‘‘off condition’’, and from 273 neuronsalong 13 tracks in the seven dystonia patients. The mean recordingdurations (±SD) were 45.9 ± 23.6 and 42.7 ± 27.2 s, respectively (nostatistical difference). In addition, 17 neurons were recorded intrack 1 of PD patient #1 when the patient was in the ‘‘on condition’’and the findings are reported separately below. The number ofneurons and microelectrode trajectories that were analyzed ineach patient are given in Table 1.
3.1. Firing rates of GPi neurons
The mean firing rate (±SD) of GPi neurons recorded from PD pa-tients in the ‘‘off condition’’ was 81.9 ± 40.7 Hz. In the dystoniagroup, the mean firing rate was 61.2 ± 30.6 Hz and was signifi-cantly lower than that from PD patients (P 6 0.001, Mann–Whitneyrank-sum test on the medians: 58.3 and 74.6 Hz, respectively).
3.2. Coherence between neuronal firing and oscillatory LFPs in PDpatients
In the PD patients, beta (11–30 Hz) oscillatory activity was ob-served in the LFPs recorded from the GPi, and there was significantcoherence between pairs of LFPs in 44 out of 52 sites (�85%) whereLFPs were recorded simultaneously from the two microelectrodes.Fig. 2 shows reconstructions of the electrode tracks in patients #1and #2 and the locations of the oscillatory and non-oscillatory neu-rons. Of the 94 neurons recorded in the PD patients, the firing of 32(�34%) neurons was significantly coherent with the simulta-neously recorded LFP at the beta frequencies. The frequency ofpeak coherence ranged between 15 and 30 Hz with a mean of24.5 ± 4.2 Hz. Ten of these neurons were coherent with the LFPs re-corded from both microelectrodes, whereas 18 neurons werecoherent only with the LFP recorded from the same electrode.The remaining four neurons were coherent only with the LFP re-corded from the other electrode. Fig. 1 shows an example of spec-tral analysis of simultaneous recordings of neuronal firing and LFPactivity, in which significant coherence in the beta range wasobserved.
Interestingly, although 34% of the neurons displayed significantcoherence with the LFP, significant oscillatory firing was only ob-served in 12 (14%) neurons, of which 10 were coherent with the
PD patient 2
PD patient 1
-2
0
2
4
6
8
10
12
-4
14
Outside GPiGPi uncorrelated GPi correlated
0
20
40
60
80
100
DorsalGPi
VentralGPi
% M
ax b
eta
pow
er P = 0.4
0
20
40
60
80
100
% M
ax b
eta
pow
er
P =< 0.001
DorsalGPi
VentralGPi
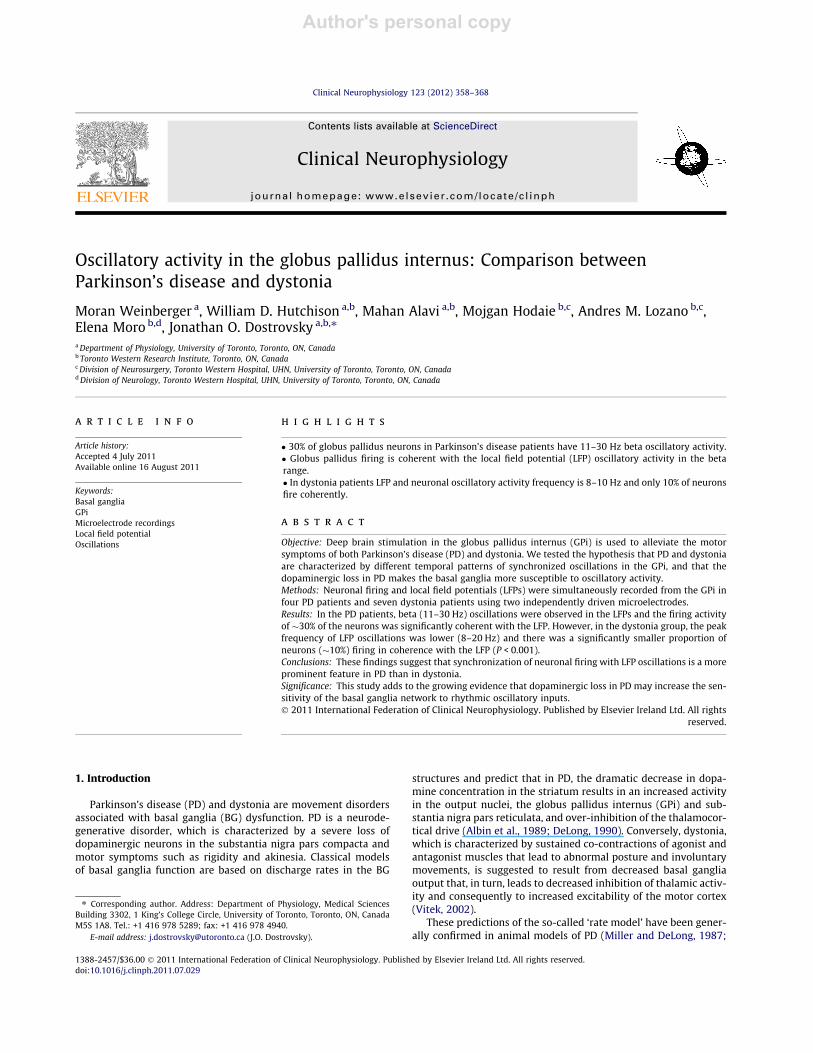
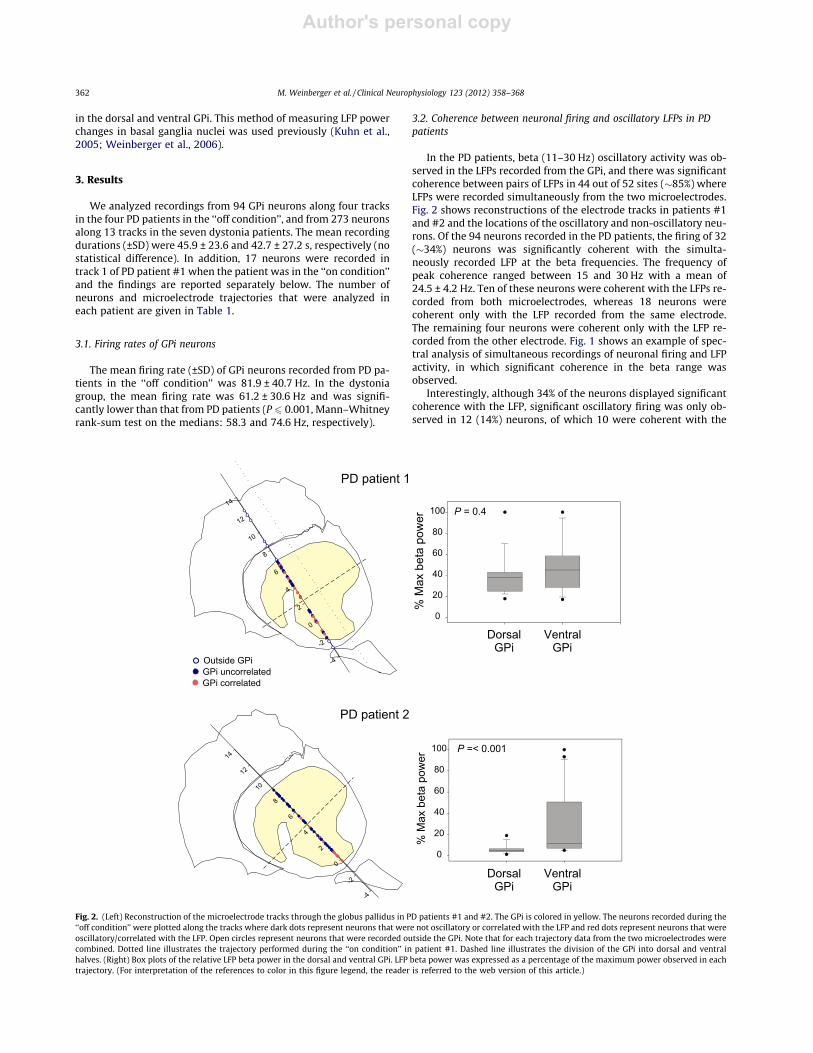
Fig. 2. (Left) Reconstruction of the microelectrode tracks through the globus pallidus in PD patients #1 and #2. The GPi is colored in yellow. The neurons recorded during the‘‘off condition’’ were plotted along the tracks where dark dots represent neurons that were not oscillatory or correlated with the LFP and red dots represent neurons that wereoscillatory/correlated with the LFP. Open circles represent neurons that were recorded outside the GPi. Note that for each trajectory data from the two microelectrodes werecombined. Dotted line illustrates the trajectory performed during the ‘‘on condition’’ in patient #1. Dashed line illustrates the division of the GPi into dorsal and ventralhalves. (Right) Box plots of the relative LFP beta power in the dorsal and ventral GPi. LFP beta power was expressed as a percentage of the maximum power observed in eachtrajectory. (For interpretation of the references to color in this figure legend, the reader is referred to the web version of this article.)
362 M. Weinberger et al. / Clinical Neurophysiology 123 (2012) 358–368
Author's personal copy
LFP (see Fig. 1B for an example). The mean frequency of neuronaloscillations was 24.0 ± 5.7 Hz, and this was similar to the mean fre-quency of coherence with the LFP (P = 0.95, Mann–Whitney rank-sum test). Coherence between simultaneously recorded neuronswas observed in only 5 out of 49 pairs.
3.3. Distribution of coherent neurons in dorsal and ventral regions ofthe GPi in PD
Table 2 shows the numbers of oscillatory/coherent neurons indorsal and ventral regions of the GPi for each of the PD patients.In 3 of the 4 patients the percentage of coherent neurons washigher in the ventral GPi however only in patient #2 (Fig. 2, rightpanel) was this difference significant, and although the meanpercentage of coherent neurons was higher ventrally (45% vs28%) this was not significant. The beta LFP power was notsignificantly different between the dorsal and ventral GPi exceptin patient #2 (medians: 4.7 and 11.4, respectively; P 6 0.001,rank-sum test).
3.4. Neurons are less correlated to oscillatory LFPs in dystonia patients
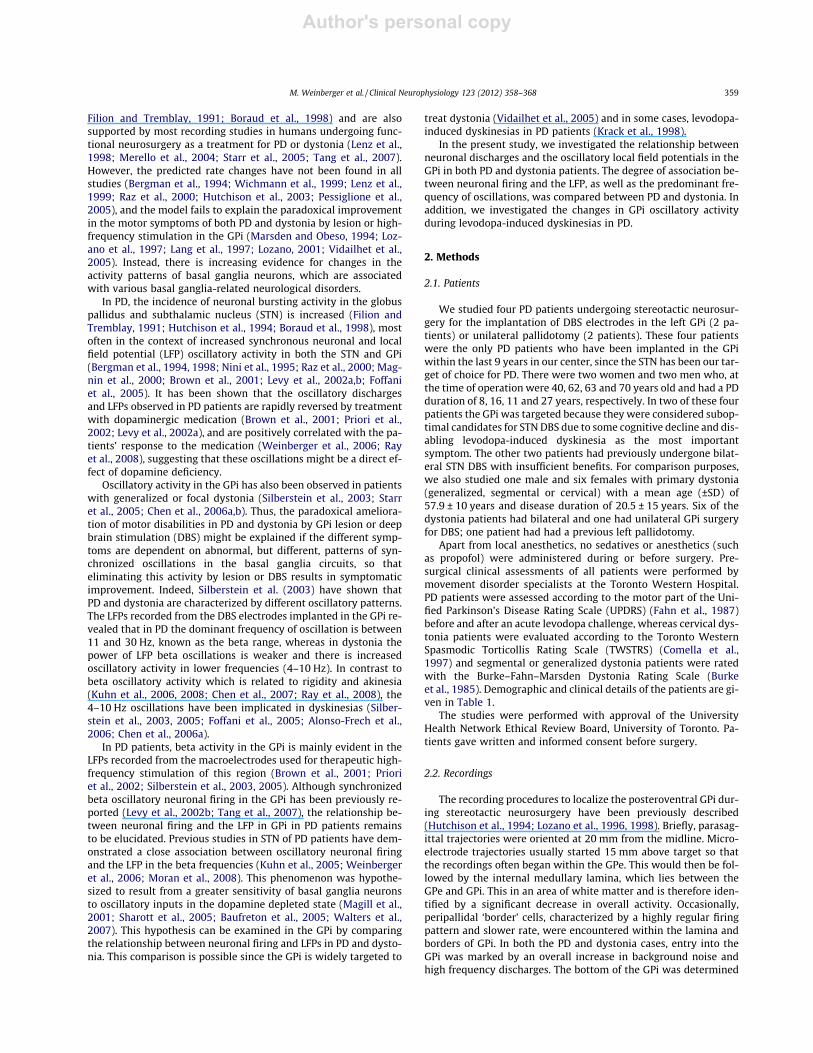
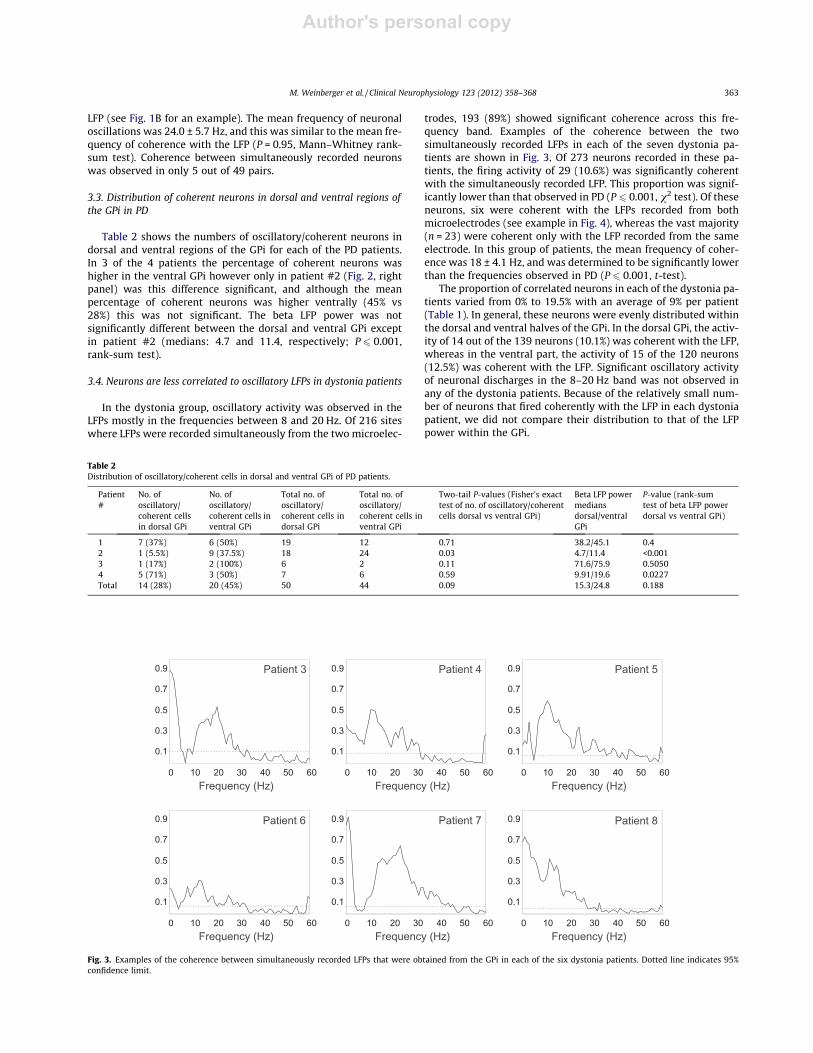
In the dystonia group, oscillatory activity was observed in theLFPs mostly in the frequencies between 8 and 20 Hz. Of 216 siteswhere LFPs were recorded simultaneously from the two microelec-
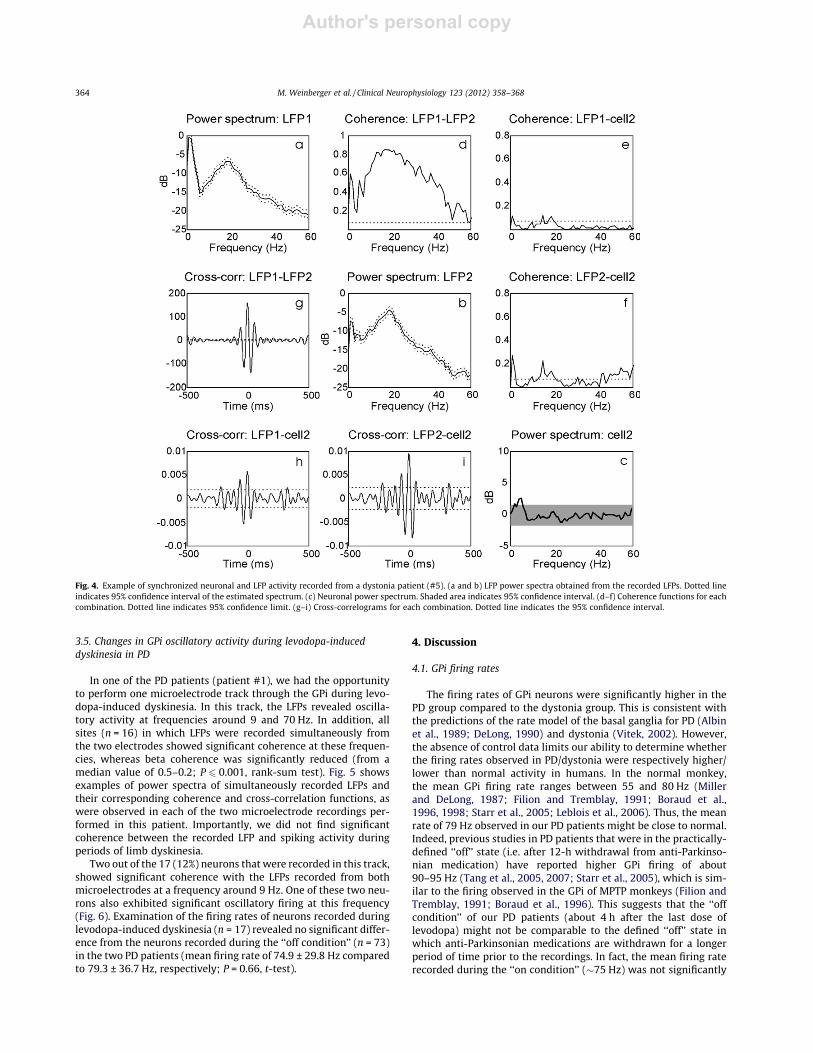
trodes, 193 (89%) showed significant coherence across this fre-quency band. Examples of the coherence between the twosimultaneously recorded LFPs in each of the seven dystonia pa-tients are shown in Fig. 3. Of 273 neurons recorded in these pa-tients, the firing activity of 29 (10.6%) was significantly coherentwith the simultaneously recorded LFP. This proportion was signif-icantly lower than that observed in PD (P 6 0.001, v2 test). Of theseneurons, six were coherent with the LFPs recorded from bothmicroelectrodes (see example in Fig. 4), whereas the vast majority(n = 23) were coherent only with the LFP recorded from the sameelectrode. In this group of patients, the mean frequency of coher-ence was 18 ± 4.1 Hz, and was determined to be significantly lowerthan the frequencies observed in PD (P 6 0.001, t-test).
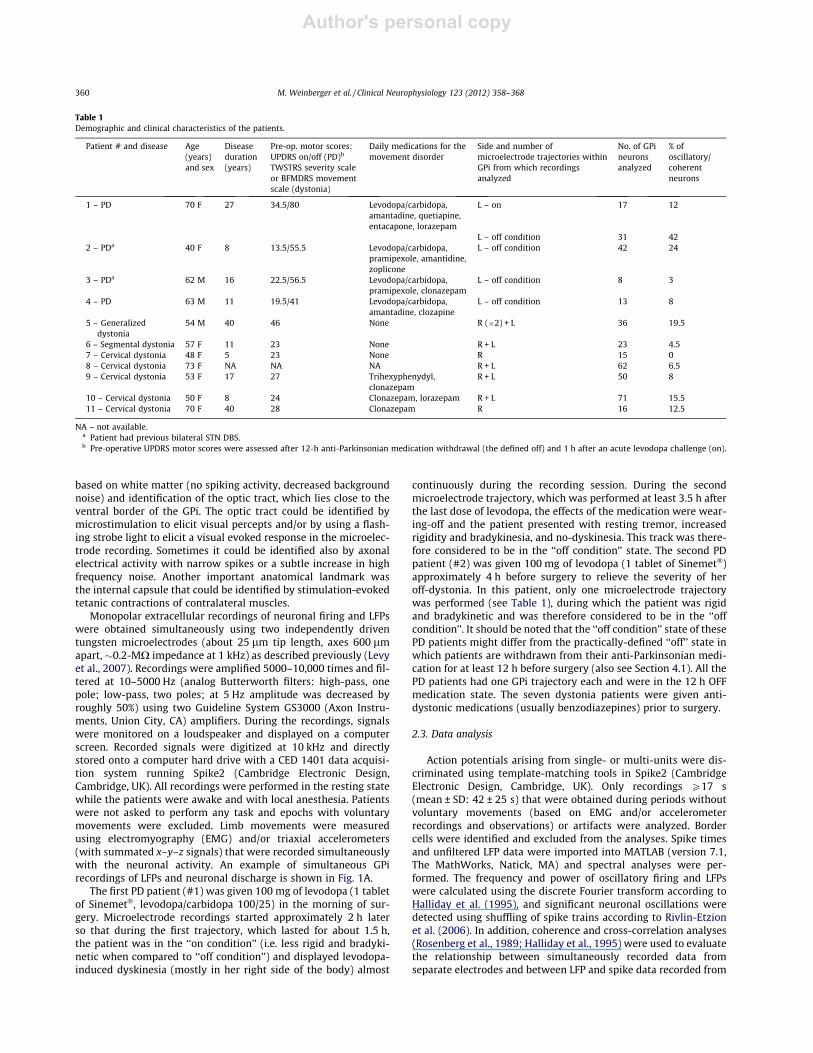
The proportion of correlated neurons in each of the dystonia pa-tients varied from 0% to 19.5% with an average of 9% per patient(Table 1). In general, these neurons were evenly distributed withinthe dorsal and ventral halves of the GPi. In the dorsal GPi, the activ-ity of 14 out of the 139 neurons (10.1%) was coherent with the LFP,whereas in the ventral part, the activity of 15 of the 120 neurons(12.5%) was coherent with the LFP. Significant oscillatory activityof neuronal discharges in the 8–20 Hz band was not observed inany of the dystonia patients. Because of the relatively small num-ber of neurons that fired coherently with the LFP in each dystoniapatient, we did not compare their distribution to that of the LFPpower within the GPi.
Table 2Distribution of oscillatory/coherent cells in dorsal and ventral GPi of PD patients.
Patient#
No. ofoscillatory/coherent cellsin dorsal GPi
No. ofoscillatory/coherent cells inventral GPi
Total no. ofoscillatory/coherent cells indorsal GPi
Total no. ofoscillatory/coherent cells inventral GPi
Two-tail P-values (Fisher’s exacttest of no. of oscillatory/coherentcells dorsal vs ventral GPi)
Beta LFP powermediansdorsal/ventralGPi
P-value (rank-sumtest of beta LFP powerdorsal vs ventral GPi)
1 7 (37%) 6 (50%) 19 12 0.71 38.2/45.1 0.42 1 (5.5%) 9 (37.5%) 18 24 0.03 4.7/11.4 <0.0013 1 (17%) 2 (100%) 6 2 0.11 71.6/75.9 0.50504 5 (71%) 3 (50%) 7 6 0.59 9.91/19.6 0.0227Total 14 (28%) 20 (45%) 50 44 0.09 15.3/24.8 0.188
0 10 20 30 40 50 60
0.1
0.3
0.5
0.7
0.9
0 10 20 30 40 50 60
0.1
0.3
0.5
0.7
0.9
0 10 20 30 40 50 60
0.1
0.3
0.5
0.7
0.9
0 10 20 30 40 50 60
0.1
0.3
0.5
0.7
0.9
0 10 20 30 40 50 60
0.1
0.3
0.5
0.7
0.9
0 10 20 30 40 50 60
0.1
0.3
0.5
0.7
0.9
Frequency (Hz)
Frequency (Hz)
Frequency (Hz)
Frequency (Hz)Frequency (Hz)
Frequency (Hz)
Patient 3 Patient 5Patient 4
Patient 6 Patient 7 Patient 8
Fig. 3. Examples of the coherence between simultaneously recorded LFPs that were obtained from the GPi in each of the six dystonia patients. Dotted line indicates 95%confidence limit.
M. Weinberger et al. / Clinical Neurophysiology 123 (2012) 358–368 363
Author's personal copy
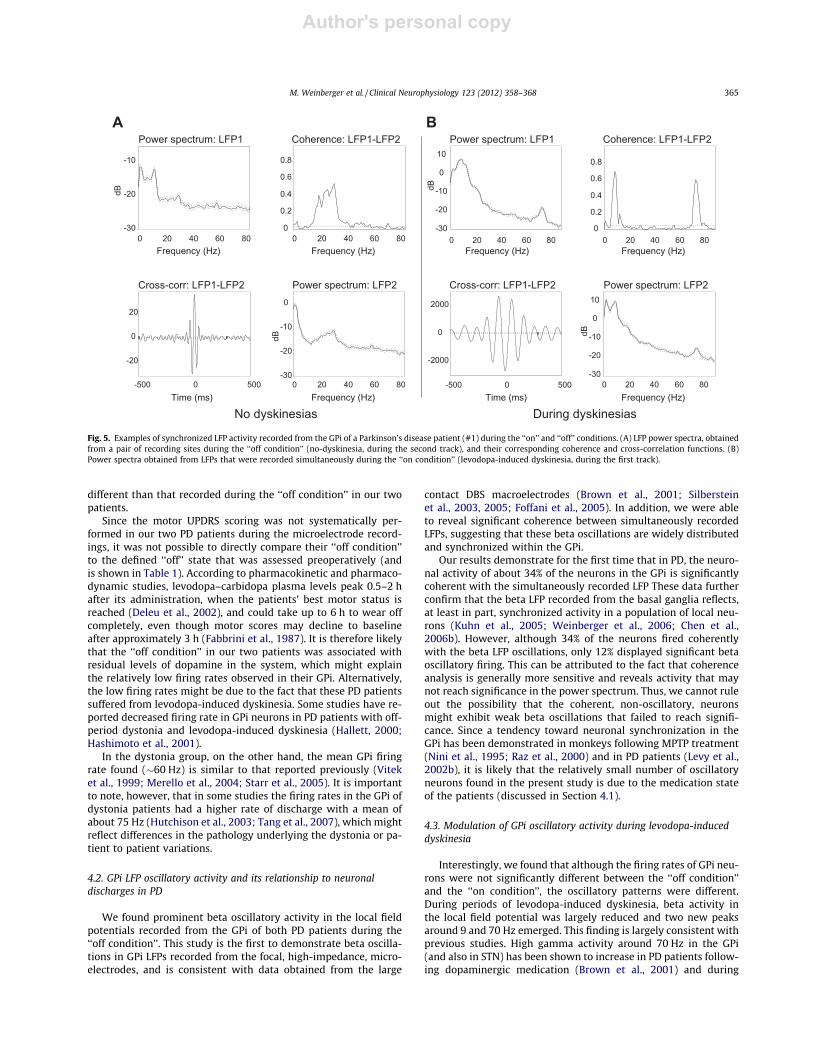
3.5. Changes in GPi oscillatory activity during levodopa-induceddyskinesia in PD
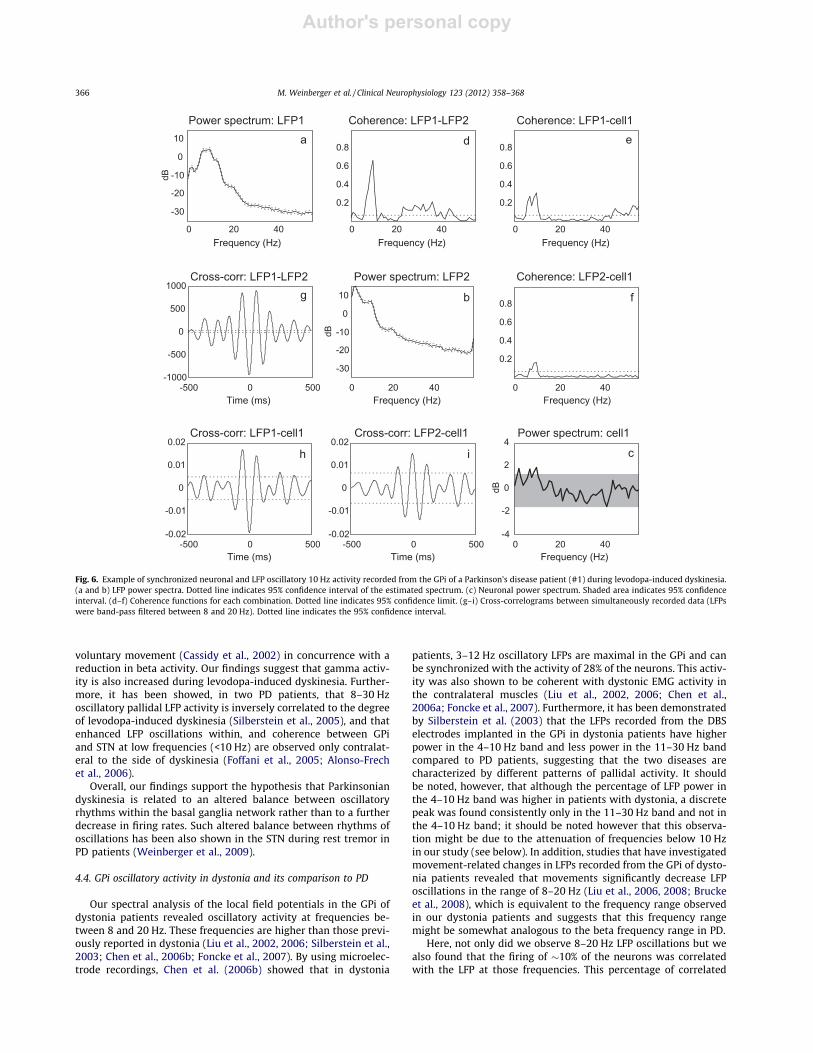
In one of the PD patients (patient #1), we had the opportunityto perform one microelectrode track through the GPi during levo-dopa-induced dyskinesia. In this track, the LFPs revealed oscilla-tory activity at frequencies around 9 and 70 Hz. In addition, allsites (n = 16) in which LFPs were recorded simultaneously fromthe two electrodes showed significant coherence at these frequen-cies, whereas beta coherence was significantly reduced (from amedian value of 0.5–0.2; P 6 0.001, rank-sum test). Fig. 5 showsexamples of power spectra of simultaneously recorded LFPs andtheir corresponding coherence and cross-correlation functions, aswere observed in each of the two microelectrode recordings per-formed in this patient. Importantly, we did not find significantcoherence between the recorded LFP and spiking activity duringperiods of limb dyskinesia.
Two out of the 17 (12%) neurons that were recorded in this track,showed significant coherence with the LFPs recorded from bothmicroelectrodes at a frequency around 9 Hz. One of these two neu-rons also exhibited significant oscillatory firing at this frequency(Fig. 6). Examination of the firing rates of neurons recorded duringlevodopa-induced dyskinesia (n = 17) revealed no significant differ-ence from the neurons recorded during the ‘‘off condition’’ (n = 73)in the two PD patients (mean firing rate of 74.9 ± 29.8 Hz comparedto 79.3 ± 36.7 Hz, respectively; P = 0.66, t-test).
4. Discussion
4.1. GPi firing rates
The firing rates of GPi neurons were significantly higher in thePD group compared to the dystonia group. This is consistent withthe predictions of the rate model of the basal ganglia for PD (Albinet al., 1989; DeLong, 1990) and dystonia (Vitek, 2002). However,the absence of control data limits our ability to determine whetherthe firing rates observed in PD/dystonia were respectively higher/lower than normal activity in humans. In the normal monkey,the mean GPi firing rate ranges between 55 and 80 Hz (Millerand DeLong, 1987; Filion and Tremblay, 1991; Boraud et al.,1996, 1998; Starr et al., 2005; Leblois et al., 2006). Thus, the meanrate of 79 Hz observed in our PD patients might be close to normal.Indeed, previous studies in PD patients that were in the practically-defined ‘‘off’’ state (i.e. after 12-h withdrawal from anti-Parkinso-nian medication) have reported higher GPi firing of about90–95 Hz (Tang et al., 2005, 2007; Starr et al., 2005), which is sim-ilar to the firing observed in the GPi of MPTP monkeys (Filion andTremblay, 1991; Boraud et al., 1996). This suggests that the ‘‘offcondition’’ of our PD patients (about 4 h after the last dose oflevodopa) might not be comparable to the defined ‘‘off’’ state inwhich anti-Parkinsonian medications are withdrawn for a longerperiod of time prior to the recordings. In fact, the mean firing raterecorded during the ‘‘on condition’’ (�75 Hz) was not significantly
Fig. 4. Example of synchronized neuronal and LFP activity recorded from a dystonia patient (#5). (a and b) LFP power spectra obtained from the recorded LFPs. Dotted lineindicates 95% confidence interval of the estimated spectrum. (c) Neuronal power spectrum. Shaded area indicates 95% confidence interval. (d–f) Coherence functions for eachcombination. Dotted line indicates 95% confidence limit. (g–i) Cross-correlograms for each combination. Dotted line indicates the 95% confidence interval.
364 M. Weinberger et al. / Clinical Neurophysiology 123 (2012) 358–368
Author's personal copy
different than that recorded during the ‘‘off condition’’ in our twopatients.
Since the motor UPDRS scoring was not systematically per-formed in our two PD patients during the microelectrode record-ings, it was not possible to directly compare their ‘‘off condition’’to the defined ‘‘off’’ state that was assessed preoperatively (andis shown in Table 1). According to pharmacokinetic and pharmaco-dynamic studies, levodopa–carbidopa plasma levels peak 0.5–2 hafter its administration, when the patients’ best motor status isreached (Deleu et al., 2002), and could take up to 6 h to wear offcompletely, even though motor scores may decline to baselineafter approximately 3 h (Fabbrini et al., 1987). It is therefore likelythat the ‘‘off condition’’ in our two patients was associated withresidual levels of dopamine in the system, which might explainthe relatively low firing rates observed in their GPi. Alternatively,the low firing rates might be due to the fact that these PD patientssuffered from levodopa-induced dyskinesia. Some studies have re-ported decreased firing rate in GPi neurons in PD patients with off-period dystonia and levodopa-induced dyskinesia (Hallett, 2000;Hashimoto et al., 2001).
In the dystonia group, on the other hand, the mean GPi firingrate found (�60 Hz) is similar to that reported previously (Viteket al., 1999; Merello et al., 2004; Starr et al., 2005). It is importantto note, however, that in some studies the firing rates in the GPi ofdystonia patients had a higher rate of discharge with a mean ofabout 75 Hz (Hutchison et al., 2003; Tang et al., 2007), which mightreflect differences in the pathology underlying the dystonia or pa-tient to patient variations.
4.2. GPi LFP oscillatory activity and its relationship to neuronaldischarges in PD
We found prominent beta oscillatory activity in the local fieldpotentials recorded from the GPi of both PD patients during the‘‘off condition’’. This study is the first to demonstrate beta oscilla-tions in GPi LFPs recorded from the focal, high-impedance, micro-electrodes, and is consistent with data obtained from the large
contact DBS macroelectrodes (Brown et al., 2001; Silbersteinet al., 2003, 2005; Foffani et al., 2005). In addition, we were ableto reveal significant coherence between simultaneously recordedLFPs, suggesting that these beta oscillations are widely distributedand synchronized within the GPi.
Our results demonstrate for the first time that in PD, the neuro-nal activity of about 34% of the neurons in the GPi is significantlycoherent with the simultaneously recorded LFP These data furtherconfirm that the beta LFP recorded from the basal ganglia reflects,at least in part, synchronized activity in a population of local neu-rons (Kuhn et al., 2005; Weinberger et al., 2006; Chen et al.,2006b). However, although 34% of the neurons fired coherentlywith the beta LFP oscillations, only 12% displayed significant betaoscillatory firing. This can be attributed to the fact that coherenceanalysis is generally more sensitive and reveals activity that maynot reach significance in the power spectrum. Thus, we cannot ruleout the possibility that the coherent, non-oscillatory, neuronsmight exhibit weak beta oscillations that failed to reach signifi-cance. Since a tendency toward neuronal synchronization in theGPi has been demonstrated in monkeys following MPTP treatment(Nini et al., 1995; Raz et al., 2000) and in PD patients (Levy et al.,2002b), it is likely that the relatively small number of oscillatoryneurons found in the present study is due to the medication stateof the patients (discussed in Section 4.1).
4.3. Modulation of GPi oscillatory activity during levodopa-induceddyskinesia
Interestingly, we found that although the firing rates of GPi neu-rons were not significantly different between the ‘‘off condition’’and the ‘‘on condition’’, the oscillatory patterns were different.During periods of levodopa-induced dyskinesia, beta activity inthe local field potential was largely reduced and two new peaksaround 9 and 70 Hz emerged. This finding is largely consistent withprevious studies. High gamma activity around 70 Hz in the GPi(and also in STN) has been shown to increase in PD patients follow-ing dopaminergic medication (Brown et al., 2001) and during
0 20 40 60 80-30
-20
-10
0
10
Frequency (Hz)
dB
Power spectrum: LFP1
Frequency (Hz)0 20 40 60 80
0
0.2
0.4
0.6
0.8
Coherence: LFP1-LFP2
-500 0 500
-2000
0
2000
Time (ms)
Cross-corr: LFP1-LFP2
During dyskinesiasNo dyskinesias
-500 0 500
-20
0
20
Cross-corr: LFP1-LFP2
Time (ms)
0 20 40 60 80-30
-20
-10
Power spectrum: LFP1
Frequency (Hz)
dB
0 20 40 60 80-30
-20
-10
0
Power spectrum: LFP2
Frequency (Hz)
dB
Frequency (Hz)0 20 40 60 80
-30
-20
-10
0
10
dB
Power spectrum: LFP2
0 20 40 60 800
0.2
0.4
0.6
0.8
Coherence: LFP1-LFP2
Frequency (Hz)
A B
Fig. 5. Examples of synchronized LFP activity recorded from the GPi of a Parkinson’s disease patient (#1) during the ‘‘on’’ and ‘‘off’’ conditions. (A) LFP power spectra, obtainedfrom a pair of recording sites during the ‘‘off condition’’ (no-dyskinesia, during the second track), and their corresponding coherence and cross-correlation functions. (B)Power spectra obtained from LFPs that were recorded simultaneously during the ‘‘on condition’’ (levodopa-induced dyskinesia, during the first track).
M. Weinberger et al. / Clinical Neurophysiology 123 (2012) 358–368 365
Author's personal copy
voluntary movement (Cassidy et al., 2002) in concurrence with areduction in beta activity. Our findings suggest that gamma activ-ity is also increased during levodopa-induced dyskinesia. Further-more, it has been showed, in two PD patients, that 8–30 Hzoscillatory pallidal LFP activity is inversely correlated to the degreeof levodopa-induced dyskinesia (Silberstein et al., 2005), and thatenhanced LFP oscillations within, and coherence between GPiand STN at low frequencies (<10 Hz) are observed only contralat-eral to the side of dyskinesia (Foffani et al., 2005; Alonso-Frechet al., 2006).
Overall, our findings support the hypothesis that Parkinsoniandyskinesia is related to an altered balance between oscillatoryrhythms within the basal ganglia network rather than to a furtherdecrease in firing rates. Such altered balance between rhythms ofoscillations has been also shown in the STN during rest tremor inPD patients (Weinberger et al., 2009).
4.4. GPi oscillatory activity in dystonia and its comparison to PD
Our spectral analysis of the local field potentials in the GPi ofdystonia patients revealed oscillatory activity at frequencies be-tween 8 and 20 Hz. These frequencies are higher than those previ-ously reported in dystonia (Liu et al., 2002, 2006; Silberstein et al.,2003; Chen et al., 2006b; Foncke et al., 2007). By using microelec-trode recordings, Chen et al. (2006b) showed that in dystonia
patients, 3–12 Hz oscillatory LFPs are maximal in the GPi and canbe synchronized with the activity of 28% of the neurons. This activ-ity was also shown to be coherent with dystonic EMG activity inthe contralateral muscles (Liu et al., 2002, 2006; Chen et al.,2006a; Foncke et al., 2007). Furthermore, it has been demonstratedby Silberstein et al. (2003) that the LFPs recorded from the DBSelectrodes implanted in the GPi in dystonia patients have higherpower in the 4–10 Hz band and less power in the 11–30 Hz bandcompared to PD patients, suggesting that the two diseases arecharacterized by different patterns of pallidal activity. It shouldbe noted, however, that although the percentage of LFP power inthe 4–10 Hz band was higher in patients with dystonia, a discretepeak was found consistently only in the 11–30 Hz band and not inthe 4–10 Hz band; it should be noted however that this observa-tion might be due to the attenuation of frequencies below 10 Hzin our study (see below). In addition, studies that have investigatedmovement-related changes in LFPs recorded from the GPi of dysto-nia patients revealed that movements significantly decrease LFPoscillations in the range of 8–20 Hz (Liu et al., 2006, 2008; Bruckeet al., 2008), which is equivalent to the frequency range observedin our dystonia patients and suggests that this frequency rangemight be somewhat analogous to the beta frequency range in PD.
Here, not only did we observe 8–20 Hz LFP oscillations but wealso found that the firing of �10% of the neurons was correlatedwith the LFP at those frequencies. This percentage of correlated
0 20 40
-30
-20
-10
0
10
Frequency (Hz) Frequency (Hz)Frequency (Hz)
dB
Power spectrum: LFP1
0 20 40
0.2
0.4
0.6
0.8
Coherence: LFP1-LFP2
-500 0 500-1000
-500
0
500
1000
Time (ms)
Cross-corr: LFP1-LFP2
0 20 40
0.2
0.4
0.6
0.8
Coherence: LFP1-cell1
-500 0 500-0.02
-0.01
0
0.01
0.02
Time (ms)
Cross-corr: LFP1-cell1
0 20 40
-30
-20
-10
0
10
Frequency (Hz) Frequency (Hz)
dB
Power spectrum: LFP2
0 20 40
0.2
0.4
0.6
0.8
Coherence: LFP2-cell1
-500 0 500-0.02
-0.01
0
0.01
0.02
Time (ms)
Cross-corr: LFP2-cell1
Frequency (Hz)
dB
Power spectrum: cell1
0 20 40-4
-2
0
2
4
a
b
c
d e
fg
h i
Fig. 6. Example of synchronized neuronal and LFP oscillatory 10 Hz activity recorded from the GPi of a Parkinson’s disease patient (#1) during levodopa-induced dyskinesia.(a and b) LFP power spectra. Dotted line indicates 95% confidence interval of the estimated spectrum. (c) Neuronal power spectrum. Shaded area indicates 95% confidenceinterval. (d–f) Coherence functions for each combination. Dotted line indicates 95% confidence limit. (g–i) Cross-correlograms between simultaneously recorded data (LFPswere band-pass filtered between 8 and 20 Hz). Dotted line indicates the 95% confidence interval.
366 M. Weinberger et al. / Clinical Neurophysiology 123 (2012) 358–368
Author's personal copy
neurons, however, was significantly lower than that observed inPD. A possible explanation is that synchronized activity in dystoniatends to not be oscillatory and thus could not be detected by ourcoherence analysis. Whether this is the case or not, our findingsprovide further evidence for the hypothesis that dopaminergic lossat the level of the STN and GP in PD may increase the sensitivity ofthe network to rhythmic, perhaps of cortical origin, inputs in thebeta range (Magill et al., 2001; Sharott et al., 2005; Baufretonet al., 2005; Walters et al., 2007), leading to the pathological syn-chronized oscillations within and between these structures (Bevanet al., 2006).
The fact that the frequencies of oscillations were broadly similarin all seven dystonia patients might suggest that these oscillatoryfrequencies (8–20 Hz) are not related to a specific pathology ofdystonia but are more likely associated with the manifestation ofdystonic symptoms. Nevertheless, the small number of dystoniapatients in this study precludes a meaningful comparison betweenthe three types of dystonia (generalized, segmental and cervical).
4.5. Methodological constraints
The number of PD patients that participated in this study is lim-ited because of the low prevalence of patients with PD for whichGPi surgery is indicated. The four PD cases were offered GPi sur-gery due to asymmetric severe drug-induced dyskinesias in twoof the patients, and STN DBS-resistant off-dystonia in the remain-ing two. Thus, the pathology in these patients might share somesimilarities to the pathology in dystonia, and this could have influ-enced our results. Moreover, the possibility that chronic bilateralSTN DBS in one of the PD patients could have resulted in somelong-term physiological changes in the basal ganglia circuits can-not be ruled out. Another limitation was that these data werenot obtained after overnight withdrawal from anti-Parkinsonianmedication since the patients could not tolerate the defined ‘‘off’’condition. The patients were considered to be in either ‘‘on condi-tion’’ during levodopa-induced dyskinesias, or ‘‘off condition’’ inthe absence of levodopa-induced dyskinesia and reappearance ofmotor signs such as rigidity, bradykinesia and tremor, but the mo-tor state was not evaluated using a standardized method (i.e.UPDRS). Despite these limitations, these results are unique andprovide interesting insights regarding the possible pathophysiol-ogy of PD and dystonia.
The lowest setting of our amplifier high-pass filter was 10 Hzand thus lower frequencies were attenuated. This has resulted inlower magnitudes of the power of the frequencies below 10 Hz(e.g. in the power spectra illustrated in the figures) and may alsohave reduced possible coherence in this range. However, we feelthat this is unlikely to have confounded our main conclusionswhich were focused on oscillatory activity in the 8–20 Hz range.The method would have been sensitive enough to reveal oscillatorypower and coherence around 5 Hz (where attenuation was about50%). This study does not and cannot address oscillatory activitybelow 5 Hz in these patients.
5. Conclusion
This study shows, for the first time, that the oscillatory LFPs re-corded from the GPi in PD patients are closely associated with bothsignificant and subthreshold beta oscillatory activity in popula-tions of GPi neurons. In dystonia, the firing rates of GPi neuronsand the frequencies of LFP oscillations are significantly lower thanin PD, and the oscillatory LFPs are not as closely related to the neu-ronal firing. This may be due to enhanced coupling of oscillatoryinputs with neuronal output in the dopamine depleted state(Weinberger and Dostrovsky, 2011).
Acknowledgements
We wish to thank all the patients for participating in this studyand Y.Y. Poon for her help with obtaining clinical data. The workwas supported by the Canadian Institutes of Health Research grantto J.O.D. (MOP-42505). A.M.L. holds a Canada Research Chair inNeuroscience.
References
Albin RL, Young AB, Penney JB. The functional anatomy of basal ganglia disorders.Trends Neurosci 1989;12:366–75.
Alonso-Frech F, Zamarbide I, Alegre M, Rodriguez-Oroz MC, Guridi J, Manrique M,et al. Slow oscillatory activity and levodopa-induced dyskinesias in Parkinson’sdisease. Brain 2006;129:1748–57.
Baufreton J, Atherton JF, Surmeier DJ, Bevan MD. Enhancement of excitatorysynaptic integration by GABAergic inhibition in the subthalamic nucleus. JNeurosci 2005;25:8505–17.
Bergman H, Raz A, Feingold A, Nini A, Nelken I, Hansel D, et al. Physiology of MPTPtremor. Mov Disord 1998;13(Suppl. 3):29–34.
Bergman H, Wichmann T, Karmon B, DeLong MR. The primate subthalamic nucleus:II. Neuronal activity in the MPTP model of Parkinsonism. J Neurophysiol1994;72:507–20.
Bevan MD, Atherton JF, Baufreton J. Cellular principles underlying normal andpathological activity in the subthalamic nucleus. Curr Opin Neurobiol2006;16:621–8.
Boraud T, Bezard E, Bioulac B, Gross C. High frequency stimulation of the internalGlobus Pallidus (GPi) simultaneously improves Parkinsonian symptoms andreduces the firing frequency of GPi neurons in the MPTP-treated monkey.Neurosci Lett 1996;215:17–20.
Boraud T, Bezard E, Guehl D, Bioulac B, Gross C. Effects of L-DOPA on neuronalactivity of the globus pallidus externalis (GPe) and globus pallidus internalis(GPi) in the MPTP-treated monkey. Brain Res 1998;787:157–60.
Brown P, Oliviero A, Mazzone P, Insola A, Tonali P, Di Lazzaro V. Dopaminedependency of oscillations between subthalamic nucleus and pallidum inParkinson’s disease. J Neurosci 2001;21:1033–8.
Brucke C, Kempf F, Kupsch A, Schneider GH, Krauss JK, Aziz T, et al. Movement-related synchronization of gamma activity is lateralized in patients withdystonia. Eur J Neurosci 2008;27:2322–9.
Burke RE, Fahn S, Marsden CD, Bressman SB, Moskowitz C, Friedman J. Validity andreliability of a rating scale for the primary torsion dystonias. Neurology1985;35:73–7.
Cassidy M, Mazzone P, Oliviero A, Insola A, Tonali P, Di Lazzaro V, et al. Movement-related changes in synchronization in the human basal ganglia. Brain2002;125:1235–46.
Chen CC, Kuhn AA, Hoffmann KT, Kupsch A, Schneider GH, Trottenberg T, et al.Oscillatory pallidal local field potential activity correlates with involuntary EMGin dystonia. Neurology 2006a;66:418–20.
Chen CC, Kuhn AA, Trottenberg T, Kupsch A, Schneider GH, Brown P. Neuronalactivity in globus pallidus interna can be synchronized to local field potentialactivity over 3–12 Hz in patients with dystonia. Exp Neurol 2006b;202:480–6.
Chen CC, Litvak V, Gilbertson T, Kuhn A, Lu CS, Lee ST, et al. Excessivesynchronization of basal ganglia neurons at 20 Hz slows movement inParkinson’s disease. Exp Neurol 2007;205:214–21.
Comella CL, Stebbins GT, Goetz CG, Chmura TA, Bressman SB, Lang AE. Teachingtape for the motor section of the Toronto Western Spasmodic Torticollis Scale.Mov Disord 1997;12:570–5.
Deleu D, Northway MG, Hanssens Y. Clinical pharmacokinetic andpharmacodynamic properties of drugs used in the treatment of Parkinson’sdisease. Clin Pharmacokinet 2002;41:261–309.
DeLong MR. Primate models of movement disorders of basal ganglia origin. TrendsNeurosci 1990;13:281–5.
Fabbrini G, Juncos J, Mouradian MM, Serrati C, Chase TN. Levodopa pharmacokineticmechanisms and motor fluctuations in Parkinson’s disease. Ann Neurol1987;21:370–6.
Fahn S, Elton RLmembers of the UPDRS Development Committe. Unified Parkinson’sDisease Rating Scale. In: Fahn S, Marsden SD, Calne DB, Goldstein M, editors.Recent developments in Parkinson’s disease. Florham Park, NJ: Macmillan;1987. p. 153–63.
Filion M, Tremblay L. Abnormal spontaneous activity of globus pallidus neurons inmonkeys with MPTP-induced Parkinsonism. Brain Res 1991;547:142–51.
Foffani G, Ardolino G, Meda B, Egidi M, Rampini P, Caputo E, et al. Alteredsubthalamo-pallidal synchronisation in Parkinsonian dyskinesias. J NeurolNeurosurg Psychiatry 2005;76:426–8.
Foncke EM, Bour LJ, Speelman JD, Koelman JH, Tijssen MA. Local field potentials andoscillatory activity of the internal globus pallidus in myoclonus-dystonia. MovDisord 2007;22:369–76.
Hallett M. Clinical physiology of dopa dyskinesia. Ann Neurol 2000;47:S147–50.Halliday DM, Rosenberg JR, Amjad AM, Breeze P, Conway BA, Farmer SF. A
framework for the analysis of mixed time series/point process data – theory andapplication to the study of physiological tremor, single motor unit dischargesand electromyograms. Prog Biophys Mol Biol 1995;64:237–78.
M. Weinberger et al. / Clinical Neurophysiology 123 (2012) 358–368 367

Author's personal copy
Hashimoto T, Tada T, Nakazato F, Maruyama T, Katai S, Izumi Y, et al. Abnormalactivity in the globus pallidus in off-period dystonia. Ann Neurol2001;49:242–5.
Hutchison WD, Lang AE, Dostrovsky JO, Lozano AM. Pallidal neuronal activity:implications for models of dystonia. Ann Neurol 2003;53:480–8.
Hutchison WD, Lozano AM, Davis KD, Saint-Cyr JA, Lang AE, Dostrovsky JO.Differential neuronal activity in segments of globus pallidus in Parkinson’sdisease patients. Neuroreport 1994;5:1533–7.
Krack P, Pollak P, Limousin P, Hoffmann D, Xie J, Benazzouz A, et al. Subthalamicnucleus or internal pallidal stimulation in young onset Parkinson’s disease.Brain 1998;121(Pt. 3):451–7.
Kuhn AA, Kempf F, Brucke C, Gaynor DL, Martinez-Torres I, Pogosyan A, et al. High-frequency stimulation of the subthalamic nucleus suppresses oscillatory betaactivity in patients with Parkinson’s disease in parallel with improvement inmotor performance. J Neurosci 2008;28:6165–73.
Kuhn AA, Kupsch A, Schneider GH, Brown P. Reduction in subthalamic 8–35 Hzoscillatory activity correlates with clinical improvement in Parkinson’s disease.Eur J Neurosci 2006;23:1956–60.
Kuhn AA, Trottenberg T, Kivi A, Kupsch A, Schneider GH, Brown P. The relationshipbetween local field potential and neuronal discharge in the subthalamic nucleusof patients with Parkinson’s disease. Exp Neurol 2005;194:212–20.
Lang AE, Lozano AM, Montgomery E, Duff J, Tasker R, Hutchinson W. Posteroventralmedial pallidotomy in advanced Parkinson’s disease. N Engl J Med1997;337:1036–42.
Leblois A, Meissner W, Bezard E, Bioulac B, Gross CE, Boraud T. Temporal and spatialalterations in GPi neuronal encoding might contribute to slow down movementin Parkinsonian monkeys. Eur J Neurosci 2006;24:1201–8.
Lenz FA, Jaeger CJ, Seike MS, Lin YC, Reich SG, DeLong MR, et al. Thalamic singleneuron activity in patients with dystonia: dystonia-related activity and somaticsensory reorganization. J Neurophysiol 1999;82:2372–92.
Lenz FA, Suarez JI, Metman LV, Reich SG, Karp BI, Hallett M, et al. Pallidal activityduring dystonia: somatosensory reorganisation and changes with severity. JNeurol Neurosurg Psychiatry 1998;65:767–70.
Levy R, Ashby P, Hutchison WD, Lang AE, Lozano AM, Dostrovsky JO. Dependence ofsubthalamic nucleus oscillations on movement and dopamine in Parkinson’sdisease. Brain 2002a;125:1196–209.
Levy R, Hutchison WD, Lozano AM, Dostrovsky JO. Synchronized neuronal dischargein the basal ganglia of Parkinsonian patients is limited to oscillatory activity. JNeurosci 2002b;22:2855–61.
Levy R, Lozano AM, Hutchison WD, Dostrovsky JO. Dual microelectrode techniquefor deep brain stereotactic surgery in humans. Neurosurgery 2007;60:277–83.
Liu X, Griffin IC, Parkin SG, Miall RC, Rowe JG, Gregory RP, et al. Involvement of themedial pallidum in focal myoclonic dystonia: a clinical and neurophysiologicalcase study. Mov Disord 2002;17:346–53.
Liu X, Wang S, Yianni J, Nandi D, Bain PG, Gregory R, et al. The sensory and motorrepresentation of synchronized oscillations in the globus pallidus in patientswith primary dystonia. Brain 2008;131:1562–73.
Liu X, Yianni J, Wang S, Bain PG, Stein JF, Aziz TZ. Different mechanisms maygenerate sustained hypertonic and rhythmic bursting muscle activity inidiopathic dystonia. Exp Neurol 2006;198:204–13.
Lozano A, Hutchison W, Kiss Z, Tasker R, Davis K, Dostrovsky J. Methods formicroelectrode-guided posteroventral pallidotomy. J Neurosurg 1996;84:194–202.
Lozano AM. Deep brain stimulation for Parkinson’s disease. Parkinsonism RelatDisord 2001;7:199–203.
Lozano AM, Hutchison WD, Tasker RR, Lang AE, Junn F, Dostrovsky JO.Microelectrode recordings define the ventral posteromedial pallidotomytarget. Stereotact Funct Neurosurg 1998;71:153–63.
Lozano AM, Kumar R, Gross RE, Giladi N, HutchisonWD, Dostrovsky JO, et al. Globuspallidus internus pallidotomy for generalized dystonia. Mov Disord1997;12:865–70.
Magill PJ, Bolam JP, Bevan MD. Dopamine regulates the impact of the cerebralcortex on the subthalamic nucleus–globus pallidus network. Neuroscience2001;106:313–30.
Magnin M, Morel A, Jeanmonod D. Single-unit analysis of the pallidum, thalamusand subthalamic nucleus in Parkinsonian patients. Neuroscience2000;96:549–64.
Marsden CD, Obeso JA. The functions of the basal ganglia and the paradox ofstereotaxic surgery in Parkinson’s disease. Brain 1994;117(Pt. 4):877–97.
Merello M, Cerquetti D, Cammarota A, Tenca E, Artes C, Antico J, et al. Neuronalglobus pallidus activity in patients with generalised dystonia. Mov Disord2004;19:548–54.
Miller WC, DeLong MR. Altered tonic activity of neurons in the globus pallidus andsubthalamic nucleus in the primate MPTP model of Parkinsonism. In: Carpenter
MB, Jayaraman A, editors. Basal ganglia II. New York: Plenum Press. p. 415–27.Moran A, Bergman H, Israel Z, Bar-Gad I. Subthalamic nucleus functional
organization revealed by Parkinsonian neuronal oscillations and synchrony.Brain 2008;131:3395–409.
Nini A, Feingold A, Slovin H, Bergman H. Neurons in the globus pallidus do not showcorrelated activity in the normal monkey, but phase-locked oscillations appearin the MPTP model of Parkinsonism. J Neurophysiol 1995;74:1800–5.
Pessiglione M, Guehl D, Rolland AS, Francois C, Hirsch EC, Feger J, et al. Thalamicneuronal activity in dopamine-depleted primates: evidence for a loss offunctional segregation within basal ganglia circuits. J Neurosci2005;25:1523–31.
Priori A, Foffani G, Pesenti A, Bianchi A, Chiesa V, Baselli G, et al. Movement-relatedmodulation of neural activity in human basal ganglia and its L-DOPAdependency: recordings from deep brain stimulation electrodes in patientswith Parkinson’s disease. Neurol Sci 2002;23(Suppl. 2):S101–2.
Ray NJ, Jenkinson N, Wang S, Holland P, Brittain JS, Joint C, et al. Local field potentialbeta activity in the subthalamic nucleus of patients with Parkinson’s disease isassociated with improvements in bradykinesia after dopamine and deep brainstimulation. Exp Neurol 2008;213:108–13.
Raz A, Vaadia E, Bergman H. Firing patterns and correlations of spontaneousdischarge of pallidal neurons in the normal and the tremulous 1-methyl-4-phenyl-1,2,3,6-tetrahydropyridine vervet model of Parkinsonism. J Neurosci2000;20:8559–71.
Rivlin-Etzion M, Ritov Y, Heimer G, Bergman H, Bar-Gad I. Local shuffling of spiketrains boosts the accuracy of spike train spectral analysis. J Neurophysiol2006;95:3245–56.
Rosenberg JR, Amjad AM, Breeze P, Brillinger DR, Halliday DM. The Fourier approachto the identification of functional coupling between neuronal spike trains. ProgBiophys Mol Biol 1989;53:1–31.
Schaltenbrand G, Wahren W. Atlas for stereotaxy of the human brain. ThiemeMedical Publishers; 1977.
Sharott A, Magill PJ, Harnack D, Kupsch A, Meissner W, Brown P. Dopaminedepletion increases the power and coherence of beta-oscillations in the cerebralcortex and subthalamic nucleus of the awake rat. Eur J Neurosci2005;21:1413–22.
Silberstein P, Kuhn AA, Kupsch A, Trottenberg T, Krauss JK, Wohrle JC, et al.Patterning of globus pallidus local field potentials differs between Parkinson’sdisease and dystonia. Brain 2003;126:2597–608.
Silberstein P, Oliviero A, Di Lazzaro V, Insola A, Mazzone P, Brown P. Oscillatorypallidal local field potential activity inversely correlates with limb dyskinesiasin Parkinson’s disease. Exp Neurol 2005;194:523–9.
Starr PA, Rau GM, Davis V, Marks Jr WJ, Ostrem JL, Simmons D, et al. Spontaneouspallidal neuronal activity in human dystonia: comparison with Parkinson’sdisease and normal macaque. J Neurophysiol 2005;93:3165–76.
Tang JK, Moro E, Lozano AM, Lang AE, Hutchison WD, Mahant N, et al. Firing rates ofpallidal neurons are similar in Huntington’s and Parkinson’s disease patients.Exp Brain Res 2005;166:230–6.
Tang JK, Moro E, Mahant N, Hutchison WD, Lang AE, Lozano AM, et al. Neuronalfiring rates and patterns in the globus pallidus internus of patients with cervicaldystonia differ from those with Parkinson’s disease. J Neurophysiol2007;98:720–9.
Vidailhet M, Vercueil L, Houeto JL, Krystkowiak P, Benabid AL, Cornu P, et al.Bilateral deep-brain stimulation of the globus pallidus in primary generalizeddystonia. N Engl J Med 2005;352:459–67.
Vitek JL. Pathophysiology of dystonia: a neuronal model. Mov Disord2002;17(Suppl. 3):S49–62.
Vitek JL, Chockkan V, Zhang JY, Kaneoke Y, Evatt M, DeLong MR, et al. Neuronalactivity in the basal ganglia in patients with generalized dystonia andhemiballismus. Ann Neurol 1999;46:22–35.
Walters JR, Hu D, Itoga CA, Parr-Brownlie LC, Bergstrom DA. Phase relationshipssupport a role for coordinated activity in the indirect pathway in organizingslow oscillations in basal ganglia output after loss of dopamine. Neuroscience2007;144:762–76.
Weinberger M, Dostrovsky JO. A basis for the pathological oscillations in basalganglia: the crucial role of dopamine. Neuroreport 2011;22:151–6.
Weinberger M, Hutchison WD, Lozano AM, Hodaie M, Dostrovsky JO. Increasedgamma oscillatory activity in the subthalamic nucleus during tremor inParkinson’s disease patients. J Neurophysiol 2009;101:789–802.
Weinberger M, Mahant N, Hutchison WD, Lozano AM, Moro E, Hodaie M, et al. Betaoscillatory activity in the subthalamic nucleus and its relation to dopaminergicresponse in Parkinson’s disease. J Neurophysiol 2006;96:3248–56.
Wichmann T, Bergman H, Starr PA, Subramanian T, Watts RL, DeLong MR.Comparison of MPTP-induced changes in spontaneous neuronal discharge inthe internal pallidal segment and in the substantia nigra pars reticulata inprimates. Exp Brain Res 1999;125:397–409.
368 M. Weinberger et al. / Clinical Neurophysiology 123 (2012) 358–368