Organizational and Risk Characteristics of Emerging Public-Private Partnership Models
140
Organizational and Risk Characteristics of Emerging Public- Private Partnership Models. Priyanka A. Shingore Research and thesis submitted to the faculty of Virginia Polytechnic and State University in partial fulfillment of the requirements for the degree Masters of Science in Civil and Environmental Engineering Michael J.Garvin Anthony D.Songer Raman Kumar 5 th January 2009 Blacksburg, Virginia Key words: Public-Private Partnerships, Greenfield, Brownfield, Innovative Project Delivery, Project Finance.
Transcript of Organizational and Risk Characteristics of Emerging Public-Private Partnership Models

Organizational and Risk Characteristics of Emerging Public-Private Partnership Models.
Priyanka A. Shingore
Research and thesis submitted to the faculty of Virginia Polytechnic and State
University in partial fulfillment of the requirements for the degree
Masters of Science in
Civil and Environmental Engineering
Michael J.Garvin Anthony D.Songer
Raman Kumar
5th January 2009
Blacksburg, Virginia
Key words: Public-Private Partnerships, Greenfield, Brownfield, Innovative Project Delivery, Project Finance.

Abstract
State transportation authorities’ reliance on traditional financing mechanisms such as gas taxes
and federal support has waned of late as these mechanisms have proved insufficient to keep pace
with the escalating demand for transportation infrastructure in the United States. As a result,
public-private partnerships (P3) are increasingly viewed as a part of the solution to this problem.
A partnership between the public and private sector allows both entities to ‘mutually benefit’
from the private sector’s equity/debt financing structure and ability to bring innovation and
efficiency to the table. Companies have formed consortiums either to lease the existing toll roads
through what is termed as a Brownfield project model or deliver design-build-finance-operate
projects categorized as a Greenfield model.
A case-study based approach helps to identify the organizational structure, nature of the key
participants and risk characteristics of these Greenfield-Brownfield P3 models. The four cases
identified for study include, the Pocahontas Parkway in Virginia, SR-125 in California
representing the Greenfield model and the Chicago Skyway and Indiana Toll road under the
Brownfield model.
An analytical template comprised of a project finance structure, risk matrix for each of the four
cases and Porter’s segmentation matrix for the selected private sector project participants is used
to characterize the structure of the P3 arrangement in the cases. The project finance structure
illustrates the formation of a special purpose vehicle (SPV) to delineate the role played by
different participants. Risk matrices developed for all the four cases helps to identify the
allocation of risks among the state and the SPV or the concessionaire. Porter’s segmentation
matrix helps to identify the activities of the key players or sponsor companies in various sectors
including infrastructure, across the world.
The SR-125- Greenfield- model seems to have evolved from Pocahontas Parkway as the private
sector solely finances the project and assumes the high revenue risk and responsibility to operate
and maintain the facility. The Brownfield model faces a political backlash in the U.S., and this
risk has become fundamental to the model.

iii iii
Based on their core competencies, companies decide in which of the two models they are suited
to participate. Their individual expertise adds value when they collaborate to deliver a public-
private partnership. Finally, further evolution of the Greenfield and Brownfield models depends
upon the developments in the U.S. P3 market.

iv iv
Acknowledgements I thank my advisor Dr. Garvin for introducing me to the field of infrastructure management
strategies and providing guidance from the inception to the completion of this thesis. Special
thanks to Dr. Songer and Dr. Kumar for serving on my committee and helping me grow
professionally during my master’s studies at Virginia Tech. I am also thankful to the faculty and
staff of the VCEMP program and the Myers and Lawson School of Construction for providing
me an exceptional learning environment.
I appreciate the support from the members of Garvin Research Group especially Martha- her
camaraderie has been precious. I am also grateful to have met all my friends at Virginia Tech
whose company made my stay here enjoyable.
I am thankful to my family, friends back home and all my well wishers. Last but not the least,
thank you Aai for your love, care and support that made this possible.

v v
Table of Contents
Chapter 1 - Introduction.............................................................................................1 1.1 Background............................................................................................................................... 1
1.1.1 Demand and Supply Gap ............................................................................................... 1 1.1.2 Traditional Funding Mechanisms .................................................................................. 2
1.2 Public-Private Partnership Models ........................................................................................... 5 1.2.1 Definition of PPP ........................................................................................................... 5 1.2.2 Greenfield and Brownfield Models ............................................................................... 5
1.3 Objective ................................................................................................................................... 6 1.4 Research Methodology ............................................................................................................. 7
1.4.1 Case Study Based Approach.......................................................................................... 7 1.4.3 Development of the Analytical Template .................................................................... 10
Chapter 2 - Literature Review .................................................................................13 2.1 Overview of P3 ....................................................................................................................... 13 2.2 Project Finance........................................................................................................................ 14 2.3 Infrastructure........................................................................................................................... 15 2.4 Risks........................................................................................................................................ 16 2.5 Organizational Analysis.......................................................................................................... 17 Chapter 3 - Case Studies ..........................................................................................19 3.1 Pocahontas Parkway ............................................................................................................... 19
3.1.1 Introduction.................................................................................................................. 19 3.1.2 The Procurement Process............................................................................................ 21
3.1.3 Project Finance Structure............................................................................................. 25 3.1.4 Terms and Conditions of the Agreement ..................................................................... 26 3.1.5 Troubled Waters........................................................................................................... 31 3.1.6 The Rescue................................................................................................................... 32
3.2 SR-125 (Southbay Expressway) ............................................................................................. 34 3.2.1 Introduction.................................................................................................................. 34 3.2.2 Selection of the proposal.............................................................................................. 35 3.2.3 Innovative financing mechanism ................................................................................. 37 3.2.4 Highlights of the agreement......................................................................................... 38 3.2.5 Traffic projection and studies ...................................................................................... 40 3.2.6 Risks............................................................................................................................. 40
3.3 Chicago Skyway ..................................................................................................................... 42 3.3.1 Overview...................................................................................................................... 42 3.3.2 Early Financial Troubles.............................................................................................. 43 3.3.3 Coming out of the Red................................................................................................. 43 3.3.4 Acquisition and Procurement Process ......................................................................... 46 3.3.5 The Winning Bid.......................................................................................................... 48
3.3.6 Terms of Agreement………………………………………………………………….48 3.3.7 Investment Rational ..................................................................................................... 55

vi vi
3.3.8 Sponsors and Debt Refinancing................................................................................... 57 3.3.9 Reactions...................................................................................................................... 58
3.4 Indiana Toll Road ................................................................................................................... 60 3.4.1 Overview...................................................................................................................... 60 3.4.2 Selection Strategy ........................................................................................................ 62 3.4.3 Terms of the lease ........................................................................................................ 64 3.4.4 The Winning Bid.......................................................................................................... 70 3.4.5 The Investment Rationale ............................................................................................ 70 3.4.6 Reactions...................................................................................................................... 72
Chapter 4- Project Finance Structure and Risk analysis..........................................74 4.1 The Greenfield Model............................................................................................................. 74
4.1.1 Pocahontas Parkway .................................................................................................... 74 4.1.2 SR-125 ......................................................................................................................... 78 4.1.3 Summary ...................................................................................................................... 82
4.2 The Brownfield Model............................................................................................................ 84 4.2.1 Chicago Skyway
4.2.2 Indiana Toll Road ........................................................................................................ 88 4.2.3 Summary ...................................................................................................................... 91
Chapter 5 Study of Key Organizations ....................................................................93 5.1 Fluor Corporation.................................................................................................................... 93
5.1.1 Background.................................................................................................................. 93 5.2 Macquarie Group .................................................................................................................... 99
5.2.1 Background.................................................................................................................. 99 5.2.3 Macquarie Infrastructure Group (MIG) ..................................................................... 100 5.2.4 Segmentation Matrix for Macquarie Capital Group .................................................. 103
5.3 Grupo Ferrovial..................................................................................................................... 105 5.3.1 Background................................................................................................................ 105 5.3.2 Cintra.......................................................................................................................... 108 5.4 Nature of the Participants.............................................................................................. 113
Chapter 6- Conclusion ...........................................................................................116 6.1 Objective and Means………………………………………………………………………..116 6.2 Observation………………………………………………………………………………....116 6.2.1 Project Structure and Associated Risks………………………………………….....116 6.2.2 Nature of Lead Organizations……………………………………………………....117 6.3 Future Trends……………………………………………………………………………….118 6.4 Scope for Future Work……………………………………………………………………...120 Bibliography…………………………………………………...………………...121

vii vii
List of Figures Figure 1.1 Disparity between Vehicle Miles Travelled and Lane Miles………………………....2
Figure 1.2 Case Study Approach…………………………………………………………………8
Figure 1.3 Yescombe’s Project Finance Structure……………………………………………….11
Figure 1.4 Porter’s Segmentation Matrix Template……………………………………………..12
Figure 3.1 Pocahontas Parkway Map…………………………………………………………….20
Figure 3.2 Map of Southbay Expressway………………………………………………………..34
Figure 3.3 Chicago Skyway Map………………………………………………………………..43
Figure 3.4 Indiana Toll Road Map………………………………………………………………60
Figure 4.1 Pocahontas Parkway Project Finance Structure …………………………………….74
Figure 4.2 Pocahontas Parkway Source of Financing…………………………………………...75
Figure 4.3 Pocahontas Parkway Risk Matrix……………………………………………………76
Figure 4.4 Pocahontas Parkway Flow of Funds…………………………………………………77
Figure 4.5 SR-125 Source of Financing…………………………………………………………78
Figure 4.6 SR-125 Project Finance Structure……………………………………………………79
Figure 4.7 SR-125 Risk Matrix…………………………………………………………………..80
Figure 4.8 SR-125 Flow of Funds………………...…………..………………………………....82
Figure 4.9 Chicago Skyway Project Finance Structure… ………………………...………….....84
Figure 4.10 Chicago Skyway Source of Financing ………………………………………...…...85
Figure 4.11 Chicago Skyway Flow of Funds……………………………………………………86
Figure 4.12 Chicago Skyway Risk Matrix………………………………………………………87
Figure 4.13 Indiana Toll Road Project Finance Structure ……………………………………...88
Figure 4.14 Indiana Toll Road Source of Financing…………………………………………….89
Figure 4.15 Indiana Toll Road Risk Matrix……………………………………………………..90
Figure 4.16 Indiana Toll Road Flow of Funds……………………………………………..……91
Figure 5.1 Porter’s Segmentation Matrix for Fluor’s Operations in the North America
&Europe……………………………………………………………………………...97
Figure 5.2 Porter’s Segmentation Matrix for Fluor’s operations in the Africa/Middle East and
Asia/Pacific…………………………………………………………………………...98
Figure 5.3 Porter’s Segmentation Matrix for Macquarie’s Operations in North America,

viii viii
Europe and the Asia Pacific…………………………………………………………104
Figure 5.4 Porter’s Segmentation Matrix for Porter’s Segmentation Matrix for
Grupo Ferrovial’s Operations in North America , Europe and Latin America…......112
List of Tables
Table 1.1 U.S. Highway Funding Sources and Uses, 2004 Estimate…………………………….4
Table 1.2 Selected Public-Private-Partnership Cases…...…………………………………….….9
Table 1.3 Risk Matrix Template…………………………………………………………………12
Table 3.1 Pocahontas Parkway Initial Toll Schedule…………………………………………....30
Table 3.2 Use of Skyway Deal Proceeds ………………………………………………………..45
Table 5.1Background of Fluor Corporation……………………………………………………..94
Table 5.2 Fluor’s Public-Private-Partnership Projects…………………………………….…….95
Table 5.3 Fluor’s Financial Highlights………………………………………………………….95
Table 5.4 MIG Background and Asset Portfolio …………………………….………….…….102
Table 5.5 MIG Financial Highlights………………………………………….………………..102
Table 5.6 MIP Asset Portfolio………………………………………………….………………102
Table 5.7 Grupo Ferrovial’s Core Operations………………………………….……………....106
Table 5.8 Grupo Ferrovial’s Subsidiaries……………………..……………….……………....107
Table 5.9 Cintra’s Regional Distribution of Revenue and Profits…………….…….…….…....108
Table 5.10 Cintra’s Financial Highlights……………………………………….………….…...108
Table 5.11Cintra Background and Asset Portfolio……………………………...…..………….110

1 1
Chapter 1 - Introduction
1.1 Background
Global demand for infrastructure in the areas of transportation, power, telecommunication,
water-supply and other social infrastructure such as schools and hospitals etc. have been rising
exponentially. According an article on project finance loans, Public Works Financing has
reported that internationally, about $300 billion worth of “market-oriented” infrastructure
projects have been funded or are under development since the 1980’s. Nevertheless, significant
deficit in funding has been illustrated by organizations and agencies through reports and studies
on infrastructure investment requirements, citing the failures of infrastructure assets in the recent
past (e.g. the I-35 bridge collapse in Minneapolis) and the shortfall in government expenditure
over the past two decades.
In North America, much has been talked about the inadequacies in surface transportation
focusing on highway infrastructure in particular.
1.1.1 Demand and Supply Gap
Traffic levels have been rising over the past few decades and the insufficient expansion in road
capacity has resulted into congestion on highways. Moreover, non-highway transportation
investments have failed to reduce traffic congestion (Poole and Samuel 2006).
In the year 2000, the federal, state, and local capital investment in highway was $64.6 billion.
The required investment in construction and expansion per year to keep up with the projected
increase in automobile and trucks vehicle miles traveled (VMT) was estimated at $ 75.9 billion.
Figure 1, indicates growing disparity between the VMT and the land miles of roadway in the U.S
since 1980 (Poole and Samuel 2006).

2 2
Figure 1.1-Disparity between Vehicle Miles Travelled and Lane Miles, Source: FHWA, (Poole and Samuel 2006)
1.1.2 Traditional Financing Mechanisms and Innovative Project Delivery
President Eisenhower signed the Federal Highway Act in 1956 which authorized the Eisenhower
System of Interstate and Defense Highway that has added approximately 162,158 miles in length
of highway infrastructure(Cox and Love 1996). Ninety percent of the construction cost of this
Federal Interstate System was supported by the federal government through a one cent tax per
gallon of gasoline sold (Cox and Love 1996). Remaining cost was covered by state funding.
Conventionally, until the early 21st century, highway infrastructure in the U.S has been owned
by the state and operated and maintained by the public transportation agencies. States have
depended on a combination of motor fuel sales tax; sales tax on motor vehicles; use tax on motor
vehicles; licensing fees; toll revenue; debt financing and federal grants to finance transportation
projects. Sources of funds at the county level include fee for granting the right-of-way, regional
mobility authority and special tax districts.

3 3
Highway Trust Funds (HTF) have also been widely used. These are financing mechanisms
established by the federal government to allocate the tax receipts to a specialized fund
“earmarked” for expenditure on transit needs(Northeast Midwest Institute 2004). In addition to
drawing upon the Highway Trust Funds, federal government has been providing assistance
through innovative financial instruments such as, Grant Anticipation Revenue Vehicles
(GARVEEs), State Infrastructure Bank (SIB) and grants such as Transportation Infrastructure
Finance and Innovation Act (TIFIA) loans to encourage investment in highway infrastructure.
1. Grant Anticipation Revenue Vehicles (GARVEE): GARVEE are debt- financing
instruments (Bond, Note, Certificate, Mortgage or Lease) used by the states to fund their
transportation projects, such that the financing costs related to them are eligible for
federal- aid highway reimbursements(FHWA 2006).
2. State Infrastructure Bank (SIB): SIBs provide loans and assistance to public and private
entities for carrying out transportation projects(Clary 2003).
3. Transportation Infrastructure Finance and Innovation Act ( TIFIA) : TIFIA of 1998 is a
federal program under which the U.S. Department of Transportation (USDOT) provides
credit assistance for surface transportation projects of national or regional significance
including highway, transit and rail (AASHTO 2007).
4. Under the 2005, SFETEA-LU (Safe, Accountable, Flexible, and Efficient Transportation
Equity Act- A Legacy of Users), privately developed highway facilities have been
considered eligible for tax-exempt bond financing (up to a maximum of $15 billion in
bonds), encouraging private sector participation in providing highway infrastructure. It
has also enhanced the TIFIA program by relaxing the eligibility criteria to avail credit
assistance (FHWA 2006).
Following is a table from Standard and Poor’s P3 credit survey in 2006; it provides an
estimate of the sources of revenue for U.S highway construction and expenditures in the
year 2004.

4 4
U.S.Highway Funding Sources And Uses 2004 estimates
(Mil $)
%of
total (Mil $) %of total
Funding Sources U.S.Highway Expenditures
Motor Fuel and Vehicle 47,874 32.5 Capital outlay 70,274 47.6
taxes(state and local)
Motor fuel and vehicle 28,560 19.4
Maintenance and traffic
services 36,327 24.6
Taxes(federal)
General Fund appropriations 23,562 16 Administration and research 12,737 8.6
Bond proceeds 15,794 10.7 Highway law enforcement and 14,322 9.7
(Including Garvees) safety
Other taxes 7,940 5.4 interest on debt 5,819 3.9
Property taxes 7,453 5.1 Bond retirements 8,011 5.4
Investment income 7,560 5.1
Tolls 6,572 4.5
Funds drawn from reserves 2,174 1.5
Total Funds Available
147,48
9 100 Total expenditures
147,48
9 100
Source: FHWA Highway Statistics 2004, Table HF-10 (January 2006 data)
Table 1.1- U.S. Highway Funding Sources and Uses 2004 Estimates, Source: (Standard and
Poor’s 2006)
Over the past few years, the traditional financing tools have strained their capacity and additional
funds are required for sustenance. Increase in fuel tax in order to keep up with the demand has
received weak public and political support, nonetheless, cash strapped states are continuously
pressed to fund the gap. In this situation, some state transportation authorities’ are looking
towards private participation to fund development either in combination with other available
sources or by themselves. Public- Private Partnerships (P3) are used as strategy to solve these
problems where both private and public sector benefit from their mutual competencies through
appropriate risk allocation. Design-build-finance-operate (DBFO) project delivery method and
toll road lease agreements are avenues through which private sector has contributed towards the
development of transportation infrastructure.

5 5
1.2 Public-Private Partnership Models
1.2.1 Definition for PPP
The role played by a private entity in the development/operation of an infrastructure asset may
vary greatly. Thus Public-Private Partnerships (P3) can be defined in a number of ways based on
the context they have been applied to. It has widely been used to describe contribution of a
private entity to a project. The nature of this participation is not limited to an equity stake and
may involve greater private participation in the delivery of transportation projects using design-
build (D-B), Design-build-finance-operate (DBFO) or long term concessions (Buxbaum and
Ortiz 2007). In general, Public-Private-Partnerships are long-term contractual agreements
between the public and private sector where mutual benefits are derived (Garvin 2007b).
After World War II, design-bid-build became a default mode for public infrastructure delivery in
the U.S. (Miller et al 2000). Separate contracts for construction, design, operation/maintenance
of projects fragmented the project delivery and the private sector’s responsibilities became
limited to their individual contracts. Present day Public- Private Partnerships stress upon the
relationship between the involved parties, who can be assumed to operate on shared
understandings of mutual benefit, rather than relying primarily on written contracts (Quiggin
2005).Various phases and aspects of the project are bundled into one contract with a single
partner (a consortium or a project company or a special purpose vehicle (SPV)) over longer
terms, typically 20-30 years (Quiggin 2005).
1.2.2 Definition for Greenfield and Brownfield Models
A consortium formed for the development of a new infrastructure facility usually without an
operating history or providing substantial improvements/modifications to an existing facility
constitutes a Greenfield model. This consortium operates and maintains the facility over a period
of 30-99 years under a long-term agreement with the public agency or the owner, during which
the project company or the Special Purpose Vehicles (SPV) collects tolls from the passing
vehicles (assuming market risk) or gets paid periodically by the owner for providing the services
(availability payments).The facility is handed back at the end of its operating term, usually at no
cost to the public agency.

6 6
The type of P3 arrangements in which the private sector takes on the responsibility of operating
and maintaining an existing facility, providing public services including, enhancing or
constructing additional necessary infrastructure- also termed as capital improvements- is a
Brownfield model. The recent toll road lease agreements observed in the United States can be
categorized under this concession model and the special purpose vehicle formed to achieve this
may be termed as a ‘Brownfield Consortium’.
A long-term Brownfield concession of an existing infrastructure asset involves an upfront
payment made by the private sector or investment in the construction of a new facility in return
for the cash-flows generated by the asset over the term of the lease. The consortium may have
the right (as per the clauses in the agreement) to increase the toll as per a predetermined
schedule, up to a certain period after which it normally is tied with increase in gross development
product (GDP) or inflation.
The long term concession agreement usually transfers operating risk and unless it is availability
type of contract, also the revenue risk to the private sector. Capital expenditures like expansion,
modernization of the highway and maintenance of the highway usually fall in the books of
private sector. The private sector is considered capable of contributing innovative ideas thereby
achieving operating efficiency.
1.3 Research Objective
Innovative methods of financing infrastructure projects have been studied and the applicability of
Public-Private Partnerships as means to deliver infrastructure in North America has been
investigated by researchers. The nature of the two emerging Greenfield and Brownfield P3
models has been recognized and fairly defined, but most of the work in this area has fallen short
of an analysis of these models from a structural and organizational stand-point.
This research studies the emerging Greenfield and Brownfield P3 models in the North America
with respect to their finance structures, the risk characteristics associated with them and the
nature of the key players in the P3 projects. Thus, the result of this study will help us understand
characteristics of the two models based on the following:

7 7
1. Financial Structure
2. Risks associated with the two P3 models
3. Nature of lead organizations
1.4 Research Methodology
This research uses a two pronged approach for investigation. One is case based and the other is
based on an organizational study of the key participants. An analytical template of Yescombe’s
project finance structure and a risk matrix are used as tools to analyze the information collected
from the case studies prepared on two Greenfield and two Brownfield projects. Further, studying
the organizations participating in these projects coupled with Porter’s segmentation matrix for
each firm provides an understanding of the nature of the key players in the two P3 models. The
outcome is an appreciation of the characteristics of the emerging Greenfield and Brownfield P3
models.
1.4.1 Case Study Based Approach
The case studies of selected toll road P3 arrangements in the U.S. provide a background for this
research. This serves as a data pool from where the elements to populate the analytical templates
are derived.
Katsanis (2007) quotes Robert K. Yin’s description of a case study as an empirical inquiry that
investigates a contemporary phenomenon within its real life context; when the boundaries
between phenomenon and context are not clearly evident; and in which multiple sources of
evidence are used (Katsanis 2007). The phases of research must satisfy the tests of Construct
Validity- which suggests use of multiple sources of evidence- and Reliability –demonstrating
that the procedures can be repeated- during the phase of data collection (Yin 1994).
Four real life cases (shown in Table 1.2) representative of both the P3 models under
examination, are prepared using multiple sources of evidence, in this case, various source
documents and third-party reactions. Information is gathered from the documents which directly
form a part of the project such as government reports, third party reviews, request for proposals,
lease/contract agreements, operation and maintenance manuals released by the state

8 8
transportation authorities, etc. These are reinforced with the media reactions through articles and
journal papers written about these projects or deals.
Figure1.2- Case Study Approach
After scanning the P3 market in North America the following early P3 deals were identified as
sample projects for the case study.
P3 Brownfield Model P3 Greenfield Model
Chicago Skyway Pocahontas Parkway
Indiana Toll Road SR125
Table 1.2- Selected Public-Private Partnership Cases
Chicago Skyway and Indiana Toll Road are unique as they were the first and so far the only two
projects in the U.S. that have been procured as pure leases representing the Brownfield model.
Source Documents
Third Party Reaction
Case Study

9 9
Pocahontas Parkway is unique in its own respects as the need for the project was identified in the
1980s but the development of the project faced financial constraint. The Public-Private
Transportation Act (PPTA) of 1995 – a legislation allowing private participation in infrastructure
projects in Virginia- allowed the project to proceed as a P3. Pocahontas Parkway is also the
second transportation project in the U.S. to be sponsored by a 63-20, tax-exempt, not-for-profit
organization in the U.S. It was later acquired by Transurban, a private company under a
concession; this gives it a flavor of both- a Greenfield and Brownfield model. However, the
scope of this study is restricted to its Greenfield aspect.
SR – 125 is known as the first highway to be privately financed in the U.S., also ranking among
the first five projects selected by the U.S. Department of Transportation to receive TIFIA credit
assistance in 1999. The project company to sponsor the project was initiated by a group of
private engineering and construction firms which was later acquired by Macquarie Infrastructure
Group.
A project finance structure and risk matrix created for each of the four cases as further discussed
in the analytical template, facilitates an understanding of the structure of these models and their
risk allocation.
1.4.2 Organizational Study
As a sample of the players in the North American P3 market, firms that were a part of the
consortium responsible for the development/operation & maintenance of the selected P3 cases
are picked. Information on each of these companies is collected from the company web-sites,
press news, annual reports and other analyst reports such as Hoover’s, Reuter’s Finance, reports
from credit rating companies and magazine and journal articles.
A two dimensional grid, based on Porter’s Segmentation Matrix, for each firm (with the
companies product/services drawn against the range of sectors they participate in various
geographic locations) is prepared as described in the analytical template bellow.

10 10
1.4.3 Development of the Analytical Template
The analytical template is used as a tool to analyze the information that is assembled by
preparing the case studies. It consists of a Yescombe’s project finance structure, risk matrix and
Porter’s segmentation matrix
1. A project financing structure for each of the case study examples is created using E.R
Yescombe’s project finance structure, as shown in Figure 1.3. Yescombe’s Project Finance
Structure demonstrates a formation of a special purpose vehicle (SPV) or a project company and
lines up the role played by various participants to finance, construct, and operate a toll road
usually through separate contracts with the SPV and under a single concession agreement
between the SPV and the public agency. The risk- reward distribution is done in a manner in
which “risk is assumed by parties best capable to handle them”. This structure uses a
combination of equity and debt, to finance the project, backed by its future cash-flows. Debt
issued is non-recourse, off the sponsor companies’ balance sheet but may be supported by third
party creditworthiness. Thus the project is able to achieve higher financial leverage as
contractual arrangements between the parties impart greater accountability. Following is
Yescombe’s project finance structure.

11 11
Figure 1.3 - Yescombe’s Project Finance Structure. Source: (Yescombe 2002).
Investors Lenders
Equity Project Finance Debt
Finance
Operating Contract
Contractor
Road users Contracting Authority
Government
Operator
EPC Contractor
Maintenance Contractor
Toll Payment
Concession Agreement
Support Agreement
Project Company

12 12
2. A matrix for allocation of the risks between the members of the concession agreement
that assume it is created for all four cases in the following structure:
Risk State Authority Concessionaire
Right-of-way acquisition
Revenue
O&M
Completion
Competitive Facility
Environmental
Political
Force Majeure
Capital Improvement
Table1.3- Risk Matrix Template
3. A Segmentation Matrix, which adopts Porter’s methodology, is developed to determine
the range of services provided, sector participation or clientele and the geographic
distribution of the principal companies in the consortia based on Porter’s research on
competitive advantage. This provides an understanding of various activities of a firm and
the markets in which it operates, leading us to identify the core competency of the firm.
This is achieved by listing down of the various services provided by the company against
the sectors it is involved in forming a matrix. The following diagram represents one
segment of the matrix.
Sector
Products/Services
Figure 1.4 – Porter’s Segmentation Template. Source: (Porter 1985).

13 13
Chapter 2 - Literature Review Chapter 2 provides a summary of the material examined for developing the objective and the analytical template for this research. This thesis is based on the review of material available on infrastructure project delivery methods, transportation finance and public-private partnerships and competitive strategy. The required information is collected from books, journal publications, peer-reviewed papers, articles in new-papers and magazines, websites maintained by companies and the state and federal government, guidelines provided by international organizations, documents released by government agencies, reports published by private companies and other non-government organizations.
2.1 Overview of P3
The International Monetary Fund’s (IMF) report on the issues raised by P3s and their fiscal
consequences provides a glimpse of the various P3 programs initiated by countries around the
word. United Kingdom’s Private Finance Initiative (PFI) began in 1992 and has been responsible
for 14% of its key public infrastructure. Similarly, Partnerships Victoria in Australia is a policy
framework on P3s for infrastructure development. Other EU nations such as Finland, Germany,
Greece, Netherlands, Portugal, Spain have P3 projects with a moderate share in public
investments. Central European countries like Poland, Czech Republic, Hungary have started
using P3 and Canada and Japan have recently adopted the trend. Chile and Mexico have made
significant progress with some developments in Latin America and Brazil is known to have its
own program. U.S has been noted to have a considerable experience in ‘leasing’ (FAD 2004).
This report further mention, European Commission has described P3 as “arrangements for
services earlier provided by the public sector now provided by the private sector”. The author
argues there is no common definition for what comprises a P3, however, the transfer of risk from
the public to private sector is key to successful implementation of these P3 programs. There is
emphasis on the co-operation between the government and private sector in delivering
infrastructure services(FAD 2004).
Several definitions for P3 have been coined by international organizations based on their
individual perceptions and there is no universal agreement on what constitutes a P3. Based on the
similarities of these definitions Garvin (2007) provides a working definition for the infrastructure
community:” Public-Private Partnership (P3) is a long-term contractual arrangement between

14 14
the public and private sector where mutual benefits are sought and where the private sector
provides operating services and/or puts private finance at risk”. This definition distinguishes
“privatization”, marked by transfer of asset, from P3 arrangements that are governed by contracts
and accompanying body of contract law (Garvin 2007b). Further, Garvin (2007) discusses the
competencies such an organization must possess to institute P3 for infrastructure.
Various state documents such as the Value for Money Assessment Guidance document prepared
by the government of United Kingdom, Australia’s Partnership Victoria, Canada’s Public Sector
Comparator, provide guidelines for procurement of P3 projects and all maintain that P3
arrangements are to be pursued if they deliver value for money (Garvin 2007b). Akintoye et al
(2003,2005) discuss the participation of the private sector to resolve financial constraints in the
provision of public facilities and add value though their management skills, increasing
efficiency, effectiveness, quality of facilities and services delivery(Akintoye. et al 2003; Li. et.
al. 2005).
Quiggin (2005) describes the emergence of the Public Private Partnership models to facilitate
reduction in the public sector debt and to yield value for money by achieving an optimal
allocation of risk. He points out that, revenue risk can be best managed by the private sector
through efficient operations. Russell and Nelms (2006) has formulated a procurement decision
making process based on a risk adjusted Public Sector Comparator (PSC)(Russell and Nelms
2006).
2.2 Project Finance
Yescombe (2002) has defined Project Finance as a method of raising long-term debt based on the
projected cash-flow from the project which is yet to be established. He has laid out a structure of
a project finance company, formed by the owner, investors, lenders, contractors and operators of
the project. The project company or a special purpose vehicle enters into a contract with other
project participants such that projects risks are distributed. Some advantages of Project Finance
have been noted as follows: the project does not appear on the balance sheet of the parent
company; the ability to attain higher leverage than a regular debt financing, provides greater
return on equity; it provides tax benefits in the early initial years as interest payments are tax-

15 15
deductible. Project Finance is an effective way to finance individual project however it may not
be used as recourse to finance unviable projects (Yescombe 2002).
The area of Project Finance has been well explored by John.D.Finnerty in his book, Asset Back
Financing. His work explains the theory and methods of asset-back financing and identifies the
associated risks (Finnerty 1996). Further it differentiates contractual agreements into Off-Take
Contracts and Concession Agreements. Accordingly, Off-Take Contracts are those in which the
purchaser is provided with a secure supply of product/service as agreed upon and Concession
Agreements involve payments based either on the usage or the availability of the service.
Esty (2004) provides a bunch of case studies on infrastructure such as highways, pipelines,
power plants, that have been developed using Modern Project Finance.
D.J. Gribbin the Director of Macquarie Holdings (USA) Inc, in his testimonial before the House
Transportation and Infrastructure Committee Subcommittee on Highways, Transit and Pipelines
mentioned the benefits of the debt-equity financing model which allowed the concession
company to pay more than twice the value the state placed on the Indiana Toll Road while
considering the lease of the Toll Road (Florian 2006; Gribbin 2006).
2.3 Infrastructure
Over the past few years a number of organizations have estimated a wide gap between the
government spending and the actual need for capital investment in infrastructure. Gramlich
(1994) has attempted to rationalize whether there really is a shortfall in government spending on
infrastructure and has addressed the need for a change in the policy for infrastructure
investments. He hints at the possibility of funding infrastructure using user fees (Gramlich 1994).
Mansour Nadji (2006) have discussed the policy issues for “privatization” of infrastructure in the
U.S. They contend that the state/local government is not only pressed to fund the deficits but at
the same time have other competing commitments towards health care and retirement. In this
situation they believe, Public-Private Partnerships are an alternative to traditional financing of
infrastructure. These partnerships they say are also driven by the interest of the investor class
such as pension funds looking for long term investments(Mansour and Nadji 2007).

16 16
Orr (2005) has illustrated examples of projects where a mature form of Project Finance has been
implemented that involves mobilizing debt and equity for major infrastructure initiatives. He
terms this new trend as the ‘infrastructure privatization paradigm’ where project sponsors,
institutional investors, government, multi lateral agencies, and bankers are involved for self-
interest, which has also lead to the emergence of infrastructure as an asset class(Orr 2005).
Representatives of intermediaries like Goldman Sachs & Co, Citibank etc who may be viewed as
the major underwriting firms and facilitators of the toll road lease agreements have confirmed P3
as an effective financing tool for toll roads, supported by the investor class looking for a steady
and a moderate risk/return type of instruments.
2.4 Risks
Typically risk has been defined as outcomes that can be described in statistical terms, where as,
uncertainty characterizes situations in which potential outcomes are not fully understood
(Lessard and Miller 2000). Research has been conducted to identify these risks and develop
management tools to mitigate them. Lessard and Miller (2000) have classified project risks into
three distinct categories i.e., Completion Risk, Market-Related Risks and Institutional Risks.
They studied the dynamic evolution of these risks over the life-cycle of the project. Further they
have developed a template showing managerial approach to risk and a ‘Layering Model’ as a
strategy to face risk.
Songer (1997) demonstrates a Monte Carlo risk analysis method to evaluate which of the
uncertain quantities most significantly contribute to the project risk in the construction
industry.(Songer, Diekmann et al. 1997)
Beidleman et al (1990) have identified the risks associated with different phases of a mega
project and suggest allocation of the appropriate risks to parties best capable of handling them as
means of mitigating these risks(Beidleman et al.).
Zhang (2005) has identified social, political and legal risk as barriers to successful P3s on the
basis of a survey(Zhang 2005). The document International Monetary Fund identifies the
various project risks as construction risk, financial risk, performance risk, residual value risk
that are assumed by those party to the P3 agreement. It is also indicated that private sector

17 17
participation results in lowering of the overall project risks, however, the private sector should be
suitably rewarded for assuming these risks(FAD 2004).Project specific risks eventually get
diversified over various parties, however, the demand risk must be priced as these may depend
on government policies.
Nissar (2007) has concluded that emphasis needs to be placed on the strategies for the transfer
of risk for successful completion of P3 contracts. Li et al (2004) discuss the type of risks that
should be assumed by the private sector and the type of risks that should be held back by the
public sector(Li et al 2004).
Esty (2004) provides case studies that give examples of different project contract structures
concentrating on the management of risk and the allocation of control. He concludes that all
researchers have identified revenue risk as the most significant of all the project risks. Irving
(2002) discusses how Macquarie Infrastructure Group has diversified their risks through a global
portfolio of toll roads(Esty 2004).
A special report by analysts at Fitch Ratings, George et al (2006) discusses the toll road lease
arrangements with a credit risk angle and identifies the strengths and risks of some specific
leases (George et al 2006).
Most of the literature on project risks seems to have a common theme that suggests “appropriate
risk allocation to parties best suited to manage them” is key to risk mitigation.
2.5 Organizational Analysis
Porter’s series of books and papers in the area of strategic management have provided a ground
work for determining a firm’s strategic theme by mapping its activity system. His work suggests
a firm’s indifference to competitive advantage is responsible for its strategic mediocrity and
under average performance. The three core strategies of a company described by him are cost
leadership, differentiation and Focus. To help firms understand which market segment to focus,
Porter proposed two-dimensional industry segmentation, each segment representing a product or
service against a buyer type. Porter has defined a process for developing a segmentation matrix

18 18
which is an analytical tool that reflects the strategic differences of companies (Porter 1980, 1985,
1996).
The activities of a firm are the sign posts of its strategic initiatives Cheah and Garvin (2004).
Performance of a firm can be determined from its financial and accounting data. The income
statements and balance sheets of a firm are indicators of its performance and activities Cheah and
Garvin (2004) have demonstrated how financial ratios which were traditionally applied for
security pricing can be used as an indicator of the firm’s performance and general practices. This
research has created a link between financial data and strategic management. Their work
illustrates the use of financial and operating performance data to calculate financial ratios that
can be used to judge a firms operational performance(Cheah and Garvin 2004a).
Cheah et al (2002) used financial data to study the performance of 24 construction firms
originating out of the U.S, Europe and Japan. Their analysis helped identify different corporate
strategies among these sample firms (Cheah. et al 2002). Based on these findings, Cheah and
Garvin (2004) proposed a new conceptual model for corporate strategy in the construction
industry(Cheah and Garvin 2004b).

19 19
Chapter 3 - Case Studies
3.1 Pocahontas Parkway
3.1.1 Introduction
Pocahontas Parkway in Richmond, Virginia is the first successful implementation of the Public
Private Transportation Act of 1995. It has known to become a front-runner for other projects
developed under the PPTA in Virginia. Pocahontas-Parkway-Association, a 63-20 not-for-profit
organization was formed by VDOT and FD/MK to finance and construct this project. In 2006,
Transurban an Australian group acquired the Pocahontas Parkway from the Association and at
present is the authority responsible for its operation and maintenance. The Pocahontas Parkway
has both Greenfield and Brownfield aspects to it. For the purpose of this study we shall explore
its Greenfield side.
Geographic Location
The nine-mile, four lane Route 895 also known as the Pocahontas Parkway is a direct connection
between the Chippenham Parkway (State Route- 150), I-95 at Bensley and I-295 south-east of
Richmond International Airport in Virginia state. The James River has a historical significance
as a major shipping route for distribution of goods along the eastern coast of U.S. Over the years
with the development of highways, trucks have become a major mode for freight movement.
Interstate -95 falls among a major truck route in the Richmond area(Richmond Regional
Organization 2008). As for the residents of the Henrico and Chesterfield counties in Richmond,
the Pocahontas Parkway is an alternative route for crossing the James River. Earlier, it was
inevitable to circumvent the valley before reaching across the river and the nearest crossing was
about 10 miles apart. Route 895 also provided the commuters a direct connection to the
Richmond International Airport (before the approval of the Airport Connector) (ENR 2002).

20 20
Figure 3.1- Pocahontas Parkway Map. Source: Pocahontas Parkway website,(Transurban 2007).
The Project Inception
During 1980-1983, VDOT identified the need, and studies were conducted to examine the
feasibility of an east-west corridor connecter. Following Commonwealth Transportation Board’s
(CTB) approval, the Federal Highway Administration (FHWA) granted the state a tentative
permit to utilize the interstate 4R -discretionary funds allocated to states for Reconstruction,
Restoration, Rehabilitation, Resurfacing of transportation projects- for the studies and
preliminary engineering (Kozel 2006).However, insufficient funds to construct the connector
project, suspended its execution. A senior official with Fluor Corporation confirmed that Fluor
Daniel and Morrison Knudsen’s (FD/MK) unsolicited proposal after the passage of the Virginia
Public-Private Transportation Act (PPTA) caused the materialization of the project fifteen years
after its conception.

21 21
3.1.2 The Procurement Process
Public Private Transportation Act
The Virginia Public-Private Transportation Act (PPTA) passed in 1995, allows private entity to
collaborate with the public agency in order to design, build, operate and finance transportation
projects. The construction of the Pocahontas Parkway is known as the first PPTA project which
has been a pioneer to other projects in Virginia such as the Jamestown Project, conceptualization
of I-81 improvements and I-495 HOT lanes (NCPPP 2003) .
FD/MK’s Unsolicited Proposal
In 1996, FD/MK a group formed by Fluor Daniel, Inc and Morrison Knudsen Corporation
(MKC), Ohio - a wholly owned subsidiary of MKC Delaware, who were already working jointly
on the E-470 project in Colorado, submitted an unsolicited proposal to the department for the
design, construction, operation, and maintenance of certain transportation facilities. The
implementation guidelines set forward by the PPTA required VDOT to post a notice of
competing proposal to allow fair and transparent procurement process while encouraging
competition. Accordingly, a notice was posted and published while the FD/MK proposal was
submitted for preliminary review to the Independent Review Panel (IRP). However, no
competing proposals were received in response.
IRP referred the conceptual proposal for further review on March 21, 1996 to the
Commonwealth Transportation Board (CTB). After approving the further evaluation of the
proposal, CTB invited detailed proposal for consideration by the Public-Private-Transportation
Advisory Panel. In July 1996, the detailed proposal was submitted to the Advisory Panel. The
proposal evaluation and selection criteria were used as per the implementation guidelines set
forth by the PPTA.
In May 1997, the project was recommended to the commissioner for development provided there
were successful negotiations between both Virginia Department of Transportation (VDOT) and
FD/MK. Further, a Comprehensive Agreement was executed and delivered, following which the
negotiations between VDOT and FD/MK were commenced on May, 21, 1997.

22 22
According to a senior official with Fluor Corporation, incidentally in 1998, Fluor Daniel was
finishing up the E-470 project in Colorado in partnership with Morrison Knudsen. Their joint
venture, FD/MK found it easy to transfer the leadership and experience from the E-470 project to
this one in Virginia ( Personal Communication with Herb Morgan, February 2008).
Under a Comprehensive Development Agreement between Virginia Department of
Transportation and FD/MK the Pocahontas Parkway was Design-Built by a joint venture of
Fluor Daniel (FD), a subsidiary of Fluor Corporation and Morrison Knudsen Corporation (MKC-
Ohio) a subsidiary of MKC Delaware to form an entity called, FD/MK.
Formation of the Association
In order to assist FD/MK finance the project (explained in detail later), VDOT and FD/MK
together formed a Virginia, 63-20 non-stock, not-for-profit corporation called the Pocahontas
Parkway Association (PPA). Creation of a 63-20 corporation enables the issuance of tax-exempt
debt for private development and keeps interest costs lower than financing through commercial
debt (VDOT and FD/MK 1998).
According to an official with Fluor Corporation, a 63-20 corporation has been a “preferred
mode” of financing projects in the late 1990s, before the full-fledged advent of the concession
model for Public-Private-Partnerships. Since the Henrico County was reluctant in issuing
revenue bonds, they used the 63-20 corporation instead (Personal Communication with Herb
Morgan, February 2008).
The members of the PPA comprised of five voting directors and two non-voting directors. Three
out of the five directors were appointed by the incorporators and elected by a majority vote of
quorum of the voting directors. VDOT was responsible for appointing two voting directors and
one non-voting director, while the balance non-voting director was appointed by FD/MK(VDOT
and FD/MK 1998).
Pocahontas Parkway is known to be the second transportation project financed nationwide using
a 63-20 corporation (FHWA 2002).

23 23
Parties to the Agreement
A series of agreements, viz, a Comprehensive Development Agreement, Design-Build Contract,
Project Financing Agreement, Contractor Loan Agreement, Guarantee of Contractor Loan
Agreement, Master and Supplemental Indenture, SBI Loan Agreement and a Memorandum and
Assignment were signed between these agencies, which defined the roles and responsibilities of
each participant. Virginia Department of Transportation (VDOT), the Commonwealth
Transportation Board (CTB) , FD/MK, the Pocahontas Parkway Association (PPA), the Trustee,
Fluor Corporation, Morrison Knudsen Corporation (Delaware) and Morrison Knudsen
Corporation (Ohio) were the members, party to one or more of the above mentioned agreements.
Pocahontas Parkway Association (PPA)
The association’s prime responsibility/obligation was to raise pubic debt through issue of tax-
exempt bonds before the date of financial closure. After the construction of the project the on-
going duties of an operator were performed by VDOT. The PPA held a “limited recourse
obligation to pay for the costs of managing, operating, insuring, promoting, maintaining,
policing, and providing incident response for the project”. The source for making these payments
were the funds or revenues obtained from the project’s operation. Supplemental to these the
association bore responsibility towards “marketing, promoting, advertising, financial accounting,
and reporting responsibilities, budgeting responsibilities, and responsibilities that the department
may direct the PPA to perform relating to the project enhancement, complacence orders and
improvements respecting reserved rights” (VDOT and FD/MK 1998)
Fluor Daniel/ Morrison Knudsen (FD/MK)
As the principal designer and contractor of the project, FD/MK was responsible to perform the
design, project right-of-way acquisition, obtain regulatory approvals and utility relocation for the
construction and performance of the project. They were required to insure the project and issue
payment and performance bonds for the work in accordance with the Design-Build contract
signed between VDOT and FD/MK. Technically, until the completion date FD/MK were to
assume the role of an operator after which these rights were transferred to the PPA.

24 24
FC and MKC (Delaware and Ohio), parent corporations of FD/MK, jointly or severally, had to
provide a guarantee towards the performance and completion of all of FD/MK’s obligations as
agreed upon. In addition, they were required to provide a revolving line of credit worth $ 5
million, in the form of a Contractor’s Loan, which would be utilized to pay the interest on bonds
issued by the PPA in the event this obligation could not be met due to unavailability of funds.
The interest applied to this loan would be equal to the interest paid on the State Infrastructure
Bank loan. The availability of this credit was also required to be guaranteed by the parent
corporations Virginia Department of Transportation (VDOT). As the owner of the project,
VDOT established the terms and conditions under which the project was to be implemented.
Accordingly they were responsible for:
1. Authorizing PPA to issue bonds and requesting CBT to approve State Infrastructure
Bank (SIB) Loan.
2. Granting FD/MK the permission to develop as per the terms and conditions of the
agreement, and accept their work upon successful completion.
3. If required, condemning right- of- way for the project.
4. Performing operation and maintenance services including O&M of electronic tolling
systems and facilities, and carrying out manual collection of toll, providing incident
response such as snow and ice removal, carrying out temporary/partial/full closures of
the project and making available emergency and police services.
5. Providing traffic management activities.
6. Maintaining and renewing regulatory approvals necessary for the toll road operation.
7. Allocating funds and paying if required for the current expenses and extraordinary
maintenance or repair that exceed funds available for this purpose and also provide
oversight services.
Most importantly they held the responsibility to “protect the operator from economic impacts of
competitive transportation facilities” (VDOT and FD/MK 1998).

25 25
3.1.3 Project Finance Structure
At the time the agreement was made, FD/MK agreed to complete the project for a lump-sum $
324 million. The tax-exempt revenue bonds issue helped raise $ 354 million. Bear Stearns and
Co Inc was the lead underwriter in selling the bonds. According to the Managing Director of
Bear Stearns, the PPA bonds were the first ever privately issued tax-exempt bonds for a new Toll
Road to receive Investment-Grade rating from the three leading bond services rating agencies,
viz, Moody’s, Fitch’s and Standard & Poor’s(Business Wire Editors 2003) .
State Infrastructure Bank Loan (SIB)-acts as complementary grant programs that provide the
state financial assistance for essential surface transportation projects- authorized by the CBT
from the Federal Subaccount of Toll Facilities (a revolving account) amounted to $ 18 million in
principal. In addition, $ 9 million were made available through federal/state funds for design
work (Kozel 2006). According to the FHWA, this total sum of $27 million is the only part that
came directly from public funds, rest were financed by the tax-exempt bonds, thereby
minimizing risks to tax-payers and localities.
A Trust Estate was formed and, Cester Bank- a financial institution with a license to operate in
Virginia- was appointed as its trustee. VDOT as the owner, FD/MK as the Design-Build
contractor, the CTB as the facilitator, the PPA and the Trustee, were bound by one or more of the
following agreements to finance: the Master Indenture, the First Supplemental Indenture, the SIB
loan agreement and the Contractor loan agreement(VDOT and FD/MK 1998).
The SIB loan agreement was executed and delivered by the CTB, PPA and the Trustee. In
addition, $5 million revolving line of credit assistance was made available by FD/MK in favor of
the PPA as a precondition to the authorization of the SIB by CTB and the tax-exempt debt by the
underwriters, Bear Stearns.
There was also an allowance for extraordinary completion bonds to be issued by the association
to VDOT or the CBT in case there were insufficient funds from bond series and SIB to finance
the completion of the project(VDOT and FD/MK 1998).

26 26
3.1.4 Terms and Conditions of the Agreement
Design- Build Contract
In June 1998, VDOT and FD/MK signed the Design-Build contract. The contracts that VDOT
held with any previous design contractors, while studying the feasibility of the east-west
connector project in the 1980s (VDOT claims it amounts to 60% of the preliminary design work-
both percentage completion and quality of this work is controversial )(Kozel 2006) had expired
by January, 1998.
After the procurement process was completed, FD/MK assumed the role of the prime Design-
Build contractor under a contract agreement with VDOT. FD/MK retained the design contractors
appointed by VDOT and signed separate contracts with them. As required by the agreement,
FD/MK was responsible to acquire right-of-way (RoW), regulatory approvals, utility clearances
and proceed with the construction after the department would issue the notice to proceed(VDOT
and FD/MK 1998).
FD/MK were entitled to receive a development fee of $ 6 million as a reward for the risk
assumed during the pre-development stage. This amount was paid out of the bond money raised.
The payments were made on the 15th of every month after a submittal of draw of request to
VDOT. Pre-closure payments to FD/MK were capped at $ 1.5 million which were mainly
attributed to the design costs. All payments except the $1.5 million, discretionary directed
charges were to be received through the Trustee and not directly through VDOT(VDOT and
FD/MK 1998).
According to the deal, FD/MK was not to self-perform the construction and hence they
competitively bid the construction of the road and the small bridge among local contractors
(NCPPP 2003). W.C English won this part of the job. The more crucial portion of the project
was constructing the interchange at I-95 and the bridge crossing over James River. Since the
port of Richmond is upstream of the project, it was necessary to have a 145 feet vertical
clearance during normal high tide for the ships to reach the port. A cast-in place segment was
considered most feasible and hence, the work was sub-contracted to Recchi/Mclean who had
completed a similar structure in Florida (NCPPP 2003).

27 27
Time-Line
Substantial completion was required to be attained by 45 months post financial closing date.
However, the final acceptance was required to come in effect, 90 days post substantial
completion. FD/MK were obliged to pay liquidated damages in the amount of $ 25,500 a day for
each day after the final acceptance date. These payments were capped at $ 25,000,000. The
contract gave VDOT, the right to authorize a change in work within the scope of the Design-
Build contract by issuing a change order modifying the completion date. FD/MK was required to
cause its parent companies to provide a completion guarantee to the department. Apart from this,
the contractor was required to maintain a professional liability insurance and property insurance.
The contractor was required to provide VDOT, performance and payment bonds(VDOT and
FD/MK 1998).
Flow of funds
Proceeds from the SIB loans and the bond issue were deposited with the Trustee in a common
Revenue Fund. The revenues generated from the project operation were also deposited into this
common fund. As for the order of distribution, toll revenues would first pay back the bond
holders and then pay VDOT for its operations and maintenance expenses. An approved
requisition from VDOT was required for the Trustee to withdraw funds(VDOT and FD/MK
1998).
The Revenue Fund was divided based on its application into
1. A Rebate fund, used to create a rebate fund so as to obtain a tax exempt certificate.
2. Debt service reserve fund, to pay interests due on senior bonds, principal installments that
become due, amount payable to the banks, security dealers, and financial institution.
3. Construction fund, to cover capital costs during construction phase, costs of developing
the project (covered by the proceeds of the bond), amount required to be paid as per the
master indenture to the contractor, any moneys received by issuer from any source,
casualty insurance proceeds.
4. Department oversight fund, for VDOT to draw from to pay for its oversight services.
5. Contingency Fund, for both the department and FD/MK to draw from.

28 28
The Revenue Fund was expected to
1. Cover the cost of engineering, right of way acquisition , utility relocation, non-
construction costs approved by the department ( all funded by the SIB loans)
2. Reimburse VDOT for extraordinary maintenance that have not been reimbursed by other
funds.
3. Provide for preliminary design work and discretionary directed changes.
The remainder of the revenue fund was to be transferred to the surplus fund. After defeasement
of bonds any funds remaining in reserve funds were supposed to be returned to the
department(VDOT and FD/MK 1998).
Contract Termination and Dispute Resolution.
Automatic termination of all agreements was to occur once the association had paid off all the
principal and interest on all bonds, SIB Loan and Contractor Loan or on the date of defeasance of
all bonds. The project could have been terminated for public convenience after the first to occur
of the Financial Closing Date and December 31, 1998 or after the issuance of bonds, provided
they arrange for funds to defease the outstanding bonds and repay the SIB loan and the
Contractor Loan and also arrange for funds to complete the remainder of work as per the Design-
Build contract (VDOT and FD/MK 1998).
VDOT reserved the right to terminate the Design-Build contract in the event of default by
FD/MK. They were required to be notified about such a termination in advance however, the
contractor loan agreement and its guarantee would not be reimbursed. As a remedy to the
default, there was a provision for the contractor to rectify the fault within 15 days (with
additional 180 days if required to effect the cure) of notice of such a default.
If the bonds were not issued and sold by December 31, 1998, FD/MK had the unilateral right to
terminate the contract. Similarly VDOT had the right to terminate all project agreements if the
bonds were not issued and sold by the above mentioned date. The Association however, was
bound to all project agreements at all times irrespective of any defaults by VDOT, FD/MK or
any other party(VDOT and FD/MK 1998).

29 29
Oversight Services
VDOT held the right to oversee the project with respect to its design, permitting, financing,
acquisition, construction, installation, equipping, maintenance, repair, preservation, modification,
operation, management and administration. All services including services relating to the project
right-of-way acquisition and utility relocation and oversight of operator’s non-delegated
responsibilities for management, administration and promotion of the project, except for the
oversight of design or permitting for the project were compensable to VDOT (VDOT and
FD/MK 1998).
Competitive facilities
Since a competing transportation facility could impact, toll revenue and thereby affect bond
repayment, the agreement restricted the department from initiating, authorizing, owning,
operating and financing private parallel transportation facilities during the term of the agreement.
VDOT was required to exercise all discretionary authority available to them in order to prevent
any private development of any such competition. However, they were permitted to distribute
federal funds and advise or make recommendations, if mandated by the federal laws. Any such
competing facility was required to comply with the regulations set for competing transportation
facilities. However, the PPA was not eligible for any compensation under such an event.
User Fee
The construction of Route 895 began in October, 1998 and the project was aimed to be
completed by April, 2002. However, the Toll Road was opened to traffic in stages beginning
May, 2002, attaining final completion in September, 2002 (Kozel 2006).The Parkway traffic is a
mixture of automobiles, trucks and buses. The projected average daily traffic at the time of
opening over the James River Bridge was 15,000 and as of November, 2005 it was 16,700
(Kozel 2006). The initial traffic projections and projection of current expenses were based on
studies performed by independent consultants.

30 30
The operator had the right to charge toll for the use of the Parkway during the term of the lease.
Tolls were imposed only at the tolling plazas viz, Mainline Plaza and Laburnum Ramp Plaza.
The Mainline Plaza is located on the east-side of the bridge (with open road toll lanes at the
center and cash lanes off to the right on both sides) and Ramp Plaza at the interchange about
mid-way at VA-5(Reason Foundation). The passengers have the option of installing transponders
under the Smart-Tag facility or purchase E-Z passes to avail the electronic tolling system.
VDOT operated the project without charging the vehicles using it for the first 60 days in order to
attract ridership. James Carroll from VDOT, stated that due to favorable (low) interest rates on
the bonds issued, they were in a position to reduce the opening toll from the proposed 2.00$ to
$1.50 for vehicles with two axels. Thereafter, it was a dollar increase in toll for every additional
axel (Business Wire Editors 2003).Beginning the second year of the operation of the project, toll
rates were fixed based on the revenue generated by the project in the previous year. The
projected revenues were required to meet two conditions:
1. be equal to at least 1.25 times the aggregate debt service on public debt.
2. be equal to the aggregate debt service on all outstanding Bonds for each fiscal year plus
the projected current expenses for that year.
Main Line Plaza Toll
1) Passenger Car and 2 Axel Truck or Bus $ 1.50
2) 3 Axle Truck or Bus $ 3.00
3) 4 Axle Truck $ 4.00
4) 5 Axle Truck $ 5.00
5) Vehicle with six or more axles $ 6.00
Laburnum Ramp Plaza-all Vehicles $ 0.50
Table 3.1- Pocahontas Parkway Initial Toll Schedule. Source: Comprehensive Agreement (VDOT and FD/MK 1998).

31 31
3.1.5 Troubled Waters
Foreseeable Risks
The agreements required all three rating agencies, Fitch’s, Moody’s and Standard and Poor’s, to
rate the issued bonds. Accordingly, Fitch Rating initially presented a stable outlook, rating the
Bonds at BBB-(Business Wire Editors 2003). Significant completion risk surfaced when FD/MK
announced in April 2002 that they would be unable to meet the Guaranteed Completion Date.
(liquidated damages would applied to a delay beyond the Guaranteed Completion Date). The
sub-contractor, Recchi America had faced labor shortages while performing the critical bridge
work. Also there was quality of work issue at the James River Bridge. These challenges might
have slowed down construction(George and Streeter 2001).
On the retrospect, an official with Fluor Daniel feels, since the Pocahontas Parkway project was
VDOT’s first venture in implementing the 1995 PPTA, the lengthy negotiations were time
consuming. Part of the delay could be attributed to the learning curve involved (Personal
Communication with Herb Morgan, February, 2008). (VDOT now has an Innovative Delivery
Group to facilitated PPTA projects, formed towards the completion phase of the Pocahontas
Parkway).
The rating agencies considered the following as important risk mitigating factors: The capitalized
interest through Aug 2002, the fixed-price nature of the Design-Build contract, Completion
Guaranty provided by the parent companies, Subordinated Contractor Loan Agreement(George
and Streeter 2001). The sub-contractor default risk was mitigated by the contractor’s
responsibility in the event of such a default.
The initial delay was considered “withstandable”, not necessitating a review of the toll roads
senior bond rating. However, they stated that any further delay (beyond September 2002) would
call for such a review. There was a feeling among the bond rating agencies that the delay would
increase ramp-up risk which is usually mitigated by the otherwise available time interval in
which the revenue is expected to ramp up(George and Streeter 2001).

32 32
Another potential risk projected was, Washington Group International’s (the group which
acquired MK at that time) short term liquidity problems on account of its acquisitions. This made
it difficult for MK to secure performance bonds for other projects. Nonetheless, the nature of the
contracts negated such a risk, as Fluor Daniel was obliged to perform even if MK was to
default(George and Streeter 2001).
Traffic and Revenue
Initial traffic and revenue forecasts were made with an expectation of significant development in
the eastern part of Henrico County. The demand at the time of opening was pegged at 15,000
vehicles per day with trucks accounting towards 10% of this volume. Unfortunately, this
prediction did not materialize as this market suffered a downturn instead (Personal
Communication with Herb Morgan, February, 2008).
In August’04, as ridership on the Pocahontas Parkway fell short of projection. The toll revenues
were only $ 7 million a year, only half of the forecast for that time (Samuels 2005). To make up
for the loss in revenue, the PPA raised tolls on motor cars by one-third. This negatively hit the
bond rating, and it was downgraded to BB-. The failure to meet forecasted traffic and revenue
levels made it susceptible to payment default on subordinate lien bonds (Waltz 2004)
3.1.6 The Rescue
In 2006 after months of negotiation with the PPA, Transurban an Australian, Toll Road operator,
made a modest offer of $603 million to manage, operate, collect tolls and maintain the Parkway.
The Pocahontas Parkway is known as Transurban’s first acquired project in the U.S. This
upfront payment was expected to repay all of the PPA’s outstanding debt along with interest and
reimburse VDOT for the costs incurred while operating and maintaining the road (Euromoney
2007). Transurban acquired PPA’s interest under the existing comprehensive agreement with
VDOT in 2006, only amending the lease term to 99 years (Gibbons and McGuigan 2006). The
highlight of the terms was a revenue sharing agreement between Transurban and VDOT apart
from the $ 603 million upfront payment. As a part of the entire lease package, Transurban is
required to finance and build a $ 150 million, 1.6 mile road connector to the Richmond

33 33
International Airport, subject to the availability of a TIFIA loan (TIFIA loan is form of federal
government loan for financing transportation projects).
Currently, Transurban operates the Pocahontas Parkway as per the toll schedule defined until
2016 after which they have the authority to increase the annual toll rates by the greater of the rise
in GDP, CIP, or 2.8%(VDOT and FD/MK 1998). With the recent approval of the TIFIA loan
Transurban are working with VDOT on the development of the Airport Connector (a spur from
the Pocahontas Parkway to one of the terminals) - by far the best connectivity to the International
Airport in Richmond’s history.

34 34
3.2 SR-125 (Southbay Expressway) 3.2.1 Introduction
SR 125 or the South Bay Expressway is an 11.5 mile highway that connects SR 905 in Otay
Mesa near the U.S –Mexico international border and SR 54 near the Sweet Water reservoir. It is
considered as the “missing-link” in California’s highway network and runs through the
communities of Lomas Verdes, Otay Ranch, Rolling Hills, Rancho San Miguel, Sunbow and
East Lake. Opened to traffic in November, 2007, the expressway is expected to reduce the
congestion between Otay Mesa and Eastern Chula Vista. It also provides access to Downtown,
Sorrento Valley, Santee, I-8, I-15, and Mexico (SBX 2008).SR125 is San Diego’s first toll road
project, and a part of the pilot program initiated by Caltrans that followed the AB680 – which
gave Caltrans the authority to involve private sector to develop, finance and operate
transportation projects. The northern 2 mile section of SR 125 from SR 54 south to San Miguel
Road is an eight-lane freeway costing $138 million sponsored by a mixture of voter approved
local tax measures, state and federal funds. The remainder southern 9.5 miles is a four-lane tolled
road, financed by a consortium of private firms (FHWA 2008b)
Figure 3.2- Map of South Bay Expressway. Source: Southbay Expressway website, (SBX 2008)

35 35
Need for the project
125-South has been a part of the California’s Local Transportation Plan called the “Transnet”
since 1959. However, the state was short of the capital required to sponsor the project. The North
American Free Trade Agreement augmented the cross border traffic between U.S. and Mexico
and the subsequent economic growth in southern San Diego region increased demands on the
existing highway network of I-5, I-15, I-805 which serve the San Diego county. As the state’s
federal funding declined, a supplemental funding plan was floated by San Diego Association of
Governments (SANDAG) through which one-half –cent sales tax was collected to fund essential
transportation facilities. The state employed these funds to develop the 3 mile segment of SR-
125 but the funds to construct the remainder of the 9.5 mile segment were to be available not
before 2020. This uncertainly of the availability of funds and increased project cost due to
inflation if the project was delayed, urged Caltrans to seek alternative methods such as toll,
private equity, credit enhancement options (TIFIA) for financing the project (FHWA 2008a)
In the back-drop of these events, California had passed AB680 in 1989, a bill which allowed the
private financing of toll road projects in the state of California. SR-125 became one of the four
pilot projects (SR125, SR-91, SR-57 and Mid State Toll Road) as part of California State’s
efforts of testing the use of private finance for surface transportation. It remains the only one of
the four projects undertaken that is operated by a private agency despite its share of hurdles.
In 1991, Caltrans signed an agreement with a consortium called the California Transportation
Ventures (CTV) lead by Parsons Brinkerhoff (PB) to design, build, finance, operate and maintain
9.5 mile portion of SR-125 for 35 years, after which the control was to be transferred back to
Caltrans. The $130 million, three mile portion as mentioned earlier, was funded by a mix of
federal funds and local funds through TransNet and is operated and maintained by Caltrans.
Initially, the 9.5 mile section was estimated at $ 390 million excluding the financing cost during
construction which was proposed to begin in 2002 and complete in 2005 (CTV 2003).
3.2.2 Selection of the proposal
Based on the evaluation criteria set by the AB 680, a ‘Privatization Advisory Committee’ was
formed that prequalified ten proposers for the pilot project. Eight of them submitted a

36 36
‘Conceptual Proposal’ to develop and operate/maintain a transportation facility and finally four
of these proposals that satisfied the following criteria were selected for implementation (Miller
2002 )
At least one of the four selected projects had to be constructed in the Northern and one in the
Southern portion of California.
1. There had to be another alternative route to each of the proposed routes.
2. The state would remain the owner of the facility at any given point of time and the public
entity would only hold a franchise for 35 years and the control would be transferred back
to the Caltrans after the completion of this period.
3. The private entity was expected to recover its capital costs, life-cycle costs and earn a
reasonable return during the lease period of 35 years through toll revenue, sufficient to
repay the expenditure.
4. All projects were required to be fully financed by the vendor with no state or federal
investment.
5. The developer would repay costs incurred on account of additional services provided by
the state, such as highway patrol or maintenance services.
Outcome of the selection process were, the four demonstration projects, SR-91, SR-57, SR-125
and the Mid State Toll Road. SR-125 was also identified by Caltrans as a part of its long term
transportation planning.
The California Transportation Ventures (CTV), a special purpose vehicle formed to design,
build, finance, operate and maintain the 9.5 mile segment of the SR-125 was initially owned by
Parsons Brinkerhoff and Egis Projects. Parsons Brinkerhoff was also the design contractor in
association with Quade and Douglas Inc. and J.Muller International. The project, both the
northern publically funded segment and the privately funded toll road operated by CTV, was
constructed by (as mandated by the agreement) a partnership of Fluor Daniel and Washington
Group, called the Otay River Constructors as a fixed price and time contract. Nossaman,
Gunther, Kox & Elliott, LLP Salomon Smith Barney, PB Consult, Orrick Herringon & Sutcliffe,
Wilbur Smith Associates acted as project advisors (FHWA 2008b) .

37 37
After a year of owning the special purpose vehicle, Parsons Brinkerhoff seemed disinterested in
continuing as an equity member and CTV was bought from them by Macquarie Group, which at
present is responsible for the operation and maintenance of the toll road(Samuel 2005). This buy-
out of the CTV marked Macquarie’s entrance in the U.S. market.
3.2.3 Innovative financing mechanism
The project utilized, at that time, a unique combination of private capital markets, sponsor’s
equity and credit enhancement facilities such as the Transportation Infrastructure Finance
Innovation Act (TIFIA) assistance. TIFIA was enacted as a part of the Safe Accountable Flexible
Efficient Transportation Equity Act (SAFETEA). It is an instrument through which the federal
government provides assistance in the form of direct loans and/or credit lines (rather than grants)
to public and private sponsors of critical surface transportation projects. The U.S. DOT provides
assistance in the form of secured (direct loans), loan guarantees, and stand by lines of credit. The
stand-by line of credits can be drawn upon to supplement the project revenues during the first 10
years of operation (Dutton 2009).
The aim of the program is to fill the market gaps for financing transportation projects with a
potential for generating its own revenue stream through user charges and other funding source,
enhance the creditworthiness of the project and improve access to capital markets, facilitating
financial close, and to serve as traffic guarantee during the ramp-up stage of the project (FHWA
2008a).
The Southbay Expressway (SR-125) project is considered as one of the first privately financed
toll roads in the 20th Century U.S. and also one of the first five projects selected by U.S. DOT in
September 1999 for providing credit assistance of about $140 million through TIFIA (FHWA
2008a).
In addition to that Macquarie Infrastructure Group- a Macquarie Group fund- contributed about
$160-$180 million in equity, which included the cost of acquisition of the project from the initial
owner of the special purpose vehicle. The group was expecting an IRR between 15%-20% based
on the traffic volumes calculated using different tolling strategies(MIG 2003). The rest was
covered by a senior bank debt of above $300 million, provided by Spanish bank Banco Bilbao

38 38
Vizcaya Argentaria, S.A. and Irish bank DEPFA Bank plc, through a secured construction loan
and a term loan which was later syndicated after financial close (USDOT 2003). The needed
right-of-way was donated by private land owners who hoped for increased property values due to
the development.
The funding sources for this project anticipated by the FHWA are as follows (dollars in
millions)(TIFIA 2008):
• Senior bank loans: $340.0
• TIFIA loan: 140.0
• Equity contribution: 132.2
• Donated right of way: 47.8
• Total: $660.0
The $140 million TIFIA loan was secured by interest payments (debt service), secondary to the
senior bank debt. As of January, 2008, the entire proceeds of the TIFIA were fully disbursed.
The TIFIA loan allows deferral of the interest payments until year 2010 with the first mandatory
payment due in the year 2011. The first principal payment is due in 2018 and the entire loan has
to be repaid by year 2014 (TIFIA 2008).
3.2.4 Highlights of the agreement
As per the agreement between the Caltrans and CTV, CTV as the developer was responsible for
obtaining the finance for the development, construction, maintenance, and operation of the
project and would arrange for the service and retirement of the debt. Caltrans was responsible for
obtaining certain environmental approvals. In exchange for their service, CTV held the rights to
collect toll on the privately funded section of the expressway, up to a maximum of 18.5% of the
total investment. In the event that income exceeds the 18.5% cap, the excess cash flow is paid to
Caltrans as an Excess Franchise Fee (in addition to the $10 monthly fee paid as annual
payments). CTV was not limited by the agreement in selecting toll rates, and could modify rates
at its discretion based on classes of vehicles, vehicle occupancy levels, time of use, or portion of
project available for service(FHWA 2005a).The agreement allows for an extension in the term of

39 39
the lease (beyond 35 years) if the developer is unable to make a reasonable return on investment
as stipulated by the agreement.
The lease concession agreement comprised of the lease agreement, maintenance and service
agreement and an airspace lease agreement which specify the expected standards of construction,
operation and maintenance and comply with the Caltrans standards. The operations and
maintenance services were required to be carried out by the developer using their own forces
and/or on contract basis, acceptable to Caltrans. The developer was required to maintain the
records of the project costs, operations and maintenance to be inspected by Caltrans.
The developer was expected to begin construction no later than 90 days after the Notice to
Proceed (NTP) which would be after the environmental approval. The project was required to be
completed by six months from the later of 31st December 2001 or four years after the Record of
Decision (ROD) and definitely within one year after the opening of the connector. The developer
indemnifies Caltrans against any errors in construction and design(FHWA 2005a).
The agreement did not have any mandatory capital improvements program but the developer was
allowed to expand the capacity of the toll-road (one lane in each direction along the median)
when the road was operating at a certain level of traffic, the developer has repaid all its debt from
project revenues and has followed the steps suggested by the agreement with respect to such
capacity expansion(FHWA 2005a).
The agreement contained a “non-compete” clause by which development of a new competing
facility was restricted in the 6-mile wide corridor running north–south along SR-125. The
existing competing 8-lane Route 805, which runs parallel to the expressway, can only be
expanded by one lane ( for High-Occupancy-Vehicles) in each direction(Samuel 2005). The
SANDAG officials are reported to have later insisted the modification of the agreement to allow
for expansion of Route 805 by constructing four additional (toll) lanes beginning year 2013 and
had demanded that the buses be allowed to pass toll-free (Samuel 2005). In 2006, CTV was
negotiating with Caltrans for an extension in the lease period from 35 to 45 years as they claimed
that with the cost overruns the project was not in a position to provide a “reasonable return on
investment” as was suggested by the agreement(Samuel 2005).

40 40
In the event of termination of the agreement due to change in legislation the developer is entitled
to an award, the amount of which would be determined upon state authorization. Caltrans holds
the rights to terminate the contract if there is any material default in fulfilling the developer’s
obligation as per the agreement, and remains uncorrected. Arbitration is one of the dispute
resolution mechanisms, provided, the disputed amount or the aggregated disputed amount till
date is not in the excess of $500,000,000 and the dispute is not related to franchise rights and
non-compete provisions(FHWA 2005a).
3.2.5 Traffic projection and studies
MIG based their financial model on the traffic projections conducted by Wilbursmith Associates
and another such study conducted by Dennis Johnston of Australia. ‘FasTrak’ electronic toll
collection system was employed to collect tolls along with manual tolling. Tolls were based on
the length of travel. Patrons using FasTrak are billed for the exact mileage driven and the ones
not using the FasTrak will be billed based on ‘short’, ‘medium’, or ‘long’ trips. As per the
southbay expressway website a medium length trip for a vehicle with 2 axels (approximately
three miles) costs between $2.00 to $3.00, while a long trip (riding the entire length of the
project) cost between $3.50 and $4.00 .For vehicles with 3-4 axels the toll is double d and
vehicles with 5 axels pay 3 times the 2-axel toll rate(SBX 2008).
The project opened to traffic in November 19th 2007 and manual tolls were collected from early
December 2007. Electronic tolling was fully implemented in January 2008.
3.2.6 Risks
SR-125 being a Greenfield project, presents a considerable amount of traffic and revenue risk.
The investors (MIG) are expecting a return of 15%-20% over the 35 years of the concession. The
traffic and revenue risk is somewhat mitigated by the TIFIA credit assistance. Still, there remain
speculations as to whether the project will be able to meet its traffic projections, as it has been
noted that 50% of the project traffic is dependent on the development in the Chula Vista
area(Samuel 2007). In the event of the projections not meeting reality it has been predicted that
the market will not bear higher toll rates than proposed due to competing facilities (Samuel

41 41
2005). In addition to this, there may be a diversion in traffic due to the expansion in capacity of
Route 805 (a competitive facility).
The project has suffered a number of delays during the construction phase causing the project
completion and opening of the toll road to drag until November 2007. As per the agreement the
project was required to be completed within six months of either December 31, 2001 or four
years after the Record of Decision (May 2007)( whichever is the latest) but no later than one year
from the completion of the northern ‘gap’ connector. The project start delays have been
attributed to environmental and permitting issues running a decade long since the franchise was
formed and the project attained financial close only in May 2003(MIG 2003). Federal agencies
(USEPA and USDOI) demanded extended research into habitat for endangered butterfly and
some owls causing extra mitigation costs of $50m(Samuel 2007).
The project seems to have gained a strong community support since onset. The legislation in
support of this project was passed with a single negative vote. The project was expected to
reduce travel time by 34% from Otey Mesa to San Diego and by 75% from San Diego to Otey
Mesa(Samuel 2005).An interactive website has been set up by the developer
(www.southbayexpressway.com) which provides an overview of the project, updates about
events organized for the local community and the toll rates for different vehicle class based on
the length of travel. The project website also has for sale its South Bay Expressway merchandise
for patrons as part of their program to attract the community.
Currently, in October 2008, the expressway is reported of having 26.1K transactions/day
collecting toll revenue at the rate of $ 21m/year (approximately) since it opened in November
2007. However, Macquarie has confirmed that the traffic has been affected by the slow-down in
the housing in the Chula-Vista area and cross border trade with Mexico(Samuel 2008).

42 42
3.3 Chicago Skyway 3.3.1 Overview
The 7.8 mile elevated toll bridge known as the Chicago Skyway is a connecting link between the
Dan Ryan Expressway in Illinois and the East West Indiana Toll Road, I-91 near the Illinois-
Indiana border. A unique feature of the Skyway is the half a mile long steel truss bridge that runs
over the Calumet river known as the “High Bridge”. According to Chicago Regional
Transportation Authority, congestion was anticipated due to the development of an expressway
system in the absence of a vital link down south. Hence, the Skyway was constructed to meet
demand. Soon, the city discovered that it lacked the authority to build a toll road, this led to the
conception of a Skyway Toll Bridge with a portion about 120 feet above the Calumet river
(Chicago Area Transportation Study 2007).The Calumet Skyway as it was originally called, took
about 34 months to build and was opened to traffic in April 1958. The total construction cost of
$101 million was covered by bonds issued by the city. Thereafter the facility was operated and
maintained by the City of Chicago Department of Streets and Sanitation (FHWA 2005b).
The toll bridge is a three lane highway in both directions with a single toll plaza for both east and
west bound vehicles. This is the only toll facility that was operated by the city and was
independent of the Illinois Toll Way Authority. Most citizen commuters historically have
preferred the neighboring free Dan Ryan Expressway (I-94), Calumet Expressway, Kingery
Expressway and Borman Expressway for traveling eastwards. Recently, due to construction
activities on Borman and Kingerly and major gaming attractions in the East Chicago, Hammond
and Indiana the traffic on the skyway has increased. Thus the skyway has, but a limited
competition from free routes. Although the Skyway is not a part of the federal Interstate network,
it still is a vital link for out-state passenger and commercial vehicles (Johnson. et. al. 2006).

43 43
Figure 3.3 - Chicago Skyway Map. Source, Chicago Skyway website, (Chicago Skyway Company 2005)
3.3.2 Early Financial Troubles
When it was first opened to traffic, the Skyway could not compete with the I-94, a free
expressway. The city had self-financed its construction by issuing revenue bonds worth $101
million (Chicago Area Transportation Study 2007). Until 1976, the revenue generated remained
insufficient to even make interest payments on the bonds issued. The holders of these bonds sued
the city in 1972 for its failure to provide them a return on their investment. The city’s credit
rating plummeted as the bonds became delinquent (Johnson.et al. 2006).
3.3.3 Coming out of the Red
The bond holder litigations forced a mandatory toll increase for paying off the interest on the
bonds. As traffic grew on the Dan Rayn expressway (I-94), the skyway served as faster route that
saved substantial time (Samuel 2004a). Due to the combined effect of the traffic diverted by the
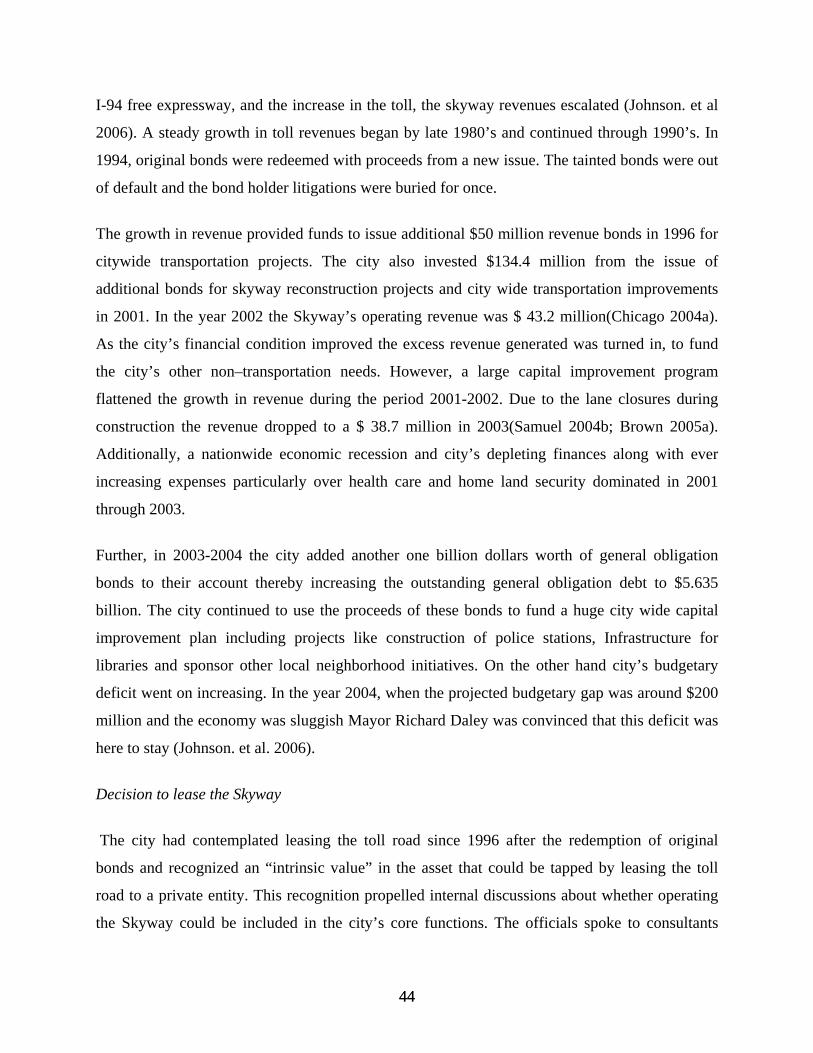
44 44
I-94 free expressway, and the increase in the toll, the skyway revenues escalated (Johnson. et al
2006). A steady growth in toll revenues began by late 1980’s and continued through 1990’s. In
1994, original bonds were redeemed with proceeds from a new issue. The tainted bonds were out
of default and the bond holder litigations were buried for once.
The growth in revenue provided funds to issue additional $50 million revenue bonds in 1996 for
citywide transportation projects. The city also invested $134.4 million from the issue of
additional bonds for skyway reconstruction projects and city wide transportation improvements
in 2001. In the year 2002 the Skyway’s operating revenue was $ 43.2 million(Chicago 2004a).
As the city’s financial condition improved the excess revenue generated was turned in, to fund
the city’s other non–transportation needs. However, a large capital improvement program
flattened the growth in revenue during the period 2001-2002. Due to the lane closures during
construction the revenue dropped to a $ 38.7 million in 2003(Samuel 2004b; Brown 2005a).
Additionally, a nationwide economic recession and city’s depleting finances along with ever
increasing expenses particularly over health care and home land security dominated in 2001
through 2003.
Further, in 2003-2004 the city added another one billion dollars worth of general obligation
bonds to their account thereby increasing the outstanding general obligation debt to $5.635
billion. The city continued to use the proceeds of these bonds to fund a huge city wide capital
improvement plan including projects like construction of police stations, Infrastructure for
libraries and sponsor other local neighborhood initiatives. On the other hand city’s budgetary
deficit went on increasing. In the year 2004, when the projected budgetary gap was around $200
million and the economy was sluggish Mayor Richard Daley was convinced that this deficit was
here to stay (Johnson. et al. 2006).
Decision to lease the Skyway
The city had contemplated leasing the toll road since 1996 after the redemption of original
bonds and recognized an “intrinsic value” in the asset that could be tapped by leasing the toll
road to a private entity. This recognition propelled internal discussions about whether operating
the Skyway could be included in the city’s core functions. The officials spoke to consultants

45 45
familiar with toll road leases in Canada and Europe, which triggered the thought process further.
Anticipation that the deal could fetch a $400 million after the outstanding bonds were dissolved
was quite an incentive for the city to capitalize on their profit making ‘cash cow’ (Johnson. et al.
2006). In 2000, the mayor engaged his chief of staff, John Schmidt who had an excellent track
record, to manage the entire leasing process.
The Skyway deal
The outcome of the procurement process was an outstanding offer of $1.83 billion from the
Cintra-Macquarie consortium in return for acquiring the rights to lease the Skyway for a period
of 99 years. The $1.83 billion upfront payment made by the consortium was to retire the city's
obligations, fund new projects and provide for reserve funds. The city redeemed the principle
and interest on the $ 453 million outstanding Skyway bond debt, $392 million general obligation
debt and other commercial paper (Johnson. et. al. 2006). $ 500 million were dedicated towards a
‘rainy day’ fund i.e. reserve funds to strengthen city’s finances (Brown 2005a) Another $475
million were expected to be spent over the next eight years for “ stabilizing “ the city’s revenue
flow, fighting the homeless and upgrading the libraries computer systems(Hinz 2004a). Moody’s
Investors Service, a credit rating agency that had earlier expressed a negative outlook on the
Skyway debt (Hinz 2004a) upgraded Chicago’s general obligation credit from A to Aa3 in
2006,the city’s highest bond rating in 25 year (Johnson. et. al. 2006).
Chicago Skyway Privatization
Use of Proceeds Amount
Refund outstanding Skyway bond principal and interest $453 million
Retire portion of outstanding Government Obligation debt $392 million
Permanent operating budget rainy day fund $500 million
8-year capital budget and operating budget stabilization fund $475 million
Total
$1.82
billion
Based on Crains Chicago Business, November 2004
Table 3.2. Use of Skyway Deal Proceeds. Source, (Johnson. et al. 2006)

46 46
3.3.4 Acquisition and Procurement Process
Qualification based Selection
Goldman Sachs and Loop Capital Markets were appointed as financial co- advisors and Mayer,
Brown, Rowe & Maw as legal advisors for the leasing process. Mayor, Richard Daley, had once
stated that operating the skyway was not the city government’s core function and with impending
financial challenges the transaction was an effort to improve the management of the city’s assets
(Samuel 2004a). However, some obstacles had to be sorted before the commencement of the
process. The state laws subjected the Skyway to high real estate taxes; these laws were amended
by the legislature, such that the potential operator was exempt from property taxes thereby
making the deal attractive. The Federal Highway Administration also changed their rules that
placed restrictions on the city’s use of the proceeds from the lease (Lerer 2005).
The deal being politically sensitive, the bidding process had to be fair and transparent such that it
would maximize value to the city (city’s credit score had to improve) and eliminate any claims of
political favoritism (Lerer 2005). FHWA has described it as a “competitive” bid process similar
to that of a corporate auction.
The procurement process was set in accordance with the following guidelines (Johnson. et al
2006):
1. The potential bidder had to demonstrate its capacity to provide safe and efficient
transportation service in the city.
2. Was needed to have a reasonable toll rate structure.
3. Proceeds were to be used to stabilize the city’s operating budget and fund capital
improvement programs spread across city wards over a period of time.
The City through their advisors contacted over 40 potential bidders internationally. They made a
request for qualification in spring 2004.Ten potential bidders responded to the preliminary non-
binding bid. Out of which 5 teams were qualified including 1) Abertis Infraestructuras SA
(Barcelona, Spain), 2)Chicago Skyway Group consisting of VINCI
Concessions/ASF/COFIROUTE, Borealis Infrastructure Management, Canadian Highway

47 47
Infrastructure Corp, ABN AMRO, Parsons (LA), American Bridge (New York), and Kenny
Construction ( France / Irvine, CA) 3)the Cintra-Macquarie consortium consisting of Cintra
Concesiones de Infraestructuras de Transporte SA (Madrid) and Macquarie Investment Holdings
(Sydney Australia), 4)the Skyway Infrastructure Group, consisting of Bilfinger Berger BOT
(Germany) and Cheung Kong Infrastructure Holdings (Hong Kong) and 5)Transurban
Infrastructure Developments Limited (Melbourne Australia), in association with VMS Inc
(Richmond VA), Ontario Teachers Pension Plan, Gary/Chicago Int Airport Authority, Bear
Stearns & Co (New York), and Vollmer Assoc (New York) (Samuel 2004b).
The proposals eliminated in the selection process were those from TransCore ( Hummelstown,
PA), J. P. Morgan-Chase (New York), CPS Chicago Parking and Gomez Transp (Chicago, IL),
Carlyle Group (Washington DC) and Caja Madrid since they could not meet the desired financial
capacity and experience (Samuel 2004b).
The five bidders deemed qualified by the city were invited for further due diligence and
competitive bidding. Each of these respondents were given a draft of the concession and lease
agreement that stipulated the standards of safety, operations and maintenance, insurance and
policing that the lease had to uphold (Lerer 2005). A virtual data room (a website) was also set
up that provided access to financial information, traffic statistics, and engineering data. The
potential bidders signed a confidentiality agreement and received a Confidential Information
Memorandum that provided additional information on the skyway and the bidding process.
Instead of a Request for Proposal (RFP) a Request for Qualification was issued and therefore the
selection was purely based only on qualification followed by a due diligence process (Chicago
2004a).
The due diligence process included toll way tours, management presentations by the potential
concessionaires and review and discussion of key business terms of the lease agreement. Based
on the information provided by the city, final bids were submitted in October 2004.
In Goldman Sachs’s opinion the process incorporated the essentials to make a success story. In
their presentation to National Association of State Treasurers they have illustrated the ingredients
of their recipe. Flexible business terms, solid underlying assets, good public policy, highly

48 48
structured bidding process, intensive marketing were the underpinnings of the procurement
process (Brown 2005b).
3.3.5 The Winning Bid
On October 15th 2004, the bids were scheduled to be opened at Chicago’s city hall. The city
officials were initially disappointed when they began to open the bids. Two of the bids were $
505 million and $ 705 million quoted by Albertis Infrastructuras SA and the Chicago Skyway
Group respectively, much lower than what the City desired. But the $ 1.83 billion offer that came
from the Skyway Concession Company (SCC) formed by the Cintra-Macquarie consortium
captured everyone’s attention.
The SCC’s offer was about 2.6 times greater than their next contender, the Chicago Skyway
Group and about twice the city’s expectations(Johnson. et. al. 2006).John Harris, a spokesperson
of the city of Chicago once mentioned that the other bidders probably undervalued the asset or
were not “serious” with their bids (Samuel 2005b). The then Chief Financial Officer of the City,
Dana Levenson, is quoted in a magazine article that reads, “if those (lower bids) were the only
two bids, we would have declined them. We would have continued to operate the Skyway
ourselves (Samuel 2005b)."
The city officials seemed pleased with a smooth and satisfactory take over process. Once the
winner was announced the city expected to complete the financial closure and the SCC assumed
operations on January 26, 2005 (FHWA 2005b).
3.3.6 Terms of Agreement
The lease agreement grants the concessionaire the right to “use, possess, operate, manage,
maintain, rehabilitate” and collect toll revenues from the commuters for a period of 99 years as
opposed to a minimum of 50 years prescribed by the RFQ. The RFQ that was issued insists that
the term of the lease may not be less than 50 years, this allows the concessionaire to assume tax
ownership of the Skyway - whereby the concessionaire profits from the depreciation of the asset
and manages to collect a decent return (as per scheduled hike) over the term of the lease(Brown

49 49
2005a).There is no provision for the renewal of the term but allows extension to provide
compensation in the event of Force Majeure.
Toll Revenue and User Fees
At all times the concessionaire retains the right to collect toll revenue subject to a predetermined
maximum rate applied to different vehicle classes until 2017 as specified in the agreement. After
this, toll could be increased at the concessionaire’s discretion, annually, by the greater of an
annual rate of 2 %, increase in Inflation or increase in per capita Gross Domestic Product
(G.D.P). Currently (June 2007), the toll charged is $2.5 for two-axle vehicle and $1.2 per axle for
vehicles with three or more axles through December 31, 2007(Chicago 2004b). Based on the
historic traffic study that shows a modest increase in passenger car revenues over the period
1993-2003 by 7.3%, despite a toll hike in 1993 and recent road construction, the City of Chicago
did not expect the price hike to significantly impact the traffic on the Skyway(Chicago 2004a).
Nonetheless, the agreement provides the concessionaire with the flexibility to set a tolling
schedule lower than the applicable maximum toll levels, offer discount programs, and
encourages them to implement Electronic Tolling System during the lease term. In addition, the
Skyway lease agreement also give the concessionaire the freedom to apply time-of-day variable
rate tolling, congestion related tolling including High-Occupancy-Toll lanes or any other method
of charging the toll subject to the maximum toll regulation. However, an exception to the
maximum toll levels, allows for an increase in toll that can be charged to vehicles with three or
more axles between 4:00 am to 8:00 pm by forty percent of the ongoing scheduled toll rate,
provided the toll charged for the same vehicle class is discounted by an amount equivalent to the
increment during 8:00 pm to 4:00 am (Chicago 2004b).
The agreement restricts the concessionaire from establishing toll from vehicles used in fire
fighting and law enforcement, vehicles bearing diplomatic license plates, ambulances, vehicles
owned or operated by the city or any department or agency thereof. Apart from the tolls collected
from the commuters the concessionaire has the authority to collect rent from the restaurants
approved by the city on the portion of the Skyway. Other sources of revenue including the mass

50 50
transit facilities, sale of goods and services, installation of utilities and erection of billboards and
related services remain under the control of the city (Chicago 2004c).
Rights and Responsibilities
The concessionaire’s responsibilities include
1. Operating and maintaining the toll road as per the provisions of the agreement
2. Providing 24x7 public access to the toll road except during construction activities and
unavoidable conditions.
3. Maintaining the required level of police service, Chicago Police Department (CPD).
4. Plan and execute the Capital Improvements Program to be supervised and co-coordinated
by the City.
5. Maintain the minimum level of service (LOS) at all times as per the agreement.
6. Pay taxes and utility bills.
7. This consortium is exempt from the payment of property taxes that are incurred due to
the ownership of all or any part of the toll road in accordance with the agreement
(Chicago 2004b).
8. The City, reserves the right: To access (store materials in compliance with the
environmental laws, in an orderly fashion) and inspect the toll toad with prior intimation
to the concessionaire and are required to maintain minimum interference with the
operations of the toll road.
9. Make necessary repairs in case of the concessionaire’s default, compensable by the
concessionaire.
10. Design, construct, operate, maintain, repair, and rehabilitate any existing or future streets
or highways adjacent to or above or under the toll toad in accordance with the terms of
the agreement.
11. The agreement explicitly mentions that “the development, redevelopment, construction,
maintenance, modification or change in the operation of existing or new mode of
transportation (including road, street or highway) that results in the reduction of toll
revenues or in the number of vehicles using the skyway Toll Bridge” will not be
considered for any compensation under the provision for an “Adverse Action”(explained

51 51
further)(Chicago 2004b).Thus, the City does not protect the concessionaire from the
construction of competing roads in the vicinity.
Performance Measurement
The concessionaire is required to perform maintenance and operate the Skyway in accordance
with the Maintenance Manual and Operations Procedure Manual prepared along with the lease
agreement. The maintenance manual depicts the City’s maintenance policies and its objective to
“provide a safe and pleasant passage”. Repairs are to be performed in order to maximize the
functional life of the structure, conduct emergency and preventive maintenance throughout the
Skyway system for the Skyway users, while maintaining the Skyway as an asset”(Chicago
2004b). This manual provides the concessionaire with a timeframe for repairs, the frequency at
which it must be done, and the acceptance criteria as per Illinois Department of Transportation
(INDOT) standard specifications.
The operations and procedures manual provide the concessionaire, guidelines to prepare and
submit an operations plan that would include the concessionaire’s intent to deal with the staffing
requirements and allocations, customer service, a safety plan describing the working conditions
and the training programs under Occupational Safety and Health Association (OSHA) standards,
a plan for controlling the operations of equipment, a toll collection and operations plan, and a
traffic and travel management plan to name a few. It also mentions a timeframe for the submittal
of each of these plans and the criteria for the acceptance. Any change in procedure proposed by
the operator would require the prior approval from the City accompanied by the concessionaire’s
rational for such alteration.
Audits and Inspections
The city reserves the right to access the Skyway at all times, make audits and inspections with no
undue interference with the operation of the skyway in order to check the concessionaire’s
performance and adherence to the agreement. It also holds the right to make changes to the
standards of operations such that they comply with the new laws or the norms followed by the
government authorities in the U.S of comparable highways otherwise provide adequate
compensation for any change not in accordance with the standard practice or the agreement.

52 52
Quarterly traffic volume forecasts, notification of any emergencies, environmental incident
eports and semi-annual financial reports (copy of un-audited balance sheets and income
statements, changes in shareholder equity and cash-flows) are to be submitted to the City as a
measure of the Skyway operations. The concessionaire needs to reimburse the City for any costs
or expenses incurred for monitoring the skyway operations to the extent of $165,000 per annum.
The concessionaire is required to furnish the City with any information relating the Skyway
operations under the condition of confidentiality.
Capital Improvement Program
The City of Chicago had already spent about $ 300 million in an intensive Capital Improvement
Project (CIP) that was to be completed by 2004. Although the concessionaire had a limited
responsibility towards any immediate capital improvement works (Chicago 2004a) they were
obliged to perform CIP as mandated by the agreement over the lease term. The City was
responsible for the coordination and completion of the On-Going CIP contracts and On-Going
Engineering Contracts in accordance with their respective terms (Chicago 2004b) unless the
concessionaire had been authorized by the City to execute any of their contracts. The CIP over
the lease term would be executed by the concessionaire in accordance with the lease and
supervised and coordinated by the City. However the concessionaire’s obligation to perform the
CIP was subject to the issuance of any authorization required from the City and such an
authorization could not be unreasonably withheld or delayed by the City.
Toll Collection System
The concessionaire is encouraged to adapt to an Electronic Toll Collecting (ETC) system from
the manual system during the term of the lease in compliance with the standards and
specifications laid down in the agreement. After implementing the ETC, the concessionaire has
the right to enforce admission fees, charge interest on unpaid tolls, reasonable fees for
distribution and security of toll devices. The concessionaire was also required to host a website
and provide a contact number where details of the current tolls, temporary discounts and pending
toll changes could be obtained. Any changes to the tolling schedule were to be notified to the city
officials and the public in advance of such implementation (Chicago 2004b).

53 53
The consortium began the implementation of the ETC with the toll booth plaza reconfiguration
and three ETC enabled lanes in each direction were installed. I-Pass and E-Z Pass were
implemented on June 16th 2005 and September 26th 2005 respectively. The transaction time per
vehicle is reported to have reduced from 15.38 sec to 12.87 sec. The consortium believes to have
attained a 10% reduction in operating expenses compared to the city ownership and hopes to
reduce the operating expenses after full implementation of the ETC (Securities 2006).
Remedies
Termination
The City does not hold the right to terminate the agreement for convenience, however the
concession may stand cancelled in the event of the concessionaire’s failure to perform as per the
terms of the agreement and such negligence continues to be unhealed(Chicago 2004b). For any
reason other than the concessionaires default, the city is bound to pay the concessionaire the
value of the Skyway concession as of the date of termination and the concessionaire to surrender
the control of the skyway operation and the property possession to the City without any
encumbrances (Chicago 2004b).
In case of any adverse action, defined as “any action taken by the City, state or local government
authority in Chicago during the term of the lease such that its effect is directly borne by the
concessionaire or has material adverse effect on the fair market value of the concessionaire
interest, provided any such action is, not a response to any act on the part of the concessionaire
that is illegal or permitted under the agreement or mandated by the U.S government”, the
concessionaire has the option of exercising one of the two rights, 1) Termination of the
agreement along with a refund of the toll road concession value as of the date of termination and
out-of-pocket expenses incurred by the concessionaire during the term, 2) Right to
compensation(Chicago 2004b).
The concessionaire is required to give the City a 30 days notice following the date on which the
concessionaire first became aware of the situation before they decide to exercise one of the two
rights. If the concessionaire decides to exercise the right to compensation, they must provide the
City with the reason for the claim, calculations of the expected compensation, and any

54 54
supporting documents or details that the City considers necessary. The City reserves the right to
dispute any such claim and if the concessionaire fails to withdraw the claim within the 30 days,
they shall follow a dispute resolution process. However, if the City remedies the occurrence of
Adverse Action within a specified period of time, the concessionaire’s right to claim will be
subject to the improvements made (Chicago 2004b).
In case, the concessionaire fails to “comply with, perform or observe any Operating Standard or
if the concessionaire’s default creates a material danger to the safety of the Skyway operations, a
material impairment to the Skyway or to the continuing use of the Skyway for transportation
purposes” then the City may give the concessionaire a notice for termination or appeal for
dispute resolution or resort to any other means as specified in the agreement. On the other hand
the concessionaire is entitled to cure the default by providing the City an approved work plan,
within the 60 days period of notice, outlining the actions by which the concessionaire will ensure
future compliance (Chicago 2004b).
Dispute Resolution
Both parties may attempt to resolve the dispute within 15 days of receiving a notice for such an
appeal made by either of the parties. However, if both parties are not able to reach any resolution
after 15 days since notification, the parties must attempt to resolve the dispute through mediation
before resorting to arbitration. The arbitration is required to be held no later than 45 days after
the referral to mediation, in Chicago, Illinois unless both parties mutually agree upon another
location. Each party shall bare their own expenses, attorney cost and fees and the award of this
arbitration would be final and binding on both (Chicago 2004b).
Other Conditions
During the lease term the concessionaire may request to undertake an expansion or major capital
change of the Skyway subject to the City’s approval and the City at its discretion may grant or
withheld from the concessionaire, permission to acquire additional lands for expansion. The
agreement grants the concessionaire permission to enter city property adjacent or below the
skyway during emergencies.

55 55
The City may make necessary repairs and take measures to rectify danger or emergency in case
the concessionaire defaults and may cause the concessionaire to perform construction or
expansion work at the city’s expense along with compensation for net present and future revenue
loss due to such an action (FHWA 2005c). The agreement does not provide for any third party
guarantee, however the bid was secured by a $ 55 million letter of credit and the investors
obligations to close the agreement was secured by a letter of credit in the amount of 5% of the
rent payable(FHWA 2005c)
The Chicago Police Department is responsible to enforce law on the skyway with the consent of
the city authority. The concession agreement also requires the private operator to abide by the
city’s minority and female-owned business requirements (Chicago 2004a).
The agreement does not express any limit on the concessionaire’s rate of return (FHWA 2005c),
however it is explicit that the city believes the agreement is designed to produce a reasonable
return to the private operator and would not alter or revoke such provision. The revenues thus
generated are to be used for “debt service related to the Skyway and proper operation and
maintenance of the skyway prior to making any distribution of such toll revenue to any holder of
an equity interest in the concessionaire (Chicago 2004b)”.
The City reserves the rights to change the name of the Skyway, grant easement rights to utility
and service providers. The lease could be mortgaged by the concessionaire that may serve as
recourse in the event of bankruptcy or debt default. The third party that assumed the control of
the operations would have to abide by the concessionaires obligations and responsibilities.
3.3.7 Investment Rational
Chicago is one of three largest cities in the U.S and with the continuous economic development
the population is expected to grow in the future. Proximity to the gaming facilities has made the
toll road a primary route for Chicago based consumers of casino gambling (Chicago 2004a). The
City predicted that the lease proposal had favorable conditions that would make it attractive to
the potential bidder. The Toll Road had a 45 year operating history and was the most preferable
route as it was a direct link to the interstate traffic. The toll revenue growth rates had been quite
strong over the past decade ignoring a slight dip on account of the capital improvement program.

56 56
With the growing popularity of the Casinos in the eastern part of Chicago, on weekends, traffic
was observed to hit its peak at about 4500 vehicles per hour. In spite of this, the six-lane Skyway
in 2005 ran at one third of its capacity while the alternative routes were congested (Brown
2005a).
The Cintra-Macquarie group was mainly looking at the (Group 2004; Samuel 2005a),
1. Long and proven operating history since 1959.
2. The toll road franchise for 99 years with an attractive maximum tolling schedule in line
with inflation
3. Historic traffic growth that had out-performed the corridor and other public sector
forecasts.
4. The skyway’s significant spare capacity while alternative competing routes remain
congested and inconvenient.
5. The Skyway’s condition following the recent $300 million CIP conducted by the City.
6. Risk premium at 6% that exceeded Macquarie’s average risk premium
Based on these conditions, Macquarie Infrastructure Group (MIG) in their presentation have
expressed their expectation of a potential increase in the value of the Skyway. Macquarie and
Cintra have an international experience of implementing the electronic toll collection techniques.
A major cost saving due to the change from the manual to electronic toll collecting system,
operating costs were expected to be reduced by $ 16.2 million (Bunker 2005).
Although the concession value quoted by the group was much larger than their competitors’,
Steve Allen, Chief Executive, Macquarie is reported to have said that their estimate was based
not only on a speculation of their competitors’ bid but also how much the state might expect
from the deal (Myer 2005).
However, according to Peter Samuel, a senior fellow at the Reason Foundation in his article
featured in the Toll Road News, the Cintra -Macquarie group might have bid in the excess of
about 600-800 million dollars (Samuel 2005a). The group might have failed to foresee some of
the less encouraging points about the Skyway such as:

57 57
1. The customer base in the northwest Indiana region traveling the Skyway who may have
less willingness to pay the toll per unit of time saved.
2. Affected demand because of the fact that steel industries in this area remain closed since
1950s and 1960s.
3. Slow growth in the North-West Indiana than anywhere else in the region.
4. Growing job opportunities away from the Skyway Loop.
In Samuel’s opinion the group may also have down played the free competition from Borman
Expressway in Indiana (BE), the Kingery Expressway on the Illinois side (I-80/94), Dan Rayn
Expressway (DRE) which are under going reconstruction, improvements and road widening with
an aim to increase capacity. The work is expected to complete by 2007-2009 after which they
might emerge as free alternatives with improved travel times (Samuel 2005a).
3.3.8 Sponsors and Debt Refinancing
The Cintra-Macquarie consortium is led by a joint venture between Macquarie Investment Group
and Cintra Infrastructuras de Tansporte. Cintra is known as one of the world’s largest private
sector infrastructure developer and at the time of the bid was jointly owned by group Ferrovial,
2nd largest infrastructure developer in Europe and Macquarie Infrastructure Group MIG is
World’s 3rd largest infrastructure developer, and a wholly owned subsidy of Macquarie Bank
Limited – the largest investment bank in Australia (Samuel 2004a)
Cintra-Macquarie have a demonstrated 35 years experience as an international toll road operator.
They run more than 30 toll road concessions including Highway 407 in Canada (99 year
concession) and have been involved in last three toll road “privatizations” in the United States
(SR125, Chicago Skyway, Indiana Toll road)(Samuel 2004a).
The lease was initially financed by a combination of equity and debt with Macquarie’s equity
share of $397million and Cintra’s share equal to $485million. Debt was financed by European
banks in the form of loans to the order of $ 948 million. The transaction and debt costs accounted
to another $52 million (Macquarie 2004).

58 58
According to Macquarie’s website, the terms and conditions of debt were consistent with
standard project finance facilities. A flexible debt structure with low yields in the early years and
interest rate hedging was incorporated.
Later a restructuring of the debt through securitization reduced the equity share of Cintra-
Macquarie to $ 509 million. A new $1.55 billion was issued by the Skyway Concession
Company (SCC) and the Skyway Concession Company Holdings (SCCH) to replace the $1.00
billion loan.
A senior debt comprising of Capital accretion bonds with a 21 year maturity with interest rate
equivalent to 5.6% were used to finance $ 961 million and additional $ 439 million were raised
by issuing 12 year Current Interest Bonds, both issued by SCC(Macquarie 2004). Citigroup and
Goldman Sachs Capital Markets were the joint book runners of this bond issue and Macquarie
Securities was a member of the selling group. They also provided interest rate derivatives such
that the interest rate on all the bonds was swapped to a fixed rate. It has been reported that the
securities were sold across investor types including the traditional buyers of asset-backed,
municipal, corporate, project finance debt (Carey 2006). The senior debt (the bonds) has been
rated Aaa and AAA by Moody’s Investors Service and Standard and Poors respectively and also
has received a guarantee from Financial Security Assurance Inc (FSA) - a triple bond insurer.
In addition, a subordinate debt of $150 million was issued by SCCH, provided by Banco Bilbao
Vizcaya Argentaria and Santander Central Hispano of Spain, together with Calyon of
Chicago(Macquarie 2004; FHWA 2005c).The average interest cost on debt is 5.9%.
With the refinanced structure in line with the cash-flows of the Skyway, MIG hoped to improve
the early yield to 2.7 % up from zero and reduce the payback on equity to 14 years. The Internal
Rate of Return (IRR) increased by 1.5%, raising it to 12.3% and thus the discount rate of 10.5%
made the deal attractive (Macquarie 2004).
3.3.9 Reactions
The deal was well received by the City Council, which is evident from the unanimous 45-0
voting in its favor and eliminated the impending need to increase the property taxes for the year

59 59
2005. The City’s Finance Committee Chairman, Alderman Edward Burke called it “ a bold and
dramatic venture- probably the best deal ever in Chicago’s history” (Spielman 2004).The
Mayor’s decision was lauded by many as Alderman exclaimed, “ the deal is Chicago’s biggest
windfall!” ( Hinz 2004b).
Yet, a few were concerned about the City’s plan for spending the proceeds of the concession as
they thought it lacked foresight as there was no consideration for a long-term investment in the
transportation of the region (Hinz 2004b) and others feared that the increase in toll might compel
the traffic to take the alternative toll free route and add to the congestion on those routes (Foote
2006). Others expressed concerns that the city’s spending might exhaust the “windfall” in no
time (Jones 2004). On contrary, the proceeds from the lease of Indiana Toll Road - that came on
heals of the Chicago Skyway- are seen to benefit taxpayers with an enhanced transportation
system (Foote 2006).
Without any doubts, the Chicago Skyway lease agreement came as a windfall at the time the city
was facing a financial crisis but there have also been apprehensions about the city giving up
claim to its future cash flows. Foote believes, if the funds are utilized for enhancing the
transportation in the region, the lost claims on the revenue should be justifiable (Foote 2006).

60 60
3.4 Indiana Toll Road 3.4.1 Overview
The Indiana Toll Road, a 157 mile stretch that runs through northwest Indiana between the Ohio
turnpike near the Ohio-Indiana state border and the Chicago-Skyway near the Indiana-Illinois
state line, designated as I-90 and is part of the US Interstate Highway System. It serves as an
arterial link for the state’s metropolitan areas including Angola, Goshen, Elkhart, Mishawaka,
South Bend, La Porte, Chesterton, Valparaiso, Hobart, Portage, Gary, Hammond and East
Chicago and is an important freight route link between Northwestern Indiana, the Chicago area
and major commercial hubs in the South and East (Indiana Finance Authority 2005).An
alternative east-west corridor, the combined route of I-94 and I-80 to Chicago, parallels the
Indiana Toll Road. However it is considered to be sixty percent slower and it is twenty percent
longer.
Figure 3.4. Indiana Toll Road Map, Source: Macquarie Infrastructure Group Presentation,(MIG 2005)
Since 1956, when it first opened to traffic, the vehicular volume has followed an overall
increasing trend with minor fluctuations that can be attributed to the detours due to construction
activities on I-65 and the Chicago Skyway. In spite of a toll hike in October 1985, the
transactions increased by 5.1% with a 15.7% annual increase in revenue. Contributing to about

61 61
sixty percent of the traffic on the toll road, commercial trucks are a substantial portion of the
traffic volume Alternative non-tolled routes that come with a time and economic penalty are not
preferred by this time sensitive vehicle class (Indiana Finance Authority 2005).
The toll rate is based on the class of the vehicle and the distance traveled. The toll road has four
or six lanes throughout its length with toll plazas located at ten different mileposts. What
originally operated as a ticket collecting system transformed into a computerized barrier system
in July 1986. Although both barrier and ticket collecting systems are employed at present, ITR is
fast moving towards an electronic toll collection system. Apart from the toll revenues, lease
payments made by vendors operating restaurants and gas stations along the toll road also
contribute to the operating cash flows of the highway.
The Indiana Toll Road is owned by the Indiana Finance Authority (IFA) and operated by the
Indiana Department of Transportation. The toll road was a significant source of cash flow to the
state, yet state authorities expected that engaging a private entity would help derive greater
economic value (Indiana Finance Authority 2005).
In September 2005, Governor Mitch Daniels proposed an increase in toll rates by 72 percent for
cars and 113 percent for five axel commercial vehicles, a step towards raising funds for his 10
year, $10.6 billion, ‘Major Moves’ initiative, which would invest infrastructure to boost the
state’s economy(Indiana Finance Authority 2005). A deficit of $2.8 billion to fund the
comprehensive 10 year plan prompted the state to consider alternative modes of financing
(Florian 2006). After evaluating the pros and cons of entering into a Public-Private-Partnership
(P3) and contemplating raising funds against the bonding capacity of the standalone toll road, the
state decided to seek bids from interested private companies to lease the toll road (Florian 2006).
Indiana Finance Authority employed Goldman Sachs and Co – a global banking enterprise- to
provide financial advice and to facilitate the procurement process for the Indiana Toll Road
Lease.

62 62
3.4.2 Selection Strategy
A ‘fast track’ procurement process was adopted in which binding offers were accepted in a
record time of 117 days from solicitation. The concept was to have bids in hand to present end of
the assembly session in March 2006. Goldman Sachs and Co, also involved in the Chicago
Skyway lease procurement based on their experience with toll road leases (e.g. Chicago Skyway,
French Toll Road System) were able to craft a well structured yet flexible procurement process
(Florian 2006). In his testimony before the House Subcommittee on Transportation and
Infrastructure, Mark Florian, mentioned that “given the accelerated pace, Goldman Sachs moved
quickly to utilize its global network to contact over 70 potential buyers around the world”,
(Florian 2006).
The procurement was done in four phases Pre-Marketing, Marketing, Due Diligence and
Negotiation, and Final Bids.
Pre-Marketing
Prior to marketing the offer, objectives were prioritized and key public policy decisions were
evaluated thereby developing internal support for the process. Historic data, other information
was gathered and preparation of financing, marketing and legal materials was begun. A manual
that described the expected operating standards was prepared and a marketing strategy was
finalized, (Florian 2006). As many as 75 organizations were contacted to facilitate the formation
of consortia. Ten responded to the Request for Proposal (RFP).
Marketing
The RFP was distributed via the Indiana Finance Authority website. A confidential information
memorandum was negotiated, drafted and distributed among the potential bidders, (Florian
2006). Preliminary non-binding bids were sought. No restrictions were placed on the number of
bids that could be accepted and the state reserved the right to dissolve the entire process at any
stage. Nine qualified bidders were invited to participate in the final process of evaluation by
early January 2006.

63 63
Due Diligence process
The financial advisors arranged a two day toll road tour for each of the prospective bidders and
used this opportunity to assist the State of Indiana and the qualified bidders to negotiate and
finalize terms of the agreement. Information was promptly passed through electronic resources.
Additional information on the bidding process was to be provided only to the qualified bidders,
(Indiana Finance Authority 2005). Access to on-line data room was provided and initial due-
diligence questions were addressed.
The financial advisors received valuation responses and risk pricing from qualified bidders.
(Florian 2006).Negotiated confidentiality agreements were utilized to protect the privacy of all
parties. Management presentations were made by the bidder’s representatives and the state’s
proposed toll road concession and lease agreement was reviewed and discussed. All
environmental, legal and operational due-diligence questions were also answered at this stage
(Florian 2006).
Four Qualified bidders were short-listed on the basis of their technical capability- rated by the
firm’s standards of operation and maintenance, customer service and safety policy and financial
capability–rated by their ability to raise financing and the capacity to pay purchase price and
maintain the Toll Road.
Final Bids
The offers of the four teams considered by the state for the final evaluation round ranged
between $1.9 and $ 3.85 billion. Ultimately, State Wide Mobility Partners a team formed by
Macquarie and Cintra, the operators of the Chicago Skyway, won the bid for a $3.85 billion and
the right to operate the toll road for a 75 year lease period. The financial close was scheduled for
June 2006.Finalized agreement and operating standards were sealed and the transaction was
closed.

64 64
3.4.3 Terms of the lease
The lease granted the winning proposal, “exclusive franchise and license” to operate, manage,
maintain, rehabilitate and toll the road over seventy five years or the lease term in return for an
upfront payment. The state agency also transferred the toll road assets and assigned toll road
contracts to the concessionaire. The outstanding bonds issued by the authority against the toll
road were to be defeased before the closing, scheduled in June 2006. The State’s expected
operating standards, maintenance, tolling schedules and proposed capital expenditures were
outlined in the lease agreement.
Through this concession and lease agreement the ITR Concession Company experiences “Quiet
enjoyment” of the toll road. In other words, as long as the concessionaire performs all of the
obligations of the agreement, they are free to enjoy all the rights and privileges of operating the
toll road(Indiana Finance Authority and Company 2006).
The concessionaire’s responsibilities include:
1. Operating and maintaining the toll road as per the provisions of the agreement
2. Providing 24x7 public access to the toll road except during construction activities and
unavoidable conditions.
3. Maintaining the required level of police service, Indiana State Police (ISP) employed by
the Indiana Finance Authority.
4. Plan and execute the pre-specified capital improvements program to be supervised and
co-coordinated by the Indiana Finance Authority.
5. Maintain the minimum level of service (LOS) at all times as per the agreement.
6. Pay taxes and utility bills.
This consortium is exempt from the payment of property taxes that are incurred due to the
ownership of all or any part of the toll road in accordance with the agreement.
The Indiana Finance Authority, reserves the right:

65 65
1. To access (store materials in compliance with the environmental laws, in an orderly
fashion) and inspect the toll toad with prior intimation to the concessionaire and are
required to maintain minimum interference with the operations of the toll road.
2. Make necessary repairs in case of the concessionaire’s default, compensable by the
concessionaire.
3. Design, construct, operate, maintain, repair, and rehabilitate any existing or future streets
or highways adjacent to or above or under the toll toad in accordance with the terms of
the agreement.
In the event of opening a competing highway, the state has an obligation to compensate the
concessionaire with an amount equivalent to the loss suffered by them in the previous year
resulting from the diversion of traffic on account of the competing highway (Indiana Finance
Authority and Company 2006).
Termination
The state reserves the right to terminate or modify the agreement at any stage of the procurement
process. The agreement could have been terminated before closure by mutual consent or at either
party’s notice, as long as neither party failed to comply with the requirements of the agreement.
In case of any adverse action, defined as “any action taken by the IFA, state or local government
authority in Indiana during the term of the lease such that its effect is directly borne by the
concessionaire or has material adverse effect on the fair market value of the concessionaire
interest, provided any such action is not a response to any act on the part of the concessionaire
that is illegal or permitted under the agreement or mandated by the U.S government”, the
concessionaire has the option of exercising one of the two rights, 1) Termination of the
agreement along with a refund of the toll road concession value as of the date of termination and
out-of-pocket expenses incurred by the concessionaire during the term, 2) Right to adverse action
compensation
The concessionaire is required to give the IFA a 30 days notice following the date on which the
concessionaire first became aware of the situation before they decide to exercise one of the two
rights. If the concessionaire decides to exercise the right to compensation, they must provide the
66 66
IFA with the reason for the claim, calculations of the expected compensation, and any supporting
documents or details that the IFA considers necessary. The IFA reserves the right to dispute any
such claim and if the concessionaire fails to withdraw the claim within the 30 days, they shall
follow a dispute resolution process. However, if the IFA remedies the occurrence of Adverse
Action within that time, the concessionaire’s right to claim will be limited to that which is
incomplete.
In case, the concessionaire fails to “comply with, perform or observe any Operating Standards or
if the concessionaire’s default creates a material danger to the safety of the ITR operations, a
material impairment to the ITR or to the continuing use of the ITR for transportation purposes”
then the IFA may give the concessionaire a notice for termination or appeal for dispute
resolution or resort to any other means as specified in the agreement. On the other hand the
concessionaire is entitled to cure the default by providing the IFA an approved work plan, within
the 60 days period of notice, outlining the actions by which the concessionaire will ensure future
compliance.
In the event of termination for reasons other than the concessionaire’s default the Indiana
Finance Authority is liable to pay the concessionaire an amount equal to the concession value as
of the date of the termination, reimbursement of the brokerage costs incurred by the
concessionaire and concession compensation less insurance coverage. The concessionaire would
surrender the control of the toll operation and the possession of any tangible and intangible
assets, return the toll road in a good order without bearing any encumbrance(Indiana Finance
Authority and Company 2006).
Dispute Resolution
Both parties may attempt to resolve the dispute within 15 days of receiving a notice for such an
appeal made by either of the parties. However, if both parties are not able to reach any resolution
after 15 days since notification, the parties must attempt to resolve the dispute through mediation
before resorting to arbitration. The arbitration is required to be held no later than 45 days after
the referral to mediation. Each party shall bare their own expenses, attorney cost and fees and the
award of this arbitration would be final and binding on both.

67 67
User Fee
Governor Mitch Daniels announced an increase in the toll rates that were expected to be
effective from April 2006. The step-up on toll was the first toll increase in tolls since 1985.The
existing toll rates were among the lowest $/mile in the US. Thus, passenger vehicles saw a 72
percent increase from 3c/mile to 5c/mile and the toll for trucks jumped up by about 113%. In
spite of the huge hike, the toll rate was found comparable with other tolled roads in the
region(Samuel 2006).
After the concessionaire assumes operating control, the toll rate is planed to be raised as per a set
schedule for a step-up in the commercial vehicle toll by 3c/mile each year starting at 11.4c/mile
and a constant rate of 5.1c/mile for passenger vehicles through 2010. A catch up increase is
introduced to account for inflation over the first four years; this would be applied between mid
2010 to mid 2011. From mid 2011 the concessionaire has the ability to raise the toll to the
greater of 2%, the change in the annual CPI or the nominal US GDP per capita growth
rate(Samuel 2006).
Performance Measures
The concessionaire is required to perform maintenance and operate in accordance with
maintenance manual and operations procedure manual, follow guidelines stipulated in the
environmental management manual, prepared along with the lease agreement. The maintenance
manual depicts IFA’s maintenance policies and aims to “preserve the economic value of the ITR
as a capital asset, and restore a riding quality reasonably satisfactory to the ITR users”. Repairs
are to be made in order to maximize the functional life of the structure, conduct emergency
maintenance, restore safety and useful condition, and above all maintain orderly traffic. This
manual provides the concessionaire with a timeframe for repairs, the frequency at which it must
be done, and the acceptance criteria as per Indiana Department of Transportation (INDOT)
standard specifications (Authority and Architects 2005).
The operations and procedures manual provide the concessionaire, guidelines to prepare and
submit an operations plan that would include the concessionaire’s intent to deal with the staffing
requirements and allocations, customer service, a safety plan describing the working conditions

68 68
and the training programs under Occupational Safety and Health Association (OSHA) standards,
a plan for controlling the operations of equipment, a toll collection and operations plan, and a
traffic and travel management plan to name a few. It also mentions a timeframe for the submittal
of each of these plans and the criteria for the acceptance (Authority and Architects 2005). Any
change in procedure proposed by the operator would require the prior approval of the IFA
accompanied by the concessionaire’s rational for such alteration.
Currently, the ITRCC which is responsible for the operation and maintenance of the ITR,
(indirectly owned by the State Wide Mobility Partners) is working on the implementation of the
an E-Z Pass compatible toll collection system called ‘i-Zoom’, whereby a vehicle equipped with
a transponder issued by a state that belongs to an Interagency group can use it for travel in any
other member state (ITR 2007).
The concessionaire is also required to submit an annual traffic study conducted by an accredited
traffic consultant in order to measure the level of service before July 1 of each year and also to
project the level of service (LOS) for the following seven year period. However, the IFA
reserves the right to modify or change the operating standards in accordance with generally
adopted procedures by the U.S highway authorities. Any modifications desired by the State those
are not in accordance with the standard practice require the state to provide additional
compensation(Indiana Finance Authority and Company 2006).
Financial statements are to be submitted bi-annually that include un-audited balance sheets,
statements of income and changes in equity and cash flow prepared in accordance with the
Generally Accepted Accounting Principles(Indiana Finance Authority and Company 2006).
Capital Improvements Program
Based on annual inspection of the toll road by an independent engineering firm and a traffic
consultant, the concessionaire is required to submit an annual capital improvements program to
the IFA. The purpose of this inspection is to check the roadway’s structural condition and to
determine potential capacity increases due to projected traffic growth, with a ten year planning
horizon(Authority and Architects 2005). Apart from the routine plan, a mandatory capital
improvements program has been scheduled by the IFA. The State Wide Mobility Partners have

69 69
anticipated up to $ 700 million in mandatory capital expenditure and maintenance requirements
over the first nine years of the concession (MIG 2005).
The agreement permits the addition of new lanes to the extent that it does not call for
construction of multilevel lanes or substantial modifications in the interchanges (Authority and
Indiana Finance Authority and Company 2006). Any default in capital improvements program is
secured by a letter of credit equivalent to ten percent of the purchase price deposited by the
concessionaire at the time of agreement.
Other Conditions
The agreement bestows upon the Indiana Finance Authority the right to modify the operating
standards that adhere to the new laws applicable to the toll road operations or conform to the
operating standards adopted by the state or government highway authorities in the United States.
The concessionaire can transfer the lease to another party, provided they are approved by the
Indiana Finance Authority based on the following factors:
1. The financial strength and integrity of the proposed transferee.
2. The experience of the proposed transferee or the operator to be engaged by the proposed
transferee.
3. Background and reputation of the proposed transferee.
The agreement binds the concessionaire to utilize the toll revenue to service debt and capital
expenditure related to the toll road operation and maintenance before passing the income to any
equity holders(Indiana Finance Authority and Company 2006)
Any revenue collected from the restaurant and gas station vendors is considered a part of the toll
road operating income. However, any new vendor would have to be approved by the IFA before
the ITR concession company can sign an agreement. The agreement encourages the use of
Minority Business Enterprises (MBE) and Women Business Enterprises (WBE) with a goal of
up to 6% of their total employment(Indiana Finance Authority and Company 2006).

70 70
3.4.4 The Winning Bid
The IFA received ten pre-qualified responses to their RFP, out of which nine were invited to bid
and four submitted final bids (Carey 2006). Statewide Mobility Partners consortium (SMP) an
even partnership between Macquarie Infrastructure Group (MIG), a wholly owned subsidiary of
Australian Macquarie Bank, and Cintra, a Spanish toll road operator, acquired the lease for an
upfront payment of $ 3.85 billion. The other three bidders were the Indiana Toll Road Partners
LLC (Kwame Parker), Itinere Infraestructuras S.A (an all Spanish group) , Indiana Road
Company LLC (Babcock and Brown) who offered $1.9 billion, $2.52 billion and $ 2.84 billion
respectively(Samuel 2006). Babcock and Brown submitted an alternative bid offering a $ 3.25
billion subject to a modification in the clause that determines the level of service based on the
peak time traffic study(Indiana Toll Road Company 2006) Abertis of Spain a potential fifth
bidder, withdrew shortly before the deadline(Statewide Mobility Partners 2005).
An independent analysis made by Crow Chizek and Co on behalf of the state was based on the
traffic projections by Wilbur Smith Associates for year 2006 through 2008. Assuming an
operating expense growth rate at 5.1%, capital expenditure growth rate at 2.5% and a 6%
discount rate based on the market cost of capital for the state of Indiana, net present value of the
cash flows was determined to be $1.9 billion (Nickerson 2006).
General feeling among the Indiana state authorities was that all bids were strong, from seasoned
and the biggest toll road operators in the world. The amount that Macquarie and Cintra offered
was significantly more than the state’s expectation, so the lease naturally went to the highest
qualified bidder. This amount covered more than the requirement to fund the Governor’s ten year
Major Moves Program. Apart from the successful deal, the authorities seemed to be proud of
having achieved a completion of the process in a record time of 177 days and were satisfied with
the level of service promised by the concessionaire(Samuel 2006).
3.4.5 The Investment Rationale
The offer made by Macquarie and Cintra was definitely an aggressive move on their part – a cut
above the rest. The consortium seems confident of the value they have assigned to the asset.
However, if the criterion for expansion were changed from peak traffic to those based on average

71 71
traffic, they might have bid $3.25 billion (Project Finance 2006). They projected a potential
growth in toll revenue based on the 49 year operating history that shows a substantial growth as
traffic has grown over 3.9% per annum since its opening (Indiana Finance Authority 2005).
The toll road, a link between major logistics hubs in the U.S., is a part of the Federal Interstate. It
is mainly used by commercial traffic and enjoys a monopoly in this region with only competing
routes I-94 to US-20 and I-94 to US-12. However, these routes have a time penalty attached to
them (MIG 2005). Thus, increase in toll is expected to have a limited impact on the traffic
demands since most of these commercial vehicles are out-state vehicles which would not take the
free local routes.
Toll revenues in 2005 were $ 88 m, apart from the $8 m collected from the gas and restaurant
owners. The state’s operating costs were $ 35 m producing earnings before interest, tax,
depreciation and amortization (EBITDA) of $ 61m, (Samuel 2006). The state laid out a
scheduled increase for the initial few years of the lease which was designed to double the toll
revenues to a $170m per annum, viewed as a ‘very attractive tolling plan’ by chief executive of
Cintra, Jose Maria (Samuel 2006). The State Wide Mobility Partners have anticipated upto $ 700
million in mandatory capital expenditure and maintenance requirements over the first nine years
of the concession (MIG 2005). The 75 year long term concession provides the operator sufficient
time to recover the expenses and make a decent profit from the toll road operation. The
advantage of the deduction in operating income due to asset depreciation would account for a
significant tax saving over the lease period (Lerer 2005).
The consortium planned an eighty-twenty debt-equity financing to fund the deal. The equity
portion was $770 m out of which the individual contribution by Cintra and Macquarie was $
375m and $ 385m respectively. The balance of $ 3,279 million was raised through non-recourse
debt from international financial institutions and banks such as DEPFA, Dexia, BBVA, BNP,
Caja Madrid, RBS, SCH. The equity and debt thus raised about $4,049 million, accounted for the
total cost of deal (Samuel 2006).
The consortium expected an equity internal rate of return between 12.5% to 13.3% that provides
a yield of 2.6% per annum in a the first five years with an anticipated 15 year pay back period to

72 72
equity. The equity risk premium was 8% to 9% per annum over US ten year bond yield. This
acquisition is critical to the Macquarie Infrastructure Group (MIG) as it increased average
concession period, internal rate of return and equity risk premium of the MIG portfolio.
According to MIG reports toll way accounted for 5% of MIG’s portfolio after closure. (Samuel
2006).
3.4.6 Reactions
Concerns regarding the morality and legality of leasing a public property were expressed by the
“public policy watch-dogs”. Companies engaged in distribution of products from the area
warehouses, feared the long term toll hikes (Weskits 2006).According to the results of a poll
conducted, a majority did not approve of the toll road lease. Many were skeptical of the transfer
of control, for an indefinite period, to a “foreign” private entity which concerned many. Others
were of the opinion that the state is trading its cash-cow that will now benefit a private entity
(South Bend Tribune 2006).
With an aim of discouraging law suits that hinder the progress of public projects, the Indiana
Supreme Court ruled that those challenging the deed would have to put up a bond equal to half
the lease’s worth or equal to $1.9 billion in proceeds (News-Sentinel 2006).
On contrary to the opposition, the state considered the deal a current value in exchange for
revenue foregone. The state government was looking at this transaction as a way to capitalize on
its infrastructure assets. The cash payment was utilized for reinvesting, repaying outstanding debt
and the IFA will be able to save the funds earmarked for the ITR capital improvement projects.
An innovative investment plan was chalked out that released interest payouts to fund the major
moves program and support the future infrastructure requirements through a ‘next generations’
trust fund (Heim 2006). Treasurer, Tim Berry outlined how the remaining $ 3.6 billion of the
proceeds, after paying off debt, could be invested. A website was launched that provided the
update of the interests earned on the investments by the minute.
$2.9 billion were placed in government- sponsored securities including Fannie Mae and the
Federal Home Loan Bank. $375 million were deposited at four major Indiana banks, and $ 315
million were invested in certificates of deposit at local banks around the state (Heim 2006).

73 73
In sum, the deal was expected to create a total $11.5 billion monetary benefit to the state
including the new construction and the operations and maintenance cost of the toll road over the
seventy five years of the lease.

74 74
Chapter 4- Case Based Project Finance Structure and Risk analysis In this chapter, as described in the research methodology, a project finance structure based on Yescombe’s template is drawn and the risk matrix is created to identify the risk allocation for each case study, thereby tracing the characteristics of the Greenfield and the Brownfield model.
4.1 The Greenfield Model
4.1.1 Pocahontas Parkway
Both Pocahontas Parkway and SR-125 have a similar project finance structure comprising of
design/build contractors, operation and maintenance providers, lenders, investors and end users.
A special purpose vehicle (SPV) or a project company is created for financing, operating and
maintaining the toll road. The members of project company are bound to each other via separate
contracts and a single comprehensive agreement is signed between the project company and the
regional transportation authority.
Pocahontas Parkway Association
FD/MK & VDOT
SIB & Tax Exempt Bonds Gov Funds
Debt Equity
Finance
FD/MK VDOT
UsersVDOT
D/B Contract
Toll Payment
O/M
ConcessionAgreement
Figure 4.1 Project Finance Structure for Pocahontas Parkway

75 75
The Pocahontas Parkway project was financed through a 63-20, not-for-profit organization
(formed by VDOT and FD/MK- a private and a public entity) which seems to have been created
for the sole purpose of issuing tax-exempt bonds. FD/MK being a private entity, under the then
U.S. taxation laws, was not eligible for tax-exempt financing. State Infrastructure Bank loan
provided subordinate debt. The project did not utilize any private sector equity. However, the
state government provided some funds representing equity contribution to the project.
93%
5%2%
Pocahontas Parkway - Source of FinancingTax Exempt Bonds Federal Funds State Infrastructure Bank
Figure 4.2 Pocahontas Parkway Source of Financing
FD/MK truly acted as a design-build contractor being responsible for construction of the project
under a fixed price and time contract with the 63-20 organization. The comprehensive agreement
mandated that the actual construction be subcontracted out to local contractors and VDOT was
responsible for the operation and maintenance of the project through its life-cycle.
Although a single comprehensive agreement was signed between VDOT and FD/MK, it was a
compilation of series of other separate agreements such as a contractor loan agreement, design-
build contract, project financing agreement, SIB loan agreement, guarantee of contractor loan,
etc. This seems to have caused fragmentation of the “comprehensive agreement” to some extent.

76 76
Risk Matrix for Pocahontas Parkway :
Figure 4.3 Pocahontas Parkway Risk Matrix
As far as the risk allocation is concerned, the right of way was to be acquired by FD/MK where
the private sector could utilize their ability to negotiate to their advantage. However, VDOT’s
oversight and support might have also helped mitigate the risk to some extent. VDOT was to
prevent the development of any competing facilities in its capacity but was not obliged to
provide any compensation to the project company. However, VDOT was ultimately responsible
to defease the bonds hence the risk due to competing facilities was held by the public sector.
They also assumed political risk due to change in legislation.
The construction completion risk was rightly allocated to the design-build contractor by
requiring them to guarantee the completion and performance. However, the force majeure risk
was improperly allocated to the contractor by requiring them to use contingency funds – a part of
the fixed price contract.

77 77
Although the revenue risk was assumed by VDOT, as they were ultimately responsible for the
defeasement of the bonds, they seem to have mitigated this risk by including a clause in the
agreement that required the toll rates to be set such that the revenue would cover the public debt
service and projected expenses for the year in question. FD/MK was required to provide a line
of credit that would be utilized for the payment of interest on the issued bonds in the absence of
sufficient revenue to cover the same. This suggests that some portion of the revenue risk was
passed on to FD/MK while they received no reward in return for the risk assumed.
VDOT was also responsible for providing the operations and maintenance and also providing
capital improvement. The reimbursement for VDOT’s operation and maintenance service did not
have guaranteed compensation as this was to be paid for only after the bonds and the debt was
serviced as shown in figure bellow. With lack of appropriate incentive to provide maintenance
this arrangement risked maintenance becoming discretionary.
Revenue Fund
Construction Fund
Tax Exempt Bond Service
State Infrastructure Bank debt Service
O&M & Oversight
Contingency Funds
O&M and Oversight
Contingency Funds
Surplus Funds after bond defeasement
Figure 4.4 Pocahontas Parkway Flow of Funds

78 78
4.1.2 SR-125
In case of SR-125, the project finance structure shows a movement towards increased private
participation as the initial project company (California Transportation Ventures) was wholly
sponsored by private engineering and construction firms. The project company was later
acquired by Macquarie (an investment bank) through their infrastructure investment arm. They
bought the equity stake in the project, which constituted to approximately 20% of the project
cost. This project also utilized the first ever TIFIA loan (a form of subsidized loan provided by
the federal government) that represents federal credit assistance that surface transportation
projects receive in order to make these projects financeable and encourage private sector
investment.
This project used the combination of private sector equity / debt and federal credit assistance to
finance it. No federal funds were directly utilized and the right-of –way was donated by the
community members.
52%
21%
20%
7%
SR-125 Sources of FinancingBank Loan TIFIA Equity Donation
Figure 4.5 SR-125 Source of Financing

79 79
Southbay ExpresswayPrivate entity
Caltrans
Concession Agreement
Finance
Macquarie Infrastructure Group
Senior Debt & TIFIA
Equity Debt
Parsons Brinkerhoff
Otey River Constructors ( (Fluor/ WGI)
Construction Contract
Design Contract
Community
Caltrans
O/M
User
Toll
DonatedROW
Figure 4.6 SR- 125 Project Finance Structure
As shown by the project structure above, a common comprehensive agreement governed the
construction, operations and maintenance of the project and the project company held separate
design, construction and the operations and maintenance contracts with the project company. The
transportation agency of California state, Caltrans, was contracted with the project company to
provide the operations and maintenance services.
The Greenfield model seems to have evolved from the way it was structured in case of the
Pocahontas Parkway.
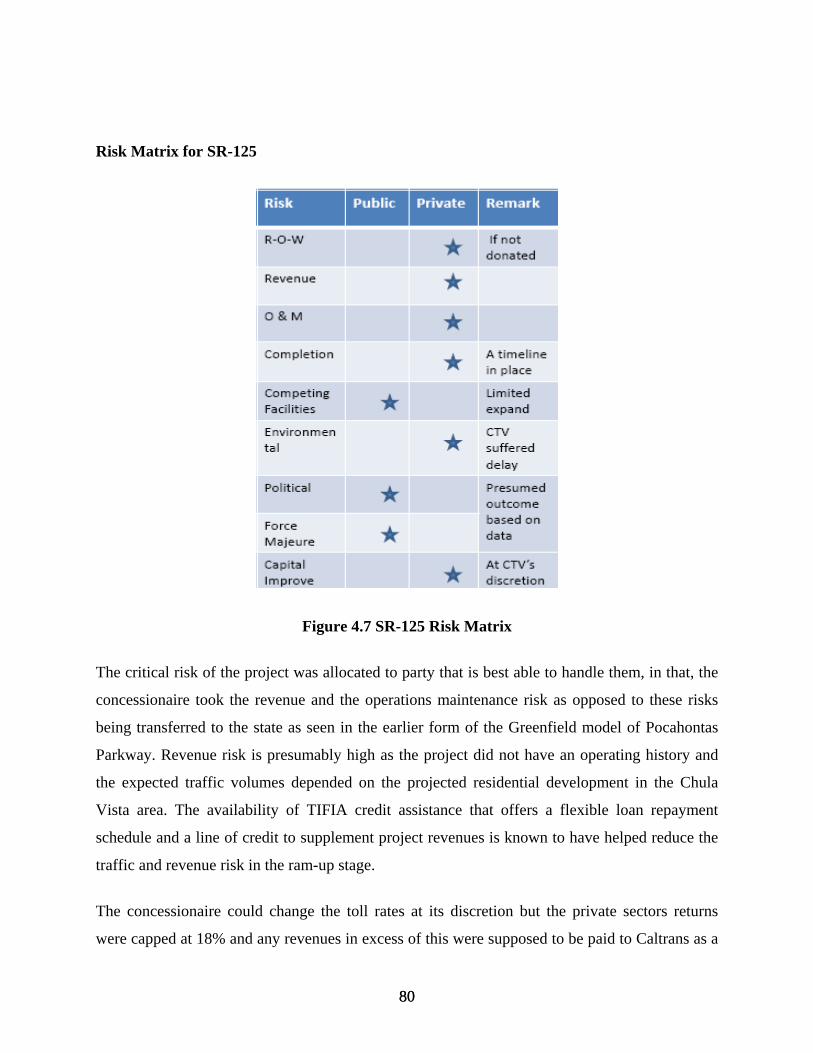
80 80
Risk Matrix for SR-125
Figure 4.7 SR-125 Risk Matrix
The critical risk of the project was allocated to party that is best able to handle them, in that, the
concessionaire took the revenue and the operations maintenance risk as opposed to these risks
being transferred to the state as seen in the earlier form of the Greenfield model of Pocahontas
Parkway. Revenue risk is presumably high as the project did not have an operating history and
the expected traffic volumes depended on the projected residential development in the Chula
Vista area. The availability of TIFIA credit assistance that offers a flexible loan repayment
schedule and a line of credit to supplement project revenues is known to have helped reduce the
traffic and revenue risk in the ram-up stage.
The concessionaire could change the toll rates at its discretion but the private sectors returns
were capped at 18% and any revenues in excess of this were supposed to be paid to Caltrans as a

81 81
franchise fee. Thereby the private sector shared the upside in revenues but had no liability in
downtime. By instilling a clause that limited the development of a competing facility, the
concessionaire seems to have further reduced their exposure to revenue risk.
The concession agreement provided a timeline for the project completion and did not have a
penalty clause for delay. Since the revenue risk was absorbed by the private entity a distinct
penalty clause for delay may not have been considered necessary.
Operations and maintenance services were contracted by the project company to Caltrans, the
public entity and the revenue obtained was first utilized to pay off expenditures related to
operations and maintenance. There were no mandatory capital improvements and the
concessionaire had the flexibility to conduct them when the traffic reached a particular level or
the concessionaire had paid out its debts. This could be read as an encouragement to the private
sector to implement congestion pricing for effectively managing the traffic.
The project right-of-way was donated by the community members otherwise it would have been
the concessionaire’s responsibility. The risk was further mitigated as Caltrans could intervene
and use its power of “eminent domain” (use authority to obtain a property with appropriate
compensation) if required by the concessionaire.
Once all the debts were repaid the revenues were available for making equity distributions in the
following order.

82 82
Revenue
Operations/ Maintenance
Capital Improvement
Program
Senior Bank Loan Service
Equity Distribution
Figure 4.8 SR- 125 Flow of Funds
Environmental risk was clearly held by the concessionaire, as the delay in environmental
approvals hurt the project completion and caused cost-overruns. The responsibility to obtain
environmental permits was correctly held by the public sector but the agreement could have
constituted a relief event for the concessionaire due to delay in acquiring approvals. This would
constitute a risk sharing mechanism between the public and private sector. Further, in the event
of any political overturn the concessionaire was entitled to receive compensation as determined
by the state authority.
4.1.3 Summary The Pocahontas Parkway case represents a developing Greenfield model which, to some extent,
retained the characteristics of a traditional design-build project with respect to how it was
financed and the responsibilities were allocated. Private participation was limited to providing
the design-build services and only partially assuming the revenue risk. However, this risk was
not tied to a distinct reward. The private sector did not provide any equity and the project was
financed by issuing public debt where the public sector tacitly assumed the role of a guarantor.
On the other hand SR -125 seems to be an evolved version of the Greenfield model where the
private entity provided equity participation equal to 20% of the cost of the project while the rest
was financed through commercial bank loan and government credit assistance. Government

83 83
credit assistance and the flexible repayment of the TIFIA loan may have mitigated the high
revenue risk that a Greenfield project has during the ramp-up stage, making it attractive to the
private sector. The private entity thus assumed the revenue, operation and maintenance risk
making it non-discretionary as opposed to the Pocahontas Parkway case where the debt service
had the first claim on the revenues generated. Political and completion risks in both cases were
rightly allocated to the public sector and the private sector respectively in both the cases. The
right-of- way was acquired by the private sector though the public sector was to execute
“eminent domain” if required, in order to facilitate the process.
However, an anomaly exists with respect to the Fore Majeure risk allocation in case of the
Pocahontas Parkway, where the risk was allocated to the design-build contractor. In case of SR-
125 the environmental risk could have been better handled if there was a relief event in place for
the private sector to assuage the cost-overruns caused by the delay in obtaining environmental
permits.
Implicit government support and also risk averseness to competitive facilities can be noted as a
common feature of both the cases studied under the Greenfield model. This can be attributed to
the revenue risk this model carries. However, there is greater risk acceptance in terms of equity
contribution, acceptance of revenue and operation and maintenance risk observed in the evolved
Greenfield model.

84 84
4.2 The Brownfield Model
4.2.1 Chicago Skyway
This was the first lease model that was signed in the U.S. The project structure was based on the
formation of a project company comprising of the equity providers, lenders, operation and
maintenance contractor. The members of the project company were tied together by a single
lease agreement to the pubic entity. The lease agreement laid out the rules under which the toll
road would be operated and maintained during the term of the lease.
Skyway Concession Company
City of Chicago
Concession Agreement
Cintra /MacquarieBank loan and Bonds
Finance
O/M
Users
Toll
Equity Debt
Cintra
Figure 4.9 Chicago Skyway Project Finance Structure
The lease was initially financed through an debt/equity ratio of 53:47. Macquarie and Cintra
consortium provided the seed investment, contributing to 55% and 45% of the total equity

85 85
respectively. The initial debt was issued by a syndication of European banks and later refinanced
through the issue of bonds on behalf of the project company, thereby reducing the equity stake of
Cintra-Macquarie by almost half.
47%
53%
Original Source of Financing for Chicago Skyway Equity Bank Loan
23%
70%
7%
Sources after Refinancing of Chicago SkywayEquity Securities/ Bonds Subordinate Bank Debt
Figure 4.10 Chicago Skyway Source of Financing

86 86
The operation and maintenance services were provided by Cintra a toll road operator through a
separate contract with the project company.
The revenues generated included tolls collected from vehicles and the funds received from the
mass transit operations and other miscellaneous services in the area. The cash flows from the
projects were first used to conduct operations and maintenance, capital expenditure, debt service
and finally for making distributions to the equity holders as shown bellow.
Revenue
Operations/ Maintenance
Capital Improvement
Program
Senior Bond Service
Subordinate Loan Service
Equity Distribution
Figure 4.11 Chicago Skyway flow of Funds

87 87
Risk Matrix for Chicago Skyway
Figure 4.12 Chicago Skyway Risk Matrix
The concessionaire was responsible for conducting the operations and maintenance and follow
environmental policies in accordance with the standards recommended by the City of Chicago.
The existing traffic and volume and the already congested parallel facilities might have led the
concessionaire to assume any risk that would arise from deviation in traffic due to development
of a competing facility. The traffic and revenue risk was not grave, as the toll road had an
operating history on the basis of which the private sector made an upfront payment to the City.
Toll rate was imposed as per a predefined schedule in line with inflation or GDP (gross domestic
product) growth. The agreement provided an extension in the lease term to off-set any loss of
revenue due to Force Majeure events. Capital improvements were required to be carried out as
per the agreement during the term of the lease under the City’s oversight.
The concessionaire was to be compensated if the city was to terminate the lease for convenience
thus they were safeguarded against any political risk due to change in legislation that would

88 88
over-throw the lease agreement. Considering the lack of political consensus the Brownfield
model has in the U.S., it seems to be one of the most significant risk categories, revenue risk only
follows next.
4.2.2 Indiana Toll Road
The finance structure for Indiana Toll Road- which followed on the heels of the Skyway- is
based on the same model where a project company Statewide Mobility Partners (SMP) was
formed to lease, operate and maintain the toll road. The lease operates under a single concession
agreement signed between the Indiana Finance Authority and the project company. Separate
contracts were signed between Cintra, the operator, and the syndication of banks with
SMP.
Figure 4.13 Indiana Toll Road Project Finance Structure
Statewide Mobility Partners
Indiana Finance Authority
Concession Agreement
Cintra /Macquarie
Finance
User Fee
Toll O/M
Equity Debt
Bank Loan
Cintra

89 89
The revenues collected included the funds from the toll road user fee and the lease payments
made by leasers of the properties in the area and operating restaurants and gas stations. The toll
rate was determined by a fixed schedule and was tied with inflation or GDP growth rate.
The equity was equally sponsored by Cintra and Macquarie and the debt was issued by a
syndication of Argentinean, Spanish and a local bank in Chicago. The debt/equity ratio was
approximately 80:20, indicating that the Brownfield project finance structures are financeable
on its own credibility without requirement of any form of third party/ government support.
19%
81%
Source of Financing for Indiana Toll RoadEquity Bank Loan
Figure 4.14 Indiana Toll Road Source of Financing

90 90
Risk Matrix for Indiana Toll Road
Figure 4.15 Indiana Toll Road Risk Matrix
Not surprisingly, the revenue risk and operations and maintenance risk was assumed by the
private sector. The operations and maintenance was to be conducted as per the standards and
procedures laid out in the lease agreement and the environmental policies were to be adhered to.
The concessionaire was responsible to perform any capital improvement as mandated by the
agreement. Also political and force majeure risks were assumed by the state authority.
Interestingly, through a ‘non-compete’ clause, the concessionaire was entitled for compensation
if the development of an alternate competing facility caused loss of revenue. This is a deviation
from the way this risk was handled for the Chicago Skyway, where the risk due to competing
facility was absorbed by the concessionaire. The reason being, Chicago Skyway is located in a
metropolitan area, so the risk perception due to competing facilities for this toll road is lower
than the risk perception for Indiana Toll Road, which is an interstate highway.

91 91
The hierarchy for the use of the revenue mandates the use the revenue first for the operation and
maintenance expenses followed by the capital improvement program then the repayment of debt
and balance for equity distributions as shown in figure.
Revenue
Operations/ Maintenance
Capital Improvement Program
Senior Bank Loan Service
Equity Distribution
Figure 4.16 Indiana Toll Road Flow of Funds
4.2.3 Summary The Indiana Toll Road lease was structured similar to Chicago Skyway as the Skyway lease
which was the first of its kind in the U.S. In both the cases the private sector was responsible for
providing operation and maintenance services and financing the lease governed by a single
comprehensive agreement with the project company. The project company further held separate

92 92
contracts that defined the roles of individual parties (operators, financiers etc) of the project
structure.
Both leases were financed through a combination of private sector equity and commercial debt.
The Chicago Skyway was initially sponsored through almost an equal percentage of equity and
debt, which was later refinanced such that the equity portion was reduced to approximately 20%
of the upfront payment.
In addition to the tolls collected from the vehicles, the revenue stream included funds from allied
operations such as property rents and mass transit systems functional in the area of service.
Operation and maintenance and capital improvements were non-discretionary and were required
to be performed as scheduled by the agreement. Debt could be serviced only after these expenses
were covered and equity distributions could be made after debt service.
The revenue risk was handled by the private sector and no government/ third party guarantee in
any form supported the financing of the lease, points out the secondary importance of this risk.
This can also be concluded from the Chicago Skyway case where the concessionaire accepted no
protection from competing facilities. However this was not consistently true for the Indiana Toll
Road due to the variation in risk perception.
Lack of political consensus for the Brownfield deals makes political risk very significant and
puts it in the forefront of the revenue risk. This can be noted as a typical characteristic of a
Brownfield model in the U.S. In both the cases studied this risk was mitigated by a clause in the
agreement that made the private sector eligible for compensation equal to the present value of the
asset in case the lease agreement was overturned due to any legislative changes.
93 93
Chapter 5 Study of Key Organizations This chapter provides a brief account of the operations, market and key financials of the three private sector organizations that have participated in the four case studies. This provides a background for an analysis of the nature of the participants in the Greenfield and Brownfield model.
5.1 Fluor Corporation
5.1.1 Background
Fluor is Engineering, Procurement, Construction and Maintenance service provider based in the
U.S. It is listed on the NYSE and has offices spanning over 25 countries across 6 continents. At
present, Fluor has an employee base of more than 46,000 people. Their five main business
segments are Oil and Gas, Power, Government, Industrial and Infrastructure, and Global
Services. Its operations in the Oil and Gas Sector account for about 50% of its sales. Through its
Industrial and Infrastructure segment, Fluor participates in Public-Private Partnerships for
railway and road projects.
Fluor directly and indirectly operates in the above mentioned sectors through its subsidiaries,
American Construction Equipment Company, Inc., Fluor Constructors International, Inc., Fluor
Enterprises, Inc., Daniel International Corporation, Del-Jen, Inc., ICA-Fluor Daniel, S. de R.L.
de C.V. (49%, Mexico), Fluor Holding Company LLC and TRS Staffing Solutions, Inc. The
services provided by these companies include:
1. Design- feasibility studies, project development planning, technology evaluation and
recommendations, risk management assessment, global sitting, financing planning,
constructability reviews, asset optimization over facilities life-cycle and front end
engineering.
2. Engineering- piping, mechanical, electrical, control System, civil/structural/architectural,
simulation, enterprise integration, integrated automation processes, interactive -3D
modeling
3. Construction- construction management and self-perform and O&M
4. Project Management, Program Management, Project Development and Finance
5. Procurement- global strategic sourcing , Contract Staffing

94 94
Company Name Origin
Fluor Corporation U.S.A.
Legal Status ( September 2008) Public
Number of Employees 46,000
Competitors ABB, Bechtel, Foster Wheeler, Balfour
Construction, Earth Tech, Hitachi, KBR, Marelich
Mechanical, Michael Baker, POSCO, Raytheon,
Shaw Group, Technip, Tyco, BE&K, Dragados,
Halliburton, Jacobs Engineering, McDermott,
Parsons Corporation, URS, BilfingerBerger,
Bouygues,CH2MHILL, Black&Veatch,
Region % Sales in 2007
U.S.A. 44
Canada 9
Asia/Pacific ( including Australia) 6
Europe 21
Central and South America 10
Middle East and Africa 10
Business Segments % Sales in 2007
Oil and Gas* 50
Power 7
Government** 8
Industrial and Infrastructure*** 20
Global Services**** 15
Services Provided Design, Engineering , Construction, Project
Management, Program Management, Project
Development and Finance, Procurement,
Operations and Maintenance, Contract Staffing
Table 5.1- Background of Fluor Corporation. Source: Fluor Annual Report (2007) and
Hoovers (2008).

95 95
* Accounts for 50% of the sales. Provides EPC and project management services in this sector.
* * Offers project management to the U.S. Department of Energy and Defense.
*** EPC services for pharmaceutical, biotechnology facilities, commercial/ institutional buildings, mining, telecommunications, and transportation projects. Public-Private-Partnerships for road-way and rail projects.
**** Provides it clients temporary staffing through its TRS staffing solutions unit, operations and maintenance services and asset management.
Following tables provides a summary of the P3 projects that Fluor has provided its services and some of the company’s key financials to understand the characteristics of the firm.
Project Location P3 Model Financing Source
High Speed Line Netherlands Greenfield (D/B) Dutch Government
London Underground U.K Greenfield (DBF) Private Finance
Pocahontas Parkway Virginia, USA Greenfield
(DBOF)
Tax exempt bonds
Conway Bypass South Carolina, USA Greenfield (DB) State Infrastructure
Bank
State Highway- 130 Texas, USA Greenfield(D/B) State/Local or
TIFIA
SR-125 California, USA Greenfield ( D/B) Macquarie
A-59 Freeway Netherlands Greenfield (D/B) Government
E470 Toll Road Colorado, USA Greenfield (D/B) Bond Issue
Table 5.2- Fluor’s Public-Private-Partnership Projects. Source: Fluor Website (2008)
Financial Measure Value
EBITDA Margin 4.032%
Total Backlog $ 30,000 million
Total New Awards $22,000 million
Total Assets $ 5796.2 million
Table 5.3-Fluor Financial Highlights. Source: Fluor Annual Report (2007)

96 96
5.1.2 Segmentation Matrix for Fluor A horizontal alignment of Fluor’s business segments examined against the different services they
provide in North America, Europe, Africa, Middle East, Asia Pacific helps identify the sector in
which Fluor most actively provides its services. An overview of their activities is summarized as
follows:
1. Fluor focuses on the oil, power and gas business segment and provides design and
construction related services in this segment in all of its markets majorly in North
America, Africa /Middle East and Asia Pacific.
2. In North America and Europe, Flour provides construction and design related services as
well as program management and project development services in the infrastructure
segment, especially in the U.S Greenfield P3 market. In the U.K. their Global Services
group provided EPC, program management and also arranged finance and provided
equity for the concession of the London Underground’s communications system. This
role is a deviation from the usual construction and engineering services that they provide.
3. Fluor is a popular contractor for government jobs in the U.S., which is their home market.
4. In the industrial segment Fluor provides substantial construction and design related
services in North America and Asia Pacific.
In sum, Fluor can be categorized as mainly a design and construction contractor operating in
all the continents of the world with most of their projects in the U.S focusing on oil, power
and gas and industrial sectors. They also provide design-build, program management and
project development services in the U.S. infrastructure segment or for Greenfield P3 projects.
Segmentation Matrix as proposed by Porter in his research on competitive strategy of a firm
is drawn for Fluor.

97 97
Europe
Oil ,Gas and
Power Industrial Infrastructure
Global Services
Government
Design Engineering Construction Procurement Project Mgmt
Construction Mgmt O&M
Program Mgmt Project Development
Staffing
Figure 5.1– Porter’s Segmentation Matrix for Fluor’s Operations in the North America and Europe. Source: Fluor Website (2008).
North America
Oil ,Gas and Power
Industrial InfrastructureGlobal Services
Government
Design Engineering Construction Procurement Project Mgmt Construction Mgmt O&M Program Mgmt Project Development Staffing

98 98
Asia Pacific
Oil, Gas and Power
Industrial InfrastructureGlobal Services
Government
Design Engineering Construction Procurement Project Mgmt Construction Mgmt O & M Program Mgmt Project Development Staffing
Figure 5.2 – Porter’s Segmentation Matrix for Fluor’s operations in the Africa/Middle East and Asia/Pacific. Source: Fluor Website (2008).
Africa/Middle East
Oil, Gas and Power
Industrial InfrastructureGlobal Services
Government
Design
Engineering
Construction
Procurement
Project Mgmt
Construction Mgmt Operations & Maintenance
Program Mgmt
Project Development
Staffing

99 99
5.2 Macquarie Group
5.2.1 Background
Listed on the Australian Securities Exchange (ASX), this group provides international banking,
financial, investments and advisory services. As per the companies databases Macquarie Group
employs over 13,000 people across 25 different countries in the Africa, Americas, Asia,
Australasia and Europe. Their International operations have contributed to 57% of operating
income in year 2007. Among the company’s competitors are Citigroup, Deutsche Bank, Goldman
Sachs, UBS Investment Bank.
Macquarie’s activities are organized into six different operational units:
1. Macquarie Capital (former Investment Banking Group) is involved in providing mergers
and acquisitions, takeovers and corporate restructuring advice. Equity capital markets and
equity and debt capital management, specialized equipment financing, specialized fund
management, raising Project Financing, equities cash and equities research capacities.
2. Equities Market Group provides equity linked products, equity hedge funds, and equity
finance.
3. Treasury and Commodities Group – Trades in Metals, Energy, Agriculture and other
commodities, debt market, foreign exchange, futures.
4. Banking and Financial Services Group – Stock broking, financial planning, investment
products, administrative and portfolio services, cash management trust, Personal Loans,
Credit Cards, Mortgages, Margin and Capital protected lending, deposit facilities, Business
Banking.
5. Real Estate Group- Fund and asset management. Investment and development finance,
Real Estate investment banking and advisory, development management and real estate
research.
6. Funds Management Group – manager of superannuation funds, full service manager for all
asset classes.

100 100
. 5.2.2 Macquarie Capital Group
This group which has contributed to 63% of the company’s profit in the year ending March’08 is
involved in activities such as Macquarie Group’s wholesale structuring, underwriting, corporate
advisory, specialized funds management, specialized equipment financing, institutional stock
broking and equities research capabilities.
In addition to providing investment banking solutions and other financial services the Macquarie
Capital Group has an independent Capital Funds division which provides vehicles to private and
institutional investors for investing their capital into infrastructure assets such as roads, public
transport, aged-care facilities, water utilities, wind farms, power utilities and car parking. These
funds focus on a variety of services related to infrastructure in diverse geographical markets.
Individually and in combination with other Macquarie funds they concentrate on investment in the
infrastructure assets such as Toll Roads, Power, Telecommunications, and Airports. Among the
listed funds are Macquarie Infrastructure Group that invests in Toll Roads, Macquarie Airports that
invest in Airports. Macquarie Infrastructure Partners is an unlisted fund.
In March 2008, Macquarie managed 166 infrastructure assets including roads, utilities, and
international airports through these funds with a total infrastructure asset valuing $ A 140 billion.
These funds are reported to have delivered 16% compound annual return to their investors
(individual or institutional) over the past 13 years. Eighty three percent of the infrastructure assets
are based outside Australia (Macquarie Group Annual Reports). Macquarie Capital Advisors and
Capital Funds together contributed to 44% of Macquarie’s profits in the year 2007-2008.
5.2.3 Macquarie Infrastructure Group (MIG)
According to an article in the New Age, Macquarie seems to have identified early the need for
private investment in the toll road sector, and specialized in the development and management of
toll roads. MIG is purely an infrastructure investment vehicle formed by Macquarie Infrastructure
Trust I (MIT), MIT II, Macquarie Infrastructure Group International Limited (MIGL) formerly
known as Macquarie Infrastructure Bermuda Ltd. These Trusts are managed by Macquarie
Infrastructure Investment Management Ltd (MIML), a wholly owned subsidiary of Macquarie
Group Ltd. MIGL is managed by Macquarie Capital Funds (Europe) Ltd (MCFEL). Both MIML

101 101
and MCFEL are part of the Macquarie Capital which is a leading player in infrastructure
investments over the world. Following is a background of MIG and its portfolio of toll road assets
across the world.
Company Name Origin
Macquarie Infrastructure Group (MIG) Australia
Number of Employees 246
Competitors Abertis, Brisa, Transurban, Ferrovial, John Liang
Asset Risk
Premium(%)
Location
%MIG Stake
%MIG portfolio
(asset value) P3 Model
407 ETR 4.3 Canada 30 38 Brownfield
M6 Toll UK 100 26
Greenfield
*
APRR 6 France 20.4 12 Brownfield
Westlink M7** 5 Australia 47.5 9 Greenfield
Dulles Greenway 8.5 USA 50 5 Brownfield
Indiana Toll Road 6 USA 25 4 Brownfield
Chicago Skyway 6 USA 22.5 3 Brownfield
Tagus River Crossing-
Lusoponte ( April 25 and
Vasco da Gama Bridge) 4 Portugal 30.6 2
Greenfield
/Brownfiel
d***
South Bay Expressway 9.5 USA 50 2
Greenfield
****
Warnow Tunnel 7 Germany 70 < 1 Greenfield
*MIG has a stake in the consortium that arranged the finance and negotiated the construction contract;
** Stake in Westlink was recently sold (Dec 2008); *** MIG has sold its stake in Lusoponte, responsible
for the O&M of 25th April Bridge and DBFO of the Vasco da Gama Bridge;**** MIG acquired the
consortium that was responsible for the DBFO of the Southbay Expressway.
Region % Revenue (2006)
Australia 49
North America 28
Europe 23

102 102
Region % Assets by value(2007)
Australia 9
Canada 38
UK and Europe 39
USA 14
Table 5.4- MIG Background and Asset Portfolio. Source: Hoover’s(2008); MIG
Website(2008); MIG Annual Report (2008).
Some financial highlights of MIG:
Financial Measure Value
EBITDA margin (AGM presentation 2008) 72.9%
Portfolio Valuation in June 2008 ( They have
written down their asset values in the wake of
the current unfavorable market conditions)
$ A 8,569 million
Return on Equity 18.3% ( MIG’s letter to risk matrix)
Total Equity $A 6,668,385,000
Total Assets $ A 9,747,056,000
Portfolio Risk Premium 5.16%
Table 5.5 – MIG Financial Highlights. Source: MIG Annual Reports (2008), MIG Website
(2008).
Following is the asset portfolio of Macquarie Infrastructure Partners (MIP) (a non listed fund)
MIP’s Asset Portfolio MIP's%stake
Chicago Skyway 23%
Indiana Toll Road 25%
Dulles Greenway 50%
Southbay Expressway ( SR-125) 50%
Table 5.6- MIP Asset Portfolio. Source: MIG Website (2008).

103 103
5.2.4 Segmentation Matrix for Macquarie Capital Group Studying the operations of the Macquarie Capital group provides significance to the investments of
its infrastructure fund, MIG.
In North America, Macquarie provides financial advisory services for structuring the financing for
the infrastructure and other projects. In addition their Securities division in the U.S. provides range
of services from investment banking to advising on corporate finance, project finance, P3s.
Through their funds MIG and MIP, Macquarie has so far, mainly invested in Brownfield projects
as SR-125 is their only Greenfield project in the U.S. MIP is also involved in investing in
peripheral infrastructure projects such as docks, container terminus etc. However they do not
noticeably participate in any airport projects. In Europe they are mainly involved in investing in
Greenfield projects as the only Brownfield project they have there is the operation of the Vasco da
Gama bridge in Portugal which is a part of the Design-Build-Finance-Operate agreement for the
new April 25 bridge across the Tagus River. Through Map (a fund that invests in airports) they
have stakes in Bristol, Brussels, and Copenhagen airports.
Recently the group sold their interests in Westlink toll road and Sydney’s Eastern Distributor Link
and had stakes in the consortiums that were responsible for the Design-Build -Finance-Operate-
Maintain these projects. They also have some equity interests in Sydney Airport and stake in a
consortium that operates the Janpan Airport Termial at the Tokyo airport. Their other investments
in the Asia Pacific region include interests in natural gas, gas and electricity distribution networks.
Macquarie also has stake in three toll road companies in South Africa and some presence in the
rail, airport and telecommunications sector.
A market overview of Macquarie Capital Group revels that this group is primarily a financial
services provider with interests in making direct and indirect investments in infrastructure sector
through their funds in North America, Europe, Asia, Australia, Africa, and Brazil in the Latin
American region. The following segmentation matrix reflects the activities of Macquarie in the
infrastructure sector and allied fields across the world. The information for developing the matrix
is obtained from their website.

104 104
North America Services/Products Greenfield Brownfield Others Toll Roads Airports Toll Roads Airports Advisory Services Banking Solutions
*Investments Infrastructure Funds
MIG MIP Map
Europe Services/Products Greenfield Brownfield Others Toll Roads Airports Toll Roads Airports Advisory Services Banking Solutions
*Investments Infrastructure Funds
MIG MIP Map
Asia Pacific Services/Products Greenfield Brownfield Others Toll Roads Airports Toll Roads Airports Advisory Services Banking Solutions
*Investments Infrastructure Funds
MIG MIP Map
Figure 5.3- Porter’s Segmentation Matrix for Macquarie’s Operations in North America,
Europe and the Asia Pacific. Source: MIG website (2008).
*Our focus for the Segmentation Matrix is Macquarie’s investments in the infrastructure and related sector mainly through three of its funds viz, MIG, MIP and Map. In other parts of the world, Macquarie Group has presence in Brazil. Macquarie’s South African Infrastructure Fund has stake in three toll road concessions, rail, airport and telecom sector.

105 105
5.3 Grupo Ferrovial
5.3.1 Background
Grupo Ferrovial, is one of Spain’s largest construction and engineering company, which started in
the 1950's to build rail roads and by late 1960's was an established public sector highway
contactor. Ferrovial has now grown into a leading private airport manager, toll road and car-park
operator, and other infrastructure related service provider. It has presence in 43 countries in
Europe, North America, South America, Africa, Asia with more than 100,000 employees. Eighty
percent of its profits are earned outside of Spain and 73% of the total profits were attributed to its
infrastructure management business in the year ending March 2008.
Ferrovial operates in the construction industry though its flagship company, Ferrovial Agroman,
Cadagua, Budimex in Poland and Webber in Texas. Fairly recently, Ferrovial acquired the British
Airport Authority (BAA), through which it is involved in the development and operation and
maintenance of Airports.
Grupo Ferrovial is the parent company of Cintra Concessions Infrastructuras de Transporte SA.
Cintra is one of world’s leading toll road developers and a car park manager in Spain. It has in its
portfolio over 23 Toll Roads in Spain, Portugal, Ireland, Greece, Chile, Canada and USA
amounting to 16.0 billion Euro which contribute to 86% of Cintra’s revenue stream. After being a
part of the winning bid for both the Chicago Skyway and the Indiana Toll Road, Cintra has also
been chosen a strategic partner under the Comprehensive Development Agreement for the
development of the Trans-Texas-Corridor.
Grupo Ferrovial’s core-operations underwent a change in the year 2006 and the infrastructure
development business got clearly distinguished into Airports, Toll Roads and Car Parks as shown
by the table bellow. Its toll toad and car-park business has contributed to 7% of the parent
companies sales in the past two years.

106 106
Sector Operations % Sales Sep’05
Civil Engineering (Bridges,Dams
etc)
Construction and
Design
Commercial, Residential and
Heavy
Construction 48
Real Estate Development 9
Infrastructure Development 8
Urban Services Waste Collection
Waste Management
Facility Management
Core
Operations
in 2005
Infrastructure Upkeep and
Maintenance and Handling
35
Sector Operations %Sales
Sep’06
%Sales
Sep’07
Civil Engineering (Bridges,
Dams, etc)
Construction and
Design
Construction (Commercial,
Heavy and Residential)
Construction
44
35
Airports 13 27
Toll Roads and Car Parks 7 7
Urban Services Waste collection and
Management
Facility Management
Core
Operations
in 2006,
2007
Infrastructure Upkeep
,Maintenance and Handling
Services
36
31
Table 5.7 – Grupo Ferrovial’s Core Operations. Source: Ferrovial website (2008).

107 107
Ferrovial’s
Subsidiary
company
Discreption
Ferrovial Agromn
Was formed in 1999, with the merger of the construction business of Ferrovial
and Agroman Empresa Constructura, involved in civil engineering projects such
as dams, reservoirs, highway, water treatment plant engineering and construction.
Cintra Ferrovial has 62% stake in Cintra, one of world's largest transportation
infrastructure operation and maintenance of toll roads and manages over 20 toll
road concessions internationally. Cintra also manages over 250,000 parking
spaces in Spain, Andora, Puerto Rico, holds on-street car park concessions,
provides car towing services, manages airport/private car parks, off-street car
parks and also provides management solutions to government agencies.
Swissport Provides ground handling services that include cabin maintenance, safety
activities, and executive activities in North America, Latin America, South East
Asia, Africa.
Ferrovial Inmobiliaria
Real estate activities in development and brokerage were dissolved in 2006.
Cadagua Provides turnkey contracting, O&M, BOOT/BOT financing for water treatment
plants and solutions for solid waste management.
Ferrovial Services
Provided public services such as water and solid waste management, facility
maintenance.
Ferrovial Servicois
Provided public services such as water and solid waste management, facility
maintenance.
Cepa and
Eurolimp
Are cleaning services group in Spain and Portugal.
Ecocat and
Ecodinic
Are subsidiaries of cespa that provide hazardous and health care waste
management services respectively.
Amey Has a strong hold in the U.K PFI market. It has equity interest in Tube Lines – the London Underground concession.
Table 5.8 Grupo Ferrovial’s Subsidiaries. Source: Ferrovial Website (2008)

108 108
5.3.2 Cintra Some financial highlights for Cintra are as follows: Geographical Region Percentage Revenue
(Year-2008)
Percentage Profit (EBITDA )
(Year-2008)
Canada 34.51 % 39.8%
Chile 16.35% 16.8%
Spain 30.8% 22.3%
Rest of Europe 9.2% 10.8%
USA 9.1% 10.3%
Table 5.9 –Cintra’s Regional Distribution of Revenue and Profits . Source: Cintra Annual
Report (2007).
Financial Measure Value
EBITDA Margin 67.7%
Value of Principal Assets Euros 9,186 million
Return on Equity (average of 5 yrs) (reuters
finance)
5.61%
Average Risk Premium in 2004 4.5%
Total Equity Euros 1,034.7 million
Total Assets Euros 12,295 million
Return on Portfolio Investment Approx 12.5
Table 5.10 – Cintra’s Financial Highlights . Source: Cintra website (2007); Cintra Annual
Report (2007); Reuter’s Finance (2008); Ferrovial website(2008).

109 109
Company Name Origin
Cintra Concesiones de
Infraestructurasde Transporte, S.A
Spain
Legal Status Public
Number of Employees 2900
Competitors Abertis, Iberpistas, Itinere Infrastructuras
Asset Portfolio Location %Cintra
Stake
% of Cintra’s
Portfolio(200
4 present)
P3 Model
Ausol I Spain 80 Greenfield
Ausol II Spain 80 Greenfield
Madrid Sur Radial- 4 Spain 55 Greenfield
Madrid Levante Spain 51.84 Greenfield
M-45 Spain 50 Brownfield
M-203 Spain 100 Greenfield
Autema Spain 76.275
28%
Geenfield
Central Greece Toll
Road
Greece 33.34 Geenfield
Lonian Roads Toll
Road
Greece 33.34 Geenfield
M-3 Toll Road Ireland 95 Greenfield
Eurolink M4-M5 Ireland 66 Geenfield
Scut Açores Toll
Road
Portugal 89
Greenfield
Euroscut Algarve
Toll Road
Protugal 77 Greenfield
Euroscut Norte
Litoral Toll Road
Portugal
75.5
4%
Greenfield

110 110
Asset Portfolio
Location
% Cintra
Stake
% Cintra’s
Portfolio
P3 Model
Temuco-Río Bueno
Toll Road
Chile 75 Brownfield
Santiago-Talca Toll
Road
Chile 100 Brownfield
Talca-Chillán Toll
Road
Chile 67.6 Brownfield
Ruta del Bosque Chile 100 Brownfield
Collipulli-Temuco Chile 100
5%
Brownfield
SH-130 Segment 5,6 USA 65 Greenfield
Chicago Skyway USA 55 Brownfield
Indiana Toll Road USA 50
7%
Brownfield
407 ETR Canada 53.2 47% Brownfield
Aparamientos (car
parking)
Spain/Andora/Pu
erto Rico
100 9%
Car Park
Concessions
Table 5.11 – Cintra’s Background and Asset Portfolio. Source: Cintra website (2008); Hoover’s (2008).

111 111
5.3.3 Segmentation Matrix for Ferrovial
Since Ferrovial is the parent company of Cintra, studying Ferrovial’s operations gives a wider
perspective to Cintra’s activities.
In the North American market Grupo Ferrovial provides design-build services for toll roads,
railways, civil and industrial structures and hydraulic/water treatment plants. Through Cintra they
are also involved in sponsoring and operating Greenfield and Brownfield toll road projects.
Ferrovial provides design-build services and lease retail facilities in some of the U.S. airports.
Ferrovial also provides consulting services for environmental and hydraulic works.
In Europe, Ferrovial provides design-build services for toll roads, railways, airports, industrial
facilities. Through Cintra they are also involved in Greenfield and Brownfield toll road projects
and leasing car-parks. They also provide advisory services for environmental and hydraulic works.
In 2006 they acquired the British Airport Authority that owns and operates seven airports in the
U.K and also has retail contracts with some airports in Italy and the U.S. In Latin America they
provide design-build services for Greenfield and Brownfield toll-roads and also lease airports.
A market analysis for Ferrovial suggests that this group primarily provides Design-Build services
and has diversified their operations thorough its subsidiaries (Cintra, Amey) into investing in and
operating and maintaining a wide range of infrastructure assets ranging from toll roads and car
parks to water treatment plants. Cintra is distinctly provides operating and maintenance services
and also acts as an equity participant in Greenfield and Brownfield projects.
Ferrovial’s segmentation matrix is based on the information available on their services and
projects in different geographic regions as published on their website.

112 112
North America
Facility Transportation Urban Services
Hydraulic
works/Enviro **IndustrialBuilding/Civil
Structures Car
Parks *AirportsToll
Roads Railway
Street Cleaning and Waste
Management
Design/Build
DBFO
Leases
Advisory Europe
Facility Transportation Urban Services
Hydraulic
works/Enviro **IndustrialBuilding/Civil
Structures Car
Parks *AirportsToll
Roads Railway
Street Cleaning and Waste
Management
Design/Build
DBFO
Leases
Advisory Latin America
Facility Transportation Urban Services
Hydraulic
works/Enviro **IndustrialBuilding/Civil
Structures Car
Parks *AirportsToll
Roads Railway
Street Cleaning and Waste
Management
Design/Build
DBFO
Leases
Advisory
Figure 5.4 – Porter’s Segmentation Matrix for Grupo Ferrovial’s Operations in North
America , Europe and Latin America . Source: Ferrovial website (2008).
*Participates in the airport distribution industry through the retail facilities, ‘World Duty Free’ in the
airports of Baltimore/Washington, Pittsburg, Boston Logan; **The sector ‘Industrial’ includes energy,

113 113
power, chemical plants and utilities. In Europe, Ferrovial’s concession business is major growth
area.They acquired British Airport Authority to form the largest airport manager in the world.
5.4 Nature of the Participants All the three companies studied seem to have one common feature i.e. their interest in the P3
market. However, Fluor, Macquarie and Cintra/Ferrovial differ greatly, mainly with respect to
the services they provide to the P3 market and their core competencies. They also have differing
geographic backgrounds although the interest in the U.S. market is common to all three. Based
on their respective business models they use different financial metrics to gauge their
performance
From an organizational background study and the segmentation matrix it is evident that Fluor is
purely an Engineering Procurement and Construction (EPC) firm based in the U.S., catering
majorly to the Oil and Gas industry and their infrastructure and industrial business follows next
in line (Table 5.1).Their involvement in the P3 market is only limited to providing design-build
services as observed in both the Pocahontas Parkway and SR-125. Fluor seem to have confined
themselves from contributing equity to most of the P3 projects they have participated in (Table
5.2), except for the London Underground project, where they arranged financing and provided
equity to the project company .They are mainly interested in being a part of the consortium for
Greenfield projects where they can add value by providing construction and related services.
Their profit margin is as low as 4%, which points out their low-profit, high-turnover business
model. This is a characteristic of the firms in the construction industry that measure their
performance based on the volume of work, new awards and the backlog of projects. Fluor’s total
asset value is $5.7 billion (year 2007-2008) most of which accounts towards the ongoing
construction operations as per Fluor’s annual report.
Cintra on the other hand is an off-shoot of a construction company (Ferrovial) that purely
provides operation and maintenance services to toll-roads and car-parks and also contributes
equity to projects where they hold an operation and maintenance (O&M) contract. They majorly
focus on the infrastructure sector as nearly 80% of their profits are contributed by their toll-roads

114 114
business unit. Cintra has a profit margin of 67% and its revenues come from the operations and
maintenance contracts it holds.
Cintra’s association with Ferrovial can be seen as their competitive advantage that they can
leverage while bidding for a Greenfield project. They use their operation and maintenance
(O&M) competence to bid for Brownfield projects. In the U.S they have so far been involved in
the two Brownfield projects, Chicago Skyway and Indiana Toll Road, providing equity and
operation and maintenance services. They were also recently chosen as the strategic partner of
the Texas Department of Transportation for the development of the Trans-Texas Corridor. They
equally participate in both the Greenfield and Brownfield arena. Out of their portfolio of toll-
roads and car-parks, 32% are Greenfield projects in the Europe, 47% is occupied solely by the E-
407 Brownfield project in Canada, 5% are Brownfield projects in Chile and 7% are Greenfield
and Brownfield projects in the U.S. (Table 5.11).
Lastly, Macquarie is a financial services firm or an investment bank. Through their Capitals
Group they provide advisory services and investments in P3s via special infrastructure funds,
Macquarie Infrastructure Group being one of them. This group alone has contributed to 63% of
Macquarie Group’s profits. The profit margin of Macquarie Capitals Group like any other firm in
the financing and consulting business is high, approximately equal to 70%. Their business model
for P3 projects is to provide equity to finance the projects, combining it with advisory services
and investment banking to the project company for a fee. The refinancing of Chicago Skyway
debt is an example, where, securitization of the debt provided returns to the equity holders and
the transaction fees to group that issued the securities. Thus they seem to leverage their
competence in providing financial services while investing in Brownfield and Greenfield
projects.
Out of Macquarie Infrastructure Group’s asset portfolio, 38% is the E-407 Brownfield project in
Canada and the remaining portion consists of Greenfield and Brownfield projects in the Europe
and the U.S. Macquarie has recently (December 2008) sold its stake in the M7 Westlink project
in Sydney as per an article in Infra New article and in 2006 had disposed off its interests in
Sydney Roads Group operating M5 and M6 toll roads in Australia.

115 115
Macquarie on its own can only invest in the P3 projects as an equity member and needs to
partner with construction firms and O&M contractors to deliver a Greenfield or Brownfield
project. Similarly, Cintra needs to tie up with companies with financial expertise to structure the
deals and construction contractors to design-build the project. However, they can engage
Ferrovial (the parent company) as a design-build contractor to their advantage. Fluor being a
construction company has to form a consortium with the firms with financial expertise and O&M
contractors to deliver P3 projects.
Thus the core competencies of these companies shape their interests regarding the P3 models that
they would choose to participate in or limit themselves to. This justifies Fluor’s interest to
operate only in the Greenfield model while Cintra and Macquarie are interested in the Greenfield
as well as the Brownfield model.
We also observe how the differing natures of the key participants allow them to bring in
individual expertise to the table which is one of the essences of Public-Private-Partnership
projects.

116 116
Chapter 6 Conclusion
6.1 Objective and Means The purpose of this research is to study the characteristics of the emerging Greenfield and
Brownfield P3 models through an organizational and structural point of view. The aim is
to understand the characteristics of the two models, based on their financial structure,
associated risk allocation, and the nature of the lead organizations participating in these
project models.
This is achieved using a two pronged methodology that involves developing case studies
for four P3 projects in the U.S. and conducting an organizational study of the key
participants of these projects. An analytical template consisting of a Yescombe’s project
finance structure, a risk matrix and Porter’s segmentation matrix is used as a medium to
assimilate the information assembled through the cases, and to provide an analysis of the
cases thereby leading to a characterization of the Greenfield and the Brownfield model.
6.2 Observations Both Greenfield and Brownfield models have a common framework that involves
formation of a special purpose vehicle that comprises of lenders, equity providers and
contractors. Generally, they utilize an equity/debt form of financing, and the debt is off of
the sponsor companies’ balance sheet. The special purpose vehicle together with the
government authority and the end user complete the project finance structure. However,
there are few differences with respect to the type of project participants, risk allocations
and mechanisms used to finance the projects in both the models.
6.2.1 Project Structure and Associated Risks The SR-125 model has evolved from the earlier version of a Greenfield model which had
traces of the traditional design-build approach. The reason being, in the earlier model
(Pocahontas Parkway), the project was financed by the public sector. The project
operations risk and most of the revenue risk were also assumed by the public sector. The

117 117
private sector’s contribution was limited to providing design-build services and absorbing
part of the revenue risk by making available a line of credit to service the debt.
In the evolved Greenfield model, operations and maintenance and revenue risk are being
assumed by the private sector. It has been noted that, since the Greenfield project model
has significantly high traffic and revenue risk perception – as they do not have an
operating history- the implicit government support in the form of subsidized credit
assistance with flexible repayments has made these projects palpable to the private sector.
The private sector firms are increasingly investing equity in Greenfield projects and
assuming the revenue and operations/maintenance risk (putting their skin in the game).At
the same time, they seem to safeguard themselves from any political overturn by seeking
compensation in the event of termination. Thus in the evolved Greenfield model we
observe that the government plays a regulator’s and facilitator’s role rather than being the
key driver of the project, thereby, allocating most of the risks to the private sector.
The Brownfield model is similar in structure to the evolved Greenfield model except for
the absence of a design-build contractor in the special purpose vehicle. The two projects
studied under this category utilized equity contributed by the private sector and debt
issued by commercial banks. There is no credit assistance or guarantee provided by the
government, this is likely due to the low revenue risk associated with these projects
which have a proven traffic history. The operation and maintenance and revenue risk is
taken by the private entity. The government authority only plays a regulatory role
directing the toll rates and standards of operation and maintenance. Although the revenue
risk is not a prime concern, lack of consensus for these projects has raised the political
risks for long-term leases in the U.S. In both the cases studied, this risk is mitigated by a
clause in the comprehensive agreement that makes the private sector entitled to
compensation in case the lease is terminated due to change in legislation.
Since the risk perception due to competing facilities are different for Chicago Skyway
and Indiana Toll Road this risk has been assumed by the project company in case of the
Chicago Skyway, whereas, for Indiana Toll Road public sector assumes this risk.

118 118
6.2.2 Nature of Lead Organizations
Both the models have participation from Wall Street firms like Macquarie – as an
investor and advisor- and operation and maintenance contractors like Cintra. Traditional
construction firms like Fluor and Ferrovial are players in the Greenfield model where
they can use their competency as a design-build contractor adding value to the project
company. On contrary to Fluor’s business model- that restricts them to Greenfield
projects- Ferrovial is indirectly involved in the Brownfield model through their
subsidiary Cintra which provides operations/maintenance and also invests equity to
finance the project. The cash-flows of the Brownfield model provide stable and long-term
returns to firms or funds that are looking to make investments.
The core competency that each company has defines the role they play in the special
purpose vehicle and also the type of model they choose to become a participant of. It is
evident that each of these companies, Macquarie, Fluor or Cintra are interdependent to
deliver a P3 project. Through their multifarious expertise they add-value to the project
company in which they participate. This validates one of the advantages of Public-
Private-Partnerships, where the private sector is expected to bring in innovation and
efficiency to the table.
6.3 Future Trends
Outside the scope of the thesis traditional construction firms are also found increasingly
interested in providing equity in the Greenfield arena. Thus we see the Greenfield model
is ever evolving with respect to the type of players it can attract and hence the manner in
which the risks are allocated to various participants.
A possible change in the Greenfield model, as this thesis characterizes it, is observed in
the procurement of the Port of Miami Tunnel project which failed to reach financial
close. The project was being procured using an availability based payment structure
where the public sector would have taken in the revenue risk and the private sector

119 119
instead would receive periodic payments for making the facility available and providing
quality service.
Specifically, in the U.S. Brownfield arena, many of the deals that were awarded did not
reach financial close and still remain a controversial topic. For example, a private
consortium had offered approximately $12 billion to lease Pennsylvania Turnpike. They
called off their offer as the State could not come to an agreement to pass a legislation that
would allow the private entity to lease the turnpike. Congressmen James Oberstar and
Peter DeFazio have time and again expressed concerns regarding long-term toll-road
concessions. Thus future of the Brownfield model in the U.S. remains uncertain.
The new administration in the U.S. has announced the future creation of a National
Infrastructure Bank as part of its ‘Economic Stimulus Plan’ which will flush funds into
the state transportation authorities’ accounts, to be utilized for the development of the
much needed infrastructure. Now, whether these funds will be utilized to provide credit
assistance or to completely finance the projects is a question which is unanswered at this
point in time. Some have proposed increase in gas taxes to fund highway projects which
would bring infrastructure financing back to its traditional form. Critics of this proposal
think this is a temporary fix and will not cover infrastructure deficit over long-term.
The current economic crisis has created a credit crunch, as a result, the cost of financing
P3 projects has increased and the private sector finds it difficult to arrange commercial
debt for infrastructure projects. This difficulty is pushing the private sector to restructure
mechanisms used for financing these projects.
Recently, the TIFIA program whose interest rates are tied to the treasury bonds is
reported to have been oversubscribed. With the central bank slashing the rates for the
treasury bonds, the demand for the TIFIA loan has increased. With nine pending
applications claiming $110 million this year, there are questions whether the program
will increase its capacity. The TIFIA program has been crucial in attracting private

120 120
investment in infrastructure through subsidized and flexible credit assistance, which also
provides an open line-of-credit to supplement the revenues during ramp-up stage.
There is uncertainty with respect to the development of P3 projects in the United States
and how they will be structured. It remains to be seen how the political scenario in the
U.S. and the economic situation around the world will impact the present day Greenfield
and Brownfield P3 models.
6.4 Scope for Future Work
This research studies four unique cases and the conclusions are based upon these. A
wider range of case studies might possibly add new dimensions to those characterized by
this thesis. We are also constrained by the facts available on the Brownfield model as
only two projects have been procured as pure leases so far. It might be worthwhile to add
new cases as an when they are procured to widen the characteristics of both the models.

121 121
Bibliography
Akintoye, A., Hardcastle,C., Beck, M., Chinyio, E., and Asenova, D.(2003). "Achieving
best value in private finance initiative project procurement." Construction Management
and Economics 21(5): 461-470.
AASHTO (American Association of State Highway & Transportation Officials).(2007).
"Innovative Finance for Surface Transportation." Retrieved May 20, 2007, from
http://www.innovativefinance.org/topics/finance_mechanisms/federal_loans/tifia.asp.
Beidleman, C. R., Fletcher, D., and Vesbosky, D. (1990). "On Allocating Risk: The
Essence of Project Finance." Sloan Management Review.
Buxbaum, J. N. and Ortiz, I.N. (2007). Protecting the Public Interest: The Role of Long-
Term Concession Agreements for Providing Transportation Infrastructure, USC Kenston
Institute for Public Finance and Infrastructure Policy.
Business Wire Editors. (2003) " Fitch Affs Pocahontas Parkway Association, VA Sr Revs
at 'BBB-'; Remains on Rating Watch Neg " Business Wire. New York.
Brown, B. (2005a). A Presentation on Public-Private-Partnerships-The Skyway Sale and
its Implications for Municipal Finance. Natonal Association of State Treasurers,
Goldman Sachs.
Brown, K. (2005b). A Presentation on The Skyway Sale and its Implications for
Municipal Finance, Goldman Sachs.
Bunker, T. (2005). "Leasing the Masspike to Private Operators." Directions(14).
Carey, G. (2006). You Bet Your Assets: Leveraging Existing Infrastructure, Current
Opportunities in the US PPP marketplace. Texas Transportation Forum. Goldman
Sachs.Texas.
122 122
Cheah, C. and Garvin, M. J. (2004a). Gauging the Strategic Performance of Public and
Private Sector Enterprises with Financial Data. Construction Research Conference.
Cheah, C. and Garvin, M. J. (2004b). "An open framework for corporate strategy in
construction". Engineering, Construction and Architechtural Management. 11(3): 176-
188.
Cheah, C., Garvin, M.J., and Miller, J. (2002). "Empirical Study of Strategic Performance
of Global Construction Firms". Journal of Construction Engineering And Management
ASCE 130(6): 808 to 817.
Chicago Skyway Company. (2005). "Maps and Routes -Chicago Skyway." Retrieved
November, 2008, from http://www.chicagoskyway.org/routes/.
City Council of Chicago (2004a). Request for Skyway Concessionaire Qualification, The
Authority of the City Council of the City of Chicago.
City Council of Chicago (2004b). Authorization For Execution of Concession and Lease
Agreement for Operation of Chicago Skyway Toll Bridge System, City Council,
Chicago.
City of Chicago (2004c). Journal of Proceedings of the City Council of the City of
Chicago Chicago, Illinois, The City Clearks Office.
Cintra website (2008). Information retrieved from www.ferrovial.com/en/ in October
2008.
Cintra Annual Report (2007). Annual Report. retrieved from www.cintra.es in October,
2008.
Chicago Area Transportation Study. (2007). "Interactive Regional Highway Atlas."
Retrieved June 2007, from http://www.catsmpo.com/.

123 123
Cox, W. and J. Love (1996). "The Best Investment A Nation Ever Made." The American
Highway Users Alliance.
CTV (California Transportation Ventures). (2003). "State Route 125 Toll Road- San
Diego County, CA." Retrieved November, 2008, from
http://www.innovativefinance.org/projects/highways/125.asp
Clary, L. R. (2003). State infrastructure Bank Selection Process.
Carey, G. (2006). You Bet Your Assets : Leveraging Existing Infrastructure, Current
Opportunities in the US P3 marketplace. Texas Transortation Forum. Texas, Goldman
Sachs.
Dutton, A. (2009)."Is TIFIA Tapped Out?" The Bond Buyer, January 7, 2009.
ENR (Engineering News Record). (2002). "Pocahontas Parkway Evokes and Makes a Bit
of History." Engineering News Record 248(17).
Enright, D. J. (2006). The Chicago Skyway - An Analytical Review. Jersey City, New
Jersey, NW Financial Group.
Esty, B. C. (2004). Modern Project Finance- A Casebook. U.S.A, John Wiley & Sons,
Inc.
Euromoney. (2007). "Deep Impacts." Project Finance Magazine.
FAD (Fiscal Affairs Department) ( 2004). International Monetory Fund Public-Private
Partnerships.1-48.
FHWA (Federal Highway Authority).(2002). "Case Studies- Pocahontas Parkway."
Retrieved November, 2008, from
http://www.fhwa.dot.gov/ppp/case_studies_pocahontas.htm.

124 124
FHWA(Federal Highway Authority) (2005a). "Key elements of Public Private
Partnership agreements." Retrieved November, 2008, from
http://www.fhwa.dot.gov/ppp/agreements_sr125.htm.
FHWA ( Federal Highway Authority). (2005c). Key elements of the public private
partnership agreement- Chicago Skyway. Retrieved 17 June 2007 from
http://www.fhwa.dot.gov/PPP/agreements_chicago_skyway.htm
FHWA (Federal Highway Authority) . (2005b). P3-Case Study, Chicago Skyway.
Retrieved July 2007 from http://www.fhwa.dot.gov/PPP/chicago_skyway.htm
FHWA(Federal Highway Authority). (2006). Status of the Nation’s Highways, Bridges,
and Transit: Conditions and Performance. U.S. Department of Transportation.
FHWA (Federal Highway Authority) (2008a). Case Study TIFIA SR-125. Retrieved
October, 2008, from http://www.fhwa.dot.gov/innovativeFinance/ifp/cssr125.htm.
FHWA (Federal Highway Authority) (2008b). PPP Case Studies- South Bay Expressway
SR-125. Retrieved November, 2008, from
http://www.fhwa.dot.gov/ppp/case_studies_sr125.htm.
Finnerty, J. D. (1996). Project Financing. Asset- Based Financial Engineering. New
York, New York. John Wiley & Sons.
Florian, M. (2006). Public Private Partnerships : An Alternative Source of Capital,
Municipal and Infrastructure Finance Group Goldman, Sachs & Co.
Florian, M. ( 2006). Understanding Contemporary Public-Private Highway Transactions:
The Future Of Infrastructure Finance. Testimony before the Subcommittee on Highways,
Transit, and Pipelines of the U.S. House Transportation and Infrastructure. 1-7.
Washington .D.C.
Fluor website (2008). Information retrieved from www.fluor.com in October, 2008.

125 125
Fluor Annual Report (2007). Annual Repot. retrieved from www.fluor.com in October
2008.
Ferrovial website (2008). Information retrieved from www.ferrovial.com in October,
2008.
Foote, J.H. (2006). Statement of Mr John H Foote, Senior Fellow, Harvard University.
Testimony before the Subcommittee on Highways, Transit and Pipelines of the U.S.
House of Transportation and Infrastructure Committee Washingoton D.C.
Garvin, M. J. (2007a). America's Infrastructure Strategy: Drawing on History to Guide
the Future. KPMG LLP, written in collaboration with Stanford University's Collaboratory
for Research on Global Projects.
Garvin, M. J. (2007b). Are Public-Private Partnerships Effective Infrastructure
Development Strategies? 25th Aniversary of Construction Management and Economics
Conference U.K.
George, C., et al. (2006). U.S. Toll Road Privatizations : Seeking The Right Balance
Public Finance, Fitch Ratings.New York.
George, C. and W. Streeter (2001). Pocahontas Parkway Association, Virginia. Project
Finance North America Credit Update. Fitch Ratings. New York.
Giannone, J. A. (2007). Privatization drive slowed down by roadblocks. Reuters. New
York.
Gibbons, R. J. and M. P. McGuigan (2006). "Transport report: The trend continues "
Project Finance.
Giglio, J. (1998). "Private toll roads: Is the glass 1/4 full or 3/4 empty? ." Public Works
Management & Policy 2(4): 286-293.

126 126
Gramlich, E. M. (1994). "Infrastructure Investment a Review Essay." Journal of
Economic Literature 32: 1176-1196.
Gribbin, D. J. ( 2006). Understanding Contemporary Public-Private Highway
Transactions: The Future Of Infrastructure Finance . House Transportation and
Infrastructure Committee & Subcommittee on Highways, and Pipelines of the U.S.
House of Transportation and Infrastructure. 1-8. Washington D.C.
Heim, S. (2006). Counting the ways the Toll Road lease benifits Indiana. South Bend
Tribune. Michigan: B7.
Hinz, G. (2004a). Blown Windfall? The Skyway deal was smart.But the city's planning to
spend the jackpot-fast. Chicago Business,Chicago, Illinois.
Hinz, G. (2004b). City Council Giddy over Skyway Lease. Chicago Business News.
Chicago, Illinois.
Hoover's (2008). Information retrieved from www.hoovers.com in October 2008.
Indiana Finance Authority and Company. (2006). Indiana Toll Road Concession and
Lease Agreement. Indiana Finance Authority: 1-102.
Indiana Finance Authority and Company. (2006). The First Amendment to the Indiana
Toll Road Concession and Lease Agreement. Department of Transportation.
Indiana Road Company. (2006). Conditional Bid. Department of Transportation.
Indiana Finance Authority. (2005). Request for Toll Road Concessionaire Proposals,
Department of Transportation.
Indiana Finance Authority and Architects. (2005). Concession and Lease Agreement for
the Indiana Toll Road Maintenance Manual. 1 of 3.
Indiana Finance Authority and Architects. (2005). Concession and Lease Agreement for
Indiana Toll Road -Operations and Procedures Manual. 2 of 3.
127 127
ITR (Indiana Toll Road). (2007). "Indiana Toll Road Website." Retrieved November,
2008, from https://www.getizoom.com/index.jsp.
Johnson, C., Luby, M., Kurbanov, S., and Nelyubov, V. (2006). The Buck Starts Where?
Paying for Public Services. Privatizing Toll Roads in the United States. Lexington,
Kentucky.
Jones, S. (2004). CEOs offer advice on Skyway windfall. Chicago Business. Chicago,
Illinois.
Katsanis, C. J. (2007). Research Methods For Organizational Research In AEC
Proceedings of the 2007 Construction Research Congress, May 6-8, ASCE, Grand
Bahama Island, Bhamas, 200-207.
Kozel, S. M. (2006) "Route 895 - Pocahontas Parkway." Roads to the Future
Lerer, L. (2005). "Dealmakers of the Year." The American Lawyer.
Lessard, D. and R. Miller (2000). Mapping and Facing the Landscape of Risks.
Cambridge, MA, MIT Press.
Li, B., Akintoye, A., Edwards, P.J., and Hardcastle, C. (2005). "Critical success factors
for PPP/PFI projects in the UK construction industry." Construction Management and
Economics 23(June ): 459-471.
Li, B., Akintoye, A., and Hardcastle, C. (2004). "VFM and Risk Allocation Models in
Construction PPP Projects." School of Built and Natural Environment, Glasgow
Caledonian University, Glasgo G4 0BA.
Lowy, J. (2009)."Government Panel Wants Fuel Taxes Hiked to Fund Highways." The
Huffington Post, January 1, 2009.
Mansour, A. and H. Nadji (2007). "Performance Characteristics of Infrastructure
Investments " RREEF Research

128 128
MIG (Macquarie Infrastructure Group).(2003). "SR 125 South Financial Close."
Retrieved November, 2008, from
http://www.macquarie.com.au/au/mig/news/20030523.htm.
MIG (Macquarie Infrastructure Group).(2005). Presentation on Indiana Toll Road.
Macquarie Securities (2006). Presentation on Transportation Partnership Agreements - A
Private Sector Perspective, Macquarie Securities U.S.A. Retrieved June 2007
www.utrc2.org/events/assets/partnerships/Leslie.pdf
MIG (Macquarie Infrastructure Group)(2004). Presentation on the Skyway Financial
Close. Retrieved in June 2007
www.macquarie.com.au/au/mig/acrobat/mig_chicago_close.pdf
MIG (Macquarie Infrastructure Group) website (2008). Information retrieved from
www.macquarie.com.au/au/mig/ in October 2008.
MIG (Macquarie Infrastructure Group)(2008). Annual Report 2008. retrieved from
www.macquarie.com.au/au/mig/ in October 2008.
Macquarie Bank. (2004). "Chicago Skyway Concession and Lease Agreement Signed."
Retrieved June 2007, from http://www.macquarie.com.au/au/mig/news/20041028.htm.
Miller, J. B., Garvin, M.J., Ibbs, C.W., Mahoney, S.E., (2000). "Toward a New Paradigm
: Simultaneous Use of Multiple Project Delivery Methods " Journal of Management in
Engineering
Miller, J.B. (2000). Case Studies in Infrastructure Delivery, Kluwer Academic
Publishers, Boston.
Myer, R. (2005). MIG trumps Chicago underbidder by $ 1.27bn. The Age, Australia.
retrieved in April 2008 from http://www.theage.com.au/news/Business/MIG-trumps-
Chicago-underbidder-by-127bn/2005/03/01/1109546866928.html

129 129
Northeast Midwest Institute. (2004). "What is Highway Trust Fund ?". Retrieved May 20
2007, from http://www.nemw.org/HWtrustfund.htm.
NCPPP ( National Council for Public-Private Partnerships).(2003). "The National
Council for Public-Private Partnerships : Pocahontas Parkway." from
http://www.ncppp.org/cases/pocahontas.shtml.
Nickerson, S. R. (2006). State of Indiana Indiana East-West Toll Road Financial
Analysis, Crowe Chizek and Company LLC: 1-17.
Nissar, T. M. (2007). Risk management in public-private partnership contracts." Public
Organiz. Review, 7(1), 1-19.
Orr, R. (2005). The Privatisation Paradigm Jumping onto the infrastructure bandwagon
www.infrastructurejournal.com. 2007.
Oberstar, J.L. and.DeFazio, P.A. (2007). Letter from the U.S House of Representatives
Committee on Transportation and Infrastructure. Washington DC.
Porter , M. (1985). Competitive Advantage : Creating and Sustaining Superior
Performance. New York , Macmillan.
Porter, M. (1980). Competitive Strategy: Techniques for analyzing industries and
competitors. New York, The Free Press.
Porter, M. (1996). What is Strategy?. Harvard Business Review. Boston. Harvard
Business School. Product no 4134.
Poole, R. (1998). "Private Toll Roads: Chinging the highway paradigm. ." Public Works
Management & Policy 3: 3-9.
Poole, R. and P. Samuel (2006). "The Return of Private Toll Roads." Public Roads 69(5).
Price, W. T. (2001). "An Odyssey of Privatizing Highways- The Evolving Case of SR -
91." Public Works Management and Policy 5(4).

130 130
Project Finance (2006). "Deal Analysis, Indiana Toll Road : Giant Step." Project Finance.
Quiggin, J. (2005). "Pbulic-Private Partnerships: Options for Improved Risk." The
Australian Economic Review 38(4): 445-50.
Richmond Regional Organization. (2008). The Intermodal System
Russell, A. D. and C. Nelms (2006). The public sector comparator:uses and abuses.
Proceedings of CIB Joint International Symposium on Construction in the 21st Century:
Local & Global Challenges Oct. 18-20, Rome, Napoli:Edizioni Scientifiche Italiane.
Reuters Finance (2008). Information retrieved from www.reuters.com/finance in
November 2008.
Samuel, P. (2005). "125 South going for ten more years - for 45 year franchise." Toll
Road News (online).
Samuel, P. (2006). "Cintra-Macquarie bid of $3.85b for Indiana TR accepted."
Tollroadsnews.
Samuel, P. (2007). "San Diego's South Bay Expressway could open end-sept 2007." Toll
Road News (online).
Samuel, P. (2008). "Macquarie says traffic "subdued" in Sept quarter but toll revenues up
modestly on 2007." Toll Road News (online).
Samuels, P. (2005) "Transurban moves to buy troubled Pocahontas Parkway VA." Toll
Road News.
SBX.(Southbay Expressway). (2008). "South Bay Expressway." Retrieved October,
2008, from http://www.southbayexpressway.com/newsroom/.
Segal, G. (2006). Bottom-line on Indiana Toll Road Deal. Indiana Policy Review, Reason
Foundation.

131 131
Songer, A. D., J. Diekmann, et al. (1997). "Risk analysis for revenue dependent
infrastructure projects." Construction Management and Economics.
Standard and Poor's. (2006).Infrastructure Finance Ratings, Public-Private Partnerships,
Global Credit Survey, 2006.
Statewide Mobility Partners. (2005). "Financial Analysis by Statewide Mobility
Partners."
Spielman, F. (2004). Probably the very best deal ever in Chicago's history';Council OKs
sale of Skyway for $ 1.82 billion. Chicago Sun-Times. Chicago, Illinois.
Samuel, P. (2004b). "Five Bids Wanted for Chicago Skyway." Toll Roads News.
Samuel, P. (2005a). "Cintra- Macquarie paid too much for the Chicago Skyway - an
opinion." Toll Roads News.
Samuel, P. (2005b). "Cintra-Macquarie made only viable bid for Chicago-Skyway- City."
Toll Roads News.
Samuel, P. (2004a). "Cintra-Macquarie to take over Chicago Skyway for $1.8b."
TollRoadsNews.
The News-Sentinel. (2006). Major Moves ahead : In many ways, the great lease debate is
just starting here and in the rest of the nation. Knight/ Ridder Tribune News Service. Fort
Wayne.
Tribune Staff. (2006). Interest hits $50 million from Toll Road Lease. South Bend
Tribune Corporation. Marshall.
Thornton, E. (2007). Roads to Riches - Why investors are clamoring to take over
America's highways, bridges, and airports and why the public should be nervous.
BusinessWeek

132 132
TIFIA (Transportation Infrastructure Finance and Innovation Act). (2008). "Fact Sheet:
South Bay Expressway (Formerly State Route 125 South)." Retrieved November, 2008,
from http://tifia.fhwa.dot.gov/projects/fs3.cfm.
Transurban. (2007). "Pocahontas 895." Retrieved July, 2008, from
https://www.pocahontas895.com/using_pocahontas_895.html.
USDOT ( United States Department of Transportation). (2003). "U.S. transportation
secretary Mineta announces $140 million loan for SR 125 south toll road, salutes
California Public-Private Partnership." Retrieved November, 2008, from
http://www.fhwa.dot.gov/pressroom/fhwa0318.htm.
U.S. House of Representatives Committee on Transportation and Infrastructure (2007).
Public Interest Concerns of Public-Private-Partnerships. Washington, DC.
VDOT ( Virginia Department of Transportation). (2008). "Public Private Transportation
Act " Retrieved July 2008, 2008, from http://www.virginiadot.org/business/ppta-
default.asp.
VDOT and FD/MK (Virginia Department of Transportation and Fluor Daniel/ Morrison
Knudsen). (1998). Comprehensive Agreement to Develop and Operate Route 895
Connector between VDOT anf Fluor Daniel and Morrison Knudsen
Waltz, L. (2004) "Building Virginia's Roads." Virginia Business Online.
Wensits, J. (2006). Toll hearings draw angry comments; Lease agreement still a touchy
issue. South Bend Tribune Marshall.
Yescombe, E. R. (2002). Principles of Project Finance. London, Academic Press.
Yin, R. K. (1994). Case Study Research Design and Methods, Sage Publicatiions Inc.
Zhang, X. (2005). "Paving the Way for Public-Private Partnerships in infrastructure
Development." Journal of Construction Engineering and Management 131(1): 71-80.