Order and segmental mobility during polymer crystallization: Poly(butylene isophthalate)
10
Order and segmental mobility during polymer crystallization: Poly (butylene isophthalate) Alejandro Sanz a , Aurora Nogales a, * , Tiberio A. Ezquerra a , Nadia Lotti b , Andrea Munari b , Sergio S. Funari c a Instituto de Estructura de la Materia, CSIC, C/Serrano 121, Madrid 28006, Spain b Dipartamento di Chimica Applicata e Scienze dei Materiali, Universita ´ di Bologna, Via Risorgimento 2, 40136 Bologna, Italy c Max-Planck Intitute for Colloids and Surfaces, c/o HASYLAB, DESY, Notkestraße 85, 22603 Hamburg, Germany Received 19 October 2005; received in revised form 3 December 2005; accepted 10 December 2005 Available online 18 January 2006 Abstract The influence of the development of crystalline structure on the segmental dynamics of the amorphous phase in poly(butylene isophthalate) (PBI) has been studied by a combination of relaxation and scattering techniques. By means of dielectric spectroscopy (DS) the dynamics of both amorphous and semicrystalline PBI samples has been observed in a wide frequency and temperature range. The evolution of the crystalline phase with time has been studied in a range of temperatures, starting from initially glassy PBI by simultaneous small and wide angle X-ray scattering (SWAXS). By using a state-of-the-art setup designed specifically for the in situ study of both DS and SWAXS simultaneously (SWD), the crystallization of initially amorphous PBI has been followed in real time from both the structural and dynamics points of view. The obtained results support a model based on two different regimes on crystallization and a heterogeneous distribution of lamellar stacks. During the first regime the primary stacks cause the apparition of a rigid amorphous phase (RAP), i.e. a phase of amorphous chains lacking segmental motion. During the second regime, however, no more RAP is observed, indicating that the new lamellae that appear during this stage are nearly individual and not forming lamella stacks. q 2005 Elsevier Ltd. All rights reserved. Keywords: Poly(butylene isopththalate); Synchrotron radiation; Dielectric spectroscopy 1. Introduction Polymer systems may exhibit a rich hierarchical structure when crystallize at temperatures above the glass transition temperature (T g ). Although polymer crystallization has been investigated for many years there are several aspects that still remain controversial [1]. The process of crystallization has been historically studied from the viewpoint of the crystalline structure development [2]. However, polymers never crystal- lize completely and they always present a complex structure, consisting, at least, of two phases: crystalline and amorphous. Polymer crystals arrange themselves into characteristic units consisting of stacks of laminar crystals intercalated by amorphous less ordered regions. The average distance between the centres of two consecutive crystalline lamella is called long spacing (L b ), and is often used to characterize the lamellar structure. L b is of the order of various tens of nanometers. In general, small angle X-ray scattering (SAXS) is a very suitable tool to study the development of these arrays of lamella [3]. The, either homogeneous or heterogeneous, nature of the distribution of lamellar stacks in the system has been a subject of extended debate in the last years [1,4–9]. Traditionally, the observation of the crystalline phase evolution has been performed by diffraction techniques [10] and by microscopy techniques [11]. Both methods pay special attention to the crystalline phase, and very little, or non-at all, to the amorphous one. X-ray scattering and transmission electronic microscopy (TEM) experiments in different polymers some- times have been interpreted invoking the formation of a heterogeneous multiple lamellar population arrangement [4–6]. However, similar studies and recent atomic force microscopy (AFM) and TEM studies seem to favour a view in terms of the formation of a homogeneous lamellar space- filling structure [7–9]. From the point of view of the dynamics of the chains participating in the crystallization process, also controversial Polymer 47 (2006) 1281–1290 www.elsevier.com/locate/polymer 0032-3861/$ - see front matter q 2005 Elsevier Ltd. All rights reserved. doi:10.1016/j.polymer.2005.12.047 * Corresponding author. Tel.: C34 915616800; fax: C34 915645557. E-mail address: [email protected] (A. Nogales).
Transcript of Order and segmental mobility during polymer crystallization: Poly(butylene isophthalate)

Order and segmental mobility during polymer crystallization: Poly
(butylene isophthalate)
Alejandro Sanz a, Aurora Nogales a,*, Tiberio A. Ezquerra a, Nadia Lotti b, Andrea Munari b,
Sergio S. Funari c
a Instituto de Estructura de la Materia, CSIC, C/Serrano 121, Madrid 28006, Spainb Dipartamento di Chimica Applicata e Scienze dei Materiali, Universita di Bologna, Via Risorgimento 2, 40136 Bologna, Italy
c Max-Planck Intitute for Colloids and Surfaces, c/o HASYLAB, DESY, Notkestraße 85, 22603 Hamburg, Germany
Received 19 October 2005; received in revised form 3 December 2005; accepted 10 December 2005
Available online 18 January 2006
Abstract
The influence of the development of crystalline structure on the segmental dynamics of the amorphous phase in poly(butylene isophthalate)
(PBI) has been studied by a combination of relaxation and scattering techniques. By means of dielectric spectroscopy (DS) the dynamics of both
amorphous and semicrystalline PBI samples has been observed in a wide frequency and temperature range. The evolution of the crystalline phase
with time has been studied in a range of temperatures, starting from initially glassy PBI by simultaneous small and wide angle X-ray scattering
(SWAXS). By using a state-of-the-art setup designed specifically for the in situ study of both DS and SWAXS simultaneously (SWD), the
crystallization of initially amorphous PBI has been followed in real time from both the structural and dynamics points of view. The obtained
results support a model based on two different regimes on crystallization and a heterogeneous distribution of lamellar stacks. During the first
regime the primary stacks cause the apparition of a rigid amorphous phase (RAP), i.e. a phase of amorphous chains lacking segmental motion.
During the second regime, however, no more RAP is observed, indicating that the new lamellae that appear during this stage are nearly individual
and not forming lamella stacks.
q 2005 Elsevier Ltd. All rights reserved.
Keywords: Poly(butylene isopththalate); Synchrotron radiation; Dielectric spectroscopy
1. Introduction
Polymer systems may exhibit a rich hierarchical structure
when crystallize at temperatures above the glass transition
temperature (Tg). Although polymer crystallization has been
investigated for many years there are several aspects that still
remain controversial [1]. The process of crystallization has
been historically studied from the viewpoint of the crystalline
structure development [2]. However, polymers never crystal-
lize completely and they always present a complex structure,
consisting, at least, of two phases: crystalline and amorphous.
Polymer crystals arrange themselves into characteristic units
consisting of stacks of laminar crystals intercalated by
amorphous less ordered regions. The average distance between
the centres of two consecutive crystalline lamella is called long
0032-3861/$ - see front matter q 2005 Elsevier Ltd. All rights reserved.
doi:10.1016/j.polymer.2005.12.047
* Corresponding author. Tel.: C34 915616800; fax: C34 915645557.
E-mail address: [email protected] (A. Nogales).
spacing (Lb), and is often used to characterize the lamellar
structure. Lb is of the order of various tens of nanometers. In
general, small angle X-ray scattering (SAXS) is a very suitable
tool to study the development of these arrays of lamella [3].
The, either homogeneous or heterogeneous, nature of the
distribution of lamellar stacks in the system has been a subject
of extended debate in the last years [1,4–9]. Traditionally, the
observation of the crystalline phase evolution has been
performed by diffraction techniques [10] and by microscopy
techniques [11]. Both methods pay special attention to the
crystalline phase, and very little, or non-at all, to the
amorphous one. X-ray scattering and transmission electronic
microscopy (TEM) experiments in different polymers some-
times have been interpreted invoking the formation of
a heterogeneous multiple lamellar population arrangement
[4–6]. However, similar studies and recent atomic force
microscopy (AFM) and TEM studies seem to favour a view
in terms of the formation of a homogeneous lamellar space-
filling structure [7–9].
From the point of view of the dynamics of the chains
participating in the crystallization process, also controversial
Polymer 47 (2006) 1281–1290
www.elsevier.com/locate/polymer

A. Sanz et al. / Polymer 47 (2006) 1281–12901282
effects have been observed during polymer crystallization. The
a-relaxation, that appears at TOTg, is associated to the
segmental motions of the chains in the amorphous state. This
a-process is highly affected by the presence of lamellar
crystals. In this respect, it has been proposed, on the basis of
thermal and dielectric analysis, that the formation of a rigid
amorphous phase (RAP), i.e. a phase of amorphous chains
lacking segmental motion, proposed long time ago [12,13], can
be located in the interfacial region between the crystalline
lamellae and the inter-lamellar amorphous phase [14,15].
However, dielectric experiments in several polymers [16,17]
and direct observation of the crystal–amorphous interface in
poly(ethylene terephthalate) by means of AFM seems to
indicate that the entire inter-lamellar amorphous phase could
be considered as rigid [8].
Dielectric spectroscopy (DS) techniques are widely used to
study the dynamics of the amorphous chains in polymeric
systems [18]. DS has been used to study, in real time, the
modification of the dynamics of the segments in the amorphous
phase during crystallization processes [16,19–25].
Recently, a combination of wide and small angle X-ray
scattering experiments, performed simultaneously with dielec-
tric measurements has been developed in order to monitor in
real time the evolution of both, structure in the crystalline
phase and dynamics in the amorphous phase during crystal-
lization processes. Results obtained by this technique, labelled
as SWD, show the existence of a rigid amorphous phase (RAP)
in PET [17] and in PEN that is located mainly between lamella
inside the lamellar stacks [26]. However both, PET and PEN
are aromatic polyesters with such a regular molecular structure
that crystallization easily takes place above Tg. For this reason,
it is generally difficult to distinguish between primary and
secondary crystallization events.
In this paper, we have selected poly(butylene isophthalate)
(PBI) which is a polyester belonging to the class of the
poly(alkylene phthalate)s. The chemical structure of PBI is
similar to that of the well-known poly(butylene terephthalate)
(PBT), but with the two ester groups located in the ‘meta’
position of the phenyl group (Fig. 1). As opposed to PBT, PET
Fig. 1. DSC traces of initially amorphous (bottom) and semicrystalline XcZ24% (top) PBI. Arrows indicate Tg.
and PEN, the crystallization of PBI is much slower, allowing to
obtain a better control over the crystallization kinetics. Here,
we present real time isothermal crystallization experiments
during cold crystallization of PBI as revealed by means of
simultaneous small-wide angle X-ray scattering and dielectric
spectroscopy (SWD) measurements in real time. Provided that
this procedure aims to obtain information from both the
crystalline and the amorphous phase we attempt to shed
additional light about the above unresolved topics.
2. Experimental part
2.1. Samples
Poly(butylene isophthalate) (PBI) was synthesized accord-
ing to the well-known two-stage polycondensation procedure,
as previously reported [27], starting from dimethyl isophthalate
and 1,4-butanediol glycol, with titanium tetrabutoxide
(Ti(OBu)4) as catalyst. The monomeric unit is presented in
Fig. 1. The polymer was previously characterized by some of
us from the molecular and thermal point of view [27]. The
chemical structure was confirmed by means of 1H NMR, and
the number molecular weight, determined by GPC, turned out
to be about 20,000. At room temperature the polymer appeared
as a semicrystalline solid. To prepare amorphous films, first the
powder obtained from the synthesis was dried under vacuum in
order to eliminate existing traces of humidity. Amorphous
films of 0.2 mm thickness were obtained by melt pressing the
dried powder at TZ190 8C for 2 min and subsequently
quenched into iced water. By this procedure fully amorphous
PBI samples are obtained. The specimens were stored at 5 8C
before any characterization. The glass transition of this
polymer, in the amorphous state is 19 8C, as measured by
differential scanning calorimetry (DSC) (Fig. 1). The small
tendency to crystallize of PBI is visualize by the absence of
exothermal crystallization peak at the current heating rate
(10 8C/min). DSC traces obtained in both, the initially
amorphous and the semicrystalline sample crystallized at TZ60 8C for 12 h allows one to determine the Tg for each system.
Both temperatures are presented in Table 1. The amorphous
and semicrystalline samples exhibit a difference in the Tg of
approx. 10 8C, being higher in the semicrystalline system.
2.2. Techniques
2.2.1. Differential scanning calorimetry
DSC experiments were carried out with a Perkin–Elmer
DSC7 instrument at a heating rate of 10 8C/min. Sub-ambient
operation was carried out by using a controlled flow of cooled
nitrogen gas by using a Perkin–Elmer TA7. The temperature
was calibrated by using indium standard. The samples were
encapsulated in aluminium pans and the typical sample weights
used in these experiments were about 5 mg.
2.2.2. Dielectric spectroscopy measurements
Dielectric loss measurements (3 00 where 3 00ZIm(3*)) were
performed over a broad frequency range (10K1–107 Hz) in a

Table 1
Characteristic values for the two studied samples
Sample TDSCg (8C) DCp (J KK1 gK1) D Log(F0/Hz) T0 (K) TtZ100 s (8C)
Amorphous 19.5 0.335 8.3 13.2 236 18
Semicrystalline 29 0.144 7.6 13.2 247 26
Tg and DCp obtained by DSC, and fittings parameters from the VFT equation.
A. Sanz et al. / Polymer 47 (2006) 1281–1290 1283
temperature range of K150 8C!T!110 8C using a BDS-40
Novocontrol system with an integrated dielectric interface
alpha. The temperature in these experiments was controlled by
a nitrogen jet with a temperature error, during every single
sweep in frequency, of G0.2 8C.
2.2.3. Simultaneous structural and dynamic measurements
Changes in the amorphous and crystalline phases of the
system were studied by simultaneous SAXS, WAXS and
dielectric spectroscopy experiments. They were performed in
the soft condensed matter research beamline A2 at HASYLAB
(DESY, Hamburg), using an experimental setup (SWD setup)
developed specifically for this purpose [28]. The wavelength
used in the X-ray scattering study was lZ1.5 A. The collected
data were corrected for background and primary beam intensity
fluctuations during the experiment. The dielectric study in the
case of the SWD setup was performed using a Novocontrol
system integrating a SR830 lock in amplifier with a dielectric
interface. A circular film of PBI (3 cm diameter) was
sandwiched between two electrodes and introduced in an on-
purpose designed cell described elsewhere [28]. Simultaneous
wide and small angle X-ray scattering was recorded for 90 s
with 90 s wait time between frames. Each dielectric spectrum,
obtained simultaneously with the X-ray experiments, took
180 s to collect.
3. Data analysis
3.1. Wide angle X-ray scattering patterns
The crystallinity of the final pattern was obtained as the ratio
of the deconvoluted crystalline peaks over the total diffracted
area. By this method, the diffraction pattern of the crystalline
phase at any moment of the crystallization process was
considered fixed in shape, and only its intensity was varied.
The contribution of the amorphous halo was taken from the
initial pattern (crystallization time tcZ0). Therefore, at any
time, the diffraction pattern was considered to be a linear
combination of the crystalline contribution (Ac) and the
amorphous one (Aa). The crystallinity was obtained by:
Xc ZAc
Ac CAa
(1)
3.2. Small angle X-ray scattering patterns
The position of the scattering maximum, qmax, from the
Lorentz-corrected SAXS profile, was used for the calculation
of the Bragg’s long period, LB:
LB Z2p
qmax
(2)
where qZ(4p/l)sin q is the scattering vector, and 2q is the
scattering angle. LB corresponds to the average periodicity of
the lamellar stack, which corresponds, in first approximation,
to the sum of the average thickness of the crystal lamellae, lc,
and of the interlamellar amorphous regions, la. However, this
method does not readily provide any information about la or
lc.The SAXS data have been analyzed using the correlation
function approach by Vonk [29] using the methods described
by Strobl and Schneider [30]. The electronic density
correlation function was calculated from the Fourier transform
of the Lorentz-corrected profile using the approximations
previously described [16]. The lamellar variables obtained
from this analysis of the scattering data are long period (L),
linear degree of crystallinity (XcL), crystalline lamellar
thickness (lc) and amorphous layer thickness (la). The average
linear degree of crystallinity in the lamellar stacks can be
determined from the following equation [31]:
x1x2 ZB
LMc
(3)
where B is the first intercept of the correlation function with the
abscissa, LMc is the long spacing calculated from the first
maximum in the correlation function, and x1 and x2 are the
volume fractions of the two phases, within the lamellar stacks,
respectively (x1Cx2Z1). The thickness of the two phases can
be calculated as L1Zx1LMc and L2Zx2LM
c . From the
correlation function itself it is not possible to associate L1 or
L2 to the thickness of the crystalline lamellae unless a given
model is invoked. The principles of the subsequent analysis
and the evaluation of the correlation function are discussed in
detail elsewhere [31]. Another magnitude that can be derived
from the SAXS experiments is the invariant, Q, defined as the
area under the SAXS curves.
3.3. Dielectric loss curves
The description of the dielectric relaxation in terms of the
Havriliak–Negami empirical equation [32] for the dielectric
permittivity has been shown to be of great use when dealing
with polymeric materials [18]. This formalism gives the
following expression for the complex dielectric permittivity:
3� Z 3N C30 K3N
½1 C ðiutHNÞb�c
(4)
where 30 and 3N are the relaxed and unrelaxed dielectric
constant value, respectively, tHN is the central relaxation time,

Fig. 3. Relaxation map of PBI: Fmax as a function of the reciprocal temperature
for the two observed relaxations: a (B) and b (,). (C) Correspond to the a-
relaxation of the semicrystalline PBI sample. Continuous lines correspond to
best fittings according to VFT equation (a-relaxation) and Arrhenius equation
(b-relaxation). The dotted line indicates the temperature at which the SWD
crystallization experiments were performed.
A. Sanz et al. / Polymer 47 (2006) 1281–12901284
and b and c are parameters which describe the symmetrical and
asymmetrical broadening of the relaxation time distribution
function, respectively. The fact that the a-relaxation is
described by an HN equation (Eq. (4)) implies that there is a
distribution of relaxation times with most probable value tHN.
The average relaxation time of the relaxation time distribution
function is calculated through:
t Z tHN sinbp
2 C2c
� �� �K1=b
sinbcp
2 C2c
� �� �1=b
(5)
The difference D3Z30K3N is called dielectric strength and
it is related to the amount of dipoles involved in the relaxation
process.
4. Results
4.1. Dielectric loss spectroscopy of PBI
Fig. 2 shows the dependence of the dielectric loss (3 00) with
frequency and temperature. The dielectric spectrum reveals the
existence of two main relaxations, as evidenced by the
presence of two main maxima that shift towards higher
temperatures when the frequency is increased. At low
temperatures, a broad maxima located around FZ102 Hz for
TZK80 8C indicates the presence of some dynamics with a
local character at low temperatures. This maximum is labelled
as b-relaxation. At higher temperatures (i.e. at temperatures
above the glass transition temperature TgZ19 8C as measured
by calorimetric methods) a more intense and narrower
maximum is observed, positioned at FZ102 Hz for TZ45 8C. The existence of this maximum is associated to the
presence of segmental motions above the Tg. The frequency of
maximum loss (Fmax) has been represented in Fig. 3 as a
function of the reciprocal temperature (Arrhenius represen-
tation). In this plot, the b-relaxation follows a linear behaviour
as corresponds to a local non-cooperative thermally activated
Fig. 2. Dielectric loss (3 00) as a function of frequency and temperature for
amorphous PBI.
process with and activation energy of 44 kJ/mol. The
a-relaxation, however, exhibits some curvature, and the
dependence of Fmax with temperature, for this relaxation, can
be described by means of the Vogel Fulcher Tamann equation
(VFT):
Fmax Z F0expKDT0
ðT KT0Þ
� �(6)
The a-relaxation of the semicrystalline sample has been also
studied by dielectric spectroscopy as a function of temperature
and frequency. Fig. 3 shows the variation of the frequency of
maximum loss with the reciprocal temperature in an Arrhenius
plot, for the amorphous and the semicrystalline sample. As can
be observed in that figure, the a-relaxation of both samples
exhibit a VFT behaviour. The fit of the experimental points to
the VFT equation is also indicated in Fig. 3 with continuous
lines, and the obtained parameters are presented in Table 1.
4.2. Isothermal crystallization of PBI as followed by WAXS and
SAXS
In order to analyze the influence of crystallization
conditions on the structure developed by PBI, simultaneous
wide and small scattering experiments were performed
isothermally at different temperatures. Fig. 4 shows the
evolution of the scattered intensity at wide angle (top) and
small angle (bottom) during an isothermal crystallization of
PBI at TZ80 8C. As a function of time, crystallization is
revealed in the WAXS patterns by the onset of several Bragg
reflections superimposed to the amorphous halo. In the
scattered intensity at small angle (SAXS) the presence of
crystals arranged in a periodic fashion is manifested with the
development of a maxima located around qZ0.036 AK1 for
tcO2000 s. From the WAXS pattern an estimation of the
fraction of crystalline phase (Xc) in the sample can be obtained

Fig. 4. Isothermal crystallization process at TZ80 8C as followed by real time
simultaneous WAXS (top) and SAXS (bottom).
A. Sanz et al. / Polymer 47 (2006) 1281–1290 1285
by deconvoluting the Bragg reflections and the amorphous halo
from the total reflections. The evolution with time of Xc, for
different temperatures is presented in Fig. 5. There is a strong
dependence of the rate of crystallization with temperature. To
emphasize this, in the inset of Fig. 5 the half time of
crystallization (t1/2), defined as the time when the 50% of the
maximum crystallinity is reached, is reported as a function of
temperature. As it can be seen, the maximum rate of
crystallization is observed approx at 90 8C, as previously
found by some of us [33].
Fig. 5. Evolution of the fraction of crystalline phase (Xc) with time, obtained
from the WAXS patterns at different temperatures (B TcZ60 8C, C TcZ80 8C, , TcZ90 8C, & TcZ100 8C, 6 TcZ110 8C and : TcZ120 8C). The
inset represents t1/2 as a function of the crystallization temperature Tc.
To characterize any obtained differences in the crystalline
nanostructure developed when crystallizing under different
temperature conditions, a profound study of the evolution of
the SAXS curves has been made by using the formalism of the
correlation function, as described previously [16]. The values
of the long spacings obtained by direct application of the Bragg
law (Eq. (2)) are presented in Fig. 6(a). For a given
crystallization temperature, Lb initially decreases with the
crystallization time (tc) up to times tc/t1/2z1 and subsequently
it levels off. This behaviour is found for all the studied
temperatures, except for the crystallization studied at the
highest temperature TcZ120 8C. For this temperature Lb
remains nearly constant for the whole crystallization process.
The obtained final Lb values (for long crystallization times) are
higher when the crystallization temperature increases. More-
over, from the analysis of the SAXS curves within the
formalism of the correlation function [29,30,34], and assuming
that the nanostructural morphology of the system consists of a
periodic arrangement of crystalline lamella and amorphous
Fig. 6. Evolution of (a) the Bragg long spacing (Lb), (b) and (c) thicknesses of
the two constituent phases L1 and L2,and (d) invariant Q with time normalized
to the half time of crystallization at each temperature (Fig. 5), (B TcZ60 8C,
C TcZ80 8C, , TcZ90 8C, & TcZ100 8C, 6 TcZ110 8C and : TcZ120 8C).

A. Sanz et al. / Polymer 47 (2006) 1281–12901286
regions, the thicknesses of the two constituent phases (L1 and
L2) have been obtained. The resulting values are presented in
Fig. 6(b) and (c) as a function of the normalized crystallization
time (tc/t1/2) for the different studied crystallization tempera-
tures. First of all, it has to be emphasized, that representative
values of L1 and L2 are obtained only for tc/t1/2O1/2, where the
SAXS curves exhibit a clear maximum and the calculations to
obtain the correlation function can be performed with a high
degree of confidence. The obtained values for the thickness of
one of the phases, L1, are between 80 and 120 A in the whole
range of crystallization times and temperatures. During every
isothermal experiment, L1 values slightly decrease with tc.
With increasing crystallization temperature, higher L1 values
are obtained. Fig. 6(c) presents the calculated values of L2,
which corresponds to the thickness of the second constituent
phase of the lamellar morphology, as function of time and
crystallization temperature. The behaviour of L2 as a function
of temperature is similar to that observed for L1. The higher the
temperature at which the isothermal crystallization experiment
has been performed, the higher the L2 obtained values. For L2 it
is worth mentioning that the obtained values in the crystal-
lization at TcZ120 8C are considerably higher than those
obtained at the lower crystallization temperatures. With the
Fig. 7. Evolution of the a-relaxation as measured by DS (left), WAXS (centre) and
selected crystallization times, labelled within the figures in hours.
crystallization time, L2 tends to be constant, or in some cases, it
exhibits a slight increase as crystallization develops.
The calculated invariant is shown in Fig. 6(d). The evolution
with time is qualitatively similar to that observed in previous
studies for other polymers [16,35].
4.3. Simultaneous WAXS, SAXS and DS experiments
In order to gain information about the changes in the
amorphous phase produced by the crystallization process,
measurements of the a-relaxation as a function of the
crystallization time were performed at a selected crystallization
temperature, in this case TcZ60 8C. This temperature was
chosen to be located in the left branch side of the t1/2 parabolic
curve (inset in Fig. 5). Thus, undesirable crystallization
previous to the isothermal experiment was prevented. At this
temperature the a-relaxation fell within the experimental
frequency window (10K1!F (Hz)!105) as marked in Fig. 3
by the vertical dotted line, and the characteristic crystallization
times allow the study of the structure by means of real time
wide and small angle X-ray scattering. Fig. 7 presents the
results obtained by using simultaneously the three techniques
during the crystallization process. In the left panels of Fig. 7
SAXS (right) during the real time of the crystallization process (TcZ60 8C), at

Fig. 8. (a) Variation of the Bragg long spacing (C) and the invariant (B) with
the crystallization time. (b) Variation of the shape parameters of the relaxation
with crystallization time (B, b) and (C, c). (c) Variation of the dielectric
strength (B) and average relaxation time (C) with time during the
crystallization experiment, obtained simultaneously with the SWD technique
for PBI crystallizing at TcZ60 8C. (d) Variation of the crystallinity with time
during the SWD experiment.
A. Sanz et al. / Polymer 47 (2006) 1281–1290 1287
values of the dielectric loss (3 00) as a function of frequency for
different crystallization times have been represented. SAXS
(right panel) and WAXS (centre panel) intensities are
presented for the same selected tc as a function of the scattering
vector q. The initial amorphous state is characterized by the
presence of a broad halo in the WAXS intensity, the absence of
scattering in the SAXS pattern, and by a maximum in 3 00 values
located at FmaxZ2!104 Hz. As time proceeds, the crystal-
lization of PBI starts, as revealed by the incipient growth of
Bragg maxima in the WAXS patterns. Especially visible are
the ones located at qZ1.20 and 1.75 AK1. The crystallization
gives rise to the formation of an heterogeneous nanostructure,
characterized by the presence of periodicity revealed by the
maximum appearing in the SAXS patterns, that in the initial
stages is located around qZ0.36 AK1. In the DS experiment,
the onset of crystallization is revealed by a decrease in the
intensity of the relaxation. For longer crystallization times, the
features in the WAXS and SAXS patterns that evidenced the
presence of crystals arranged in a periodic structure become
more pronounced, with more intense Bragg peaks and a more
defined SAXS maximum. In this stage of the crystallization
process, the a-relaxation process is affected not only in
intensity but also in shape and position. The relaxation
becomes broader and slightly shifts towards lower frequencies.
The dielectric loss curves were analyzed within the Havriliak–
Negami phenomenological framework. From this analysis,
values of the dielectric strength (D3), average relaxation time
(t), and shape parameters b and c are obtained. Fig. 8 shows
jointly the variation of Xc, Lb and the invariant Q, and the
dynamic parameters, D3, t and b and c with tc. D3 exhibits a
nearly sigmoidal decrease with tc. During the initial stages of
the crystallization process D3 does not vary. Suddenly, it
exhibits a dramatic decrease, and for tcOt1/2 it exhibits a
change of tendency, with a small slope linear behaviour. The
average relaxation time t presents a different trend with tc. For
tc!t1/2 it remains constant, and for tcOt1/2 increases indicating
a slowing down of the relaxation process as crystallization
proceeds in its latter stages. Regarding the shape parameters,
Fig. 8 shows the variation of the HN parameters defining the
shape of the relaxation, with crystallization time. The b
parameter, related to the symmetrical broadening of the curve,
decreases with crystallization time, indicating that the
relaxation time distribution becomes broader. The c parameter
increases and it becomes nearly 1 for tczt1/2.
Before discussing the observed results, we present a
summary of the observed results.
The study of the isothermal cold crystallization process in
PBI at different temperatures reveals that, in all cases, there is a
transformation from the totally amorphous state towards a
semicrystalline one. A sigmoidal like shape is observed in the
evolution of the crystallinity with time at all the studied
temperatures. The inset in Fig. 5 shows that as the crystal-
lization temperature varies, dramatic changes in the crystal-
lization rate are produced. At low temperatures, the
crystallization is slow while it accelerates by increasing the
temperature in the range between 60 and 90 8C. At higher
temperatures a slow down is observed. This behaviour was
previously observed in PBI by means of calorimetric
experiments [27]. In all the studied temperatures, after a
given induction period, whose length depends on Tc, Bragg
peaks start to appear, accompanied by an emerging SAXS
maximum. The presence of this maximum suggests the
formation of a periodic structure in the range of tenths of
nanometers. This periodicity corresponds to crystalline
lamellae stacked together and separated by interlamellar
amorphous regions. The characteristics of these arrangements
of crystals are given by the structural parameters obtained from
the analysis of the SAXS curves, and represented in Fig. 6. The
dependence of Lb with tc for each temperature presents similar
features at all temperatures. It decreases initially, for tc!t1/2
and then stabilises later on. The final values depend on Tc,
indicating that the geometric details of the lamellar stacks
formed at different temperatures are different. The repeating
distance in the stacks formed at higher temperatures is larger
than the one obtained at low temperatures. From the analysis of
the correlation function of the SAXS curves it is possible to
obtain the fraction of each of the constituent phases x1 and x2,

A. Sanz et al. / Polymer 47 (2006) 1281–12901288
and through that, by using the value of the long spacing,
detailed geometrical characteristics of the lamellar stacks, such
as the thicknesses of both phases, L1 and L2 are obtained
(Fig. 6) [36]. Considering those values, one obtain nearly
constant values for the fraction of the constituent phases as a
function of the crystallization time (x1Z70% and x2Z30%,
independently of the Tc). The geometrical characteristic of the
stacks, however, exhibit a clear dependence with both,
crystallization time and temperature. L1 decreases clearly
with tc, and it presents higher values for the higher Tc. On the
contrary, L2 remains nearly constant during the crystallization
process, and also the higher Tc is, the higher the values of L2
are.
5. Discussion
5.1. Nanostructural development
It has been extensively discussed that, from all the above-
mentioned features, it is not possible to assign unambiguosly L1
and L2 to either the crystalline lamellae thickness or the
interlamellar amorphous regions thicknesses. An additional
criterion may arise from the obtained values of crystallinity. In
all the studied temperatures, Xc is always around 25%. The
correlation function provides values for the fraction of the
phases forming the stacks, x1 and x2 that are higher than Xc.
This implies that, the crystallinity in the stacks is higher than
the overall crystallinity, indicating an inhomogeneous distri-
bution of the stacks in the sample. If the higher value of x1 and
x2 is assigned to the crystalline fraction, then the inhomogen-
eity of the distribution of the crystals will be higher, indicating
that the stacks are highly crystalline and there are broad
amorphous areas separating the stacks. On the contrary, if x2 is
considered to be the fraction of crystalline material in the
stacks, then the stacks should nearly cover the whole sample,
and there will not be broad amorphous areas when the
crystallization process is finished. The discussion of the
dynamic measurements, presented in the next paragraph, may
help to elucidate this question.
5.2. Changes in the segmental dynamics of the amorphous
phase induced by the crystalline phase
As mentioned in Section 4, by performing SWD exper-
iments, one obtains parallel information on the structure
development and on the changes induced by this development
on the dynamics. According to the Kirkwood–Frohlich
equation, at a given temperature, the dielectric strength D3 in
a first approach, assuming a constant dipole correlation, is
proportional to the amount of dipoles involved in the relaxation
process [37–39]. As evidenced by the SWD experiments, the
onset of crystallization produces a strong reduction of the
intensity of the relaxation, i.e. of the D3. Close analysis of this
dependence (Fig. 8) shows that in the initial stage of
crystallization (tc!t1/2) the reduction in the amount of dipoles
involved in the relaxation is drastic. As an example, at tcZt1/2,
(t1/2z20,500 s, dotted lines in Fig. 8), the crystallinity reaches
values of around 12.5% whereas D3 has halved its value. This
observation cannot be explained unless one assumes that, the
material immobilized during this stage of crystallization comes
not only from the chain segments incorporated to the crystals,
but also from an extra immobile phase that is not crystalline.
This is a clear evidence for the formation of a rigid amorphous
phase (RAP) during crystallization. As observed in other
polymeric system [16,17], one possibility is that this RAP is
located between adjacent lamellae inside the lamellar stacks.
During the initial crystallization regime, when the stacks have
not impinged with each other, the formation of semicrystalline
stacks immobilize the material on them: both the amorphous
and the crystalline fractions. Therefore, the a-relaxation
observed by dielectric spectroscopy comes from broad
amorphous regions between the stacks. Accordingly, our
results seem to favour a heterogeneous distribution of lamellar
crystals. Previous SWD experiments performed in PET [17,40]
have shown the existence of a secondary a-relaxation (a 0)
associated to the segmental motion of a restricted amorphous
phase. This a 0-relaxation is slower than the original a one,
since it appears at lower frequencies, and its strength grows at
expenses of the a-relaxation. The secondary a 0-process has
been attributed to the relaxation of the amorphous chain
segments belonging to broad regions in the inter lamellar stack
regions [17]. In the case of PET, the relaxation in this regions
starts to be restricted due to the appearance of the secondary
lamellar stacks which start to be significant for tcOt1/2. For
times longer than about t1/2 a 0 coexists with the initial
a-process. In the present case for PBI, during the crystal-
lization process no secondary a 0-process is detected coexisting
with the initial one and the evolution from the segmental
dynamics for the fully amorphous sample to that of the
semicrystalline specimen can be described by a single
a-relaxation process. Qualitatively similar behaviour has
been observed in different polymers [16,18,20–23]. This can
be understood considering that, after completion of the
crystallization process the a-relaxation of the semicrystalline
PBI sample is about one order of magnitude slower than the
original one (Fig. 8(c)). This difference is about half of that
observed in PET for similar values of the final crystallinity
[17]. Noteworthy, as for PET, the onset of the dynamic
restrictions, as revealed by the shift of t towards higher values,
appears around the inflection point, tzt1/2, of the Xc curve. As
mentioned above, for longer times the appearance of secondary
crystals starts to be significant. The influence of secondary
crystallization events on the dynamics is further emphasized in
Fig. 9. In that plot, the value of D3, normalized to its initial
value, is presented versus crystallinity. D3norm can be
considered as a measure of the fraction of relaxing species
[16]. As observed in Fig. 9, D3norm decreases with Xc exhibiting
two clear linear tendencies. Initially, D3norm presents a slope far
away from K1, indicating that, during the initial regime, the
immobilized segments are not only the ones included in the
crystals, but also a large portion of the non-crystallized
segments, further supporting the existence of a rigid
amorphous phase. Using Fig. 9, one may have an estimation
about the fraction of sample included in the RAP. For XcZ
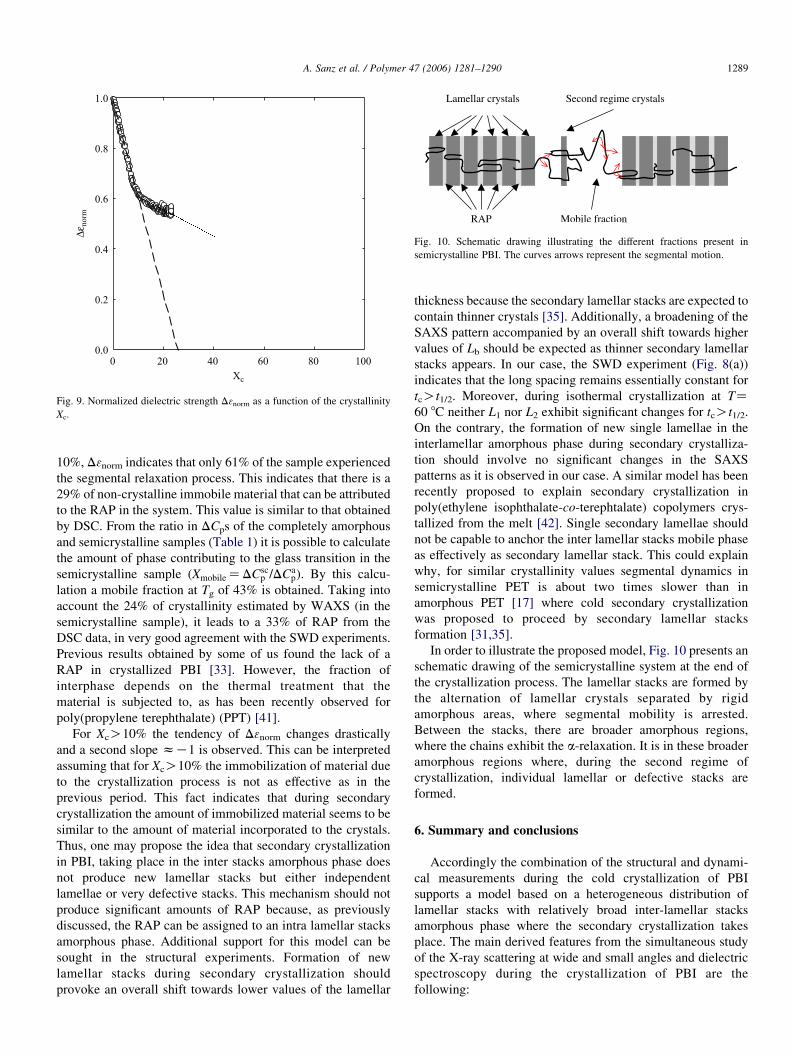
Fig. 10. Schematic drawing illustrating the different fractions present in
semicrystalline PBI. The curves arrows represent the segmental motion.
Fig. 9. Normalized dielectric strength D3norm as a function of the crystallinity
Xc.
A. Sanz et al. / Polymer 47 (2006) 1281–1290 1289
10%, D3norm indicates that only 61% of the sample experienced
the segmental relaxation process. This indicates that there is a
29% of non-crystalline immobile material that can be attributed
to the RAP in the system. This value is similar to that obtained
by DSC. From the ratio in DCps of the completely amorphous
and semicrystalline samples (Table 1) it is possible to calculate
the amount of phase contributing to the glass transition in the
semicrystalline sample ðXmobile ZDCscp =DCa
pÞ. By this calcu-
lation a mobile fraction at Tg of 43% is obtained. Taking into
account the 24% of crystallinity estimated by WAXS (in the
semicrystalline sample), it leads to a 33% of RAP from the
DSC data, in very good agreement with the SWD experiments.
Previous results obtained by some of us found the lack of a
RAP in crystallized PBI [33]. However, the fraction of
interphase depends on the thermal treatment that the
material is subjected to, as has been recently observed for
poly(propylene terephthalate) (PPT) [41].
For XcO10% the tendency of D3norm changes drastically
and a second slope zK1 is observed. This can be interpreted
assuming that for XcO10% the immobilization of material due
to the crystallization process is not as effective as in the
previous period. This fact indicates that during secondary
crystallization the amount of immobilized material seems to be
similar to the amount of material incorporated to the crystals.
Thus, one may propose the idea that secondary crystallization
in PBI, taking place in the inter stacks amorphous phase does
not produce new lamellar stacks but either independent
lamellae or very defective stacks. This mechanism should not
produce significant amounts of RAP because, as previously
discussed, the RAP can be assigned to an intra lamellar stacks
amorphous phase. Additional support for this model can be
sought in the structural experiments. Formation of new
lamellar stacks during secondary crystallization should
provoke an overall shift towards lower values of the lamellar
thickness because the secondary lamellar stacks are expected to
contain thinner crystals [35]. Additionally, a broadening of the
SAXS pattern accompanied by an overall shift towards higher
values of Lb should be expected as thinner secondary lamellar
stacks appears. In our case, the SWD experiment (Fig. 8(a))
indicates that the long spacing remains essentially constant for
tcOt1/2. Moreover, during isothermal crystallization at TZ60 8C neither L1 nor L2 exhibit significant changes for tcOt1/2.
On the contrary, the formation of new single lamellae in the
interlamellar amorphous phase during secondary crystalliza-
tion should involve no significant changes in the SAXS
patterns as it is observed in our case. A similar model has been
recently proposed to explain secondary crystallization in
poly(ethylene isophthalate-co-terephtalate) copolymers crys-
tallized from the melt [42]. Single secondary lamellae should
not be capable to anchor the inter lamellar stacks mobile phase
as effectively as secondary lamellar stack. This could explain
why, for similar crystallinity values segmental dynamics in
semicrystalline PET is about two times slower than in
amorphous PET [17] where cold secondary crystallization
was proposed to proceed by secondary lamellar stacks
formation [31,35].
In order to illustrate the proposed model, Fig. 10 presents an
schematic drawing of the semicrystalline system at the end of
the crystallization process. The lamellar stacks are formed by
the alternation of lamellar crystals separated by rigid
amorphous areas, where segmental mobility is arrested.
Between the stacks, there are broader amorphous regions,
where the chains exhibit the a-relaxation. It is in these broader
amorphous regions where, during the second regime of
crystallization, individual lamellar or defective stacks are
formed.
6. Summary and conclusions
Accordingly the combination of the structural and dynami-
cal measurements during the cold crystallization of PBI
supports a model based on a heterogeneous distribution of
lamellar stacks with relatively broad inter-lamellar stacks
amorphous phase where the secondary crystallization takes
place. The main derived features from the simultaneous study
of the X-ray scattering at wide and small angles and dielectric
spectroscopy during the crystallization of PBI are the
following:

A. Sanz et al. / Polymer 47 (2006) 1281–12901290
† There are two clearly differentiated regimes of crystal-
lization: a primary regime where lamellar stacks are formed
and a secondary regime in which isolated lamella grow in
broad amorphous regions located between the stacks.
† Due to the crystallization in stacks a rigid amorphous phase
is formed, which can be assigned to the amorphous fraction
included in the stacks, that is, located between consecutive
lamella inside the stacks.
† During the second regime of crystallization no more RAP is
originated.
† Secondary crystallization proceeds by the formation either
of single lamellae or of very defective lamellar stacks.
Acknowledgements
The authors are indebted to MCYT (grant FPA2001-2139)
Spain, and Marie Curie Reintegration Grant Program of the
European Community (ERG 505674) for generous support of
this investigation. The experiments at HASYLAB (Hamburg,
Germany) have been supported through the Integrated
Infrastructure Initiative ‘Integrating Activity on Synchrotron
and Free Electron Laser Science’ of the European Community-
Research Infrastructure Action under the FP6 ‘Structuring the
European Research Area’. A.N. thanks the MCYT for the
tenure of a Ramon y Cajal contract. We thank M. Dommach,
MJ Capitan and C Alvarez for technical assistance.
References
[1] Sommer JU, Reiter G. Editors lecture notes in physics. Polymer
crystallization: observations, concepts and interpretations, vol. 606.
Heidelberg: Springer; 2003.
[2] Mandelkern L. Crystallization of polymers. Equilibrium concepts, vol. 1.
Cambridge: Cambridge University Press; 2002.
[3] Balta-Calleja FJ, Vonk OC. X-ray scattering of synthetic polymers.
Amsterdam: Elsevier; 1989.
[4] Santa Cruz C, Stribeck N, Zachmann HG, Balta-Calleja FJ. Macromol-
ecules 1991;24(22):5980–90.
[5] Xia Z, Sue H, Wang Z, Avila-Orta CA, Hsiao BS. J Macromol Sci, Phys
2001;B40(5):625–38.
[6] Verma R, Marand H, Hsiao BS. Macromolecules 1996;29(24):7767–75.
[7] Ivanov DA, Legras R, Jonas AM. Macromolecules 1999;32(5):1582–92.
[8] Ivanov DA, Pop T, Yoon DY, Jonas AM. Macromolecules 2002;35(26):
9813–8.
[9] Haubruge HG, Jonas AM, Legras R. Macromolecules 2004;37(1):
126–34.
[10] Kakudo M, Kasai N. X-ray diffraction by polymers. Amsterdam: Elsevier;
1972.
[11] Bassett DC. Principles of polymer morphology. Cambridge solid state
series. Cambridge: Cambridge University Press; 1981.
[12] Cheng SZD, Cao MY, Wunderlich B. Macromolecules 1986;19(7):
1868–76.
[13] Hou P, Cebe P. Macromolecules 1992;25(2):902–9.
[14] Dobbertin J, Hensel A, Schick C. J Thermal Anal 1996;47(4):1027–40.
[15] Schick C, Donth E. Phys Scr 1991;43(4):423–9.
[16] Nogales A, Ezquerra TA, Denchev Z, Sics I, Balta Calleja FJ, Hsiao BS.
J Chem Phys 2001;115(8):3804–12.
[17] Alvarez C, Sics I, Nogales A, Denchev Z, Funari SS, Ezquerra TA.
Polymer 2004;45:3953–9.
[18] Schonhals A, Kremer F. Broad band dielectric spectroscopy. Berlin:
Springer; 2002.
[19] Williams G. Adv Polym Sci 1979;33:59–92.
[20] Ezquerra TA, Balta Calleja FJ, Zachmann HG. Polymer 1994;35(12):
2600–6.
[21] Nogales A, Ezquerra TA, Garcıa JM, Balta Calleja FJ. J Polym Sci, Part
B: Polym Phys 1999;37(1):37–49.
[22] Kanchanasopa M, Runt J. Macromolecules 2004;37(3):863–71.
[23] Andjelic S, Fitz BD. J Polym Sci, Part B: Polym Phys 2000;38(18):
2436–48.
[24] Mijovic J, Sy JW. Macromolecules 2002;35(16):6370–6.
[25] Massalska-Arodz M, Williams G, Thomas DK, Jones WJ, Dabrowski R.
J Phys Chem 1999;3(20):4197–205.
[26] Sics I, Ezquerra TA, Nogales A, Denchev Z, Alvarez C, Funari SS.
Polymer 2003;44(4):1045–9.
[27] Munari A, Manaresi P, Chiorboli E, Chiolle A. Eur Polym J 1992;28(1):
101–6.
[28] Sics I, Nogales A, Ezquerra TA, Denchev Z, Balta-Calleja FJ, Meyer A,
et al. Rev Sci Instrum 2001;71(4):1733–6.
[29] Kortleve G, Vonk CG, Kolloid ZZ. Polymer 1968;225(2):124–31.
[30] Strobl GR, Schneider M. J Polym Sci, Part A-2: Polym Phys 1980;18(6):
1343–59.
[31] Hsiao BS, Verma RK. J Synchrotron Radiat 1998;5(1):23–9.
[32] Havriliak S, Negami S. Polymer 1967;8:161–210.
[33] Righetti MC, Pizzoli M, Lotti N, Munari A. Macromol Chem Phys 1998;
199(9):2063–70.
[34] Vonk CG, Kortleve G, Kolloid ZZ. Polymer 1967;220(1):19–24.
[35] Wang Z, Hsiao BS, Sauer BB, Kampert WG. Polymer 1999;40(16):
4615–27.
[36] Denchev Z, Nogales A, Ezquerra TA, Fernandes-Nascimento J, Balta
Calleja FJ. J Polym Sci, Part B: Polym Phys 2000;38(9):1167–82.
[37] Hedvig P. Dielectric spectroscopy of polymers. Bristol: Hilger; 1967.
[38] Frohlich H. Theory of dielectrics. London: Oxford University Press;
1941.
[39] Fuoss RM, Kirkwood JG. J Am Chem Soc 1941;63:385.
[40] Fukao K, Miyamoto Y. Phys Rev Lett 1997;79(23):4613–6.
[41] Sisti L, Finelli L, Lotti N, Berti C, Munari A. e-Polymers 2003 [Paper no.
54].
[42] Lee B, Shin TJ, Lee SW, Yoon J, Kim J. Macromolecules 2004;37(11):
4174–84.