Optimizing PaaS provider profit under service level agreement ...
147
HAL Id: tel-01124007 https://tel.archives-ouvertes.fr/tel-01124007 Submitted on 6 Mar 2015 HAL is a multi-disciplinary open access archive for the deposit and dissemination of sci- entific research documents, whether they are pub- lished or not. The documents may come from teaching and research institutions in France or abroad, or from public or private research centers. L’archive ouverte pluridisciplinaire HAL, est destinée au dépôt et à la diffusion de documents scientifiques de niveau recherche, publiés ou non, émanant des établissements d’enseignement et de recherche français ou étrangers, des laboratoires publics ou privés. Optimizing PaaS provider profit under service level agreement constraints Djawida Dib To cite this version: Djawida Dib. Optimizing PaaS provider profit under service level agreement constraints. Networking and Internet Architecture [cs.NI]. Université Rennes 1, 2014. English. NNT : 2014REN1S044. tel- 01124007
-
Upload
khangminh22 -
Category
Documents
-
view
1 -
download
0
Transcript of Optimizing PaaS provider profit under service level agreement ...
HAL Id: tel-01124007https://tel.archives-ouvertes.fr/tel-01124007
Submitted on 6 Mar 2015
HAL is a multi-disciplinary open accessarchive for the deposit and dissemination of sci-entific research documents, whether they are pub-lished or not. The documents may come fromteaching and research institutions in France orabroad, or from public or private research centers.
L’archive ouverte pluridisciplinaire HAL, estdestinée au dépôt et à la diffusion de documentsscientifiques de niveau recherche, publiés ou non,émanant des établissements d’enseignement et derecherche français ou étrangers, des laboratoirespublics ou privés.
Optimizing PaaS provider profit under service levelagreement constraints
Djawida Dib
To cite this version:Djawida Dib. Optimizing PaaS provider profit under service level agreement constraints. Networkingand Internet Architecture [cs.NI]. Université Rennes 1, 2014. English. �NNT : 2014REN1S044�. �tel-01124007�

ANNÉE 2014
THÈSE / UNIVERSITÉ DE RENNES 1sous le sceau de l’Université Européenne de Bretagne
pour le grade de
DOCTEUR DE L’UNIVERSITÉ DE RENNES 1
Mention : InformatiqueÉcole doctorale Matisse
présentée par
Djawida Dibpréparée à l’unité de recherche no 6074 - IRISA
Institut de Recherche en Informatique et Systèmes AléatoiresISTIC
Optimizing PaaS
Provider Profit
under Service
Level Agreement
Constraints
Thèse soutenue à Rennesle 7 juillet 2014
devant le jury composé de :
Jean-Marc Menaud / Rapporteur
Professeur, École des Mines de Nantes
Pierre Sens / Rapporteur
Professeur, Université Pierre et Marie Curie
Michel Banâtre / Examinateur
Directeur de Recherche, Inria Rennes - Bretagne Atlantique
Stephen Scott / Examinateur
Professeur, Tennessee Tech University
Christine Morin / Directrice de thèse
Directrice de Recherche, Inria Rennes - Bretagne Atlantique
Nikos Parlavantzas / Co-directeur de thèse
Maître de Conférences, INSA de Rennes


When you see clouds gathering, prepare to catch rainwater ...Golan proverb


Remerciements
Cette thèse est une aventure dans laquelle plusieurs personnes ont fait partie.Tout d’abord, j’ai une profonde pensée pour Françoise André, avec qui j’ai commencé
ma thèse et qui nous a malheureusement quitté avant la fin de ma première année dethèse. Françoise était une directrice rigoureuse et perfectionniste. Grâce à elle j’ai apprisà développer des arguments solides pour défendre mes idées.
Je tiens à exprimer ma gratitude à Christine Morin pour avoir pris le relais de Fran-çoise et d’avoir toujours veillé à ce que ma thèse se passe dans de bonnes conditions.Merci Christine d’avoir su orienter mes travaux. Merci également de m’avoir trouvé dutemps pour des discussions malgré un planning très chargé. Chacune de nos discussionsm’a permis de voir mes travaux de différents angles et de penser à plein de perspectives.
Je remercie Nikos Parlavantzas d’avoir co-diriger ma thèse et d’avoir été disponiblepour discuter sur toutes les idées et les approches utilisées, même sur les plus petitsdétails de configuration. Toutes nos discussions étaient très enrichissantes. Merci Nikospour toutes tes reflexions pertinentes qui ont fait avancer mes travaux de thèse.
J’adresse mes remerciements aux membres de jury : Pierre Sens et Jean-Marc Menaudd’avoir été rapporteurs, Michel Banâtre d’avoir présider le jury et Stephen Scott d’avoirparticiper à l’évaluation de ma thèse. Je vous remercie tous pour l’intérêt que vous avezporté à mes travaux et pour vos retours constructifs.
Je remercie tous les membres de l’équipe Myriads pour tous les moments agréablesque j’ai pu partager avec eux. Merci Pierre d’avoir toujours été disponible pour donnerun coup de main ou un conseil et ça depuis mon stage de Master. Je remercie Marko,Louis et Maxence pour leur support concernant Kerrighed. Je remercie Guillaume etErwan pour leur support concernant Safdis. Un grand merci à Eugen pour toutes lesdiscussions intéressantes et amusantes ainsi que pour son support concernant Snooze. Jeremercie également Matthieu d’avoir pris le relais de Eugen dans le support techniquede Snooze. Je remercie Anca pour ses scripts de configuration d’Hadoop. Je remercieGuillaume, Anne-Cécile et Alexandra pour notre contribution fructueuse "Green PaaS".Merci à Roberto et Anne-Cécile pour la pertinence de leurs retours concernant mesprésentations orales. Je remercie la communauté de Grid’5000 et plus particulièrementDavid, Yvon et Pascal pour leur support technique. Un grand merci à Maryse pour sonaide dans les formalités administratives ainsi que dans l’organisation des missions quin’étaient pas des plus simples. Je remercie chaleureusement Anca, Stefania, Elya, Peter,Rémy, Amine, Guillaume, Mohammed, Ghislain, Alexandra, Bogdan, Anne-Cécile, An-dré, Pierre, Roberto, Eugen, Matthieu, ... et tous ceux qui rendaient le quotidien socialagréable.
Un énorme merci à ma famille pour m’avoir toujours soutenue et encouragée. À mesparents pour leur affection, leurs sacrifices et leur soutien inconditionnel. À mon maripour avoir été à mes côtés pendant les moments les plus difficiles de la thèse et d’avoirtoujours su trouver les mots pour me rassurer. À mon petit bout’chou Abdesselem pourm’avoir tenue compagnie pendant la rédaction et la soutenance de la thèse. À ma soeurNassima et mon petit frère Mohammed Riad pour leur amour et leurs encouragementsinfinis. À mes frères Mokhtar et Kheir-edinne. À mon beau frère Samir. À mes bellessoeurs Leila et Souhila. À mes petits nerveux et nièces Mehdi, Zakia, Abderrahmene,Meriem et Yacine. À mes grands mères pour toutes leurs prières. À mes tantes, oncles,cousins et cousines. À mes beaux parents et mes belles soeurs Ilhem et Dounyazed pour
5

leur sympathie et leurs encouragements.J’ai une pensée particulière pour ma mère Zakia. J’espère qu’elle est contente de ce
que j’ai accomplis de là où elle est.Enfin, un grand merci à tous mes amis. À Sarra pour son amitié exceptionnelle et
pour ses encouragements. À Esma pour toutes nos discussions et pour son grand sou-tien, notamment durant les derniers jours précédant la soutenance. À Wahida, Fadhela,Rafik, Hakim, ... et tous ceux qui ont partagé avec moi cette aventure.
6

Contents
1 Introduction 131.1 Context . . . . . . . . . . . . . . . . . . . . . . . . . . . . . . . . . . . . . . . 141.2 Objectives . . . . . . . . . . . . . . . . . . . . . . . . . . . . . . . . . . . . . 151.3 Contributions . . . . . . . . . . . . . . . . . . . . . . . . . . . . . . . . . . . 151.4 Outline of the Thesis . . . . . . . . . . . . . . . . . . . . . . . . . . . . . . . 16
2 Background 172.1 IT Infrastructures . . . . . . . . . . . . . . . . . . . . . . . . . . . . . . . . . 18
2.1.1 Cluster . . . . . . . . . . . . . . . . . . . . . . . . . . . . . . . . . . . 182.1.2 Grid . . . . . . . . . . . . . . . . . . . . . . . . . . . . . . . . . . . . 192.1.3 Utility Computing . . . . . . . . . . . . . . . . . . . . . . . . . . . . 19
2.2 Taxonomy of Application Models . . . . . . . . . . . . . . . . . . . . . . . 202.2.1 Parallelism Model . . . . . . . . . . . . . . . . . . . . . . . . . . . . 202.2.2 Resource Requirements . . . . . . . . . . . . . . . . . . . . . . . . . 202.2.3 Resource Usage . . . . . . . . . . . . . . . . . . . . . . . . . . . . . . 212.2.4 Lifetime . . . . . . . . . . . . . . . . . . . . . . . . . . . . . . . . . . 212.2.5 Interactivity . . . . . . . . . . . . . . . . . . . . . . . . . . . . . . . . 22
2.3 Service Level Agreement (SLA) . . . . . . . . . . . . . . . . . . . . . . . . . 222.3.1 Overview . . . . . . . . . . . . . . . . . . . . . . . . . . . . . . . . . 222.3.2 SLA Specification . . . . . . . . . . . . . . . . . . . . . . . . . . . . . 232.3.3 SLA metrics . . . . . . . . . . . . . . . . . . . . . . . . . . . . . . . . 232.3.4 Price Formation and Billing Models . . . . . . . . . . . . . . . . . . 232.3.5 Penalties . . . . . . . . . . . . . . . . . . . . . . . . . . . . . . . . . . 242.3.6 SLA Lifecycle . . . . . . . . . . . . . . . . . . . . . . . . . . . . . . . 24
2.4 Cloud Computing . . . . . . . . . . . . . . . . . . . . . . . . . . . . . . . . . 242.4.1 Overview . . . . . . . . . . . . . . . . . . . . . . . . . . . . . . . . . 242.4.2 Service Models . . . . . . . . . . . . . . . . . . . . . . . . . . . . . . 252.4.3 Deployment Models . . . . . . . . . . . . . . . . . . . . . . . . . . . 282.4.4 Business Aspects . . . . . . . . . . . . . . . . . . . . . . . . . . . . . 29
2.5 Summary . . . . . . . . . . . . . . . . . . . . . . . . . . . . . . . . . . . . . . 30
3 SLA-Based Profit Optimization in Cloud Bursting PaaS 333.1 Thesis Objective . . . . . . . . . . . . . . . . . . . . . . . . . . . . . . . . . . 343.2 Platform as a Service (PaaS) . . . . . . . . . . . . . . . . . . . . . . . . . . . 34
3.2.1 Commercial PaaS . . . . . . . . . . . . . . . . . . . . . . . . . . . . . 353.2.2 Open Source PaaS . . . . . . . . . . . . . . . . . . . . . . . . . . . . 413.2.3 Research PaaS . . . . . . . . . . . . . . . . . . . . . . . . . . . . . . . 45
7

Contents
3.3 Cloud Bursting . . . . . . . . . . . . . . . . . . . . . . . . . . . . . . . . . . 493.3.1 Based on User Constraints . . . . . . . . . . . . . . . . . . . . . . . 493.3.2 Based on Economic Criteria . . . . . . . . . . . . . . . . . . . . . . . 503.3.3 Targeting Specific Application Types . . . . . . . . . . . . . . . . . 51
3.4 Economic Optimizations . . . . . . . . . . . . . . . . . . . . . . . . . . . . . 523.4.1 Targeting Specific Application Types . . . . . . . . . . . . . . . . . 523.4.2 Targeting Specific Infrastructures . . . . . . . . . . . . . . . . . . . . 543.4.3 Focusing on the Optimization of Energy Costs . . . . . . . . . . . . 55
3.5 Gaps . . . . . . . . . . . . . . . . . . . . . . . . . . . . . . . . . . . . . . . . 563.6 Summary . . . . . . . . . . . . . . . . . . . . . . . . . . . . . . . . . . . . . . 56
4 Profit Optimization Model 614.1 Definitions and Assumptions . . . . . . . . . . . . . . . . . . . . . . . . . . 624.2 PaaS System Model . . . . . . . . . . . . . . . . . . . . . . . . . . . . . . . . 63
4.2.1 Notations . . . . . . . . . . . . . . . . . . . . . . . . . . . . . . . . . 634.2.2 Objective . . . . . . . . . . . . . . . . . . . . . . . . . . . . . . . . . . 644.2.3 Constraints . . . . . . . . . . . . . . . . . . . . . . . . . . . . . . . . 64
4.3 Policies . . . . . . . . . . . . . . . . . . . . . . . . . . . . . . . . . . . . . . . 654.3.1 Basic Policy . . . . . . . . . . . . . . . . . . . . . . . . . . . . . . . . 664.3.2 Advanced Policy . . . . . . . . . . . . . . . . . . . . . . . . . . . . . 664.3.3 Optimization Policy . . . . . . . . . . . . . . . . . . . . . . . . . . . 68
4.4 Summary . . . . . . . . . . . . . . . . . . . . . . . . . . . . . . . . . . . . . . 70
5 Computational Applications 735.1 Definitions and Assumptions . . . . . . . . . . . . . . . . . . . . . . . . . . 745.2 Performance Model . . . . . . . . . . . . . . . . . . . . . . . . . . . . . . . . 745.3 Service Level Agreement (SLA) . . . . . . . . . . . . . . . . . . . . . . . . . 74
5.3.1 SLA Contract . . . . . . . . . . . . . . . . . . . . . . . . . . . . . . . 745.3.2 SLA Classes . . . . . . . . . . . . . . . . . . . . . . . . . . . . . . . . 755.3.3 Revenue Functions . . . . . . . . . . . . . . . . . . . . . . . . . . . . 765.3.4 Lifecycle . . . . . . . . . . . . . . . . . . . . . . . . . . . . . . . . . . 77
5.4 Bids Heuristics . . . . . . . . . . . . . . . . . . . . . . . . . . . . . . . . . . 785.4.1 Waiting Bid . . . . . . . . . . . . . . . . . . . . . . . . . . . . . . . . 785.4.2 Donating Bid . . . . . . . . . . . . . . . . . . . . . . . . . . . . . . . 79
5.5 Summary . . . . . . . . . . . . . . . . . . . . . . . . . . . . . . . . . . . . . . 82
6 Meryn: an Open Cloud-Bursting PaaS 856.1 Design Principles . . . . . . . . . . . . . . . . . . . . . . . . . . . . . . . . . 866.2 System Architecture . . . . . . . . . . . . . . . . . . . . . . . . . . . . . . . 86
6.2.1 Overview . . . . . . . . . . . . . . . . . . . . . . . . . . . . . . . . . 876.2.2 Components . . . . . . . . . . . . . . . . . . . . . . . . . . . . . . . . 876.2.3 Application Life-Cycle . . . . . . . . . . . . . . . . . . . . . . . . . . 896.2.4 VC Scaling Mechanisms . . . . . . . . . . . . . . . . . . . . . . . . . 90
6.3 Implementation . . . . . . . . . . . . . . . . . . . . . . . . . . . . . . . . . . 906.3.1 Frameworks Configuration . . . . . . . . . . . . . . . . . . . . . . . 906.3.2 Components Implementation . . . . . . . . . . . . . . . . . . . . . . 916.3.3 Parallel Submission Requests . . . . . . . . . . . . . . . . . . . . . . 92
8

6.3.4 Cloud Bursting . . . . . . . . . . . . . . . . . . . . . . . . . . . . . . 936.4 Summary . . . . . . . . . . . . . . . . . . . . . . . . . . . . . . . . . . . . . . 93
7 Evaluation 957.1 Evaluation Setup . . . . . . . . . . . . . . . . . . . . . . . . . . . . . . . . . 96
7.1.1 Meryn Prototype . . . . . . . . . . . . . . . . . . . . . . . . . . . . . 967.1.2 Policies . . . . . . . . . . . . . . . . . . . . . . . . . . . . . . . . . . . 967.1.3 Workloads . . . . . . . . . . . . . . . . . . . . . . . . . . . . . . . . . 977.1.4 Pricing . . . . . . . . . . . . . . . . . . . . . . . . . . . . . . . . . . . 977.1.5 SLAs . . . . . . . . . . . . . . . . . . . . . . . . . . . . . . . . . . . . 987.1.6 Grid’5000 testbed . . . . . . . . . . . . . . . . . . . . . . . . . . . . . 987.1.7 Evaluation Metrics . . . . . . . . . . . . . . . . . . . . . . . . . . . . 99
7.2 Simulations . . . . . . . . . . . . . . . . . . . . . . . . . . . . . . . . . . . . 1007.2.1 Environment Setup . . . . . . . . . . . . . . . . . . . . . . . . . . . . 1007.2.2 Results . . . . . . . . . . . . . . . . . . . . . . . . . . . . . . . . . . . 101
7.3 Experiments . . . . . . . . . . . . . . . . . . . . . . . . . . . . . . . . . . . . 1057.3.1 Measurements . . . . . . . . . . . . . . . . . . . . . . . . . . . . . . 1057.3.2 Environment Setup . . . . . . . . . . . . . . . . . . . . . . . . . . . . 1077.3.3 Results . . . . . . . . . . . . . . . . . . . . . . . . . . . . . . . . . . . 110
7.4 Summary . . . . . . . . . . . . . . . . . . . . . . . . . . . . . . . . . . . . . . 115
8 Conclusions and Perspectives 1178.1 Contributions . . . . . . . . . . . . . . . . . . . . . . . . . . . . . . . . . . . 1188.2 Perspectives . . . . . . . . . . . . . . . . . . . . . . . . . . . . . . . . . . . . 119
Bibliography 121
A Publications 135
B Résumé en Français 137B.1 Introduction . . . . . . . . . . . . . . . . . . . . . . . . . . . . . . . . . . . . 137B.2 Objectifs . . . . . . . . . . . . . . . . . . . . . . . . . . . . . . . . . . . . . . 138B.3 Contributions . . . . . . . . . . . . . . . . . . . . . . . . . . . . . . . . . . . 139
B.3.1 Modèle d’optimisation de profit . . . . . . . . . . . . . . . . . . . . 139B.3.2 Application du modèle d’optimisation . . . . . . . . . . . . . . . . 139B.3.3 Meryn : un système de PaaS avec la fonctionnalité de cloud bursting140
B.4 Évaluation . . . . . . . . . . . . . . . . . . . . . . . . . . . . . . . . . . . . . 140B.5 Organisation du manuscrit . . . . . . . . . . . . . . . . . . . . . . . . . . . 141
9

Contents
10

List of Figures
2.1 Overview of a cluster managed using a programming framework . . . . . 182.2 Overview of a cluster managed using a single system image . . . . . . . . 192.3 SLA overview . . . . . . . . . . . . . . . . . . . . . . . . . . . . . . . . . . . 222.4 Cloud service models . . . . . . . . . . . . . . . . . . . . . . . . . . . . . . . 25
4.1 Overview of the considered hosting environment . . . . . . . . . . . . . . 62
5.1 Linear revenue function . . . . . . . . . . . . . . . . . . . . . . . . . . . . . 765.2 Bounded linear revenue function . . . . . . . . . . . . . . . . . . . . . . . . 775.3 Constant revenue function . . . . . . . . . . . . . . . . . . . . . . . . . . . . 775.4 Hosting options . . . . . . . . . . . . . . . . . . . . . . . . . . . . . . . . . . 785.5 Application times according to the three impact forms. . . . . . . . . . . . 82
6.1 Meryn architecture overview . . . . . . . . . . . . . . . . . . . . . . . . . . 876.2 Meryn components . . . . . . . . . . . . . . . . . . . . . . . . . . . . . . . . 886.3 Application life-cycle . . . . . . . . . . . . . . . . . . . . . . . . . . . . . . . 896.4 Configuration of the Hadoop VC . . . . . . . . . . . . . . . . . . . . . . . . 91
7.1 Meryn prototype configuration. . . . . . . . . . . . . . . . . . . . . . . . . . 967.2 Workload profit comparison. Profit shown is the sum of profits of all jobs
in the workload. (Simulations) . . . . . . . . . . . . . . . . . . . . . . . . . 1027.3 VMs usage proportion for each workload and policy, calculated as the
number of the used VMs multiplied by the usage duration. (Simulations) 1037.4 Workloads completion time (seconds), from the submission of the first job
to the completion of the final job. (Simulations) . . . . . . . . . . . . . . . 1057.5 Creation and configuration of OGE VMs . . . . . . . . . . . . . . . . . . . 1067.6 Creation and configuration of Hadoop VMs . . . . . . . . . . . . . . . . . 1077.7 Submission time of batch applications on (a) local VMs, (b) VC VMs, and
(c) public VMs . . . . . . . . . . . . . . . . . . . . . . . . . . . . . . . . . . . 1087.8 Submission time of MapReduce applications on (a) local VMs, (b) VC
VMs, and (c) public VMs . . . . . . . . . . . . . . . . . . . . . . . . . . . . . 1087.9 Workload profit comparison. Profit shown is the sum of profits of all jobs
in the workload. (Experiments) . . . . . . . . . . . . . . . . . . . . . . . . . 1127.10 VMs usage proportion for each workload and policy, calculated as the
number of the used VMs multiplied by the usage duration. (Experiments) 1147.11 Workloads completion time (seconds), from the submission of the first job
to the completion of the final job. (Experiments) . . . . . . . . . . . . . . . 115
11

List of Figures
12

List of Tables
2.1 Examples of existing cloud SLA metrics . . . . . . . . . . . . . . . . . . . . 31
3.1 Summary of commercia PaaS solutions . . . . . . . . . . . . . . . . . . . . 393.2 Summary of open source PaaS solutions . . . . . . . . . . . . . . . . . . . . 443.3 Summary of commercial, open source and research PaaS solutions . . . . 483.4 Summary of cloud bursting related work . . . . . . . . . . . . . . . . . . . 533.5 Summary of economic optimization policies . . . . . . . . . . . . . . . . . 573.6 Positioning this thesis with the main related works. . . . . . . . . . . . . . 58
4.1 Notations . . . . . . . . . . . . . . . . . . . . . . . . . . . . . . . . . . . . . . 65
7.1 Configuration parameters of SLA classes. . . . . . . . . . . . . . . . . . . . 987.2 Profit Rates of the advanced and the optimization policies compared to
the basic policy. (Simulations) . . . . . . . . . . . . . . . . . . . . . . . . . . 1027.3 Profit Rates of the optimization policies compared to the advanced policy.
(Simulations) . . . . . . . . . . . . . . . . . . . . . . . . . . . . . . . . . . . . 1037.4 Percentage of the used public cloud VMs. (Simulations) . . . . . . . . . . 1047.5 Percentage of (A) delayed applications and (B) average delay of delayed
applications with the optimization policy. (Simulations) . . . . . . . . . . 1047.6 Average applications submission time on public VMs. . . . . . . . . . . . 1117.7 Required time for processing a local VM(s) loan. . . . . . . . . . . . . . . . 1117.8 Average applications submission time on local VMs. . . . . . . . . . . . . 1117.9 Required time for processing a VC VM(s) loan. . . . . . . . . . . . . . . . 1117.10 Average applications submission time on VC VMs. . . . . . . . . . . . . . 1117.11 Profit Rates of the advanced and the optimization policies compared to
the basic policy. (Experiments) . . . . . . . . . . . . . . . . . . . . . . . . . 1137.12 Profit Rates of the optimization policies compared to the advanced policy.
(Experiments) . . . . . . . . . . . . . . . . . . . . . . . . . . . . . . . . . . . 1137.13 Percentage of the used public cloud VMs. (Experiments) . . . . . . . . . . 1137.14 Percentage of (A) delayed applications and (B) average delay of delayed
applications with the optimization policy. (Experiments) . . . . . . . . . . 115
13

List of Tables
14

Chapter 1
Introduction
Contents1.1 Context . . . . . . . . . . . . . . . . . . . . . . . . . . . . . . . . . . . . . . 14
1.2 Objectives . . . . . . . . . . . . . . . . . . . . . . . . . . . . . . . . . . . . 15
1.3 Contributions . . . . . . . . . . . . . . . . . . . . . . . . . . . . . . . . . . 15
1.4 Outline of the Thesis . . . . . . . . . . . . . . . . . . . . . . . . . . . . . 16
This PhD thesis examines economic optimizations in cloud computing environments,focusing mainly on the optimization of PaaS providers’ profits. This chapter in-
troduces the context, objectives and contributions of this PhD thesis and presents theoutline of this document.
15

1.1. Context
1.1 Context
Cloud computing is an emerging paradigm revolutionizing the use and marketing ofInformation Technology (IT). The cloud computing concept enables customers from allover the world to access very large computing capacities, using a simple Internet con-nection, while paying only for the resources they really use. Indeed, the pay-as-you-gopricing model of cloud computing services attracts many customers and small compa-nies aiming at reducing the cost of their IT usage and offers providers new opportunitiesfor commercializing computing resources. Cloud computing services are provided ac-cording to three fundamental models: Infrastructure as a Service (IaaS), Platform as aService (PaaS) and Software as a Service (SaaS). The IaaS model provides basic comput-ing resources, such as computing machines as well as storage and networking devices.The PaaS model provides configured execution environments, ready to host cloud ap-plications. The SaaS model provides hosted applications, ready for use.
In this thesis we are interested in the PaaS service model, which gained a lot ofattention over the past years. A PaaS environment is typically built on top of virtu-alized resources owned by the PaaS provider or rented on-demand from public IaaSproviders. The advantage of this model over the two others is that it hides the complex-ity of the used resources while offering customers the possibility to run and control theirown applications. The interactions between PaaS customers and providers are governedby Service Level Agreements (SLAs), specifying the obligations of each party as wellas associated payments and penalties. For instance, the PaaS offerings of the currentbig players, such as Amazon Elastic Beanstalk [10] and Microsoft Windows Azure [13],guarantee a high service availability. Their clients pay for the resources consumed bytheir applications. Then, if the promised availability target is missed, the providers givecustomers a service credit.
The socio-economic impact of PaaS services becomes critical since the number ofPaaS users and providers is growing. PaaS providers want to generate the maximumprofit from the services they provide. This requires them to face a number of challenges.They have to efficiently manage the underlying resources and to decide between us-ing privately owned resources or renting public IaaS resources. Moreover, they mustmanage the placement and isolation of customer applications on the resources and sat-isfy their SLAs in order to avoid the payment of penalties. Current big commercialPaaS providers, such as Amazon and Microsoft, use their own resources. However,smaller PaaS providers, such as Heroku [15], CloudBees [34] and dotCloud [35], renton-demand public IaaS resources. In this thesis we consider a cloud-bursting PaaS envi-ronment, which is built on a limited number of private resources and is able to burstinto public IaaS cloud resources. Such an environment represents the general case andoffers several options for the PaaS provider to select resources for hosting applications.
Recently, a number of research works focusing on economic optimizations in multi-cloud environments have been proposed. However, most of them either focus on specificapplication types [120][79][64] or target specific hosting environments [90][141][158].Therefore, exploring and investigating the possible solutions for managing a cloud-bursting PaaS environment with the objective of optimizing the provider profit remainsan open research topic. The work of this thesis is part of this theme.
16

Chapter 1. Introduction
1.2 Objectives
The main objective of this thesis is to provide a profit-optimization solution for SLA-enabled,cloud-bursting, PaaS systems. To achieve this objective, this thesis investigates four mainsub-objectives:
• Profit Optimization. The profit optimization is the central objective of every PaaSprovider. On one hand, this involves accepting and satisfying client requestswhether in low or peak periods. On the other hand, the competition betweenproviders compels each provider to propose prices following the market, whichlimits their revenues. Therefore, the provider profit optimization should be per-formed through the optimization of the incurred costs for hosting applications.However, if such a cost optimization leads the provider to miss its commitmentsregarding the QoS promised to applications, the customers will be disappointedand may migrate to an other competitor. Thus our objective here is to provide a pol-icy that searches the cheapest resources for the provider to host clients applications, takinginto account the provider’s reputation and its long-term profit.
• SLA Support. PaaS customers expect PaaS providers to propose SLA contractsthat guarantee a QoS level to their applications. An important part of the SLAagreement consists in arranging to compensate users if the agreed QoS level oftheir applications is missed. Such compensations may penalize providers’ profitsbut are necessary to gain the confidence of clients. Thus, our goal here is to provideQoS-based SLA to applications and to take into account the payment of penalties if theproviders fail in providing the QoS level promised to their clients’ applications.
• Support for Multiple Application Types. An open PaaS solution, easily extensibleto support of new application types, is appealing to both customers and providers.On one hand, it offers more flexibility to customers having various requirements.On the other hand, it enables PaaS providers to attract clients from several profes-sional areas and to easily add the support of any new profit-making applicationtype, which helps increasing their turnovers. Therefore, we aim at providing anopen and generic PaaS profit-efficient solution, which is independent from a specific ap-plication type. The difficulty in building such a PaaS solution lies in the supportof various application types, each application type having its own hardware andsoftware dependencies.
• Cloud-Bursting PaaS System. A cloud-bursting PaaS system enabling the de-ployment of applications simultaneously on private and public cloud resourcesoffers PaaS providers several deployment options to optimize either applicationperformance or costs. The support of cloud-bursting capability requires signifi-cant engineering work to enable the PaaS system to use several IaaS systems andto maintain the SLA of the applications deployed simultaneously on several IaaSclouds. Therefore, our goal is to design a cloud-bursting PaaS system enabling thedeployment of applications on multiple clouds.
1.3 Contributions
This thesis tackles the introduced objectives with the following contributions.
17

1.4. Outline of the Thesis
• Profit Optimization Model. We define a generic model of an open cloud-burstingPaaS system, based on which we propose a policy for optimizing the PaaS providerprofit. The profit optimization policy proposes a placement of applications onthe cheapest resources, taking into account the satisfaction of their SLAs. Theproposed policy is generic and may be applied on any application type with onlyone condition, which consists in cooperating with application type-specific entitiesproviding information about the performance and SLAs of the hosted applications.
• Application of the Optimization Model. To demonstrate the genericity of themodel, we applied it to rigid and elastic computational applications. Specifically,we defined corresponding SLA terms. Based on that, we proposed heuristics forproviding the information required by the generic profit optimization policy. Theidea behind this investigation is to show a concrete and complete illustration ofthe generic profit optimization policy.
• Meryn: an Open Cloud-Bursting PaaS. We propose an open cloud-bursting PaaSsystem, called Meryn, providing all the features required for implementing thegeneric profit optimization policy. To support the extensibility regarding applica-tion types, we use existing frameworks for managing the supported applicationtypes. For instance, the Oracle Grid Engine (OGE) framework is used for manag-ing batch applications and the Hadoop framework is used for managing MapRe-duce applications. Moreover, to facilitate the management of cloud bursting, webuilt Meryn on top of virtualized private resources similar to the virtual resourcesleased from public cloud providers.
1.4 Outline of the Thesis
The rest of this thesis is organized as follows. Chapter 2 presents background defi-nitions in the context of our work. Specifically, it gives an overview of the differentIT infrastructures and application models, and defines the service level agreement andcloud computing concepts. Chapter 3 presents the requirements to achieve the thesisobjectives, covers the state of the art and positions the contributions of this thesis. Themain covered axes are: economic optimization policies, cloud bursting mechanisms,and PaaS systems. Chapter 4 describes the first contribution of this thesis consisting ina generic model for optimizing the provider profit in an open cloud-bursting PaaS sys-tem environment. Chapter 5 investigates rigid and elastic computational applications inorder to enable a concrete applicability of our generic profit optimization model. Chap-ter 6 presents the design principles, architecture and implementation of Meryn, our opencloud-bursting PaaS system. Chapter 7 presents an evaluation of our approach througha set of simulations and experiments performed on the Grid’5000 testbed [40]. Chap-ter 8 concludes this thesis by summarizing our contributions and presenting some futurework directions.
18

Chapter 2
Background
Contents2.1 IT Infrastructures . . . . . . . . . . . . . . . . . . . . . . . . . . . . . . . . 18
2.1.1 Cluster . . . . . . . . . . . . . . . . . . . . . . . . . . . . . . . . . . 18
2.1.2 Grid . . . . . . . . . . . . . . . . . . . . . . . . . . . . . . . . . . . 19
2.1.3 Utility Computing . . . . . . . . . . . . . . . . . . . . . . . . . . . 19
2.2 Taxonomy of Application Models . . . . . . . . . . . . . . . . . . . . . . 20
2.2.1 Parallelism Model . . . . . . . . . . . . . . . . . . . . . . . . . . . 20
2.2.2 Resource Requirements . . . . . . . . . . . . . . . . . . . . . . . . 20
2.2.3 Resource Usage . . . . . . . . . . . . . . . . . . . . . . . . . . . . . 21
2.2.4 Lifetime . . . . . . . . . . . . . . . . . . . . . . . . . . . . . . . . . 21
2.2.5 Interactivity . . . . . . . . . . . . . . . . . . . . . . . . . . . . . . . 22
2.3 Service Level Agreement (SLA) . . . . . . . . . . . . . . . . . . . . . . . 22
2.3.1 Overview . . . . . . . . . . . . . . . . . . . . . . . . . . . . . . . . 22
2.3.2 SLA Specification . . . . . . . . . . . . . . . . . . . . . . . . . . . . 23
2.3.3 SLA metrics . . . . . . . . . . . . . . . . . . . . . . . . . . . . . . . 23
2.3.4 Price Formation and Billing Models . . . . . . . . . . . . . . . . . 23
2.3.5 Penalties . . . . . . . . . . . . . . . . . . . . . . . . . . . . . . . . . 24
2.3.6 SLA Lifecycle . . . . . . . . . . . . . . . . . . . . . . . . . . . . . . 24
2.4 Cloud Computing . . . . . . . . . . . . . . . . . . . . . . . . . . . . . . . 24
2.4.1 Overview . . . . . . . . . . . . . . . . . . . . . . . . . . . . . . . . 24
2.4.2 Service Models . . . . . . . . . . . . . . . . . . . . . . . . . . . . . 25
2.4.3 Deployment Models . . . . . . . . . . . . . . . . . . . . . . . . . . 28
2.4.4 Business Aspects . . . . . . . . . . . . . . . . . . . . . . . . . . . . 29
2.5 Summary . . . . . . . . . . . . . . . . . . . . . . . . . . . . . . . . . . . . 30
This chapter provides the background related to the contributions of this PhD thesis.First, we present existing IT infrastructures and a taxonomy of existing application
models. Then, we present the Service Level Agreement (SLA) concept. Finally, wepresent the cloud computing technology, its service and deployment models as well asits business aspects.
19

2.1. IT Infrastructures
2.1 IT Infrastructures
IT (Information Technology) infrastructures refer to systems composed of software andhardware to process and manage information automatically. IT infrastructures emergedover the last century, evolved very quickly, and revolutionized our society and our in-dustry. The development of IT infrastructures has gone through several steps and gaverise to the emergence of multiple software models. Software refers to programs writtenusing specific programming languages and hosted on specific IT infrastructures. Thereare mainly two classes of software: system and user software. System software is de-signed to operate and manage the IT infrastructure’s hardware and provide a platformfor running user software. User software, also called Applications, is designed to per-form specific tasks to help users. In this section we present a number of existing ITinfrastructures as well as their respective system software.
2.1.1 Cluster
A cluster is a set of homogeneous computers interconnected through a fast Local AreaNetwork (LAN)1. There are mainly two types of cluster’s system software: programmingframeworks and Single System Images (SSI). A programming framework, also called a clus-ter resource manager, provides control over the cluster’s compute resources to allocatethem to users jobs2. Programming frameworks are often configured in a master nodeand a set of slave nodes. The master node has a global view of the cluster. It is responsi-ble for scheduling the jobs on the slave nodes using specific scheduling algorithms suchas the well known first-fit and round-robin algorithms. The slave nodes are responsiblefor the execution of the jobs assigned to them, as illustrated in Figure 2.1. For runningapplications in such systems, the users have to connect to the master node, wrap theirapplications using a job template specific to the programming framework and submittheir jobs using the programming framework tools. Examples of well known program-ming frameworks include batch frameworks such as OAR [69], Torque [138], Oracle GridEngine (OGE) [89] and data-intensive frameworks such as Hadoop [151] and HPCC [29]for respectively batch and data-intensive applications (more details about applicationtypes are given in Section 2.2).
Slave nodes Master node
submit jobs schedule jobs
Users
execute jobs
Figure 2.1: Overview of a cluster managed using a programming framework
A single system image (SSI), also called a cluster operating system, hides the dis-tributed nature of the cluster and gives users the illusion of a single multiprocessor
1Local Area Network (LAN) is a communication system used to interconnect computers in a limitedgeographical area, such as a campus, a laboratory or a company.
2A job is a collection of one or more applications that run together.
20

Chapter 2. Background
Cluster Virtual multiprocessor machine Users multiprocessor
submit jobs
Figure 2.2: Overview of a cluster managed using a single system image
machine. This enables the use of the cluster in exactly the same way as the use of asingle computer, as seen in Figure 2.2. Usually SSIs are implemented as an extension ofstandard operating systems. In such systems, users may connect to any node of the clus-ter to have a global view of the available resources and run their applications. Examplesof SSI are Kerrighed [125], MOSIX [60] and OpenSSI [147].
2.1.2 Grid
A grid is a federation of geographically distributed heterogeneous computing resourcesinterconnected through a Wide Area Network (WAN)3. The computing resources maybe individual machines, clusters or any other PDA4 devices, belonging to several VirtualOrganizations (VOs). Virtual organizations may be a group of people or real organiza-tions with common goals. They share their resources for the purpose of providing accessto compute resources in the same way as electric grids. However, the access to resourcesis governed by specific sharing rules defined locally by each virtual organization. Usersmust join a VO to be able to use the grid resources. Examples of existing grids includeexperimental grids such as PlanetLab [62] and Grid’5000 [65], and compute grids suchas the European Grid Infrastructure (EGI) [30].
There are mainly two types of grid system software: grid middleware and grid operat-ing system. A grid middleware is a software layer between operating systems installedin the individual computers and the applications. It provides users with standardizedinterfaces for monitoring, reserving and using the grid resources for running their appli-cations. Some well known grid middleware are Globus [31], gLite [112] and DIET [55].A grid operating system hides the heterogeneity of the grid environment and providesusers with the same functionalities of a traditional operating system. Examples of gridoperating systems include XtreemOS [124], Legion [94], and GridOS [128].
2.1.3 Utility Computing
Utility computing is a computing business model which consists in providing comput-ing resources on-demand, as a measured service, in exchange of a payment accordingto the use of resources. This model is inspired from the conventional utilities such asphone services, electricity and gas. Basically, the entity that owns, operates, managesand provides the resources is called a provider and the entity that accesses and usesthe resources is called a customer. The provider makes the resources available to users
3Wide Area Network (WAN) is a communication network used to interconnect computers from verylarge geographic area that cannot be covered using a LAN.
4PDA (Personal Digital Assistant) is a handheld computing device such as smartphones.
21

2.2. Taxonomy of Application Models
through a network. The provided resources may be either computational hardware orsoftware applications. Utility computing may be applied in any computing environ-ment but the most known and used environment is cloud computing. We present thecloud computing technology in detail in Section 2.4.
2.2 Taxonomy of Application Models
An application is a computing software that consists of a set of tasks, designed to solvespecific problems from a specific activity domain. Nowadays, there are several softwareapplications for almost all life activity domains such as health, education, and science.Applications may be classified according to many parameters, such as the activity do-main of the problem to solve, used programming languages, supported operating sys-tems and infrastructures and so on. In this section we classify applications based on theirparallelism model, resource requirements, resource usage, lifetime and interactivity.
2.2.1 Parallelism Model
There are mainly three application parallelism models: sequential, parallel and distributed.A sequential application is a single process containing a set of instructions to run oneafter another in a successive fashion. The sequential applications may run on any ITinfrastructure type, even on a simple uni-processor and mono-task computer.
A parallel application consists of multiple processes or threads able to run simulta-neously where each process or thread has a set of instructions to run sequentially. Theparallel applications are designed to solve very large problems requiring capabilities ofmore than one CPU. Thereby, usually a separate CPU is assigned for each process orthread that composes the parallel application. Parallel applications may run on a mul-tiprocessor machine or on a cluster managed using an SSI system software. They mayalso run or uni-processor machines but in this case they will not run in parallel, theywill just have the illusion of parallelism.
A distributed application is a collection of multiple processes to run on multiplecomputers. The distributed applications are designed as independent processes; eachone solves a subproblem. Applications are designed to be distributed either to takeadvantage of available computation resources or because the distribution is necessary forsolving the concerned problem. For example utility computing providers may require adistributed software to manage users requests where one part of the software runs onthe users side for enabling them specifying their requests and preferences and the otherpart runs on the providers side for configuring and providing the required resources forthe users.
Parallel and distributed applications can also be classified as tightly-coupled or loosely-coupled applications according to their communication patterns. In a tightly-coupled ap-plication the processes have frequent communications and inversely in a loosely coupledapplication the communication between the processes is insignificant.
2.2.2 Resource Requirements
Based on their resource requirements, applications can be classified as static and dynamic.The static applications require a fixed amount of resources over their whole execution.
22

Chapter 2. Background
They can be subclassed as either rigid or moldable applications. The number of resourcesrequired for running a rigid application is decided at the development time. Therefore,rigid applications may only run on a specific configuration of resources. The number ofresources required for running a moldable application is decided at the submission time.Thus, moldable applications can run on a wide variety of resource configurations. Theflexibility on allocating resources to moldable applications may considerably improvethe utilization of resources and the performance of the applications [100]. Some mold-able applications may only run on a predefined set of specific resource configurationssuch as the NAS Parallel Benchmarks [59].
The resource requirements of dynamic applications may change during their exe-cutions. Basically, there are two types of dynamic applications: malleable and evolvingapplications. Malleable applications are able to adapt to changes in their resource al-location during their execution. Thus, the malleable applications may be shrinked orextended depending on the availability of resources. However, these applications havea minimum and maximum values of resource requirements. The application does notprogress if its allocated resources are less than the minimum value and does not benefitfrom the allocated resources that exceed the maximum value. Examples of malleableapplications include Bag of tasks [75] and MapReduce applications [77]. Evolving appli-cations are constrained by a resource requirement change during their execution. Theresource requirement change may be generated either internally because of an increasedor decreased complexity of the executed algorithms, or externally because of specificinteractions with external entities. Scientific workflows [63] are an example of evolvingapplications.
2.2.3 Resource Usage
The applications may be classified based on the main hardware resource used inten-sively. Namely, there are four main application classes according to the resource usageparameter: CPU-intensive, IO-intensive and data-intensive applications. A CPU-intensiveapplication uses a high percentage of CPU resources and may reach 100% of CPU(s)usage. Usually CPU-intensive applications are designed to be parallel or distributed.An IO-intensive application reads and/or writes data very frequently, possibly with bigsize, either from stored files or from IO devices. A data-intensive application processesa very large amount of data and may have different access patterns to it. MapReduceapplications are a well known example of data-intensive applications.
2.2.4 Lifetime
Software applications may be hosted in the infrastructures in two ways: permanently ortemporally. A permanent software application ends only if the underlying infrastructureis turned off or following a manual user intervention. The permanent applications arenot necessarily always actively using resources. Web applications are a good exampleof permanent applications. In contrast, a temporary software application runs during afinite duration that may be known in advance or not.
23

2.3. Service Level Agreement (SLA)
Provider Consumer
SLA
service
remuneration
enforcement of violation penalties
Figure 2.3: SLA overview
2.2.5 Interactivity
The applications may also be classified according to the degree of their interactivity withusers during their execution. The interactivity between applications and users may bein the form of a request to select an option or to give specific data. An application issaid to be interactive if it requires recurrent interactions with the user. In general, inter-active applications become temporally idle when an interaction is required. Examples ofinteractive applications include visualization applications. An application is said to bepassive or batch if it requires no interaction with users during its execution. The requiredinput data of a passive application is given at submission time and the possible outputdata is given at the end of the application execution. Generally, passive applicationsare not permanent and can be suspended and resumed later, or check-pointed or killedand restarted later. Examples of passive applications include a big number of scientificsimulations.
2.3 Service Level Agreement (SLA)
2.3.1 Overview
A Service Level Agreement (SLA) is a formal contract concerning a given service be-tween two parties: the service provider and the service consumer. The SLA explicitly de-fines the concerned service using measurable metrics such as the service availability andperformance. It also specifies the expectations and obligations of each party. A cloudprovider may also list in the SLAs a set of restrictions or limitations, and obligations thatcloud consumers must accept. If the customer or the provider violates the agreement,the SLA indicates how violation penalties will be enforced (see Figure 2.3). Thus, theSLA is used to guarantee the satisfaction of the service quality expected by the consumerand the deserved remuneration for the provider. SLAs started to be used in IT domainswith the advent of utility computing. Then, many system models have been proposedin the literature to support autonomic SLA management [106][67][152] which consists inmanaging and automating the entire SLA lifecycle using an SLA specification language.
24

Chapter 2. Background
2.3.2 SLA Specification
To ease the automation of SLA negotiation and management, the SLA should be pre-sented in a formalized way such that the concerned service may be adapted accord-ing to the agreed SLA terms. Several SLA specification languages have been proposedin the literature. The most popular and widely used ones are WSLA [119] and WS-Agreement [56]. Both of them provide support for the entire SLA lifecycle and relyon WSDL (Web Service Description Language) to describe the service functionalities.WSLA (Web Service Level Agreement) is a framework developed by IBM to specify andmonitor SLAs for web services. It provides a formal language based on XML to rep-resent SLAs for both the provider and the consumer. Based on the interpretation ofthe WSLA document the provider and the consumer configure their respective systems.The WSLA framework can measure, monitor and report to the two parties the values ofmultiple implemented SLA metrics. Moreover, it enables the creation and the implemen-tation of new SLA metrics. WS-Agreement (Web Service Agreement) is a language andprotocol defined by Open Grid Forum (OGF) for the creation, specification and man-agement of SLAs. The WS-Agreement language uses XML to formalize the agreementin a template. The template defines, among other things, the agreement parties and de-scribes the offered service. The WS-Agreement protocol is based on request response forthe interaction between the provider and the consumer. WS-Agreement does not definespecification for SLA metrics as WSLA but many research works have been proposed inorder to extend the WS-Agreement model such as [134], [131] and [126].
2.3.3 SLA metrics
The SLA metrics are measurable aspects, defining what services and guarantees thecloud provider will provide. The SLA metrics may be categorized as functional andnonfunctional. Functional properties cover aspects like the number of arguments andthe semantics of operations. Nonfunctional properties define the service capabilities androbustness, covering terms regarding the QoS, security, and remedies for performancefailures. The SLA metrics should be monitored and reported to both the provider andthe consumer for the assessment of the service’s ability to achieve the agreement.
2.3.4 Price Formation and Billing Models
The price formation model determines how to account the price of a service based ona set of parameters. According to [113] there are mainly three price formation models:cost-based, demand-driven and competition-oriented. The cost-based price formation modelestablishes the price using the provider cost for operating the service which may includeexpenses of the used resources and third party services. The demand-driven price for-mation model establishes the price based on the consumers demand of the service inthe current market. Finally the competition-oriented price formation model establishesthe price based on competitors prices, thus competitive providers propose equivalentservices with attractive prices to get a large market share.
The billing model determines how consumers pay for using a service. Serviceproviders apply mainly two billing models: pay-as-you-go and subscription. The pay-as-you-go billing model accounts the service price according to the actual consumer’susage of the service. The service usage is accounted using service-specific units. Well
25

2.4. Cloud Computing
known examples of services provided in a pay-you-go model include the electric energyand the telephony, where consumers usually pay a predefined price per respectivelyconsumed kWh or seconds of voice transfer. The subscription billing model gives con-sumers an unlimited access to the service or a maximum service usage value whiledemanding a periodical payment of a predefined price. For example, many mobiletelephony suppliers propose monthly subscriptions for an unlimited access to calls tomobiles in a same country. Usually, the subscription billing model is more advantageousfor the consumers than the pay-as-you-go billing model if the service is used more thana specific usage threshold and vice-versa.
2.3.5 Penalties
Penalties may be enforced against both providers and consumers if one of them doesnot fulfill the agreement. If it is the customer that does not satisfy the agreement, shemay for example be forced to pay additional fees or undergo a deterioration in servicequality. If it is the provider that fails in delivering the agreed service quality, it may beforced to refund the affected customers. The refund is usually in the form of servicecredit rather than a real monetary refund because the latter may seriously compromisethe provider profit.
2.3.6 SLA Lifecycle
The SLA lifecycle proposed in the literature [98][152] includes six phases: (1) definition,(2) discovery and negotiation, (3) establishment, (4) execution and monitoring, (5) termination,and (6) assessment and enforcement phases. In the first phase the provider develops theservice and defines its corresponding SLA terms which involve technical and legal as-pects. SLA terms include a minimum and/or maximum values of SLA metrics as wellas associated billing and penalty policies. In the second phase, the consumer discoversthe service provider and negotiates the SLA terms until a mutual agreement betweenthe two parties. The third phase consists in the establishment of the agreement and thedeployment of the service for the consumer. The fourth phase consists in the executionof the service and the monitoring of the values of each SLA metric over all the service’sexecution time. In the fifth phase, the SLA terminates following the completion of theservice or a violation of SLA terms from any party. In the sixth phase the monitoredvalues of SLA metrics are assessed and if any party violates the contract terms the cor-responding penalties are enforced. The sixth phase may operate in parallel with thefourth phase and the possible SLA violation penalties are enforced immediately. Oth-erwise it operates at the end of the fifth phase and the possible SLA violation penaltiesare enforced at the end of the service execution.
2.4 Cloud Computing
2.4.1 Overview
Several cloud computing definitions and features have been proposed in the literature[145][95][135][57]. Most definitions converge on describing the cloud computing as anew computing paradigm for providing on-demand software and hardware resources
26

Chapter 2. Background
Platform as a Service (PaaS)
Software as a Service (SaaS)
Infrastructure as a Service (IaaS)
Figure 2.4: Cloud service models
as services over a network (e.g., Internet) in a pay-as-you-go pricing model. The maincloud computing features are: elasticity, on-demand self-service, pay-as-you-go pricing model,availability, and multi-tenancy.
Elasticity. Clouds appear to customers as an infinite pool of computing resources(e.g., compute and storage capacity) that may be purchased at any quantity and at anytime. Thus, customers can easily scale up and down their resource provisioning to meetchanges in their applications and workloads requirements.
On-demand self-service. Customers can instantly provision computing resourceswithout requiring human interaction with the cloud provider. This feature is stronglyrelated to the elasticity feature but it implicitly requires autonomic resource managementsoftware to enable an on-time reaction to new resource provision requests as well aschanges in existing resource provisions.
Pay-as-you-go pricing model. Cloud services are measured using predefined units(e.g., resources consumption, QoS requirement) that depend on the type of the providedservice. Thereby, the cloud services are monitored, controlled and reported to both theprovider and customer in order to establish a billing according to the actual serviceconsumption.
Availability. Cloud services are almost constantly available over the networked andaccessible through standard network devices (e.g., laptops, servers, and PDAs).
Multi-tenancy. Cloud resources are pooled to be assigned to multiple customersin a multi-tenant model, where the exact location of customer’s data and/or code isunknown. This implies a high privacy issue in cloud systems.
2.4.2 Service Models
The cloud computing services are commonly classified in three fundamental deliverymodels [135][95][156]: Infrastructure as a Service (IaaS), Platform as a Service (Paas), andSoftware as a Service (SaaS). Each service model has its own specific properties. Figure 2.4visualizes the three cloud service models in a pyramid.
2.4.2.1 Infrastructure as a Service (IaaS)
Infrastructure as a Service (IaaS) is the base cloud service model in the pyramid. It deliv-ers fundamental compute resources (computing, storage, and network). The IaaS modelrelies on the virtualization technology in order to hide the complexity of the underling
27

2.4. Cloud Computing
physical resources and expose a flexible virtual execution environment to customers.The virtualization allows the creation of a pool of virtual computing, storage and net-work resources on top of physical resources using specific virtualization tools. Virtualcomputing resources, commonly called Virtual Machines (VMs), represent full comput-ers containing hardware components and running an operating system in the same wayas real computers [137]. Virtual machines are obtained by partitioning physical machinesusing a hypervisor [91] such as Xen [61], KVM [110], VMware Workstation [38], and Vir-tualBox [149]. Virtual storage resources are obtained through the pooling of multipledata pieces stored in multiple physical storage devices and appear to customers as asingle storage device (e.g., disk drive, folder, etc.) [150][132]. Examples of storage virtu-alization systems include Hitachi Virtual Storage Platform (VSP) [12], IBM SAN VolumeController (SVC) [23], and DataCore SANsymphony [33]. Virtual network resources con-sist in separate logical networks that have their own topology and IP addressing schemewhile sharing a common or multiple physical network infrastructures [70][74]. Exam-ples of network virtualization software include VMware NSX [43], IPOP [88], CISCOEasy Virtual Network (EVN) [47], and VIOLIN [102].
IaaS customers are able to build customized and elastic execution platforms on-demand from the provided IaaS resources in order to fit their requirements. The elas-ticity in the IaaS model may be either vertical or horizontal, where the vertical elastic-ity refers to the modification of virtual machines capacities and the horizontal elasticityrefers to the modification of the amount of virtual machines. The customers have controland administrative rights over operating systems installed in the rented virtual machinesand are able to install, configure and operate their own software (e.g., applications, li-braries, etc.). Moreover, they have the possibility to delete, save, stop, and restart theirown environments as required. For instance, if a consumer does not use continuouslyhis/her environment he/she may stop it during the no-usage period and restart it laterin order to limit her expenses. On the other hand, IaaS providers may migrate virtualmachines from one physical machine to another one for maintenance reasons or for con-solidating virtual machines during low demand periods in order to save energy and/orcost of their infrastructure.
Today, there is a growing number of commercial IaaS providers, the main importantindustry players are Amazon (EC2) [54], Rackspace [2], Microsoft (Windows Azure In-frastructure) [1], and Google (Compute Engine) [49]. Furthermore, several open sourceand commercial solutions for building and managing IaaS cloud services have emerged.Open source solutions include Nimbus [108], OpenNebula [123], OpenStack [5], Cloud-Stack [4], and Snooze [86] and commercial solutions include Flexiant [3], Microsoft pri-vate cloud [6], Red Hat CloudForms [7], IBM SmartCloud Orchestrator [8], and HPCloudSystem [9].
2.4.2.2 Platform as a Service (PaaS)
Platform as a Service (PaaS) is the middle cloud service model in the pyramid. It deliv-ers a complete runtime environment for building, deploying and hosting software appli-cations typically including operating systems, software libraries, storage and databaseservices. The PaaS model relies on computational resources in the form of IaaS re-sources or operating system containers. On one hand, relying on virtual resources fromIaaS clouds brings a high degree of flexibility and multi-tenancy to the PaaS, but at the
28

Chapter 2. Background
cost of being dependent on IaaS and virtualization layers. On the other hand, relyingon operating system containers enables a better utilization of resources, but at the costof being constrained to host only applications running on the same operating system.Therefore, the choice of computational resources on which the PaaS relies depends onthe PaaS’s goals and requirements.
PaaS customers deploy their applications on the PaaS environment without the com-plexity of managing the underlying software and hardware required by their applica-tions. PaaS environments are usually designed to support the execution of specific ap-plication types (e.g., web services) developed using specific aprogram languages (e.g.,Python, Java) and libraries (e.g., Apache libraries). Moreover, because of a lack of stan-dardized interfaces, each PaaS provider exposes its own API to enable customers to useits services. Thus, customers have to carefully choose their providers according to thesupported programming languages and the provided tools for building, running andmanaging their applications because they are often subject to vendor lock-in.
Most of prominent IaaS providers propose also PaaS services and run the hosted ap-plications on their infrastructures. For instance, Amazon provides Elastic Beanstalk [10]for web-applications developed in familiar languages, such as Java, Python, Ruby, etc.and Elastic MapReduce [11] for data-intensive applications. Microsoft provides Win-dows Azure Cloud Services [13] for multi-tier web-applications. Google provides AppEngine [14] for web-applications developed in Java, Python, Go, or PHP. Other com-mercial providers provide only PaaS services and host applications either on resourcesfrom other IaaS providers or on their own infrastructures. For instance, Heroku [15]hosts applications on resources from Amazon and Salesforce’s platform (Force.com) [16]hosts applications on the Salesforce’s infrastructure. Similar to IaaS clouds there areseveral open source and commercial solutions for building and managing PaaS cloudservices. Open source solutions include ConPaaS [130], AppScale [17], Cloudify [18],and WSO2 Stratos [20]. Commercial solutions, also known as cloud managers, includeRightScale [21], Scalr [22], and Dell Cloud Manager [24]. In addition, some companiesprovide PaaS solutions as well as hosted instances of their solutions, such as RedHatOpenShift [25] and VMware Cloud Foundry [19].
2.4.2.3 Software as a Service (SaaS)
Software as a Service (SaaS) is the highest cloud service model in the pyramid. It de-livers specific software applications with specific capabilities accessible through a clientinterface such as a web browser (e.g., business functions, games, web-mails, etc.). Theprovided applications are hosted on the provider’s infrastructure or on another cloudinfrastructure or platform. SaaS customers directly access and use the software appli-cations without having to acquire the software licenses or to configure the underlyinginfrastructure and hosting environment. However, customers have only a limited con-trol on applications configuration where providers have full control and are in chargeof installing, operating, updating and managing the applications. Examples of SaaSproviders include Salesforce CRM [27], iCloud [28] and Google Apps [26] such as Gmail,Gtalk, and Google Agenda.
29

2.4. Cloud Computing
2.4.3 Deployment Models
Cloud computing services are also classified according to their deployment models. Theare mainly three deployment models: public cloud, private cloud, and multi-cloud. In thefollowing we present each deployment model and describe some existing instances ofthe multi-cloud deployment model.
2.4.3.1 Public Cloud
A public cloud is a commercial cloud owned by a business organization, known as publiccloud provider, and available to the general public, individuals or organizations. Publiccloud providers implement a payment method (e.g., automatic bank card debit) to billcustomers their resource and service usage. Thus, customers do not invest in hardwareequipments and pay only for what they really use.
2.4.3.2 Private Cloud
A private cloud is a cloud owned, managed and used by a single organization (e.g.,company, academic institution). It is deployed on the organization’s datacenter using aninternal, open source or commercial solution and controlled by the organization’s staff.The exposed cloud services and functionalities match the specific requirements of theorganization. Usually, private cloud customers do not pay for using the services butsome usage rules may be applied such as quotas and charters.
2.4.3.3 Multi-Cloud
A multi-cloud deployment model refers to the use of two or more cloud services (eitherprivate or public), where each cloud service is provided by a different entity. There aremany instances of the multi-cloud deployment model. In the following we describe themost common of them.
• Community Cloud. A community cloud is an aggregation of multiple private orpublic clouds provided and shared by several organizations with common con-cerns. Community clouds share some similarities with grids in terms of resourcesharing between multiple organizations. The community cloud is managed by thecommunity or a third party and is used exclusively by the community members,following specific terms of use. For example a community cloud may be designedfor academic organizations working on a joint project.
• Hybrid Cloud. A hybrid cloud is a cloud composed of at least one private cloudand one public cloud, which are bound together to form a unique cloud. Thisdeployment model offers more flexibility and takes advantage at the same timeof the private cloud in terms of control and security of sensitive services, and ofthe public cloud in terms of on-demand expansion during high load periods. Ahybrid cloud may be built for either private or commercial purposes.
• Cloud Bursting. The cloud bursting deployment model can be classified as aninstance of the hybrid cloud deployment model. Specifically, it is a deploymentmodel based on private resources, in the form of cluster, grid or private cloud,
30

Chapter 2. Background
that may burst into public cloud resources on-demand, mainly to address the lackof resources when the demand for computing increases. The cloud bursting ap-proach is an appealing intermediate solution between static provisioning of localcomputing resources and entirely outsourcing applications on public clouds.
• Cloud Federation. A cloud federation is the union of several cloud services, pri-vate or public, to form a single cloud. The cloud federation provides interoperabil-ity among many cloud providers and is responsible for mapping clients requestson the best cloud provider according to the requirements and the type of the re-quest.
• Cloud Broker. A cloud broker is a third party entity that acts as an intermediarybetween cloud computing customers and cloud computing providers. The role ofa cloud broker is either to assist customers to select the cloud computing providerbased on their requirements, or to facilitate the distribution of customers requestsbetween different cloud service providers.
2.4.4 Business Aspects
Cloud providers spend a lot of money to provide and maintain their services and inreturn they get payments from consumers using their services. In this document we callprovider expenses "costs" and consumer payments "revenues". To provide a global viewof cloud providers business models we present in the following a non-exhaustive listof both cloud provider costs and revenues. Then, we briefly present characteristics andlimitations of existing cloud SLAs of the main commercial cloud providers.
2.4.4.1 Costs
The cost of cloud computing services comprises multiple factors, already identified inmany research works [57][78][107][140][143][127]. We classify the cloud cost factors infive categories: acquisition, upgrading, electricity consumption, support and maintenance andthird-party services.
Acquisition. This category refers to the acquisition of software licenses and hard-ware resources. Software licenses cover basic system software, internal cloud systemmanagement software and application software used by final consumers. Hardwareresources include computing hardware (e.g., servers, storage disks), needed networkdevices (e.g., routers, switches), plus the required cooling infrastructure.
Upgrading. The economic lifetime of the acquired software licenses and hardwareresources is limited. Moreover, software updates and hardware improvements are regu-larly released. Thus, it is necessary for cloud providers to upgrade regularly their ownedsoftware licenses and computing hardware resources.
Electricity consumption. This category considers the consumed electricity in theentire datacenter including electric devices (e.g., computing hardware and cooling in-frastructure) and premises lighting. The cost of the electricity consumption relies onthe price of the electricity which depends on the datacenter location. The electricityconsumption of computing resources varies according to their utilization. Usually, idleresources consume less electricity than heavily utilized ones.
31
2.5. Summary
Support and maintenance. This category comprises salaries of employees workingon administering and managing the cloud system, maintaining software and hardwareand providing support to customers.
Third-party services. This category includes expenses for services obtained fromthird party providers, such as internet network connectivity, premises renting and anyadditional utilities.
2.4.4.2 Revenues
Cloud providers revenues are determined based on three aspects: services prices, ser-vices utilization, and the providers ability to satisfy the promised service qualities.Service prices are determined using the used price formation model and the usedbilling model. Usually, with the subscription pricing model long contract periods im-ply cheaper service prices, which is profitable for both service providers and con-sumers [136]. And with the pay-as-you-go pricing model services have always sameprices per time unit, but the payment time unit varies from one provider to another one.Initially all providers were charging the resource consumption of their consumers perhour but recently some providers started to charge their customer’s resource consump-tion per minute, such as Google App Engine and Windows Azure Cloud Services.
Cloud customers pay, directly or indirectly, for the used computing resources, forproviding them with services as well as for the provided services quality level. Thecomputing resources include computing nodes, network bandwidth and storage. Cus-tomers may also pay for additional, often optional, services to improve and facilitatetheir applications execution and management, such as resource utilization monitoringand load balancing tools [116].
2.4.4.3 SLA
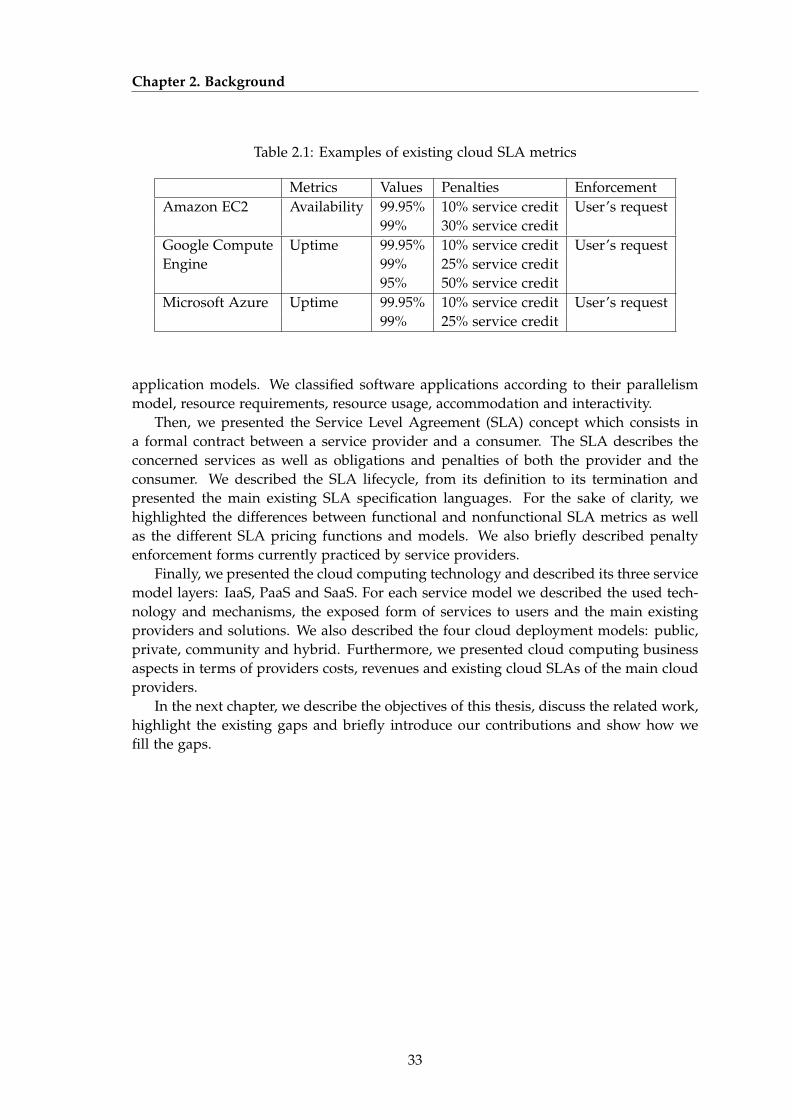
Cloud providers propose several services with different qualities to customers and alsopropose separate SLAs for each service. However, current cloud computing offeringsprovide a limited SLA penalty management support. Most of providers, including bigplayers, focus on services availability and uptime. Table 7.1 provides examples of exist-ing cloud SLA metrics practiced by respectively Amazon EC2, Google Compute Engineand Microsoft Azure. If the providers fail to ensure the promised service availability,they propose to credit the user with a percentage of the bill for the eligible credit period.However, their mechanisms are not automatic. The user should provide logs that docu-ment the errors and send a request through an Email or the customer contact support.Moreover, to benefit from SLA guarantees some providers impose specific conditions.For instance, to benefit from a minimum uptime of 99.9% in Windows Azure CloudServices requires to have at least two compute node instances.
2.5 Summary
In this chapter we presented the background of this thesis. We started with a brief de-scription of existing IT infrastructures and their respective system software. We also in-troduced the utility computing paradigm and gave a taxonomy of the different software
32
Chapter 2. Background
Table 2.1: Examples of existing cloud SLA metrics
Metrics Values Penalties EnforcementAmazon EC2 Availability 99.95% 10% service credit User’s request
99% 30% service creditGoogle Compute Uptime 99.95% 10% service credit User’s requestEngine 99% 25% service credit
95% 50% service creditMicrosoft Azure Uptime 99.95% 10% service credit User’s request
99% 25% service credit
application models. We classified software applications according to their parallelismmodel, resource requirements, resource usage, accommodation and interactivity.
Then, we presented the Service Level Agreement (SLA) concept which consists ina formal contract between a service provider and a consumer. The SLA describes theconcerned services as well as obligations and penalties of both the provider and theconsumer. We described the SLA lifecycle, from its definition to its termination andpresented the main existing SLA specification languages. For the sake of clarity, wehighlighted the differences between functional and nonfunctional SLA metrics as wellas the different SLA pricing functions and models. We also briefly described penaltyenforcement forms currently practiced by service providers.
Finally, we presented the cloud computing technology and described its three servicemodel layers: IaaS, PaaS and SaaS. For each service model we described the used tech-nology and mechanisms, the exposed form of services to users and the main existingproviders and solutions. We also described the four cloud deployment models: public,private, community and hybrid. Furthermore, we presented cloud computing businessaspects in terms of providers costs, revenues and existing cloud SLAs of the main cloudproviders.
In the next chapter, we describe the objectives of this thesis, discuss the related work,highlight the existing gaps and briefly introduce our contributions and show how wefill the gaps.
33

2.5. Summary
34

Chapter 3
SLA-Based Profit Optimization inCloud Bursting PaaS
Contents3.1 Thesis Objective . . . . . . . . . . . . . . . . . . . . . . . . . . . . . . . . 34
3.2 Platform as a Service (PaaS) . . . . . . . . . . . . . . . . . . . . . . . . . 34
3.2.1 Commercial PaaS . . . . . . . . . . . . . . . . . . . . . . . . . . . . 35
3.2.2 Open Source PaaS . . . . . . . . . . . . . . . . . . . . . . . . . . . 41
3.2.3 Research PaaS . . . . . . . . . . . . . . . . . . . . . . . . . . . . . . 45
3.3 Cloud Bursting . . . . . . . . . . . . . . . . . . . . . . . . . . . . . . . . . 49
3.3.1 Based on User Constraints . . . . . . . . . . . . . . . . . . . . . . 49
3.3.2 Based on Economic Criteria . . . . . . . . . . . . . . . . . . . . . . 50
3.3.3 Targeting Specific Application Types . . . . . . . . . . . . . . . . 51
3.4 Economic Optimizations . . . . . . . . . . . . . . . . . . . . . . . . . . . 52
3.4.1 Targeting Specific Application Types . . . . . . . . . . . . . . . . 52
3.4.2 Targeting Specific Infrastructures . . . . . . . . . . . . . . . . . . . 54
3.4.3 Focusing on the Optimization of Energy Costs . . . . . . . . . . . 55
3.5 Gaps . . . . . . . . . . . . . . . . . . . . . . . . . . . . . . . . . . . . . . . 56
3.6 Summary . . . . . . . . . . . . . . . . . . . . . . . . . . . . . . . . . . . . 56
The objective of this PhD thesis is to provide a profit-optimization solution for SLA-enabled, cloud-bursting, PaaS systems. In this chapter, we specify the main required
features to achieve this objective and review the most recent proposed approaches inthree related fields: Platform as a Service (PaaS) systems, cloud-bursting environments,and economic optimization policies. We highlight the limitations of the main relatedwork that prevent achieving the defined objectives. Finally, we summarize this chapter.
35

3.1. Thesis Objective
3.1 Thesis Objective
The main objective of this thesis is to provide a profit-optimization solution for SLA-enabled, cloud-bursting, PaaS systems. To achieve this objective, the solution mustsupport the following two features: a PaaS hosting environment and a profit-makingbusiness model.
• Profit-Making Business Model. The required profit-efficient business model shouldtake into account three main properties.
1. Generic. It should be generic and independent from specific application types.
2. Support for SLA constraints. It should take into account SLA constraints andthe payment of penalties if the QoS promised to applications is not satisfied.
3. Applicability to PaaS environments. It should be applicable on a cloud-burstingPaaS environment.
• PaaS Hosting Environment. The required PaaS hosting environment should pro-vide a number of properties to enable the implementation of a profit-making busi-ness model for PaaS providers. In the following we identify two properties.
1. Open. An open PaaS hosting environment should be easily extensible to hosta large variety of application types. This is necessary in order to attract usershaving different requirements, thus increasing providers’ turnovers.
2. Cloud bursting. The cloud bursting feature is required in a PaaS hosting envi-ronment in order to avoid rejecting clients requests in peak periods. Moreover,this provides several options to the PaaS provider for selecting the resourcesthat host applications.
Based on these requirements we review in the next sections three main fields: PaaSsystems, cloud bursting environments, and economic optimization policies.
3.2 Platform as a Service (PaaS)
Nowadays the number of emerging Platform as a Service (PaaS) cloud systems is in-creasingly growing. Such systems aim at providing users with complete hosting envi-ronments to deploy and manage their applications while shielding them from managingthe underlying resources. We classify the PaaS solutions in three categories: commer-cial, open source and research. In this section, we review some existing PaaS solutionsfrom each category according to several characteristics: resources, services, applications,languages, architectures, billing and SLA. The resources characteristic represents the un-derlying infrastructure or computing nodes that may be used by the PaaS. The servicecharacteristics describe the provided features for executing applications. The applicationscharacteristic determines the application types supported by the considered PaaS. Thelanguages characteristic represents the program languages supported in the PaaS. Thearchitecture characteristic describes how the underlying resources are partitioned to beused for running an application. The billing characteristic shows the used pricing modelwhich is often pay-as-you-go or subscription model. The SLA characteristic describesthe promised service quality levels if any.
36

Chapter 3. SLA-Based Profit Optimization in Cloud Bursting PaaS
3.2.1 Commercial PaaS
In this section, we review the main current commercial PaaS solutions and summarizethem in Table 3.1.
Google App Engine. Google App Engine (GAE) [14] is a PaaS designed and pro-vided by Google for building and hosting distributed web applications. The supportedapplications may be interactive, modeled on processing operations in a task queue, orcombining the two. GAE relies on the Google infrastructure [49], provides an automaticscalability for applications and supports four programming languages Java, Python,PHP and Go and three options for storing data: App Engine Datastore, Google CloudSQL and Google Cloud Storage. GAE provides an App Engine software developmentkits (SDKs) for each supported language to emulate all of the App Engine services onusers’ local computers. To host applications, users create the corresponding code andconfiguration files and upload them to the App Engine. The execution of each App En-gine application is charged according to its resources and services usage. It is possibleto specify a maximum daily budget for each application to better control expenses. TheGAE’s SLA consists in providing to customers a monthly service’s uptime percentage atleast 99.95%. If Google does not meet the SLA, customers will be eligible to receive aservice credit of 10%, 25%, or 50% depending on if the monthly service uptime is respec-tively less than 99.95%, 99% or 95%. However, this compensation is not automaticallyassigned to customers. They are responsible for keeping logs to request and justify theirclaim. Further, the service credit is applied to future service use within only 60 daysafter the request.
Windows Azure Cloud Services. Windows Azure Cloud Services (Azure) [1] isa PaaS designed and provided by Microsoft for building and hosting multi-tier webapplications, also called cloud services. The cloud services are hosted on top of the Win-dows Azure IaaS resources where Windows Azure handles the resources provisioningand load balancing while enabling users to configure their applications to automaticallyscale up or down and match current demands. A cloud service is defined in two roles:a web role and a worker role. The web role provides a dedicated Internet InformationServices (IIS) server used for handling web-based requests and hosting web applica-tions front-end. The worker role hosts the long-running or perpetual tasks of the webapplications that are independent of user interaction or input. The creation of a cloudservice requires specific packages created using the Windows Azure SDKs or VisualStudio. There are six supported programming languages: .NET, Node.js, PHP, Python,Java, and Ruby and three types of storage services: SQL Database, Tables or Blobs. It ispossible to manage hosted applications either through the Windows Azure dashboardor through a command line interface. The Azure’s SLA guarantees a monthly externalconnectivity to the Internet facing roles at least 99.95% of the time, with the conditionof deploying at least two or more web role instances. The monthly connectivity uptimepercentage is calculated as the total number of maximum connectivity minutes less con-nectivity downtime divided by maximum connectivity minutes for a giving month. Ifthe SLA guarantee is not met Microsoft undertakes to assign to customers 10% or 25% ofservice credit depending if the monthly connectivity uptime percentage is respectivelyless than 99.95% or 99%. To benefit from this compensation, customers have to contactthe Customer Support and provide reasonable details regarding the claim. The claimshould be submitted by the end of the billing month where the incident occurred.
37

3.2. Platform as a Service (PaaS)
Amazon Web Services. Amazon Web Services (AWS) provides two PaaS systems:Elastic Beanstalk [10] and Elastic MapReduce (Amazon EMR) [11]. Elastic Beanstalk isdesigned for deploying and hosting web applications. It enables the load balancing,automatic scaling and the management of applications in the AWS cloud. Moreover,it gives users full control over the AWS resources powering their applications. For in-stance, customers may specify the number and the type of virtual machine instancesand decide to replicate the application on multiple geographic zones. AWS Beanstalksupports six programming languages: Java, PHP, Python, Node.js, Ruby and .NET anduses Amazon S3 for the data storage. Beanstalk’s clients are charged based on the usedresources to store and run their applications without any additional charge for the Elas-tic Beanstalk. Elastic MapReduce (Amazon EMR) [11] is designed for processing data-intensive tasks, specifically MapReduce applications. Amazon EMR utilizes a hostedHadoop framework [151] on the Amazon infrastructure using Amazon EC2, AmazonS3 and Amazon SimpleDB services and supports seven programming languages: Java,Perl, Python, Ruby, C++, PHP and R. To process their data, customers create a resizablecluster and launch it without the need to worry about the cluster setup and Hadoopconfiguration. As opposed to Beanstalk, customers using EMR pay an extra charge inaddition to normal Amazon EC2 and Amazon S3 pricing. Amazon provides no SLAfor its PaaS services but applies the SLAs of the IaaS services composing them. Forinstance, the Amazon EC2’s SLA consists in making the EC2 resources available to ex-ternal connectivity at least 99.95% per month. Otherwise, affected clients receive 10% or30% service credit of the billing of the unavailability period depending if the availabilitypercentage is respectively less than 99.95% or 99%. To receive the service credit, cus-tomers must submit a claim to the AWS support center by the end of the second billingcycle after which the incident occurred.
Force.com. Force.com [16] is a PaaS, provided by Salesforce, for creating and de-ploying business web applications on the Salesforce’s infrastructure. It uses a multi-tenant architecture where all users share the same infrastructure which allows a loweroperational cost. The used application development model is metadata-driven wheredevelopers build applications functionalities with tools provided by the platform. Thishelps developers becoming more productive compared to the hard-coded developmentmodel. In addition, Force.com provides three APIs to create a more customized appli-cations behaviors: SOAP, REST and Bulk. These APIs may be called from a wide varietyof programming languages that support web services, such as Java, PHP, C#, or .NET.The use of Force.com requires an annual contract where users pay monthly a predefinedinvoice depending on the application characteristics and capabilities. To the best of ourknowledge Force.com does not provide a compensation if something goes wrong
Heroku. Heroku [15] is a PaaS for web applications, initially founded by a num-ber of engineers then acquired by the Salesforce company. Heroku is designed basedon isolated and virtualized Unix containers, called dynos, that provide the runtime en-vironment required for running applications. Heroku utilizes a process-based execu-tion model for running the applications. It separately and dynamically assigns dynosto the hosted applications and uses a dyno manager that provides mechanisms anal-ogous to ones provided by traditional OS process managers. To build and run anapplication, Heroku’s customers should provide the corresponding source code anddependency files written in one of the five supported programming languages: Ruby,Node.js, Python, Java Clojure and Scala. Based on the provided files, Heroku generates
38

Chapter 3. SLA-Based Profit Optimization in Cloud Bursting PaaS
a runnable ready for execution. Heroku calculates billing based on dynos and databaseusage per application. Heroku provides four levels of the database uptime expectationper month: hobby, standard, premium and enterprise. The database downtime toleranceis up to 4 hours for the hobby tier, 1 hour for the standard tier and 15 minutes for thepremium and enterprise tiers. However, any measure of compensation is specified ifHeroku fails to achieve the promised database uptime.
Engine Yard. Engine Yard [32] is a PaaS designed for building, deploying and man-aging web-applications written in one of the three supported programming languages:Ruby on Rails, PHP and Node.js. It relies on the Amazon cloud infrastructure whereit configures and manages multiple software components depending on applicationsparticular needs. Engine Yard is responsible of VMs configuration and imaging, auto-matic scaling, administering databases and load balancing and performing backups. Inaddition, it enables customers to have control over VM instances. Engine Yard chargescustomers based on resource usage of their applications and promises, in its SLA, asystem availability of 99.9% for a month. Otherwise, customers shall be entitled to aservice credit equivalent to the amount of unscheduled service downtime in excess of0.1%, divided by the amount of scheduled service uptime for that month, and multipliedby the total recurring fee for that month for the affected services payable by customer.However, the maximum cumulative credit in a month is 50% of the total recurring feefor that month for the affected services.
RightScale. RightScale [21] is a cloud management platform that provides abstrac-tion for managing a set of cloud infrastructures on behalf customers. It enables in-teroperability among the supported public clouds: Amazon AWS [54], Datapipe [37],Google Compute Engine (GCE) [49], HP Cloud [9], Rackspace [2] and Windows Azure(WA) [1], and private clouds: CloudStack [4] and OpenStack [5]. It enables customersto easily run and manage their applications and development environments while pro-viding them freedom to choose or mix vendors and technologies. RightScale providesautomation techniques and enables customers to make their operations scalable whilegiving them visibility and control over the used IaaS resources. It delivers the necessarytools to create runtime environments for HPC (High Performance Computing) tasks,big data analytics, web, gaming and mobile applications. RightScale supports a rangeof languages and frameworks including Java, .NET, PHP, Python Django, and Ruby onRails. For the pricing, RightScale proposes a range of customized subscription contractswhere some services are charged according to the usage. No compensation rules arespecified in the RightScale’s website if the services are not correctly provided.
CloudBees. CloudBees [34] is a PaaS for building, hosting and managing web appli-cations on the cloud. The CloudBees PaaS is hosted on the Amazon cloud infrastructure.It configures, scales (manually or automatically) and assigns the Amazon resources tocustomers’ applications. CloudBees supports a set of well known tools for applica-tions development such as Eclipse, and also proposes its own SKD. The main supportedprogramming language in CloudBees is Java, but there are also other languages suchas Node.js, PHP and JavaScript. CloudBees proposes several pricing models. Someservices are charged based on subscriptions such as databases and applications devel-opment. Other services are made available on a pay-as-you-go basis. For example,the application execution is charged according to the dedicated VM instances or theconsumed app-cells, where an app-cell is the basic unit for running an application onCloudBees and is more finely grained than the Amazon instance types. The users pay-
39

3.2. Platform as a Service (PaaS)
ment also depends on the a committed level of response and problem resolution timethat varies from two days to four hours. No compensation measures are specified if theresponse time is longer than expected.
AppFog. AppFog [36] is a PaaS for web applications built on CloudFoundry, theopen source PaaS of VMware described in section 3.2.2. AppFog provides a multi-clouddeployment and scalability options. It may run on Amazon, HP, Microsoft Azure andRackspace clouds as well as on a private cloud. AppFog supports many web applica-tion runtimes: PHP, Node.js, Ruby, Python, Java, and .NET and provides a number ofdatabase services. To create and manage applications, AppFrog provides a graphicaluser interface and command line tools. AppFog uses memory as the basis for establish-ing different service levels and the corresponding subscription contracts. To the best ofour knowledge AppFog provides no compensation if something goes wrong.
dotCloud. dotCloud [35] is a PaaS for deploying, managing and scaling web applica-tions where an application is considered as a collection of one or more services workingtogether. Each service includes specific support for a fixed program or data storage lan-guage. dotCloud runs on the Amazon EC2 resources where it uses a container system,called Docker, for allocating resources to the hosted applications. Docker [45] is an opensource engine based on the Linux container runtime to automate applications deploy-ment and execution. dotCloud is responsible for automatically configuring Docker onEC2 instances and applying scaling strategies specific to each application. dotCloudprovides a Command Line Interface (CLI) to be installed on customers computers fordeploying and managing applications. The supported programming languages on dot-Cloud are: Java, Perl, PHP, Nodes.js, Python and Ruby. The price of applications hostedon dotCloud is based on the total allocated memory per hour. dotCloud provides twoSLA support levels: expedited and live. The promised applications response time isless than 30 minutes for the expedited level and less than one hour for the live level.However, no compensation is considered if the SLA is not met.
We observe that most of commercial PaaS solutions have mainly three limitations: (1)relying on specific IaaS providers, (2) focusing only on web applications and (3) having avery limited support of SLA. Moreover, all of the reviewed commercial solutions chargetheir users according to their resources consumption rather than service quality.
40

Chapter 3. SLA-Based Profit Optimization in Cloud Bursting PaaS
Tabl
e3.
1:Su
mm
ary
ofco
mm
erci
aPa
aSso
luti
ons
PaaS
Res
ourc
esSe
rvic
esA
pplic
atio
nsLa
ngua
ges
Arc
hite
ctur
eBi
lling
SLA
GA
E[1
4]G
oogl
eBu
ildin
g,ho
stin
g,W
ebJa
va,P
HP,
Unk
now
nPa
y-as
-you
-go
Mon
thly
upti
me
infr
astr
uctu
reda
tast
orag
e,au
toPy
thon
,Go
perc
enta
gesc
alin
g≥
99.9
5%A
zure
[1]
Win
dow
sBu
ildin
g,ho
stin
g,M
ulti
-tie
r.N
ET,R
uby,
Ded
icat
edPa
y-as
-you
-go,
Mon
thly
conn
e-A
zure
load
bala
ncin
g,au
tow
ebPH
P,Py
thon
,V
Ms
per
app
subs
crip
tion
ctiv
ity
upti
me
infr
astr
uctu
resc
alin
g,da
tast
orag
eJa
va,N
ode.
js≥
99.9
5%A
WS
Elas
tic
Am
azon
Hos
ting
,loa
dba
lan-
Web
Java
,Nod
e.js
Ded
icat
ed
Pay-
as-y
ou-g
oIa
aSre
sour
ces
Bean
stal
kIn
fras
truc
ture
cing
,aut
osc
alin
g,Py
thon
,PH
PV
Ms
per
app
avai
labi
lity
[10]
data
stor
age
Rub
y,.N
ET
≥99
.95%
Am
azon
Am
azon
Hos
ting
,sca
ling,
Map
Red
uce
Java
,Per
l,R
,H
adoo
pEM
R[1
1]In
fras
truc
ture
data
stor
age
Pyth
on,P
HP,
clus
ter
[151
]C
++,R
uby
Forc
e.co
mSa
lesf
orce
Build
ing,
host
ing,
Web
Met
adat
aM
ulti
-ten
ant
Subs
crip
tion
No
[16]
infr
astr
uctu
reda
tast
orag
eA
PIs:
Bulk
,co
mpe
nsat
ion
RES
T,SO
AP
Her
oku
Am
azon
Build
ing,
host
ing,
Web
Rub
y,Py
thon
,D
edic
ated
Pay-
as-y
ou-g
oD
ata
base
dow
n-[1
5]in
fras
truc
ture
auto
scal
ing,
data
Nod
e.js
,Jav
a,dy
nos:
Uni
xti
me≤
4hou
rs-
stor
age
Clo
jure
,Sca
laco
ntai
ners
15m
inut
esEn
gine
Am
azon
Build
ing,
host
ing,
Web
Rub
yon
Rai
ls,
Ded
icat
edPa
y-as
-you
-go
Mon
thly
syst
emYa
rd[3
2]in
fras
truc
ture
auto
scal
ing,
load
ba-
PHP,
Nod
e.js
VM
spe
rap
pav
aila
bilit
yla
ncin
g,da
tast
orag
e≥
99.9
%R
ight
Scal
eA
WS,
Dat
apip
e,Bu
ildin
g,ho
stin
g,H
PC,w
eb,
Java
,Pyt
hon,
Ded
icat
edPa
yas
you
go,
Not
men
tion
ed[2
1]G
CE,
Ope
nSta
ck,
auto
scal
ing,
mob
ile,g
a-R
uby,
.NET
,V
Ms
per
app
subs
crip
tion
Rac
kspa
ce,W
A,
data
stor
age,
mes
,big
da-
PHP
41

3.2. Platform as a Service (PaaS)H
P,C
loud
Stac
k,ta
anal
ytic
sC
loud
Bees
Am
azon
Build
ing,
host
ing,
Web
Java
,Nod
e.js
,D
edic
ated
Pay
asyo
ugo
,R
espo
nse
tim
e<
[34]
infr
astr
uctu
resc
alin
g,da
taJa
vaSc
ript
,PH
PV
Ms
orun
its
subs
crip
tion
2da
ys-
4ho
urs
stor
age
(app
-cel
ls)
App
Fog
Am
azon
,Azu
reH
osti
ng,s
calin
g,W
ebPH
P,N
ode.
jsC
loud
Subs
crip
tion
No
[36]
HP,
Rac
kspa
ceda
tast
orag
eR
uby,
Pyth
onFo
undr
yco
mpe
nsat
ion
priv
ate
clou
dJa
va,.
NET
dotC
loud
Am
azon
Build
ing,
host
ing,
Web
Java
,Per
lD
edic
ated
Pay
asyo
ugo
Res
pons
e<
30[3
5]in
fras
truc
ture
load
bala
ncin
g,PH
P,N
ode.
jsco
ntai
ners
min
utes
-1
hour
scal
ing,
data
stor
ePy
thon
,Rub
y(D
ocke
r)
42

Chapter 3. SLA-Based Profit Optimization in Cloud Bursting PaaS
3.2.2 Open Source PaaS
In this section, we review the main well-known open source PaaS solutions and summa-rize them in Table 3.2.
Cloud Foundry. Cloud Foundry [19] is an industry open source PaaS developedby VMware for deploying and running web applications written in Java, Groovy, Scala,Ruby, PHP, Python or Node.js, using the Spring, Grails, Lift, or Play frameworks. CloudFoundry provides different services for storing data and enables an horizontal scalabil-ity of the services required by applications. Cloud foundry may be deployed on AmazonAWS, WMware vSphere, vCloud Director or OpenStack. The Cloud Foundry architec-ture uses Linux containers in the virtual machines obtained from an IaaS cloud in orderto create isolated environments. These containers can be limited in terms of CPU usage,memory usage, disk usage, and network access. Each container is managed and con-trolled using a component called Warden container running in the same virtual machine.Droplet Execution Agent (DEA) components are also hosted on the virtual machines formanaging Warden containers and assigning applications to them. The DEA managesthe entire lifecycle of all its applications and periodically broadcasts the applicationsstate to a Health Manager. The Health Manager is responsible for reconciling appli-cations’ current state (e.g. running, stopped, crashed) and their expected state. If thereconciliation fails the Health Manager directs the Cloud Controller to take actions. TheCloud Controller maintains a database with tables for applications, services, DEAs, etc.When a new application is submitted the Cloud Controller selects a DEA from the poolof available DEAs to stage the application. A Micro Cloud Foundry is provided as a vir-tual machine image that can be deployed on a laptop to help developers running a localinstance of Cloud Foundry. Also, there is a public instance of Cloud Foundry operatedby Pivotal1 and hosted on the Amazon infrastructure to enable an online deploymentof web-applications. The Hosted Cloud Foundry instance uses a price formation modelbased on the memory usage per application and the container hosting the applicationis configured accordingly. However, no compensation is provided if the services are notcorrectly delivered.
ConPaaS. ConPaaS [130] is an open source PaaS, developed in the framework of theEU FP7 Contrail project. It is designed to leverage cloud computing resources from awide variety of public and private IaaS clouds in order to provide a flexible and scal-able hosting environment for high-performance scientific applications as well as onlineweb applications. The current ConPaaS implementation is compatible with AmazonEC2 and OpenNebula infrastructures. It provides data storage services, support forhosting web applications written in Java or PHP and high-performance computing en-vironments including Hadoop MapReduce cluster and bag of tasks scheduler services.Each service is deployed on one or more VMs and each application is organized as acollection of services. The services can be scaled on demand to adapt the number ofcomputing resources to the capacity required by the application. ConPaaS provides sev-eral tools and building blocks for building complex runtime environments and cloudapplications. Moreover, it provides two ready-made applications: WordPress and Me-diaWiki. A hosted instance of ConPaaS is available2 offering a free trial feature with acredit system. Users are given a number of credits where one credit corresponds to one
1run.pivotal.io2https://online.conpaas.eu/
43

3.2. Platform as a Service (PaaS)
hour of execution of one virtual machine. However, no SLA is provided.OpenShift. OpenShift [25] is the RedHat PaaS offered in three forms: Online, En-
terprise and Origin. OpenShift Online is a public PaaS hosted by RedHat on top of theAmazon infrastructure. OpenShift Enterprise is a private PaaS designed to run withinorganizations’ data center. OpenShift Origin is the open source software underlyingOpenShift Online and OpenShift Enterprise. It is able to run on top of OpenStack, AWS,or in a data center on top of KVM or VMware. It may run also in a personal laptop ontop of Virtual Box or on top of unvirtualized Linux hosts. OpenShift allows develop-ers developing, hosting, and scaling their web applications written either in Java, Ruby,PHP, Python, Node.js or Perl. In OpenShift, an application is a combination of code,configurations and application components called cartridges. Each cartridge provides aspecific services to build the application, which may be web framework, database, mon-itoring service, or connector to external backends. Cartridges are deployed and isolatedin one or more containers known as gears. A single server may have multiple gearsrunning at the same time and isolated from each other. Each gear is given an allocationof CPU, memory, disk, and network bandwidth using Linux control groups. Overall,in OpenShift the servers hold gears that contain one or more cartridges, and cartridgeshosted on one gear belong to the same application. When a new cartridge needs to beadded to an application, OpenShift chooses where to deploy it based on the type andneeds of the cartridge. The OpenShift Online pricing model is based on the number andtypes of used gears per hour. However, no SLA is provided.
AppScale. AppScale [17] is an open-source PaaS implementing the Google AppEngine APIs for hosting web applications either on the Google Compute Engine orany other supported infrastructure (Eucalyptus, RackSpace, CloudStack, OpenStack andAmazon EC2) or virtualization tool (KVM and VirtualBox). The AppScale software stackis packaged with a single VM image to be deployed on the cloud using one or more in-stances. AppScale tools are provided to automatically assign roles to each deployed VMinstance and accordingly each instance implements one or more AppScale componentsand services. AppScale provides automatic configuring, deploying, and scaling as wellas applications and data backup and migration from one IaaS cloud to another one.AppScale supports the same application runtimes supported in Google App Engine;namely Java, PHP, Python and Go.
Paasmaker. Paasmaker [42] is an open source PaaS designed to be run on a clusterof machines. It can also be run on Amazon EC2 resources or on a single node for de-velopment. The Paasmaker architecture consists of three node roles: pacemaker, routerand heart. The pacemaker is the master node responsible for coordinating all the activi-ties on the cluster and providing a front end for the users. The router directs incomingrequests to the corresponding nodes that can serve them. The heart node is instructedby the pacemaker node to run and manage user applications written in one of the foursupported languages: Python, PHP, Node.js and Ruby. An application may be replicatedor scaled horizontally using multiple heart nodes.
Cloudify. Cloudify [18] is an enterprise-class open source PaaS for deploying, man-aging and scaling enterprise-grade web applications. Cloudify can run on a laptop,datacenter or any cloud supporting the JClouds API, particularly the following publicand private cloud environments: AWS, Rackspace, Windows Azure, HP, OpenStack,and CloudStack. Cloudify supports many programming languages such as Java, PHP,.NET and Ruby on Rails and provides data storage and auto-scaling services. To de-
44
Chapter 3. SLA-Based Profit Optimization in Cloud Bursting PaaS
ploy applications on Cloudify, no change in their code is required but customers haveto describe their needed services and interdependencies using recipes components. Arecipe describes the execution plans for the application lifecycle and the required virtualmachines as well as their images for a chosen cloud. Cloudify auto-installs its agents oneach VM to process the recipes and install the corresponding application tiers. It enablescustomers to define custom application metrics such as availability and performance, tomonitor the metrics and to define scaling rules based on those metrics. Cloudify recipescan also describe an SLA for each service as the minimum number of instances Cloud-ify has to start and maintain. If Cloudify detects that a service’s minimum number ofservice instances are not running, it will attempt to heal by reinstalling and starting theservice instances again. If it detects that a service instance’s VM has stopped respond-ing, Cloudify provisions a new VM for the service instance. Cloudify does not proposebilling methods for using its services.
Tsuru. Tsuru [41] is an open source PaaS for hosting web applications writtenin Python, PHP, Node.js, Go, Ruby or Java. Tsuru uses either Ubuntu Juju [44] orDocker [45] to deploy the applications. Each application runs on a set of units hav-ing all dependencies the application needs to run. A unit may be either an isolated Unixcontainer or a virtual machine, depending on the used provisioner, Docker or Juju. Jujudeploys the applications on a data center or any other supported cloud environmentsuch as EC2, CloudStack and Azure and Docker runs the applications on containers.Tsuru enables users to easily add and remove units in order to scale their applications.Tsuru does not provide any billing model but proposes the usage of quotas where aquota defines for each user the maximum number of applications and the maximumnumber of units that an application may have.
Many open source PaaS solutions rely on more than one IaaS infrastructure but theyprovide no policies for selecting the IaaS resources to use. Moreover, most of them onlyfocus on web applications.
45

3.2. Platform as a Service (PaaS)Ta
ble
3.2:
Sum
mar
yof
open
sour
cePa
aSso
luti
ons
PaaS
Res
ourc
esSe
rvic
esA
pplic
atio
nsLa
ngua
ges
Arc
hite
ctur
eBi
lling
SLA
Clo
udA
WS,
Ope
nSta
ck,
Hos
ting
,sca
ling,
Web
Java
,Rub
y,PH
PD
edic
ated
Pay
asyo
ugo
No
Foun
dry
vClo
udD
irec
tor,
data
stor
age
Gro
ovy,
Scal
a,Li
nux
for
the
host
edco
mpe
nsat
ion
[19]
VM
war
evS
pher
eN
ode.
js,P
ytho
nco
ntai
ners
inst
ance
Con
PaaS
Am
azon
EC2,
Build
ing,
host
ing,
Web
,bat
ch,
Java
,PH
PD
edic
ated
Pay
asyo
ugo
Serv
ices
[130
]O
penN
ebul
asc
alin
g,st
orag
eM
apR
educ
eV
Ms
per
app
cred
itsy
stem
enfo
rcem
ent
Ope
nShi
ftO
penS
tack
,AW
S,Bu
ildin
g,ho
stin
gW
ebJa
va,R
uby,
Perl
,D
edic
ated
Pay
asyo
ugo
Not
prov
ided
[25]
KV
M,V
Mw
are,
scal
ing,
stor
age
PHP,
Pyth
on,
cont
aine
rsfo
rO
penS
hift
VBo
x,Li
nux
clus
ter
Nod
e.js
(Gea
rs)
Onl
ine
App
Scal
eG
CE,
Euca
lypt
us,
Build
ing,
host
ing,
Web
Pyth
on,J
ava,
Ded
icat
edN
otpr
ovid
edN
otpr
ovid
ed[1
7]K
VM
,Rac
kSpa
ce,
data
stor
age,
Go,
PHP
VM
spe
rap
pV
Box,
Clo
udSt
ack,
faul
tto
lera
nce,
EC2,
Ope
nSta
ckau
tosc
alin
gPa
asm
aker
Clu
ser,
sing
leH
osti
ng,s
calin
g,W
ebPH
P,N
ode.
js,
Ded
icat
edN
otpr
ovid
edN
otpr
ovid
ed[4
2]no
de,A
WS
EC2
data
stor
age
Rub
y,Py
thon
node
sC
loud
ify
AW
S,R
acks
pace
Hos
ting
,dat
aW
ebJa
va,P
HP,
Ded
icat
edN
otpr
ovid
edR
esou
rce
[18]
WA
,Ope
nSta
ck,
stor
age,
auto
-R
uby,
.NET
VM
spe
rap
pre
quir
emen
tsH
P,C
loud
Stac
ksc
alin
gTs
uru
[41]
Ubu
ntu
Juju
,H
osti
ng,s
calin
g,W
ebPy
thon
,PH
P,D
edic
ated
Not
prov
ided
Not
prov
ided
Doc
ker
data
stor
age
Nod
e.js
,Go,
unit
s:V
Ms,
Rub
y,Ja
vaco
ntai
ners
46

Chapter 3. SLA-Based Profit Optimization in Cloud Bursting PaaS
3.2.3 Research PaaS
In this section, we present some relevant research PaaS solutions and summarize them inTable 3.3. Note that, the majority of research PaaS works focuses only on specific aspectsof the PaaS systems. Thus, not all the PaaS characteristics are provided. In Table 3.3,when either the applications types and programming languages are not a focus of aresearch PaaS work we just write "Common" in the corresponding cell.
MCP. MCP (Multi-Cloud-PaaS) [129] is an architecture for managing elastic applica-tions across multiple cloud providers. MCP replicates the application on multiple cloudsand continuously monitors their workloads and resources provisioning. A load balancercomponent routes requests to application instances and dispatches load among the dif-ferent cloud providers in a round robin fashion. To avoid a single point of failure theMCP architecture is deployed in at least two different cloud providers. The MCP com-ponents are deployed on one cloud and replicated on a second a cloud. MCP allocatesand deallocates IaaS resources according to the workloads and resources utilization.
PoI. PoI (PaaS on IaaS) [109] is a method for improving the utilization of supersat-urated clouds while easily deploying SaaS. Supersaturated clouds are defined as allo-cating more logical resources than actual physical resources. In this work the authorscompare Single Tenant PaaS (ST-PaaS) and Multi Tenant PaaS (MT-PaaS). The ST-PaaSdedicates a VM instance of IaaS to a single tenant user in order to allow applications tobe easily installed. The MT-PaaS shares a VM instance of IaaS between multiple tenantusers, thus reducing the cost of the cloud. The authors state the relationship betweenMT-PaaS and ST-PaaS as a trade off where the running cost of MT-PaaS is smaller thanthat of ST-PaaS but the development cost is higher.
[66] presents a PaaS architecture, developed in the frame of the EU IST IRMOSproject, for online interactive multimedia applications. The authors identify require-ments and opportunities for new PaaS capabilities to guarantee real-time QoS for inter-active applications. They propose an architecture that uses and provisions on-demandvirtualized IaaS resources (storage, networking and computing) for application servicecomponents. The resources to provision are determined based on specified applicationsQoS and a predicted user interaction in the form of SLA. The application runtime infor-mation is collected and if SLA violations are detected, the provider is notified to triggercorresponding mitigating actions.
CloudServ. CloudServ [154] is a PaaS system dedicated to service-based applicationsregardless of their programming languages and hosting frameworks. CloudServ consistsof a set of PaaS resources able to offer or consume a particular PaaS service. The authorsdefine three types of PaaS resources: container, database and router. The container isthe engine that hosts and runs services, the database enables the data storage and therouter provides routing protocol between services. These resources are continuouslyprovisioned along with the arrival of new requests. CloudServ deploys a personalizedcontainer each time a new service is deployed where a service may be any dependencyrequired by an application.
COSCA. COSCA [104] is a component-based PaaS inspired from the OSGi program-ing model. It is built on top of Java Virtual Machine (JVM) and runs on each cloud nodea layer of cloud extension above the JVM to provide support for user applications. Theapplications are composed from multiple bundles that can be started, stopped, updatedand replicated as OSGi bundles. COSCA provides a virtual OSGi-like container for
47

3.2. Platform as a Service (PaaS)
each application in order to grant isolation between components of the different appli-cations. The platform allows the loading of new application components at runtime andpermits the coexistence of components in different versions. To deploy an application,COSCA users have to provide an application description containing the application ex-ecution settings and links to the corresponding application components to be deployed.COSCA keeps track of the service usage in order to check the workload flow. In caseof a high workload, COSCA automatically duplicates the services and distributes clientrequests among them while ensuring load balancing. The client requests distributionis based on a weighted round-robin scheduling where a load-level is assigned to eachnode. COSCA enables applications to be cloud-independent and easily switch betweenthe use of a local infrastructure and a cloud platform. It also implements a module tocollect the applications resources usage to be utilized for the establishment of a pay asyou go pricing model. COSCA may run on a cluster or on cloud nodes. No explicitspecification about the supported IaaS cloud solution is given by the authors.
Resilin. Resilin [101] is a PaaS system for running MapReduce applications usingthe Hadoop framework. Resilin provisions a Hadoop cluster and submits MapReducejobs on behalf the user. The Hadoop cluster interacts with a cloud storage repositoryto provide input and output data for the MapReduce applications. Resilin supportsMapReduce applications written in Java or Python as well as data analysis systems suchas Apache Hive and Pig. The main Resilin feature, compared to Amazon EMR, is thepossibility to execute MapReduce computations over multiple private, community andpublic clouds, such as Nimbus, OpenNebula, OpenStack, Eucalyptus and Amazon EC2.Moreover, users have the possibility to select the VM types, the operating system andthe Hadoop version they want to use for running their applications. Users are also ableto add and remove VMs to their Hadoop cluster during the execution of their jobs. Forinteroperability reasons, Resilin implements the Amazon EMR API and provides mostof its supported features. In order to provide a uniform interface to the most open-source and commercial IaaS clouds, Resilin uses the Apache Libcloud library. Resilindoes not provide any support for the pricing and SLA functions.
Merkat. Merkat [76] is a private platform that shares cloud resources between com-peting applications using a market-based allocation mechanism. In Merkat, each ap-plication runs in an autonomous virtual platform, defined as a composition of one ormultiple virtual clusters, a set of monitors and an application controller. A virtual clusteris defined as a group of VMs having the same disk image and hosting the same appli-cation components. The application controller manages the application life-cycle andprovides Service Level Objective (SLO) support by applying elasticity rules to scale theapplication demand according to user performance objectives. Each virtual platformadapts individually, without knowledge regarding other participants. Thus, users canrun different applications and express a variety of performance goals. Merkat relies ona market-based resource allocation where users have an amount of credit received froma banking service and distribute it to the virtual platforms running their applications.The assigned credit to a virtual platform reflects the maximum cost for executing theapplication. Further, the CPU and memory resources have a price set through marketpolicies which fluctuates based the resource demand. Virtual platforms autonomouslyadapt their applications resource demand to price variations with the aim to meet ap-plications SLO. The Merkat system ensures a fair and maximized resource utilizationbased on a budget-proportional share policy. Merkat is designed to manage a single
48

Chapter 3. SLA-Based Profit Optimization in Cloud Bursting PaaS
cloud and it current implementation relies on the OpenNebula cloud manager.Qu4Ds. Qu4Ds [111] is a PaaS-level framework for the applications based on the
Master/Worker pattern. The framework includes mechanisms for SLA negotiation,translation, and enforcement and supports both performance and reliability QoS prop-erties. When a new QoS contract is proposed Qu4Ds translates this on resource require-ments and configurations able to ensure the QoS and provisions the resources until theend of the QoS contract. Qu4Ds provides a QoS assurance loop that monitors the job’sdynamic metrics and handles the possible failures and delays.
Aneka. Aneka [146] is a PaaS framework for deploying multiple application modelson the cloud. It supports many program models and languages by creating customizablesoftware containers. The Aneka platform relies on physical or virtualized computing re-sources connected through a network. Each resource hosts an instance of a container,the Aneka core unit, representing the applications’s runtime environment. The con-tainer provides the basic management features to a single node and leverages the otheroperations needed by the hosted services. The services available on the container maybe customized and deployed according to the application-specific needs. Also, it is pos-sible to increase on-demand the number of the Aneka framework nodes according tothe user needs. Aneka provides a basic resource controlling feature that restricts thenumber of resources that can be used per deployment or the number of nodes allowedin the Aneka platform.
The reviewed research PaaS works have different focuses but none of them providesthe features required to achieve our objectives. Specifically, they do not provide open-ness, support for cloud bursting and support for provider’s profit optimization underSLA constraints.
49

3.2. Platform as a Service (PaaS)Ta
ble
3.3:
Sum
mar
yof
com
mer
cial
,ope
nso
urce
and
rese
arch
PaaS
solu
tion
s
PaaS
Res
ourc
esSe
rvic
esA
pplic
atio
nsLa
ngua
ges
Arc
hite
ctur
eBi
lling
SLA
MC
P[1
29]
Mul
ti-C
loud
Hos
ting
,sca
ling
Elas
tic
Com
mon
Not
Not
spec
ified
Not
spec
ified
(WA
,EC
2,et
c.)
load
-bal
anci
ngsp
ecifi
edPo
I[1
09]
IaaS
Hos
ting
SaaS
Com
mon
Sing
le/m
ulti
Not
spec
ified
Not
spec
ified
tena
ntus
ers
[66]
IaaS
reso
urce
sH
osti
ngIn
tera
ctiv
eC
omm
onD
edic
ated
Not
spec
ified
QoS
assu
ranc
em
ulti
med
iare
sour
ces
Clo
udSe
rvV
irtu
alno
des
Hos
ting
,dat
aSe
rvic
eC
omm
onD
edic
ated
Not
spec
ified
Not
spec
ified
[154
](O
penN
ebul
a)st
orag
eba
sed
cont
aine
rsC
OSC
AC
lust
er,c
loud
Hos
ting
,loa
dba
lan-
Com
mon
Java
OSG
ipa
yas
you
goN
otsp
ecifi
ed[1
04]
node
sci
ng,a
uto-
scal
ing
cont
aine
rsM
erka
tsi
ngle
clou
dH
osti
ng,s
calin
g,C
omm
onC
omm
onD
edic
ated
budg
et-b
ased
Aim
sat
mee
ting
[76]
(Ope
nNeb
ula)
load
bala
ncin
gre
sour
ces
reso
urce
shar
ing
appl
icat
ions
SLO
Res
ilin
Mul
ti-c
loud
Hos
ting
,sca
ling,
Map
Red
uce
Java
,Pyt
hon,
Had
oop
Not
spec
ified
Not
spec
ified
[101
](L
ibcl
oud)
data
stor
age
Hiv
e,Pi
gQ
u4D
sPh
ysic
al/v
irtu
a-H
osti
ng,f
ault
Mas
ter
/C
omm
onD
edic
ated
pay
asyo
ugo
QoS
assu
ranc
e[1
11]
lized
reso
urce
sto
lera
nce
Wor
ker
reso
urce
sA
neka
Phys
ical
/vir
tua-
Hos
ting
,sca
ling,
Web
,bat
ch,
.NET
,C#,
C++
,D
edic
ated
Not
prov
ided
Not
prov
ided
[146
]liz
edre
sour
ces
data
stor
age
task
fram
ing
VB,
etc.
node
s
50

Chapter 3. SLA-Based Profit Optimization in Cloud Bursting PaaS
3.3 Cloud Bursting
Cloud bursting has been defined for the first time by Amazon’s Jeff Barr [39] for run-ning applications on a powerful and high scalable hosting environment that combinesenterprises’ owned infrastructures and cloud-based infrastructures. Many researchershave been attracted by the cloud bursting approach for its many benefits, such as cost-efficiency, performance optimization and users satisfaction. In this section, we reviewsome recent research works related to cloud bursting. We classify the related work inthree categories: works based on user constraints, works based on economic criteria,and works targeting specific application types. We describe the objective of each work,its context as well as the used method for achieving its objective. Finally, we summarizethe reviewed work in Table 3.3.3.
3.3.1 Based on User Constraints
We identified a significant number of interesting cloud-bursting research works focusingon covering resources overload or satisfying user preferences and constraints in termsof applications deadline and performance as well as VM placement [84][105][115][103].
[84] proposes a multi-cloud environment for processing user demands where theusers specify the percentage of resources to use from each cloud environment. If userpreferences may not be satisfied initially because of unavailability of resources, the au-thors propose using already deployed instances in less desirable clouds and then rebal-ancing instances progressively instead of pending user demands until the environmentmatches the specified cloud preferences. The rebalancing policies determine whetheror not an excess instance (an instance in a particular cloud that exceed the user desiredamount) should be terminated to create a new one in a higher-preferred cloud. The au-thors proposed three rebalancing policies: Opportunistic-Idle, Force-Offline and AggressivePolicy. The Opportunistic-Idle policy terminates only idle excess instances. The Force-Offline policy marks excess instances offline to prevent them from accepting new jobswhile allowing them to finish running jobs, then terminates the instances when theybecome idle. The Aggressive Policy aggressively terminates excessive instances even ifthey are running user jobs while giving the possibility to specify a job progress thresholdafter which the instance may no longer be terminated.
[105] considers optimizing the completion time of data-intensive jobs with cloudbursting while preserving the same order of their submission. They propose threescheduling heuristics that adapt to changing workload and available resources to op-timize ordered throughput. The heuristics determine the number of resources to provi-sion on the external cloud and decide which jobs to burst. The first heuristic parses thejob queue in the order of job arrival and schedules each job in the internal or externalcloud according to where it is expected to complete earliest. The second heuristic cal-culates the time of the entire job execution in the external cloud (uploading, processing,downloading) before the jobs preceding it complete in the private cloud. Based on thiscalculation the heuristic determines if there are enough workload queued in the internalcloud and decides whether or not bursting the current job. The third heuristic calculatesa suffrage value as the difference between the best and the second best completion timeof each job. Then schedules the job with the maximum suffrage on the node where itcould complete earliest.
51

3.3. Cloud Bursting
[115] presents a cloud bursting model for enabling elastic applications running acrossdifferent cloud infrastructures. The authors propose a framework for building cloud-bursting applications that monitors their performance and decides when to burst theminto the public cloud and when to consolidate them again accordingly, where they linkapplications’ performance to the private resources load. When an application finishes,the mapping of the other applications to resources is replanning.
[103] aims at optimizing the performance of big-data analytics in loosely-coupleddistributed computing environments such as federated clouds. The data is divided intochunks to be analyzed by an algorithm that determines the nodes to use for each datachunk. Initially, the algorithm sorts the set of data chunks according to their size and thenodes from each cloud according to their data transfer delay plus their computation timefor a fixed size of data. The algorithm assigns data chunks to nodes such that large datachunks are handled by nodes with higher data transfer delay and computation time.The algorithm organizes the sequence of chunks for each node in order to maximize theoverlap between the data transfer and computation.
The main limitation of the aforementioned works consists in under-estimating theadditional cost incurred using public cloud resources.
3.3.2 Based on Economic Criteria
We identified other works that base their cloud bursting decisions according to economiccriteria [97][141][90][142].
[97] proposes a system, called Seagull, for determining the most economic appli-cations to migrate into the cloud when the enterprise local resources are overloaded.The authors assume that applications are composed of one or more virtual machineshosted in a private data center and each application may be scaled either horizontallyor vertically. They also assume that the data center overload is predictable. Based onthat, they generate a list of applications likely to become overloaded on which they pe-riodically perform pre-copying by transferring an incremental snapshot of their virtualmachine’s disk-state to the cloud in order to reduce the cloud bursting latency once itoccurs. When an application is overloaded, they decide whether moving it to the cloudor moving other applications and free-up resources to the overloaded application. Theirdecision is driven by the migration cost with the objective of optimizing the amount oflocal capacity freed per dollar spent running applications in the cloud. The underesti-mated cost in this work is the cost of saving VM disk images.
[141] considers cloud providers supporting two QoS levels and VM pricing models:on-demand and spot. The two models are inspired from the VM pricing models pro-vided by Amazon EC23. On-demand VMs are provisioned for the users and payed byits hour usage. If the provider doesn’t possess enough resources the request is rejected.Spot VM requests include the number of VMs and a maximum price, called a bid, theuser is willing to pay per VM/hour. The VMs are instantiated if the current price isbelow the bid price and run until either the user decides to terminate them or the pricegoes above the bid. When the provider receives an on-demand VMs request and re-sources are unavailable, the authors propose comparing the profit of outsourcing therequest to other clouds member of a federation or terminating spot VMs. In this work,the cost of the lost computation due to terminating spot instances is underestimated.
3http://aws.amazon.com/ec2/purchasing-options/
52

Chapter 3. SLA-Based Profit Optimization in Cloud Bursting PaaS
[90] focuses on the parameters impacting the profitability of using a cloud federa-tion for one cloud provider. A global scheduler is proposed to enable cloud providersdeciding between selling their free resources to other providers, buying resources fromother providers or shutting down unused nodes to save power. The scheduler tries tomaximize the provider’s profit while guaranteeing that the hosted services meet theirperformance goals. The main considered parameters for deciding where services will beexecuted are the provider’s incoming workload, the cost of buying additional resources,the generated revenues from selling unused resources and the cost of maintaining theprovider’s resources active.
[142] proposes an architecture for cloud brokering and multi-cloud VM placement.The objective is to optimize the placement of VMs across multiple cloud providers ac-cording to user-specified criteria, such as VM hardware configuration, the number ofVMs of each instance type, the minimum and maximum percent of all VMs to be lo-cated in each cloud as well as the minimum performance and the maximum price.Based on these criteria and the available cloud providers, the cloud broker should gen-erate an optimal deployment plan. The authors provide an integer programming modelformulation to enable an optimized VM placement based on price-performance trade-offs and propose using modeling languages and solvers, such as AMPL, to solve thisoptimization problem.
Some of these works present a limitation that consists in under-estimating the costof their used mechanisms [97][141] and other works do not consider how to concretelyapply their approaches in a real cloud environment [90][142].
3.3.3 Targeting Specific Application Types
There are other relevant cloud-bursting research works aware of the public cloud re-sources cost but they target specific application types [99][79][121].
[99] presents a framework, called PANDA, for scheduling BoT (Bag of Task) applica-tions across resources in both private and public clouds. The objective of this work isto optimize the performance to cost ratio and enabling users choosing the best tradeoffbetween application completion time and cost. The authors assume having a generatorthat produces a set of feasible Pareto-optimal points proposed to the user for selectingthe point with the maximum utility. Based on the selected Pareto-optimal point PANDAfinds a near optimal schedule by defining an optimal workload for each resource andrearranging tasks in the way cost and/or makespan is reduced. The authors use a modelwhere each of the private and public resources has a specific speed and cost and eachtask of an application has a specific and known running time.
[79] proposes a set of algorithms to cost-efficiently schedule batch workloads underdeadline constraints on either a private infrastructure or on public clouds. In this work,the authors assume that private resources are costless and they attempt to maximizethe local infrastructure utilization. They propose a scheduler to decide whether anincoming application can be scheduled on the organization’s private infrastructure oron the public cloud depending on the application’s deadline and potential cost. Whena new application is submitted for execution, it is inserted in the singe system queueaccording a queue sort policy that follows FCFS (First-Come First-Served) and EDF(Earliest Deadline First) policies. The scheduler executes the application at the frontof the queue on the private cloud as soon as sufficient resources become available and
53

3.4. Economic Optimizations
constantly scans the queue in order to detect unfeasible applications (applications thatwill not be able to finish before their deadlines). If an unfeasible application is detected,the authors propose two options, either moving the unfeasible application to a publiccloud or moving application(s) which precede(s) the unfeasible application and incurs alowest cost on the public cloud.
[121] proposes a model, called Elastic Site, to extend a private cluster using publiccloud resources in order to respond to changing demand. The model is integrated witha batch scheduler where the resources are provisioned based on changes in the clusterjob queue. The authors propose three provisioning policies: On-demand, Steady streamand Bursts. The on-demand policy boots a new cloud VM each time a new job is queuedand terminates all idle VMs when the queue is empty. For the second and third policiesthe authors estimate the waste time as the sum of average startup times and shutdowntimes for a particular VM image on the cloud. In the steady-stream policy a new VM isbooted when the total queued wall time becomes greater than five times the estimatedwaste time of a particular cloud and terminates when the total queued wall time dropsbelow three times the estimated waste time of the cloud. In the bursts policy the numberof VMs to launch is calculated by dividing the total wall time of all queued jobs by twotimes the estimated waste time.
3.4 Economic Optimizations
Economic optimizations have been a focus of multiple research work in cloud comput-ing due to its economic importance. In this section, we survey and classify some of therecently proposed related work in three categories: works targeting specific applicationtypes, works targeting specific infrastructures, and works focusing on the optimizationof energy costs. Our survey focuses on presenting the objective of each work, its consid-ered constraints, its targeted type of applications and/or infrastructures, and the usedmethods for achieving its objectives. Finally, we summarize the reviewed works in Ta-ble 3.4.3.
3.4.1 Targeting Specific Application Types
We identified many economic optimization works in the literature that focus on specificapplication types [93][114][58][64][120]. In the following we describe some relevant ones.
[93] considers the SLA-based resource allocation problem for multi-tier applicationsin cloud computing. The objective is to optimize the total profit from the SLA con-tracts that may be reduced by operational costs. The authors assume that servers arecharacterized by a maximum capacity and the SLA of each client request has a pricebased on the response time. The proposed solution first provides an upper bound onthe total profit then tries to reach it by applying a simultaneous server consolidation andresources assignment based on force-directed search method.
[114] proposes an SLA-aware scheduling mechanism for running scientific applica-tions on a public IaaS cloud. The authors assume that each application has an approxi-mated execution time and once it starts running it may not be interrupted or moved toa different resource. They take into account the required time to provision and sched-ule an application and consider the payment of penalties if an application’s executionis delayed. To minimize the cost of running the applications, each time an application
54

Chapter 3. SLA-Based Profit Optimization in Cloud Bursting PaaS
Table 3.4: Summary of cloud bursting related work
Objective Context Method[84] Satisfying user Multi-cloud Terminating excess VMs: (1) if idle, (2) after
preferences running jobs complete, (3) aggressively.[105] Fast and ordered Scheduling Bursting a job if (1) it completes earlier exter-
jobs’ completion data-intensive nally. (2) many jobs are queued internally.apps (3) it saves max time when running externally.
[115] Covering load Elastic apps Bursting and consolidating the applicationsspikes based on the load increase and decrease.
[103] Optimizing big-data Assigning data to nodes based on chunks si-performance analytics ze and nodes transfer and computation time.
[97] Managing local Enterprise Determining the least costly applicationsresources overload to migrate into the cloud.
[141] Maximizing Cloud federa- Deciding between outsourcing resourcesprovider’s profit tion and using or terminating spot instances to serve new
spot instances requests.[90] Maximizing cloud Cloud Deciding between resources outsourcing,
provider revenues federation insourcing or nodes shut downing.[142] Optimizing VM Multi-cloud Formulating an integer programming model
placement to be solved with a modeling solver (AMPL).[99] Optimizing ratio Scheduling Preprocessing workload and assigning
performance/cost BoT apps tasks according to a Pareto-optimal point.[79] Cost-efficiently Scheduling ba- Moving to cloud either the application that
meeting deadlines tch workloads cannot meet its deadline locally or the chea-pest application preceding it in the queue.
[121] Responding to Cluster: batch Adding one VM (1) when a new job is queued.changing demand scheduler (2) when queued wall time is 5x greater than
waste time. Or (3) calculating VMs to add bydividing queued wall time by 2x waste time.
55

3.4. Economic Optimizations
request arrives they decide between instantiating new resources for running it or usingexisting ones.
[58] provides a cost-efficient cloud resource allocation approach for web applications.The method proposed for reducing the applications hosting costs consists in reducingthe number of required VMs by sharing them between applications. The authors defineapplications’ QoS in terms of server resource utilization metrics and provide a proactivescaling algorithm accordingly. Thus, they add and remove fractions of VMs for theapplications and maintain resource utilization below a specific upper limit and a suitablenumber of VMs to host the applications.
[64] focuses on time and cost sensitive execution for data-intensive applications ex-ecuted in a hybrid cloud. The authors consider two different modes of execution: (1)Cost constraint-driven execution, where they minimize the execution time while stayingbelow a user-specified cost constraint, and (2) Time constraint-driven execution, wherethey minimize the cost while completing the execution within a user-specified deadline.They monitor data processing and transfer times to predict the expected time and costfor finishing the execution. The allocation of resources may change, when needed, tomeet the specified time and cost constraint. They propose a model based on a feedbackmechanism in which compute nodes regularly report their performance to a centralizedresource allocation subsystem, and the resources are dynamically provisioned accordingto the user constraints
[120] formulates the problem of minimizing the cost of a running computationalapplication on a hybrid cloud infrastructure as a mixed integer nonlinear programmingproblem and specifies it using a modeling language. The authors assume heterogeneouscompute and storage resources from multiple cloud providers and a private cloud. Eachcloud has a maximum number of resources and the resources are parameterized bycosts and performance. To calculate the cost of a single task, they include the cost ofthe VM instance, the time required for transferring data and the time for computing thetask. For each task, they compute the relation between deadline and cost. The definedobjective function consists in getting the minimum total cost for running the applicationtasks under a deadline constraint.
3.4.2 Targeting Specific Infrastructures
We identified other relevant economic research works which are applicable on specificcomputing infrastructures different from the infrastructure considered in this thesis,namely a cloud-bursting PaaS [158][157][153][68][139][87]. In the following we presentsome of these works.
[158] formalizes the global cost optimization problem among multiple IaaS clouds.The authors assume a cooperative scenario where each IaaS cloud exposes it’s workloadand cost information. They propose an inter-cloud new job scheduling and leftover jobmigration. Their method is based on a double auction mechanism where each cloudprovider gives buy-bids and sell-bids for the required VM instances for the jobs.
[157] studies the profit maximization in a cloud environment with geo-distributeddata centers, where the data centers receive VM requests from customers in the form ofjobs. The authors assume having a complete information of all job arrivals to guaranteea bounded maximum job scheduling latency. They propose a dynamic pricing of VMresources related to customers’ maximum value for a job at a data center and choose the
56

Chapter 3. SLA-Based Profit Optimization in Cloud Bursting PaaS
minimum number of servers required to meet the VM demands.[153] proposes a resource allocation algorithm for SaaS providers to minimize infras-
tructure cost and SLA violations. To achieve this goal, the authors propose mapping andscheduling mechanisms to deal with the customer-side dynamic demands and resource-level heterogeneity. The mechanisms translate client requests into VM capacity and tryto minimize their cost by using the available space within existing VMs which allows acost effective usage of resources.
[68] studies the optimal multi-server configuration for maximizing the profit in acloud environment. The multi-server system is treated as an M/M/m queuing model toformulate and solve the profit optimization problem. The servers are configured basedon the speed and power consumption models of a service request. Then, a probabilitydensity function (pdf) of the waiting time of the newly arrived service request is derived.And based on that the expected service charge is calculated. If the service quality satis-fies the customer expectation then the service charge is linearly proportional to the taskexecution time. Otherwise, the service charge decreases linearly as the service responsetime increases. If the request waits too long then no service charge is applied and theservice is free. Based on that, the expected business gain is obtained in unit of time andthe optimal server’s size and speed are numerically deduced.
[139] proposes a cost-efficient task scheduling in a cloud environment. The problemis presented as a directed acyclic graph (DAG), where nodes are tasks and edges areprecedence constraints between tasks. Weights are assigned to nodes and edges basedon respectively the predicted tasks execution time and the predicted time to transfer databetween VMs. Finally, the scheduling plans for mapping tasks are calculated accordingto the most cost-efficient VMs
[87] provides an SLA-driven management solution for maximizing the profit of PaaSproviders that host their services on IaaS clouds. To achieve the providers’ profit maxi-mization, the authors propose reducing resource costs by sharing them among differentcontracts while ensuring agreed QoS in the SLA. They propose a mechanism with mul-tiple control loops for adjusting services configurations and resource usage in order tomaintain SLAs in the most cost-effective way. In peak periods, their mechanism choosesthe most suitable request to be aborted to handle the lack of resources.
3.4.3 Focusing on the Optimization of Energy Costs
There are other research works that focus on the optimization of the electricity costsfor optimizing cloud data centers costs. For instance, [148] studies the power consump-tion of data centers for cost-effective operation taking into account multiple electricitypricing schemes. [117] considers geographically distributed data centers in a multi-electricity market environment and proposes an energy-efficient, profit and cost awarerequest dispatching and resource allocation algorithm to maximize a service provider’snet profit. [92] considers resource allocation problem aiming to minimize the total en-ergy cost of cloud computing system while meeting specific client-level SLAs. [122]maximizes providers net revenue by dynamically powering servers on and off in orderto minimize the amount of consumed energy.
As it can be observed, the majority of the reviewed economic optimization worksdo not handle peak periods. They consider either using a public IaaS cloud and havingaccess to an unlimited number of resources or rejecting requests that may not be served
57

3.5. Gaps
if no resources are available.
3.5 Gaps
Table 3.5 compares the goal of this thesis (the last row) with the most relevant relatedsystems previously analyzed. The comparison criteria highlight the required featuresfor meeting the objectives of this thesis; namely, optimizing the provider profit in acloud-bursting PaaS environment under SLA constraints. In the comparison table weuse three symbols to express (1) if the criterion is met (X), (2) if the satisfaction of thecriterion is unknown, i.e. there is no publicly available information (-), and (3) if thecriterion is not met (7). In the following we explain the meaning of each criterion.
Hosting Environment. The hosting environment describes the computing environ-ment considered in each work and its capabilities. We focus on three capabilities.
1. Open. A hosting environment is considered as open if it is designed to be extensibleand able to support a large variety of application types, frameworks and programlanguages.
2. Multi-Cloud Applications Deployment. This capability is valid if the hosting environ-ment enables the deployment of applications on simultaneously several IaaS cloudsystems.
Business Model. The business model considers the economic policy provided ineach work and its corresponding features that are part of the business model. We focuson the three following features.
1. Optimization of Provider Profit. This feature is valid if the marketing solution pro-vides a provider profit optimization policy.
2. Support for SLA Constraints. This feature is valid if the marketing solution pro-vides SLA/QoS support, aims to satisfy them and incurs penalties if they are notsatisfied.
3. Support for PaaS. This feature is valid if the marketing solution is applicable on aPaaS environment.
The general observation is that no related work targets the objectives of this thesisnor covers the required features to achieve them. The works focusing on optimizing theprovider profit are generally specific to application models and may not be applied toan open hosting environment. Further, many works providing an open hosting environ-ment provide no economic oriented features. Moreover, few works provide or considerthe possibility of deploying applications on a multi-cloud environment.
3.6 Summary
In this chapter we presented the main required features to achieve the objective of thisthesis, which consist in a cloud-bursting PaaS hosting environment and a profit-efficientbusiness model. We reviewed the current state of the art of cloud bursting environmentsand economic optimization policies. Moreover, we analyzed some current commercial,
58

Chapter 3. SLA-Based Profit Optimization in Cloud Bursting PaaS
Table 3.5: Summary of economic optimization policies
Objective Constraints Target applica- Methodtions and infra-structure types
[93] Optimizing profit Response Multi-tier Force-directed resourcestime applications assignment
in IaaS cloud[114] Minimizing cost Execution Scientific Deciding between reusing
time applications or renting new VMson IaaS cloud
[58] Minimizing cost Bounded Web Dynamically allocatingserver load applications VM’s fractions to
hosting (PaaS) applications[64] (1) Minimizing (1) Cost Data-intensive Dynamic resource allo-
execution time applications cation based on feedback(2) Minimizing cost (2) Deadline in hybrid cloud
[120] Minimizing cost Deadline Batch Mixed integer nonlinearapplications formalizationin hybrid cloud
[158] Minimizing cost Response Multiple IaaS Inter-cloud job schedulingtime clouds based on sell/buy bids
[157] Maximizing profit Bounded Geo-distributed Dynamic VM pricinglatency data centers and server provisioning
[153] Minimizing cost and - SaaS Optimizing the use ofSLA violations VMs available resources
[68] Maximizing profit Response Multi-server Defining servertime system configurations
[139] Minimizing cost and - IaaS cloud Scheduling tasks on VMsmakespan with low monetary cost
[87] Maximizing profit Throughput Services Dynamic resource sha-hosting (PaaS) ring between services
[117] Maximizing profit - Geo-distributed Dynamic request dispa-data centers ching on resources
[92] Minimizing energy Service time IaaS Cloud Dynamic resourcecosts allocation
[122] Maximizing profit - IaaS Cloud Dynamically poweringservers on/off to minimizeconsumed energy
59

3.6. Summary
Table 3.6: Positioning this thesis with the main related works.Approach Hosting Environment Business Model
Open Multi-Cloud Optimization Support SupportApplications of Provider for SLA for PaaSDeployment Profit Constraints
[93] 7 7 X X X[157] 7 7 X X 7
[58] 7 7 X X X[87] 7 7 X X X[114] 7 7 X X X[120] 7 X X X X[68] 7 7 X X X[99] 7 X 7 X X[105] 7 X 7 X X[90] 7 - X X X[141] 7 - X 7 7
[79] 7 7 X X XGAE [14] 7 7 - X XAzure [1] 7 7 - X X
RightScale [21] X X 7 7 XCloud Foudry X 7 7 7 X
[19]ConPaaS [130] X X 7 7 XOpenShift [25] X 7 7 7 XCloudify [18] X 7 7 X X
[66] 7 7 7 X XResilin [101] 7 X 7 7 XMerkat [76] X 7 7 X XAneka [146] X 7 7 7 XThesis goal X X X X X
60

Chapter 3. SLA-Based Profit Optimization in Cloud Bursting PaaS
open source and research PaaS systems regarding a number of characteristics; partic-ularly, regarding their underlying infrastructure, provided services, supported applica-tion types and program languages, architecture, and billing and SLA models . We alsostressed the limitations of the related work that prevent achieving the objective of thisthesis. In the next chapters we introduce the contributions of this thesis.
61

3.6. Summary
62

Chapter 4
Profit Optimization Model
Contents4.1 Definitions and Assumptions . . . . . . . . . . . . . . . . . . . . . . . . 62
4.2 PaaS System Model . . . . . . . . . . . . . . . . . . . . . . . . . . . . . . 63
4.2.1 Notations . . . . . . . . . . . . . . . . . . . . . . . . . . . . . . . . 63
4.2.2 Objective . . . . . . . . . . . . . . . . . . . . . . . . . . . . . . . . . 64
4.2.3 Constraints . . . . . . . . . . . . . . . . . . . . . . . . . . . . . . . 64
4.3 Policies . . . . . . . . . . . . . . . . . . . . . . . . . . . . . . . . . . . . . . 65
4.3.1 Basic Policy . . . . . . . . . . . . . . . . . . . . . . . . . . . . . . . 66
4.3.2 Advanced Policy . . . . . . . . . . . . . . . . . . . . . . . . . . . . 66
4.3.3 Optimization Policy . . . . . . . . . . . . . . . . . . . . . . . . . . 68
4.4 Summary . . . . . . . . . . . . . . . . . . . . . . . . . . . . . . . . . . . . 70
In the previous chapter we presented and analyzed a number of recent works treatingaspects related to the objective of this PhD thesis, which consists in optimizing the
provider profit in a cloud-bursting PaaS environment under SLA constraints. Our anal-ysis has shown that existing works are applicable either to specific application types oron specific hosting environments different from a cloud-bursting PaaS. To address theselimitations we propose in this chapter a generic profit optimization model, independentfrom specific application types and considering the payment of penalties if the SLAsof clients applications are not satisfied. First, we present a mathematical model of acloud-bursting PaaS environment as well as the objective and the constraints of the PaaSprovider. Then, we propose generic policies for optimizing the PaaS provider profit.
This chapter is organized as follows. Section 4.1 provides definitions and assump-tions about the considered PaaS hosting environment. Section 4.2 describes the consid-ered system using a mathematical model. Section 4.3 presents a number of policies usedto optimize the PaaS provider profit. Finally, Section 4.4 summarizes the chapter.
63

4.1. Definitions and Assumptions
4.1 Definitions and Assumptions
In this section we define the characteristics of the considered PaaS hosting environmentas well as the background assumptions. First of all, we consider an open PaaS systemable to host a wide variety of application types and that relies on private resourcesowned by the provider and is able to burst into public IaaS cloud resources, as seen inFigure 4.1. The main function of the PaaS is to assign resources to applications accordingto specific policies that depend on the provider objectives. Furthermore, we considerthat the PaaS system uses a different resource configuration for each application typebecause each type has specific dependencies and requirements in terms of softwarestack and management tools. Thus, the private resources are partitioned into severalgroups, where each group is dedicated to a specific application type. When necessary,each group may burst into public cloud resources independently from the other groups.Thereby, each group is composed of a set of private resources and possibly some publicresources.
The PaaS providers objective considered here is the optimization of their profit whiletaking into account two parameters. The first parameter consists in providing SLAs tothe hosted applications based on QoS properties, such as response time and throughput.The second parameter consists in the payment of penalties if the level of QoS promisedin the SLA is not met. To achieve this objective, our approach consists mainly in se-lecting the cheapest resources for the provider able to host and satisfy the SLA of eachapplication. Indeed, we consider that both of private and public resources have a knowncost for the PaaS provider.
Our approach is generic and independent from the types of supported applicationsbut it relies on one background assumption. Namely, the considered assumption isthat for each supported application type there is a corresponding manager capable totranslate the applications’ required QoS levels into resource requirements, to estimatetheir possible penalties due to QoS impacts and to predict their resource usage scheme.Such capabilities are based on application type-specific knowledge and performancemodel.
PaaS provider
Private resources Public resources
PaaS solution
Public IaaS providers
Figure 4.1: Overview of the considered hosting environment
64

Chapter 4. Profit Optimization Model
4.2 PaaS System Model
In this section, we formalize the considered PaaS system as well as the provider objectiveand constraints using a mathematical model.
4.2.1 Notations
Basically, the considered PaaS system relies on a constant number K of private resourcesand on a variable number Z of public cloud resources, R = {R1, R2, ..., RK, RK+1, ..., RK+Z}.The private resources may be either available or used by the hosted applications and thepublic resources may only be used, otherwise they are released to avoid the providerpaying additional charges. Note that in this model we consider that the PaaS providerpays the public resources exactly according to their usage duration. For simplicity rea-sons, we consider that each of the private and public resources are built in a way to behomogeneous. Thus, if an application runs on a resource Ri from the private or publiccloud it achieves the same QoS level. Each resource has a cost and a price. The resourceprice Rprice is set by the PaaS provider and used for billing the provided services. Theresource cost may be either private Rprivate or public Rpublic depending on the locationof the resource. The private cost is estimated by the PaaS provider according to theincurred operational costs and the public cost is dynamically obtained from public IaaScloud providers. Obviously, we assume that the resource price is set to be higher thanthe private and public costs, in order to enable the provider to make profit.
The resources are partitioned into M groups, G = {G1, G2, ..., GM}, where M isthe number of the supported types of applications. Each group Gj holds a subset ofresources Gj
R, where (1) the sum of the number of resources assigned to each one ofthe groups in the system is equal to the total number of resources in the system (seeEquation 4.1a) and (2) each resource Ri in the system belongs to a unique group Gj
(see Equation 4.1b). The PaaS system hosts N applications, A = {A1, A2, ..., AN}, ofall the supported types. Each group Gj hosts a subset of applications Gj
A of the sametype where the sum of the number of applications belonging to each one of the groupsin the system is equal to the total number of applications hosted in the system (seeEquation 4.1c). Further, the resources are considered as computing units that may notbe shared between multiple applications. Thus, each resource is held by at most oneapplication and each application holds at least one resource.
More generally, each application Ax holds a number of resources AxR that may be
either private Axprivate or public Ax
public and requires a specific QoS level AxQoS. The cost of
hosting an application for the provider Axcost is calculated as a function of the required
QoS level, the number of private and public resources used by the application, and thecost of the private and public resources for the provider. The price paid by the user forhosting an application Ax
price is calculated as a function of the required QoS level, thenumber of resources used by the application, and the resources price set by the provider.If the QoS level required by an application is impacted according to an impact levelAx
impact (e.g., the impact level could be the extent that the application runtime exceedsits deadline), an application penalty Ax
penalty is calculated as a function of this impactand the initial application revenue paid by the user. Otherwise, the application penaltyis zero. The revenue generated by the provider from hosting an application Ax
revenueis calculated as the difference between the application price and penalty. Finally, the
65

4.2. PaaS System Model
profit obtained by the provider from hosting an application Axpro f it is calculated as the
difference between the application revenue and the application cost.Table 4.1 summarizes all the notations used in this chapter, the aforementioned ones
as well as the ones that will be used in the next sections.
PaaS system properties:
M
∑j=1
∣∣∣GjR
∣∣∣ = K + Z (4.1a)
∀Ri ∈ R, ∃!Gj ∈ G, Ri ∈ GjR (4.1b)
M
∑j=1
∣∣∣GjA
∣∣∣ = N (4.1c)
4.2.2 Objective
As already mentioned, our objective is to maximize the overall PaaS provider profitwhile providing specific QoS levels to applications or paying penalties otherwise. Weconsider that the QoS level required by an application is translated into resources re-quirements by a manager specific to the corresponding application types. If this QoS isimpacted, an application penalty that affects the application profit is computed accord-ingly. Thus, the objective is formulated here in the maximization of the sum of all thehosted applications profits (see equation. 4.2).
Objective:
max(N
∑x=1
Axpro f it) (4.2)
4.2.3 Constraints
The payment of penalties when the required QoS level by an application is not met isan attractive feature for the users. However, if the provider does not fulfill its com-mitments regarding the initially promised QoS level to applications, the customers willbe disappointed and may migrate to an other competitor. Consequently, in additionto the penalties, the provider should also care about its reputation. Specifically, theprovider has to limit the number of impacted applications as well as the level of impactfor each impacted application, even if this may decrease its profit. Indeed, if a QoS im-pact exceeding a predefined limit is detected during the execution of an application theprovider should fix it by adding resources for example, even if the additional resourceswill not be accounted in the price paid by the user. This may reduce the provider profitin the short term but it is advantageous for the longer term.
Namely, we consider two constraints. First, the impact level of impacted applicationsshould not exceed a threshold Athreshold predefined by the provider (see Equation 4.3a),where the threshold Athreshold is the highest allowed level of QoS impact of each appli-cation in the PaaS system. Second, the ratio of the impacted applications in the PaaS
66
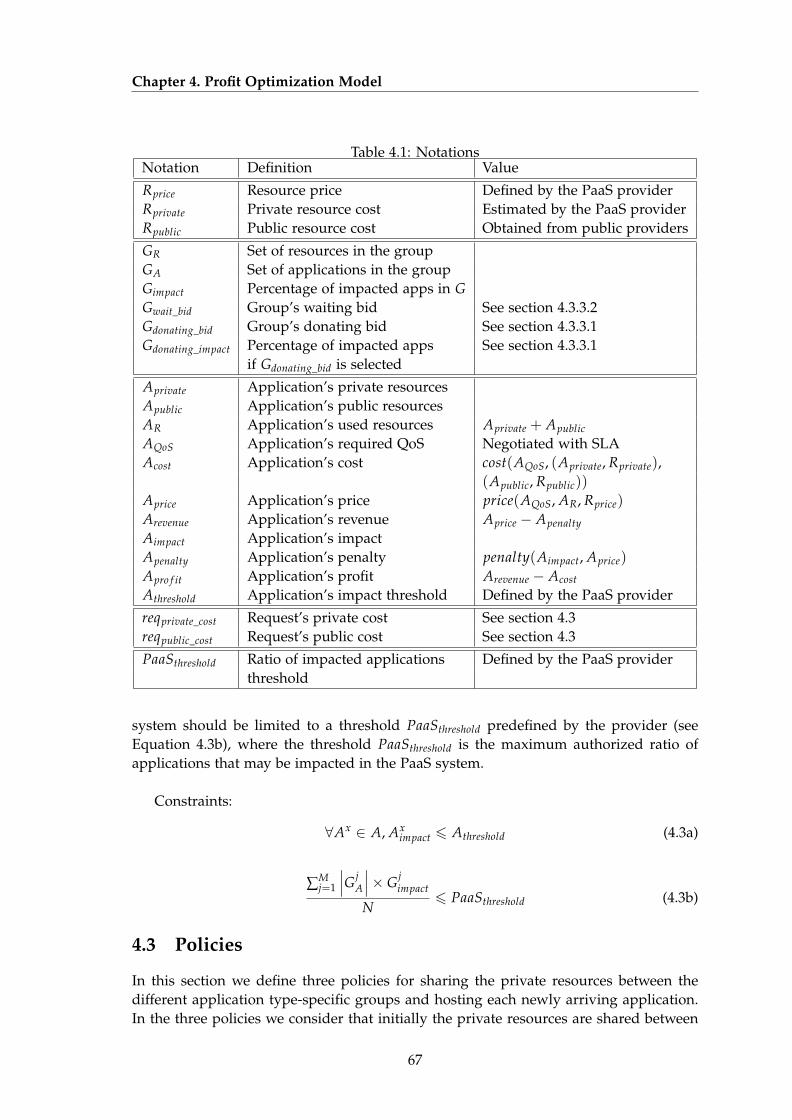
Chapter 4. Profit Optimization Model
Table 4.1: NotationsNotation Definition Value
Rprice Resource price Defined by the PaaS providerRprivate Private resource cost Estimated by the PaaS providerRpublic Public resource cost Obtained from public providers
GR Set of resources in the groupGA Set of applications in the groupGimpact Percentage of impacted apps in GGwait_bid Group’s waiting bid See section 4.3.3.2Gdonating_bid Group’s donating bid See section 4.3.3.1Gdonating_impact Percentage of impacted apps See section 4.3.3.1
if Gdonating_bid is selected
Aprivate Application’s private resourcesApublic Application’s public resourcesAR Application’s used resources Aprivate + ApublicAQoS Application’s required QoS Negotiated with SLAAcost Application’s cost cost(AQoS, (Aprivate, Rprivate),
(Apublic, Rpublic))
Aprice Application’s price price(AQoS, AR, Rprice)
Arevenue Application’s revenue Aprice − ApenaltyAimpact Application’s impactApenalty Application’s penalty penalty(Aimpact, Aprice)
Apro f it Application’s profit Arevenue − Acost
Athreshold Application’s impact threshold Defined by the PaaS provider
reqprivate_cost Request’s private cost See section 4.3reqpublic_cost Request’s public cost See section 4.3
PaaSthreshold Ratio of impacted applications Defined by the PaaS providerthreshold
system should be limited to a threshold PaaSthreshold predefined by the provider (seeEquation 4.3b), where the threshold PaaSthreshold is the maximum authorized ratio ofapplications that may be impacted in the PaaS system.
Constraints:
∀Ax ∈ A, Aximpact 6 Athreshold (4.3a)
∑Mj=1
∣∣∣GjA
∣∣∣× Gjimpact
N6 PaaSthreshold (4.3b)
4.3 Policies
In this section we define three policies for sharing the private resources between thedifferent application type-specific groups and hosting each newly arriving application.In the three policies we consider that initially the private resources are shared between
67

4.3. Policies
the groups either equally or according to application type-specific workload predictions.Then, each time a request req for hosting a new application arrives the policies try tofind the suitable resources to host it. We consider that the user of the new applicationhas already negotiated an SLA and QoS properties with the corresponding applica-tion type-specific manager which translates the application QoS level requirement intoresources requirement. The request has the same attributes as the other applicationshosted in the PaaS system, presented in Section 4.2, plus two additional ones: a privatecost reqprivate_cost and a public cost reqpublic_cost. The private cost is calculated as if the newapplication will use private resources only and the public cost is calculated as if the newapplication will use totally or partially public resources. The two costs are comparedand the cheapest one determines the resources to use for hosting the application.
4.3.1 Basic Policy
The basic policy is naive. It statically partitions the private resources between the groups.Thus, a constant number of private resources is assigned to each group. If a group hasno more available private resources and a new application arrives, the new applicationwill be hosted on public resources regardless of the possible available private resourcesin the other groups.
Specifically, when a new application request arrives its corresponding manager be-haves as shown in Algorithm 1. First, the manager gets the current resources prices froma set of public IaaS cloud providers on which the PaaS may burst. The cheapest publiccloud price is selected as a resource’s public cost. Then, the manager compares thispublic cost with the private cost predefined by the PaaS provider. The cheapest cost de-termines whether the new application will be hosted on the private or public resources.Nevertheless, if there are not enough private resources available in the correspondinggroup we rent public resources.
Algorithm 1: Basic PolicyData: reqResult: Find resources for req
1 Get current resources’ prices from a set of pubic cloud providers ;2 Rpublic = min(public cloud prices) ;3 if (Rprivate 6 Rpublic) ∧ (∃r ⊆ Gcurrent
R , (∀Ri ∈ r, Ri is available) ∧ (|r| > reqR)) then4 Use private resources ;5 else6 Rent public resources from the provider with the cheapest price;7 end
4.3.2 Advanced Policy
The advanced policy offers more flexibility than the basic one. It provides mainlytwo more features: exchange and hybrid. The exchange feature consists in enablingthe application-type specific groups to exchange private resources between each other.Specifically, when the private resource cost is cheaper than the public resource cost andthe corresponding group does not have enough private resources for hosting a new
68

Chapter 4. Profit Optimization Model
application, we check if the other groups have available private resources before rent-ing public cloud resources. The hybrid feature consists in enabling applications to runsimultaneously on both private and public resources. Specifically, when the private re-sources cost is cheaper than the public one and there are not enough available privateresources for hosting a new application, rather than renting all the required resourcesfrom a public cloud we rent only the number of missing resources.
In Algorithm 2 we show the pseudocode of the advanced policy run by an applica-tion type-specific manager when its corresponding group receives a request for hostinga new application. First, the manager gets the cheapest public cloud resource cost andcompares it with the private resource cost in the same way as in the basic policy. If thepublic cost is cheaper the manager rents the resources from the corresponding publiccloud provider. Otherwise, the manager checks the number of private resources avail-able in the current application type-specific group. If the available private resources aresufficient the manager uses them to host the new application. Otherwise, the managercalculates the number of missing resources Rmissing and checks if the other groups haveat least as much available private resources. If so, the required resources are transferredfrom their initial groups to the requesting group to be used for hosting the new applica-tion. If not, the number of resources available on the other groups Ravailable is calculatedto deduce the number of missing sources. Then, the resources available on the othergroups will be transferred to the requesting group, and the missing resources will berent from the public cloud provider.
Algorithm 2: Advanced PolicyData: reqResult: Find resources for req
1 Get current resources’ prices from a set of public cloud providers ;2 Rpublic ← min(public cloud prices) ;3 Rmissing ← reqR ;4 r ← set of available resources in Gcurrent
R ;5 if (Rprivate 6 Rpublic) then6 if (|r| < reqR) then7 Rmissing ← reqR − |r| ;8 if (other groups have Rmissing) then9 Get Rmissing from corresponding groups ;
10 else11 Ravailable ← available resources on other groups ;12 Rmissing ← Rmissing − Ravailable ;13 Get Ravailable from corresponding groups ;14 Rent Rmissing from corresponding public cloud ;15 end16 else17 Use available resources in Gcurrent;18 end19 else20 Rent Rmissing from corresponding public cloud ;21 end
69
4.3. Policies
4.3.3 Optimization Policy
The optimization policy goes one step further than the advanced policy in optimizingthe use of private resources if their cost is cheaper than the public one. Specifically,when the available private resources in all the groups are not sufficient for hosting anew application, the policy compares the cost of three options for getting the missingresources: (1) renting them from a public cloud provider, (2) getting them from runningapplications, or (3) waiting for private resource to become available. The first optionis the simplest one and is similar to the one used in the advanced policy. The secondoption, called donating option, may generate an impact on the promised QoS propertiesof the affected applications. The third option, called waiting option, may generate animpact on the promised QoS properties of the new application. In two last options,the payment of the incurred penalties should be considered. In the next subsections,we explain each of the donating and waiting options and provide the algorithm of theoptimization policy.
4.3.3.1 Donating Option
The donating option consists in removing or borrowing a part of resources used byapplications already running and giving them to the new application. The resourcescould be obtained either from one application or from a subset of applications belongingto a same group, where the number of resources to donate is less or equal to the totalnumber of private resources in the group. The QoS promised in the SLAs of the affectedapplications may deteriorate and as a result the provider loses some revenue due to thepayment of penalties. The sum of the possible penalties of the applications that may beaffected in a group in order to donate the required resources is called a group donatingbid and referenced as Gdonating_bid. Each application type-specific manager is responsiblefor determining which applications could be affected for calculating the amount of theirpossible penalties. This calculation is based on the corresponding application type-specific performance model. Thus, each group provides (1) a donating bid, (2) theaverage ratio of impacted applications in the group if the donating bid is taken, and (3)the average ratio of applications impacted in the past.
The idea is to select one donating bid from the proposed ones and use it to makethe choice between using the private and public resources. As shown in Algorithm 3, toselect a donating bid first we perform an ascendant sort on the groups based on theircorresponding donating bids. Then, we calculate the average ratio of the impacted ap-plications in the overall PaaS system as if the smallest donating bid was selected. If thisaverage ratio is smaller or equal to the predefined PaaS threshold then we select thesmallest donating bid. Otherwise, we perform the same steps with the next smallestdonating bids until we find a donating bid that satisfies the impact threshold constraintor exhaust all groups. If no proposed donating bids enable the satisfaction of the thresh-old constraint, we set the donating bid value to infinity in order to avoid selecting thedonating option.
4.3.3.2 Waiting Option
The waiting option consists in either maintaining the new application in a queue untilall the required resources become available or starting the application with only the part
70

Chapter 4. Profit Optimization Model
Algorithm 3: get_donating_bid() functionData: RmissingResult: Find Gj, donating_bid
1 ∀Gj ∈ G, get(Gjdonating_bid, Gj
donating_impact, Gjimpact) ;
2 sort(Gj, Gjdonating_bid) ;
3 for j← 1 to M do4 bid← Gj
donating_bid ;
5 donating_bidimpact ←
∣∣∣GjA
∣∣∣× Gjdonating_impact + ∑M
y=1,y 6=j∣∣Gy
A
∣∣× Gyimpact
N + 1;
6 if (donating_bidimpact 6 PaaSthreshold) then7 break ;8 end9 end
10 if (donating_bidimpact > PaaSthreshold) then11 donating_bid← ∞ ;12 end13 return Gj, donating_bid ;
of resources already available and adding the missing resources once they become avail-able. The resources become available following either the end of a temporal applicationor a decrease in the resource consumption of a permanent application. This waitingtime may impact the QoS properties promised to the new application which leads to thepayment of a penalty, waiting bid, which is assumed to be calculated by the correspond-ing application type-specific manager. The required time for the other applications torelease a number resources is also assumed to be computed by their correspondingapplication type-specific managers, knowing their application performance model. Weassume that each application-type specific group provides its required time to have anumber of available private resources Gwait and its corresponding waiting bid Gwait_bidcalculated as the penalty of new application caused by Gwait. As shown in Algorithm 4,once all the groups propose their waiting bid, we select the smallest one and calculatethe average ratio of impacted application in the overall PaaS system taking into accountthe impact of the new application. If this average ratio is greater than the predefinedthreshold, we set the waiting bid to infinity to avoid selecting this option and impactingone more application.
4.3.3.3 Algorithm
Algorithm 5 shows the pseudocode of the optimization policy with both options donat-ing and waiting bids. First, the manager receiving the request gets the resource costsfrom a set of public cloud providers, selects the cheapest one as the public resource costand compares it with the private resource cost. If the public cost is cheaper the managerhosts the new application on resources from the corresponding public cloud provider.Otherwise, the manager checks the availability of private resources on its correspondingapplication type-specific group. If the resources are sufficient the manager uses them forhosting the new application. Otherwise, the manager computes the number of missing
71

4.4. Summary
Algorithm 4: get_waiting_bid() functionData: Rmissing, reqResult: Find Gj, waiting_bid
1 ∀Gj ∈ G, get(Gjwait, Gj
wait_bid, Gjimpact) ;
2 sort(Gj, Gjwait_bid) ;
3 waiting_bid← G1wait_bid ;
4 waitimpact ←1 + (∑M
j=1
∣∣∣GjA
∣∣∣× Gjimpact)
N + 1;
5 if (waitimpact > PaaSthreshold) then6 waiting_bid← ∞ ;7 end8 return G1, G1
wait, waiting_bid ;
resources and checks if the other groups have as much private resources available. Ifso, the available resources will be transferred from their corresponding groups to therequesting group and will be used for hosting the new application. If not, in additionto transferring the available resources from their corresponding groups, the manger up-dates the number of missing resources to get the donating and the waiting bids. Thetwo bids are compared and the smallest one is used to calculate the cost of the requestusing private resources. The cost of the request using public resources to cover the miss-ing resources is also calculated. Finally, the two costs are compared and the cheapestone determines if the missing resources will be rent from a public cloud provider orobtained through the waiting or the donating bid options.
4.4 Summary
In this chapter we introduced the considered PaaS hosting environment and formalizedit using a mathematical model. We also presented a set of policies for optimizing theprofit of the PaaS provider when hosting applications. The main considered hostingenvironment features are the support of cloud bursting and the capacity to host sev-eral application types. Our mathematical model formalizes such a system as well asthe applications’ characteristics and requirements. The model formalizes also the PaaSprovider objective and constraints. Specifically, the provider objective considered here isto earn the maximum profit from hosting applications with the constraint of satisfyingtheir required QoS levels or paying penalties. Another considered constraint consists inlimiting the QoS impact level of applications and the number of impacted applicationsif an impact is required to achieve the provider’s objective. We provided a set of policiesto map arriving applications on resources in a profit-efficient way. The policies comparethe cost of hosting applications with the private resources and public resources at dif-ferent levels to select the cheapest one. The main assumption of the proposed modeland policies is that the PaaS system is able to estimate the QoS level of an applicationits type-specific knowledge and performance model.
In the following chapter we investigate computational applications and propose SLAand pricing function accordingly, in order to provide an example of an application-type
72

Chapter 4. Profit Optimization Model
Algorithm 5: Optimization PolicyData: reqResult: Find resources for req
1 Get current resources’ prices from a set of public cloud providers ;2 Rpublic = min(public cloud prices) ;3 Rmissing ← reqR ;4 r ← set of available resources in Gcurrent
R ;5 if (Rprivate 6 Rpublic) then6 if (|r| < reqR) then7 Rmissing ← reqR − |r| ;8 if (other groups have Rmissing) then9 Get Rmissing from corresponding groups ;
10 else11 Ravailable ← available resources on other groups ;12 Rmissing ← Rmissing − Ravailable ;13 Get Ravailable from corresponding groups ;14 (Gj, donating_bid)← get_donating_bid(Rmissing) ;15 (Gj, wait, waiting_bid)← get_waiting_bid(Rmissing, req) ;16 if (donating_bid < waiting_bid) then17 reqprivate_cost ←
cost(reqQoS, (reqR, Rprivate), (0, Rpublic)) + donating_bid ;18 private_option← donating bid ;19 else20 reqprivate_cost ← cost(reqQoS, (reqR, Rprivate), (0, Rpublic)) + waiting_bid ;21 private_option← waiting bid ;22 end23 reqprivate ← reqR − Rmissing ;24 reqpublic_cost ← cost(reqQoS, (reqprivate, Rprivate), (Rmissing, Rpublic)) ;25 if (reqprivate < reqpublic) then26 if (private_option = waiting bid) then27 if (req support running with partial resources) then28 Start running the new application with available resources ;29 end30 Wait during wait time ;31 end32 Get Rmissing from Gj ;33 else34 Rent Rmissing from corresponding public cloud ;35 end36 end37 else38 Use available resources in Gcurrent ;39 end40 else41 Rent Rmissing from corresponding public cloud ;42 end
73

4.4. Summary
specific manager.
74

Chapter 5
Computational Applications
Contents5.1 Definitions and Assumptions . . . . . . . . . . . . . . . . . . . . . . . . 74
5.2 Performance Model . . . . . . . . . . . . . . . . . . . . . . . . . . . . . . 74
5.3 Service Level Agreement (SLA) . . . . . . . . . . . . . . . . . . . . . . . 74
5.3.1 SLA Contract . . . . . . . . . . . . . . . . . . . . . . . . . . . . . . 74
5.3.2 SLA Classes . . . . . . . . . . . . . . . . . . . . . . . . . . . . . . . 75
5.3.3 Revenue Functions . . . . . . . . . . . . . . . . . . . . . . . . . . . 76
5.3.4 Lifecycle . . . . . . . . . . . . . . . . . . . . . . . . . . . . . . . . . 77
5.4 Bids Heuristics . . . . . . . . . . . . . . . . . . . . . . . . . . . . . . . . . 78
5.4.1 Waiting Bid . . . . . . . . . . . . . . . . . . . . . . . . . . . . . . . 78
5.4.2 Donating Bid . . . . . . . . . . . . . . . . . . . . . . . . . . . . . . 79
5.5 Summary . . . . . . . . . . . . . . . . . . . . . . . . . . . . . . . . . . . . 82
This chapter completes the formalism of the PaaS profit optimization model pro-posed in the previous chapter with a computational applications’ group model.
Specifically, it proposes an SLA model for computational applications and presents cor-responding donating and waiting bids heuristics for providing private resources fromrunning applications.
The chapter is organized as follows. Section 5.1 defines computational applicationsand presents the considered background assumption in this work. Section 5.2 presentsthe assumed computational application performance model. Section 5.3 presents theused service level agreement contract, classes, functions and lifecycle. Section 5.4 de-scribes the used donating and waiting bids heuristics. Finally, Section 6.4 summarizesthis chapter.
75

5.1. Definitions and Assumptions
5.1 Definitions and Assumptions
We define a computational application as a temporal passive application running fora finite duration without any human intervention (see definitions in Section 2.2). Theapplications may use either a fixed or a variable set of resources. Accordingly, we dif-ferentiate between two types of applications: rigid and elastic. The rigid applicationsrequire a fixed amount of resources and the elastic applications can be adapted to usedifferent amounts of resources.
In this chapter, we propose a computational application manager responsible forproviding and managing the entire lifecycle of applications and their correspondingSLAs. The role of this manager in our profit optimization model is to provide the do-nating and waiting bids of its corresponding application group. Our manager relies onone background assumption that consists in being capable to integrate a QoS predictorplugin. Such a plugin estimates the quality level of an application based on its character-istics and used resources. In the context of computational applications, we consider thatthe predictor plugin provides the runtime of applications according to the performancemodel described in the next section.
5.2 Performance Model
In our current implementation we assume that the computational applications have alinear speedup performance model, where the application runtime is inversely propor-tional to the used number of resources. Moreover, if an elastic application uses less ormore resources during its execution, its remaining runtime changes according to its newnumber of resources. We also assume that based on the application progress and thenumber of resources we can predict its remaining execution time.
In practice, this simple performance model can be replaced by more realistic per-formance models. Examples of such models provided in the literature are [133] forMapReduce applications and [73] for scientific applications.
5.3 Service Level Agreement (SLA)
In this section we define a service level agreement for computational applications. Basi-cally, we make use of a QoS-based SLA metric, called deadline. The deadline, referencedas Adeadline, is a main QoS property of computational applications, which consists inthe overall time for running an application and giving results to its corresponding user.Accordingly, the user pays an amount of money to the provider, called henceforth theapplication price, referenced as Aprice. In the following, we define the SLA contract andclasses, propose revenue functions, and finally present the SLA lifecycle management.
5.3.1 SLA Contract
We consider an SLA contract where the user provides the description of the application.The application description contains the application characteristics such as its resourceconsumption pattern, and requirements in terms of software and hardware dependen-cies. Based on this description the PaaS system predicts the application runtime and
76

Chapter 5. Computational Applications
calculates the corresponding deadline and price. The application’s deadline is calcu-lated as the sum of its predicted runtime, Aruntime, and the required time for processingthe application submission, Aprocessing, as seen in Equation 5.1a. The processing timeincludes the time for getting and configuring resources in order to host the application.The application’s price is calculated as the product of its runtime, used resources andthe resources price set by the provider, as seen in Equation 5.1b. If an application usesdifferent quantities of resources during its execution, the price function will be decom-posed in multiple runtime periods where in each period the application uses the sameamount of resources. For example, if an application uses AR1 resources during a periodAp1 and AR2 resources during a period Ap2, its price would be calculated as seen inEquation 5.1c. If the agreed application’s deadline is exceeded, a penalty is calculatedaccording to a specific function and deduced from the initial price in order to providethe real provider revenue (see Equation 5.1d).
Adeadline = Aruntime + Aprocessing (5.1a)
Aprice = Aruntime × AR × Rprice (5.1b)
Aprice = (Ap1 × AR1 + Ap2 × AR2)× Rprice (5.1c)
Arevenue = Aprice − Apenalty (5.1d)
5.3.2 SLA Classes
In order to target a wide range of consumers, service providers may propose several lev-els of QoS and corresponding prices. We call each QoS level and its corresponding pricean SLA class. In our scenario, an application with a high SLA class has a shorter deadlineand a higher price compared to the deadline and the price of the same application witha lower SLA class, taking into account the minimal possible application’s runtime. Onone hand, the SLA classes give many choices to customers for hosting their applicationsaccording to their preferences, best price or best QoS level. On the other hand, the SLAclasses enable the providers to leave a margin when hosting applications with low SLAclasses in order to serve applications with high SLA classes in peak periods .
We set a number of SLA classes, from the highest to the lowest one. Specifically, wedefine a deadline margin and a price factor for each SLA class, used to be multipliedrespectively by the initial deadline and price, calculated in Equations 5.1 according tothe predicted application’s runtime (see Equations 5.2). The deadline margin and theprice factor are set to be inversely proportional.
Adeadline_class = Adeadline ×margin_class (5.2a)
Aprice_class = Aprice × f actor_class (5.2b)
77

5.3. Service Level Agreement (SLA)
5.3.3 Revenue Functions
Provider revenues depend on their capacity to provide the QoS promised in the SLAsof their hosted applications. In our scenario, if the provider fails to give applications’results before their deadlines, the corresponding applications’ revenues decrease ac-cording specific revenue functions. We call the difference between the initially expectedapplication’s revenue and the real application’s revenue a penalty, referenced as Apenalty.
In this section we define three revenue functions for calculating an application’spenalty: linear, bounded linear and step. The three functions depend on the delay todeliver results to the user, where an application’s delay is calculated as the differencebetween the real application’s completion time and its agreed deadline and is referencedas Adelay. In the following we describe each revenue function.
5.3.3.1 Linear
The linear function consists in increasing the penalty linearly to the increase of the delay.Specifically, it calculates the penalty according to the delay and an α value determininghow fast the penalty increases, as seen in Figure 5.1. Specifically, the penalty is calculatedas a delay coefficient (delay divided by the deadline) multiplied by the application pricedivided by α (see Equation 5.3). A high α value is more advantageous for the providerwhile a low one is more advantageous for the user. An α value is defined by the providerfor each SLA class; the higher the SLA class, the lower the alpha value.
Apenalty =Adelay
Adeadline×
Aprice
α, α > 0 (5.3)
Deadline Completion time
Revenue
Price
Delay
Penalty
Figure 5.1: Linear revenue function
5.3.3.2 Bounded linear
The bounded linear function is quite similar to the linear function. However, the penaltyis bounded to a maximum value defined by the provider in order to limit its loss of in-comes (see Figure 5.2). Initially, the penalty is calculated exactly as in the linear function(Equation 5.3) then it is compared to a defined maximum penalty value. If it is greater,its value gets the maximum penalty value (see Equation 5.4). Otherwise, it keeps thesame value.
If (Apenalty > penaltymax) then Apenalty ← penaltymax (5.4)
78

Chapter 5. Computational Applications
Deadline Completion time
Revenue
Price
Delay
Penalty
Bound
Figure 5.2: Bounded linear revenue function
5.3.3.3 Step
The step function consists in many constant values of revenues (see Figure 5.3). Eachvalue corresponds to a completion time interval. Given that the penalty is the differ-ence between the revenue and the initial price and the delay is the difference betweenthe completion time and the deadline, the penalty gets a specific value for each delayinterval (see Equation 5.5). A set of penalty values are defined by the provider for eachSLA class; the higher the SLA class, the higher the penalty value.
Apenalty =
C1 for 0 � Adelay � x1
C2 for x1 � Adelay � x2
...
Cn for xn−1 � Adelay
(5.5)
Deadline Completion time
Revenue
Price
Delay
Penalty Level 1 Level 2
Level n
x1 x2 ….. xn
Figure 5.3: Constant revenue function
5.3.4 Lifecycle
As mentioned earlier, to enable the PaaS system to propose SLAs, first of all the userprovides a description of the application to host. Based on this description and theused predictor plugin, the computational application manager provides the user witha set of pairs (deadline, price), each pair corresponding to an SLA class, and lets theuser select one of them. If the user does not agree with any proposed pairs she may
79

5.4. Bids Heuristics
propose one of the two SLA metrics. Then, whenever possible the provider proposesaccordingly the second SLA metric for each SLA class if this is feasible. For instance,if the user has budget constrains, she may impose a price and the manager gives thecorresponding deadline. Otherwise, if the user’s application is urgent, she may imposea deadline and the manager gives the corresponding price. If the proposed SLA metric isnot acceptable to the system, the user may propose another one and a new negotiationround is launched until the user and the provider agree. Based on the agreement,resources are provisioned and configured for hosting the application. At the end of theapplication execution, if the agreed deadline is exceeded, the penalty to be paid by theprovider is calculated according to the delay and the used revenue function.
5.4 Bids Heuristics
As seen in the previous chapter, several options are possible when the PaaS system re-ceives a request for hosting a new application, see Figure 5.4. The main options arethe use of available private resources or public cloud resources. With the optimizationpolicy there are two more options. Specifically, when no private resources are availableand the cost of public resources is higher than the cost of private resources, each appli-cation type-specific group is asked to propose donating and waiting bids for providing anumber of resources. The donating bid is calculated as the sum of the possible penaltiesof the applications that may be affected to donate the required resources. The waitingbid is calculated as the possible penalty of the new application due to waiting privateresources to become available. In the following we present the heuristics for providingcomputational applications donating and waiting bids.
Private resources Public resources
Available Donating bid Waiting bid
Hosting options
Figure 5.4: Hosting options
5.4.1 Waiting Bid
To propose a waiting bid, the computational applications’ manager considers waitingprivate resources used by the running applications to become available. The requiredtime for a running computational application to finish and release its resources is de-duced from its predicted runtime and referenced henceforth as Await. Such a waitingtime may impact the deadline of the new application with a specific delay that leads to apenalty, which is called henceforth application’s waiting bid and referenced as Await_bid.The group’s waiting bid is then calculated as the smallest possible application’s waitingbid.
80

Chapter 5. Computational Applications
Specifically, we calculate the group’s waiting bid as shown in Algorithm 6. First, thecomputational application manager performs an ascending sort of the applications be-longing to the group according to their waiting bid. Afterwards, in a loop the managerselects the application with the smallest waiting bid and compares the number of itsprivate resources to the number of missing resources. If it is greater or equal, the man-ager considers the application’s waiting bid as the group waiting bid and exits the loop.Otherwise, the manager increments a variable R f ound by the number of the application’sprivate resources. Then, it selects the next application with the smallest waiting bid andperforms the same check, and so on for the rest of applications. The manager exits theloop if (1) it finds an application holding enough resources, or (2) the number of foundresources in the variable R f ound becomes greater or equal to the missing resources. Thus,the group’s waiting bid is respectively (1) the selected application’s waiting bid, or (2)the waiting bid of the last application having incremented R f ound.
Algorithm 6: Waiting bid of computational applications’ groupData: Rmissing, reqResult: Gwait, Gwait_bid
1 ∀Ai ∈ GA, calculate (Aiwait, Ai
wait_bid) ;2 sort(GA, Ai
wait_bid) ;3 // initializing variables ;4 Gwait ← ∞ ; Gwait_bid ← ∞ ;R f ound ← 0 ; ;5 for (i← 1 to |GA|) do6 if (Ai
private > Rmissing) then7 Gwait_bid ← Ai
wait_bid ;8 Gwait ← Ai
wait ;9 break ;
10 else11 R f ound+← Ai
private ;12 if (R f ound > Rmissing) then13 Gwait_bid ← Ai
wait_bid ;14 Gwait ← Ai
wait ;15 break ;16 end17 end18 end19 return Gwait, Gwait_bid ;
5.4.2 Donating Bid
To propose a donating bid, the computational applications’ manager considers impact-ing its applications using one of three possible forms of impact. The first form, calledpartial lending, consists in lending a subset of application resources to the request, theapplication continues running with the remaining resources, and gets back the borrowedresources once the request finishes its execution. The second form, called total lending,consists in suspending the application, lending all its resources to the request, and re-
81

5.4. Bids Heuristics
suming it once the request finishes its execution. The third form of impact, called giving,consists in giving a subset of application resources to the request and finish its executiononly with the remaining VMs. The three forms of impact may potentially lead the ap-plications to exceed their agreed deadlines by a given delay. Obviously, the estimationof the delay depends on the form of impact. Note that the rigid applications may beimpacted only with a total lending while the elastic applications may undergo the threeforms of impact. In the next subsections we explain in more detail how we estimatethe delay of each of the rigid and elastic applications. Based on the delay and the usedrevenue function we calculate the possible penalty of each application (see Section 5.3.3).
We calculate the group’s donating bid similarly to what we do for calculating thegroup’s waiting bid. As shown in Algorithm 7, we calculate the applications penalty aswell as their impact. The application impact is calculated here as a ratio between thedelay and the deadline (see Equation 5.6). Then, we perform an ascending sort of theapplications according to their penalties. The group’s donating bid may be obtainedfrom only one application that holds enough private resources for the request or froma number of applications. In the second case the group’s donating bid is calculatedas the sum of penalties of all the applications to impact. The number of applicationsto be impacted for providing the bid is counted in order to provide the percentage ofimpacted applications if this group’s bid is selected.
Aimpact =Adelay
Adeadline× 100 (5.6)
5.4.2.1 Rigid Applications Delay
To estimate the delay of a rigid application, we consider impacting the application witha total lending impact form. Thus, the application is suspended during a requestedduration that includes the request runtime and the time for transferring the resourcesto the request and getting them back later. Thus, we first compute the application’sspent time from its submission until the time the request is received, (see Figure. 5.5).Then, we deduce the remaining time as the predicted application’s runtime minus thespent time. Afterwards, we estimate the time when the application ends its execution asthe remaining time plus the requested duration and compare it to the deadline. If theestimated application’s end time is before the deadline, then the delay is zero. Otherwisethe delay is calculated as the difference between the end time and the deadline.
5.4.2.2 Elastic Applications Delay
To estimate the delay of an elastic application we first have to select the correct formof impact. If the application holds the requested number of resources or less, the ap-plication may only be impacted with a total lending and its delay is calculated in thesame way as that of a rigid application. Otherwise, if the application holds more re-sources than requested, we estimate its delay that corresponds to the partial lending andthe giving impact forms. Then, we select the form of impact according to the smallestcorresponding penalty. Initially for both impact forms we calculate the spent time andthe remaining time of the application, as we do for rigid applications. However, theremaining time of the application changes in a different way according to the impactform, see Figure. 5.5. With the giving form, we assume that the predictor plugin is able
82

Chapter 5. Computational Applications
Algorithm 7: Donating bid of computational applications’ groupData: Rmissing, reqruntime, AthresholdResult: Gdonating_bid, Gdonating_impact
1 ∀Ai ∈ GA, calculate Aipenalty and Ai
impact ;
2 sort(GA, Aipenalty) ;
3 // initializing variables ;4 Gdonating_bid ← ∞; R f ound ← 0; donating_bid← 0; donating_impact← 0 ;5 for (i← 1 to |GA|) do6 if (Ai
private > Rmissing) then7 if (Ai
penalty 6 Gdonating_bid) ∧ (Aiimpact 6 Athreshold) then
8 Gdonating_bid ← Aipenalty ;
9 donating_impact← 1 ;10 break ;11 end12 else13 if (Ai
impact 6 Athreshold) then14 R f ound+← Ai
private ;15 donating_bid+← Ai
penalty ;
16 impact ++ ;17 if (R f ound > Rmissing) then18 Gdonating_bid ← donating_bid ;19 break ;20 end21 end22 end23 end
24 Gdonating_impact ←(
Gimpact100 ×|GA|)+donating_impact
|GA| ;
25 return Gdonating_bid, Gdonating_impact ;
83

5.5. Summary
to predict the application remaining time based on the progress of the application ex-ecution, the number of remaining resources, and the application performance model.With the partial lending form, the predictor estimates the application runtime accordingto two phases. In the first phase, during the requested duration, the application runswith the remaining resources and in the second phase, after getting back the borrowedresources, the application runs with all its resources.
Total Lending
Runtime Deadline Spent time
Requested duration
Remaining time
Start Request
Delay
new Remaining time
End Remaining time
Runtime Deadline Spent time Remaining time
Start Request
Delay End Giving
new Remaining time
Runtime Deadline Spent time Remaining time
Start
Request
Delay End Partial Lending
Requested duration Progress
Figure 5.5: Application times according to the three impact forms.
5.5 Summary
In this chapter we investigated computational applications, proposed SLA metrics andfunctions, and presented the corresponding donating and waiting bid heuristics for max-imizing the PaaS provider profit. Basically, when the PaaS system receives a request forhosting a new application and private resources are not readily available, each applica-tion type-specific group is asked to propose donating and waiting bids for providing anumber of resources. We proposed a computational applications waiting bid heuristicthat estimates the required time for applications to finish their execution and calculatesthe possible penalty of the new application accordingly. Then, it tries to provide thewaiting time generating the smallest possible penalty of the new application. We alsoproposed a computational applications donating bid heuristic that calculates the bidbased on the possible penalties of the running applications providing some of their re-sources. We defined three forms to be used by computational applications for providingresources during their execution. The first form, partial lending, consists in lending a partof running applications resources to the new application and continue running with theremaining resources until the new application gives back the borrowed resources. Thesecond form, total lending, consists in suspending the running applications during theexecution of the new application and resuming them once the new application finishesits execution. The third form, giving, consists in giving a part of the running applicationsresources to the new application and continue their execution only with the remainingresources. The partial lending and giving forms of impact may be used only by elasticapplications. Each form leads to a different penalty for applications . Thus, the heuristic
84

Chapter 5. Computational Applications
selects the impact form causing the smallest penalty.In the next chapter we present the design and implementation of an open cloud-
bursting PaaS system able to incorporate the proposed profit optimization model aswell as the computational applications heuristics presented in this chapter.
85

5.5. Summary
86

Chapter 6
Meryn: an Open Cloud-BurstingPaaS
Contents6.1 Design Principles . . . . . . . . . . . . . . . . . . . . . . . . . . . . . . . . 86
6.2 System Architecture . . . . . . . . . . . . . . . . . . . . . . . . . . . . . . 86
6.2.1 Overview . . . . . . . . . . . . . . . . . . . . . . . . . . . . . . . . 87
6.2.2 Components . . . . . . . . . . . . . . . . . . . . . . . . . . . . . . . 87
6.2.3 Application Life-Cycle . . . . . . . . . . . . . . . . . . . . . . . . . 89
6.2.4 VC Scaling Mechanisms . . . . . . . . . . . . . . . . . . . . . . . . 90
6.3 Implementation . . . . . . . . . . . . . . . . . . . . . . . . . . . . . . . . . 90
6.3.1 Frameworks Configuration . . . . . . . . . . . . . . . . . . . . . . 90
6.3.2 Components Implementation . . . . . . . . . . . . . . . . . . . . . 91
6.3.3 Parallel Submission Requests . . . . . . . . . . . . . . . . . . . . . 92
6.3.4 Cloud Bursting . . . . . . . . . . . . . . . . . . . . . . . . . . . . . 93
6.4 Summary . . . . . . . . . . . . . . . . . . . . . . . . . . . . . . . . . . . . 93
In the two previous chapters we presented a set of heuristics providing a completeview of our profit optimization model for PaaS providers. This model requires to be
incorporated in a real PaaS system providing support to specific features, in order to beable to evaluate its efficiency. In this chapter we present Meryn, our PaaS design andarchitecture, providing all the features required by our profit optimization model.
This chapter is organized as follows. Section 6.1 discusses the design principles ofMeryn. Section 6.2 describes the Meryn system architecture. Section 6.3 presents theimplementation details of the Meryn prototype. Finally, Section 6.4 summarizes thischapter.
87

6.1. Design Principles
6.1 Design Principles
Our main goal in designing a PaaS system architecture is to provide support for the mainrequired features enabling the provider to optimize its profit. Specifically, as discussedin Section 3.1, to achieve our objectives we need a PaaS system supporting cloud burstingand extensibility regarding application types. The majority of existing PaaS systems donot provide such features. They either focus on specific application types or rely onspecific infrastructures. Therefore, we made three key design decisions in designing ourPaaS system, called Meryn1.
The first decision concerns the resource granularity. We chose to use virtual ma-chines (VMs) as the basic resource unit running applications. Thus, each applicationis separately hosted on at least one virtual machine. Our choice is motivated by thewell-know advantages of virtualization in terms of flexible resource control and isola-tion. Moreover, as we aim at being extensible to host several application types, the useof virtual machines is more advantageous than the use of system containers because itenables hosting applications with different operating system requirements (find moredetails in Section 2.4.2.2). Furthermore, using this approach private resources and re-sources dynamically leased from public clouds can be managed in a similar way, whichgreatly simplifies the resources management as well as the deployment and accountingof the resources consumed by each application.
The second decision concerns the use of existing programing frameworks to managethe supported application types. A great variety of frameworks have proven to be widelyuseful and are currently part of PaaS offerings, including web application frameworks,MapReduce, batch frameworks, and task framing frameworks. These frameworks em-ploy sophisticated scheduling and resource management policies, optimized to supportthe quality objectives of framework-based applications. The key idea here is to facili-tate the extensibility of the PaaS system with the support of new application types withminimal effort.
The final decision concerns the division of resource management responsibilities be-tween the frameworks and the PaaS system. We adopt a decentralized architecture inwhich the frameworks collaborate though exchanging resources with the aim of increas-ing the provider profit. Compared to a centralized architecture, the advantage of thisapproach is that it imposes minimal changes on the frameworks, thus facilitating theextensibility of the PaaS system. Indeed, the frameworks continue to take most of theresource management decisions regarding their hosted applications, taking advantageof their application type-specific knowledge to better satisfy their SLA objectives.
6.2 System Architecture
In this section we present the system architecture of Meryn, our open cloud-burstingPaaS system. First, we present a high level overview. Then, we provide more detailsabout the system components, the application life-cycle and and used scaling mecha-nisms.
1Meryn is an Arabic word ( àQÓ) that means Flexible and Elastic.
88

Chapter 6. Meryn: an Open Cloud-Bursting PaaS
6.2.1 Overview
The overall Meryn architecture is illustrated in Figure 6.1, where private resources con-sist in a fixed number of VMs shared between multiple elastic Virtual Clusters (VCs).We define a VC as a set of VMs running on private resources plus possibly some VMsrent from public IaaS clouds. Each VC is associated with an application type-specificgroup and is managed by a specific framework. For example, it is possible to use theOracle Grid Engine (OGE) framework to manage a VC that hosts batch applications, andthe Hadoop framework to manage a VC that hosts MapReduce applications.
Note that for each framework we create a set of customized VM disk images withthe suitable software stack, used to create VMs of the corresponding VC. Each VC hasan initial amount of resources. Then, according to specific policies VCs may exchangethe private resources among each other. The overall resource management is fully de-centralized where each VC autonomously manages its own resources and decides whento burst into public cloud resources. The end users submit their applications through acommon and uniform interface, whatever the type of their applications.
Public Cloud 1 Public
Cloud 1
Submission Interface Submission Interface Submission Interface Submission Interface
Public Cloud 2
Private Resources
VC 1 VC 2 VC 3
App. 1 App. 2 App. 3 Private VMs Public cloud VMs
Figure 6.1: Meryn architecture overview
6.2.2 Components
The main components of the Meryn system, shown in Figure 6.2, are a Client Manager, aCluster Manager for each VC, an Application Controller for each hosted application and aResource Manager.
Most frameworks consist of one master daemon and a set of slave daemons. InMeryn, we run the master daemon separately on one or more private VMs, called MasterVM(s), and the slave daemons either on private VMs or public cloud VMs, called SlaveVMs. The master VMs are shared between all the applications hosted in the same VCand run the Cluster Manager component as well as the Application Controllers of theapplications running on the VC. The slave VMs are dedicated to applications and runtheir corresponding code. In the following we give more details about each Meryncomponent.
• Client Manager. The Client Manager is the entry point of the system providingusers with a uniform submission interface. It is responsible for receiving sub-mission requests and transferring them to the corresponding Cluster Manager. It
89

6.2. System Architecture
also enables users to get the results of their applications. Meryn may have severalClient Managers in order to avoid a potential bottleneck, which could happen inpeak periods.
• Cluster Manager. The Cluster Manager plays the role of the application type-specific manager and consists of two parts, a generic part and a framework-specificpart. The generic part is the same for all Cluster Managers and consists in man-aging resources and deciding when to horizontally scale up and down. Specifi-cally, the Cluster Manager has to decide when releasing resources to other VCs,when to acquire resources from other VCs and when to rent resources from publicclouds. The framework-specific part depends on the hosted type of applicationsas well as the used framework. This part wraps the interface of the frameworkto enable a standardized interaction between the Client Manager and the ClusterManagers of all the supported application types. The wrapping implementationtranslates for example the submission request template of the Client Manager to asubmission request template compatible with the framework. Moreover, depend-ing on the hosted application type, this part implements a QoS predictor pluginand proposes corresponding SLA metrics accordingly. Consequently, the exten-sion of Meryn with the support of a new application type requires three terms:(1) creating a new VC, (2) managing the VC and the applications using the cor-responding framework, and (3) implementing the application type-specific part ofthe Cluster Manager.
• Application Controller. The Application Controller is responsible for monitoringthe execution progress of its associated application as well as the satisfaction ofits agreed SLA. This component is mainly based on mechanisms provided by theframework.
• Resource Manager. The Resource Manager provides support to functions for ini-tially deploying the PaaS system and for transferring VMs from one VC to anotherone. The Resource Manager interacts with a VM manager software, such as Open-Stack [5], OpenNebula [123] or Snooze [86].
Cluster Manager Cluster Manager Cluster Manager
Client Manager Client Manager
Resource Manager
SlavesMaster
App
lica
tion
Con
trol
lers
...... ...
VC 1 VC 2 VC 3{Master Slaves Master Slaves
VM Management System
Figure 6.2: Meryn components
90

Chapter 6. Meryn: an Open Cloud-Bursting PaaS
6.2.3 Application Life-Cycle
The application life-cycle is shown in Figure 6.3. The process starts when the usercontacts the Client Manager and gives a description of her application using a standard-ized template provided by the submission interface. The application description shouldmainly characterize the application in terms of resource consumption requirements aswell as software dependencies. Based on the application description the Client Managerdetermines its corresponding VC and acts as an intermediary between the user and theCluster Manager. The Cluster Manager and the user negotiate the SLA terms, throughthe Client Manager, until a mutual agreement. Then, the user transfers the executablefile and the needed input data of the application to the corresponding VC.
The Cluster Manager translates the application description to a template compatiblewith the corresponding framework, launches a new Application Controller instance,and submits the application to the framework. The Application Controller monitors theapplication progress and regularly checks the satisfaction of its agreed SLA. If an SLAviolation is detected, the Application Controller computes the corresponding penaltyand informs the Cluster Manager. Finally, the Client Manager provides a way for theuser to retrieve the results of her application from the Cluster Manager.
Client Manager Framework Cluster Manager Cluster Manager
Describe application Transfer description
SLA negotiation
Agree SLA
Upload application files
Allow uploading
Translate standard template to framework template
Application Controller
Create Application Controller
Submit application
Run application
Monitor application
SLA violation
Enforce SLA Application end
Application results
Figure 6.3: Application life-cycle
91

6.3. Implementation
6.2.4 VC Scaling Mechanisms
Horizontally scaling up a VC is performed either using private VMs taken from the otherVCs or using public clouds VMs. Below we describe the used technical mechanisms foreach option.
Obtaining VMs from other VCs. The transfer of VMs from a source VC to a desti-nation VC operates as follows. First, the Cluster Manager of the source VC selects theVMs to remove, removes them from the framework and requests the Resource Managerto shut them down. Then, the Cluster Manager of the source VC informs the ClusterManager of the destination VC about the availability of the VMs. The Cluster Managerof the destination VC requests the Resource Manager to start new VMs with the corre-sponding VM disk image, gets their corresponding IP addresses, configures them andadds them to its framework resources.
Obtaining VMs from Public Clouds. The cloud bursting mechanism of a VC oper-ates as follows. First, the Cluster Manager of the corresponding VC requests a selectedpublic cloud to create the VMs, gets their corresponding IP addresses, configures themand adds them to its framework resources. When the VC finishes using the public VMs,its Cluster Manager removes the VMs from the framework and asks the correspondingpublic cloud to stop them. Note that before enabling a VC to burst into public clouds,we first make sure that the corresponding VM disk images are saved in the set of publicclouds that may be used.
6.3 Implementation
We have developed a Meryn prototype in about 4,000 lines of shell script. The proto-type is built upon the Snooze VM manager software for virtualizing the private physicalresources. The prototype provides support to batch and MapReduce applications usingrespectively Oracle Grid Engine OGE 6.2u7 and Hadoop 0.20.2 frameworks. In the fol-lowing we describe the configuration of each framework, the implementation details ofeach Meryn component, the management of parallel submissions, and the implementa-tion of the bursting mechanism.
6.3.1 Frameworks Configuration
The two used frameworks have different structures and mechanisms for scheduling jobs.The OGE framework operates as any classic batch scheduler (as seen in Figure 2.1),where the Hadoop framework has specific configurations and scheduling mechanismsfor running data intensive applications. Therefore, we configured differently each frame-work such that we get more control over the assignment of resources to applications.
OGE. We set the OGE virtual cluster such that it consists of one master node run-ning the sgemaster daemon and a number of slave nodes, each node running an sgeexecdaemon. The slave nodes are set such that each node cannot host more than one applica-tion. However, one application may run on multiple slave nodes. Furthermore, the slavenodes are set to belong to a unique queue that handles all the submissions. In order tocontrol the submitted jobs spend in the queue, our policy specifies the hostname of theslave node(s) to use for hosting the new job .
92

Chapter 6. Meryn: an Open Cloud-Bursting PaaS
Hadoop. The default Hadoop scheduler performs a fair assignment of resourcesto jobs. For instance, when there is only one job running in the cluster, the job usesall the resources. If other jobs are submitted some resources are assigned to the newjobs, so that each job gets on average the same amount of CPU time. This schedulingmechanism, performed by the JobTracker daemon, makes it complex to predict the ap-plication runtimes. Therefore, we setup our Hadoop virtual cluster to have multiplesub-clusters, such that each sub-cluster runs a separate JobTracker daemon and hostsonly one application. Each application sub-cluster consists on at least one node runningthe JobTracker and TaskTracker daemons. When required by the application, its sub-clustermay hold additional nodes running the Tasktracker daemon. Furthermore, we configuredthe Hadoop storage nodes to be shared between all the hosted applications. The storagenodes consists in one node running the NameNode daemon and a set of nodes runningthe DataNode daemon to store data and ensure replicas. In our Meryn prototype we runthe Cluster Manager and Application Controllers components on the node running theNameNode daemon. Finally, the free nodes belonging to the VC do not have any particu-lar function and do not run any daemon. When a new MapReduce application needs tobe hosted, we configure and start daemons in a number of free nodes according to theapplication requirements.
Free nodes
Sub-clusters Storage
JobTracker + TaskTracker
TaskTracker NameNode (Master)
DataNode
Figure 6.4: Configuration of the Hadoop VC
6.3.2 Components Implementation
In the following we present the important implementation aspects of each Meryn com-ponent.
Client Manager. We implemented a command line interface for submitting applica-tions where the client has to fill a submission template, such as the example shown inthe Extract 6.1. The main required fields are the application type (batch or MapReduce),the number of processes, the path to the source code file and possibly the required pa-rameters. Note that the path should be accessible by the Client Manager for uploadingthe source code. The Client Manager transfers the information provided in the templateto the corresponding Cluster Manager, using the Secure Copy Protocol (SCP). The re-quired interaction between the client and the Cluster Manager to negotiate SLA is alsoperformed using files exchanges between the Cluster Manager and the Client Managerwith SCP. After an SLA agreement, the Client Manager transfers the template file as well
93

6.3. Implementation
as the application source files to the Cluster Manager for performing the submission.
Extract 6.1: Example of job submission template
# User InputType=mapreduceNb_processes=1S o u r c e _ f i l e =/tmp/hadoop/benchmarks . j a rParameters ="Benchmark2 /data/ v i s i t s / output/aggre101/ −m 10 −r 3"
# SLADeadline =1230P r i c e =.08668800Class=Medium
Cluster Manager. First, to enable a framework to add a new VM, the Cluster Man-ager starts on the new VM the corresponding daemon and informs the master daemonabout its availability. Inversely to remove a VM, the Cluster Manager asks the masterdaemon to remove it from the list of its slave nodes, then it optionally stops the daemonrunning on the VM. Then, to standardize the basic actions performed on the applicationssuch as start/stop and suspend/resume, the Cluster Manager wraps the functionalitiesprovided by each framework’s management tool with common commands. Finally, theCluster Manager implements the policies described in Chapters 4 and 5 for making de-cisions about resources provisioning and assignment, in about 400 lines of Java code andinteracts with them through synchronized read/write operations in XML files.
Application Controller. The Application Controller regularly gets the state of itscorresponding application using commands provided by the programing frameworkand checks its number of resources. We implemented an Application Controller specificto computational applications that also checks the elapsed runtime of applications andcompares it to their agreed deadline. If the agreed deadline is violated, the ApplicationController informs the Cluster Manager. If the real application completion time exceedsits expected deadline, the Application Controller computes the corresponding penaltyand informs the Cluster Manager.
Resource Manager. The Resource Manager interacts with Snooze through its Lib-cloud API for creating and removing VMs either for initially deploying the VCs of thePaaS system or upon Cluster Manager request for VMs exchange.
In the current deployment, we host the Client Manager and Resource Manager com-ponents in one physical node, hosting also some Snooze daemons and not used for cre-ating virtual machines. In a production deployment, we can host separately the ClientManager in a front-end web node.
6.3.3 Parallel Submission Requests
In order to handle requests submitted in parallel and provide consistent resource as-signment, we implement two mechanisms. First, we use mutual exclusion mechanismsto access the parts of code checking or modifying the resources availability and status.Second, we use a reservation flag to tag resources (1) under SLA negotiation, (2) waitedfor by an application or (3) lent to an application for a specific duration that should be
94
Chapter 6. Meryn: an Open Cloud-Bursting PaaS
reassigned to their initial application. The tagged resources may not be assigned to anyapplication until they are untagged.
6.3.4 Cloud Bursting
To enable each VC to burst into public clouds, we set in a specific config file of theCluster Manager the IP addresses and the user account credentials of the entry pointof each supported public cloud provider. Currently, we deploy a second instance of theSnooze VM manager in remote resources accessed over a wide-area network from thedeployed Meryn prototype.
6.4 Summary
In this chapter we presented the design, architecture and implementation of Meryn, ouropen cloud-bursting PaaS system. The architecture relies on private virtual machinesand may burst into virtual machines from public cloud providers. To enable Meryn tosupport extensibility regarding application types, we make use of independent virtualclusters. Each virtual cluster is managed using an existing framework dedicated to aspecific application type. In the next chapter we evaluate our profit optimization modelusing the Meryn prototype.
95

6.4. Summary
96

Chapter 7
Evaluation
Contents7.1 Evaluation Setup . . . . . . . . . . . . . . . . . . . . . . . . . . . . . . . . 96
7.1.1 Meryn Prototype . . . . . . . . . . . . . . . . . . . . . . . . . . . . 96
7.1.2 Policies . . . . . . . . . . . . . . . . . . . . . . . . . . . . . . . . . . 96
7.1.3 Workloads . . . . . . . . . . . . . . . . . . . . . . . . . . . . . . . . 97
7.1.4 Pricing . . . . . . . . . . . . . . . . . . . . . . . . . . . . . . . . . . 97
7.1.5 SLAs . . . . . . . . . . . . . . . . . . . . . . . . . . . . . . . . . . . 98
7.1.6 Grid’5000 testbed . . . . . . . . . . . . . . . . . . . . . . . . . . . . 98
7.1.7 Evaluation Metrics . . . . . . . . . . . . . . . . . . . . . . . . . . . 99
7.2 Simulations . . . . . . . . . . . . . . . . . . . . . . . . . . . . . . . . . . . 100
7.2.1 Environment Setup . . . . . . . . . . . . . . . . . . . . . . . . . . . 100
7.2.2 Results . . . . . . . . . . . . . . . . . . . . . . . . . . . . . . . . . . 101
7.3 Experiments . . . . . . . . . . . . . . . . . . . . . . . . . . . . . . . . . . . 105
7.3.1 Measurements . . . . . . . . . . . . . . . . . . . . . . . . . . . . . 105
7.3.2 Environment Setup . . . . . . . . . . . . . . . . . . . . . . . . . . . 107
7.3.3 Results . . . . . . . . . . . . . . . . . . . . . . . . . . . . . . . . . . 110
7.4 Summary . . . . . . . . . . . . . . . . . . . . . . . . . . . . . . . . . . . . 115
In this chapter we evaluate the contributions of this PhD thesis. The purpose of ourevaluations is to show the efficiency of the proposed profit optimization policies in
increasing the provider profit as well as in satisfying SLAs and QoS properties requiredby the clients. This chapter is organized as follows. Section 7.1 describes our evaluationsetup, specifying the configuration parameters of the Meryn prototype and optimizationpolicies, and describing the used workloads, pricing model, SLA classes, revenue func-tions, and testbed. It also defines the used evaluation metrics. Section 7.2 presents a firstevaluation based on simulations and discusses the corresponding results. Section 7.3presents a second evaluation based on experiments and discusses the correspondingresults. Finally, Section 7.4 summarizes this chapter.
97

7.1. Evaluation Setup
7.1 Evaluation Setup
This section discusses the evaluation setup used in both the simulations and the exper-iments. We describe the setup of the Meryn prototype, the profit optimization policiesand the submitted workloads. We also present the used configuration of resources costsand prices as well as SLA classes and revenue functions.
7.1.1 Meryn Prototype
As shown in Figure 7.1, we configured the Meryn prototype with two VCs, one VC forMapReduce applications managed with the Hadoop framework and one VC for batchapplications managed with the OGE framework. We used a VM instance model similarto the Amazon EC2 medium instance1, which consists of 2 CPUs and 3.75 GB of memory.The Snooze managed private cloud is configured to have 100 VMs. Thus, we assigned50 private VMs to each VC. We assume that the number of VMs available in the Snoozemanaged public cloud, able to be rent as public VMs, is infinite.
Submission Interface Submission Interface Submission Interface Submission Interface
Private Resources
Hadoop OGE
Public VMs Private VMs
Remote Resources (Public cloud)
Figure 7.1: Meryn prototype configuration.
7.1.2 Policies
We evaluate and compare the efficiency of the three policies described in Chapter 4:basic, advanced and optimization. The basic policy statically partitions the private re-sources between the groups and hosts applications using public resources each time thegroup has no more available private resources. The advanced policy offers more flexi-bility than the basic policy. It enables the exchange of resources between the applicationtype-specific groups and the deployment of applications simultaneously on private andpublic resources. The optimization policy goes one step further than the advanced pol-icy. In order to optimize the provider profit, it considers either impacting the QoS levelof running applications to host a new application or impacting the QoS level of the newapplication due to waiting for private resources to become available. Accordingly, wedefine two threshold setups for both the ratio of applications in the PaaS system that
1http://aws.amazon.com/ec2/instance-types/ [Online; accessed February 2013]
98

Chapter 7. Evaluation
may be impacted and the allowed impact on the impacted applications. In the firstsetup, referenced henceforth as opt1, the threshold of applications ratio able to be im-pacted is set to 20% and the threshold of the allowed applications impact is set to 50%.In the second setup, referenced henceforth as opt2, the threshold of applications ratioable to be impacted is set to 50% and the threshold of the allowed applications impact isset to 100%. Overall, the opt2 policy is more aggressive than the opt1 policy in impactingapplications.
7.1.3 Workloads
We submit to the Meryn prototype simultaneously two workloads, one for the batchVC and one for the MapReduce VC. The batch workload follows the Lublin workloadmodel [118]. To adapt this workload model to our scenario, we consider the number ofnodes in each Lublin request as the number of VMs in a job and limit this number to128 simultaneous VMs for one job. In order to generate a shorter workload we changedthe following parameters of the Lublin workload model: the number of jobs from 1000to 100, the maximum job runtime from two days to one hour, and the maximum inter-arrival time from five days to half an hour.
The MapReduce workload is based on the distribution of job sizes and inter-arrivaltimes seen at Facebook over a week in october 2009, reported in [155]. The workloadconsists of 100 jobs randomly submitted over 25 minutes with a mean inter-arrival timeof 14s. The jobs are instances of the four queries of Hive benchmarks [48]: text search(grep), selection, aggregation, and join. Basically, there are ten job instances submitted anumber of times such that the total number of submitted jobs is 100. Each job instanceruns one of the four Hive queries and uses a specific number of mappers and reducers.To determine the runtime of each job instance in the workload, we generated 2 GBof Grep data, 3 GB of Rankings data, and 2 GB of UserVisits data. Then, we separatelymeasured the average runtime of each job instance using a randomly predefined numberof TaskTracker VMs.
We generated three instances of each workload, batch and MapReduce, and ran-domly combined them to get three workloads (workload 1, workload 2, and workload3).Each workload consists of one batch workload instance and one MapReduce workloadinstance to be submitted together.
7.1.4 Pricing
In our pricing model we assume a per-second billing, following the current trend forincreasingly shorter billing periods in cloud platforms [53]. To calculate the cost andrevenue of applications we defined a cost for public cloud VMs, a cost for private VMs,and a VM price as follows. The cost of a public cloud VM is based on the per-hourAmazon EC2 pricing of a standard medium VM instance in the Ireland datacenter2
divided by 3600 (the number of seconds per hour), giving 0.00003612$/s. The cost ofa private cloud VM is based on the per hour power cost of one core, reported in [144].The reported cost is converted to dollars (with an exchange rate of 1.35), multiplied by2 (as medium VM instances have 2 cores), and divided by 3600 (the number of secondsper hour), giving 0.0000064497$/s. The VM price for end users is calculated as the cost
2http://aws.amazon.com/ec2/pricing/ [Online; accessed June 2013]
99

7.1. Evaluation Setup
of a public cloud VM multiplied per 2, giving 0.00007224$/s. This is justified by the factthat our system offers an extra service compared to IaaS providers.
7.1.5 SLAs
First, we define three SLA classes: high, medium, and low. We randomly distribute theSLA classes among jobs in workloads as follows. We set 10% of jobs with a high SLAclass, 70% of jobs with a medium SLA class and 20% of jobs with a low SLA class.Furthermore, we defined a different deadline margin, price factor, and α value in thelinear and bounded linear revenue functions for each SLA class.
In the bounded linear revenue function, we compute a lower revenue bound for eachapplication according to its SLA class and initial price. Specifically, we define a lowerrevenue percentage compared to the initial price of applications for each SLA class,based on which we deduce the minimum revenue bound for each application. Thevalue of the maximum penalty of each application is then calculated as the applicationinitial price minus the value of the application lower revenue bound.
In the step revenue function, we defined three penalty levels corresponding to threedelay levels. The delay levels are computed for each application as a percentage ofthe agreed deadline and are common for all applications and all SLA classes. The firstdefined level is included between zero and 20% (0 < level 1 6 20%). The second level isincluded between 20% and 50% (20% < level 2 6 50%). Finally, the third level is greaterthan 50% (50% < level 3). For each SLA class and delay level we define a differentpenalty where penalties are calculated as a percentage of the application initial price.
All the defined values for each SLA class are shown in Table 7.1.
Table 7.1: Configuration parameters of SLA classes.High Medium Low
Deadline margin 1 2 3Price factor 3 2 1Linear SLA: α 2 5 20Bounded linear SLA: 10% 20% 30%min revenue percentageStep SLA: 15% 5% 0%L1 delay percentageStep SLA: 30% 15% 5%L2 delay percentageStep SLA: 50% 25% 10%L3 delay percentage
7.1.6 Grid’5000 testbed
Grid’5000 [40] is a testbed supporting experiment-driven research in large scale paralleland distributed computing. It provides 5000 cores geographically distributed on 10 sitesin France (Bordeaux, Grenoble, Lille, Luxembourg, Lyon, Nancy, Reims, Rennes, Sophia-Antipolis, Toulouse) plus one site abroad in Porto Alegre, Brazil. All sites in France areconnected through a 10 Gb/s backbone.
100

Chapter 7. Evaluation
We carried out our simulations and experiments on the Grid’5000 testbed. Accord-ing to our requirements and availability of resources, we have used resources from threeclusters of the Rennes site (paradent, paradent, and parapluie) and two clusters of theNancy site (griffon and graphene). The paradent cluster consists of 64 Carri System CS-5393B nodes supplied with 2 Intel Xeon L5420 processors (each with 2 cores at 2.5GHz),24 GB of memory, and Gigabit Ethernet network interfaces. The parapide cluster con-sists of 25 SUN FIRE X2270 nodes supplied with 2 Intel Xeon X5570 processors (eachwith 2 cores at 2.93 GHz), 24 GB of memory, and Gigabit Ethernet network interfaces.The parapluie cluster consists of 40 HP Proliant DL165 G7 nodes supplied with 2 AMDOpteron(tm) 6164 HE processors (each with 6 cores at 1.7 GHz), 48 GB of memory, andGigabit Ethernet network interfaces. The griffon cluster consists of 92 Carri System CS-5393B nodes supplied with 2 Intel Xeon L5420 processors (each with 2 cores at 2.5GHz),16 GB of memory, and Gigabit Ethernet network interfaces. The graphene cluster consistsof 144 Carri System CS-5393B nodes supplied with 1Intel Xeon X3440 processors (with4 cores at 2.53 GHz), 16 GB of memory, and Gigabit Ethernet network interfaces.
7.1.7 Evaluation Metrics
In this section we describe a set of evaluation metrics used to show to which extent (1)the PaaS provider profit is optimized and (2) the deadlines of computational applicationsare violated.
• Profit. The profit of a workload is calculated as the sum of profits of all the submit-ted jobs from that workload. The profit of one job is calculated as the job’s revenueminus the job’s cost.
• VMs usage proportions. The VMs used for hosting each application are obtainedeither from the private or public IaaS resources (public VMs). The private resourcesmay be obtained either (1) from available VMs on the same VC where the appli-cation is hosted (local VMs), (2) from available VMs on a VC different than theone hosting the application (VC VMs), (3) from running applications, from any VC(donating VMs), or (4) by waiting the execution end of running applications, fromany VC (waiting VMs). The amount of VMs used from each source is calculated asa percentage compared to the total number of VMs used in the workloads.
• Completion time. The completion time of a workload is the elapsed time betweenthe arrival of the first job in the workload and the completion of the final job inthe workload (not necessarily the last submitted one). The goal of this metric is toshow the overhead of the optimization policies.
• Deadline violations. The deadline violations are presented in two ways. The firstway consists in presenting the ratio of the delayed applications in the workloadby counting the number of applications missing their deadlines. The second wayconsists in presenting the average delay percentage of the delayed applications bycomputing the delay percentage of each delayed application.
101

7.2. Simulations
7.2 Simulations
In this section we evaluate our policies through a series of simulations. The objective ofthese simulations is to show the behavior of the policies in mapping the applications onthe resources for optimizing the provider profit. The interest of performing simulationsin our context is the limited amount of needed resources, in contrast to real experiments.In the following we describe the simulations environment setup, then we present andanalyze the results.
7.2.1 Environment Setup
To perform the simulations we used the implemented Meryn prototype with the follow-ing modifications.
1. No VC is really created. Instead, we create a different folder for each VC containingthe corresponding Cluster Manager component, the applications information aswell as their corresponding Application Controller components.
2. We removed the interaction of the Resource Manager with Snooze. Thus, insteadof really creating and removing VMs we simply modify the values of the numberof used and available VMs of the VCs in the corresponding configuration files.
3. The submitted jobs are treated as follows. First we find VMs for hosting themand switch the VMs states from available to busy. Then, instead of really runningthe applications we create a process that sleeps for the entire application runtime.Finally, when the sleep process ends we switch the state of VMs from busy toavailable. We simulate the possibility that applications’ execution time is differentfrom their predicted runtime by adjusting the sleep time
4. We run all Meryn components (Client Manager, Resource Manager, Cluster Man-agers and Application Controllers) in only one physical machine.
Using this prototype, we measured the submission time of an application with differ-ent resource availability scenarios and different VMs requirements (from 1 to 100 VMs).We define the submission time as the required time from the submission of an applica-tion in the PaaS system to the time the application really starts running. The applicationsubmission time varied from one second to 13 seconds. Thus, for homogeneity reasonsand to leave a margin, we set the processing time of all the submitted applications to 15seconds. Note that the difference between the submission time and the processing timeof an application is that the processing time should be the same whatever is the sourceof the used VMs, because in this thesis we consider that the deadline proposed to a spe-cific application requiring a specific number of VMs and a specific SLA class is alwaysthe same. We also measured the required time for an application to lend one or moreVMs and to get them back (without counting the runtime of the application borrowingthe VMs). This loan duration varied from 5 seconds to 16 seconds, depending on thenumber of the lent VMs (measured with 1 to 50 VMs). Therefore, we left a margin andset this parameter to 20 seconds.
We carried out our simulations on the Grid’5000 testbed using nodes from the pa-radent and the parapide clusters of the Rennes site.
102

Chapter 7. Evaluation
7.2.2 Results
We evaluate the optimization policies, opt1 and opt2, with the three defined revenuefunctions: opt1 with linear revenue function (Lopt1), opt2 with linear revenue function(Lopt2), opt1 with bounded linear revenue function (Bopt1), opt2 with bounded linearrevenue function (Bopt2), opt1 with step revenue function (Sopt1), and opt2 with steprevenue function (Sopt2). We also evaluate the basic and advanced policies, withoutspecifying any revenue function because in these policies we do not intentionally im-pact applications. Thus, in the simulations there is practically practically no deadlineviolation. We performed three simulations using each policy. In each simulation wesubmit a different workload instance. In the following we compare the obtained resultsfrom the eight polices according to the aforementioned evaluation metrics.
Each simulation presented here was performed five times and the results are pre-sented as means (± standard deviations in the bars).
7.2.2.1 Profit
Figure 7.2 shows the generated profit in the three workloads using the basic, advancedand Sopt2 policies. We show only the Sopt2 optimization policy in the figure for visibil-ity reasons because it is the one that generates the best profit for the provider in threeworkloads, from 2.64% to 4.98% more profit than the advanced policy. The basic policygenerates the worst provider profit. Then, the advanced policy generates from 1.91% to6.32% more profit than the basic policy. The provider profit generated using the otheroptimization policies is between the one generated using the advanced policy and theone generated using the Sopt2 policy, as seen in Tables 7.2 and 7.3. In Table 7.2 we showthe rate of profit gains obtained with all the polices compared to the basic one and inTable 7.3 we show the rate of profit gains obtained with all the optimization policiescompared to the advanced one. The optimization rates differ from one workload to an-other one. The general observation is that the opt2 policies generate a little more profitthan the opt1 policies using the same revenue function, from 0.06 % to 0.77%. More-over, the optimization policies using a bounded linear revenue function generate moreprofit than the same policies using the linear revenue function, up to 1.02% in opt1 usingworkload1; and the optimization policies using a step revenue function generate moreprofit than the same policies using the bounded linear revenue function, up to 1.59% inopt2 using workload1. These differences between policies in the generated profit varyinversely with the amount of the used public cloud resources, as seen in Figure 7.3 anddescribed in the next subsection.
7.2.2.2 VMs Usage Proportions
Figure 7.3 shows the used VMs proportions for each workload and policy. Each pro-portion in the figure represents a percentage of the used VMs compared with the totalVMs used. Each of the total used VMs and the proportions are calculated as the numberof VMs multiplied by the VMs usage duration. We clearly see in the figure that thepolicies using the less public cloud VMs in all workloads are ordered as follows: Sopt2,Sopt1, Bopt2, Bopt1, Lopt2, Lopt1, then the advanced policy. The basic policy is the onewhich uses the more public cloud VMs. The Sopt2 policy uses up to 82.61% less public
103

7.2. Simulations
Workload 1 Workload 2 Workload 3
0
10
20
30
40
50
60
70
80
Bas
ic
Bas
ic
Bas
ic
Adv
ced
Adv
ced
Adv
ced
Sop
t2
Sop
t2
Sop
t2
Wo
rklo
ad
Pro
fit
[$]
Figure 7.2: Workload profit comparison. Profit shown is the sum of profits of all jobs inthe workload. (Simulations)
Table 7.2: Profit Rates of the advanced and the optimization policies compared to thebasic policy. (Simulations)
Workload 1 Workload 2 Workload 3Advanced 6.29 % 1.91 % 6.32 %Linear Opt 1 8.77 % 3.87 % 8.37 %Linear Opt 2 9.54 % 4.37 % 8.44 %Bounded Opt 1 9.79 % 4.68 % 8.57 %Bounded Opt 2 10 % 4.77 % 8.64 %Step Opt 1 11.06 % 4.95 % 9.08 %Step Opt 2 11.59 % 5.14 % 9.14 %
cloud resources compared to the basic policy (find more details in Table 7.4). This usagescheme of public cloud VMs is directly reflected in the overall provider profit.
We notice that in the optimization policies the donating VMs are more used thanthe waiting VMs. The selection of one option, donating or waiting, depends on the loanduration, the runtime and SLA class of the new application and the remaining executiontime of the running applications. In our evaluation the order and arrival time of theapplications in the workloads as well as their corresponding SLA classes are random.However, the configured loan duration in these simulations (20 seconds) is relativelysmaller than the average applications runtime (around 350 seconds). Thus, often thedonating bid is cheaper than the waiting bid.
104

Chapter 7. Evaluation
Table 7.3: Profit Rates of the optimization policies compared to the advanced policy.(Simulations)
Workload 1 Workload 2 Workload 3Linear Opt 1 2.33 % 1.92 % 1.92 %Linear Opt 2 3.06 % 2.41 % 1.99 %Bounded Opt 1 3.29 % 2.71 % 2.11 %Bounded Opt 2 3.48 % 2.80 % 2.17 %Step Opt 1 4.48 % 2.98 % 2.59 %Step Opt 2 4.98 % 3.17 % 2.64 %
0
10
20
30
40
50
60
70
80
90
100
VM
s U
sage P
roport
ion
Local
VC
Donating
Waiting
Public
a b c d e f g hWorkload 1
a b c d e f g hWorkload 2
a b c d e f g hWorkload 3
a = Basic b = Advanced c = Lopt1 d = Lopt2 e = Bopt1 f = Bopt2 g = Sopt1 h = Sopt2
Figure 7.3: VMs usage proportion for each workload and policy, calculated as the num-ber of the used VMs multiplied by the usage duration. (Simulations)
7.2.2.3 Completion Time
Figure 7.4 shows the completion time of the three workloads. We see that the workloadcompletion time in the basic and advanced policies is almost the same in all the work-loads. However, the workload completion time in the optimization policies is slightlyhigher, especially in workload 1 (up to 5.43% with the Sopt2 policy) and workload 2(up to 2.13% with the Lopt1 policy). This overhead in workloads completion time ismainly due to the incurred delay of the impacted applications and the required time forcalculating the bids.
Indeed, the required time for calculating the bids varies according to the numberof requested VMs as well as the number of running applications and their used VMs.In our simulations the bid calculation time varied from 6 seconds to 20 seconds withoutliers values up to 345 seconds. The median bid calculation time is 7 seconds whichcorresponds to the most frequent case.
105

7.2. Simulations
Table 7.4: Percentage of the used public cloud VMs. (Simulations)
workload 1 workload 2 workload 3Basic 45.13 % 75.38 % 72.58 %Advanced 20.46 % 69.62 % 55.68 %Linear Opt 1 9.13 % 61.44 % 48.73 %Linear Opt 2 9.07 % 60.46 % 48.37 %Bounded Opt 1 8.98 % 59.68 % 48.16 %Bounded Opt 2 8.51 % 59.51 % 47.95 %Step Opt 1 8.06 % 57.87 % 47.14 %Step Opt 2 7.85 % 57.11 % 47 %
7.2.2.4 Deadline Violations and Impact
As expected, in these simulations the deadlines of all applications in the three workloadswere satisfied with the basic and the advanced policies. With the optimization policies,there are some applications that exceeded their deadlines in each workload, in order toimprove the provider profit. Nevertheless in all the workloads the ratio of the delayedapplications and the average delay percentage of delayed applications did not go beyondtheir respective defined thresholds. As it can be observed in Table 7.5, the ratio of theimpacted applications is between 3.5% and 7.75% in the opt1 policy and between 2% and7% in the opt2 policy. The average delay of the delayed applications is between 35.33%and 47% in opt1 policy and between 35.6% and 54.17% in the opt2 policy. We noticethat both of the ratio of impacted applications as well as the average delay of delayedapplications do not reach the respective defined thresholds. This is because impactingmany applications with a high delay while considering the payment of penalties is notbeneficial for optimizing the provider profit. We also notice that there are more impactswith the optimization policies using the step revenue function. This is because thepenalty calculation in the step revenue function is more advantageous for the provider.
Table 7.5: Percentage of (A) delayed applications and (B) average delay of delayed ap-plications with the optimization policy. (Simulations)
workload 1 workload 2 workload 3A B A B A B
Lopt1 4.5 % 35.33 % 3.5 % 45.41 % 7.5 % 36.6 %Bopt1 5 % 35.9 % 4 % 46.74 % 6 % 36.75 %Sopt1 5.75 % 36 % 5.5 % 47 % 7.75 % 36.94 %Lopt2 2 % 38.8 % 2.5 % 54.17 % 4 % 35.6 %Bopt2 6 % 36 % 4.75 % 48.8 % 7 % 36.87 %Sopt2 5 % 35.73 % 6.5 % 45 % 6 % 35.66 %
106

Chapter 7. Evaluation
Workload 1 Workload 2 Workload 3
0
500
1000
1500
2000
2500
3000
3500
4000
4500
5000
5500
Bas
ic
Bas
ic
Bas
ic
Adv
ced
Adv
ced
Adv
ced
Lopt
1
Lopt
1
Lopt
1
Lopt
2
Lopt
2
Lopt
2
Bop
t1
Bop
t1
Bop
t1
Bop
t2
Bop
t2
Bop
t2
Sop
t1
Sop
t1
Sop
t1
Sop
t2
Sop
t2
Sop
t2
Wo
rklo
ad
co
mp
letio
n T
ime
[se
c]
Figure 7.4: Workloads completion time (seconds), from the submission of the first job tothe completion of the final job. (Simulations)
7.2.2.5 Conclusion
In this section we evaluated our optimization policies using different revenue functionsthrough a set of simulations and compared them to the basic and the advanced policies.Our results show that the optimization policies generates more profit for the providerthan the basic and the advanced policies with a small overhead on the workloads com-pletion time. The comparison between to the instances of the optimization policies, opt1and opt2, shows that the possibility to impact more applications and with more delayis not highly exploited because of the corresponding payment of penalties. Finally, thecomparison between the optimization policies using different revenue functions showsthat when the penalty calculation is more advantageous for the provider, the profit isgreater and the applications are more impacted.
7.3 Experiments
In this section we evaluate our profit optimization policies through a series of experi-ments. The experiments’ goal is to see the behavior of our policies in a real PaaS environ-ment. In the following we present some measurements and describe the experimentalenvironment setup, then we describe and analyze the results.
7.3.1 Measurements
In this section we measure the time for creating and configuring private and public VMs.Then, we measure the time for processing the submission of a batch and MapReduceapplications on (1) available private resources, (2) private resources transferred fromanother VC, and (3) public cloud resources. The objective of these measurements is toconfigure our experimental environment.
107

7.3. Experiments
1 2 5 10 20 0
50
100
150
200
250
300
350
VMs
Tim
e [sec]
(a) Private VMs
1 2 5 10 20 0
50
100
150
200
250
300
350
VMs
Tim
e [sec]
(b) Public VMs
Figure 7.5: Creation and configuration of OGE VMs
To perform these measurements, we deployed a private instance of Snooze to hostMeryn on 10 nodes from the paradent and parapluie clusters of the Rennes site, anddeployed a public instance of Snooze on 14 nodes from the griffon and graphene clustersof the Nancy site.
7.3.1.1 VM(s) Creation and Configuration
Figure 7.5 shows the required time for creating and configuring 1, 2, 5, 10, and 20private and public VMs of the OGE VC. Figure 7.6 shows the required time for creatingand configuring 1, 2, 5, 10, and 20 private and public VMs of the Hadoop VC. We useda VM instance model similar to the Amazon EC2 medium instance3, which consists of 2CPUs and 3.75 GB of memory. With the two frameworks OGE and Hadoop, the requiredtime for creating public cloud VMs is greater than the required time for creating privateVMs. This is mainly because of the network latency between the two remote sites.
We tried to parallelize most of the operations to create and configure multiple VMs.However, for consistency reasons, many configuration operations consist in modifyingspecific shared configuration files which requires the use of mutual exclusion. Thus, therequired time for creating multiple VMs is approximately linear.
We also measured the required time for removing separately a local and a publiccloud VM from both the OGE and the Hadoop programming frameworks and shuttingthe VM down. With both frameworks and with the private and the public VM, thisoperation takes around 2 seconds. We didn’t measure the removal of multiple VMsbecause the framework’s remove operation requires the name or the IP address of thespecific VM to remove. Thus, if we need to remove multiple VMs we should do itsequentially.
7.3.1.2 Job Submission
We measure the submission time of batch and MapReduce applications on (1) availableprivate resources (local VMs), (2) private resources transferred from another VC (VC
3http://aws.amazon.com/ec2/instance-types/ [Online; accessed February 2013]
108

Chapter 7. Evaluation
1 2 5 10 20 0
50
100
150
200
250
300
350
VMs
Tim
e [sec]
(a) Private VMs
1 2 5 10 20 0
50
100
150
200
250
300
350
VMs
Tim
e [sec]
(b) Public VMs
Figure 7.6: Creation and configuration of Hadoop VMs
VMs), and (3) public cloud resources (public VMs). We define the submission time as therequired time from the submission of an application in the PaaS system to the time theapplication really starts running.
Figure 7.7 shows the submission time of batch applications requiring 1, 2, 5, 10and 20 VMs, on local VMs (Figure 7.7(a)), VC VMs (Figure 7.7(b)) and public VMs (Fig-ure 7.7(c)). Figure 7.8 shows the submission time of MapReduce applications requiring1, 2, 5, 10 and 20 VMs, on local VMs (Figure 7.8(a)), VC VMs (Figure 7.8(b)) and publicVMs (Figure 7.8(c)).
Our first observation is that with both types of application and the three sources ofVMs (local, VC and public) the applications submission time increases with the increaseof the number of VMs required by the applications. Our second observation is that theapplications submission time varies according to the source of VMs and the greatestapplication submission time values are obtained with the use of public VMs.
7.3.2 Environment Setup
Our first setup concerns the batch applications. As it is difficult to find real batch ap-plications matching the applications properties described in the used batch workloadmodel, we implemented a simple sleep MPI application taking as input a number ofprocesses and a sleep duration.
Our second setup concerns the definition of a function for computing applicationsprocessing time which is used to compute the application deadline, as seen in Sec-tion 5.3. The difference between the submission time and the processing time of anapplication is that the processing time should be the same whatever is the source ofthe used VMs, because in this thesis we consider that the deadline proposed to a spe-cific application requiring a specific number of VMs and a specific SLA class is alwaysthe same. Thus, for all applications we calculate the processing time according to thesubmission time values obtained with the source of VMs requiring the maximum time,namely with the public VMs.
The average application submission time on public VMs of batch and MapReduceapplications requiring from 1 to 20 VMs is shown in Table 7.6. To define a function
109

7.3. Experiments
1 2 5 10 20 0
5
10
15
VMs
Tim
e [
se
c]
(a) Local VMs
1 2 5 10 20 0
50
100
150
200
250
300
VMs
Tim
e [
se
c]
(b) VC VMs
1 2 5 10 20 0
50
100
150
200
250
300
350
VMs
Tim
e [
se
c]
(c) Public VMs
Figure 7.7: Submission time of batch applications on (a) local VMs, (b) VC VMs, and (c)public VMs
1 2 5 10 20 0
5
10
15
20
25
30
35
40
VMs
Tim
e [
se
c]
(a) Local VMs
1 2 5 10 20 0
50
100
150
200
250
300
VMs
Tim
e [
se
c]
(b) VC VMs
1 2 5 10 20 0
50
100
150
200
250
300
350
VMs
Tim
e [
se
c]
(c) Public VMs
Figure 7.8: Submission time of MapReduce applications on (a) local VMs, (b) VC VMs,and (c) public VMs
110

Chapter 7. Evaluation
for calculating the applications processing time we make use of these values and thepolyfit function of the NumPy Python library [46]. The polyfit function gets a sampleof points (x: number of VMs, y: submission time) and returns a vector of coefficientfor the polynomial function. Thus, we define a processing time function for batch andMapReduce applications as seen in Equations 7.1, where AR is the number of resourcesrequired by the application.
Batch : Aprocessing = −0.4877× (AR)2 + 25.34× AR + 8.482 (7.1a)
MapReduce : Aprocessing = −0.5462× (AR)2 + 27.72× AR + 13.83 (7.1b)
Our final setup concerns the definition of a function for computing the VM loanduration. This duration depends if the loan is between applications from the same VCor between applications from different VCs.
In the first scenario the VM loan duration includes (1) the time for suspending/shrink-ing the source application, (2) the time for cleaning up the VM(s), (3) the submission timeof the new application, (4) the time for cleaning up the VM(s) after the end of the newapplication (e.g., removing the new application files), and (5) the time for resuming/ex-tending the source application. We measure the required time for each step for bothbatch and MapReduce applications, as seen in Table 7.7. The time for suspending a batchapplication is around 2 seconds and the time for shrinking or suspending a MapReduceapplication is around 1 second. The time for cleaning up an OGE VM is null (becauseof our simple sleep MPI applications).The time for cleaning up a Hadoop TaskTrackerVM is around 1 second (for stopping the corresponding daemons and reconfiguring theapplication sub-cluster). The submission time of the new application on local VMs ismeasured in the previous section and the average values are shown in Table 7.8. Basedon these values and using the polyfit function of the NumPy library we define a functionfor calculating the submission time of batch and MapReduce applications on local VMs,see Equations 7.2. The required time for cleaning up the VM(s) after the end of a batchapplication is null and after the end of a MapReduce application is around 1 second.Finally, the time for resuming a batch application follows the same batch local sub-mission function and the time for extending a MapReduce application also follows thesame MapReduce local submission function where the function depends on the numberof VMs to add to the impacted application Alend_R rather than AR. Therefore, we useFunctions 7.3 to calculate the required time for loaning VMs between applications fromthe same VC.
Batch local submission time = −0.007576× (AR)2 + 0.4025× AR + 9.944 (7.2a)
MapReduce local submission time = −0.0625× (AR)2 + 2.349× AR + 12.973 (7.2b)
Batch local_VMs_loan = 2 + 2× (−0.007576× (new_AR)2 + 0.4025× new_AR + 9.944)
(7.3a)
111

7.3. Experiments
MapReduce local_VMs_loan = 3 + (−0.0625× (new_AR)2 + 2.349× new_AR + 12.973)+
(−0.0625× source_Alend_R)2 + 2.349× source_Alend_R + 12.973)
(7.3b)
In the second scenario the VM loan duration between applications from different VCsincludes (1) the time for suspending/shrinking the source application (2) the time forremoving the VM(s) from the source VC and creating new VM(s) in the destination VCand submitting the new application, and (3) removing the VM(s) from the destinationVC after the end of the new application, creating VM(s) in source VC and resuming/ex-tending the source application. We measure the required time of each step for bothbatch and MapReduce applications, as seen in Table 7.9. The first step is similar to theone in the first scenario. The second and the third steps are similar to processing thesubmission of an application on private VMs from a different VC (VC VMs), which wasreported in Section 7.3.1 and is shown in Table 7.10. Based on these values and usingthe polyfit function of the NumPy library we define a function for calculating the re-quired time for submitting batch and MapReduce applications on VC VMs, as seen inEquations 7.4. Therefore, we use functions 7.5 to calculate the required time for loan-ing VMs between applications from the different VCs. Note that Function 7.5a is usedby MapReduce applications lending VMs for a new batch application and inversely inFunction 7.5b.
Batch VC submission time = 0.02187× (AR)2 + 11.8× AR + 20.22 (7.4a)
MapReduce local submission time = −0.0894× (AR)2 + 14.97× AR + 21.68 (7.4b)
Batch vc_VMs_loan = 1 + (0.02187× (new_AR)2 + 11.8× new_AR + 20.22)+
(−0.0894× (source_AR)2 + 14.97× source_AR + 21.68)
(7.5a)
MapReduce vc_VMs_loan = 2 + (−0.0894× (new_AR)2 + 14.97× new_AR+
21.68) + (0.02187× (source_AR)2 + 11.8× source_AR + 20.22)
(7.5b)
To carry out these experiments, we deployed a private instance of Snooze to hostMeryn on 20 nodes from the parapluie cluster of the Rennes site, and deployed a publicinstance of Snooze on 70 nodes from the griffon cluster of the Nancy site.
7.3.3 Results
Due to the high number of resources required to carry out the experiments, here weevaluate only the opt2 instance optimization policy and compare it with the advancedthe basic policies. We evaluate three instances of the opt2 policy, each instance uses aspecific revenue function: opt2 with linear revenue function (Lopt2), opt2 with boundedlinear revenue function (Bopt2), and opt2 with step revenue function (Sopt2). We do notspecify a revenue function in the basic and the advanced polices because there would be
112

Chapter 7. Evaluation
Table 7.6: Average applications submission time on public VMs.
1 VM 2 VMs 5 VMs 10 VMs 20 VMsBatch [sec] 33.4 57.5 117.5 209.6 310MapReduce [sec] 38.1 67.3 133.5 231.9 341.8
Table 7.7: Required time for processing a local VM(s) loan.
(1) (2) (3) (4) (5)Batch [sec] 2 null equation 7.2a null equation 7.2aMapReduce [sec] 1 1 equation 7.2b 1 similar to equation 7.2b
Table 7.8: Average applications submission time on local VMs.
1 VM 2 VMs 5 VMs 10 VMs 20 VMsBatch [sec] 9.7 10.5 11.6 12.8 14.4MapReduce [sec] 14 18.2 22.6 29.2 34.6
Table 7.9: Required time for processing a VC VM(s) loan.
(1) (2) (3)Batch [sec] 2 equation 7.4a equation 7.4bMapReduce [sec] 1 equation 7.4b equation 7.4a
Table 7.10: Average applications submission time on VC VMs.
1 VM 2 VMs 5 VMs 10 VMs 20 VMsBatch [sec] 30.2 44.8 79 138.3 261.4MapReduce [sec] 36 52.1 88.4 159.7 279.5
113

7.3. Experiments
no deadline violation with the used environment setup. We perform three experimentsusing each policy. In each experiment we submited a different workload instance. Inthe following we compare the obtained results from the six policies according to theaforementioned evaluation metrics.
Each experiment presented here was performed three times and the results are pre-sented as means (± standard deviations in the bars).
7.3.3.1 Profit
Figure 7.9 shows the profit generated in the three workloads using each policy. The re-sults are quite similar to the ones obtained with simulations. The main noticed differenceis that with the experiments all the policies generate less profit than with simulationsFor instance in the basic policy we generate 32.74$, 75.15$, and 53.46$ rather than 33.11$,76.35$, and 54.26$ in respectively workload 1, workload 2 and workload 3. This is be-cause in a real environment the VMs usage is longer due to the required configurationsfor hosting applications, which increases the costs of hosting applications. In Table 7.11we show the rate of profit gains obtained with all the polices compared to the basic oneand in Table 7.12 we show the rate of profit gains obtained with all the optimizationpolicies compared to the advanced one. The advanced policy generates from 1.90% to5.06% more profit than the basic policy and the Sopt2 policy generates from 2.99% to4.29% more profit than the advanced policy. Similarly to simulations, these differencesvary inversely with the amount of the used public cloud resources, as seen in Figure 7.10and described in the next subsection.
Workload 1 Workload 2 Workload 3
0
10
20
30
40
50
60
70
80
Bas
ic
Bas
ic
Bas
ic
Adv
ced
Adv
ced
Adv
ced
Lopt
2
Lopt
2
Lopt
2
Bop
t2
Bop
t2
Bop
t2
Sop
t2
Sop
t2
Sop
t2
Wo
rklo
ad
Pro
fit
[$]
Figure 7.9: Workload profit comparison. Profit shown is the sum of profits of all jobs inthe workload. (Experiments)
114

Chapter 7. Evaluation
Table 7.11: Profit Rates of the advanced and the optimization policies compared to thebasic policy. (Experiments)
Workload 1 Workload 2 Workload 3Advanced 4.53 % 1.90 % 5.06 %Linear Opt 2 7.12 % 4.01 % 7.93 %Bounded Opt 2 7.38 % 4.20 % 8.24 %Step Opt 2 9.01 % 4.96 % 9.02 %
Table 7.12: Profit Rates of the optimization policies compared to the advanced policy.(Experiments)
Workload 1 Workload 2 Workload 3Linear Opt 2 2.48 % 2.07 % 2.73 %Bounded Opt 2 2.72 % 2.26 % 3.03 %Step Opt 2 4.29 % 2.99 % 3.77 %
7.3.3.2 VMs Usage Proportion
Figure 7.10 shows the used VMs proportions for each workload and policy. The opti-mization policies uses clearly less public cloud VMs than the basic and advanced poli-cies. For instance, the Sopt2 policy uses up to 80.55% and 57.14% less public VMs thanrespectively the basic and the advanced policies. More details are shown in Table 7.13.Similarly to simulations, the usage scheme of public cloud VMs is directly reflected inthe overall provider profit.
We notice that with the experiments in the optimization policies waiting VMs aremore used than donating VMs. The reason is related to two factors. First, the VM loanduration is more significant than in the simulations which highly affects the comple-tion time of the impacted applications with a donating bid as well as their penalties.Therefore the proposed donating bid is often higher than the waiting bid, and thus it isnot selected. Second, the time for exchanging VMs between VCs is comparable to theaverage applications runtime in our workloads. Thus, waiting the end of the executionof running applications often takes a comparable time and with a more attractive cost.
Table 7.13: Percentage of the used public cloud VMs. (Experiments)
workload 1 workload 2 workload 3Basic 45.04 % 75.28 % 72.60 %Advanced 20.44 % 69.59 % 55.78 %Linear Opt 2 10.12 % 60.59 % 50.05 %Bounded Opt 2 9.80 % 60.41 % 49.49 %Step Opt 2 8.76 % 58.63 % 48.07 %
115

7.3. Experiments
0
20
40
60
80
100
VM
s U
sage P
roport
ion
a b c d eWorkload1
a b c d eWorkload 2
a b c d eWorkload 3
Local
VC
Donating
Waiting
Public
a = Basic b = Advanced c = Lopt2 d = Bopt2 e = Sopt2
Figure 7.10: VMs usage proportion for each workload and policy, calculated as thenumber of the used VMs multiplied by the usage duration. (Experiments)
7.3.3.3 Completion Time
Figure 7.11 shows the completion time of the three workloads. Similarly to the simula-tions, the completion time of the workloads with the basic and the advanced policies arealmost the same. However, workload completion time with the optimization policies isslightly higher, especially in workload 1 (up to 4.17% with the Sopt2 policy) and work-load 2 (up to 6.63% with the Sopt2 policy). The workloads completion time overhead isdue to the incurred delay of the impacted applications, the required time for calculatingthe bids, and the mechanisms for transferring VMs between VCs. In these experimentsthe bid calculation time varied from 14 seconds to 50 seconds with outliers values up to876 seconds. The median bid calculation time is 23 seconds which corresponds to themost frequent case.
7.3.3.4 Deadline Violations
As expected, in the these experiments the deadlines of all applications in the three work-loads were satisfied with the basic and the advanced policies. With the optimizationpolicies some applications exceeded their deadlines. However, the ratio of delayed ap-plications and the average delay percentage of delayed applications do not go beyondtheir respective thresholds. As it can be observed in Table 7.14, the ratio of the impactedapplications is between 4% and 8.75% and the average delay of the delayed applicationsis between 39% and 65.52%. We notice that in the experiments the impact of applica-tions is higher than the one in the simulations, mainly because of the overhead of themechanisms for handling VMs.
116

Chapter 7. Evaluation
Workload 1 Workload 2 Workload 3
0
1000
2000
3000
4000
5000
Bas
ic
Bas
ic
Bas
ic
Adv
ced
Adv
ced
Adv
ced
Lopt
2
Lopt
2
Lopt
2
Bop
t2
Bop
t2
Bop
t2
Sop
t2
Sop
t2
Sop
t2
Wo
rklo
ad
co
mp
letio
n T
ime
[se
c]
Figure 7.11: Workloads completion time (seconds), from the submission of the first jobto the completion of the final job. (Experiments)
Table 7.14: Percentage of (A) delayed applications and (B) average delay of delayedapplications with the optimization policy. (Experiments)
workload 1 workload 2 workload 3A B A B A B
Lopt2 4 % 46.5 % 4 % 59.07 % 4.5 % 40.65 %Bopt2 6.5 % 39 % 6.75 % 49.23 % 8 % 46.93 %Sopt2 7 % 55.63 % 7.5 % 49 % 8.75 % 65.51 %
7.3.3.5 Conclusion
In this section we evaluated the opt2 optimization policy using different revenue func-tions through a set of experiments and compared it to the basic and the advanced poli-cies. Our results show that the optimization policy generates more profit for the providerthan the basic and the advanced policies. As a cost of this profit increase, the workloadscompletion time with the optimization policy is slightly higher and the deadline of someapplications is violated. The results also show that all the policies generate less profit inthe experiments than in the simulations.
7.4 Summary
In this chapter we presented the evaluation of our contributions through a series of sim-ulations and experiments on the Grid’5000 testbed. We have used different workloads,SLA classes and revenue functions. We compared the efficiency of the optimization,basic and advanced policies in optimizing the provider profit and satisfying SLAs. The
117

7.4. Summary
results show that the optimization policies are able to improve the provider profit andsignificantly reduce the number of the used public cloud VMs. Moreover, the number ofapplications undergoing an impact in their QoS properties does not exceed the prede-fined thresholds. Furthermore, the results of the simulations and the experiments agreewith each other, which validates the evaluation.
118

Chapter 8
Conclusions and Perspectives
Contents8.1 Contributions . . . . . . . . . . . . . . . . . . . . . . . . . . . . . . . . . . 118
8.2 Perspectives . . . . . . . . . . . . . . . . . . . . . . . . . . . . . . . . . . . 119
This chapter summarizes the contributions of this PhD thesis and presents some fu-ture research directions.
119

8.1. Contributions
8.1 Contributions
Cloud computing is an emerging paradigm revolutionizing the usage and marketingof Information Technology (IT). Nowadays, the socio-economic impact of cloud com-puting and particularly PaaS services becomes critical since the number of PaaS usersand providers is growing. PaaS providers want to generate the maximum profit fromthe services they provide. This requires them to face a number of challenges such asefficiently managing the underlying resources and satisfying the SLAs of customer ap-plications. This thesis addresses these challenges and focuses on optimizing the PaaSprovider profit while considering the payment of penalties if the QoS level promised tothe hosted applications is violated. The contributions of this thesis are summarized inthe following.
Profit Optimization Model. In order to address the challenges related to optimizingthe provider profit, this thesis considered a cloud-bursting PaaS environment and pro-posed a profit optimization policy that tries to find the cheapest resources for hostingapplications. After each request submission, our optimization policy estimates the costof hosting the new application using the private and the public resources and choosesthe most profit-efficient option. During peak periods and unavailability of private re-sources, the policy tries to optimize the use of private resources with the considerationof two more options. The first option consists in taking resources from running appli-cations while considering the payment of penalties if their promised QoS is impacted.The second option consists in evaluating the possible penalty of the new application dueto waiting for private resources to become available. This policy cooperates with a setof application type-specific heuristics that provide the required information about thehosted applications.
Application of the Optimization Model. To show the applicability of our profit op-timization model to a particular class of applications, we investigated rigid and elasticcomputational applications. We defined a deadline-based revenue function and pre-sented two heuristics that collaborate with the profit optimization policy for maximizingthe PaaS provider profit. The first heuristic provides a waiting bid, the smallest possiblepenalty of the new application due to waiting for private resources to become available.The second heuristic provides a donating bid, the smallest possible penalty of runningapplications due to providing some of their resources during their execution. We de-fined three possible forms that may be used by computational applications for providingresources during their execution. The first form consists in suspending the applicationsduring the execution of the new application and resuming them once the new appli-cation finishes its execution and gives back the resources. The second form consistsin lending a part of their resources to the new application and continuing to run withthe remaining resources until the new application finishes and gives back the borrowedresources. The third form consists in giving a part of their resources to the new applica-tion and continuing their execution only with the remaining resources. The second andthird forms may be used only by elastic applications. Each form leads applications to adifferent penalty. Thus, the heuristic selects the form of impact leading to the smallestpossible penalty.
120

Chapter 8. Conclusions and Perspectives
Meryn: an Open Cloud-Bursting PaaS. We designed and implemented a PaaS architec-ture, called Meryn, able to incorporate the profit optimization policy as well as differentapplication type-specific heuristics. The Meryn architecture relies on virtualized privateresources, using an IaaS manager solution, and supports bursting into public cloudswhen it is necessary. To support extensibility regarding application types, Meryn makesuse of independent virtual clusters and manages each virtual cluster using an existingprogramming framework (e.g., OGE, Hadoop). Each programming framework is dedi-cated to a specific application type (e.g., batch, MapReduce). The private resources aredynamically shared between the virtual clusters according to specific policies and objec-tives, namely in our context according to the profit optimization policy. An applicationtype-specific manager is hosted on each virtual cluster in order to provide and manageapplication SLAs.
To validate our contributions, we implemented a prototype that supports batch andMapReduce applications and used workload models based on real world traces. Weperformed a set of simulations and experiments on the Grid’5000 testbed. The resultsshow that the proposed profit optimization model enables the provider to generatesup to 11.59% and 9.02% more profit for the provider in respectively the simulationsand experiments compared to a basic approach. As a cost of such an optimization, thecompletion time of workloads using our optimization model is slightly higher comparedto the basic approach and the expected QoS level of some applications is impacted.
8.2 Perspectives
The work presented in this thesis, as any research work, is far from being complete orfinished. Thus, several research directions are open for future work. Some of them aimat improving the proposed contributions, others at exploring new research areas. In thefollowing we present the main identified perspectives.
Meryn Software. The Meryn software prototype was tested only on the Grid’5000testbed. To make it available and useful for potential external users two improvementdirections are possible. First, the Client Manager requires two additional features to beusable in a productive environment. The first feature consists in storing and managinguser identities and their authentication credentials. The second feature consists in mak-ing the Client Manager more user-friendly through the implementation of a graphicalweb submission interface.
Second, the Meryn prototype should be tested on top of further IaaS managers, suchas Open Stack, Eucalyptus and Nimbus in order to make it available to a larger com-munity. For that reason, the Resource Manager needs to interact with IaaS managersthrough standard interfaces, such as the EC2 interface.
Optimization Model. The proposed profit optimization model makes three simplifi-cations concerning PaaS environments. First, it considers that the PaaS system is builton top of homogenous private and public resources. However, both private and pub-lic resources may be heterogeneous, for example in the form of multiple VM instancetypes like in Amazon. Thus, the model should be extended to take into account thepossibility of having resources with different capacities, which is more realistic. As a
121

8.2. Perspectives
result, the Cluster Manager component requires changes particularly for predicting theperformance of applications and estimating their possible penalties for providing thedonating and waiting bids.
Second, the proposed profit optimization model considers a per second resourcebilling model. However, the majority of current commercial providers propose a perhour resource pricing. Considering such pricing in our model leads to revise the priceand cost functions for hosting applications. Moreover, the model should be extended totake into account the possibility to use idle public resources, which are already rented.
Finally, this thesis did not investigate the optimization of providers’ profits duringidle periods where the private resources are underutilized. The current behavior of oursystem in such a situation is to keep the resources idle. However, other actions are pos-sible such as shutting down the idle resources to reduce their energy consumption andpossibly their cost (as it was investigated in [122]), or selling the idle resources in theform of IaaS services (as it was investigated in [141]). Thus to complete our profit op-timization model, a future direction would be to investigate the impact of such actionson the PaaS provider profit.
Evaluation. We have identified two possible future evaluations. The first evaluationconsists in integrating an existing solution that predicts the runtime of computationalapplications such as the work presented in [133] and [73] (see Chapter 5). Then, wecould measure the accuracy of predicting the runtime of real applications, and evaluatethe impact of this accuracy on the PaaS provider profit. The second evaluation consistsin measuring the effectiveness of the proposed policy in optimizing the profit with theuse of several real public clouds with different characteristics and pricing models.
Application Types. The PaaS system and profit optimization approach proposed in thisthesis are designed to be open and easily extensible to support new application types.In this thesis, we investigated rigid and elastic computational applications. A futuredirection would be to investigate further application types and associated programingframeworks and QoS properties. For instance to add support for workflow applications,it is possible to use existing workflow management systems such as Xerox [52], ApacheODE [51], or Activiti [50] for managing the workflow virtual cluster. In addition, theapplication type-specific part of our Cluster Manager component may implement theQoS specification and prediction of workflow applications proposed in research work,such as [71] and [96].
Energy Consumption. The energy consumption in cloud computing environments isgrowing and has become a major concern in the cloud computing community. A possi-ble future direction of our work in this context is evaluating the impact of energy-savingactions on the performance and availability of virtual machines used by the Meryn sys-tem. Energy-saving actions, such as dynamically consolidating private VMs in the leastnumber of physical machines and transitioning the idle physical machines into a lowerpower-state, may be provided by a VM manager such as Snooze [85]. Furthermore, itwould be interesting to study PaaS management policies for minimizing the energy con-sumption of the hosted applications while meeting their SLAs, as already proposed forIaaS cloud environments [92]. Then, it would be possible to measure how the optimiza-tion of the energy consumption of applications impacts their costs.
122

Bibliography
[1] Microsoft Windows Azure Infrastructure. http://www.windowsazure.com/en-us/solutions/infrastructure/, 2013. [Online; accessed 30-November-2013]. 26, 35,37, 39, 58, 137
[2] Rackspace: The Open Cloud Company. http://www.rackspace.com/, 2013. [On-line; accessed 30-November-2013]. 26, 37
[3] Flexiant. http://www.flexiant.com/, 2013. [Online; accessed 30-November-2013].26
[4] The Apache Software Foundation. CloudStack: Open Source Cloud Computing.http://cloudstack.apache.org/, 2013. [Online; accessed 30-November-2013]. 26,37
[5] OpenStack. http://www.openstack.org/, 2013. [Online; accessed 30-November-2013]. 26, 37, 88
[6] Microsoft Private Cloud. http://www.microsoft.com/en-us/server-cloud/solutions/virtualization-private-cloud.aspx#fbid=vbMp209OQ4l, 2013. [On-line; accessed 30-November-2013]. 26
[7] Red Hat CloudForms. http://www.redhat.com/products/cloud-computing/cloudforms/, 2013. [Online; accessed 30-November-2013]. 26
[8] IBM SmartCloud Orchestrator. http://www-03.ibm.com/software/products/en/smartcloud-orchestrator/, 2013. [Online; accessed 30-November-2013]. 26
[9] HP CloudSystem. http://www8.hp.com/us/en/business-solutions/solution.html?compURI=1079455#tab=TAB2, 2013. [Online; accessed 30-November-2013]. 26,37
[10] Amazon AWS Elastic Beanstalk. http://aws.amazon.com/elasticbeanstalk/,2013. [Online; accessed 16-Decembre-2013]. 14, 27, 36, 39, 137
[11] Amazon AWS Elastic MapReduce. http://aws.amazon.com/elasticmapreduce/,2013. [Online; accessed 16-Decembre-2013]. 27, 36, 39, 137
[12] Hitachi Data Systems’ Virtual Storage Platform (VSP). http://www.hds.com/products/storage-systems/hitachi-virtual-storage-platform.html, 2013.[Online; accessed 30-November-2013]. 26
123

BIBLIOGRAPHY
[13] Microsoft Windows Azure Cloud Services. http://www.windowsazure.com/en-us/services/cloud-services/, 2013. [Online; accessed 16-Decembre-2013].14, 27
[14] Google App Engine. https://cloud.google.com/products/app-engine/, 2013.[Online; accessed 16-Decembre-2013]. 27, 35, 39, 58
[15] Heroku. https://www.heroku.com/, 2013. [Online; accessed 16-Decembre-2013].14, 27, 36, 39, 137
[16] SalesForce Platform (Force.com). http://www.salesforce.com/platform/overview/, 2013. [Online; accessed 16-Decembre-2013]. 27, 36, 39
[17] Amazon AWS. Cloudbursting - Hybrid Application Hosting. http://www.appscale.com/, 2014. [Online; accessed 20-January-2014]. 27, 42, 44
[18] Cloudify. http://www.cloudifysource.org/, 2014. [Online; accessed 20-January-2014]. 27, 42, 44, 58
[19] VMware Cloud Foundry. http://www.cloudfoundry.com/, 2013. [Online; ac-cessed 17-Decembre-2013]. 27, 41, 44, 58
[20] WSO2 Stratos. http://wso2.com/cloud/stratos/, 2014. [Online; accessed 20-January-2014]. 27
[21] RightScale. http://www.rightscale.com/, 2013. [Online; accessed 16-Decembre-2013]. 27, 37, 39, 58
[22] Scalr. http://www.scalr.com/, 2013. [Online; accessed 16-Decembre-2013]. 27
[23] IBM SAN Volume Controller (SVC). http://www-03.ibm.com/systems/storage/software/virtualization/svc/, 2013. [Online; accessed 30-November-2013]. 26
[24] Dell Cloud Manager. https://www.enstratius.com/, 2013. [Online; accessed 17-Decembre-2013]. 27
[25] RedHat OpenShift. https://www.openshift.com/, 2013. [Online; accessed 17-Decembre-2013]. 27, 42, 44, 58
[26] Google Apps. http://www.google.com/intl/en/about/products/, 2013. [Online;accessed 17-Decembre-2013]. 27
[27] SalesForce CRM. https://www.salesforce.com/crm/, 2013. [Online; accessed 17-Decembre-2013]. 27
[28] iCloud. https://www.icloud.com/, 2013. [Online; accessed 17-Decembre-2013].27
[29] High-Performance Computing Cluster (HPCC). http://hpccsystems.com/Why-HPCC/How-it-works, 2013. [Online; accessed 27-Decembre-2013]. 18
[30] European Grid Infrastructure (EGI). http://www.egi.eu/, 2013. [Online; accessed27-Decembre-2013]. 19
124

BIBLIOGRAPHY
[31] Globus. https://www.globus.org/, 2013. [Online; accessed 28-Decembre-2013].19
[32] Engine Yard. https://www.engineyard.com/, 2014. [Online; accessed 15-January-2014]. 37, 39
[33] DataCore SANsymphony. http://www.datacore.com/Software/Products/SANsymphony-V.aspx, 2013. [Online; accessed 30-November-2013]. 26
[34] CloudBees. http://www.cloudbees.com/platform/, 2014. [Online; accessed 15-January-2014]. 14, 37, 40, 137
[35] dotCloud. https://www.dotcloud.com/index.html, 2014. [Online; accessed 15-January-2014]. 14, 38, 40, 137
[36] AppFog. https://www.appfog.com/, 2014. [Online; accessed 15-January-2014]. 38,40
[37] DATAPIPE. http://www.datapipe.com/, 2014. [Online; accessed 15-January-2014]. 37
[38] VMware Workstation. http://www.vmware.com/fr/products/workstation/,2013. [Online; accessed 30-November-2013]. 26
[39] AppScale. http://aws.typepad.com/aws/2008/08/cloudbursting-.html, 2008.[Online; accessed 05-February-2014]. 49
[40] Grid5000. https://www.grid5000.fr/, 2014. [Online; accessed 20-March-2014].16, 98, 140, 141
[41] Tsuru. http://www.tsuru.io, 2014. [Online; accessed 20-January-2014]. 43, 44
[42] Paasmaker. http://paasmaker.org/, 2014. [Online; accessed 20-January-2014].42, 44
[43] VMware NSX. http://www.vmware.com/products/nsx/, 2013. [Online; accessed30-November-2013]. 26
[44] Ubuntu Juju. https://juju.ubuntu.com/, 2014. [Online; accessed 11-February-2014]. 43
[45] Docker. http://www.docker.io/, 2014. [Online; accessed 12-February-2014]. 38,43
[46] NumPy library. http://docs.scipy.org/doc/numpy/reference/index.html,2014. [Online; accessed 11-April-2014]. 109
[47] CISCO Easy Virtual Network (EVN). http://www.cisco.com/en/US/products/ps11783/products_ios_protocol_option_home.html, 2013. [Online; accessed 30-November-2013]. 26
[48] Hive performance benchmarks. https://issues.apache.org/jira/browse/HIVE-396, 2014. [Online; accessed 01-April-2014]. 97
125

BIBLIOGRAPHY
[49] Google Compute Engine. https://cloud.google.com/products/compute-engine, 2013. [Online; accessed 30-November-2013]. 26, 35, 37
[50] Activiti. http://activiti.org/index.html, 2014. [Online; accessed 30-April-2014]. 120
[51] Apache ODE. http://ode.apache.org/, 2014. [Online; accessed 30-April-2014].120
[52] Xerox. http://www.xerox.com/, 2014. [Online; accessed 30-April-2014]. 120
[53] Google App Engine Billing. https://developers.google.com/appengine/kb/billing#time_granularity_instance_pricing, 2014. [Online; accessed 06-May-2014]. 97
[54] Amazon AWS EC2. http://aws.amazon.com/ec2/, 2013. [Online; accessed 30-November-2013]. 26, 37
[55] Abdelkader Amar, Raphaël Bolze, Aurélien Bouteiller, Andréea Chis, Yves Caniou,Eddy Caron, Pushpinder-Kaur Chouhan, Gaël Le Mahec, Holly Dail, BenjaminDepardon, et al. Diet: New developments and recent results. In Euro-Par 2006:Parallel Processing, pages 150–170. Springer, 2007. 19
[56] Alain Andrieux, Karl Czajkowski, Asit Dan, Kate Keahey, Heiko Ludwig,Toshiyuki Nakata, Jim Pruyne, John Rofrano, Steve Tuecke, and Ming Xu. Webservices agreement specification (ws-agreement). In Global Grid Forum, volume 2,2004. 23
[57] Michael Armbrust, Armando Fox, Rean Griffith, Anthony D. Joseph, Randy H.Katz, Andrew Konwinski, Gunho Lee, David A. Patterson, Ariel Rabkin, Ion Sto-ica, and Matei Zaharia. Above the clouds: A berkeley view of cloud computing.Technical Report UCB/EECS-2009-28, EECS Department, University of California,Berkeley, Feb 2009. 24, 29
[58] Adnan Ashraf, Benjamin Byholm, and Ivan Porres. Cramp: Cost-efficient resourceallocation for multiple web applications with proactive scaling. 4th IEEE Interna-tional Conference on Cloud Computing Technology and Science Proceedings, 0:581–586,2012. 52, 54, 57, 58
[59] David H Bailey, Eric Barszcz, John T Barton, David S Browning, Robert L Carter,Leonardo Dagum, Rod A Fatoohi, Paul O Frederickson, Thomas A Lasinski, Rob SSchreiber, et al. The nas parallel benchmarks summary and preliminary results.In Supercomputing, 1991. Supercomputing’91. Proceedings of the 1991 ACM/IEEE Con-ference on, pages 158–165. IEEE, 1991. 21
[60] Amnon Barak and Oren La’adan. The mosix multicomputer operating systemfor high performance cluster computing. Future Generation Computer Systems,13(4):361–372, 1998. 19
[61] Paul Barham, Boris Dragovic, Keir Fraser, Steven Hand, Tim Harris, Alex Ho, RolfNeugebauer, Ian Pratt, and Andrew Warfield. Xen and the art of virtualization. InProceedings of the Nineteenth ACM Symposium on Operating Systems Principles, SOSP’03, pages 164–177, New York, NY, USA, 2003. ACM. 26
126

BIBLIOGRAPHY
[62] Andy Bavier, Mic Bowman, Brent Chun, David Culler, Scott Karlin, Steve Muir,Larry Peterson, Timothy Roscoe, Tammo Spalink, and Mike Wawrzoniak. Operat-ing system support for planetary-scale network services. In Proceedings of the 1stConference on Symposium on Networked Systems Design and Implementation - Volume1, NSDI’04, pages 19–19, Berkeley, CA, USA, 2004. USENIX Association. 19
[63] S. Bharathi, A. Chervenak, E. Deelman, G. Mehta, Mei-Hui Su, and K. Vahi. Char-acterization of scientific workflows. In Workflows in Support of Large-Scale Science,2008. WORKS 2008. Third Workshop on, pages 1–10, 2008. 21
[64] Tekin Bicer, David Chiu, and Gagan Agrawal. Time and cost sensitive data-intensive computing on hybrid clouds. Cluster Computing and the Grid, IEEE In-ternational Symposium on, pages 636–643, 2012. 14, 52, 54, 57, 138
[65] Raphaël Bolze, Franck Cappello, Eddy Caron, Michel Daydé, Frédéric Desprez,Emmanuel Jeannot, Yvon Jégou, Stephane Lanteri, Julien Leduc, Noredine Melab,Guillaume Mornet, Raymond Namyst, Pascale Primet, Benjamin Quetier, OlivierRichard, El-Ghazali Talbi, and Iréa Touche. Grid’5000: A large scale and highlyreconfigurable experimental grid testbed. Int. J. High Perform. Comput. Appl.,20(4):481–494, November 2006. 19
[66] M. Boniface, B. Nasser, J. Papay, S.C. Phillips, A. Servin, Xiaoyu Yang, Z. Zlatev,S.V. Gogouvitis, G. Katsaros, K. Konstanteli, G. Kousiouris, A. Menychtas, andD. Kyriazis. Platform-as-a-service architecture for real-time quality of service man-agement in clouds. In Internet and Web Applications and Services (ICIW), 2010 FifthInternational Conference on, pages 155–160, 2010. 45, 48, 58
[67] M. J. Buco, R. N. Chang, L. Z. Luan, C. Ward, J. L. Wolf, and P. S. Yu. Utility com-puting sla management based upon business objectives. IBM Syst. J., 43(1):159–178,January 2004. 22
[68] Junwei Cao, Kai Hwang, Keqin Li, and Albert Y. Zomaya. Optimal multiserverconfiguration for profit maximization in cloud computing. IEEE Trans. ParallelDistrib. Syst., 24(6):1087–1096, June 2013. 54, 55, 57, 58
[69] N. Capit, G. Da Costa, Y. Georgiou, G. Huard, C. Martin, G. Mounie, P. Neyron,and O. Richard. A batch scheduler with high level components. In Proceedings ofthe Fifth IEEE International Symposium on Cluster Computing and the Grid (CCGrid’05)- Volume 2 - Volume 02, CCGRID ’05, pages 776–783, Washington, DC, USA, 2005.IEEE Computer Society. 18
[70] Jorge Carapinha and Javier Jiménez. Network virtualization: A view from thebottom. In Proceedings of the 1st ACM Workshop on Virtualized Infrastructure Systemsand Architectures, VISA ’09, pages 73–80, New York, NY, USA, 2009. ACM. 26
[71] Jorge Cardoso, Amit Sheth, and John Miller. Workflow quality of service. InEnterprise Inter-and Intra-Organizational Integration, pages 303–311. Springer, 2003.120
[72] Alexandra Carpen-Amarie, Djawida Dib, Anne-Cécile Orgerie, and GuillaumePierre. Towards Energy-Aware IaaS-PaaS Co-design. In SMARTGREENS: Inter-national Conference on Smart Grids and Green IT Systems, colocated with International
127

BIBLIOGRAPHY
Conference on Cloud Computing and Services Science (CLOSER),, Barcelona, Spain,2014. 135
[73] Laura Carrington, Allan Snavely, and Nicole Wolter. A performance predictionframework for scientific applications. Future Gener. Comput. Syst., 2006. 74, 120
[74] N. M. Mosharaf Kabir Chowdhury and Raouf Boutaba. Network virtualization:State of the art and research challenges. Comm. Mag., 47(7):20–26, July 2009. 26
[75] W. Cirne, D. Paranhos, L. Costa, E. Santos-Neto, F. Brasileiro, J. Sauve, F. A BSilva, C.O. Barros, and C. Silveira. Running bag-of-tasks applications on compu-tational grids: the mygrid approach. In Parallel Processing, 2003. Proceedings. 2003International Conference on, pages 407–416, 2003. 21
[76] Stefania Victoria Costache, Nikos Parlavantzas, Christine Morin, and Samuel Ko-rtas. Merkat: A Market-based SLO-driven Cloud Platform. In 5th IEEE Interna-tional Conference on Cloud Computing Technology and Science (CloudCom 2013), Bristol,Royaume-Uni, December 2013. 46, 48, 58
[77] Jeffrey Dean and Sanjay Ghemawat. Mapreduce: Simplified data processing onlarge clusters. Commun. ACM, 51(1):107–113, January 2008. 21
[78] Ewa Deelman, Gurmeet Singh, Miron Livny, G. Bruce Berriman, and John Good.The cost of doing science on the cloud: the montage example. In SC, page 50.IEEE/ACM, 2008. 29
[79] Ruben Van den Bossche, Kurt Vanmechelen, and Jan Broeckhove. Online cost-efficient scheduling of deadline-constrained workloads on hybrid clouds. FutureGeneration Computer Systems, 29(4):973 – 985, 2013. Special Section: Utility andCloud Computing. 14, 51, 53, 58, 138
[80] Djawida Dib. Adaptation dynamique des fonctionnalités d’un systèmed’exploitation large échelle, May 2011. Publication de la journée ADAPT 2011.135
[81] Djawida Dib, Nikos Parlavantzas, and Christine Morin. Towards multi-level adap-tation for distributed operating systems and applications. In Proceedings of the 12thInternational Conference on Algorithms and Architectures for Parallel Processing - Vol-ume Part II, ICA3PP’12, pages 100–109, Berlin, Heidelberg, 2012. Springer-Verlag.135
[82] Djawida Dib, Nikos Parlavantzas, and Christine Morin. Meryn: Open, sla-driven,cloud bursting paas. In Proceedings of the First ACM Workshop on OptimizationTechniques for Resources Management in Clouds, ORMaCloud ’13, pages 1–8, NewYork, NY, USA, 2013. ACM. 135
[83] Djawida Dib, Nikos Parlavantzas, and Christine Morin. SLA-based Profit Opti-mization in Cloud Bursting PaaS. In 14th IEEE/ACM International Symposium onCluster, Cloud and Grid Computing, Chicago, États-Unis, 2014. 135
128

BIBLIOGRAPHY
[84] Dmitry Duplyakin, Paul Marshall, Kate Keahey, Henry Tufo, and Ali Alzabarah.Rebalancing in a multi-cloud environment. In Proceedings of the 4th ACM Workshopon Scientific Cloud Computing, Science Cloud ’13, pages 21–28, New York, NY, USA,2013. ACM. 49, 53
[85] E. Feller, C. Rohr, D. Margery, and C. Morin. Energy management in iaas clouds:A holistic approach. In Cloud Computing (CLOUD), 2012 IEEE 5th InternationalConference on, pages 204–212, June 2012. 120
[86] Eugen Feller, Louis Rilling, and Christine Morin. Snooze: A scalable and auto-nomic virtual machine management framework for private clouds. In Proceedingsof the 2012 12th IEEE/ACM International Symposium on Cluster, Cloud and Grid Com-puting (Ccgrid 2012), CCGRID ’12, pages 482–489, Washington, DC, USA, 2012.IEEE Computer Society. 26, 88
[87] A.L. Freitas, N. Parlavantzas, and J-L Pazat. Cost reduction through sla-drivenself-management. In Web Services (ECOWS), 2011 Ninth IEEE European Conferenceon, pages 117–124, Sept 2011. 54, 55, 57, 58
[88] Arijit Ganguly, Abhishek Agrawal, P. Oscar Boykin, and Renato Figueiredo. Ipover p2p: Enabling self-configuring virtual ip networks for grid computing. In InProc. of 20th International Parallel and Distributed Processing Symposium (IPDPS-2006,pages 1–10, 2006. 26
[89] Wolfgang Gentzsch. Sun grid engine: Towards creating a compute power grid.In Cluster Computing and the Grid, 2001. Proceedings. First IEEE/ACM InternationalSymposium on, pages 35–36. IEEE, 2001. 18
[90] I. Goiri, J. Guitart, and J. Torres. Characterizing cloud federation for enhancingproviders’ profit. In Cloud Computing (CLOUD), 2010 IEEE 3rd International Confer-ence on, pages 123–130, July 2010. 14, 50, 51, 53, 58, 138
[91] Robert P. Goldberg. Survey of virtual machine research. Computer, 7(9):34–45,September 1974. 26
[92] Hadi Goudarzi, Mohammad Ghasemazar, and Massoud Pedram. Sla-based op-timization of power and migration cost in cloud computing. In 12th IEEE/ACMInternational Symposium on Cluster, Cloud and Grid Computing, CCGrid, 2012. 55, 57,120
[93] Hadi Goudarzi and Massoud Pedram. Multi-dimensional sla-based resource allo-cation for multi-tier cloud computing systems. In Proceedings of the 2011 IEEE 4thInternational Conference on Cloud Computing, CLOUD ’11. IEEE Computer Society,2011. 52, 57, 58
[94] Andrew S. Grimshaw, Wm. A. Wulf, and CORPORATE The Legion Team. The le-gion vision of a worldwide virtual computer. Commun. ACM, 40(1):39–45, January1997. 19
[95] NIST Cloud Computing Standards Roadmap Working Group, Michael Hogan,Fang Liu, Annie Sokol, and Jin Tong. NIST Cloud Computing Standards
129

BIBLIOGRAPHY
Roadmap. Technical report, National Institute of Standards and Technology, July2011. 24, 25
[96] L Guo, AS McGough, A Akram, D Colling, J Martyniak, and M Krznaric. Qosfor service based workflow on grid. In Proceedings of UK e-Science 2007 All HandsMeeting, Nottingham, UK, 2007. 120
[97] Tian Guo, Upendra Sharma, Timothy Wood, Sambit Sahu, and Prashant Shenoy.Seagull: Intelligent cloud bursting for enterprise applications. In Proceedings ofthe 2012 USENIX Conference on Annual Technical Conference, USENIX ATC’12, pages33–33, Berkeley, CA, USA, 2012. USENIX Association. 50, 51, 53
[98] Peer Hasselmeyer, Henning Mersch, Bastian Koller, HN Quyen, Lutz Schubert,and Philipp Wieder. Implementing an sla negotiation framework. In Proceedingsof the eChallenges Conference (e-2007), volume 4, pages 154–161, 2007. 24
[99] M. Reza HoseinyFarahabady, Young Choon Lee, and Albert Y. Zomaya. Pareto-optimal cloud bursting. IEEE Transactions on Parallel and Distributed Systems,99(PrePrints):1, 2013. 51, 53, 58
[100] Jan Hungershofer. On the combined scheduling of malleable and rigid jobs. In Pro-ceedings of the 16th Symposium on Computer Architecture and High Performance Com-puting, SBAC-PAD ’04, pages 206–213, Washington, DC, USA, 2004. IEEE Com-puter Society. 21
[101] Anca Iordache, Christine Morin, Nikos Parlavantzas, Eugen Feller, and PierreRiteau. Resilin: Elastic mapreduce over multiple clouds. Cluster Computing andthe Grid, IEEE International Symposium on, 0:261–268, 2013. 46, 48, 58
[102] Xuxian Jiang and Dongyan Xu. Violin: Virtual internetworking on overlay infras-tructure. In Jiannong Cao, LaurenceT. Yang, Minyi Guo, and Francis Lau, editors,Parallel and Distributed Processing and Applications, volume 3358 of Lecture Notes inComputer Science, pages 937–946. Springer Berlin Heidelberg, 2005. 26
[103] Gueyoung Jung, N. Gnanasambandam, and T. Mukherjee. Synchronous parallelprocessing of big-data analytics services to optimize performance in federatedclouds. In Cloud Computing (CLOUD), 2012 IEEE 5th International Conference on,pages 811–818, June 2012. 49, 50, 53
[104] Steffen Kächele, Jörg Domaschka, and Franz J. Hauck. Cosca: An easy-to-usecomponent-based paas cloud system for common applications. In Proceedings ofthe First International Workshop on Cloud Computing Platforms, CloudCP ’11, pages4:1–4:6, New York, NY, USA, 2011. ACM. 45, 48
[105] S. Kailasam, N. Gnanasambandam, J. Dharanipragada, and N. Sharma. Opti-mizing ordered throughput using autonomic cloud bursting schedulers. SoftwareEngineering, IEEE Transactions on, 39(11):1564–1581, Nov 2013. 49, 53, 58
[106] Mira Kajko-Mattsson. Sla management process model. In Proceedings of the 2NdInternational Conference on Interaction Sciences: Information Technology, Culture andHuman, ICIS ’09, pages 240–249, New York, NY, USA, 2009. ACM. 22
130

BIBLIOGRAPHY
[107] Mohammad Mahdi Kashef and Jörn Altmann. A cost model for hybrid clouds. InProceedings of the 8th international conference on Economics of Grids, Clouds, Systems,and Services, GECON’11, pages 46–60, Berlin, Heidelberg, 2012. Springer-Verlag.29
[108] Kate Keahey, Tim Freeman, Jerome Lauret, and Doug Olson. Virtual workspacesfor scientific applications. Journal of Physics: Conference Series, 78(1):012038, 2007.26
[109] S. Kibe, S. Watanabe, K. Kunishima, R. Adachi, M. Yamagiwa, and M. Uehara.Paas on iaas. In Advanced Information Networking and Applications (AINA), 2013IEEE 27th International Conference on, pages 362–367, 2013. 45, 48
[110] Avi Kivity. kvm: the Linux virtual machine monitor. In OLS ’07: The 2007 OttawaLinux Symposium, pages 225–230, July 2007. 26
[111] André Lage Freitas, Nikos Parlavantzas, and Jean-Louis Pazat. An IntegratedApproach for Specifying and Enforcing SLAs for Cloud Services. In The IEEE 5thInternational Conference on Cloud Computing (CLOUD 2012), Honolulu, États-Unis,June 2012. 47, 48
[112] E. Laure, C. Gr, S. Fisher, A. Frohner, P. Kunszt, A. Krenek, O. Mulmo, F. Pacini,F. Prelz, J. White, M. Barroso, P. Buncic, R. Byrom, L. Cornwall, M. Craig, A. DiMeglio, A. Djaoui, F. Giacomini, J. Hahkala, F. Hemmer, S. Hicks, A. Edlund,A. Maraschini, R. Middleton, M. Sgaravatto, M. Steenbakkers, J. Walk, and A. Wil-son. Programming the grid with glite. In Computational Methods in Science andTechnology, page 2006, 2006. 19
[113] Sonja Lehmann and Peter Buxmann. Pricing strategies of software vendors. Busi-ness & Information Systems Engineering, 1(6):452–462, 2009. 23
[114] P. Leitner, W. Hummer, B. Satzger, C. Inzinger, and S. Dustdar. Cost-efficientand application sla-aware client side request scheduling in an infrastructure-as-a-service cloud. In Cloud Computing (CLOUD), 2012 IEEE 5th International Conferenceon, pages 213–220, June 2012. 52, 57, 58
[115] Philipp Leitner, Zabolotnyi Rostyslav, Alessio Gambi, and Schahram Dustdar.A framework and middleware for application-level cloud bursting on top ofinfrastructure-as-a-service clouds. 6th IEEE/ACM International Conference on Utilityand Cloud Computing (UCC 2013), 2013. 49, 50, 53
[116] Siew Huei Liew and Ya-Yunn Su. Cloudguide: Helping users estimate clouddeployment cost and performance for legacy web applications. In Proceedings ofthe 2012 IEEE 4th International Conference on Cloud Computing Technology and Science(CloudCom), CLOUDCOM ’12, pages 90–98, Washington, DC, USA, 2012. IEEEComputer Society. 30
[117] Shuo Liu, Shaolei Ren, Gang Quan, Ming Zhao, and Shangping Ren. Profit awareload balancing for distributed cloud data centers. In Parallel Distributed Processing(IPDPS), 2013 IEEE 27th International Symposium on, pages 611–622, May 2013. 55,57
131

BIBLIOGRAPHY
[118] Uri Lublin and Dror G. Feitelson. The workload on parallel supercomputers: mod-eling the characteristics of rigid jobs. Journal of Parallel and Distributed Computing,63(11):1105 – 1122, 2003. 97
[119] Heiko Ludwig, Alexander Keller, Asit Dan, Richard P King, and Richard Franck.Web service level agreement (wsla) language specification. IBM Corporation, pages815–824, 2003. 23
[120] Maciej Malawski, Kamil Figiela, and Jarek Nabrzyski. Cost minimization for com-putational applications on hybrid cloud infrastructures. Future Generation Com-puter Systems, 29(7):1786 – 1794, 2013. 14, 52, 54, 57, 58, 138
[121] Paul Marshall, Kate Keahey, and Tim Freeman. Elastic site: Using clouds to elas-tically extend site resources. In Proceedings of the 2010 10th IEEE/ACM InternationalConference on Cluster, Cloud and Grid Computing, CCGRID ’10, pages 43–52, Wash-ington, DC, USA, 2010. IEEE Computer Society. 51, 52, 53
[122] Michele Mazzucco and Dmytro Dyachuk. Optimizing cloud providers revenuesvia energy efficient server allocation. Sustainable Computing: Informatics and Sys-tems, 2(1):1 – 12, 2012. 55, 57, 120
[123] Dejan Miloji?i?, I.M. Llorente, and Ruben S. Montero. Opennebula: A cloud man-agement tool. Internet Computing, IEEE, 15(2):11–14, 2011. 26, 88
[124] Christine Morin. Xtreemos: a grid operating system making your computer readyfor participating in virtual organizations. In Object and Component-Oriented Real-Time Distributed Computing, 2007. ISORC’07. 10th IEEE International Symposium on,pages 393–402. IEEE, 2007. 19
[125] Christine Morin, Renaud Lottiaux, Geoffroy Vallée, Pascal Gallard, Gaël Utard,Ramamurthy Badrinath, and Louis Rilling. Kerrighed: a single system image clus-ter operating system for high performance computing. In Euro-Par 2003 ParallelProcessing, pages 1291–1294. Springer, 2003. 19
[126] C. Müller, O. Martín-Díaz, A. Ruiz-Cortés, M. Resinas, and P. Fernández. Improv-ing temporal-awareness of ws-agreement. In BerndJ. Krämer, Kwei-Jay Lin, andPriya Narasimhan, editors, Service-Oriented Computing – ICSOC 2007, volume 4749of Lecture Notes in Computer Science, pages 193–206. Springer Berlin Heidelberg,2007. 23
[127] Alek Opitz, Hartmut König, and Sebastian Szamlewska. What does grid comput-ing cost? Journal of Grid Computing, 6(4):385–397, 2008. 29
[128] Pradeep Padala and JosephN. Wilson. Gridos: Operating system services for gridarchitectures. In TimothyMark Pinkston and ViktorK. Prasanna, editors, High Per-formance Computing - HiPC 2003, volume 2913 of Lecture Notes in Computer Science,pages 353–362. Springer Berlin Heidelberg, 2003. 19
[129] Fawaz Paraiso, Philippe Merle, and Lionel Seinturier. Managing elasticity acrossmultiple cloud providers. In Proceedings of the 2013 international workshop on Multi-cloud applications and federated clouds, MultiCloud ’13, pages 53–60, New York, NY,USA, 2013. ACM. 45, 48
132

BIBLIOGRAPHY
[130] G. Pierre and C. Stratan. Conpaas: A platform for hosting elastic cloud applica-tions. Internet Computing, IEEE, 16(5):88–92, 2012. 27, 41, 44, 58
[131] Omer Rana, Martijn Warnier, Thomas B. Quillinan, and Frances Brazier. Moni-toring and reputation mechanisms for service level agreements. In Proceedings ofthe 5th International Workshop on Grid Economics and Business Models, GECON ’08,pages 125–139, Berlin, Heidelberg, 2008. Springer-Verlag. 23
[132] James E Reuter, David W Thiel, Richard F Wrenn, and Andrew C St Martin. Sys-tem and method for managing virtual storage, June 1 2004. US Patent 6,745,207.26
[133] Nikzad Babaii Rizvandi, Albert Y. Zomaya, Ali Javadzadeh Boloori, and JavidTaheri. On modeling dependency between mapreduce configuration parametersand total execution time. CoRR, 2012. 74, 120
[134] Rizos Sakellariou and Viktor Yarmolenko. On the flexibility of ws-agreement forjob submission. In Proceedings of the 3rd International Workshop on Middleware forGrid Computing, MGC ’05, pages 1–6, New York, NY, USA, 2005. ACM. 23
[135] Lutz Schubert, Keith G Jeffery, and Burkard Neidecker-Lutz. The Future of CloudComputing: Opportunities for European Cloud Computing Beyond 2010:–expert GroupReport. European Commission, Information Society and Media, 2010. 24, 25
[136] B. Sharma, R.K. Thulasiram, P. Thulasiraman, S.K. Garg, and R. Buyya. Pric-ing cloud compute commodities: A novel financial economic model. In Cluster,Cloud and Grid Computing (CCGrid), 2012 12th IEEE/ACM International Symposiumon, pages 451–457, 2012. 30
[137] James E. Smith and Ravi Nair. The architecture of virtual machines. Computer,38(5):32–38, May 2005. 26
[138] Garrick Staples. Torque resource manager. In Proceedings of the 2006 ACM/IEEEConference on Supercomputing, SC ’06, New York, NY, USA, 2006. ACM. 18
[139] Sen Su, Jian Li, Qingjia Huang, Xiao Huang, Kai Shuang, and Jie Wang. Cost-efficient task scheduling for executing large programs in the cloud. Parallel Com-puting, 39(4-5):177–188, 2013. 54, 55, 57
[140] Byung Chul Tak, Bhuvan Urgaonkar, and Anand Sivasubramaniam. To move ornot to move: The economics of cloud computing. In Proceedings of the 3rd USENIXConference on Hot Topics in Cloud Computing, HotCloud’11, pages 5–5, Berkeley, CA,USA, 2011. USENIX Association. 29
[141] Adel Nadjaran Toosi, Rodrigo N. Calheiros, Ruppa K. Thulasiram, and Rajku-mar Buyya. Resource provisioning policies to increase iaas provider’s profit in afederated cloud environment. In Proceedings of the 2011 IEEE International Confer-ence on High Performance Computing and Communications, HPCC ’11, pages 279–287,Washington, DC, USA, 2011. IEEE Computer Society. 14, 50, 51, 53, 58, 120, 138
133

BIBLIOGRAPHY
[142] Johan Tordsson, Rubén S. Montero, Rafael Moreno-Vozmediano, and Ignacio M.Llorente. Cloud brokering mechanisms for optimized placement of virtual ma-chines across multiple providers. Future Generation Computer Systems, 28(2):358 –367, 2012. 50, 51, 53
[143] Hong-Linh Truong and Schahram Dustdar. Composable cost estimation and mon-itoring for computational applications in cloud computing environments. ProcediaComputer Science, 1(1):2175 – 2184, 2010. <ce:title>ICCS 2010</ce:title>. 29
[144] Radu Tudoran, Alexandru Costan, Gabriel Antoniu, and Luc Bougé. A perfor-mance evaluation of azure and nimbus clouds for scientific applications. In Pro-ceedings of the 2Nd International Workshop on Cloud Computing Platforms, CloudCP’12, pages 4:1–4:6, New York, NY, USA, 2012. ACM. 97
[145] Luis M. Vaquero, Luis Rodero-Merino, Juan Caceres, and Maik Lindner. A breakin the clouds: Towards a cloud definition. SIGCOMM Comput. Commun. Rev.,39(1):50–55, December 2008. 24
[146] Christian Vecchiola, Xingchen Chu, and Rajkumar Buyya. Aneka: a software plat-form for .net-based cloud computing. High Speed and Large Scale Scientific Comput-ing, pages 267–295, 2009. 47, 48, 58
[147] Bruce J Walker. Open single system image (openssi) linux cluster project. 2005,2008. 19
[148] Cheng Wang, Bhuvan Urgaonkar, Qian Wang, George Kesidis, and Anand Siva-subramaniam. Data center cost optimization via workload modulation under real-world electricity pricing. arXiv preprint arXiv:1308.0585, 2013. 55
[149] Jon Watson. Virtualbox: Bits and bytes masquerading as machines. Linux J.,2008(166), February 2008. 26
[150] Barry B White. Virtual storage system and method, August 21 1984. US Patent4,467,421. 26
[151] Tom White. Hadoop: the definitive guide. O’Reilly, 2012. 18, 36, 39
[152] Linlin Wu and Rajkumar Buyya. Service level agreement (sla) in utility computingsystems. CoRR, abs/1010.2881, 2010. 22, 24
[153] Linlin Wu, S.K. Garg, and R. Buyya. Sla-based resource allocation for software asa service provider (saas) in cloud computing environments. In Cluster, Cloud andGrid Computing (CCGrid), 2011 11th IEEE/ACM International Symposium on, 2011.54, 55, 57
[154] S. Yangui and S. Tata. Cloudserv: Paas resources provisioning for service-basedapplications. In Advanced Information Networking and Applications (AINA), 2013IEEE 27th International Conference on, pages 522–529, 2013. 45, 48
134

BIBLIOGRAPHY
[155] Matei Zaharia, Dhruba Borthakur, Joydeep Sen Sarma, Khaled Elmeleegy, ScottShenker, and Ion Stoica. Delay scheduling: A simple technique for achieving lo-cality and fairness in cluster scheduling. In Proceedings of the 5th European Confer-ence on Computer Systems, EuroSys ’10, pages 265–278, New York, NY, USA, 2010.ACM. 97
[156] Qi Zhang, Lu Cheng, and Raouf Boutaba. Cloud computing: state-of-the-art andresearch challenges. Journal of Internet Services and Applications, 1(1):7–18, 2010. 25
[157] Jian Zhao, Hongxing Li, Chuan Wu, Zongpeng Li, Zhizhong Zhang, and F Lau.Dynamic pricing and profit maximization for clouds with geo-distributed data-centers. Proc. of IEEE INFOCOM to appear, 2014. 54, 57, 58
[158] Jian Zhao, Chuan Wu, and Zongpeng Li. Cost minimization in multiple iaasclouds: A double auction approach. CoRR, abs/1308.0841, 2013. 14, 54, 57, 138
135

BIBLIOGRAPHY
136

Appendix A
Publications
• International Conferences
– Djawida Dib, Nikos Parlavantzas, and Christine Morin. SLA-based ProfitOptimization in Cloud Bursting PaaS. In Proceedings of the 14th IEEE/ACMInternational Symposium on Cluster, Cloud and Grid Computing (CCGrid 2014),May 2014. [83]
– Alexandra Carpen-Amarie, Djawida Dib, Anne-Cécile Orgerie, and GuillaumePierre. Towards Energy-Aware IaaS-PaaS Co-design. In SMARTGREENS: In-ternational Conference on Smart Grids and Green IT Systems, colocated with Inter-national Conference on Cloud Computing and Services Science (CLOSER), April2014. [72]
– Djawida Dib, Nikos Parlavantzas, and Christine Morin. Towards Multi-LevelAdaptation for Distributed Operating Systems and Applications. In Proceed-ings of the 12th international conference on Algorithms and Architectures for ParallelProcessing - Volume Part II (ICA3PP’12), Yang Xiang, Ivan Stojmenovic, BernadyO. Apduhan, Guojun Wang, and Koji Nakano (Eds.), Vol. Part II. Springer-Verlag,Berlin, Heidelberg, 100-109., September 2012. [81]
• International Workshops
– Djawida Dib, Nikos Parlavantzas, and Christine Morin. Meryn: Open, SLA-driven, Cloud Bursting PaaS. In Proceedings of the first ACM workshop on Opti-mization techniques for resources management in clouds (ORMaCloud ’13). ACM,New York, NY, USA, 1-8., June 2013. [82]
• Other
– Djawida Dib. Adaptation dynamique des fonctionnalités d’un système d’exploitationlarge échelle. In Journée Adapt, Saint-Malo, France May 2011. [80]

138

Annexe B
Résumé en Français
B.1 Introduction
L’apparition de l’informatique dans les nuages (cloud computing) ces dernières annéesa ouvert de nouvelles perspectives à l’utilisation et la commercialisation des ressourcesinformatiques. Le concept de cloud computing permet aux utilisateurs du monde entierd’accéder à de très grandes capacités de calcul en utilisant une simple connexion Internetet en ne payant que pour les ressources réellement utilisées. Ce modèle de tarification àl’usage (pay-as-you-go) attire beaucoup de consommateurs et de petites entreprises ayantl’objectif de réduire le coût d’utilisation des ressources informatiques, et offre aux four-nisseurs de nouvelles opportunités pour commercialiser les ressources informatiques.Les services de cloud computing sont fournis selon trois modèles fondamentaux : infra-structure en tant que service (IaaS), plate-forme en tant que service (PaaS), et logiciel entant que service (SaaS). Le modèle de service IaaS fournit des ressources de base, telsque des processeurs, de l’espace de stockage et du réseau. Le modèle de service PaaSfournit un environnement de développement et d’exécution prêt à être exploité par lesapplications. Le modèle de service SaaS fournit des applications hébergées prêtes à êtreutilisées.
Dans cette thèse nous nous intéressons au modèle de service PaaS fondé sur desressources du niveau IaaS. Les systèmes PaaS dispensent leurs utilisateurs d’acquérirdes compétences techniques de programmation et d’administration pour déployer leursapplications et de gérer les ressources sous-jacentes. L’interaction entre les clients et lesfournisseurs de PaaS est gouvernée par des contrats de service SLA (Service Level Agree-ment), spécifiant les obligations de chaque partie ainsi que les paiements et les pénalitésassociés. L’impact socio-économique des services de PaaS devient essentiel puisque lenombre d’utilisateurs et de fournisseurs des clouds PaaS est en pleine croissance.
L’objectif principal des fournisseurs de cloud PaaS est de générer le maximum deprofit des services qu’ils fournissent. Cela les oblige à faire face à un certain nombrede défis. Ils doivent gérer efficacement le placement et l’isolation des applications desclients sur les ressources et satisfaire les SLAs des applications afin d’éviter le paie-ment de pénalités. Les grands fournisseurs de clouds PaaS commerciaux, tels que Ama-zon [10][11] et Microsoft [1], utilisent leurs propres ressources. Cependant, les fournis-seurs émergeants, tels que Heroku [15], CloudBees [34] et dotCoud [35], louent à lademande des ressources de clouds IaaS publics. Dans cette thèse nous considérons unenvironnement PaaS hybride de cloud bursting, où le système PaaS est fondé sur un
139

B.2. Objectifs
nombre limité de ressources privées et est capable de s’étendre sur des ressources declouds IaaS publics. Un tel environnement représente le cas général et offre plusieursoptions au fournisseur de cloud PaaS pour sélectionner les ressources qui hébergent lesapplications.
Récemment, plusieurs travaux de recherche se sont intéressés aux optimisations éco-nomiques dans des environnements composés de plusieurs systèmes de cloud. Cepen-dant, la plupart de ces travaux visent des types d’application spécifiques [120][79][64]ou des types d’environnement spécifiques [90][141][158]. C’est pourquoi l’optimisationdu profit d’un fournisseur de cloud PaaS exploitant la fonctionnalité de cloud burstingreste un sujet de recherche ouvert. Les travaux de cette thèse s’inscrivent dans cettethématique.
B.2 Objectifs
L’objectif principal de cette thèse est de proposer une solution d’optimisation du profit desfournisseurs PaaS permettant le support de SLA et du cloud bursting. Afin d’atteindre cetobjectif, cette thèse étudie quatre sous-objectifs.
• Optimisation du profit. L’optimisation du profit est l’objectif principal de chaquefournisseur de cloud PaaS. D’un côté, ceci implique l’acceptation et la satisfac-tion des requêtes des clients que ce soit dans des périodes de forte ou de faibledemande. D’un autre côté, la compétition entre les fournisseurs contraint chaquefournisseur à proposer des prix raisonnables et compétitifs par rapport aux prixpratiqués sur le marché, ce qui limite leurs revenus. Par conséquent l’optimisationdu profit du fournisseur doit passer par l’optimisation des coûts induits pour l’hé-bergement des applications. Cependant, si l’optimisation de tels coûts conduit lefournisseur à ne pas tenir ses engagements concernant la qualité de service (QoS)promise aux applications, les utilisateurs seront déçus et peuvent se tourner versd’autres fournisseurs. Ainsi notre objectif ici est de fournir une politique qui chercheles ressources les moins chéres pour le fournisseur pour héberger les applications des clients,tout en prenant en compte la réputation du fournisseur et le profit sur le long terme.
• Support de SLA. Les consommateurs de clouds PaaS s’attendent à ce que lesfournisseurs proposent des contrats de SLA qui garantissent un certain niveaude QoS à leurs applications. Une partie importante d’un accord de SLA consisteà compenser les utilisateurs si le niveau de QoS promis à leurs applications n’estpas tenu. De telles compensations peuvent pénaliser le profit des fournisseurs maissont nécessaires pour gagner la confiance des clients. Ainsi notre but est de fourniraux applications des contrats de SLA fondés sur la QoS et de prendre en compte le paiementde pénalités si le fournisseur n’arrive pas a fournir aux applications de ses clients le niveaude QoS promis.
• Support de plusieurs types d’applications. Une solution de cloud PaaS facile-ment extensible pour supporter de nouveaux types d’applications est attrayantepour les consommateurs et les fournisseurs. D’un côté, elle offre plus de flexibi-lité aux consommateurs ayant des besoins variés. D’un autre côté, elle permet auxfournisseurs d’attirer des clients de différents domaines professionnels et d’ajou-ter facilement le support aux nouvelles applications rentables, ce qui les aide à
140

Appendix B. Résumé en Français
augmenter leur chiffre d’affaire. Pour cela, notre objectif est de fournir une solutiond’optimisation de profit de fournisseur PaaS générique qui soit indépendante d’un typed’application spécifique.
• Système PaaS avec cloud bursting Un système PaaS avec cloud bursting permet-tant le déploiement des applications simultanément sur des ressources privées etpubliques offre au fournisseur de cloud PaaS plusieurs options de déploiementpour optimiser le coût ou la performance des applications. Le support du cloudbursting nécessite un travail d’ingénierie important pour permettre au système dePaaS d’utiliser plusieurs systèmes IaaS et de garantir les termes de SLA des ap-plications déployées simultanément sur plusieurs clouds IaaS. À cet effet, notrebut est de concevoir un système PaaS avec cloud bursting permettant le déploiement desapplications sur plusieurs clouds.
B.3 Contributions
L’objectif de cette thèse est de fournir une solution d’optimisation du profit du fournis-seur PaaS sous des contraintes de SLA dans un environnement de cloud bursting. Cettethèse aborde cet objectif avec les contributions suivantes.
B.3.1 Modèle d’optimisation de profit
Nous définissons un modèle générique de système PaaS avec la fonctionnalité de cloudbursting et nous proposons une politique d’optimisation du profit du fournisseur decloud PaaS. La politique proposée essaye de trouver les ressources les moins chères pourhéberger les applications des clients, tout en prenant en compte la satisfaction de leursSLAs. Concrètement, à chaque requête d’un client la politique évalue le coût d’hébergerson application en utilisant les ressources publiques et privées et choisit l’option qui gé-nère le plus de profit. Pendant les périodes de pointe et l’indisponibilité des ressourcesprivées, la politique essaye d’optimiser l’utilisation des ressources privées en considè-rant deux autres options. La première option consiste à emprunter quelques ressourcesaux applications en cours d’exécution tout en considérant le paiement de pénalités sileur niveau de QoS promis est affecté. La seconde option consiste à évaluer la pénalitépossible de la nouvelle application due à l’attente de la libération de ressources privées.La politique proposée est générique et peut être appliquée sur n’importe quel type d’ap-plication avec une seule condition qui consiste à faire coopérer des entités spécifiquesaux types d’application supportés. De telles entités fournissent des informations sur lemodèle de performance et le contrat de SLA des applications hébergées.
B.3.2 Application du modèle d’optimisation
Pour montrer l’applicabilité de notre modèle d’optimisation de profit sur une classe par-ticulière d’application, nous avons étudié les applications de calcul rigides et élastiquesNous avons défini des termes de SLA correspondants et présenté deux heuristiques quicollaborent avec la politique d’optimisation pour maximiser le profit du fournisseur decloud PaaS. La première heuristique fournit une offre d’attente qui représente la plus pe-tite pénalité possible pour la nouvelle application due à l’attente de la disponibilité de
141

B.4. Évaluation
ressources privées. La deuxième heuristique fournit une offre de don qui représente laplus petite pénalité possible pour des applications en cours d’exécution induite par lafourniture d’une partie de leurs ressources à la nouvelle application. Nous avons définitrois formes possibles qui peuvent être utilisées par les applications de calcul pour four-nir des ressources durant leur exécution. La première forme consiste à suspendre desapplications durant l’exécution de la nouvelle application et les reprendre une fois quela nouvelle application termine son exécution et rend les ressources. La deuxième formeconsiste à prêter une partie des ressources des applications en cours d’exécution à lanouvelle application et de continuer leur exécution avec les ressources restantes jusqu’àce que la nouvelle application termine son exécution et rende les ressources emprun-tées. La troisième forme consiste à donner une partie des ressources des applications encours d’exécution à la nouvelle application et à continuer leur exécution avec les res-sources restantes. La deuxième et troisième forme ne peuvent être utilisées qu’avec lesapplications de calcul élastiques. Chaque forme induit pour l’application une pénalitédifférente. Ainsi, l’heuristique sélectionne la forme d’impact qui conduit à la plus petitepénalité possible.
B.3.3 Meryn : un système de PaaS avec la fonctionnalité de cloud bursting
Nous avons conçu et implémenté une architecture de système PaaS, appelée Meryn, ca-pable d’incorporer la politique d’optimisation de profit ainsi que les différentes heuris-tiques spécifiques aux types d’application. L’architecture du système Meryn repose surdes ressources privées virtualisées, en utilisant une solution de gestion de cloud IaaS,et supporte la fonctionnalité de cloud bursting dans des cloues publics quand cela estnécessaire. Pour supporter l’extensibilité par rapport aux types d’applications, Merynfait usage de clusters virtuels et gère chaque cluster virtuel en utilisant un frameworkexistant dédié à un type d’application spécifique. En l’occurrence, le framework OGEest dédié aux applications batch et le framework Hadoop est dédié aux applicationsMapReduce. Les ressources privées sont dynamiquement partagées entre les clustersvirtuels suivant des politiques et des objectifs spécifiques, à savoir dans notre contextesuivant la politique d’optimisation de profit.
B.4 Évaluation
Pour valider nos contributions nous avons implémenté un prototype Meryn supportantles applications batch et MapReduce. Nous avons évalué la politique d’optimisation deprofit proposée en utilisant le prototype Meryn et des modèles de workload fondés surdes traces du monde réel. Nous avons effectué un ensemble de simulations et d’expé-riences sur la plate-forme d’expérimentation Grid’5000 [40].
Nous avons comparé la politique d’optimisation proposée à une approche de basequi attribue un nombre fixe de ressources privées aux clusters virtuels et elle ne leurpermet de s’étendre qu’avec des ressources de clouds publics. Les résultats montrentque notre politique d’optimisation permet au fournisseur de cloud PaaS d’augmenterson profit de 11.59% et 9.02% dans respectivement les simulations et les expériencespar rapport à l’approche de base. Comme coût d’une telle optimisation, le temps determinaison des workloads dans un système utilisant notre politique d’optimisation est
142

Appendix B. Résumé en Français
légèrement supérieure par rapport à l’approche de base. En outre, le niveau de QoSpromis à certaines applications a été affecté.
B.5 Organisation du manuscrit
Ce manuscrit est organisé comme suit. Le chapitre 2 présente les définitions généralesdu contexte de notre travail. Plus précisément, ce chapitre fournit un aperçu des dif-férentes infrastructures de calcul et des différents modèles d’applications. En outre, ildéfinit les concepts de Service Level Agreement (SLA) et de cloud computing. Le chapitre 3présente les différentes conditions requises pour atteindre les objectifs de cette thèse,il couvre l’état de l’art et il positionne les contributions de cette thèse. Les principauxaxes couvèrt sont : les politiques d’optimisation économique, les mécanismes de cloudbursting, et les systèmes de type PaaS. Le chapitre 4 décrit la première contribution decette thèse qui consiste en la proposition d’un modèle générique pour l’optimisation duprofit d’un fournisseur de cloud OaaS dans un environnement de cloud bursting. Lechapitre 5 étudie les applications de calcul rigides et élastiques dans le but d’appliquerconcrètement notre modèle générique d’optimisation de profit. Le chapitre 6 présenteles principes de conception, l’architecture et la mise en œuvre du système Meryn, uncloud PaaS qui implémente le scénario de cloud bursting et les algorithmes d’optimi-sation que nous avons proposés. Le chapitre 7 montre les résultats d’évaluation de noscontributions à l’aide de simulations et expériences effectuées sur la plate-forme d’expé-rimentation Grid’5000 [40] avec notre prototype. Le chapitre 8 conclut ce manuscrit enrésumant nos contributions et en présentant quelque perspectives.
143


Optimizing PaaS Provider Profit under Service Level AgreementConstraints
Abstract
Cloud computing is an emerging paradigm revolutionizing the use and marketing of informationtechnology. As the number of cloud users and providers grows, the socio-economical impact ofcloud solutions and particularly PaaS (platform as a service) solutions is becoming increasinglycritical. The main objective of PaaS providers is to generate the maximum profit from the servicesthey provide. This requires them to face a number of challenges such as efficiently managing theunderlying resources and satisfying the SLAs of the hosted applications.
This thesis considers a cloud-bursting PaaS environment where the PaaS provider owns alimited number of private resources and is able to rent public cloud resources, when needed.This environment enables the PaaS provider to have full control over services hosted on theprivate cloud and to take advantage of public clouds for managing peak periods. In this context,we propose a profit-efficient solution for managing the cloud-bursting PaaS system under SLAconstraints. We define a profit optimization policy that, after each client request, evaluates thecost of hosting the application using public and private resources and chooses the option thatgenerates the highest profit. During peak periods the optimization policy considers two moreoptions. The first option is to take some resources from running applications, taking into accountthe payment of penalties if their promised quality of service is affected. The second option isto wait until private resources become available, taking into account the payment of penalties ifthe promised quality of service of the new application is affected. Furthermore we designed andimplemented an open cloud-bursting PaaS system, called Meryn, which integrates the proposedoptimization policy and provides support for batch and MapReduce applications. The results ofour evaluation show the effectiveness of our approach in optimizing the provider profit. Indeed,compared to a basic approach, our approach provides up to 11.59% and 9.02% more providerprofit in, respectively, simulations and experiments.
Keywords
Cloud computing, Platform as a Service (PaaS), Service Level Agreement (SLA), economic opti-mization, computational applications.
Résumé
L’informatique en nuage (cloud computing) est un paradigme émergent qui révolutionne l’utili-sation et la commercialisation des services informatiques. De nos jours, l’impact socio-économiquede l’informatique en nuage et plus particulièrement des services de PaaS (plate-forme en tantque service) devient essentiel, puisque le nombre d’utilisateurs et de fournisseurs des cloudPaaS est en pleine croissance. L’objectif principal des fournisseurs de cloud PaaS est de générerle maximum de profit des services qu’ils fournissent. Cela les oblige à faire face à un certainnombre de défis, tels que la gestion efficace des ressources sous-jacentes et la satisfaction desSLAs (contrat de service) des applications hébergées.
Dans cette thèse, nous considérons un environnement PaaS hybride de cloud bursting, où lefournisseur PaaS possède un nombre limité de ressources privées et a la possibilité de louer desressources publiques. Ce choix permet au fournisseur PaaS d’avoir un contrôle complet sur lesservices hébergés dans les ressources privées et de profiter de ressources publiques pour gérerles périodes de pointe. De plus, nous proposons une solution rentable pour gérer un tel systèmePaaS sous des contraintes de SLA. Nous définissons une politique d’optimisation de profit qui, àchaque requête d’un nouveau client, évalue le coût d’hébergement de son application en utilisantles ressources publiques et privées et choisit l’option qui génère le plus de profit. Pendant les

périodes de pointe la politique considère deux autres options. La première option consiste àemprunter quelques ressources aux applications en cours d’exécution tout en considérant lepaiement de pénalités si leur qualité de service est affectée. La seconde option consiste à attendreque des ressources privées soient libérés tout en considérant le paiement de pénalités si la qualitéde service de la nouvelle application est affectée. En outre, nous avons conçu et mis en œuvreune architecture de cloud PaaS, appelée Meryn, qui intègre la politique d’optimisation proposée,supporte le cloud bursting et héberge des applications du type batch et MapReduce. Les résultatsde notre évaluation montrent l’efficacité de notre approche dans l’optimisation du profit dufournisseur. En effet, comparée à une approche de base, notre approche fournit jusqu’à 11.59 % et9.02 % plus de profits pour le fournisseur dans respectivement les simulations et les expériences.
Mots clés
Informatique en nuage, plate-forme en tant que service, contrat de service, optimisation écono-mique, applications de calcul.