Bilayer photovoltaic devices with PPQ as the electron acceptor layer
Upload
independentCategory
view
3download
0
Optical and Electrical Studies of the Double AcceptorLevels of the Mercury Vacancies in HgCdTe
F. GEMAIN,1 I.C. ROBIN,1,3 S. BROCHEN,1 M. DE VITA,1 O. GRAVRAND,1
and A. LUSSON2
1.—CEA, LETI, Minatec, 17 Rue des Martyrs, 38054 Grenoble Cedex 9, France. 2.—GEMaC,CNRS, UVSQ, 1 Place Aristide Briand, 92190 Meudon, France. 3.—e-mail: [email protected]
Correlations between photoluminescence and temperature-dependent Hallmeasurements were carried out on unintentionally doped HgCdTe epilayerswith cadmium composition of 32.7%. These films were grown by liquid-phaseepitaxy and post-annealed under different conditions as follows: a p-typeannealing was used to control the mercury vacancy concentration, and ann-type annealing under saturated mercury atmosphere was used to fill themercury vacancies. Comparison of the results obtained by these two charac-terization techniques allowed us to identify the two acceptor energy levels ofthe mercury vacancy. Moreover, the ‘‘U-negativity’’ of the vacancy was evi-denced: the ionized state V� is stabilized under the neutral state V0 by thedominance of the Jahn–Teller effect over Coulombic repulsion. Finally, threeepilayers with different cadmium compositions were also characterized tocomplete this study.
Key words: HgCdTe, photoluminescence, mercury vacancies, U-negativity,Hall effect
INTRODUCTION
The success of new-generation HgCdTe (MCT)devices based on p/n junctions requires good controlof doping properties, especially extrinsic p-typedoping.1,2 This material is naturally p-type doped bynative mercury vacancies. Vydyanath and cowork-ers3,4 estimated the concentration of these intrinsicacceptor impurities in as-grown liquid-phase epitaxy(LPE) samples to be about 1018 cm�3 for growthtemperatures T > 300�C. The energy levels relatedto these acceptors are still not well known. Indeed,the Hg vacancy is a double acceptor defect with twolevels at different ionization energies. However, todate, only one acceptor activation energy has usuallybeen measured in literature by temperature-depen-dent Hall measurements.5,6 Also, only one emissionpeak at about 12 meV to 15 meV lower than theband-to-band emission was reported in literatureusing photoluminescence (PL) measurements and
identified to be potentially related to Hg vacancies.7–10
In this work, several samples from the sameepilayer undergoing different annealing to fill or toreinforce the Hg vacancies are used. Systematiccomparison of the PL studies performed on thedifferent samples allowed us to observe for the firsttime the two acceptor levels of the Hg vacancies.The ionization energy of the two acceptor levelscould be measured and the correlation with tem-perature-dependent Hall measurements allowed usto clearly attribute the emission peaks to eachacceptor level of the Hg vacancy. Studies of threeepilayers with different cadmium compositions(32%, 45%, and 60%) are finally presented.
SAMPLE PREPARATION
The studied MCT layer was grown by LPE at500�C. The active layer was 9 lm thick with cad-mium composition of 32.7%, corresponding to acutoff wavelength of 3.75 lm at room temperature.Three samples of this MCT epilayer were compared
(Received October 27, 2011; accepted April 5, 2012;published online May 15, 2012)
Journal of ELECTRONIC MATERIALS, Vol. 41, No. 10, 2012
DOI: 10.1007/s11664-012-2104-8� 2012 TMS
2867
as follows: A first sample was kept as grown.Another sample was p-type annealed under vacuumat 330�C for 1 h in order to fix the p-type dopinglevel due to Hg vacancies. A third sample washeated under saturated mercury atmosphere for5 days at 200�C in order to fill the Hg vacancies andto electrically measure the residual doping level.This treatment is called ‘‘n-type annealing.’’ Modu-lated PL measurements were carried out using aFourier-transform infrared (FTIR) spectrometer onthe as-grown, p-type annealed, and n-type annealedsamples. The PL measurements were performedbetween 2 K and 300 K using a 1064 nm wave-length neodymium-doped yttrium aluminum garnet(YAG) laser for excitation. The signal was detectedusing a cooled InSb detector. The results are com-pared with temperature-dependent Hall measure-ments obtained with a magnetic field of 7 kG.
OPTICAL CHARACTERIZATION:PHOTOLUMINESCENCE STUDIES
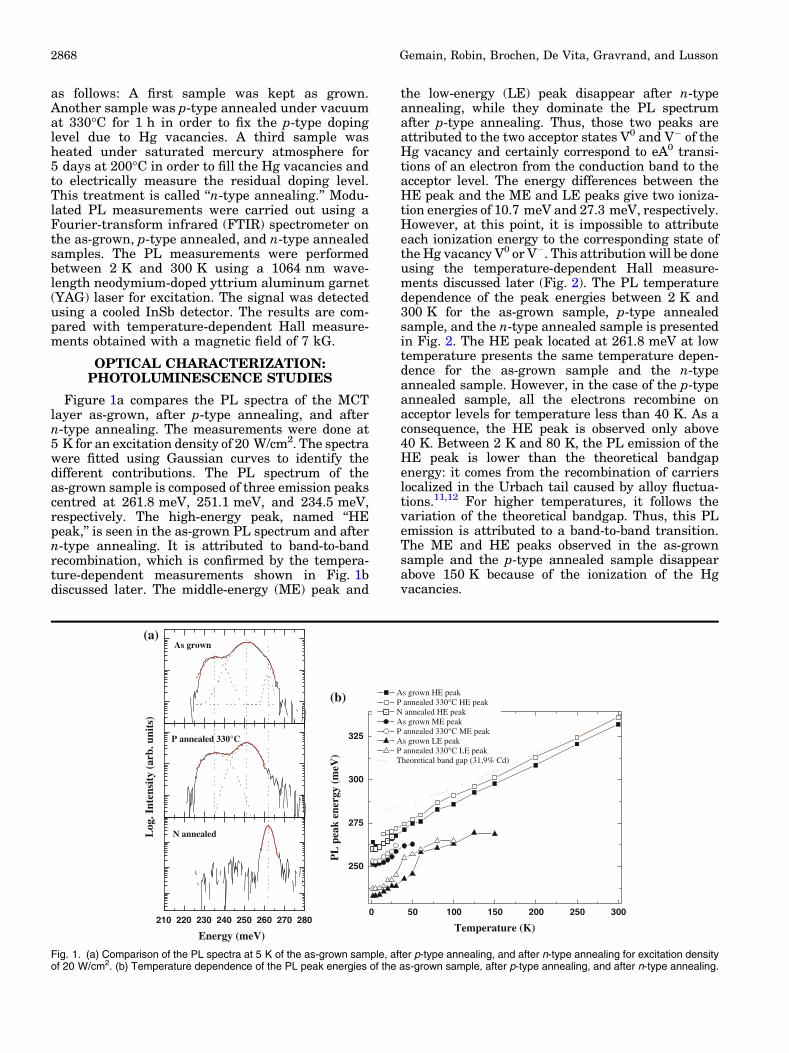
Figure 1a compares the PL spectra of the MCTlayer as-grown, after p-type annealing, and aftern-type annealing. The measurements were done at5 K for an excitation density of 20 W/cm2. The spectrawere fitted using Gaussian curves to identify thedifferent contributions. The PL spectrum of theas-grown sample is composed of three emission peakscentred at 261.8 meV, 251.1 meV, and 234.5 meV,respectively. The high-energy peak, named ‘‘HEpeak,’’ is seen in the as-grown PL spectrum and aftern-type annealing. It is attributed to band-to-bandrecombination, which is confirmed by the tempera-ture-dependent measurements shown in Fig. 1bdiscussed later. The middle-energy (ME) peak and
the low-energy (LE) peak disappear after n-typeannealing, while they dominate the PL spectrumafter p-type annealing. Thus, those two peaks areattributed to the two acceptor states V0 and V� of theHg vacancy and certainly correspond to eA0 transi-tions of an electron from the conduction band to theacceptor level. The energy differences between theHE peak and the ME and LE peaks give two ioniza-tion energies of 10.7 meV and 27.3 meV, respectively.However, at this point, it is impossible to attributeeach ionization energy to the corresponding state ofthe Hg vacancy V0 or V�. This attribution will be doneusing the temperature-dependent Hall measure-ments discussed later (Fig. 2). The PL temperaturedependence of the peak energies between 2 K and300 K for the as-grown sample, p-type annealedsample, and the n-type annealed sample is presentedin Fig. 2. The HE peak located at 261.8 meV at lowtemperature presents the same temperature depen-dence for the as-grown sample and the n-typeannealed sample. However, in the case of the p-typeannealed sample, all the electrons recombine onacceptor levels for temperature less than 40 K. As aconsequence, the HE peak is observed only above40 K. Between 2 K and 80 K, the PL emission of theHE peak is lower than the theoretical bandgapenergy: it comes from the recombination of carrierslocalized in the Urbach tail caused by alloy fluctua-tions.11,12 For higher temperatures, it follows thevariation of the theoretical bandgap. Thus, this PLemission is attributed to a band-to-band transition.The ME and HE peaks observed in the as-grownsample and the p-type annealed sample disappearabove 150 K because of the ionization of the Hgvacancies.
210 220 230 240 250 260 270 280
As grown(a)
(b)
P annealed 330°C
N annealedLog
. Int
ensi
ty (
arb.
uni
ts)
Energy (meV)
0 50 100 150 200 250 300
250
275
300
325
As grown HE peak P annealed 330°C HE peak N annealed HE peak As grown ME peak P annealed 330°C ME peak As grown LE peak P annealed 330°C LE peak Theoretical band gap (31,9% Cd)
PL
pea
k en
ergy
(m
eV)
Temperature (K)
Fig. 1. (a) Comparison of the PL spectra at 5 K of the as-grown sample, after p-type annealing, and after n-type annealing for excitation densityof 20 W/cm2. (b) Temperature dependence of the PL peak energies of the as-grown sample, after p-type annealing, and after n-type annealing.
Gemain, Robin, Brochen, De Vita, Gravrand, and Lusson2868
ELECTRICAL CHARACTERIZATION:TEMPERATURE-DEPENDENT HALL
EFFECT
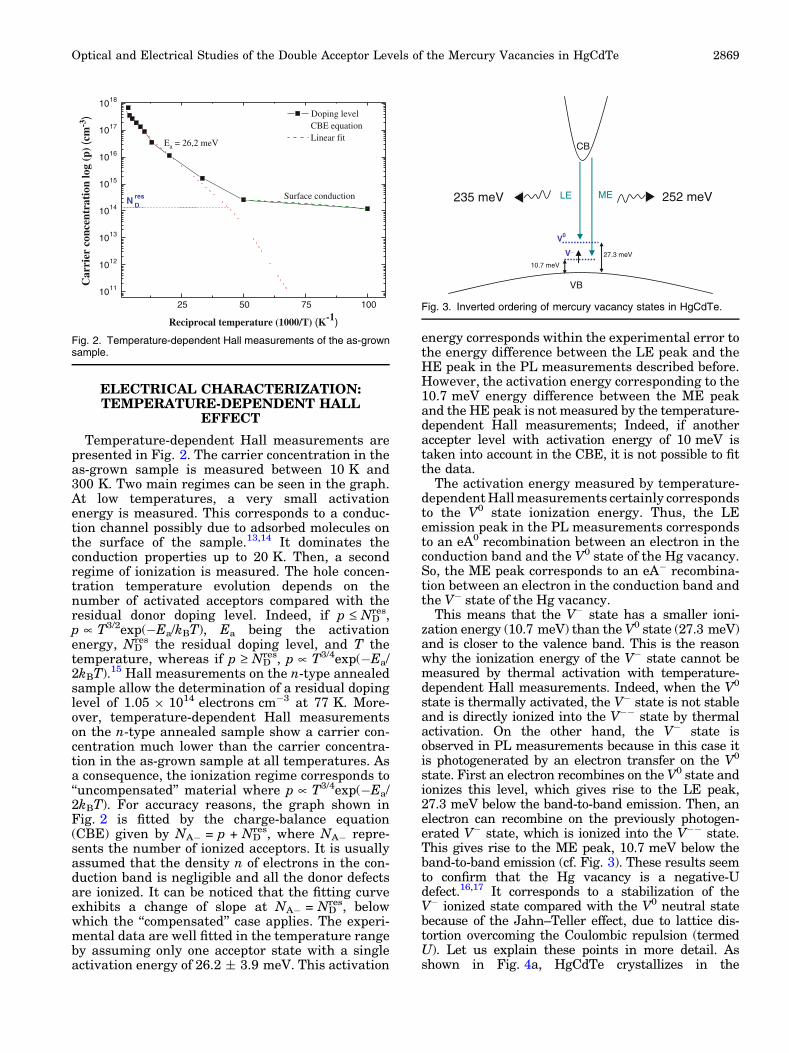
Temperature-dependent Hall measurements arepresented in Fig. 2. The carrier concentration in theas-grown sample is measured between 10 K and300 K. Two main regimes can be seen in the graph.At low temperatures, a very small activationenergy is measured. This corresponds to a conduc-tion channel possibly due to adsorbed molecules onthe surface of the sample.13,14 It dominates theconduction properties up to 20 K. Then, a secondregime of ionization is measured. The hole concen-tration temperature evolution depends on thenumber of activated acceptors compared with theresidual donor doping level. Indeed, if p £ ND
res,p � T3/2exp(�Ea/kBT), Ea being the activationenergy, ND
res the residual doping level, and T thetemperature, whereas if p ‡ ND
res, p � T3/4exp(�Ea/2kBT).15 Hall measurements on the n-type annealedsample allow the determination of a residual dopinglevel of 1.05 9 1014 electrons cm�3 at 77 K. More-over, temperature-dependent Hall measurementson the n-type annealed sample show a carrier con-centration much lower than the carrier concentra-tion in the as-grown sample at all temperatures. Asa consequence, the ionization regime corresponds to‘‘uncompensated’’ material where p � T3/4exp(�Ea/2kBT). For accuracy reasons, the graph shown inFig. 2 is fitted by the charge-balance equation(CBE) given by NA� = p + ND
res, where NA� repre-sents the number of ionized acceptors. It is usuallyassumed that the density n of electrons in the con-duction band is negligible and all the donor defectsare ionized. It can be noticed that the fitting curveexhibits a change of slope at NA� = ND
res, belowwhich the ‘‘compensated’’ case applies. The experi-mental data are well fitted in the temperature rangeby assuming only one acceptor state with a singleactivation energy of 26.2 ± 3.9 meV. This activation
energy corresponds within the experimental error tothe energy difference between the LE peak and theHE peak in the PL measurements described before.However, the activation energy corresponding to the10.7 meV energy difference between the ME peakand the HE peak is not measured by the temperature-dependent Hall measurements; Indeed, if anotheraccepter level with activation energy of 10 meV istaken into account in the CBE, it is not possible to fitthe data.
The activation energy measured by temperature-dependent Hall measurements certainly correspondsto the V0 state ionization energy. Thus, the LEemission peak in the PL measurements correspondsto an eA0 recombination between an electron in theconduction band and the V0 state of the Hg vacancy.So, the ME peak corresponds to an eA� recombina-tion between an electron in the conduction band andthe V� state of the Hg vacancy.
This means that the V� state has a smaller ioni-zation energy (10.7 meV) than the V0 state (27.3 meV)and is closer to the valence band. This is the reasonwhy the ionization energy of the V� state cannot bemeasured by thermal activation with temperature-dependent Hall measurements. Indeed, when the V0
state is thermally activated, the V� state is not stableand is directly ionized into the V�� state by thermalactivation. On the other hand, the V� state isobserved in PL measurements because in this case itis photogenerated by an electron transfer on the V0
state. First an electron recombines on the V0 state andionizes this level, which gives rise to the LE peak,27.3 meV below the band-to-band emission. Then, anelectron can recombine on the previously photogen-erated V� state, which is ionized into the V�� state.This gives rise to the ME peak, 10.7 meV below theband-to-band emission (cf. Fig. 3). These results seemto confirm that the Hg vacancy is a negative-Udefect.16,17 It corresponds to a stabilization of theV� ionized state compared with the V0 neutral statebecause of the Jahn–Teller effect, due to lattice dis-tortion overcoming the Coulombic repulsion (termedU). Let us explain these points in more detail. Asshown in Fig. 4a, HgCdTe crystallizes in the
25 50 75 1001011
1012
1013
1014
1015
1016
1017
1018
Surface conduction
Doping level CBE equation Linear fit
Car
rier
con
cent
rati
on lo
g (p
) (c
m-3
)
Reciprocal temperature (1000/T) (K-1)
Ea = 26,2 meV
N resD
Fig. 2. Temperature-dependent Hall measurements of the as-grownsample.
10.7 meV
VB
V0
V_27.3 meV
CB
LE ME 252 meV235 meV
Fig. 3. Inverted ordering of mercury vacancy states in HgCdTe.
Optical and Electrical Studies of the Double Acceptor Levels of the Mercury Vacancies in HgCdTe 2869
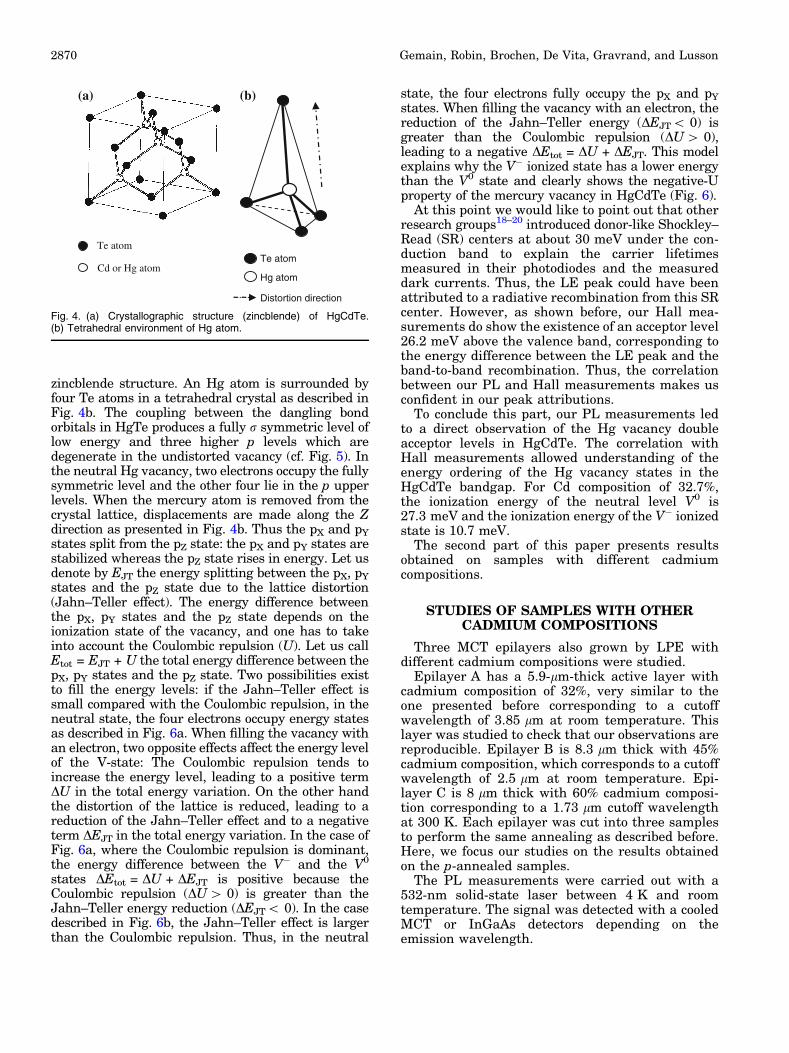
zincblende structure. An Hg atom is surrounded byfour Te atoms in a tetrahedral crystal as described inFig. 4b. The coupling between the dangling bondorbitals in HgTe produces a fully r symmetric level oflow energy and three higher p levels which aredegenerate in the undistorted vacancy (cf. Fig. 5). Inthe neutral Hg vacancy, two electrons occupy the fullysymmetric level and the other four lie in the p upperlevels. When the mercury atom is removed from thecrystal lattice, displacements are made along the Zdirection as presented in Fig. 4b. Thus the pX and pY
states split from the pZ state: the pX and pY states arestabilized whereas the pZ state rises in energy. Let usdenote by EJT the energy splitting between the pX, pY
states and the pZ state due to the lattice distortion(Jahn–Teller effect). The energy difference betweenthe pX, pY states and the pZ state depends on theionization state of the vacancy, and one has to takeinto account the Coulombic repulsion (U). Let us callEtot = EJT + U the total energy difference between thepX, pY states and the pZ state. Two possibilities existto fill the energy levels: if the Jahn–Teller effect issmall compared with the Coulombic repulsion, in theneutral state, the four electrons occupy energy statesas described in Fig. 6a. When filling the vacancy withan electron, two opposite effects affect the energy levelof the V-state: The Coulombic repulsion tends toincrease the energy level, leading to a positive termDU in the total energy variation. On the other handthe distortion of the lattice is reduced, leading to areduction of the Jahn–Teller effect and to a negativeterm DEJT in the total energy variation. In the case ofFig. 6a, where the Coulombic repulsion is dominant,the energy difference between the V� and the V0
states DEtot = DU + DEJT is positive because theCoulombic repulsion (DU > 0) is greater than theJahn–Teller energy reduction (DEJT< 0). In the casedescribed in Fig. 6b, the Jahn–Teller effect is largerthan the Coulombic repulsion. Thus, in the neutral
state, the four electrons fully occupy the pX and pY
states. When filling the vacancy with an electron, thereduction of the Jahn–Teller energy (DEJT< 0) isgreater than the Coulombic repulsion (DU > 0),leading to a negative DEtot = DU + DEJT. This modelexplains why the V� ionized state has a lower energythan the V0 state and clearly shows the negative-Uproperty of the mercury vacancy in HgCdTe (Fig. 6).
At this point we would like to point out that otherresearch groups18–20 introduced donor-like Shockley–Read (SR) centers at about 30 meV under the con-duction band to explain the carrier lifetimesmeasured in their photodiodes and the measureddark currents. Thus, the LE peak could have beenattributed to a radiative recombination from this SRcenter. However, as shown before, our Hall mea-surements do show the existence of an acceptor level26.2 meV above the valence band, corresponding tothe energy difference between the LE peak and theband-to-band recombination. Thus, the correlationbetween our PL and Hall measurements makes usconfident in our peak attributions.
To conclude this part, our PL measurements ledto a direct observation of the Hg vacancy doubleacceptor levels in HgCdTe. The correlation withHall measurements allowed understanding of theenergy ordering of the Hg vacancy states in theHgCdTe bandgap. For Cd composition of 32.7%,the ionization energy of the neutral level V0 is27.3 meV and the ionization energy of the V� ionizedstate is 10.7 meV.
The second part of this paper presents resultsobtained on samples with different cadmiumcompositions.
STUDIES OF SAMPLES WITH OTHERCADMIUM COMPOSITIONS
Three MCT epilayers also grown by LPE withdifferent cadmium compositions were studied.
Epilayer A has a 5.9-lm-thick active layer withcadmium composition of 32%, very similar to theone presented before corresponding to a cutoffwavelength of 3.85 lm at room temperature. Thislayer was studied to check that our observations arereproducible. Epilayer B is 8.3 lm thick with 45%cadmium composition, which corresponds to a cutoffwavelength of 2.5 lm at room temperature. Epi-layer C is 8 lm thick with 60% cadmium composi-tion corresponding to a 1.73 lm cutoff wavelengthat 300 K. Each epilayer was cut into three samplesto perform the same annealing as described before.Here, we focus our studies on the results obtainedon the p-annealed samples.
The PL measurements were carried out with a532-nm solid-state laser between 4 K and roomtemperature. The signal was detected with a cooledMCT or InGaAs detectors depending on theemission wavelength.
Te atom
Cd or Hg atomTe atom
Hg atom
Distortion direction
(a) (b)
Fig. 4. (a) Crystallographic structure (zincblende) of HgCdTe.(b) Tetrahedral environment of Hg atom.
Gemain, Robin, Brochen, De Vita, Gravrand, and Lusson2870
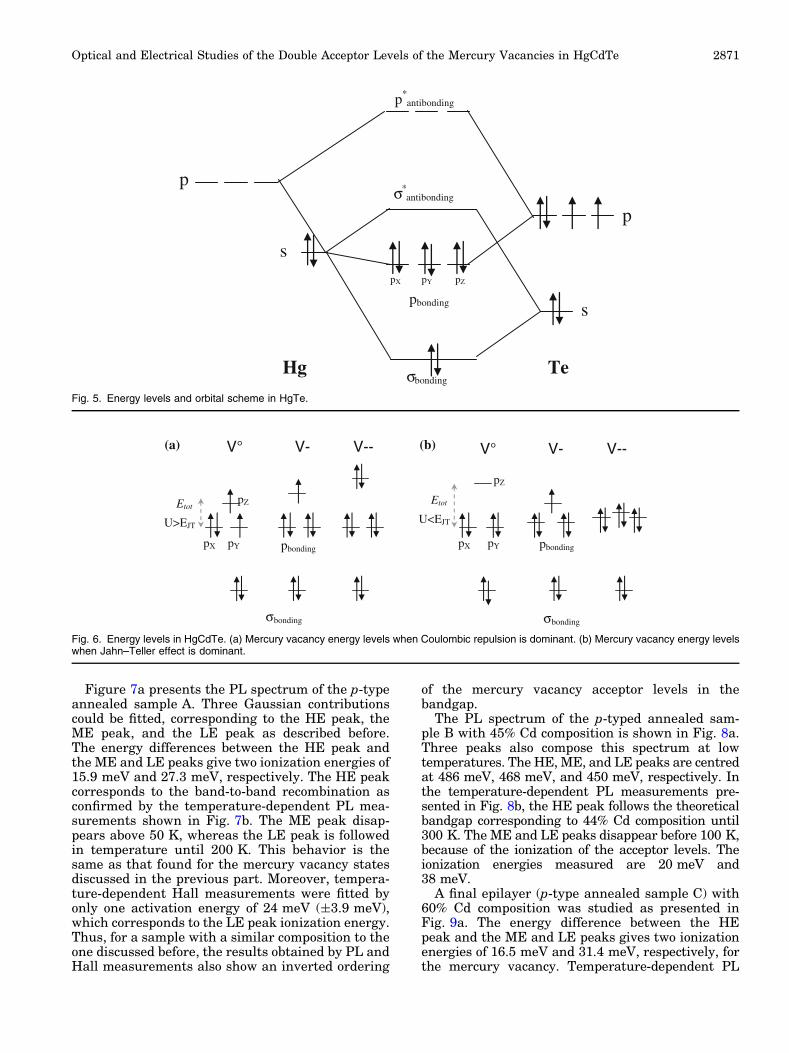
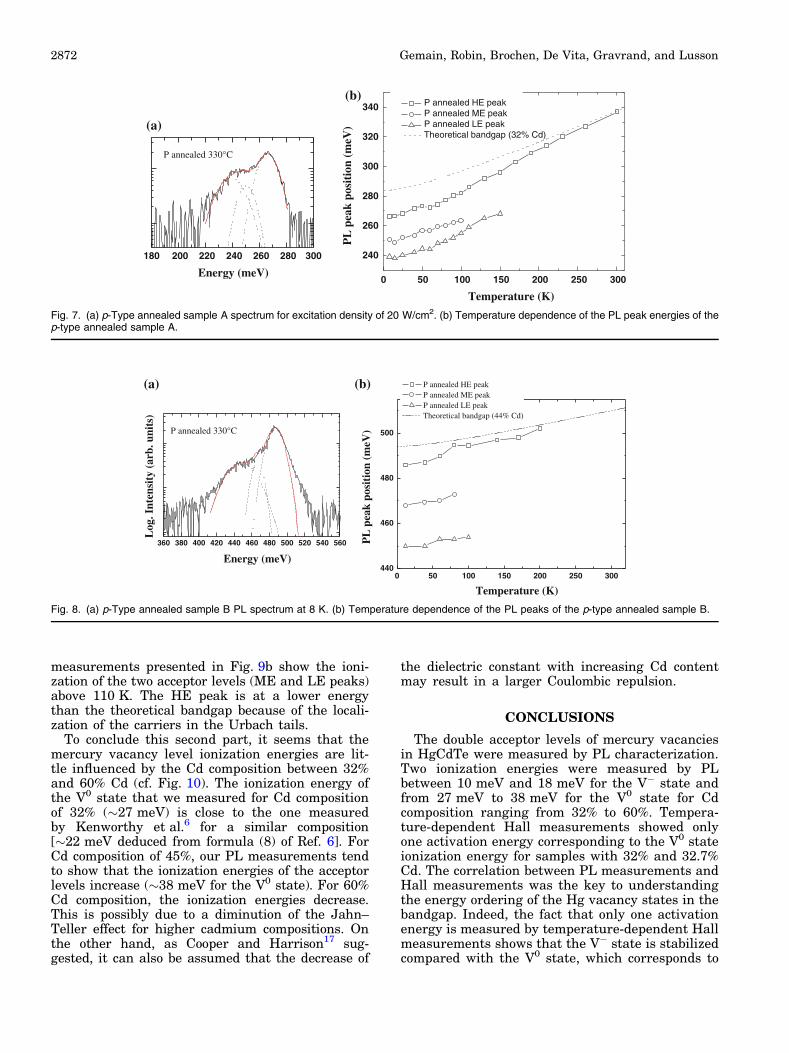
Figure 7a presents the PL spectrum of the p-typeannealed sample A. Three Gaussian contributionscould be fitted, corresponding to the HE peak, theME peak, and the LE peak as described before.The energy differences between the HE peak andthe ME and LE peaks give two ionization energies of15.9 meV and 27.3 meV, respectively. The HE peakcorresponds to the band-to-band recombination asconfirmed by the temperature-dependent PL mea-surements shown in Fig. 7b. The ME peak disap-pears above 50 K, whereas the LE peak is followedin temperature until 200 K. This behavior is thesame as that found for the mercury vacancy statesdiscussed in the previous part. Moreover, tempera-ture-dependent Hall measurements were fitted byonly one activation energy of 24 meV (±3.9 meV),which corresponds to the LE peak ionization energy.Thus, for a sample with a similar composition to theone discussed before, the results obtained by PL andHall measurements also show an inverted ordering
of the mercury vacancy acceptor levels in thebandgap.
The PL spectrum of the p-typed annealed sam-ple B with 45% Cd composition is shown in Fig. 8a.Three peaks also compose this spectrum at lowtemperatures. The HE, ME, and LE peaks are centredat 486 meV, 468 meV, and 450 meV, respectively. Inthe temperature-dependent PL measurements pre-sented in Fig. 8b, the HE peak follows the theoreticalbandgap corresponding to 44% Cd composition until300 K. The ME and LE peaks disappear before 100 K,because of the ionization of the acceptor levels. Theionization energies measured are 20 meV and38 meV.
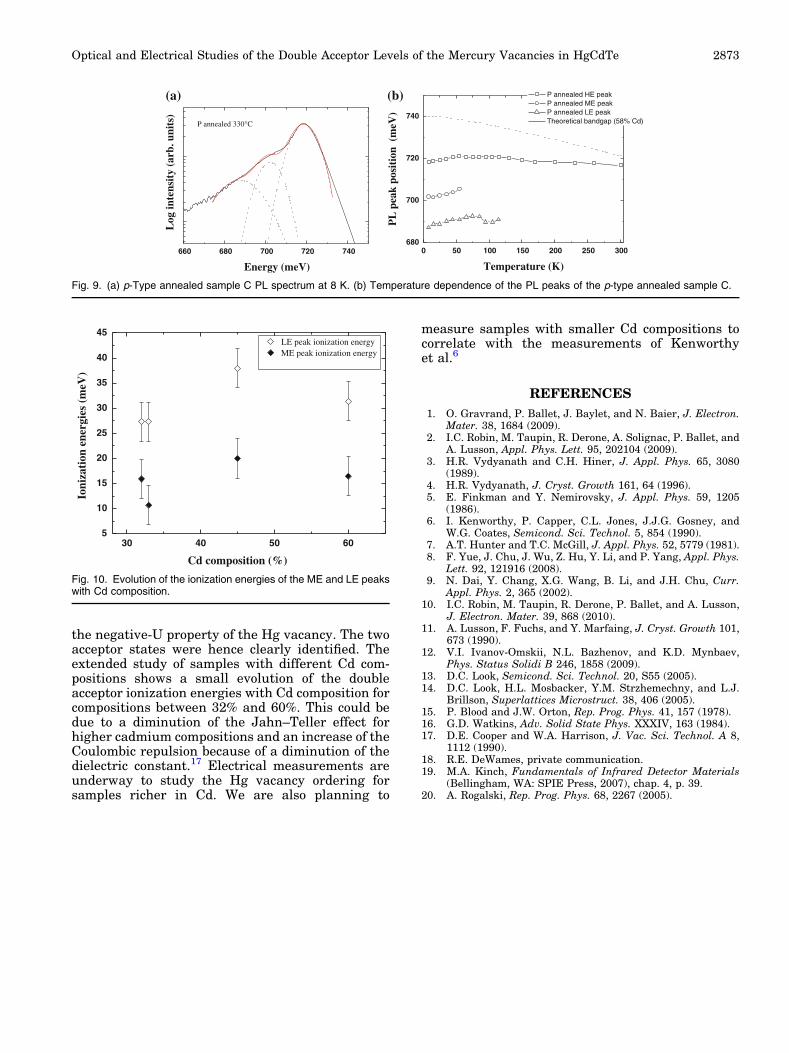
A final epilayer (p-type annealed sample C) with60% Cd composition was studied as presented inFig. 9a. The energy difference between the HEpeak and the ME and LE peaks gives two ionizationenergies of 16.5 meV and 31.4 meV, respectively, forthe mercury vacancy. Temperature-dependent PL
Hg Teσbonding
pbonding
σ*antibonding
p*antibonding
pX pY pZ
s
s
p
p
Fig. 5. Energy levels and orbital scheme in HgTe.
pbonding
σbonding
V° V- V--
pbonding
V°
σbonding
V- V--
Etot
U<EJT
Etot
U>EJT
pX pY
pZ
pX pY
pZ
(a) (b)
Fig. 6. Energy levels in HgCdTe. (a) Mercury vacancy energy levels when Coulombic repulsion is dominant. (b) Mercury vacancy energy levelswhen Jahn–Teller effect is dominant.
Optical and Electrical Studies of the Double Acceptor Levels of the Mercury Vacancies in HgCdTe 2871
measurements presented in Fig. 9b show the ioni-zation of the two acceptor levels (ME and LE peaks)above 110 K. The HE peak is at a lower energythan the theoretical bandgap because of the locali-zation of the carriers in the Urbach tails.
To conclude this second part, it seems that themercury vacancy level ionization energies are lit-tle influenced by the Cd composition between 32%and 60% Cd (cf. Fig. 10). The ionization energy ofthe V0 state that we measured for Cd compositionof 32% (�27 meV) is close to the one measuredby Kenworthy et al.6 for a similar composition[�22 meV deduced from formula (8) of Ref. 6]. ForCd composition of 45%, our PL measurements tendto show that the ionization energies of the acceptorlevels increase (�38 meV for the V0 state). For 60%Cd composition, the ionization energies decrease.This is possibly due to a diminution of the Jahn–Teller effect for higher cadmium compositions. Onthe other hand, as Cooper and Harrison17 sug-gested, it can also be assumed that the decrease of
the dielectric constant with increasing Cd contentmay result in a larger Coulombic repulsion.
CONCLUSIONS
The double acceptor levels of mercury vacanciesin HgCdTe were measured by PL characterization.Two ionization energies were measured by PLbetween 10 meV and 18 meV for the V� state andfrom 27 meV to 38 meV for the V0 state for Cdcomposition ranging from 32% to 60%. Tempera-ture-dependent Hall measurements showed onlyone activation energy corresponding to the V0 stateionization energy for samples with 32% and 32.7%Cd. The correlation between PL measurements andHall measurements was the key to understandingthe energy ordering of the Hg vacancy states in thebandgap. Indeed, the fact that only one activationenergy is measured by temperature-dependent Hallmeasurements shows that the V� state is stabilizedcompared with the V0 state, which corresponds to
180 200 220 240 260 280 300
Energy (meV)
(a)
(b)
P annealed 330°C
0 50 100 150 200 250 300
240
260
280
300
320
340 P annealed HE peak P annealed ME peak P annealed LE peak Theoretical bandgap (32% Cd)
PL
pea
k po
siti
on (
meV
)
Temperature (K)
Fig. 7. (a) p-Type annealed sample A spectrum for excitation density of 20 W/cm2. (b) Temperature dependence of the PL peak energies of thep-type annealed sample A.
360 380 400 420 440 460 480 500 520 540 560
Log
. Int
ensi
ty (
arb.
uni
ts)
Energy (meV)
(a) (b)
P annealed 330°C
0 50 100 150 200 250 300440
460
480
500
PL
pea
k po
siti
on (
meV
)
Temperature (K)
P annealed HE peak P annealed ME peak P annealed LE peak Theoretical bandgap (44% Cd)
Fig. 8. (a) p-Type annealed sample B PL spectrum at 8 K. (b) Temperature dependence of the PL peaks of the p-type annealed sample B.
Gemain, Robin, Brochen, De Vita, Gravrand, and Lusson2872
the negative-U property of the Hg vacancy. The twoacceptor states were hence clearly identified. Theextended study of samples with different Cd com-positions shows a small evolution of the doubleacceptor ionization energies with Cd composition forcompositions between 32% and 60%. This could bedue to a diminution of the Jahn–Teller effect forhigher cadmium compositions and an increase of theCoulombic repulsion because of a diminution of thedielectric constant.17 Electrical measurements areunderway to study the Hg vacancy ordering forsamples richer in Cd. We are also planning to
measure samples with smaller Cd compositions tocorrelate with the measurements of Kenworthyet al.6
REFERENCES
1. O. Gravrand, P. Ballet, J. Baylet, and N. Baier, J. Electron.Mater. 38, 1684 (2009).
2. I.C. Robin, M. Taupin, R. Derone, A. Solignac, P. Ballet, andA. Lusson, Appl. Phys. Lett. 95, 202104 (2009).
3. H.R. Vydyanath and C.H. Hiner, J. Appl. Phys. 65, 3080(1989).
4. H.R. Vydyanath, J. Cryst. Growth 161, 64 (1996).5. E. Finkman and Y. Nemirovsky, J. Appl. Phys. 59, 1205
(1986).6. I. Kenworthy, P. Capper, C.L. Jones, J.J.G. Gosney, and
W.G. Coates, Semicond. Sci. Technol. 5, 854 (1990).7. A.T. Hunter and T.C. McGill, J. Appl. Phys. 52, 5779 (1981).8. F. Yue, J. Chu, J. Wu, Z. Hu, Y. Li, and P. Yang, Appl. Phys.
Lett. 92, 121916 (2008).9. N. Dai, Y. Chang, X.G. Wang, B. Li, and J.H. Chu, Curr.
Appl. Phys. 2, 365 (2002).10. I.C. Robin, M. Taupin, R. Derone, P. Ballet, and A. Lusson,
J. Electron. Mater. 39, 868 (2010).11. A. Lusson, F. Fuchs, and Y. Marfaing, J. Cryst. Growth 101,
673 (1990).12. V.I. Ivanov-Omskii, N.L. Bazhenov, and K.D. Mynbaev,
Phys. Status Solidi B 246, 1858 (2009).13. D.C. Look, Semicond. Sci. Technol. 20, S55 (2005).14. D.C. Look, H.L. Mosbacker, Y.M. Strzhemechny, and L.J.
Brillson, Superlattices Microstruct. 38, 406 (2005).15. P. Blood and J.W. Orton, Rep. Prog. Phys. 41, 157 (1978).16. G.D. Watkins, Adv. Solid State Phys. XXXIV, 163 (1984).17. D.E. Cooper and W.A. Harrison, J. Vac. Sci. Technol. A 8,
1112 (1990).18. R.E. DeWames, private communication.19. M.A. Kinch, Fundamentals of Infrared Detector Materials
(Bellingham, WA: SPIE Press, 2007), chap. 4, p. 39.20. A. Rogalski, Rep. Prog. Phys. 68, 2267 (2005).
660 680 700 720 740
Log
inte
nsit
y (a
rb. u
nits
)
Energy (meV)
(a) (b)
P annealed 330°C
0 50 100 150 200 250 300680
700
720
740
PL
pea
k po
siti
on (
meV
)
Temperature (K)
P annealed HE peak P annealed ME peak P annealed LE peak Theoretical bandgap (58% Cd)
Fig. 9. (a) p-Type annealed sample C PL spectrum at 8 K. (b) Temperature dependence of the PL peaks of the p-type annealed sample C.
30 40 50 605
10
15
20
25
30
35
40
45
Ioni
zati
on e
nerg
ies
(meV
)
Cd composition (%)
LE peak ionization energy ME peak ionization energy
Fig. 10. Evolution of the ionization energies of the ME and LE peakswith Cd composition.
Optical and Electrical Studies of the Double Acceptor Levels of the Mercury Vacancies in HgCdTe 2873
Copyright © 2022 FDOKUMEN