Antimicrobial Evaluation of Sequentially extracted Leaf of ...
Marine Chemistry 162 (2014) 96–113
Contents lists available at ScienceDirect
Marine Chemistry
j ourna l homepage: www.e lsev ie r .com/ locate /marchem
Optical and chemical characterization of base-extracted particulateorganic matter in coastal marine environments
Adeline Brym a, Hans W. Paerl b, Michael T. Montgomery c, Lauren T. Handsel a,Kai Ziervogel d, Christopher L. Osburn a,⁎a Department of Marine Earth and Atmospheric Sciences, North Carolina State University, 2800 Faucette Drive, Raleigh, NC 27607, United Statesb Institute of Marine Sciences, University of North Carolina at Chapel Hill, 3431 Arendell St, Morehead City, NC 28557, United Statesc Chemistry Division, US Naval Research Laboratory, 4555 Overlook Avenue SW, Washington, District of Columbia 20375, United Statesd Department of Marine Sciences, University of North Carolina at Chapel Hill, 123 South Road, Chapel Hill, NC 27599, United States
⁎ Corresponding author. Tel.: +1 919 600 1386.E-mail address: [email protected] (C.L. Osburn).
http://dx.doi.org/10.1016/j.marchem.2014.03.0060304-4203/© 2014 Elsevier B.V. All rights reserved.
a b s t r a c t
a r t i c l e i n f oArticle history:Received 7 October 2013Received in revised form 1 February 2014Accepted 20 March 2014Available online 28 March 2014
Keywords:POMAbsorptionFluorescencePARAFACCarbon stable isotopes
Absorbance and fluorescence measurements were measured on base-extracted particulate organic matter(BEPOM) to examine POM biogeochemistry in coastal marine environments. BEPOM trends from August2011–September 2012 in the Neuse River Estuary (NRE) were compared against single sampling events inCharleston Harbor (CHS) and the inner Louisiana–Texas Shelf of the Gulf of Mexico (GOM) in July 2011 andJuly 2012, respectively. Spectral slope values, S275–295, and the ratio of spectral slopes, SR values, were mainlyinfluenced by distinct structure in the UV-B region of BEPOM absorption spectra, which was similar to priorlaboratory work on autochthonous, planktonic sources of chromophoric dissolved organic matter (CDOM). APARAFAC model with five components was fit to BEPOM excitation–emission matrix (EEM) fluorescence data.Excitation and emission spectra of the five components were similar to those found for dissolved organic matter(DOM) in other coastal environments, with two components attributed to planktonic sources and two compo-nents attributed to terrestrial (humic) sources. A fifth component was attributed tomicrobial humic substances.Principle components analysis of PARAFAC results separated autochthonous, planktonic components fromallochthonous, terrestrial components and explained N70% of the variance in the data. Surface water stablecarbon isotope (δ13C) values of BEPOM from the NRE and CHS ranged from−29 to−23‰, with most enrichedvalues occurring synchronouswith high Chl-a concentrations, and indicating that enriched δ13C values in BEPOMreflected a planktonic source. Notably, δ13C-BEPOM values for the GOM shelf below 50 m water depth weredepleted (b−30‰), and a mixing model indicated that 30–40% of the POM could originate from methaniccarbon. BEPOM absorption and fluorescence results suggested a planktonic POM as a source of CDOM in coastalmarine environments.
© 2014 Elsevier B.V. All rights reserved.
1. Introduction
The chemical composition of organic matter (OM) in coastalenvironments is complex, being comprised of allochthonous andautochthonous sources. Allochthonous compounds are delivered tocoastal environments (e.g., through estuaries) from their catchments,whereas autochthonous sources are formed within coastal environ-ments (predominantly from primary and secondary production).Allochthonous OM is dominated by humic substances, which are poorlycharacterized aggregates of individual compounds, high in molecularweight and generally existing as polymeric units (Sleighter andHatcher, 2007). In contrast, autochthonous compounds generally arenon-humic in that they tend to retain their chemical identity within a
mixture. OM transformations may occur within coastal environments,which may alter its chemical identity. Important processes are photo-chemical bleaching, bacterial degradation, and autochthonous productionby phytoplankton and microbes (Rochelle-Newall and Fisher, 2002;Romera-Castillo et al., 2011).
Optical properties of organic matter (OM) play an important role inunderstanding OM sources and chemistry (Del Vecchio and Blough,2004). In coastal environments (estuaries to the inner shelf of the coast-al ocean), the optical properties of dissolved organic matter (DOM) thatabsorb light and the corresponding fraction that fluoresces light, whichare known as CDOM and FDOM, respectively, have been extensivelystudied (Coble, 2007). While rapid and informational, absorption andfluorescence historically have only been applied to dissolved organics.
Particulate organic matter (POM) often is operationally defined asorganic matter greater than 0.7 μm and represents a pool of potentialchromophoric and fluorophoric organic material in coastal environ-ments. While POM absorption has been measured (e.g., Vernet and
97A. Brym et al. / Marine Chemistry 162 (2014) 96–113
Whitehead, 1996), limited success has been achieved by measuringorganic matter fluorescence in the solid phase (Chen et al., 2000). Arecent method involving base extraction of particulate organic matter(BEPOM) has raised the opportunity of conducting fluorescencespectroscopy on these extracts and comparing BEPOM to CDOM(Osburn et al., 2012). The method has its origins in studies of alkalineextracts of soils and sediments (e.g., Santín et al., 2009). As this isa new technique, BEPOM fluorescence patterns are unknown incoastal environments, let alone the open ocean where autochthonousprocesses apparently contribute to oceanic CDOM (Nelson and Siegel,2013). It is hypothesized that BEPOM fluorescence and absorbancehave similar properties to CDOM in coastal systems.
Use of multivariate statistical tools, such as parallel factor analysis(PARAFAC) to statistically decompose individual fluorescing excitationand emission matrices (EEMs) of samples and model prevalent fluores-cence spectra, has dominated recent literature (Stedmon et al., 2003;Kowalczuk et al., 2009; Fellman et al., 2011). This technique is aninexpensive and efficient means of providing insights into organicmatter sources and cycling. FDOM studies have ranged from usingmesocosms to understand the influence of microbes and phytoplank-ton, tracing various allochthonous sources in coastal waters, to model-ing its global distribution (Steinberg et al., 2004; Osburn and Stedmon,2011; Jørgensen et al., 2011). In addition, several works have usedprinciple components analysis (PCA) to model relatedness of samplesmodeled by PARAFAC and relatedness of model components to otherecosystem properties such as salinity and dissolved organic carbon(DOC) concentration (Santín et al., 2009; Chen et al., 2010; Cawleyet al., 2013).
In this study, BEPOM absorbing and fluorescing properties werecompared for three coastal environments. The main focus of this studywas the Neuse River Estuary (NRE) in eastern North Carolina. NREwas compared to Charleston Harbor (CHS) in South Carolina and theinner Louisiana–Texas Shelf, east of the Mississippi River plume, in thenorthern Gulf of Mexico (GOM). PARAFAC was used to model andvalidate six components. These results were examined against absorp-tion spectral slope and chemical measurements of base-extractedparticulate organic carbon (BEPOC) concentrations and correspondingstable carbon isotope values (δ13C-BEPOM). Using BEPOM optical andchemical measurements to evaluate POM quality in coastal ecosystemsimproved our understanding of organic matter cycling and potentialplanktonic sources of CDOM.
2. Methods
2.1. Study sites
Location information, basic water quality measurements, and keyabsorption and fluorescence results for all stations in this study arepresented in Table 1. Station locations of each coastal environment areshown in Fig. 1. Surface samples (n=168)were collected on amonthlybasis from August 2011 to September 2012 from the Neuse RiverEstuary (NRE) and Trent River (TR), a tributary located near theestuary's headwaters, in Eastern North Carolina (Table 1). NRE is ashallow, river and wind-dominated micro-tidal estuary that dischargesinto Pamlico Sound, the second largest estuarine complex in the UnitedStates. Neuse River watershed covers an area of approximately16,000 km2, flowing through wetlands, forests, and heavy agriculture.Over the past 4 decades, the NRE has suffered declining water qualityand habitat conditions due to nutrient over-enrichment. The system isalso strongly impacted by a recent rise in tropical cyclones andmore ex-treme wet–drought cycles (Paerl et al., 1998, 2006; Burkholder et al.,2006).
Samples from thirteen stations were collected over the 70 kmtransect along the estuary's main axis as part of the Neuse River EstuaryModeling and Monitoring Program (ModMon). Station names increasefrom NR000 to NR180 with increasing salinity downstream. Samples
were collected twice each month during August 2011, September2011, and March 2012. NRE samples were collected in clean polyethyl-ene bottles and shipped on ice to the laboratory at North Carolina StateUniversity. Estuarine particles were collected onto a 0.7 μm GF/F filterand stored frozen until further analysis.
Charleston Harbor estuary (CHS) is a harbor shelf environmentdominated by marine processes, yet having three small riverine inputs(Table 1). CHS lies in the extensive southeastern coastal plain of theUnited States and its catchment is dominated by substantial Spartinamarshes and tidal creeks (Wiegert and Freeman, 1990). Depth profileswere taken from seven stations in summer 2011. Sample sites includedthree rivers, Ashley, Cooper, andWando, inside the harbor, and approx-imately 11 km off shore in the South Atlantic Bight (SAB).
The inner continental shelf of the northern Gulf of Mexico (GOM),the third site for this study, is strongly influenced by Mississippi Riveroutflow, primarily through Southwest Pass (Table 1). Globally, theMississippi River has the third largest drainage basin area in the worldand sixth largest freshwater discharge accounting for around 60% oftotal suspended matter transported from the continental United States(Milliman, 1991; Presley et al., 1980). Sampling sites were locatedsouth and west of the main discharge through Southwest Pass, andwere influenced both by the Mississippi River plume and by marineprocesses. Sta. 3 was located near a sunken oil rig. The GOM samplingoccurred in summer 2012 and also included depth profiles.
Samples collected from CHS and GOM each occurred during onetime sampling events and were compared to the synoptic study of theNRE. CHS and GOM samples were filtered on site and frozen GF/F filtersfor particulate and chlorophyll a (CHS only) analysis were transportedto North Carolina State University. In CHS, samples of the benthicbottom boundary layer (nepheloid) were pumped into collectionvessels through an intake funnel affixed to a metal frame ca. 15 cmabove the sediment (Pohlman et al., 2002). Silicone tubing and a Teflonpneumatic pump were used in this apparatus.
2.2. Base extraction of POM (BEPOM)
Base-soluble POM was extracted from each GF/F filter into 0.1 Nsodium hydroxide (NaOH) for 24 h at 4 °C. The basic solution wasneutralized with concentrated hydrochloric acid (HCl) and filtered(0.2 μm PES filter) to remove filter particles prior to absorbance andfluorescencemeasurement on Varian Cary 300 and Eclipse instruments,respectively. Details of the BEPOM extraction procedures are in Osburnet al. (2012).
BEPOM absorbance spectra were measured from 220 to 800 nm.Samples with raw absorbance greater than 0.4 at 240 nmwere diluted.All samples were blank-corrected against a neutralized NaOH control.Absorbance measurements were converted into Napierian absorptioncoefficients (m−1):
a λð Þ ¼ a λ0ð ÞeS λ0−λð Þ ð1Þ
where a is the absorption coefficient at reference wavelength, λ0, and Sis the slope of the exponential fit to data over a given range (Bricaudet al., 1981). Absorption coefficients were back-corrected for anydilution. Two spectral slopes were calculated on linear fits to naturallog-transformed BEPOM absorption data for this study over rangesbetween 275 and 295 nm (S275–295) and between 350 and 400 nm(S350–400). Slope ratios (SR) of S275–295 to S350–400 were also calculated(Helms et al., 2008).
Fluorescence of BEPOM samples was measured at excitationwavelengths 220–500 nm at 5 nm intervals, with 5 nm excitationslits. Emission was measured between 240 and 600 nm at 2 nm inter-vals with 5 nm emission slits. Fluorometer voltage measurementsranged from 800 to 950 nm (depending on sample response) at ascan rate of 4800 nmmin−1. Integration timewas 0.025 s. Fluorescencemeasurements were corrected for inner-filter effects, calibrated against
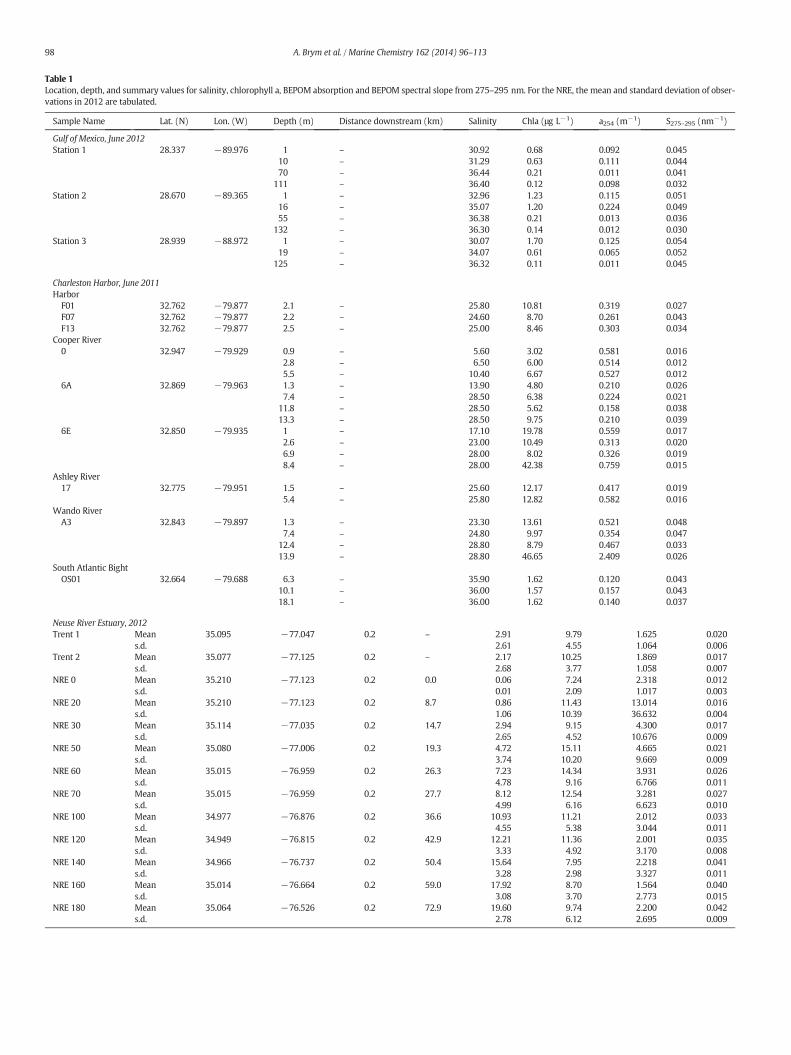
Table 1Location, depth, and summary values for salinity, chlorophyll a, BEPOM absorption and BEPOM spectral slope from 275–295 nm. For the NRE, the mean and standard deviation of obser-vations in 2012 are tabulated.
Sample Name Lat. (N) Lon. (W) Depth (m) Distance downstream (km) Salinity Chla (μg L−1) a254 (m−1) S275–295 (nm−1)
Gulf of Mexico, June 2012Station 1 28.337 −89.976 1 – 30.92 0.68 0.092 0.045
10 – 31.29 0.63 0.111 0.04470 – 36.44 0.21 0.011 0.041
111 – 36.40 0.12 0.098 0.032Station 2 28.670 −89.365 1 – 32.96 1.23 0.115 0.051
16 – 35.07 1.20 0.224 0.04955 – 36.38 0.21 0.013 0.036
132 – 36.30 0.14 0.012 0.030Station 3 28.939 −88.972 1 – 30.07 1.70 0.125 0.054
19 – 34.07 0.61 0.065 0.052125 – 36.32 0.11 0.011 0.045
Charleston Harbor, June 2011HarborF01 32.762 −79.877 2.1 – 25.80 10.81 0.319 0.027F07 32.762 −79.877 2.2 – 24.60 8.70 0.261 0.043F13 32.762 −79.877 2.5 – 25.00 8.46 0.303 0.034
Cooper River0 32.947 −79.929 0.9 – 5.60 3.02 0.581 0.016
2.8 – 6.50 6.00 0.514 0.0125.5 – 10.40 6.67 0.527 0.012
6A 32.869 −79.963 1.3 – 13.90 4.80 0.210 0.0267.4 – 28.50 6.38 0.224 0.021
11.8 – 28.50 5.62 0.158 0.03813.3 – 28.50 9.75 0.210 0.039
6E 32.850 −79.935 1 – 17.10 19.78 0.559 0.0172.6 – 23.00 10.49 0.313 0.0206.9 – 28.00 8.02 0.326 0.0198.4 – 28.00 42.38 0.759 0.015
Ashley River17 32.775 −79.951 1.5 – 25.60 12.17 0.417 0.019
5.4 – 25.80 12.82 0.582 0.016Wando RiverA3 32.843 −79.897 1.3 – 23.30 13.61 0.521 0.048
7.4 – 24.80 9.97 0.354 0.04712.4 – 28.80 8.79 0.467 0.03313.9 – 28.80 46.65 2.409 0.026
South Atlantic BightOS01 32.664 −79.688 6.3 – 35.90 1.62 0.120 0.043
10.1 – 36.00 1.57 0.157 0.04318.1 – 36.00 1.62 0.140 0.037
Neuse River Estuary, 2012Trent 1 Mean 35.095 −77.047 0.2 – 2.91 9.79 1.625 0.020
s.d. 2.61 4.55 1.064 0.006Trent 2 Mean 35.077 −77.125 0.2 – 2.17 10.25 1.869 0.017
s.d. 2.68 3.77 1.058 0.007NRE 0 Mean 35.210 −77.123 0.2 0.0 0.06 7.24 2.318 0.012
s.d. 0.01 2.09 1.017 0.003NRE 20 Mean 35.210 −77.123 0.2 8.7 0.86 11.43 13.014 0.016
s.d. 1.06 10.39 36.632 0.004NRE 30 Mean 35.114 −77.035 0.2 14.7 2.94 9.15 4.300 0.017
s.d. 2.65 4.52 10.676 0.009NRE 50 Mean 35.080 −77.006 0.2 19.3 4.72 15.11 4.665 0.021
s.d. 3.74 10.20 9.669 0.009NRE 60 Mean 35.015 −76.959 0.2 26.3 7.23 14.34 3.931 0.026
s.d. 4.78 9.16 6.766 0.011NRE 70 Mean 35.015 −76.959 0.2 27.7 8.12 12.54 3.281 0.027
s.d. 4.99 6.16 6.623 0.010NRE 100 Mean 34.977 −76.876 0.2 36.6 10.93 11.21 2.012 0.033
s.d. 4.55 5.38 3.044 0.011NRE 120 Mean 34.949 −76.815 0.2 42.9 12.21 11.36 2.001 0.035
s.d. 3.33 4.92 3.170 0.008NRE 140 Mean 34.966 −76.737 0.2 50.4 15.64 7.95 2.218 0.041
s.d. 3.28 2.98 3.327 0.011NRE 160 Mean 35.014 −76.664 0.2 59.0 17.92 8.70 1.564 0.040
s.d. 3.08 3.70 2.773 0.015NRE 180 Mean 35.064 −76.526 0.2 72.9 19.60 9.74 2.200 0.042
s.d. 2.78 6.12 2.695 0.009
98 A. Brym et al. / Marine Chemistry 162 (2014) 96–113

Fig. 1. Locations of the three coastal environments studied. (A) Neuse River Estuary (NRE), North Carolina; (B) Charleston Harbor (CHS), South Carolina; (C) northern Gulf of Mexico(GOM). The sampling stations for each site are indicated.
99A. Brym et al. / Marine Chemistry 162 (2014) 96–113
the instrument's water Raman signal, and standardized to quininesulfate units (ppb QSU) (Lawaetz and Stedmon, 2009). Fluorescenceresults are presented as excitation–emission matrices (EEMs) andvisualized as contour plots.
Sample volumes varied greatly among different sites and differentestuaries and coastal waters. To account for this variability, additionalcorrections were made on absorption coefficients and fluorescenceintensities (as QSU). These corrections accounted for the volume ofsample filtered, any dilutions made to maintain optical thinness of theBEPOM solution, and the absorbance cell pathlength (1-, 5-, or 10-cm).
2.3. Absorption spectra corrections
Additional corrections were applied to remove structure present inthe UV region in BEPOM absorption spectra. These corrections wereapplied to test the effect of absorption peaks on calculation of derivedparameters such as spectral slopes and SR. BEPOM absorption valuesbetween 280 and 301 nm were removed, and a non-linear function
was applied to interpolate the excised data. S275–295, S350–400, and SRof the natural log of the corrected absorption values were thenrecomputed and compared to the original values and previously-published CDOM values.
2.4. BEPOC concentration and stable C isotopes
Base extracted particulate organic carbon (BEPOC) and correspond-ing stable isotope ratios, δ13C-BEPOM,were obtained on anOI Analytical1030D TOC analyzer coupled in continuous flow to a Thermo Delta VPlus, Isotope Ratio Mass Spectrometer (IRMS) (Osburn and St-Jean(2007). Prior to analyses, BEPOM was diluted with 10 mL MilliporeMilli-Q water and acidified to pH 2 with 85% phosphoric acid (H3PO4).BEPOC values were blank corrected againstMilli-Qwater and calibratedagainst solutions of potassium hydrogen phthalate (KHP) at DOCconcentrations of 1, 5, and 10 mg C L−1. Final BEPOC values accountedfor Milli-Q water dilutions and initial filtration volume.

100 A. Brym et al. / Marine Chemistry 162 (2014) 96–113
Stable C isotope (δ13C) valueswere calculated from 13C:12C ratios fora sample (sample) expressed relative to an in-house standard CO2
reference gas (std):
δ13C ¼13C=12Csample13C=12Cstd
−1
" #� 1000: ð2Þ
All in-house δ13C values were normalized to Vienna Pee DeeBelemnite standards in per mil (‰) notation using internationalstandards of IAEA-CH-6 sucrose (δ13C = −10.45‰) and IAEA-600caffeine (δ13C = −27.77‰). Reproducibility on these standardsprovided a precision of 0.2‰ on this analysis. We also analyzed HansellDeep Sea Reference DOC with a DOC concentration of 45 ± 5 μM and aδ13C value of −20 ± 0.6‰ (vs VPDB). Dissolved inorganic carbonisotope values (δ13C-DIC) were measured on discrete samples of theNRE collected in June 2013 using the 1030TOC-IRMS system and theisotope values calibrated and normalized as described above.
2.5. Chlorophyll a concentrations
Chlorophyll a was measured on samples from CHS following EPAMethod, 446.0, which uses the trichromatic equation (Arar, 1997).Filters were ground and extracted in a 90:10 acetone:water solutionin the dark for 2–24 h at 4 °C before absorbance was measured. Allsamples were blank corrected against the acetone:water solution. NREin situ chlorophyll concentrations were obtained from a flat Li-Corsensor (UWQ-PAR6067) coupled with a YSI 650 MDS Multi-parameterDisplay System datalogger. GOM in-situ chlorophyll concentrationswere from a Wet Labs ECO Chlorophyll Fluorometer. All chlorophyll avalues were reported in micrograms per liter.
2.6. Statistical modeling
Parallel factor analysis (PARAFAC) modeling was completed in theMATLAB computing environment (Mathworks, Inc., Natick, MA) withthe DOMFluor toolbox (Stedmon and Bro, 2008). Model calculationsare based onminimizing the sumof square residualswith an alternatingleast squares algorithm (Bro, 1997; Stedmon et al., 2003). Maximumfluorescence intensities of each component (FMax) are reported inquinine sulfate units (1 QSU = 1 part per billion quinine sulfate in 0.1N H2SO4). The models were split-half validated by dividing the dataarray into two halves and testing separate PARAFAC models fit to eachhalf. Random initialization confirmed the best-fit model as that withthe lowest sum of squared error among 10 models. The PLS toolboxfor Matlab (Eigenvector, Inc.) was used for principal componentanalysis (PCA) of PARAFAC FMax results.
3. Results
3.1. BEPOM absorption spectra variability
BEPOM absorption spectra from the NRE showed variability withinthe estuary and with seasons (Fig. 2). The low salinity, riverine end-member (NR000) exhibited a shallow peak around 280 nm whilemid-salinity and high salinity stations exhibited absorption spectrawith noticeable structure: broad peaks between 280 and 320 nm and,much less frequently, around400nm. Seasonal variability in the absorp-tion spectra was observed. For example, BEPOM absorption intensitywas greatest at station NR000 and decreased with increasing salinityin September 2011 and March 2012 (Fig. 2A and C). In February 2012and September 2012, however BEPOM absorption was greatest at themid-estuary, station NR060 (Fig. 2B and D).
Overall, spectral peaks were also identified in the CHS and GOM, butthe intensities of BEPOM absorption spectra were lower than thosefrom the NRE. Freshwater influenced stations (e.g. CHS0 and CHS17),
exhibited shallow peaks in the ultraviolet (UV) region of the absorptionspectrum (data not shown). However, the intensity and width of aspectral peak were more pronounced in the more marine-influencedstations outside CharlestonHarbor, on the SAB shelf, and in the northernGOM.
On the SAB shelf, the absorption spectra exhibited minimal changeand distinct peaks were observed throughout the 18 meter watercolumn (Fig. 2E). The strongest absorption at this shelf site was at10 m. BEPOM absorption spectra from samples on the inner shelf ofthe GOM (Sta. 2) were similar to the inner shelf of the SAB (Fig. 2F).The maximum absorption was measured at 16 m below sea surfaceand prominent absorption peaks were clear in the 0 and 16m samples.These peaks were far less pronounced in the deeper samples of theinner shelf of the GOM collected at 55 m and 132 m, respectively.
3.2. Changes to BEPOM spectral slope values
In estuarine environments, spectral slope (S) values for CDOM canoften represent a distinction between freshwater (terrestrial) andmarine end-members, because as S values calculated over the rangesused here tend to increase with salinity (Helms et al., 2008). For theNRE, mixing is between the Neuse River and the Pamlico Sound. Morechange in BEPOM S275–295 values than in S350–400 values weremeasuredacross the salinity gradient for all NRE samples (Fig. 3A). In fact, S350–400values measured across the salinity gradient of the NRE were ratherconsistent between 0.01 and0.02nm−1 (Fig. 3A). Therefore,we focusedon S275–295 values for the rest of this study. S275–295 values increased inabsolute magnitude with increasing salinity, ranging from 0.010 to0.062 nm−1. CHS and GOM S275–295 values also fell within that range(Table 1). A positive linear relationship between S275–295 and salinityhas been observed for CDOM in the Delaware Bay Estuary and in theMississippi River plume, but at lower magnitudes (Helms et al., 2008;Fichot and Benner, 2012). Absolute BEPOM S350–400 values rangedfrom 0.00460 to 0.0208 nm−1 but did not exhibit a clear trend withsalinity.
Changes in SR values with salinity in the NREwere plotted for select-ed months that show contrasting trends in the behavior of thisparameter (Fig. 3B). A slight decrease in SR as a function of salinitywas observed in September 2011 and all SR values were b1. In contrast,February 2012, March 2012, and September 2012 all exhibited steepincreases in SR with values ranging from 1 to 4. The pattern in BEPOMSR values tended to follow the pattern in S275–295 values as opposed toS350–400 values. Thus, it appears the SR values calculated for BEPOM inthe NRE largely are controlled by the slope region of 275–295 nm.Similar behaviorwas observed for CDOMSR values calculated for coastalwaters (Helms et al., 2008).
3.3. Effect of BEPOM absorption peaks on NRE spectral slope values
It was clear that the presence of intermittent peaks in NRE BEPOMabsorption spectra near 280 nm influenced S275–295 values the most,and resulted in relatively large SR values (Fig. 3B). The peaks near280 nm were more prominent and more consistent amongst BEPOMabsorption spectra than the peaks near 400 nm. Therefore, we testedthe effect of removing the peaks near 280 nm on SR values. BEPOMabsorption spectra were re-processed (“peak-corrected”) to removethe broad peak from each spectrum, when it was present. Weperformed this analysis on the NRE, which had the richest data set.The first derivative of each NRE BEPOM absorption spectrum wascalculated and the results indicated that the peak generally occurredca. 285 nm. Next, a nonlinear interpolation was used to re-populateexcised values in each absorption spectrum, and then Eq. (1) was usedto re-model S275–295, S350–400, and SR values on the peak-correctedspectra. Finally, these post-corrected values were compared to pre-corrected values.

Fig. 2. Downstream changes in BEPOM absorption spectra for select stations in the NRE during: (A) September 2011, (B) February 2012, (C) March 2012, and (D) September 2012. NREspectra are from surface waters. Changes in BEPOM absorption spectra with depth for: (E) Station OS01 in the South Atlantic Bight and (F) Station 2 in the northern Gulf of Mexico.See Table 1 for station locations.
101A. Brym et al. / Marine Chemistry 162 (2014) 96–113
Correction of absorption spectra by removing the broad dominantpeak ca. 280 nm resulted in lower S275–295 values than without thecorrection (Fig. 3C). However, a positive linear relationship was foundbetween S275–295 from the original absorption spectra and S275–295from the spectra corrected for BEPOM absorption structure (Fig. 3D).Post-corrected values also clustered togethermore tightly in a generallylinear increase with salinity. Thus, S275–295 values calculated via eithermethod increased with increasing salinity; however, magnitude ofdifference between the two S275–295 values for a given sample increaseddown the estuary (Fig. 3C). This resulted in a linear correlation betweenpre- and post-corrected slope values but an offset of roughly 0.005 nm−1 (Fig. 3D).
3.4. BEPOM fluorescence features
Fluorescence emission spectra recorded at successive excitationwavelengths were concatenated into 151 × 43 matrices (termed“EEMs”) and presented as contour plots of fluorescent “landscapes”using interpolation between successive spectra (Fig. 4). BEPOM fluores-cence intensities ranged from about 0.01 QSU to nearly 3 QSU with no
clear trend toward greater fluorescence at either low or high salinities.At the freshwater riverine portion of the NRE, BEPOM fluorescenceexhibited a pattern very similar to that measured for CDOM in numer-ous studies of estuaries and coastal waters (Fig. 4A) (e.g., Fellmanet al., 2011). Peaks at 240/450 (excitation/emission) and at 320/425were distinct atop a shoulder of the main fluorescence signal. Littleseparation between peaks was observed in the river BEPOM EEM,which is characteristic of broad emission of humic substances (Senesi,1990). Peak locations correspond to those first identified in CDOM:peak A (240/450) and peak C (300–340/410–440) by Coble (1996). Insharp contrast, the BEPOM EEM measured at the saline mouth of NREwhere it enters Pamlico Sound (NR180) exhibited a distinct “threepeak” pattern that lacked shouldering features of riverine BEPOM EEM(Fig. 4B).
This pattern is apparently common to BEPOM in estuaries and coast-al waters. An EEM of surface water BEPOM from the shelf outsideCharleston Harbor in the South Atlantic Bight looked similar to theNR180, as did a nepheloid BEPOM EEM from the estuarine CooperRiver, which drains to Charleston Harbor (Figs. 4C and 4D). In addition,an EEM of surface water BEPOM from the Gulf of Mexico also exhibited
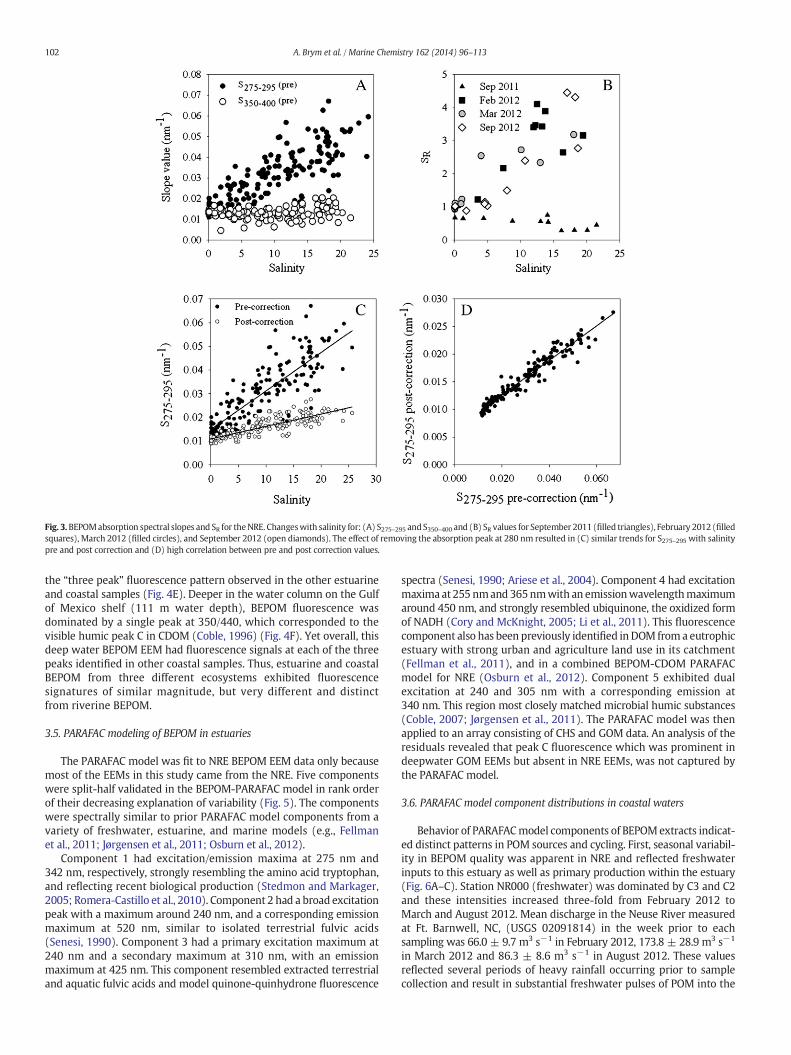
Fig. 3.BEPOMabsorption spectral slopes and SR for theNRE. Changeswith salinity for: (A) S275–295 and S350–400 and (B) SR values for September 2011 (filled triangles), February 2012 (filledsquares), March 2012 (filled circles), and September 2012 (open diamonds). The effect of removing the absorption peak at 280 nm resulted in (C) similar trends for S275–295 with salinitypre and post correction and (D) high correlation between pre and post correction values.
102 A. Brym et al. / Marine Chemistry 162 (2014) 96–113
the “three peak” fluorescence pattern observed in the other estuarineand coastal samples (Fig. 4E). Deeper in the water column on the Gulfof Mexico shelf (111 m water depth), BEPOM fluorescence wasdominated by a single peak at 350/440, which corresponded to thevisible humic peak C in CDOM (Coble, 1996) (Fig. 4F). Yet overall, thisdeep water BEPOM EEM had fluorescence signals at each of the threepeaks identified in other coastal samples. Thus, estuarine and coastalBEPOM from three different ecosystems exhibited fluorescencesignatures of similar magnitude, but very different and distinctfrom riverine BEPOM.
3.5. PARAFAC modeling of BEPOM in estuaries
The PARAFAC model was fit to NRE BEPOM EEM data only becausemost of the EEMs in this study came from the NRE. Five componentswere split-half validated in the BEPOM-PARAFAC model in rank orderof their decreasing explanation of variability (Fig. 5). The componentswere spectrally similar to prior PARAFAC model components from avariety of freshwater, estuarine, and marine models (e.g., Fellmanet al., 2011; Jørgensen et al., 2011; Osburn et al., 2012).
Component 1 had excitation/emission maxima at 275 nm and342 nm, respectively, strongly resembling the amino acid tryptophan,and reflecting recent biological production (Stedmon and Markager,2005; Romera-Castillo et al., 2010). Component 2 had a broad excitationpeak with a maximum around 240 nm, and a corresponding emissionmaximum at 520 nm, similar to isolated terrestrial fulvic acids(Senesi, 1990). Component 3 had a primary excitation maximum at240 nm and a secondary maximum at 310 nm, with an emissionmaximum at 425 nm. This component resembled extracted terrestrialand aquatic fulvic acids and model quinone-quinhydrone fluorescence
spectra (Senesi, 1990; Ariese et al., 2004). Component 4 had excitationmaxima at 255 nmand 365nmwith an emissionwavelengthmaximumaround 450 nm, and strongly resembled ubiquinone, the oxidized formof NADH (Cory and McKnight, 2005; Li et al., 2011). This fluorescencecomponent also has been previously identified in DOM from a eutrophicestuary with strong urban and agriculture land use in its catchment(Fellman et al., 2011), and in a combined BEPOM-CDOM PARAFACmodel for NRE (Osburn et al., 2012). Component 5 exhibited dualexcitation at 240 and 305 nm with a corresponding emission at340 nm. This region most closely matched microbial humic substances(Coble, 2007; Jørgensen et al., 2011). The PARAFAC model was thenapplied to an array consisting of CHS and GOM data. An analysis of theresiduals revealed that peak C fluorescence which was prominent indeepwater GOM EEMs but absent in NRE EEMs, was not captured bythe PARAFAC model.
3.6. PARAFAC model component distributions in coastal waters
Behavior of PARAFACmodel components of BEPOMextracts indicat-ed distinct patterns in POM sources and cycling. First, seasonal variabil-ity in BEPOM quality was apparent in NRE and reflected freshwaterinputs to this estuary as well as primary production within the estuary(Fig. 6A–C). Station NR000 (freshwater) was dominated by C3 and C2and these intensities increased three-fold from February 2012 toMarch and August 2012. Mean discharge in the Neuse River measuredat Ft. Barnwell, NC, (USGS 02091814) in the week prior to eachsampling was 66.0 ± 9.7 m3 s−1 in February 2012, 173.8 ± 28.9 m3 s−1
in March 2012 and 86.3 ± 8.6 m3 s−1 in August 2012. These valuesreflected several periods of heavy rainfall occurring prior to samplecollection and result in substantial freshwater pulses of POM into the

Fig. 4. Examples of BEPOM EEM fluorescence landscapes for: surface samples collected from (A) Sta. NR000 in the Neuse River Estuary, March 2012 (Salinity= 0.4); (B) Sta. NR180 in theNeuse River Estuary, March 2012 (Salinity= 18); (C) surfacewater in the South Atlantic Bight, offshore fromCharleston Harbor (Salinity= 35.90); (D) the bottomnepheloid layer in theCooper River tributary to Charleston Harbor (Salinity = 28.50); (E) 1 m water depth (Salinity = 32.96) and (F) 132 m water depth (Salinity = 36.30) on the inner shelf of the Gulf ofMexico.
103A. Brym et al. / Marine Chemistry 162 (2014) 96–113
estuary. In contrast, the component distribution mid-way down the NRE,at NR050, showed a shift toward dominance by C1 and, in August, C4. InFebruary and August 2012, these planktonic components also had higherfluorescence intensities than inMarch. In eachmonth, Sta. NR180, wheretheNREflows into Pamlico Sound, exhibited BEPOMcomponent distribu-tions dominated by C1 and C4, with some influence of C5. Peak chloro-phyll occurred consistently with the shift in component distributionsfrom C2 and C3 (terrestrial dominance) to C1 and C4 (planktondominance; Fig. 6A–6C). Note that the position of this maximum in theestuary occurred in a region between NR050 and NR100, which alsotypically is the region of the chlorophyll maximum in the NRE betweenspring and fall (Paerl et al., 2006). Thus, the component distributionresults from PARAFAC modeling demonstrated a distinct change inBEPOM quality from terrestrial sources to planktonic sources down thisestuary.
Analysis of PARAFAC component distributions from BEPOM fluores-cence modeled in Charleston Harbor, inner shelf of the South AtlanticBight (SAB), and northern GOM supported our findings in NRE(Fig. 7). Surface water BEPOM samples extending from the tidal Ashley(Station 17), Cooper (Stations 0, 6A, 6E), and Wando Rivers (StationA3), through Charleston Harbor (Station A1), and out to the shelf ofthe SAB (Station OS01) were strongly dominated by C1 and C4, likeestuarine station NR180 in NRE (Fig. 7A). C2 fluorescence was minimalin these samples. However, the rivers had decidedlymore of a terrestrialinfluence due to the high FMax values for C3, and to a lesser extent C2,than did the Harbor and Shelf samples.
A depth profile from the tidal portion of Cooper River (Sta. 6E)exhibited subtle changes in PARAFAC component distributions(Fig. 7B). However, the nepheloid sample has a very different compo-nent distribution from that of the upper water column. The nepheloidlayer was dominated by C3 fluorescence and had nearly double the C1
(protein) fluorescence as in the water column. The nepheloid layeralso was enriched in C4 (NADH) fluorescence. This would suggest thatthe nepheloid was enriched both in terrestrial and planktonic POM.
Depth profiles from two stations on the inner shelf of the northernGulf of Mexico, showed variability with respect to PARAFAC modelcomponent distributions (Fig. 7C–D). Surface waters down to 20 mwere enriched in protein fluorescence relative to other components.C4 (NADH) fluorescence was generally higher offshore (Sta. 1) than atSta. 2, west of the Mississippi River mouth (Fig. 7D). At Sta. 2, clearincreases in C4 and C5 fluorescence occurred with depth.
3.7. BEPOM δ13C values
Carbon concentrations (BEPOC) and stable isotope values (δ13C) forBEPOMvalues weremeasured on a subgroup of the NRE, CHS, and GOMdatasets (n = 105; Table 3). In NRE, BEPOC concentrations were alsocompared to POC concentrations (B. Peierls, personal communication)to compute BEPOM extraction efficiency. Extraction of organic carbonin BEPOM from total POM averaged around 38% (median 28%; N =92), though a few samples had efficiencies as low as 5% and as high as95%. Extraction efficiency was not influenced by station location orseasonality.
δ13C-BEPOM values varied seasonally in NRE and appear influencedby primary production (Table 3; Fig. 7). δ13C-BEPOM values rangedbetween −32‰ and −23‰ (mean −27‰). The Trent River, a maintributary to the oligohaline region of NRE, had δ13C-BEPOM values of−28 to−29‰ during each sampling (Table 3). The δ13C-BEPOMvaluesin February and August 2012 at 0 kmdownstreamwere similar. A slightdepletion in δ13C-BEPOM values occurred in the first 20 km of the estu-ary for the three sampling dates. Stable carbon isotope values becameenriched mid-estuary, generally after the peak in Chl-a concentrations.
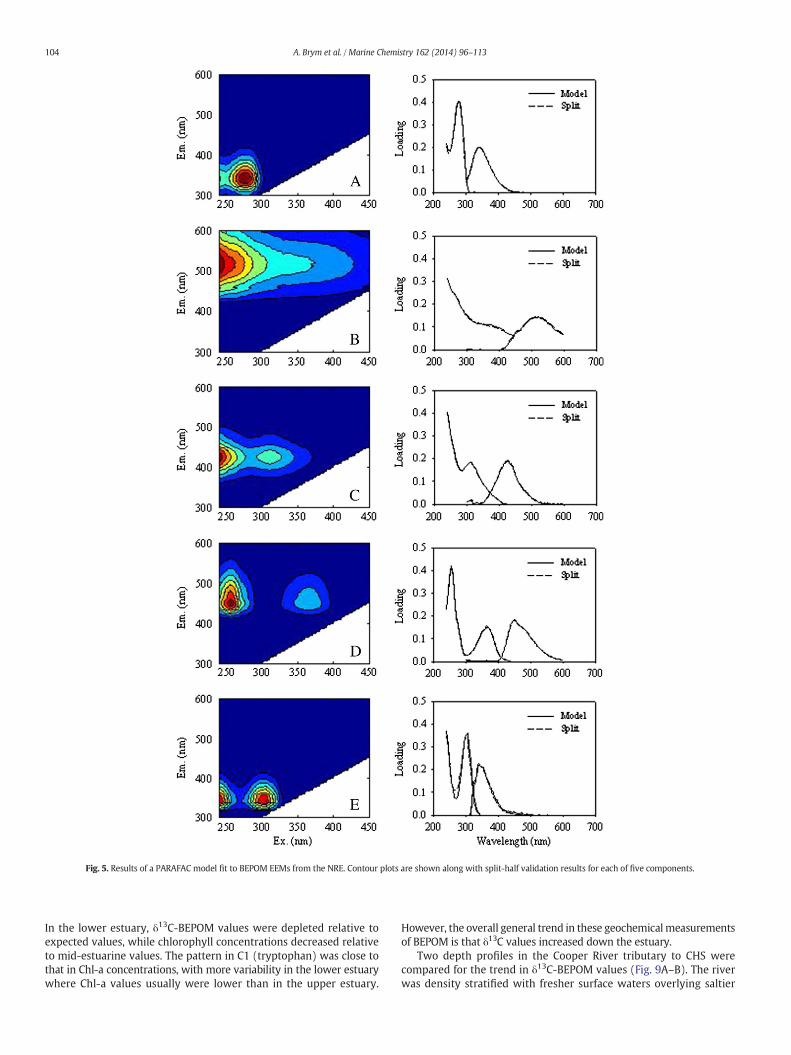
Fig. 5. Results of a PARAFAC model fit to BEPOM EEMs from the NRE. Contour plots are shown along with split-half validation results for each of five components.
104 A. Brym et al. / Marine Chemistry 162 (2014) 96–113
In the lower estuary, δ13C-BEPOM values were depleted relative toexpected values, while chlorophyll concentrations decreased relativeto mid-estuarine values. The pattern in C1 (tryptophan) was close tothat in Chl-a concentrations, with more variability in the lower estuarywhere Chl-a values usually were lower than in the upper estuary.
However, the overall general trend in these geochemicalmeasurementsof BEPOM is that δ13C values increased down the estuary.
Two depth profiles in the Cooper River tributary to CHS werecompared for the trend in δ13C-BEPOM values (Fig. 9A–B). The riverwas density stratified with fresher surface waters overlying saltier

Fig. 6. Component distributions (C1–C5) and Chl-a concentrations for (A) February, (B) March, and (C) August 2012 in the NRE.
105A. Brym et al. / Marine Chemistry 162 (2014) 96–113
marine waters, reflected in the surface water δ13C-BEPOM values of−25.54 and −25.91‰. At Sta. 6A, the mid-depth sample (ca. 8 m)showed an isotopically depleted value of −28.39‰, but generally theδ13C-BEPOM values increase to −24.0 to −23.5‰, shifting to moreenriched, plankton-like values as salinity increased, even into thenepheloid layer (Fig. 9A). Two other surface water observations fromCHS reflected depleted freshwater δ13C values and enriched marineδ13C values, as a function of salinity (Tables 1 and 3). FMax C1 valueswere slightly larger at middle and bottom depths at Sta. 6A, but thendecreased into the nepheloid layer (Fig. 9A). At Sta. 6E, C1 fluorescencedecreased from surface to mid-depth, but then showed a pronouncedincrease at the bottom depth, prior to decreasing in the nepheloidlayer (Fig. 9B).
Similar to the results from Charleston Harbor estuary, the moremarine-dominated GOM samples also showed evidence of marineprimary production contributing to BEPOM in surface waters (Fig. 9C–D). However a notable distinction was that δ13C-BEPOM values weredepleted at bottom depths relative to surface and mid depth waters.The trend appeared consistent between the three stations sampledalong the northern GOM shelf (Table 3).
4. Discussion
4.1. Patterns in BEPOM absorption
A typical absorption spectrum of coastal water CDOM exponentiallydecays with increasing wavelength which is generally attributed tocharge transfer in humic substances derived from partially-oxidizedpolyphenolic moieties, such as in lignin (Del Vecchio and Blough, 2004;Coble, 2007). Planktonic sources of CDOM also are known but far less isknown about the chemical structures that give rise to their optical prop-erties. In general, BEPOM from NRE had the most terrestrial influence ofthe sampleswe examined, perhaps because it was extracted fromupper,oligohaline reaches of this estuary. In contrast, the BEPOM absorptionspectra fromSABandnorthernGOMhad sharper decreaseswith increas-ingwavelength. These lower salinity BEPOMsamples (e.g., NR000) in theNRE gradually decayed into the blue wavelengths, as is common for ter-restrial humic substances. BEPOM absorption was also nearly ten-foldhigher in NRE than in SAB coastal waters or northern GOM.
Formost BEPOMabsorption spectrameasured in this study, patternswere observed in the form of broad peaks, centered near 280 nm

Fig. 7. Component distributions (C1–C5) and Chl-a concentrations for (A) the tributaries, open bay, and shelf waters of Charleston Harbor and the SAB; (B) depths in thewater column ofthe tidal estuarine portion of the Cooper River at Station 6E; (C) depths at Station 1 and (D) Station 3 on the inner shelf of the northern GOM.
106 A. Brym et al. / Marine Chemistry 162 (2014) 96–113
(Fig. 2). The nature of these peaks is unknown, but is very likely due tosubstituted aromatic compounds, including aromatic amino acids suchas tryptophan. Mayer et al. (2009) found absorption peaks ca. 280 nmin dissolved and particulate fractions of algal detritus, in addition to anunfiltered suspension. Tryptophan and tyrosine fluorescence dominat-ed the dissolved fraction of the algal detritus they studied. These resultssuggest that tryptophan and tyrosine were important components ofthe BEPOM absorption at 280 nm and protein-like fluorescence in thethree coastal environments we studied.
Steeply decreasing BEPOM absorption spectra in the more offshorewaters of SAB and northern GOM had more pronounced peaks at ca.280 nm than did NRE spectra, which argue for discrete compoundsand molecules with less conjugation than condensed humic substances(Del Vecchio and Blough, 2004). Moreover, BEPOM absorption spectragenerally bore remarkable resemblance to CDOM absorption spectrameasured on cultures of Trichodesmium spp., and of mesoplanktonranging from copepods to salps and worms (Steinberg et al., 2004;Urban-Rich et al., 2006; Ortega-Retuerta et al., 2009). In the Mayeret al. (2009) study, it was found that POM dissolved by sunlight intoDOM was itself photolabile. Therefore, structure variability in BEPOMabsorption spectra may be caused by mixing multiple planktonicsources and from lability of absorbing compounds.
Tryptophan exhibits peak absorption at 280 nm and possibly is thesource of the peak in BEPOM spectra near 280 nm (Lakowicz, 2009).Previous research on the extraction and measurement of mycrosporineamino acids absorbance spectra identified peaks around 320–390 nm(Whitehead and Vernet, 2000). These compounds could contribute tothe weak, secondary BEPOM absorption peaks from 350 to 400 nmobserved in some NRE samples (Fig. 2). Fooken and Liebezeit (2000)found absorption peak at 407 nm in lipidic extracts of humic like mate-rial from marine sediments, which they attributed to degradedpigments. Other potential candidates are aforementioned tryptophan,
as well as chlorinated carboxylic acids and ubiquinone, the latter wasa predominant feature of the BEPOM EEM fluorescence (Fig. 4; Repetaet al., 2004; Cory and McKnight, 2005). As indicated in Fig. 2, theintensity of the broad peaks in the BEPOM absorption spectra of mid-estuarine stations in the NRE was intermittent, but it did appear tobe a feature of locations likely most influenced by recent primaryproduction as indicated by relatively large Chl-a concentrations (Fig. 8).
4.2. Patterns in BEPOM spectral slopes
In CDOM, high absorption and low spectral slope values may reflecthigh molecular weight terrestrial humic substances (Coble, 2007).BEPOM absorption did not indicate that highmolecular weightmaterial(e.g., humic-like substances) was extracted from POM. Rather, structur-al features in shortwave UV and overall low absorption in longwave UVand blue wavelengths indicate discrete compounds such as tryptophanand NADH dominate the absorption spectra rather than humicsubstances, especially in estuarine and marine samples (Fig. 2). Inmany coastal environments, absorption tends to decrease, and S275–295values increase, along a salinity gradient, partly reflecting dilution ofhigh molecular weight compounds with low molecular weight com-pounds in seawater (Twardowski et al., 2004; Helms et al., 2008;Fichot and Benner, 2012). BEPOM absorption does not behave in asimilar manner. In this study, absorption intensities were found tovary with location, seasonality, and depth (Fig. 2). No distinct trendemerged between these three factors and the corresponding BEPOMabsorption spectra, although S275–295 did increase with salinity.
The manner in which BEPOM S275–295 and SR values did increasealong an estuarine salinity gradient in this study was greater than thecorresponding values for CDOM in the Delaware estuary (Helms et al.,2008). The increase in CDOM SR values with salinity commonlyobserved in estuaries reflects either: 1) mixing between two end

Table 2Results of a PARAFAC model fit to samples in this study.
FMax (relative QSU)
Sample Name C1 C2 C3 C4 C5
Gulf of Mexico, June 2012Station 1 0.877 0.148 0.274 0.796 0.093
0.897 0.150 0.295 0.741 0.1780.041 0.027 0.462 0.299 0.0110.201 0.064 0.582 0.349 0.163
Station 2 0.985 0.151 0.225 0.817 0.0410.966 0.094 0.191 0.257 0.0490.621 0.136 0.396 0.397 0.1260.382 0.161 0.389 0.355 0.091
Station 3 1.004 0.066 0.222 0.229 0.0150.981 0.073 0.201 0.283 0.0610.373 0.109 0.232 0.382 0.218
Charleston Harbor, June 2011F01 0.725 0.104 0.239 0.786 0.045F07 0.477 0.074 0.209 0.780 0.029F13 0.596 0.101 0.237 0.734 0.0400 0.597 0.276 0.513 0.591 0.078
0.351 0.372 0.685 0.450 0.1030.381 0.362 0.720 0.399 0.108
6A 0.470 0.148 0.344 0.658 0.0450.543 0.148 0.386 0.638 0.0420.477 0.134 0.404 0.662 0.0750.369 0.183 0.441 0.579 0.086
6E 0.670 0.139 0.289 0.834 0.0570.572 0.098 0.247 0.700 0.0310.792 0.100 0.287 0.713 0.0410.348 0.292 0.678 0.469 0.112
17 0.575 0.104 0.491 0.595 0.0620.684 0.141 0.544 0.574 0.054
A3 0.424 0.139 0.296 0.689 0.0820.559 0.166 0.370 0.740 0.0830.738 0.138 0.335 0.641 0.1320.412 0.340 0.678 0.457 0.128
OS01 0.589 0.105 0.118 0.861 0.0630.820 0.116 0.168 0.842 0.0890.416 0.095 0.104 0.923 0.067
Neuse River Estuary, 2012TR01 Mean 1.097 0.155 0.359 1.380 0.105
s.d. 1.146 0.166 0.409 1.922 0.150TR02 Mean 0.345 0.548 0.738 0.167 0.052
s.d. 0.347 0.390 0.430 0.072 0.050NRE 0 Mean 0.185 0.785 1.180 0.205 0.088
s.d. 0.089 0.505 0.647 0.068 0.127NRE 20 Mean 0.313 0.789 1.215 0.241 0.114
s.d. 0.229 0.459 0.581 0.068 0.131NRE 30 Mean 0.403 0.912 1.531 0.509 0.105
s.d. 0.568 1.683 2.629 0.578 0.142NRE 50 Mean 0.946 0.934 1.555 0.689 0.220
s.d. 1.004 1.670 2.582 0.679 0.492NRE 60 Mean 1.461 0.748 1.414 1.074 0.191
s.d. 2.373 1.170 2.142 1.298 0.275NRE 70 Mean 0.891 0.681 1.259 0.986 0.151
s.d. 0.695 1.281 2.269 0.879 0.181NRE 100 Mean 0.972 0.333 0.711 1.056 0.109
s.d. 0.900 0.511 1.107 0.915 0.130NRE 120 Mean 1.460 0.251 0.571 1.145 0.163
s.d. 2.670 0.328 0.753 1.045 0.229NRE 140 Mean 1.334 0.224 0.519 1.581 0.153
s.d. 1.932 0.298 0.711 1.956 0.308NRE 160 Mean 1.631 0.107 0.256 1.193 0.223
s.d. 3.884 0.126 0.274 1.824 0.493NRE 180 Mean 1.097 0.155 0.359 1.380 0.105
s.d. 1.146 0.166 0.409 1.922 0.150
107A. Brym et al. / Marine Chemistry 162 (2014) 96–113
members having different SR values; or 2) a loss of high molecularweight terrestrial humic-like compounds as they are converted intolow molecular weight compounds via photochemical or microbialdegradation (Helms et al., 2008). BEPOM suggests a third possibility:presence of material that strongly absorbs UV-B and results in a verysteep slope for S275–295. Larger SR values for BEPOM implies a greater
abundance of low molecular weight compounds in the particulatefraction that is extractable into base as opposed to the dissolvedphase. This would appear to be in conflict with published geochemicalstudies identifying a greater amount of high molecular weightcompounds in POM than in DOM (Golchin et al., 1994; Volkman andTanoue, 2002). However, the BEPOM extraction process may degradelargemolecularweight OM to lowermolecularweightOM. The increasein values of S275–295 and SR that we observed in these estuaries isprimarily caused by broad peak absorption at 260± 20 nm. Peak signalstrength causes an increase in absorption that, when log-linearized,produces a distinctly steeper slope from 275 to 295 nm. Removing thebroad UV-B peak produced generally lower SR values in a range closerto that previously reported for CDOM (Fig. 2; e.g., Helms et al., 2008).
CDOM SR values can be expressed as a degradation index for terres-trial OM. Unless there is an input of fresh terrestrial OM from tributarieswithin an estuarine system, SR values increase conservatively withsalinity (Helms et al., 2008). We hypothesize that BEPOM SR values donot behave like CDOM SR values because the base extracted fraction ofPOM is dominated by small molecular weight, discrete chromophoressuch as tryptophan, rather than humic substances. This could meanthat POM is a source for “fresh” planktonic CDOM, or, as mentionedpreviously, that the base-extraction partially degrades high molecularweight DOM.
4.3. Interpretation of PARAFAC model components of BEPOM
BEPOM fluorescence results supported the absorption data andstrongly suggested the influence of recent phytoplankton productionof POM of these coastal environments. EEMs of BEPOM at freshwaterstations exhibited fluorescence patterns typical of terrestrial CDOM,yet the distinct “three peak” pattern that dominated most estuarineand coastal BEPOM EEMs appeared to represent both tryptophan andNADH fluorescence, and it was associated with individual EEMs down-stream and offshore (Fig. 3). This three peak-pattern was consistentlyidentified in sampleswith strong peaks in the corresponding absorptionspectra and as prominent components in the BEPOM PARAFAC model.The PARAFAC model provided a more robust understanding of BEPOMsources, demonstrating a shift in potential POM precursors to CDOMfrom terrestrial (soil-derived) to planktonic organic matter. C4 hasbeen identified in numerous recent studies of DOM fluorescence inwastewater, streams and estuaries impacted by agriculture and urbani-zation (e.g., Fellman et al., 2011; Graeber et al., 2012; Tedetti et al.,2012). However, in this study, it is unlikely that C4 is entirely due toanthropogenic influences. Rather, we hypothesize that Components 1and 4 (Trp and NADH/ubiquinone, respectively) are the fluorescentfeatures in the three-peak pattern.
Phytoplankton growth in culture and during blooms typically gener-ates DOM dominated by protein-like fluorescence (i.e., C1 fluorescence),which later apparently generates microbial humic-like fluorescence(i.e., C5 fluorescence) (Romera-Castillo et al., 2010, 2011). These signalswere clearly defined in EEMs measured from the more marine-dominatedwaters at NR180 in NRE, CHS, and GOM. The C1fluorescenceappeared to reflect primary production in CHS and GOM because Chl-aconcentrations typically were higher in surface waters and decreasedwith depth (Table 1).
Chari et al. (2013) have also found similar results in “bacteria-free”algal cultures and they have modeled three components with PARAFAC,two of which are designated “terrestrial.” However, we propose a differ-ent interpretation of such autochthonous, planktonic fluorescence signals.We hypothesize that our Component 4 (spectrally similar to Component3 in Chari et al., 2013) is perhaps a precursor to microbial humicsubstances (peak M), a signal which we modeled as Component 5 ofour PARAFAC model. This interpretation of our Component 4 is basedon the similarity of our Component 4 to the Cory and McKnight (2005)PARAFAC model of ubiquinone and the fluorescence of the hydroqui-none/quinone model system studied by Ariese et al. (2004), but also on

Table 3Summary of BEPOC concentrations and BEPOMstable carbon isotope values for theGOM, CHS, andNRE. For theNRE,mean extraction efficiency of organic carbon is shown as a percentageof total organic carbon. δ13C-DIC valuesweremeasured on surfacewater samples from the NRE in June 2013. δ13C-BEPOMpp is a predicted value based only carbon fixation by C3 aquaticprimary producers (see text). ‘n.d.’ means “not determined.”.
Station Depth (m) BEPOC (μg/L) δ13C-BEPOM (‰) VPDB Mean extraction efficiency (%) δ13C-DIC (‰) VPDB δ13C-BEPOMpp (‰) VPDB
Gulf of Mexico, June 2012Station 1 1 81.7 −28.59 n.d. n.d.
10 80.1 −21.65 n.d. n.d.70 22.0 −33.33 n.d. n.d.
111 14.4 −34.11 n.d. n.d.Station 2 1 90.4 −32.71 n.d. n.d.
16 55.2 −24.60 n.d. n.d.55 50.5 −35.68 n.d. n.d.
132 70.1 −31.31 n.d. n.d.Station 3 1 106.1 −31.30 n.d. n.d.
19 68.1 −33.20 n.d. n.d.125 15.4 −37.98 n.d. n.d.
Charleston Harbor, June 2011F01 2.1 132.2 −23.24 n.d. n.d.0 0.9 149.2 −26.67 n.d. n.d.6E 1 322.8 −25.91 n.d. n.d.
2.6 145.2 −25.69 n.d. n.d.6.9 136.3 −24.05 n.d. n.d.8.4 132.0 −24.39 n.d. n.d.
6A 1.3 89.8 −23.58 n.d. n.d.7.4 111.2 −28.39 n.d. n.d.
11.8 132.4 −24.74 n.d. n.d.13.3 92.4 −25.54 n.d. n.d.
Neuse River Estuary, 2012TR01 Mean 0.2 433.0 −28.22 n.d. n.d.
s.d. 337.7 0.97TR02 Mean 0.2 302.8 −28.76 n.d. n.d.
s.d. 122.5 1.23NR000 Mean 0.2 481.4 −27.30 44.0 −13.44 −33.44
s.d. 590.4 2.39NR020 Mean 0.2 642.7 −28.07 34.7 −13.89 −33.89
s.d. 651.0 2.75NR030 Mean 0.2 315.5 −29.40 36.6 −12.66 −32.66
s.d. 114.4 1.63NR050 Mean 0.2 533.3 −30.55 43.5 −10.13 −30.13
s.d. 385.1 2.58NR060 Mean 0.2 741.8 −27.14 28.3 −6.73 −26.73
s.d. 676.7 0.99NR070 Mean 0.2 448.7 −27.83 22.4 −6.47 −26.47
s.d. 261.3 2.07NR100 Mean 0.2 712.4 −26.95 34.3 −4.74 −24.74
s.d. 736.0 2.41NR120 Mean 0.2 695.9 −28.00 35.7 −4.08 −24.08
s.d. 483.1 2.23NR140 Mean 0.2 629.2 −26.51 40.7 −3.62 −23.62
s.d. 564.0 2.07NR160 Mean 0.2 340.0 −27.54 24.9 −3.16 −23.16
s.d. 186.2 3.34NR180 Mean 0.2 806.2 −28.31 23.1 −2.11 −22.11
s.d. 1056.1 1.67
108 A. Brym et al. / Marine Chemistry 162 (2014) 96–113
the fluorescence properties of NADH studied in microbial bioreactors(Li et al., 2011, 2011). Quinones are important to the donor–acceptorpair needed to form an intramolecular charge transfer complex(Del Vecchio and Blough, 2004; Sharpless, 2012). In other words, wespeculate that BEPOM fluorescence may be a proxy for in situ metabolicactivity of the microbial loop that leads to the formation of peak Mfluorescence in CDOM via components that we measure in BEPOM.
It was clear that C1 (tryptophan) fluorescence served as a discretemarker for recent primary production in POM. Distribution ofPARAFAC components in NRE showed this most clearly when Chl-awas evaluated with C1 (Fig. 6A–C). Of the three months examined,February and August 2012 had high levels of Chl-a that coincidedwith high levels of C1 and C4 fluorescence, and the ratios of thesetwo components were significantly correlated to Chl-a (r2 = 0.38;
p b 0.001; N = 22). In February 2012, phytoplankton blooms wereobserved at NR050 and NR070 in the NRE (B. Peierls, personal commu-nication). March 2012 was the best example of the transition fromterrestrial to planktonic POM in NRE.
4.4. PCA analysis of BEPOM optical data
PCA was carried out to investigate the relationships of BEPOMPARAFAC components and to support observations made with compo-nent distributions (Fig. 10). The PCA model included FMax values foreach component from all three systems and explained nearly 75% ofthe variability between the first two principle components. For NRE,Trent River (TR) sample scores were coded separately from the mainstem of the estuary (Fig. 10A). Loadings plot from the PCA model
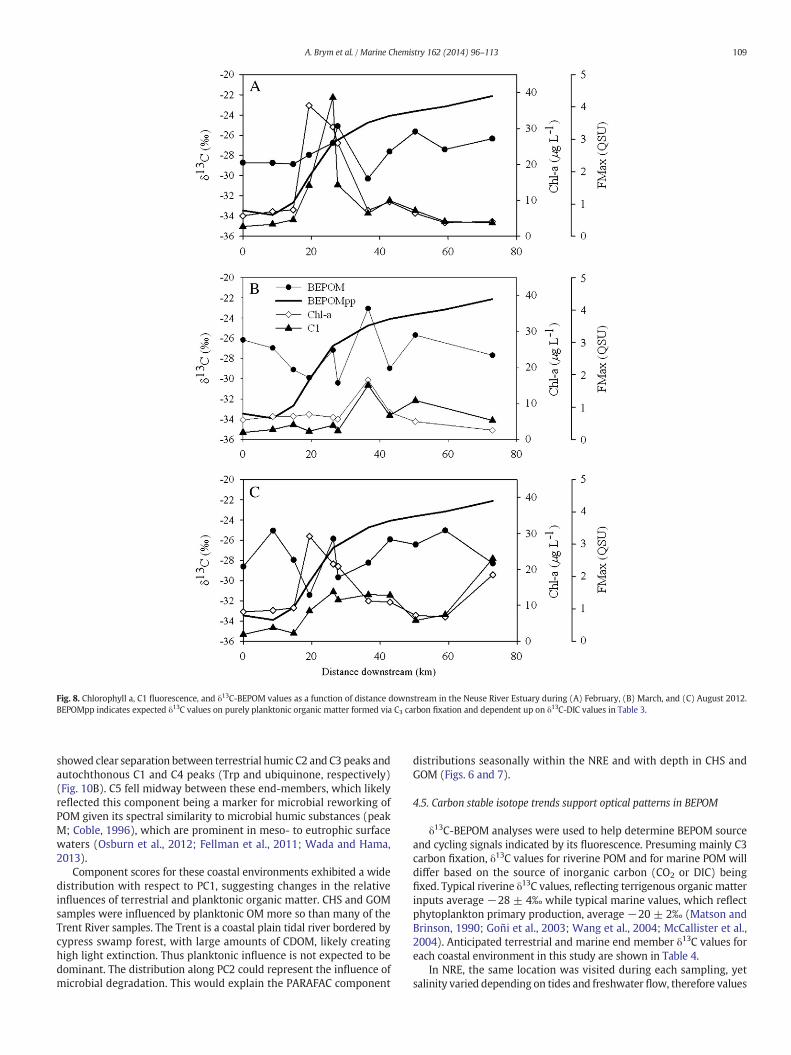
Fig. 8. Chlorophyll a, C1 fluorescence, and δ13C-BEPOM values as a function of distance downstream in the Neuse River Estuary during (A) February, (B) March, and (C) August 2012.BEPOMpp indicates expected δ13C values on purely planktonic organic matter formed via C3 carbon fixation and dependent up on δ13C-DIC values in Table 3.
109A. Brym et al. / Marine Chemistry 162 (2014) 96–113
showed clear separation between terrestrial humic C2 and C3 peaks andautochthonous C1 and C4 peaks (Trp and ubiquinone, respectively)(Fig. 10B). C5 fell midway between these end-members, which likelyreflected this component being a marker for microbial reworking ofPOM given its spectral similarity to microbial humic substances (peakM; Coble, 1996), which are prominent in meso- to eutrophic surfacewaters (Osburn et al., 2012; Fellman et al., 2011; Wada and Hama,2013).
Component scores for these coastal environments exhibited a widedistribution with respect to PC1, suggesting changes in the relativeinfluences of terrestrial and planktonic organic matter. CHS and GOMsamples were influenced by planktonic OM more so than many of theTrent River samples. The Trent is a coastal plain tidal river bordered bycypress swamp forest, with large amounts of CDOM, likely creatinghigh light extinction. Thus planktonic influence is not expected to bedominant. The distribution along PC2 could represent the influence ofmicrobial degradation. This would explain the PARAFAC component
distributions seasonally within the NRE and with depth in CHS andGOM (Figs. 6 and 7).
4.5. Carbon stable isotope trends support optical patterns in BEPOM
δ13C-BEPOM analyses were used to help determine BEPOM sourceand cycling signals indicated by its fluorescence. Presuming mainly C3carbon fixation, δ13C values for riverine POM and for marine POM willdiffer based on the source of inorganic carbon (CO2 or DIC) beingfixed. Typical riverine δ13C values, reflecting terrigenous organic matterinputs average −28 ± 4‰ while typical marine values, which reflectphytoplankton primary production, average −20 ± 2‰ (Matson andBrinson, 1990; Goñi et al., 2003; Wang et al., 2004; McCallister et al.,2004). Anticipated terrestrial and marine end member δ13C values foreach coastal environment in this study are shown in Table 4.
In NRE, the same location was visited during each sampling, yetsalinity varied depending on tides and freshwater flow, therefore values
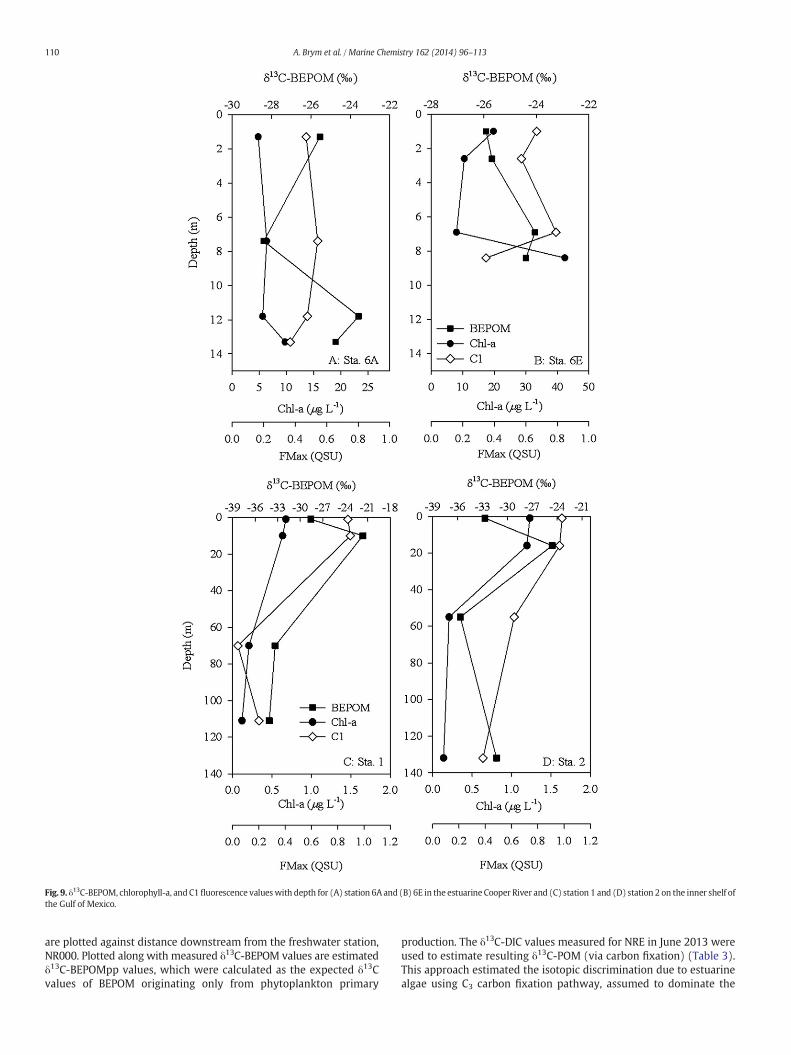
Fig. 9. δ13C-BEPOM, chlorophyll-a, and C1fluorescence valueswith depth for (A) station 6A and (B) 6E in the estuarine Cooper River and (C) station 1 and (D) station 2 on the inner shelf ofthe Gulf of Mexico.
110 A. Brym et al. / Marine Chemistry 162 (2014) 96–113
are plotted against distance downstream from the freshwater station,NR000. Plotted along with measured δ13C-BEPOM values are estimatedδ13C-BEPOMpp values, which were calculated as the expected δ13Cvalues of BEPOM originating only from phytoplankton primary
production. The δ13C-DIC values measured for NRE in June 2013 wereused to estimate resulting δ13C-POM (via carbon fixation) (Table 3).This approach estimated the isotopic discrimination due to estuarinealgae using C3 carbon fixation pathway, assumed to dominate the

Fig. 10. PCA of EEM-PARAFAC data from the estuarine and coastal environments in thisstudy (N= 217). (A) Sample scores plot coded by environment studied: CHS— CharlestonHarbor; GOM — Gulf of Mexico; SAB = South Atlantic Bight; NRE = Neuse River Estuary;TR = Trent River (a tributary to the NRE). (B) Loadings plot for PARAFAC components;PC1 accounted for 43.62% of the variance in the data while PC 2 accounted for 31.99% ofthe variance in the data.
111A. Brym et al. / Marine Chemistry 162 (2014) 96–113
primary producers in NRE (Laws et al., 1995). No other assumptionsabout phytoplankton taxa or growth kinetics were made. In addition,no isotopic fractionation between POM and BEPOM (see below) was
Table 4Anticipated terrigenous and marine (planktonic) end-member δ13C-POM values (‰ vs.VPDB) for the three coastal environments studied in this work. *Values are for WinyahBay, SC, ca. 95 km NE of Charleston Harbor.
End-member
Location Terrigenous Marine Source
Gulf of Mexico −27 to−25‰ −22 to−19‰ Wang et al., 2004Charleston Harbor −30 to−25‰ −22 to−18‰ Goñi et al., 2003*Neuse River Estuary −26‰ −23‰ Matson and
Brinson, 1990
assumed. Thus, the predicted δ13C-BEPOMpp values ranged from −32to −22‰ downstream in the NRE, each value reflecting photosynthet-ically fixed POM using a −20‰ offset of the corresponding δ13C-DICvalue from Table 3. This meant that the δ13C-BEPOMpp curve is thesame in each panel of Fig. 8, but also misses any seasonal variability inNRE δ13C-DIC values.
δ13C-BEPOM values reflecting recent fixation of isotopically-depleted DIC during in situ primary production could overlap withterrestrial organic matter. δ13C-DIC values in the upper NRE were rela-tively depleted (−13‰) and were consistent with prior measurements(Table 2; Matson and Brinson, 1990). The calculated δ13C-BEPOMppvalues in the NRE ranged from −33 to −22‰ and increased down-stream with salinity. However, the measured BEPOM values in theupper NRE at the freshwater reach were consistently enriched relativeto predicted values (−26 to−29‰, Fig. 8). Maximum Chl-a concentra-tions were generally 20–30 km downstream from the freshwater reachof NRE at NR000. These results suggest that the freshwater portion wasmostly influenced by allochthonous, terrestrial OM, which supports thePARAFAC modeling results (Fig. 6).
In the lower NRE (NR140 to NR180), the mean δ13C-BEPOM valueswere depleted by about 3–5‰ relative to the δ13C-BEPOMpp values,which are estimated as BEPOM solely derived from phytoplankton(Table 3). This result could simply reflect seasonal variability in POMquality in the NRE. In the Delaware Bay estuary, δ13C-POM valueswere seasonally variable with more depleted values (−24 to −29‰)reflecting uptake of isotopically-depleted DIC (Bianchi and Bauer,2011). Our results from the Neuse River Estuary and Charleston Harbormight also suggest that the BEPOM extraction technique preferentiallyextracts 13C-depleted compounds such as lipids (Close et al., 2014).Further work is warranted to establish fractionation factors betweenBEPOM and POM.
C1 FMax values were synchronous with Chl-a concentrations in theNRE (Fig. 8). It was also in this region of the estuary where measuredand expected δ13C-BEPOM values most closely matched. Moreover,this region was also where the PARAFAC component distributionsbegan to shift from the allochthonous, terrestrial features to autochtho-nous, planktonic features. Thus, stable C isotope measurements ofBEPOM confirm the planktonic influences indicated by the opticalmeasurements.
Results from the tidal Cooper River were very similar to those forNRE. Depleted δ13C values in surface water BEPOM indicated terrestrialsources, and enrichment in more saline bottomwaters indicated plank-tonic sources. Chl-a and C1 FMax values mostly were synchronous withthe δ13C-BEPOM trends. A slight depletion in δ13C-BEPOM of thenepheloid suggested incorporation of both riverine and estuarine POMinto the bottom boundary layer of the Cooper River (Fig. 9A–B). Thisbottom water mass is a key conduit for transport of POM across coastalwaters (Mitra et al., 2000).
GOM δ13C-BEPOM showed a remarkable trend with bottom waterbeing highly depleted relative to surface water. Chl-a concentrationand C1 fluorescence decreased with depth at Sta. 1 and Sta. 2 in GOM.One reasonmay be because bulk marine POM δ13C values at depth rep-resent aweighted average shift toward isotopically depleted δ13C valuesof POM composition, possibly lipidic material, which could be preferen-tially preserved inmarine particles in discrete size fractions (Close et al.,2014). Alternatively, selective preservation of terrigenous materialcould partly explain these depleted δ13C values. However, most watercolumn POM at the sites we sampled in the GOM had salinities greaterthan 30, which argues against large terrigenous influences. In fact, priorwork in the region indicates that most POM is phytoplankton-derived,even near the Mississippi River plume, at salinities ca. 30. Mean watercolumn POM δ13C values of−22.7±2.6‰weremeasured in the north-ern Gulf of Mexico near our Stations 1 and 2, while δ13C-POM values inthe Mississippi plume region near our Station 3 averaged−21.5 ± 2‰(Kelley et al., 1998; Gordon and Goñi, 2004). In corresponding bacterialDNA samples, Kelley et al. (1998) alsomeasured δ13C valueswhichwere
112 A. Brym et al. / Marine Chemistry 162 (2014) 96–113
depleted relative to POM values by ca. 2‰. This result lead the authorsto conclude the hydrocarbons in the GOMmay be contributing to bacte-rial carbon isotope values.
Kelley et al.'s work suggests that hydrocarbons such as methanecould be influencing microbial communities in northern GOM. It alsois possible that microbial communities assimilate methanic C, which isheavily depleted in 13C, and contributes to depleted δ13C-BEPOM valuesrelative to POM formed during primary production (Kelley et al., 1998;δ13C-CH4 ca. −60‰; Reddy et al., 2012). Recent work on POM in thenorthern GOM revealed δ13C values as depleted as what we measuredfor BEPOM as well as depleted Δ14C values indicating a fossil methanesource (Cherrier et al., 2014). A simple mass balance can estimate themethanic C required to produce the δ13C-BEPOM values of −31 to−38‰ we measured in the GOM below 40 m water depth. Using−21‰ as a value for marine source of BEPOM at these locationsand −60‰ as a methane source of BEPOM, we estimate that 30–40% of the BEPOM in GOM waters below 40 m could be derivedultimately from methanic C and reflect perhaps its processing throughthe microbial loop. Cherrier et al. (2014) also used a mixing model toestimate between 28 and 43% of the suspended POM in the northernGOM could be derived from fossil methane. Their results support thedepleted δ13C-BEPOM values we have measured in the GOM. Ultimate-ly, the GOM results raise interesting questions about a variety of poten-tial POM sources to oceanic CDOM.
5. Conclusions
BEPOM absorbance and fluorescence provided a tracer approach tostudy POM biogeochemical cycling in coastal marine environments,similar to CDOM (Stedmon and Markager, 2003). However, some finalpoints are noted. First, SR values for BEPOM were informative, but theinfluence of peaks, presumably related to autochthonous production,added structure to absorption spectra, and resulted in SR values muchhigher than commonly observed for estuarine CDOM. Direct compari-son of BEPOM SR value to a corresponding CDOM SR value should bemade with caution. It is advised that S275–295 values be used ratherthan SR given the low absorption signal N350 nm. Second, similar torecent work on CDOM, a PARAFACmodel fit to the BEPOM fluorescencedata set from one coastal environment was applicable to two verydifferent coastal environments (Shank et al., 2011; Chen et al., 2010;Cawley et al., 2013). This result extends the utility of PARAFAC tomake comparisons in POM and DOM fluorescence across estuaries andcoastal waters. Third, the agreement between patterns of BEPOM fluo-rescence and carbon stable isotopes suggests BEPOM provides informa-tion on OM quality on actionable time scales, which could make this animportant technique for connecting DOM and POM cycling in thesedynamic ecosystems. Finally, further research into the compounds caus-ing the absorption peak in BEPOM iswarranted because of the similaritybetween BEPOMabsorption spectra shown in this study and absorptionproduced by mesoplankton in culture (Steinberg et al., 2004). Thiscould provide a unique tracer for a POM precursor to autochthonous(i.e., planktonic) CDOM.
Acknowledgments
We thank two anonymous reviewers for their thoughtful commentswhich improved this manuscript. This work was supported by NCDENR319Grant 4443 (C.L.O., H.W.P.), a Strategic Environmental Research andDevelopment Program Environmental Restoration grant (M.T.M.,C.L.O.), the Lower Neuse Basin Association (Neuse River Modeling andMonitoring Project, ModMon), (H.W.P.), the North Carolina StateUniversity Faculty Research and Professional Development program(C.L.O.), the National Science Foundation (OCE 0825466, CBET 0932632)(H.W.P.) and the Gulf of Mexico Research Initiative's “Ecosystem Impactsof Oil and Gas Input to the Gulf” (ECOGIG) program (K.Z.; ECOGIG contri-bution #274; data fall under GRIIDC accession number R1.x132.134:006).
John Helms is thanked for the helpful suggestions on data analysis. KaylaChristianson, Molly Mikan, and Luke Sachsenmaier are acknowledged fortheir assistance in the laboratory.
References
Arar, E., 1997. Method 446. In Vitro Determination of Chlorophylls a, b, c1 + c2 andPheopigments in Marine and Freshwater Algae by Visible Spectrophotometry. EPA,Ohio, USA.
Ariese, F., van Assema, S., Gooijer, C., Bruccoleri, A., Langford, C.H., 2004. Comparison ofLaurentian fulvic acid luminescence with that of the hydroquinone/quinone modelsystem: evidence from low temperature fluorescence studies and EPR spectroscopy.Aquat. Sci. 66 (1), 86–94.
Bianchi, T.S., Bauer, J.E., 2011. Particulate organic carbon cycling and transformation. In:Wolanski, E., McLusky, D.S. (Eds.), Treatise on Estuarine and Coastal Science, Vol 5.Academic Press, Waltham, pp. 69–117.
Bricaud, A., Morel, A., Prieur, L., 1981. Absorption by dissolved organic-matter of the sea(yellow substance) in the UV and visible domains. Limnol. Oceanogr. 26, 43–53.
Bro, R., 1997. PARAFAC. Tutorial and applications. Chemom. Intell. Lab. Syst. 38, 149–171.Burkholder, J.M., Dickey, D.A., Kinder, C.A., Reed, R.E., Mallin, M.A., McIver, M.R., Cahoon, L.
B., Melia, G., Brownie, C., Smith, J., et al., 2006. Comprehensive trend analysis ofnutrients and related variables in a large eutrophic estuary: a decadal study ofanthropogenic and climatic influences. Limnol. Oceanogr. 51, 463–487.
Cawley, K.M., Yamashita, Y., Maie, N., Jaffé, R., 2013. Using optical properties to quantifyfringe mangrove inputs to the dissolved organic matter (DOM) pool in a subtropicalestuary. Estuar. Coast. Shelf Sci. http://dx.doi.org/10.1007/s12237-013-9681-5.
Chari, N.V.H.K., Keerthi, S., Sarma, N.S., Pandi, S.R., Chiranjeevulu, G., Kiran, R., Koduru, U.,2013. Fluorescence and absorption characteristics of dissolved organic matter excret-ed by phytoplankton species of western Bay of Bengal under axenic laboratorycondition. J. Exp. Mar. Biol. Ecol. 445, 148–155.
Chen, R.F., Jiang, Y., Zhao, M., 2000. Solid phase fluorescence determination of chlorins inmarine sediments. Org. Geochem. 31, 1755–1763.
Chen, M., Price, R.M., Yamashita, Y., Jaffé, R., 2010. Comparative study of dissolved organicmatter from groundwater and surface water in the Florida coastal Everglades usingmulti-dimensional spectrofluorometry combined with multivariate statistics. Appl.Geochem. 25 (6), 872–880.
Cherrier, J., Sarkodee-Ardoo, J., Guilderson, T.P., Chanton, J.P., 2014. Fossil carbon in particulateorganic matter in the Gulf of Mexico following the Deepwater Horizon event. Environ.Sci. Technol. Lett. 2014 (1), 108–112.
Close, H.G., Wakeham, S.G., Pearson, A., 2014. Lipid and b sup N 13b/sup N C signatures ofsubmicron and suspended particulate organic matter in the Eastern Tropical NorthPacific: Implications for the contribution of Bacteria. Deep Sea Res. 85, 15–34.
Coble, P.G., 1996. Characterization of marine and terrestrial DOM in seawater usingexcitation–emission matrix spectroscopy. Mar. Chem. 51, 325–346.
Coble, P.G., 2007. Marine optical biogeochemistry: the chemistry of ocean color. Chem.Rev. 107, 402–418.
Cory, R.M., McKnight, D.M., 2005. Fluorescence spectroscopy reveals ubiquitous presenceof oxidized and reduced quinones in dissolved organic matter. Environ. Sci. Technol.39, 8142–8149.
Del Vecchio, R., Blough, N., 2002. Photobleaching of chromophoric dissolved organicmatter in natural waters: kinetics and modeling. Mar. Chem. 78, 231–253.
Del Vecchio, R., Blough, N.V., 2004. On the origin of the optical properties of humic sub-stances. Environ. Sci. Technol. 38 (14), 3885–3891.
Fellman, J.B., Petrone, K.C., Grierson, P.F., 2011. Source, biogeochemical cycling, andfluorescence characteristics of dissolved organic matter in an agro-urban estuary.Limnol. Oceanogr. 56, 243–256.
Fichot, C.G., Benner, R., 2012. The spectral slope coefficient of chromophoric dissolvedorganic matter (S275–295) as a tracer of terrigenous dissolved organic carbon inriver-influenced ocean margins. Limnol. Oceanogr. 57, 1453–1466.
Fooken, U., Liebezeit, G., 2000. Distinction of marine and terrestrial origin of humic acids inNorth Sea surface sediments by absorption spectroscopy. Mar. Geol. 164 (3), 173–181.
Golchin, A., Oades, J., Skjemstad, J., Clarke, P., 1994. Study of free and occluded particulateorganic-matter in soils by solid-state C-13 Cp/mas NMR-spectroscopy and scanningelectron-microscopy. Aust. J. Soil Res. 32, 285–309.
Goñi, M.A., Teixeira, M.J., Perkey, D.W., 2003. Sources and distribution of organic matter ina river-dominated estuary (Winyah Bay, SC, USA). Estuar. Coast. Shelf Sci. 57 (5),1023–1048.
Gordon, E.S., Goñi, M.A., 2004. Controls on the distribution and accumulation of terrigenousorganic matter in sediments from the Mississippi and Atchafalaya river margin. Mar.Chem. 92 (1), 331–352.
Graeber, D., Gelbrecht, J., Pusch, M.T., Anlanger, C., von Schiller, D., 2012. Agriculture haschanged the amount and composition of dissolved organic matter in CentralEuropean headwater streams. Sci. Total Environ. 438, 435–446.
Helms, J.R., Stubbins, A., Ritchie, J.D., Minor, E.C., Kieber, D.J., Mopper, K., 2008. Absorptionspectral slopes and slope ratios as indicators of molecular weight, source, andphotobleaching of chromophoric dissolved organic matter. Limnol. Oceanogr. 53,955–969.
Jørgensen, L., Stedmon, C.A., Kragh, T., Markager, S., Middelboe, M., Søndergaard, M., 2011.Global trends in the fluorescence characteristics and distribution of marine dissolvedorganic matter. Mar. Chem. 126, 139–148.
Kelley, C.A., Coffin, R.B., Cifuentes, L.A., 1998. Stable isotope evidence for alternativebacterial carbon sources in the Gulf of Mexico. Limnol. Oceanogr. 43 (8), 1962–1969.
Kowalczuk, P., Durako, M.J., Young, H., Kahn, A.E., Cooper, W.J., Gonsior, M., 2009. Charac-terization of dissolved organic matter fluorescence in the south atlantic bight withuse of PARAFAC model: interannual variability. Mar. Chem. 113, 182–196.
113A. Brym et al. / Marine Chemistry 162 (2014) 96–113
Lakowicz, J.R., 2009. Principles of Fluorescence Spectroscopy, 3rd edition. Springer.Lawaetz, A.J., Stedmon, C.A., 2009. Fluorescence intensity calibration using the raman
scatter peak of water. Appl. Spectrosc. 63, 936–940.Laws, E.A., Popp, B.N., Bidigare, R.R., Kennicutt, M.C., Macko, S.A., 1995. Dependence of
phytoplankton carbon isotopic composition on growth rate and [CO2]aq: theoreticalconsiderations and experimental results. Geochim. Cosmochim. Acta 59 (6),1131–1138.
Li, W., Sheng, G., Lu, R., Yu, H., Li, Y., Harada, H., 2011. Fluorescence spectral characteristicsof the supernatants from an anaerobic hydrogen-producing bioreactor. Appl.Microbiol. Biotechnol. 89, 217–224.
Matson, E., Brinson, M., 1990. Stable carbon isotopes and the C-N ratio in the estuaries ofthe pamlico and neuse rivers, North Carolina. Limnol. Oceanogr. 35, 1290–1300.
Mayer, L.M., Schick, L.L., Hardy, K.R., Estapa, M.L., 2009. Photodissolution and other photo-chemical changes upon irradiation of algal detritus. Limnol. Oceanogr. 54 (5), 1688.
McCallister, S.L., Bauer, J.E., Cherrier, J.E., Ducklow, H.W., 2004. Assessing sources andages of organic matter supporting river and estuarine bacterial production: amultiple-isotope (Δ14C, δ13C, and δ15N) approach. Limnol. Oceanogr. 49 (5), 1687.
Milliman, J., 1991. Flux and fate of fluvial sediment and water in coastal seas. In:Mantoura, R.F.C., Martin, J., Wollast, R. (Eds.), Ocean Margin Processes in GlobalChange. Academic, pp. 513–564.
Mitra, S., Bianchi, T.S., Guo, L., Santschi, P.H., 2000. Terrestrially derived dissolved organicmatter in the Chesapeake Bay and the Middle Atlantic Bight. Geochim. Cosmochim.Acta 64, 3547–3557.
Nelson, N.B., Siegel, D.A., 2013. The global distribution and dynamics of chromophoricdissolved organic matter. Annu. Rev. Mater. Sci. 5, 447–476.
Ortega-Retuerta, E., Frazer, T.K., Duarte, C.M., Ruiz-Halpern, S., Tovar-Sanchez, A., Arrieta,J.M., Reche, I., 2009. Biogeneration of chromophoric dissolved organic matter bybacteria and krill in the southern ocean. Limnol. Oceanogr. 54, 1941–1950.
Osburn, C.L., Stedmon, C.A., 2011. Linking the chemical and optical properties of dissolvedorganic matter in the Baltic–North Sea transition zone to differentiate threeallochthonous inputs. Mar. Chem. 126, 281–294.
Osburn, C.L., St-Jean, G., 2007. The use of wet chemical oxidation with high-amplificationisotope ratio mass spectrometry (WCO-IRMS) to measure stable isotope values ofdissolved organic carbon in seawater. Limnol. Oceanogr. Methods 5, 296–308.
Osburn, C.L., Handsel, L.T., Mikan, M.P., Paerl, H.W., Montgomery, M.T., 2012. Fluorescencetracking of dissolved and particulate organic matter quality in a river-dominatedestuary. Environ. Sci. Technol. 46, 8628–8636.
Paerl, H., Pinckney, J., Fear, J., Peierls, B., 1998. Ecosystem responses to internal andwatershed organic matter loading: consequences for hypoxia in the eutrophyingNeuse river estuary, north carolina, USA. Mar. Ecol. Prog. Ser. 166, 17–25.
Paerl, H.W., Valdes, L.M., Joyner, A.R., Peierls, B.L., Buzzelli, C.P., Piehler, M.F., Riggs, S.R.,Christian, R.R., Ramus, J.S., Clesceri, E.J., Eby, L.A., Crowder, L.W., Luettich, R.A., 2006.Ecological response to hurricane events in the Pamlico Sound System, NC andimplications for assessment and management in a regime of increased frequency.Estuar. Coasts 29, 1033–1045.
Pohlman, J., Coffin, R., Mitchell, C., Montgomery, M., Spargo, B., Steele, J., Boyd, T., 2002.Transport, deposition and biodegradation of particle bound polycyclic aromatichydrocarbons in a tidal basin of an industrial watershed. Environ. Monit. Assess. 75,155–167.
Presley, B., Trefry, J., Shokes, R., 1980. Heavy-metal inputs to Mississippi delta sediments— a historical view. Water Air Soil Pollut. 13, 481–494.
Reddy, C.M., Arey, J.S., Seewald, J.S., Sylva, S.P., Lemkau, K.L., Nelson, R.K., Carmichael, C.A.,McIntyre, C.P., Fenwick, J., Ventura, G.T., Van Mooy, B.A.S., Camilli, R., 2012. Composi-tion and fate of gas and oil released to the water column during the DeepwaterHorizon oil spill. Proc. Nat. Acad. Sci. 109, 20229–20234.
Repeta, D., Hartman, N., John, S., Jones, A., Goericke, R., 2004. Structure elucidation andcharacterization of polychlorinated biphenyl carboxylic acids as major constituentsof chromophoric dissolved organic matter in seawater. Environ. Sci. Technol. 38,5373–5378.
Rochelle-Newall, E.J., Fisher, T.R., 2002. Production of chromophoric dissolved organicmatter fluorescence in marine and estuarine environments: an investigation intothe role of phytoplankton. Mar. Chem. 77, 7–21.
Romera-Castillo, C., Sarmento, H., Anton Alvarez-Salgado, X., Gasol, J.M., Marrase, C., 2010.Production of chromophoric dissolved organic matter by marine phytoplankton.Limnol. Oceanogr. 55, 446–454.
Romera-Castillo, C., Sarmento, H., Anton Alvarez-Salgado, X., Gasol, J.M., Marrase, C., 2011.Net production and consumption of fluorescent colored dissolved organic matter bynatural bacterial assemblages growing on marine phytoplankton exudates. Appl.Environ. Microbiol. 77, 7490–7498.
Santín, C., Yamashita, Y., Otero, X.L., Alvarez, M.A., Jaffé, R., 2009. Characterizing humicsubstances from estuarine soils and sediments by excitation–emission matrixspectroscopy and parallel factor analysis. Biogeochemistry 96, 131–147.
Senesi, N., 1990. Molecular and quantitative aspects of the chemistry of fulvic acid and itsinteractions with metal ions and organic chemicals: part II. The fluorescencespectroscopy approach. Anal. Chim. Acta. 232, 77–106.
Shank, G.C., Evans, A., Yamashita, Y., Jaffé, R., 2011. Solar radiation-enhanced dissolutionof particulate organic matter from coastal marine sediments. Limnol. Oceanogr. 56,577–588.
Sharpless, C.M., 2012. Lifetimes of triplet dissolved natural organic matter (DOM) and theeffect of NaBH4 reduction on singlet oxygen quantum yields: implications for DOMphotophysics. Environ. Sci. Technol. 46 (8), 4466–4473.
Sleighter, R.L., Hatcher, P.G., 2007. The application of electrospray ionization coupled toultrahigh resolution mass spectrometry for the molecular characterization of naturalorganic matter. J. Mass Spectrom. 42, 559–574.
Stedmon, C.A., Bro, R., 2008. Characterizing dissolved organic matter fluorescence withparallel factor analysis: a tutorial. Limnol. Oceanogr. Methods 6, 572–579.
Stedmon, C.A., Markager, S.S., 2003. Behaviour of the optical properties of coloureddissolved organic matter under conservative mixing. Estuar. Coast. Shelf Sci. 57,973–979.
Stedmon, C.A., Markager, S.S., 2005. Tracing the production and degradation of autoch-thonous fractions of dissolved organic matter by fluorescence analysis. Limnol.Oceanogr. 50, 1415–1426.
Stedmon, C., Markager, S., Bro, R., 2003. Tracing dissolved organic matter in aquaticenvironments using a new approach to fluorescence spectroscopy. Mar. Chem. 82,239–254.
Steinberg, D., Nelson, N., Carlson, C., Prusak, A., 2004. Production of chromophoricdissolved organic matter (CDOM) in the open ocean by zooplankton and the colonialcyanobacterium trichodesmium spp. Mar. Ecol. Prog. Ser. 267, 45–56.
Tedetti, M., Longhitano, R., Garcia, N., Guigue, C., Ferretto, N., Goutx, M., 2012. Fluores-cence properties of dissolved organicmatter in coastalMediterraneanwaters influencedby a municipal sewage effluent (Bay of Marseilles, France). Environ. Chem. 9 (5),438–449.
Twardowski, M.S., Boss, E., Sullivan, J.M., Donaghay, P.L., 2004. Modeling the spectral shapeof absorption by chromophoric dissolved organic matter. Mar. Chem. 89, 69–88.
Urban-Rich, J., McCarty, J.T., Fernández, D., Acuña, J.L., 2006. Larvaceans and copepodsexcrete fluorescent dissolved organic matter (FDOM). J. Exp. Mar. Biol. Ecol. 332,96–105.
Vernet, M., Whitehead, K., 1996. Release of ultraviolet-absorbing compounds by the red-tide dinoflagellate Lingulodinium polyedra. Mar. Biol. 127, 35–44.
Volkman, J., Tanoue, E., 2002. Chemical and biological studies of particulate organicmatter in the ocean. J. Oceanogr. 58, 265–279.
Wada, S., Hama, T., 2013. The contribution of macroalgae to the coastal dissolved organicmatter pool. Estuar. Coast. Shelf Sci. 129, 77–85.
Wang, X.C., Chen, R.F., Gardner, G.B., 2004. Sources and transport of dissolved and particulateorganic carbon in the Mississippi River estuary and adjacent coastal waters of thenorthern Gulf of Mexico. Mar. Chem. 89 (1), 241–256.
Whitehead, K., Vernet, M., 2000. Influence of mycosporine-like amino acids (MAAs) onUV absorption by particulate and dissolved organic matter in La Jolla Bay. Limnol.Oceanogr. 45, 1788–1796.
Wiegert, R.G., Freeman, B.J., 1990. Tidal salt marshes of the southeast Atlantic Coast: acommunity profile. United States Fish and Wildlife Service Biological Report, 85,pp. 1–67.
Copyright © 2022 FDOKUMEN