Opportunity to Learn: The Role of Structures and Routines in ...
217
Persistent link: http://hdl.handle.net/2345/3786 This work is posted on eScholarship@BC, Boston College University Libraries. Boston College Electronic Thesis or Dissertation, 2014 Copyright is held by the author, with all rights reserved, unless otherwise noted. Opportunity to Learn: The Role of Structures and Routines in Understanding and Addressing Educational Inequities Authors: Phillip John Potenziano, Ann Allwarden, Sujan Talukdar White, Karen J. Zaleski
-
Upload
khangminh22 -
Category
Documents
-
view
0 -
download
0
Transcript of Opportunity to Learn: The Role of Structures and Routines in ...

Persistent link: http://hdl.handle.net/2345/3786
This work is posted on eScholarship@BC,Boston College University Libraries.
Boston College Electronic Thesis or Dissertation, 2014
Copyright is held by the author, with all rights reserved, unless otherwise noted.
Opportunity to Learn: The Roleof Structures and Routines inUnderstanding and AddressingEducational Inequities
Authors: Phillip John Potenziano, Ann Allwarden, SujanTalukdar White, Karen J. Zaleski

BOSTON COLLEGE Lynch School of Education
Department of Educational Leadership and Higher Education
Professional School Administrator Program (PSAP)
OPPORTUNITY TO LEARN: THE ROLE OF STRUCTURES
AND ROUTINES IN UNDERSTANDING AND ADDRESSING
EDUCATIONAL INEQUITIES
Dissertation in Practice By
PHILLIP J. POTENZIANO
with Ann F. Allwarden, Sujan S. Talukdar, and Karen J. Zaleski
submitted in partial fulfillment of the requirements for the degree of
Doctor of Education
May 2014

© Copyright by Ann F. Allwarden, Phillip J. Potenziano, Sujan S. Talukdar, and Karen J. Zaleski.
© Copyright Chapter 5: Phillip Potenziano 2014.

i
ABSTRACT
Opportunity to Learn: The Role of Structures and Routines in
Understanding and Addressing Educational Inequities
Phillip J. Potenziano
Dissertation Chairperson: Diana Pullin, J.D., Ph.D.
As district- and school-level leaders face increasing pressure from federal, state,
and local accountability mandates there has been increased dependence on using and
analyzing student data to help improve student performance. While the reporting of
disaggregated data by student subgroup confirms that achievement gaps exist, it does not
provide district- and school-level leaders with the diagnostic data needed to identify key
factors inhibiting student performance. Identifying and understanding factors hindering
student performance is critical knowledge for leaders to cultivate as they work to address
elements within their school or district that may need to change if student learning is to
improve. This research study examined specific ways district- and school-level leaders go
about challenging and helping their community to face the problem of student
performance disparities, as well as specific aspects of the situation that may be
contributing to the community’s collective capacity, to address student performance
disparities.
Without proper district-level leadership, effectively addressing operational
conditions that may lead to disparities in student learning is unlikely. Yet, little is known
about which structures and routines district- and school-level leaders perceive to be
important when analyzing student data. This single case study presents the results of an
examination of student data analysis structures and routines within a small diverse urban

ii
Massachusetts district designated by the state as low-performing based on state
indicators. In order to further understand structures and routines, interview and document
data were reviewed. Four primary findings identified the district leadership’s response to
educational inequities: (1) a mandate for using data war-rooms and student data walls;
(2) a traveling cabinet to ensure uniform review of student data across the schools in
the district; (3) a mandate for individual school improvement plans; and (4) the use of
school-based instructional coaches.

i
Executive Summary Dissertation in Practice
Ann F. Allwarden, Phillip J. Potenziano, Sujan S. Talukdar, and Karen J. Zaleski
March 2014
Opportunity to Learn: Understanding and
Addressing Educational Inequities

ii
Context and Background The release of A Nation at Risk in 1983 marks a defining moment in the history of American education, heralding the advent of standards-‐based educational reform. Whereas previous reform efforts worked to provide equal access to education for
minority groups (e.g., Brown v. Board of Education, Civil Rights Act of 1964, Elementary and Secondary Education Act, Amendments of 1966, Rehabilitation Act of 1973, Education for All
Handicapped Children Act of 1975), the standards-‐based reform movement focuses on excellence for all. Providing the same to all may at times create unfair and unjust circumstances leading to greater levels of inequity and injustice. As a result, there are times when “persons may be treated and rewarded unequally and also justly” (Green, 1983, p. 324). While some examples of inequalities are in fact just, inequities are never just. In the pursuit of excellence, the role of standards continued to gain strength, culminating in the reauthorization of the Elementary and Secondary Education Act of 1965, now commonly referred to as the No Child Left Behind Act of 2001 (NCLB). With bi-‐partisan support for the enactment of NCLB, standards-‐based educational reform emphasizing standards, assessments, and accountability “was catapulted into national policy” (Foorman & Nixon, 2006, p. 163). In order “to ensure that all children have a fair, equal, and significant opportunity to obtain a high-‐quality education” (20 U.S.C. 6302 § 1001), NCLB established a test-‐based accountability system (Hamilton, 2003; Hamilton & Koretz, 2002). Test-‐based accountability systems include four major components: goals (i.e., rigorous standards), measures (i.e., high-‐stakes state tests), targets (i.e., adequate yearly
PROVIDING THE SAME TO ALL MAY AT TIMES CREATE UNFAIR AND UNJUST CIRCUMSTANCES LEADING TO GREATER LEVELS OF INEQUITY AND INJUSTICE.

iii
progress), and consequences (i.e., school transfer options, supplemental services, corrective actions, and restructuring) (Hamilton & Koretz, 2002). Since the authorization of NCLB in 2001, there is little evidence to suggest that the current accountability system is having a positive effect on long-‐standing equity issues (Harris & Herrington, 2006). Even though the ultimate effectiveness of current federal and state policy is yet unknown, policymakers continue to show unwavering support for the pairing of rigorous standards to test-‐based accountability. Most recently, support for this pairing was demonstrated by the provision of federal funding to the assessment consortiums of SMARTER Balanced and Partnership for Assessment of Readiness for College and Careers (PARCC) to support the development of a national testing system that will assess the Common Core State Standards (CCSS) adopted by 45 out of the 50 United States of America (Achieve, Inc., 2013; Massachusetts Department of Elementary and Secondary Education, 2011; SMARTER Balanced Assessment Consortium, 2012; U.S. Department of Education, 2013). While efforts to raise standards and improve assessments deserve thoughtful consideration in the “landscape of educational policy, they are not effective drivers toward significantly changing the conditions for students who are in need….For a student, or to a parent whose child is academically drowning, simply moving the shoreline further away is not compelling” (Schott Foundation for Public Education, 2012, pp. 10-‐11). Instead, attention must turn towards formulating “a support-‐based reform agenda focused on creating the learning environment and condition in which...all children will have an opportunity to learn and succeed” (Schott Foundation for Public Education, 2012, p. 11). Purpose of Study The most recent “report cards” from the National Center for Education Statistics (NCES) highlight enduring and substantial achievement gaps. In these reports, disaggregated data from the National Assessment of Educational Progress (NAEP) reveal statistically significant discrepancies between the performance of African-‐American and Hispanic students and their White, non-‐Hispanic peers (NCES, 2011a, 2011b). Equally large performance gaps separate low-‐income from middle-‐ to high-‐income students (NCES, 2011a, 2011b). And, although less

iv
attention has been focused on measuring, monitoring, and reporting changes experienced by English language learners (ELL) and students with disabilities (SD), considerable performance gaps also exist for these student populations (NCES, 2011a, 2011b). Equally alarming, national data exposes sizable differences in graduation rates when presented by race/ethnicity. These on-‐going, statistically significant disparities raise critical questions regarding educational equity and students’ opportunity to learn within the public school system. Addressing long standing disparities in student performance calls for systemic change, a theme that resounds throughout and across the work of many educational practitioners, scholars, researchers, and advocacy groups. Igniting such a transformational change requires “step[ping] outside the situation, make[ing] sense of it, and reframe[ing] the problem” (Grogan & Shakeshaft, 2011, p. 54). Part of reframing the problem involves a collective shift in thinking that moves away from viewing disparate outcomes as an “achievement gap,” which too often reinforces the beliefs and attitudes of some that the root cause of widely discrepant outcomes stems from underperforming students’ lack of ability to achieve at high levels, and towards seeing disparate outcomes as an “opportunity gap,” which places the onus for divergent outcomes squarely upon the educational system. This essential shift in thinking emphasizes that disparities in outcomes for students are absolutely “not a reflection of their potential nor their abilities—but a direct result of denying them equitable supports and resources they need to be fully engaged and succeed” (Schott Foundation for Public Education, 2012, p. 2). In an effort to further explore the “opportunity gap”
THIS STUDY SOUGHT TO ANSWER TWO OVERARCHING RESEARCH QUESTIONS:
• HOW DO DISTRICT- AND SCHOOL-LEVEL LEADERS UNDERSTAND DISPARITIES IN STUDENT PERFORMANCE RELATED TO RACE/ETHNICITY, CLASS, AND/OR DISABILITY?
• HOW DO THESE UNDERSTANDINGS THEN INFLUENCE THE WORK OF LEADERSHIP FOCUSED ON ADDRESSING DISPARITIES IN STUDENT PERFORMANCE RELATED TO RACE/ETHNICITY, CLASS, AND/OR DISABILITY?

v
that exists for many students, the purpose of this qualitative research study was to explore how district-‐ and school-‐level leaders’ understanding of the “nature of the gap” influences the work of leadership focused on addressing disparities in student performance related to race/ethnicity, class, and/or disability. Methodology Under the umbrella of qualitative research designs, a case study approach was selected, “which focuses on understanding the dynamics present within single settings” (Eisenhardt, 1989, p. 534). Yin (2008) explains “a case study is an empirical inquiry that investigates a contemporary phenomenon within its real-‐life context, especially when the boundaries between the phenomenon and context are not clearly evident” (p. 18). Conducting a single case study allowed the research team the opportunity to fully analyze all aspects of the study in depth. Sample and participant selection. This qualitative case study began by identifying a school district and superintendent through the review of district profiles on the Massachusetts Department of Elementary and Secondary Education website. Once a district was identified, the strategies of purposeful and snowball sampling were used to identify school-‐level leaders, as well as additional district-‐level leaders. To mitigate the risk of coercion, the superintendent of the district was asked to name more people than needed for the research study sample, and research team members have kept confidential who was, in fact, approached for recruitment. To further assure confidentiality, an administrator’s decision regarding whether or not to participate in the research study was not shared with the superintendent. Data collection. Data was collected primarily through semi-‐structured interviews and then supplemented by the gathering of documents recommended by participants during their interviews. The researchers used purposeful sampling for the identification and collection of relevant school and district documents. The collection and analysis of document data offered researchers the opportunity to crosscheck and verify interviewee responses, as well as the conclusions being drawn by the researchers as they engaged in data analysis. This process of verification supported the triangulation of data and thus strengthened the trustworthiness of the study’s findings and final conclusions.

vi
Data analysis. This research study followed the three components of data analysis described by Miles and Huberman (1994): (a) data reduction, (b) data display, and (c) conclusion drawing/verification. Once data was entered into a data display, several tactics were used to both draw and verify conclusions. Ultimately, the researchers aimed to draw conclusions that have been rigorously tested for “their plausibility, their sturdiness, their ‘confirmability’—that is, their validity” (Miles & Huberman, 1994, p.11). Findings and Discussion The fourteen participants involved in this study shared their perspectives and revealed that they engaged in interactions that contributed to their understanding of the nature of the achievement gap. Some leaders in the New Hope School District recognized that disparities in student outcomes was “not a reflection of their potential nor their abilities—but a direct result of denying them equitable supports and resources they need to be fully engaged and succeed” (Schott Foundation for Public Education, 2012, p. 2). In turn, this understanding influenced their work focused on addressing disparities in student performance related to race/ethnicity, class, and/or disability. This was evident in both participant responses and a full review of documents. This research study applied the distributed leadership theoretical framework to explore the following research questions: How do district-‐ and school-‐level leaders understand disparities in student performance related to race/ethnicity, class and/or disability? How do these understandings then influence the work of leadership that focuses on addressing disparities in race/ethnicity, class, and/or disability? The distributed leadership framework allowed for a focus on interactions and the practice of leadership (Spillane, 2006; Spillane et al., 2004; Spillane et al., 2009, Spillane & Sherer, 2011). Specifically, the practice of leadership focused on the interactions of district-‐ and school-‐level leaders and aspects of their work such as the tools and routines utilized to address disparities in student performance and broaden students’ opportunity to learn (Spillane, 2006; Spillane & Sherer, 2011). In this study four researchers (Allwarden, 2014; Potenziano, 2014; Talukdar, 2014; Zaleski, 2014) explored how district-‐ and school-‐level leaders’

vii
understanding influenced the work of addressing barriers inhibiting students’ opportunity to learn. In an attempt to answer the overarching research questions, each researcher examined separate aspects of the central phenomenon, including:
• The specific shifts in thinking that district-‐ and school-‐level leaders identified as needed before disparities in student performance related to race/ethnicity, class, and/or disability could be effectively addressed, as well as the strategies district-‐ and school-‐level leaders used in their attempts to prompt these shifts in thinking (Allwarden, 2014).
• The professional learning leveraged by district-‐level leaders for school-‐level leaders as an action to further learn about, understand, and address the barriers that may be inhibiting students’ opportunity to learn (Talukdar, 2014).
• The data analysis structures and routines that district-‐ and school-‐level leaders perceived to be essential in understanding and addressing disparities in student performance related to race/ethnicity, class, and/or disability, as well as promoting students’ opportunity to learn (Potenziano, 2014).
• The influence that interactions between district-‐ and school-‐level leaders had on their understanding of barriers to students’ opportunity to learn, as well as the influence that existing ties between district-‐ and school-‐level leaders had on their practice aimed at improving students’ opportunity to learn (Zaleski, 2014).
Prompting cognitive shifts. The findings from this portion of the case study include (a) district-‐and school-‐level leaders used a range of framing strategies to prompt a common set of issue-‐and constituency-‐related cognitive shifts and (b) a correlation existed between leaders’ use of particular framing strategies and their “level” of leadership (Allwarden, 2014). The cognitive shifts that district-‐ and school-‐level leaders were attempting to prompt are presented in Figure 1 and have been divided into two broad categories: issue-‐ and constituency-‐related cognitive shifts. Issue-‐related cognitive shifts focus on the problems and solutions related to student performance disparities. When attempting to prompt for issue-‐related

viii
cognitive shifts, district-‐ and school-‐level leaders’ choice of framing strategies revealed similarities and differences. Whereas both district-‐ and school-‐level Figure 1. Prompting for Cognitive Shifts
leaders used data to quantify and clarify the magnitude of a problem in order to heighten awareness, increase importance, and create a sense of urgency (e.g., data war rooms, data walls, excel spreadsheets–all color-‐coded to emphasize the distribution of students by achievement level), district-‐ and school-‐level leaders differed in their use of framing strategies for getting their audience to accept a solution. District-‐level leaders focused on offering proof that an idea worked. For example, they frequently leveraged the success of the Level 1 school with implementing inclusive practices. District-‐level leaders also focused on explicitly establishing the direction (e.g., schools had to establish a data war room; principals had to spend 2.5-‐3 hours a day in classrooms). School-‐level leaders, on the other hand, concentrated on presenting solutions as best practice (e.g., students analyze their own data, set individual goals, and track their progress; teachers use performance data to inform their instruction and select appropriate interventions). Furthermore, data collected from leaders of Level 1 and Level 2 schools revealed that these leaders also focused on framing issues as having leverage (e.g., being strategic, focusing on and prioritizing the “right things”) and connecting solutions to their school’s mission.
Prompqng for Cogniqve Shirs
Issue-‐related Cogniqve Shirs
Heighten awareness, increase importance, and create a sense of urgency regarding a problem (or need) related to dispariqes in
student performance
Accept/Embrace a soluqon for addressing dispariqes in student
performance
Consqtuency-‐related Cogniqve Shirs
How the Consqtuency Sees Itself: We are responsible for helping all
students experience high levels of academic success.
How One Part of the Consqtuency Sees Another Part: We can learn
from one another.

ix
Constituency-‐related cognitive shifts involve a change in how an audience views themselves, their work, or others within the school district. The framing strategies that district-‐ and school-‐level leaders used to prompt constituency-‐related cognitive shifts were the same. In order to foster a sense of responsibility for helping all children experience high levels of academic success, leaders focused on redefining and re-‐envisioning the constituency’s role and responsibilities within the organization (e.g., district-‐level leaders working side by side principals; principals spending 2.5-‐3 hours a day in classrooms; using data to inform instruction). In order to promote the idea that we can learn from one another, leaders concentrated on building and acknowledging the competency and capacity present within the constituency. While the framing strategies used by district-‐ and school-‐level leaders were the same, important differences were noted regarding the cognitive shift that emphasized learning from one another. Whereas district-‐level leaders spoke of the schools learning from one another (e.g., communicating regularly, sharing successful practices), school-‐level leaders spoke of learning from individuals, or groups of individuals, within their school (e.g., data meetings, common planning time). Another notable difference emerged with the disaggregation of data collected from leaders of Level 1 and Level 2 schools. These leaders used the framing strategy of redefining the students’ role and responsibility within the organization to prompt the following cognitive shift among students: we are capable (e.g., knowing their data, setting goals, tracking their progress). Social ties among leaders. Social capital theory reminds us that the structure of ties relate to how knowledge and resources flow to individuals in the network (Daly & Finnigan, 2011), and are considered to be a determinant in actions (Daly & Finnigan, 2010, 2012; Leanna & Pil, 2006), and that trusting, cohesive, partnerships are an essential element to the tie relation (Bryk & Schneider, 2002;
“I WISH WE COULD COME TOGETHER MORE AS A COLLECTIVE LEADERSHIP GROUP IN THE DISTRICT. WE’RE UNABLE TO. IT’S NOT THE CULTURE…YOU HAVE TO BE CAREFUL WHAT YOU SAY AND HOW YOU SAY IT AND WHEN YOU SAY IT; IT SOMETIMES CAN COME BACK AND GET YOU.” BUILDING LEADER JAYDEN

x
Daly & Finnigan, 2011, 2012; Nahapiet & Ghoshal, 1998). Therefore, strengthening social ties is one way to improve collaboration among district-‐ and school-‐level leaders. After analyzing the data, the existing social ties and their influence on leadership practice as it relates to students opportunity to learn became clearer. As such, the following findings emerged: (a) lack of trust hinders building level leader ties with one another, (b) district leaders have greater ties and reciprocity among themselves than building leaders, (c) despite specific building and district relations, ties are evident between district-‐ and school-‐level leaders, and (d) regardless of tie relations, all leaders engage in tasks to enhance student learning (Zaleski, 2014). Lack of trust hinders building-‐level leader ties with one another. Figure 2 displays the first analysis of tie relations, which is the social network among building leaders. Each node represents one of the six interviewed building leaders and the arrows reflect the direction of the connection. Participant responses revealed that there are no mutual ties indicated in the group. Mutual ties in this study refer to an aspect of tie strength that involves a reciprocal sharing of information (Granovetter, 1973). District leaders have greater ties and reciprocity among themselves than building leaders. Relationships between district leaders are represented in Figure 3. Here, it is noted that there are greater ties than in the building leader network as well as greater reciprocity. However, of the eight district leaders interviewed, there are no more than three mutual ties between them. Trust was mentioned as a factor among half of the district leadership team. Further interview data reveals that despite the nature of building or central office specific relations, this does not hinder the
“YEAH, I THINK PART OF IT YOU BUILD TRUST AS YOU GET TO KNOW PEOPLE…I ALREADY KNEW VERONICA COMING INTO THE POSITION ALREADY, AND I’VE LEARNED OVER THE PAST TWO YEARS TO HAVE A LOT MORE TRUST FOR SEAN, LOGAN, AND COTE…I THINK THIS GROUP HAS A GOOD WORKING DYNAMIC. I MEAN, DO WE GO BACK AND FORTH WITH EACH OTHER SOMETIMES ON SOME MATTERS, OF COURSE WE DO, BUT JUST OUT OF FRUSTRATION FOR THE WHOLE JOB AND LACK OF RESOURCES.” DISTRICT LEADER ADRIANNE

xi
interactions between school and district level leaders. Figure 2. Sociogram for School-‐Level Leaders
Figure 3. Sociogram for District-‐Level Leaders
Despite specific building and district relations, ties are evident between district-‐ and school-‐level leaders. Despite the fact that trust impacts at least half of the relations at the school and district level, Figure 4 highlights that all building leaders have incoming ties from at least three district leaders. Figure 4 also highlights that more than half of the district leadership team is actively seeking
●
●●
●
●
●
Brian
JoeJamie
Jayden
Bill
Sharon
●
●
●
●
●
●
●
●
Logan
Cote
Veronica
Sean
Adrianne
Alicia
Kaydence
Kelsey

xii
out building leaders. Also, all five-‐district leaders engaging with principals share at Figure 4. Sociogram for District-‐ and School-‐Level Leaders
least one mutual tie with a building leader. Similarly, four of the six building leaders (with the exception of Sharon and Jayden) revealed that they are seeking out district leaders to exchange knowledge, ideas, and seek advice. The two leaders not seeking out district leaders attribute this to a perception that central
●
●
●
●
●
●
●
●
●
●
●
●
●
●
Logan
Cote
Veronica
Sean
Adrianne
Brian
Alicia
Joe
Kaydence
Jamie
JaydenBill
Kelsey
Sharon
●
●
District LeaderBuilding Leader
“I GUESS PART OF IT IS THEY ARE PEERS OF MINE AND IT’S A NATURAL WAY FOR ME TO KIND OF EXPAND THE KNOWLEDGE THAT I NEED BY WORKING WITH THEM, AND PROBABLY PART OF IT IS PROXIMITY. THEY’RE HERE IN THE SAME OFFICE WITH ME, I CAN SIT IN MY OFFICE AND SCRATCH MY HEAD AND TRY TO FIGURE IT OUT OR I COULD WALK DOWN THE HALL AND TRY TO BRAINSTORM AND TRY TO BRAINSTORM IT WITH THEM.” DISTRICT LEADER COTE

xiii
office has too much on their plate and other resources are more easily accessible at the building level. Complementary Findings The following discussion synthesizes insights drawn from the four individual studies. These insights were gained by searching for complementary results based on the “complementarity model of triangulation” (Erzberger & Kelle, 2003, p.469). Applying the complementarity model of triangulation involved reviewing the individual studies for findings that complemented one another. Because the complementary findings were drawn from individual studies that highlighted different aspects of the central phenomenon, these findings offer a stronger depiction of the topic being analyzed (Erzberger & Kelle, 2003) and further inform current understandings about the work of leadership focused on addressing disparities in student performance and enhancing students’ opportunity to learn. Level 3 status: Catalyst for change. Gioia and Chittipeddi (1991) emphasized that initiating change often triggers cyclical patterns of acquiring knowledge and taking action. Insights from across the studies revealed that the designation of Level 3 state accountability status served as a catalyst for change in the New Hope School District. The assignment of Level 3 status led to the development of new organizational structures and routines, which, in turn, supported patterns of acquiring knowledge and taking action (Allwarden, 2014; Potenziano, 2014; Talukdar, 2014; Zaleski, 2014). Specifically, the development of new organizational structures and routines led to (a) increased opportunities for leaders to interact with one another (Zaleski, 2014) and (b) enhanced opportunities for leaders to engage in professional learning (Talukdar, 2014). Furthermore, since the structures and routines described by district-‐ and school-‐level leaders occurred regularly (e.g., weekly, monthly, quarterly), leaders were provided with
“THE DSAC TEAM ASSISTED THE DISTRICT BY MEETING WITH SCHOOL AND DISTRICT LEADERS MONTHLY, AND SOMETIMES MORE OFTEN, AND HAS SUPPORTED AND ASSISTED US WITH COLLABORATING, ANALYZING DATA, AND CREATING THE ACCELERATED IMPROVEMENT PLAN.” DISTRICT LEADER SEAN

xiv
ongoing support as they grappled with understanding—or further developing their understanding—of barriers hindering students’ opportunity to learn (Allwarden, 2014; Potenziano, 2014; Talukdar, 2014; Zaleski, 2014). Additionally, the development of new organizational structures and routines provided leaders with a forum for presenting their plans for addressing disparities in student performance, as well as presenting the outcomes that resulted from actions taken. Figure 5 depicts the relationship between the catalyst for change, the development of organizational structures and routines, and the increased opportunities for leader interaction and professional learning (Potenziano, 2014; Talukdar, 2014; Zaleski, 2014). Figure 5 also illustrates the relationship between these three elements and leaders’ ability to frame problems, solutions and constituencies related to disparities in student performance (Allwarden, 2014). While the individual researchers of this study looked at specific aspects of leadership in isolation, Figure 5 offers a broader, more complete picture of how these elements interacted and influenced one another in real life. As a result of the Level 3 status, district-‐level leaders sought out and established a partnership with the District and School Assistance Center (DSAC), a state sponsored organization. This partnership led to the establishment of new structures and routines which afforded on-‐going opportunities to conduct in-‐depth analyses of (a) disparities in student performance, (b) barriers in the learning environment, and (c) organizational challenges related to students’ opportunity to learn. Grogan and Shakeshaft (2011) emphasize the importance of analyzing situations in an objective fashion and framing issues from a different perspective when working to addressing long-‐standing disparities in student performance. The partnership with DSAC led to the construction of structures and the development of routines that supported this aspect of leadership work. As leaders came together to analyze disparities in student performance, barriers in the learning environment, and organizational challenges related to students’ opportunity to learn, the professional learning environment within the district was further enhanced. The interactions that took place within this learning environment between district-‐ and school-‐level leaders were examined as a

xv
critical element relating to school improvement (Daly & Finnigan, 2010, 2011, 2012). The superintendent’s statement captures the value of these interactions when he offered, “The DSAC team assisted the district by meeting with school Figure 5. The Interrelationship of Elements Studied
and district leaders monthly, and sometimes more often, and has supported and assisted us with collaborating, analyzing data, and creating the Accelerated Improvement Plan (AIP).” Frequently, interactions between district-‐ and school-‐level leaders occurred during Administrative Council (ADCO), Full Administrative Council (FADCO), and traveling cabinet meetings (Zaleski, 2014). These meetings offered leaders regular opportunities to engage in professional learning that enhanced their capacity to (a) identify and describe gaps in student performance and (b) consider and explore potential barriers to student learning (Talukdar, 2014). In other words, these meetings offered leaders opportunities “to engage in continuous and sustained learning about their practice in the setting where they actually work...confronting similar problems of practice” (Elmore, 2004, p. 127). Finnigan and Daly (2010) remind us that sharing knowledge and mobilizing resources embedded in individual interactions is critical to influencing practice and enhancing success in “purposive action” (p. 180). The assignment of Level 3 status triggered the mobilizing of resources to develop new structures and routines, which then enhanced leaders’ ability to share knowledge and take purposive action (Allwarden, 2014; Potenziano, 2014; Zaleski, 2014). The actions taken were deliberate (thought about and discussed), developmental (designed to assist with growth and bring about improvement), and progressive (kept

xvi
“AS AN ADMINISTRATIVE LEADERSHIP GROUP… WE’VE DONE, LET’S SEE MONTHLY MEETINGS…. CERTAINLY TALKING ABOUT THE DATA, TALKING ABOUT THE IMPLICATIONS OF DATA….THEN, OKAY, HOW DOES THIS TRANSLATE INTO WHAT YOUR TEACHERS ARE DOING IN THE CLASSROOM.” BUILDING LEADER BILL “IF I’VE LEARNED ANYTHING IN MY TIME HERE, EACH SCHOOL IS A FUNCTION OF THEIR PRINCIPAL, THE LEADERSHIP CULTURE AT THEIR SCHOOL….I THINK NOW WITH THIS ACCELERATED IMPROVEMENT PLAN WHICH WE ARE IN YEAR TWO OF, I THINK IT WILL HELP MOST OF THESE LEVEL 3 SCHOOLS MOVE UP AT LEAST ONE LEVEL….I’M CONFIDENT THEY CAN MOVE UP FROM AT LEAST THREE TO TWO.”
PARTICIPANT QUOTES
moving forward), always with the intent of ensuring that students’ opportunity to learn was enhanced. These actions supported understanding student performance disparities and informing solutions to address barriers to students’ opportunity to learn. The leaders in New Hope School District also used organizational routines and structures to help distribute leadership responsibilities (Spillane, 2006). Prior to the Level 3 designation, structures and routines were in place that required district-‐ and school-‐level leaders to meet. However, leaders were not required to collectively identify and develop a shared understanding of achievement disparities. Following Level 3 designation, enhanced and newly created structures and routines helped promote collaboration and build robust intra-‐organizational ties (Chrispeels, 2004; Honig, 2004; Togneri & Anderson, 2003). The use of the structures and routines also played a critical role in guiding the New Hope School District in their development of a clearly aligned vision and mission (Harris, Leithwood, Day, Sammons & Hopkins, 2007; Waters & Marzano, 2006). Structures and routines led to shared understandings and collective action. New Hope School District leaders described specific structures and routines that had been set in place to support collaboration between district-‐ and school-‐level leaders, as well as to support data use practices. The Administrative Council (ADCO), Full Administrative Council (FADCO), traveling cabinet, DSAC meetings, and the Accelerated Improvement Plan (AIP) are examples of structures and routines put in place to support collaboration and data use among district-‐ and school-‐level leaders

xvii
(Allwarden, 2014; Potenziano, 2014; Zaleski, 2014). In addition, these structures allowed leaders to engage in ongoing professional learning (Talukdar, 2014). Spillane (2006) describes this leadership practice as “a product of the joint interactions of school leaders, followers, and aspects of their situation such as tools and routines” (p. 3). According to the distributed leadership framework, the structures used within the New Hope School District can be thought of as tools and routines because they involved recurring patterns of “interdependent actions, involving multiple actors” (Feldman & Pentland, 2003, p. 311). For instance, the traveling cabinet structure supported the routine of leaders meeting regularly to engage in ongoing professional learning that involved the frequent review and analysis of student performance data (Potenziano, 2014; Talukdar, 2014). Established structures and routines also sought to allow district-‐and school-‐level leaders to develop an understanding of the opportunity gaps present in the learning environment (Allwarden, 2014; Zaleski, 2014). The action planning template and the AIP that leaders created in partnership with DSAC facilitated this understanding (Zaleski, 2014). As a result, leaders’ ability to recognize barriers was evident in the areas of leadership skills, curriculum alignment and implementation, and instructional practice. More specifically, leaders identified barriers specific to students with disabilities, students from low-‐income households, Latino/a students, and English language learners (ELL). Additionally, the implementation of enhanced and newly developed structures and routines helped to expose inequitable practices in the New Hope School District.
“THE SCHOOLS WE’RE STILL STRUGGLING WITH, YOU MAY HEAR [PRINCIPALS] SEPARATE OUT ONE POPULATION OF STUDENTS FROM ANOTHER, BUT THE SCHOOLS THAT WERE A SUCCESS, LIKE I SAID WITH THE DATA, THEY’RE ALL INCORPORATED IN; IT’S ALL STUDENTS ALL THE TIME. AND THERE’S A BIG SHIFT IN THE DISTRICT AROUND INCLUSIVE TEACHING.” DISTRICT LEADER ADRIANNE

xviii
District-‐ and school-‐level leaders interviewed consistently referred to students receiving special education as the sub-‐group most impacted by the achievement gap in the New Hope School District. Research findings revealed that one of the barriers to student learning for students with special needs was inequitable access to the general education curriculum (Allwarden, 2014; Potenziano, 2014; Talukdar, 2014; Zaleski, 2014). Greene (1983) explains that equality in education focuses on “inputs” and ensures that the same is provided to all, while equity places emphasis on “outputs” and focuses on achieving the same outcomes for all. Lindsey et al. (2009) contend accommodations that account for differences, such as race and ethnicity, language, and ability are sometimes needed in order to achieve educational equity. Students receiving special education services in the New Hope School District were often educated in separate settings. Research evidence revealed there were some schools that deliberately encouraged equitable learning environments for special education students. When comparing schools across the district, data indicated that schools utilizing co-‐teaching and inclusion models earned higher state accountability ratings than those that did not. By focusing on differentiating instruction to meet the needs of all students within the general education classroom, leaders within the New Hope School District believed that school staff were moving closer to creating educational equity while improving students’ opportunity to learn. When examining how district-‐level leaders sought to leverage professional learning opportunities in the New Hope School District, leaders took advantage of improved structures and routines resulting from the DSAC partnership (Potenziano, 2014; Talukdar, 2014). Knapp (2003) reported “professional learning could involve changes in one’s capacity for practice (i.e., changes in professionally relevant thinking, knowledge, skills, and habits of mind) and/or changes in practice itself (enacting the new knowledge and skills in one’s daily work)” (pp. 112-‐113). New structures and routines, such as traveling cabinet meetings, not only resulted in increased interaction between leaders, but also offered occasions for leaders to build their data analysis and decision-‐making capacity (Talukdar, 2014; Zaleski, 2014). Further, structures and routines promoted sustained, job-‐embedded professional learning (e.g., ADCO, FADCO, and traveling cabinet

xix
meetings, learning walks, and 9-‐day instructional coaching cycle) and allowed for frequent collaboration and discussion of factors influencing teaching and learning (Potenziano, 2014; Talukdar, 2014; Zaleski, 2014). Given the evidence of deficit thinking that existed among some school staff, particularly as it related to special education students, district leaders also sought to leverage professional learning to prompt cognitive shifts (Talukdar, 2014). As district-‐ and school-‐level leaders’ understanding developed, so did their ability to influence how others understood factors contributing to disparities in student performance related to race/ethnicity, class, and/or disability. Influencing how others understand a situation is a critical aspect of leadership work, and the ability to effectively frame the problems, solutions, and constituencies related to disparities in student performance becomes a powerful means for shifting the thinking of others. After all, when effectively done, influencing how others understand a situation can positively impact individuals’ perceptions of their work and provide a powerful source of inspiration and motivation (Awamleh & Gardner, 1999; Foldy, Goldman & Ospina, 2008). The interactions and professional learning that occurred among leaders as a result of the structures and routines that were in place not only led to an understanding of the nature of the gap, it also led to an influence on their work, which focused on addressing disparities in student performance (Potenziano, 2014; Talukdar, 2014; Zaleski, 2014). Specifically, leaders recognized that ongoing data analysis was critical to teaching and learning improvements. The task of analyzing data was distributed among all leaders for the specific purpose of improving the professional capacity to identify gaps in learning with the goal of eliminating barriers. For instance, when looking at data, one building leader recognized that low-‐income and Latino students lacked opportunities pertaining to course placement; it was then brought to the attention of a district leader who subsequently mandated that all students take at least one Advanced Placement course prior to graduation. Similarly, as a result of student performance data analysis, several building-‐based accelerated improvement plans were strategically created and utilized as tools across the district to enhance the learning environment.

xx
The Accelerated Improvement Plans included specific initiatives and objectives that were designed by school and district leaders as tools to guide their work in an effort to eliminate identified barriers and enhance student opportunities to learn. Harris, Leithwood, Day, Sammons, and Hopkins (2007) remind us that school improvement based on a distributed leadership model is not automatic, rather, “much depends on the way in which leadership is distributed, how it is distributed and for what purpose” (p. 9). The strategic approach utilized to address barriers in the learning environment in the New Hope School District as mentioned above reinforces that they subscribed to a distributed leadership model. It is clearly indicated that school and district leaders have gained an understanding of barriers in the learning environment pertaining to low-‐income students, as well as students with disabilities, as a result of their interactions with one another. However, further data reveals that despite these interactions some school leaders need additional support as they work to continually understand and address barriers in the learning environment. School leaders need more central office support. During interviews some of the school level leaders indicated that they need more support from district level leaders regarding data analysis. District leader Kelsey acknowledged that district level leaders tend to assume everyone including administrators knows how to use data, and she further offered:
We need to make sure that everybody understands what it is that we're analyzing, and exactly what a particular tool is able to do for us. So if we're looking at benchmarks in fluencies, people need to be aware that we are looking at fluency, and just fluency, and then extrapolating from that what that means, okay, that people need to understand what that can do for you and what it can’t do for you.
Daly and Finnigan (2010, 2011) emphasize that schools are rooted in the wider efforts of the district, and district-‐level leaders may have a direct influence on change initiatives and outcomes through the development of network ties between district-‐ and school-‐level leaders. In an effort to examine leader connectedness and its relation to the performance of leadership tasks (Borgatti, Jones, & Everett, 1998), ties and relations among leaders was examined.

xxi
Student learning is enhanced regardless of tie relations. District-‐ and school-‐level leaders revealed that they are engaging in a variety of practices to enhance students’ opportunity to learn at the school and district level. This was evident regardless of whether or not trusting ties were formulated and existent between individuals (Zaleski, 2014). For example, to prompt shifts in thinking and practice among principals and school staff, district leaders fostered and leveraged professional learning activities (Talukdar, 2014). Interview responses suggested professional learning played a role in the way some thought about and in-‐turn approached their work with particular sub-‐groups of students (e.g., students with disabilities). In addition, some district-‐ and school-‐level leaders appeared more willing to learn from the best practices of schools realizing academic growth. One of the ways in which these educators were able to learn more about successful schools was through professional learning activities (e.g., book studies, belief surveys, case studies, and resource sharing) (Talukdar, 2014). For example, although Jamie shared no outgoing tie connections with building leaders, she acknowledged that she engaged in efforts with Bill and Joe to create a school within her school to address students and subgroups with risk factors such as poor attendance, retention, and high discipline referrals (Zaleski, 2014). The systems and structures (ADCO, FADCO, traveling cabinet) are supporting leaders with enhancing students’ opportunity to learn across the district. One school in the district did move from a Level 2 to Level 1 status last year; this is the highest performance rating assigned by the state. District leaders are diligently working with principals to close gaps in performance via the structures in place, and district leader Sean is working with principals on improvement planning at the building level. District leader Alicia also works with principals on attendance, dropout rates, and graduation rates within a four-‐year period of time. Although there was a lack of tie relations at the building and district level, this did not result in initiatives being stalled (Zaleski, 2014). Rather, despite the nature of relations in the New Hope School District, the organizational structures in place resulted in both building and district leaders being actively engaged in practices that were intended to support enhancing students’ opportunity to learn (Allwarden, 2014; Potenziano, 2014; Talukdar, 2014; Zaleski, 2014).

xxii
Recommendations for Practice First and foremost, we recommend that the New Hope School District keep organizational structures intact. ADCO, FADCO, and the traveling cabinet offer building leaders direct oversight and support from central office leaders. Spillane (2013) states that the advantages of organizational structures and routines are that they “allow efficient coordinated action; [provide] a source of stability; and reduce conflict about how to do work”. Furthermore, the use of organizational structures and routines that district-‐ and school-‐level leaders institute has significant potential to enhance students’ opportunity to learn. This was best evidenced in the New Hope School District when district-‐ and school-‐level leaders analyzed student data with uniformity resulting in at least one school narrowing achievement gaps and advancing to Level 1 status. School districts that embrace these types of structures and routines increase the likelihood that interaction among administrators will take place which will allow knowledge and resources to flow through the network of leaders, ultimately informing the work of practitioners (Daly & Finnigan, 2010). Sustainability is also likely enhanced when these structures and routines are in place. Hargreaves and Fink (2006) emphasize “sustainable leadership matters [as it] preserves, protects, and promotes deep and broad learning for all in relationships of care for others” (p. 23). In an effort to enhance relations, increase support from central office leaders to building leaders, and enhance success at the building level, it is recommended that the district consider creating prescribed structures/routines that require school-‐level leaders to visit each other’s schools to analyze data together and share successful practices. In doing so, school-‐level leaders are also less likely to feel unsupported and isolated from one another. Varying tie relations may be a result of competitive pressure at the local level to perform and meet accountability demands (Zaleski, 2014). Daly (2009) points out that as a result of high stakes accountability, relations between school and district leaders tend to become less collaborative and more official and organized. One way to remedy this is by fostering the professional growth of leaders and differentiating supports for principals depending on their needs as instructional leaders. Daly and Finnigan (2010) highlight that “leadership development programs both outside and within districts have the unique opportunity to create the space for reflection and dialogue for leaders to explore these tensions and

xxiii
how they may be brought into balance” (p. 520). Therefore, it is essential that school districts add a component to their existing professional development plans that specifically promote the building of relationships among leaders across the district in a way that supports collaboration (Talukdar, 2014; Zaleski, 2014). The National Institute for School Leadership Program (NISL) is one example of a program designed to assist leaders with collaborating and enhancing their skills in the face of accountability demands (NISL, 2013). Participation in the NISL program also holds the potential to increase the social capital among leaders and assist with policy implementation at the local level (Daly & Finnigan, 2010). District-‐level leaders should also consider creating opportunities for school-‐level leaders to strengthen relations and formulate new ties (Zaleski, 2014). Allowing leaders’ time to meet and discuss building based concerns without a central office driven agenda may enhance relations as well. Daly and Finnigan (2010) point out in a related study “district[s] will have to avoid the trap of merely providing time and directives to work together as this does not necessarily result in meaningful collaboration between leaders” (p.128). Therefore, practitioners should heed the advice of DuFour and Burnette (2002) by insisting that principals develop improvement plans demonstrating the collective efforts of the team and not merely the work of individuals. Enhancing connections at the district level will assist with building relations across the district, ultimately improving the overall school climate (Zaleski, 2014). Curtis and City (2009) agree that collaboration is critical and begins at the central office level stating:
Central office departments create teams to do their work most effectively. The superintendent convenes a senior leadership team to shape and drive the direction of the system’s work. Effective collaboration is critical to success at all levels of the organization. Yet the knowledge, skills, and dispositions required for collaboration are seldom taught. It is deeply ironic that a skill students need to ensure their future opportunities is one that the adults responsible for their education often do not possess and have not had the opportunity to learn (p. 38).

xxiv
In order for the central office team to be considered high functioning, there must be a “high level of trust, a willingness to be vulnerable, and comfort with conflict” (Curtis & City, 2009, p.56). District leaders are encouraged to implement and facilitate team-‐building activities to work on strengthening partnerships with each other. Incorporating time on meeting agendas for district-‐ and school-‐level leaders to engage in activities focused on developing authentic relationships is a suggested activity (Curtis & City, 2009). For instance, Curtis and City (2009) suggest leaders complete the Meyers & Briggs Personality Inventory and share results in an effort to enhance relations and build trust. Hargreaves and Fink (2006) emphasize that “investing resources in training, trust building, and teamwork” (p. 267) is a function of sustainable leadership that has long lasting effects. District leaders should consider expanding liaison support to all principals, and not limit this resource to struggling schools alone (Zaleski, 2014). Honig et al. (2010) point out that central office staff can engage in efforts to support the teaching and learning environment entirely by “taking the case management and project management approaches to their work”(p. 7). Honig et al. (2010) emphasize that the case management approach enables district leaders to utilize their expertise to fully support “the specific needs, strengths, goals, and character of each individual school in their case load” with the goal of working to provide “high-‐quality, responsive services appropriate to their individual schools”(p. 8). Likewise, the project management approach results in district leaders directly “solving problems that promised to help schools engage in teaching and learning, even if those problems cut across multiple central office units” (p. 8). District-‐level leaders should also consider expanding professional learning opportunities intended to eliminate deficit thinking within the district (Talukdar, 2014). The New Hope School District superintendent took positive steps to support principals in their efforts to dismantle deficit thinking and enhance some of the skills needed to assume responsibility for teaching and learning improvements. Moving forward, the superintendent must deepen the dialogue around instructional issues beyond data review. In light of the success of schools that ensured students with disabilities had full access to the curriculum,

xxv
consideration should be given to expanding the full-‐inclusion teaching model across the district. Consideration should also be given to implementing multicultural and anti-‐racist professional learning opportunities in order to continue to prompt shifts in teacher beliefs. While anti-‐racist and multicultural education are closely related in the goal to improve student outcomes, Kailin (1998) believes that multicultural education is a non-‐threatening way to address gaps in student performance because it is focused around building teachers’ and students’ cultural awareness rather than tackling structural aspects of racism. Kailin (1998) further argues that an anti-‐racist approach to education must focus on the deliberate dismantling of racism whereas multicultural education strives to broaden teachers’ understanding of the diverse histories of students they serve as a means to empower them. It is important to note, however, that ultimately multicultural education and anti-‐racism both seek raise the academic achievement of students of color while nurturing the growth of all students. By implementing multicultural and anti-‐racist professional learning opportunities, administrators of the New Hope School District will be better equipped to learn about, understand and address the undeniable correlation between students’ race and ethnicity and disparities in student performance. There are prevailing approaches to multicultural and anti-‐racist professional development and learning that espouse to reduce the achievement gap while transforming teacher beliefs (Ferguson, 2007; Howard, 2007; Singleton & Linton, 2006; Skrla, McKenzie & Scheurich, 2009). Ferguson (2007) is responsible for putting forth a conceptual framework titled the Tripod Project, which aims to close the achievement gap by addressing the three legs of the “tripod”: content, pedagogy and relationships. He argues that in order to reduce achievement gaps, content must be accessible and culturally relevant, pedagogy must involve varied approaches to meeting students’ needs, and teachers must develop meaningful relationships with students while maintaining high expectations for ALL students. Skrla et al. (2009) describe the need to use Equity Audits as a means to creating equitable and excellent schools. They contend that by assessing the equity and inequity of programs, as well as teacher quality and achievement, school leaders will be better prepared to develop an action plan that uncompromisingly

xxvi
promotes educational equity. They describe particular skills teachers must develop to improve their practice that include clearly communicating expectations, stimulating students with high-‐level tasks, and using an asset-‐based approach when working with diverse populations. While experienced, high-‐quality teachers within the New Hope School District may already possess many of the skills needed to serve most students effectively, Singleton and Linton (2006) argue that in order to reduce the “racial” achievement gap, educators must be willing to engage in courageous conversations about race. Additionally, they and many others (Darling-‐Hammond & McLaughlin, 1995; Gay & Howard, 2000; Ladson-‐Billings, 2006; Lawrence & Tatum, 1997; Nieto, 2000; Tatum, 1997) believe it is critical for teachers to explore their own racial identities and consider how it affects their teaching of students, particularly students of color (i.e., Asian American, Hispanic/Latino, Black/African-‐American, Multiracial and Native American). The research of Singleton and Linton (2006) indicates when white teachers were able to relate to their diverse students experiences, and as they developed cultural awareness or competence, a narrowing of the achievement gap occurred. Given over 90% of administrators and teachers in the New Hope School District are white while over 60% of students identify as students of color, and in light of the existing racial achievement gap as measured across three performance indicators (i.e., state achievement tests, graduation rates, and SAT performance reports), serious consideration should be given to implementing multicultural and anti-‐racist professional learning opportunities. Recommendations for Policy Makers Cohesive relations between school and district leaders are often hindered by accountability policy demands (Daly 2009). This often complicates the job of leaders trying to effect change in schools (Zaleski, 2014). Daly and Finnigan (2010) point out that “effectively responding to state and federal accountability policies at the local level may require a more collaborative relationship among and between central office and school administrators to allow for the diffusion of innovation and knowledge”(p.131). In an effort to strike this balance, district leaders need to develop systems and structures to enhance collaboration within school districts (Potenziano, 2014; Zaleski, 2014). New Hope School District

xxvii
leaders implemented structures to support collaboration in an effort to enhance students’ opportunity to learn. Their efforts yielded evidence that some schools were making progress. This supports the research claim that school culture, namely interactions, is a valuable consideration when enhancing student opportunities to learn. Policy makers should be mindful of this consideration and recognize that accountability demands alone do not promote equitable student opportunities to learn (Harris & Herrington, 2006). Recommendations for Future Research While this study contributed to theoretical knowledge and provided a practical contribution to the field of education, future research areas must be noted. First, conducting an exploration of interactions among leaders using an external social capital lens (Leana & Pil, 2006) may prove beneficial. The external partnership with DSAC in this study was instrumental in assisting leaders with responding to accountability demands beyond standardized testing through the development of the Accelerated Improvement Plan. A deeper exploration of external partnerships may yield findings in relation to the importance of these relations when attempting to enhance students’ opportunity to learn. Second, an examination of which structures and routines district-‐ and school-‐level leaders perceive to be important when analyzing student data in multiple districts on a larger scale may prove beneficial. Third, future research should include multiple districts with similar demographics in an effort to gain a more comprehensive and generalizable understandings of how district-‐ and school-‐level leaders seek to understand and address disparities in student performance. Finally, because the research team members sought to understand how district-‐ and school-‐level leaders learned about, understood, and addressed barriers to students’ opportunities to learn, interviews were limited to district-‐ and school-‐level leaders. This had potential implications for the overall conclusions drawn. Future research efforts involving staff at all levels could help to address this limitation and assist in uncovering the true impact of efforts aimed at eliminating barriers to students’ opportunity to learn.

xxviii
Conclusion The literature portrays a multifaceted depiction of how many factors have the potential to impact district-‐ and school-‐level leaders understanding of the nature of the gap and how these understandings then influence the work leadership focused on addressing disparities in student performance. It was the intent of the research team to enhance insight in this area for practitioners. It is evident that leaders’ interactions and framing of events coupled with how they practice has the potential to enhance the school climate and increase students’ opportunities to learn (Allwarden, 2014; Potenziano, 2014; Talukdar, 2014; Zaleski, 2014). Additionally, the purposeful distribution of leadership work provides the opportunity to enhance collaboration and collective action (Allwarden, 2014; Potenziano, 2014; Talukdar, 2014; Zaleski, 2014). Conversely, without proper district-‐level leadership and leader distribution, effectively addressing disparities in student performance may be hindered.

xxix
ACKNOWLEDGEMENTS
First and foremost, I would like to thank my chair, Dr. Diana Pullin. She is a
professor who commands respect by guiding you to do the best work possible and
without her guidance, encouragement, and support I am not sure I would have been able
to complete this journey.
I am also grateful to Dr. David Scanlon and Dr. Maryellen Brunelle, for the
constructive analysis and direction. Dr. Scanlon’s feedback, and insights helped shape my
dissertation and made this process a more valuable learning experience. Dr. Brunelle,
thank you for your words of encouragement and wisdom. I appreciated how you always
knew when I might need a boost.
Thank you to my fellow team members: Ann Allwarden, Sujan Talukdar and
Karen Zaleski for working so enthusiastically and collaboratively. I could always count
on the strength of the collective group to help pull me through.
I would also like to thank my best friend and wife Karen. Thank you for being the
glue that held the family together. Without you as my partner, I certainly would not have
taken the initial risk of even applying to Boston College yet alone finish.
Lastly, I would like to thank my children, Owen, Allie and Lex, each of whom
provided me with words of encouragement. I know that there were many events,
activities, and games that I did not attend but I also hope that I have modeled what it
looks like to follow your passion and dreams.

xxx
TABLE OF CONTENTS
Executive Summary ………………………………………………………………………i
Acknowledgements ……………………………………………………………………xxix
List of Tables …………………………………………………………………………xxxv
List of Figures…………………………………………………………………………....xli
Chapter 1: Introduction ……………………………………………………………….......1
Statement of the Problem ……………………………………………………………….1
Research Questions ……………………………………………………………………..4
Chapter 2: Literature Review ……………………………………………………………..8
Historical Context .… …………………………………………………………………..8
Opportunity to Learn (OTL) …………………………………………..……………….11
The Challenge of Defining and Measuring OTL ………….…………………………..13
A traditional perspective of OTL ……………………………………………………...14
A sociocultural perspective of OTL …………………………………………………...14
Common ground ………………………………………………………………………15
Theoretical Framework …………………...………...………………………………....16
Chapter 3: Methods ……………………………………………………………………...21
Qualitative Research …………………………………………………………………..21
Case Study …………………………………………………………………………….23
Sample and Participant Selection ……………………………………………………..24
District selection: State one …………………………………………………………...25
District selection: Stage two …………………………………………………………..27
District selection: Stage three …………………………………………………………28

xxxi
School-level leaders and additional district-level leaders …………………………….30
Data Collection ………………………………………………………………………..32
Interview ………………………………………………………………………………32
Documents …………………………………………………………………………….36
Data Analysis ………………………………………………………………………….37
Data reduction …………………………………………………………………………37
Data reduction …………………………………………………………………………37
Creating codes …………………………………………………………………………38
Coding procedures ……………...……………………………………………………..39
Marginal remarks ……………………………………………………………………...40
Memoing ………………………………………………………………………………40
Data storage and management ………………………………………………………...41
Data displays …………………………………………………………………………..41
Conclusion drawing and verification ………………………………………………….42
Traditional analysis sequence …………………………………………………………44
The Use of Triangulation ……………………………………………………………...44
Reliability and Validity ………………………………………………………………..46
Researcher Bias and Assumptions …………………………………………………….47
Chapter 4: Description …………………………………………………………………..48
Overview of the New Hope Public School District …………………………………...49
Disparities in Student Performance …………………………………………………...54
State achievement tests ………………………………………………………………..54
Graduation rates ……………………………………………………………………….56

xxxii
SAT performance reports ……………………………………………………………..60
Chapter 5: Findings ……………………………………………………………………...64
Statement of Purpose ………………………………………………………………….64
Historical Perspective ………………………………………………………..………..65
Changes in Leadership Roles ………………………………………………………….65
Distributed leadership ………………………………………………………………....66
Ensuring accountability ……………………………………………………………….68
Defining data ………………………………………………………………………….70
Defining structures and routines ………………………………………………………72
Structure ……………………………………………………………………………….73
Routine ………………………………………………………………………………...73
Methods …………………………………………………………………….………….74
Case study …………………………………………………………………….……….74
Sample and Participant Selection ………………………………………………….…..75
Data collection ……………………………………………………………………..….75
Interviews …………………………………………………………………..………….75
Document analysis …………………………………………………………………….76
Data analysis ……………………………………………………………….………….79
Data displays ……………………….……………………………………………….…80
Conclusion drawing and verification …………………………...……………………..80
Triangulation ……………………………………………………….….………………80
Reliability and validity …………………………………………….…………………..80
Researcher bias and assumptions ………………………….…………………………..81

xxxiii
Results …………………………..………………………….…….……………………81
Structures and Routines ……………………………………………………………….81
Overview of the New Hope Public School District including Massachusetts
performance ranks …………………………………………………………...………...82
A mandate for using data war-rooms and student data walls ………………...……….83
A traveling cabinet ensures uniform review of student data …………………….…….89
Mandated plans for individual school improvement ………………………………….92
School-based instructional coaches …………………………………………………...97
Discussion ……………………………………………………..……………………..103
Implications for Practice ……………………………………………………………..110
Study Limitations …………………………………………………………………….111
Chapter Six: Discussion and Recommendations ………………...…...………………..114
Complementary Findings ……………………………………………………….……116
Level 3 status: Catalyst for change ………………………………………….……….116
Structures and routines led to shared understandings and collective action …..……..119
Student learning is enhanced regardless of tie relations ……………………..………124
Recommendations for Practice …………..…………………………………………..125
Recommendations for Policy Makers ……………………………………..…………131
Recommendations for Future Research ……………………………………………...132
Overarching Study Limitations ………………………………………………..……..133
Conclusion ………………………………………………….…..……………………134
References ……………………………………………………….…...………………135
Appendix A ………………………………………………………….……………….169

xxxiv
End Note ……………………………………………………………………………..169
District-Level Leader Interview Questions …………………………………..………170
School-level Leader Interview Questions ……………………………………………172

xxxv
LIST OF TABLES
Table 3.1 Tactics for Drawing and Verifying Conclusions (Miles & Huberman, 1994) ……………...…………………......................................43 Table 4.1 New Hope District- and School-level Leaders ………..………………….52
Table 4.2 Percentage of Students Scoring Proficient or Higher on the State Test…..58
Table 4.3 Four Year Graduation Rate …....................................................................61
Table 4.4 Performance of New Hope Students in Reading and Mathematics on the SAT ……………………..……………………………………………………….63 Table 5.1 Research Questions ……………………………………………………….77

xli
LIST OF FIGURES
Figure 1.1 Developing an In-depth Understanding of the Central Phenomenon……...5
Figure 3.1 Single-case Study (Yin, 2008, p.18) ………………………………….....25
Figure 3.2 Sequence of Interview Process ………………………………………….34
Figure 3.3 Traditional Data Analysis Sequence …………………………………….45
Figure 3.4 Modified Traditional Data Analysis Sequence ………………………….45
Figure 4.1 PPI Scores from the 2012-2013 School Year …………………………...54
Figure 4.2 New Hope School District’s ELA MCAS Results ……………………...56
Figure 4.3 New Hope School District’s Mathematics MCAS Results ……………..56
Figure 5.1 New Hope School District’s ELA MCAS Results ………………………84
Figure 5.2 New Hope School District’s Mathematics MCAS Results ……………...84
Figure 5.3 New Hope School District’s Catalyst for Change Model ………………107
Figure 6.1 The Interrelationship of Elements Studied …………………………….117

xlii

1
Opportunity to Learn: The Role of Structures and Routines in
Understanding and Addressing Educational Inequities
CHAPTER ONE 1: INTRODUCTION
Statement of the Problem
The most recent “report cards” from the National Center for Education Statistics
(NCES) highlight enduring and substantial achievement gaps. In these reports,
disaggregated data from the National Assessment of Educational Progress (NAEP) reveal
statistically significant discrepancies between the performance of African-American and
Hispanic students and their White, non-Hispanic peers (NCES, 2011a, 2011b). Equally
large performance gaps separate low-income from middle- to high-income students
(NCES, 2011a, 2011b). And, although less attention has been focused on measuring,
monitoring, and reporting changes experienced by English language learners (ELL) and
students with disabilities (SD), considerable performance gaps also exist for these student
populations (NCES, 2011a, 2011b).¹ Equally alarming, national data exposes sizable
differences in graduation rates when presented by race/ethnicity. For example, while the
graduation rate for White, non-Hispanic students reaches 82%, the graduation rates for
African-American and Hispanic students are at 63.5% and 65.9% respectively (Stillwell,
Sable, & Plotts, 2011). These on-going, statistically-significant disparities raise critical
questions regarding educational equity and students’ opportunity to learn within the
public school system.
1 Chapter One was co-authored by Ann F. Allwarden, Phillip J. Potenziano, Sujan S. Talukdar, and Karen J. Zaleski.

2
While the reporting of disaggregated data by student subgroup ensures “a focus
on the extent to which an achievement gap exists” (Shaul & Ganson, 2005, p. 152), it
fails to provide district- and school-level leaders with the descriptive, diagnostic data
needed to identify key factors inhibiting student performance (Braun, 2005; Stecher,
2005). Identifying and understanding factors hindering student performance is critical
knowledge for leaders to cultivate as they work to address elements within their school or
district that may need to change if student learning is to improve. Boykin and Noguera
(2011) also emphasize the need for educators to develop a deep understanding of these
underlying complexities, warning:
Before undertaking efforts to eliminate the disparities in outcomes that, in most
districts, correspond to the race and class backgrounds of students...it is essential
that educators understand the nature of the gap and why it exists. Absent a clear
understanding of the causes of the gap, it is easy for schools to adopt strategies
that either do not work or, in some cases, even exacerbate the problem (p. 1).
Addressing long standing disparities in student performance calls for systemic
change, a theme that resounds throughout and across the work of many educational
practitioners, scholars, researchers, and advocacy groups. Igniting such a
transformational change requires “step[ping] outside the situation, make[ing] sense of it,
and reframe[ing] the problem” (Grogan & Shakeshaft, 2011, p. 54). Part of reframing the
problem involves a collective shift in thinking that moves away from viewing disparate
outcomes as an “achievement gap,” which too often reinforces the beliefs and attitudes of
some that the root cause of widely discrepant outcomes stems from underperforming
students’ lack of ability to achieve at high levels, and towards seeing disparate outcomes

3
as an “opportunity gap,” which places the onus for divergent outcomes squarely upon the
educational system. This essential shift in thinking emphasizes that disparities in
outcomes for students are absolutely “not a reflection of their potential nor their
abilities—but a direct result of denying them equitable supports and resources they need
to be fully engaged and succeed” (Schott Foundation for Public Education, 2012, p. 2). In
regards to the notion of providing equitable supports and resources, Katie Haycock,
director of The Education Trust, contributed the following quote to a press release
entitled “A Dream Deferred: 50 Years after Brown vs. Board of Education”:
We have never made good on the promise of equal opportunity in public
education....The fact is, we have organized our educational system in this country
so that we take children who have less to begin with and then turn around and
give them less in school, too. Indeed, we give these children less of all of the
things that both research and experience tell us make a difference (The Education
Trust, 2004).
In an effort to further explore the “opportunity gap” that exists for many students,
the purpose of this qualitative research study will be to explore how district- and school-
level leaders’ understanding of the “nature of the gap” influences the work of leadership
focused on addressing disparities in student performance related to race/ethnicity, class,
and/or disability. In this study, the “work of leadership” will be defined as “influencing
the community to face its problems….leaders mobilize people to face problems, and
communities make progress on problems because leaders challenge and help them do so”
(Heifetz, 1996, p. 14). Based on this description, challenging and helping communities to
make progress on addressing an identified problem is a key outcome of leadership.

4
Therefore, this study will examine specific ways leaders go about challenging and
helping their community to face the problem of student performance disparities (i.e.,
prompting changes in thinking, leveraging professional learning), as well as specific
aspects of the situation that may be contributing to the community’s collective capacity to
address student performance disparities (i.e., data analysis structures and routines,
relationships between district- and school-level leaders) (see Figure 1.1).
Research Questions
Facing problems often involves initiating change, and initiating change often
triggers cyclical patterns of acquiring knowledge and taking action (Gioia & Chittipeddi,
1991). In order to better understand the actions of district- and school-level leaders, the
following research will be explored:
● How do district- and school-level leaders understand disparities in student
performance related to race/ethnicity, class, and/or disability? How do these
understandings then influence the work of leadership focused on addressing
disparities in student performance related to race/ethnicity, class, and/or
disability (Allwarden, 2014; Potenziano, 2014; Talukdar, 2014; Zaleski,
2014)?
● What specific shifts in thinking do district- and school-level leaders identify
as needed before disparities in student performance related to race/ethnicity,
class, and/or disability can be effectively addressed? What specific strategies
do district- and school-level leaders use to prompt shifts in thinking about
disparities in student performance related to race/ethnicity, class, and/or
disability (Allwarden, 2014)?

5
● How do district-level leaders leverage professional learning for school-level
leaders as an action to further learn about, understand, and address the barriers
that may be inhibiting students’ opportunity to learn (Talukdar, 2014)?
● What data analysis structures and routines do district- and school-level leaders
perceive to be essential in understanding and addressing disparities in student
performance related to race/ethnicity, class, and/or disability, as well as
promoting students’ opportunity to learn (Potenziano, 2014)?
● How do interactions between district- and school-level leaders influence their
understanding of barriers to students’ opportunities to learn (Zaleski, 2014)?

6
Figure 1.1. Developing an In-depth Understanding of the Central Phenomenon
In general, this study aims to further inform the work of district- and school-level leaders
by helping them to examine and evaluate specific leadership practices that focus on
understanding and addressing disparities in student performance. Spillane and Diamond
(2007) point out that “knowing what leaders do is one thing, but a rich understanding of
how, why and when they do it, is essential if research is to contribute to improving the
practice of leading and managing schools” (p.5). Understanding how, why, and when to
engage in specific leadership practices will allow district- and school-level leaders to
Central Phenomenon: How district- and school-level leaders’ understanding of the “nature
of the gap” influences the work of leadership focused on addressing disparities in student performance related to race/ethnicity, class,
and/or disability
Ann: Strategies used to prompt changes in thinking that have been identified as
needed in order for disparities in student performance to be effectively addressed
Sujan: Endeavors to further learn about and understand factors that may be contributing to disparities in student
performance, the barriers that may be inhibiting students’ opportunity to learn
(i.e., professional learning)
Phil: The process of sustaining a focus on
addressing disparities in student performance by enhancing students’
opportunity to learn (i.e., data analysis structures and routines within the district)
Karen: The impact of interactions
between district- and school-level leaders on their understanding of barriers
inhibiting students’ opportunity to learn

7
more effectively and strategically address disparities in student performance—ultimately
enhancing students’ opportunity to learn.
The concept of opportunity to learn has an interesting, as well as controversial,
history. The following section will explore a range of policies and scholarship from
which the notion of opportunity to learn emerged and developed. This review of relevant
policies and scholarship also serves to illuminate the incredibly complex and challenging
work of leadership, specifically the work of leadership focused on understanding and
addressing the seemingly entrenched discrepancies in student performance.

8
CHAPTER 22: LITERATURE REVIEW
Historical Context
The release of A Nation at Risk (NAR) in 1983 marks a defining moment in the
history of American education, heralding the advent of standards-based educational
reform. While previous reform efforts worked to provide equal access to education for
minority groups (e.g., Brown v. Board of Education, Civil Rights Act of 1964,
Elementary and Secondary Education Act Amendments of 1966, Rehabilitation Act of
1973, Education for All Handicapped Children Act of 1975), the standards-based reform
movement focuses on excellence for all. Recommendations identified in the NAR report
included (a) developing rigorous and measurable standards, (b) lengthening the amount
of time spent in school, (c) increasing the requirements for high school graduation, (d)
improving teacher preparation and salaries, and (e) strengthening educational leadership
(NCEE, 1983). These recommendations, which called for a significant investment of
resources, were put into motion in an effort to regain “our once unchallenged
preeminence in commerce, industry, science, and technology innovation” (NCEE, 1983,
p. 1).
Published during the same year as NAR, “Excellence, Equity, and Equality” by
Thomas F. Green (1983) offers further insight into the thinking that surrounded and
informed policymakers’ decision-making processes during this time period. Green (1983)
explains how the quest for one educational ideal (i.e., excellence, equity, or equality) may
inhibit the development of another (p. 381). In particular, Green (1983) clarifies that the
principles of equality and equity differ in significant ways. For example, the ideal of 2 Chapter Two was co-authored by Ann F. Allwarden, Phillip J. Potenziano, Sujan S. Talukdar, and Karen J. Zaleski

9
equality focuses on “inputs” and denotes providing the same to all, disregarding
differences such as race/ethnicity, language, age, gender, and ability (Green, 1983;
Lindsey, Nuri Robins, & Terrell, 2009). Providing the same to all may at times create
unfair and unjust circumstances leading to greater levels of inequity and injustice. As a
result, there are times when “persons may be treated and rewarded unequally and also
justly” (Green, 1983, p. 324). While some examples of inequalities are in fact just,
inequities are never just. This is a critically important distinction. The ideal of
educational equity is based upon fair treatment through “justified inequality” (Green,
1983, p. 331). Equity acknowledges and promotes the notion of providing
accommodations “for differences so that the outcomes are the same for all individuals”
(Lindsey et al., 2009, p. 166).
After describing, comparing, and contrasting the ideals of excellence, equity, and
equality, Green (1983) goes on to carefully consider “which of the ideals should have
priority in the formulation of policy” (p. 318). He concludes:
Policies in pursuit of educational excellence are more likely to produce gains in
equity than policies in pursuit of equality are likely to produce gains in excellence.
Thus, it is better to pursue the ideal of equity through the pursuit of excellence
than to pursue excellence through the advancement of equality. If this is true, then
it is better to formulate policy for the advancement of excellence than to
formulate policy for the advancement of equality (p. 331).
Therefore, even though the NAR report was not particularly concerned with strengthening
educational equity (Harris & Herrington, 2006), Green (1993) concluded that through the
development of policies that pursue excellence of education, the interests of educational

10
equity will also be served. In their analysis of the implementation of NAR
recommendations, Harris and Herrington (2006) offer further support for Green’s
conclusion, stating that the “reforms recommended in NAR...had a significant positive
impact on achievement equity” (p. 213). Yet, initial gains credited to NAR
recommendations, which focused on providing more resources and better content, slowed
as the attention of policymakers turned to the development of an accountability system.
In the pursuit of excellence, the role of standards continued to gain strength,
culminating in the reauthorization of the Elementary and Secondary Education Act of
1965, now commonly referred to as the No Child Left Behind Act of 2001 (NCLB). With
bi-partisan support for the enactment of NCLB, standards-based educational reform
emphasizing standards, assessments, and accountability “was catapulted into national
policy” (Foorman & Nixon, 2006, p. 163). In order “to ensure that all children have a fair,
equal, and significant opportunity to obtain a high-quality education” (20 U.S.C. 6302 §
1001), NCLB established a test-based accountability system (Hamilton, 2003; Hamilton
& Koretz, 2002). Test-based accountability systems include four major components:
goals (i.e., rigorous standards), measures (i.e., high-stakes state tests), targets (i.e.,
adequate yearly progress), and consequences (i.e., school transfer options, supplemental
services, corrective actions, and restructuring) (Hamilton & Koretz, 2002).
Since the authorization of NCLB in 2001, there is little evidence to suggest that
the current accountability system is having a positive effect on long-standing equity
issues (Harris & Herrington, 2006). Even though the ultimate effectiveness of current
federal and state policy is yet unknown, policymakers continue to show unwavering
support for the pairing of rigorous standards to test-based accountability. Most recently,

11
support for this pairing was demonstrated by the provision of federal funding to the
assessment consortiums of SMARTER Balanced and Partnership for Assessment of
Readiness for College and Careers (PARCC) to support the development of a national
testing system that assesses the Common Core State Standards (CCSS) adopted by 45 out
of the 50 United States of America (Achieve, Inc., 2013; Massachusetts Department of
Elementary and Secondary Education, 2011; SMARTER Balanced Assessment
Consortium, 2012; U.S. Department of Education, 2013).
While efforts to raise standards and improve assessments deserve thoughtful
consideration in the “landscape of educational policy, they are not effective drivers
toward significantly changing the conditions for students who are in need….For a student,
or to a parent whose child is academically drowning, simply moving the shoreline further
away is not compelling” (Schott Foundation for Public Education, 2012, pp. 10-11).
Instead, attention must turn towards formulating “a support-based reform agenda focused
on creating the learning environment and condition in which...all children will have an
opportunity to learn and succeed” (Schott Foundation for Public Education, 2012, p. 11).
Opportunity to Learn (OTL)
The punitive nature of current policy and legislation increases pressure on school
leaders to address educational inequities and narrow existing achievement gaps—or
suffer the consequences of not making adequate yearly progress. This increased focus on
students’ achievement, as measured by standardized tests, heightens an awareness of and
concern for the consequences of high-stakes tests on students (Darling-Hammond, 1994,
2004; Guiton & Oakes, 1995; Porter, 1994, 1995). Critics of accountability measures
argue that it is unfair to hold schools and students accountable for content and skills they

12
have not had the opportunity to learn (Darling-Hammond, 1994, 2004; Guiton & Oakes,
1995; Traiman, 1993; Ysseldyke, Thurlow, & Shin, 1995). Therefore, while NCLB
outlines the legal responsibilities that accompany the current test-based accountability
system, there remain important ethical considerations regarding increased accountability
and high expectations.
Starratt (2003) argues “imposing…accountability systems without fully
addressing the issue of OTL is a violation of social justice” (p. 298). Have all students
had the opportunity to learn? Darling-Hammond (2007) emphatically disputes the notion
that standards and testing alone will improve schools or guarantee equitable opportunities
to learn, emphasizing that “the biggest problem with the NCLB act is that it mistakes
measuring schools for fixing them” (p. 9). Instead, school reform efforts need to focus on
ensuring access to high-quality teaching and providing equitable opportunities to learn
rigorous curriculum (Darling-Hammond, 2004, 2007).
Although a recurring theme of current school reform, a focus on truly providing
equitable opportunities to learn rigorous curriculum struggles to gain—and hold—center
stage. As a result, prominent individuals within the field of education have called for the
inclusion of data beyond results from high-stakes state tests. In her testimony for the
House Education and Labor Committee on the reauthorization of NCLB, Darling-
Hammond (2007) emphasized the need for multiple indicators of learning and school
performance in order to “build a more powerful engine for educational improvement by
understanding what is really going on with students and focusing on the elements of the
system that need to change if learning is to improve” (p. 72). Darling-Hammond goes on
to present and describe an indicator system that includes measures of (a) student learning
13
(e.g., state and local assessments), (b) additional student outcomes (e.g., data on
attendance, promotion/retention, and graduation rates), and (c) learning conditions (e.g.,
school climate, instructional practices).
Part of the intent behind the development of school process indicators, or a
complete “indicator system,” is that they offset the deficiencies arising from an over-
focus on school inputs (i.e., standards) and school outputs (i.e., test scores). School
process indicators measure “services the education system is actually providing” (Stecher,
2005, p. 4). The intent of school process indicators is to “monitor the nature of schooling:
the curriculum students study, the instruction teachers provide, and the environment in
which teaching and learning take place” (Porter, 1991, p. 13). Consequently, data from
school process indicators offer district- and school-level leaders opportunities to evaluate
their school reform efforts and strengthen their decision-making process, which could
ultimately lead to more effective and equitable school improvement planning and
implementation.
The Challenge of Defining and Measuring OTL
Threaded throughout much of the available research is the ongoing challenge of
defining and measuring a variable, or set of variables, which represent a valid and reliable
measure of a school’s contribution to students’ learning. The challenge resides in the fact
that school systems are inherently complex organizations. Therefore, identifying,
isolating, and measuring school factors that contribute to students’ learning remains an
on-going difficulty. As a result, the thinking of scholars and researchers who have
actively confronted these challenges differs considerably. In an effort to illustrate
noteworthy differences, two contrasting perspectives will be presented. The work of

14
Andrew Porter represents a traditional view of OTL, and the work of James Paul Gee
represents a sociocultural view of OTL.
A traditional perspective of OTL. Porter (1994) discusses how OTL has
historically been defined as “the enacted curriculum as experienced by the student” (p.
427). Porter (1994) also points out that enacted curriculum encompasses both the content
of instruction and “the pedagogical quality of instruction” (p. 427). “The content and
pedagogy of instruction are the two best school-controlled predictors of student
achievement” (Porter, 1994, p. 427). Therefore, Porter (1991, 1994) presents for
consideration a theoretical model that focuses on the content of instruction as a school
process indicator. The model predicts a causal relationship between the level of
curriculum alignment and student outcomes. In other words, stronger curriculum
alignment leads to better student outcomes.
Efforts aimed at strengthening curriculum alignment focus on increasing the
degree of alignment between (a) instruction, (b) standards, (c) assessments, (d)
curriculum materials and resources, and (e) professional development opportunities
(Porter, Smithson, Blank, & Zeidner, 2007). Yet, whereas efforts that focus on
curriculum alignment have the potential to significantly improve student outcomes
(Porter, 1991, 1994), “alignment is only good for education if the target for alignment is
of sufficient quality” (Porter, Smithson, Blank, & Zeidner, 2007, p. 29).
A sociocultural perspective of OTL. Gee (2008), in contrast, argues against
definitions of OTL based on a traditional view of knowledge, which focuses on
quantifying exposure to instructional content that is aligned with standards and
assessments. These definitions are built upon the assumption: If students are exposed to

15
the same instructional content, then they have been provided with an equal opportunity to
both (a) learn the instructional content and (b) demonstrate their learning on an
assessment. Embedded within this notion are underlying “complexities” (Gee, 2008, p.
77). These underlying complexities relate closely to the concept of equality and justice
discussed earlier. Providing equal opportunities does not ensure equal outcomes. Instead,
students need to be provided with equitable opportunities to learn instructional content
and demonstrate their learning. This shift in thinking significantly complicates measuring
students’ OTL. The difference between measuring equal and equitable opportunities to
learn is the difference between a teacher covering instructional content and a student
learning instructional content. Yet, if these underlying complexities are ignored, Gee
argues that the resulting measure of OTL offers an incomplete picture.
Gee (2008) defines OTL from a sociocultural perspective, which examines the
relationship between learners and their environment. Gee describes the “action
possibilities” (p. 81) that exist within learners’ environments. Gee then discusses the
impact of learners’ abilities, or lack thereof, to first recognize action possibilities
available to them, and then to convert those action possibilities into “actual and effective”
(p. 81) actions. This pairing of action possibilities with learners’ capacity to take
meaningful action broadens the traditional view of what it means to offer opportunities to
learn.
Common ground. The distinct perspectives embraced by Porter and Gee
illustrate the challenges and limitations that accompany defining and measuring OTL.
Yet, interesting to consider is the motivation behind both Porter and Gee’s work.
Although Porter and Gee provide very different ways of thinking about and

16
conceptualizing OTL, both share a common focus on examining what is happening in
schools. What is the nature of schooling, and how does it enhance or inhibit students’
opportunities to learn? This emphasis on the part of researchers and scholars to untangle
complexities inherent within the process of schooling provides further incentive for
looking more closely at the specific actions of district- and school-level leaders as they
grapple with these very challenges. Additionally, Boykin and Noguera (2011) put forth
for consideration: “It is essential that educators understand the nature of the gap and why
it exists” (p. 1). Therefore, this research study will focus on how district- and school-level
leaders’ understanding of the “nature of the gap” influences their actions as they work to
address disparities in student performance related to race/ethnicity, class, and/or disability,
including (a) the use of strategies to prompt shifts in thinking, (b) the leveraging of
professional learning, (c) the use of data analysis structure and routines, and (d) the
relationships between district- and school-level leaders.
Theoretical Framework
A useful theory helps you organize your data….A useful theory also illuminates
what you are seeing in your research. It draws your attention to particular events
or phenomena and sheds light on relationships that might otherwise go unnoticed
or misunderstood (Maxwell, 1998, p. 227).
The researchers of this study viewed the process of identifying and reviewing
potentially useful theories, which ultimately led to the final selection of a useful theory,
as an important part of developing an appropriate research design. The researchers
recognized that a useful theory would influence the methods of data collection and would
also become an important instrument for generalizing the results of the case study (Yin,

17
2009). Therefore, researchers believed the identification and selection of a useful theory
would further support and enhance their ability to thoroughly investigate the research
questions and draw valid and reliable conclusions. At the same time, the researchers
considered the disadvantages to using existing theory. Maxwell (2008), referring to the
work of Becker (1986), follows the benefits of using an existing theory with the
following warning:
Existing literature, and the assumptions embedded in it, can deform the way you
frame your research, causing you to overlook important ways of conceptualizing
your study or key implications of your results….Trying to fit your insights into
this established framework can deform your argument, weakening its logic and
making it harder for you to see what this new way of framing the phenomenon
might contribute (Maxwell, 2008, p. 227).
After reviewing both the beneficial and detrimental effects of using existing
theory, the advice of Becker (1986) ultimately guided the selection and implementation
of existing theory in this study. “‘A serious scholar ought routinely to inspect competing
ways of taking [sic] about the same subject matter,’ and warns ‘Use the literature, don’t
let it use you’” (Becker, 1986 as cited in Maxwell, 1998, p. 227). Therefore, the
researchers explored various existing frameworks in their efforts to both (a) identify an
existing theory that appropriately aligns with the research focus and will allow the
research team to reap the potential benefits and (b) examine existing theories in an effort
to help them “routinely inspect” competing ways of seeing and understanding the same
subject matter.
Since this research study will be examining district- and school-level leaders’

18
understandings and how these understandings then influence the work of leadership, the
researchers determined that the distributed leadership theoretical frame, with its focus on
interactions and the practice of leadership aligns most closely with this study (Spillane,
2006; Spillane, Halverson, & Diamond, 2004; Spillane, Healey & Parise, 2009). Spillane
(2006) states distributed leadership practice is defined as “a product of the joint
interactions of school leaders, followers, and aspects of their situation such as tools and
routines” (p. 3). Tools can be defined as outer portrayals of ideas that multiple leaders use
in their practice, such as lesson plans, student work samples, observation protocols, and
student assessment data (Spillane, 2006). Spillane (2012) uses the definition of routines
created by Feldman and Pentland (2003): “a repetitive, recognizable pattern of
interdependent actions, involving multiple actors” (p. 311). As this theoretical frame is
applied to the present study there will be focus on both leaders’ interactions and aspects
of their situations as defined from this perspective.
A distributed leadership perspective is primarily about interactions and leadership
practice (Spillane, 2006; Spillane, Halverson, & Diamond, 2004; Spillane, Healey &
Parise, 2009). According to this framework, decisions are not made in isolation, rather,
the interactions between many individuals involved in shared activities contribute to the
decision making process. “These collaborative dialogues are a key component of what
Spillane et al. (2004) have defined as the social distribution of leadership” (Scribner,
Sawyer, Watson, & Myers, 2007, p.71). Leadership from a distributed perspective is
defined as individuals, officially or unofficially assigned to leadership roles, taking
responsibility for the work of leadership (i.e., leadership activities) (Spillane, 2006).
Distributed leadership is more than leaders interacting and assuming responsibilities.

19
Instead, it is the interactions among these individuals that specifically contribute to the
practice of leadership that is critical to this theoretical framework (Harris, Leithwood,
Day, Sammons, & Hopkins, 2007; Spillane, 2006).
The distributed leadership framework highlights the potential and opportunity for
any individual within a school district to engage in the work of leadership, strengthening
the collective capacity of individuals to change and improve schools (Harris, 2002).
Examining this shared aspect of leadership work, as well as how it can be intentionally
distributed across individuals as they work to address disparities in student performance,
offers the researchers greater insight into the topic being studied as they seek to answer
the research questions.
The development of distributed leadership is also believed to enhance school
improvement by building the capacity of employees to achieve goals collectively
(Copland, 2003; Harris, 2004). However, it is important to note that school improvement
based on a distributed leadership model is not automatic, rather, “much depends on the
way in which leadership is distributed, how it is distributed and for what purpose” (Harris,
Leithwood, Day, Sammons, & Hopkins, 2007, p. 9). Specific consideration will be given
to these factors when examining leadership practices at the district and school levels.
Spillane (2006) and Spillane et al. (2004) further state that distributed leadership
offers an analytic perspective that is designed to allow school leaders to reflect on and
diagnose the distribution of leaders, the practices employed, and the impact on outcomes,
which enhances the design process. Spillane (2006) describes three governing design
principles:

20
• The practice of leadership should be a central focus in efforts to improve
school leadership because it is a more proximal cause of instructional
improvement than leadership roles, processes or structures.
• Intervening to improve leadership necessitates attention to interactions, not
just actions, because leadership practice takes shape in the interactions
between leaders and followers.
• Intervening to improve leadership practice requires attention to the design and
redesign of aspects of the situation, such as routines and tools, because the
situation helps define leadership practice (p. 93).
The distributed leadership framework will inform this study and assist in
identifying and assessing the routines and tools utilized in practice and distributed among
district- and school-level leaders as they work to address disparities in student
performance. Additionally, the framework will assist us in exploring the significant
nature of relations between district- and school-level leaders. This framework also
supports the individual portions of this study, which examine related but distinct aspects
of leadership work—cognitive shifts, professional learning, data structures and routines,
and leader interactions.

21
CHAPTER 33: METHODS
The focus of this study was on investigating how district- and school-level leaders
understand disparities in student performance due to race/ethnicity, class, and/or
disability, and how their understandings of those disparities then influence the work of
leadership focused on addressing disparities in student performance related to
race/ethnicity, class, and/or disability in a culturally diverse school district. Therefore, the
design of this research sought to answer the following questions:
1. How do district- and school-level leaders understand disparities in student
performance due to race/ethnicity, class, and/or disability?
2. How do these understandings then influence the work of leadership focused
on addressing disparities in student performance due to race/ethnicity, class,
and/or disability?
Because the researchers were interested in “not only the physical events and behavior
taking place, but also how the participants in [the] study make sense of these and how
their understandings influence their behavior” (Maxwell, 2008, p. 221), qualitative
methods offered the greatest opportunity to gain an in-depth understanding.
Qualitative Research
Maxwell (2008) outlines five broad research goals, which he believes are
especially well-suited to qualitative research. Three of the five goals identified by
Maxwell (2008) were particularly relevant to the researchers’ proposed inquiry:
3 Chapter Three was co-authored by Ann F. Allwarden, Phillip J. Potenziano, Sujan S. Talukdar, and Karen J. Zaleski

22
• Understanding the meaning, for participants in the study, of the events,
situations, and actions they are involved with, and of the accounts that they
give of their lives and experiences.
• Understanding the particular context within which the participants act and the
influence this context has on their actions.
• Understanding the processes by which events and actions take place (Maxwell,
2008, p. 221).
The researchers wanted to hear richly detailed, first-hand accounts of events, situations,
and actions that have influenced district- and school-level leaders’ understanding of
existing disparities in student performance. In other words, they wanted to “achieve an
understanding of how people make sense out of their lives, delineate the process (rather
than the outcome or product) of meaning-making, and describe how people interpret what
they experience” (Merriam, 2009, p. 14). Furthermore, the researchers hoped to gain
insight into how these understandings then influence the work of leadership focused on
addressing disparities in student performance. As a result, they believed the
characteristics, or features, which distinguish qualitative research, provided them with the
greatest opportunity to develop and share an in-depth understanding of the research focus.
Eisner (1991) describes six features that make a study qualitative. First,
qualitative studies are “field focused.” Researchers “observe, interview, record, describe,
interpret, and appraise settings as they are” (Eisner, 1991, p. 33). Next, researchers
consider themselves to be the main “instrument.” This is important because “the features
that count in a setting do not wear labels on their sleeves: they do not announce
themselves. Researchers must see what is to be seen…it is not a matter of checking

23
behaviors, but rather of perceiving their presence and interpreting their significance”
(Eisner, 1991, pp. 33-34). The third feature of a qualitative research identified by Eisner
(1991) is its “interpretive character.” Interpretive character refers to a researcher’s ability
to make sense of and explain a situation, including the significance it holds for those
involved in the situation. A fourth feature of qualitative research is “the use of expressive
language and the presence of voice in text….We display our signatures. Our signature
makes it clear that a person, not a machine, was behind the words” (Eisner, 1991, p. 36).
The fifth feature is its “attention to particulars.” This allows the readers to “gain a feeling
for the distinctive characteristics of the case. The classroom, the school, the teacher are
not lost to abstraction” (Eisner, 1991, p. 39). The final feature detailed by Eisner (1991)
involves the criteria used to evaluate qualitative research. “Qualitative research becomes
believable because of its coherence, insight, and instrumental utility” (Eisner, 1991, p.
39).
The researchers believed the six features of qualitative research, as described by
Eisner (1991), captured the type of inquiry in which they needed to engage to
successfully address both the research goals and questions. Under the umbrella of
qualitative research designs, the researchers selected the case study approach “which
focuses on understanding the dynamics present within single settings” (Eisenhardt, 1989,
p. 534).
Case Study
Creswell (2012) defines a case study as “an in-depth exploration of a bounded
system (e.g., activity, event, process, or individuals) based on extensive data collection
(Creswell, 2007). Bounded means that the case is separated out for research in terms of

24
time, place, or some physical boundaries” (p. 465). Yin (2008) explains “a case study is
an empirical inquiry that investigates a contemporary phenomenon within its real-life
context, especially when the boundaries between the phenomenon and context are not
clearly evident” (p. 18) (see Figure 3.1).
Case studies rely on multiple sources of evidence (Creswell, 2012), and both
single and multiple case studies are used in case study research (Yin, 2008). Yin (2008)
explains that case study research is quite challenging and should not be underestimated.
The single case study allows the researcher to devote more time to exploring the case in
depth (Creswell 1998, 2012). Conducting a single case study allowed the research team
the opportunity to fully analyze all aspects of the study in depth.
Sample and Participant Selection
The study began with the identification of a school district and superintendent
through purposeful sampling. Patton (2002) contends that “the logic and power of
purposeful sampling lies in selecting information-rich cases for study in depth.
Information-rich cases are those from which one can learn a great deal about issues of
central importance to the purpose of the inquiry” (p. 230). Similarly, Maxwell (1998)
describes purposeful sampling as “a strategy in which particular settings, persons, or
events are deliberately selected for the important information they can provide that
cannot be gotten as well from other choices” (p. 235). Merriam (2009) further explains
that “purposeful sampling is based on the assumption that the investigator wants to
discover, understand, and gain insight and therefore must select a sample from which the
most can be learned” (p. 77). As a result, purposeful sampling allows “for the

25
examination of cases that are critical for the theories that the study began with or that
have been subsequently developed” (Maxwell, 1998, p. 235). In other words, the
sampling for this study was theoretically-driven. “Choices of informants, episodes, and
interactions are being driven by a conceptual question, not by a concern for
‘representativeness’” (Miles & Huberman, 2004, p. 29). The researchers’ main goal was
to select a site and individuals who could help them gain an in-depth understanding of the
central phenomenon to be studied. Therefore, the researchers established criteria that
guided their selection of the school district. The following sections outline three “stages”
of sampling. During each successive stage, established criteria was applied to further
narrow the pool of potential research sites to include only districts that would provide a
strong case for this research study.
District selection: Stage one. Researchers visited the Department of Elementary
and Secondary Education's (DESE) website to review school district profiles. School
districts that met the following criteria were noted: (a) a K-12 public school district, (b) a
small to medium-sized school district (i.e., five to ten schools), and (c) a school district
with identifiable, measurable disparities in student performance related to race/ethnicity,
class and/or disability.
Figure 3.1. Single-case Study (Yin, 2008, p.18)
Context
Case

26
According to the National Assessment of Educational Progress (2012):
A difference in scores between two groups of students (for instance male and
female, Black and White, or Hispanic and White) can only be considered an
achievement gap if the difference is statistically significant, meaning larger than
the margin of error.
As such, in stage one of district selection the researchers adhered to this definition in
order to identify measurable disparities in student performance. When reviewing school
district profiles on the DESE website, particular attention was paid to MCAS scores and
graduation rates disaggregated by race/ethnicity, class, and/or disability. Further, the
researchers sought to understand disparities in performance across student sub-groups
within a single-school district. Disparities within the district were not compared to the
performance of students across the state or the nation.
The first criterion, a K-12 public school district, and the third criterion, a school
district with identifiable, measurable disparities in student performance related to
race/ethnicity, class and/or disability, relate directly to the educational issue that this
research study identified as concerning: On-going, statistically significant disparities raise
critical questions regarding educational equity and students’ opportunity to learn within
the public school system.
The second criterion, a small to medium-sized school district (i.e., five to ten
schools), was pre-determined to provide the research team with an opportunity to conduct
both comprehensive and in-depth interviews of district- and school-level leaders. Since
qualitative studies require researchers to “define aspects of your case(s) that you can
study within the limits of your time and means” (Miles & Huberman, 1994, p. 27), a

27
small to medium-sized district allowed the researchers to conduct in-depth interviews of
most of the district- and school-level leaders. Furthermore, interviewing most of the
district- and school-level leaders provided a richer, more insightful understanding of the
case, as well as increased the credibility of the study. Comparing and contrasting data
collected from individuals with different perspectives is a form of triangulation, which is
an important strategy for strengthening the internal validity of a research study (Merriam,
2009).
District selection: Stage two. During the second stage of sampling, the criteria
for selection shifted to identifying school districts whose administrators (a) believed they
were committed to addressing disparities in student performance related to race/ethnicity,
class, and/or disability and (b) thought they were actively engaged in work that focused
on eliminating performance gaps related to at least one of the following areas:
race/ethnicity, low income, and/or disability. The research team reviewed school district
websites for evidence relating to one or more of the following areas:
• The district thought it was investing resources (e.g., time, money, people) in
an effort to address disparities in student performance related to
race/ethnicity, class, and/or disability.
• The district thought it was implementing a strategic change effort that
targeted addressing student performance related to race/ethnicity, class,
and/or disability.
The criteria for this stage of sampling was directly related to the study’s
overarching research questions. In order for the researchers to examine how district- and
school-level leaders understand disparities in student performance due to race/ethnicity,

28
class, and/or disability, as well as how their understandings of these disparities then
influence the work of leadership focused on addressing disparities in student
performance, the school district ultimately selected believed that they were committed to
and actively engaged in addressing student performance disparities.
In addition to visiting and reviewing the websites of the school districts, the
strategy of reputational sampling was relied upon heavily during this stage. Reputational
sampling involves seeking out recommendations from experts or key informants (Miles
& Huberman, 1994). The researchers asked experts and key informants in the field (e.g.,
superintendents, principals, university professors, and researchers) to suggest school
districts that they believed met the pre-determined criteria. Therefore, while the review of
district websites served as a source of useful information, it was not a requirement for this
stage of sampling.
District selection: Stage three. Once the research team narrowed down a list of
potential research sites that met the pre-determined criteria, additional sampling was
conducted to ensure that the superintendents or assistant superintendents of the school
districts met the following established criteria: (a) had provided the district with stable,
consistent leadership and (b) thought they were providing school-level leaders with a
professional learning opportunity that focused on addressing student performance related
to race/ethnicity, class, and/or disability. With regard to stable and consistent district-
level leadership, the research team sought out a district that had either employed their
superintendent or assistant superintendent for at least two years and/or had a district-level
leadership team that had provided consistent leadership over the course of at least two
consecutive years in the area of addressing disparities related to race/ethnicity, class,

29
and/or disability.
Although the state and district websites provided evidence indicating that a
superintendent or assistant superintendent met the pre-determined criteria, the researchers
relied more heavily upon reputational sampling as a strategy during this stage. Once a
district that seemingly met all of the established criteria was identified, initial contact was
made with the superintendent. The initial contact was made by an individual who was
known to the research team and was also a colleague of the superintendent. After talking
with the superintendent, this individual connected the research team with the
superintendent through email. Through email the superintendent asked the research team
to send a description of what the proposed study would entail. A member of the research
team responded:
Thank you for your email and interest in our study. On behalf of our research
team, I have attached a brief overview of what our study entails. We would love
the opportunity to discuss this with you, and it is our hope to set up a date/time to
meet with you at your convenience. We look forward to your response and please
do not hesitate to contact us with any specific questions you may have regarding
our study.
The overview sent to the superintendent included (a) the study’s research questions, (b)
the purpose of the research study, (c) a description of how and what data would be
collected, and (d) the amount of time research participants would need to commit to the
study. After the superintendent read the overview of the proposed study and indicated
that he was interested in talking further with the research team, the team provided the
superintendent with a number of potential meeting dates and times, the superintendent

30
selected a date and time that worked best for him and a face-to-face meeting was
scheduled.
Three out of the four researchers were able to meet with the superintendent. At
this meeting the superintendent began by sharing some of his personal history, including
where he grew up and where he had lived as an adult. He expressed that living in
different areas of the state strengthened his lens and passion to serve all students
regardless of their socio-economic background. The superintendent then went on to
briefly describe the current focus of the district- and school-level leaders’ work. The
superintendent described the role of data in their efforts to improve student achievement.
He also emphasized the importance of collaboration between district- and school-level
leaders. Lastly, the superintendent expressed interest in participating in the proposed
study but stated he would need to consult with the leaders making up the Full
Administrative Council (FADCO), as they would be asked to participate.
The superintendent asked the research team to attend the next FADCO meeting
and present to the other district- and school-level leaders. The research team agreed and
returned to the district two weeks later to provide members of FADCO an overview of
the proposed study. After the presentation, the superintendent asked the members of
FADCO to let him know if they had any hesitations or questions. He later sent an email
to the research team that read “I asked people to get back to me if they had any
hesitations or questions and the only feedback I have gotten are yes.”
School-level leaders and additional district-level leaders. The strategies of
purposeful and snowball sampling were used to identify school-level leaders, as well as
additional district-level leaders. All building principals were asked to participate in the

31
study. In order to identify additional district-level leaders to interview, the researchers
relied on the superintendent and assistant superintendent to recommend individuals
whom they felt could best describe efforts aimed at impacting students’ opportunity to
learn and performance gaps. This strategy of sampling is referred to as snowball sampling.
Creswell (2012) defines snowball sampling as “sampling procedure in which the
researcher asks participants to identify other participants to become members of the
sample” (p. 628). Merriam (2009) further elaborates by stating that snowball sampling
“involves locating a few key participants who easily meet the criteria you have
established for participation in the study. As you interview these key participants [i.e. the
superintendent and the assistant superintendent] you ask each one to refer you to other
participants” (p. 79). Thus, the interview snowball grew to include additional district-
level leaders who played a critical role in efforts aimed at understanding and addressing
barriers inhibiting students’ opportunity to learn.
Additionally, under specific conditions the use of snowball sampling would have
been extended. For example, if a building principal had stated to an interviewer that he or
she should interview another building-level leader because this individual played a
critical role in the school’s efforts to understand and address barriers inhibiting students’
opportunity to learn, the researchers would have considered extending the use of
snowball sampling. This recommendation would have needed be freely offered during the
interview. The researcher would not have actively sought out this information.
Furthermore, the research team would have met to discuss and debate the usefulness and
appropriateness of including the recommended interviewee in the sample. Using
snowball sampling to reach additional individuals that otherwise would have been

32
excluded would have potentially allowed the research team to gain further information
that may have helped strengthen the triangulation of interview data. Furthermore, the use
of snowball sampling aligned with both the type of research being conducted (i.e.,
qualitative) and the study’s theoretical framework (i.e., distributed leadership) because it
would have used the social or personal knowledge of the individual being interviewed
(Cohen, Manion, & Morrison, 2011). Although extending the use of snowball sampling
was part of the initial research design, none of the participants interviewed recommended
interviewing individuals beyond central office leaders and building principals.
Data Collection
Data was collected primarily through semi-structured interviews and then
supplemented by the gathering of documents recommended by participants during their
interviews.
Interview. DeMarrais (2004) defines the research interview as “a process in
which a researcher and participant engage in a conversation focused on questions related
to a research study” (p. 55). Merriam (2009) provides a continuum of three types of
interviews: highly structured/standardized, semi-structured, and unstructured/informal (p.
89). Open-ended semi-structured individual interviews served as the primary method of
data collection for this case study. Falling in the middle of the “interview structure
continuum” (Merriam, 2009), a semi-structured interview method provides a researcher
the opportunity “to enter into the other person’s perspective” (Patton, 2002, p. 341), and
to respond flexibly to new information that may surface related to topic being studied
(Merriam, 2009).

33
Semi-structured interviews allow the opportunity to digress from the primary
question and probe a response to understand more clearly what is seen as a
provocative remark on the part of the interviewee. Such remarks may come in two
categories: (1) the researcher has not heard that position stated before or (2) what
has been said seems to be in contradiction to comments others have made
previously (James, Milenkiewicz, & Bucknam, 2008, pp. 73).
While semi-structured interviews allowed for flexibility, they also provided for some
uniformity among the researchers during data gathering. Additionally, having a pre-
determined list of questions enhanced the researchers’ ability to efficiently gather needed
information. More open-ended, less focused interview protocols can lead to collecting
“too much superfluous information…An overload of data will compromise the efficiency
and power of the analysis” (Miles & Huberman, 1994, p. 35). Interviews assisted
researchers in answering the study’s overarching research questions, as well as provided
insight into the researchers’ individual portions of the study. Figure 3.2 provides a
conceptual design that illustrates the order of interviewing. The interview process also
assisted the researchers in determining “what services the education system is actually
providing” (Stecher, 2005, p.4).
Interviews were conducted in-person within the school district setting, in as natural an
environment as possible, most frequently at each interviewee’s office, unless an alternate
location was mutually agreed upon. Privacy was a factor in determining the location to
ensure the session was uninterrupted, and in the hopes that this would enhance the
participants’ attentiveness and willingness to respond in a fashion that was open and
honest. In an effort to minimize intrusion upon the interviewees’ ability to perform their
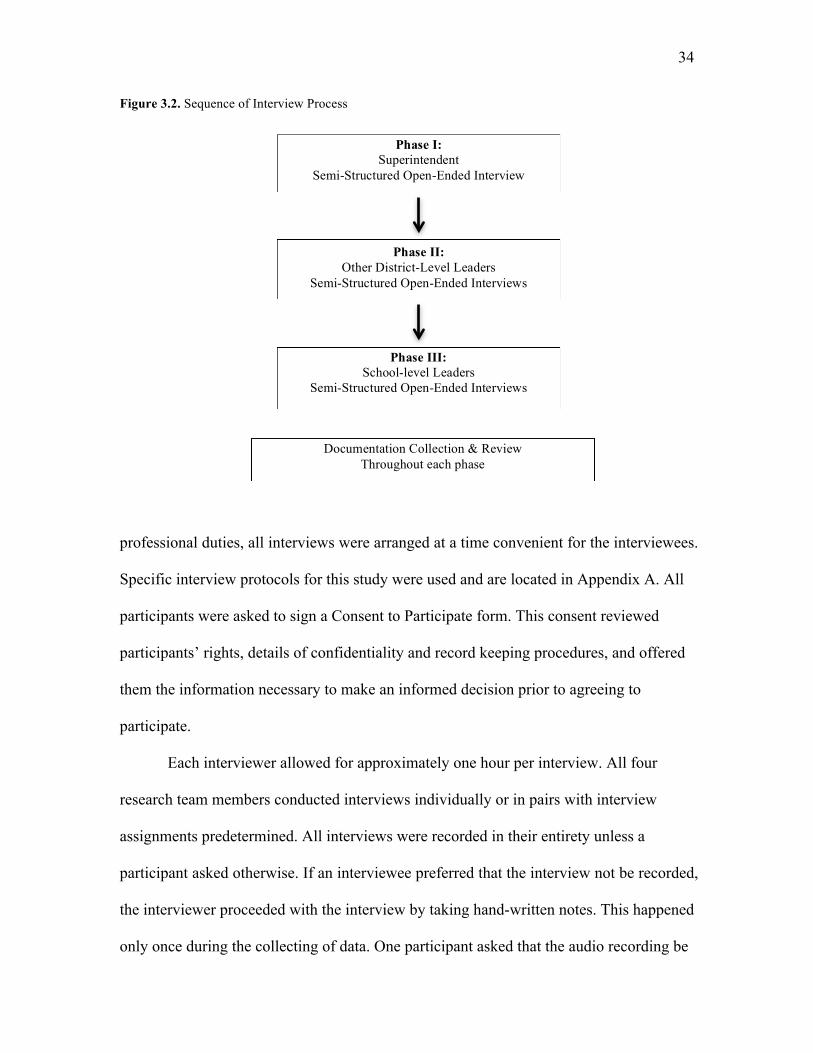
34
Figure 3.2. Sequence of Interview Process
professional duties, all interviews were arranged at a time convenient for the interviewees.
Specific interview protocols for this study were used and are located in Appendix A. All
participants were asked to sign a Consent to Participate form. This consent reviewed
participants’ rights, details of confidentiality and record keeping procedures, and offered
them the information necessary to make an informed decision prior to agreeing to
participate.
Each interviewer allowed for approximately one hour per interview. All four
research team members conducted interviews individually or in pairs with interview
assignments predetermined. All interviews were recorded in their entirety unless a
participant asked otherwise. If an interviewee preferred that the interview not be recorded,
the interviewer proceeded with the interview by taking hand-written notes. This happened
only once during the collecting of data. One participant asked that the audio recording be
Phase I: Superintendent
Semi-Structured Open-Ended Interview
Phase II: Other District-Level Leaders
Semi-Structured Open-Ended Interviews
Phase III: School-level Leaders
Semi-Structured Open-Ended Interviews
Documentation Collection & Review Throughout each phase

35
stopped in the middle of an interview. The participant wanted to share information that he
or she was not comfortable having audio recorded. The participant agreed to the
interviewer taking notes by hand during this portion of the interview. Following this
portion of the interview, the recording of audio resumed for the remainder of the
interview.
The research team piloted the research questions. Each member of the research
team piloted the interview protocol a minimum of two times and reported back to the
research team on what was learned from those interviews and how to improve upon them
(Merriam, 2009). Merriam (2009) stresses the importance of piloting interview questions:
Not only do you get some practicing interviewing, but you also quickly learn
which questions are confusing and need rewording, which questions yield useless
data, and which questions, suggested by your respondents, you should have
thought to include in the first place” (p. 95).
Research team members used the strategy of conducting pilot interviews in pairs to
ensure that the interview protocol was sufficiently covered, as well as to ensure that there
was consistency across researchers regarding how interviews were conducted. In addition,
during the interview piloting process, the researchers attempted to mitigate any issues
that the presence of a digital voice recorder may have caused by practicing with the
recording devices they planned to use (McMillian, 2004). A professional transcriptionist,
who was required to sign a confidentiality agreement, was hired to transcribe some of the
interview recordings. In an effort to further strengthen the reliability of the study,
secondary sources of data were also sought out, including archived schools documents
(Creswell, 2012).

36
Documents. The researchers used purposeful sampling for the identification and
collection of relevant school and district documents. Creswell (2012) extols that the use
of “documents represent a good source for text data for a qualitative study” (p. 223).
Furthermore, Stake (1995) states that using a variety of data sources such as archival
documents will reduce the potential for misinterpretation and help produce greater
reliability. Yin (2009) also states the benefit of using documents in case studies,
explaining that documents are not the case study but rather help explain and corroborate
details of the study.
In an effort to collect relevant documents, each participant was asked during his
or her interview if there were specific documents that he or she viewed as particularly
germane to the researchers’ areas of focus (i.e., prompting shifts in thinking, professional
learning, data analysis structures and routines, interactions) and would recommend that
the researchers collect for analysis. Researchers also sought out additional documents that
they believed were pertinent to the case, including:
• District Improvement Plan
• School Improvement Plans
• Documents outlining and detailing professional learning opportunities relevant to
the study topic offered by the district
The collection and analysis of document data offered researchers the opportunity to
crosscheck and verify interviewee responses, as well as the conclusions being drawn by
the researchers as they engaged in data analysis. This process of verification supported
the triangulation of data and thus strengthened the trustworthiness of the study’s final
conclusions and findings.

37
Data Analysis
This research study followed the three components of data analysis described by
Miles and Huberman (1994): (a) data reduction, (b) data display, and (c) conclusion
drawing/ verification.
Data reduction. The first component of data analysis, data reduction, involves
“selecting, focusing, simplifying, abstracting, and transforming the data” (Miles &
Huberman, 1994, p. 10). For this study, the process of data reduction began with the
identification of a theoretical framework (i.e., distributed leadership) and the
development of specific research questions (i.e., How do district- and school-level leaders
understand disparities in student performance related to race/ethnicity, class, and/or
disability? How do these understandings then influence the work of leadership focused on
addressing disparities in student performance related to race/ethnicity, class, and/or
disability?). The process of data reduction continued with the selection of specific
strategies for sampling (i.e., criterion-based selection and snowball sampling). Decisions
regarding the choice of a theoretical framework, the development of research questions,
and the selection of sampling strategies served as important mechanisms for focusing and
narrowing (or reducing) the data that was ultimately collected. Miles and Huberman
(1994) refer to these decisions as “anticipatory data reduction” (p. 10) because they are
made before the collection of data has begun.
The process of data reduction continued throughout the study. During (and after)
the data collection period of the study, data reduction occurred as researchers engaged in
the coding process. Creswell (2011) defines coding as a “qualitative research process in
which the researcher makes sense out of text data, divides it into text or image segments,

38
labels the segments, examines codes for overlap and redundancy, and collapses these
codes into themes” (p. 618). Similarly, Miles and Huberman (1994) describe coding as “a
way of forcing you to understand what is still unclear, by putting names on incidents and
events, trying to cluster them, communicating with others around some commonly held
ideas, and trying out enveloping concepts against a wave of observations and
conversations” (p. 62). In other words, as researchers engaged in the process of coding,
they identified and assigned labels to “chunks,” in essence highlighting and extracting
sections of data that seemed particularly relevant. The process of coding, therefore, was
inherently analytical and served as another important mechanism for further reducing the
data collected.
Creating codes. Prior to entering the research site, each researcher created a “start
list” of codes based on the study’s theoretical framework and their specific research
questions. In order to ensure the consistent application of codes across interview
transcripts and documents each researcher developed clear definitions for each of their
master codes (Miles & Huberman, 1994). Definitions for master codes were theoretically
based and drawn from the literature. The analysis of collected data began with the coding
of the transcript from the interview with the superintendent. The process of coding
continued through subsequent phases of analyzing different “sets” of interviews (i.e.,
district-level leaders, school-level leaders). These successive sets of data were analyzed
using the constant comparative method. The constant comparative method “involves
comparing one segment of data with another to determine similarities and differences.
Data are grouped together on a similar dimension. The dimension is tentatively given a
name; it then becomes a category” (Merriam, 2009, p. 30). The use of the constant
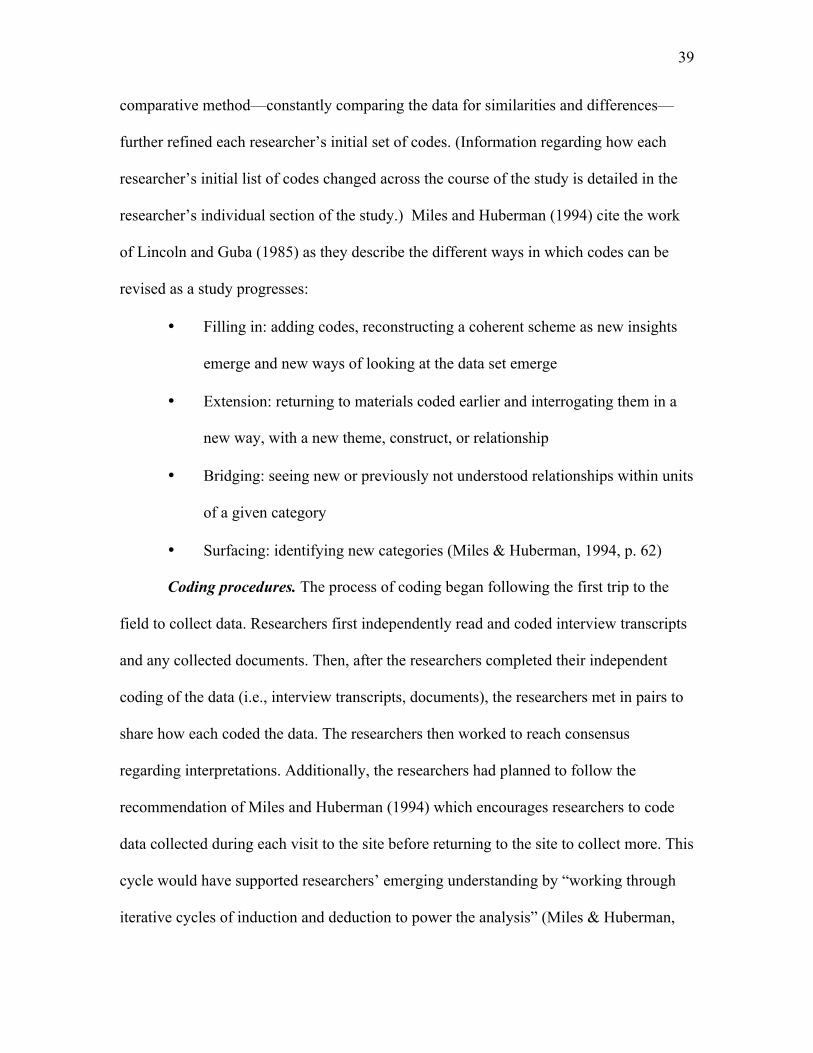
39
comparative method—constantly comparing the data for similarities and differences—
further refined each researcher’s initial set of codes. (Information regarding how each
researcher’s initial list of codes changed across the course of the study is detailed in the
researcher’s individual section of the study.) Miles and Huberman (1994) cite the work
of Lincoln and Guba (1985) as they describe the different ways in which codes can be
revised as a study progresses:
• Filling in: adding codes, reconstructing a coherent scheme as new insights
emerge and new ways of looking at the data set emerge
• Extension: returning to materials coded earlier and interrogating them in a
new way, with a new theme, construct, or relationship
• Bridging: seeing new or previously not understood relationships within units
of a given category
• Surfacing: identifying new categories (Miles & Huberman, 1994, p. 62)
Coding procedures. The process of coding began following the first trip to the
field to collect data. Researchers first independently read and coded interview transcripts
and any collected documents. Then, after the researchers completed their independent
coding of the data (i.e., interview transcripts, documents), the researchers met in pairs to
share how each coded the data. The researchers then worked to reach consensus
regarding interpretations. Additionally, the researchers had planned to follow the
recommendation of Miles and Huberman (1994) which encourages researchers to code
data collected during each visit to the site before returning to the site to collect more. This
cycle would have supported researchers’ emerging understanding by “working through
iterative cycles of induction and deduction to power the analysis” (Miles & Huberman,

40
1994, p. 65). The scheduling of interviews did not provide the researchers enough time to
code a data set before returning to the field. Yet, following the collection of data, coding
procedures still involved iterative cycles of induction and deduction as the researchers
refined and revised their list of codes and then recoded previously coded data.
Marginal remarks. As researchers coded multiple pages of text, they interspersed
coding with written remarks in the “margins.” Since researchers used web-based
qualitative research software, marginal remarks were recorded by clicking on and
opening a comment window. These remarks included the researchers’ thoughts and
reactions to the data. Miles and Huberman (1994) emphasize that “these ideas are
important; they suggest new interpretations, leads, connections with other parts of the
data” (p. 67). Miles and Huberman (1994) also suggest that recording marginal notes may
“point to important issues that a given code may be missing or blurring, suggesting
revisions in the coding scheme” (p. 67). In addition to noting marginal remarks early in
the coding cycle, researchers were also able to retrieve and review “chunks” of text that
share a common code and add new marginal remarks.
Memoing. Glaser (1978) describes memoing as “the theorizing write-up of ideas
about codes and their relationships as they strike the analyst while coding” (p. 83). The
content and focus of memos varies. Memos can be written when a researcher is confused
or surprised. Memos can also be written in response to another researcher’s memo,
sharing an alternative perspective. Other memos may focus on proposing a new code (or
set of codes). Memos are frequently written to explore emerging patterns and themes.
While the content and focus of memos varies, the writing of each memo provides

41
researchers important opportunities to gain further clarity and insight. The researchers of
this study followed the memoing advice of Miles and Huberman (1994):
• Always give top priority to memoing.
• Memoing should begin as soon as the first field data start coming in, and
should usually continue until right up to production of the final report.
• Keep memos “sortable.”
• Memos are about ideas…Simply recounting data examples is not enough.
• Don’t standardize memo formats or types, especially in a multi-researcher
study.
Data storage and management. As data was collected, it was compiled into a
“case study database” (Yin, 2008). A case study database refers to the collection and
organization of data. The storage and organization of the data was critically important. A
well-organized case study database allowed for the easy retrieval of relevant data during
analysis. For this reason, a “code-and-retrieve” computer software program was used to
ensure the development of a well-organized case study database. Code-and-retrieve
programs allowed researchers to “divide text into segments or chunks, attach codes, and
find and display all instances of coded chunks (or combinations of coded chunks)” (Miles
& Huberman, 1994, p. 312). This coding scheme allowed for the easy retrieval of
relevant data to support the work of determining (a) the frequency of themes and patterns,
(b) the intersection of themes and patterns, and (c) the comparisons of themes and
patterns.
Data displays. The second component of data analysis, data displays, involves
displaying the data as “an organized, compressed, assembly of information that permits

42
conclusion drawing and action” (Miles & Huberman, 1994, p. 11). The use of data
displays further supported the work of comparing and contrasting data, identifying
patterns and themes, detecting trends, and ultimately enabling researchers to draw valid
conclusions. The process of creating data displays involved transforming multiple pages
of text into a visual format that fit on a single page and displayed data in ways that:
• show the data and analysis in one place,
• allow the analyst to see where further analyses are called for,
• make it easier to compare different data sets, and
• permit direct use of the results in a report, improving the credibility of
conclusions drawn (Miles & Huberman, 1994, p. 92).
The researchers of this study used data displays within their individual research sections.
Conclusion drawing and verification. The third component of data analysis,
conclusion drawing and verification, involves deciding “what things mean…noting
regularities, patterns, explanations, possible configurations, casual flows, and
propositions” (Miles & Huberman, 1994, p. 11). Once data has been entered into a data
display, several tactics can be used to both draw and verify conclusions. The researchers
of this study began by applying tactics appropriate for drawing initial conclusions; the
researchers then selected from a different set of tactics to verify those conclusions. Table
3.1 lists the range of tactics used by the research team as they worked to draw and verify
both individual and group conclusions. The tactics used by individual researchers as they
worked to answer questions specific to their portion of the research study are further
detailed within each researcher’s individual section. The main tactics used by the
research team as they worked together to answer the research study’s overarching

43
Table 3.1
Tactics for Drawing and Verifying Conclusions (Miles & Huberman, 1994)
Tactics for Drawing Conclusions Description
Noting patterns, themes Note recurring patterns, themes, or “gestalts” (p. 246)
Seeing plausibility Jot down what some plausible conclusions seem to be, and then check them with other tactics (p. 248)
Clustering Grouping and then conceptualizing objects that have similar patterns of characteristics (p. 249)
Counting “See” the general drift of the data more easily and rapidly by looking at distribution (p. 253)
Making contrasts/comparisons How does X differ from Y (p. 254)
Noting relations between variables Once you are reasonably clear about what variables might be in play in a situation….How do they relate to each other (p. 257)
Tactics for Verifying Conclusions Description
Triangulating to ensure reliability and validity
Triangulating: • By method (i.e., interview, document) • By source (i.e., persons to be interviewed) • By researcher (i.e., investigator A, B, C, and D) (p. 267)
Following up on surprises Follow up on surprises: • Reflect on the surprise to surface your violated theory • Consider how to revise it • Look for evidence to support your revision (p. 271)
Making if-then tests Make if-then statements on data about which you: • Are increasingly puzzled or blocked • Feel on the brink of an Aha! (p.272)
Checking out rival explanations During the final analysis, first check out the merits of the “next best” explanation you or others can think of as an alternative to the one you preferred at the end of the field work (p. 275).
questions, which involved drawing and verifying conclusions based on the findings from
each of the researchers’ individual sections, included (a) noting patterns and themes, (b)
making comparisons and contrasts, (c) triangulating to ensure reliability and validity.
Ultimately, the researchers aimed to draw conclusions that have been rigorously tested

44
for “their plausibility, their sturdiness, their ‘confirmability’—that is, their validity”
(Miles & Huberman, 1994, p.11).
Traditional analysis sequence. The process of data analysis followed a slightly
modified “traditional analysis sequence” (see Figures 3.3 and 3.4). The traditional
analysis sequence includes (a) conducting interviews, (b) transcribing the interviews, (c)
coding the interview data, (d) displaying the interview data, (e) drawing conclusions, (f)
creating an outline for the final report, and (g) writing the final report. Whereas a
traditional data analysis sequence involves multiple cycles of conducting interviews,
transcribing interviews, coding data, displaying data, and drawing conclusions before
moving on to creating an outline and writing the final report, the sequence of this study
involved multiple cycles of coding data, displaying data, and drawing conclusions before
moving on to creating an outline and writing the final report.
This modification to the traditional data analysis sequence resulted from the
limited amount of time available between trips to the field. The research team conducted
three full days of interviews. The three days were evenly spread across a three-week time
span. The researchers discovered that a week was not enough time to transcribe the data
(write up the data), code the data, display the data, and draw conclusions before the next
trip into the field. Therefore, all the data was collected and written up before any
significant coding, displaying, or conclusion drawing occurred. Yet, valuable and
iterative cycles of induction and deduction occurred as researchers refined and revised
their list of codes which led to the recoding of previously coded data.
The Use of Triangulation
Researchers of this study applied two distinct understandings regarding the role

45
Figure 3.3. Traditional Data Analysis Sequence (Miles & Huberman, 1994, p. 85)
Figure 3.4. Modified Traditional Data Analysis Sequence
and purpose of triangulation. The first understanding views triangulation as a way to
ensure reliability and validity. In qualitative studies, reliability refers to “whether the
results are consistent with the data collected” (Merriam, 2009, p. 221). Lincoln and Guba
(1985) describe reliability in terms of “dependability” and “consistency.” Ultimately, the
reliability of a study depends on the likelihood that others, “outsiders,” would draw the
same conclusions given the data collected (Merriam, 2009). If yes, then the study’s
results are consistent with the data collected and therefore reliable, as in dependable
(Lincoln & Guba, 1985). Validity, in qualitative studies, speaks to the credibility of a
study’s findings (Merriam, 2009). “Do the findings capture what is really there”
(Merriam, 2009, p. 213)? Do the findings emanate accuracy and truthfulness? If yes, then
the study’s results are considered valid, as in credible.
The second understanding views triangulation “less as a strategy for validating
results and procedures than an alternative to validation…which increases scope, depth,
and consistency” (Flick, 1998, p. 230 as cited by Erzberger & Kelle, 2003, p. 461).
Within the researchers’ individual sections, the first understanding of triangulation was
Code Data
[iterate]
Collect Data
Write-up Data
Display Data
Draw Conclusions
Create Outline
Write Report
[iterate]
Collect Data
Write-up Data
Code Data
Display Data
Draw Conclusions
Create Outline
Write Report

46
applied (see the following section entitled “Reliability and Validity”). Then, as the
researchers brought together the understandings and findings that emerged from their
individual sections in order to address the overarching research questions of the larger
study, the researchers shifted to apply the second understanding of triangulation. At this
point, the work of the researchers focused on searching for complementary results based
on the “complementarity model of triangulation” (Erzberger & Kelle, 2003, p.469),
meaning, that as the researchers investigated the central phenomenon of the larger study
“different methods highlight different aspects of it” (Erzberger & Kelle, 2003, p.469). As
a result, the researchers reviewed and examined understandings and findings from the
individual sections looking for findings that complemented each other, ultimately
resulting in a stronger depiction of the topics being analyzed (Erzberger & Kelle, 2003).
Reliability and Validity
It is critical to ensure the trustworthiness of findings based on the information
gathered and data analysis. Merriam (2009) states “the most well-known strategy to shore
up the internal validity of a study is what is known as triangulation” (p. 215). Creswell
(2012) also emphasizes the process of triangulation as ensuring the validity of the
findings. Both Merriam (2009) and Miles and Huberman (1994) describe triangulation
from Denzin’s (1978) description of the four forms of triangulation, including: by method,
by source, by researcher, or by theory. Each form of triangulation serves to verify the
study’s findings. The researchers of this study applied the following forms of
triangulation within their individual sections: (a) by method (i.e., interviews and
documents), (b) by source (i.e., multiple district- and school-level leaders), and (c) by
researcher (i.e., multiple researchers collecting and analyzing data).

47
The process of “check coding” was also used to ensure reliability (Miles &
Huberman, 1994, p. 64). Check coding occurs when more than one researcher codes data,
then they review and discuss the results together. Once the data was accurately coded and
triangulated, the data was interpreted and written in narrative form (Creswell, 2012;
Merriam, 2009).
Researcher Bias and Assumptions
This research team consisted of four doctoral candidates who were all working as
administrators in public school districts that were attempting to address disparities in
student performance. Each of districts had different approaches to this work and as a
result the researchers brought different experiences and perspectives to the analysis
process. Because of the varying backgrounds and viewpoints, it is important to note that
the researchers may have shared certain characteristics with the research participants. As
a result, the researchers may have brought bias regarding the interpretation of leaders’
understanding about the nature of the gap and related actions. Merriam (2009) states that
researchers are the primary instrument in the data collection and analysis process,
therefore, biases may influence the research study. Rather than trying to remove the
biases, it is essential to “identify them and monitor them as to how they may be shaping
the collection and interpretation of data” (Merriam, 2009, p.15). Ultimately, this required
the researchers to rely solely on the data gathered rather than their bias and assumptions
when analyzing the data.

48
CHAPTER 44: DESCRIPTION
The city of New Hope, Massachusetts was first settled in the 1700s. The city is
positioned on the New Hope River and a railway. Comprised of numerous one-way
streets, bridges, and hills, New Hope is divided into several diverse neighborhoods that
each have a specific ethnic identity (City of New Hope, 2013). Upon entering the city of
New Hope, visitors encounter the downtown area which is intersected by the river.
A cluster of human service agencies line Main Street and are geared toward
providing services in the city and nearby surrounding towns. The downtown business
district is deprived of hustle and bustle, foot traffic, and commerce. This once prosperous
nineteenth century manufacturing center now consists of numerous derelict factories
undergoing conversion for alternate uses such as businesses and residences. The city
shows further signs of a troubled economy with many vacant storefronts and apparently
abandoned buildings throughout. Despite this sense of hardship, there are undercurrents
of revitalization in the city. There is an acknowledgement of the arts in the city in the
form of sculptures, and there are numerous restaurants catering to an ethnically diverse
palette. A local college recently accredited with University status lies in the heart of the
city.
New Hope is governed by a Mayor and is populated with over 40,000 individuals
and up to 10,000 families residing in multi-family and single family homes. There is a
50% homeownership rate in the city of New Hope. According to the United States 2010
Census Bureau, the racial makeup of the city was roughly 80% White, 5% African
American, 0.3% Native American, 4% Asian, 0% Pacific Islander, 9% from another race,
4 Chapter Four was co-authored by Ann F. Allwarden, Phillip J. Potenziano, Sujan S. Talukdar, and Karen J. Zaleski

49
and 4% from two or more races and more than 20% of the population is made up of
Hispanic or Latinos of any race. English is spoken as the first language in more than 75%
of the homes. The median income for a household in the city averaged just below
$50,000 and the median income for a family was slightly below $60,000 (United States
Census Bureau, 2010). About 15% of families and 19% of the population were below the
poverty line which included almost 30% of those being under age 18 and roughly 13% of
those ages 65 or over (United States Census Bureau, 2010). As of 2011 the crime rate
was estimated at roughly 400.1 compared with the U.S. average of 213.6 (City-Data,
2011). New Hope has the highest crime rate in comparison to the eight surrounding
towns (City-Data, 2011). The New Hope Police Department responds to over 40,000
incidents each year.
Overview of the New Hope Public School District
The city of New Hope has eight public schools, five private/parochial schools, a
regional vocational technical school, and a charter school that services students from the
city of New Hope (City of New Hope, 2013). Students are registered and assigned to the
public schools based on their primary residence; however, parents have the option of
requesting their child’s school assignment based on their top 3 choices of schools within
the district (City of New Hope, 2013). Students are also accepted into the district by
school choice. According to the Massachusetts Department of Elementary and
Secondary Education (2013) school choice gives parents the option of seeking school
enrollment for their children in a school district outside of their hometown. All
application considerations are processed by the New Hope School District’s Director of
ELL who also handles registration for the district. Students are accepted into the only

50
charter school in the district via a lottery.
The public school district serves approximately 4,900 students in grades K-12 and
of those, approximately 76% qualify for free and reduced lunch and 21% have
individualized special education programs. The student population is identified racially as
44.6% Hispanic, 38.2% White, 5.8% Black/African American, 5.5% Asian, 5.7% Multi-
Race, Non-Hispanic and the remaining Native American or Native Hawaiian, Pacific
Islander. There are different home languages, and 32% of the students speak a first
language other than English.
Using 2012-2013 district data, there are approximately 282 full time equivalent
teachers in the district. Of those, approximately 258 are White, 16 Hispanic, 5
Black/African American, 2 Asian and 1 Multi-Race Non-Hispanic, with the gender
breakdown being 221 females and 61 males. The complete district wide staffing data by
race, ethnicity, and gender by full time equivalents is as follows: 602 White, 39 Hispanic,
15 African American/Black, three Asian, one Multi Race Non-Hispanic, 116 males and
544 females for a total of 660 staff.
The New Hope School District has eight district-level leaders and eight school-level
leaders (i.e., principals). Interviews were conducted with all eight of the district-level
leaders and six out of the eight school-level leaders. The following pseudonyms were
given to district-level leaders: Sean, Adrianne, Veronica, Kaydence, Cote, Kelsey, Alicia,
and Logan. The pseudonyms assigned to school-level leaders included: Ken, Mary, Brian,
Jayden, Joe, Bill, Jamie, and Sharon. Table 4.1 offers additional information about each
of the leaders interviewed. This table also includes information about the district’s

51
accountability and assistance level, as well as each school’s accountability and assistance
level.

52
Table 4.1 New Hope District- and School-level Leaders
Participant District/School Accountability and Assistance Level
2010-2012
Accountability and Assistance Level
2013 Sean District Level 3 Level 3
Adrianne District Level 3 Level 3
Veronica District Level 3 Level 3
Kaydence District Level 3 Level 3
Cote District Level 3 Level 3
Kelsey District Level 3 Level 3
Alicia District Level 3 Level 3
Logan District Level 3 Level 3
Ken Elementary School Level 2 Level 1
Mary Elementary School Level 3 Level 3
Brian Elementary School Level 3 Level 3
Jayden Elementary/Middle School Insufficient Data Level 2
Joe Middle School Level 3 Level 3
Bill Middle School Level 2 Level 2
Jamie High School Level 3 Level 3
Sharon High School Insufficient Data Insufficient Data Note. Information shaded in gray indicates the district’s top performing schools.
In the state of Massachusetts, each school is assigned an accountability and
assistance level. There are five different levels (1-5). Level 1 status is assigned to the
highest performing schools, and Level 5 is assigned to the lowest performing schools.
(Districts are assigned a level based on the level of their lowest performing school.)
Currently, the majority of schools within the state of Massachusetts have been assigned
Level 1 or Level 2 status (Massachusetts Department of Elementary and Secondary
Education, 2013b). A school assigned a Level 3 status indicates that it is among the
lowest performing 20% of schools (Massachusetts Department of Elementary and

53
Secondary Education, 2013a).
In order to determine the accountability and assistance level for each school, the
state uses the Progress and Performance Index (PPI). The PPI “combines information
about narrowing proficiency gaps, growth, and graduation and dropout rates into a
number between 0 and 100” (MADESE, 2013a, p. 2). A school is considered to be
making progress toward narrowing proficiency gaps when the cumulative PPI for both
the "all students" group and “high needs” group reaches or surpasses 75 (MADESE,
2013a). The high needs group is comprised of an “unduplicated count” of all students in a
school belonging to at least one of the following subgroups: students with disabilities,
English language learners (ELL)/Former ELL students, low income students (eligible for
free/reduced price school lunch) (MADESE, 2013a, p. 2). The state’s decision to include
the high needs group stems from the belief that it will hold “more schools accountable for
the performance of students belonging to historically disadvantaged groups” (MADESE,
2013a, p. 2). A school’s level status can change from one year to the next based on their
PPI score and their school percentile.
School percentiles (1-99) are reported for schools with at least four years of data.
This number is an indication of the school’s overall performance relative to other
schools that serve the same or similar grades. State law requires ESE
[Massachusetts’s Department of Elementary and Secondary Education] to classify
a school into Level 3 if it is among the lowest performing 20 percent of schools
relative to other schools of the same school type (percentiles 1-20) (MADESE,
2013a, p. 7).

54
Figure 4.1 illustrates each school’s PPI score for “all students” and “high needs” students
Figure 4.1. PPI Scores from the 2012-2013 School Year
from the 2012-2013 school year. With the target being 75, some schools seem better
positioned to qualify for a move up in accountability and assistance level. The following
section will explore further the disparities in student performance at both the district and
individual school level.
Disparities in Student Performance
In an effort to describe clearly the student performance disparities that exist
within the New Hope School District, three key indicators were examined: (a) state
achievement tests, (b) graduation rates, and (c) Scholastic Aptitude Test (SAT)
performance reports.
State achievement tests. Between the years of 2009 and 2013, an average of 50%
of students attending the New Hope School District scored proficient or higher on the
English Language Arts (ELA) portion of the state test. On the Mathematics portion of the

55
state test, an average of 40% of New Hope students scored proficient or higher. The
disaggregation of this data illustrates the performance differences that exist among the
specific student subgroups. As shown in Figures 4.2 and 4.3, the performance of some
student subgroups falls substantially below the performance of other student subgroups.
The greatest disparities (i.e., “gaps”) in student performance, as measured by the state test,
are experienced by Students with Disabilities, ELL students, Hispanic/Latino students,
and Low Income students. Discrepancies in performance are evident in both ELA and
mathematics for the students in these subgroups.
Table 4.2 provides the same information but disaggregated by school. Similar to
district results, the greatest disparities in student performance have been experienced by
Students with Disabilities, ELL students, Hispanic/Latino students, and Low Income
students. This holds true for student performance in both ELA and mathematics. Table
4.2 also shares the percentage of students statewide who scored proficient or higher on
the ELA and mathematics portions of the state test. Comparing individual school results
against state results allows for a greater level of analysis. For example, the Students with
Disabilities, ELL students, and Low Income students in Ken’s Level 1 elementary school
have regularly met or exceeded the state’s performance. This further clarifies why Ken’s
school recently moved from Level 2 to Level 1. Another example includes the ELA
performance of Low Income students in Bill’s Level 2 school. Students within this
subgroup have made steady gains since 2009, culminating in a record high of 52%
percent scoring proficient or higher in 2013 which exceeded the state’s performance by
two percentage points. Although small, the percentage of Students with Disabilities

56
scoring proficient or higher in Bill’s school has also increased across the last five years.
Other “stand outs” include the Students with Disabilities and Low Income students
attending Jamie’s Level 3 school. Although the performance of students in these
subgroups seems to fluctuate from year to year (rather than demonstrating steady gains),
their performance has regularly met or exceeded the state’s performance.
Graduation rates. Between the years of 2009 and 2012, approximately 70% of
students attending the New Hope School District graduated. When data on graduation
rates is disaggregated by student subgroup, differences once again emerge. Table 4.3

57
further illustrates the disparities in graduation rates that exist for Students with
Disabilities, Hispanic/Latino students, ELL students, and Low Income Students when
compared to the graduation rates of other student subgroups.

58
Table 4.2. Percentage of Students Scoring Proficient or Higher on the State Test
Ken’s Level 1 School
ELA Results Math Results
2009 2010 2011 2012 2013 2009 2010 2011 2012 2013 White 45 56 53 62 55 53 49 51 59 53
Asian - - - - - - - - - - African American/Black 86 81 69 69 - 71 91 69 69 -
Low Income 40 50 46 56 50 49 41 47 53 49
ELL 18 21 22 30 22 23 21 34 40 43
Hispanic/Latino 39 40 36 54 46 43 36 36 47 47 Students w/ Disabilities 22 44 14 23 7 29 28 12 21 24
Mary’s Level 3 School
ELA Results Math Results
2009 2010 2011 2012 2013 2009 2010 2011 2012 2013 White 49 48 40 41 35 40 55 44 40 43
Asian 13 27 25 55 33 19 9 17 45 41 African American/Black - 31 47 16 17 - 38 33 23 25
Low Income 24 34 27 27 24 19 37 29 25 34
ELL 12 5 0 0 6 12 9 13 8 21
Hispanic/Latino 30 32 19 16 24 24 31 20 13 30 Students w/ Disabilities 8 6 7 11 5 8 6 7 11 10
Brian’s Level 3 School
ELA Results Math Results
2009 2010 2011 2012 2013 2009 2010 2011 2012 2013 White 46 50 31 51 51 46 39 44 47 63
Asian 43 21 33 27 40 28 21 33 33 60 African American/Black 31 33 33 36 33 31 25 25 36 41
Low Income 24 30 25 32 33 29 21 27 27 37
ELL 9 14 28 19 16 12 8 10 16 27
Hispanic/Latino 22 29 29 31 28 24 21 26 25 31 Students w/ Disabilities 7 5 2 3 4 9 5 9 3 20

59
Note. Bolded percentages in a high needs category indicate that the percentages were equal to or higher than the state’s percentages for that year. ª A “-” indicates insufficient data. Since data from the state’s test was not available for Sharon’s high school, her school was not included in the table.
Table 4.2. (continued)
Percentage of Students Scoring Proficient or Higher on the State Test
Jayden’s Level 2 School
ELA Results Math Results
2009 2010 2011 2012 2013 2009 2010 2011 2012 2013 White - - - - 61 - - - - 50
Asian - - - - 58 - - - - 50 African American/Black - - - - 63 - - - - 52
Low Income - - - - 43 - - - - 37
ELL - - - - 7 - - - - 13
Hispanic/Latino - - - - 35 - - - - 32 Students w/ Disabilities - - - - 12 - - - - 9
Bill’s Level 2 School
ELA Results Math Results
2009 2010 2011 2012 2013 2009 2010 2011 2012 2013 White - 53 54 60 63 - 40 36 38 45
Asian - 39 43 68 65 - 31 34 36 46 African American/Black - 48 59 48 41 - 24 29 28 26
Low Income - 40 44 47 52 - 22 23 24 29
ELL - 21 26 20 7 - 12 15 4 10
Hispanic/Latino - 39 44 43 49 - 22 25 24 25 Students w/ Disabilities - 12 17 18 19 - 6 6 9 9
Joe’s Level 3 School
ELA Results Math Results
2009 2010 2011 2012 2013 2009 2010 2011 2012 2013 White 69 69 68 60 66 51 55 50 47 52
Asian 56 39 42 55 50 43 45 43 37 43 African American/Black 53 54 61 48 45 41 35 29 29 36
Low Income 45 44 47 43 45 31 34 29 30 34
ELL 13 3 6 6 8 7 10 11 6 10
Hispanic/Latino 43 42 43 41 42 27 32 26 27 27

60
Students w/ Disabilities 16 13 10 7 10 13 14 6 2 6
Note. Bolded percentages in a high needs category indicate that the percentages were equal to or higher than the state’s percentages for that year. ª A “-” indicates insufficient data. Since data from the state’s test was not available for Sharon’s high school, her school was not included in the table. Table 4.2. (continued) Percentage of Students Scoring Proficient or Higher on the State Test
Jamie’s Level 3 School
ELA Results Math Results
2009 2010 2011 2012 2013 2009 2010 2011 2012 2013 White 75 79 85 84 90 62 79 79 76 78
Asian 50 61 78 100 100 57 72 78 83 82 African American/Black 59 71 60 63 88 59 66 53 38 65
Low Income 48 46 63 64 78 44 50 64 44 58
ELL 25 - - - - - 60 - - -
Hispanic/Latino 41 37 63 58 72 37 43 63 38 51 Students w/ Disabilities 31 14 38 33 54 22 39 38 13 20
State
ELA Results Math Results
2009 2010 2011 2012 2013 2009 2010 2011 2012 2013 White 74 76 77 76 76 63 64 65 66 67
Asian 74 75 77 77 78 73 75 77 77 79 African American/Black 47 47 50 50 51 31 35 34 35 37
Low Income 45 47 49 50 50 33 37 37 38 41
ELL 19 22 22 22 21 22 24 26 24 25
Hispanic/Latino 41 43 45 45 45 30 34 34 34 38 Students w/ Disabilities 28 28 30 31 29 20 21 22 21 23
Note. Bolded percentages in a high needs category indicate that the percentages were equal to or higher than the state’s percentages for that year. ª A “-” indicates insufficient data. Since data from the state’s test was not available for Sharon’s high school, her school was not included in the table.
SAT performance reports. Reports of students completing the SAT were
compiled and reviewed for discrepancies in student performance. The SAT is a college

61
admissions examination that tests skills students have learned while attending school in
the areas of reading, writing, and mathematics.
Table 4.3.
Four Year Graduation Rate
Percentage Graduated
2009 2010 2011 2012 Ave.
White 75 74 73 79 75
Asian 79 75 90 93 84
African American/Black 67 70 77 85 75
Low Income 64 62 70 69 66
ELL 55 61 71 74 65
Hispanic/Latino 59 57 63 64 61
Students with Disabilities 55 48 63 65 58
In essence, “the SAT provides a trusted, globally recognized indicator of…academic
readiness for college” (The College Board, 2013). Upon close examination of the
available data regarding the number of high school graduates who completed the SAT
between 2009 and 2013, it is interesting to note that in the case of White and
Hispanic/Latino, the percentage of students taking the test is inconsistent with the
percentage of students that make up these subgroups within the district. In other words,
while 40% of the total number of students in the New Hope School District is identified
as White, an average of 63% of the SAT test takers were White between 2009 and 2013.
Alternatively, while 40% of students are identified as Hispanic/Latino, on average only
17% of students belonging to this subgroup took the SAT between 2009 and 2013. This
also held true when looking at socioeconomic status. While 65% of the total high school
population was defined as low income between 2009 and 2013, only 38% of students
belonging to this subgroup completed the SAT during those years. Because the number of

62
students who took the SAT that were classified as ELL and Students with Disabilities
was so small, performance data was not available for the purpose of making comparisons.
When SAT performance data is disaggregated by student subgroup, disparities once again
become evident. Table 4.4 illustrates differences among the various student subgroups on
the reading and math sections of the SAT.
Across all three indicators (i.e., state achievement tests, graduation rates, and SAT
performance reports), discrepancies in the performance of students attending the New
Hope School District exist. These disparities in performance correspond to students’
race/ethnicity, class, and/or disability.

63
Table 4.4. Performance of New Hope Students in Reading and Mathematics on the SAT
SAT Reading Scores
2009 2010 2011 2012 2013 Ave.
White 490 483 472 494 469 482
Asian 421 415 387 408 421 410
African American/Black 381 425 426 436 402 414
Low Income 415 427 409 425 415 418
ELL - - - - - -
Hispanic/Latino 423 445 401 412 412 419
Students with Disabilities - - 418 - - 418
SAT Mathematics Scores
2009 2010 2011 2012 2013 Ave.
White 505 481 476 491 474 485
Asian 474 500 431 448 456 462
African American/Black 383 444 413 414 386 408
Low Income 428 446 406 427 412 424
ELL - - - - - -
Hispanic/Latino 420 442 394 420 406 416
Students with Disabilities - - 367 - - 367

64
CHAPTER 5: FINDINGS
Statement of Purpose
In 2002, the United States Government implemented the No Child Left Behind
Act (NCLB). As a result, local, federal and state policies have demanded more
accountability from district- and school-level leaders by focusing on high stakes testing
of students in an effort to “level the playing field.” As a result, there is a growing area of
research discussing the best practices and general significance of how district- and
school-level leaders use student data effectively to improve learning (Copland, 2003;
Wayman, Cho & Johnson, 2007; Wayman & Stringfield, 2006). Our overall, broad
research study concentrated on district- and school-level leaders who are addressing
disparities in student performance related to race/ethnicity, class, and/or disability. The
study addressed two specific questions:
1. How do district- and school-level leaders understand disparities in student
performance related to race/ethnicity, class, and/or disability?
2. How do these understandings then influence the work of leadership focused
on addressing disparities in student performance related to race/ethnicity, class,
and/or disability?
This portion of the study specifically examined which data analysis structures and
routines district-and school-level leaders perceive essential in understanding and
addressing disparities in student performance related to race/ethnicity, class, and/or
disability, in order to promote students’ opportunity to learn.

65
Historical Perspective
In 1865, Horace Mann wrote, “education then, beyond all other devices of human
origin, is a great equalizer of the conditions of men” (p. 669). The United States’ attempts
to create a level playing field, or, in other words, provide learning opportunities for all
students, regardless of race/ethnicity, class and/or disability, began in earnest in 1954
when the Supreme Court issued the landmark decision Brown et al. v. The Board of
Education of Topeka, Kansas. This ruling provided a legal construct clarifying that
education: “…must be made available to all on equal terms” (p. 4). The ruling ignited a
chain of events and actions that spanned the last half of the 20th century and focused on
improving and expanding educational opportunities for all.
The slow march forward to improve American public schools continued during
the 1980s with a series of commissions and reports (e.g., National Commission on
Excellence in Education, 1981; A Nation at Risk: The Imperative for Educational Reform,
1983; A Nation Prepared, 1986; Bjork, 1993; Linn, 1988). A Nation at Risk (1983)
caused significant debates that led to various policy initiatives. For instance, in one
debate, then Secretary of Education, William Bennett, labeled the public school education
bureaucracy a “blob” that resisted reform by using up precious resources (Walker, 1987).
Then, in 1990, President George H.W. Bush and the nation’s governors created eight
National Education Goals for the year 2000 (Stripling, 1992). Ravitch (1995) further
concluded that educators as well as the public would expect that these changes, once
implemented, would alter how district- and school-level leadership functioned.
Changes in Leadership Roles. Historically, the superintendent of schools served
as a schoolmaster appointed to make all decisions pertaining to the education of children.

66
During the 20th century, “hierarchical bureaucracies and scientific management principles
continued to dominate the roles of superintendents into the 1980s and beyond” (Alsbury
& Whitaker, 2007, p. 154-155). However, in the 1980s, the role of district-level
leadership began moving from a stagnant bureaucratic affair toward a system that
connected administrative performance to overall district performance (Coleman &
LaRocque, 1988). For example, numerous studies revealed that during the 1990s, both
district- and school-level leaders were capable of implementing successful results (Davis,
Darling-Hammond, LaPointe, & Meyerson, 2005; Leithwood & Jantzi, 2008; Marzano,
Waters, & McNulty, 2005; Robinson, Hohepa, & Lloyd, 2009; Silins, Mulford, & Zarins,
2002). However, with dwindling resources available to district leaders, schools were not
capable of being everything to everyone. As a result, local, federal and state policies have
demanded more accountability from district- and school-level leaders by focusing on
high stakes testing of students.
Distributed leadership. Evidence-based practices should be thought of as
organizational routines and structures that are used to distribute leadership (Spillane,
2006). Indeed, recent studies of successful school districts have shown that there is a
range of strategies and tools that are considered routines and structures which can be put
in place by district-level leaders to build stronger intra-organizational ties (Chrispeels,
2004; Honig, 2004; Togneri & Anderson, 2003). Also, it is important to note that
distributing leadership is not simply charting the course from above and letting others do
the work. Rather, true distributed leadership travels within the organization (Barnard,
1968; Harris, 2008; Spillane, 2012).

67
Effective district leadership has far reaching effects that have been shown to play
a critical role in guiding an organization in developing tools and routines to ensure a
planned alignment strategy with a vision and mission (Harris, Leithwood, Day, Sammons
& Hopkins, 2007; Waters & Marzano, 2006). Those school organizations demonstrating
effective institutionalized leadership practices with a distribution of leadership via
principals, department heads, teacher leaders, and other players have been identified with
experiencing school success (Murphy & Hallinger, 1988; Leithwood et al., 2004;
Marzano et al., 2005).
Five specific district-level actions that district- and school-level leaders should
engage in to accomplish increased accountability using a model of distributed leadership
were delineated by Marzano & Waters (2009):
• Ensure collaborative goal setting
• Establish nonnegotiable goals for achievement and instruction
• Create board alignment and support of district goals
• Monitor achievement and instruction goals
• Allocate resources to support the goals for achievement and instruction (p. 6).
A distributed leadership model focuses on the leadership goings-on within the district. It
also ensures that leadership roles and practices are “distributed over leaders, followers,
and their situation and incorporates the activities of multiple groups of individuals”
(Spillane, Halverson, & Diamond, 2004). Lashway (2003) described distributed
leadership as “a conceptual framework that incorporates leadership, instructional
improvement and organizational change” (p. 3).

68
Moreover, distributed leadership is more than shared leadership; it incorporates a
collective leadership throughout an organization but is more than “multiple leaders in a
school sharing responsibility for leadership activities” (Spillane, 2006, p. 13). One form
of distributed leadership is co-principals within a school (Gronn, 2003; Grubb & Flessa
2006). Another is building level leaders and teachers who mentor new teachers, supervise
paraprofessionals, and plan and provide professional development.
Ensuring accountability. Finally, effective district leadership puts a focus on
increased accountability for all students by developing systems to collect student data
(Wohlstetter, Datnow, & Park, 2008; Farley-Ripple, 2012; Wayman, Cho, & Johnson,
2007). These student data collection systems that have been put in place are considered
organizational structures and routines (Spillane, 2006). District-level leaders who develop
structures and routines with high expectations for all students tend to be effective in
promoting students’ opportunity to learn (Skrla, Scheurich, & Johnson, 2000). The local,
state, and federal policies that mandate standards and test-based accountability are firmly
entrenched in our public schools. This increased level of scrutiny to improve student
learning was specifically noted in the U.S. Department of Education’s data reporting
guidelines which state, “the accountability provisions included in the No Child Left
Behind Act of 2001 (NCLB) significantly increased the urgency for states, local
educational agencies (LEAs), and local schools to produce accurate, reliable, high-quality
educational data” (U.S. Dept. of Education, 2006). More recently, the U.S. Department of
Education reiterated this data requirement by echoing that districts and schools should be
using assessment data to respond to students’ academic strengths and overall needs
(American Recovery and Reinvestment Act of 2009). These federal policies have caused

69
significant shifting to occur with respect to how data is consumed and employed at the
district and school levels.
As a result, high-stakes district accountability measures have caused district- and
school-level leaders to focus on being instructional leaders and less on being managers
(Alsbury & Whitaker, 2007; Bredeson & Kose, 2007; Theoharis, 2007). Embracing the
concept of accountability, the public expects school districts to sustain a culture of
constantly improving by using data to inform decisions (Goldring & Berends, 2009;
Hawley & Sykes, 2007). Furthermore, research shows that district- and school-level
leaders have significantly increased their use of student data to inform their practice
(Anderson, Leithwood & Strauss, 2010; Marsh, McCombs, & Martorell, 2010).
Thrust into this current climate of data-driven results, district- and school-level
leaders are gathering data from a “range of sources of ‘evidence,’ ‘data,’ and ‘research’ in
order to ground a host of decisions” (Honig, 2007, p. 580). Consequently, district- and
school-level leaders have (a) immediate access to computerized student information
systems that provide opportunities to review both real time and longitudinal data
disaggregated by individual student, classroom, grade-level, disability, or other
demographic factors, and (b) the potential to calculate future student performance on
evaluations (e.g. Aarons & Gewertz, 2009; Brunner et al. 2005; Wayman, Cho, & Shaw,
2009).
All of this access to data can be positive. However, there are reasons to be
cautious, as Love (2009) indicated:
Without a systemic process for using data effectively and collaboratively, many
schools, particularly those serving high-poverty students, will languish in chronic

70
low performance in mathematics, science, and other content areas-no matter what
the pressures for accountability. Or even worse, abuses of data-drilling students
on test items; narrowing the curriculum; tutoring “bubble” students while failing
to improve instruction; instituting practices that further exclude, label, or
discriminate against students of color-will leave underserved students even worse
off (p. ix).
In other words, district- and school-level leaders must establish structures and routines
that enhance staff use of data so that data-based decisions are made consistently and with
regard for the needs of all students (Wohlstetter, Datnow, & Park, 2008; Knapp,
Swinnerton, Copland, & Monpas-Huber, 2006; Wayman, Jimerson & Cho, 2012).
Defining data. The recent educational policy phenomenon of raising student test
scores has led district and school-level leaders to design organizational structures and
routines that collect, interpret and disseminate student data for the purpose of improving
educational practices (Hallinger & Heck, 2002; Sherer & Spillane, 2011). As a result
there have been numerous studies examining how district- and school-level leaders use
data to improve practice (e.g., Anderson, Leithwood, & Strauss, 2010; Wayman &
Stringfield, 2006; Copland, 2003; Lachat & Smith, 2005; Marsh, McCombs, & Martorell,
2010).
For instance, district- and school-level leaders often use data in order to target a
problem and then set strategic goals (Goldring & Berends, 2009: Halverson, Kelly &
Kimball, 2004; Hallinger & Heck, 2002). In this case, typical sources of data that district-
and school-level leaders use are: student test scores, dropout rates, socio-economic status
and attendance rates.

71
Embedded in all strategic goal setting are efforts to improve instruction. Tucker
(2010) portrays student information data systems as having the greatest potential to
improve daily classroom instruction:
With a couple of mouse clicks, classroom teachers can now get such data as
interim test scores, subject grades, attendance records, and English language
learner status on a single computer screen. Thanks to [this system], a high school
instructor who may have a student for just one period a day can now see how that
student is progressing across all courses, and can identify students at risk of
academic failure (p.2).
There are more organic data sources that district-and school-level leaders create to
help close the achievement gap. One such example is “The Five Week Assessment
Routine” which is written about extensively by Zoltners-Sherer and Spillane (2011).
Designed at the Adams School in Chicago, this specific routine was developed for the
purpose of better comprehending what students were learning. At Adams School:
Every five weeks, all K–8 students at Adams took a math, reading, and writing
assessment. The reading and writing assessments were written by the literacy
coordinator and distributed by her assistant. Teachers administered the
assessments and returned the student work to the literacy office where the literacy
coordinator and her assistant scored the student work, analyzed the data, compiled
reports, and shared them with the teachers, principal, and assistant principals
(Zoltners-Sherer & Spillane, 2011, p. 620).
The above example, similar in some respects to Response to Intervention, illustrates how
data can be developed and used to improve instruction. It also reinforces that data can

72
include “any information that helps an educator know more about their students”
(Wayman, Jimerson & Cho, 2012, p. 160).
For this portion of my study, data will be defined using Bernhardt’s (2003) four
unique categories of data that district and school-level leaders often analyze: student
learning, demographics, school process, and teacher perceptions. Bernhardt’s definitions
are as follows:
Student learning data include a variety of measurements—norm-referenced tests,
criterion-referenced tests, standards assessments, teacher-assigned grades, and
authentic assessments.
Demographic data describe the students, the school's staff, the school, and the
surrounding community.
Perceptions data—gathered through questionnaires, interviews, and observations.
School processes data include the school's programs, instructional strategies,
assessment strategies, and classroom practices (Bernhardt, 2003, p. 26).
According to both Kennedy (2003) and Schmoker (2003), analyzing these categories of
data often reveals some of the most basic challenges district- and school-level leaders
face.
Defining structures and routines. Structure and routines are fundamental to any
organization, but each of us views these through different lenses, leading to disparate
levels of understanding (Feldman & Rafaeli, 2002). A logical starting point is to provide
the reader clear definitions of structure and routine, as the following indicates: school
districts have formal hierarchical structures that act as blueprints of each district’s
bureaucracy. These structures are put in place to accomplish the goals of leading,

73
teaching and learning, and to assist the individuals within the organization and those on
the outside to understand the official structures that guide the organization.
Structure. There are different definitions of structure. Structure can be considered
“the patterns of organizing and allocating time, space, staff, students, curriculum, and
learning resources that directly affect student opportunities to successfully learn what is
essential” (Schwahn & Spady, 2002, p. 98). It can also be framed using Spillane, Mesler-
Parise and Zoltners-Sherer’s (2010) definition: “Formal structure refers to the designed
organization including formally designated positions, chains of command, departments,
programs, and formal organizational routines” (p. 588).
Indeed, structure is more than just a linear model of who is responsible for what,
and who supervises whom; structure can also be less tangible. Therefore, for the purpose
of this study, the definition of structure will be Spillane’s (2006) fluid description: “go-
betweens in our interactions with others in and on the world” (p. 75). Using this fluid
definition for structure builds on previous literature that discusses how structure is yet an
abstract idea or concept. However, when coupled with a specific person, at a defined time,
in a specific location (school or district), with a specific task/activity, it becomes less
abstract (Bourdieu, 1977, 1990; Feldman & Pentland, 2003; Giddens, 1984).
Routine. In theory, a public school system is made up of people working for the
common good. The general coordination of these activities within the school district
could be considered a routine (Feldman & Rafaeli, 2002; March & Simon, 1958; Nelson
& Winter, 1982). However, there is a voluminous amount of research regarding
organizational routines, and a large number of competing definitions of what constitutes a
routine (March & Simon 1958, Nelson & Winter, 1982; Spillane, 2012). For instance,

74
organizational routine may look different depending upon an individual’s experiences
within the organization (Pentland & Feldman, 2005). March and Simon (1958) suggest
that an organizational routine is similar to a computer program. Contrary to this definition,
which neglects the personal elements of what a routine is within a public school system,
is that proposed by Feldman and Rafaeli (2002): “organizational routines are recurring
patterns of behavior of multiple organizational members involved in performing
organizational tasks” (p. 311). Similarly, Feldman and Pentland (2003), from a more
humanistic point of view, defined routine as “a repetitive, recognizable pattern of
interdependent actions, involving multiple actors” (p. 95). Also, the articles and books
about distributed leadership produced by Spillane (2006; 2012), and Spillane, Zoltners-
Sherer and Parise (2010; 2011) support this definition of routine. Therefore, Feldman and
Pentland’s definition was used for this study.
Methods
Case study. Through the lens of a distributed leadership model, this study
specifically examined which data analysis structures and routines district- and school-
level leaders perceived essential in addressing disparities in student performance related
to race/ethnicity, class, and/or disability in order to promote students’ opportunity to learn
Whereas the methodology outlined in the overarching study was followed, the subsequent
sections further detail information more specific to this portion of the study.
Creswell (2012) defines a case study as “an in-depth exploration of a bounded
system (e.g., activity, event, process, or individuals) based on extensive data collection
(Creswell, 2007). Bounded means that the case is separated out for research in terms of
time, place, or some physical boundaries” (p. 465). The qualitative case study method is

75
appropriate for this section of the study for two reasons: it will result in both a greater
understanding of the data analysis structures and routines within the district and also the
determination of how they are utilized for leadership (Creswell, 2012; Merriam, 2009;
Salkind, 2006). Creswell (2009) suggested the use of qualitative research because it
provides a detailed view of the topic. Accordingly, this qualitative case study analysis
was in New Hope School District, an urban, K-12 district in Massachusetts, as described
in Chapter III.
Sample and Participant Selection. As previously outlined, snowball sampling
(Creswell, 2012; Merriam, 2009) and reputational sampling (Miles & Huberman, 1994)
was used to identify superintendent, school and district leaders dedicated to addressing
disparities in student performance. The sampling included district-level and school-level
leaders that were actively engaged in interacting with one another as they attempted to
address gaps in student performance gap.
Data collection. Simmons (2006) describes interviews as the most common form
of data collection. Therefore data for this portion of the study was collected by the entire
research team primarily through individual semi-structured interviews using a protocol
developed by the research team.
Interviews. According to Stake (1995), interviews are a valuable way to uncover
multiple facets within a case study. Therefore, a limited number of district- and school-
level leaders were interviewed in order to understand their perceptions of the evidence-
based practices within the district. Interviews were conducted in-person on site within the
school district setting, in each interviewee’s office. Confidentiality was a consideration in
deciding the location to ensure the session was uninterrupted. In an effort to minimize

76
intrusion upon the interviewees’ ability to perform their professional duties, all interviews
were arranged at a time convenient for the interviewees. Specific interview questions
were developed using the theoretical distributed leadership framework and are outlined in
Appendix (A) whereas Table 5.1 shows the specific interview questions for this portion
of the study.
Document analysis. Spillane, Diamond and Jita (2003) used the term “collective
leading” as a way to illustrate distributed leadership and described it by stating, “when
two or more leaders work together to co-enact a particular leadership task” (p. 538).
When district- and school-level leaders collaborate, as is the case in distributed leadership,
documents are often generated that illustrate the decisions made. These organizational
documents “have been a staple of qualitative research for many years” (Bowen, 2009, p.
27). More specifically, in widely circulated distributed leadership books and studies, the
resulting documents, available for review, usually include the following: (a) meeting
agendas, student assessments, scheduling protocols, staff procedures (structures/routines)
(for student data review); and (b) the strategic plan (Vision/Mission) as it relates to data,
structures and routines (Spillane, Halverson, & Diamond, 2001; Spillane, Parise, &
Sherer, 2011; Harris, 2002; Harris, 2004).
Analysis and review of multiple documents is widely supported: Creswell (2012)
and Merriam (1998) recommended the use of documents, as did Yin (1994) who
advocated for the collection of multiple data sources such as documentation and archival
records. Stake (1995) stated that using a variety of data sources such as archival
documents would reduce the potential for misinterpretation and help produce greater
reliability. Bogdan and Biklen (2003) suggested, “the qualitative research approach

77
Table 5.1. Research Questions
OTL: Understanding and Addressing Educational Inequities
Overarching Research Questions
OTL: Structures and Routines Research Questions
How do district- and school-level leaders understand disparities in student performance related to race/ethnicity, class, and/or disability? How do these understandings then influence the work of leadership that focuses on addressing disparities in student performance related to race/ethnicity, class, and/or disability?
Which data analysis structures and routines do district-and school-level leaders perceive essential in understanding and addressing disparities in student performance related to race/ethnicity, class, and/or disability, in order to promote students’ opportunity to learn?
demands that the world be examined with the assumption that nothing is trivial, that
everything has the potential of being a clue that might unlock a more comprehensive
understanding of what is being studied” (p.6).
Therefore, in this portion of the case study, an interview probe was used to help
identify and locate district- and school-level archival documents. By using an interview
probe, it was possible to draw upon multiple sources of evidential data (interviews and
documents) collected by multiple researchers conducting the study. This helped validate
and triangulate the data (Denzin, 1978; Miles & Huberman, 1994; Merriam, 2009; Yin,
1994). A sample of the following documents was examined from the 2011-2013 school-
years to the present:
• district- and school-level routines, and structures that the district uses to
support analysis of data;
• district- and school-level improvement plans;
• district- and school-level benchmark student data and assessment schedules;
78
• district policy as it relates to student data and use of data as it relates to
student performance pertaining to race/ethnicity, class, and/or disability;
• district strategic vision as it relates to student data, and use of data as it relates
to student performance pertaining to race/ethnicity, class, and/or disability;
and
• documentation of the types of professional development offered to district-
and school-level leaders.
This researcher acknowledges the limitations that document analysis presents. The
district documents were produced by individuals with biases, interests, and values that
have the potential to impact the credibility of those documents (Hammersley & Atkinson,
2007; Hitchcock & Hughes, 1995). An additional concern is that they also reflect the
language and orientations of the research participants instead of being actual or somehow
definitive. However, since public schools are bureaucratic entities that use documents as
the primary means to guide staff to carry out policies, procedures, and protocols, formal
document analysis is important to perform despite the inherent limitations.
The primary goal of document analysis was to assist in confirming or invalidating
the interview responses regarding data structures and routines. The data collected during
interviews was divided into two separate categories: district-level leaders and school-
level leaders. By analyzing documents that district- and school-level leaders referred to in
the interview process, the researcher was able to cross-check and verify responses in
order to gain further insight into which student data structures and routines the
respondents perceived to be essential in addressing existing disparities in student
performance.

79
Data analysis. The analysis of data consisted of (a) data reduction, (b) displaying
data, and (c) drawing/verifying conclusions (Miles & Huberman, 1994). For this portion
of the research study, the process of data reduction began prior to the collection of data
with the development of following research question:
Which data analysis structures and routines do district-and school-level leaders
perceive essential in understanding and addressing disparities in student performance
related to race/ethnicity, class, and/or disability, in order to promote students’ opportunity
to learn?
Data reduction continued throughout the analysis utilizing the coding process. Prior to
entering New Hope School District, this researcher created a “start list” of codes based on
the study’s theoretical framework and research questions as described in Chapter 3
(Merriam, 2009; Miles, Huberman & Saladaña, 2014). Coding is the process of
conceptualizing the data and moving from description to formulation of the data.
Creswell (2012) defines coding as a “qualitative research process in which the researcher
makes sense out of text data, divides it into text or image segments, labels the segments,
examines codes for overlap and redundancy, and collapses these codes into themes” (p.
618). Correspondingly, Saldaña (2013) defines a code in qualitative inquiry as being
“most often a word or short phrase that symbolically assigns a summative, salient,
essence-capturing, and/or evocative attribute for a portion of language-based or visual
data” (p. 3). This start list began with a master code for each research based category and
sub codes to follow, which “marked off segments of data in each class of variables”
(Merriam, 2009, p.58). Definitions of the master codes were developed to ensure that the

80
researcher was coding with the same phenomena in mind (Miles & Huberman, 1994).
These definitions were drawn from research and the literature review.
Data displays. Creating a data display involved displaying the data in an
organized fashion to allow for conclusions to be drawn (Miles & Huberman, 1994).
Conclusion drawing and verification. The final component of data analysis,
conclusion drawing and verification, involved determining the meaning of the data (Miles
& Huberman, 1994). As outlined in Chapter 3 various tactics are used to draw
conclusions and verify those conclusions (Miles & Huberman, 1994).
Triangulation. It is critical to ensure the trustworthiness of findings based on the
information gathered and data analysis (Merriam, 2009). Specific strategies were utilized
to ensure trustworthiness data was triangulated (Merriam 2009; Creswell, 2012). The
following forms of triangulation were used: (a) by method (i.e., interviews and
documents), (b) by source (i.e., multiple district- and school-level leaders), and (c) by
researcher (i.e., multiple researchers collecting and analyzing data). Each form of
triangulation serves to verify the study’s findings. Triangulating in this manner yielded
valuable information pertaining to the role of interactions and its impact on leaders’
understanding and practice.
Reliability and validity. Both Merriam (2009) and Creswell (2012) emphasize
that triangulation ensures the validity of the findings. Ultimately, triangulation assisted
with ensuring the validity of the findings in this section. Additionally, the process of
“check coding” was used to ensure clarity of the definitions when coding and to
guarantee reliability (Miles & Huberman, 1994, p. 64). Check coding occurs when more
than one researcher codes data, then they review and discuss the results together. Once

81
the data was accurately coded and triangulated, the data was interpreted and written in
narrative form (Creswell, 2012; Merriam, 2009).
Researcher bias and assumptions. This research team consisted of four doctoral
level candidates who were all working as administrators in public school districts that
were attempting to address disparities in student performance. Each of the districts had
different approaches to this work and as a result the researchers brought different
experiences and perspectives to the analysis process. Because of the varying backgrounds
and viewpoints, it is important to note that the researchers may have shared certain
characteristics with the research participants. As a result, the researchers may have
brought bias regarding the interpretation of leaders’ understanding about the nature of the
gap and related actions. Merriam (2009) states that researchers are the primary instrument
in the data collection and analysis process, therefore, biases may influence the research
study. Rather than trying to remove the biases, it is essential to “identify them and
monitor them as to how they may be shaping the collection and interpretation of data”
(Merriam, 2009, p.15).
Results
Structures and routines. The structures and routines that district- and school-
level leaders use to analyze student data are crucial to understanding how leaders try to
improve students’ opportunity to learn. Accordingly, student data analysis organizational
structures and routines comprise the framework within which school leaders monitor
student progress. Planning and implementing the necessary structures and routines in
New Hope School District involved a conscious decision by the district- and school-level
leadership (Zoltners Sherer, & Spillane 2011).

82
The following section, divided into two parts, presents the findings and discussion
that emerged from the analysis of interviews and documents in response to my research
question. The findings are organized and presented with the purpose of specifically
examining which data analysis structures and routines district- and school-level leaders
perceive essential in understanding and addressing disparities in student performance
related to race/ethnicity, class, and/or disability, in order to promote students’ opportunity
to learn. The analysis showed that structures and routines were: (a) a mandate for public
display of student data using data war-rooms and student data walls, (b) a traveling
cabinet for the purpose of ensuring uniform review of student data, (c) mandated plans
for individual school improvement and (d) implementation of school-based instructional
coaches created opportunities for student data review. Furthermore, this researcher
recognized that the Level 3 status of the district influenced the implementation of these
organizational structures and routines.
Overview of the New Hope Public School District including Massachusetts
performance ranks. Massachusetts assigns performance ranks 1-5 (accountability and
assistance) to its school districts and each of the schools within the districts. Level 1
means highest performing, and level 5, lowest performing. Districts are assigned a level
based on that of their lowest performing school. New Hope, ranked level 3, is among the
20 percent lowest performing districts in Massachusetts (Massachusetts Department of
Elementary and Secondary Education, 2013a). Table 5.2 shows the pseudonyms of the
district- and school-level leaders as well as their years in their respective roles and their
school’s state performance rankings. Interviews were conducted with all district-level
leaders and all but two of the school-level leaders.

83
A mandate for using data war-rooms and student data walls. Much of the work of
central office administration leadership requires putting in place structures and routines
that individuals within the school organization can enact and follow. Routines and
structures within an organization evolve over time and external factors contribute to those
changes (Zoltners- Sherer, 2006; Feldman & Pentland, 2003). In 2012, the superintendent
of schools in New Hope School District, along with the other district-level leaders,
mandated that school-level leaders analyze student achievement data in an effort to close
the achievement gap. Throughout all of the interviews, district- and school-level leaders
identified Special Education students and English Language Learners (ELL) as the two
groups for which the district deliberately analyzed student data. Figures 5.1 and 5.2
illustrate that the greatest performance differences in New Hope, as measured by the state
test, are experienced by Students with Disabilities, ELL students, Hispanic/Latino
students, and Low Income students. Similar discrepancies in performance are evident in
both English language arts (ELA) and mathematics for the students in these subgroups.
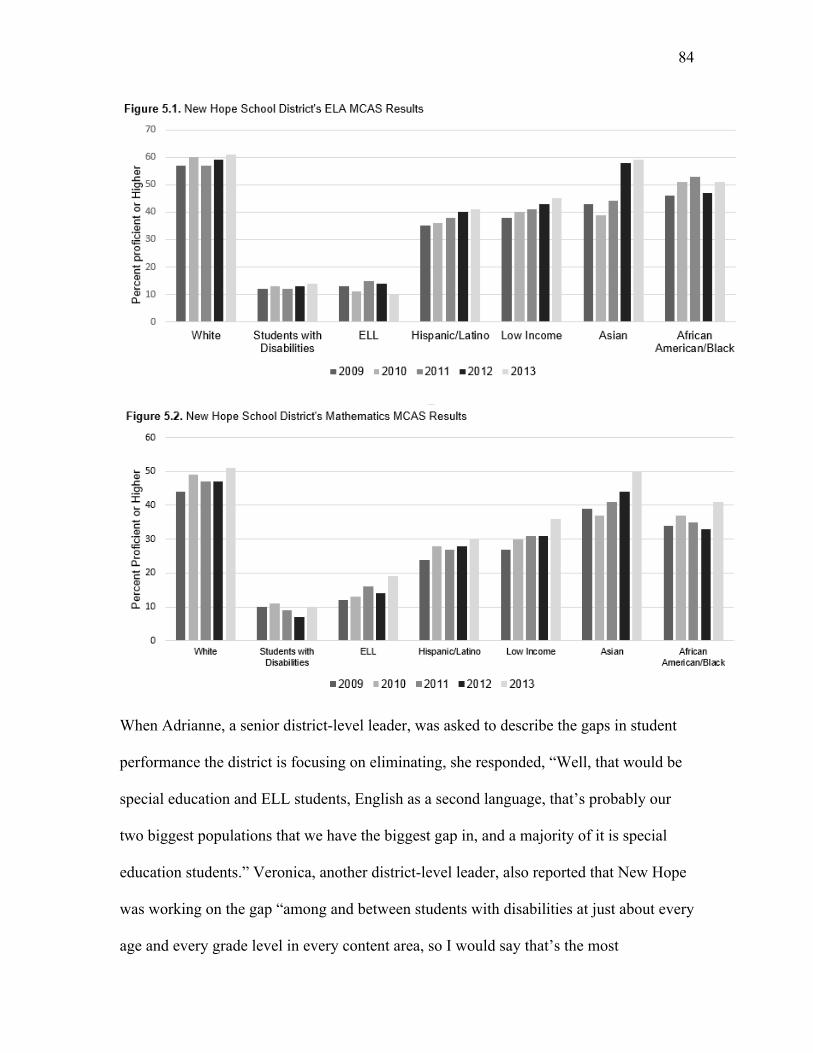
84
When Adrianne, a senior district-level leader, was asked to describe the gaps in student
performance the district is focusing on eliminating, she responded, “Well, that would be
special education and ELL students, English as a second language, that’s probably our
two biggest populations that we have the biggest gap in, and a majority of it is special
education students.” Veronica, another district-level leader, also reported that New Hope
was working on the gap “among and between students with disabilities at just about every
age and every grade level in every content area, so I would say that’s the most

85
persistent.” Jayden, a school-level leader stated, “To get specific on your proficiency gap,
we’re targeting the subgroups of English language learners, special education.” Jamie, a
school-level leader identified the gaps persisting in the “SPED [Special Education]
demographic group.” Sean, a district leader said that “we’re looking at a lot of the same
gaps that a lot of urban [districts] are looking at…Special Education and ELL.” Finally
Brian, a school-level leader reported that, “if you talk about gaps, specifically with my
subgroups, the gaps with my specific subgroups would definitely be my English language
learners, my low income, and my SPED.”
To address the achievement gaps the district targeted, it adopted new structures
and routines. One such specific structure/routine that district- and school-level leaders
perceived as an essential tool in analyzing student data was what Sean referred to as “data
war-rooms” and “student data walls.” Sean said the primary factor contributing to the
newly mandated structure/routine was the fact that the Massachusetts Department of
Elementary and Secondary Education identified the district as being Level 3. Sean’s
comments provided his initial rationale for providing a mandated structure/routine in
each building with the following statements:
Up until like June I had data walls here [central office], I had them up in here
trying to basically model what it is, but I found that I actually stopped doing it
because it was more like a pro forma kind of showy thing. This is used as a
conference room, nobody’s really analyzing the data here that much, so whereas
for the schools it’s the place where the data teams meet and they’re actually using
the raw data every day.

86
In other words, Sean envisioned that intentional, regular use of formative and
summative assessment data would help school-level leaders and teachers determine their
students’ proficiency. Therefore, Sean mandated the “data walls” and “data rooms.”
The intent of these data exhibitions was to help guide the specific interventions for each
student as well as provide opportunities for collaboration and sharing of resources. Sean
further described the purpose of the mandated format that each school was to follow:
So one of the mandates for me was that every school would have a data room,
refer to it as the data war room, and on the walls are the academic, where all the
students are individually to the point where a lot of the schools use the red,
yellow, and green way of marking where students are, red being in need of
remediation, yellow being on their way, and green being at the grade or above. So
that most of the schools have charts where they actually have little cards with
every student’s number and dates and picture to really make this all very personal,
this is about every student, knowing where every student is academically in
different subject areas and the goal being to move them up from red to yellow to
green.
Essentially, central office leadership positioned the use of student data as a top priority
throughout the New Hope School District. Sean reported the district mandate:
The goal being that at one point it was central office [who] need[ed] to know the
data, then it was really central office and the principals need[ing] to know the
data, and then there are data people who need to know the data, and now it’s
every teacher needs to know the data. And really the schools that are having the

87
biggest success…every student…knows their own data, that’s the goal, to have
every student have ownership of their data.
In fact, all of the school-level leader participants confirmed that central office
administration, and particularly the superintendent of schools, had placed an importance
on mandating the use of publicly displaying and analyzing student data. “There’s
certainly a lot of conversation around data and presentation of data…..the
standardization, every school in some shape or form has had data walls, there’s a
requirement to have it,” said Jayden, a school-level leader. School-level leaders perceived
the importance placed on student data and adhered to the mandate of displaying student
data via data war-rooms and data walls.
The prevalence of publicly posting student data throughout the district was
evident, as Bill, a school-level leader, reported:
So, what started as this philosophy around posting, publically posting it
[data]….we took it to a different level when we said we don’t just want to have it
on the wall. We want the kids to know it. We want the kids to be able to interact
with it. So, like in our interventions when they do their progress monitoring,
they’ll get a marker and they’ll walk up to their data sheet, and they’ll color in
their little bar graph that shows what their fluency was today versus what it was
two weeks ago, and they can come back and say, ‘Geez it went up 5 words, and I
only made one mistake. That’s, I’m really making gains towards my benchmark.’
And that’s the level we want to get to. So, I think the greatest change is looking at
our use of it, but then making it so public and so internalized by the children that
they can understand it.

88
Further, Jamie, a school-level leader, described that her staff decided to implement the
data display mandate in multiple ways. For instance, they displayed daily student
attendance rates on the school entrance doors, office doors, classroom doors and hallways
throughout the school. At another school, the school-level leader dedicated a conference
room as a “data-room.” At Jayden’s school there was a conference room dedicated as a
“data-room” in an effort to adhere to the structure/routine mandate from the
superintendent of schools. Jayden described the data in the room as follows:
We track in this room, we based it off our assessments so we don’t necessarily
track the subgroups; we’re addressing skills. But one of the things we do delineate
here in monitoring the gap is that these cards actually represent students and their
programs are identified. So as we place them based on the skills and the
proficiency that we’re seeking, we’re able to also look at programming what they
may fall under and what those are. So we do that. This is the language arts, the
mathematics is behind you and that’s how we look at skills, but then within that is
looking at proficiency gaps that are subgroups. And with the delineation in
MCAS it makes it quite neat to compare high needs to no needs to non-needs. So
we look at that as a holistic group but then we can also break that down into the
categories.
The above examples exhibit the ways that school-level leaders adhered to the
mandate set by the superintendent. This demonstrates the importance district-level and
school-level leaders placed on the judicious use of student data to improve students’
opportunity to learn.

89
Upon reviewing and coding transcriptions from the district- and school-level
leaders’ interviews, another bit of peripheral evidence, revealing the significant
importance of student data, was uncovered: how often district- and school-level leaders
used the term “data” during each interview. The eight central office district-level leaders
used the word “data” an average of 24.5 times per one hour interview whereas the school-
level leaders used the word “data” an average of 34.5 times per interview. Most striking,
however, was the difference between how often Jayden, a school-level leader used the
word “data” during the one-hour interview: 81 times; and how often Joe, a school-level
leader, used it, only 10 times. This level of discrepancy among school-level leaders
demonstrates the potential inconsistency of how individuals perceive the importance of
data.
A traveling cabinet ensures uniform review of student data. One specific
district-level structure/routine that all but two interviewees recognized as important was
the “traveling cabinet.” In 2010, the district developed the Accelerated Improvement Plan
(AIP) in an effort to increase student performance by having district- and school-level
leaders analyze student data more effectively. In 2012 district leadership implemented the
“traveling cabinet.” A review of the AIP document showed that the “traveling cabinet”
initiative required the central office administrative cabinet to meet every two weeks at a
different school for the purpose of analyzing student data. Further review indicated that
the traveling cabinet practice was intended to engender openness and communication
between district- and school-level leaders and to demonstrate and model how important
district-level leaders valued student data analysis. During his interview, Sean, a senior
district leader, described the traveling cabinet as follows:

90
Last year I started a traveling cabinet meeting, so cabinet meetings are meetings
of central office so it’s Veronica and me, Logan, Cote, and Adrianne, and every
other week we meet in the school. We used to meet up here all the time, but now
we meet in the school and the school knows we’re coming and they’re supposed
to present their data, where they are, what are they doing with their data teams,
what’s their biggest weakness, how are they going to address that, and then
basically what do you need, what more do you need to do your work.
Sean further reported that four of the principle goals of the “traveling cabinet” were to
ensure that:
Data is shown in a very public way. Building-level leaders and staff know that
central office administration is using the student data to make informed decisions.
Data is tied to the teacher evaluation system and analyzing student data is an
essential part of the work. Prior to the 2012-2013 school year, the cabinet had met
weekly at central office, in isolation, without the participation of school-level
leaders.
By traveling to the different schools and allocating substantial time and resources, district
and school-level leaders were demonstrating that collaboration was a high priority. From
the perspective of Sean, the “traveling cabinet” also helped teachers see how the cabinet
analyzed data. In addition, it provided an opportunity for teachers to collaborate with
district level-leaders in their own school and with their own students’ data. Cote, a central
office administrator, discussed what the traveling cabinet had recently seen while visiting
a school:

91
We were at a meeting at a middle school, we had the cabinet there yesterday and
they were showing us these color-coded cards that they had that kind of identified
where the kids were in terms of …growth related to math, and then what
interventions are going on. And then there was talking about sharing that
information with the kids so the kids kind of had an understanding of, oh well,
what the growth means and how it affects overall not only their own learning but
the district and accountability and how to try to raise everyone up.
The traveling cabinet supported the superintendent’s mandate of ensuring that school-
level leaders implemented structures and routines to use student data in their efforts to
increase students’ opportunity to learn. Adrianne, a district level leader, described the
cabinet this way:
We have a traveling cabinet every other Monday with the schools, and his
[superintendent’s] major priority is to be in their data room to say we need to see
the data, we need to see what’s going on. Because that’s the biggest impact I think
we’ve seen last year is people really focusing on those students and scores with
their faces attached and really trying to move kids forward.
Sean justified having a traveling cabinet initiative by saying:
Their issue [school-level leaders] was, there need[ed] to be some non-negotiables
because I’m more, like, bringing people along because my experience is there’s
power and there’s authority. Power lasts while the people are in the room with
you; authority lasts when they leave. And my approach has been you want to gain
authority and not just have power.

92
During interviews with building level-leaders, there was strong evidence that the
traveling cabinet was addressing the need to analyze student data in a uniform approach.
Joe, a school-level leader, said, “People from central office come over and debrief with
us, you know, how we did relative to the district and what standards and that sort of stuff
that you know how kids are approaching.” A document review of two school-level
leaders’ Power Point presentations that had been made to the traveling cabinet revealed
that both of the presentations were comprised of various student data, including the
following areas: MCAS, Demographic, Attendance, Disciplinary, Literacy and Math.
Mandated plans for individual school improvement. Comprehensive district
school improvement and reform comes in many different methodologies and iterations;
using student data to make data-based decisions has been seen in various school districts
(Datnow, 2005; Datnow, Park, & Wohlstetter, 2008; Knapp, Swinnerton, Copland, &
Monpas-Huber, 2006) and it is evident in New Hope School District. Educational leaders
must guide reform through an increasingly complex policy environment, curriculum
standards, and other outside pressures. A review of standards based assessment
documents from the Massachusetts Department of Elementary and Secondary Education
accountability data (2013a) revealed that over a five-year span from 2009-2013, there
was a significant gap in performance between student subgroups and White students in
the New Hope District. For instance, the advanced and proficient performance of White
students surpassed that of the student subgroups in English language arts by fifty-nine
percent. In Math, it was a forty-eight percent gap.
Analysis of interviews and district documents showed that in 2013 district
leadership in New Hope had mandated specific school improvement structures and

93
routines to increase student achievement. The superintendent of schools developed a
structure/routine where every school principal had to develop either (a) a sustained
improvement plan demonstrating continued student growth, or (b) if the school had not
made sufficient progress, an accelerated improvement plan. These specific organizational
structures and routines were deemed key mechanisms for the district improvement
process through which leaders augmented district goals.
A review of the New Hope website revealed that New Hope School District had a
District Improvement Plan (DIP) for the years 2011-2014. The plan stated that the district
was “engaged in using data driven improvement practices throughout the district, and has
provided technical assistance in utilizing a data analysis process to each school.” While
the superintendent of schools deemed it necessary to have a district Accelerated
Improvement Plan, the Massachusetts Department of Elementary and Secondary
Education did not formally require Level 3 districts or schools to have one
(Massachusetts Department of Elementary and Secondary Education, 2013b, p.1). In fact,
only those school districts that were designated Level 4 by the Massachusetts Department
of Elementary and Secondary Education were required to “operate under Accelerated
Improvement Plans [in order] to address systematic challenges” (Massachusetts
Department of Elementary and Secondary Education, 2013b, p.1).
However, Sean, the New Hope district leader, justified the decision to implement
a district accelerated improvement plan as well as individual school plans by saying,
“The approach used to be, throw everything against the wall and hope something sticks,
and if you have fairly good demographics enough would stick to get by. Those days are
over.”

94
Sean also explained that during the 2012-13 school year, the New Hope School
District partnered with the Massachusetts District and School Assistance Center (DSAC).
According to the Massachusetts Department of Elementary and Secondary Education
(2013c), “in accordance with state law, the Department of Elementary and Secondary
Education (DESE) annually classifies the lowest performing 20 percent of schools into
level 3” (p.1). Sean reported that because the New Hope School District was a Level 3
school district, they were given priority for receiving DSAC support. Sean went on to say,
“The DSAC team assisted the district by meeting with school and district leaders monthly,
and sometimes more often, and has supported and assisted us with collaborating,
analyzing data, and creating the Accelerated Improvement Plan (AIP).”
Sean further explained his decision to align the mandate for internal school
improvement plans and accelerated improvement plans with the DSAC system:
[It was] a model that they’re [principals] familiar with and [can] replicate that
model at the school level instead of inventing something new, so that’s very
heavily data driven. And that’s what we’re hearing from all of our principals that
are presenting that have had success it’s been about data-data-data.
Sean implemented a formal structure/routine that incorporated components of the state
compliance model for schools because it incorporated analysis of student data.
In addition, another structure and routine associated with the school improvement
plans was a provision unique to New Hope. In an effort to help further support the
analysis of student data, each school was assigned a central office cabinet liaison. Sean
said, “In a district with over 5,000 students in seven schools, it’s easy to just forget them
[students].” The central office cabinet liaison meets with the principal and continues the

95
data dialogue with an emphasis on supporting the school. Sean is liaison for Jamie, a
school-level leader; Veronica, is liaison for Joe, a school-level leader; Adrianne is liaison
for Mary, a school-level leader; and a contracted retired principal works with Brian, a
school-level leader. Research by Fullan and Stiegel-bauer, 1991; Miller, 2004; and
Whitaker, 1996, support central office administration being the individuals who support
school-level principals.
Further document analysis of the New Hope school improvement plans and
accelerated improvement plans showed that significant emphasis was being placed on
student data; also, there was a level of uniformity among the plans.
School-level leaders indicated different views regarding the plans. For instance,
Joe, a school-level leader, said there was limited usefulness in creating an improvement
plan:
We have school improvement plans and accelerated improvement plans and after
a while it’s just words on paper. Like exercising compliance, you know, you have
to get this done. This is what you have to say, you know, you got to do, so you do
it but it’s not particularly meaningful to somebody.
Jayden, a school-level leader, described his dissatisfaction with the improvement plan in
the following way:
And of course the requirement for us to have an improvement plan is now thirty-
five pages. I just went through it and I’m like, really? We’re supposed to be able
to accomplish – we can’t. The research has been very clear, those who focus, so
that’s why our focus is writing and we’re going really deep in writing, but if we
do well, you know, right now we’re about 50 percent across the board, open

96
response and long comp, well, we’re going to get it to 75 and then watch our
scores go up. But there are a thousand things out there to improve scores. I can
show you where I can improve scores in 25 percent in less than a year. That’s
been one of the reasons why this school was a level three and now in one year is a
level two. Our goal in the second year is to be a level one.
Jayden also expressed frustration that while the district had mandated increased student
data collection, there was a lack of training on how to best use that data, he reporting:
I’m not sure they’ve trained us very well and some people might need better
training on how to use that data to drive instruction. One example that I can say
that I believe empirically that’s not, is a sixty-five page district improvement plan.
However, other administrators found the school improvement plans beneficial.
For instance, Jamie, a school-level leader, said, “Our school improvement plan, which is
on our website, I think that has a lot of stuff that’s pertinent. We’re using it. It’s not just a
cyberspace dust collector.” Veronica, a central office administrator, reported, “I’m not
sure that it’s a cohesive district thing, although maybe at the superficial level it looks that
way, but the strength is still at the school level and that’s almost better.” When Veronica
was asked if the collaboration was genuine, she responded:
That collaboration is genuine, strong and deep; school to school not so much. It
looks similar, it looks like there’s a through line, all of that’s true, and some of
our schools are stronger collaborators with each other than others. Some of our
elementary [schools] are very strong, but it’s really still leadership and personality
driven.
In addition, Kaydence, a district level-leader, saw value in the plans:

97
[The] superintendent and the assistant superintendent provide guidance on what
needs to be included in the improvement planning. Some of it is compliance.
We’re a Title I district. Except for our high school and alternative high school,
we’re all school-wide Title I, so some of those things were required. But then it’s
kind of interesting, they’re required for a reason, because it’s really good practice,
I mean overall, and I think that’s what you end up seeing when we start doing this
type of stuff and have some kind of early wins on.
School-based instructional coaches. The work of district- and school-level
leaders evolved over time. This finding demonstrated that the leadership in New Hope
deliberately changed course on how the district analyzed student data by implementing an
instructional coach structure/routine. During the interview with Sean, he explained that
throughout the 2012-13 school year, New Hope School District had partnered with the
Massachusetts District and School Assistance Center (DSAC) as a result of its Level 3
status. The Massachusetts Department of Elementary and Secondary Education (2013b)
assigned a DSAC team to the New Hope School District comprised of a regional
assistance director, a professional development coordinator, as well as others with
expertise in the areas of data, math, and literacy. The basic premise of the DSAC team
was to “collaborate with districts to assess their strengths and needs, facilitate access to
resources and professional development, establish partnerships and networks, and deliver
individualized assistance for the region's districts”(Massachusetts Department of
Elementary and Secondary Education, 2013b, p.1). During the preliminary review by the
DSAC team, Sean reported that the team said he was not “hierarchical” enough and he
commented:

98
I was kind of cited on by the advance, by the team, that came to review this, that I
wasn’t hierarchical enough basically to say something like this. Basically they
said you’re too collaborative, and I thought, hmm, everything that you recognize
for being what you expect in charter schools about encouraging the teachers,
letting them take ownership, I do it and you criticize me for it, but they do it and
it’s the best thing since sliced bread. I mean it was a pretty ugly conversation.
Sean went on to say that he was in his eighth school year (2012-2013), the district had not
been making progress, and “things needed to change”:
Last year at this time nothing had happened. All of our schools were flat, the
scores weren’t going up, and I was like oh, my gosh, this is awful. So now I’ve
told them [school-level leaders] all my goal is to make this a level one school
district, so if you have a school that’s a level three and you’re not doing anything
to move it up that’s not going to work because we will always be the level of our
lowest performing school, so now the flames been turned up and you got to
deliver. But we’ll provide everything you need, you know, just tell us what you
need.
Sean reported that during several meetings with other members of the district leadership
team, including several principals, they all brainstormed about ways to improve. The
general theme that emerged was that there was too much data for individual schools,
teams and teachers to use effectively. Sean described the problem this way, “It was as if
teachers were drinking out of a fire hose and by instituting instructional coaches the
principals could have a cadre of people to help have professional learning team leaders to
help review school and student data.”

99
As a result, district-level leaders in New Hope decided to rebuild the instructional
coaching structure/routine, which had begun in 2009 with the premise that instructional
coaches would support frequent student data review, perform classroom observations,
and present varying teaching methods in language arts and math. Essentially, the district
leaders attempted to create a structure/routine that supported school-level leaders’ and
teachers’ practice of analyzing student data. Prior to the 2012-2013 school year, which
was when the district instituted full-time literacy and mathematics coaches at all of the
schools, the Title 1 director oversaw different programs intended to support students and
staff. Sean described this old model of support in this way:
The Title I director here had four secretaries when I came, so the resources were
really apportioned to an old model. We had no coaches; now we have full time
math and ELA coaches in all of the schools, so we’ve shifted a lot. Upstairs, the
special education department had six secretaries and two assistant directors and
the director, and now there’s the director, two assistant directors who are almost
never in their offices, they’ve all been assigned schools, and one secretary. So it’s
because we’ve moved a lot of the work into the schools.
By assigning instructional coaches to each building, there was the appearance of more
consistency created to review student data. As documented in the New Hope District
Improvement Plan, the instructional coaches were not only supposed to help work with
student data, but also “provided embedded professional development, modeling, peer-
coaching, and mini-content workshops” to help address district and school goals (New
Hope District Improvement Plan).
The district changed from an old model to a new uniform plan of action with the
100
goal of helping students achieve at a higher level. Kaydence, a district level leader,
described her role in the instructional coach structure/routine as the following:
We have a pretty significant coaching initiative in the district and that started with
math coaches, so those were kind of both between myself and the assistant
superintendent in charge of curriculum. That coaching initiative is a pretty
significant part of my role here as well I oversee that.
Kaydence went on further, describing how she saw the positive changes that central
office had implemented using data via coaches this way:
We at the central office are out helping them analyze their benchmark data, and
then the coaches are working, they do coaching cycles and part of that is kind of
an intensive nine-day coaching cycle that they’re involved with so that they’re
doing on demand coaching but under that nine-day they’re working the
instructional model which is launch, explore, summarize type of thing, but then
how the formative assessment’s embedded in that.
Joe, school-level leader, described the new model, saying the following:
Yeah, I have full time math and literacy coach. They’ve added some district level,
like curriculum people do that, so I think there’s definitely a movement towards
less autonomy more of a uniform reports like a lesson plan, lesson plan template,
standards-based classroom, what should that look like, what does it sound like. I
think there’s definitely been more movement towards that. I think teachers are
actually too inundated with data to actually make sense of it all in a meaningful
way to influence instruction.
The strength of the instructional coach routine/structure was the ability to help

101
teachers use student data to inform instruction. Bill, a school-level leader, emphasized
how data and the accompanying accountability put more responsibility on the teachers to
change instruction so that students were better able to learn:
Teachers now look at [data] and the progress monitoring piece of that, and it
impacts my instruction and my responsibility because it’s so, it’s so obvious of
where we need to make gains, or where potentially we really want to make gains,
um, and then having that, and I don’t want to say that accountability piece as an
negative, but that accountability slash assessment piece provides you with that
information that you can look at and say, ‘Geez, you know, my children are
making great gains, or I’m a little frustrated that Johnny and Susie aren’t making
the gains so maybe we can go back and change something within my instruction.’
So that use of data has made it, I think increasingly clear for teachers around their
practice.
The instructional coach structure/routine also led to some cultural challenges. Joe, a
school-level leader, discussed how instructional coaching presented challenges affecting
the culture in his building:
The coaches help some. A coach will cover class so this one [teacher] can go
watch [another] one. But then you run into, so you want me to go watch so-and-
so; are you saying that so-and-so is a better teacher than I am that’s why? And
then the teacher that, you know, well, I don’t want anyone to think that I think I’m
teacher of the year so why are you having people come watch me. So that’s why I
think that collaboration piece, when you’re doing lesson planning together, if you
have two sixth grade math teachers that are planning their lesson together, all

102
right, I’ll go watch you teach it Thursday and you come watch me teach it Friday,
that sort of stuff, so it takes like the whole competition type of thing out of it.
However, all but one school-level leader expressed that although there was a great
deal of collaboration in the district resulting in leaders’ understanding of barriers, central
office was not actually supporting school-level leaders and the work that was being done
at the building level. Clearly, the instructional coaching model was embedded into the
New Hope School District K-12. However, just how the instructional coaches functioned
in each building appeared to be slightly different.
For instance, Sharon reported that her staff used coaches, but her school did not
have full-time formal literacy and math coaches assigned. Rather, they had to access
coaches via the regular high school:
Yeah, we have coaches as well. And then you have—it is central office, but out
there right now is [a] Special Education [coach], working with our Special
Education teacher. There has to be collaboration. Again, data is critical because of
our clientele.
Jayden, another school-level leader, stated there is “not enough nuts and bolts from
central office, the umbrella is there but the nuts and bolts is not.” Jayden went on to
describe the coaching model this way:
Yeah, there’s coaches…and they’re coming in working with us and so, you
know, that’s a plus. But those are new systems so they’re not quite integrated
completely, and I think because of lack of standardization it’s a little hard to come
across with a – although you want to keep the individuality so it’s a balance,
sometimes it’s hard.

103
Responding to a question of how does central office support building leaders analyzing
student data, Joe stated: “I don’t think they do support it. I think central office has their
own issues, and I think a lot of times they solve them at the school level and think, well
this problem is solved so it’s gone, it’s off my plate, now it’s down there.”
This theme that the structure/routine of instructional coaches provided by central
office was not helping was echoed by Brian who, in response to an inquiry regarding
whether or not central office supported him as he attempted to address resistant teachers
at his school, stated, “Oh yes, absolutely.” However, when asked if central office
supported him with initiatives at the building level such as his efforts surrounding the use
of data, he boldly replied, “No” and went on to say: “Central office hasn’t done any
training with student data, they have asked us and required us to do is have a data room
and data walls.”
District leaders did not discuss whether the expertise of the instructional coaches
was an issue. Roehrig, Bohn, Turner and Pressley, 2008 reported that those leaders who
provide school-level leaders and teachers support should be skilled in content and
pedagogy and should have structured opportunities to share relevant experiences and
knowledge with those that they are coaching. Finally, in New Hope, the newly introduced
instructional coaches structure/routine appeared to be an attempt by central office
administration to provide greater support to school-level leaders. However, the school-
level leaders indicated that that there continued to be a lack of meaningful collaboration.
Discussion
The research described in this dissertation was motivated by an interest in the
structures and routines that district-and school-level leaders use to analyze student data.

104
This case study specifically examined which data analysis structures and routines district-
and school-level leaders perceived as essential in understanding and addressing
disparities in student performance. As reported earlier, those school organizations that
demonstrate effective institutionalized leadership practices with a distribution of
leadership via principals, department heads, teacher leaders, and other players have been
identified with experiencing school success (Murphy, & Hallinger, 1998, Leithwood et
al., 2004; Marzano et al., 2005). Sean, the New Hope School District superintendent,
encouraged school-level leaders to accept responsibility for school success by supporting
the idea that every school-level leader had an opportunity to demonstrate leadership in a
distributed capacity. Honig et al. (2010) further conveyed that district leadership in
coordination with school-level leadership plays a critical role in building school system
capacity.
Effective district-and school-level leadership is important to educational
organizations. The specific structures and routines that were implemented by district-
level leadership in New Hope School District were explored by using (a) Spillane’s
(2006) description of structure: “go-betweens in our interactions with others in and on the
world,” (p. 75) and (b) Feldman and Pentland’s (2003) definition of routine: “a repetitive,
recognizable pattern of interdependent actions, involving multiple actors” (p. 95).
Furthermore, the leaders’ perceptions of structures and routines were explored using a
distributed leadership lens in interview and document analysis (Spillane, 2006; Spillane,
Halverson, & Diamond, 2001, 2004). Using the distributed leadership framework allowed
the researcher to concentrate on the activity of leadership (structures and routines) rather
than focus solely on the leaders.

105
Conclusions based on the findings showed that district- and school-level leaders
in New Hope were working to provide students an equal opportunity to learn by putting a
priority on the analysis of student data. In fact, Veronica, and Kaydence, both district
leaders, spoke of book studies, with Kaydence sharing that “one of the very first book
studies that we did was Nancy Love’s Using Data/Getting Results.” In addition, Sharon, a
school-level leader recognized that central office had also trained administrators to work
with teachers on how to use data. In effect, the findings specifically concluded that
district leadership demonstrated that there was a priority placed on creating structures and
routines, as evidenced by the following findings: (a) a mandate for public display of
student data using data war-rooms and student data walls; (b) the traveling cabinet; (c)
district mandated school accelerated/improvement plans; and (d) the implementation of
instructional coaches.
March (1981) highlights the need to look at both stability and change in an
organization: "Changes in organizations depend on a few stable processes. Theories of
change emphasize either the stability of the processes or the changes they produce, but a
serious understanding of organizations requires attention to both," (p. 563). This
researcher’s analysis of New Hope School District revealed that the structures and
routines that were enacted were due to the exogenous factor of the state mandated policy
of accountability for adequate yearly progress. Specifically, it was revealed that the Level
3 status of the school district was a catalyst for change in New Hope. As a result of this
Level 3 status assigned to the district, New Hope leaders were afforded an opportunity to
work with a DSAC team to analyze systemic challenges related to students’ opportunity
to learn.

106
This partnership with DSAC also led to the creation of an Accelerated
Improvement Plan (AIP) that enhanced collaboration, organizational structures and
routines, and professional learning. More specifically this catalyst for change resulted in
actions that were purposeful, developmental, and aligned, ensuring that the catalyst
stimulated the process for district wide change within all the schools. Furthermore, the
new structures and routines resulting from the Accelerated Improvement Plan were
implemented as a result of deliberate vision and creativity from within the district
leadership system (Leithwood, & Riehl, 2003). Figure 5.3 highlights how the
Massachusetts Level 3 status assignment prompted the New Hope School District’s
implementation of new structures and routines for improving student performance. By
providing vision, focus, support and coordination of district wide improvement, these
data analysis structures/routines prompted change within the district (Feldman &
Pentland, 2003; Marzano & Waters, 2009; Sherer & Spillane, 2011). However, district-
wide efforts to align formal goals and strategies fall short without substantial support
from central office administration (Corcoran, Fuhrman, & Belcher 2001; Marzano &
Waters, 2009).

107
Figure 5.3. New Hope School District's Catalyst for Change Model
Indeed, structure is more than just a linear model of who is responsible for what, and who
supervises whom; structure can also be less tangible. In this instance, the institutional
structures and routines implemented in New Hope were shown to help organize the
district’s goals. This was evidenced by how district- and school-level leaders used
structures and routines to engage in analyzing student data on a regular basis. Moreover,
a document review of the AIP and interview data revealed that leadership within the
district had flattened, to a degree, by giving school-level leaders more responsibility for
Exogenous Catalyst for Change (District Level 3 Status)
A mandate for public display of student data by using data war-rooms and student data walls.
A traveling cabinet ensures uniform review of student data.
Mandated plans for individual school improvement.
Implementation of school-based instructional coaches creates
opportunities for student data review.

108
their work (Harris, 2013). One example of this flattening of the leadership within the
district was evidenced by the traveling cabinet, which shifted the focus away from central
office administration analyzing student data in isolation to analyzing student data with
school-level leadership participating. A practical benefit of implementing the traveling
cabinet was that it enabled multiple individuals (district- and school-level leaders) within
the organization to work collaboratively with one another (Spillane, Parise, & Sherer,
2011). For instance, the traveling cabinet structure also supported the routine of ensuring
that district- and school-level leaders as well as teachers were regularly engaged in
ongoing discussion and analysis of the same student performance data. This was
evidenced by Jayden’s explanation of how important looking at student data was:
Teachers are understanding that it’s a data-driven system, and that decisions have
to be based on that data. What we’re trying to find right now is—what data to
drive our systems? And…that has helped us to collaborate….We’ve realized that
if we’re all going in the same direction, and we’re all looking at—and working on
and using that—we overcome barriers. We open up communication lines.
Furthermore, the study confirmed that leaders also perceive specific structures
and routines as important when analyzing student data. Elmore (2000) states,
“administration in education…has come to mean not management of instruction but the
management of the structures and processes around instruction” (p. 6). Although, some
may argue that data analysis structures/routines have the potential to stifle
experimentation and can “contribute to mindless action, deskilling, demotivation, and
inappropriate responses to problems (Feldman & Pentland, 2003). In New Hope School
District the structures and routines developed to enhance student’s opportunity to learn

109
helped improve the practice of analyzing student data by serving “various functions
including enabling efficient coordinated action, reducing conflict about how to do
organizational work, and storing organizational experiences” (Spillane, Parise, & Sherer,
2011). Spillane (2013) states that the advantages of organizational routines are that they
“allow efficient coordinated action; [provide] a source of stability; and reduce conflict
about how to do work”. This was evidenced by how district- and school-level leaders
were analyzing student data with uniformity district wide K-12.
The implementation of certain structures and routines within New Hope School
District created a mechanism for engaging district- and school-level leaders in
collaboratively reviewing and analyzing student data. The findings also indicate that
implementing school improvement initiatives district wide has built district- and school-
levels leaders’ capacity and encouraged school-level leaders to accept responsibility for
individual school success. This distribution of leadership also helps provide a broader
base of support so that when new programs or initiatives are instituted, the likelihood of
success is greater. Furthermore, by integrating distributed leadership practices within
New Hope School District have become less likely to be impacted by the leadership
practices of one leader working in isolation.
Staying the course while traveling through the rocky waters of system-wide
district change is a struggle for district-and school-level leaders. The amount of
questioning that occurs from outside forces, as well as those skeptics who reside within
the organization, can be overwhelming at times. The following quote from Sean exhibited
this sentiment:
There are all these different variables…it’s kind of like trying to align the moon,

110
the tide and the wind to get from A to B on a stormy night. Like I said, I’m
encouraged by what I’m seeing, but then again I don’t know?
The structures and routines that the New Hope District has implemented are: (a) a
mandate for public display of student data using data war-rooms and student data walls,
(b) a traveling cabinet ensures uniform review of student data, (c) mandated plans for
individual school improvement and (c) implementation of school-based instructional
coaches creates opportunities for student data review, offers building leaders oversight of
student data and provides consistency across the district in terms of the use of data driven
practices at the building level. Keeping these structures and routines intact increases the
likelihood that knowledge and resources will continue to flow through the network of
leaders, ultimately informing their practice (Daly & Finnigan, 2010).
Implications for Practice
Current public policy demands that district leaders use student data to make
informed decisions. The use of organizational structures/routines that district- and school-
level leaders institute to enhance the organization’s mission have significant potential.
Structures/routines are often thought of as non-innovative “inhibitors of change”
(Spillane, Parise, & Sherer, 2011). However, both the review of the literature and
research affirmed that school district leaders understand that there is neither a silver
bullet nor a single quick fix approach to using structures/routines to analyze student data.
As evidenced in this case-study, the opposite is true in that “organizational routines-
multi-actor, interlocking, reciprocally-triggered sequences of actions-are a major source
of the reliability and speed of the organizational performance. Without routines,
organizations would lose efficiency as structures for collective action” (Cohen &

111
Bacdayan, 1994). Rather, consistent leadership with a clear focus has the best chance of
producing opportunity for all. In fact, creating multiple pathways to ensure that student
data is being used effectively is essential and in this time limited case-study the leaders
have designed organizational routines in part due to the lack of district-wide student
progress. With the current requirements of using student test-based achievement data in
the forefront of district accountability, uniformity in data analysis structures/routines is
necessary. A uniform organizational structure/routine to analyze such student data can
contribute to stability, provide a common language, reduce potential conflict about which
data is important, and help provide an overall framework of responsibility (Sherer, &
Spillane, 2011; Cohen & Bacdayan, 1996; Feldman, 2000; Feldman & Pentland, 2003).
While structures and routines do not guarantee improved student performance they
should play an integral role in district- and school-level leadership in the 21st Century.
The challenge for district leadership is striking an effective balance between requiring a
certain level of structures and routines while allowing school-level leaders to operate with
autonomy.
Study Limitations. Within any study, limitations exist. This research team
consists of four doctoral candidates who are working as administrators in public school
districts that are attempting to address disparities in student performance. Each of our
districts has different approaches to this work. As a result, we bring different experiences
and perspectives to the analysis process. Because of my own personal and professional
background and viewpoints, it is important to note that I may have shared certain
characteristics with participants.
Merriam (2009) states that researchers are the primary instrument in the data

112
collection and analysis process, therefore, biases may influence the research study. Rather
than try to remove the biases, it is essential to “identify them and monitor them as to how
they may be shaping the collection and interpretation of data” (Merriam, 2009, p.15). The
most significant threat to the internal validity of this portion of the study is that I also
serve as a district-level leader. Because of this, the potential response bias includes the
possibility of study participants altering their responses in order to provide information
they believe the interviewer [would want] to hear (Miles, Huberman, & Saldaña, 2014;
Saldaña, 2013). One way to counter this would have been to have subsequent interviews
with participants.
Another significant limitation of the study was the fact that the research team was
not able to interview two school-level leaders. Both school-level leaders who did not
participate were afforded confidentiality. The research team went so far as to offer
various interview options and methods for participation, allowing the participants to
answer the questions via email. As a result of not having the interview data from these
two individuals, there was a real limitation of the reported data. The study was also
limited by the fact that teaching staff was not interviewed as part of this study further
restricting the ability to generalize.
An additional limitation of this study was that the generalizability of the findings
was limited because it was a study of one district at one point in time. Furthermore, it was
too soon to get test data to know if improvements occurred over time as a result of these
initiatives. Conducting future research involving multiple districts that are implementing
the same structures and routines may prove to be a beneficial research topic, especially if

113
future research was able to look at longitudinal student achievement data to see if the
structures/routines were having an effect on student performance.

114
CHAPTER SIX5: DISCUSSION AND RECOMMENDATIONS
This research study applied the distributed leadership theoretical framework to
explore the following research questions: How do district- and school-level leaders
understand disparities in student performance related to race/ethnicity, class and/or
disability? How do these understandings then influence the work of leadership that
focuses on addressing disparities in race/ethnicity, class, and/or disability? The
distributed leadership framework allowed for a focus on interactions and the practice of
leadership (Spillane, 2006; Spillane et al., 2004; Spillane et al., 2009; Spillane & Sherer,
2011). Specifically, the practice of leadership focused on the interactions of district- and
school-level leaders and aspects of their work such as the tools and routines utilized to
address disparities in student performance and broaden students’ opportunity to learn
(Spillane, 2006; Spillane & Sherer, 2011).
In this study, four researchers (Allwarden, 2014; Potenziano, 2014; Talukdar,
2014; Zaleski, 2014) examined specific actions of district- and school level leaders as
they engaged in the work of understanding and addressing barriers to students’
opportunity to learn. In an attempt to answer the overarching research questions, each
researcher examined separate aspects of the central phenomenon, including:
• The specific shifts in thinking that district- and school-level leaders identified as
needed before disparities in student performance related to race/ethnicity, class,
and/or disability could be effectively addressed, as well as the strategies district-
and school-level leaders used in their attempts to prompt these shifts in thinking
(Allwarden, 2014).
5 Chapter Five was co-authored by Ann F. Allwarden, Phillip J. Potenziano, Sujan S. Talukdar, and Karen J. Zaleski.

115
• The professional learning leveraged by district-level leaders for school-level
leaders as an action to further learn about, understand, and address the barriers
that may be inhibiting students’ opportunity to learn (Talukdar, 2014).
• The data analysis structures and routines that district- and school-level leaders
perceived to be essential in understanding and addressing disparities in student
performance related to race/ethnicity, class, and/or disability, as well as
promoting students’ opportunity to learn (Potenziano, 2014).
• The influence that interactions between district- and school-level leaders had on
their understanding of barriers to students’ opportunity to learn, as well as the
influence that existing ties between district- and school-level leaders had on their
practice aimed at improving students’ opportunity to learn (Zaleski, 2014).
The following discussion synthesizes insights drawn from the four individual
studies. These insights were gained by searching for complementary results based on the
“complementarity model of triangulation” (Erzberger & Kelle, 2003, p.469). Applying
the complementarity model of triangulation involved reviewing the individual studies for
findings that complemented one another. Because the complementary findings were
drawn from individual studies that highlighted very different aspects of the central
phenomenon, these findings offer a stronger depiction of the topic being analyzed
(Erzberger & Kelle, 2003) and further inform current understandings about the work of
leadership focused on addressing disparities in student performance and enhancing
students’ opportunity to learn.

116
Complementary Findings
Level 3 status: Catalyst for change. Gioia and Chittipeddi (1991) emphasized
that initiating change often triggers cyclical patterns of acquiring knowledge and taking
action. Insights from across the studies revealed that the designation of Level 3 state
accountability and assistance status served as a catalyst for change in the New Hope
School District. The assignment of Level 3 status led to the development of new
organizational structures and routines, which, in turn, supported patterns of acquiring
knowledge and taking action. Specifically, the development of new organizational
structures and routines led to (a) increased opportunities for leaders to interact with one
another and (b) enhanced opportunities for leaders to engage in professional learning.
Furthermore, since the structures and routines described by district- and school-level
leaders occurred regularly (e.g., weekly, monthly, quarterly), leaders were provided with
ongoing support as they grappled with understanding—or further developing their
understanding—of barriers hindering students’ opportunity to learn. Additionally, the
development of new organizational structures and routines provided leaders with a forum
for presenting their plans for addressing disparities in student performance, as well as
presenting the outcomes that resulted from actions taken. Ultimately, the opportunities
that accompanied the establishment of new organizational structures and routines further
supported and strengthened the development of shared understandings among district-
and school-level leaders regarding why particular student performance gaps exist and
how to most effectively address existing performance gaps.

117
Figure 6.1 depicts the relationship between the catalyst for change, the development of
organizational structures and routines, and the increased opportunities for leader
interaction and professional learning. Figure 6.1 also illustrates the relationship
Figure 6.1. The Interrelationship of Elements Studied
between these three elements and leaders’ ability to frame problems, solutions and
constituencies related to disparities in student performance. While the individual
researchers of this study looked at specific aspects of leadership in isolation, Figure 6.1
offers a broader, more complete picture of how these elements interacted and influenced
one another in real life.
As a result of the Level 3 status, district-level leaders sought out and established a
partnership with the District and School Assistance Center (DSAC), a state sponsored
organization. This partnership led to the establishment of new structures and routines
which afforded on-going opportunities to conduct in-depth analyses of (a) disparities in
student performance, (b) barriers in the learning environment, and (c) organizational
challenges related to students’ opportunity to learn. Grogan and Shakeshaft (2011)
emphasize the importance of analyzing situations in an objective fashion and framing
issues from a different perspective when working to address long standing disparities in

118
student performance. The partnership with DSAC led to the construction of structures
and the development of routines that supported this aspect of leadership work.
As leaders came together to analyze disparities in student performance, barriers in
the learning environment, and organizational challenges related to students’ opportunity
to learn, the learning environment within the district was further enhanced. The
interactions that took place within this learning environment between district- and school-
level leaders were examined as a critical element relating to school improvement (Daly &
Finnigan, 2010, 2011, 2012). Sean’s statement captures the value of these interactions
when he offered, “The DSAC team assisted the district by meeting with school and
district leaders monthly, and sometimes more often, and has supported and assisted us
with collaborating, analyzing data, and creating the Accelerated Improvement Plan
(AIP).” Frequently, interactions between district- and school-level leaders occurred
during ADCO, FADCO and traveling cabinet meetings. These meetings offered leaders
regular opportunities to engage in professional learning that enhanced their capacity to (a)
identify and describe gaps in student performance and (b) consider and explore potential
barriers to student learning. In other words, these meetings offered leaders opportunities
“to engage in continuous and sustained learning about their practice in the setting where
they actually work...confronting similar problems of practice” (Elmore, 2004, p. 127).
Finnigan and Daly (2010) remind us that sharing knowledge and mobilizing
resources embedded in individual interactions is critical to influencing practice and
enhancing success in “purposive action” (p. 180). The assignment of Level 3 status
triggered the mobilizing of resources to develop new structures and routines which then
enhanced leaders’ ability to share knowledge and take purposive action. Purposive action

119
taken by district- and school-level leaders included attempts to prompt a common set of
shifts in thinking, which focused on distributing across the district a shared understanding
that would support collective action. The actions taken were deliberate (thought about
and discussed), developmental (designed to assist with growth and bring about
improvement), and progressive (kept moving forward), with the intent of ensuring that
students’ opportunity to learn was enhanced. These actions supported understanding
student performance disparities and informed solutions to address barriers to students’
opportunity to learn.
The leaders in the New Hope School District also used organizational routines
and structures to help distribute leadership responsibilities (Spillane, 2006). Prior to the
Level 3 designation, structures and routines were in place that required district- and
school-level leaders to meet. However, leaders were not required to collectively identify
and develop a shared understanding of achievement disparities. Following Level 3
designation, enhanced and newly created structures and routines helped promote
collaboration and build robust intra-organizational ties (Chrispeels, 2004; Honig, 2004;
Togneri & Anderson, 2003). The use of the structures and routines also played a critical
role in guiding the New Hope School District in their development of a clearly aligned
vision and mission (Harris, Leithwood, Day, Sammons & Hopkins, 2007; Waters &
Marzano, 2006).
Structures and routines led to shared understandings and collective action.
New Hope School District leaders described specific structures and routines that had been
set in place to support collaboration between district- and school-level leaders, as well as
to support data use practices. The Administrative Council (ADCO), Full Administrative

120
Council (FADCO), traveling cabinet, DSAC meetings, and the Accelerated Improvement
Plan (AIP) were examples of structures and routines put in place to support collaboration
and data use among district- and school-level leaders. In addition, these structures
allowed leaders to engage in ongoing professional learning. Spillane (2006) describes this
leadership practice as “a product of the joint interactions of school leaders, followers, and
aspects of their situation such as tools and routines” (p. 3).
According to the distributed leadership framework, the structures used within the
New Hope School District can be thought of as tools and routines because they involved
recurring patterns of “interdependent actions, involving multiple actors” (Feldman &
Pentland, 2003, p. 311). For instance, the traveling cabinet structure supported the routine
of leaders meeting regularly to engage in ongoing professional learning that involved the
frequent review and analysis of student performance data. Established structures and
routines also sought to allow district-and school-level leaders to develop an
understanding of the opportunity gaps present in the learning environment. The action
planning template and the AIP that leaders created in partnership with DSAC facilitated
this understanding. As a result, leaders’ ability to recognize barriers was evident in the
areas of leadership skills, curriculum alignment and implementation, and instructional
practice. More specifically, leaders identified barriers specific to students with
disabilities, students from low income households, Latino/a students, and English
language learners (ELL).
Additionally, the implementation of enhanced and newly developed structures and
routines helped to expose inequitable practices in the New Hope School District. District-
and school-level leaders interviewed consistently referred to students receiving special

121
education as the sub-group most impacted by the achievement gap in the New Hope
School District. Research findings revealed that one of the barriers to student learning for
students with special needs was inequitable access to the general education curriculum.
Greene (1983) explains that equality in education focuses on “inputs” and ensures that
the same is provided to all, while equity places emphasis on “outputs” and focuses on
achieving the same outcomes for all. Lindsey et al. (2009) contend accommodations that
account for differences, such as race and ethnicity, language, and ability, are sometimes
needed in order to achieve educational equity.
Students receiving special education services in the New Hope School District
were often educated in separate and substandard settings. Research evidence revealed
there were some schools that deliberately encouraged equitable learning environments for
students receiving special education services. When comparing schools across the
district, data indicated that schools utilizing co-teaching and inclusion models earned
higher state accountability ratings than those that did not. By differentiating instruction to
meet the needs of all students within the general education classroom, school staff moved
closer to creating educational equity while improving students’ opportunity to learn.
When examining how district-level leaders sought to leverage professional
learning opportunities in the New Hope School District, leaders took advantage of
improved structures and routines resulting from the DSAC partnership. Knapp (2003)
reported “professional learning could involve changes in one’s capacity for practice (i.e.,
changes in professionally relevant thinking, knowledge, skills, and habits of mind) and/or
changes in practice itself (enacting the new knowledge and skills in one’s daily work)”
(pp. 112-113). New structures and routines, such as traveling cabinet meetings, not only

122
resulted in increased interaction between leaders, but also offered occasions for leaders to
build their data analysis and decision-making capacity. Further, structures and routines
promoted sustained, job-embedded professional learning (e.g., ADCO, FADCO, and
traveling cabinets meetings, learning walks, and 9-day instructional coaching cycle) and
allowed for frequent collaboration and discussion of factors influencing teaching and
learning. Given the evidence of deficit thinking that existed among school staff,
particularly as it related to students with disabilities, district leaders also sought to
leverage professional learning to prompt needed shifts in thinking.
As district- and school-level leaders’ understanding developed, so did their ability
to influence how others understood factors contributing to disparities in student
performance related to race/ethnicity, class, and/or disability. Influencing how others
understand a situation is a critical aspect of leadership work, and the ability to effectively
frame the problems, solutions, and constituencies related to disparities in student
performance related to race/ethnicity, class, and/or disability becomes a powerful means
for shifting the thinking of others. When effectively done, influencing how others
understand a situation can positively impact individuals’ perceptions of their work and
provide a powerful source of inspiration and motivation (Awamleh & Gardner, 1999;
Goldman & Ospina, 2008). The interactions that occurred among district- and school-
level leaders as a result of new structures and routines not only led to a shared
understanding of student performance gaps and appropriate responses, they also
contributed to leaders’ attempting to prompt a common set of issue- and constituency-
related cognitive shifts, which included:

123
• Heighten awareness, increase importance, and create a sense of urgency
regarding a problem (or need) related to disparities in student performance
• Accept/Embrace a solution for addressing disparities in student performance
• We are responsible for helping all students experience high levels of academic
success.
• We can learn from one another.
As leaders attempted to prompt this set of cognitive shifts, the work of leadership (which
includes the managing of meaning for others) was further distributed across the district.
The interactions and professional learning that occurred among leaders as a result
of the structures and routines that were in place not only led to an understanding of the
nature of the gap, it also led to an influence on their work, which focused on addressing
disparities in student performance. Specifically, leaders recognized that ongoing data
analysis was critical to teaching and learning improvements. The task of analyzing data
was distributed among all leaders for the specific purpose of improving the professional
capacity to identify gaps in learning with the goal of eliminating barriers. For instance,
when looking at data, one building leader recognized that low income and Latino students
lacked opportunities pertaining to course placement; it was then brought to the attention
of a district leader who subsequently mandated that all students take at least one
Advanced Placement course prior to graduation. Similarly, as a result of student
performance data analysis, several building-based accelerated improvement plans were
strategically created and utilized as tools across the district to enhance the learning
environment. The Accelerated Improvement Plan included specific initiatives and
objectives that were designed by school and district leaders as tools to guide their work in

124
an effort to eliminate identified barriers and enhance student opportunities to learn.
Harris, Leithwood, Day, Sammons, and Hopkins (2007) remind us that school
improvement based on a distributed leadership model is not automatic, rather, “much
depends on the way in which leadership is distributed, how it is distributed and for what
purpose” (p. 9). The strategic approach utilized to address barriers in the learning
environment in the New Hope School District as mentioned above reinforces that they
subscribed to a distributed leadership model.
Student learning is enhanced regardless of tie relations. District- and school-
level leaders revealed that they were engaging in a variety of practices to enhance
students’ opportunity to learn at the school and district level. This was evident regardless
of whether or not trusting ties were formulated and existent between individuals. For
example, to prompt shifts in thinking and practice among principals and school staff,
district leaders fostered and leveraged professional learning activities. Interview
responses suggested professional learning played a role in the way some thought about
and in-turn approached their work with particular sub-groups of students (e.g., students
with disabilities). In addition, some district- and school-level leaders appeared more
willing to learn from the best practices of schools realizing academic growth. One of the
ways in which these educators were able to learn more about successful schools was
through professional learning activities (e.g., book studies, belief surveys, case studies,
and resource sharing). Another example was that although Jamie shared no outgoing tie
connections with building leaders, she acknowledged that she engaged in efforts with Bill
and Joe to create a school within her school to address students and subgroups with risk
factors such as poor attendance, retention, and high discipline referrals.

125
Finally, the systems and structures (ADCO, FADCO, Traveling Cabinet)
supported leaders with enhancing students’ opportunity to learn across the district. One
school in the district did move from a Level 2 to Level 1 status last year; this is the
highest performance rating assigned by the state. District leaders were diligently working
with principals to close gaps in performance via the structures in place, and District
leader Sean was working with principals on improvement planning at the building level.
District leader Alicia also worked with principals on attendance, dropout rates, and
graduation rates within a four-year period of time. Although there was a lack of tie
relations at the building and district level this did not result in initiatives being stalled.
Rather, despite the nature of relations in the New Hope School District, the
organizational structures in place resulted in both building and district leaders being
actively engaged in practices that were intended to support enhancing students’
opportunity to learn. Both group and individual findings informed researchers, resulting
in the development of recommendations for practitioners, policy makers and research.
Recommendations for Practice
First and foremost, we recommend that the New Hope School District keep
organizational structures intact. ADCO, FADCO, and the traveling cabinet offer building
leaders direct oversight and support from central office leaders. Spillane (2013) states
that the advantages of organizational structures and routines are that they “allow efficient
coordinated action; [provide] a source of stability; and reduce conflict about how to do
work”. Furthermore, the use of organizational structures/routines that district- and school-
level leaders institute have significant potential to enhance students’ opportunity to learn.
This was best evidenced in the New Hope School District when district- and school-level

126
leaders analyzed student data with uniformity district wide K-12, resulting in at least one
school closing achievement gaps and advancing to Level 1 status.
Any school district that has an opportunity to learn gap should consider
developing and implementing the types of structures and routines outlined in the New
Hope School District. These types of structures and routines increase the likelihood that
interaction among administrators will take place which will allow knowledge and
resources to flow through the network of leaders, ultimately informing the work of
practitioners (Daly & Finnigan, 2010). Sustainability is also likely enhanced when these
structures and routines are in place. Hargreaves and Fink (2006) emphasize “sustainable
leadership matters [as it] preserves, protects, and promotes deep and broad learning for
all in relationships of care for others” (p. 23).
Varying tie relations in the New Hope School District may also be a result of
competitive pressure at the local level to perform and meet accountability demands. Daly
(2009) points out that as a result of high stakes accountability, relations between school
and district leaders tend to become less collaborative and more official and organized.
One way to remedy this is by fostering the professional growth of leaders and
differentiating supports for principals depending on their needs as instructional leaders.
Daly and Finnigan (2010) highlight that “leadership development programs both outside
and within districts have the unique opportunity to create the space for reflection and
dialogue for leaders to explore these tensions and how they may be brought into balance”
(p. 520). Therefore, it is essential that the New Hope School District add a component to
their existing professional development plans that specifically promotes the building of
relationships among leaders across the district in a way that supports collaboration. The

127
National Institute for School Leadership Program (NISL) is one example of a program
designed to assist leaders with collaborating and enhancing their skills in the face of
accountability demands (NISL, 2013). Participation in the NISL program also holds the
potential to increase the social capital among leaders and assist with policy
implementation at the local level (Daly & Finnigan, 2010).
New Hope District-level leaders should also consider creating opportunities for
school-level leaders to strengthen relations and formulate new ties. Allowing leaders’
time to meet and discuss building based concerns without a central office driven agenda
may enhance relations. Daly and Finnigan (2010) point out in a related study that
“district[s] will have to avoid the trap of merely providing time and directives to work
together as this does not necessarily result in meaningful collaboration between leaders”
(p.128). Therefore, New Hope practitioners should heed the advice of DuFour and
Burnette (2002) by insisting that principals develop improvement plans demonstrating the
collective efforts of the team and not merely the work of individuals. In an effort to
enhance relations, increase support from central office leaders to building leaders and
enhance success at the building level, it is recommended that the New Hope School
District consider creating prescribed structures/routines that require school-level leaders
to visit each other’s schools to analyze data together and observe successful practices. In
doing so, school-level leaders are also less likely to feel unsupported and isolated from
one another.
Enhancing connections at the district level in the New Hope School District as
well as in other districts with an opportunity to learn gap will assist with building
relations across the district, ultimately improving the overall school climate. Curtis and

128
City (2009) agree that collaboration is critical and begins at the central office level
stating:
Central office departments create teams to do their work most effectively. The
superintendent convenes a senior leadership team to shape and drive the direction
of the system’s work. Effective collaboration is critical to success at all levels of
the organization. Yet the knowledge, skills, and dispositions required for
collaboration are seldom taught. It is deeply ironic that a skill students need to
ensure their future opportunities is one that the adults responsible for their
education often do not possess and have not had the opportunity to learn (p.38).
In order for the central office team to be considered high functioning, there must be a
“high level of trust, a willingness to be vulnerable, and comfort with conflict” (Curtis &
City, 2009, p.56). District leaders in the New Hope School District and those with
opportunity to learn gaps are encouraged to implement and facilitate team building
activities to work on strengthening partnerships with each other. Incorporating time on
meeting agendas for district- and school-level leaders to engage in activities focused on
developing authentic relationships is a suggested activity (Curtis & City, 2009). For
instance, Curtis and City (2009) suggest leaders complete the Meyers & Briggs
Personality Inventory and share results in an effort to enhance relations and build trust.
Hargreaves and Fink (2006) emphasize that “investing resources in training, trust
building, and teamwork” (p. 267) is a function of sustainable leadership that has long
lasting effects.
New Hope District leaders are also recommended to expand liaison support to all
principals, and not limit this resource to struggling schools alone. Honig et al. (2010)

129
point out that central office can engage in efforts to support the teaching and learning
environment entirely by “taking the case management and project management
approaches to their work”(p.7). Honig et al. (2010) emphasize that the case management
approach enables district leaders to utilize their expertise to fully support “the specific
needs, strengths, goals, and character of each individual school in their case load” with
the goal of working to provide “high-quality, responsive services appropriate to their
individual schools”(p.8). Likewise, the project management approach results in district
leaders directly “solving problems that promised to help schools engage in teaching and
learning, even if those problems cut across multiple central office units” (p.8).
New Hope District-level leaders should also consider expanding professional
learning opportunities intended to eliminate deficit thinking within the district. The New
Hope School District superintendent took positive steps to support principals in their
efforts to dismantle deficit thinking and enhance some of the skills needed to assume
responsibility for teaching and learning improvements. Moving forward, the
superintendent must deepen the dialogue around instructional issues beyond data review.
In light of the success of schools that ensured students with disabilities had full access to
the curriculum, consideration should be given to expand the full-inclusion teaching model
across the district.
Consideration should also be given to implementing multicultural and anti-racist
professional learning opportunities in order to continue to prompt shifts in teacher beliefs.
While anti-racist and multicultural education are closely related in the goal to improve
student outcomes, Kailin (1998) believes that multicultural education is a non-threatening
way to address the gaps in student performance because it is focused around building

130
teachers’ and students’ cultural awareness rather than tackling structural aspects of
racism. Kailin (1998) further argues that an anti-racist approach to education must focus
on the deliberate dismantling of racism whereas multicultural education strives to
broaden teachers’ understanding of the diverse histories of students they serve as a means
to empower them. It is important to note, however, that ultimately multicultural education
and anti-racism both seek to raise the academic achievement of students of color while
nurturing the growth of all students. By implementing multicultural and anti-racist
professional learning opportunities, administrators of the New Hope School District will
be better equipped to learn about, understand, and address the undeniable correlation
between students’ race and ethnicity and disparities in student performance.
There are prevailing approaches to multicultural and anti-racist professional
development and learning that espouse to reduce the achievement gap while transforming
teacher beliefs (Ferguson, 2007; Howard, 2007; Singleton & Linton, 2006; Skrla,
McKenzie & Scheurich, 2009). Ferguson (2007) is responsible for putting forth a
conceptual framework titled the Tripod Project, which aims to close the achievement gap
by addressing the three legs of the “tripod”: content, pedagogy and relationships. He
argues that in order to reduce achievement gaps, content must be accessible and culturally
relevant, pedagogy must involve varied approaches to meeting students’ needs, and
teachers must develop meaningful relationships with students while maintaining high
expectations for ALL students. Skrla et al. (2009) describe the need to use Equity Audits
as a means to creating equitable and excellent schools. They contend that by assessing the
equity and inequity of programs, as well as teacher quality and achievement, school
leaders will be better prepared to develop an action plan that uncompromisingly promotes

131
educational equity. They describe particular skills teachers must develop to improve their
practice that include clearly communicating expectations, stimulating students with high-
level tasks, and using an asset-based approach when working with diverse populations.
While experienced, high-quality teachers within the New Hope School District
may already possess many of the skills needed to serve most students effectively,
Singleton and Linton (2006) argue that in order to reduce the “racial” achievement gap,
educators must be willing to engage in courageous conversations about race. Additionally,
they and many others (Darling-Hammond & McLaughlin, 1995; Gay & Howard, 2000;
Ladson-Billings, 2006; Lawrence & Tatum, 1997; Nieto, 2000; Tatum, 1997) believe it is
critical for teachers to explore their own racial identities and consider how it affects their
teaching of students, particularly students of color (i.e., Asian American, Hispanic/Latino,
Black/African-American, Multiracial and Native American). The research of Singleton
and Linton (2006) indicates when white teachers were able to relate to their diverse
students experiences, and as they developed cultural awareness or competence, a
narrowing of the achievement gap occurred. Given over 90% of administrators and
teachers in the New Hope School District are white while over 60% of students identify
as students of color, and in light of the existing racial achievement gap as measured
across three performance indicators (i.e., state achievement tests, graduation rates, and
SAT performance reports), serious consideration should be given to implementing
multicultural and anti-racist professional learning opportunities.
Recommendations for Policy Makers
Cohesive relations between school and district leaders are often hindered by
accountability policy demands (Daly 2009). This often complicates the job of leaders

132
trying to effect change in schools. Daly and Finnigan (2010) point out that “effectively
responding to state and federal accountability policies at the local level may require a
more collaborative relationship among and between central office and school
administrators to allow for the diffusion of innovation and knowledge”(p.131). In an
effort to strike this balance, district leaders in the New Hope School district and those in
districts with an opportunity to learn gap need to develop systems and structures to
enhance collaboration within school districts. New Hope School District leaders
implemented structures to support collaboration in an effort to enhance students’
opportunity to learn. Their efforts yielded evidence that some schools were making
progress. This supports the research claim that school culture, namely interactions, is a
valuable consideration when enhancing student opportunities to learn. Policy makers are
recommended to be mindful of this consideration and recognize that accountability
demands alone do not promote equitable opportunities to learn (Harris & Herrington,
2006).
Recommendations for Future Research
While this study contributed to theoretical knowledge and provided a practical
contribution to the field of education, future research areas must be noted. First,
conducting an exploration of interactions among leaders using an external social capital
lens (Leana & Pil, 2006) may prove beneficial. The external partnership with DSAC in
this study was instrumental in assisting leaders with responding to accountability
demands beyond standardized testing through the development of the Accelerated
Improvement Plan. A deeper exploration of external partnerships may yield findings in
relation to the importance of these relations when attempting to enhance students’

133
opportunity to learn. Second, given the potential that leader relations may be
“bureaucratic” due to accountability pressures (Daly & Finnigan, 2010, p.131), it may be
worthwhile to conduct a similar study with a focus on examining the impact of roles and
hierarchy on relations in a district that is attempting to enhance student opportunities to
learn. Third, future research should include multiple districts with similar demographics
in an effort to enhance generalizability.
Finally, because the research team members sought to understand how district-
and school-level leaders learned about, understood, and addressed barriers to students’
opportunities to learn, interviews were limited to district- and school-level leaders. This
had potential implications for the overall conclusions drawn. Future research efforts
involving staff at all levels could help to address this limitation and assist in uncovering
the true impact of efforts aimed at eliminating barriers to students’ opportunity to learn.
Overarching Study Limitations
A few limitations are noted in this study. The New Hope School District is a small
district comprised of eight district leaders and eight school level leaders. As
aforementioned, researchers were unable to interview two building level leaders. This
hindered the overall analysis and conclusion of findings for the overarching study.
Additionally, researchers relied on the strategy of snowball sampling as outlined by
Creswell (2012) and Merriam (2009) to interview participants. Because the researchers
relied on the superintendent and assistant superintendent to recommend individuals
whom they felt could best describe efforts aimed at impacting students’ opportunity to
learn and performance gaps, key individuals were not recommended and were therefore
not interviewed. Mentors, coaches, DSAC members, teachers, and students may have

134
been able to provided information which might have enhanced the overall findings.
Conclusion
The literature portrays a multifaceted depiction of how many factors have the
potential to impact district- and school-level leaders understanding of the nature of the
gap and how these understandings then influence the work leadership focused on
addressing disparities in student performance. It was the intent of the research team to
enhance insight in this area for practitioners. It is evident that leaders’ interactions and
framing of events coupled with how they practice has the potential to enhance the school
climate and increase students’ opportunity to learn. Additionally, the purposeful
distribution of leadership work provides the opportunity to enhance collaboration and
collective action. Conversely, without proper district-level leadership and leader
distribution, effectively addressing disparities in student performance may be hindered.

135
References
Aaron, D. I., & Gewertz, C. (2009) Enthusiasm builds for data systems. Education Week,
18-19.
Achieve, Inc. (2013). About PARCC. Retrieved from http://www.parcconline.org/about-
parcc
Achinstein, B., & Barrett, A. (2004). (Re) Framing classroom contexts: How new
teachers and mentors view diverse learners and challenges of practice. Teachers
College Record, 106(4), 716-746.
Adler, P. S., & Kwon, S.W. (2002). Social capital: Prospects for a new concept. Academy
of Management Journal, 27(1), 17–40.
Allwarden, A. F. (2014). Opportunity to learn: The role of prompting cognitive shifts in
understanding and addressing educational inequities (Doctoral
dissertation). Boston College, Boston, MA.
Alsbury, T. L., & Whitaker, K. S. (2007). Superintendent perspectives and practice of
accountability, democratic voice and social justice. Journal of Educational
Administration, 45(2), 154.
American Recovery and Reinvestment Act (ARRA) of 2009, Pub. L. No. 111-5, 123 Stat.
115, 516 (Feb. 19, 2009).
Anderson, S., Leithwood, K., & Strauss, T. (2010). Leading data use in schools:
Organizational conditions and practices at school and district levels. Leadership
and Policy in Schools, 9, 292-327. doi: 10.1080/15700761003731492

136
Awamleh, R., & Gardner, W. L. (1999). Perceptions of leader charisma and
effectiveness: The effects of vision, content, delivery, and organizational
performance. Leadership Quarterly, 10(3), 345-373.
Barnard, C. (1968). Functions of the executive. Cambridge, MA: Harvard University
Press.
Basadur, M. (2004). Leading others to think innovatively together: Leading creatively.
Leadership Quarterly, 15(1), 103-115.
Becker, H. S. (1986). Writing for social scientists: How to start and finish your thesis,
book, or article. Chicago, IL: University of Chicago Press.
Benford, R. D., & Snow, D. A. (2000). Framing processes and social movements: An
overview and assessment. Annual Review of Sociology, 26, 611-639.
Bennett, W., Finn, C., & Cribb, J. (1999). The educated child: A parent’s guide from
preschool through eighth grade. New York: The Free Press.
Berman, P., & Chambliss, D. (2000). Readiness of low-performing school for
Comprehensive reform. Emeryville, CA: RPP International.
Berman, P., Chambliss, D., & Geiser, K. D. (1999). Making the case for a focus on equity
In school reform. Emeryville, CA: RPP International.
Bernhardt, V. L. (2003). Using data to improve student learning in elementary schools.
Larchmont, NY: Eye on Education.
Bjork, L. G. (1993). Effective schools, effective superintendents: The emerging
Instructional leadership role. Journal of School Leadership, 3(3), 246-259.
Bogdan, R., & Biklen, S. (2003). Qualitative research for education: An introduction to
theory and methods. Boston, MA: Allyn & Bacon.

137
Bogdan, R.C., & Biklen, S.K. (1998). Qualitative research for education: An
introduction to theory and methods. Needham Heights, MA: Allyn & Bacon.
Borgatti, S. P., & Halgin, D. (2011). On network theory. Organization Science, 22(5),
1168-1181.
Borgatti, S. P., Jones, C., & Everett, M. G. (1998). Network measures of social capital.
Connections, 21(2), 1–36.
Borgatti, S. P., Mehra, A. J., Brass D. J., & Labianca, G. (2009). Network analysis in the
social sciences. Science, 323(5916), 892–895.
Bourdieu, P. (1977). Outline of a theory of practice. New York, NY: Cambridge
University Press.
Bourdieu, P. (1986). The forms of social capital. In J. Richardson (Ed.), Handbook
of theory and research for the sociology of education (pp. 241-258). New
York: Greenwood.
Bourdieu, P. (1990). The logic of practice. Stanford, CA: Stanford University Press.
Bowen, G. A., (2009). Document analysis as a qualitative research method. Qualitative
Research Journal, 9(2) 27-40. doi:10.3316/QRJ0902027
Boykin, A. W., & Noguera, P. (2011). Creating the opportunity to learn: Moving from
research to practice to close the achievement gap. Alexandria, VA: ASCD.
Braun, H. I. (2005). Using student progress to evaluate teachers: A primer on value-
Added models. Princeton, NJ: Educational Testing Services.
Brazer, S. D., & Keller, L. R. (2006). A conceptual framework for multiple stakeholder
educational decision making. International Journal of Educational Policy and
Leadership, 1(3), 1-14.

138
Bredeson, P. V., & Kose, B. W. (2007). Responding to the education reform agenda: A
study of school superintendents. Education Policy Analysis Archives, 15(5), 1-24.
Brown v. Board of Education, 347 U.S. 483 (1954).
Brunner, C., Fasca, C., Heinze, J., Honey, M., Light, D., Mandinach, E. B., & Wexler, D.
(2005). Linking data and learning: The grow network study. Journal of Education
for Students Placed At Risk, 10(3), 241-267.
Bryk, A. S., & Schneider, B. (2002). Trust in schools: A core resource for school
improvement. New York, NY: Russell Sage Foundation.
Camburn, E., Rowan, B., & Taylor, J. E. (2003). Distributed leadership in schools: The
case of elementary schools adopting comprehensive school reform models.
Educational Evaluation and Policy Analysis, 25(4), 347-373.
Carmin, J., & Balser, D. B. (2005). Mobilization routines in professional environmental
movement organizations: Matching solutions to problems. Paper presented at the
Annual meeting of the American Sociological Association, Philadelphia, PA.
Cawelti, G., & Protheroe, N. (2001). High student achievement: How six school districts
changed into high-performance systems. Arlington, VA: Educational Research
Service.
Choo, C. W. (1996). The knowing organization: How organizations use information to
construct meaning, create knowledge and make decisions. International Journal
of Information Management, 16(5), 329-340.
Chrispeels, J. H. (Ed.) (2004). Learning to lead together: The challenge and promise of
sharing leadership. Thousand Oaks, CA: Sage.

139
City-Data (2011). New Hope profile: population, maps… Retrieved from
http://www.city-data.com/crime/crime-NewHope-Massachusetts.html
#ixzz2gJqVoiwB
City of New Hope (2013). City of New Hope, city information. Retrieved from
http://www.ci.newhope.ma.us/
Cohen, L., Manion, L., & Morrison, K. (2011). Organizational routines are stored as
procedural memory: Evidence from a laboratory study. Research methods in
education (7th ed.). New York, NY: Routledge.
Cohen, M. D., & Bacdayan, P. (1996). Organizational routines are stored as procedural
memory: Evidence from a laboratory study. In M. Cohen & L. S. Sproull (Eds.),
Organizational learning (pp. 403-429). Thousand Oaks, CA: Sage Publications.
Coleman, J. S. (1988). Social capital in the creation of human capital. American
Journal of Sociology, 94(1), 95-120.
Coleman, P., & LaRocque, L. (1988). Reaching out: Instructional leadership in school
districts: The local school district superintendency, under reform. Peabody
Journal of Education, 65(4), 60-89.
Collins Educational Associates. (2013). Five types of writing. Retrieved from
http://www.collinsed.com/5types.htm
Conger, J. A., & Kanungo, R. N. (1987). Toward a behavioral theory of charismatic
leadership in organizational settings. Academy of Management Review, 12(4),
637-647.
Copland, M. A. (2003). Leadership of inquiry: Building and sustaining capacity for
school improvement. Educational Evaluation and Policy Analysis, 25(4), 375–

140
395.
Corbin, J., & Strauss, A (2008). Basics of qualitative research: Techniques and
procedures for developing grounded theory (3rd ed.). Thousand Oaks, CA: Sage.
Corcoran, T., Fuhrman, S.H., & Belcher, C. L. (2001). The district role in instructional
improvement. Phil Delta Kappan 83(1), 78-84.
Creswell, J. W. (1998). Qualitative inquiry and research design: Choosing among five
designs. Thousand Oaks, CA: Sage.
Creswell, J. W. (2012). Educational research: Planning, conducting, and evaluating
quantitative and qualitative research. Boston, MA: Pearson Education, Inc.
Creswell, J. W., & Plano Clark, V. L. (2007). Designing and conducting mixed methods
research. Thousand Oaks, CA: Sage.
Curtis, R., & City, E. (2009). Strategy in Action. Cambridge, Ma: Harvard Education
Press.
Daly, A. J. (2009). Threat rigid response in an age of accountability. Educational
Administration Quarterly,45(2),168-216.
Daly, A. J., & Finnigan, K. S. (2010). A bridge between worlds: Understanding network
structure to understand change strategy. Journal of Educational Change, 11(2),
111-138.
Daly, A. J., & Finnigan, K. S. (2011). The ebb and flow of social network ties between
district leaders under high-stakes accountability. American Educational Research
Journal, 48(1), 39-80.
Daly, A. J., & Finnigan, K. S. (2012). Exploring the space between: Social networks,
trust, and urban school district leaders. Journal of School Leadership, 22(3), 493-

141
530.
Darling-Hammond, L. (1994). Standards of practice for learning-centered schools. In R.
Berne & L. Picus (Eds.), Outcome equity in education (pp. 191-223). Thousand
Oaks, CA: Corwin Press.
Darling-Hammond, L. (2004). From “separate but equal” to “No Child Left Behind”: The
collision of new standards and old inequalities. In D. Meier & G. Wood (Eds.),
Many children left behind (pp. 3-32). Boston, MA: Beacon Press.
Darling-Hammond, L. (2007). Third Annual Brown Lecture in Education Research: The
flat earth and education: How America's commitment to equity will determine our
future. Educational Researcher, 36(6), 318-334.
Darling-Hammond, L. U.S. House of Representatives, Committee on Education and
Labor. (2007). ESEA reauthorization: Options for improving NCLB's measures of
progress (110-11). Retrieved from United States Government Printing Office
website:
http://www.gpo.gov/fdsys/pkg/CHRG-110hhrg34015/pdf/CHRG-
110hhrg34015.pdf
Darling-Hammond, L., & McLaughlin, M.W. Policies that support professional
development in an era of reform. Retrieved from
http://www.questia.com/googleScholar.qst?docId=5000286584
Davis, S., Darling-Hammond, L., LaPointe, M., & Meyerson, D. (2005). School
leadership study developing successful principals. Standard Educational
Leadership Institute, Stanford University, Stanford, CA, United States.

142
Delpit, L. (1995). Other people’s children: Cultural conflict in the classroom. New York:
The New Press.
DeMarrais, K. (2004). Qualitative interview studies: Learning through experience. In K.
DeMarrais & S. Lapan (Eds.), Foundations for research (pp. 51-68). Mahwah,
NJ: Erlbaum.
Denzin, N. K. (1978). The research act: A theoretical introduction to sociological
methods (2nd ed.). New York, NY: McGraw-Hill.
Drath, W. H., & Palus, C. J. (1994). Making common sense: Leadership as meaning
making within a community of practice. Greensboro, NC: Center for Creative
Leadership.
DuFour, R. (2002). The learning centered principal. Educational Leadership, 59(8), 12-
15.
DuFour, R., & Burnette, B. (2002). Pull out negativity by its roots. Journal of Staff
Development, 23(3), 27-30.
DuFour, R., Eaker, R., & Karhanek, G. (2004). Whatever it takes: How professional
learning communities respond when kids don’t learn. Bloomington, IN: Solution
Tree.
Education Trust. (2010). Reports reveal colleges with the biggest, smallest gaps in
minority graduation rates in the U.S. Retrieved May 16, 2012, from
www.edtrust.org
Elmore, R. (1993). The role of local districts in instructional improvement. In S.
Fuhrman (Ed.), Designing coherent education policy: Improving the system (pp.
96-124). San Francisco: Jossey-Bass.

143
Elmore, R. F. (2007). School reform from the inside out: Policy, practice, and
performance. Cambridge, MA: Harvard Education Press.
Elmore, R.F., & Burney, D. (1997). Investing in teacher learning: Staff development and
instructional improvement in Community School District #2, New York City.
National Commission on Teaching & America’s Future.
Elmore, R. F. (2000). Building a new structure for school leadership (pp. 1-46).
Washington, DC: Albert Shanker Institute.
Elmore, R. F. (2004). School reform from the inside out: Policy, practice, and
performance. Cambridge, MA: Harvard University Press.
Eisenhardt, K. M. (1989). Building theories from case study research. Academy of
Management Review, 14(4), 532-550.
Eisner, E. W. (1991). The enlightened eye: Qualitative inquiry and the enhancement of
educational practice. New York, NY: Macmillan Publishing Company.
Entman, R. M. (1993). Framing: Toward clarification of a paradigm. Journal of
Communication, 43(4), 51-58.
Erzberger, C., & Kelle, U. (2003). Making inferences in mixed methods: The rules of
integration. In A. Tashakkori & C. Teddue (Eds.), Handbook of mixed methods in
social and behavioral research (pp. 457-488). Thousand Oaks, CA: Sage.
Evans, R. (2005). Reframing the achievement gap. The Phi Delta Kappan, 86(8), 582-
589.
Fairhurst, G. T., & Sarr, R. A. (1996). The art of framing: Managing the language of
leadership. San Francisco, CA: Jossey-Bass Publishers.

144
Farley-Ripple, E. N. (2012). Research use in school district central office decision
making: A case study. Educational Management Administration & Leadership,
40(6), 786-806. doi: 10.1177/1741143212456912
Feldman, M. S. (2000). Organizational routines as a source of continuous change.
Organization Science, 11(6), 611-629.
Feldman, M. S., & Rafaeli, A. (2002). Organizational routines as sources of connections
and understandings. Journal of Management Studies, 39(3), 309-332.
Feldman, M. S., & Pentland, B. T. (2003). Reconceptualizing organizational routines as a
source of flexibility and change. Administrative Science Quarterly, 48(1), 94-118.
doi:10.2307/3556620
Ferguson, R. (2007). Toward excellence with equity: An emerging vision for closing the
achievement gap. Cambridge, MA: Harvard Education.
Fink, E. & Resnick, L.B. (2001). Developing principals as instructional leaders. The Phi
Delta Kappan. 82(8), 598-606.
Finnigan, K. S., & Daly, A. J. (2010). Learning at the system level: Ties between
principals of low-performing schools and central office leaders. In A. Daly (Ed),
Social network theory and educational change (pp. 179-196). Cambridge, MA:
Harvard Education Press.
Firestone, W. A., & Martinez, M. C. (2007). Districts, teacher leaders, and distributed
leadership: Changing instructional practice. Leadership & Policy in Schools, 6(1),
3-35.
Fixsen, D. L., Blase, K. A., Horner, R., & Sugai, G. (2009). Readiness for change.
Scaling Up Brief #3. Chapel Hill: The University of North Carolina, Frank Porter

145
Graham Child Development Institute, State Implementation and Scaling Up of
Evidence Based Practices (SISEP). Retrieved from http://sisep.fpg.unc.edu/
Flick, U. (1998). An introduction to qualitative research. Thousand Oaks, CA: Sage.
Foldy, E. G., Goldman, L. S., & Ospina, S. M. (2008). Sensegiving and the role of
cognitive shifts in the work of leadership. The Leadership Quarterly, 19(5), 514-
529.
Foldy, E. G., Goldman, L. S., & Ospina, S. M. (2009). The leadership task of prompting
cognitive shifts: Shaping perceptions of issues and constituencies to achieve
public service goals. Retrieved from New York University’s Research Center for
Leadership in Action website
http://wagner.nyu.edu/leadership/reports/files/CognitiveShiftsLeadership0309.pdf
Foorman, B. R., & Nixon, S. M. (2006). The influence of public policy on reading
research and practice. Topics in language disorders, 26(2), 157-171.
Friend, M., & Cook, L. (1992). Interactions: Collaboration skills for school professionals.
White Plains, NY: Longman Publishing Group.
Fuhrman, S. H., Goertz, M. E., & Weinbaum, E. H. (2007). Educational governance in
the United States: Where are we? How did we get here? Why should we care? In
D. Cohen, S. Fuhrman, & F. Mosher (Eds.), The state of education policy
research (pp. 41–61). Mahwah, NJ: Lawrence Erlbaum.
Fullan, M. (2007). Change the terms for teacher learning. Journal of Staff Development,
28(3), 35-36.
Fullan, M., & Stiegelbauer, S. (1991). The meaning of educational change. (2nd ed.).
New York, NY: Teachers College Press.

146
Gall, M. D., Borg, W. R., & Gall, J. P. (1996). Educational research: An introduction
(6th ed.). White Plains, NY: Longman.
Garcia, S. B., & Guerra, P. L. (2004). Deconstructing deficit thinking: Working with
educators to create more equitable learning environments. Education and Urban
Society, 36(2), 150-160.
Gardner, D. (2007). Confronting the achievement gap. Kaleidoscope: Contemporary and
Classic Readings in Education, 154-159.
Gauthier, A. (2006). Developing collective leadership: Partnering in multi- stakeholder contexts. Retrieved from http://www.alaingauthier.org/GauthierChapter.pdf Gay, G. (2004). Beyond Brown: Promoting equality through multicultural education.
Journal of Curriculum and Supervision, 19(3), 193-216.
Gay, G., & Howard, T. C. (2000). Multicultural teacher education for the 21st century.
The Teacher Educator, 36(1), 1-16.
Gee, J. P. (2008). A sociocultural perspective on opportunity to learn. In P. Moss, D.
Pullin, J. Gee, E. Haertel, & L. Young (Eds.), Assessment, equity, and opportunity
to learn (pp. 17-41). New York, NY: Cambridge University Press.
Giddens, A. (1984). The constitution of society. Berkeley, CA: University of California
Press.
Gioia, D. A., & Chittipeddi, K. (1991). Sensemaking and sensegiving in strategic change
initiation. Strategic Management Journal, 12(6), 433−448.
Glaser, B. G., & Strauss, A. L. (1967). The discovery of grounded theory: Strategies for
qualitative research. New York, NY: Aldine de Gruyter.

147
Glasser, B. G. (1978). Theoretical sensitivity: Advances in the methodology of
grounded theory. Mill Valley, CA: Sociology Press.
Glasman, N. (1984). Student achievement and the school principal. Educational
Evaluation and Policy Analysis, 6(3), 283-296.
Glass, T., Bjork, L., & Brunner, C. (2000). The 2000 study of the American school
superintendency: A look at the superintendent of education in the new millennium.
Arlington, VA: American Association of School Administrators.
Goffman, E. (1974). Frame analysis. Cambridge, MA: Harvard University Press.
Goldring, E., & Berends, M. (2009). Leading with data: Pathways to improve your
school. Thousand Oaks, CA: Corwin.
Granovetter, M. (1973). The strength of weak ties. American Journal of Sociology, 78(1),
1360-1380.
Greene, J. P., & Forster, G. (2003). Public high school graduation and college readiness
rates in the United States. New York, NY: The Manhattan Institute.
Green, T. F. (1983). Excellence, equity, and equality. In L. Shulman & G. Sykes (Eds.),
Handbook of teaching and policy (pp. 318-341). New York, NY: Longman Inc.
Grogan, M., & Shakeshaft, C. (2011). Women and educational leadership. San Francisco,
CA: Jossey-Bass.
Gronn, P. C. (1983). Talk as the work: The accomplishment of school administration.
Administrative Science Quarterly, 28, 1-21.
Gronn, P. (2000). Distributed properties: A new architecture for leadership. Educational
Management Administration Leadership, 28(3), 317-338.
Gronn, P. (2003). Leadership: Who needs it? School Leadership and Management, 23(3),

148
267-290.
Grubb, W. N., & Flessa, J. J. (2006). “A job too big for one”: Multiple principals and
other nontraditional approaches to school leadership. Educational Administration
Quarterly, 42(4), 518-550. doi:10.1177/0013161X06290641
Guiton, G., & Oakes, J. (1995). Opportunity to learn and conceptions of educational
equality. Educational Evaluation and Policy Analysis, 17(3), 323-336.
Hallinger, P., & Heck, R. H. (2002). What do you call people with visions? The role of
vision, mission, and goals in school leadership and improvement. In K.
Leithwood & P. Hallinger (Eds.), Second international handbook of educational
leadership and administration (pp. 9-40). Dordrecht, NL: Kluwer Academic
Publishers.
Hallinger, P., & Heck, R. H. (2009). Distributed leadership in schools: Does system
policy make a difference? In A. Harris (Ed.), Distributed leadership (pp. 101–
117). New York, NY: Springer.
Hallinger, P., & Heck, R. H. (2010). Collaborative leadership and school improvement:
Understanding the impact on school capacity and student learning. School
Leadership & Management, 30(2), 95-110.
Halverson, R., Kelley, C., & Kimball, S. (2004). Implementing teacher evaluation
systems: How principals make sense of complex artifacts to shape local
instructional practice. In W. Hoy & C. Miskel (Eds.), Educational administration,
policy, and reform: Research and theory (Vol. 3). Greenwich, CT: Information
Age Press.

149
Hammersley, M., & Atkinson, P. (2007) Ethnography: Principals in practice (3rd ed.).
London: Routledge.
Hamilton, L. S. (2003). Assessment as a policy tool. Review of Research in Education,
27, 25-68.
Hamilton, L. S., & Koretz, D. M. (2002). Tests and their use in test-based accountability
systems. In L. Hamilton, B. Stecher, & S. Klein (Eds.), Making sense of test-
based accountability in education (pp. 13-49). Santa Monica, CA: RAND.
Hanneman, R., & Riddle, M. (2005). Introduction to social network methods. Riverside,
CA: University of California, Riverside. Retrieved from
http://faculty.ucr.edu/~hanneman/
Hargreaves, A., & Fink, D. (2004). The seven principles of sustainable leadership.
Educational Leadership, (61)7, 8-13.
Hargreaves, A., & Fink, D. (2006). Sustainable Leadership. San Francisco, CA: Jossey-
Bass.
Harris, A. (2002). Effective leadership in schools facing challenging contexts. School
Leadership & Management, 22(1), 15-26.
Harris, A. (2004). Distributed leadership for school improvement: Leading or misleading.
Educational Management Administration and Leadership, 32(1), 11–24.
Harris, A. (2005). Distributed leadership. In B. Davies (Ed.), The essentials of school
leadership (pp. 160-172). London, UK: Paul Chapman Publishing.
Harris, A. (2008). Distributed school leadership developing tomorrow’s leaders. New
York, NY Routledge.

150
Harris, A. (2013). Distributed Leadership: Friend or foe? Educational Management
Administration & Leadership, 41(5), 545-554. doi:10:1177/1741143213497635
Harris, A., Leithwood, K., Day, C., Sammons, P., & Hopkins, D. (2007). Distributed
leadership and organizational change: Reviewing the evidence. Journal of
Educational Change, 8(4), 337-347. doi:10.1007/s10833-007-9048-4
Harris, D. N., & Herrington, C. D. (2006). Accountability, standards, and the growing
achievement gap: Lessons from the past half-century. American Journal of
Education,112(2), 209-238.
Hawley, W., & Sykes, G. (2007). Continuous school improvement. In W. Hawley
(Ed.), The keys to effective schools: Educational reform as continuous
Improvement (pp. 153–172). Thousand Oaks, CA: Corwin.
Heifetz, R. A. (1996). Leadership without easy answers. Cambridge, MA: Belknap Press
of Harvard University Press.
Hightower, A. (2002). San Diego’s big boom: Instructional change in the central office
and schools. In A. Hightower, M. Knapp, J. Marsh & M. McLaughlin (Eds.),
School districts and instructional renewal (pp. 76-93). New York: Teachers
College Press.
Hitchcock, G., & Huges, D. (1995). Research and the teacher: A qualitative introduction
to school-based research (2nd ed.). London: Routledge.
Honig, M. I. (2004). District central office-community partnerships: From contracts to
collaboration to control. In W. Hoy & C. Miskel (Eds.), Theory and research in
educational administration (pp. 59-99). Greenwich, CT: Information Age.

151
Honig, M. I. (2012). District central office leadership as teaching how central office
administrators support principals’ development as instructional leaders.
Educational Administration Quarterly, 48(4), 733-774.
Honig, M. I., & Coburn, C. (2007). Evidence-based decision making in school district
central offices: Toward a policy and research agenda. Educational Policy, 22(4),
578–608. doi:10.1177/0895904807307067
Honig, M. I., Copland, M. A., Rainey, L., Lorton, J. A., & Newton, M. (2010). Central
office transformation for district-wide teaching and learning improvement. Center
for the Study of Teaching and Policy, University of Washington.
Honig, M. I., & Venkateswaran, N. (2012). School-central office relationships in
evidence use: Understanding evidence use as a systems problem. American
Journal of Education, 118(2), 199-222.
Howard, G.R. (2007). As diversity grows, so must we. Educational Leadership, 64(6),
16-22.
Huzzard, T. (2004). Communities of domination: Reconceptualizing organizational
learning and power. Journal of Workplace Learning, 16(6), 350-361.
Ingram, D., Louis, K., & Schroeder, K. G. (2004). Accountability policies and teacher
decision-making: Barriers to the use of data to improve practice. Teachers
College Record, 106(6), 1258-1287.
James, E. A., Milenkiewicz, M. T., & Bucknam, A. (2008). Participatory action research
for educational leadership: Using data-driven decision making to improve
schools. Thousand Oaks, CA: Sage.

152
Kailin, J. (1998). Preparing urban teachers for schools and communities: An anti-racist
perspective. The High School Journal, 82(2), 80-87.
Kennedy, E. (2003). Raising test scores for all students: An administrator’s guide to
improving standardized test performance. Thousand Oaks, CA: Corwin Press.
Kirkpatrick, S. A., & Locke, E. A. (1996). Direct and indirect effects of three core
charismatic leadership components on performance and attitudes. Journal of
Applied Psychology, 81(1), 36-51.
Knapp, M. S. (2003). Professional development as a policy pathway. Review of Research
in Education, 27(1), 109-157.
Knapp, M. S., Copland, M. A., & Talbert, J. (2003). Leading for Learning: Reflective
tools for school and district leaders. Seattle, WA: Center for the Study of
Teaching and Policy, University of Washington.
Knapp, M. S., Swinnerton, J. A., Copland, M. A., & Monpas-Huber, J. (2006). Data-in-
formed leadership in education. Seattle, WA: University of Washington, Center
for the Study of Teaching and Policy.
Lachat, M. A., & Smith, S. (2005). Practices that support data use in urban high
schools. Journal of Education for Students Placed At Risk, 10(3), 333-349.
doi:101207/s15327671espr1003_7
Ladson-Billings, G. (2006). From the achievement gap to the education debt:
Understanding achievement in U.S. schools. Educational Researcher, 35(7), 3-12.
Lashway, L. (2003). Distributed leadership. Retrieved from ERIC database. (ED
477356).

153
Lawrence, S. M., & Tatum, B. D. (1997). White educators as allies: Moving from
awareness to action. Retrieved from https://www.mtholyoke.edu/
Leana, C., & Pil, F. (2006). Social capital and organizational performance: Evidence
from urban public schools. Organization Science, 17(3), 353-366.
Leithwood, K., Begley, P., & Cousins, B. (1990). The nature, causes and consequences of
principals' practices: An agenda for future research. Journal of Educational
Administration, 28(4), 5-31.
Leithwood, K., Harris, A., & Hopkins, D. (2008). Seven strong claims about successful
school leadership. School Leadership and Management, 28(1), 27–42.
Leithwood, K., & Jantzi, D. (2008). Linking leadership to student learning: The
contributions of leader efficacy. Educational Administration Quarterly, 44, 496-
528. doi:10.1177/0013161X08321501
Leithwood, K., Louis, K., Anderson, S., & Wahlstrom, K. (2004). How leadership
influences student learning. Retrieved from http://www.wallacefoundation.org
/WF/KnowledgeCenter/KnowledgeTopics/EducationLeadership/HowLeadershipI
nfluences Student Learning.htm.
Leithwood, K. A., & Riehl, C. (2005). What we know about successful school leadership.
In W. Firestone & C. Riehl (Eds.), A new agenda: directions for research on
educational leadership (pp. 22-47). New York, NY: Teachers College Press.
Levin, B. (2006). Schools in challenging circumstances: A reflection on what we know
and what we need to know. School Effectiveness and School Improvement, 17(4),
399–407.
Lin, N. (1999). Building a network theory of social capital. Connections, 22(1), 28-51.

154
Lincoln, Y. S., & Guba, E. G. (1985). Naturalistic inquiry. Thousand Oaks: CA: Sage.
Linn, R. L. (1988). Perspective: State-by-state comparisons of achievement: Suggestions
for enhancing validity. Educational Researcher, 17(3) 6-9. doi:
10.3102/0013189x017003006
Lindsey, R. B., Nuri Robins, K. T., & Terrell, R. D. (2009). Cultural proficiency: A
manual for school leaders. Thousand Oaks, CA: Corwin Press.
Louis, K. S., Leithwood, K., Wahlstrom, K. L., Anderson, S. E., Michlin, M., Mascall, B.,
& Moore, S. (2010). Learning from leadership: Investigating the links to
improved student learning: Final report of research to the Wallace Foundation.
New York, NY: The Wallace Foundation.
Love, N. (Ed.). (2009). Using data to improve learning for all: A collaborative approach.
Thousand Oaks, CA: Corwin Press.
Mann, H. (1865). Life and works of Horace Mann. Boston, MA: Walker, Fuller and Co.
Massachusetts Department of Elementary and Secondary Education (2012). Glossary of
2012 accountability reporting terms. Retrieved from
http://www.doe.mass.edu/apa/ayp/2012/GlossaryTerms.docx
Massachusetts Department of Elementary and Secondary Education (2013b).
Accountability, Partnerships, & Assistance. Retrieved from
http://www.doe.mass.edu/apa/sss/dsac/teams/
Massachusetts Department of Elementary and Secondary Education. (2013). District and
School Assistance Center. Retrieved from http://www.doe.mass.edu/apa/sss/dsac/
Massachusetts Department of Elementary and Secondary Education. (2013). Focused
Planning for Accelerated Student Learning: District Guide for the Development

155
and Implementation of Accelerated Improvement Plans. Retrieved from
http://www.doe.mass.edu/apa/sss/dsac/FocusedPlanning.pdf
Massachusetts Department of Elementary and Secondary. (2013). Learning Walkthrough
Implementation Guide. Retrieved from
http://www.doe.mass.edu/apa/dart/walk/ImplementationGuide.pdf Massachusetts
Massachusetts Department of Elementary and Secondary Education (2013a). MCAS
Results by Subgroup by Grade and Subject. Retrieved from
http://profiles.doe.mass.edu/mcas/subgroups2.aspx?linkid=25&orgcode=0097000
0&fycode=2013&orgtypecode=5&
Massachusetts Department of Elementary and Secondary Education (2013c).
Methodology for identifying Level 3 and Level 4 schools. Retrieved from
www.doe.mass.edu/apa/ayp/2013/MethodologyL3-4.docx
Massachusetts Department of Elementary and Secondary Education. (2013, December).
School Choice. Retrieved from http://www.doe.mass.edu/finance/schoolchoice/
Massachusetts Department of Elementary and Secondary Education. (2013a). School
leaders guide to the 2013 accountability determination. Retrieved from
http://www.doe.mass.edu/apa/accountability/default.html
Massachusetts Department of Elementary and Secondary Education. (2013b). State
releases 2013 MCAS school and district results: Majority of schools statewide
improve or hold steady since last year. Retrieved from
http://www.doe.mass.edu/news/news.aspx?id=7703
Massell, D., & Goertz, M. E. (2002). District strategies for building instructional capacity.
In A. M. Hightower, M. S. Knapp, J. A. Marsh, & M. McLaughlin, (Eds.), School

156
districts and instructional renewal (pp. 43-60). New York, NY: Teachers College
Press.
March, J. G., & Simon, H.A. (1958). Organizations. New York, NY: Wiley.
Marsh, J. A., McCombs, J. S., & Martorell, F. (2010). How instructional coaches support
data-driven decision making: Policy implementation and effects in Florida middle
schools. Educational Policy, 24(6), 872-907. doi: 10.1177/0895904809341467
Marzano, R.J. (2003). What works in schools: Translating research into action.
Alexandria, VA: ASCD.
Marzano, R. J., & Waters, T. (2009). District leadership that works: Striking the right
balance. Bloomington, IN: Solution Tree Press.
Marzano, R. J., Waters, T., & McNulty, B. (2005). School leadership that works: From
research to results. Aurora, CO: ASCD and McREL.
Massachusetts Department of Elementary and Secondary Education. (2011).
Massachusetts Comprehensive Assessment System, Partnership for Assessment of
Readiness for College and Career, 2011. Retrieved from
http://www.doe.mass.edu/mcas/parcc/
Maxwell, J. (2008). Designing a qualitative study. In L. Bickman & D. Rog (Eds.),
The handbook of applied social research methods (pp. 214-253). Thousand Oaks
CA: Sage.
McGrath, C., & Krackhardt, D. (2003). Network conditions for organizational change.
The Journal of Applied Behavioral Science, 39(3), 324–336.
McMillian, J. H. (2004). Educational research: Fundamentals for the consumer. New
York, NY: Pearson Education.
157
Merriam, S. B. (1998). Qualitative research and case study applications in education.
San Francisco, CA: Jossey-Bass.
Merriam, S. B. (2009). Qualitative research: A guide to design and implementation. San
Francisco, CA: Jossey-Bass.
Miles, B., & Huberman, M. (1994). Qualitative data analysis. Thousand Oaks, CA: Sage.
Miles, B., Huberman, M., & Saldaña, J. (2014). Qualitative data analysis: A methods
sourcebook (3rd ed.). Thousand Oaks, CA: Sage.
Miller, K. (2004). Creating conditions for leadership effectiveness: The district’s role.
Aurora, CO: Mid-continent Research for Education and Learning.
Mintrop, H., & Trujillo, T. (2007). The practical relevance of accountability systems for
school improvement: A descriptive analysis of California schools. Educational
Evaluation and Policy Analysis, 29(4), 319–352.
Mohrman, S., Tenkasi, R., & Mohrman, A. (2003). The role of networks in fundamental
organizational change. The Journal of Applied Behavioral Science, 39(3), 301–
323.
Monroe, C.R. (2005). Understanding the discipline gap through a cultural lens:
Implications for the education of African American students. Intercultural
Education, 16(4), 317-330.
Murphy, J., & Hallinger, P. (1988). Characteristics of instructionally effective districts.
Journal of Educational Research, 81(3), 175-181.
Nahapiet, J., & Ghoshal, S. (1998). Social capital, intellectual capital, and the
organizational advantage. Academy of Management Review, 23(2), 242–266.

158
National Assessment for Educational Progress. (2012). Understanding gaps. Retrieved
from http://nces.ed.gov/nationsreportcard/studies/gaps/understand_gaps.asp
National Center for Educational Statistics. (2010). Trends in high school dropout and
completion rates in the United States: 1972–2008. Retrieved from
nces.ed.gov/pubs2011/2011012.pdf
National Center for Educational Statistics. (2011a). The nation's report card:
Mathematics 2011. Retrieved from
http://nces.ed.gov/nationsreportcard/pdf/main2011/2012457.pdf
National Center for Educational Statistics. (2011b). The nation's report card: Reading
2011. Retrieved from
http://nces.ed.gov/nationsreportcard/pdf/main2011/2012457.pdf
National Commission on Excellence in Education. (1983). A nation at risk: The
imperative for educational reform. Washington, DC: U.S. Government Printing
Office.
National Institute for School Leadership. (2013). Frequently Asked Questions. Retrieved
from http://www.nisl.net/faq/
National Institute for School Leadership (2013). The NISL difference for Principals and
School Leaders. Retrieved from http://www.nisl.net/our-difference/you-are-a-
principal-or-school-leader/
Nelson, R., & Winter, S. G. (1982). An Evolutionary Theory of Economic Change.
Cambridge, MA: Harvard University Press.
New Hope Public School District. (2014). District Improvement Plan. Retrieved from
http://www.newhope.k12.ma.us/about-us/district-improvement-plan

159
New Hope Public School District. (2014). Professional development plan. Retrieved
from http://www.newhope.k12.ma.us/about-us/professional-developmental-plan
Nieto, S. (2000). Affirming diversity: The sociopolitical context of multicultural
education (3rd ed.). New York: Longman.
No Child Left Behind Act, 20 U.S.C. 6302 § 1001 (2001).
Noguera, P., & Akom, A. (2000). Disparities demystified. The Nation, 270(22), 29-31.
O’Day, J. (2004). Complexity, accountability, and school improvement. In S. Fuhrman &
R. Elmore (Eds.), Redesigning accountability systems (pp. 15–43). New York,
NY: Teachers College Press.
Paccione, A. (2001). Developing a commitment to multicultural education. Teachers
College Record, 102(6), 980-1005.
Park, V., Daly, A. J., & Guerra, A. W. (2013). Strategic framing: How leaders craft the
meaning of data use for equity and learning. Educational Policy, 27(4), 645-675.
Patton, M. Q. (2002). Qualitative research and evaluation methods (3rd ed.). Thousand
Oaks, CA: Sage.
Pentland, B. T., & Feldman, M. S. (2005). Organizational routines as a unit of analysis.
Industrial and Corporate Change, 14(5), 739-815. doi:10:1093/icc/dth070
Plessy v. Ferguson. 163 U.S. 537 (1896).
Pondy, L. R. (1989). Leadership is a language game. In H. Leavitt, L. Pondy, & D. Bonje
(Eds.), Readings in managerial psychology (pp. 224-233). Chicago, IL:
University of Chicago Press. (Original work published in 1978)

160
Potenziano, P. J. (2014). Opportunity to learn: The role of structures and routines in
understanding and addressing educational inequities (Doctoral dissertation).
Boston College, Boston, MA.
Porter, A. C. (1991). Creating a system of school process indicators. Educational
Research and Policy Analysis, 13(1), 13-29.
Porter, A. C. (1994). National standards and school improvement in the 1990s: Issues and
promise. American Journal of Education, 102(4), 421-449.
Porter, A. C. (1995). The uses and misuses of opportunity-to-learn standards. Educational
Researcher, 24(1), 21-27.
Porter, A. C., Smithson, J., Blank, R., & Zeidner, T. (2007). Alignment as a teacher
variable. Applied Measurement in Education, 20(1), pp. 27-51.
Portin, B., Schneider, P., DeArmond, M., & Gundlach, L. (2003). Making sense of
Leading schools: A study of the school principalship. Seattle, WA: Center on
Reinventing Public Education, Washington University.
Prepared, A. N. (1986). Teachers for the 21st Century. The Report of the Task Force on
Teaching as a Profession.
Ravitch, D. (1995). National standards in American education: A citizen’s guide.
Washington, DC: The Brookings Institution.
Research for Better Teaching. (2013). About RBT. Retrieved from
http://www.rbteach.com/rbteach2/about.html
Richardson, J. (2011). The ultimate practitioner. The Phi Delta Kappan, 93(1), 27-32.

161
Robinson, V., Hohepa, M., & Lloyd, C. (2009). School leadership and student outcomes:
Identifying what works and why. New Zealand Ministry of Education, University
of Auckland, Wellington, New Zealand.
Roehrig, A. D., Bohn, C. M., Turner, J. E., & Pressley, M. (2008). Mentoring beginning
primary teachers for exemplary teaching practices. Teaching and Teacher
Education, 24, 684-702.
Romm, T., & Mahler, S. (1986). A three-dimensional model for using case studies in the
academic classroom. Higher Education, 15(6), 677-696.
Rorrer, A. K., & Skrla, L. (2005). Leaders as policy mediators: The reconceptualization of accountability. Theory into Practice, 44 (1), 53-62.
Saldaña, J. (2013). The coding manual for qualitative researchers (2nd ed.). Thousand
Oaks, CA: Sage.
Salkind, N. J. (2006) Exploring research (6th ed.). Upper Saddle River, NJ: Pearson
Prentice Hall.
Schall E., Ospina, S., Godsoe, B., & Dodge, J. (2004). Appreciative narrative as
leadership research: Matching method to lens. Retrieved from
http://wagner.nyu.edu/files/leadership/matchingmethodtolens.pdf
Schmoker, M. (2003). First things first: Demystifying data analysis. Educational
Leadership, 60 (5), 22-25.
Schon, D. A., & Rein, M. (1994). Frame reflection: Toward the resolution of intractable
policy controversies. New York, NY: Basic Books.
Schott Foundation for Public Education. (2012). The urgency of now: The Schott 50 state

162
report on public education and black males. Retrieved from
www.blackboysreport.org
Schwahn, C. J., & Spady, W. G. (2002). Total leaders applying the best future-focused
change strategies to education. Lanham, MD: Scarecrow Education.
Scribner, R., Sawyer, K., Watson, S., & Myers, V. (2007). Teacher teams and distributed
leadership: A study of group discourse and collaboration. Educational
Administration Quarterly, 43(1), 67-100.
Seidman, I. (2006). Interviewing as qualitative research: A guide for researchers in
education and the social sciences (3rd ed.). New York, NY: Teachers College
Press.
Senge, P. M. (1990).The fifth discipline: The art and practice of the learning
organization. New York, NY: Doubleday.
Shaul, M. S., & Ganson, H. C. (2005). The No Child Left Behind Act of 2001: The
Federal government's role in strengthening accountability for student performance.
In L. Parker (Ed.), Review of research in education (pp. 151-163). Washington,
DC: American Educational Research Association.
Sheppard, B., Brown, J., & Dibbon, D. (2009). School district leadership matters. New
York, NY: Springer.
Sherer, J. Z. (2006). School leadership practice: Putting school subjects into leadership
equation. (Order No. 3212789, Northwestern University). Proquest Dissertations
and Theses, 198-198 p. Retrieved from
http://search.proquest.com/docview/305305437.

163
Sherer, J. Z. & Spillane, J. P. (2011). Constancy and change in school work practice:
Exploring the role of organizational routines. Teachers College Record, 113(3),
611-657.
Silins, H., Mulford, B., & Zarins, S. (2002). Organizational learning and school change.
Educational Administration Quarterly, 38, 613-642.
Singleton, G., & Linton, C. (2006). Courageous conversations about race: A field guide
for achieving equity in schools. Thousand Oaks, CA: Corwin Press.
Skrla, L., McKenzie, K. B., & Scheurich, J. J. (2009). Using equity audits to create
equitable and excellent schools. Thousand Oaks, CA: Corwin.
Skrla, L., & Scheurich, J. J. (2001). Displacing deficit thinking in school district
leadership. Education and Urban Society 33(3), 235-259.
Skrla, L., Scheurich, J. J., & Johnson, J. F. (2000). Equity-driven achievement-focused
school districts: A report on systemic school success in four Texas school districts
serving diverse student populations. The Charles A. Dana Center. Austin, TX:
University of Texas. Retrieved from
http://www.utdanacenter.org/downloads/products/equitydistricts.pdf
Smarter Balanced Assessment Consortium. (2012). About Smarter Balanced Assessment
Consortium. Retrieved from http://www.smarterbalanced.org/about/
Snow, D. A., Rochford, E. B., Worden, S. K., & Benford, R. D. (1986). Frame alignment
processes, micromobilization, and movement participation. American
Sociological Review, 51(4), 464−481.
Spillane, J. P. (2006). Distributed leadership. San Francisco, CA: Jossey-Bass.

164
Spillane, J. P. (2012). Data in practice: Conceptualizing the data-based decision-making
phenomena. American Journal of Education, 118(2), 113-141.
Spillane, J. P. (2013). Diagnosis and design for instructional improvement: Formal structure and school work practice [Powerpoint slides]. Retrieved from http://www.distributedleadership.org/DLS/Presentations_files/SingaporeTalk_ final.pdf Spillane, J. P., & Diamond, J. B. (2007). Distributed leadership in practice. New York,
NY: Teachers College Press.
Spillane, J. P., Diamond, J. B., & Jita, L. (2003). Leading instruction: the distribution of
leadership for instruction. Journal of Curriculum Studies, 35(5), 533-543.
doi:10.1080/00220270210000041972
Spillane, J. P., Halverson, R., & Diamond, J. B. (2001). Investigating school leadership
practice: A distributed perspective. Educational Researcher 30(3), 23-28.
Spillane, J. P., Halverson, R., & Diamond, J. B. (2004). Towards a theory of
leadership practice: A distributed perspective. Journal of Curriculum Studies,
36(1), 3-34. doi: 10.1080/0022027032000106726
Spillane, J. P., Healey, K., & Mesler, L. M. (2009). School leaders' opportunities to learn:
A descriptive analysis from a distributed perspective. Educational Review, 61(4),
407-432. doi: 10.1080/00131910903403998
Spillane, J. P., & Kenney, A. W. (2012). School administration in a changing education
sector: The US experience. Journal of Educational Administration, 50(5), 541-
561. doi:10.1108/09578231211249817
Spillane, J. P., Parise, L. M., & Sherer, J. Z. (2011). Organizational routines as coupling
mechanisms: Policy, school administration, and the technical core. American
Educational Research Journal, 48(3), 586-620.

165
Stake, R. (1995). The art of case study research. Thousand Oaks, CA: Sage.
Starratt, R. J. (2003). Opportunity to learn and the accountability agenda. The Phi Delta
Kappan, 85(4), 298-303.
Stecher, B. (2005). Public hearing on educational governance: Statement of Brian Stecher
to State of California, Little Hoover Commission. Retrieved from
http://www.rand.org/pubs/testimonies/2005/RAND_CT245.pdf
Stein, M.K., & D’Amico, L. (2002). The district as a professional learning laboratory. In
A. Hightower, M. Knapp, J. Marsh & M. McLaughlin (Eds.), School districts and
instructional renewal (pp. 61-75). New York: Teachers College Press.
Stillwell, R., Sable, J., & Plotts, C. (2011). Public school graduates and dropouts from
the common core of data: School year 2008–09 (NCES 2011-312). U.S.
Department of Education. Washington, DC: National Center for Education
Statistics. Retrieved from http://nces.ed.gov/pubsearch
Strategic Education Research Partnership. (2011). Word generation. Retrieved from
http://wg.serpmedia.org/
Stripling, B. (1992). Libraries for the national education goals. Syracuse, NY:
Information Resources Publications, Syracuse University.
Sugai, G., & Horner, R. H. (2009). Defining and describing school-wide positive
behavior support. In W. Sailor, G. Dunlap, G. Sugai, & R. Horner (Eds.),
Handbook of positive behavior supports (pp. 307–326). New York, NY: Springer.
Talukdar, S. S. (2014). Opportunity to learn: The role of professional learning in
understanding and addressing educational inequities (Doctoral
dissertation). Boston College, Boston, MA.

166
Tatum, B.D. (1997). “Why are all the Black kids sitting together in the cafeteria?” and
other conversations about race. New York: BasicBooks.
Taylor, J. R., & Van Every, E. J. (2000). The emergent organization: Communication as
its site and surface. Mahwah, NJ: Lawrence Erlbaum Associates, Inc.
The Education Trust. (2004). A dream deferred: 50 years after Brown vs. Board of
Education, the struggle continues...A 50 state look at achievement, attainment,
and opportunity gaps. Retrieved from
http://www.edtrust.org/dc/press-room/press-release/a-dream-deferred-50-years-
after-brown-v-board-of-education-the-struggle-
Theoharis, G. (2007). Social justice educational leaders and resistance: Toward a theory
of social justice leadership. Educational Administration Quarterly, 43(2), 221.
Timperley, H.S. (2005). Distributed leadership: Developing theory from practice. Journal
of Curriculum Studies, 37(4), 395-420.
Togneri, W., & Anderson, S. E. (2003). How high poverty districts improve. Leadership,
33(1), 12-16.
Traiman, S. L. (1993). The debate on opportunity-to-learn standards. Washington, DC:
National Governors' Association.
Tucker, B. (2010). Putting data into practice: Lessons from New York City. Washington,
DC: Education Sector.
United States Census Bureau (2010). Retrieved from
http://quickfacts.census.gov/qfd/states/25/2523875.html
U.S. Department of Education. (2006). No Child Left Behind improving data quality for
Title I standards, assessments and accountability reporting: Guidelines for states,

167
LEAs, and schools [Non-Regulatory Guidance]. Retrieved from
http://www2.ed.gov/policy/elsec/guid/standardassessment/nclbdataguidance.doc
U.S. Department of Education. (2013). Race to the Top assessment program. Retrieved
from http://www2.ed.gov/programs/racetothetop-assessment/index.html
Valencia, R.R. (1997). The evolution of deficit thinking: Educational thought and
practice. London: Falmer.
Valencia, R., & Solórzano, D. (1997). Contemporary deficit thinking. In R. Valencia
(Ed.), The evolution of deficit thinking in educational thought and practice (pp.
160-210). Abingdon, Oxon: Rutledge.
Valenzuela, A. (1999). Subtractive schooling: U.S.-Mexican youth and the politics of
caring. Albany: State University of New York Press.
Vardaman, J. M., Amis, J. M., Dyson, B. P., Wright, P. M., & Van de, G. R. (2012).
Interpreting change as controllable: The role of network centrality and self-
efficacy. Human Relations, 65(7), 835-859. doi:10.1177/0018726712441642
Walker, R. (1987). Bennet: Test gains at a “dead stall.” Education Week, 7(23), 5.
Waters, J. T., & Marzano, R. J. (2006). School district leadership that works: The effect
of superintendent leadership on student achievement. Denver, CO: Mid-continent
Research for Education and Learning.
Ware, F. (2006). Warm demander pedagogy: Culturally responsive teaching that supports
A culture of achievement for African American students. Urban Education, 41(4),
427-456.
Wayman, J. C., Cho, V., & Shaw, S. (2009). First-year results from an efficacy study of
the Acuity data system. Austin, TX: The University of Texas at Austin.

168
Wayman, J. C., Cho, V., & Johnston, M. T. (2007). The Data-informed district: A district
wide evaluation for data use in the Natrona County School District. Austin, TX:
University of Texas.
Wayman, J. C., Jimerson, J., & Cho, V. (2012). Organizational considerations in
establishing the data-informed district. School Effectiveness & School
Improvement, 23(2), 159-178. doi:101080/09243453.2011.652124
Wayman, J. C., & Stringfield, S. (2006). Data use for school improvement: School
practices and research perspectives. American Journal of Education, 112(4), 463-
468.
Weick, K. E., Sutcliff, K. M., & Obstfeld, D. (2005). Organizing and the process of
sensemaking. Organization Science, 16(4), 409-421.
Whitaker, K. (1996). Exploring causes of principal burnout. Journal of Educational
Administration, 34(1), 60-71.
Wohlstetter, P., Datnow, A., & Park, V. (2008). Creating a system for data-driven
decision-making: Applying the principal-agent framework. School Effectiveness
and School Improvement, 19(3), 239-259.
Yin, R. K. (1994). Case study research: Design and methods (revised 2nd ed.). Newbury
Park, CA: Sage.
Yin, R. K. (2003). Case study research: Designs and methods (3rd ed.). Thousand Oaks,
CA: Sage.
Yin, R. K. (2008). Case study research: Designs and methods (4th ed.). Thousand Oaks,
CA: Sage.

169
Ysseldyke, J., Thurlow, M., & Shin H. (1995). Opportunity-to-learn standards (Policy
Directions No. 4). Retrieved from University of Minnesota, National Center on
Educational Outcomes website:
http://www.cehd.umn.edu/NCEO/onlinepubs/archive/Policy/Policy4.html
Zaleski, K. J. (2014). Opportunity to learn: The role of interactions in understanding and
addressing educational inequities (Doctoral dissertation). Boston College,
Boston, MA.
Zaleznik, A. (2004). Managers and leaders: Are they different? Harvard Business
Review, 82(1), 74-81. (Original work published in 1977)

170
End Note
¹Due to differences in student populations, as well as variation found among the states’
policies and practices for identifying and including SD and ELL students in NAEP
testing, comparisons of performance results for SD and ELL populations may not
accurately reflect increases and decreases over time (NCES, 2011). This likely explains
why less attention has been focused on reporting discrepancies between students with and
without disabilities (Foorman & Nixon, 2006), as well as between native English
speaking students and English language learners. In an effort “to ensure that NAEP
results accurately reflect the educational performance of all students in the target
population and can continue to serve as a meaningful measure of U.S. students’ academic
achievement over time” (NCES, 2011, p.100), the National Assessment Governing Board
recently adopted a new policy that focuses on testing and reporting on SD and ELL
students.

171
Appendix A
District-level Leader Interview Questions
1. To begin, please briefly describe your educational background, as well as your
current role and your history in the school district.
2. Please describe any gaps in student performance that your district is focused on
eliminating.
3. How has central office trained school leaders to use student data?
a. Are there any other supports offered?
b. What else helps people to learn how to use data in this district?
4. What changes have you seen in schools as a result of this training?
5. Have you seen any changes in the central office as a result of this training?
6. Do you believe people have changed the way they think about:
a. their professional responsibilities?
b. collaborating with others?
c. student subgroups?
d. Probes: How do you know? What have you seen? Can you provide an
example?
7. What should schools be doing regularly when it comes to analyzing student data?
How is central office supporting this?
8. Who do you go to for advice regarding work (if anyone)? Why?

172
a. What do you talk about? Give me an example of a recent conversation you
have had?
b. Have you talked about gaps in student performance?
c. Have any actions been taken as a result of these discussions?
i. Which student subgroup(s) have been/will be impacted by these
actions?
9. Are there others you should be able to go to, but do not? Explain.
10. Imagine you had a magic wand. What else needs to happen in your district to
improve student performance?
11. Are there any specific documents related to what we have just discussed that you
would recommend for us to review?

173
School-level Leader Interview Questions
1. To begin, please briefly describe your educational background, as well as your
current role and your history in the school district.
2. Please describe any gaps in student performance that your district is focused on
eliminating.
3. How has central office trained school leaders to use student data?
a. Are there any other supports offered?
b. What else helps people to learn how to use data in this district?
4. What changes have you seen in your school as a result of this training?
5. Have you seen any changes in the central office as a result of this training?
6. Do you believe people have changed the way they think about:
a. their professional responsibilities?
b. collaborating with others?
c. student subgroups?
d. Probes: How do you know? What have you seen? Can you provide an
example?
7. What should schools be doing regularly when it comes to analyzing student data?
a. How are you supporting this?
b. How is central office supporting this?
8. Who do you go to for advice regarding work (if anyone)? Why?
a. What do you talk about? Give me an example of a recent conversation you
have had?

174
b. Have you talked about gaps in student performance?
c. Have any actions been taken as a result of these discussions?
i. Which student subgroup(s) have been/will be impacted by these
actions?
9. Are there others you should be able to go to, but do not? Explain.
10. Imagine you had a magic wand. What else needs to happen in your school to
improve student performance?
11. Are there any specific documents related to what we have just discussed that you
would recommend for us to review?

175