Operations Management, Eleventh Edition Heizer and Render
67
1 - 1 © 2014 Pearson Education, Inc. Operations and Productivity PowerPoint presentation to accompany Heizer and Render Operations Management, Eleventh Edition Principles of Operations Management, Ninth Edition PowerPoint slides by Jeff Heyl 1 1 © 2014 Pearson Education, Inc.
Transcript of Operations Management, Eleventh Edition Heizer and Render

1 - 1© 2014 Pearson Education, Inc.
Operations and Productivity
PowerPoint presentation to accompany Heizer and Render Operations Management, Eleventh EditionPrinciples of Operations Management, Ninth Edition
PowerPoint slides by Jeff Heyl
11
© 2014 Pearson Education, Inc.

1 - 2© 2014 Pearson Education, Inc.
Outline▶Global Company Profile: Hard
Rock Cafe▶What Is Operations Management?▶Organizing to Produce Goods and
Services ▶The Supply Chain▶Why Study OM?▶What Operations Managers Do

1 - 3© 2014 Pearson Education, Inc.
Outline - Continued▶The Heritage of Operations
Management▶Operations for Goods and
Services▶Growth of Services▶Service Pay
▶The Productivity Challenge▶ Productivity Measurement▶ Productivity Variables▶ Productivity and the Service Sector

1 - 4© 2014 Pearson Education, Inc.
Outline - Continued▶New Challenges in Operations
Management▶Ethics, Social
Responsibility, and Sustainability

1 - 5© 2014 Pearson Education, Inc.
Learning ObjectivesWhen you complete this chapter you should be able to:1.Define operations
management2.Explain the distinction
between goods and services
3.Explain the difference between production and productivity

1 - 6© 2014 Pearson Education, Inc.
Learning ObjectivesWhen you complete this chapter you should be able to:4.Compute single-factor
productivity5.Compute multifactor
productivity6.Identify the critical
variables in enhancing productivity

1 - 7© 2014 Pearson Education, Inc.
Operations Management at Hard Rock Cafe
▶First opened in 1971▶ Now – 150 restaurants in over 53 countries
▶Rock music memorabilia▶Creates value in the form of good
food and entertainment▶3,500+ custom meals per day in
Orlando▶How does an item get on the menu?▶Role of the Operations Manager
© 2014 Pearson Education, Inc.

1 - 8© 2014 Pearson Education, Inc.
What Is Operations Management?
Production is the creation of goods and
servicesOperations management (OM) is the set of activities that create value in the
form of goods and services by transforming inputs into
outputs

1 - 9© 2014 Pearson Education, Inc.
Organizing to Produce Goods and Services
▶ Essential functions:1. Marketing – generates demand2. Production/operations – creates
the product3. Finance/accounting – tracks how
well the organization is doing, pays bills, collects the money

1 - 10© 2014 Pearson Education, Inc.
Organizational ChartsFigure 1.1

1 - 11© 2014 Pearson Education, Inc.
Organizational ChartsFigure 1.1

1 - 12© 2014 Pearson Education, Inc.
Organizational ChartsFigure 1.1

1 - 13© 2014 Pearson Education, Inc.
The Supply Chain▶A global network of organizations and activities that supply a firm with goods and services
▶Members of the supply chain collaborate to achieve high levels of customer satisfaction, efficiency and competitive advantage. Figure 1.2
Farmer Syrup Bottler Distributor Retailerproducer

1 - 14© 2014 Pearson Education, Inc.
Why Study OM?1. OM is one of three major functions
of any organization, we want to study how people organize themselves for productive enterprise
2. We want (and need) to know how goods and services are produced
3. We want to understand what operations managers do
4. OM is such a costly part of an organization

1 - 15© 2014 Pearson Education, Inc.
Options for Increasing Contribution
TABLE 1.1
MARKETING OPTION
FINANCE /ACCOUNTING
OPTION OM OPTION
CURRENT
INCREASE SALES
REVENUE 50%
REDUCE FINANCE COSTS 50%
REDUCE PRODUCTION COSTS 20%
Sales $100,000
$150,000
$100,000
$100,000
Cost of goods –80,000 –120,000
–80,000 –64,000
Gross margin 20,000 30,000 20,000 36,000Finance costs –6,000 –6,000 –3,000 –6,000Subtotal 14,000 24,000 17,000 30,000Taxes at 25% –3,500 –6,000 –4,200 –7,500Contribution $
10,500$
18,000$
12,750$
22,500

1 - 16© 2014 Pearson Education, Inc.
What Operations Managers Do
Basic Management Functions
▶Planning▶Organizing▶Staffing▶Leading▶Controlling

1 - 17© 2014 Pearson Education, Inc.
Ten Strategic Decisions
TABLE 1.2DECISION CHAPTER(S)1. Design of goods and services 5, Supplement 52. Managing quality 6, Supplement 63. Process and capacity design 7, Supplement 74. Location strategy 85. Layout strategy 96. Human resources and job design 107. Supply-chain management 11, Supplement 118. Inventory management 12, 14, 169. Scheduling 13, 1510. Maintenance 17

1 - 18© 2014 Pearson Education, Inc.
The Strategic Decisions
1. Design of goods and services▶ Defines what is required of
operations▶ Product design determines quality,
sustainability and human resources2. Managing quality
▶ Determine the customer’s quality expectations
▶ Establish policies and procedures to identify and achieve that quality Table 1.2 (cont.)

1 - 19© 2014 Pearson Education, Inc.
The Strategic Decisions
3. Process and capacity design▶ How is a good or service produced?▶ Commits management to specific
technology, quality, resources, and investment.
4. Location strategy▶ Nearness to customers, suppliers,
and talent.▶ Considering costs, infrastructure,
logistics, and government.Table 1.2 (cont.)

1 - 20© 2014 Pearson Education, Inc.
The Strategic Decisions
5. Layout strategy▶ Integrate capacity needs, personnel
levels, technology, and inventory▶ Determine the efficient flow of
materials, people, and information. 6. Human resources and job design
▶ Recruit, motivate, and retain personnel with the required talent and skills.
▶ Integral and expensive part of the total system design.
Table 1.2 (cont.)

1 - 21© 2014 Pearson Education, Inc.
The Strategic Decisions
7. Supply-chain management▶ Integrate supply chain into the
firm’s strategy.▶ Determine what is to be purchased,
from whom, and under what conditions.
8. Inventory management▶ Inventory ordering and holding
decisions.▶ Optimize considering customer
satisfaction, supplier capability, and production schedules. Table 1.2 (cont.)

1 - 22© 2014 Pearson Education, Inc.
The Strategic Decisions
9. Scheduling▶Determine and implement
intermediate- and short-term schedules.
▶Utilize personnel and facilities while meeting customer demands.
10.Maintenance▶Consider facility capacity,
production demands, and personnel.▶Maintain a reliable and stable
process. Table 1.2 (cont.)

1 - 23© 2014 Pearson Education, Inc.
Where are the OM Jobs?▶Technology/methods▶Facilities/space
utilization▶Strategic issues▶Response time▶People/team development▶Customer service▶Quality▶Cost reduction▶Inventory reduction▶Productivity improvement

1 - 24© 2014 Pearson Education, Inc.
OpportunitiesFigure 1.3

1 - 25© 2014 Pearson Education, Inc.
Certifications▶ APICS, the Association for
Operations Management▶ American Society for Quality (ASQ)▶ Institute for Supply Management
(ISM)▶ Project Management Institute (PMI)▶ Council of Supply Chain Management
Professionals▶ Charter Institute of Purchasing
and Supply (CIPS)

1 - 26© 2014 Pearson Education, Inc.
Significant Events in OM
Figure 1.4

1 - 27© 2014 Pearson Education, Inc.
The Heritage of OM▶ Division of labor (Adam Smith 1776;
Charles Babbage 1852)▶ Standardized parts (Whitney 1800)▶ Scientific Management (Taylor 1881)▶ Coordinated assembly line (Ford/
Sorenson 1913)▶ Gantt charts (Gantt 1916)▶ Motion study (Frank and Lillian
Gilbreth 1922)▶ Quality control (Shewhart 1924;
Deming 1950)

1 - 28© 2014 Pearson Education, Inc.
The Heritage of OM▶Computer (Atanasoff 1938)▶ CPM/PERT (DuPont 1957, Navy 1958)▶ Material requirements planning
(Orlicky 1960)▶ Computer aided design (CAD 1970)▶ Flexible manufacturing system (FMS
1975)▶ Baldrige Quality Awards (1980)▶ Computer integrated manufacturing
(1990)▶ Globalization (1992)▶ Internet (1995)

1 - 29© 2014 Pearson Education, Inc.
Eli Whitney▶Born 1765; died 1825▶In 1798, received government
contract to make 10,000 muskets
▶Showed that machine tools could make standardized parts to exact specifications▶Musket parts could be used in
any musket

1 - 30© 2014 Pearson Education, Inc.
Frederick W. Taylor▶Born 1856; died 1915▶Known as ‘father of
scientific management’▶In 1881, as chief engineer
for Midvale Steel, studied how tasks were done▶Began first motion and time
studies▶Created efficiency principles

1 - 31© 2014 Pearson Education, Inc.
Taylor’s PrinciplesManagement Should Take More Responsibility for:
► Matching employees to right job
► Providing the proper training► Providing proper work methods
and tools► Establishing legitimate
incentives for work to be accomplished

1 - 32© 2014 Pearson Education, Inc.
Frank & Lillian Gilbreth
▶Frank (1868-1924); Lillian (1878-1972)
▶Husband-and-wife engineering team
▶Further developed work measurement methods
▶Applied efficiency methods to their home and 12 children!
▶Book & Movie: “Cheaper by the Dozen,” “Bells on Their Toes”

1 - 33© 2014 Pearson Education, Inc.
▶Born 1863; died 1947▶In 1903, created Ford Motor
Company▶In 1913, first used moving
assembly line to make Model T▶Unfinished product moved by
conveyor past work station▶Paid workers very well for
1911 ($5/day!)
Henry Ford

1 - 34© 2014 Pearson Education, Inc.
W. Edwards Deming▶Born 1900; died 1993▶Engineer and physicist▶Credited with teaching Japan
quality control methods in post-WW2
▶Used statistics to analyze process
▶His methods involve workers in decisions

1 - 35© 2014 Pearson Education, Inc.
Contributions From▶Human factors▶Industrial engineering▶Management science▶Biological science▶Physical sciences▶Information technology

1 - 36© 2014 Pearson Education, Inc.
Operations for Goods and Services
▶Manufacturers produce tangible product, services often intangible
▶Operations activities often very similar
▶Distinction not always clear▶Few pure services

1 - 37© 2014 Pearson Education, Inc.
Differences Between Goods and Services
TABLE 1.3CHARACTERISTICS OF SERVICES CHARACTERISTICS OF GOODSIntangible: Ride in an airline seat Tangible: The seat itself Produced and consumed simultaneously: Beauty salon produces a haircut that is consumed as it is produced
Product can usually be kept in inventory (beauty care products)
Unique: Your investments and medical care are unique
Similar products produced (iPods)
High customer interaction: Often what the customer is paying for (consulting, education)
Limited customer involvement in production
Inconsistent product definition: Auto Insurance changes with age and type of car
Product standardized (iPhone)
Often knowledge based: Legal, education, and medical services are hard to automate
Standard tangible product tends to make automation feasible
Services dispersed: Service may occur at retail store, local office, house call, or via internet.
Product typically produced at a fixed facility
Quality may be hard to evaluate: Consulting, education, and medical services
Many aspects of quality for tangible products are easy to evaluate (strength of a bolt)
Reselling is unusual: Musical concert or medical care
Product often has some residual value

1 - 38© 2014 Pearson Education, Inc.
U.S. Agriculture, Manufacturing, and Service
EmploymentFigure 1.5100 –
80 –
60 –
40 –
20 –
0 –
Percen
t of W
orkfor
ce
18001825
18501875
19001925
19501975
20002025 (est.)
| | | | | | | | |
Agriculture Services Manufacturing

1 - 39© 2014 Pearson Education, Inc.
Organizations in Each Sector
TABLE 1.4
SECTOR EXAMPLEPERCENT OF ALL JOBS
Service SectorEducation, Legal, Medical, Other Trade (retail, wholesale) Utilities, Transportation Professional and Business Services Finance, Information, Real Estate Food, Lodging, Entertainment Public Administration
San Diego Zoo, Arnold Palmer Hospital Walgreen's, Walmart, Nordstrom Pacific Gas & Electric, American Airlines Snelling and Snelling, Waste Management, Inc. Citicorp, American Express, Prudential, AetnaOlive Garden, Motel 6, Walt DisneyU.S., State of Alabama, Cook County
13.213.83.3
10.121.09.0
15.5
85.9
Manufacturing Sector General Electric, Ford, U.S. Steel, Intel
8.2
Construction Sector Bechtel, McDermott 4.1Agriculture King Ranch 1.4Mining Sector Homestake Mining .4Grand Total 100.
0

1 - 40© 2014 Pearson Education, Inc.
Service Pay▶Perception that services are low-paying
▶42% of service workers receive above average wages
▶14 of 33 service industries pay below average
▶Retail trade pays only 61% of national average
▶Overall average wage is 96% of the average

1 - 41© 2014 Pearson Education, Inc.
Productivity ChallengeProductivity is the ratio of outputs (goods and services)
divided by the inputs (resources such as labor and capital)The objective is to improve
productivity!
Important Note!Production is a measure of output only
and not a measure of efficiency

1 - 42© 2014 Pearson Education, Inc.
Feedback loop
Outputs
Goods and
services
Transformation
The U.S. economic system transforms
inputs to outputs at about an annual 2.5%
increase in productivity per year. The productivity increase is the result of a mix of capital (38% of 2.5%), labor (10% of 2.5%),
and management (52% of 2.5%).
The Economic SystemInputs
Labor,capital,
management
Figure 1.6

1 - 43© 2014 Pearson Education, Inc.
Improving Productivity at StarbucksA team of 10 analysts continually look for ways to shave time. Some improvements:Stop requiring signatures on credit card purchases under $25
Saved 8 seconds per transaction
Change the size of the ice scoop
Saved 14 seconds per drink
New espresso machines
Saved 12 seconds per shot

1 - 44© 2014 Pearson Education, Inc.
Improving Productivity at StarbucksA team of 10 analysts continually look for ways to shave time. Some improvements:Stop requiring signatures on credit card purchases under $25
Saved 8 seconds per transaction
Change the size of the ice scoop
Saved 14 seconds per drink
New espresso machines
Saved 12 seconds per shot
Operations improvements have helped Starbucks increase yearly revenue per outlet by $250,000 to $1,000,000 in seven years.Productivity has improved by 27%, or about 4.5% per year.

1 - 45© 2014 Pearson Education, Inc.
▶Measure of process improvement▶Represents output relative to input▶Only through productivity increases
can our standard of living improve
Productivity
Productivity =Units producedInput used

1 - 46© 2014 Pearson Education, Inc.
Productivity Calculations
Productivity = Units producedLabor-hours used
= = 4 units/labor-hour1,000250
Labor Productivity
One resource input single-factor productivity

1 - 47© 2014 Pearson Education, Inc.
Multi-Factor Productivity
OutputLabor + Material + Energy + Capital +
Miscellaneous
Productivity =
► Also known as total factor productivity
► Output and inputs are often expressed in dollars
Multiple resource inputs multi-factor productivity

1 - 48© 2014 Pearson Education, Inc.
Collins Title Productivity
Staff of 4 works 8 hrs/day 8 titles/dayPayroll cost = $640/day Overhead = $400/day
Old System:
=Old labor productiv
ity
8 titles/day32 labor-hrs

1 - 49© 2014 Pearson Education, Inc.
Collins Title Productivity
Staff of 4 works 8 hrs/day 8 titles/dayPayroll cost = $640/day Overhead = $400/day
Old System:
8 titles/day32 labor-hrs=Old labor
productivity
= .25 titles/labor-hr

1 - 50© 2014 Pearson Education, Inc.
Collins Title Productivity
Staff of 4 works 8 hrs/day 8 titles/dayPayroll cost = $640/day Overhead = $400/day
Old System:
14 titles/day Overhead = $800/dayNew System:
8 titles/day32 labor-hrs=Old labor
productivity
=New labor productiv
ity
= .25 titles/labor-hr
14 titles/day32 labor-hrs

1 - 51© 2014 Pearson Education, Inc.
Collins Title Productivity
Staff of 4 works 8 hrs/day 8 titles/dayPayroll cost = $640/day Overhead = $400/day
Old System:
14 titles/day Overhead = $800/dayNew System:
8 titles/day32 labor-hrs=Old labor
productivity
= .25 titles/labor-hr
14 titles/day32 labor-hrs=New labor
productivity
= .4375 titles/labor-hr

1 - 52© 2014 Pearson Education, Inc.
Collins Title Productivity
Staff of 4 works 8 hrs/day 8 titles/dayPayroll cost = $640/day Overhead = $400/day
Old System:
14 titles/day Overhead = $800/dayNew System:
=Old multifactor productivity
8 titles/day$640 + 400

1 - 53© 2014 Pearson Education, Inc.
Collins Title Productivity
Staff of 4 works 8 hrs/day 8 titles/dayPayroll cost = $640/day Overhead = $400/day
Old System:
14 titles/day Overhead = $800/dayNew System:
8 titles/day$640 + 400=Old
multifactor productivity
= .0077 titles/dollar

1 - 54© 2014 Pearson Education, Inc.
Collins Title Productivity
Staff of 4 works 8 hrs/day 8 titles/dayPayroll cost = $640/day Overhead = $400/day
Old System:
14 titles/day Overhead = $800/dayNew System:
8 titles/day$640 + 400=Old
multifactor productivity
=New multifactor productivity
= .0077 titles/dollar
14 titles/day$640 + 800

1 - 55© 2014 Pearson Education, Inc.
Collins Title Productivity
Staff of 4 works 8 hrs/day 8 titles/dayPayroll cost = $640/day Overhead = $400/day
Old System:
14 titles/day Overhead = $800/dayNew System:
8 titles/day$640 + 400
14 titles/day$640 + 800
=Old multifactor productivity
=New multifactor productivity
= .0077 titles/dollar
= .0097 titles/dollar

1 - 56© 2014 Pearson Education, Inc.
Measurement Problems1.Quality may change while the
quantity of inputs and outputs remains constant
2.External elements may cause an increase or decrease in productivity
3.Precise units of measure may be lacking

1 - 57© 2014 Pearson Education, Inc.
Productivity Variables1.Labor -
contributes about 10% of the annual increase2.Capital - contributes about 38% of the annual increase3.Management - contributes about 52% of the annual increase

1 - 58© 2014 Pearson Education, Inc.
Key Variables for Improved Labor Productivity
1.Basic education appropriate for the labor force
2.Diet of the labor force3.Social overhead that makes
labor available▶Challenge is in maintaining and
enhancing skills in the midst of rapidly changing technology and knowledge

1 - 59© 2014 Pearson Education, Inc.
Labor SkillsAbout half of the 17-year-olds in the U.S. cannot correctly answer questions of this type
Figure 1.7

1 - 60© 2014 Pearson Education, Inc.
Capital10
8
6
4
2
0
Perc
ent
incr
ease
in
prod
ucti
vity
Percentage investment10 15 20 25 30 35

1 - 61© 2014 Pearson Education, Inc.
Management▶Ensures labor and capital are effectively used to increase productivity▶Use of knowledge▶Application of technologies
▶Knowledge societies▶Difficult challenge

1 - 62© 2014 Pearson Education, Inc.
Productivity and the Service Sector
1.Typically labor intensive2.Frequently focused on unique
individual attributes or desires
3.Often an intellectual task performed by professionals
4.Often difficult to mechanize and automate
5.Often difficult to evaluate for quality

1 - 63© 2014 Pearson Education, Inc.
Productivity at Taco Bell
Improvements:▶Revised the menu ▶ Designed meals for easy
preparation▶ Shifted some preparation to
suppliers▶ Efficient layout and
automation▶ Training and employee
empowerment▶ New water and energy saving
grills

1 - 64© 2014 Pearson Education, Inc.
Results::▶Preparation time cut to 8 seconds▶ Management span of control
increased from 5 to 30▶ In-store labor cut by 15 hours/day▶ Floor space reduced by more than
50%▶ Stores average 164
seconds/customer from drive-up to pull-out
▶ Water- and energy-savings grills conserve 300 million gallons of water and 200 million KwH of electricity each year
▶ Green-inspired cooking method saves 5,800 restaurants $17 million per year
1 - 65© 2014 Pearson Education, Inc.
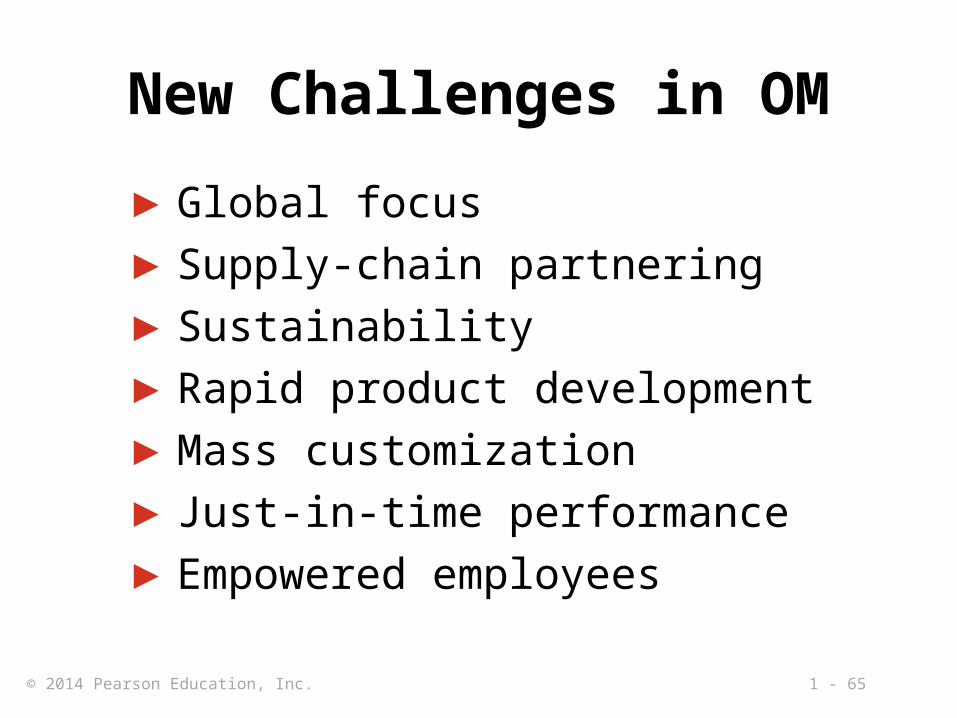
New Challenges in OM▶Global focus▶Supply-chain partnering▶Sustainability▶Rapid product development▶Mass customization▶Just-in-time performance▶Empowered employees

1 - 66© 2014 Pearson Education, Inc.
Ethics, Social Responsibility, and
SustainabilityChallenges facing operations managers:▶Develop and produce safe,
high-quality green products▶Train, retrain, and motivate
employees in a safe workplace▶Honor stakeholder commitments

1 - 67© 2014 Pearson Education, Inc.
All rights reserved. No part of this publication may be reproduced, stored in a retrieval system, or transmitted, in any form or by any
means, electronic, mechanical, photocopying, recording, or otherwise, without the prior written permission of the publisher.
Printed in the United States of America.