
Operational Water Withdrawal and Consumption Factors for ...
15
sustainability Review Operational Water Withdrawal and Consumption Factors for Electricity Generation Technology in China—A Literature Review Jinjing Gao 1 , Peng Zhao 1, * ID , Hongwei Zhang 1,2 , Guozhu Mao 1 and Yuan Wang 1 1 School of Environmental Science and Engineering, Tianjin University, Tianjin 300072, China; [email protected] (J.G.); [email protected] (H.Z.); [email protected] (G.M.); [email protected] (Y.W.) 2 School of Environmental and Chemical Engineering, Tianjin Polytechnic University, Tianjin 300287, China * Correspondence: [email protected] Received: 13 March 2018; Accepted: 12 April 2018; Published: 14 April 2018 Abstract: As two indispensable resources for human development, energy and water are closely related. China, as the world’s largest consumer of electricity, is also experiencing very serious water shortages. Understanding the water consumption intensity in various types of electric power production technologies according to China’s national conditions is a prerequisite for understanding the potential impact of electrical power production on water resources. Therefore, following the steps of a meta-analysis, this paper provides a literature review on operational water withdrawal and consumption factors for electricity generation technology in China. We observed that 50% of water consumption for electricity generation was for coal power, whereas there was no research on the water consumption intensity of natural gas power generation, and a shortage of studies on water intake during electrical power production. The average water consumption intensity of hydropower is the largest. The results indicate that compared with other fuel types, hydropower is not a sustainable energy with respect to water conservation, and the study of hydropower applications should be improved in China. Keywords: water–energy nexus; China; electricity generation; freshwater demands; meta-analysis 1. Introduction The contradiction between the rapidly increasing demand for water/energy and the lack of both resources has gradually become one of the largest obstacles to development in most parts of the world [1–3]. At the same time, water and energy are inextricably and reciprocally linked. The electricity sector is highly dependent on water. By 2035, global water withdrawals for energy production will increase by more than 20% compared to 2010 [4]. China has become the world’s largest consumer of electricity. With its rapid development, China’s demand for electricity will be further expanded. To achieve sustainable development goals, such as a reduction in carbon dioxide emissions, Chinese government departments are adjusting the structure and technology of electric power production. In China’s most important planning initiative—the 13th Five Year Plan—the government clearly noted the goal of establishing a low-carbon electric power industry system and the plan to adjust the working focus in the electric power structure [5]. China is experiencing highly serious water shortages and water contaminations [6,7], while climate change will worsen water availability. What is the impact on water resources of the speed and direction of the electricity demand? Are water resources able to support electricity development goals in the future? Such issues should be considered by the government. Therefore, comprehensive and Sustainability 2018, 10, 1181; doi:10.3390/su10041181 www.mdpi.com/journal/sustainability
-
Upload
khangminh22 -
Category
Documents
-
view
4 -
download
0
Transcript of Operational Water Withdrawal and Consumption Factors for ...

sustainability
Review
Operational Water Withdrawal and ConsumptionFactors for Electricity Generation Technology inChina—A Literature Review
Jinjing Gao 1, Peng Zhao 1,* ID , Hongwei Zhang 1,2, Guozhu Mao 1 and Yuan Wang 1
1 School of Environmental Science and Engineering, Tianjin University, Tianjin 300072, China;[email protected] (J.G.); [email protected] (H.Z.); [email protected] (G.M.);[email protected] (Y.W.)
2 School of Environmental and Chemical Engineering, Tianjin Polytechnic University, Tianjin 300287, China* Correspondence: [email protected]
Received: 13 March 2018; Accepted: 12 April 2018; Published: 14 April 2018�����������������
Abstract: As two indispensable resources for human development, energy and water are closelyrelated. China, as the world’s largest consumer of electricity, is also experiencing very seriouswater shortages. Understanding the water consumption intensity in various types of electric powerproduction technologies according to China’s national conditions is a prerequisite for understandingthe potential impact of electrical power production on water resources. Therefore, following thesteps of a meta-analysis, this paper provides a literature review on operational water withdrawal andconsumption factors for electricity generation technology in China. We observed that 50% of waterconsumption for electricity generation was for coal power, whereas there was no research on the waterconsumption intensity of natural gas power generation, and a shortage of studies on water intakeduring electrical power production. The average water consumption intensity of hydropower is thelargest. The results indicate that compared with other fuel types, hydropower is not a sustainableenergy with respect to water conservation, and the study of hydropower applications should beimproved in China.
Keywords: water–energy nexus; China; electricity generation; freshwater demands; meta-analysis
1. Introduction
The contradiction between the rapidly increasing demand for water/energy and the lack ofboth resources has gradually become one of the largest obstacles to development in most parts of theworld [1–3]. At the same time, water and energy are inextricably and reciprocally linked. The electricitysector is highly dependent on water. By 2035, global water withdrawals for energy production willincrease by more than 20% compared to 2010 [4].
China has become the world’s largest consumer of electricity. With its rapid development, China’sdemand for electricity will be further expanded. To achieve sustainable development goals, such as areduction in carbon dioxide emissions, Chinese government departments are adjusting the structureand technology of electric power production. In China’s most important planning initiative—the 13thFive Year Plan—the government clearly noted the goal of establishing a low-carbon electric powerindustry system and the plan to adjust the working focus in the electric power structure [5].
China is experiencing highly serious water shortages and water contaminations [6,7], whileclimate change will worsen water availability. What is the impact on water resources of the speed anddirection of the electricity demand? Are water resources able to support electricity development goalsin the future? Such issues should be considered by the government. Therefore, comprehensive and
Sustainability 2018, 10, 1181; doi:10.3390/su10041181 www.mdpi.com/journal/sustainability

Sustainability 2018, 10, 1181 2 of 15
accurate data on the water consumption intensity of all types of electric power production is the basisfor answering the above questions.
With the increasing attention of the academic community on problems of the water and energynexus all over the world [8–13], more systematic and comprehensive studies on the water consumptionof electric power production in China have also emerged. Several studies have calculated the waterconsumption intensity of the whole process of electric power production using input–output tables,such as Wu [14], Feng [15] and Okadera [16], but these results mostly present the aggregated waterfootprint of industry sectors, with a lack of spatial and technology details. This shortage of Input-output(IO) analysis was also noted by other researchers, such as Zhang [17], Yuan [18] and Zhang [19], whoidentify the plant-level water consumption for coal-fired electricity generation, and Liu [20], whocalculated the evaporative water consumption for each unit of hydropower generation in China basedon data from 209 power plants. However, these results only focused on one kind of energy source orone category of electrical-power-producing technology. Water consumption for power plants withdifferent energy resources needed to be compared to help the government in making decisions onenergy resources and to help understand the water impact of their electricity decisions. Thus an overallpicture of the water withdrawn and consumption factors for different kinds of energy resources andpower generation technologies in China is strongly needed [21].
Therefore, we provide a review of publications that focus on operational water withdrawals andconsumption factors for electricity generation technology using a meta-analysis. By classifying andsummarizing the relevant literature and data, we present the water use data for China’s power plantsmore clearly [8]. This analysis can more effectively reflect the existing problems of studies of waterconsumption intensity in electrical power production in China and provide a data foundation forfurther studies on the energy and water nexus in China.
2. Materials and Methods
2.1. The Scope of the Review
We estimated the two aspects of water usage: water consumption and water withdrawal.According to the US Geological Survey (USGS), ‘withdrawal’ is defined as the amount of waterremoved from the ground or diverted from a water source for use, while ‘consumption’ refers to theamount of water that is evaporated, transpired, incorporated into products or crops, or otherwiseremoved from the immediate water environment [22].
China’s electricity generation primarily relies on coal power [23]. Meanwhile, the governmentis encouraging the development of hydropower, nuclear power, wind power, solar power, naturalgas power and biomass power [5]. Therefore, this article focuses on the water use of power plantsduring electricity generation utilizing coal, natural gas, nuclear energy, water, wind, solar energyand biomass energy. The electricity generation methods that are not mainstream methods or are notstrongly encouraged by the government, such as geothermal power generation and oil-fired powergeneration, will not be discussed in this article.
Only the water usage for power plant operation, rather than other aspects of the life cycle,such as the fuel cycle or plant construction, was taken into consideration. In this study, operationalwater use includes all of the press-related needs that occur during electricity generation. Thermalelectricity technologies (for example, coal, natural gas, nuclear, concentrating solar power (CSP) andbiopower technologies) generally require water as the working fluid as part of the Rankine cycle, thethermodynamic process that drives a steam engine. Fuel-based electricity technologies (for example,coal, natural gas, nuclear and biopower technologies) also require water as the cooling medium tocondense steam. In addition, coal power plants also involve water use in desulfurization and fluegas dust removal. Nuclear power plants also involve water use for the nuclear island, and CSPalso involves water use in mirror cleaning. For hydroelectricity generation, water is passed straightthrough with negligible losses at the turbine level. The majority of the water lost in hydropower
Sustainability 2018, 10, 1181 3 of 15
plants with reservoirs is incurred by evaporation [24–26]. From the point of the working principle [27]and Macknic’s work [8], for fuel-based electricity technologies, water withdrawals are different fromwater consumption, while for other electricity generation technologies, water consumption is equalto water withdrawals. Therefore, in this paper, we focus on water consumption and withdrawalfactors for fuel-based electricity technologies and water consumption factors for non-fuel-basedelectricity technologies.
2.2. Meta-Analysis
In the study, we followed the steps of a systematic review—a meta-analysis [28]—and attemptedto obtain useful and reliable intensity factors of operational water withdrawal and consumption forelectricity generation technology. The guidelines stage of a meta-analysis includes (1) planning thereview scope (literature review): construct a search strategy and set inclusion criteria for the relevantarticles; (2) data extraction (coding and generation of the databases): tabulate summary data andcode the heterogeneity factors; and (3) data analysis: check for heterogeneity, either by performing ameta-analysis if heterogeneity is not a major concern or by explaining the heterogeneity.
To identify eligible studies, the data sources included published academic literature andgovernment agency reports. The literature involved the topics of operational water consumption orwithdrawal factors for electricity generation technology in China. A full collection of the key wordsused in the search process is shown in Appendix A. The collected studies could be included when(1) the study area was located in China; (2) it revealed information on operational water usage factorsfor individual power plants or statistics for many power plants in China, while the water usagevalue derived from the input–output table was not included; (3) only the input of the operationalphase rather than the life cycle was taken into consideration; and (4) the water resources refer only tofreshwater, while sea water and recycled water were excluded.
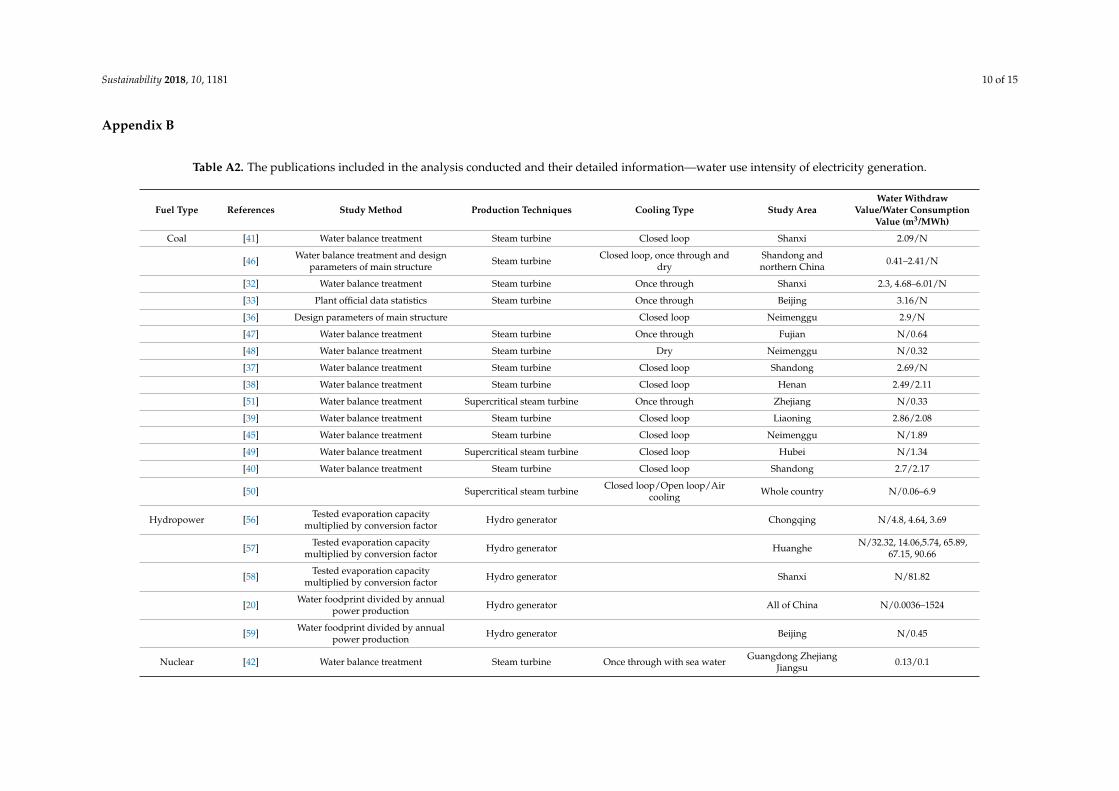
The selected literature was characterized by the explanatory variables representing differentdeterminants of variations in value. The sub-categories included the fuel type (for example, coal,nuclear, hydropower, biopower, solar power or wind power), production technique, cooling system,and literature type (such as national-level statistics, district-level statistics, individual plant surveysor derived from laboratory experiments), study method (for example, energy balance text, designparameters), study area (accurate to province) and year of publication. The first three sub-categorieswere used to classify the selected water use value, while the last three were used for the analysis of theselected studies. The reviewed references are shown in Appendix B.
Finally, the water use value collected was statistically classified and summarized, according towhich the maximum value, the minimum value, and the intermediate value of the water consumptionof the power plants will be determined. In the process of data aggregation, with regard to nationwidedata, the authors took the average value or intermediate value of the range as the median of theresult, whereas extreme values of the range are taken as extreme values of the results. In regard to theregional average values, a regional average value is regarded as the median if it lacks national leveldata, whereas if there is a national average value involved, it will be considered the water consumptionof a particular power plant. Additionally, regional extreme values are taken as the representativewater consumption of power plants and are aggregated together with the water consumption of otherspecific power plants provided in other documents. After the summarization process was completed,the data were further analyzed.
3. Results
3.1. Overview of Water Usage Factors for the Power Plants Studied
According to the literature collected, there are several problems:
(1) We observed that a limited number of valuation studies have been conducted at the national scaleand the compiled statistics from many individual plants in the whole province or country, such as
Sustainability 2018, 10, 1181 4 of 15
the work done by Liu [20], who calculated the water footprints of hydroelectricity in China basedon data from 209 power plants. Other studies mostly used the data from only one power plant.
(2) The papers focused on coal-fired power plants accounted for 30% of all the papers cited in thisstudy, followed by nuclear power and hydropower both accounting for 12%. We did not find anypaper focused on the water consumption intensity of gas-fired power plants. The reason may bethat 75% of all of China’s electricity is generated by coal-fired power plants [29], while only 4% isfrom gas-fired power plants [30].
(3) The concepts of “water usage” was not defined precisely in some literature, such as Li’s work [31].They just use the concept of “water usage” without explaining whether the “water usage” was“water consumption” or “water withdrawal”. This problem was obvious in the literature writtenin Chinese.
(4) Furthermore, the statistical system is incomplete in China and lacks comprehensive, official,public statistical reports on the water use for electric power production. In the Statistical Yearbookof China’s Power Industry, which is the authority for the statistical results for the power industryin China, there was no information about the water use of electric power plants (except for the2012 yearbook) [23]. This lack indicates that the government did not mention the importance ofthe impact on water of electricity generation.
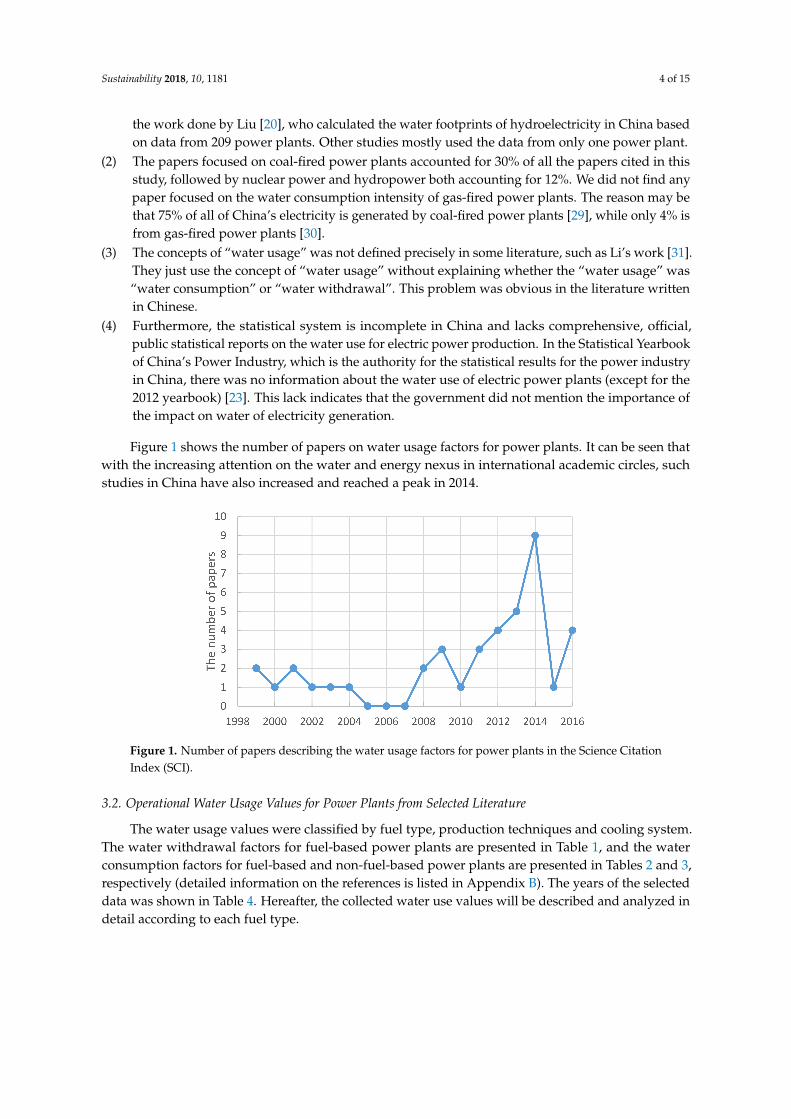
Figure 1 shows the number of papers on water usage factors for power plants. It can be seen thatwith the increasing attention on the water and energy nexus in international academic circles, suchstudies in China have also increased and reached a peak in 2014.
Figure 1. Number of papers describing the water usage factors for power plants in the Science CitationIndex (SCI).
3.2. Operational Water Usage Values for Power Plants from Selected Literature
The water usage values were classified by fuel type, production techniques and cooling system.The water withdrawal factors for fuel-based power plants are presented in Table 1, and the waterconsumption factors for fuel-based and non-fuel-based power plants are presented in Tables 2 and 3,respectively (detailed information on the references is listed in Appendix B). The years of the selecteddata was shown in Table 4. Hereafter, the collected water use values will be described and analyzed indetail according to each fuel type.

Sustainability 2018, 10, 1181 5 of 15
Table 1. The water withdrawal factors for fuel-based power plants.
FuelType Technology Cooling Type
Median Mean Min MaxN 1 Sources
(m3/MWh)
Coal Generic Closed-loop 3.16 3.8 2.49 7.07 16 [32–40]Subcritical Closed-loop 2.09 2.09 2.09 2.09 1 [41]
Nuclear GenericOnce-through
(using seawaterfor cooling)
0.05 0.074 0.04 0.13 6 [42–44]
1 Number of power plant samples.
Table 2. The water consumption factors for fuel-based power plants.
FuelType Technology Cooling Type
Median Mean Min MaxN 1 Sources
(m3/MWh)
Coal Generic Closed-loop 1.9 1.6 1.89 2.23 6 [38,40,45,46]Once-through 0.64 0.64 0.64 0.64 1 [47]
Dry 0.24 0.17 0.32 2 [46,48]Supercritical Closed-loop 2.2 2.32 0.15 6.9 45 [49,50]
Once-through 0.4 0.55 0.31 3 37 [50,51]Dry cooling 0.435 0.449 0.18 0.7 7 [50]
Nuclear Generic
Closed-loop(using fresh
water forcooling)
1.7 1.6 1.8 2 [52,53]
Biopower Steam Closed-loopcooling 4.47 4.39 2.4 5.53 15 [54,55]
1 Number of power plant samples.
Table 3. The water consumption factors for non-fuel-based power plants.
Fuel Type Sub-CategoryMedian Mean Min Max
N 1 Sources(m3/MWh)
Hydropower 13 0.0036 15,244 222 [20,56–59]CSPr Wet cooling 3.78 3.65 3.18 4 3 [60,61]
Dry cooling 0.75 0.75 0.75 0.75 1 [62]PV 0.019 0.19 0.019 0.019 1 [61]
Wind 0 0 0 0 1 [63]1 Number of power plant samples.
Table 4. The years of the selected data.
Fuel Type Coal Nuclear Biopower Hydropower CSP PV Wind
Year 2002–2013 2010–2015 2014 1998–2014 2013–2014 2014 2012
The largest water consumption of all fuel resources results from the use of hydropower. However,hydroelectricity does not always have a large water intensity. For the Three Gorges HydroelectricProject, the water consumption per unit of electricity generated was only 4.25 m3 MW−1 h−1, which is20 times less than hydroelectric projects on the Fenhe River (81.8 m3 MW−1 h−1), but is of the sameorder of magnitude for other fuel resource categories. The smallest water consumption values resultfrom wind energy and photovoltaic (PV), which are close to zero. Nuclear power plants generally havelower water consumption and water withdrawals than coal-fired power plants with general technologyand have greater water consumption than coal-fired power plants with supercritical technology.Coastal nuclear fresh-water withdrawals are only 1/60 of the intensity of water withdrawals of coalpower that uses general technology, whereas the water consumption of inland nuclear power is 1/2 the

Sustainability 2018, 10, 1181 6 of 15
intensity of that of general coal power and slightly larger than the supercritical water consumption ofcoal power generation (when using closed-loop cooling technology). Biomass power plants consumetwice as much water as coal-fired power plants. From this result, we can see that changing theelectricity generation technology from coal to other fuels is not always water-friendly.
3.3. The Quality of the Selected Data
For coal power, 352 coal-fired power plants were included in our references, which accountedfor 30% of all the thermal power plants in China. Thermal power plants can be found in 30 provincesin China (1191) [23] and the thermal power plant locations in our references were distributed in26 provinces.
According to the statistical numbers of nuclear power enterprises from the World NuclearAssociation, there were 11 nuclear power plants with 30 nuclear power sets in China in 2015; fourplants with 10 nuclear power sets were included in the references (Cao [43] and Guo [44]) and wereused in this paper. There were also six types of nuclear power sets actively used in China in 2015,which were CNP300, M310, CNP600, Candu HWR, VVER1000, and CPR1000, while four of them(M310, Candu PHWR, VVER1000, CPR1000) were included in the references (Cao [43] and Guo [44])and were used in this paper.
For biomass-fired power plants, although there were two studies—Zhao [54] and Peng [55]—onthe water consumption of electricity generation from biomass combustion, it can be seen in Table A2that the water consumption data were not very divergent from those in existing studies.
For hydropower, 219 hydropower plants were included in our references, which accounted for20% of the total number of hydropower plants (1152) [23].
For concentrating solar power, there were also two types of mature concentrating solar powertechnologies, namely parabolic trough and power tower. The water consumption for the power towerwas included in our references.
Both of the studies on water for wind power plants found that there was nearly no waterconsumption for electricity generation by wind power. They drew this conclusion not only from thepower plant but also from the theory of wind power generation [9,63].
4. Discussion
4.1. Status and Knowledge Gaps of Water for Electricity Studies
For coal power, there was only one study that evaluated the water use for electricity productionat the national scale, which was in Yuan’s work [18]. Besides this, Zuo’s study [33] provided theregional power plant statistics for Beijing; the other data all comes from a summary of independentpower plant data. The collected literature lacks reports on the water withdrawal of the air-cooling sets.However, its water consumption should be approximately the same as its water intake, consideringits operating principle [64]. In the literature, there is also a shortage of reports regarding waterwithdrawals in once-through cooling technology, which is probably observed because cooling water isdischarged into the water pool during the once-through cooling process, where the consumption isnegligible. Moreover, China has not explicitly stipulated water withdrawal standards for once-throughcooling technology in the Norm on Water Intake, Part1—Electricity Power Production [65] and thetechnical code for designing fossil fuel power plants [21]. The amount of water intake in direct coolingtechnologies is a noteworthy issue. During the once-through cooling process, there is almost noconsumption of cooling water, but it still occupies local water resources for the purpose of ensuringthe safe operation of power plants, which is related to the allocation of local fresh water resources.Therefore, further attention is needed on this type of research.
China’s current nuclear power plants are all located in coastal areas. They have adoptedonce-through cooling technology and use seawater as the cooling water [66]. Therefore, in theliterature we can find the fresh water withdrawal intensity data for seawater as the cooling water and
Sustainability 2018, 10, 1181 7 of 15
the conjectural data of the water consumption intensity of closed-loop water cooling technology, inspite of the lack of literature providing national statistical data.
There are only two independent project studies on the water consumption of China’s biomasselectricity generation, and the relevant studies on water consumption of garbage power generationand biogas power generation were not found. The search results for the water consumption of biofuelwere mainly focused on water consumption for bio-ethanol and biodiesel, such as Gerbens’ work [67],Ding’s work [68], Hao’s work [69] and Yao’s work [70]. The biomass energy utilization has grown fastin the past 25 years and there is a huge development potential in biomass energy [71–75]. Thus, thewater use of biomass power should receive more attention.
4.2. Factors That Influence the Water Consumption Factors of Electricity Generation
For fuel-based electricity technologies, the cooling system employed is often a greater determinantof the water consumption than the technology and fuel type. For coal-fired power plants, the differencein values between water consumption factors for general technology and supercritical technologywith the same cooling type is smaller than that between the closed-loop cooling type and othercooling types with the same technology. For closed-loop technologies, biopower plants have thelargest water consumption factors, which are three times greater than the lowest water consumptionfactors of coal-fired power plants with supercritical technology. However, for the same fuel type, thewater consumption factors of the closed loop were four times (for coal-fired power with supercriticaltechnology), five times (for concentrating solar power) and six times (for coal-fired power with generictechnology) that of dry cooling.
Liu [20] calculated hydroelectric water footprints, that is, the evaporative water consumptionfor each unit of hydropower generation in China based on data from 875 representative reservoirs(209 with power plants). In addition, we collected the evaporation data in the Three Gorges area [56],the large and medium-sized reservoirs of the Yellow River area [54], and the Fenhe reservoir [58] andthe electricity generation data from the corresponding power plants. The results are all within therange of Liu’s results [20]. At the same time, the water consumption of the hydropower projects inthe Three Gorges area is 10 times lower than those in the Yellow River area and Fenhe area, as shownin Table 5. The reason for the huge difference in water consumption between different hydropowerprojects may be because of the vast differences in the evaporation conditions in China. In the contextof China’s vigorous promotion of hydropower projects, the impact of the hydropower projects on thelocal water resources through the evaporation of reservoir water should receive considerable attention.
Table 5. The comparison of the results from Sun [56] (2012), Tian [57] (2005) and Yang [58] (2005).
Water Consumption of Hydropower Plants Hydropower Plant Area
4.25 [56] Three Gorges Hydroelectric Project51.9 [57] Yellow River81.8 [58] Fenhe
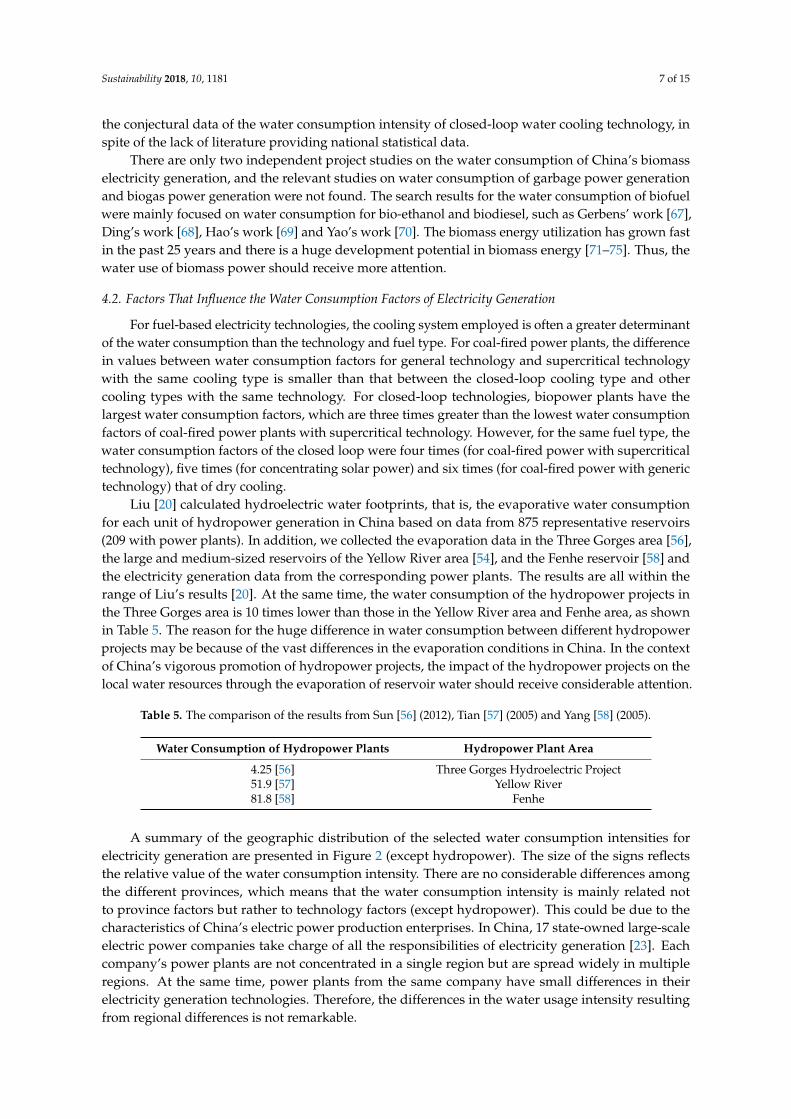
A summary of the geographic distribution of the selected water consumption intensities forelectricity generation are presented in Figure 2 (except hydropower). The size of the signs reflectsthe relative value of the water consumption intensity. There are no considerable differences amongthe different provinces, which means that the water consumption intensity is mainly related notto province factors but rather to technology factors (except hydropower). This could be due to thecharacteristics of China’s electric power production enterprises. In China, 17 state-owned large-scaleelectric power companies take charge of all the responsibilities of electricity generation [23]. Eachcompany’s power plants are not concentrated in a single region but are spread widely in multipleregions. At the same time, power plants from the same company have small differences in theirelectricity generation technologies. Therefore, the differences in the water usage intensity resultingfrom regional differences is not remarkable.
Sustainability 2018, 10, 1181 8 of 15
Figure 2. Geographical distribution of the selected data.
4.3. The Effect of the Energy Development Trend on Water Resources in China
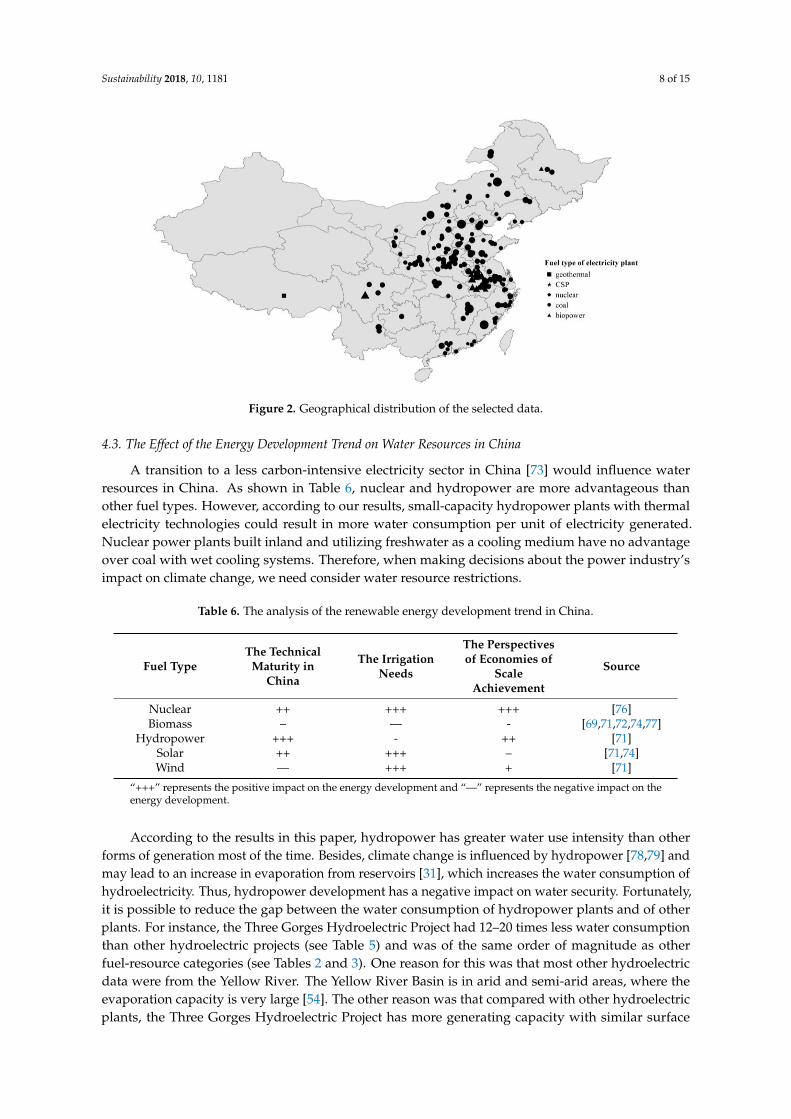
A transition to a less carbon-intensive electricity sector in China [73] would influence waterresources in China. As shown in Table 6, nuclear and hydropower are more advantageous thanother fuel types. However, according to our results, small-capacity hydropower plants with thermalelectricity technologies could result in more water consumption per unit of electricity generated.Nuclear power plants built inland and utilizing freshwater as a cooling medium have no advantageover coal with wet cooling systems. Therefore, when making decisions about the power industry’simpact on climate change, we need consider water resource restrictions.
Table 6. The analysis of the renewable energy development trend in China.
Fuel TypeThe Technical
Maturity inChina
The IrrigationNeeds
The Perspectivesof Economies of
ScaleAchievement
Source
Nuclear ++ +++ +++ [76]Biomass – — - [69,71,72,74,77]
Hydropower +++ - ++ [71]Solar ++ +++ – [71,74]Wind — +++ + [71]
“+++” represents the positive impact on the energy development and “—” represents the negative impact on theenergy development.
According to the results in this paper, hydropower has greater water use intensity than otherforms of generation most of the time. Besides, climate change is influenced by hydropower [78,79] andmay lead to an increase in evaporation from reservoirs [31], which increases the water consumption ofhydroelectricity. Thus, hydropower development has a negative impact on water security. Fortunately,it is possible to reduce the gap between the water consumption of hydropower plants and of otherplants. For instance, the Three Gorges Hydroelectric Project had 12–20 times less water consumptionthan other hydroelectric projects (see Table 5) and was of the same order of magnitude as otherfuel-resource categories (see Tables 2 and 3). One reason for this was that most other hydroelectricdata were from the Yellow River. The Yellow River Basin is in arid and semi-arid areas, where theevaporation capacity is very large [54]. The other reason was that compared with other hydroelectricplants, the Three Gorges Hydroelectric Project has more generating capacity with similar surface

Sustainability 2018, 10, 1181 9 of 15
evaporation [54,56]. Therefore, to solve the problem, hydropower development requires coordinatedimplementation among geographic regions to improve efficiency, as well as a trade-off analysis betweenreducing greenhouse gas emissions and water use sustainability [80,81].
5. Conclusions
Following the steps of a meta-analysis, in this study we reviewed the literature that reports onthe operational water withdrawal and consumption factors for electricity generation technology inChinese power plants. Through a relevant literature review, we observed that studies on the wateruse intensity of electrical power production in Chinese power plants are still very incomplete. Thereare several main problems. There is a lack of national-level investigation into the water consumptionof power plants in China to represent the conditions of the whole country. There is a lack of reportsaimed at examining the water use intensity of some electricity production technologies, such as powergeneration from natural gas. Studies on the water intake intensity of electrical power productionare inadequate, as well. Hence, several conclusions can be drawn from the results of the existingreports. For fuel-based power plants, the difference in water consumption intensity resulting from thedifference in cooling methods is greater than that resulting from different energy sources. For the waterconsumption intensity of hydropower, which results from reservoir evaporation, its average value isthe largest. Therefore, it can be seen that in the process of China’s transition to low-carbon electricitygeneration, the government should pay special attention to whether it will increase the regional watercrises with the use of hydropower. The water consumption intensity of wind power and solar powergeneration is close to zero. Thus, these two technologies are water-friendly power generation sources.In addition, the water intake intensity of coastal nuclear power plants and the water consumptionintensity of inland nuclear power are both less than that of coal power. The water consumptionintensity of biomass power generation was generally no more than that for coal-fired plants. It canbe conjectured that the water consumption in power plants is not an obstacle to biomass application.In the meantime, since coal power’s position in China’s electric power production structure will notchange in a short period of time, the change of its cooling modes will certainly and significantly reducethe pressure on water resources in the process of coal power generation.
Acknowledgments: This research was supported by the National Natural Science Foundation of China(No. 41571522).
Author Contributions: Jinjing Gao made substantial contributions to the acquisition of data, calculation andresults interpretation. Peng Zhao made substantial contributions to the logical structure of the manuscript.Hongwei Zhang, Guozhu Mao and Yuan Wang provided useful advice for the structure and grammar revisionthe paper.
Conflicts of Interest: The authors declare no conflict of interest.
Appendix A
Table A1. The keywords introduced in the systematic review regarding the three main fields: studylocation, economic valuation technique and ecosystem services.
Field Main Words
Study location “Chinese” or “China”
Water consumption for power plants
“water use *” or “water balance” or “water consumption” or “water saving”or “water demand” or “consumption of water” or “water resource *”“fossil-fired power plant *” or “thermal power plant *” or “power plant *”“hydropower” or “evaporation and reservoirs”“nuclear plant” or “nuclear power”“biomass power” or “biomass” or “wind power” or “renewable power” or“non-fossil power”
Water and energy nexus “water -energy nexus” or “water electricity nexus”
Wildcard (*) is used here to find plurals and word variants
Sustainability 2018, 10, 1181 10 of 15
Appendix B
Table A2. The publications included in the analysis conducted and their detailed information—water use intensity of electricity generation.
Fuel Type References Study Method Production Techniques Cooling Type Study AreaWater Withdraw
Value/Water ConsumptionValue (m3/MWh)
Coal [41] Water balance treatment Steam turbine Closed loop Shanxi 2.09/N
[46] Water balance treatment and designparameters of main structure Steam turbine Closed loop, once through and
dryShandong andnorthern China 0.41–2.41/N
[32] Water balance treatment Steam turbine Once through Shanxi 2.3, 4.68–6.01/N
[33] Plant official data statistics Steam turbine Once through Beijing 3.16/N
[36] Design parameters of main structure Closed loop Neimenggu 2.9/N
[47] Water balance treatment Steam turbine Once through Fujian N/0.64
[48] Water balance treatment Steam turbine Dry Neimenggu N/0.32
[37] Water balance treatment Steam turbine Closed loop Shandong 2.69/N
[38] Water balance treatment Steam turbine Closed loop Henan 2.49/2.11
[51] Water balance treatment Supercritical steam turbine Once through Zhejiang N/0.33
[39] Water balance treatment Steam turbine Closed loop Liaoning 2.86/2.08
[45] Water balance treatment Steam turbine Closed loop Neimenggu N/1.89
[49] Water balance treatment Supercritical steam turbine Closed loop Hubei N/1.34
[40] Water balance treatment Steam turbine Closed loop Shandong 2.7/2.17
[50] Supercritical steam turbine Closed loop/Open loop/Aircooling Whole country N/0.06–6.9
Hydropower [56] Tested evaporation capacitymultiplied by conversion factor Hydro generator Chongqing N/4.8, 4.64, 3.69
[57] Tested evaporation capacitymultiplied by conversion factor Hydro generator Huanghe N/32.32, 14.06,5.74, 65.89,
67.15, 90.66
[58] Tested evaporation capacitymultiplied by conversion factor Hydro generator Shanxi N/81.82
[20] Water foodprint divided by annualpower production Hydro generator All of China N/0.0036–1524
[59] Water foodprint divided by annualpower production Hydro generator Beijing N/0.45
Nuclear [42] Water balance treatment Steam turbine Once through with sea water Guangdong ZhejiangJiangsu 0.13/0.1

Sustainability 2018, 10, 1181 11 of 15
Table A2. Cont.
[43] Water balance treatment Steam turbine Once through with sea water 0.04,0.13,0.05/N
[44] Water balance treatment Steam turbine Closed loop with fresh water 0.054/N
[52] Water balance treatment Steam turbine Closed loop with fresh water N/1.8
[53] Water balance treatment Steam turbine Once through with fresh water N/1.6
Biopower [54] Water balance treatment Straw combustion Closed loop Heilongjiang N/2.4
[55] Water balance treatment Straw combustion Closed loop Anhui N/3.43–5.53
Solar power [62] Design parameters of main structure Concentrating solar power Dry Neimenggu N/0.75
[60] Design parameters of main structure Concentrating solar power Closed loop Northwest China N/4
[61] CSPPV
Closed loop N/3.18–3.78N/0.019
Wind [63] LCA 0
Sustainability 2018, 10, 1181 12 of 15
References
1. King, C.W.; Holman, A.S.; Webber, M.E. Thirst for energy. Nat. Geosci. 2008, 1, 283–286. [CrossRef]2. Sovacool, B.K.; Sovacool, K.E. Identifying future electricity-water trade-offs in the United States. Energy
Policy 2009, 37, 2763–2773. [CrossRef]3. Schaeffer, R.; Szklo, A.S.; de Lucena, A.F.P.; Borba, B.S.M.C.; Nogueira, L.P.P.; Fleming, F.P.; Troccoli, A.;
Harrison, M.; Boulahya, M.S. Energy sector vulnerability to climate change: A review. Energy 2012, 38, 1–12.[CrossRef]
4. Power Reactor Information System-Reactor Details: Hongyanhe 1. Available online: https://www.iaea.org/pris/CountryStatistics/ReactorDetails.aspx?current=904 (accessed on 11 March 2016).
5. 13th Five-Year Plan of Power Industry Development. (In Chinese). Available online: http://www.ndrc.gov.cn/fzgggz/fzgh/ghwb/gjjgh/201706/t20170605_849994.html (accessed on 20 July 2017).
6. Zhang, S.; Mao, G.Z.; Crittenden, J.; Liu, X.; Du, H.B. Groundwater remediation from the past to the future:A bibliometric analysis. Water Res. 2017, 119, 114. [CrossRef] [PubMed]
7. Zhang, S.; Hou, Z.; Du, X.M.; Li, D.M.; Lu, X.X. Assessment of biostimulation and bioaugmentationfor removing chlorinated volatile organic compounds from groundwater at a former manufacture plant.Biodegradation. 2016, 27, 223–236. [CrossRef] [PubMed]
8. Macknick, J.; Newmark, R.; Heath, G.; Hallett, K.C. Operational water consumption and withdrawal factorsfor electricity generating technologies: A review of existing literature. Environ. Res. Lett. 2012, 7, 045802.[CrossRef]
9. Meldrum, J.; Nettles-Anderson, S.; Heath, G.; Macknick, J. Life cycle water use for electricity generation: Areview and harmonization of literature estimates. Environ. Res. Lett. 2013, 8, 015031. [CrossRef]
10. Macknick, J.; Sattler, S.; Averyt, K.; Clemmer, S.; Rogers, J. The water implications of generating electricity:Water use across the United States based on different electricity pathways through 2050. Environ. Res. Lett.2012, 7, 045803. [CrossRef]
11. Wang, S.; Wang, S. Implications of improving energy efficiency for water resources. Energy 2017, 140, 922–928.[CrossRef]
12. Shaikh, M.A.; Kucukvar, M.; Onat, N.C.; Kirkil, G. A framework for water and carbon footprint analysis ofnational electricity production scenarios. Energy 2017, 139, 406–421. [CrossRef]
13. Averyt, K.; Macknick, J.; Rogers, J.; Madden, N.; Fisher, J.; Meldrum, J.; Newmark, R. Water use for electricityin the United States: An analysis of reported and calculated water use information for 2008. Environ. Res. Lett.2013, 8, 015001. [CrossRef]
14. Wu, X.D.; Chen, G.Q. Energy and water nexus in power generation: The surprisingly high amount ofindustrial water use induced by solar power infrastructure in China. Appl. Energy 2017, 195, 125–136.[CrossRef]
15. Feng, K.; Hubacek, K.; Siu, Y.L.; Li, X. The energy and water nexus in Chinese electricity production:A hybrid life cycle analysis. Renew. Sustain. Energy Rev. 2014, 39, 342–355. [CrossRef]
16. Okadera, T.; Geng, Y.; Fujita, T.; Dong, H.; Liu, Z.; Yoshida, N.; Kanazawa, T. Evaluating the water footprintof the energy supply of Liaoning Province, China: A regional input-output analysis approach. Energy Policy2015, 78, 148–157. [CrossRef]
17. Zhang, C.; Anadon, L.D.; Mo, H.P.; Zhao, Z.N.; Liu, Z. Revealing water stress by the thermal powerindustry in China based on a high spatial resolution water withdrawal and consumption inventory.Environ. Sci. Technol. 2016, 50, 1642–1652. [CrossRef] [PubMed]
18. Yuan, J.; Lei, Q.; Xing, M.; Guo, J.S.; Zhao, C.H. Scenario-based analysis on water resources implication ofcoal power in Western China. Sustainability 2014, 6, 7155–7180. [CrossRef]
19. Zhang, X.; Liu, J.; Tang, Y.; Zhao, X.; Yang, H.; Gerbens-Leenes, P.W.; van Vliet, M.T.H.; Yan, J. China’scoal-fired power plants impose pressure on water resources. J. Clean. Prod. 2017, 161, 1171–1179. [CrossRef]
20. Liu, J.G.; Zhao, D.D.; Gerbens-Leenes, P.W.; Guan, D. China’s rising hydropower demand challenges watersector. Sci. Rep. 2015, 5, 11446. [CrossRef] [PubMed]
21. Li, M.; Dai, H.; Xie, Y.; Tao, Y.; Bregnbaek, L.; Sandholt, K. Water conservation from power generation inChina: A provincial level scenario towards 2030. Appl. Energy 2017, 208, 580–591. [CrossRef]

Sustainability 2018, 10, 1181 13 of 15
22. Kenny, J.F.; Barber, N.L.; Hutson, S.S.; Linsey, K.S.; Lovelace, J.K.; Maupin, M.A. Estimated Use of Waterin the United States in 2005(US Geological Survey Circularvol; Geological Survey: Reston, VA, USA, 2009;Volume 1344, pp. 25–40.
23. National Bureau of Statistics of China. Statistical Yearbook of China’s Power Industry; China Statistics Press:Beijing, China, 2013. (In Chinese)
24. Gleick, P. Water and energy. Annu. Rev. Energy Environ. 1994, 19, 267–299. [CrossRef]25. Wang, B. Comprehensive Assessment of the Three Gorges Project’s Impact on the Eco-environment in Reservoir Area;
Beijing Forestry University: Beijing, China, 2009. (In Chinese)26. Cao, Y.Q.; Ni, G.H.; Hu, H.P. Analyze impacts on the eco-environment of the hydraulic and hydropower
projects. Yellow River 2005, 1, 56–58. (In Chinese)27. Ministry of Housing and Urban-Rural Development of the People’s Republic of China (MOHURD). Code for
Design of Fossil fired Power Plant; M. E. Sharpe: Beijing, China, 2011; pp. 160–169.28. Pullin, A.S.; Stewart, G.B. Guidelines for systematic review in conservation and environmental management.
Conserv. Biol. 2006, 20, 1647–1656. [CrossRef] [PubMed]29. Jia, X.; Li, Z.; Wang, F.; Foo, D.C.Y.; Tan, R.R. Multi-dimensional pinch analysis for sustainable power
generation sector planning in China. J. Clean. Prod. 2016, 112, 2756–2771. [CrossRef]30. The Data List of 2015 Chinese Electricity Statistics. Available online: http://www.cec.org.cn/
guihuayutongji/tongjxinxi/niandushuju/2016-09-22/158761.html (accessed on 30 April 2016).31. Lv, M.-Q.; Chen, J.-L.; Mirza, Z.A.; Chen, C.-D.; Wen, Z.-F.; Jiang, Y.; Ma, M.-H.; Wu, S.-J. Spatial distribution
and temporal variation of reference evapotranspiration in the Three Gorges Reservoir area during 1960–2013.Int. J. Climatol. 2016, 36, 4497–4511. [CrossRef]
32. Li, B.; Pi, J.G.; Zhang, S.X. Investigation and analysis of water resources and water consumption conditionsin large-scale thermal power plant of Shanxi province. Shanxi Electr. Power 2002, 108, 8–10. (In Chinese)
33. Zuo, J.B.; Liu, C.M.; Zheng, H.X. Analysis on water consumption and water saving countermeasures ofthermal power industry in Beijing. Water Wastewater Eng. 2008, 34, 56–60. (In Chinese)
34. Su, W.J. Water economizing problem in Zhongning electric power plant Ningxia. Electr. Power 2001, 4, 21–24.(In Chinese)
35. Wang, F. Analysis on water consumption level of the power plants in China and water-saving measures.Hebei Electr. Power 2001, 20, 6–9. (In Chinese)
36. Qian, W.X.; Xu, R.W. The measures and proposal for sustainable development water supply of powerindustry in eastern inner Mongolia Inner. Mong. Environ. Prot. 2004, 16, 9–14. (In Chinese)
37. Zhang, L. Coal-fired thermal power plant technical analysis and transformation for water-saving, emissionreduction, efficiency improvement. China Plant Eng. 2013, 6, 5–7. (In Chinese)
38. Cai, J.M.; Fan, X. Water balance test example and analysis in thermal power plant. Electr. Power Technol.Environ. Prot. 2013, 29, 28–30. (In Chinese)
39. Du, J.; Du, F. Discussion on water saving method of fossil-fired power plants in consideration of waterbalance testing. Northeast Electr. Power Technol. 2011, 4, 15–17. (In Chinese)
40. Zhang, Y.; Wang, C.L.; Zhang, W.; Xin, H.C. Water balance test and water saving measur of 300 MW unitShandong. Electr. Technol. 2008, 163, 77–80. (In Chinese)
41. Xu, H.; Yu, T.Q.; Tian, J.; Zhang, G.B. Research and analysis test of water balance in Hejin power plant.Shanxi Electr. Power 2003, 112, 12–14. (In Chinese)
42. Qiu, J.; Huang, B.S.; Ma, R.; Ji, H.X. Experience and rationality analysis of water use by nuclear plant. ChinaWater Resour. 2011, 17, 35–39. (In Chinese)
43. Cao, X.Q.; Huang, B.S.; Qiu, J. Water use rationality analysis and guideposts discussion of nuclear powerstation near the sea. Guangdong Water Resour. Hydropower 2012, 6, 12–14. (In Chinese)
44. Guo, L.; Huang, B.S.; Qiu, J.; Qiu, S.X. Research on the characteristics of fresh water consumption in nuclearpower plant. J. Hydraul. Eng. 2013, 44, 615–621. (In Chinese)
45. Wang, W.J.; Liu, T.X.; Liu, X.M. Water balance testing and its saving analysis in a themal power plant water.Conserv. Sci. Technol. Econ. 2009, 15, 225–230. (In Chinese)
46. Han, M. Analysis and countermeasures on water consumption in thermal power plants. Ind. Water Treat.2010, 30, 3–6. (In Chinese)
47. Zeng, Z.W. Analysis on water consumption and water saving countermeasures of thermal power industryin Fujian. Fujian Power Electr. Eng. 2000, 20, 39–40. (In Chinese)

Sustainability 2018, 10, 1181 14 of 15
48. Song, J.H.; Yang, X.R. Reduce power plant water consumption by plant water conservation. Inner Mong. Sci.Technol. Econ. 2014, 24, 45–46. (In Chinese)
49. Peng, T.B. Water balance test and energy saving and emission reduction in dabieshan thermal power plant.Cent. China Electr. Power 2009, 22, 46–49. (In Chinese)
50. China Electricity Council (CEC). Notification of energy efficiency benchmarking and competition data of2012 national 600 MW thermal power sets. Available online: http://kjfw.cec.org.cn/kejifuwu/2013-04-07/99877.html (accessed on 1 March 2017).
51. Yao, L.; Feng, L.K.; Yu, Z.Y.; Cao, Q.X. Water balance test and water saving analysis of a thermal power plant.Ind. Water Wastewater 2011, 42, 54–57. (In Chinese)
52. Chen, Q.W.; Qi, Q.B.; Jiang, Q.; Zhan, D. Nuclear power development and water resources management.J. Hohai Univ. 2010, 38, 25–28. (In Chinese)
53. Guo, Y.; Cao, Y.Q.; Xian, T.; Zhang, C.R. Brief analysis on water consumption index of inland nuclear powerstation. Water Resour. Hydropower Eng. 2012, 43, 119–122. (In Chinese)
54. Zhao, H.X.; Zhong, J.; Liu, Z.G. Water resources argumentation of a biomass power generation project inHeilongjiang Province. J. Eng. Heilongjiang Univ. 2014, 5, 14–17. (In Chinese)
55. Peng, B. Analysis the water-used of biomass power generation project. Zhihuai 2014, 3, 42–43. (In Chinese)56. Sun, Z.Y. Estimation of the three gorges reservoir water loss. China Three Gorges 2012, 20, 68–69. (In Chinese)57. Tian, J.H.; Cui, Q.; Xu, J.H.; Zhou, X. Surface-evaporation of large and middle reservoirs affects the cunount
of water resource in the Yellow River valley. J. Shandong Agric. Univ. 2005, 36, 391–394. (In Chinese)58. Yang, H.X. Calculation of Evaporation and Seepage Loss in Fenhe Reservoir. Shanxi Hydrotech. 2005, 158,
34–36. (In Chinese)59. Zhao, D.D.; Liu, J.G.; Zhao, X. A new approach to assess the water footprint of hydropower: A case study of
the Miyun reservoir in China. Acta Ecol. Sin. 2014, 34, 2787–2795. [CrossRef]60. Wu, Z.Y.; Hou, A.; Chang, C.; Huang, X.; Shi, D.; Wang, Z.F. Environmental impacts of large-scale CSP plants
in North-western China. Environ. Sci. Process. Impacts 2014, 16, 2432–2441. [CrossRef] [PubMed]61. Liao, S.; Wang, X.Y.; Zhu, L.; Yang, W.H. Research of water consumption in concentrated solar power system.
Ningxia Electr. Power 2013, 1, 35–40. (In Chinese)62. Qiu, Z.S.; Lei, X.Y.; Zhang, B.J. The water supplement and wastewater treatment system design of one
parabolic trough concentrated solar power plant. Water Wastewater Eng. 2014, 40, 264–266. (In Chinese)63. Li, X.; Kuishuang, F.; Yim, L.S.; Klaus, H. Energy-water nexus of wind power in China: The balancing act
between CO2 emissions and water consumption. Energy Policy 2012, 45, 440–448. [CrossRef]64. Mielke, E.; Anadon, L.D.; Narayanamurti, V. Water Consumption of Energy Resource Extraction, Processing,
and Conversion; A Review of the Literature for Estimates of Water Intensity of Energy-resource Extraction,Processing to fuels and Conversion to Electricity; Energy Technology Innovation Policy Discussion Paper No.2010-15; Belfer Center for Science and International Affairs, Harvard Kennedy School, Harvard University:Cambridge, MA, USA, 2010; pp. 29–38.
65. National Standard of the People’s Republic of China. Norm of Water Intake Part 1: Electric Power Production;M. E. Sharpe: Beijing, China, 2002; pp. 1–2.
66. World Nuclear Performance Report 2016. Available online: http://www.world-nuclear.org/our-association/publications/online-reports/world-nuclear-performance-report-2016.aspx (accessed on 7 September 2017).
67. Gerbens-Leenes, P.W.; Lienden, A.R.V.; Hoekstra, A.Y.; van der Meer, T.H. Biofuel scenarios in a waterperspective: The global blue and green water footprint of road transport in 2030. Glob. Environ. Chang. 2012,22, 764–775. [CrossRef]
68. Ding, N.; Yang, Y.; Cai, H.; Liu, J.; Ren, L.; Yang, J.; Xie, G.H. Life cycle assessment of fuel ethanol producedfrom soluble sugar in sweet sorghum stalks in North China. J. Clean. Prod. 2017, 161, 335–344. [CrossRef]
69. Hao, M.; Jiang, D.; Wang, J.; Fu, J.; Huang, Y. Could biofuel development stress China’s water resources?GCB Bioenergy 2017, 9, 1447–1460. [CrossRef]
70. Yao, Y.; Chang, Y.; Huang, R.; Zhang, L.; Masanet, E. Environmental implications of the methanol economyin China: Well-to-wheel comparison of energy and environmental emissions for different methanol fuelproduction pathways. J. Clean. Prod. 2018, 172, 1381–1390. [CrossRef]
71. Hu, Y.; Cheng, H. Development and bottlenecks of renewable electricity generation in China: A criticalreview. Environ. Sci. Technol. 2013, 47, 3044–3056. [CrossRef] [PubMed]
Sustainability 2018, 10, 1181 15 of 15
72. Guo, M.; Song, W.; Buhain, J. Bioenergy and biofuels: History, status, and perspective. Renew. Sustain.Energy Rev. 2015, 42, 712–725. [CrossRef]
73. Zhang, D.; Wang, J.; Lin, Y.; Si, Y.; Huang, C.; Yang, J.; Huang, B.; Li, W. Present situation and future prospectof renewable energy in China. Renew. Sustain. Energy Rev. 2017, 76, 865–871. [CrossRef]
74. Qin, Z.; Zhuang, Q.; Cai, X.; He, Y.; Huang, Y.; Jiang, D.; Lin, E.; Liu, Y.; Tang, Y.; Wang, M.Q. Biomassand biofuels in China: Toward bioenergy resource potentials and their impacts on the environment.Renew. Sustain. Energy Rev. 2018, 82, 2387–2400. [CrossRef]
75. Ye, B.; Yang, P.; Jiang, J.; Miao, L.; Shen, B.; Li, J. Feasibility and economic analysis of a renewable energypowered special town in China. Resour. Conserv. Recycl. 2017, 121, 40–50. [CrossRef]
76. Yun, Z. Why is China going nuclear? Energy Policy 2010, 38, 3755–3762. [CrossRef]77. Shen, L.; Liu, L.; Yao, Z.; Liu, G.; Lucas, M. Development potentials and policy options of biomass in China.
Environ. Manag. 2010, 46, 539–554. [CrossRef] [PubMed]78. Liu, X.; Tang, Q.; Voisin, N.; Cui, H. Projected impacts of climate change on hydropower potential in China.
Hydrol. Earth Syst. Sci. 2016, 20, 3343–3359. [CrossRef]79. Zhang, X.; Li, H.-Y.; Deng, Z.D.; Ringler, C.; Gao, Y.; Hejazi, M.I.; Leung, L.R. Impacts of climate change,
policy and Water-Energy-Food nexus on hydropower development. Renew. Energy 2018, 116, 827–834.[CrossRef]
80. Liu, J.; Zuo, J.; Sun, Z.; Zillante, G.; Chen, X. Sustainability in hydropower development—A case study.Renew. Sustain. Energy Rev. 2013, 19, 230–237. [CrossRef]
81. Wang, G.; Fang, Q.; Zhang, L.; Chen, W.; Chen, Z.; Hong, H. Valuing the effects of hydropower developmenton watershed ecosystem services: Case studies in the Jiulong River Watershed, Fujian Province, China.Estuar. Coast. Shelf Sci. 2010, 86, 363–368. [CrossRef]
© 2018 by the authors. Licensee MDPI, Basel, Switzerland. This article is an open accessarticle distributed under the terms and conditions of the Creative Commons Attribution(CC BY) license (http://creativecommons.org/licenses/by/4.0/).