AMC 20-27A Airworthiness Approval and Operational Criteria ...
Upload
khangminh22Category
view
0download
0
OPERATIONAL PLAN 2019-20
RESEARCH DEVELOPMENT AND SUPPORT
A scientometric assessment of Statistics in South Africa
Johann Mouton, Isabel Basson, Jaco Blanckenberg, Nelius Boshoff, Kyle Ford, Marina Joubert, Lynn Lorenzen, Herman Redelinghuys, Milandré van Lill and Marthie van Niekerk
Final report
31 March 2019
i
Contents
Preface .................................................................................................................................................... xii
Terms of reference ............................................................................................................................. xii
Work programmes ............................................................................................................................ xiii
Work programme 1: A comprehensive bibliometric analysis of South African research in the BS
....................................................................................................................................................... xiii
Work programme 2: A desktop analysis of the postgraduate course offering in the BS in South
Africa ............................................................................................................................................. xiii
Work programme 3: An analysis of NRF support for the BS in South Africa ................................ xiii
Work programme 4: An analysis of human resources for the BS in South Africa ......................... xiv
Work programme 5: An analysis of ‘field vulnerability’ based on the field-specific profiles
generated in work programmes 1 to 4 ......................................................................................... xiv
Report outline ................................................................................................................................... xiv
Acknowledgements ............................................................................................................................ xv
Introduction ........................................................................................................................................... xvi
Executive summary ................................................................................................................................. 1
NRF investment in research ................................................................................................................ 1
Staff quality, capacity and diversity .................................................................................................... 3
Academic pipeline: enrolments ........................................................................................................... 5
Academic pipeline: graduates ............................................................................................................. 7
Academic pipeline: efficiency .............................................................................................................. 8
Academic pipeline: conversion rates ................................................................................................ 10
Conversion rates of honours to master’s students ....................................................................... 10
Conversion rates of master’s to doctoral students ....................................................................... 11
Research production ......................................................................................................................... 12
Research collaboration ...................................................................................................................... 13
Research quality ................................................................................................................................ 14
Citation impact .................................................................................................................................. 15
Research transformation ................................................................................................................... 17
Concluding assessment: a field vulnerability index (FVI) .................................................................. 18
NRF investment in Statistics research ........................................................................................... 18
Staff capacity and diversity ........................................................................................................... 19
The academic pipeline ................................................................................................................... 20
Research ........................................................................................................................................ 21
Section 1: Main findings ........................................................................................................................ 24

ii
1.1 Introduction ........................................................................................................................... 24
1.2 The main assessment dimensions and their indicators ........................................................ 24
1.2.1 Investment in Statistics research .................................................................................. 24
1.2.2 Staff capacity and diversity ........................................................................................... 25
1.2.3 The academic pipeline ................................................................................................... 26
1.2.4 Research ........................................................................................................................ 27
1.3 Investment in Statistics research .......................................................................................... 29
1.3.1 Grant holders ................................................................................................................. 29
1.3.2 Grant values................................................................................................................... 30
1.4 Staff capacity and diversity ................................................................................................... 32
1.4.1 Staff capacity ................................................................................................................. 32
1.4.2 Staff diversity ................................................................................................................. 33
1.5 The academic pipeline ........................................................................................................... 35
1.5.1 Trends in enrolments and graduations ......................................................................... 35
1.5.2 Demographics of enrolled doctoral students ................................................................ 36
1.5.3 Demographics of doctoral graduates ............................................................................ 37
1.6 Research ................................................................................................................................ 40
1.6.1 Research output and field strength ............................................................................... 40
1.6.2 Research collaboration .................................................................................................. 41
1.6.3 Research quality ............................................................................................................ 41
1.6.4 Citation impact .............................................................................................................. 42
1.6.5 Research transformation ............................................................................................... 43
Section 2: Tables and graphs ................................................................................................................. 45
2.1 Investment in research .......................................................................................................... 46
2.1.1 Comparison between Statistics and other BS fields ...................................................... 46
2.1.2 Trends in the number of grant holders in Statistics ...................................................... 49
2.1.3 Grant values in Statistics ............................................................................................... 52
2.2. Academic staff ....................................................................................................................... 55
2.2.1 Staff capacity ................................................................................................................. 55
2.2.2 Staff diversity ................................................................................................................. 56
2.3 The academic pipeline ........................................................................................................... 60
2.3.1 Honours ......................................................................................................................... 60
2.3.2 Masters .......................................................................................................................... 67
2.3.3 Doctoral students .......................................................................................................... 74
2.4 Bibliometric analyses ............................................................................................................. 83
iii
2.4.1 Article output, world share and rank ............................................................................ 83
2.4.2 Relative field strength ................................................................................................... 84
2.4.3 Visibility (citation impact) .............................................................................................. 85
2.4.4 Research collaboration .................................................................................................. 86
2.4.5 Collaboration and citation impact ................................................................................. 88
2.4.6 Quality of journals: papers in highly ranked CAWoS -journals ....................................... 88
2.4.7 Analysis by journal index (SAK) ..................................................................................... 90
2.4.8 The demographics of South African-authored articles in Statistics (SAK) ..................... 90
Appendix 1: List of academic courses offered in the BS ....................................................................... 93
1.1 List of academic courses ........................................................................................................ 93
1.2 Courses by BS field, course level and university ................................................................... 94
1.2.1 Honours programmes.................................................................................................... 94
1.2.2 Master’s programmes ................................................................................................... 95
1.2.3 Doctoral programmes ................................................................................................... 95
Appendix 2: Descriptive statistics for NRF grant values ........................................................................ 96
Appendix 3: Technical notes on the analysis of HEMIS (staff and student) data ................................ 100
3.1 Disciplines selected ............................................................................................................. 100
3.1.1 CESM codes ................................................................................................................. 100
3.2 Data cleaning ....................................................................................................................... 104
3.2.1 Students ....................................................................................................................... 104
3.2.2 Staff ............................................................................................................................. 104
3.3 Analysis ................................................................................................................................ 105
3.3.1 Student analysis ........................................................................................................... 105
3.3.2 Staff analysis ................................................................................................................ 109
3.3.3 Race ............................................................................................................................. 110
3.3.4 Compound Annual Growth Rate (CAGR) ..................................................................... 110
Appendix 4: Technical notes on bibliometric analyses ....................................................................... 111
4.1 Bibliometric indicators ........................................................................................................ 111
4.1.1 Percentage world share............................................................................................... 111
4.1.2 Mean normalised citation score (MNCS) .................................................................... 111
4.1.3 Relative field strength ................................................................................................. 112
4.1.4 Journal impact factor ................................................................................................... 112

iv
List of tables
Table 1 Field vulnerability index of NRF investment in Statistics research ........................................................... 18
Table 2 Field vulnerability index of staff capacity and diversity in Statistics ........................................................ 19
Table 3 Field vulnerability index of the academic pipeline in Statistics ................................................................ 20
Table 4 Field vulnerability index of research in Statistics ..................................................................................... 22
Table 5 Number of unique grant holders by BS field (2000 to 2015) ................................................................... 29
Table 6 Indicators for investment in Statistics research: Grant holders (2002 to 2015) ...................................... 30
Table 7 Total amount of NRF grants by BS field (2002 to 2015) (R’000’s) ............................................................ 30
Table 8 Average amount per individual grant holders for BS field: comparing 2002 and 2015 ........................... 30
Table 9 Indicators for investment in Statistics research: grant values (R’000s) comparing 2002 and 2015......... 31
Table 10 Indicators of staff capacity (2000 and 2015) .......................................................................................... 32
Table 11 Indicators of staff diversity (2000 and 2015) .......................................................................................... 33
Table 12 Staff capacity and diversity comparison across all basic science fields (2015) ...................................... 34
Table 13 Indicators of the academic pipeline (2000 and 2015) ............................................................................ 35
Table 14 Indicators of the academic pipeline: demographics of enrolled students (2000 and 2015) .................. 36
Table 15 Indicators of the academic pipeline: demographics of graduates (2000 and 2015) .............................. 37
Table 16 Academic pipeline indicators across all BS fields (2015) ........................................................................ 39
Table 17 Indicators of research output, world share and field strength (2005 to 2016) ...................................... 41
Table 18 Indicators of research collaboration (2005 and 2016) ........................................................................... 41
Table 19 Indicators of research quality (2005 and 2016) ...................................................................................... 42
Table 20 Indicators of citation impact (2005 and 2014) ....................................................................................... 42
Table 21 Indicators of research transformation (2005 and 2016) ........................................................................ 43
Table 22 Research indicators: comparison across all BS fields (2014/2016) ........................................................ 44
Table 23 Number of grant holders by year by BS field (2002 to 2015) ................................................................. 46
Table 24 Amounts granted by BS field (2002 to 2015) ......................................................................................... 47
Table 25 Average amount granted by BS field by year (2002 to 2015) ................................................................ 47
Table 26 Grants by BS field and gender (2002 to 2015)........................................................................................ 48
Table 27 Grants by BS field and race (2002 to 2015) ............................................................................................ 48
Table 28 Number of grant holders in Statistics (2002 to 2015) ............................................................................ 49
Table 29 Number of grant holders by funding category in Statistics (2002 to 2015) ........................................... 49
Table 30 Number of grants and grant value in Statistics by year (2002 to 2015) ................................................. 52
Table 31 Number of grants and grant values in Statistics by institution (2002 to 2015) ...................................... 52
Table 32 Demographic profile of permanent instructional staff FTE in Statistics by year (2000 to 2015) ........... 56
Table 33 Number of permanent instructional staff with FTE in Statistics by nationality and year (2000 to 2015)
...................................................................................................................................................................... 56
Table 34 Number of permanent instructional staff in Statistics, by demographic subgroup and selected years 57
Table 35 Number of permanent, instructional staff with FTE in Statistics by highest qualification and year (2000
to 2015) ........................................................................................................................................................ 58
Table 36 Supervisory capacity of doctoral students in Statistics by year (2000 to 2015) ..................................... 58
Table 37 Number of permanent instructional staff in Statistics by university and year (2000 to 2015) .............. 59
Table 38 Honours enrolments in Statistics by university and year (2000 to 2015) .............................................. 62
Table 39 Honours graduates in Statistics by university by year (2000 to 2015) ................................................... 65
Table 40 Completion rates of honours students in Statistics by year (2000 to 2014) .......................................... 66
Table 41 Master’s enrolments in Statistics by university by year (2000 to 2015) ................................................ 69
Table 42 Conversion rates from honours to masters of Statistics students for selected years ............................ 70
Table 43 Master’s graduates in Statistics by university and year (2000 to 2015) ................................................. 72
Table 44 Master’s completion rates in Statistics by year (2000 to 2014) ............................................................. 73
Table 45 Doctoral enrolments in Statistics by university and year (2000 to 2015) .............................................. 77
Table 46 Conversion rates from master’s to doctoral studies of Statistics students for selected years .............. 78
Table 47 Doctoral graduates in Statistics by university and year (2000 to 2015) ................................................. 80

v
Table 48 Completion rates of doctoral students in Statistics by year (2000 to 2012) .......................................... 81
Table 49 Descriptive statistics for NRF grant values by BS fields, 2002 versus 2015 (real values, with 2015 as
base) ............................................................................................................................................................. 96
Table 50 Descriptive statistics for NRF grant values by BS fields, 2002 versus 2015 (nominal values) ................ 97
Table 51 Descriptive statistics for NRF grant values by BS fields, 2002 versus 2015 (real values, with 2015 as
base, and grants <R1000 removed).............................................................................................................. 98
Table 52 Descriptive statistics for NRF grant values by BS fields, 2002 versus 2015 (nominal values, and grants
<R1000 [adjusted values] removed)............................................................................................................. 99
Table 53 JIF and number of South African publications in Statistics in 2016 ...................................................... 112
List of figures
Figure 1 Average value of individual grants in BS fields compared (2002 and 2015) ............................................. 1
Figure 2 Change in growth and demographics of grant holders in BS fields compared (2002 to 2015) ................. 2
Figure 3 Change in growth and profile of instructional staff in BS fields compared (2000 to 2015) ...................... 3
Figure 4 Staff capacity and supervisory capacity in BS fields compared (2015) ..................................................... 4
Figure 5 Change in growth and demographic profile of doctoral enrolments in BS fields compared (2000 to
2015) .............................................................................................................................................................. 6
Figure 6 Change in growth and demographic profile of doctoral graduates in BS fields compared (2000 to 2015)
........................................................................................................................................................................ 7
Figure 7 Doctoral pipeline in BS fields compared (2000 and 2015) ........................................................................ 9
Figure 8 Age at graduation and time-to-degree of doctoral graduates in BS fields compared (2015) ................. 10
Figure 9 Conversion rates of honours to master’s students in BS fields compared (2000 to 2015) ..................... 11
Figure 10 Conversion rates of masters to doctoral studies in BS fields compared (2000 to 2015) ...................... 12
Figure 11 Change in world share of research publication output in BS fields compared (2005 and 2016) .......... 13
Figure 12 Change in world rank position of publication output in BS fields compared (2005 to 2016) ............... 13
Figure 13 Change in proportion (%) of international collaboration from 2005 to 2016 in BS fields compared ... 14
Figure 14 Proportion of articles in quartiles (Q1, Q2, Q3 and Q4) in 2016 ........................................................... 14
Figure 15 Change in MNCS in BS fields compared (2005 and 2014) ..................................................................... 15
Figure 16 Proportion of papers cited in the top 1%, 5% and 10% of highly cited papers in BS fields compared
(2005 and 2014) ........................................................................................................................................... 16
Figure 17 Demographics of authors in 2016 in the BS fields compared ............................................................... 17
Figure 18 Proportion of female grant holders in Statistics by year (2002 to 2015) .............................................. 50
Figure 19 Proportion of black grant holders in Statistics by year (2002 to 2015) ................................................. 50
Figure 20 Number of grant holders in Statistics (2002 to 2015) by race and gender ........................................... 51
Figure 21 Comparison between the number of grants allocated in 2002 and 2015, by race and gender............ 51
Figure 22 Proportion of young grant holders in statistics (under 40 years) by year (2002 to 2015) .................... 51
Figure 23 Total grant value in Statistics by gender (2002 to 2015) ....................................................................... 53
Figure 24 Total grant value in Statistics (2002 to 2015) by gender and year ........................................................ 53
Figure 25 Total grant value in Statistics (2002 to 2015) by race ........................................................................... 53
Figure 26 Total grant value in Statistics by race and year (2002 to 2015) ............................................................ 54
Figure 27 Total grant value in Statistics by age category (2002 to 2015) ............................................................. 54
Figure 28 Total grant value in Statistics by age category and year (2002 to 2015) .............................................. 54
Figure 29 Total headcount of permanent instructional staff FTE in Statistics compared to permanent
instructional staff with a minimum of 20% FTE in Statistics (2000 to 2015) ................................................ 55
Figure 30 Total and valid sum FTE of permanent, instructional staff in Statistics (2000 to 2015) ........................ 55
Figure 31 Permanent instructional staff in Statistics compared by demographic subgroups and selected years 57
Figure 32 Total enrolments, new enrolments and graduates of honours students in Statistics by year (2000 to
2015) ............................................................................................................................................................ 60
Figure 33 Honours enrolments in Statistics disaggregated by gender and year (2000 to 2015) .......................... 60
Figure 34 Number of South African black honours enrolments in Statistics by year (2000 to 2015) ................... 61

vi
Figure 35 Honours enrolments in Statistics by race and year (2000 to 2015) ...................................................... 61
Figure 36 Average age at honours enrolment in years (2000 to 2015) ................................................................ 61
Figure 37 Honours enrolments in Statistics by nationality and year (2000 to 2015) ............................................ 61
Figure 38 Honours graduates in Statistics by gender and year (2000 to 2015) .................................................... 63
Figure 39 Honours graduates in Statistics by race and year (2000 to 2015) ........................................................ 63
Figure 40 Number of South African black honours graduates in Statistics by year (2000 to 2015) ..................... 63
Figure 41 Honours graduates in Statistics by nationality and year (2000 to 2015) .............................................. 64
Figure 42 Average age at graduation of honours graduates in Statistics by year (2000 to 2015) ........................ 64
Figure 43 Mean time-to-degree of honours graduates in Statistics by year (2000 to 2015) ................................ 66
Figure 44 Total enrolments, new enrolments and graduates of master’s students in Statistics by year (2000 to
2015) ............................................................................................................................................................ 67
Figure 45 Master’s enrolments in Statistics disaggregated by gender and year (2000 to 2015) .......................... 67
Figure 46 Number of all South African black master’s enrolments in Statistics by year (2000 to 2015) .............. 67
Figure 47 Master’s enrolments disaggregated by race by year (2000 to 2015) ................................................... 68
Figure 48 Average age at commencement of master’s enrolments in Statistics by year (2000 to 2015) ............ 68
Figure 49 Master’s enrolments in Statistics disaggregated by nationality by year (2000 to 2015) ...................... 68
Figure 50 Master’s graduates in Statistics by gender and year (2000 to 2015) .................................................... 70
Figure 51 Number of South African black masters graduates in Statistics by year (2000 to 2015) ...................... 70
Figure 52 Master’s graduates in Statistics by race and year (2000 to 2015) ........................................................ 70
Figure 53 Master’s graduates in Statistics by nationality and year (2000 to 2015) .............................................. 71
Figure 54 Average age at graduation of master’s graduates in Statistics by year (2000 to 2015) ........................ 71
Figure 55 Mean time-to-degree of master’s graduates in Statistics by year (2000 to 2015) ............................... 74
Figure 56 Total enrolments, new enrolments and graduates of doctoral students in Statistics by year (2000 to
2015) ............................................................................................................................................................ 74
Figure 57 Doctoral enrolments disaggregated by gender and year (2000 to 2015) ............................................. 75
Figure 58 Doctoral enrolments disaggregated by race and year (2000 to 2015) ................................................. 75
Figure 59 Number of all South African black doctoral enrolments in Statistics by year (2000 to 2015) .............. 75
Figure 60 Doctoral enrolments in Statistics disaggregated by nationality and year (2000 to 2015) .................... 76
Figure 61 Average age at commencement of doctoral enrolments in Statistics by year (2000 to 2015) ............. 76
Figure 62 Distribution of doctoral enrolments in Statistics’ age at commencement for 2015 ............................. 76
Figure 63 Doctoral graduates in Statistics by gender and year (2000 to 2015) .................................................... 78
Figure 64 Number of all South African black doctoral graduates in Statistics by year (2000 to 2015) ................. 78
Figure 65 Doctoral graduates in Statistics by race and year (2000 to 2015) ........................................................ 78
Figure 66 Doctoral graduates in Statistics by nationality and year (2000 to 2015) .............................................. 79
Figure 67 Average age at graduation of doctoral graduates in Statistics by year (2000 to 2015) ........................ 79
Figure 68 Distribution of doctoral graduates in Statistics’ age at graduation for 2015 ........................................ 79
Figure 69 Mean time-to-degree in years of doctoral graduates in Statistics by year (2000 to 2015) .................. 82
Figure 70 Distribution of time-to-degree of doctoral graduates in Statistics for 2015 ......................................... 82
Figure 71 South African output in Statistics (CAWoS) (2005 to 2016) ................................................................... 83
Figure 72 The rank of South Africa among countries in terms of total output in Statistics (CAWoS), by year (2005
to 2016) ........................................................................................................................................................ 84
Figure 73 South African relative field strength in Statistics from 2005 to 2015 (CAWoS) ..................................... 84
Figure 74 MNCS of South African publications in Statistics by year (2005 to 2014) ............................................. 85
Figure 75 Percentage of South African publications in Statistics in the top citation percentile intervals, by year
(2005 to 2014) .............................................................................................................................................. 86
Figure 76 Author collaboration in Statistics by year (2005 to 2016)..................................................................... 87
Figure 77 Trends in research collaboration in Statistics by year (2005 to 2016) .................................................. 87
Figure 78 Map of countries with which South African authors collaborated in Statistics from 2013 to 2015 ..... 87
Figure 79 Collaboration type and citation impact in Statistics from 2005 to 2014 .............................................. 88
Figure 80 Proportion of South African-authored papers in Statistics (CAWoS), by journal rank and year (2005 to
2016) ............................................................................................................................................................ 89
vii
Figure 81 Journal Impact Factor values by journal quartile for 2016 ................................................................... 89
Figure 82 Analysis of papers in Statistics by journal index (2005 to 2016) ........................................................... 90
Figure 83 Analysis of papers in Statistics by gender of author (2005 to 2016) ..................................................... 90
Figure 84 Analysis of papers in Statistics by gender of author and year of publication (2005 to 2016) ............... 91
Figure 85 Analysis of papers in Statistics by race of author (2005 to 2016) ......................................................... 91
Figure 86 Analysis of papers in Statistics by race of author and year of publication (2005 to 2016) ................... 92
Figure 87 Analysis of publications in Statistics by age of author (2005 to 2016) .................................................. 92
Figure 88 Analysis of papers in Statistics by age of author and year of publication (2005 to 2016) .................... 92
Figure 89 Distribution of doctoral time-to-degree of the BS fields for 2015 ...................................................... 107
Figure 90 Distribution of doctoral time-to-degree in all fields for 2015 ............................................................. 107
Figure 91 Distribution of doctoral students’ age at commencement across the seven BS fields for 2015 ........ 108
Figure 92 Distribution of doctoral students’ age at commencement across all fields for 2015 ......................... 108
Figure 93 Distribution of doctoral graduates’ age at graduation across the seven BS fields for 2015 ............... 109
Figure 94 Distribution of doctoral graduates’ age at graduation across all fields for 2015 ................................ 109

viii
List of abbreviations
AEB Atomic Energy Board
AEC Atomic Energy Corporation
AECI African Explosives and Chemical Industries
Agric Agricultural Science
AIC African, Indian/Asian, Coloured
AIMS African Institute for Mathematical Sciences
AIP American Institute of Physics
AOS Applied Ocean Sciences
ARC Agriculture Research Council
Armscor Armaments Corporation of South Africa
BA Bachelor of Arts
BAgric Bachelor of Agriculture
BBusSc Bachelor of Business Science
BComm Bachelor of Commerce
BRICs Biotechnology Regional Innovation Centres
BS Basic Sciences
BSc Bachelor of Science
CAGR compound average growth rate
CAWoS Clarivate Analytics Web of Science
CERN European Organization for Nuclear Research
CESM Classification of Educational Subject Matter
CMACS Centre for Mathematical and Computational Sciences
CoE Centres of Excellence
CPUT Cape Peninsula University of Technology
CREST Centre for Research on Evaluation, Science and Technology
CUT Central University of Technology
DPhil Doctor in Philosophy
DTech Doctor of Technology
DAFF Department of Agriculture, Forestry and Fisheries
DEA Department of Environmental Affairs
DHET Department of Higher Education and Training
DSc Doctor of Science
DST Department of Science and Technology
DUT Durban University of Technology
FTE full-time equivalent
ix
FVI field vulnerability index
GIS Geographic Information System
GSSA Geological Society of South Africa
HartRAO Hartebeesthoek Radio Astronomy Observatory
HEI Higher Education Institution
HEMIS Higher Education Management Information System
HEQF Higher Education Qualification Framework
HEQSF Higher Education Qualification Sub-Framework
Hons Honours degree
IBM International Business Machines
ICP Institutional Capacity Programme
ICT information and communications technology
IEPD Institutional Engagement and Partnership Development
IPUF Indigenous Plant Use Forum
IT Information Technology
iThemba LABS iThemba Laboratory for Accelerator-Based Sciences
IUPAP International Union of Pure and Applied Physics
JIF Journal Impact Factor
MA Master of Arts
MAgricMan Master of Agricultural Management
MAppSci Master of Applied Science
MComm Master of Commerce
MINTEK Council for Mineral Technology
MNCS mean normalised citation score
MPhil Master of Philosophy
MRC Medical Research Council
MSc Master of Science
MTech Magister of Technology
MUT Mangosuthu University of Technology
NASSP National Astrophysics and Space Science Programme
NCS normalised citation score
NECSA Nuclear Energy Corporation of South Africa
NICD National Institute for Communicable Diseases
NITheP National Institute for Theoretical Physics
NMISA National Metrology Institute of South Africa
NMU Nelson Mandela University
NPRL National Physical Research Laboratory
x
nPubs number of publications
NRF National Research Foundation
NWU North West University
PG Postgraduate
PhD Doctor of Philosophy
R&D research and development
REDIBA Research Development Initiative for Black Academics
RFS relative field strength
ROA rest of Africa
ROW rest of the world
RSA Republic of South Africa
RU Rhodes University
S&F Scholarships & Fellowships Programme
SA South African
SAAMBR South African Association for Marine Biological Research
SAAO South African Astronomical Observatory
SACI South African Chemical Institute
SACJ South African Computer Journal
SAEON Southern African Environmental Observation Network
SAIAB South African Institute for Aquatic Biodiversity
SAICSIT South African Institute of Computer Scientists and Information Technologists
SAIP South African Institute of Physics
SAJP South African Journal of Physics
SAK SA Knowledgebase
SALT Southern African Large Telescope
SANBI South African National Biodiversity Institute
SANCOR South African Network for Coastal and Oceanic Research
SANPARKS South African National Parks Board
SANSA South African National Space Agency
SAPPI South African Pulp and Paper Industries
SARChI South African Research Chairs Initiative
SASA South African Statistical Association
SASOL South African Synthetic Oil Limited
SASRI South African Sugarcane Research Institute
SEAChange Society, Ecosystems and Change
SKA Square Kilometre Array
SMHSU Sefako Makgatho Health Sciences University

xi
Stats SA Statistics South Africa
SU Stellenbosch University
THRIP Technology and Human Resources for Industry Programme
TIA Technology Innovation Agency
TOR terms of reference
TTD time-to-degree
TUT Tshwane University of Technology
UCT University of Cape Town
UFH University of Fort Hare
UFS University of the Free State
UJ University of Johannesburg
UKZN University of KwaZulu-Natal
UL University of Limpopo
UNESCO United Nations Educational, Scientific and Cultural Organisation
UNISA University of South Africa
UNIVEN University of Venda
UNIZULU University of Zululand
UP University of Pretoria
USA United States of America
UWC University of the Western Cape
VUT Vaal University of Technology
WITS University of the Witwatersrand
WRC Water Research Commission
WSU Walter Sisulu University
ZSSA Zoological Society of Southern Africa

xii
Preface
Terms of reference
This study was commissioned by the Department of Science and Technology (DST). The terms of
reference (TOR) formulated the following aims of the study:
Institutionalised support to the basic sciences [BS] to ensure their sustainable development is a
necessary prerequisite for development of technology and innovation, and thereby constitutes
a key input into the transition to a knowledge-based economy. Such support takes the form of
human capital and research capacity development, as well as provision of relevant research
infrastructure. However, to motivate for the institutionalised support for the BS, it is necessary
to conduct a scientometric analysis of South African research in the BS, to (i) identify the
vulnerable disciplines (due to lack of sustainable support and capacity); and (ii) well performing
and resourced disciplines (due to sustainable support and capacity). This analysis will assist in
deploying the limited funding in a strategic manner, based on the data obtained building a
sustainability (not just funding) model. For example, using a ‘grading model – more funds to
the vulnerable disciplines to improve their standing and enough funds to the well performing
areas in order to maintain their level of performing’ to cater for both types of disciplines.
The TOR proposed that the scientometric analysis would focus on the progress made in, and
achievements of South African research in the basic sciences over the last ten years: the
performance of the individual universities and research performing institutions, as well as the
country as a whole, as a function of available capacity and levels of support given to these
institutions and disciplines. This would enable the DST and the National Research Foundation (NRF)
to make future projections in terms of support and interventions, and provide a tool for comparing
and monitoring the support to the emerging or multidisciplinary areas such as nanotechnology and
biotechnology, as opposed to the BS.
After consultation with members of the Basic Sciences Reference group, the following seven BS fields
were included in the study:
1. Biological Sciences;
2. Chemistry;
3. Computer Science;
4. Geological Sciences;
5. Mathematics;
6. Physics; and
7. Statistics.
xiii
Work programmes
The study was conceptualised into five work programmes.
Work programme 1: A comprehensive bibliometric analysis of South African research in the BS
In terms of the analytical output to be produced from the BS publication database, the following
analyses were conducted for each BS field:
the rank of South Africa in the world in the field (2005 to 2016);
total publication output (articles and reviews) per year (2005 to 2016);
share of field of world output in the field (2005 to 2016);
the relative field strength of the field;
the collaboration profile of the field (four categories) (2005 to 2016);
normalised citation impact score of the field (2005 to 2014);
proportion of the of the papers of the field in the top 1%, top 5% and top 10% of highly cited
papers in that field (2005 to 2014); and
positional analysis of the field over two citation windows.
Work programme 2: A desktop analysis of the postgraduate course offering in the BS in South Africa
The websites of the public South African universities were scanned in order to identify the current
postgraduate academic offerings in the selected BS fields at honours, master’s and doctoral levels.
Once this was done, we sent out nearly 800 emails to the programme co-ordinators of the relevant
courses. The aim with the emails was threefold:
1. to verify the accuracy of the web-information;
2. to request information about current students for each programme; and
3. to request information about the staff names for each programme.
The information has been captured in a MS Access database. A summary of courses offered by field is
attached as Appendix 1 to this report.
Work programme 3: An analysis of NRF support for the BS in South Africa
The Centre for Research on Evaluation, Science and Technology (CREST) was granted access to grant
holder support data from the NRF, for the period 2001 to 2015. The following analyses were
conducted on this dataset:
number of grant holders per year and disaggregated by institution;
number of grant holders per year disaggregated by funding instrument;
demographic profile of grant-holders in terms of gender, race and age;
total funding amounts per year, broken down by organisation; and
demographic profile of funding amounts in terms of gender, race and age.

xiv
Work programme 4: An analysis of human resources for the BS in South Africa
An analysis of human resources for the BS in South Africa cannot be done without access to the
individual student and staff records of the Higher Education Management Information System
(HEMIS) at the Department of Higher Education and Training (DHET). CREST has been able to acquire
this data from the DHET. The following analyses were conducted:
average age of honours, master’s and doctoral students (for enrolments and graduates);
gender distribution of honours, master’s and doctoral students (for enrolments and
graduates);
race distribution of honours, master’s and doctoral students (for enrolments and graduates);
nationality distribution of honours, master’s and doctoral students (for enrolments and
graduates, disaggregated in terms of gender, age and race);
completion rate of selected year cohorts (honours, master’s and doctoral students);
disaggregation of honours, master’s and doctoral students (for enrolments and graduates) by
higher education institution (HEI);
average time-to-degree of honours, master’s and doctoral graduates;
number of headcount and full-time equivalent (FTE) academic staff over time and by
institution;
number of academic staff with doctoral degrees;
age, gender, race and nationality breakdown of FTE academic staff over time; and
ratio of doctoral students to academic staff with a doctoral qualification (supervisory
capacity at doctoral level).
Work programme 5: An analysis of ‘field vulnerability’ based on the field-specific profiles generated in work programmes 1 to 4
In our proposal, we indicated that we would compile a set of indicators on the basis of the findings of
work programmes 1 to 4. The indicators were selected in terms of their ability to discriminate
between ‘vulnerable’ and ‘strong’ fields or sub-fields in the BS. The individual indicators would also
be combined in a composite measure of vulnerability to guide the DST in its strategy for support and
intervention in the BS.
Report outline
This report commences with an introduction to the field and an executive summary that presents the
salient findings of our study. In the executive summary we not only present the main findings from
our analysis of the state of the field, but we also compare the main trends in the field with the other
BS fields and – in some cases – all scientific fields in the country. This is followed by section 1 where
we present in more detail our findings organised under four headings: NRF investment in research,
staff capacity and diversity, the academic pipeline, and research output and impact. In section 2, we
include the detailed tables and graphs that underpin section 1.
xv
Acknowledgements
CREST wishes to thank Drs Danny Adams and Sagren Moodley at the DST for their advice and support
throughout the study. We also want to thank the members of the Basic Sciences Reference Group for
their advice and comments at various meetings over the past two years. We would also like to thank
Prof Daniel Uys for his useful comments and suggestions for the report. Finally, we want to thank the
DHET and NRF for granting us access to the HEMIS and NRF-funding data and Ms Juanita du Toit for
the language editing of the report.

xvi
Introduction
“A mathematical number is a point. A statistical number is a point with a fringe around it”. This
comparison was made by the first president of the South African Statistical Association (SASA), Prof B
de Loor, in his address to the inaugural meeting of the executive committee of this new association,
which took place on 12 January 1954 (Steyn, 1979:5). He positioned Statistics as a new branch of
scientific methodology that would permeate all phases of research, industry and organisation (De
Loor, 1954).
Statistics deals with the collection, organisation, analysis, interpretation and presentation of data. It
cuts across all fields of scholarly enquiry, and feeds into every step of working with data, starting
with planning how the data will be collected, through to providing evidence to support policy
formulation. Today, the pivotal role of Statistics in socioeconomic development and the importance
of statisticians in the advancement of science is recognised and acknowledged (Thabane et al., 2008).
In today’s information-driven societies, it is a growing challenge to meet the ever-increasing need for
statistical experts who are able to collect, process and disseminate large volumes of data accurately
and speedily (Zewotir & North, 2011).
The early pioneers of Statistics in South Africa were mathematicians who developed an interest in
statistical theory and probability and who started promoting the theory of Statistics since the 1930s
(Steyn, 1979). At the time, Statistics at universities had a theoretical focus and produced statisticians
who were primarily suited for academic work, rather than applying their knowledge in industry
(Zewotir & North, 2011). From these humble beginnings, Statistics developed into a field of study
that supports research across a wide range of disciplines.
In South Africa, as in many other countries, academic and industrial interest in advances and
applications of statistical theory and technology expanded swiftly after World War II. It was,
however, a seminal coin-tossing experiment that happened during wartime that delivered a
breakthrough in the development of statistical theory. In 1941, the UK-born John Kerrick was
working as a mathematics lecturer at the University of the Witwatersrand in South Africa. While
visiting his family in Denmark, Kerrick became caught up in the war and was interned in Denmark.
With ample free time on his hands, he decided to spin a small coin ten thousand times and to record
the results. With this experiment, recorded in a book called An experimental introduction to the
theory of probability, Kerrick demonstrated the empirical validity of a number of fundamental laws of
probability. Kerrick was appointed as Foundation Professor of Statistics at the University of
Witwatersrand in 1957 (Steyn, 1979).
Since the early 1950s, applied research in mathematical Statistics started featuring at scientific
organisations such as the South African Bureau of Standards, the Chamber of Mines, Onderstepoort
Veterinary Research Institute, Iscor and the Department of Agriculture.

xvii
Networking and collaboration amongst statisticians in South Africa took a step forward with the
formation of the South African Statistical Association (SASA) on 28 October 1953 and its first national
conference which took place in 1958. The South African Statistical Journal, a publication of SASA, was
launched in January 1967 (Kerrich, 1967; Steyn, 1979; Zewotir & North, 2011).
Statistics South Africa (Stats SA) is the national Statistics agency of South Africa, governed by the
Statistics Act, Act No. 6 of 1999. Stats SA is responsible for collecting and managing all official
Statistics in the country in areas such as population, economy, employment, business, construction,
mining, agriculture, health, tourism, business and crime. The agency therefore plays a key role in
government planning, governance, monitoring and evaluation, and policymaking.
Several scholars have highlighted challenges around education and training of statisticians, and the
acute shortages of experts in this field, in Africa in general, but also in South Africa (Thabane et al.,
2008; Zewotir & North, 2011). They have called for comprehensive curriculum reform and a major
overhaul of training programmes at universities and in industry. This report highlights some of the
challenges facing Statistics in South Africa, and presents an overview of a field in dire need of
attention.
References
De Loor, B. 1954. Statistics and statisticians. South African Journal of Science, 51(1)49–53.
Kerrich, J.E. 1967. Modern advances in statistical theory, South African Statistical Association and
Technology growth. South African Statistical Journal, 1(1):1.
Steyn, H.S. 1979. When the South African Statistical Association was founded. South African
Statistical Journal, 13:3–6.
Thabane, L., Chinganya, O. and Ye, C. 2008. Training Young Statisticians for the Development of
Statistics in Africa. The South African Statistical Journal, 7:125–148.
Zewotir, T and North, D. 2011. Opportunities and challenges for Statistics education in South Africa.
Pythagoras, 32(2) Art. #28, 5 pages.

1
Executive summary
NRF investment in research
One of the first aims of this study was to produce an estimate of the NRF investment in Statistics
research. We are well aware that total expenditure in the field exceeds the investment by the NRF.
However, our brief required that we focus on NRF funding only so as to allow for rigorous
comparisons across the seven BS fields.
The total NRF investment in Statistics research between 2002 and 2015 was just over R36 million.
The average value of the individual grants for Statistics was the lowest of all BS fields and decreased
from R297,765 in 2002 to R 203,311 in 2015.
Figure 1 Average value of individual grants in BS fields compared (2002 and 2015)
Between 2005 and 2015, a total of 46 (unique) scientists in Statistics received grants from the NRF.
The number of individual grant holders increased steadily from 8 in 2002 to 31 in 2015. This
represents an average annual growth rate of 11%, which is the highest of all the BS fields. The
increase in the number of grant holders in Statistics over this period occurred at the same time as the
share of female grant holders increased from 0% in 2002 to 39% in 2015. A similar increase in the
number of black grant holders, from 13% in 2002 to 19% in 2015, was recorded. A more systematic
comparative assessment of NRF funding of Statistics research with the other BS fields is presented in
the graph below.

2
Figure 2 Change in growth and demographics of grant holders in BS fields compared (2002 to 2015)
The graph above compares the ‘performance’ of Statistics on four1 indicators with three
‘comparators’: all scientific fields, all seven BS fields and the individual BS fields. The salient findings
are:
The rate of increase in the number of grant holders in Statistics (11.0%) is similar to the
average across all sciences (11.5%), but higher than the average for the other BS (6.5%).
Compared to the other individual BS fields it recorded the highest rate of increase.
The rate of increase in the total grant values in Statistics (7.8%) is lower than the rate of
increase of all BS fields (9.5%) and lower than the average across all sciences (10.5%).
The rate of increase in the average grant values in Statistics shows a negative growth rate
(- 2.9%) and is the lowest of any BS field and is lower than the average decline across all
sciences (-0.8%) and significantly lower than the average across the seven BS fields (2.9%).
The rate of increase in the number of black2 grant holders in Statistics (14.8%) is the highest
amongst the BS fields and higher than the average across the seven BS fields (11.3%) but is
lower than the national average across all fields funded by the NRF (19.0%). The number of
black grant holders, however, is very small and therefore any changes reflects a higher
growth rate.
1 The rate of increase in the number of female grant holders in Statistics could not be calculated as there were no female grant holders in 2002. 2 Throughout the report, the term ‘black’ refers persons classified as Black African, Indian/Asian and coloured. See Appendix 3 (3.3.3) for notes on the use of race in the forthcoming analyses.

3
Staff quality, capacity and diversity
In this study, we used the proportion of staff with PhDs as a proxy for staff quality. The proportion of
staff with PhDs in Statistics increased somewhat from 34% in 2000 to 41% in 2015. This proportion is
lower than the average for all BS fields in 2015 (52%). The average number of doctoral students per
supervisor increased from 0.4 to 1.2 over this period but remains lower than the average for all BS
fields (1.8 in 2015). The number of instructional staff in Statistics increased from 151 in 2000 to 284
in 2015 (the staff complement in 2015 was 1.9 of that in 2000).
The research and instructional staff in the field of Statistics is becoming much more diverse. Between
2000 and 2015, the proportion of female staff in Statistics increased slightly from 37% to 39%. This
represents an average annual rate of increase of 4.7%. The positive change in the proportion of black
staff also stands out (from 11% in 2000 to 29% in 2015). This translates into a rate of increase of
11.6%, which is significantly higher than the 5.5% for all BS fields. The proportion of statisticians who
are South African nationals declined from 84% in 2000 to 74% in 2015. The proportion of staff
younger than 35 years old decreased slightly from 25% to 24% in 2015. The 2015 figures are slightly
higher than the average of 20% for all BS fields.
Figure 3 Change in growth and profile of instructional staff in BS fields compared (2000 to 2015)
The graph above compares the ‘performance’ of Statistics on six indicators with three ‘comparators’:
all scientific fields, all seven BS fields and the individual BS fields. The salient findings are:
The rate of increase in the number of permanent staff in Statistics (4.3%) is much higher than
the average for the other BS (1.6%) and higher than the low rate of increase across all
sciences fields in the country (1.3%).
4
The rate of increase in the number of staff with PhDs in Statistics (5.7%) is higher than the
average rate of increase across all BS fields (3.2%) and higher than the national average
across all sciences (3.3%).
The rate of increase in the number of female staff in Statistics (4.7%) is higher than the
average of all BS fields (2.8%) as well as the national average across all science fields (2.6%).
The rate of increase in the number of black staff in Statistics (11.6%) is much higher than the
average of all BS fields (5.5%) as well as the national average across all science fields (4.5%).
The rate of increase in the number of South African staff in Statistics (3.4%) is higher than the
rather low average increase in all BS fields (1.0%) as well as the national average (1.1%).
The low rate of increase in the number of staff younger than 35 years in Statistics (4.1%) is
much higher than the average for all BS fields (decline of 0.8%) and the average rate of
decline at the national level (-0.3%).
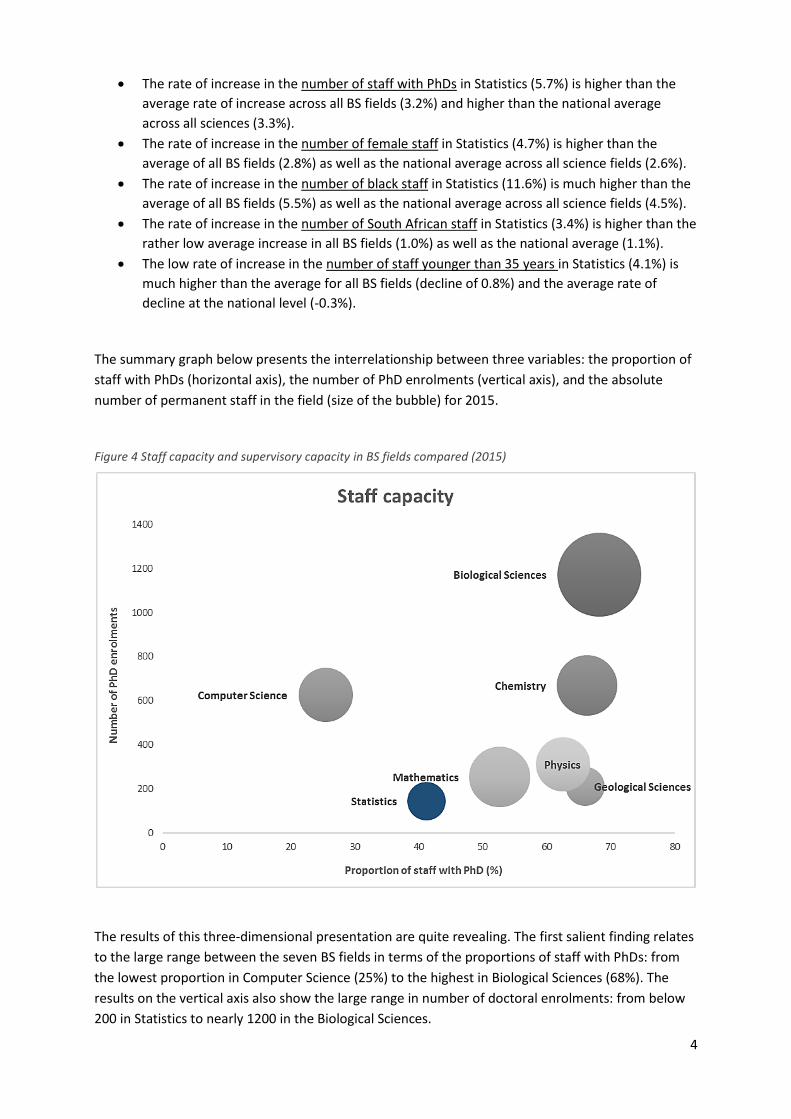
The summary graph below presents the interrelationship between three variables: the proportion of
staff with PhDs (horizontal axis), the number of PhD enrolments (vertical axis), and the absolute
number of permanent staff in the field (size of the bubble) for 2015.
Figure 4 Staff capacity and supervisory capacity in BS fields compared (2015)
The results of this three-dimensional presentation are quite revealing. The first salient finding relates
to the large range between the seven BS fields in terms of the proportions of staff with PhDs: from
the lowest proportion in Computer Science (25%) to the highest in Biological Sciences (68%). The
results on the vertical axis also show the large range in number of doctoral enrolments: from below
200 in Statistics to nearly 1200 in the Biological Sciences.
5
Academic pipeline: enrolments
Considering the strategic interest of the country in building the next generation of academics and
scientists in Statistics, this dimension focuses on the production of doctoral students in the field. The
indicators that were selected cover the sub-dimensions of quantity (numbers of enrolments and
graduates), efficiency (time-to-degree), as well as transformation (gender and race) and
internationalisation (nationality).
The number of total doctoral enrolments in Statistics increased from 21 in 2000 to 144 in 2015, and
the number of new enrolments increased from 1 in 2000 to 53 in 2015. These increases translate into
growth rates of CAGRs of 13.7% and 30.3% respectively, which are significantly higher than the
average growth rates for all BS fields.
As far as the demographics of doctoral enrolments are concerned, the results show that the number
of female enrolments increased from 6 (in 2000) to 48 (in 2015), which translates into a rate of
increase of 14.9%. This is much higher than the average growth rate across all BS fields (6.8%).
However, the overall proportion of female enrolments in 2015 (33%) remains well below the average
for all BS fields (41.6%).
The number of black doctoral enrolments increased from 2 in 2000 to 39 in 2015 and the average
annual rate of increase (21.9%) is significantly higher the same rate for all BS fields (8.0%). The
proportion of black doctoral students in 2015 (27%) is slightly lower than the average across all BS
fields (31%) for the same year.
The proportion of South African doctoral enrolments declined substantially from 71% in 2000 to 53%
in 2015. This trend has been observed for most BS fields, but the proportion of South African
students in 2015 (53%) is slightly lower than the average across all fields (58%). It is clear that South
Africa is increasingly reliant on foreign students, especially from the rest of Africa (ROA), to fuel the
academic pipeline in Statistics. The lower enrolments in Statistics by South African students is most
likely also related to the decline in the quality of science and mathematics teaching at school level.
The average age of Statistics students at enrolment increased from 32 years in 2002 to 36 years in
2015. This might be as a result of increasing numbers of part-time enrolments in Statistics. The mean
age at commencement of students in Statistics, at 36 years in 2015, was higher (and statistically
significantly3 so) than the 33 years of all BS fields.
3 The results of the statistical tests are reported in section 1.5.2.
6
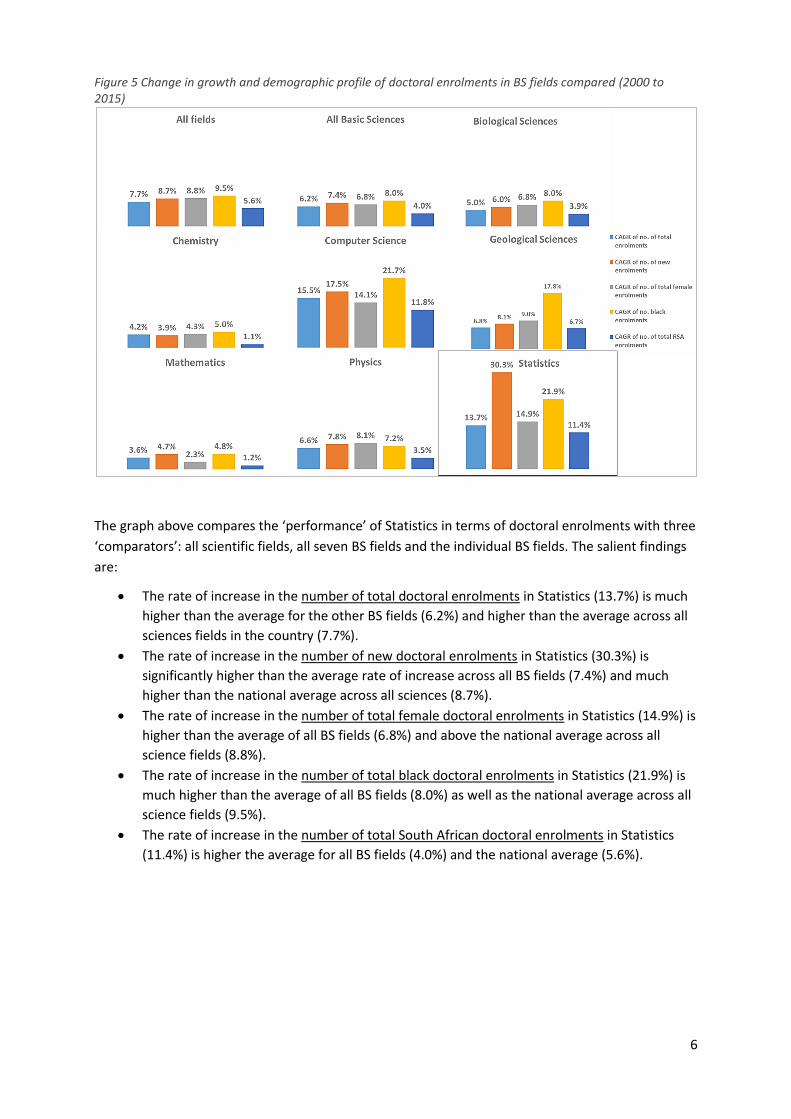
Figure 5 Change in growth and demographic profile of doctoral enrolments in BS fields compared (2000 to 2015)
The graph above compares the ‘performance’ of Statistics in terms of doctoral enrolments with three
‘comparators’: all scientific fields, all seven BS fields and the individual BS fields. The salient findings
are:
The rate of increase in the number of total doctoral enrolments in Statistics (13.7%) is much
higher than the average for the other BS fields (6.2%) and higher than the average across all
sciences fields in the country (7.7%).
The rate of increase in the number of new doctoral enrolments in Statistics (30.3%) is
significantly higher than the average rate of increase across all BS fields (7.4%) and much
higher than the national average across all sciences (8.7%).
The rate of increase in the number of total female doctoral enrolments in Statistics (14.9%) is
higher than the average of all BS fields (6.8%) and above the national average across all
science fields (8.8%).
The rate of increase in the number of total black doctoral enrolments in Statistics (21.9%) is
much higher than the average of all BS fields (8.0%) as well as the national average across all
science fields (9.5%).
The rate of increase in the number of total South African doctoral enrolments in Statistics
(11.4%) is higher the average for all BS fields (4.0%) and the national average (5.6%).

7
Academic pipeline: graduates
The number of doctoral graduates in Statistics increased from a very low base of 6 in 2000 to 16 in
2015. The average rate of increase in the number of doctoral graduates in Statistics (6.8%) is
commensurate with the average for all BS fields (6.8%).
The number of female graduates in Statistics increased slightly from 2 in 2000 to 6 in 2015 (which
translates into a rate of increase of 7.6%). The overall proportion of female graduates in Statistics
remains small. In 2015, they constituted 38% of all graduates, which is lower than the average across
all BS fields (44%). The number of black doctoral graduates in Statistics increased from no students in
2000 to a meagre 4 in 2015. In this case the proportion of black graduates in 2015 (25%) is more
commensurate with the average across all BS fields (28%) but the number of students is small. Given
the trends in foreign student enrolments, it is not surprising that we see that the proportion of South
African doctoral graduates also declined substantially: from 100% in 2000 to 38% but given the small
number of students the change in proportions is exacerbated. The share of South African students in
2015 is also less than the average for all BS fields (58%). A more systematic comparison with the
other fields is presented below4.
Figure 6 Change in growth and demographic profile of doctoral graduates in BS fields compared (2000 to 2015)
The rate of increase in the number of doctoral graduates in Statistics (6.8%) is commensurate
with the average for the other BS (6.8%) and the national average across all sciences fields in
the country (6.6%).
4 No CAGR value for the rate of increase in black doctoral graduates could be calculated from the zero base.
8
The rate of increase in the number of female doctoral graduates in Statistics (7.6%) is slightly
higher than the average of all BS fields (6.8%) and the national average across all science
fields (7.1%).
The rate of increase in the number of total South African doctoral graduates in Statistics
(0.0%) is much lower than the average for all BS fields and the national average (4.5%).
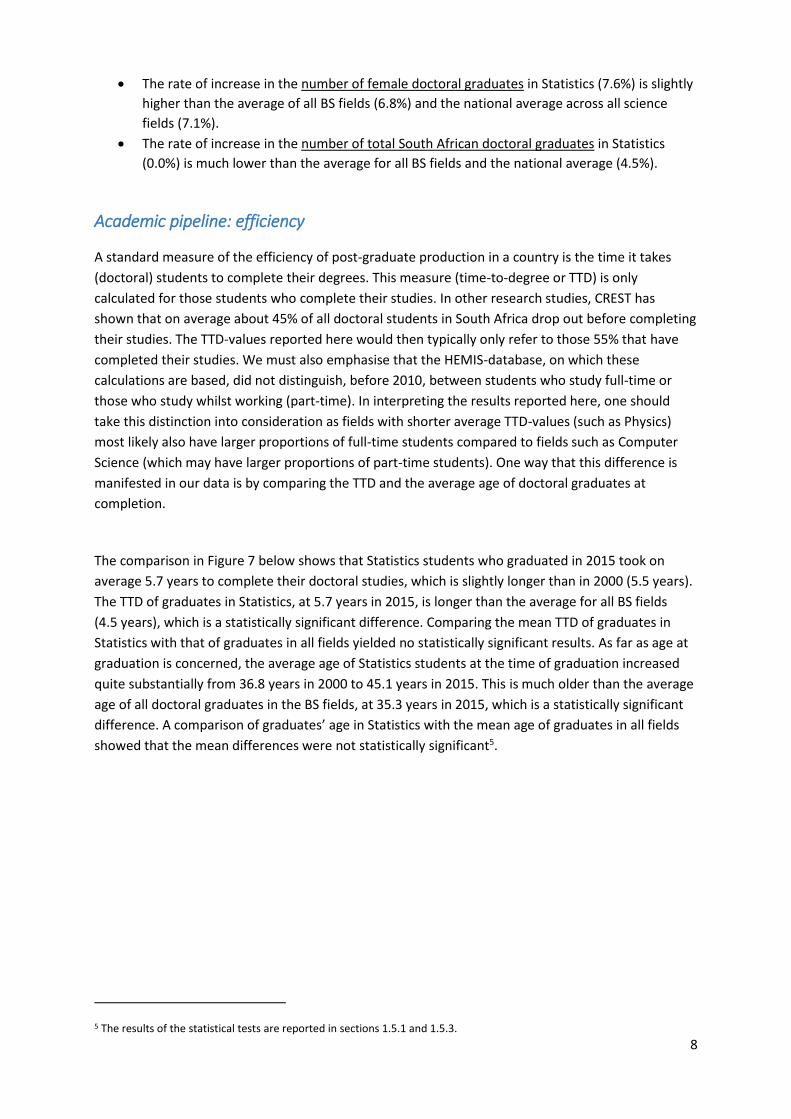
Academic pipeline: efficiency
A standard measure of the efficiency of post-graduate production in a country is the time it takes
(doctoral) students to complete their degrees. This measure (time-to-degree or TTD) is only
calculated for those students who complete their studies. In other research studies, CREST has
shown that on average about 45% of all doctoral students in South Africa drop out before completing
their studies. The TTD-values reported here would then typically only refer to those 55% that have
completed their studies. We must also emphasise that the HEMIS-database, on which these
calculations are based, did not distinguish, before 2010, between students who study full-time or
those who study whilst working (part-time). In interpreting the results reported here, one should
take this distinction into consideration as fields with shorter average TTD-values (such as Physics)
most likely also have larger proportions of full-time students compared to fields such as Computer
Science (which may have larger proportions of part-time students). One way that this difference is
manifested in our data is by comparing the TTD and the average age of doctoral graduates at
completion.
The comparison in Figure 7 below shows that Statistics students who graduated in 2015 took on
average 5.7 years to complete their doctoral studies, which is slightly longer than in 2000 (5.5 years).
The TTD of graduates in Statistics, at 5.7 years in 2015, is longer than the average for all BS fields
(4.5 years), which is a statistically significant difference. Comparing the mean TTD of graduates in
Statistics with that of graduates in all fields yielded no statistically significant results. As far as age at
graduation is concerned, the average age of Statistics students at the time of graduation increased
quite substantially from 36.8 years in 2000 to 45.1 years in 2015. This is much older than the average
age of all doctoral graduates in the BS fields, at 35.3 years in 2015, which is a statistically significant
difference. A comparison of graduates’ age in Statistics with the mean age of graduates in all fields
showed that the mean differences were not statistically significant5.
5 The results of the statistical tests are reported in sections 1.5.1 and 1.5.3.

9
Figure 7 Doctoral pipeline in BS fields compared (2000 and 2015)
Previous research by CREST has shown that there is a strong relationship between the age of the
student (both at commencement of doctoral studies and at graduation) and time to completion. This
relationship is re-affirmed in Figure 8 below: the older students are when they graduate, the longer
they take to complete their studies. As the ‘oldest’ students in our study – Statistics graduates –
were, on average, 45.1 years old at the time of graduation, and had taken on average 5.7 years to
complete their studies. As indicated above, it is very likely that a higher proportion of the Statistics
graduates was studying part-time as well, and hence took longer to complete.

10
Figure 8 Age at graduation and time-to-degree of doctoral graduates in BS fields compared (2015)
Academic pipeline: conversion rates
A useful measure of the ‘flow’ of postgraduate students from undergraduate to doctoral graduation
is the ‘conversion rate’ at each level of postgraduate studies. We calculate the conversion rate by
dividing the number of new enrolments (i.e. doctoral) in a particular year by the number of
graduates at the previous degree level (i.e. masters). We compared the results of these calculations
for Statistics for selected years between 2000 and 2015 at each postgraduate level.
Conversion rates of honours to master’s students
The graph below shows the conversion rate from honours to master’s levels for selected years. In an
efficient system, one would find relatively high levels of conversion that are either sustained or
steadily increasing. The honours-to-master’s conversion rates for Statistics students over this 16-year
period remained varied over the entire period reaching 107% in 2003 after which it declined to
averaging between 30% and 60%. This means, in effect, that postgraduate studies in Statistics do not
attract large numbers of students. The same trend of lower conversion rates is observed for
Computer Science (although there is evidence of an increase in recent years), Geological Sciences
and Mathematics. However, at the other extreme we find much higher conversion rates for Physics,
Chemistry and the Biological Sciences.
11
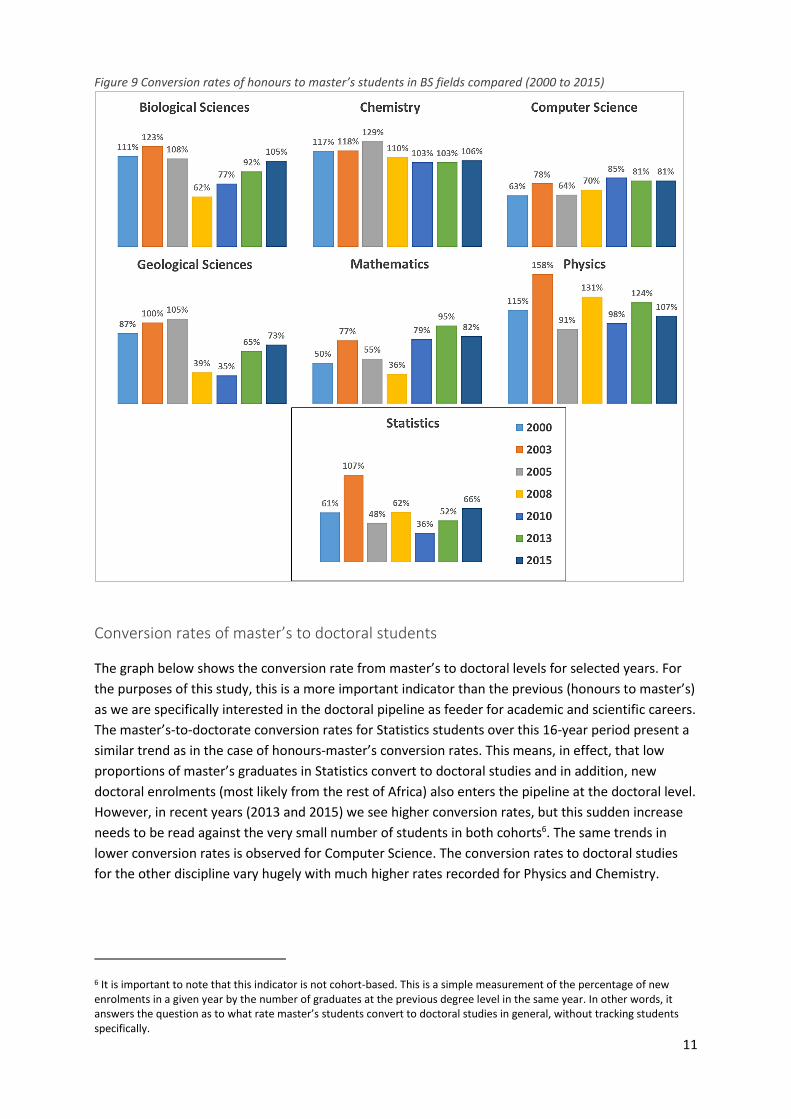
Figure 9 Conversion rates of honours to master’s students in BS fields compared (2000 to 2015)
Conversion rates of master’s to doctoral students
The graph below shows the conversion rate from master’s to doctoral levels for selected years. For
the purposes of this study, this is a more important indicator than the previous (honours to master’s)
as we are specifically interested in the doctoral pipeline as feeder for academic and scientific careers.
The master’s-to-doctorate conversion rates for Statistics students over this 16-year period present a
similar trend as in the case of honours-master’s conversion rates. This means, in effect, that low
proportions of master’s graduates in Statistics convert to doctoral studies and in addition, new
doctoral enrolments (most likely from the rest of Africa) also enters the pipeline at the doctoral level.
However, in recent years (2013 and 2015) we see higher conversion rates, but this sudden increase
needs to be read against the very small number of students in both cohorts6. The same trends in
lower conversion rates is observed for Computer Science. The conversion rates to doctoral studies
for the other discipline vary hugely with much higher rates recorded for Physics and Chemistry.
6 It is important to note that this indicator is not cohort-based. This is a simple measurement of the percentage of new enrolments in a given year by the number of graduates at the previous degree level in the same year. In other words, it answers the question as to what rate master’s students convert to doctoral studies in general, without tracking students specifically.

12
Figure 10 Conversion rates of masters to doctoral studies in BS fields compared (2000 to 2015)
Research production
The production of scientific papers in the field of Statistics has been assessed in terms of three
indicators: the number of peer-reviewed papers published in journals in the CAWeb of Science
(CAWoS), the relative share of South African Statistics papers or world output and the rank of
Statistics in the world.
The output of journal articles in Statistics is positive: the number of papers in the CAWoS increased
from only 20 in 2005 to 67 in 2016. It increased its world share (from 0.33% in 2005 to 0.67% in 2016)
while its world rank position remained steady at 37 over the same period. A comparison on the latter
two indicators with all science fields reveals the following:
The increase in world share of Statistics (from 0.33% in 2005 to 0.67% in 2016) is a large
percentage point increase (+0.34).
Statistics maintained its world rank at 37. This is below the average improvement across the
BS fields as well as the 2016 rank across all fields of 28.

13
Figure 11 Change in world share of research publication output in BS fields compared (2005 and 2016)
Figure 12 Change in world rank position of publication output in BS fields compared (2005 to 2016)
Research collaboration
It is standard practice in bibliometric studies to analyse the research collaboration between scientists
in terms of co-authorship patterns. In 2016, 74% of all papers in Statistics were co-authored with a
foreign scientist. This proportion is slightly higher than that in 2005 and much higher than the same
proportion for all sciences fields (55%).
14
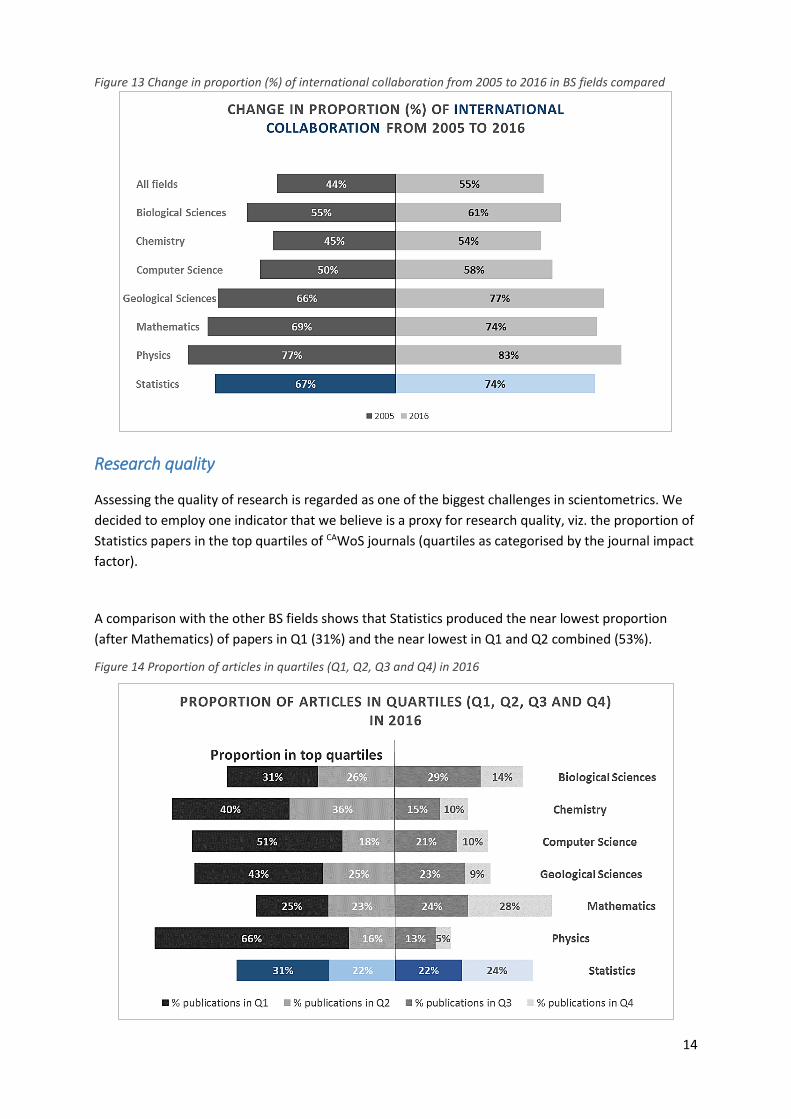
Figure 13 Change in proportion (%) of international collaboration from 2005 to 2016 in BS fields compared
Research quality
Assessing the quality of research is regarded as one of the biggest challenges in scientometrics. We
decided to employ one indicator that we believe is a proxy for research quality, viz. the proportion of
Statistics papers in the top quartiles of CAWoS journals (quartiles as categorised by the journal impact
factor).
A comparison with the other BS fields shows that Statistics produced the near lowest proportion
(after Mathematics) of papers in Q1 (31%) and the near lowest in Q1 and Q2 combined (53%).
Figure 14 Proportion of articles in quartiles (Q1, Q2, Q3 and Q4) in 2016

15
Citation impact
The visibility of science is partially captured by looking at the number of times research publications
are referenced (‘cited’) in the publications of other researchers. Citation practices differ vastly across
fields though, making it impossible to compare numbers of citations across fields. Hence, we
calculate the normalised citation score (NCS) for every publication, so-called for being normalised by
field and year. NCS = 1 indicates that the publication has received the number of citations expected
for a publication in its field and year. Since the NCS is comparable across (sub-)fields and years, we
can take the mean of these scores for a set of publications, hence the mean normalised citation score
(MNCS). In terms of citation impact, the MNCS for Statistics decreased drastically from 2.85 in 2005
to 0.67 in 2014 and is the lowest of any field in 2014. The visibility of the output in Statistics of South
Africa is lower than the world average by a factor of nearly two. The change in citation score for all
science fields is smaller: from 0.92 to 1.13 between 2005 and 2014.
Figure 15 Change in MNCS in BS fields compared (2005 and 2014)
A second set of citation impact indicators were also included in our analyses. These indicators report
on the proportion of Statistics papers in the top 1%, 5% and 10% of all Statistics papers in the world.
The results again reveal quite a negative picture: the share of Statistics papers published in the top
1% of highly cited papers decreased over time, and so did the shares of papers in the top 5% and top
10% of highly cited papers.
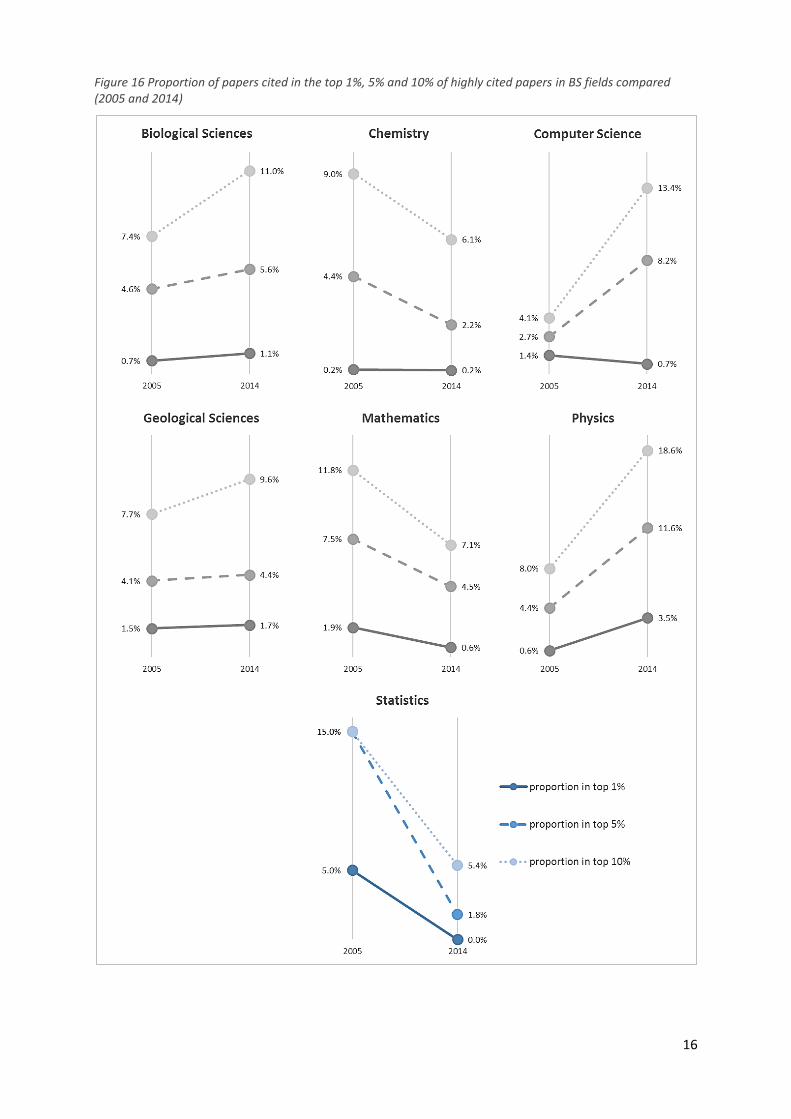
16
Figure 16 Proportion of papers cited in the top 1%, 5% and 10% of highly cited papers in BS fields compared (2005 and 2014)
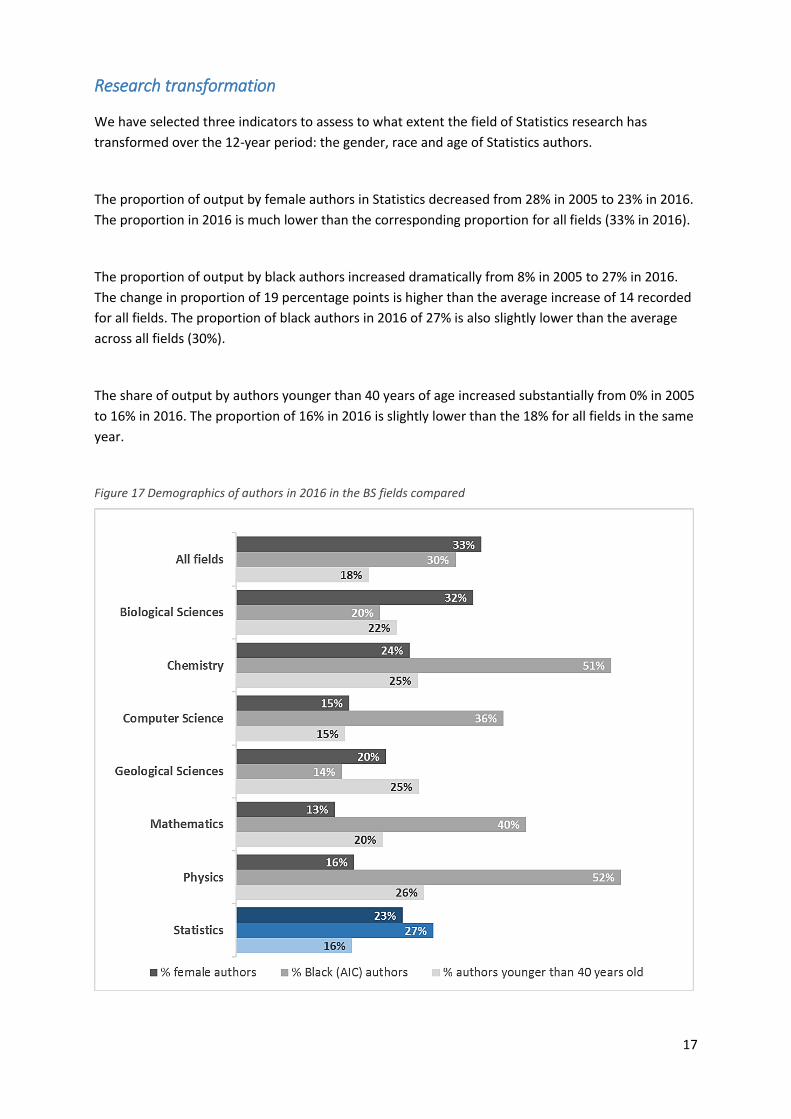
17
Research transformation
We have selected three indicators to assess to what extent the field of Statistics research has
transformed over the 12-year period: the gender, race and age of Statistics authors.
The proportion of output by female authors in Statistics decreased from 28% in 2005 to 23% in 2016.
The proportion in 2016 is much lower than the corresponding proportion for all fields (33% in 2016).
The proportion of output by black authors increased dramatically from 8% in 2005 to 27% in 2016.
The change in proportion of 19 percentage points is higher than the average increase of 14 recorded
for all fields. The proportion of black authors in 2016 of 27% is also slightly lower than the average
across all fields (30%).
The share of output by authors younger than 40 years of age increased substantially from 0% in 2005
to 16% in 2016. The proportion of 16% in 2016 is slightly lower than the 18% for all fields in the same
year.
Figure 17 Demographics of authors in 2016 in the BS fields compared

18
Concluding assessment: a field vulnerability index (FVI)
This study of the field of Statistics has focused on four main dimensions: NRF investment in research,
staff capacity and diversity, the academic pipeline, and research output and impact. These four
dimensions have formed the main headings of the report and our high-level reporting in the
Executive Summary has been framed according to these dimensions. In order to arrive at a rigorous
and detailed assessment of each dimension, our approach has been to ‘unpack’ each main dimension
into a series of sub-dimensions and associated indicators. This methodology is discussed in detail in
section 1.2 of the main report below.
In order to arrive at a more high-level assessment of the strengths and weaknesses of Statistics, we
have developed a ‘field vulnerability index’ (FVI) which provides – at a glance – a better picture of the
state of the field. The FVI which is presented below, consists of four sub-indices corresponding to
each main dimension as assessed. Each sub-index presents standardised values on the indicators
appropriate to each dimension. And importantly, each sub-index presents the results firstly by
comparing the performance of Statistics on each indicator over time (internal benchmarking) and
then, secondly, by comparing the performance of Statistics on each indicator with the average of all
BS fields (external benchmarking).
NRF investment in Statistics research
The overall profile of Statistics on this index is somewhat ambivalent. Compared to all BS fields, the
field of Statistics has evidently benefited from NRF investment albeit from a small base. This is
reflected both in the rates of increase in numbers of grant holders as well as the increases in the
total value of individual grants. However, of some concern, is the fact that the average value of
individual grants decreased noticeably over the 14-year period. The rates of increase in the numbers
of black grant holders (although from a very small base) in Statistics were commensurate with the
average rate of increase across BS fields while the number of female grant holders increased steadily.
Table 1 Field vulnerability index of NRF investment in Statistics research
Period
STATISTICS ALL BASIC SCIENCES
Value for first year
Value for last year
Rate of change in value of indicator7
Value for first year
Value for last year
Rate of change in value of indicator
CAGR
Units above
or below 0 (range: -10 to +10)
CAGR
Units above
or below 0 (range: -10 to +10)
GRANT HOLDERS
Number of grant holders 2002-
15 8 31 10.98% +10 526 1185 6.45% +6
7 Note: Intervals used to categorise the CAGR values: -10 (≤-9.50%), -9 (between -9.49% and -8.50%), -8 (between -8.49% and -7.50%), -7
(between -7.49% and -6.50%), -6 (between -6.49% and -5.50%), -5 (between -5.49% and -4.50%), -4 (between -4.49% and -3.50%), -3 (between -3.49% and -2.50%), -2 (between -2.49% and -1.50%), -1 (between -1.49% and -0.50%), 0 (between -0.49% and 0.49%), +1 (between 0.50% and 1.49%), +2 (between 1.50% and 2.49%), +3 (between 2.50% and 3.49%), +4 (between 3.50% and 4.49%), +5 (between 4.50% and 5.49%), +6 (between 5.50% and 6.49%), +7 (between 6.50% and 7.49%), +8 (between 7.50% and 8.49%), +9 (between 8.50% and 9.49%) and +10 (≥9.50%).

19
Period
STATISTICS ALL BASIC SCIENCES
Value for first year
Value for last year
Rate of change in value of indicator7
Value for first year
Value for last year
Rate of change in value of indicator
CAGR
Units above
or below 0 (range: -10 to +10)
CAGR
Units above
or below 0 (range: -10 to +10)
TRANSFORMATION
Number of female grant holders
2002-15
0 12 n/a n/a 83 329 11.18% +10
Number of black grant holders
2002-15
1 6 14.78% +10 71 286 11.31% +10
GRANT VALUES
Total value of individual grants (R’000’s)
2002-15
R2,382 R6,303 7.77% +8 R202,225 R658,951 9.51% +10
Average value of individual grants
2002-15
R297,765 R203,311 -2.89% -3 R384,459 R556,076 2.88% +3
Staff capacity and diversity
The overall picture in terms of the human resource base in Statistics is generally positive. There has
been a near double than average (average for the BS fields) growth in the number of instructional
staff and number of staff with a PhD. In terms of transformation, the profile of staff in Statistics has
become much more inclusive with high rates of growth in the numbers of especially black and female
staff. The field has also seen a near doubling of staff members younger than 35 years old in
comparison to the decline observed for all BS fields.
Table 2 Field vulnerability index of staff capacity and diversity in Statistics
Period
STATISTICS ALL BASIC SCIENCES
Value for first
year
Value for last
year
Rate of change in value of indicator8
Value for first
year
Value for last
year
Rate of change in value of indicator
CAGR
Units above
or below 0 (range: -
10 to +10)
CAGR
Units above
or below 0 (range: -
10 to +10)
STAFF CAPACITY
Number of permanent instructional staff
2000-15
151 284 4.30% +4 2867 3616 1.56% +2
Number of staff with PhDs 2000-
15 51 117 5.69% +6 1171 1870 3.17% +3
STAFF DIVERSITY
Number of female staff 2000-
15 56 111 4.67% +5 929 1406 2.80% +3
Number of black staff 2000-
15 16 83 11.60% +10 691 1542 5.50% +6
Number of RSA staff 2000-
15 127 210 3.41% +3 2532 2946 1.01% +1
Number of staff members younger than 35 years
2000-15
37 68 4.14% +4 803 712 -0.80% -1
8 Note: Intervals used to categorise the CAGR values: -10 (≤-9.50%), -9 (between -9.49% and -8.50%), -8 (between -8.49% and -7.50%), -7
(between -7.49% and -6.50%), -6 (between -6.49% and -5.50%), -5 (between -5.49% and -4.50%), -4 (between -4.49% and -3.50%), -3 (between -3.49% and -2.50%), -2 (between -2.49% and -1.50%), -1 (between -1.49% and -0.50%), 0 (between -0.49% and 0.49%), +1 (between 0.50% and 1.49%), +2 (between 1.50% and 2.49%), +3 (between 2.50% and 3.49%), +4 (between 3.50% and 4.49%), +5 (between 4.50% and 5.49%), +6 (between 5.50% and 6.49%), +7 (between 6.50% and 7.49%), +8 (between 7.50% and 8.49%), +9 (between 8.50% and 9.49%) and +10 (≥9.50%).
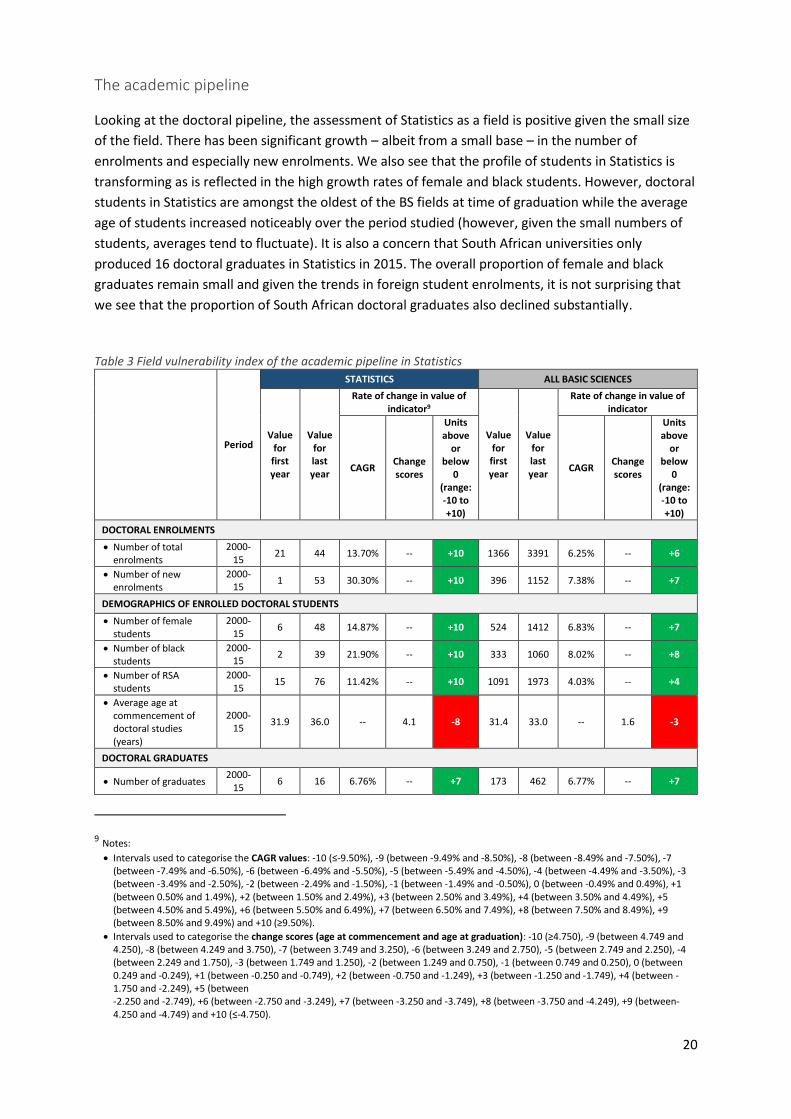
20
The academic pipeline
Looking at the doctoral pipeline, the assessment of Statistics as a field is positive given the small size
of the field. There has been significant growth – albeit from a small base – in the number of
enrolments and especially new enrolments. We also see that the profile of students in Statistics is
transforming as is reflected in the high growth rates of female and black students. However, doctoral
students in Statistics are amongst the oldest of the BS fields at time of graduation while the average
age of students increased noticeably over the period studied (however, given the small numbers of
students, averages tend to fluctuate). It is also a concern that South African universities only
produced 16 doctoral graduates in Statistics in 2015. The overall proportion of female and black
graduates remain small and given the trends in foreign student enrolments, it is not surprising that
we see that the proportion of South African doctoral graduates also declined substantially.
Table 3 Field vulnerability index of the academic pipeline in Statistics
Period
STATISTICS ALL BASIC SCIENCES
Value for first year
Value for last year
Rate of change in value of indicator9
Value for first year
Value for last year
Rate of change in value of indicator
CAGR Change scores
Units above
or below
0 (range: -10 to +10)
CAGR Change scores
Units above
or below
0 (range: -10 to +10)
DOCTORAL ENROLMENTS
Number of total enrolments
2000-15
21 44 13.70% -- +10 1366 3391 6.25% -- +6
Number of new enrolments
2000-15
1 53 30.30% -- +10 396 1152 7.38% -- +7
DEMOGRAPHICS OF ENROLLED DOCTORAL STUDENTS
Number of female students
2000-15
6 48 14.87% -- +10 524 1412 6.83% -- +7
Number of black students
2000-15
2 39 21.90% -- +10 333 1060 8.02% -- +8
Number of RSA students
2000-15
15 76 11.42% -- +10 1091 1973 4.03% -- +4
Average age at commencement of doctoral studies (years)
2000-15
31.9 36.0 -- 4.1 -8 31.4 33.0 -- 1.6 -3
DOCTORAL GRADUATES
Number of graduates 2000-
15 6 16 6.76% -- +7 173 462 6.77% -- +7
9 Notes:
Intervals used to categorise the CAGR values: -10 (≤-9.50%), -9 (between -9.49% and -8.50%), -8 (between -8.49% and -7.50%), -7 (between -7.49% and -6.50%), -6 (between -6.49% and -5.50%), -5 (between -5.49% and -4.50%), -4 (between -4.49% and -3.50%), -3 (between -3.49% and -2.50%), -2 (between -2.49% and -1.50%), -1 (between -1.49% and -0.50%), 0 (between -0.49% and 0.49%), +1 (between 0.50% and 1.49%), +2 (between 1.50% and 2.49%), +3 (between 2.50% and 3.49%), +4 (between 3.50% and 4.49%), +5 (between 4.50% and 5.49%), +6 (between 5.50% and 6.49%), +7 (between 6.50% and 7.49%), +8 (between 7.50% and 8.49%), +9 (between 8.50% and 9.49%) and +10 (≥9.50%).
Intervals used to categorise the change scores (age at commencement and age at graduation): -10 (≥4.750), -9 (between 4.749 and 4.250), -8 (between 4.249 and 3.750), -7 (between 3.749 and 3.250), -6 (between 3.249 and 2.750), -5 (between 2.749 and 2.250), -4 (between 2.249 and 1.750), -3 (between 1.749 and 1.250), -2 (between 1.249 and 0.750), -1 (between 0.749 and 0.250), 0 (between 0.249 and -0.249), +1 (between -0.250 and -0.749), +2 (between -0.750 and -1.249), +3 (between -1.250 and -1.749), +4 (between -1.750 and -2.249), +5 (between -2.250 and -2.749), +6 (between -2.750 and -3.249), +7 (between -3.250 and -3.749), +8 (between -3.750 and -4.249), +9 (between- 4.250 and -4.749) and +10 (≤-4.750).
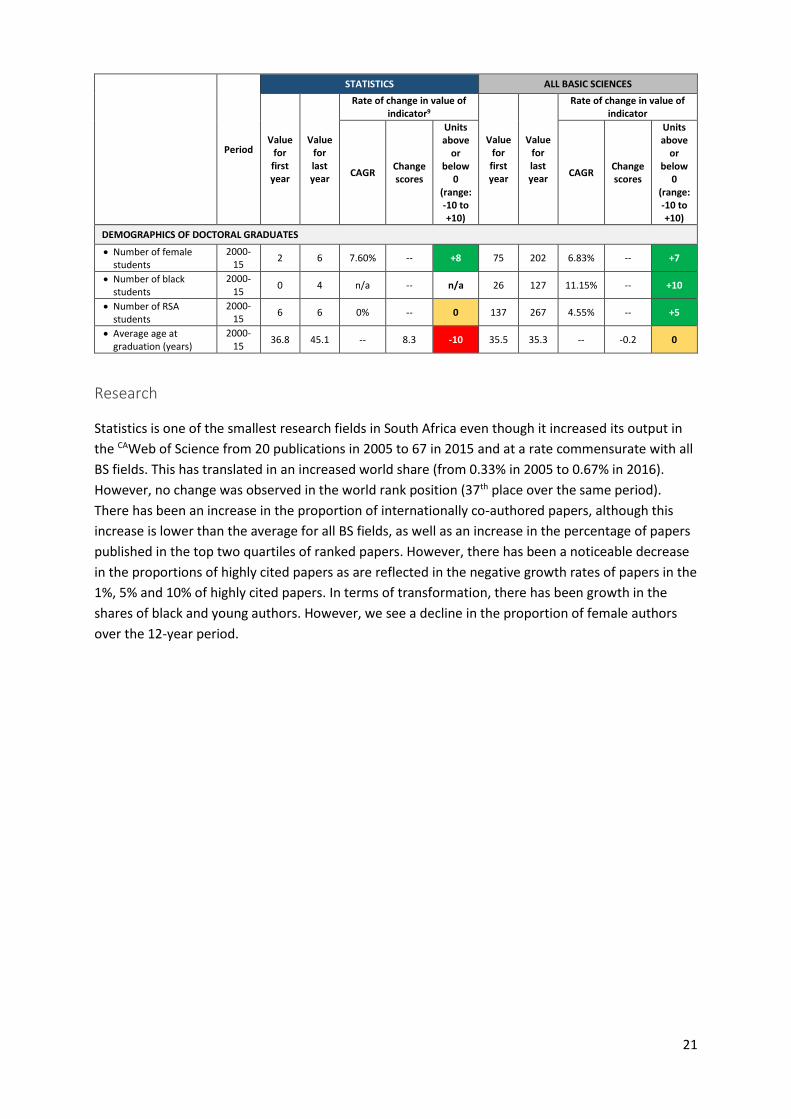
21
Period
STATISTICS ALL BASIC SCIENCES
Value for first year
Value for last year
Rate of change in value of indicator9
Value for first year
Value for last year
Rate of change in value of indicator
CAGR Change scores
Units above
or below
0 (range: -10 to +10)
CAGR Change scores
Units above
or below
0 (range: -10 to +10)
DEMOGRAPHICS OF DOCTORAL GRADUATES
Number of female students
2000-15
2 6 7.60% -- +8 75 202 6.83% -- +7
Number of black students
2000-15
0 4 n/a -- n/a 26 127 11.15% -- +10
Number of RSA students
2000-15
6 6 0% -- 0 137 267 4.55% -- +5
Average age at graduation (years)
2000-15
36.8 45.1 -- 8.3 -10 35.5 35.3 -- -0.2 0
Research
Statistics is one of the smallest research fields in South Africa even though it increased its output in
the CAWeb of Science from 20 publications in 2005 to 67 in 2015 and at a rate commensurate with all
BS fields. This has translated in an increased world share (from 0.33% in 2005 to 0.67% in 2016).
However, no change was observed in the world rank position (37th place over the same period).
There has been an increase in the proportion of internationally co-authored papers, although this
increase is lower than the average for all BS fields, as well as an increase in the percentage of papers
published in the top two quartiles of ranked papers. However, there has been a noticeable decrease
in the proportions of highly cited papers as are reflected in the negative growth rates of papers in the
1%, 5% and 10% of highly cited papers. In terms of transformation, there has been growth in the
shares of black and young authors. However, we see a decline in the proportion of female authors
over the 12-year period.

22
Table 4 Field vulnerability index of research in Statistics
Period
STATISTICS ALL FIELDS
Value for first year
Value for last year
Rate of change in value of indicator10
Value for first year
Value for last year
Rate of change in value of indicator
CAGR Change scores
Units above
or below
0 (range: -10 to +10)
CAGR Change scores
Units above
or below
0 (range: -10 to +10)
PUBLICATION OUTPUT
Number of publications in WoS
2005-16
20 67 11.62% -- +10 4660 15550 11.58% -- +10
World share of papers
2005-16
0.33% 0.67% -- 0.34% +7 0.49% 0.92% -- 0.43% +9
World rank position 2005-
16 37 37 -- 0 0 35 28 -- -7 +7
COLLABORATION
Proportion of internationally co-authored papers
2005-16
66.7% 73.7% -- 7.0% +7 43.5% 54.6% -- 11.1% +10
QUALITY
Proportion of papers published in Q1 and Q2 ranked journals
2005-16
40.0% 53.7% -- 13.7% +10 n/a n/a -- -- --
CITATION IMPACT (HIGHLY CITED PAPERS)
Proportion of papers in top 1% of highly cited papers
2005-14
5.0% 0.0% -- -5.0% -5 n/a n/a -- -- --
Proportion of papers in top 5% of highly cited papers
2005-14
15.0% 1.8% -- -13.2% -10 n/a n/a -- -- --
Proportion of papers in top 10% of highly cited papers
2005-14
15.0% 5.4% -- -9.6% -10 n/a n/a -- -- --
TRANSFORMATION
Proportion of papers published by female authors
2005-16
27.8% 22.7% -- -5.1% -5 30.5% 33.4% -- 2.9% +3
10 Notes:
Intervals used to categorise the CAGR values: -10 (≤-9.50%), -9 (between -9.49% and -8.50%), -8 (between -8.49% and -7.50%), -7 (between -7.49% and -6.50%), -6 (between -6.49% and -5.50%), -5 (between -5.49% and -4.50%), -4 (between -4.49% and -3.50%), -3 (between -3.49% and -2.50%), -2 (between -2.49% and -1.50%), -1 (between -1.49% and -0.50%), 0 (between -0.49% and 0.49%), +1 (between 0.50% and 1.49%), +2 (between 1.50% and 2.49%), +3 (between 2.50% and 3.49%), +4 (between 3.50% and 4.49%), +5 (between 4.50% and 5.49%), +6 (between 5.50% and 6.49%), +7 (between 6.50% and 7.49%), +8 (between 7.50% and 8.49%), +9 (between 8.50% and 9.49%) and +10 (≥9.50%).
Intervals used to categorise the change scores (world share of papers): -10 (≤-0.4750%), -9 (between -0.4749% and -0.4250%), -8 (between -0.4249% and -0.3750%), -7 (between -0.3749% and -0.3250%), -6 (between -0.3249% and -0.2750%), -5 (between -0.2749% and -0.2250%), -4 (between -0.2249% and -0.1750%), -3 (between -0.1749% and -0.1250%), -2 (between -0.1249% and -0.0750%), -1 (between -0.0749% and -0.0250%), 0 (between -0.0249% and 0.0249%), +1 (between 0.0250% and 0.0749%), +2 (between 0.0750% and 0.1249%), +3 (between 0.1250% and 0.1749%), +4 (between 0.1750% and 0.2249%), +5 (between 0.2250% and 0.2749%), +6 (between 0.2750% and 0.3249%), +7 (between 0.3250% and 0.3749%), +8 (between 0.3750% and 0.4249%), +9 (between 0.4250% and 0.4749%) and +10 (≥0.4750%).
Intervals used to categorise the change scores (world rank position): -10 (≥9.50), -9 (between 9.49 and 8.50), -8 (between 8.49 and 7.50), -7 (between 7.49 and 6.50), -6 (between 6.49 and 5.50), -5 (between 5.49 and 4.50), -4 (between 4.49 and 3.50), -3 (between 3.49 and 2.50), -2 (between 2.49 and 1.50), -1 (between 1.49 and 0.50), 0 (between 0.49 and -0.49), +1 (between -0.50 and -1.49), +2 (between -1.50 and -2.49), +3 (between -2.50 and -3.49), +4 (between -3.50 and -4.49), +5 (between -4.50 and -5.49), +6 (between -5.50 and -6.49), +7 (between -6.50 and -7.49), +8 (between -7.50 and -8.49), +9 (between -8.50 and -9.49) and +10 (≤-9.50).
Intervals used to categorise the change scores (proportions): -10 (≤-9.50%), -9 (between -9.49% and -8.50%), -8 (between -8.49% and -7.50%), -7 (between -7.49% and -6.50%), -6 (between -6.49% and -5.50%), -5 (between -5.49% and -4.50%), -4 (between -4.49% and -3.50%), -3 (between -3.49% and -2.50%), -2 (between -2.49% and -1.50%), -1 (between -1.49% and -0.50%), 0 (between -0.49% and 0.49%), +1 (between 0.50% and 1.49%), +2 (between 1.50% and 2.49%), +3 (between 2.50% and 3.49%), +4 (between 3.50% and 4.49%), +5 (between 4.50% and 5.49%), +6 (between 5.50% and 6.49%), +7 (between 6.50% and 7.49%), +8 (between 7.50% and 8.49%), +9 (between 8.50% and 9.49%) and +10 (≥9.50%).

23
Period
STATISTICS ALL FIELDS
Value for first year
Value for last year
Rate of change in value of indicator10
Value for first year
Value for last year
Rate of change in value of indicator
CAGR Change scores
Units above
or below
0 (range: -10 to +10)
CAGR Change scores
Units above
or below
0 (range: -10 to +10)
Proportion of papers published by black authors
2005-16
8.3% 26.9% -- 18.5% +10 15.8% 29.9% -- 14.1% +10
Proportion of papers published by authors younger than 40 years
2005-16
0.0% 15.8% -- 15.8% +10 2.7% 18.0% -- 15.3% +10
In conclusion, before commenting on some of the salient findings of our study, it is worth pointing
out that our analysis was confined to ‘Statistics’ as defined by standard classification frameworks in
higher education studies and bibliometrics. This means that our results pertain to staff and students
as well as research publications in the ‘narrow’ sense (or even ‘pure’ sense) and do not include those
fields where statistics is applied (e.g. in biostatistics, financial statistics, and so on). This ‘exclusion’
may impact especially on any assessment of research performance as publications in these applied
fields would not necessarily have been included in the subject categories that we analysed.
Having said this, it is still clear that our study has shown that Statistics remains a small field both in
terms of academic capacity, the production of post-graduate students and research production. We
are aware of initiatives to expand the capacity in the field. The NRF, for example, introduced a special
granting category in 2015 for Academics in Statistics. The early results show that this category is
increasingly being utilised by academics. But the overall production of doctoral graduates and overall
research performance requires serious attention. In an age of big data and the growing demand for
‘big data talent’, the strategic importance of Statistics (together with fields such as Computer Science
and Data Engineering) has never been more obvious.

24
Section 1: Main findings
1.1 Introduction
The aim of the study has been to undertake a scientometric assessment of the state of selected BS
disciplines in South Africa. Scientific disciplines are complex ‘objects’ and differ in multiple ways from
each other. To gain a deep understanding, a deep and detailed assessment of evaluation of the state
of a discipline is not an easy undertaking. Ideally, one would combine quantitative and qualitative
methodologies to arrive at such an assessment and in the best possible world, such an assessment
would be informed both by insider and outsider accounts of the strengths and weaknesses of the
field.
Our approach has been predominantly quantitative (scientometrics as the quantitative measurement
of science systems). The request by the DST was indeed for a predominantly quantitative approach
that would be based on the selection of appropriate and robust indicators of the strength (and
vulnerabilities) of the selected fields. This approach resulted in the development of a ‘dashboard’ of
84 indicators that aim to cover the main dimensions of the performance of a scientific field. We
describe these dimensions and the choice of indicators under each dimension in detail below.
1.2 The main assessment dimensions and their indicators
Four main dimensions of the ‘performance’ of Statistics as a field have been included in our
assessment of the state of the discipline. The choice of these dimensions is in line with good practice
in scientometric studies, but also takes into consideration the availability of appropriate data
sources. For each of the main dimensions we included a list of performance indicators.
1.2.1 Investment in Statistics research
The first dimension aims to produce an estimate of the available funding for Statistics research in
South Africa. For this purpose, we were given access to NRF-funding data for the period 2002 to
2015. We are aware that there may be other, public and private, sources of funding for Statistics.
However, for the purpose of comparison across all the BS fields11, we decided to limit our analyses of
research funding data to the NRF dataset. We include five (5) state indicators under this dimension
and five (5) dynamic indicators.
11 The ‘performance’ of Statistics on the first three dimensions (NRF investment, staff capacity and diversity and academic pipeline) is compared with the ‘performance’ of all seven BS fields on the same indicators. However, on the fourth dimension (research), we compare Statistics with all science fields in the country. This is necessary as it is not possible rigorously to delineate the ‘basic sciences” from all other fields in the CAWoS subject categories (which forms the basis for the assignment of articles and journals to scientific fields).

25
State indicators
The state indicators that we used are:
1. the number of grant holders;
2. female grant holders as share of all grant holders;
3. black grant holders as share of all grant holders;
4. the total value of individual grants; and
5. the average value of individual grants.
Dynamic indicators
The dynamic indicators that we used are:
6. the rate of increase12 in the number of grant holders;
7. the rate of increase in the number of female grant holders;
8. the rate of increase in the number of black grant holders;
9. the rate of increase in the total value of individual grants; and
10. the rate of increase in the average value of individual grants.
The inclusion of these indicators allowed us not only to assess the size and magnitude of the
monetary value of grants and changes over time, but also whether the investment has become more
inclusive over time to benefit more female and black researchers than before.
1.2.2 Staff capacity and diversity
The second dimension included in this assessment concerns the academic staff capacity in the
country to produce knowledge, teach and supervise postgraduate students (the academic pipeline)
of future researchers and scientists in Statistics. We include seven (7) state and twelve (12) dynamic
indicators under this dimension. Data for these indicators were sourced from the Higher Education
Management Information System (HEMIS) for the period 2000 to 2015.
State indicators
The state indicators that we used are:
11. the number of permanent instructional staff;
12. the proportion of staff with PhDs;
13. the ratio of doctoral enrolments per supervisor13;
14. the proportion of female staff;
15. the proportion of black staff;
16. the proportion of staff members from South Africa; and
17. the proportion of staff younger than 35 years.
12 Throughout this report ‘rate of increase’ refers to the ‘compound average annual growth rate’ (CAGR) 13 A ‘supervisor’ has been defined as any permanent instructional staff member who is eligible to supervise, i.e. who is in possession of a PhD.
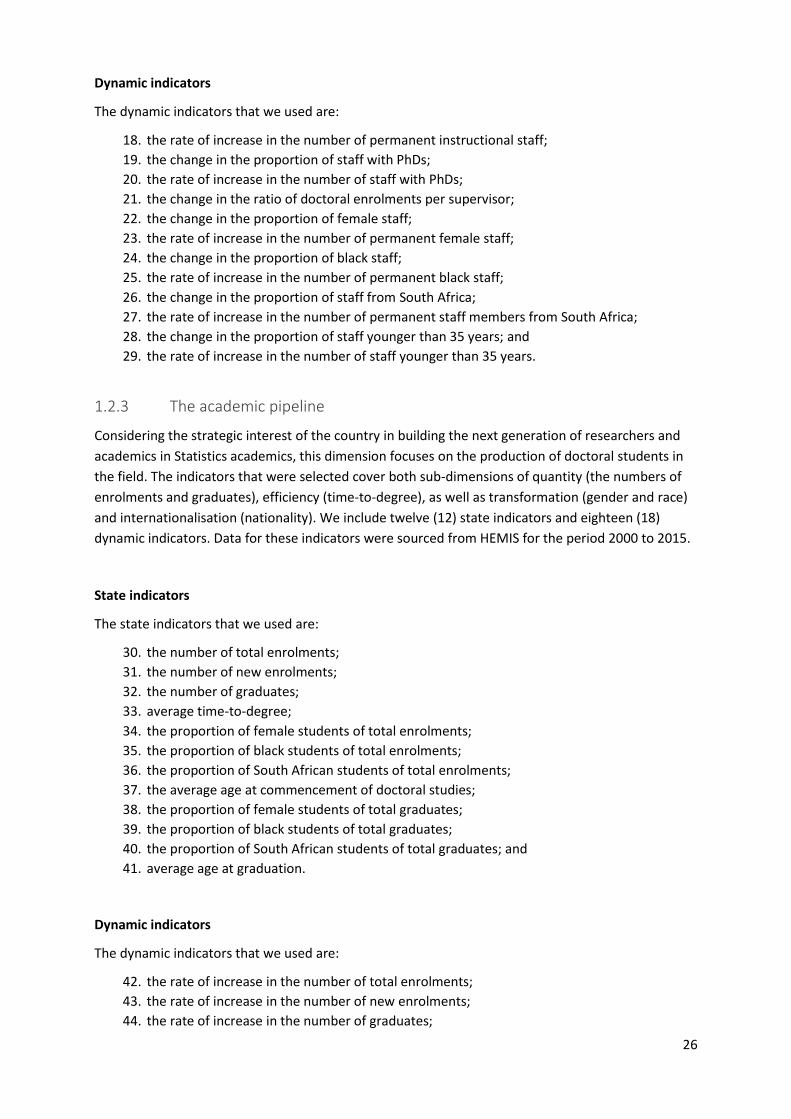
26
Dynamic indicators
The dynamic indicators that we used are:
18. the rate of increase in the number of permanent instructional staff;
19. the change in the proportion of staff with PhDs;
20. the rate of increase in the number of staff with PhDs;
21. the change in the ratio of doctoral enrolments per supervisor;
22. the change in the proportion of female staff;
23. the rate of increase in the number of permanent female staff;
24. the change in the proportion of black staff;
25. the rate of increase in the number of permanent black staff;
26. the change in the proportion of staff from South Africa;
27. the rate of increase in the number of permanent staff members from South Africa;
28. the change in the proportion of staff younger than 35 years; and
29. the rate of increase in the number of staff younger than 35 years.
1.2.3 The academic pipeline
Considering the strategic interest of the country in building the next generation of researchers and
academics in Statistics academics, this dimension focuses on the production of doctoral students in
the field. The indicators that were selected cover both sub-dimensions of quantity (the numbers of
enrolments and graduates), efficiency (time-to-degree), as well as transformation (gender and race)
and internationalisation (nationality). We include twelve (12) state indicators and eighteen (18)
dynamic indicators. Data for these indicators were sourced from HEMIS for the period 2000 to 2015.
State indicators
The state indicators that we used are:
30. the number of total enrolments;
31. the number of new enrolments;
32. the number of graduates;
33. average time-to-degree;
34. the proportion of female students of total enrolments;
35. the proportion of black students of total enrolments;
36. the proportion of South African students of total enrolments;
37. the average age at commencement of doctoral studies;
38. the proportion of female students of total graduates;
39. the proportion of black students of total graduates;
40. the proportion of South African students of total graduates; and
41. average age at graduation.
Dynamic indicators
The dynamic indicators that we used are:
42. the rate of increase in the number of total enrolments;
43. the rate of increase in the number of new enrolments;
44. the rate of increase in the number of graduates;

27
45. the change in average time-to-degree;
46. the change in the proportion of female enrolments;
47. the rate of increase in the number of female enrolments;
48. the change in the proportion of black enrolments;
49. the rate of increase in the number of black enrolments;
50. the change in the proportion of South African enrolments;
51. the rate of increase in the number of South African enrolments;
52. the change in the average age at commencement of doctoral studies;
53. the change in the proportion of female students of total graduates;
54. the rate of increase in the number of female graduates;
55. the change in the proportion of black students of total graduates;
56. the rate of increase in the number of black graduates;
57. the change in the proportion of South African students of total graduates;
58. the rate of increase in the number of South African graduates; and
59. the change in the average age at graduation.
1.2.4 Research
Various dimensions of the research performance of Statistics as a scientific field of knowledge
production were assessed by a set of 25 indicators: research production or output, transformation of
the human resource base for research in the field (black and female), research quality, research
collaboration, research (citation) impact and the relative strength of Statistics as field of research
(also relative to world output). Two data sets were used for these analyses: the CAWoS was used for
analyses related to research output, collaboration and research impact and the SA Knowledgebase
for analyses related to research transformation. In both cases, the time-period for the analyses is
2005 to 2016 (except where indicators refer to citation impact– here data is reported for 2005 to
2014).
State indicators
The state indicators that we used are:
60. the number of publications;
61. the world share of publications;
62. world rank position;
63. the relative field strength (RFS) score;
64. the proportion of internationally co-authored papers;
65. the mean normalised citation score (MNCS);
66. the proportion of papers published in Q1- and Q2-ranked journals;
67. the proportion of papers in top 1% of highly cited papers;
68. the proportion of papers in top 5% of highly cited papers;
69. the proportion of papers in top 10% of highly cited papers;
70. the proportion of papers published by female authors;
71. the proportion of papers published by black authors; and
72. the proportion of papers published by authors younger than 40 years.
28
Dynamic indicators
The dynamic indicators that we used are:
73. the rate in growth of total publication output;
74. the change in world share;
75. the change in world rank;
76. the change in RFS;
77. the change in the proportion of internationally co-authored papers;
78. the change in MNCS;
79. the change in the proportion of papers in top 1% of highly cited papers;
80. the change in the proportion of papers in top 5% of highly cited papers;
81. the change in the proportion of papers in top 10% of highly cited papers;
82. the change in the proportion of papers published by female authors;
83. the change in the proportion of papers published by black authors; and
84. the change in the proportion of papers published by authors younger than 40 years.

29
1.3 Investment in Statistics research
We present the results of our analysis of the NRF investment in Statistics under two headings: the
profile of grant holders in the field and the grant values awarded to grant holders in the field. 14
1.3.1 Grant holders
The number of grant holders in a specific field could be interpreted as a proxy for the size of the field.
Table 5 shows the large differences in these numbers. Over the time-period, a total of 46 (unique)
scientists in Statistics received grants from the NRF. The number of individual grant holders increased
steadily from 8 in 2002 to 31 in 2015. This represents a compound annual growth rate of 11% which
is the highest of all the BS fields.
Table 5 Number of unique grant holders by BS field (2000 to 2015)
Fields Number of grant holders
Biological Sciences 1000
Chemistry 362
Physics 254
Mathematics 208
Geological Sciences 119
Computer Science 102
Statistics 46
The increase in the number of grant holders in Statistics over this time period occurred at the same
time as the share of female grant holders increased from 0% in 2002 to 38.7% (12 out of 31) in 2015.
A similar increase in the number of black grant holders from 12.5% (1 out of 8 in 2002) to 19.3% (6
out of 31 in 2015) was recorded.
14 The NRF provided two sets of grant holder data, respectively for the period 2002 to 2013 and for the period 2014 to 2015. Once merged, the final dataset comprised 44 138 records. A field classification framework was developed based on information contained in the “PersonResField1” column in the dataset, which was the best populated of all the field-related columns. The field entries in the relevant column were classified according to the Web of Science subject categories that constitute the seven basic science fields. Each grant holder was also given a unique identification number. Where an individual lacked a field entry for a particular grant, the unique identification number was used to link that person to the field entries for the other grants in her/his portfolio. Where a grant-holder was found to appear in more than one basic science field, the relevant individual was placed in the field corresponding to the larger share of grants. Any individual could therefore appear in only one of the seven basic science fields. All monetary values were adjusted for inflation based on the Consumer Price Index (CPI) as released by Statistics South Africa, and by using 2015 as the base year for inflation.

30
Table 6 Indicators for investment in Statistics research: Grant holders (2002 to 2015)
Dimension Indicator
category Indicator
All BS fields
(2002
All BS fields
(2015)
Statistics
(2002)
Statistics
(2015)
GRANT
HOLDERS
Total number
of grant holders
Number of grant holders 526 1185 8 31
CAGR in number of grant
holders 6.5% 11.0%
Female grant
holders
Number of female grant
holders 83 329 0 12
CAGR in number of
female grant holders 11.2% N/A
Female grant holders as
share of all grant holders 15.8% 27.8% 0% 38.7%
Black grant
holders
Number of grant holders 71 286 1 6
CAGR in number of black
grant holders 11.3% 14.8%
Black grant holders as
share of all grant holders 13.5% 24.1% 12.5% 19.4%
1.3.2 Grant values
The total NRF investment in Statistics research between 2002 and 2015 was just over R36 million.
The average value of the individual grants for Statistics (see Table 8) was the lowest of all BS fields
(R203,311).
Table 7 Total amount of NRF grants by BS field (2002 to 2015) (R’000’s)
Fields Total value
Biological Sciences R2,562,423
Chemistry R1,285,683
Physics R1,195,7601
Geological Sciences R414,009
Mathematics R362,573
Computer Science R212,929
Statistics R36,008
Table 8 Average amount per individual grant holders for BS field: comparing 2002 and 2015 Fields Average grant value (2002) Average grant value (2015)
ALL BS R384,459 R556,076
Geological Sciences R765,673 R921,514
Physics R333,498 R806,261
Chemistry R639,051 R677,271
Biological Sciences R335,346 R475,142
Mathematics R153,496 R399,397
Computer Science R357,016 R349,071
Statistics R297,765 R203,311
Although the NRF investment in Statistics research increased over the period 2002 to 2015, this
occurred at a slower rate than for all other BS fields. This applies to the increase in the overall value
of the grants allocated (a rate of 7.8% [rate of increase]) compared to 9.5% for all BS fields. It is also
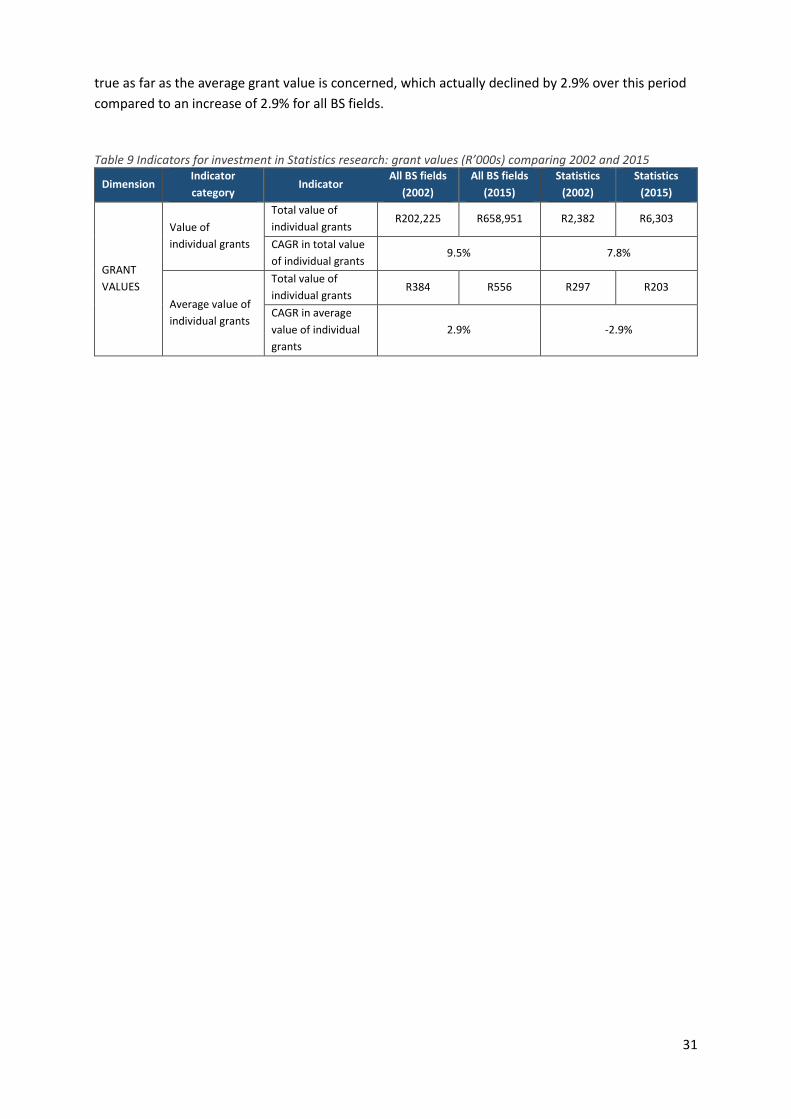
31
true as far as the average grant value is concerned, which actually declined by 2.9% over this period
compared to an increase of 2.9% for all BS fields.
Table 9 Indicators for investment in Statistics research: grant values (R’000s) comparing 2002 and 2015
Dimension Indicator
category Indicator
All BS fields
(2002)
All BS fields
(2015)
Statistics
(2002)
Statistics
(2015)
GRANT
VALUES
Value of
individual grants
Total value of
individual grants R202,225 R658,951 R2,382 R6,303
CAGR in total value
of individual grants 9.5% 7.8%
Average value of
individual grants
Total value of
individual grants R384 R556 R297 R203
CAGR in average
value of individual
grants
2.9% -2.9%
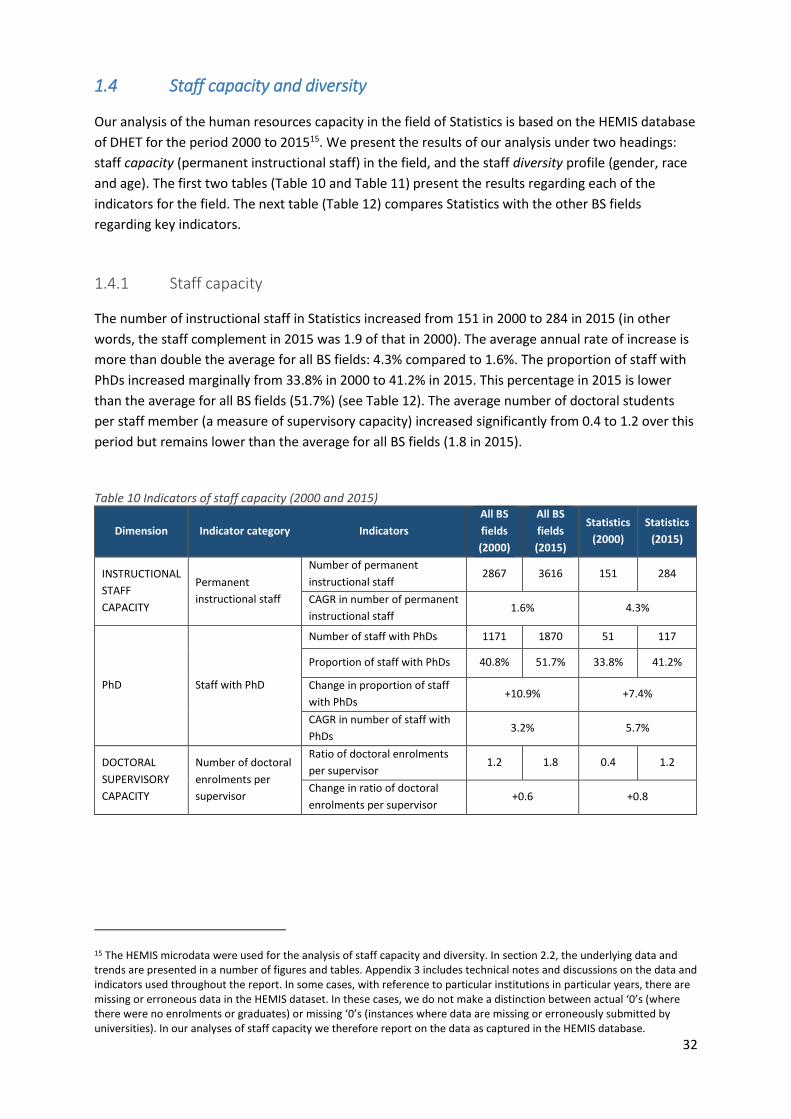
32
1.4 Staff capacity and diversity
Our analysis of the human resources capacity in the field of Statistics is based on the HEMIS database
of DHET for the period 2000 to 201515. We present the results of our analysis under two headings:
staff capacity (permanent instructional staff) in the field, and the staff diversity profile (gender, race
and age). The first two tables (Table 10 and Table 11) present the results regarding each of the
indicators for the field. The next table (Table 12) compares Statistics with the other BS fields
regarding key indicators.
1.4.1 Staff capacity
The number of instructional staff in Statistics increased from 151 in 2000 to 284 in 2015 (in other
words, the staff complement in 2015 was 1.9 of that in 2000). The average annual rate of increase is
more than double the average for all BS fields: 4.3% compared to 1.6%. The proportion of staff with
PhDs increased marginally from 33.8% in 2000 to 41.2% in 2015. This percentage in 2015 is lower
than the average for all BS fields (51.7%) (see Table 12). The average number of doctoral students
per staff member (a measure of supervisory capacity) increased significantly from 0.4 to 1.2 over this
period but remains lower than the average for all BS fields (1.8 in 2015).
Table 10 Indicators of staff capacity (2000 and 2015)
Dimension Indicator category Indicators
All BS
fields
(2000)
All BS
fields
(2015)
Statistics
(2000)
Statistics
(2015)
INSTRUCTIONAL
STAFF
CAPACITY
Permanent
instructional staff
Number of permanent
instructional staff 2867 3616 151 284
CAGR in number of permanent
instructional staff 1.6% 4.3%
PhD Staff with PhD
Number of staff with PhDs 1171 1870 51 117
Proportion of staff with PhDs 40.8% 51.7% 33.8% 41.2%
Change in proportion of staff
with PhDs +10.9% +7.4%
CAGR in number of staff with
PhDs 3.2% 5.7%
DOCTORAL
SUPERVISORY
CAPACITY
Number of doctoral
enrolments per
supervisor
Ratio of doctoral enrolments
per supervisor 1.2 1.8 0.4 1.2
Change in ratio of doctoral
enrolments per supervisor +0.6 +0.8
15 The HEMIS microdata were used for the analysis of staff capacity and diversity. In section 2.2, the underlying data and trends are presented in a number of figures and tables. Appendix 3 includes technical notes and discussions on the data and indicators used throughout the report. In some cases, with reference to particular institutions in particular years, there are missing or erroneous data in the HEMIS dataset. In these cases, we do not make a distinction between actual ‘0’s (where there were no enrolments or graduates) or missing ‘0’s (instances where data are missing or erroneously submitted by universities). In our analyses of staff capacity we therefore report on the data as captured in the HEMIS database.

33
1.4.2 Staff diversity
Over the recorded period, the proportion of female staff in Statistics increased from 37.1% in 2002 to
39.1% in 2015, an increase that is slightly below the average increase for all BS fields. However, the
proportion in 2015 is well below the average for all BS fields (38.9%) (see Table 12).
The proportion of black staff increased from 10.6% in 2000 to 29.2% in 2015. Despite this increase,
the share of black staff members in 2015 remains lower than the average for all BS fields at 42.6%
(see Table 12).
The proportion of South African staff members declined from 84.1% in 2000 to 73.9% in 2015, a
trend that is commensurate with the trend across all BS fields.
The proportion of staff younger than 35 years old has remained unchanged at around 24%. The
proportion in 2015 is higher than the average of 19.7% for all BS fields (see Table 12).
Table 11 Indicators of staff diversity (2000 and 2015)
Dimension Indicator category Indicators
All BS
fields
(2000)
All BS
fields
(2015)
Statistics
(2000)
Statistics
(2015)
GENDER
Female staff Number of female staff 929 1406 56 111
Female staff as a
percentage of total
permanent instructional
staff
Proportion of female staff 32.4% 38.9% 37.1% 39.1%
Change in proportion of
female staff +6.5% +2.0%
CAGR in number of female
staff 2.8% 4.7%
RACE
Black staff Number of black staff 691 1542 16 83
South African black staff
as a percentage of total
permanent instructional
staff
Proportion of black staff 24.1% 42.6% 10.6% 29.2%
Change in proportion of
black staff +18.5% +18.6%
CAGR in number of black
staff 5.5% 11.6%
NATIONALITY
Number of RSA staff Number of RSA staff 2532 2946 127 210
RSA staff as a
percentage of total
permanent instructional
staff
Proportion RSA staff 88.3% 81.5% 84.1% 73.9%
Change in proportion of
RSA staff -6.8% -9.2%
CAGR in number of RSA
staff 1.0% 3.4%
AGE
Number of staff
younger than 35 years
Number of staff younger
than 35 years 803 712 37 68
Staff younger than 35
years as a percentage of
total permanent
instructional staff
Proportion of staff younger
than 35 years 28.0% 19.7% 24.5% 23.9%
Change in proportion of
staff younger than 35 years -8.3% -0.6%
CAGR in number of staff
younger than 35 years -0.8% 4.1%
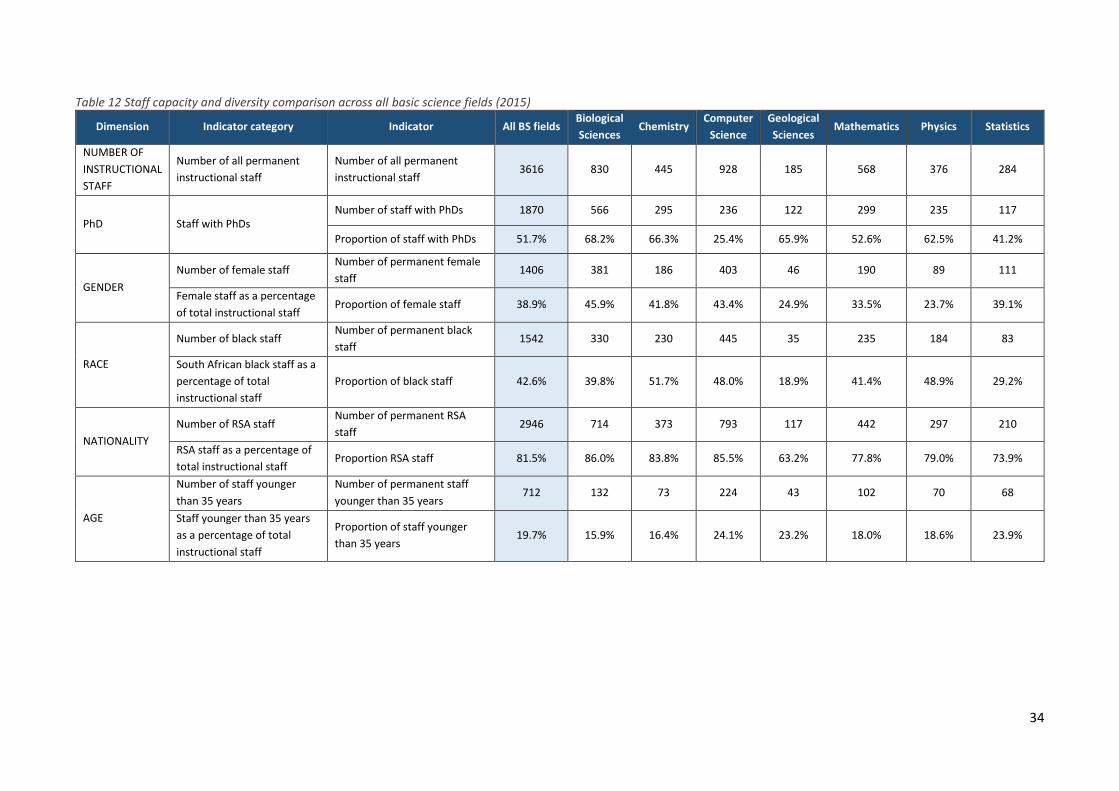
34
Table 12 Staff capacity and diversity comparison across all basic science fields (2015)
Dimension Indicator category Indicator All BS fields Biological
Sciences Chemistry
Computer
Science
Geological
Sciences Mathematics Physics Statistics
NUMBER OF
INSTRUCTIONAL
STAFF
Number of all permanent
instructional staff
Number of all permanent
instructional staff 3616 830 445 928 185 568 376 284
PhD Staff with PhDs Number of staff with PhDs 1870 566 295 236 122 299 235 117
Proportion of staff with PhDs 51.7% 68.2% 66.3% 25.4% 65.9% 52.6% 62.5% 41.2%
GENDER
Number of female staff Number of permanent female
staff 1406 381 186 403 46 190 89 111
Female staff as a percentage
of total instructional staff Proportion of female staff 38.9% 45.9% 41.8% 43.4% 24.9% 33.5% 23.7% 39.1%
RACE
Number of black staff Number of permanent black
staff 1542 330 230 445 35 235 184 83
South African black staff as a
percentage of total
instructional staff
Proportion of black staff 42.6% 39.8% 51.7% 48.0% 18.9% 41.4% 48.9% 29.2%
NATIONALITY
Number of RSA staff Number of permanent RSA
staff 2946 714 373 793 117 442 297 210
RSA staff as a percentage of
total instructional staff Proportion RSA staff 81.5% 86.0% 83.8% 85.5% 63.2% 77.8% 79.0% 73.9%
AGE
Number of staff younger
than 35 years
Number of permanent staff
younger than 35 years 712 132 73 224 43 102 70 68
Staff younger than 35 years
as a percentage of total
instructional staff
Proportion of staff younger
than 35 years 19.7% 15.9% 16.4% 24.1% 23.2% 18.0% 18.6% 23.9%
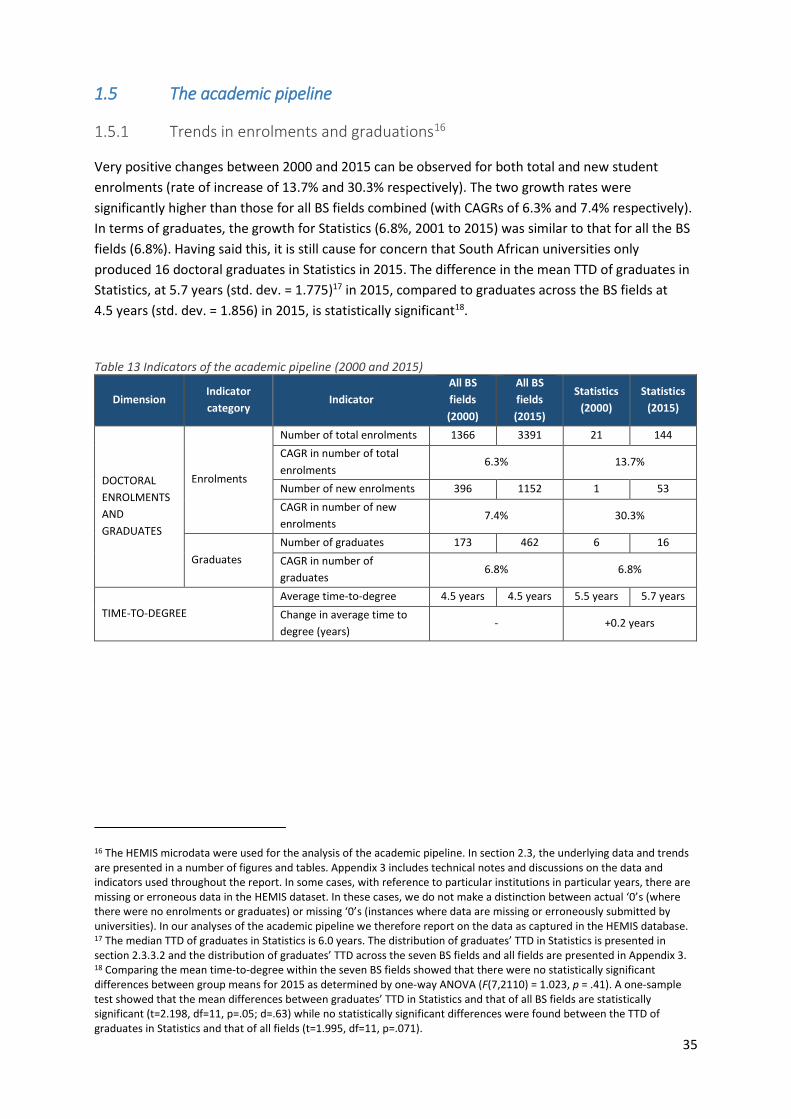
35
1.5 The academic pipeline
1.5.1 Trends in enrolments and graduations16
Very positive changes between 2000 and 2015 can be observed for both total and new student
enrolments (rate of increase of 13.7% and 30.3% respectively). The two growth rates were
significantly higher than those for all BS fields combined (with CAGRs of 6.3% and 7.4% respectively).
In terms of graduates, the growth for Statistics (6.8%, 2001 to 2015) was similar to that for all the BS
fields (6.8%). Having said this, it is still cause for concern that South African universities only
produced 16 doctoral graduates in Statistics in 2015. The difference in the mean TTD of graduates in
Statistics, at 5.7 years (std. dev. = 1.775)17 in 2015, compared to graduates across the BS fields at
4.5 years (std. dev. = 1.856) in 2015, is statistically significant18.
Table 13 Indicators of the academic pipeline (2000 and 2015)
Dimension Indicator
category Indicator
All BS
fields
(2000)
All BS
fields
(2015)
Statistics
(2000)
Statistics
(2015)
DOCTORAL
ENROLMENTS
AND
GRADUATES
Enrolments
Number of total enrolments 1366 3391 21 144
CAGR in number of total
enrolments 6.3% 13.7%
Number of new enrolments 396 1152 1 53
CAGR in number of new
enrolments 7.4% 30.3%
Graduates
Number of graduates 173 462 6 16
CAGR in number of
graduates 6.8% 6.8%
TIME-TO-DEGREE
Average time-to-degree 4.5 years 4.5 years 5.5 years 5.7 years
Change in average time to
degree (years) - +0.2 years
16 The HEMIS microdata were used for the analysis of the academic pipeline. In section 2.3, the underlying data and trends are presented in a number of figures and tables. Appendix 3 includes technical notes and discussions on the data and indicators used throughout the report. In some cases, with reference to particular institutions in particular years, there are missing or erroneous data in the HEMIS dataset. In these cases, we do not make a distinction between actual ‘0’s (where there were no enrolments or graduates) or missing ‘0’s (instances where data are missing or erroneously submitted by universities). In our analyses of the academic pipeline we therefore report on the data as captured in the HEMIS database. 17 The median TTD of graduates in Statistics is 6.0 years. The distribution of graduates’ TTD in Statistics is presented in section 2.3.3.2 and the distribution of graduates’ TTD across the seven BS fields and all fields are presented in Appendix 3. 18 Comparing the mean time-to-degree within the seven BS fields showed that there were no statistically significant differences between group means for 2015 as determined by one-way ANOVA (F(7,2110) = 1.023, p = .41). A one-sample test showed that the mean differences between graduates’ TTD in Statistics and that of all BS fields are statistically significant (t=2.198, df=11, p=.05; d=.63) while no statistically significant differences were found between the TTD of graduates in Statistics and that of all fields (t=1.995, df=11, p=.071).
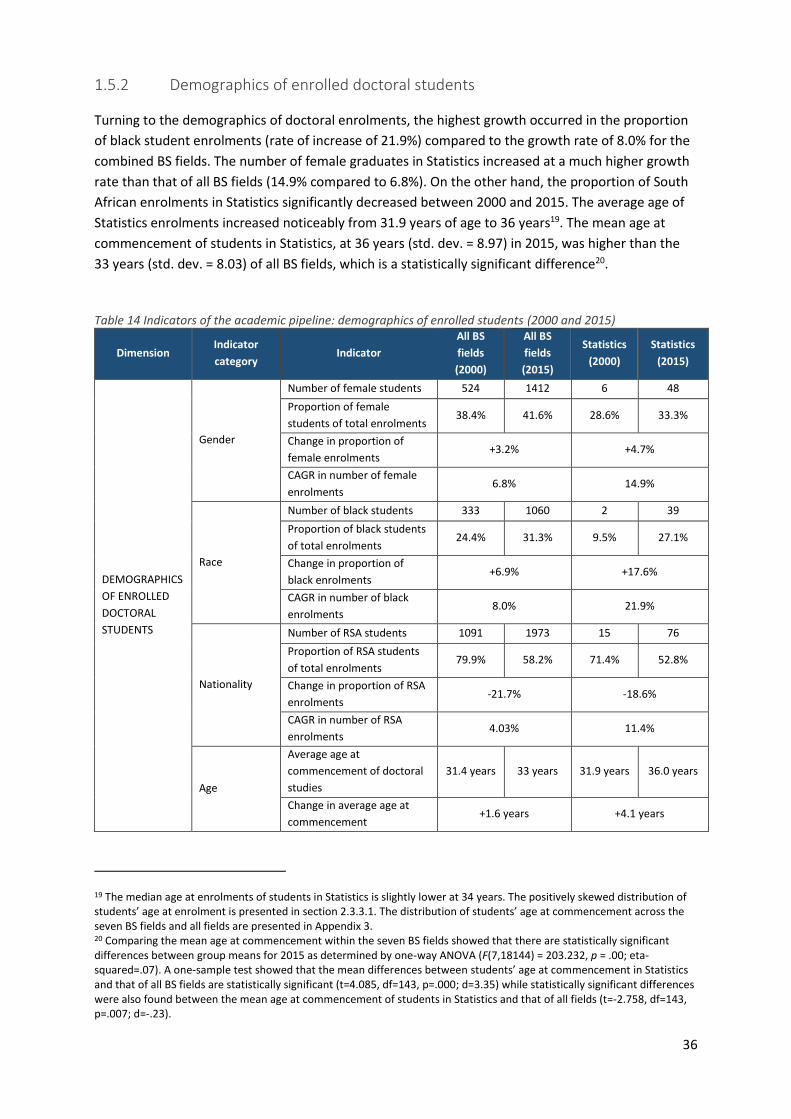
36
1.5.2 Demographics of enrolled doctoral students
Turning to the demographics of doctoral enrolments, the highest growth occurred in the proportion
of black student enrolments (rate of increase of 21.9%) compared to the growth rate of 8.0% for the
combined BS fields. The number of female graduates in Statistics increased at a much higher growth
rate than that of all BS fields (14.9% compared to 6.8%). On the other hand, the proportion of South
African enrolments in Statistics significantly decreased between 2000 and 2015. The average age of
Statistics enrolments increased noticeably from 31.9 years of age to 36 years19. The mean age at
commencement of students in Statistics, at 36 years (std. dev. = 8.97) in 2015, was higher than the
33 years (std. dev. = 8.03) of all BS fields, which is a statistically significant difference20.
Table 14 Indicators of the academic pipeline: demographics of enrolled students (2000 and 2015)
Dimension Indicator
category Indicator
All BS
fields
(2000)
All BS
fields
(2015)
Statistics
(2000)
Statistics
(2015)
DEMOGRAPHICS
OF ENROLLED
DOCTORAL
STUDENTS
Gender
Number of female students 524 1412 6 48
Proportion of female
students of total enrolments 38.4% 41.6% 28.6% 33.3%
Change in proportion of
female enrolments +3.2% +4.7%
CAGR in number of female
enrolments 6.8% 14.9%
Race
Number of black students 333 1060 2 39
Proportion of black students
of total enrolments 24.4% 31.3% 9.5% 27.1%
Change in proportion of
black enrolments +6.9% +17.6%
CAGR in number of black
enrolments 8.0% 21.9%
Nationality
Number of RSA students 1091 1973 15 76
Proportion of RSA students
of total enrolments 79.9% 58.2% 71.4% 52.8%
Change in proportion of RSA
enrolments -21.7% -18.6%
CAGR in number of RSA
enrolments 4.03% 11.4%
Age
Average age at
commencement of doctoral
studies
31.4 years 33 years 31.9 years 36.0 years
Change in average age at
commencement +1.6 years +4.1 years
19 The median age at enrolments of students in Statistics is slightly lower at 34 years. The positively skewed distribution of students’ age at enrolment is presented in section 2.3.3.1. The distribution of students’ age at commencement across the seven BS fields and all fields are presented in Appendix 3. 20 Comparing the mean age at commencement within the seven BS fields showed that there are statistically significant differences between group means for 2015 as determined by one-way ANOVA (F(7,18144) = 203.232, p = .00; eta-squared=.07). A one-sample test showed that the mean differences between students’ age at commencement in Statistics and that of all BS fields are statistically significant (t=4.085, df=143, p=.000; d=3.35) while statistically significant differences were also found between the mean age at commencement of students in Statistics and that of all fields (t=-2.758, df=143, p=.007; d=-.23).
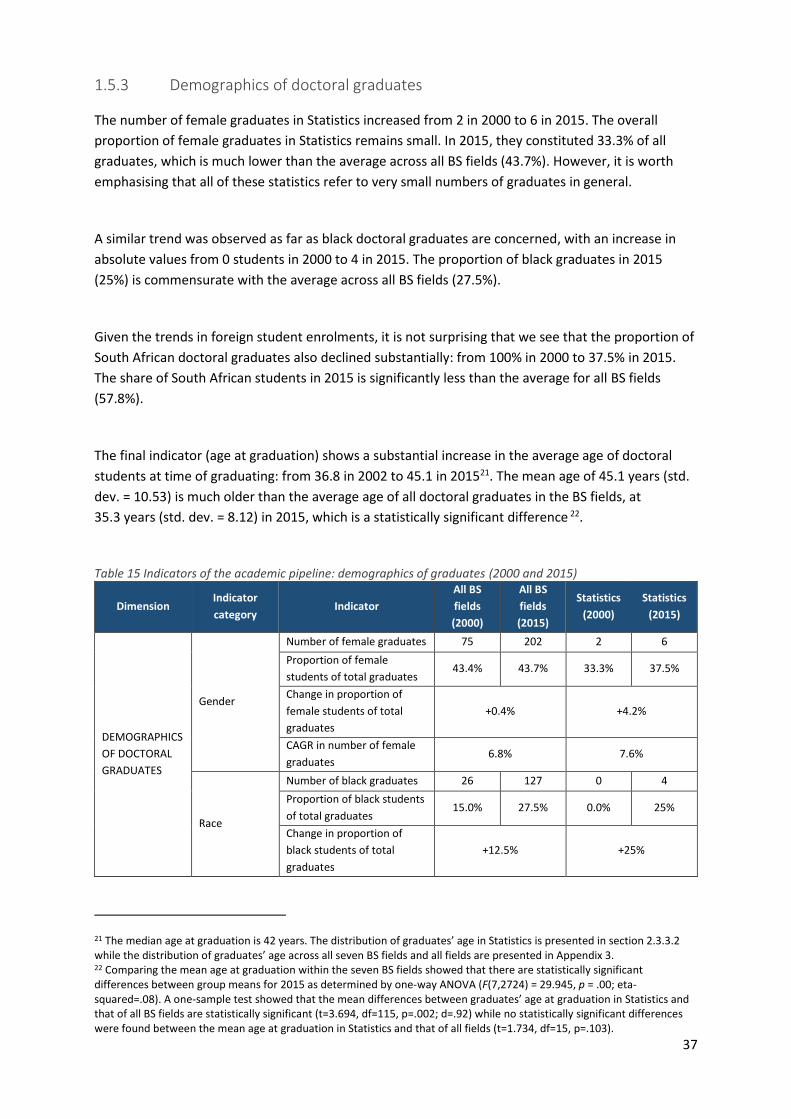
37
1.5.3 Demographics of doctoral graduates
The number of female graduates in Statistics increased from 2 in 2000 to 6 in 2015. The overall
proportion of female graduates in Statistics remains small. In 2015, they constituted 33.3% of all
graduates, which is much lower than the average across all BS fields (43.7%). However, it is worth
emphasising that all of these statistics refer to very small numbers of graduates in general.
A similar trend was observed as far as black doctoral graduates are concerned, with an increase in
absolute values from 0 students in 2000 to 4 in 2015. The proportion of black graduates in 2015
(25%) is commensurate with the average across all BS fields (27.5%).
Given the trends in foreign student enrolments, it is not surprising that we see that the proportion of
South African doctoral graduates also declined substantially: from 100% in 2000 to 37.5% in 2015.
The share of South African students in 2015 is significantly less than the average for all BS fields
(57.8%).
The final indicator (age at graduation) shows a substantial increase in the average age of doctoral
students at time of graduating: from 36.8 in 2002 to 45.1 in 201521. The mean age of 45.1 years (std.
dev. = 10.53) is much older than the average age of all doctoral graduates in the BS fields, at
35.3 years (std. dev. = 8.12) in 2015, which is a statistically significant difference 22.
Table 15 Indicators of the academic pipeline: demographics of graduates (2000 and 2015)
Dimension Indicator
category Indicator
All BS
fields
(2000)
All BS
fields
(2015)
Statistics
(2000)
Statistics
(2015)
DEMOGRAPHICS
OF DOCTORAL
GRADUATES
Gender
Number of female graduates 75 202 2 6
Proportion of female
students of total graduates 43.4% 43.7% 33.3% 37.5%
Change in proportion of
female students of total
graduates
+0.4% +4.2%
CAGR in number of female
graduates 6.8% 7.6%
Race
Number of black graduates 26 127 0 4
Proportion of black students
of total graduates 15.0% 27.5% 0.0% 25%
Change in proportion of
black students of total
graduates
+12.5% +25%
21 The median age at graduation is 42 years. The distribution of graduates’ age in Statistics is presented in section 2.3.3.2 while the distribution of graduates’ age across all seven BS fields and all fields are presented in Appendix 3. 22 Comparing the mean age at graduation within the seven BS fields showed that there are statistically significant differences between group means for 2015 as determined by one-way ANOVA (F(7,2724) = 29.945, p = .00; eta-squared=.08). A one-sample test showed that the mean differences between graduates’ age at graduation in Statistics and that of all BS fields are statistically significant (t=3.694, df=115, p=.002; d=.92) while no statistically significant differences were found between the mean age at graduation in Statistics and that of all fields (t=1.734, df=15, p=.103).
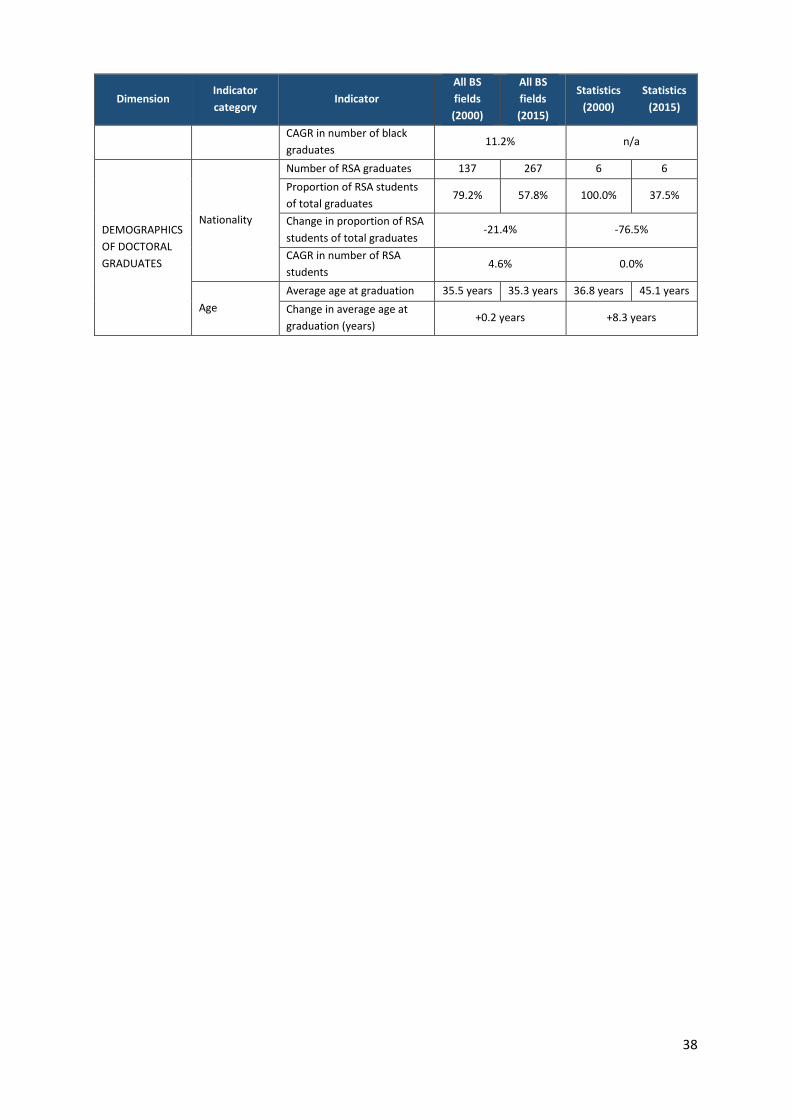
38
Dimension Indicator
category Indicator
All BS
fields
(2000)
All BS
fields
(2015)
Statistics
(2000)
Statistics
(2015)
CAGR in number of black
graduates 11.2% n/a
DEMOGRAPHICS
OF DOCTORAL
GRADUATES
Nationality
Number of RSA graduates 137 267 6 6
Proportion of RSA students
of total graduates 79.2% 57.8% 100.0% 37.5%
Change in proportion of RSA
students of total graduates -21.4% -76.5%
CAGR in number of RSA
students 4.6% 0.0%
Age
Average age at graduation 35.5 years 35.3 years 36.8 years 45.1 years
Change in average age at
graduation (years) +0.2 years +8.3 years
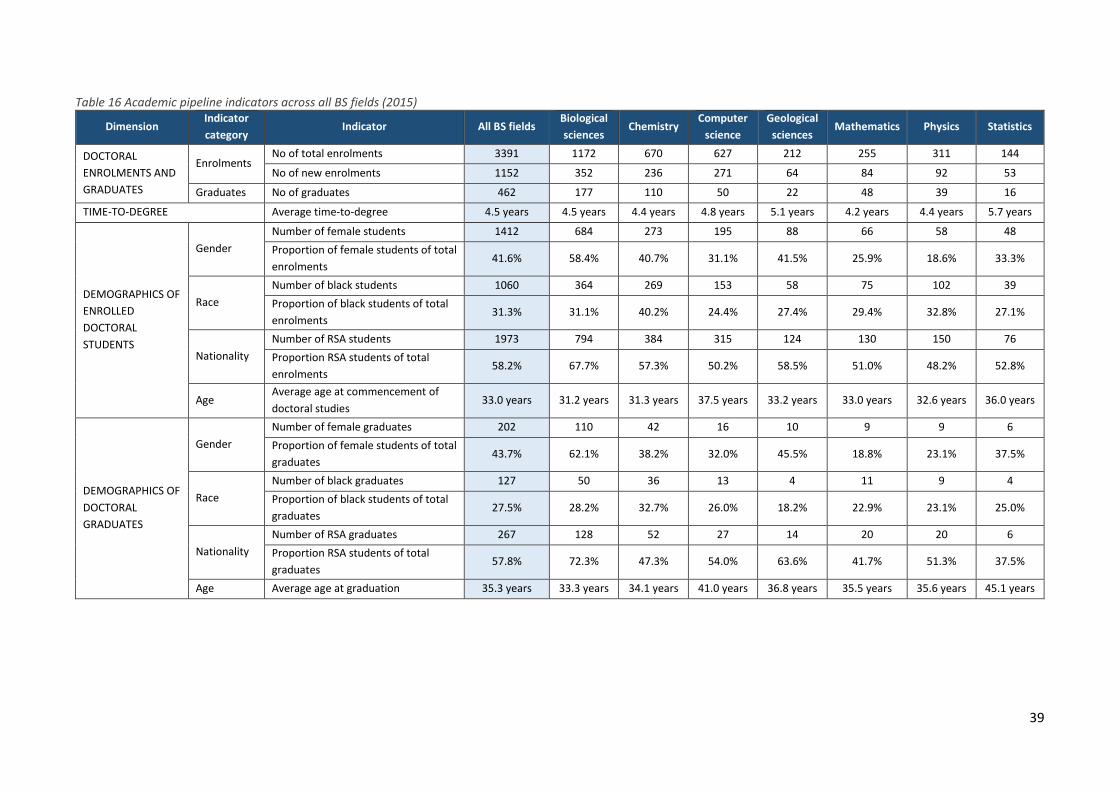
39
Table 16 Academic pipeline indicators across all BS fields (2015)
Dimension Indicator
category Indicator All BS fields
Biological
sciences Chemistry
Computer
science
Geological
sciences Mathematics Physics Statistics
DOCTORAL
ENROLMENTS AND
GRADUATES
Enrolments No of total enrolments 3391 1172 670 627 212 255 311 144
No of new enrolments 1152 352 236 271 64 84 92 53
Graduates No of graduates 462 177 110 50 22 48 39 16
TIME-TO-DEGREE Average time-to-degree 4.5 years 4.5 years 4.4 years 4.8 years 5.1 years 4.2 years 4.4 years 5.7 years
DEMOGRAPHICS OF
ENROLLED
DOCTORAL
STUDENTS
Gender
Number of female students 1412 684 273 195 88 66 58 48
Proportion of female students of total
enrolments 41.6% 58.4% 40.7% 31.1% 41.5% 25.9% 18.6% 33.3%
Race
Number of black students 1060 364 269 153 58 75 102 39
Proportion of black students of total
enrolments 31.3% 31.1% 40.2% 24.4% 27.4% 29.4% 32.8% 27.1%
Nationality
Number of RSA students 1973 794 384 315 124 130 150 76
Proportion RSA students of total
enrolments 58.2% 67.7% 57.3% 50.2% 58.5% 51.0% 48.2% 52.8%
Age Average age at commencement of
doctoral studies 33.0 years 31.2 years 31.3 years 37.5 years 33.2 years 33.0 years 32.6 years 36.0 years
DEMOGRAPHICS OF
DOCTORAL
GRADUATES
Gender
Number of female graduates 202 110 42 16 10 9 9 6
Proportion of female students of total
graduates 43.7% 62.1% 38.2% 32.0% 45.5% 18.8% 23.1% 37.5%
Race
Number of black graduates 127 50 36 13 4 11 9 4
Proportion of black students of total
graduates 27.5% 28.2% 32.7% 26.0% 18.2% 22.9% 23.1% 25.0%
Nationality
Number of RSA graduates 267 128 52 27 14 20 20 6
Proportion RSA students of total
graduates 57.8% 72.3% 47.3% 54.0% 63.6% 41.7% 51.3% 37.5%
Age Average age at graduation 35.3 years 33.3 years 34.1 years 41.0 years 36.8 years 35.5 years 35.6 years 45.1 years

40
1.6 Research
We have analysed the research ‘performance’ of Statistics in terms of the following dimensions:
1. research output and the RFS of Statistics;
2. trends in research collaboration;
3. the quality of research;
4. the citation visibility or impact of Statistics papers; and
5. the transformation of Statistics research.
In all of these instances, we compare the relative performance of Statistics with all other science
fields23.
1.6.1 Research output and field strength
The production of scientific papers in the field of Statistics is assessed in terms of three indicators:
the number of peer-reviewed papers published in journals in the CAWoS, the relative share of South
African Statistics papers of world output, and the RFS of Statistics as a field compared to other
scientific fields.
Statistics is one of the smallest research fields in South Africa even though it increased its output in
the CAWoS from 20 publications in 2005 to 67 in 2015. This has translated in an increased world
share, from 0.33% in 2005 to 0.67% in 2016. However, no change was observed in the world rank
position at 37th place over the same period.
There are differences between the research activities across fields of a single country (or other
entities such as a university) and the world as a whole. This can be due to differences in available
resources (geographic, infrastructure, or intellectual) or priorities. An indicator that is often used to
describe this difference is the activity index or, as we prefer to call it, the relative field strength (RFS).
It compares the distribution of the output of a country across fields to that of the world, resulting in a
single number, RFS, for every field. If RFS < 1, the country produces a smaller fraction of its total
output in that field than the world does. If RFS > 1, a larger fraction of the total output of the country
is in that field than the same fraction for the world. Table 17 shows that the South African RFS in
Statistics was 0.64 in 2005 and increased slightly to 0.72 in 2015.
23 As indicated above, as far as research performance is concerned, we compare Statistics with all science fields in the country combined and not only with the BS fields. This is necessary as it is not possible rigorously to delineate the ‘basic sciences’ from all other fields in the CAWoS subject categories (which forms the basis for the assignment of articles and journals to scientific fields).
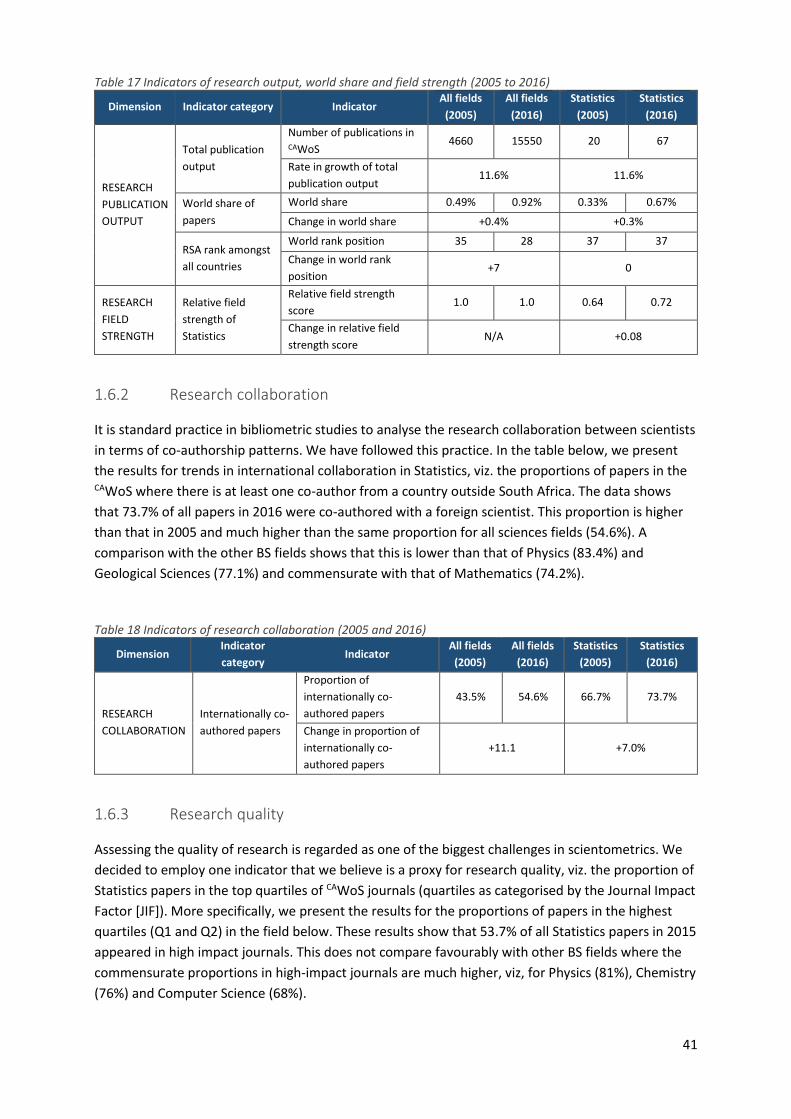
41
Table 17 Indicators of research output, world share and field strength (2005 to 2016)
Dimension Indicator category Indicator All fields
(2005)
All fields
(2016)
Statistics
(2005)
Statistics
(2016)
RESEARCH
PUBLICATION
OUTPUT
Total publication
output
Number of publications in CAWoS
4660 15550 20 67
Rate in growth of total
publication output 11.6% 11.6%
World share of
papers
World share 0.49% 0.92% 0.33% 0.67%
Change in world share +0.4% +0.3%
RSA rank amongst
all countries
World rank position 35 28 37 37
Change in world rank
position +7 0
RESEARCH
FIELD
STRENGTH
Relative field
strength of
Statistics
Relative field strength
score 1.0 1.0 0.64 0.72
Change in relative field
strength score N/A +0.08
1.6.2 Research collaboration
It is standard practice in bibliometric studies to analyse the research collaboration between scientists
in terms of co-authorship patterns. We have followed this practice. In the table below, we present
the results for trends in international collaboration in Statistics, viz. the proportions of papers in the CAWoS where there is at least one co-author from a country outside South Africa. The data shows
that 73.7% of all papers in 2016 were co-authored with a foreign scientist. This proportion is higher
than that in 2005 and much higher than the same proportion for all sciences fields (54.6%). A
comparison with the other BS fields shows that this is lower than that of Physics (83.4%) and
Geological Sciences (77.1%) and commensurate with that of Mathematics (74.2%).
Table 18 Indicators of research collaboration (2005 and 2016)
Dimension Indicator
category Indicator
All fields
(2005)
All fields
(2016)
Statistics
(2005)
Statistics
(2016)
RESEARCH
COLLABORATION
Internationally co-
authored papers
Proportion of
internationally co-
authored papers
43.5% 54.6% 66.7% 73.7%
Change in proportion of
internationally co-
authored papers
+11.1 +7.0%
1.6.3 Research quality
Assessing the quality of research is regarded as one of the biggest challenges in scientometrics. We
decided to employ one indicator that we believe is a proxy for research quality, viz. the proportion of
Statistics papers in the top quartiles of CAWoS journals (quartiles as categorised by the Journal Impact
Factor [JIF]). More specifically, we present the results for the proportions of papers in the highest
quartiles (Q1 and Q2) in the field below. These results show that 53.7% of all Statistics papers in 2015
appeared in high impact journals. This does not compare favourably with other BS fields where the
commensurate proportions in high-impact journals are much higher, viz, for Physics (81%), Chemistry
(76%) and Computer Science (68%).
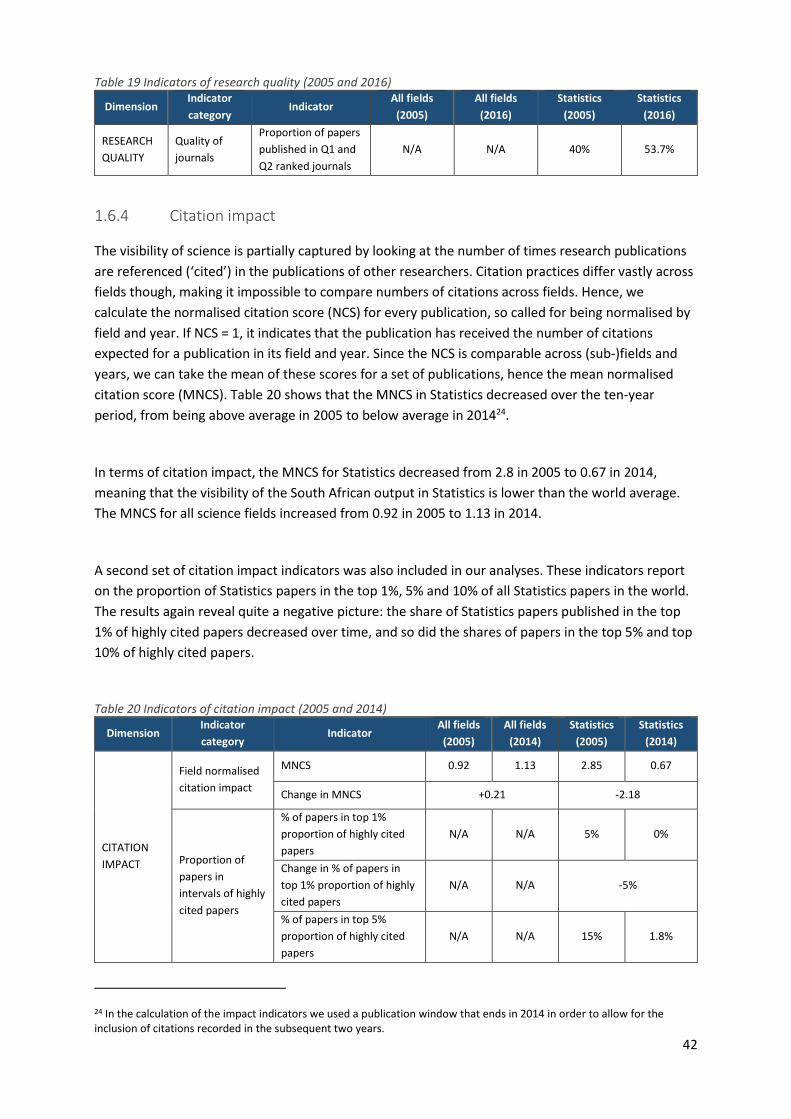
42
Table 19 Indicators of research quality (2005 and 2016)
Dimension Indicator
category Indicator
All fields
(2005)
All fields
(2016)
Statistics
(2005)
Statistics
(2016)
RESEARCH
QUALITY
Quality of
journals
Proportion of papers
published in Q1 and
Q2 ranked journals
N/A N/A 40% 53.7%
1.6.4 Citation impact
The visibility of science is partially captured by looking at the number of times research publications
are referenced (‘cited’) in the publications of other researchers. Citation practices differ vastly across
fields though, making it impossible to compare numbers of citations across fields. Hence, we
calculate the normalised citation score (NCS) for every publication, so called for being normalised by
field and year. If NCS = 1, it indicates that the publication has received the number of citations
expected for a publication in its field and year. Since the NCS is comparable across (sub-)fields and
years, we can take the mean of these scores for a set of publications, hence the mean normalised
citation score (MNCS). Table 20 shows that the MNCS in Statistics decreased over the ten-year
period, from being above average in 2005 to below average in 201424.
In terms of citation impact, the MNCS for Statistics decreased from 2.8 in 2005 to 0.67 in 2014,
meaning that the visibility of the South African output in Statistics is lower than the world average.
The MNCS for all science fields increased from 0.92 in 2005 to 1.13 in 2014.
A second set of citation impact indicators was also included in our analyses. These indicators report
on the proportion of Statistics papers in the top 1%, 5% and 10% of all Statistics papers in the world.
The results again reveal quite a negative picture: the share of Statistics papers published in the top
1% of highly cited papers decreased over time, and so did the shares of papers in the top 5% and top
10% of highly cited papers.
Table 20 Indicators of citation impact (2005 and 2014)
Dimension Indicator
category Indicator
All fields
(2005)
All fields
(2014)
Statistics
(2005)
Statistics
(2014)
CITATION
IMPACT
Field normalised
citation impact
MNCS 0.92 1.13 2.85 0.67
Change in MNCS +0.21 -2.18
Proportion of
papers in
intervals of highly
cited papers
% of papers in top 1%
proportion of highly cited
papers
N/A N/A 5% 0%
Change in % of papers in
top 1% proportion of highly
cited papers
N/A N/A -5%
% of papers in top 5%
proportion of highly cited
papers
N/A N/A 15% 1.8%
24 In the calculation of the impact indicators we used a publication window that ends in 2014 in order to allow for the inclusion of citations recorded in the subsequent two years.

43
Dimension Indicator
category Indicator
All fields
(2005)
All fields
(2014)
Statistics
(2005)
Statistics
(2014)
Change in % of papers in
top 5% proportion of highly
cited papers
N/A N/A -13.22%
% of papers in top 10%
proportion of highly cited
papers
N/A N/A 15.0% 5.4%
Change in % of papers in
top 10% proportion of
highly cited papers
N/A N/A -9.7%
1.6.5 Research transformation
We have selected three indicators to assess to what extent the field of Statistics research has
transformed over the 12-year period: the gender, race and age of Statistics authors as captured in SA
Knowledgebase (SAK). The contribution of female authors in Statistics decreased from 27.8% in 2005
to 22.7% in 2016, which means that the latter proportion is lower than the corresponding proportion
for all sciences fields (33.4% in 2016). The proportion of output by black authors increased over time
(from 8.3% in 2005 to 26.9% in 2016). Despite this increase, the proportion of black authors in
Statistics in 2016 remains much than the average across all science fields (29.9%). The share of
output by authors younger than 40 years increased significantly (although from a zero base) from 0%
in 2005 to 15.8% in 2016.
Table 21 Indicators of research transformation (2005 and 2016)
Dimension Indicator
category Indicator
All fields
(2005)
All fields
(2016)
Statistics
(2005)
Statistics
(2016)
RESEARCH
TRANSFORMATION 25
Gender
Proportion of papers
published by female
authors
30.5% 33.4% 27.8% 22.7%
Change in proportion of
papers published by
female authors
+2.8% -5.1%
Race
Proportion of papers
published by black
authors
15.8% 29.9% 8.3% 26.9%
Change in proportion of
papers published by black
authors
+14.1% +18.5%
Age
Proportion of papers
published by authors
under age of 40
2.7% 18.0% 0.0% 15.8%
Change in proportion of
papers published by
authors under age of 40
+15.4% +15.8%
25 Data is based on authorship counts. This means concretely that each individual author of a publication is coded as either male or female where the information is available.

44
Table 22 Research indicators: comparison across all BS fields (2014/2016)
Dimension Indicator category Indicator All fields Biological
Sciences Chemistry
Computer
Science
Geological
Sciences Mathematics Physics Statistics
Research
publication
output
Total publication output Number of papers in CAWoS 15 550 2195 1337 185 503 468 1308 67
World share of papers World share 0.92% 1.09% 0.61% 0.32% 1.34% 0.79% 0.87% 0.67%
SA rank amongst all
countries World rank position 28 30 38 51 31 41 36 37
Research field
strength Relative field strength
Relative field strength score (RFS
score) N/A 1.17 0.65 0.34 1.44 0.84 0.94 0.72
Citation
impact26
Field normalised citation
impact MNCS score (2014) 1.13 1.06 0.85 1.00 1.08 0.85 2.01 0.67
Proportion of papers in
intervals of highly cited
papers
% of papers in top 1%
proportion of highly cited
papers (2014)
N/A 1.1% 0.2% 0.7% 1.7% 0.6% 3.5% 0.0%
% of papers in top 5%
proportion of highly cited
papers (2014)
N/A 5.6% 2.2% 8.2% 4.4% 4.5% 11.6% 1.8%
% of papers in top 10%
proportion of highly cited
papers (2014)
N/A 11.0% 6.1% 13.4% 9.6% 7.1% 18.6% 5.4%
Research
collaboration
Internationally co-
authored papers
Proportion of internationally co-
authored papers 54.6% 61.0% 53.9% 57.9% 77.1% 74.2% 83.4% 73.7%
Research
quality
Quality of journals in
which papers appeared
Proportion of papers published
in Q1 and Q2 (JIF) ranked
journals
N/A 56.9% 75.6% 68.8% 68.0% 47.3% 81.4% 53.7%
Research
transformation
Trends in demographics:
Gender
Proportion of papers published
by female authors 33.4% 32.3% 23.6% 15.4% 20.4% 13.4% 16.0% 22.7%
Trends in demographics:
Race
Proportion of papers published
by black authors 29.9% 19.6% 51.1% 36.4% 14.4% 39.6% 52.4% 26.9%
Trends in demographics:
Age
Proportion of papers published
by authors younger than 40
years
18.0% 21.9% 24.7% 14.8% 24.9% 20.0% 25.6% 15.8%
26 Data for this indicator is from 2005 to 2014

45
Section 2: Tables and graphs

46
2.1 Investment in research
2.1.1 Comparison between Statistics and other BS fields
We first present comparative data: comparing the NRF investment in Statistics research with that of
the other BS fields (see Table 23 to
Table 27). These comparisons are related to the following variables:
1. the number of grant holders by year and field;
2. the total grant values by year and field;
3. the average grant values by year and field;
4. the number of grants and grant holders by gender and field; and
5. the number of grants and grant holders by race and field.
The subsequent sections focus specifically on Statistics.
Table 23 Number of grant holders by year by BS field (2002 to 2015)
Year
Biological
Sciences Chemistry
Computer
Science
Geological
Sciences Mathematics Physics Statistics
Number of
grant holders
Number of
grant holders
Number of
grant holders
Number of
grant holders
Number of
grant holders
Number of
grant holders
Number of
grant holders
2002 264 83 22 30 68 51 8
2003 258 85 30 34 60 47 11
2004 264 85 30 31 62 46 11
2005 298 89 30 33 58 44 8
2006 336 92 28 35 56 52 7
2007 322 89 25 31 61 59 7
2008 324 92 28 35 64 65 7
2009 497 193 50 53 96 136 16
2010 596 199 52 69 113 156 18
2011 543 198 50 62 107 157 21
2012 562 199 53 60 120 171 18
2013 614 203 64 63 131 185 21
2014 570 187 59 63 122 172 18
2015 573 181 52 65 119 164 31

47
Table 24 Amounts granted by BS field (2002 to 2015)
Year
Biological
Sciences Chemistry
Computer
Science
Geological
Sciences Mathematics Physics Statistics
Amount Amount Amount Amount Amount Amount Amount
2002 R88,531,336 R53,041,239 R7,854,352 R22,970,179 R10,437,748 R17,008,384 R2,382,122
2003 R99,899,439 R60,447,117 R11,204,167 R22,593,581 R13,255,778 R20,748,136 R2,514,214
2004 R115,539,840 R59,785,753 R14,101,646 R7,738,203 R16,470,709 R22,594,956 R3,615,118
2005 R122,952,015 R53,968,132 R13,218,574 R12,218,652 R16,360,318 R19,591,271 R2,331,101
2006 R141,414,290 R53,204,915 R11,757,280 R8,504,216 R15,877,770 R18,058,719 R1,887,185
2007 R110,559,346 R53,776,913 R10,112,398 R7,559,304 R10,403,210 R25,781,440 R2,261,788
2008 R101,524,352 R42,508,449 R19,600,635 R5,684,349 R18,405,067 R27,812,789 R1,674,359
2009 R233,866,541 R147,454,515 R18,465,041 R26,246,115 R33,918,859 R165,143,183 R2,712,658
2010 R276,623,942 R136,922,393 R19,674,119 R49,601,415 R32,856,675 R211,968,489 R2,189,758
2011 R247,627,313 R122,356,339 R16,965,007 R59,572,015 R27,856,384 R170,785,638 R2,121,680
2012 R230,288,759 R128,170,444 R16,151,719 R40,521,213 R32,770,248 R119,058,960 R1,706,186
2013 R224,880,955 R122,193,013 R15,366,051 R33,794,474 R35,826,269 R126,686,723 R1,919,528
2014 R296,458,402 R129,267,903 R20,306,703 R57,107,315 R50,605,714 R118,295,212 R2,390,117
2015 R272,256,643 R122,586,071 R18,151,689 R59,898,382 R47,528,249 R132,226,875 R6,302,644
Table 25 Average amount granted by BS field by year (2002 to 2015)
Year Biological Sciences Chemistry Computer Science Geological Sciences Mathematics Physics Statistics
Amount Amount Amount Amount Amount Amount Amount
2002 R335,346 R639,051 R357,016 R765,673 R153,496 R333,498 R297,765
2003 R387,207 R711,143 R373,472 R664,517 R220,930 R441,450 R228,565
2004 R437,651 R703,362 R470,055 R249,619 R265,657 R491,195 R328,647
2005 R412,591 R606,384 R440,619 R370,262 R282,074 R445,256 R291,388
2006 R420,876 R578,314 R419,903 R242,978 R283,532 R347,283 R269,598
2007 R343,352 R604,235 R404,496 R243,849 R170,544 R436,974 R323,113
2008 R313,347 R462,048 R700,023 R162,410 R287,579 R427,889 R239,194
2009 R470,556 R764,013 R369,301 R495,210 R353,321 R1,214,288 R169,541
2010 R464,134 R688,052 R378,348 R718,861 R290,767 R1,358,772 R121,653
2011 R456,036 R617,961 R339,300 R960,839 R260,340 R1,087,807 R101,032
2012 R409,766 R644,073 R304,749 R675,354 R273,085 R696,251 R94,788
2013 R366,256 R601,936 R240,095 R536,420 R273,483 R684,793 R91,406
2014 R520,102 R691,272 R344,181 R906,465 R414,801 R687,763 R132,784
2015 R475,142 R677,271 R349,071 R921,514 R399,397 R806,261 R203,311

48
Table 26 Grants by BS field and gender (2002 to 2015)
Fields Gender Number of
grants
Number of
grant holders Total value
Average amount
per grant
Average amount
per grant holder
Biological Sciences Male 6498 598 R1,881,835,382 R289,602 R3,146,882
Biological Sciences Female 3208 402 R680,587,791 R212,153 R1,693,004
Chemistry Male 2672 252 R1,084,364,582 R405,825 R4,303,034
Chemistry Female 716 110 R201,318,614 R281,171 R1,830,169
Computer Science Male 572 68 R182,009,645 R318,199 R2,676,612
Computer Science Female 221 34 R30,919,736 R139,908 R909,404
Geological Sciences Male 885 102 R389,845,635 R440,504 R3,822,016
Geological Sciences Female 102 17 R24,163,778 R236,900 R1,421,399
Mathematics Male 1452 167 R328,474,110 R226,222 R1,966,911
Mathematics Female 227 41 R34,098,888 R150,215 R831,680
Physics Male 2227 218 R1,128,216,553 R506,608 R5,175,305
Physics Female 291 36 R67,544,222 R232,111 R1,876,228
Statistics Male 184 29 R30,385,343 R165,138 R1,047,770
Statistics Female 77 17 R5,623,115 R,73,027 R330,771
Table 27 Grants by BS field and race (2002 to 2015)
Fields Race Number of
grants
Number of
grant holders Total value
Average amount
per grant
Average amount
per grant holder
Biological Sciences Black 835 154 R160,133,476 R191,777 R1,039,828
Biological Sciences Coloured 485 59 R80,325,647 R165,620 R1,361,452
Biological Sciences Indian 422 60 R79,195,635 R187,667 R1,319,927
Biological Sciences White 7964 727 R2,242,768,415 R281,613 R3,084,963
Chemistry Black 680 109 R263,586,582 R387,627 R2,418,226
Chemistry Coloured 228 27 R51,457,945 R225,693 R1,905,850
Chemistry Indian 228 29 R94,212,936 R413,215 R3,248,722
Chemistry White 2252 197 R876,425,733 R389,177 R4,448,862
Computer Science Black 30 11 R13,318,317 R443,944 R1,210,756
Computer Science Coloured 25 2 R23,723,957 R948,958 R11,861,979
Computer Science Indian 41 4 R8,417,416 R205,303 R2,104,354
Computer Science White 697 85 R167,469,691 R240,272 R1,970,232
Geological Sciences Black 17 7 R1,350,302 R79,430 R192,900
Geological Sciences Coloured 1 1 R92,725 R92,725 R92,725
Geological Sciences Indian 47 4 R11,173,813 R237,741 R2,793,453
Geological Sciences White 922 107 R401,392,573 R435,350 R3,751,332
Mathematics Black 221 47 R21,755,894 R98,443 R462,891
Mathematics Coloured 82 9 R18,171,897 R221,609 R2,019,100
Mathematics Indian 183 19 R74,409,621 R406,610 R3,916,296
Mathematics White 1193 133 R248,235,586 R208,077 R1,866,433
Physics Black 249 35 R94,476,712 R379,425 R2,699,335
Physics Coloured 137 16 R71,715,184 R523,468 R4,482,199
Physics Indian 196 21 R57,010,945 R290,872 R2,714,807
Physics White 1936 182 R972,557,934 R502,354 R5,343,725
Statistics Black 15 5 R2,358,552 R157,237 R471,710
Statistics Coloured 12 2 R918,048 R76,504 R459,024
Statistics Indian 17 4 R5,086,863 R299,227 R1,271,716
Statistics White 217 35 R27,644,995 R127,396 R789,857

49
2.1.2 Trends in the number of grant holders in Statistics
The results of our analysis of the trends in the numbers of grant holders are presented under the
following headings:
1. number of grant holders by university;
2. number of grant holders by funding category;
3. proportion of female grant holders by year;
4. proportion of black grant holders by year;
5. proportion of grant holders by age group;
6. comparison between number of grants allocated in 2002 and 2015 by race and gender; and
7. proportion of young grant holders (under 40 years) by year.
Table 28 Number of grant holders in Statistics (2002 to 2015) Institution Number of grant holders
University of Pretoria 10
Stellenbosch University 7
University of Cape Town 6
University of the Free State 5
North West University 4
University of the Witwatersrand 3
Nelson Mandela University 2
CSIR (Council for Scientific and Industrial Research) 2
Direct 1
SA Medical Research Council 1
South African Environmental Observation Network 1
University of Fort Hare 1
Vaal University of Technology 1
University of Johannesburg 1
University of KwaZulu-Natal 1
University of South Africa 1
Tshwane University of Technology 1
Table 29 Number of grant holders by funding category in Statistics (2002 to 2015) Funding category Number of grant holders
Incentive Funding for Rated Researchers 18
Academic Statistics Programme 16
Thuthuka 7
Unlocking the Future 5
Technology and Human Resources for Industry Programme (THRIP) 5
Economic Growth and International Competitiveness 5
Knowledge Interchange and Collaboration 3
Researchers in Training 3
Competitive Programme for Rated Researchers 2
NP - Support for Woman & Young Researchers 2
Indigenous Knowledge Systems 2
Competitive Support for Unrated Researchers 1
Development Grant for Kfd 1

50
International Science and Technology Agreements 1
Women in Research 1
Research Development Grants for Y-Rated Researchers 1
SA Research Chairs Initiative 1
Information and Communication Technology 1
Figure 18 Proportion of female grant holders in Statistics by year (2002 to 2015)
Figure 19 Proportion of black grant holders in Statistics by year (2002 to 2015)
0 2 2 1 1 1 1 4 4 8 6 10 7 12
8 9 9 7 6 6 6 12 14 13 12 11 11 19
0%
10%
20%
30%
40%
50%
60%
70%
80%
90%
100%
2002 2003 2004 2005 2006 2007 2008 2009 2010 2011 2012 2013 2014 2015
Female Male
1 3 1 0 0 0 0 3 3 4 4 6 6 6
7 8 10 8 7 7 7 13 15 17 14 15 12 25
0%
10%
20%
30%
40%
50%
60%
70%
80%
90%
100%
2002 2003 2004 2005 2006 2007 2008 2009 2010 2011 2012 2013 2014 2015
Black White

51
Figure 20 Number of grant holders in Statistics (2002 to 2015) by race and gender
Figure 21 Comparison between the number of grants allocated in 2002 and 2015, by race and gender
Figure 22 Proportion of young grant holders in statistics (under 40 years) by year (2002 to 2015)
1
4
1 12 2
13
22
0
5
10
15
20
25
AfricanFemale
African Male ColouredFemale
ColouredMale
Indian Female Indian Male White Female White Male
1
7
012345678
2002
1 1 1 2 1
9
16
0
5
10
15
20
2015
0 0 0 0 0 0 03 3
56
52
6
6 8 8 7 6 7 7
12 1516
1216
1622
0%
10%
20%
30%
40%
50%
60%
70%
80%
90%
100%
2002 2003 2004 2005 2006 2007 2008 2009 2010 2011 2012 2013 2014 2015
Younger than 40 40 and older

52
2.1.3 Grant values in Statistics
The results of our analysis of the trends in the grant values are presented under the following
headings:
1. number of grants and grant values, by year;
2. number of grants and grant values (2002 to 2015), by institution;
3. total grant value (2002 to 2015), by gender;
4. total grant value, by gender and year;
5. total grant value (2002 to 2015), by race;
6. total grant value, by race and year;
7. total grant value (2002 to 2015), by age category; and
8. total grant value, by age category and year.
Table 30 Number of grants and grant value in Statistics by year (2002 to 2015) Funding year Number of grants Grant value
2002 10 R2,382,122
2003 13 R2,514,214
2004 16 R3,615,118
2005 13 R2,331,101
2006 9 R1,887,185
2007 9 R2,261,788
2008 12 R1,674,359
2009 18 R2,712,658
2010 25 R2,189,758
2011 27 R2,121,680
2012 18 R1,706,186
2013 22 R1,919,528
2014 20 R2,390,117
2015 49 R6,302,644
Table 31 Number of grants and grant values in Statistics by institution (2002 to 2015) Institution No of grants Grant value
Stellenbosch University 72 R9,835,558
North West University 39 R9,593,486
University of Pretoria 40 R6,757,873
University of Cape Town 41 R2,423,170
University of the Witwatersrand 16 R2,330,812
University of the Free State 18 R2,012,146
Vaal University of Technology 6 R783,766
Nelson Mandela University 6 R610,040
CSIR (Council for Scientific and Industrial Research) 7 R522,642
University of South Africa 6 R259,803
University of Johannesburg 1 R205,112
SA Medical Research Council 1 R189,042
Tshwane University of Technology 2 R150,875
University of Fort Hare 3 R118,082
South African Environmental Observation Network 1 R107,189
University of KwaZulu-Natal 1 R100,000
Direct 1 R8,862

53
Figure 23 Total grant value in Statistics by gender (2002 to 2015)
Figure 24 Total grant value in Statistics (2002 to 2015) by gender and year
Figure 25 Total grant value in Statistics (2002 to 2015) by race
R30385 343 84%
R5623 115 16%
Male
Female
0%8% 10% 5% 0%
3%7% 8%
29%
36%
17%
26% 26% 28%
100% 92% 90% 95% 100% 97% 93% 92% 71% 64% 83% 74% 74% 72%
0%
10%
20%
30%
40%
50%
60%
70%
80%
90%
100%
2002 2003 2004 2005 2006 2007 2008 2009 2010 2011 2012 2013 2014 2015
Female Male
R27644 995 77%
R2358 552 7%
R918 048 2%
R5086 863 14%
White
African
Coloured
Indian
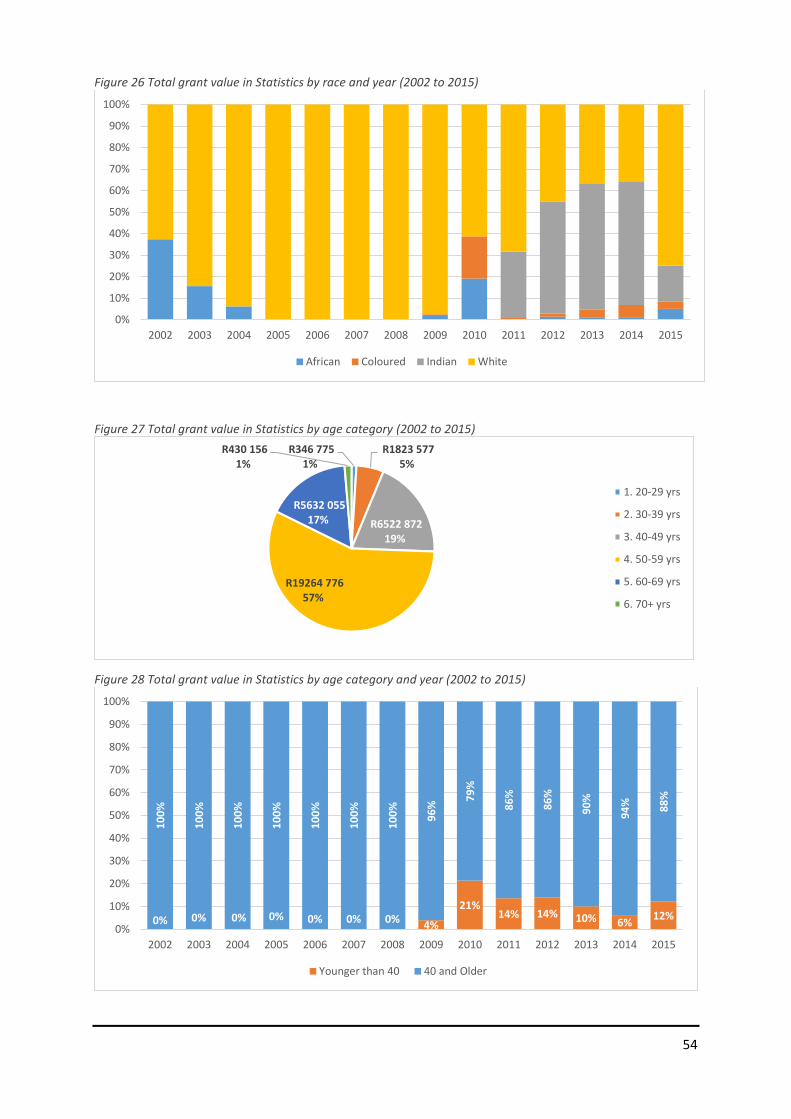
54
Figure 26 Total grant value in Statistics by race and year (2002 to 2015)
Figure 27 Total grant value in Statistics by age category (2002 to 2015)
Figure 28 Total grant value in Statistics by age category and year (2002 to 2015)
0%
10%
20%
30%
40%
50%
60%
70%
80%
90%
100%
2002 2003 2004 2005 2006 2007 2008 2009 2010 2011 2012 2013 2014 2015
African Coloured Indian White
R346 775 1%
R1823 577 5%
R6522 872 19%
R19264 776 57%
R5632 055 17%
R430 156 1%
1. 20-29 yrs
2. 30-39 yrs
3. 40-49 yrs
4. 50-59 yrs
5. 60-69 yrs
6. 70+ yrs
0% 0% 0% 0% 0% 0% 0%4%
21%14% 14% 10% 6%
12%
10
0%
10
0%
10
0%
10
0%
10
0%
10
0%
10
0%
96
%
79
%
86
%
86
%
90
%
94
% 88
%
0%
10%
20%
30%
40%
50%
60%
70%
80%
90%
100%
2002 2003 2004 2005 2006 2007 2008 2009 2010 2011 2012 2013 2014 2015
Younger than 40 40 and Older
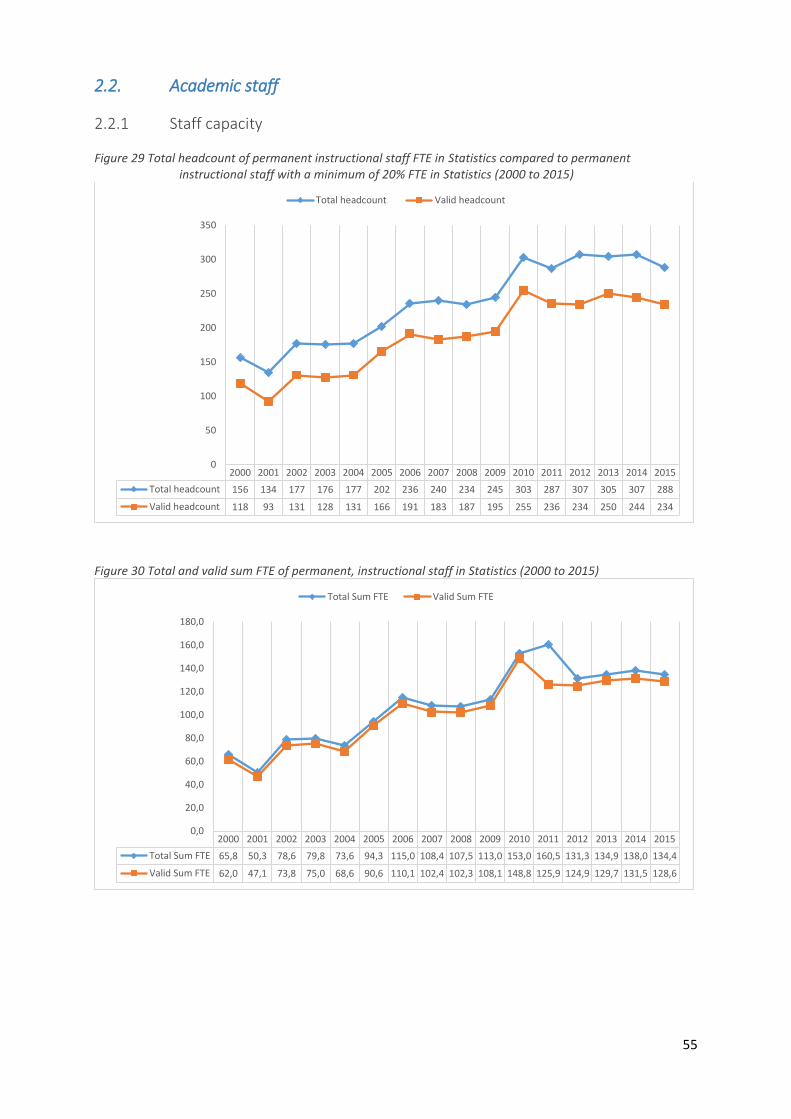
55
2.2. Academic staff
2.2.1 Staff capacity
Figure 29 Total headcount of permanent instructional staff FTE in Statistics compared to permanent instructional staff with a minimum of 20% FTE in Statistics (2000 to 2015)
Figure 30 Total and valid sum FTE of permanent, instructional staff in Statistics (2000 to 2015)
2000 2001 2002 2003 2004 2005 2006 2007 2008 2009 2010 2011 2012 2013 2014 2015
Total headcount 156 134 177 176 177 202 236 240 234 245 303 287 307 305 307 288
Valid headcount 118 93 131 128 131 166 191 183 187 195 255 236 234 250 244 234
0
50
100
150
200
250
300
350
Total headcount Valid headcount
2000 2001 2002 2003 2004 2005 2006 2007 2008 2009 2010 2011 2012 2013 2014 2015
Total Sum FTE 65,8 50,3 78,6 79,8 73,6 94,3 115,0 108,4 107,5 113,0 153,0 160,5 131,3 134,9 138,0 134,4
Valid Sum FTE 62,0 47,1 73,8 75,0 68,6 90,6 110,1 102,4 102,3 108,1 148,8 125,9 124,9 129,7 131,5 128,6
0,0
20,0
40,0
60,0
80,0
100,0
120,0
140,0
160,0
180,0
Total Sum FTE Valid Sum FTE

56
2.2.2 Staff diversity
Table 32 Demographic profile of permanent instructional staff FTE in Statistics by year (2000 to 2015)
Year Headcount Age Gender Race
< 35 years % ≥ 35 years % Female % Black27 %
2000 151 37 24.5 114 75.5 56 37.1 16 10.6
2001 126 34 27.0 92 73.0 44 34.9 27 21.4
2002 176 61 34.7 115 65.3 65 36.9 47 26.7
2003 175 57 32.6 118 67.4 64 36.6 51 29.1
2004 177 64 36.2 113 63.8 67 37.9 52 29.4
2005 200 64 32.0 136 68.0 71 35.5 57 28.5
2006 235 82 34.9 153 65.1 83 35.3 68 28.9
2007 239 73 30.5 166 69.5 82 34.3 73 30.5
2008 232 71 30.6 161 69.4 83 35.8 67 28.9
2009 240 67 27.9 173 72.1 88 36.7 74 30.8
2010 299 75 25.1 224 74.9 102 34.1 96 32.1
2011 278 74 26.6 204 73.4 102 36.7 78 28.1
2012 297 76 25.6 221 74.4 112 37.7 81 27.3
2013 298 73 24.5 225 75.5 107 35.9 71 23.8
2014 303 75 24.8 228 75.2 113 37.3 75 24.8
2015 284 68 23.9 216 76.1 111 39.1 83 29.2
Table 33 Number of permanent instructional staff with FTE in Statistics by nationality and year (2000 to 2015)
Year Headcount Nationality
ROA % ROW28 % South Africa %
2000 151 2 1.3 8 5.3 127 84.1
2001 126 5 4.0 4 3.2 117 92.9
2002 176 11 6.3 6 3.4 159 90.3
2003 175 8 4.6 6 3.4 161 92.0
2004 177 10 5.6 6 3.4 161 91.0
2005 200 7 3.5 3 1.5 189 94.5
2006 235 12 5.1 9 3.8 214 91.1
2007 239 20 8.4 8 3.3 210 87.9
2008 232 22 9.5 9 3.9 201 86.6
2009 240 21 8.8 7 2.9 211 87.9
2010 299 28 9.4 10 3.3 260 87.0
2011 278 26 9.4 11 4.0 228 82.0
2012 297 34 11.4 14 4.7 236 79.5
2013 298 50 16.8 15 5.0 222 74.5
2014 303 54 17.8 18 5.9 223 73.6
2015 284 52 18.3 11 3.9 210 73.9
27 This includes South African African, Coloured and Indian/Asian races. 28 Rest of World (ROW)
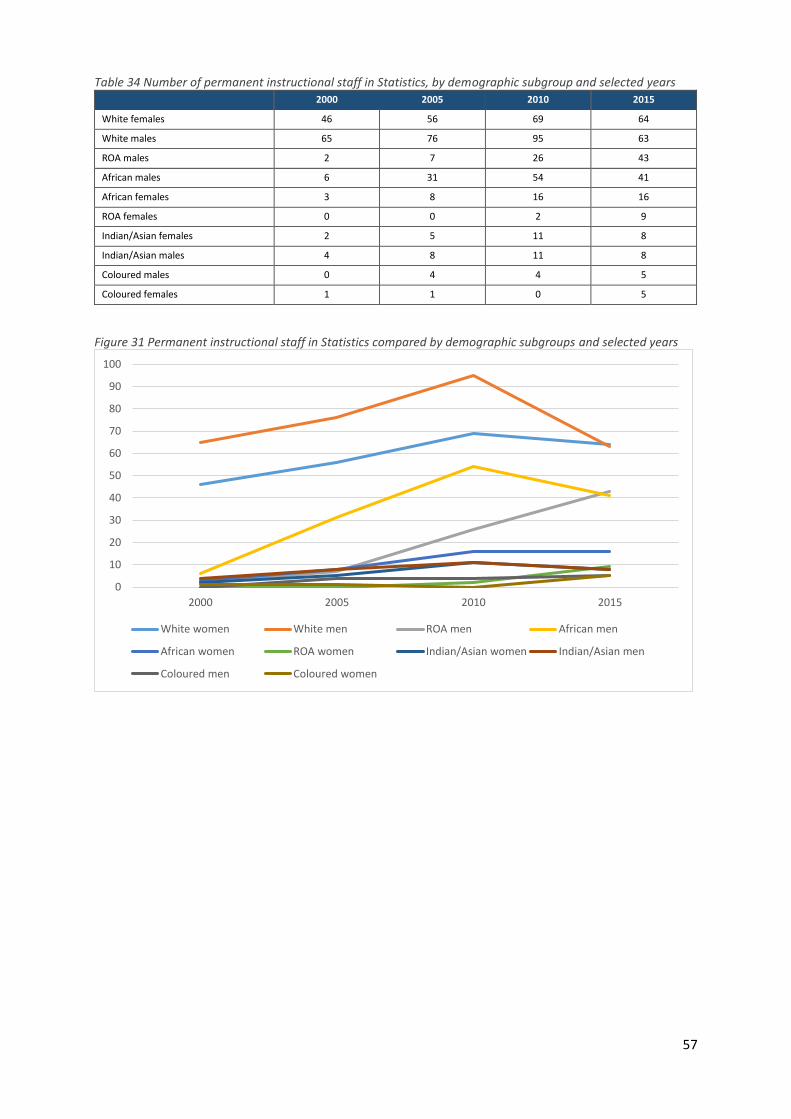
57
Table 34 Number of permanent instructional staff in Statistics, by demographic subgroup and selected years 2000 2005 2010 2015
White females 46 56 69 64
White males 65 76 95 63
ROA males 2 7 26 43
African males 6 31 54 41
African females 3 8 16 16
ROA females 0 0 2 9
Indian/Asian females 2 5 11 8
Indian/Asian males 4 8 11 8
Coloured males 0 4 4 5
Coloured females 1 1 0 5
Figure 31 Permanent instructional staff in Statistics compared by demographic subgroups and selected years
0
10
20
30
40
50
60
70
80
90
100
2000 2005 2010 2015
White women White men ROA men African men
African women ROA women Indian/Asian women Indian/Asian men
Coloured men Coloured women

58
Table 35 Number of permanent, instructional staff with FTE in Statistics by highest qualification and year (2000 to 2015)
Year Headcount29 Qualification
n PhD % Masters %
2000 151 51 33.8% 50 33.1
2001 126 38 30.2% 47 37.3
2002 176 59 33.5% 46 26.1
2003 175 51 29.1% 60 34.3
2004 177 42 23.7% 61 34.5
2005 200 63 31.5% 73 36.5
2006 235 85 36.2% 78 33.2
2007 239 79 33.1% 85 35.6
2008 232 81 34.9% 87 37.5
2009 240 81 33.8% 92 38.3
2010 299 133 44.5% 102 34.1
2011 278 114 41.0% 104 37.4
2012 297 124 41.8% 110 37.0
2013 298 122 40.9% 120 40.3
2014 303 138 45.5% 115 38.0
2015 284 117 41.2% 113 39.8
Table 36 Supervisory capacity of doctoral students in Statistics by year (2000 to 2015)
Year
At least 20%
instruction and at
least 20 % research
Qualification PhD enrolments
(total) Supervisory capacity
(number of students per
potential supervisor) n PhD % n
2000 39 20 51.3 21 0.41
2001 26 13 50.0 25 0.66
2002 25 15 60.0 26 0.44
2003 28 17 60.7 26 0.51
2004 28 7 25.0 29 0.69
2005 42 24 57.1 42 0.67
2006 75 41 54.7 73 0.86
2007 66 35 53.0 77 0.97
2008 80 40 50.0 60 0.74
2009 76 39 51.3 69 0.85
2010 113 69 61.1 82 0.62
2011 91 48 52.7 87 0.76
2012 95 47 49.5 92 0.74
2013 103 59 57.3 117 0.96
2014 96 55 57.3 133 0.96
2015 89 45 50.6 144 1.23
29 These counts do not include the approximation counts of the four universities with incomplete data.
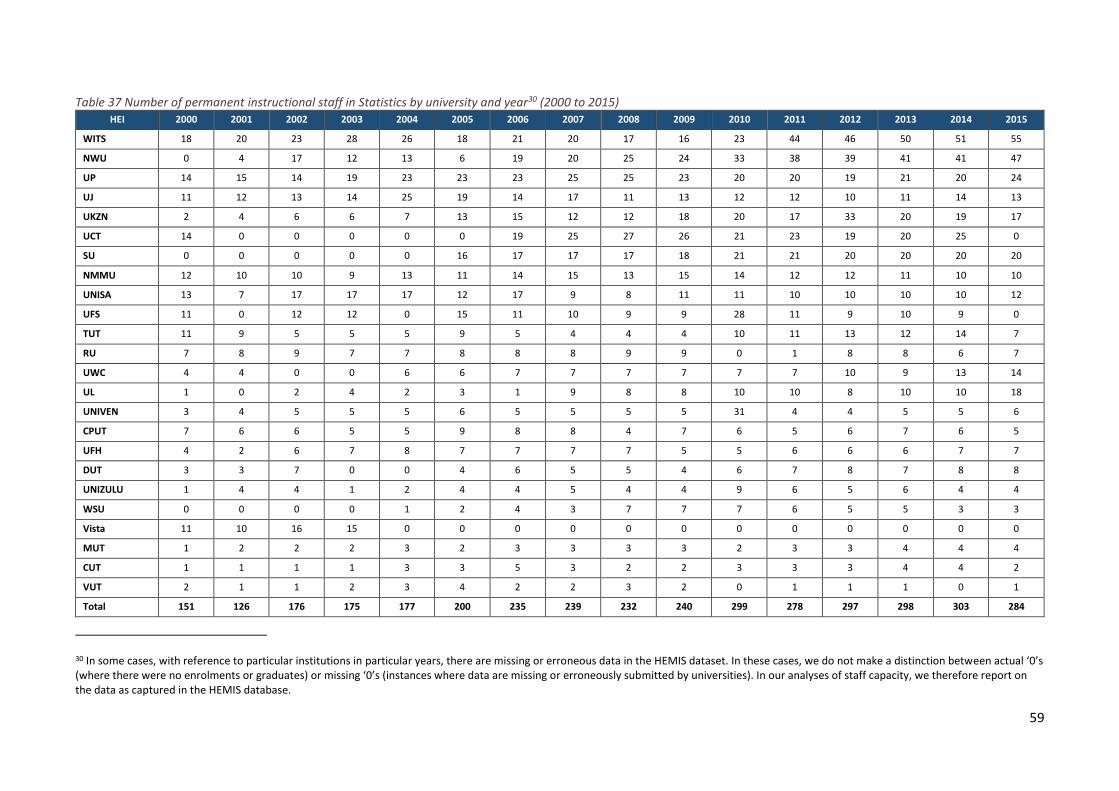
59
Table 37 Number of permanent instructional staff in Statistics by university and year30 (2000 to 2015) HEI 2000 2001 2002 2003 2004 2005 2006 2007 2008 2009 2010 2011 2012 2013 2014 2015
WITS 18 20 23 28 26 18 21 20 17 16 23 44 46 50 51 55
NWU 0 4 17 12 13 6 19 20 25 24 33 38 39 41 41 47
UP 14 15 14 19 23 23 23 25 25 23 20 20 19 21 20 24
UJ 11 12 13 14 25 19 14 17 11 13 12 12 10 11 14 13
UKZN 2 4 6 6 7 13 15 12 12 18 20 17 33 20 19 17
UCT 14 0 0 0 0 0 19 25 27 26 21 23 19 20 25 0
SU 0 0 0 0 0 16 17 17 17 18 21 21 20 20 20 20
NMMU 12 10 10 9 13 11 14 15 13 15 14 12 12 11 10 10
UNISA 13 7 17 17 17 12 17 9 8 11 11 10 10 10 10 12
UFS 11 0 12 12 0 15 11 10 9 9 28 11 9 10 9 0
TUT 11 9 5 5 5 9 5 4 4 4 10 11 13 12 14 7
RU 7 8 9 7 7 8 8 8 9 9 0 1 8 8 6 7
UWC 4 4 0 0 6 6 7 7 7 7 7 7 10 9 13 14
UL 1 0 2 4 2 3 1 9 8 8 10 10 8 10 10 18
UNIVEN 3 4 5 5 5 6 5 5 5 5 31 4 4 5 5 6
CPUT 7 6 6 5 5 9 8 8 4 7 6 5 6 7 6 5
UFH 4 2 6 7 8 7 7 7 7 5 5 6 6 6 7 7
DUT 3 3 7 0 0 4 6 5 5 4 6 7 8 7 8 8
UNIZULU 1 4 4 1 2 4 4 5 4 4 9 6 5 6 4 4
WSU 0 0 0 0 1 2 4 3 7 7 7 6 5 5 3 3
Vista 11 10 16 15 0 0 0 0 0 0 0 0 0 0 0 0
MUT 1 2 2 2 3 2 3 3 3 3 2 3 3 4 4 4
CUT 1 1 1 1 3 3 5 3 2 2 3 3 3 4 4 2
VUT 2 1 1 2 3 4 2 2 3 2 0 1 1 1 0 1
Total 151 126 176 175 177 200 235 239 232 240 299 278 297 298 303 284
30 In some cases, with reference to particular institutions in particular years, there are missing or erroneous data in the HEMIS dataset. In these cases, we do not make a distinction between actual ‘0’s (where there were no enrolments or graduates) or missing ‘0’s (instances where data are missing or erroneously submitted by universities). In our analyses of staff capacity, we therefore report on the data as captured in the HEMIS database.
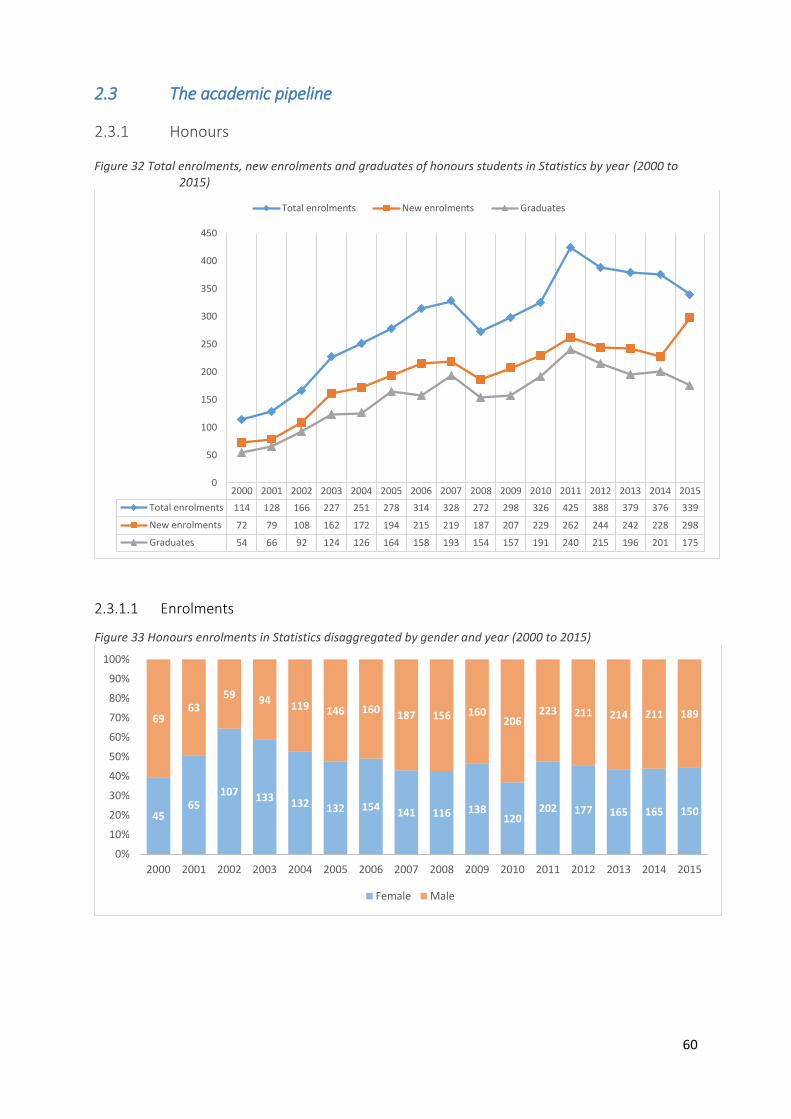
60
2.3 The academic pipeline
2.3.1 Honours
Figure 32 Total enrolments, new enrolments and graduates of honours students in Statistics by year (2000 to 2015)
2.3.1.1 Enrolments
Figure 33 Honours enrolments in Statistics disaggregated by gender and year (2000 to 2015)
2000 2001 2002 2003 2004 2005 2006 2007 2008 2009 2010 2011 2012 2013 2014 2015
Total enrolments 114 128 166 227 251 278 314 328 272 298 326 425 388 379 376 339
New enrolments 72 79 108 162 172 194 215 219 187 207 229 262 244 242 228 298
Graduates 54 66 92 124 126 164 158 193 154 157 191 240 215 196 201 175
0
50
100
150
200
250
300
350
400
450
Total enrolments New enrolments Graduates
4565
107 133 132 132 154 141 116 138120
202 177 165 165 150
6963
59 94 119 146 160 187 156 160206
223 211 214 211 189
0%
10%
20%
30%
40%
50%
60%
70%
80%
90%
100%
2000 2001 2002 2003 2004 2005 2006 2007 2008 2009 2010 2011 2012 2013 2014 2015
Female Male

61
Figure 34 Number of South African black honours enrolments in Statistics by year (2000 to 2015)
Figure 35 Honours enrolments in Statistics by race and year (2000 to 2015)
Figure 36 Average age at honours enrolment in years (2000 to 2015)
Figure 37 Honours enrolments in Statistics by nationality and year (2000 to 2015)
2000 2001 2002 2003 2004 2005 2006 2007 2008 2009 2010 2011 2012 2013 2014 2015
All South African black 58 72 91 120 125 131 161 159 151 150 196 241 228 257 248 225
0
50
100
150
200
250
300N
UM
BER
OF
ENR
OLM
ENTS
2000 2001 2002 2003 2004 2005 2006 2007 2008 2009 2010 2011 2012 2013 2014 2015
White 50 45 64 98 104 126 128 137 96 102 76 102 89 49 60 51
Other/Unknown 0 0 0 0 1 0 0 1 0 0 0 0 1 0 0 1
Indian/Asian 6 8 24 13 16 17 22 28 21 10 27 31 24 20 16 9
Coloured 5 6 8 8 5 6 9 14 12 13 9 9 9 6 11 15
Black African 47 58 59 99 104 108 130 117 118 127 160 201 195 231 221 201
0%
10%
20%
30%
40%
50%
60%
70%
80%
90%
100%
Black African Coloured Indian/Asian Other/Unknown White
2000 2001 2002 2003 2004 2005 2006 2007 2008 2009 2010 2011 2012 2013 2014 2015
Avg age at commencement 24,6 26,1 24,1 25,3 25,5 25,3 25,1 24,5 24,3 24,1 24,7 25,1 25,8 26,5 26,4 26,4
0,0
5,0
10,0
15,0
20,0
25,0
30,0
AG
E (Y
EAR
S)
2000 2001 2002 2003 2004 2005 2006 2007 2008 2009 2010 2011 2012 2013 2014 2015
ROW 0 4 4 1 6 1 4 2 3 6 3 8 4 5 3 2
ROA 5 5 7 8 15 20 21 28 21 38 47 73 64 63 65 58
RSA 108 117 155 218 230 257 289 297 247 252 272 343 318 306 308 277
0%20%40%60%80%
100%
RSA ROA ROW
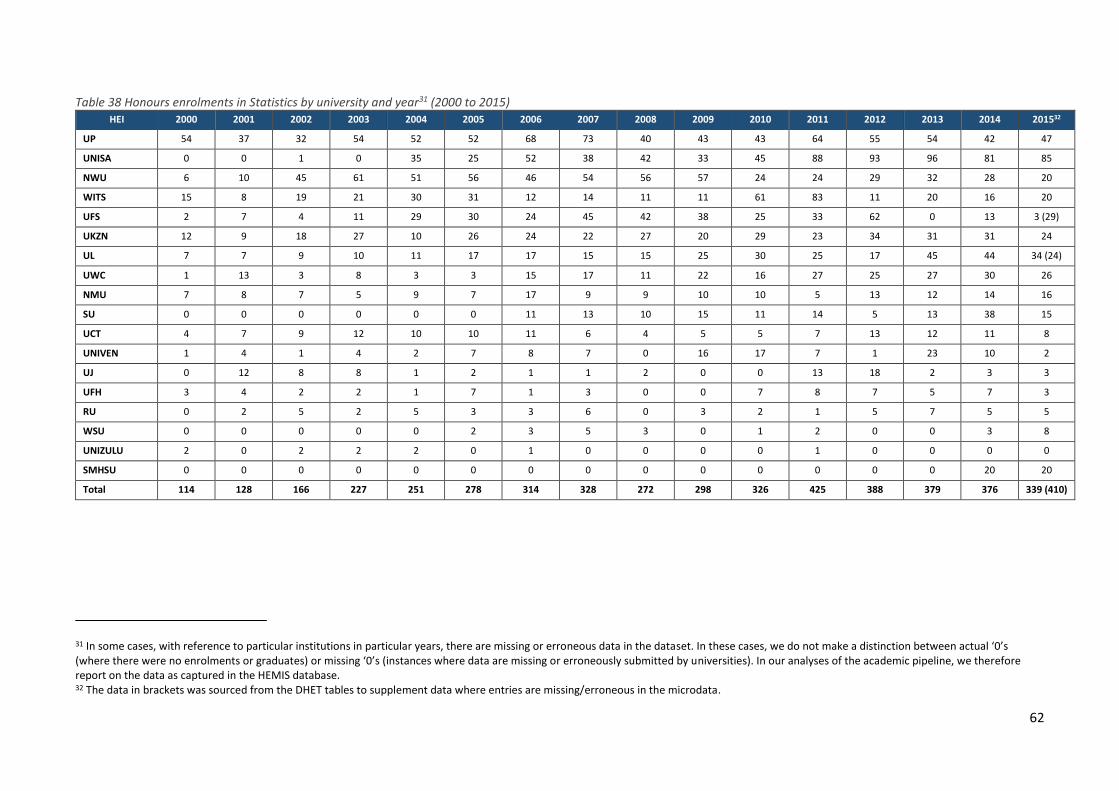
62
Table 38 Honours enrolments in Statistics by university and year31 (2000 to 2015) HEI 2000 2001 2002 2003 2004 2005 2006 2007 2008 2009 2010 2011 2012 2013 2014 201532
UP 54 37 32 54 52 52 68 73 40 43 43 64 55 54 42 47
UNISA 0 0 1 0 35 25 52 38 42 33 45 88 93 96 81 85
NWU 6 10 45 61 51 56 46 54 56 57 24 24 29 32 28 20
WITS 15 8 19 21 30 31 12 14 11 11 61 83 11 20 16 20
UFS 2 7 4 11 29 30 24 45 42 38 25 33 62 0 13 3 (29)
UKZN 12 9 18 27 10 26 24 22 27 20 29 23 34 31 31 24
UL 7 7 9 10 11 17 17 15 15 25 30 25 17 45 44 34 (24)
UWC 1 13 3 8 3 3 15 17 11 22 16 27 25 27 30 26
NMU 7 8 7 5 9 7 17 9 9 10 10 5 13 12 14 16
SU 0 0 0 0 0 0 11 13 10 15 11 14 5 13 38 15
UCT 4 7 9 12 10 10 11 6 4 5 5 7 13 12 11 8
UNIVEN 1 4 1 4 2 7 8 7 0 16 17 7 1 23 10 2
UJ 0 12 8 8 1 2 1 1 2 0 0 13 18 2 3 3
UFH 3 4 2 2 1 7 1 3 0 0 7 8 7 5 7 3
RU 0 2 5 2 5 3 3 6 0 3 2 1 5 7 5 5
WSU 0 0 0 0 0 2 3 5 3 0 1 2 0 0 3 8
UNIZULU 2 0 2 2 2 0 1 0 0 0 0 1 0 0 0 0
SMHSU 0 0 0 0 0 0 0 0 0 0 0 0 0 0 20 20
Total 114 128 166 227 251 278 314 328 272 298 326 425 388 379 376 339 (410)
31 In some cases, with reference to particular institutions in particular years, there are missing or erroneous data in the dataset. In these cases, we do not make a distinction between actual ‘0’s (where there were no enrolments or graduates) or missing ‘0’s (instances where data are missing or erroneously submitted by universities). In our analyses of the academic pipeline, we therefore report on the data as captured in the HEMIS database. 32 The data in brackets was sourced from the DHET tables to supplement data where entries are missing/erroneous in the microdata.
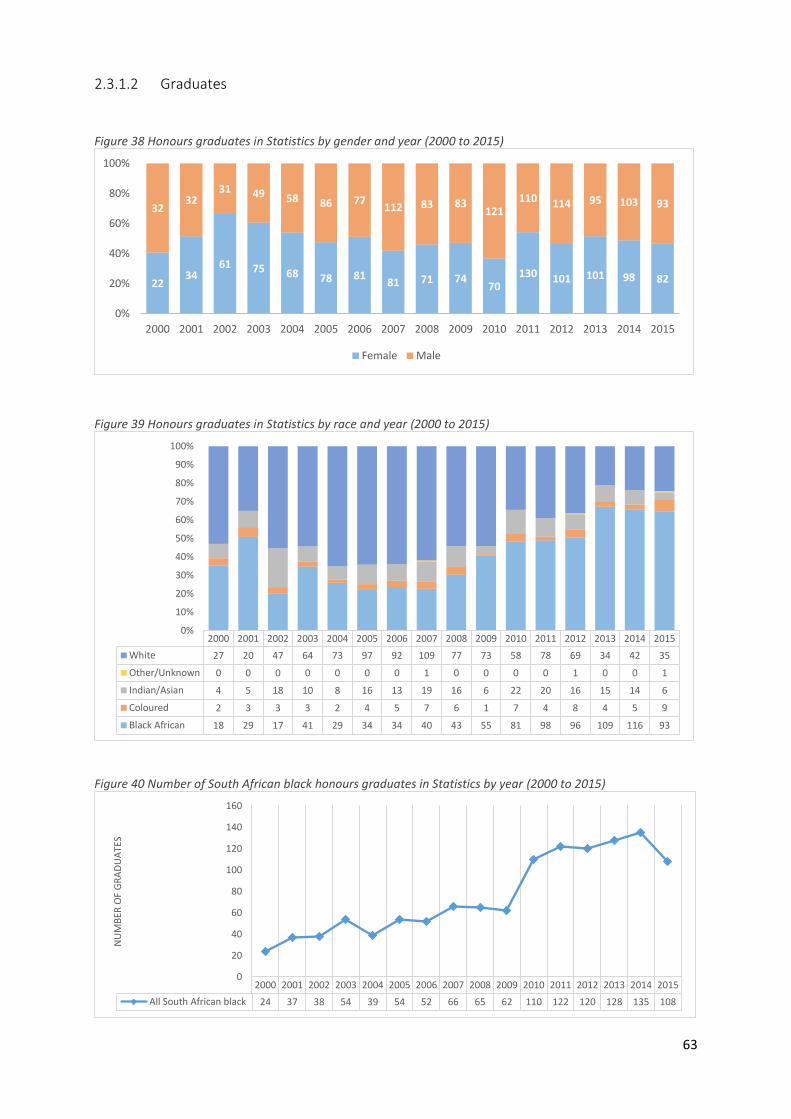
63
2.3.1.2 Graduates
Figure 38 Honours graduates in Statistics by gender and year (2000 to 2015)
Figure 39 Honours graduates in Statistics by race and year (2000 to 2015)
Figure 40 Number of South African black honours graduates in Statistics by year (2000 to 2015)
2234
61 75 68 78 8181 71 74
70130 101 101 98 82
3232
31 49 58 86 77112 83 83
121110 114 95 103 93
0%
20%
40%
60%
80%
100%
2000 2001 2002 2003 2004 2005 2006 2007 2008 2009 2010 2011 2012 2013 2014 2015
Female Male
2000 2001 2002 2003 2004 2005 2006 2007 2008 2009 2010 2011 2012 2013 2014 2015
White 27 20 47 64 73 97 92 109 77 73 58 78 69 34 42 35
Other/Unknown 0 0 0 0 0 0 0 1 0 0 0 0 1 0 0 1
Indian/Asian 4 5 18 10 8 16 13 19 16 6 22 20 16 15 14 6
Coloured 2 3 3 3 2 4 5 7 6 1 7 4 8 4 5 9
Black African 18 29 17 41 29 34 34 40 43 55 81 98 96 109 116 93
0%
10%
20%
30%
40%
50%
60%
70%
80%
90%
100%
2000 2001 2002 2003 2004 2005 2006 2007 2008 2009 2010 2011 2012 2013 2014 2015
All South African black 24 37 38 54 39 54 52 66 65 62 110 122 120 128 135 108
0
20
40
60
80
100
120
140
160
NU
MB
ER O
F G
RA
DU
ATE
S

64
Figure 41 Honours graduates in Statistics by nationality and year (2000 to 2015)
Figure 42 Average age at graduation of honours graduates in Statistics by year (2000 to 2015)
2000 2001 2002 2003 2004 2005 2006 2007 2008 2009 2010 2011 2012 2013 2014 2015
ROW 0 4 3 1 4 1 4 1 2 4 1 7 1 3 2 2
ROA 2 3 4 5 10 12 10 15 9 16 20 33 24 28 22 27
RSA 51 57 85 118 112 151 144 176 142 135 168 200 190 162 177 144
0%
10%
20%
30%
40%
50%
60%
70%
80%
90%
100%
RSA ROA ROW
2000 2001 2002 2003 2004 2005 2006 2007 2008 2009 2010 2011 2012 2013 2014 2015
Avg age at graduation 24,7 26,3 24,3 26,0 25,2 25,3 24,7 25,1 24,9 25,4 25,0 25,5 25,4 25,7 25,9 24,5
0,0
5,0
10,0
15,0
20,0
25,0
30,0
AG
E (Y
EAR
S)
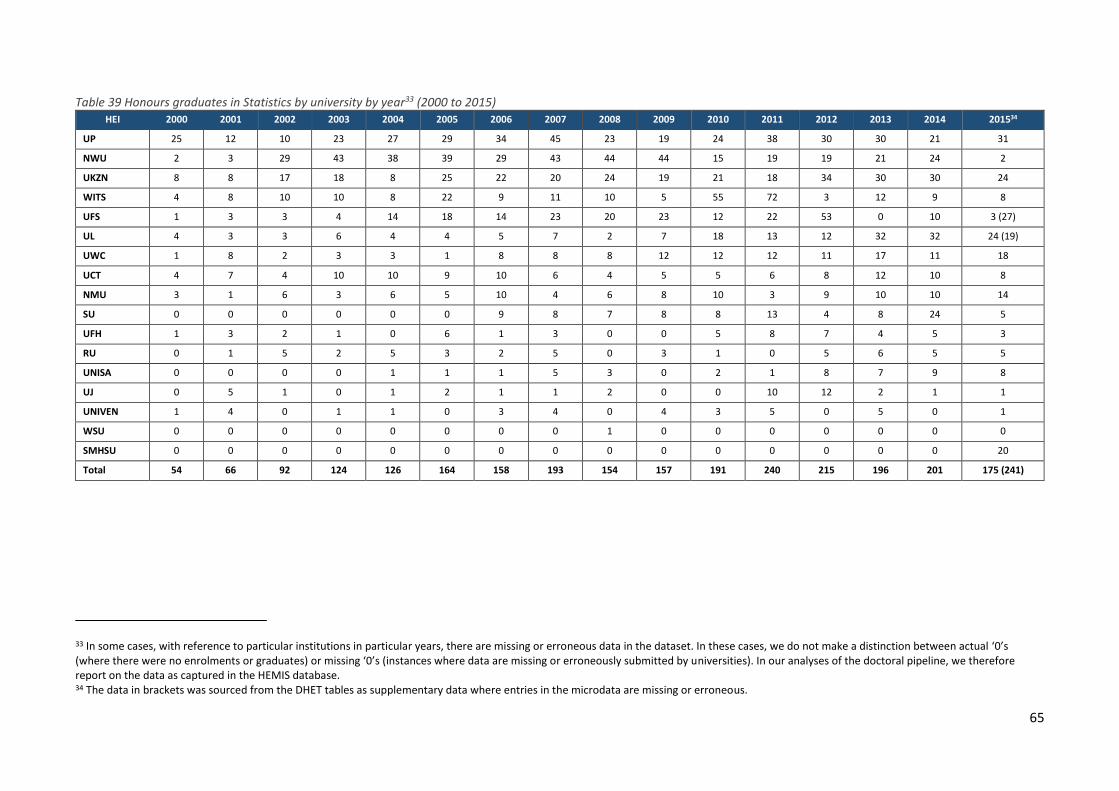
65
Table 39 Honours graduates in Statistics by university by year33 (2000 to 2015) HEI 2000 2001 2002 2003 2004 2005 2006 2007 2008 2009 2010 2011 2012 2013 2014 201534
UP 25 12 10 23 27 29 34 45 23 19 24 38 30 30 21 31
NWU 2 3 29 43 38 39 29 43 44 44 15 19 19 21 24 2
UKZN 8 8 17 18 8 25 22 20 24 19 21 18 34 30 30 24
WITS 4 8 10 10 8 22 9 11 10 5 55 72 3 12 9 8
UFS 1 3 3 4 14 18 14 23 20 23 12 22 53 0 10 3 (27)
UL 4 3 3 6 4 4 5 7 2 7 18 13 12 32 32 24 (19)
UWC 1 8 2 3 3 1 8 8 8 12 12 12 11 17 11 18
UCT 4 7 4 10 10 9 10 6 4 5 5 6 8 12 10 8
NMU 3 1 6 3 6 5 10 4 6 8 10 3 9 10 10 14
SU 0 0 0 0 0 0 9 8 7 8 8 13 4 8 24 5
UFH 1 3 2 1 0 6 1 3 0 0 5 8 7 4 5 3
RU 0 1 5 2 5 3 2 5 0 3 1 0 5 6 5 5
UNISA 0 0 0 0 1 1 1 5 3 0 2 1 8 7 9 8
UJ 0 5 1 0 1 2 1 1 2 0 0 10 12 2 1 1
UNIVEN 1 4 0 1 1 0 3 4 0 4 3 5 0 5 0 1
WSU 0 0 0 0 0 0 0 0 1 0 0 0 0 0 0 0
SMHSU 0 0 0 0 0 0 0 0 0 0 0 0 0 0 0 20
Total 54 66 92 124 126 164 158 193 154 157 191 240 215 196 201 175 (241)
33 In some cases, with reference to particular institutions in particular years, there are missing or erroneous data in the dataset. In these cases, we do not make a distinction between actual ‘0’s (where there were no enrolments or graduates) or missing ‘0’s (instances where data are missing or erroneously submitted by universities). In our analyses of the doctoral pipeline, we therefore report on the data as captured in the HEMIS database. 34 The data in brackets was sourced from the DHET tables as supplementary data where entries in the microdata are missing or erroneous.

66
Table 40 Completion rates of honours students in Statistics by year35 (2000 to 2014)
First
enrolments
Total
graduates
after 1 years
1-year
completion
rates (%)
Total
graduates
after 2 years
2-year
completion
rates (%)
Total
graduates
after 3 years
3-year
completion
rates (%)
2000 72 34 47.2 49 68.1 51 70.8
2001 79 43 54.4 59 74.7 62 78.5
2002 108 72 66.7 90 83.3 93 86.1
2003 162 99 61.1 124 76.5 136 84.0
2004 172 93 54.1 115 66.9 121 70.3
2005 194 126 64.9 148 76.3 155 79.9
2006 215 128 59.5 172 80.0 199 92.6
2007 219 129 58.9 145 66.2 149 68.0
2008 187 106 56.7 125 66.8 134 71.7
2009 207 110 53.1 136 65.7 145 70.0
2010 229 100 43.7 143 62.4 153 66.8
2011 262 131 50.0 152 58.0 164 62.6
2012 244 175 71.7 200 82.0 208 85.2
2013 242 156 64.5 179 74.0 185 76.4
2014 228 165 72.4 176 77.2
Figure 43 Mean time-to-degree of honours graduates in Statistics by year (2000 to 2015)
35 See Appendix 3 (3.3.1.1) for the calculation of completion rates.
2000 2001 2002 2003 2004 2005 2006 2007 2008 2009 2010 2011 2012 2013 2014 2015
Mean TTD 1,4 1,5 1,3 1,3 2,2 1,4 1,3 1,6 1,6 1,7 2,2 2,2 1,4 1,4 1,4 1,2
0,0
0,5
1,0
1,5
2,0
2,5
TTD
(YE
AR
S)

67
2.3.2 Masters
Figure 44 Total enrolments, new enrolments and graduates of master’s students in Statistics by year (2000 to 2015)
2.3.2.1 Enrolments
Figure 45 Master’s enrolments in Statistics disaggregated by gender and year (2000 to 2015)
Figure 46 Number of all South African black master’s enrolments in Statistics by year (2000 to 2015)
2000 2001 2002 2003 2004 2005 2006 2007 2008 2009 2010 2011 2012 2013 2014 2015
Total enrolments 59 68 118 214 126 141 229 196 207 165 204 233 220 231 244 240
New enrolments 28 29 60 115 45 54 65 53 60 48 78 77 76 77 66 116
Graduates 17 8 12 24 35 38 53 41 59 35 51 60 48 40 63 57
0
50
100
150
200
250
300
Total enrolments New enrolments Graduates
23 32 61 128 66 7794 70 63 63 72 85 86 88 96 100
36 36 57 86 60 64135 126 144 102 132 148 134 143 148 140
0%
20%
40%
60%
80%
100%
2000 2001 2002 2003 2004 2005 2006 2007 2008 2009 2010 2011 2012 2013 2014 2015
Female Male
2000 2001 2002 2003 2004 2005 2006 2007 2008 2009 2010 2011 2012 2013 2014 2015
All South African black 34 40 64 131 64 55 84 69 65 58 77 101 98 125 133 140
0
20
40
60
80
100
120
140
160
NU
MB
EF O
F EN
RO
LMEN
TS
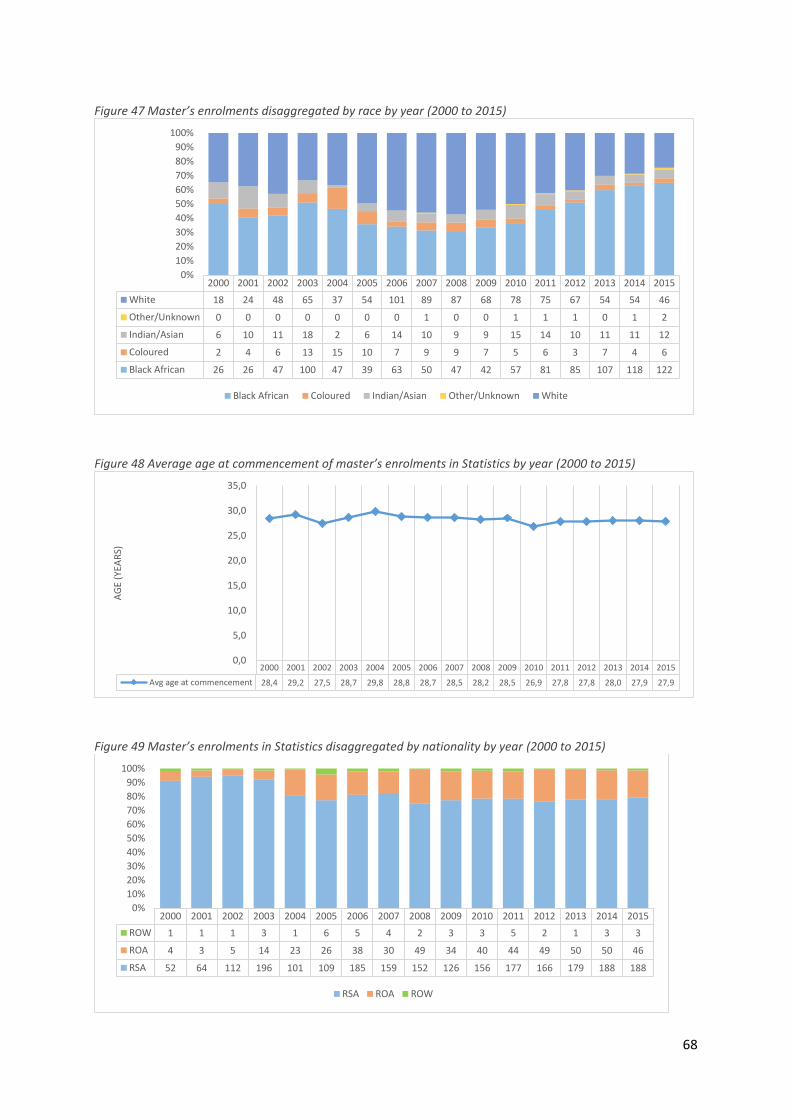
68
Figure 47 Master’s enrolments disaggregated by race by year (2000 to 2015)
Figure 48 Average age at commencement of master’s enrolments in Statistics by year (2000 to 2015)
Figure 49 Master’s enrolments in Statistics disaggregated by nationality by year (2000 to 2015)
2000 2001 2002 2003 2004 2005 2006 2007 2008 2009 2010 2011 2012 2013 2014 2015
White 18 24 48 65 37 54 101 89 87 68 78 75 67 54 54 46
Other/Unknown 0 0 0 0 0 0 0 1 0 0 1 1 1 0 1 2
Indian/Asian 6 10 11 18 2 6 14 10 9 9 15 14 10 11 11 12
Coloured 2 4 6 13 15 10 7 9 9 7 5 6 3 7 4 6
Black African 26 26 47 100 47 39 63 50 47 42 57 81 85 107 118 122
0%
10%
20%
30%
40%
50%
60%
70%
80%
90%
100%
Black African Coloured Indian/Asian Other/Unknown White
2000 2001 2002 2003 2004 2005 2006 2007 2008 2009 2010 2011 2012 2013 2014 2015
Avg age at commencement 28,4 29,2 27,5 28,7 29,8 28,8 28,7 28,5 28,2 28,5 26,9 27,8 27,8 28,0 27,9 27,9
0,0
5,0
10,0
15,0
20,0
25,0
30,0
35,0
AG
E (Y
EAR
S)
2000 2001 2002 2003 2004 2005 2006 2007 2008 2009 2010 2011 2012 2013 2014 2015
ROW 1 1 1 3 1 6 5 4 2 3 3 5 2 1 3 3
ROA 4 3 5 14 23 26 38 30 49 34 40 44 49 50 50 46
RSA 52 64 112 196 101 109 185 159 152 126 156 177 166 179 188 188
0%
10%
20%
30%
40%
50%
60%
70%
80%
90%
100%
RSA ROA ROW

69
Table 41 Master’s enrolments in Statistics by university by year36 (2000 to 2015) HEI 2000 2001 2002 2003 2004 2005 2006 2007 2008 2009 2010 2011 2012 2013 2014 201537
UP 13 9 16 19 21 27 32 35 43 27 38 38 38 45 41 34
UKZN 18 31 32 69 0 11 17 3 11 8 21 27 31 32 34 32
UWC 1 3 4 27 38 22 20 19 38 29 19 15 9 14 15 12
WITS 0 0 0 0 4 0 64 53 38 27 25 32 0 4 9 16
UCT 7 10 14 16 21 27 18 18 5 4 8 12 18 21 26 32
UFS 11 7 18 32 14 21 23 12 11 3 22 22 24 0 0 0 (12)
UL 0 4 6 6 7 6 6 6 12 17 14 22 29 38 38 17
SU 0 0 0 0 0 0 23 29 24 31 15 15 13 11 14 14
NWU 5 0 20 31 5 7 8 3 5 6 4 5 8 9 13 16
UNISA 0 0 0 0 4 10 7 7 4 1 6 10 20 20 21 18
NMU 2 1 2 6 6 5 4 6 10 6 10 14 8 8 10 11
RU 0 3 3 5 3 4 6 4 5 6 5 2 0 5 7 4
UFH 0 0 0 0 0 0 0 0 0 0 11 9 7 13 8 9
UNIVEN 0 0 3 3 3 0 1 1 1 0 1 5 5 5 4 5
UJ 0 0 0 0 0 0 0 0 0 0 5 4 9 6 4 2
UNIZULU 1 0 0 0 0 1 0 0 0 0 0 1 1 0 0 0
WSU 1 0 0 0 0 0 0 0 0 0 0 0 0 0 0 0
SMHSU 0 0 0 0 0 0 0 0 0 0 0 0 0 0 0 17
Total 59 68 118 214 126 141 229 196 207 165 204 233 220 231 244 240 (270)
36 In some cases, with reference to particular institutions in particular years, there are missing or erroneous data in the dataset. In these cases, we do not make a distinction between actual ‘0’s (where there were no enrolments or graduates) or missing ‘0’s (instances where data are missing or erroneously submitted by universities). In our analyses of the academic pipeline, we therefore report on the data as captured in the HEMIS database. 37 The data in brackets was sourced from the DHET tables to supplement data where entries in the microdata are missing or erroneous.

70
Table 42 Conversion rates from honours to masters of Statistics students for selected years 2000 2003 2005 2008 2010 2013 2015
Honours graduates 54 124 164 154 191 196 175
Master's new enrolments 33 133 79 95 69 101 116
Conversion rates 61% 107% 48% 62% 36% 52% 66%
2.3.2.2 Graduates
Figure 50 Master’s graduates in Statistics by gender and year (2000 to 2015)
Figure 51 Number of South African black masters graduates in Statistics by year (2000 to 2015)
Figure 52 Master’s graduates in Statistics by race and year (2000 to 2015)
2000 2001 2002 2003 2004 2005 2006 2007 2008 2009 2010 2011 2012 2013 2014 2015
Male 11 5 6 11 16 18 27 21 44 21 35 35 25 23 41 34
Female 6 3 6 13 19 20 26 20 15 14 16 25 23 17 22 23
0%
20%
40%
60%
80%
100%
Female Male
2000 2001 2002 2003 2004 2005 2006 2007 2008 2009 2010 2011 2012 2013 2014 2015
All South African black 5 4 9 12 16 9 12 9 7 8 15 21 11 17 27 25
0
5
10
15
20
25
30
NU
MB
ER O
F G
RA
DU
ATE
S
2000 2001 2002 2003 2004 2005 2006 2007 2008 2009 2010 2011 2012 2013 2014 2015
White 8 3 3 10 9 17 26 17 25 15 20 23 24 9 20 13
Other/Unknown 0 0 0 0 0 0 0 0 0 0 0 0 1 0 0 1
Indian/Asian 0 3 1 3 1 0 3 2 1 1 4 5 3 3 2 3
Coloured 0 0 1 2 4 2 2 3 1 2 1 2 1 3 1 1
Black African 5 1 7 7 11 7 7 4 5 5 10 14 7 11 24 21
0%10%20%30%40%50%60%70%80%90%
100%

71
Figure 53 Master’s graduates in Statistics by nationality and year (2000 to 2015)
Figure 54 Average age at graduation of master’s graduates in Statistics by year (2000 to 2015)
2000 2001 2002 2003 2004 2005 2006 2007 2008 2009 2010 2011 2012 2013 2014 2015
ROW 0 0 0 0 0 2 2 2 1 1 1 2 0 1 0 1
ROA 2 1 0 2 9 10 12 12 22 11 13 12 10 13 15 16
RSA 13 7 12 22 25 26 38 26 32 23 35 44 36 26 47 39
0%10%20%30%40%50%60%70%80%90%
100%
RSA ROA ROW
2000 2001 2002 2003 2004 2005 2006 2007 2008 2009 2010 2011 2012 2013 2014 2015
Avg age at graduation 28,4 31,9 30,2 28,6 32,0 30,4 30,5 31,3 31,5 29,5 30,7 31,3 29,4 30,0 30,7 29,3
0,0
5,0
10,0
15,0
20,0
25,0
30,0
35,0
AG
E (Y
EAR
S)
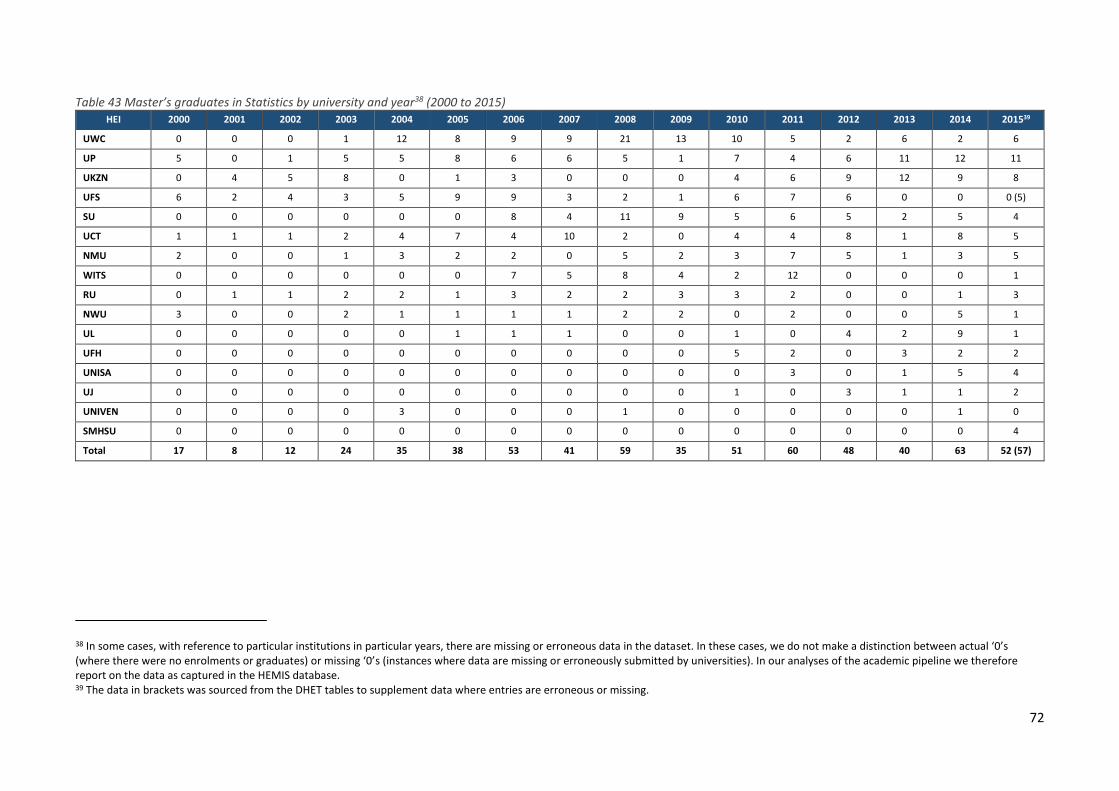
72
Table 43 Master’s graduates in Statistics by university and year38 (2000 to 2015) HEI 2000 2001 2002 2003 2004 2005 2006 2007 2008 2009 2010 2011 2012 2013 2014 201539
UWC 0 0 0 1 12 8 9 9 21 13 10 5 2 6 2 6
UP 5 0 1 5 5 8 6 6 5 1 7 4 6 11 12 11
UKZN 0 4 5 8 0 1 3 0 0 0 4 6 9 12 9 8
UFS 6 2 4 3 5 9 9 3 2 1 6 7 6 0 0 0 (5)
SU 0 0 0 0 0 0 8 4 11 9 5 6 5 2 5 4
UCT 1 1 1 2 4 7 4 10 2 0 4 4 8 1 8 5
NMU 2 0 0 1 3 2 2 0 5 2 3 7 5 1 3 5
WITS 0 0 0 0 0 0 7 5 8 4 2 12 0 0 0 1
RU 0 1 1 2 2 1 3 2 2 3 3 2 0 0 1 3
NWU 3 0 0 2 1 1 1 1 2 2 0 2 0 0 5 1
UL 0 0 0 0 0 1 1 1 0 0 1 0 4 2 9 1
UFH 0 0 0 0 0 0 0 0 0 0 5 2 0 3 2 2
UNISA 0 0 0 0 0 0 0 0 0 0 0 3 0 1 5 4
UJ 0 0 0 0 0 0 0 0 0 0 1 0 3 1 1 2
UNIVEN 0 0 0 0 3 0 0 0 1 0 0 0 0 0 1 0
SMHSU 0 0 0 0 0 0 0 0 0 0 0 0 0 0 0 4
Total 17 8 12 24 35 38 53 41 59 35 51 60 48 40 63 52 (57)
38 In some cases, with reference to particular institutions in particular years, there are missing or erroneous data in the dataset. In these cases, we do not make a distinction between actual ‘0’s (where there were no enrolments or graduates) or missing ‘0’s (instances where data are missing or erroneously submitted by universities). In our analyses of the academic pipeline we therefore report on the data as captured in the HEMIS database. 39 The data in brackets was sourced from the DHET tables to supplement data where entries are erroneous or missing.

73
Table 44 Master’s completion rates in Statistics by year40 (2000 to 2014)
First M
enrolments
Total graduates
after 1 year
1-year completion
rates (%)
Total graduates
after 2 years
2-year completion
rates (%)
Total graduates
after 3 years
3-year completion
rates (%)
Total graduates
after 4 years
4-year completion
rates (%)
2000 28 7 25.0 12 42.9 15 53.6 18 64.3
2001 29 1 3.4 3 10.3 8 27.6 9 31.0
2002 60 2 3.3 11 18.3 20 33.3 24 40.0
2003 115 6 5.2 11 9.6 20 17.4 25 21.7
2004 45 15 33.3 24 53.3 31 68.9 40 88.9
2005 54 12 22.2 29 53.7 35 64.8 41 75.9
2006 65 18 27.7 29 44.6 42 64.6 45 69.2
2007 53 11 20.8 22 41.5 25 47.2 30 56.6
2008 60 25 41.7 34 56.7 44 73.3 50 83.3
2009 48 16 33.3 25 52.1 31 64.6 34 70.8
2010 78 5 6.4 23 29.5 30 38.5 35 44.9
2011 77 6 7.8 29 37.7 41 53.2 52 67.5
2012 76 7 9.2 18 23.7 37 48.7 47 61.8
2013 77 10 13.0 28 36.4 37 48.7
2014 66 6 9.1
40 See Appendix 3 (3.3.1.1) for the calculation of completion rates.

74
Figure 55 Mean time-to-degree of master’s graduates in Statistics by year (2000 to 2015)
2.3.3 Doctoral students
Figure 56 Total enrolments, new enrolments and graduates of doctoral students in Statistics by year (2000 to 2015)
2000 2001 2002 2003 2004 2005 2006 2007 2008 2009 2010 2011 2012 2013 2014 2015
Mean TTD 2,3 2,4 3,0 2,3 4,4 2,6 2,5 2,8 2,3 2,2 3,5 4,5 2,7 2,5 3,1 2,6
0,0
0,5
1,0
1,5
2,0
2,5
3,0
3,5
4,0
4,5
5,0TT
D (
YEA
RS)
2000 2001 2002 2003 2004 2005 2006 2007 2008 2009 2010 2011 2012 2013 2014 2015
Total enrolments 21 25 26 26 29 42 73 77 60 69 82 87 92 117 133 144
New enrolments 1 6 6 3 7 10 23 27 7 14 12 15 18 25 25 53
Graduates 6 2 3 4 1 5 9 10 5 10 6 10 6 17 15 16
0
20
40
60
80
100
120
140
160
Total enrolments New enrolments Graduates

75
2.3.3.1 Enrolments
Figure 57 Doctoral enrolments disaggregated by gender and year (2000 to 2015)
Figure 58 Doctoral enrolments disaggregated by race and year (2000 to 2015)
Figure 59 Number of all South African black doctoral enrolments in Statistics by year (2000 to 2015)
69 10
13 1518 28
24 19 1931 29 29 41 44 48
1516 16
13 1424 45
53 41 5051 58 63 76 89 96
0%
10%
20%
30%
40%
50%
60%
70%
80%
90%
100%
2000 2001 2002 2003 2004 2005 2006 2007 2008 2009 2010 2011 2012 2013 2014 2015
Female Male
2000 2001 2002 2003 2004 2005 2006 2007 2008 2009 2010 2011 2012 2013 2014 2015
White 13 12 18 20 19 26 39 40 33 38 35 28 24 29 30 36
Other/Unknown 0 0 0 0 1 1 1 0 1 0 1 0 1 1 1 1
Indian/Asian 1 1 1 1 1 2 3 2 0 0 2 3 5 6 6 7
Coloured 0 1 0 0 1 0 2 1 1 2 4 4 5 6 5 8
Black African 1 3 1 0 2 4 7 9 6 6 4 8 13 19 16 24
0%
10%
20%
30%
40%
50%
60%
70%
80%
90%
100%
2000 2001 2002 2003 2004 2005 2006 2007 2008 2009 2010 2011 2012 2013 2014 2015
All South African black 2 5 2 1 4 6 12 12 7 8 10 15 23 31 27 39
0
5
10
15
20
25
30
35
40
45
NU
MB
ER O
F EN
RO
LMEN
TS
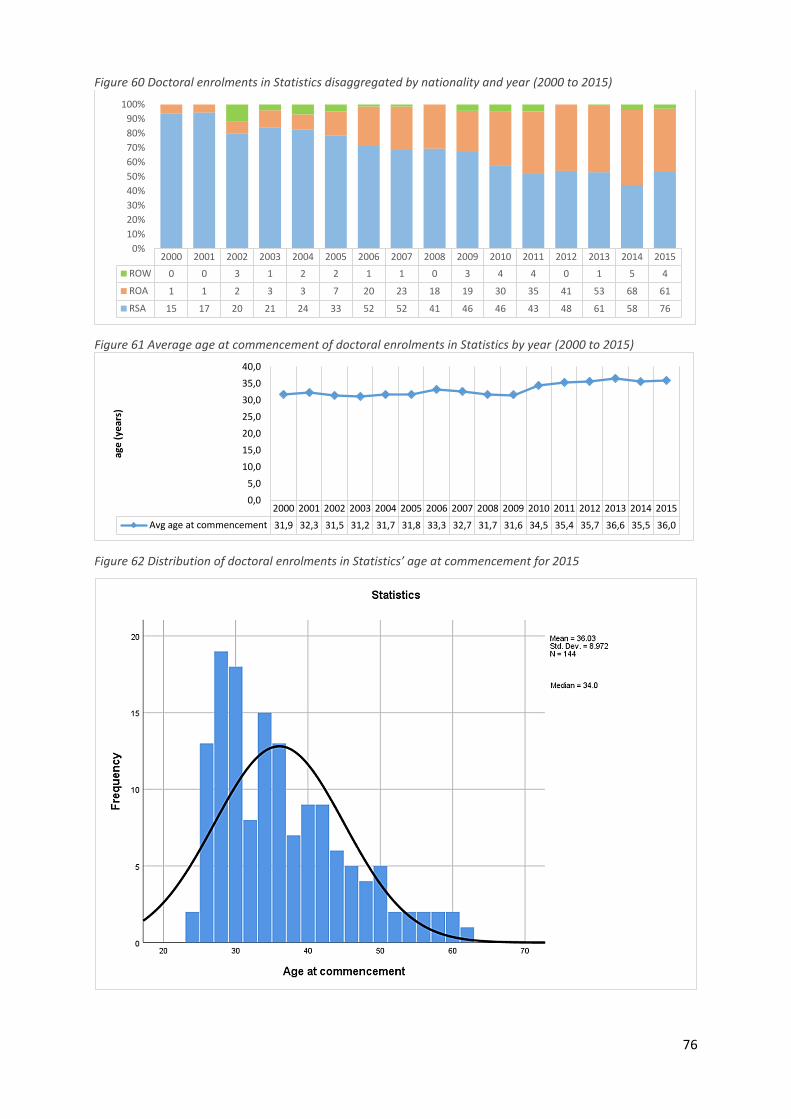
76
Figure 60 Doctoral enrolments in Statistics disaggregated by nationality and year (2000 to 2015)
Figure 61 Average age at commencement of doctoral enrolments in Statistics by year (2000 to 2015)
Figure 62 Distribution of doctoral enrolments in Statistics’ age at commencement for 2015
2000 2001 2002 2003 2004 2005 2006 2007 2008 2009 2010 2011 2012 2013 2014 2015
ROW 0 0 3 1 2 2 1 1 0 3 4 4 0 1 5 4
ROA 1 1 2 3 3 7 20 23 18 19 30 35 41 53 68 61
RSA 15 17 20 21 24 33 52 52 41 46 46 43 48 61 58 76
0%
10%
20%
30%
40%
50%
60%
70%
80%
90%
100%
2000 2001 2002 2003 2004 2005 2006 2007 2008 2009 2010 2011 2012 2013 2014 2015
Avg age at commencement 31,9 32,3 31,5 31,2 31,7 31,8 33,3 32,7 31,7 31,6 34,5 35,4 35,7 36,6 35,5 36,0
0,0
5,0
10,0
15,0
20,0
25,0
30,0
35,0
40,0
age
(ye
ars)
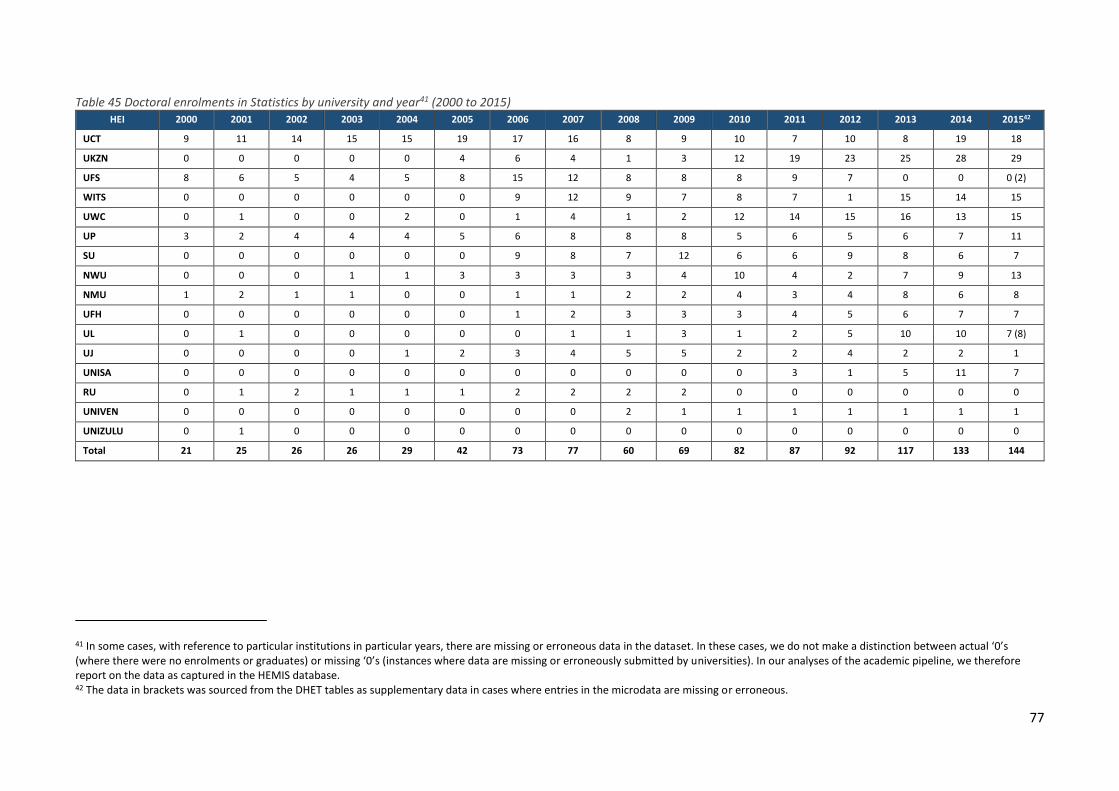
77
Table 45 Doctoral enrolments in Statistics by university and year41 (2000 to 2015) HEI 2000 2001 2002 2003 2004 2005 2006 2007 2008 2009 2010 2011 2012 2013 2014 201542
UCT 9 11 14 15 15 19 17 16 8 9 10 7 10 8 19 18
UKZN 0 0 0 0 0 4 6 4 1 3 12 19 23 25 28 29
UFS 8 6 5 4 5 8 15 12 8 8 8 9 7 0 0 0 (2)
WITS 0 0 0 0 0 0 9 12 9 7 8 7 1 15 14 15
UWC 0 1 0 0 2 0 1 4 1 2 12 14 15 16 13 15
UP 3 2 4 4 4 5 6 8 8 8 5 6 5 6 7 11
SU 0 0 0 0 0 0 9 8 7 12 6 6 9 8 6 7
NWU 0 0 0 1 1 3 3 3 3 4 10 4 2 7 9 13
NMU 1 2 1 1 0 0 1 1 2 2 4 3 4 8 6 8
UFH 0 0 0 0 0 0 1 2 3 3 3 4 5 6 7 7
UL 0 1 0 0 0 0 0 1 1 3 1 2 5 10 10 7 (8)
UJ 0 0 0 0 1 2 3 4 5 5 2 2 4 2 2 1
UNISA 0 0 0 0 0 0 0 0 0 0 0 3 1 5 11 7
RU 0 1 2 1 1 1 2 2 2 2 0 0 0 0 0 0
UNIVEN 0 0 0 0 0 0 0 0 2 1 1 1 1 1 1 1
UNIZULU 0 1 0 0 0 0 0 0 0 0 0 0 0 0 0 0
Total 21 25 26 26 29 42 73 77 60 69 82 87 92 117 133 144
41 In some cases, with reference to particular institutions in particular years, there are missing or erroneous data in the dataset. In these cases, we do not make a distinction between actual ‘0’s (where there were no enrolments or graduates) or missing ‘0’s (instances where data are missing or erroneously submitted by universities). In our analyses of the academic pipeline, we therefore report on the data as captured in the HEMIS database. 42 The data in brackets was sourced from the DHET tables as supplementary data in cases where entries in the microdata are missing or erroneous.
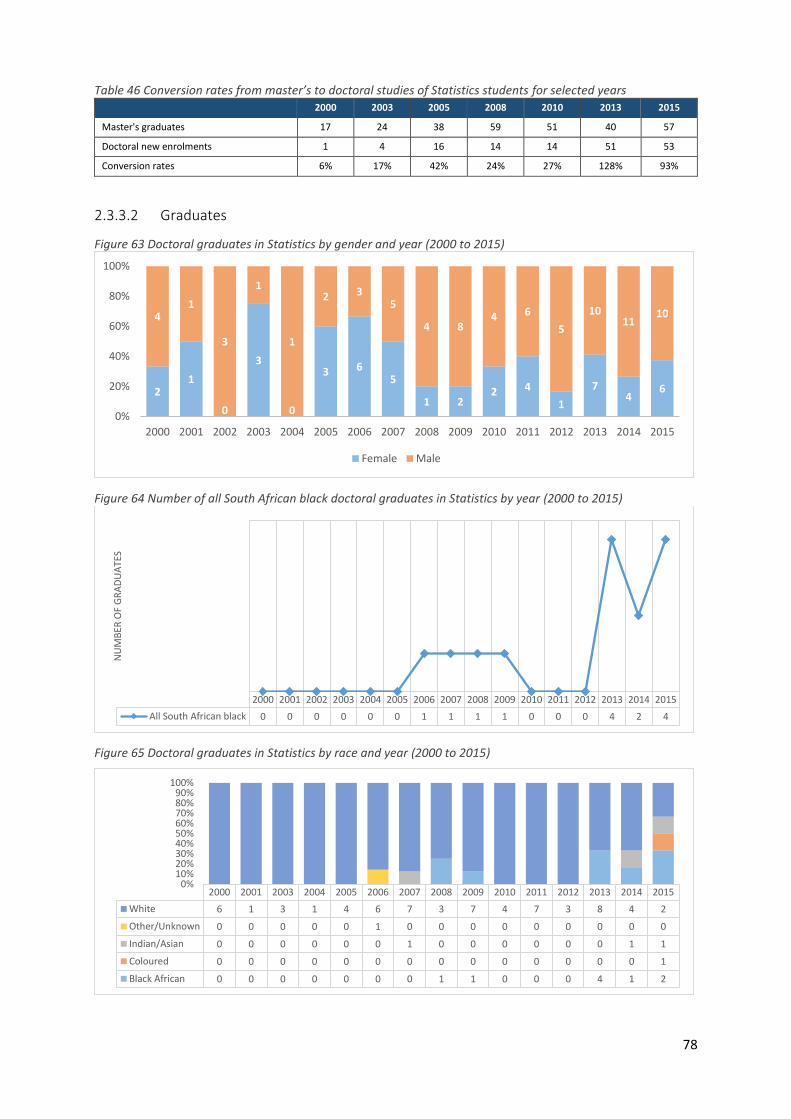
78
Table 46 Conversion rates from master’s to doctoral studies of Statistics students for selected years 2000 2003 2005 2008 2010 2013 2015
Master's graduates 17 24 38 59 51 40 57
Doctoral new enrolments 1 4 16 14 14 51 53
Conversion rates 6% 17% 42% 24% 27% 128% 93%
2.3.3.2 Graduates
Figure 63 Doctoral graduates in Statistics by gender and year (2000 to 2015)
Figure 64 Number of all South African black doctoral graduates in Statistics by year (2000 to 2015)
Figure 65 Doctoral graduates in Statistics by race and year (2000 to 2015)
21
0
3
0
3 65
1 22 4
1
74
6
41
3
1
1
2 35
4 84 6
5
1011
10
0%
20%
40%
60%
80%
100%
2000 2001 2002 2003 2004 2005 2006 2007 2008 2009 2010 2011 2012 2013 2014 2015
Female Male
2000 2001 2002 2003 2004 2005 2006 2007 2008 2009 2010 2011 2012 2013 2014 2015
All South African black 0 0 0 0 0 0 1 1 1 1 0 0 0 4 2 4
NU
MB
ER O
F G
RA
DU
ATE
S
2000 2001 2003 2004 2005 2006 2007 2008 2009 2010 2011 2012 2013 2014 2015
White 6 1 3 1 4 6 7 3 7 4 7 3 8 4 2
Other/Unknown 0 0 0 0 0 1 0 0 0 0 0 0 0 0 0
Indian/Asian 0 0 0 0 0 0 1 0 0 0 0 0 0 1 1
Coloured 0 0 0 0 0 0 0 0 0 0 0 0 0 0 1
Black African 0 0 0 0 0 0 0 1 1 0 0 0 4 1 2
0%10%20%30%40%50%60%70%80%90%
100%

79
Figure 66 Doctoral graduates in Statistics by nationality and year (2000 to 2015)
Figure 67 Average age at graduation of doctoral graduates in Statistics by year (2000 to 2015)
Figure 68 Distribution of doctoral graduates in Statistics’ age at graduation for 2015
2000 2001 2002 2003 2004 2005 2006 2007 2008 2009 2010 2011 2012 2013 2014 2015
ROW 0 0 2 0 0 1 0 0 0 0 1 1 0 0 0 1
ROA 0 0 1 1 0 0 2 2 1 2 1 2 3 5 9 8
RSA 6 1 0 3 1 4 7 8 4 8 4 7 3 12 6 6
0%
10%
20%
30%
40%
50%
60%
70%
80%
90%
100%
RSA ROA ROW
2000 2001 2002 2003 2004 2005 2006 2007 2008 2009 2010 2011 2012 2013 2014 2015
Avg age at graduation 36,8 40,0 42,0 38,0 29,0 35,2 34,0 40,5 34,0 33,7 38,2 36,1 36,3 29,9 38,3 45,1
0,0
5,0
10,0
15,0
20,0
25,0
30,0
35,0
40,0
45,0
50,0
AG
E (Y
EAR
S)

80
Table 47 Doctoral graduates in Statistics by university and year43 (2000 to 2015) HEI 2000 2001 2002 2003 2004 2005 2006 2007 2008 2009 2010 2011 2012 2013 2014 2015
UCT 1 1 3 2 0 4 3 2 1 2 2 2 0 0 2 2
UKZN 0 0 0 0 0 1 0 0 0 0 1 0 3 2 6 4
UP 1 1 0 1 1 0 2 1 1 2 0 2 0 3 1 1
SU 0 0 0 0 0 0 1 4 0 2 1 1 1 1 1 2
UFS 3 0 0 1 0 0 1 2 1 0 1 3 1 0 0 0 (1)
UWC 0 0 0 0 0 0 0 0 0 0 0 0 0 4 2 4
NWU 0 0 0 0 0 0 1 0 1 1 1 1 0 2 0 1
UJ 0 0 0 0 0 0 1 0 1 2 0 0 1 0 1 0
NMU 1 0 0 0 0 0 0 0 0 0 0 1 0 2 0 0
WITS 0 0 0 0 0 0 0 1 0 0 0 0 0 2 1 0
UL 0 0 0 0 0 0 0 0 0 0 0 0 0 1 1 0
RU 0 0 0 0 0 0 0 0 0 1 0 0 0 0 0 0
UFH 0 0 0 0 0 0 0 0 0 0 0 0 0 0 0 1
SMHSU 0 0 0 0 0 0 0 0 0 0 0 0 0 0 0 1
Total 6 2 3 4 1 5 9 10 5 10 6 10 6 17 15 16
(18)
43 In some cases, with reference to particular institutions in particular years, there are missing or erroneous data in the dataset. In these cases, we do not make a distinction between actual ‘0’s (where there were no enrolments or graduates) or missing ‘0’s (instances where data are missing or erroneously submitted by universities). In our analyses of the academic pipeline, we therefore report on the data as captured in the HEMIS database. The data in brackets was sourced from the DHET tables as supplementary data where entries in the microdata are missing or erroneous. The data in brackets was sourced from the DHET tables as supplementary data where entries in the microdata are missing or erroneous.

81
Table 48 Completion rates of doctoral students in Statistics by year44 (2000 to 2012)
First
enrolments
Total 4 years
graduates
Graduates
within 1 year
Adjusted
graduates
within four
years
4-year
completion
rates (%)
Total 5 years
graduates
Adjusted
graduates
within five
years
5-year
completion
rates (%)
total
graduates
after 7 years
Adjusted
graduates
after 7 years
7-year
completion
rates (%)
2000 1 1 0 1 100.0 1 1 100.0 1 1 100.0
2001 6 0 0 0 0.0 1 1 16.7 2 2 33.3
2002 6 2 0 2 33.3 3 3 50.0 4 4 66.7
2003 3 2 0 2 66.7 4 4 n/a 4 4 n/a
2004 7 7 0 7 100.0 9 9 n/a 8 8 n/a
2005 10 5 0 5 50.0 6 6 60.0 8 8 80.0
2006 23 4 0 4 17.4 5 5 21.7 9 9 39.1
2007 27 7 1 6 22.2 8 7 25.9 10 9 33.3
2008 7 2 0 2 28.6 3 3 42.9 5 5 71.4
2009 14 4 1 3 21.4 10 9 64.3 12 11 78.6
2010 12 5 0 5 41.7 8 8 66.7
2011 15 5 0 5 33.3 6 6 40.0
2012 18 6 0 6 33.3
44 See Appendix 3 (3.3.1.1) for the calculation of completion rates.

82
Figure 69 Mean time-to-degree in years of doctoral graduates in Statistics by year (2000 to 2015)
Figure 70 Distribution of time-to-degree of doctoral graduates in Statistics for 2015
2000 2001 2002 2003 2004 2005 2006 2007 2008 2009 2010 2011 2012 2013 2014 2015
Mean TTD 5,5 3,5 7,0 8,0 2,0 5,6 4,3 4,7 5,6 4,7 4,5 5,8 4,5 4,5 4,1 5,7
0,0
1,0
2,0
3,0
4,0
5,0
6,0
7,0
8,0
9,0TT
D (
YEA
RS)
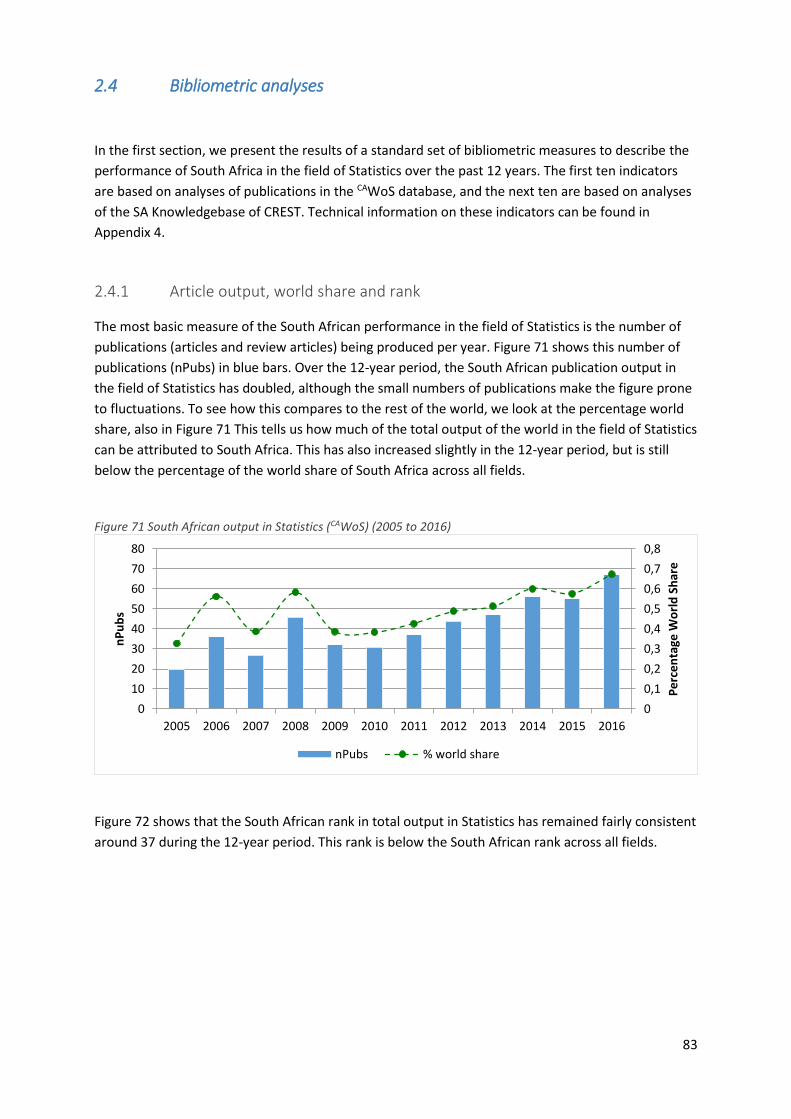
83
2.4 Bibliometric analyses
In the first section, we present the results of a standard set of bibliometric measures to describe the
performance of South Africa in the field of Statistics over the past 12 years. The first ten indicators
are based on analyses of publications in the CAWoS database, and the next ten are based on analyses
of the SA Knowledgebase of CREST. Technical information on these indicators can be found in
Appendix 4.
2.4.1 Article output, world share and rank
The most basic measure of the South African performance in the field of Statistics is the number of
publications (articles and review articles) being produced per year. Figure 71 shows this number of
publications (nPubs) in blue bars. Over the 12-year period, the South African publication output in
the field of Statistics has doubled, although the small numbers of publications make the figure prone
to fluctuations. To see how this compares to the rest of the world, we look at the percentage world
share, also in Figure 71 This tells us how much of the total output of the world in the field of Statistics
can be attributed to South Africa. This has also increased slightly in the 12-year period, but is still
below the percentage of the world share of South Africa across all fields.
Figure 71 South African output in Statistics (CAWoS) (2005 to 2016)
Figure 72 shows that the South African rank in total output in Statistics has remained fairly consistent
around 37 during the 12-year period. This rank is below the South African rank across all fields.
0
0,1
0,2
0,3
0,4
0,5
0,6
0,7
0,8
0
10
20
30
40
50
60
70
80
2005 2006 2007 2008 2009 2010 2011 2012 2013 2014 2015 2016
Pe
rce
nta
ge W
orl
d S
har
e
nP
ub
s
nPubs % world share
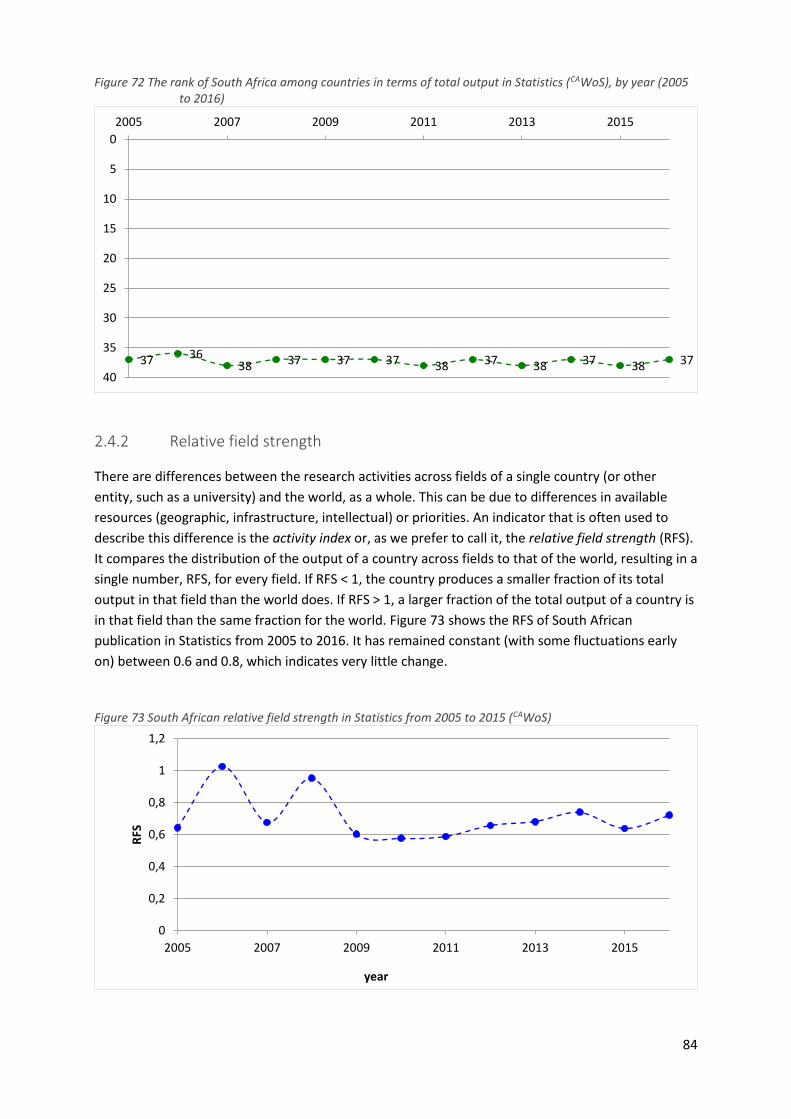
84
Figure 72 The rank of South Africa among countries in terms of total output in Statistics (CAWoS), by year (2005 to 2016)
2.4.2 Relative field strength
There are differences between the research activities across fields of a single country (or other
entity, such as a university) and the world, as a whole. This can be due to differences in available
resources (geographic, infrastructure, intellectual) or priorities. An indicator that is often used to
describe this difference is the activity index or, as we prefer to call it, the relative field strength (RFS).
It compares the distribution of the output of a country across fields to that of the world, resulting in a
single number, RFS, for every field. If RFS < 1, the country produces a smaller fraction of its total
output in that field than the world does. If RFS > 1, a larger fraction of the total output of a country is
in that field than the same fraction for the world. Figure 73 shows the RFS of South African
publication in Statistics from 2005 to 2016. It has remained constant (with some fluctuations early
on) between 0.6 and 0.8, which indicates very little change.
Figure 73 South African relative field strength in Statistics from 2005 to 2015 (CAWoS)
37 3638 37 37 37 38 37 38 37 38 37
0
5
10
15
20
25
30
35
40
2005 2007 2009 2011 2013 2015
0
0,2
0,4
0,6
0,8
1
1,2
2005 2007 2009 2011 2013 2015
RFS
year

85
2.4.3 Visibility (citation impact)
The visibility of science is partially captured by looking at the number of times research publications
are referenced (‘cited’) in the publications of other researchers. Citation practices differ vastly across
fields though, making it impossible to compare numbers of citations across fields. Hence we calculate
the normalised citation score (NCS) for every publication, so called for being normalised by field and
year. If NCS = 1, it indicates that the publication has received the number of citations expected for a
publication in its field and year. Since the NCS is comparable across (sub-)fields and years, we can
take the mean of these scores for a set of publications, hence the mean normalised citation score
(MNCS).
Figure 74 shows that for most of the ten-year period, the South African MNCS in Statistics has been
quite low, around 0.5. The low absolute number of publications makes the MNCS sensitive to
fluctuations caused by a few highly cited publications, hence the scores in 2005 and 2010.
Figure 74 MNCS of South African publications in Statistics by year (2005 to 2014)
Another citation-based measure of the visibility or impact of scientific research is to look at the
number of publications that are in the top 1%, 5% or 10% most cited publications in the field.
Average performance according to this measure would be if 10% of South African publications are
among the top 10% most cited and similarly for the top 5% and top 1%. Figure 75 indicates that
South African publications in Statistics are not well represented in the top citation percentage
intervals in any of the three intervals. There is also no sign of change.
0
0,5
1
1,5
2
2,5
3
2005 2006 2007 2008 2009 2010 2011 2012 2013 2014
MN
CS
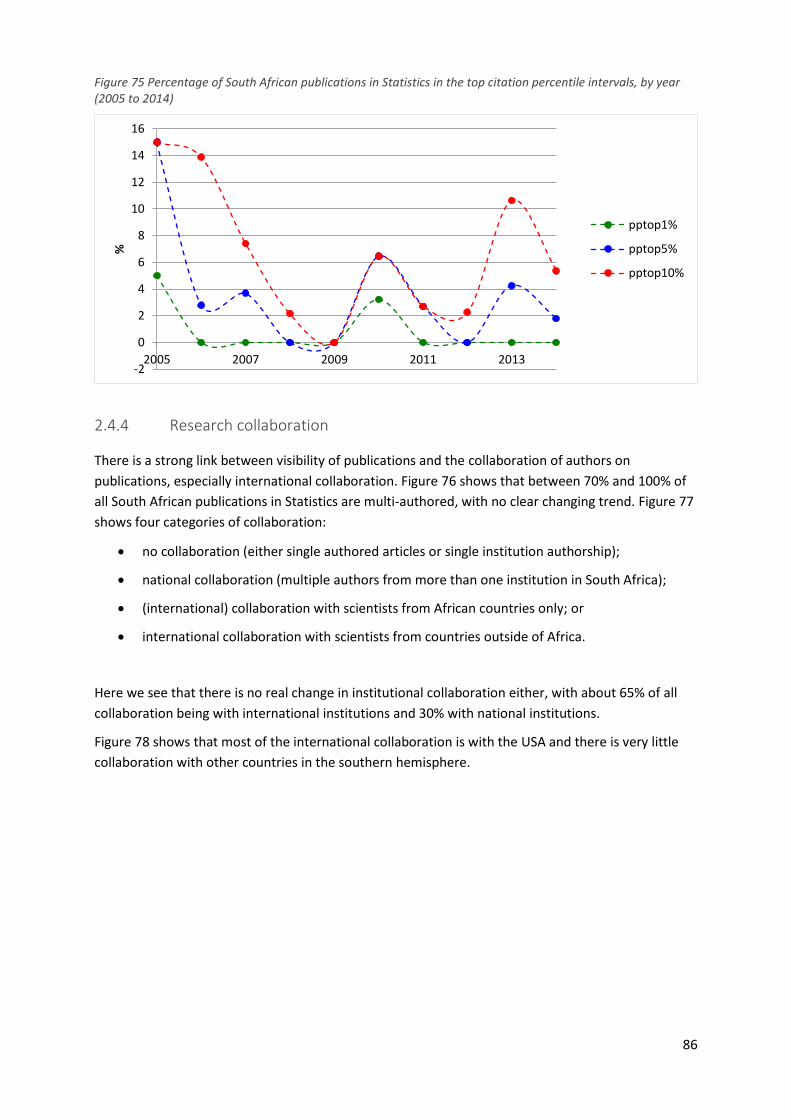
86
Figure 75 Percentage of South African publications in Statistics in the top citation percentile intervals, by year (2005 to 2014)
2.4.4 Research collaboration
There is a strong link between visibility of publications and the collaboration of authors on
publications, especially international collaboration. Figure 76 shows that between 70% and 100% of
all South African publications in Statistics are multi-authored, with no clear changing trend. Figure 77
shows four categories of collaboration:
no collaboration (either single authored articles or single institution authorship);
national collaboration (multiple authors from more than one institution in South Africa);
(international) collaboration with scientists from African countries only; or
international collaboration with scientists from countries outside of Africa.
Here we see that there is no real change in institutional collaboration either, with about 65% of all
collaboration being with international institutions and 30% with national institutions.
Figure 78 shows that most of the international collaboration is with the USA and there is very little
collaboration with other countries in the southern hemisphere.
-2
0
2
4
6
8
10
12
14
16
2005 2007 2009 2011 2013
%
pptop1%
pptop5%
pptop10%

87
Figure 76 Author collaboration in Statistics by year (2005 to 2016)
Figure 77 Trends in research collaboration in Statistics by year (2005 to 2016)
Figure 78 Map of countries with which South African authors collaborated in Statistics from 2013 to 2015
0
20
40
60
80
100
120
2005 2007 2009 2011 2013 2015
% o
f to
tal a
rtic
les
% single authored % multiple authors
0
10
20
30
40
50
60
70
80
90
2005 2007 2009 2011 2013 2015
% o
f to
tal a
rtic
les
year
% No collaboration
% National collaborationonly
% Collaboration only withAfrican countries
% Collaboration withcountries outside Africa
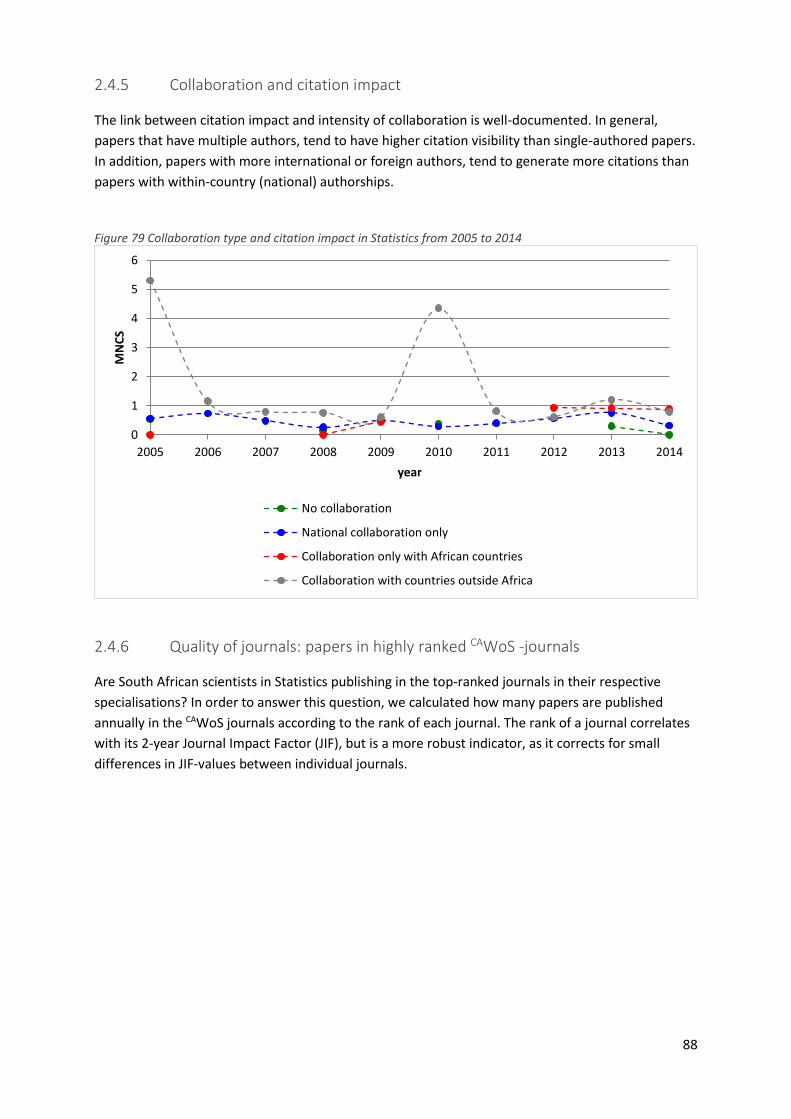
88
2.4.5 Collaboration and citation impact
The link between citation impact and intensity of collaboration is well-documented. In general,
papers that have multiple authors, tend to have higher citation visibility than single-authored papers.
In addition, papers with more international or foreign authors, tend to generate more citations than
papers with within-country (national) authorships.
Figure 79 Collaboration type and citation impact in Statistics from 2005 to 2014
2.4.6 Quality of journals: papers in highly ranked CAWoS -journals
Are South African scientists in Statistics publishing in the top-ranked journals in their respective
specialisations? In order to answer this question, we calculated how many papers are published
annually in the CAWoS journals according to the rank of each journal. The rank of a journal correlates
with its 2-year Journal Impact Factor (JIF), but is a more robust indicator, as it corrects for small
differences in JIF-values between individual journals.
0
1
2
3
4
5
6
2005 2006 2007 2008 2009 2010 2011 2012 2013 2014
MN
CS
year
No collaboration
National collaboration only
Collaboration only with African countries
Collaboration with countries outside Africa
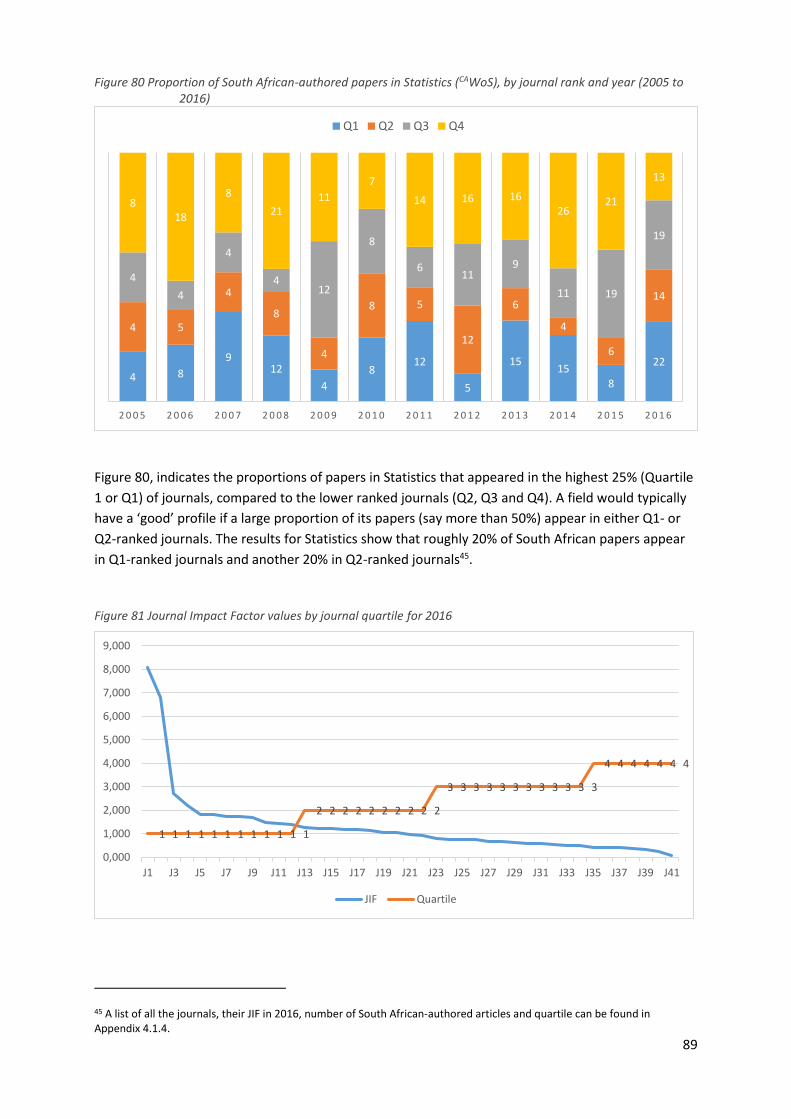
89
Figure 80 Proportion of South African-authored papers in Statistics (CAWoS), by journal rank and year (2005 to 2016)
Figure 80, indicates the proportions of papers in Statistics that appeared in the highest 25% (Quartile
1 or Q1) of journals, compared to the lower ranked journals (Q2, Q3 and Q4). A field would typically
have a ‘good’ profile if a large proportion of its papers (say more than 50%) appear in either Q1- or
Q2-ranked journals. The results for Statistics show that roughly 20% of South African papers appear
in Q1-ranked journals and another 20% in Q2-ranked journals45.
Figure 81 Journal Impact Factor values by journal quartile for 2016
45 A list of all the journals, their JIF in 2016, number of South African-authored articles and quartile can be found in Appendix 4.1.4.
4 8
912
4
812
5
1515
8
22
4 5
4
8
4
8 5
12
6
4
6
14
4
4
4
412
8
611
9
11 19
19
818
8
2111
7
14 16 1626
21
13
2 0 0 5 2 0 0 6 2 0 0 7 2 0 0 8 2 0 0 9 2 0 1 0 2 0 1 1 2 0 1 2 2 0 1 3 2 0 1 4 2 0 1 5 2 0 1 6
Q1 Q2 Q3 Q4
1 1 1 1 1 1 1 1 1 1 1 1
2 2 2 2 2 2 2 2 2 2
3 3 3 3 3 3 3 3 3 3 3 3
4 4 4 4 4 4 4
0,000
1,000
2,000
3,000
4,000
5,000
6,000
7,000
8,000
9,000
J1 J3 J5 J7 J9 J11 J13 J15 J17 J19 J21 J23 J25 J27 J29 J31 J33 J35 J37 J39 J41
JIF Quartile
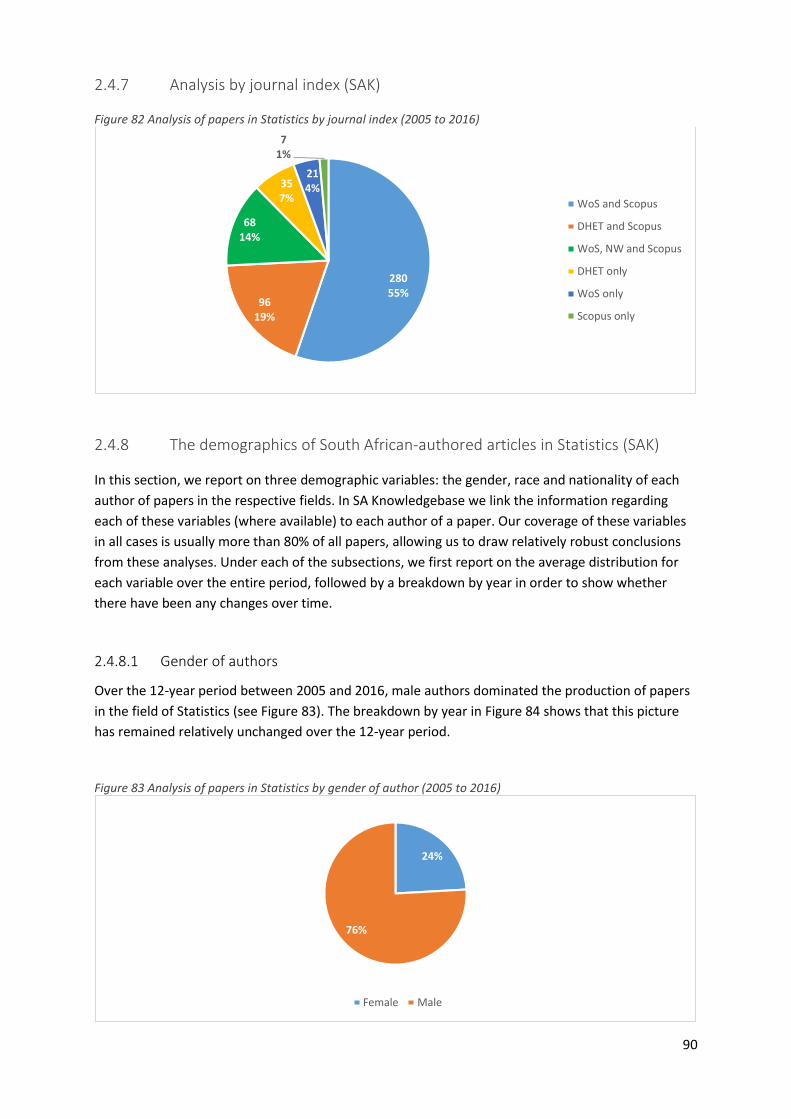
90
2.4.7 Analysis by journal index (SAK)
Figure 82 Analysis of papers in Statistics by journal index (2005 to 2016)
2.4.8 The demographics of South African-authored articles in Statistics (SAK)
In this section, we report on three demographic variables: the gender, race and nationality of each
author of papers in the respective fields. In SA Knowledgebase we link the information regarding
each of these variables (where available) to each author of a paper. Our coverage of these variables
in all cases is usually more than 80% of all papers, allowing us to draw relatively robust conclusions
from these analyses. Under each of the subsections, we first report on the average distribution for
each variable over the entire period, followed by a breakdown by year in order to show whether
there have been any changes over time.
2.4.8.1 Gender of authors
Over the 12-year period between 2005 and 2016, male authors dominated the production of papers
in the field of Statistics (see Figure 83). The breakdown by year in Figure 84 shows that this picture
has remained relatively unchanged over the 12-year period.
Figure 83 Analysis of papers in Statistics by gender of author (2005 to 2016)
28055%
9619%
6814%
357%
214%
71%
WoS and Scopus
DHET and Scopus
WoS, NW and Scopus
DHET only
WoS only
Scopus only
24%
76%
Female Male

91
Figure 84 Analysis of papers in Statistics by gender of author and year of publication (2005 to 2016)
2.4.8.2 Race of authors
Figure 85 Analysis of papers in Statistics by race of author (2005 to 2016)
Over the 12-year period between 2005 and 2016, white authors produced more than 80% of all
papers in the field of Statistics (Figure 85). The breakdown by year in Figure 86, however, shows that
this picture has started to change somewhat in recent years, with increasing contributions by black
authors.
1010
98
1614 20 15
2220 22 22
2636
2239
3041 60 61
4984 71 75
0%
10%
20%
30%
40%
50%
60%
70%
80%
90%
100%
2005 2006 2007 2008 2009 2010 2011 2012 2013 2014 2015 2016
Female Male
419%
256% 9
2%
35983%
African Asian/Indian Coloured White

92
Figure 86 Analysis of papers in Statistics by race of author and year of publication (2005 to 2016)
2.4.8.3 Age of authors
Figure 87 Analysis of publications in Statistics by age of author (2005 to 2016)
Figure 88 Analysis of papers in Statistics by age of author and year of publication (2005 to 2016)
1 2 26
2 15 3 4 5
82
1 11
34
2
10
32
11
11
2
1
2125
1725
2232
4434
2945
25
40
0%
10%
20%
30%
40%
50%
60%
70%
80%
90%
100%
2005 2006 2007 2008 2009 2010 2011 2012 2013 2014 2015 2016
African Asian/Indian Coloured White
13%
16%
21%
50%
<40 40-49 50-59 60+
1 2 29 13 9
20
11 10 123
9 4 7
2
3 124
11
21 1416
5
10 7 12
11
1011
8
1421
1315
25
18 13 17
2826 41
37
24 3436 33
0%
10%
20%
30%
40%
50%
60%
70%
80%
90%
100%
2005 2006 2007 2008 2009 2010 2011 2012 2013 2014 2015 2016
<40 40-49 50-59 60+

93
Appendix 1: List of academic courses offered in the BS
1.1 List of academic courses
Total number of courses surveyed
BS field Number of courses
Biological Sciences 234
Chemistry 129
Computer Science 45
Geological Sciences 80
Mathematics 128
Physics 76
Statistics 46
Total 738
Active courses by BS field and course level
BS field Honours Masters Doctorate
Biological Sciences 49 60 57
Chemistry 23 35 34
Computer Science 12 11 10
Geological Sciences 13 15 12
Mathematics 30 38 35
Physics 19 14 13
Statistics 14 15 11
Total 160 188 172
BS field Completion Honours Masters Doctorate
Biological Sciences Offered (unknown), but neither staff nor student info
17 28 22
Biological Sciences Offered (yes) and both staff and student info 37 46 48
Biological Sciences Offered (yes), but only staff info 12 14 10
Chemistry Offered (unknown), but neither staff nor student info
10 14 13
Chemistry Offered (yes) and both staff and student info 19 30 30
Chemistry Offered (yes), but only staff info 3 4 3
Chemistry Offered (yes), but only student info 1 1 1
Computer Science Offered (unknown), but neither staff nor student info
5 4 3
Computer Science Offered (yes) and both staff and student info 11 11 10
Computer Science Offered (yes), but only staff info 1 0 0
Geological Sciences Offered (unknown), but neither staff nor student info
11 17 12
Geological Sciences Offered (yes) and both staff and student info 10 10 9
Geological Sciences Offered (yes), but only staff info 3 5 3
Mathematics Offered (unknown), but neither staff nor student info
9 9 8
Mathematics Offered (yes) and both staff and student info 25 30 28
Mathematics Offered (yes), but only staff info 5 8 6
Physics Offered (unknown), but neither staff nor student info
8 12 10
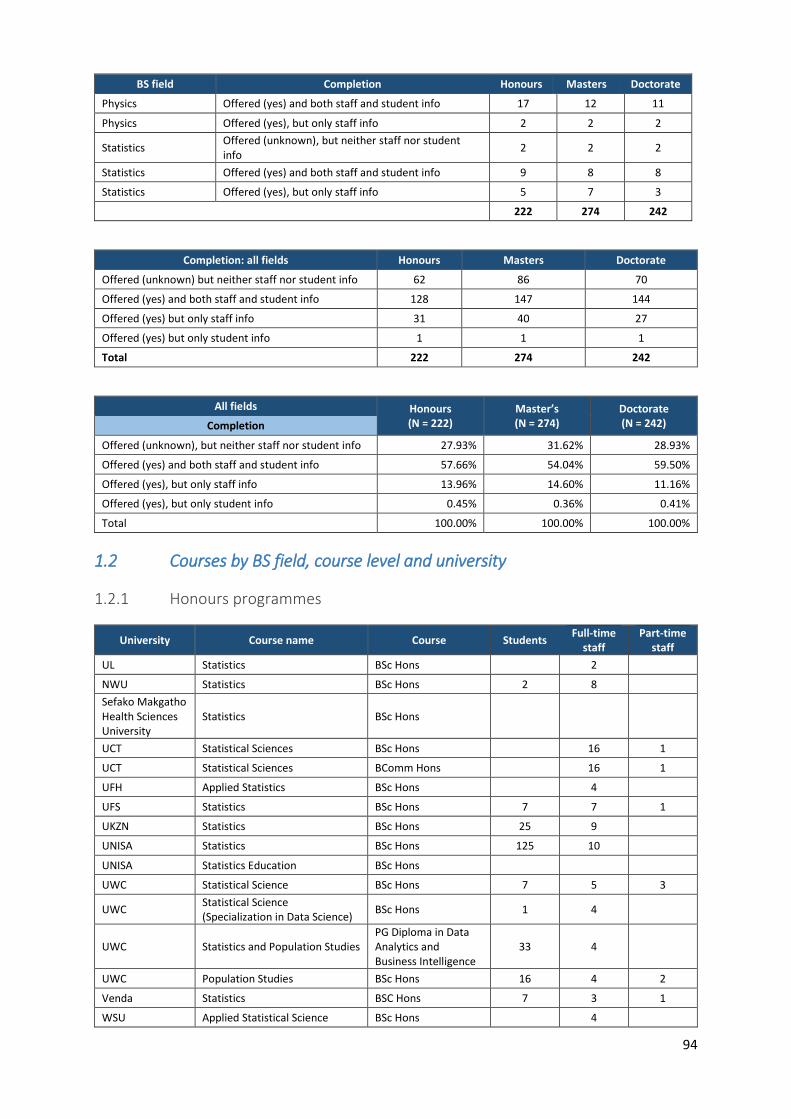
94
BS field Completion Honours Masters Doctorate
Physics Offered (yes) and both staff and student info 17 12 11
Physics Offered (yes), but only staff info 2 2 2
Statistics Offered (unknown), but neither staff nor student info
2 2 2
Statistics Offered (yes) and both staff and student info 9 8 8
Statistics Offered (yes), but only staff info 5 7 3
222 274 242
Completion: all fields Honours Masters Doctorate
Offered (unknown) but neither staff nor student info 62 86 70
Offered (yes) and both staff and student info 128 147 144
Offered (yes) but only staff info 31 40 27
Offered (yes) but only student info 1 1 1
Total 222 274 242
All fields Honours (N = 222)
Master’s (N = 274)
Doctorate (N = 242) Completion
Offered (unknown), but neither staff nor student info 27.93% 31.62% 28.93%
Offered (yes) and both staff and student info 57.66% 54.04% 59.50%
Offered (yes), but only staff info 13.96% 14.60% 11.16%
Offered (yes), but only student info 0.45% 0.36% 0.41%
Total 100.00% 100.00% 100.00%
1.2 Courses by BS field, course level and university
1.2.1 Honours programmes
University Course name Course Students Full-time
staff Part-time
staff
UL Statistics BSc Hons 2
NWU Statistics BSc Hons 2 8
Sefako Makgatho Health Sciences University
Statistics BSc Hons
UCT Statistical Sciences BSc Hons 16 1
UCT Statistical Sciences BComm Hons 16 1
UFH Applied Statistics BSc Hons 4
UFS Statistics BSc Hons 7 7 1
UKZN Statistics BSc Hons 25 9
UNISA Statistics BSc Hons 125 10
UNISA Statistics Education BSc Hons
UWC Statistical Science BSc Hons 7 5 3
UWC Statistical Science (Specialization in Data Science)
BSc Hons 1 4
UWC Statistics and Population Studies PG Diploma in Data Analytics and Business Intelligence
33 4
UWC Population Studies BSc Hons 16 4 2
Venda Statistics BSC Hons 7 3 1
WSU Applied Statistical Science BSc Hons 4

95
1.2.2 Master’s programmes
University Course name Course Students Full-time
staff Part-time
staff
UL Statistics MSc 3 1
NMU Statistics MComm/ MSc 7 6 2
NWU Statistics MSc 3 6
Sefako Makgatho Health Sciences University
Statistics MSc
UCT Data Science MSc 6 1
UCT Advanced Analytics and Decision Sciences
MSc 6 3
UCT Biostatistics MSc 5 1
UCT Operational Research MSc 3 2
UFH Applied Statistics MSc 3
UFS Statistics MSc 11 8 1
UKZN Statistics MSc 27 9
UNISA Statistics MSc 20 11
UNISA Statistics Education MSc
UWC Statistical Science MSc 1 2
UWC Population Studies MPhil 13 3 1
Venda Statistics MSc 12 3 1
WSU Statistical Science MSc 3
1.2.3 Doctoral programmes
University Course name Course Students Full-time
staff Part-time
staff
UL Statistics PhD 2 3
NMU Statistics PhD 7 5 4
NWU Statistics PhD 1 4 1
Sefako Makgatho Health Sciences University
Statistics PhD
UCT Statistical Sciences PhD 8 4
UFH Biostatistics PhD 2
UFS Statistics PhD 3 5 1
UKZN Statistics PhD 28 5
UNISA Statistics PhD 17 7 4
UNISA Statistics Education PhD
UWC Statistical Science PhD 3 1
UWC Population Studies PhD 11 3
UNIVEN Statistics PhD 3 2

96
Appendix 2: Descriptive statistics for NRF grant values
Table 49 Descriptive statistics for NRF grant values by BS fields, 2002 versus 2015 (real values, with 2015 as base)
BS fields Year Number of
grant holders
Grant values
Sum Median Mean 5% Trimmed
Mean Std. Deviation Minimum Maximum
Biological Sciences 2002 259 R88 531 336 R196 979 R341 820 R243 884 R650 434 R387 R7 036 875
2015 573 R272 256 643 R137 200 R475 142 R273 368 R1 124 943 R2 110 R10 859 831
Chemistry 2002 81 R53 041 239 R238 111 R654 830 R375 213 R1 437 463 R18 891 R8 869 555
2015 181 R122 586 071 R193 096 R677 271 R426 096 R1 431 282 R8 790 R9 476 378
Computer Science 2002 21 R7 854 352 R184 649 R374 017 R323 566 R464 748 R8 495 R1 652 935
2015 52 R18 151 689 R48 519 R349 071 R144 368 R1 026 096 R14 078 R6 283 383
Geological Sciences 2002 30 R22 970 179 R205 655 R765 673 R384 841 R2 075 738 R11 370 R11 129 448
2015 65 R59 898 382 R80 000 R921 514 R453 600 R2 404 203 R8 604 R12 581 065
Mathematics 2002 63 R10 437 748 R82 190 R165 679 R118 336 R272 379 R986 R1 713 197
2015 119 R47 528 249 R73 310 R399 397 R161 208 R1 310 505 R6 911 R9 775 000
Physics 2002 51 R17 008 384 R77 451 R333 498 R141 798 R1 229 918 R521 R8 797 769
2015 164 R132 226 875 R123 140 R806 261 R460 388 R2 075 195 R6 806 R18 771 714
Statistics 2002 8 R2 382 122 R131 325 R297 765 R279 268 R340 808 R37 781 R890 696
2015 31 R6 302 644 R100 000 R203 311 R154 686 R295 080 R30 960 R1 524 432
All BS Sciences 2002 513 R202 225 360 R171 165 R394 201 R237 368 R986 914 R387 R11 129 448
2015 1185 R658 950 553 R119 120 R556 076 R301 242 R1 440 784 R2 110 R18 771 714
The 2002 figures for Biological Sciences, Chemistry, Computer Science and Mathematics differ marginally from those in the main report. The reason is that no
funding amounts were specified for small number of grant holders in these fields. These grant holders have been excluded in the table above.

97
Table 50 Descriptive statistics for NRF grant values by BS fields, 2002 versus 2015 (nominal values)
BS fields Year Number of
grant holders
Grant values
Sum Median Mean 5% Trimmed
Mean Std. Deviation Minimum Maximum
Biological Sciences 2002 259 R46 865 074 R104 273 R180 946 R129 103 R344 315 R205 R3 725 050
2015 573 R272 256 643 R137 200 R475 142 R273 368 R1 124 943 R2 110 R10 859 831
Chemistry 2002 81 R28 077 985 R126 047 R346 642 R198 623 R760 937 R10 000 R4 695 200
2015 181 R122 586 071 R193 096 R677 271 R426 096 R1 431 282 R8 790 R9 476 378
Computer Science 2002 21 R4 157 792 R97 746 R197 990 R171 284 R246 020 R4 497 R875 000
2015 52 R18 151 689 R48 519 R349 071 R144 368 R1 026 096 R14 078 R6 283 383
Geological Sciences 2002 30 R12 159 528 R108 866 R405 318 R203 720 R1 098 815 R6 019 R5 891 500
2015 65 R59 898 382 R80 000 R921 514 R453 600 R2 404 203 R8 604 R12 581 065
Mathematics 2002 63 R5 525 340 R43 508 R87 704 R62 643 R144 187 R522 R906 900
2015 119 R47 528 249 R73 310 R399 397 R161 208 R1 310 505 R6 911 R9 775 000
Physics 2002 51 R9 003 584 R41 000 R176 541 R75 062 R651 071 R276 R4 657 200
2015 164 R132 226 875 R123 140 R806 261 R460 388 R2 075 195 R6 806 R18 771 714
Statistics 2002 8 R1 261 004 R69 519 R157 626 R147 834 R180 410 R20 000 R471 500
2015 31 R6 302 644 R100 000 R203 311 R154 686 R295 080 R30 960 R1 524 432
All BS Sciences 2002 513 R107 050 307 R90 608 R208 675 R125 654 R522 434 R205 R5 891 500
2015 1185 R658 950 553 R119 120 R556 076 R301 242 R1 440 784 R2 110 R18 771 714

98
Table 51 Descriptive statistics for NRF grant values by BS fields, 2002 versus 2015 (real values, with 2015 as base, and grants <R1000 removed)
BS fields Year Number of
grant holders
Grant values
Sum Median Mean 5% Trimmed
Mean Std. Deviation Minimum Maximum
Biological Sciences 2002 258 R88 530 949 R196 982 R343 143 R244 946 R651 349 R1 048 R7 036 875
2015 573 R272 253 181 R137 200 R475 136 R273 361 R1 124 944 R2 110 R10 859 831
Chemistry 2002 81 R53 041 239 R238 111 R654 830 R375 213 R1 437 463 R18 891 R8 869 555
2015 181 R122 586 071 R193 096 R677 271 R426 096 R1 431 282 R8 790 R9 476 378
Computer Science 2002 21 R7 854 352 R184 649 R374 017 R323 566 R464 748 R8 495 R1 652 935
2015 52 R18 151 689 R48 519 R349 071 R144 368 R1 026 096 R14 078 R6 283 383
Geological Sciences 2002 30 R22 970 179 R205 655 R765 673 R384 841 R2 075 738 R11 370 R11 129 448
2015 65 R59 897 479 R80 000 R921 500 R453 584 R2 404 204 R8 604 R12 581 065
Mathematics 2002 62 R10 435 791 R82 169 R168 319 R120 352 R273 784 R15 111 R1 713 197
2015 119 R47 528 249 R73 310 R399 397 R161 208 R1 310 505 R6 911 R9 775 000
Physics 2002 50 R17 007 863 R80 242 R340 157 R145 416 R1 241 475 R12 033 R8 797 769
2015 164 R132 226 875 R123 140 R806 261 R460 388 R2 075 195 R6 806 R18 771 714
Statistics 2002 8 R2 382 122 R131 325 R297 765 R279 268 R340 808 R37 781 R890 696
2015 31 R6 302 644 R100 000 R203 311 R154 686 R295 080 R30 960 R1 524 432
All BS Sciences 2002 510 R202 222 495 R171 932 R396 515 R239 003 R989 355 R1 048 R11 129 448
2015 1185 R658 946 188 R119 120 R556 073 R301 237 R1 440 785 R2 110 R18 771 714

99
Table 52 Descriptive statistics for NRF grant values by BS fields, 2002 versus 2015 (nominal values, and grants <R1000 [adjusted values] removed)
BS fields Year Number of
grant holders
Grant values
Sum Median Mean 5% Trimmed
Mean Std. Deviation Minimum Maximum
Biological Sciences 2002 258 R46 864 869 R104 275 R181 647 R129 665 R344 799 R555 R3 725 050
2015 573 R272 253 181 R137 200 R475 136 R273 361 R1 124 944 R2 110 R10 859 831
Chemistry 2002 81 R28 077 985 R126 047 R346 642 R198 623 R760 937 R10 000 R4 695 200
2015 181 R122 586 071 R193 096 R677 271 R426 096 R1 431 282 R8 790 R9 476 378
Computer Science 2002 21 R4 157 792 R97 746 R197 990 R171 284 R246 020 R4 497 R875 000
2015 52 R18 151 689 R48 519 R349 071 R144 368 R1 026 096 R14 078 R6 283 383
Geological Sciences 2002 30 R12 159 528 R108 866 R405 318 R203 720 R1 098 815 R6 019 R5 891 500
2015 65 R59 897 479 R80 000 R921 500 R453 584 R2 404 204 R8 604 R12 581 065
Mathematics 2002 62 R5 524 304 R43 497 R89 102 R63 710 R144 930 R7 999 R906 900
2015 119 R47 528 249 R73 310 R399 397 R161 208 R1 310 505 R6 911 R9 775 000
Physics 2002 50 R9 003 308 R42 477 R180 066 R76 978 R657 189 R6 370 R4 657 200
2015 164 R132 226 875 R123 140 R806 261 R460 388 R2 075 195 R6 806 R18 771 714
Statistics 2002 8 R1 261 004 R69 519 R157 626 R147 834 R180 410 R20 000 R471 500
2015 31 R6 302 644 R100 000 R203 311 R154 686 R295 080 R30 960 R1 524 432
All BS Sciences 2002 510 R107 048 790 R91 014 R209 900 R126 519 R523 726 R555 R5 891 500
2015 1185 R658 946 188 R119 120 R556 073 R301 237 R1 440 785 R2 110 R18 771 714

100
Appendix 3: Technical notes on the analysis of HEMIS (staff and student) data
3.1 Disciplines selected
The analysis of human resources in the BS used the classification of disciplines as outlined by the
HEMIS classifications. The HEMIS Classification of Educational Subject Matter (CESM) changed three
times over the 16-year period of data analysed. In the table below, the disciplines and their
corresponding CESM codes that were used in our analysis are shown. In some cases, the first and
second order classifications were used.
3.1.1 CESM codes
1999-2007 2008-2009
Description 2010- Description
MATHEMATICAL SCIENCES 150100 MATHEMATICS
1601 160100 Mathematical Sciences, General Perspective
150101 Mathematics, General
1602 160200 Logic, sets, and foundations 150102 Algebra and Number Theory
1603 160300 Arithmetic and Algebra 150103 Analysis and Functional Analysis
1604 160400 Classical Analysis 150104 Geometry/Geometric Analysis
1605 160500 Functional Analysis 150105 Topology and Foundations
1606 160600 Geometry and Topology 150199 Mathematics, Other
1607 160700 Probability 150200 Applied Mathematics
1609 160900 Numerical Analysis and Approximation Theory
150201 Applied Mathematics, General
1610 161000 Classical Applied Mathematics 150202 Computational Mathematics
1611 161100 Applications of Mathematics 150299 Applied Mathematics, Other
1612 161200 User-oriented Mathematics 159999 Mathematics and Statistics, Other
1699 169900 Other Mathematical Sciences
STATISTICS
1608 160800 Statistics 150300 Statistics
150301 Statistics, General
150302 Mathematical Statistics and Probability
150399 Statistics, Other
GEOLOGICAL SCIENCES GEOLOGY AND EARTH SCIENCES/GEOSCIENCES
1505 150500 Geology 140600 Geology and Earth Sciences/Geosciences
140601 Geology/Earth Science, General
140602 Geochemistry
140603 Geophysics and Seismology
140604 Palaeontology
140605 Hydrology and Water Resources Science
140606 Geochemistry and Petrology
140607 Oceanography, Chemical and Physical
140699 Geology and Earth Sciences/Geosciences, Other
COMPUTER SCIENCE COMPUTER AND INFORMATION SCIENCES
0601 060100 Applications in Computer Science and Data Processing
060100 Computer and Information Sciences
0602 060200 Computer Operations and Operations Control
060101 Computer and Information Sciences, General
0603 060300 Computer Hardware Systems 060102 Artificial Intelligence and Robotics
0604 060400 Computer Hardware 060103 Information Technology
0605 060500 Information and Data Base Systems
060199 Computer and Information Sciences, Other
0606 060600 Numerical Computations 060200 Computer Programming
0607 060700 Programming Languages 060201 Computer Programming, General

101
1999-2007 2008-2009
Description 2010- Description
0608 060800 Programming Systems 060202 Computer Programming, Specific Applications
0609 060900 Software Methodology 060299 Computer Programming, Other
0610 061000 Theory of Computation 060300 Data Processing and Information Science
0611 061100 Educational, Societal, and Cultural Considerations
060301 Data Processing and Data Processing Technology
0699 069900 Other Computer Science and Data Processing
060302 Information Science
060399 Data Processing and Information Science, Other
060400 Computer Business Systems Analysis
060401 Computer Business Systems Analysis
060500 Data Entry/Microcomputer Applications
060501 Data Entry/Microcomputer Applications, General
060502 Word Processing
060599 Data Entry/Microcomputer Applications, Other
060600 Computer Science
060601 Computer Science
060700 Computer Software and Media Applications
060701 Web Page, Digital/Multimedia and Information Resources Design
060702 Data Modelling/Warehousing and Database Administration
060703 Computer Graphics
060799 Computer Software and Media Applications, Other
060800 Computer Systems Networking and Telecommunications
060801 Computer Systems Networking and Telecommunications
060900 Computer/Information Technology Administration and Management
060901 Systems Administration
060902 Systems, Networking and LAN/WAN Management
060903 Computer and Information Systems Security
060904 Web/Multimedia Management
060999 Computer/Information Technology Administration and Management, Other
061000 Management Information Systems and Services
061001 Management Information Systems, General
061002 Information Resources Management
061003 Knowledge Management
061099 Management Information Systems and Services, Other
069999 Computer and Information Sciences, Other
CHEMISTRY
1504 150400 Chemistry 140400 Chemistry
140401 Chemistry, General
140402 Analytical Chemistry
140403 Inorganic Chemistry
140404 Organic Chemistry
140405 Physical and Theoretical Chemistry
140406 Polymer Chemistry
140407 Chemical Physics
140499 Chemistry, Other
BIOLOGICAL SCIENCES LIFE SCIENCES
1503 150300 Biological Sciences 130100 Biology general
130101 Biology/Biological Sciences, General
130200 Biochemistry, Biophysics and Molecular Biochemistry
130201 Biochemistry
130202 Biophysics
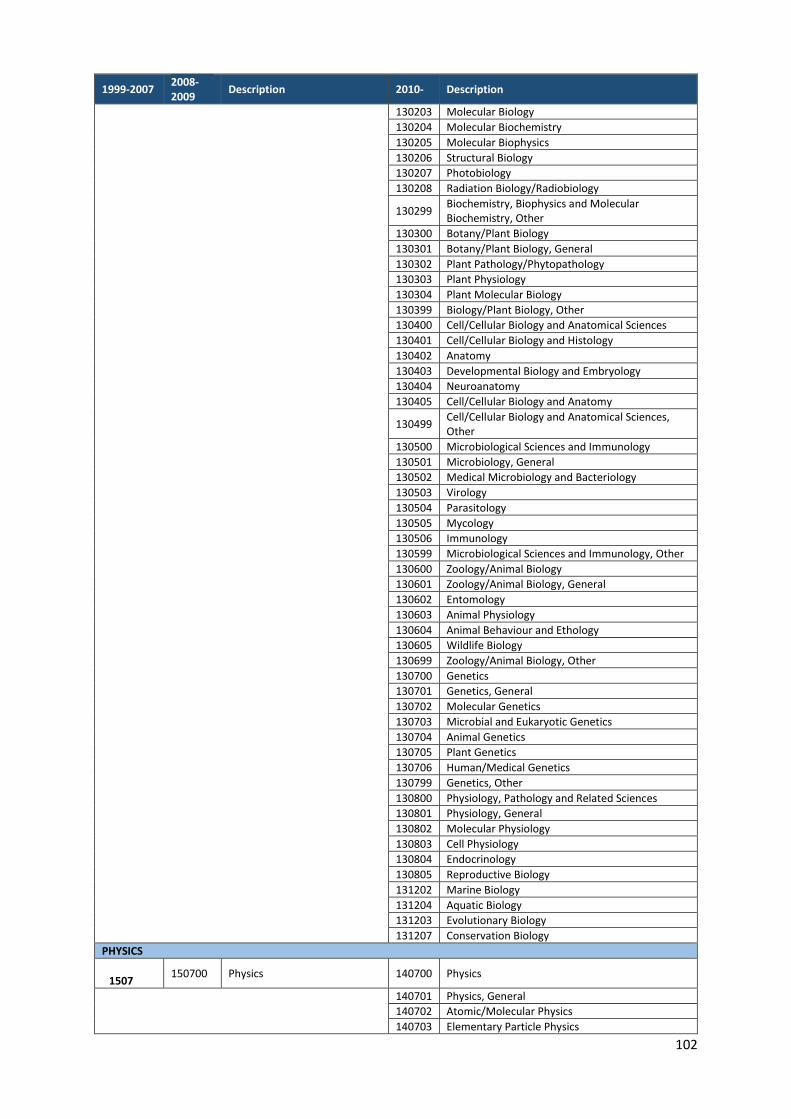
102
1999-2007 2008-2009
Description 2010- Description
130203 Molecular Biology
130204 Molecular Biochemistry
130205 Molecular Biophysics
130206 Structural Biology
130207 Photobiology
130208 Radiation Biology/Radiobiology
130299 Biochemistry, Biophysics and Molecular Biochemistry, Other
130300 Botany/Plant Biology
130301 Botany/Plant Biology, General
130302 Plant Pathology/Phytopathology
130303 Plant Physiology
130304 Plant Molecular Biology
130399 Biology/Plant Biology, Other
130400 Cell/Cellular Biology and Anatomical Sciences
130401 Cell/Cellular Biology and Histology
130402 Anatomy
130403 Developmental Biology and Embryology
130404 Neuroanatomy
130405 Cell/Cellular Biology and Anatomy
130499 Cell/Cellular Biology and Anatomical Sciences, Other
130500 Microbiological Sciences and Immunology
130501 Microbiology, General
130502 Medical Microbiology and Bacteriology
130503 Virology
130504 Parasitology
130505 Mycology
130506 Immunology
130599 Microbiological Sciences and Immunology, Other
130600 Zoology/Animal Biology
130601 Zoology/Animal Biology, General
130602 Entomology
130603 Animal Physiology
130604 Animal Behaviour and Ethology
130605 Wildlife Biology
130699 Zoology/Animal Biology, Other
130700 Genetics
130701 Genetics, General
130702 Molecular Genetics
130703 Microbial and Eukaryotic Genetics
130704 Animal Genetics
130705 Plant Genetics
130706 Human/Medical Genetics
130799 Genetics, Other
130800 Physiology, Pathology and Related Sciences
130801 Physiology, General
130802 Molecular Physiology
130803 Cell Physiology
130804 Endocrinology
130805 Reproductive Biology
131202 Marine Biology
131204 Aquatic Biology
131203 Evolutionary Biology
131207 Conservation Biology
PHYSICS
1507
150700 Physics 140700 Physics
140701 Physics, General
140702 Atomic/Molecular Physics
140703 Elementary Particle Physics

103
1999-2007 2008-2009
Description 2010- Description
140704 Plasma and High Temperature Physics
140705 Nuclear Physics
140706 Optics/Optical Sciences
140707 Solid State and Low Temperature Physics
140708 Acoustics
140709 Theoretical and Mathematical Physics
140799 Physics, Other
3.2.1.1 Biological Sciences
In Biological Sciences, only selected fields were included. This was done to create synergy between
the disciplinary fields included in the bibliometric analysis and the student/staff analysis.
3.2.1.2 Physics
Code Description
529 Reporting year Data from 2000 to 2015 were selected
5 Qualification type
The qualifications selected are as follows:
Honours:
06: Honours Degree
47: HEQF Postgraduate Diploma
48: HEQF Bachelor Honours Degree
69: HEQSF Postgraduate Diploma
70: HEQSF Bachelor Honours Degree
Master’s:
07: Master’s Degree
28: Magister Technologiae Degree
49: HEQF Master’s Degree Doctoral
72: HEQSF Master’s Degree
73: HEQSF Prof Master’s Degree
Doctoral:
08: Doctoral Degree;
30: Doctor Technologiae Degree
50: HEQF Doctoral Degree
74: HEQSF Doctoral Degree
75: HEQSF Prof Doctoral Degree
7 Commencement date The date on which a student first commenced the qualification at the reporting institution. This was recoded to ‘commencement year’
11 Date of birth Each student’s year of birth is recorded from which students’ ages were determined.
12 Gender Male; female and unknown
13 Race African, Coloured, white, Indian/Asian and ‘no information’
14 Nationality
Students’ nationality were recoded into three regional categories:
Rest of World (ROW)
Rest of Africa (ROA)
South African (RSA)
Nationality refers to citizenship, not to country of permanent residence.
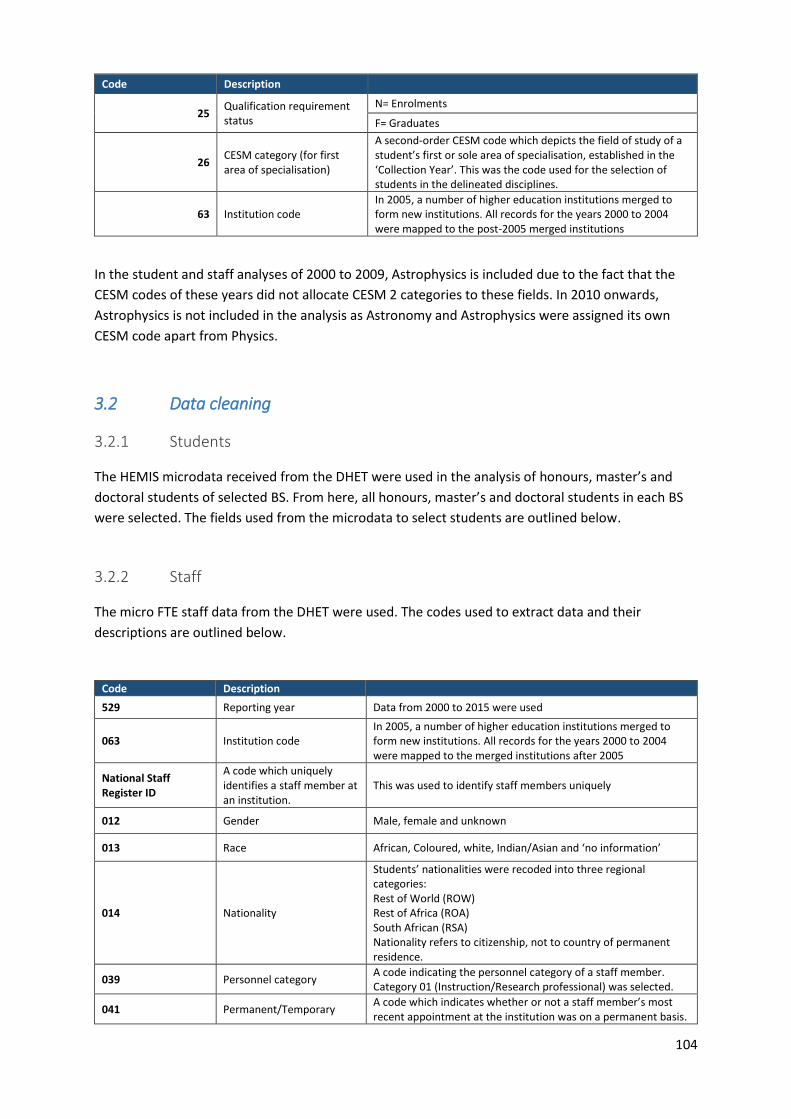
104
Code Description
25 Qualification requirement status
N= Enrolments
F= Graduates
26 CESM category (for first area of specialisation)
A second-order CESM code which depicts the field of study of a student’s first or sole area of specialisation, established in the ‘Collection Year’. This was the code used for the selection of students in the delineated disciplines.
63 Institution code In 2005, a number of higher education institutions merged to form new institutions. All records for the years 2000 to 2004 were mapped to the post-2005 merged institutions
In the student and staff analyses of 2000 to 2009, Astrophysics is included due to the fact that the
CESM codes of these years did not allocate CESM 2 categories to these fields. In 2010 onwards,
Astrophysics is not included in the analysis as Astronomy and Astrophysics were assigned its own
CESM code apart from Physics.
3.2 Data cleaning
3.2.1 Students
The HEMIS microdata received from the DHET were used in the analysis of honours, master’s and
doctoral students of selected BS. From here, all honours, master’s and doctoral students in each BS
were selected. The fields used from the microdata to select students are outlined below.
3.2.2 Staff
The micro FTE staff data from the DHET were used. The codes used to extract data and their
descriptions are outlined below.
Code Description
529 Reporting year Data from 2000 to 2015 were used
063 Institution code In 2005, a number of higher education institutions merged to form new institutions. All records for the years 2000 to 2004 were mapped to the merged institutions after 2005
National Staff Register ID
A code which uniquely identifies a staff member at an institution.
This was used to identify staff members uniquely
012 Gender Male, female and unknown
013 Race African, Coloured, white, Indian/Asian and ‘no information’
014 Nationality
Students’ nationalities were recoded into three regional categories: Rest of World (ROW) Rest of Africa (ROA) South African (RSA) Nationality refers to citizenship, not to country of permanent residence.
039 Personnel category A code indicating the personnel category of a staff member. Category 01 (Instruction/Research professional) was selected.
041 Permanent/Temporary A code which indicates whether or not a staff member’s most recent appointment at the institution was on a permanent basis.
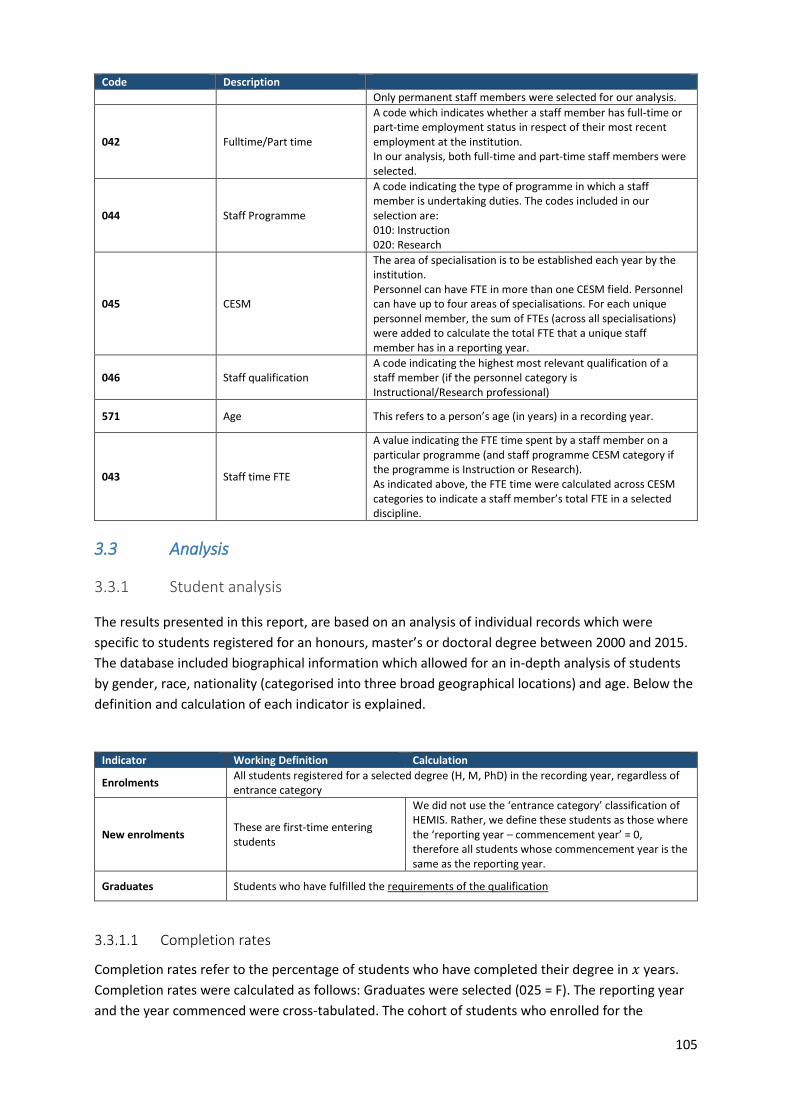
105
Code Description
Only permanent staff members were selected for our analysis.
042 Fulltime/Part time
A code which indicates whether a staff member has full-time or part-time employment status in respect of their most recent employment at the institution. In our analysis, both full-time and part-time staff members were selected.
044 Staff Programme
A code indicating the type of programme in which a staff member is undertaking duties. The codes included in our selection are: 010: Instruction 020: Research
045 CESM
The area of specialisation is to be established each year by the institution. Personnel can have FTE in more than one CESM field. Personnel can have up to four areas of specialisations. For each unique personnel member, the sum of FTEs (across all specialisations) were added to calculate the total FTE that a unique staff member has in a reporting year.
046 Staff qualification A code indicating the highest most relevant qualification of a staff member (if the personnel category is Instructional/Research professional)
571 Age This refers to a person’s age (in years) in a recording year.
043 Staff time FTE
A value indicating the FTE time spent by a staff member on a particular programme (and staff programme CESM category if the programme is Instruction or Research). As indicated above, the FTE time were calculated across CESM categories to indicate a staff member’s total FTE in a selected discipline.
3.3 Analysis
3.3.1 Student analysis
The results presented in this report, are based on an analysis of individual records which were
specific to students registered for an honours, master’s or doctoral degree between 2000 and 2015.
The database included biographical information which allowed for an in-depth analysis of students
by gender, race, nationality (categorised into three broad geographical locations) and age. Below the
definition and calculation of each indicator is explained.
Indicator Working Definition Calculation
Enrolments All students registered for a selected degree (H, M, PhD) in the recording year, regardless of entrance category
New enrolments These are first-time entering students
We did not use the ‘entrance category’ classification of HEMIS. Rather, we define these students as those where the ‘reporting year – commencement year’ = 0, therefore all students whose commencement year is the same as the reporting year.
Graduates Students who have fulfilled the requirements of the qualification
3.3.1.1 Completion rates
Completion rates refer to the percentage of students who have completed their degree in 𝑥 years.
Completion rates were calculated as follows: Graduates were selected (025 = F). The reporting year
and the year commenced were cross-tabulated. The cohort of students who enrolled for the

106
programme for the first time in year 𝑥 was then tracked to see when they graduated; i.e. what
percentage of students who enrolled in year 𝑥 graduated in year 𝑥 + 1, 𝑥 + 2, 𝑥 + 3, etc. This
number of graduates (of cohort𝑥) was then divided by the number of first enrolments (new) entrants
of year 𝑥. This then gives us one- or two-, or three year completion rates as a percentage (number of
graduates [year 𝑥 +1; x+2 …] divided by number of first enrolments [year 𝑥])
For doctoral completion rates, an adjusted completion rate was used. The minimum residency for a
PhD in South Africa is two years. The microdata show instances where a student graduates within the
same year. In these cases, the adjusted completion rates exclude the number of students who
graduated within the same year.
3.3.1.2 Conversion rates
This indicator is a measure of the ‘flow’ of post-graduate students from undergraduate to doctoral
graduation is the ‘conversion rate’ at each level of post-graduate studies. We calculate the
conversion rate by dividing the number of new enrolments (i.e. doctoral) in a particular year by the
number of graduates at the previous degree level (i.e. masters). It is important to note that this
indicator is not cohort-based. This is a simple measurement of the percentage new enrolments in a
given year divided by the number of graduates in the same year. In other words, at what rate do
master’s students convert to doctoral studies in general and without tracking students specifically?
3.3.1.3 Time-to-degree
This indicator refers to the total time (in years) a student takes to complete their degree. Time-to-
degree is only calculated for graduates and is calculated as ‘reporting year’-‘year commenced’ - 1,
under the condition that the qualification requirement status was coded as ‘F’ – the HEMIS code for
successful completion (graduates). In the calculation of doctoral time-to-degree, all cases less than
two years were excluded given the prescribed minimum registration time for a doctoral student in
South Africa. In the report, we compare each discipline’s mean time-to-degree with that of all BS
fields as well as that of all fields. The figure below shows the distribution of doctoral time-to-degree
across the seven BS fields for 2015. In 2015, the mean time-to-degree was 4.54 years (std. dev =
1.856) while the median was slightly shorter at 4 years.
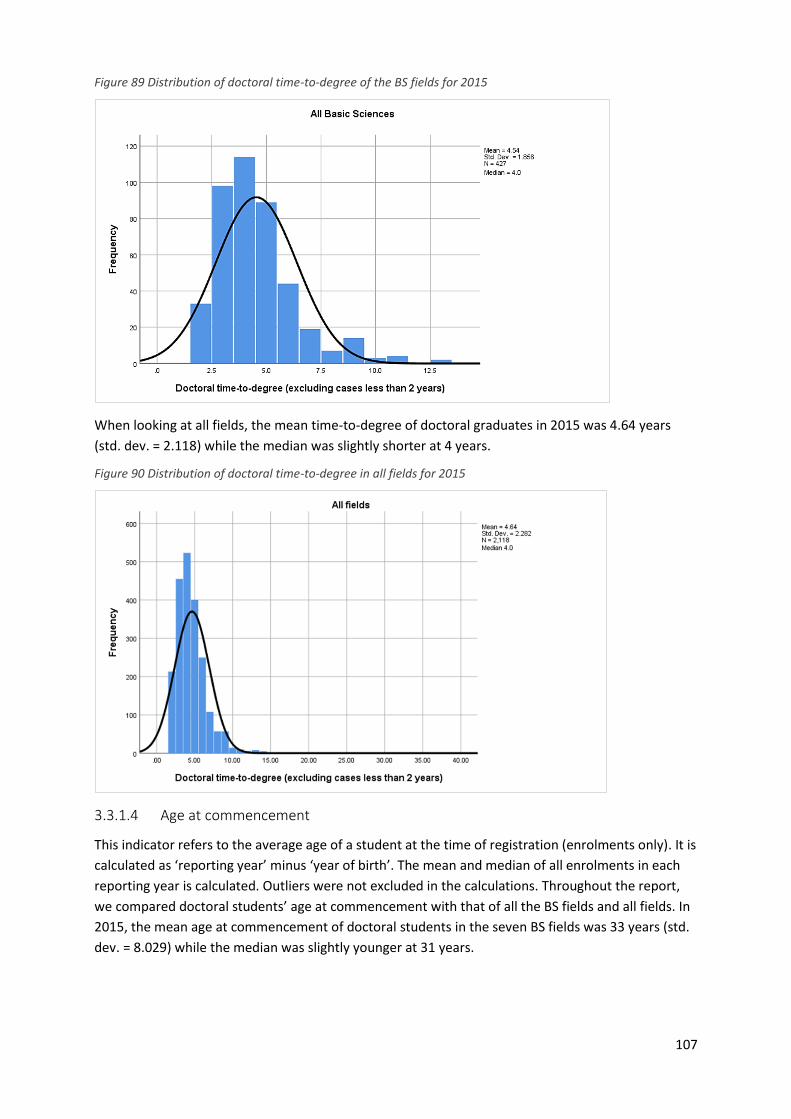
107
Figure 89 Distribution of doctoral time-to-degree of the BS fields for 2015
When looking at all fields, the mean time-to-degree of doctoral graduates in 2015 was 4.64 years
(std. dev. = 2.118) while the median was slightly shorter at 4 years.
Figure 90 Distribution of doctoral time-to-degree in all fields for 2015
3.3.1.4 Age at commencement
This indicator refers to the average age of a student at the time of registration (enrolments only). It is
calculated as ‘reporting year’ minus ‘year of birth’. The mean and median of all enrolments in each
reporting year is calculated. Outliers were not excluded in the calculations. Throughout the report,
we compared doctoral students’ age at commencement with that of all the BS fields and all fields. In
2015, the mean age at commencement of doctoral students in the seven BS fields was 33 years (std.
dev. = 8.029) while the median was slightly younger at 31 years.
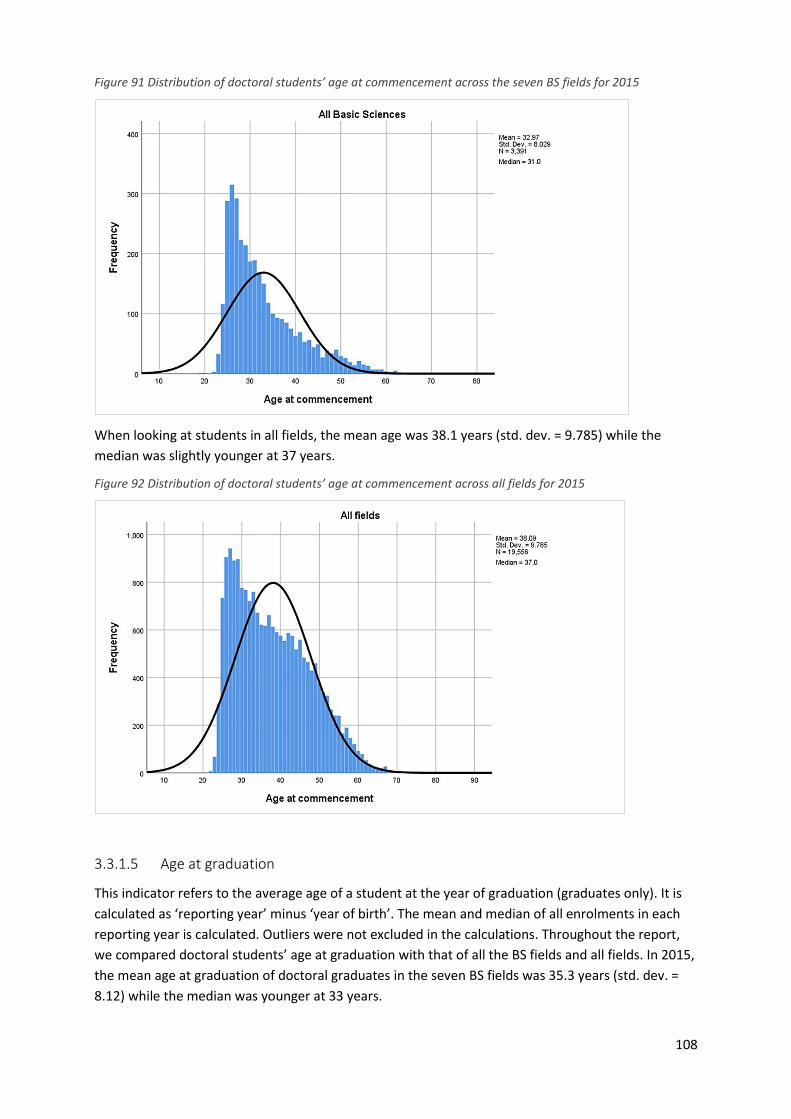
108
Figure 91 Distribution of doctoral students’ age at commencement across the seven BS fields for 2015
When looking at students in all fields, the mean age was 38.1 years (std. dev. = 9.785) while the
median was slightly younger at 37 years.
Figure 92 Distribution of doctoral students’ age at commencement across all fields for 2015
3.3.1.5 Age at graduation
This indicator refers to the average age of a student at the year of graduation (graduates only). It is
calculated as ‘reporting year’ minus ‘year of birth’. The mean and median of all enrolments in each
reporting year is calculated. Outliers were not excluded in the calculations. Throughout the report,
we compared doctoral students’ age at graduation with that of all the BS fields and all fields. In 2015,
the mean age at graduation of doctoral graduates in the seven BS fields was 35.3 years (std. dev. =
8.12) while the median was younger at 33 years.

109
Figure 93 Distribution of doctoral graduates’ age at graduation across the seven BS fields for 2015
When looking at students in all fields, the mean age was 40.5 years (std. dev. = 9.915) while the
median was slightly younger at 39 years.
Figure 94 Distribution of doctoral graduates’ age at graduation across all fields for 2015
3.3.2 Staff analysis
The criteria discussed in the section above were used to select individual records for the analysis of
staff FTE. Personnel can have FTE time in more than one CESM specialisation. Each staff member’s
total FTE time was calculated to determine a total FTE time spent in a selected discipline.

110
3.3.2.1 Supervisory capacity
In calculating supervisory capacity, we used a simple calculation in determining the number of PhD
enrolments per permanent instructional and research staff member who holds a PhD. The number of
doctoral (total) enrolments is then divided by the number of staff to determine a student-to-
supervisor ratio. This ratio then serves as an indicator of supervisory capacity at the doctoral level.
However, it should be noted that supervisory capacity is a less robust indicator and should be
interpreted within context as the distribution of students varies significantly across institutions. This
indicator does therefore not take into consideration the unequal distribution of students across
universities.
3.3.3 Race
In this report, we report on the racial classifications as used by Stats SA, which include black African,
coloured, Indian or Asian, white or other. We often report on BIC, which includes black African,
Indian/Asian and coloured groups. In the HEMIS database all students and staff are classified (in the
‘race’ field) as African irrespective of their country of birth. The HEMIS data makes no distinction in
that field between an African from South Africa (racial category) and, for example, an African from
Zimbabwe (a regional or country of birth category). In our analyses of race, we included only South
African staff and students.
3.3.4 Compound Annual Growth Rate (CAGR)
Throughout the report, we indicated rates of change through the use of the CAGR which is a measure
of growth over multiple time periods. The calculation of the CAGR is as follows:
(End Value/Start Value)^(1/Periods) – 1 written as:
𝑟𝐶𝐴𝐺𝑅 = (𝑋𝑓
𝑋0)
1𝑛
− 1
which is derived from the compound growth formula (that defines the geometric growth series):
𝑋𝑓 = 𝑋0(1 + 𝑟)𝑛
where 𝑋𝑓 is the end value, 𝑋0 is the start value and 𝑛 = 15 (the number of periods).

111
Appendix 4: Technical notes on bibliometric analyses
4.1 Bibliometric indicators
Below, we describe the calculation of the bibliometric indicators which include the percentage of
world share, the MNCS, the RFS and the journal impact factor.
4.1.1 Percentage world share
Percentage of the world’s publications that can be attributed to a single entity,
% 𝑊𝑆 =𝑛𝑓
𝑁𝑓× 100%,
where nf is the number of publications produced by the entity in field f and Nf is number of
publications produced by the whole world in field f.
4.1.2 Mean normalised citation score (MNCS)
The calculation of the MNCS starts with a calculation of the expected number of citations for any
publication in a specific field. Since publications are often associated with more than one field, each
publication and all citations it receives is attributed in equal fractions to all the fields associated with
it.
𝑒𝑖 =
∑𝑐𝑗
𝑓𝑗
𝑁𝑖𝑗=1
∑1𝑓𝑗
𝑁𝑖𝑗=1
,
where 𝑒_𝑖 is the expected number of citations for any publication in field 𝑖, 𝑁_𝑖 is the number of
publications in field 𝑖, 𝑐𝑗 is the number of citations received by publication 𝑗 and 𝑓𝑗 is the number of
fields associated with publication 𝑗. Now the normalised citation score for publication 𝑗 is given by
𝑛𝑐𝑠𝑗 = ∑𝑐𝑗
𝑒𝑖𝑓𝑗
𝑓𝑗
𝑖=1
=𝑐𝑗
𝑓𝑗∑
1
𝑒𝑖.
𝑓𝑗
𝑖=1
Finally, we can calculate MNCS for any set of 𝑛 publications:
𝑚𝑛𝑐𝑠 =1
𝑛∑ 𝑛𝑐𝑠𝑗
𝑛
𝑗=1
.
It should be noted that in our citation-based calculations, self-citations are not counted. A self-
citation is when a publication cites another, but one of the authors of the citing article is also an
author of the cited article. Furthermore, for this study, we use a two-year citation window so only
citations received up until the second year after publication are counted.

112
4.1.3 Relative field strength
The relative field strength or activity index of an entity in field 𝑓 is the ratio of two ratios, calculated
as
𝑟𝑓𝑠𝑓 = 𝑛𝑓
𝑛𝑡
𝑁𝑓
𝑁𝑡
,
where 𝑛𝑓 is the number of publications produced by the entity in field 𝑓, 𝑛𝑡 is the number of
publications produced by the entity across all fields, 𝑁𝑓 is the number of publications produced by
the world in field 𝑓 and 𝑁𝑡 is the total number of publications produced by the world. The RFS can
be interpreted as
𝑟𝑓𝑠 =field share of publications by entity
field share of publications by world.
4.1.4 Journal impact factor
The journal impact factor (𝑗𝑖𝑓𝑦) of a journal in year 𝑦 is calculated as
𝑗𝑖𝑓𝑦 =𝑐𝑦−1+𝑐𝑦−2
𝑛𝑦−1+𝑛𝑦−2,
where 𝑐𝑦−1 is the number of citations to articles published in the journal in year 𝑦 − 1, and 𝑛𝑦−1 is
the number of articles published in the journal in year 𝑦 − 1. The following table lists the journals in
the field of Statistics that South Africans published in in 2016 along with the number of South African
authored publications, the 𝑗𝑖𝑓2016 and the quartile of that journal amongst all journals in the field
ranked by their 𝑗𝑖𝑓2016.
Table 53 JIF and number of South African publications in Statistics in 2016
Journal nPubs JIF Quartile
JOURNAL OF STATISTICAL SOFTWARE 1 8.07821 1
BIOINFORMATICS 6 6.79893 1
FUZZY SETS AND SYSTEMS 1 2.7129 1
CHEMOMETRICS AND INTELLIGENT LABORATORY SYSTEMS 4 2.22464 1
JOURNAL OF THE ROYAL STATISTICAL SOCIETY SERIES A-STATISTICS IN SOCIETY 1 1.82955 1
JOURNAL OF THE AMERICAN STATISTICAL ASSOCIATION 1 1.80469 1
STATISTICS IN MEDICINE 1 1.72375 1
EXTREMES 2 1.71429 1
PROBABILISTIC ENGINEERING MECHANICS 1 1.69388 1
COMPUTATIONAL STATISTICS & DATA ANALYSIS 2 1.49378 1
INTERNATIONAL STATISTICAL REVIEW 1 1.43902 1
ENVIRONMETRICS 1 1.39362 1
SPATIAL STATISTICS 1 1.25882 2
QUALITY ENGINEERING 1 1.24359 2
TEST 1 1.20896 2
WILEY INTERDISCIPLINARY REVIEWS-COMPUTATIONAL STATISTICS 1 1.1875 2
BIOMETRICS 1 1.17117 2

113
Journal nPubs JIF Quartile
PHARMACEUTICAL STATISTICS 1 1.13265 2
ASTIN BULLETIN 1 1.0625 2
APPLIED STOCHASTIC MODELS IN BUSINESS AND INDUSTRY 4 1.04762 2
ANNALS OF THE INSTITUTE OF STATISTICAL MATHEMATICS 1 0.950617 2
QUALITY & QUANTITY 2 0.938338 2
JOURNAL OF AGRICULTURAL BIOLOGICAL AND ENVIRONMENTAL STATISTICS 2 0.803279 3
STATISTICS 1 0.777108 3
ELECTRONIC JOURNAL OF STATISTICS 1 0.751111 3
JOURNAL OF STATISTICAL COMPUTATION AND SIMULATION 2 0.740291 3
QUALITY TECHNOLOGY AND QUANTITATIVE MANAGEMENT 1 0.675676 3
STATISTICAL PAPERS 1 0.674242 3
AMERICAN STATISTICIAN 1 0.609756 3
METRIKA 1 0.598039 3
JOURNAL OF APPLIED STATISTICS 2 0.579832 3
STATISTICAL METHODS AND APPLICATIONS 1 0.537037 3
COMMUNICATIONS IN STATISTICS-SIMULATION AND COMPUTATION 2 0.519062 3
STATISTICS & PROBABILITY LETTERS 4 0.515432 3
REVSTAT-STATISTICAL JOURNAL 1 0.419355 4
HACETTEPE JOURNAL OF MATHEMATICS AND STATISTICS 1 0.40625 4
STOCHASTIC MODELS 1 0.4 4
BRAZILIAN JOURNAL OF PROBABILITY AND STATISTICS 1 0.378378 4
COMMUNICATIONS IN STATISTICS-THEORY AND METHODS 5 0.340974 4
UTILITAS MATHEMATICA 3 0.255682 4
JOURNAL OF STATISTICS & MANAGEMENT SYSTEMS 1 0.068966 4

OPERATIONAL PLAN 2019-20
RESEARCH DEVELOPMENT AND SUPPORT
DEPARTMENT OF SCIENCE AND INNOVATIONPrivate bag X894, PRETORIA, 0001DST Building No 53, Scientia Campus, Meiring Naude Road, Brummeria, PRETORIATel: +27 12 843 6666, Fax +27 12 349 1053 • www.dst.gov.za
Copyright © 2022 FDOKUMEN