Opening the Courthouse Doors: The Need for More Hispanic Judges
37
-
Upload
latinopolicy -
Category
Documents
-
view
1 -
download
0
Transcript of Opening the Courthouse Doors: The Need for More Hispanic Judges


Suggested citation: Angelo Falcón, Opening the Courthouse Doors: The Need for More Hispanic Judges (New York: Puerto Rican Legal Defense and Education Fund, 2002)

CONTENTS
Introduction: The Continuing Problem of Hispanic-American Underrepresentation in the Judiciary 1 • Hispanics, the U.S. Legal System and American Democracy 1 • Hispanic Underrepresentation on the Bench 3 —Projections of an Insurmountable Gap 3 • Acknowledgments 4 I. Hispanic-Americans and the Federal Judiciary 6 • The Numbers 6 —Hispanic Disparity in Federal Judgeships 6 • Key Issues 9
—The Campaign to Appoint the First Hispanic to the U.S. Supreme Court 12 —The Bush Record 13 II. Hispanic-Americans in the State Judiciary 14 • The Numbers 14 —Hispanic Disparity in State Judgeships 15 • Key Issues 17 —The Case of New York State 19 III. Conclusion 22 • The Value of a Diverse Judiciary 22 • Recommendations for Change 22 References 24 Appendix: Data Tables 27

O ne of our greatest gifts is the rich diversity we enjoy as Americans, and it should be reflected in our government and justice system as much as possible — not at the exclusion of the majority, but by the inclusion of the minority. … Diversity is not only an issue for minorities. It impacts upon the entire legal profession. The justice system survives because the public respects it. … [Judges’] power comes from respect for the rule of law and confidence in impartial and fair justice. In order to maintain that respect, the justice system must strive to promote diversity.
—Honorable Joseph H. Rodríguez (2002) Senior United States District Judge
U.S. District Court for the District of New Jersey
W e feel that an equitable representation of Hispanic and other minorities in the judiciary would promote greater respect [for] and understanding of the legal system. In addition, we believe that their presence would enhance the integrity of the process as well as contributing to the quality of judicial decisions. Finally, of special importance to all minorities and indeed to the nation as a whole is the opportunity to provide them with invaluable role models in an arena where we have been absent for so long.
—Congressional Hispanic Caucus (1992)
T oday, it is clear that little progress has been made in terms of increasing the number of Hispanics serving on Federal and state level judicial benches. Given that Hispanic Americans are now the nation’s largest minority group, and the ample number of qualified potential nominees, our courts should include many more Hispanic American judges. … Failing to achieve equitable representation runs the risk of having our legal system lose its legitimacy in the eyes of many Americans.
—Congressional Hispanic Caucus (2002)
O n the significance of the need for an appointment of the first Hispanic-American to the U.S. Supreme Court: “The rest of the country would recognize that Hispanic-Americans are equals. If a Hispanic can sit at that level, you know how many doors of opportunity would open? Respect is what it all boils down to.”
— Carlos G. Ortiz (quoted in Mauro 2000)

INTRODUCTION: THE CONTINUING PROBLEM OF HISPANIC-AMERICAN UNDERREPRESENTATION IN THE JUDICIARY
T he representation of Hispanic-Americans in the country’s judiciary has taken on an urgency in recent years. During the 2000 Presidential election, for example, the candidates of both major parties
committed themselves to giving priority to the consideration of a Hispanic-American for the next appointment to the United States Supreme Court. As we commence a new century, this issue continues to occupy a major place on the public policy agendas of the Hispanic-American community throughout the country. The equitable representation of Hispanics in the federal and state courts is also in the best interest of all Americans. This report, Opening the Courthouse Doors, documents the lack of progress that Hispanic-Americans have made in attaining the judgeships in the state and federal courts. Based on unpublished data on minority judges at the federal level and data compiled at the state level by the American Bar Association, the Puerto Rican Legal Defense and Education Fund wanted to look specifically at the progress made in the selection of Hispanic-American judges in the United States. We recognize that achieving greater diversity in our federal and state judiciaries through appointments of a greater number of Hispanic-Americans as judges is not just a matter of numbers alone. While numbers are important, it is equally important that the bench include individuals with strong records of demonstrated interest in, and meaningful connections to the Hispanic community. Hispanics, the U.S. Legal System and American Democracy
A ccording to the 2000 Census, the Hispanic-American population in the United States (excluding Puerto Rico and U.S. territories) stood at 35.3 million, a dramatic increase of 58 percent over the
previous decade. Projections by the Census Bureau of the Hispanic-American population for 2000 had been significantly lower, 31 million. The Hispanic-American share of the total U.S. population went from 8.9 percent to 12.5 percent between 1990 and 2000. The Census Bureau conservatively projects the Hispanic-American population to grow in the next one hundred years to over 190 million, or 33.3 percent of the total

OPENING THE COURTHOUSE DOORS: THE NEED FOR MORE HISPANIC-AMERICAN JUDGES
U.S. population. (U.S. Census Bureau 2000) By the next century, this would make the Hispanic-American population more than double the size of the Black population and almost as large as the non-Hispanic white population. Since the Census 2000 results became known, there has been much discussion in this country over the role of the Hispanic population in this society. What impact will this major Hispanic presence have on American society and, conversely, what impact will American society have on Hispanics? How will American institutions, like government and its courts, address the issues, needs and concerns of Hispanics? This report was written with the conviction that today, more than ever, there is an urgent need to strengthen democracy in the United States. The role of the Supreme Court in the controversial resolution of the 2000 Presidential election crisis underlined the critical importance of the judiciary in a representative democracy. It is an important source of legitimacy for our governing institutions, perhaps more so to a community like that of Hispanics with so many of its members being new to this country and so many being disproportionately affected by its legal system. The problems of both linguistic and cultural misunderstanding remain, for far too many Hispanics, barriers to justice and fairness. As is the case with African-Americans, Hispanics find themselves more involved with the judicial system than other Americans. (Moore and Pachon 1985: 164-168, and Reynoso 2000) The courts and other government agencies regulate the large numbers of Hispanics who are immigrants, both legal and undocumented. Hispanic-Americans in 1999 were crime victims at a rate of 35.3 per 1,000 of those ages 12 and over, compared to a rate of 32.7 for non-Hispanic whites. (U.S. Bureau of Justice Statistics 2000) In terms of property victimization (burglaries, car theft and theft), Hispanic-Americans were affected at a rate of 232.5 compared to 190.0 for whites. On the other end of the justice system, there were 310,400 Hispanic-American inmates in 2000 in state and federal prisons and local jails, representing 16.1 percent of total prisoners, despite being 11.0 percent of the total adult population. (U.S. Department of Justice 2001) In ten states, Hispanic men are incarcerated at rates between 5 and 9 times that of white men; in 8 states, Hispanic women are incarcerated at rates that are 4 and 7 times greater than white women; and in 4 states, Hispanic youth under 18 are incarcerated in adult facilities at rates between 7 and 17 times greater than white youth. (Human Rights Watch 2002) These developments together bring more Hispanics in contact with the courts than most other Americans. The fairness of the judicial system, therefore, has become an important lens by which Hispanics come to view American society and come to form attitudes about its fairness.
2

A REPORT OF THE PUERTO RICAN LEGAL DEFENSE AND EDUCATION FUND (PRLDEF)
Hispanic Underrepresentation on the Bench
T his report uses disparity ratios to indicate the degree of underrepresentation experienced by Hispanics in state and federal judgeships. This is calculated as the ratio between the Hispanic
percentage of the population and the Hispanic percent of judgeships. Complete disparity is indicated by a value of –100.0 percent, and perfect parity is indicated by a value of 0.0 percent (or beyond parity with a value higher than 0.0 percent). This statistic is used in this report to indicate the degree of the gap in Hispanic representation in the judiciary and not to promote proportionality or “quotas” in the selection of judges on the basis of population. The use of population is one way to gauge the distance in terms of representation on the bench and the public the courts serve. The availability of a large enough qualified pool of Hispanic-American lawyers and judges to be selected or promoted as judges is not at issue here given the current and historic underutilization of Hispanics in judicial selections throughout the country. Besides the lack of reliable data on experienced Hispanic attorneys and judges, this potential measure of underrepresentation is not used in this report because population was viewed as more useful in providing a measure of public perception of the lack of Hispanics on the bench, given the courts’ interactions with the general population. The percentage of Hispanic-Americans holding federal judgeships was 3.7 percent in 2000, compared to 3.8 percent of those holding state judgeships. (see Appendix: Data Table on page 27) Dividing these percentages by the Hispanic percentage of the total U.S. population (12.5 percent) yields Hispanic judgeship disparity ratios of –70.4 percent at the federal level and –69.7 percent at the state level. At the federal level (see Table 5 on page 32), Hispanic representation in judgeships has grown slightly in disparity over the last decade (going from a disparity ratio of –70.0 to –70.4 percent), while it has achieved a slight improvement for state judgeships (from –70.4 to -69.6 percent). What is remarkable is the high degree of Hispanic underrepresentation at both the state and federal levels of the judiciary. Projections of an Insurmountable Gap In the 1990s, the number of Hispanic-American judges at the state and federal levels combined grew by 54.7 percent, from 665 in 1990 to 1,029 in 2000. The growth in Hispanic state judgeships was higher, 55.0 percent, than federal judgeships, 47.6 percent. However, when taking
3

OPENING THE COURTHOUSE DOORS: THE NEED FOR MORE HISPANIC-AMERICAN JUDGES
into consideration past and current underrepresentation, and comparing it with the dramatic actual and projected rates of growth of the Hispanic population, the chance of closing this gap appears insurmountable. This degree of this growth is misleading given the very small number of Hispanic judges that constituted its base in the first place. For example, if these 1990 to 2000 trends continue, by the year 2050 (when the Census conservatively projects the Hispanic-American population to reach 24.3 percent of the total population), the number of Hispanic-American judges would have grown to 4.7 percent in the federal courts and 5.3 percent in the state courts. (See Chart 1 on the next page) Over this time period, this would constitute a widening gulf between Hispanic representation in the population and as judges. We, therefore, conclude that Hispanic-American underrepresentation in the state and federal judiciaries of the United States is and will continue to be a serious problem for our society. Unless, that is, current policies and practices focusing on the diversity of the bench are urgently and critically reexamined. This report aims at promoting a public awareness that will lead to these needed changes.
Acknowledgements
A ngelo Falcón, Senior Policy Executive of the Puerto Rican Legal Defense and Education Fund (PRLDEF) and Director of the PRLDEF Institute for Puerto Rican Policy, wrote this report. Minerva Delgado, M.P.P., Special Projects Coordinator
of the PRLDEF Institute for Puerto Rican Policy, conducted the initial bibliographical research. Special thanks for their feedback go to my colleagues at PRLDEF: Juan A. Figueroa, President and General Counsel; Vivian Todini, Media Consultant; and Foster Maer, Director of Litigation. Invaluable outside reviews were provided by Federal Circuit Court Judge Sonia Sotomayor; and attorneys Mari Carmen Aponte, Juan Cartagena and William Ho -Gonzalez, to whom we are eternally grateful for assuring that this report was on point. The impetus for this report came from Carlos G. Ortiz, Chair of the PRLDEF Board of Directors, who also currently serves as General Counsel of Goya Foods, Inc. and was a past President of the Hispanic National Bar Association (HNBA). He is responsible for the collection of much of the data used in this report, specifically those on the federal judiciary. Carlos’ lifelong mission and tireless campaigns for the appointment of the first Hispanic justice to the United States Supreme Court and his general advocacy for more Hispanic judges, at all times stressing the need for the courts and its judges to be connected in concrete ways to the Hispanic community, served as an inspiration to all of us involved in the development of this report.
4

A REPORT OF THE PUERTO RICAN LEGAL DEFENSE AND EDUCATION FUND (PRLDEF)
5

OPENING THE COURTHOUSE DOORS: THE NEED FOR MORE HISPANIC-AMERICAN JUDGES
I. HISPANIC-AMERICANS AND THE FEDERAL JUDICIARY
Please note that federal judgeships from Puerto Rico are excluded from this report because all the members of the judiciary in this jurisdiction are Hispanic and including them would unfairly skew the results of this analysis. (American Bar Association 2001: 219-243) This report also uses as its base the number of full-time Article III authorized judges and excludes those who has assumed senior status since they generally are not full-time and they generally function under reduced workloads. As referred to above, the federal judges discussed in this report are the so-called “Article III” judges of the U.S. Supreme Court, Court of Appeals and Federal District Courts. These positions are filled by Presidential appointment with Senate confirmation. While the positions of U.S. Bankruptcy Judge, U.S. Magistrate Judge and various specialized federal courts are important (and Hispanics also suffer from underrepresentation in these posts), these positions are outside the scope of this study.
The Numbers
O f the 835 authorized full-time active federal Article III judgeships in 2000, Hispanic-Americans held only 31 of these life-tenured posts, or a mere 3.7 percent of the total, compared to 12.5
percent of the U.S. population being Hispanic. (see Table 1 on page 28) Three-fourths of the Hispanic-American federal judges were in federal district trial courts, and the remainder in circuit courts of appeal. The federal courts in Texas and California alone account for half of the Hispanic-American federal judges in the country. In addition, the 31 Hispanic federal judges are concentrated in only 13 states and the District of Columbia. In short, 37 states and 7 of the 13 circuits (which consist of the 11 circuits, the District of Columbia Circuit and the Federal Circuit) have no Hispanic-American federal judges at all.
Hispanic Disparity in Federal Judgeships What is also striking from the data is that none of the top 10 states with the highest concentrations of Hispanics come close to achieving parity in their percentage of Hispanic Americans as federal judges. (see Chart 2 on the next page and Table 5 on page 32) These states are New Mexico (Disparity Ratio = -66.0 percent), California (-71.6 percent), Texas (-47.0 percent), Arizona (-47.2 percent), Nevada (-100.0 percent), Colorado (-41.5 percent), Florida (-72.9 percent), New York (-81.1 percent), New Jersey (-60.4 percent) and Illinois (-52.3 percent).
6

A REPORT OF THE PUERTO RICAN LEGAL DEFENSE AND EDUCATION FUND (PRLDEF)
Texas has the distinction of being the state with both the highest number and percentage of Hispanic-American federal judges in the country (10, comprising 16.9 percent of total federal judges in the state). (see Chart 3 on the next page) Following Texas, arguably the state with the greatest Hispanic political influence, those states with at least 10 percent of their federal judges being Hispanic-American are (ranked according to per-centage): New Mexico 14.3 percent (1 Hispanic-American federal judge), Kansas 14.3 percent (1), Arizona 13.3 percent (2), and Colorado 10.0 percent (1). In California, which has the second highest number of Hispanic-American federal judges (5), these judges make up only 7.2 percent of the total. Considering that California is the state with the largest Hispanic population (close to 11 million or 32.4 percent of its population), it certainly has much room for improvement in addressing the severe underrepresentation of Hispanics among its federal judges. Calculating a Hispanic-American Federal Judges Disparity Index (Hispanic-American percent of federal judges divided by Hispanic-American percent of the total population, subtracting 1), we find that parity (0.0 percent and above) for Hispanic-Americans in the federal judiciary has been achieved (and exceeded) in only two states: Indiana (Disparity Ratio = +118.0 percent) and Kansas (+104.0 percent). (see Table 5 on page 32) These are followed by the following four states (ranked in order of smallest Disparity Ratios): Connecticut (-11.4 percent), Pennsylvania (-32.3 percent), Colorado (-41.5 percent) and Texas (-47.0).
7

OPENING THE COURTHOUSE DOORS: THE NEED FOR MORE HISPANIC-AMERICAN JUDGES
Looking at 1990-2000 trends in the appointments of Hispanic-Americans to the federal judiciary, there has been a dramatic growth of 34.8 percent, a rise from 23 to 31 Hispanic federal judges. (see Chart 4 on the next page and Table 3 on page 30) When analyzed by state, the picture is much more mixed. Two states doubled their number of Hispanic federal judges in this period: Arizona and Florida, both going from having 1 to 2 Hispanic-American federal judges. This was followed by a percentage increase in Texas of 25.0 percent (from 8 to 10). As already mentioned, in 2000 there were 37 states, as well as 7 federal circuits, with no Hispanic-American federal judges. The 4th. 6th, 7th, 8th, 11th, District of Columbia and Federal Circuit courts of appeal have no Hispanic-American judges. However, the following six jurisdictions went from having no Hispanic-American federal judges to having at least one during this period: Colorado (from 0 to 1), District of Columbia (0 to 1), Illinois (0 to 2), Kansas (0 to 1), New York (0 to 2) and Pennsylvania (0 to 1). On the other hand, the following three states had a decrease during this period in the number of Hispanic-American federal judges: Michigan (1 to 0), Missouri (1 to 0), and New Mexico (2 to 1). Most states, 36, had no change at all, with most of these having no Hispanic-American federal judges at all during this period. The appointment of Hispanic-American federal judges has, however,
8

A REPORT OF THE PUERTO RICAN LEGAL DEFENSE AND EDUCATION FUND (PRLDEF)
consistently increased since 1969, regardless of which political party was in the White House. (see Chart 5 on the next page) Among Republican Presidents, Hispanics went from being merely 0.9 percent of Nixon appointments in 1969-74, to 4.2 percent of Bush appointments in 1989-92. (Alliance for Justice 2001) Among Democrats, Hispanic appointments went from 6.2 percent under Carter in 1977-80 to 6.3 percent under Clinton in 1993-2000. While, to date, Democratic Presidents have consistently made higher percentage of Hispanic-American judicial appointments than Republicans, the rate of percentage point growth over time under Republican Presidents in this period has been more dramatic (from 0.9 to 4.2 percent), while the Democratic record has been virtually stagnant (6.2 to 6.3 percent) at this level.
Key Issues
A lthough the first Hispanic-American on the Article III federal bench was appointed more than forty years ago, the problem of extreme underrepresentation at this level has been persistent.
Reynaldo G. Garza of Texas became the first Hispanic-American federal judge when he was appointed to the U.S. District Court for the Southern District of Texas in 1961, and the first Hispanic-American on a U.S. Court of Appeals in 1979. (Fisch 1996) However, today, although Hispanic-Americans make up 13 percent of the country’s population, they are less than 4 percent of full-time federal judges.
9

OPENING THE COURTHOUSE DOORS: THE NEED FOR MORE HISPANIC-AMERICAN JUDGES
Federal judges are appointed for life. They decide the most important issues of our times -- issues of life and death, of property rights as well as those profoundly affecting every aspect of the daily life of our nation. They also serve as final arbiters of disputes between the branches of the federal government. The importance of Hispanic-American representation in the federal judiciary, especially the courts of appeals, not only stems from the critical role this level of the court system plays, but also its increasing function as a pipeline to becoming a Justice of the U.S. Supreme Court. As Tribe (2001: 9) put it, “… the circuit courts have increasingly served as a kind of ‘farm team’ for Supreme Court nominations. In fact, 7 of the 9 sitting U.S. Supreme Court Justices had previously served, for varying lengths of time, on these courts. Other important factors in increasing the representation of qualified Hispanic-Americans on the bench are the competing factors of timeliness, but thoroughness as well. The record shows that delays in the confirmation process have been more pronounced for minority candidates. A study of the 105th Congress found that Senate review of federal judicial nominations for white nominees took an average of 186 days (167 days for white men), compared to 246 for minority candidates. (Citizens for Independent Courts 2000: 68 and 70) An updated review by USA Today discovered, “On average, its takes about eight months for minorities and women to get through the confirmation
10

A REPORT OF THE PUERTO RICAN LEGAL DEFENSE AND EDUCATION FUND (PRLDEF)
process; the average for white men is five months … .” (Biskupic 2000). In recent years, several qualified Hispanic nominees to the federal bench were subject to lengthy delays in having their nominations considered. In some instances, these nominations – including nominations of distinguished, sitting Hispanic-American district judges for promotion to the courts of appeals – languished in committee for as long as 4 years before finally being allowed to come to a vote. In other instances, nominations of extremely well qualified Hispanic candidates for judgeships were not considered at all. The high-profile cases of the successful Richard Paez and Sonia Sotomayor nominations, and the many unsuccessful cases of nominees defeated without a vote such as those of Jorge C. Rangel and Enrique Moreno, illustrate this problem. Paez, for example, who in 1994 had become the first Mexican-American on Los Angeles’ federal district court, had his nomination by President Clinton to the 9th Circuit Court of Appeals languish in the Senate for a record four years. (Biskupic 2000). Jorge Rangel, one of two nominees for the 5th Circuit, who did not even get a committee hearing, noted in a letter to President Bill Clinton: “Our judicial system depends on men and women of good will who agree to serve when asked to do so, But public service asks too much when those of us who answer the call are subjected to a confirmation process dominated by interminable delays and in action.” (Biskupic 2000) Moreover, legitimate concerns about such extensive delays have led some well-qualified Hispanic potential judges to decline consideration for nomination. On the other hand, we equally acknowledge the need for all judicial nominees – including Hispanic nominees – to undergo careful background investigation and scrutiny during the nomination and confirmation processes. This is necessary to assess the integrity, legal qualifications and judicial temperament of each nominee, as well as their record of involvement in and concern for the needs of the Hispanic community. While delays should be no longer than necessary, we also believe that evaluations should be done as thoroughly as possible without sacrificing equally important and necessary adequate periods of review. It, therefore, behooves nominating officials to make their nominations as early in their terms of office as possible. The Campaign to Appoint
11

OPENING THE COURTHOUSE DOORS: THE NEED FOR MORE HISPANIC-AMERICAN JUDGES
the First Hispanic to the U.S. Supreme Court
T he campaign to have a Hispanic-American appointed to the U.S. Supreme Court has been waged in earnest over the last decade or so. Calling it “the single most unifying issue in the history of the
Hispanic community,” Carlos Ortiz, Chair of the Board of Directors of the Puerto Rican Legal Defense and Education Fund (PRLDEF), has been at the forefront of this campaign. (Mauro 2000) Among other things, Ortiz points to major meetings of Hispanic leaders with President George Bush in 1992, Vice President Al Gore in 1994 and President Bill Clinton in 1993 and 1999 to discuss this issue. In the 2000 presidential campaign, the candidates of the two major political parties both pledged to seriously consider a Hispanic-American nomination for the next vacancy on the high court. Ortiz argues that there have been a number of misconceptions about having this goal realized, none of which have been accurate for some time: 1. The misperception that “the Hispanic community, with its Mexican-
American, Puerto Rican and Cuban-American components among others, is too fractured to unite behind a single Hispanic candidate.”
2. The notion “that there is no single, obvious choice among potential Hispanic nominees. … There’s a perception that there’s no Hispanic Thurgood Marshall.”
3. “Another reason cited in the past … was the small number of Hispanic judges with experience.”
In response, groups like the Hispanic National Bar Association (HNBA) had developed “short lists” in the past of potential Hispanic-American nominees. Currently, the organization has instead decided to release a more inclusive bipartisan “long list” of 60 Hispanics to the White House to further promote Hispanic unity on nominations to the high court. The Hispanics on this “long list” are merely meant to be illustrative of the substantial pool of Hispanic legal talent that exists throughout the country. This list makes it abundantly clear that it can no longer be asserted in good faith that the pool of potential Hispanic nominees to the United States Supreme Court is too small or inadequate. At both the state and federal levels, organizations such as the HNBA and other state and local Hispanic bar associations have made the case that, notwithstanding the extreme historical underutilization of Hispanic attor-neys as judges, there are more than sufficient numbers of qualified Hispanic attorneys and judges in absolute terms to achieve much greater parity than is currently the case. The Bush Record
12

A REPORT OF THE PUERTO RICAN LEGAL DEFENSE AND EDUCATION FUND (PRLDEF)
P resident George W. Bush’s track record of Hispanic-American appointments in all areas, including the judiciary, is being closely mintoered by organizations such as the National Hispanic
Leadership Agenda and the National Association of Latino Elected and Appointed Officials. While his initial Presidential appointments of Hispanic-Americans to non-judicial posts appear positive, his track record on judicial appointments as Governor of Texas is less reassuring. While the state of Texas has the highest number of Hispanics in both federal and state judgeships, the vast majority of these pre-dated Bush’s governorship. (Herman and McCarthy 1998, Hight and Herman 2000, Hoppe 2000, and Mittelstadt 2000). In addition, a large number of Hispanic state judges in Texas occupy lower -level posts of justice of the peace, masters, referees and administrative judgeships. (see American Bar Association 2001: 244-272) Nonetheless, the dramatic growth of the Hispanic population (and, of importance to politicians, its share of voters) has put the issue of the need to dramatically improve Hispanic-American representation on the federal courts squarely on the agenda of our nation’s political leaders and political parties.
13

OPENING THE COURTHOUSE DOORS: THE NEED FOR MORE HISPANIC-AMERICAN JUDGES
II. HISPANIC-AMERICANS IN THE STATE JUDICIARY
Please note that the number of state court judgeships used in this report are based on the most complete public sources available. The numbers of state judicial positions may include, depending on the state, a number of local judicial posts. These variations in the statistics have a variety of causes, including the different structures of court systems in different states, vacant positions and the varying ways that quasi-judicial positions are defined as being either judicial or administrative. Despite these limitations, these sources were used in order to assure consistency over the 10 year period covered by this study.
The Numbers
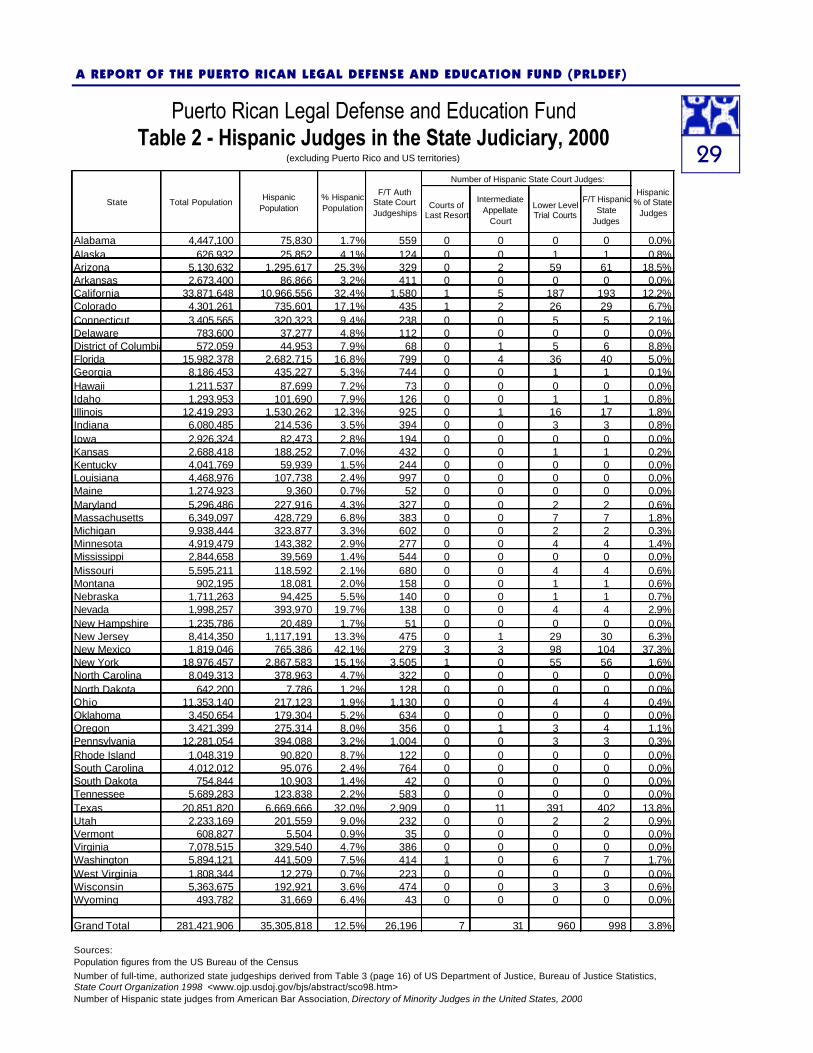
O f approximately 26,196 judges in state courts, Hispanic-Americans held only 998 of these posts, or a mere 3.8 percent of the total, a major case of underrepresentation compared to
the 12.5 percent of the U.S. population that is Hispanic. (see Table 2 on page 29) The overwhelming number of Hispanic-American state judges were in the lower level trial courts (96.3 percent), with only 3.1 percent in the intermediate appellate courts and 0.6 percent in the courts of last resort. There are 21 states with no Hispanic-American state judges. Compared to the federal judiciary, Texas and California have an even greater share of Hispanic-American state court judges, together accounting for 59.6 percent of the total. Most Hispanic-American state judges (91.7 percent) were concentrated in only eight states: Texas (402 Hispanic-American state judges), California (193), New Mexico (104), Arizona (61), New York (56), Florida (40), New Jersey (30), and Colorado (29). In a state like Texas, it is important to note that many of the Hispanic state judges are lower level administrative judges, justices of the peace, masters and referees. (see American Bar Association 2000: 244-272) While Texas has the greatest number of Hispanic-American state judges (402), being home to 40.3 percent of all Hispanic-American state judges in the country, it does not have the highest percentage of its judges being Hispanic-American. (see Chart 6 on the next page) The jurisdictions with at least 5 percent of their state judges being Hispanic-American are, in rank order: New Mexico (37.3 percent), Arizona (18.5 percent), Texas (13.8 percent), California (12.2 percent), District of Columbia (8.8 percent), Colorado (6.7 percent), and New Jersey (6.3 percent). Despite having seemingly large numbers of Hispanic-American state judges, Texas and California rank third and fourth, respectively, in the percentage of
14

A REPORT OF THE PUERTO RICAN LEGAL DEFENSE AND EDUCATION FUND (PRLDEF)
total state judges these numbers represent, although these are the two states with the largest Hispanic populations in the country. Hispanic Disparity in State Judgeships
W e have calculated what we call a Hispanic-American State Judges Disparity Ratio by dividing the Hispanic-American per -centage of state judges by the Hispanic-American percentage
of the total population and subtracting 1. A result of this Index of -100.0 percent means total disparity, while one of 0.0 percent or above means that state has achieved or exceeded parity. Of the top 10 states with the highest concentrations of Hispanics, only 2 come close to approaching parity in their percentages of Hispanic state judges (New Mexico’s Disparity Ratio is -11.4 percent, and Arizona’s is –26.6 percent). (see Chart 7 on the next page and Table 5 on page 32) The Disparity Ratios for the other eight states are: New Jersey (-52.4 percent), Texas (-56.8 percent), Colorado (-61.0 percent), California (-62.3 percent), Florida (-70.2 percent), Illinois (-85.3 percent). Nevada (-85.1 percent), and New York (-89.4 percent). In terms of all 50 states and jurisdictions, only the District of Columbia has achieved (actually exceeded) parity (Disparity Ratio = +112.3 percent). D.C. was followed by the following five states (ranked in order smallest
15
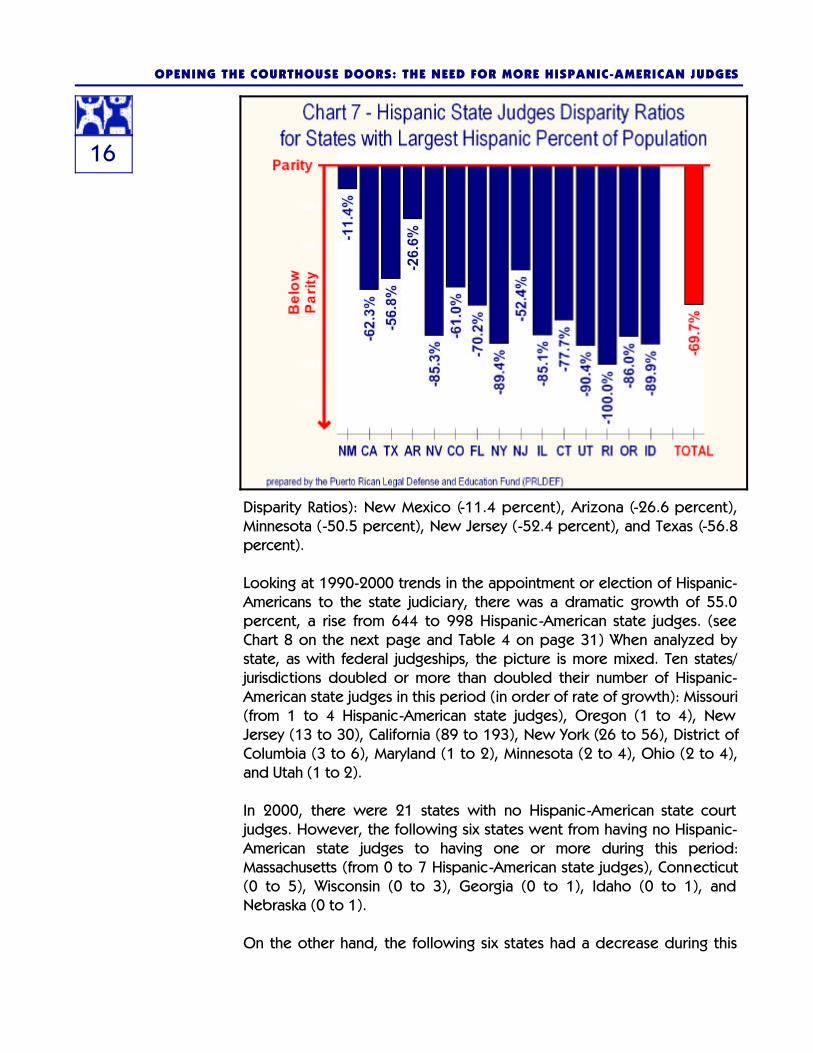
OPENING THE COURTHOUSE DOORS: THE NEED FOR MORE HISPANIC-AMERICAN JUDGES
Disparity Ratios): New Mexico (-11.4 percent), Arizona (-26.6 percent), Minnesota (-50.5 percent), New Jersey (-52.4 percent), and Texas (-56.8 percent). Looking at 1990-2000 trends in the appointment or election of Hispanic-Americans to the state judiciary, there was a dramatic growth of 55.0 percent, a rise from 644 to 998 Hispanic-American state judges. (see Chart 8 on the next page and Table 4 on page 31) When analyzed by state, as with federal judgeships, the picture is more mixed. Ten states/jurisdictions doubled or more than doubled their number of Hispanic-American state judges in this period (in order of rate of growth): Missouri (from 1 to 4 Hispanic-American state judges), Oregon (1 to 4), New Jersey (13 to 30), California (89 to 193), New York (26 to 56), District of Columbia (3 to 6), Maryland (1 to 2), Minnesota (2 to 4), Ohio (2 to 4), and Utah (1 to 2). In 2000, there were 21 states with no Hispanic-American state court judges. However, the following six states went from having no Hispanic-American state judges to having one or more during this period: Massachusetts (from 0 to 7 Hispanic-American state judges), Connecticut (0 to 5), Wisconsin (0 to 3), Georgia (0 to 1), Idaho (0 to 1), and Nebraska (0 to 1). On the other hand, the following six states had a decrease during this
16

A REPORT OF THE PUERTO RICAN LEGAL DEFENSE AND EDUCATION FUND (PRLDEF)
period in the number of Hispanic-American state judges: Alabama (1 to 0 Hispanic-American state judges). Hawaii (1 to 0), Louisiana (4 to 0), Michigan (3 to 2), Nevada (7 to 4), and Virginia (1 to 0). A large number of states, 20, had no change at all, with most of these having no Hispanic-American state judges at all during this period.
Key Issues
I n a recent study, University of Maryland School of Law Professor Sherrilyn Ifill observed, “Despite dramatic gains in the legislative arena in the past 20 years, racial diversity on state courts remains a much-
lauded but seemingly elusive goal.” (Ifill 1997: 96) While that study’s focus was the African-American community, its findings are equally relevant to Hispanic-Americans. Ifill (1997: 100) argues for the need to focus on state courts for the “simply pragmatic” reason that they are “responsible for resolving most disputes – civil or criminal.” Ifill points out that the “tradition of electing state courts’ judges reflects a tradition of state judges exercising representative functions.” She also notes that the “recent movement of power from national to state government” that “has made state government an increasingly important
17

OPENING THE COURTHOUSE DOORS: THE NEED FOR MORE HISPANIC-AMERICAN JUDGES
locus of political power.” “State judges,” she goes on to note, “are enjoying increased power as the United States Supreme Court limits opportunities for federal authorities to review or mandate state actions.” State judgeships are distinct from the federal judiciary in a number of important ways. First, while federal judgeships are for life, most state judgeships are for limited terms. Second, while federal judges are all appointed, state judges can be selected either through appointment or elections or a combination of both. Third, the state courts often serve as a “feeder system” for appointments to the federal courts. At the state level, there is a debate over whether elective or appointive (i.e., “merit”) systems generate a more racially diverse judiciary. Currently, experience by Hispanic organizations advocating greater Hispanic representation in state judgeships suggests that elective systems result in greater Hispanic representation. (Kanellos 1994: 234-235) The issue of Hispanic underrepresentation among state judges is a national problem. Whether it is Florida (Hill 2001), California (Dolan and Rosenweig 2001), Utah (Martinez 2001), Maryland (Roig-Franzia 2002), Florida (Miller 2001) or New York (Gonzalez 2002), to give but a few examples, the lack of Hispanic-Americans on the bench in the state courts, the problem of secretive, highly political and inaccessible judicial selection processes, and related issues are recurring ones in what are widely acknowledged to be the “workhorses” of the American legal system. As the state with the largest Hispanic population and yet having such a high Disparity Ratio (-62.3 percent), California deserves special scrutiny. While it appears that Governor Gray Davis is moving in the right direction with a series of recent Hispanic appointments to the state’s bench, clearly much more needs to be done in this regard by his Administration. This is the case as well for the large majority of the top 10 states with the largest percentages of Hispanic population. In a recent national opinion survey on state courts, Hispanics were surprisingly found to be more positive about this institution than other racial-ethnic groups. (National Center for State Courts 1999). However, this same study found that a majority (53 percent) of Hispanic-Americans “believe the courts are out of touch with their communities.” (pp. 4 and 40) It also found that close to half (47 percent) of all respondents felt that Hispanics receive the “worst treatment” from the courts. (p. 37). As the federal government’s devolution of responsibilities to the states continues and the role of the state courts increases, public opinion on them may change and become even more critical, particularly among Hispanic-Americans.
18

A REPORT OF THE PUERTO RICAN LEGAL DEFENSE AND EDUCATION FUND (PRLDEF)
The Case of New York State
W hile it is beyond the scope of the this report to provide a detailed state-by-state analysis of these problems, a review of the situation in New York, where the Puerto Rican Legal and
Education Fund is located, might provide a useful example. In a letter to Congressman Jose Serrano of the Bronx, Carlos Ortiz, as President-elect of the Hispanic National Bar Association, pointed out as recently as 1992 that, “New York State is the worst in the nation relative to Hispanic representation on the Federal bench and/or state bench.” (Ortiz 1992) Almost ten years later, Ortiz (2001), in a letter to the editor of the New York Law Journal, pointed out that Governor Pataki “may possibly have one of the worst records for promoting diversity on the courts of any governor,” calling the Governor’s failure to name a single Hispanic to the state’s Appellate Division “indefensible.” As this report documents, there has been some progress in those ten years overall, but in 2000 New York ranked only 24th among the states in terms of Hispanic parity in state judgeships. (see Table 5 on page 32) Among the top 10 states with the largest Hispanic concentrations, New York still has one of the worst track records of appointing Hispanics to state judgeships. In a series of columns, New York Daily News columnist Juan Gonzalez (2000a-e, 2001; also see Fenner 2000) has documented the problem of Hispanic-American judicial underrepresentation in New York State. As he recently observed, “Not a single Latino judge has served in the Appellate Division since 1994, when John Carro retired. And Carro was only the Second Hispanic in the court’s history.” (Gonzalez 2001) This problem of the lack of diversity of New York State court judgeships has been systematically analyzed since the late 1980s when then Chief State Judge Sol Wachtler established the New York State Judicial Commission on Minorities in 1988. (New York County Lawyers’ Association 2002, and Woods 2002; for a critique of this report, see Duban 1997) Their 1991 report found that of a total of 1,126 higher-level state judges, only 19 (1.7 percent of the total) were Hispanic-Americans, and in its 1997 Five-Year Report it found that the number of Hispanic state judges had almost doubled. Gonzalez (2000a) believed the problem arose in part from the misuse of regulations that circumvent elections to select state judges and allow abuse of a provision of the State Constitution that allows the appointment of acting state Supreme Court judges. (For a broader discussion on the judicial selection process in New York see Bierman 1996) He found that, among elected state judges, 35 percent were from minority groups, while among the appointed judges, only 10 percent were minority. Gonzalez (2000b) quotes Juan Figueroa, President and
19

OPENING THE COURTHOUSE DOORS: THE NEED FOR MORE HISPANIC-AMERICAN JUDGES
General Counsel of the Puerto Rican Legal Defense and Education Fund, on this practice: “This is appalling. It’s illegal and it’s a travesty to have this kind of racial and ethnic divide in our judiciary.” Most recently, Gonzalez (2002) found that even when Hispanics do get elected in New York to a state judgeship, their independence is compromised by the inappropriate influence of political parties in the operation of the courts. (also see Haberman 2001) He focused on the case of Civil Court Judge Margarita Lopez Torres, whose political independence may cost her support in her reelection bid because she refused to participate in the Brooklyn Democratic Party’s patronage system within the courts. Assemblyman Vito Lopez, Democrat from Brooklyn, who is of European heritage but has a major role in the nomination of Hispanics to state judgeships, openly spoke about Judge Lopez Torres’ defiance of his directives and failure to support his reelection, and his intention at the time to oppose her renomination. “We made her a judge,” Assemblyman Lopez told Gonzalez, “You respect the people who helped you get there.” Of the 28 Civil Courts judges in Brooklyn, only 2 are Hispanic-American (7.1 percent). The 2000 Census counted 487,878 Hispanic residents of Brooklyn, making up 19.8 percent of the borough’s population. With New York Governor George Pataki, a Republican, facing reelection this year, his poor record of appointing Hispanic-Americans to the state bench is an issue he will have to address. This is particularly the case given his recent efforts to court the state’s large Hispanic vote (see Dicker and Seifman 2002, Hicks 2002 and Humbert 2002). Governor Pataki’s March 14, 2002 appointment of a single Hispanic judge to the Appellate Division and one to the lower Court of Claims is widely viewed within the Hispanic community as simply an election year move in light of his previous failure to appoint a Hispanic in his last seven years in office to any of the 28 vacancies he had to fill in the Appellate Division. As Juan Figueroa of PRLDEF explained in reaction to the new Pataki appointees, “We’re glad Pataki appointed these two. But let’s hope we don’t have to wait another four years for two more.” (Gonzalez 2002b) On March 15, 2002, a special meeting of the Franklin H. Williams Judicial Commission on Minorities was held with Governor Pataki to discuss Hispanic concerns and his announcement the previous day of the appointment of two Hispanics to state judgeships. At this meeting, the Governor admitted that he had not done well in terms of Hispanic judicial appointments and committed himself to do better. Participants at the Williams Commission meeting with Governor Pataki noted that there would be a vacancy shortly in the Appellate Division—
20

A REPORT OF THE PUERTO RICAN LEGAL DEFENSE AND EDUCATION FUND (PRLDEF)
Second Judicial Department, which includes Kings (Brooklyn), Queens, Richmond (Staten Island), Nassau, Suffolk, Westchester, Putnam, Dutchess, Orange and Rockland counties. Together, these counties account for more than half (51.7 percent) of the state’s population and have a large Hispanic population of over 1.6 million, making up 16.5 percent of the Second Judicial Department’s population. Yet, with a total of 21 justices, this department has never had a Hispanic serve in this capacity. Those present at the Williams Commission meeting with Governor Pataki agreed that the appointment of a Hispanic-American in this department would be a historic move by the Governor. By doing so, Governor Pataki would go a long way to overcoming cynicism about the political motives behind his recent Hispanic appointment to the Appellate Division and demonstrate his serious and long-term commitment to be responsive to the Hispanic community. Such an appointment would set a excellent example for the rest of the nation, on a par with former New York Governor Mario Cuomo’s appointment of the first Hispanic to the state’s highest court, the Court of Appeals. Beyond the Governor, the nomination and appointment of state court judges is a responsibility shared by others as well. These include the court system itself, the political parties, mayors and the local bar associations, who all play such an important role in the selection of state judges at the state and local levels. As we see in New York, despite the large and growing Hispanic population, and its increasing political clout, the obstacles to achieving fair representation in state judgeships remain formidable. In this sense, New York’s response to this issue of Hispanic-American underrepresentation among its state judges can be a bellwether for the rest of the country and warrants close examination.
21

OPENING THE COURTHOUSE DOORS: THE NEED FOR MORE HISPANIC-AMERICAN JUDGES
III. Conclusion
T he important role of the courts in the everyday lives of all Americans, including an increasingly large percentage of Hispanic-Americans, raises questions about the absence of significant numbers from this
community among the judges who lead this branch of government. This is especially true in the current period where the problem of terrorism has forced our legal system to grapple with trade offs that disproportionately affect immigrants and people of color. These include the rights of people unlawfully detained and the defunding of critically important programs.
The Value of a Diverse Judiciary
A s this report demonstrates, there is a serious and potentially worsening problem of Hispanic underrepresentation in the state and federal judiciaries that requires urgent attention by
policymakers. This is a problem that can seriously undermine the role of the courts in the Hispanic community and among the public at large. Greater Hispanic and minority representation in the judiciary would positively contribute to the development of the law and enhance the administration of justice in the following ways: 1. Promote respect for the law. The fact that the Judiciary is currently
perceived by many as being biased against minorities should be of serious concern to us all since that perception breeds disrespect, indifference and contempt for law and order.
2. Enhance the public’s confidence in the legitimacy of the legal system and the role of our nation’s courts.
3. Enhance the quality of judicial decisions by reducing the risks that those decisions may be tainted by prejudice, indifference or inequity.
4. Provide invaluable role models for Hispanic youth of tomorrow.
Recommendations for Change
T he Puerto Rican Legal Defense and Education Fund presents the following set of recommendations to begin to seriously address this persistent problem of Hispanic underrepresentation in state and
federal judgeships throughout the United States. We urge the chief executives, whether the President of the United States, Governors and Senators of the fifty states, or the hundreds of mayors, party leaders and others involved in judicial selection at the local level to take the following
22

A REPORT OF THE PUERTO RICAN LEGAL DEFENSE AND EDUCATION FUND (PRLDEF)
actions: 1. Make the nominations and appointments of Hispanic Americans to
state and federal court judgeships a high priority from the leaders filtering down throughout their administrations, particularly in those states with significant Hispanic populations.
2. Appoint knowledgeable and experienced Hispanics as key advisors in cabinet-level and policymaking positions and to judicial evaluation committees.
3. Nominate qualified Hispanic candidates who have also had a demonstrated interest and a meaningful involvement in the work and activities of the Hispanic community. We will not rubber-stamp nominees who are merely identified as Hispanic. The life experiences of such candidates must clearly demonstrate that they have had a meaningful interest in the needs and concerns of the Hispanic community.
4. Nominate Hispanic nominees as early as possible in their respective terms of office to ensure that they will have enough time for adequate periods of review and avoid expirations of their nominations.
5. Support the appointment of a unifying, non-controversial, and confirmable nominee to be the first Hispanic-American to serve on the United States Supreme Court.
T he title of this report, Opening the Courthouse Doors, captures our belief that our nation’s future needs to be open to change. The question is whether the will exists among our country’s leaders to
make the necessary changes to assure that the large and growing Hispanic community is fairly represented in the judiciary. The nation’s Hispanic leadership and voters must monitor more closely those elected officials who ignore our people when they appoint judges and other public officials.
23

OPENING THE COURTHOUSE DOORS: THE NEED FOR MORE HISPANIC-AMERICAN JUDGES
REFERENCES
Alliance for Justice (2001). 14th Annual Report on the State of the Judiciary 2000: The Legacy of the Clinton Administration and the Future Under George W. Bush (Washington, DC: Author, March).
American Bar Association (2000). Miles to Go 2000: Progress of Minorities in the Legal Profession (Chicago: ABA Commission on Racial and Ethnic Diversity in the Profession).
American Bar Association (2001). Directory of Minority Judges of the United States, Third Edition (Chicago: ABA Judicial Division Task Force on Minorities in the Judiciary).
Bennack, Jr., Frank (1999). How the Public Views the State Courts: A 1999 National Survey (Williamsburg, VA: National Center for State Courts, May 14).
Bierman, Luke (1997). “Legal Development: Preserving Power in Picking Judges – Merit Selection for the New York Court of Appeals,” 60 Alb. L. Rev. 339.
Biskupic, Joan (2000). “Minorities Face Hurdles in Judgeship Quest,” USA Today (August 25).
Citizens for Independent Courts (2000). Uncertain Justice: Politics and America’s Courts – The Reports of the Task Forces of the Citizens for Independent Courts (New York: The Century Foundation).
Congressional Hispanic Caucus (1992). Letter to Carlos G. Ortiz, Then President-Elect, Hispanic National Bar Association (May 15).
__________ (2002). Letter to Carlos G. Ortiz, Chairman of the Board, Puerto Rican Legal Defense and Education Fund (March 14).
Cooper, Desiree (2001). “Champion of Legal Diversity to Tell His Tale,” Detroit Free-Press (October 4).
Dicker, Fredric U., and David Seifman (2002). “Hey, I’m Just Like Dr. King, Gov Tells Black Audience,” Daily News (January 23).
Dolan, Maura, and David Rosenweig (2001). “High Court Nominee Vows to Emphasize Consensus; Profile: Carlos Moreno’s Confirmation Would Make Him the Lone Democrat on State High Court,” Los Angeles Times (September 27).
Duban, Jeffrey M. (1997). “Banishing Bias: The Second Circuit’s Draft Report on Gender, Racial and Ethnic Fairness in the Courts,” New York State Bar Journal, Vol. 69, No. 8 (December).
Fenner, Austin (2000). “Push to Diversify Queens Court Ranks,” Daily News (October 17).
Fisch, Louise Ann (1996), All Rise: Reynaldo G. Garza, the First Mexican American Federal Judge (College Station, TX: Texas A&M University Press)
Fund for Modern Courts (1985). The Success of Women and Minorities in Achieving Judicial Office: The Selection Process (New York: Author).
Goldberg, Deborah (1998). “Lott’s Hispanic Quota,” The Nation (October 5). Gonzalez, Juan (2000a). “City’s Jerry-built Justice: Acting Judges Sidesteps Real
Reform,” Daily News (January 12). __________ (2000b). “A Supreme Example of Ethnic Bias,” Daily News (January
14), __________ (2000c). “Pols Rule Courtrooms: Acting Judges Owe Their Jobs to
Pataki, Rudy,” Daily News (January 18). __________ (2000d). “To Judge, the Law’s All in the Family,” Daily News
24

A REPORT OF THE PUERTO RICAN LEGAL DEFENSE AND EDUCATION FUND (PRLDEF)
(January 28). __________ (2000e), “Push on to Diversify Queens Court Ranks,” Daily News
(October 17). __________ (2001). “Pataki Should Name Hispanic Judges,” Daily News (March
29). __________ (2002a). “Running? He’ll Be Judge of That,” Daily News (February
27). __________ (2002b). “2 Latinos Rise on State Bench,” Daily News (March 14). Haberman, Maggie (2001). “Patronage Judges Face Disciplinary Hearings,” New
York Post (December 4). Herman. Ken and Osler McCarthy (1998). “Gonzalez Named to Supreme Court:
Bush Appoints His Secretary of State to Replace Retiring Justice,” Austin American-Statesman (November 13).
Hicks, Jonathan (2002). “Pataki Defends Record Before Black and Hispanic Legislators,” New York Times (February 18).
Hight, Bruce and Ken Herman (2000), “Bush Court Appointees Are Called Pragmatists,” Austin American-Statesman (October 16).
Hill, Martha (2001). “Judicial Appointments Ignore Diversity,” Florida News-Press (October 21).
Hoppe, Christy (2000). “State Judges May Provide Clues on Bush: U.S. High Court Picks Could Alter Abortion Law,” Dallas Morning News (July 8).
Human Rights Watch (2002). “Race and Incarceration in the United States,” Briefing (February 27).
Humbert, Marc (2002). “Dem Rivals, Pataki Woo Black, Hispanic Vote,” Ithaca Journal (February 18).
Ifill, Sherrilyn A. (1997). “Judging the Judges: Racial Diversity, Impartiality and Representation on State Trial Courts,” 39 B.C.L.Rev 95 (December).
Kanellos, Nicolás, The Hispanic Almanac: From Columbus to Corporate America (Detroit: Visible Ink Press).
Martinez, Mike (2001). “Why Doesn’t Utah Have More Hispanic Judges?,” Deseret News (December 3).
Mauro, Tony (1998). “Corps of Clerks Lacking in Diversity,” USA Today (March 13).
_________ (2000). “An Hispanic Justice At Last?,” National Law Journal (November 13): 1.
McLaughlin, Abraham (2001). “Profile: Alberto Gonzalez: Bush’s Judge Picker Could be Picked,” Christian Science Monitor (July 10).
Miller, Susan R. (2001). “Governor’s Big Chance: With New Power from Legislature, Jeb Bush Has Fewer Reasons for Not Appointing More Women and Minorities to the Appellate Bench,” Miami Daily Business Review (August 31).
Mittelstadt, Michelle (2000), “Liberal Groups Restudy Tactics: Bush’s Victory May Force Change in Agendas on Abortion, Guns,” Dallas Morning News (December 16).
Moore, Joan and Harry Pachon (1985). Hispanics in the United States (Englewood Cliffs, NJ: Prentice-Hall).
National Center for State Courts (1999). How the Public Views the State Courts: A 1999 National Survey (Williamsburg, VA: Author, May 14).
New York County Lawyers’ Association (2002). Report of the Task Force to Increase Diversity in the Legal Profession (New York: Author).
25

OPENING THE COURTHOUSE DOORS: THE NEED FOR MORE HISPANIC-AMERICAN JUDGES
Ortiz, Carlos (1992). Letter to Congressman José E. Serrano (March 19). __________ (2001). Letter to Kris Fischer, Executive Editor, New York Law
Journal (April 23). Reynoso, Cruz (2000). “Hispanics and the Criminal Justice System” in Pastora San
Juan Cafferty and David W. Engstrom (eds.), Hispanics in the United States: An Agenda for the Twenty-First Century (New Brunswick: Transaction Publishers): Chapter 9.
Rodriguez, Joseph (2002). Speech to the Specialty Bar Summit, New Jersey State Bar Association Law Center, New Brunswick, New Jersey (February 22).
Roig-Franzia, Manuel (2002). “Judgeships Overlook Hispanics, Asians,” Washington Post (February 14), page T3.
Tribe, Laurence H. (2001). “Should Ideology Matter?: Judicial Nominations 2001” (Washington, DC: Testimony Before the U.S. Senate Judiciary Committee’s Subcommittee on Administrative Oversight and the Courts, June 26).
U.S. Census Bureau (1993). We the American Hispanics (Washington, DC: U.S. Commerce Department, September 1993).
U.S. Census Bureau (2000). “Projections of the Resident Population by Race, Hispanic Origin, and Nativity: Middle Series, 2075 to 2100” (Washington, DC: U.S. Commerce Department, January 13, 2000).
U.S. Department of Justice (2001). Bureau of Justice Statistics Bulletin (NCJ 185989)(Washington, DC, March 2001).
Woods, John (2002). “New Report Cites Retention as Key Factor in Improving Diversity,” New York Law Journal (February 25).
26

A REPORT OF THE PUERTO RICAN LEGAL DEFENSE AND EDUCATION FUND (PRLDEF)
APPENDIX DATA TABLES
27

OPENING THE COURTHOUSE DOORS: THE NEED FOR MORE HISPANIC-AMERICAN JUDGES
Circuit Courts of Appeal
Federal District Trial
Courts
F/T Hispanic Federal Judges
Alabama 4,447,100 75,830 1.7% 16 0 0 0 0.0%Alaska 626,932 25,852 4.1% 4 0 0 0 0.0%Arizona 5,130,632 1,295,617 25.3% 15 0 2 2 13.3%Arkansas 2,673,400 86,866 3.2% 9 0 0 0 0.0%California 33,871,648 10,966,556 32.4% 69 2 3 5 7.2%Colorado 4,301,261 735,601 17.1% 10 1 0 1 10.0%Connecticut 3,405,565 320,323 9.4% 12 1 0 1 8.3%Delaware 783,600 37,277 4.8% 6 0 0 0 0.0%District of Columbia 572,059 44,953 7.9% 27 0 1 1 3.7%Florida 15,982,378 2,682,715 16.8% 44 0 2 2 4.5%Georgia 8,186,453 435,227 5.3% 22 0 0 0 0.0%Hawaii 1,211,537 87,699 7.2% 3 0 0 0 0.0%Idaho 1,293,953 101,690 7.9% 4 0 0 0 0.0%Illinois 12,419,293 1,530,262 12.3% 34 0 2 2 5.9%Indiana 6,080,485 214,536 3.5% 13 0 1 1 7.7%Iowa 2,926,324 82,473 2.8% 7 0 0 0 0.0%Kansas 2,688,418 188,252 7.0% 7 0 1 1 14.3%Kentucky 4,041,769 59,939 1.5% 13 0 0 0 0.0%Louisiana 4,468,976 107,738 2.4% 28 0 0 0 0.0%Maine 1,274,923 9,360 0.7% 4 0 0 0 0.0%Maryland 5,296,486 227,916 4.3% 12 0 0 0 0.0%Massachusetts 6,349,097 428,729 6.8% 15 0 0 0 0.0%Michigan 9,938,444 323,877 3.3% 24 0 0 0 0.0%Minnesota 4,919,479 143,382 2.9% 9 0 0 0 0.0%Mississippi 2,844,658 39,569 1.4% 11 0 0 0 0.0%Missouri 5,595,211 118,592 2.1% 15 0 0 0 0.0%Montana 902,195 18,081 2.0% 4 0 0 0 0.0%Nebraska 1,711,263 94,425 5.5% 4 0 0 0 0.0%Nevada 1,998,257 393,970 19.7% 9 0 0 0 0.0%New Hampshire 1,235,786 20,489 1.7% 4 0 0 0 0.0%New Jersey 8,414,350 1,117,191 13.3% 19 1 0 1 5.3%New Mexico 1,819,046 765,386 42.1% 7 0 1 1 14.3%New York 18,976,457 2,867,583 15.1% 70 1 1 2 2.9%North Carolina 8,049,313 378,963 4.7% 13 0 0 0 0.0%North Dakota 642,200 7,786 1.2% 3 0 0 0 0.0%Ohio 11,353,140 217,123 1.9% 24 0 0 0 0.0%Oklahoma 3,450,654 179,304 5.2% 13 0 0 0 0.0%Oregon 3,421,399 275,314 8.0% 8 0 0 0 0.0%Pennsylvania 12,281,054 394,088 3.2% 46 0 1 1 2.2%Rhode Island 1,048,319 90,820 8.7% 4 0 0 0 0.0%South Carolina 4,012,012 95,076 2.4% 14 0 0 0 0.0%South Dakota 754,844 10,903 1.4% 4 0 0 0 0.0%Tennessee 5,689,283 123,838 2.2% 17 0 0 0 0.0%Texas 20,851,820 6,669,666 32.0% 59 2 8 10 16.9%Utah 2,233,169 201,559 9.0% 7 0 0 0 0.0%Vermont 608,827 5,504 0.9% 3 0 0 0 0.0%Virginia 7,078,515 329,540 4.7% 20 0 0 0 0.0%Washington 5,894,121 441,509 7.5% 14 0 0 0 0.0%West Virginia 1,808,344 12,279 0.7% 10 0 0 0 0.0%Wisconsin 5,363,675 192,921 3.6% 9 0 0 0 0.0%Wyoming 493,782 31,669 6.4% 5 0 0 0 0.0%
Federal Circuit 12 0 0 0 0.0%
Grand Total 281,421,906 35,305,818 12.5% 835 8 23 31 3.7%
Total PopulationStateHispanic % of
Federal Judges
Puerto Rican Legal Defense and Education FundTable 1 - Hispanic Judges in the Federal Judiciary, 2000
Hispanic Federal Court Judges:F/T Auth Fed
Court Judgeships
% Hispanic PopulationHispanic Population
(excluding Puerto Rico and other US territories)
Sources:Population figures from the US Bureau of the CensusTotal number of full-time, authorized federal judgeships derived from 28 U.S.C. (2000) Sections 41, 44, 48 and 133Number of Hispanic federal judges from unpublished data compiled by Carlos G. Ortiz
28
A REPORT OF THE PUERTO RICAN LEGAL DEFENSE AND EDUCATION FUND (PRLDEF)
Courts of Last Resort
Intermediate Appellate
Court
Lower Level Trial Courts
F/T Hispanic State
Judges
Alabama 4,447,100 75,830 1.7% 559 0 0 0 0 0.0%Alaska 626,932 25,852 4.1% 124 0 0 1 1 0.8%Arizona 5,130,632 1,295,617 25.3% 329 0 2 59 61 18.5%Arkansas 2,673,400 86,866 3.2% 411 0 0 0 0 0.0%California 33,871,648 10,966,556 32.4% 1,580 1 5 187 193 12.2%Colorado 4,301,261 735,601 17.1% 435 1 2 26 29 6.7%Connecticut 3,405,565 320,323 9.4% 238 0 0 5 5 2.1%Delaware 783,600 37,277 4.8% 112 0 0 0 0 0.0%District of Columbia 572,059 44,953 7.9% 68 0 1 5 6 8.8%Florida 15,982,378 2,682,715 16.8% 799 0 4 36 40 5.0%Georgia 8,186,453 435,227 5.3% 744 0 0 1 1 0.1%Hawaii 1,211,537 87,699 7.2% 73 0 0 0 0 0.0%Idaho 1,293,953 101,690 7.9% 126 0 0 1 1 0.8%Illinois 12,419,293 1,530,262 12.3% 925 0 1 16 17 1.8%Indiana 6,080,485 214,536 3.5% 394 0 0 3 3 0.8%Iowa 2,926,324 82,473 2.8% 194 0 0 0 0 0.0%Kansas 2,688,418 188,252 7.0% 432 0 0 1 1 0.2%Kentucky 4,041,769 59,939 1.5% 244 0 0 0 0 0.0%Louisiana 4,468,976 107,738 2.4% 997 0 0 0 0 0.0%Maine 1,274,923 9,360 0.7% 52 0 0 0 0 0.0%Maryland 5,296,486 227,916 4.3% 327 0 0 2 2 0.6%Massachusetts 6,349,097 428,729 6.8% 383 0 0 7 7 1.8%Michigan 9,938,444 323,877 3.3% 602 0 0 2 2 0.3%Minnesota 4,919,479 143,382 2.9% 277 0 0 4 4 1.4%Mississippi 2,844,658 39,569 1.4% 544 0 0 0 0 0.0%Missouri 5,595,211 118,592 2.1% 680 0 0 4 4 0.6%Montana 902,195 18,081 2.0% 158 0 0 1 1 0.6%Nebraska 1,711,263 94,425 5.5% 140 0 0 1 1 0.7%Nevada 1,998,257 393,970 19.7% 138 0 0 4 4 2.9%New Hampshire 1,235,786 20,489 1.7% 51 0 0 0 0 0.0%New Jersey 8,414,350 1,117,191 13.3% 475 0 1 29 30 6.3%New Mexico 1,819,046 765,386 42.1% 279 3 3 98 104 37.3%New York 18,976,457 2,867,583 15.1% 3,505 1 0 55 56 1.6%North Carolina 8,049,313 378,963 4.7% 322 0 0 0 0 0.0%North Dakota 642,200 7,786 1.2% 128 0 0 0 0 0.0%Ohio 11,353,140 217,123 1.9% 1,130 0 0 4 4 0.4%Oklahoma 3,450,654 179,304 5.2% 634 0 0 0 0 0.0%Oregon 3,421,399 275,314 8.0% 356 0 1 3 4 1.1%Pennsylvania 12,281,054 394,088 3.2% 1,004 0 0 3 3 0.3%Rhode Island 1,048,319 90,820 8.7% 122 0 0 0 0 0.0%South Carolina 4,012,012 95,076 2.4% 764 0 0 0 0 0.0%South Dakota 754,844 10,903 1.4% 42 0 0 0 0 0.0%Tennessee 5,689,283 123,838 2.2% 583 0 0 0 0 0.0%Texas 20,851,820 6,669,666 32.0% 2,909 0 11 391 402 13.8%Utah 2,233,169 201,559 9.0% 232 0 0 2 2 0.9%Vermont 608,827 5,504 0.9% 35 0 0 0 0 0.0%Virginia 7,078,515 329,540 4.7% 386 0 0 0 0 0.0%Washington 5,894,121 441,509 7.5% 414 1 0 6 7 1.7%West Virginia 1,808,344 12,279 0.7% 223 0 0 0 0 0.0%Wisconsin 5,363,675 192,921 3.6% 474 0 0 3 3 0.6%Wyoming 493,782 31,669 6.4% 43 0 0 0 0 0.0%
Grand Total 281,421,906 35,305,818 12.5% 26,196 7 31 960 998 3.8%
Puerto Rican Legal Defense and Education FundTable 2 - Hispanic Judges in the State Judiciary, 2000
Number of Hispanic State Court Judges:
State Total Population Hispanic Population
% Hispanic Population
F/T Auth State Court Judgeships
(excluding Puerto Rico and US territories)
Hispanic % of State
Judges
Sources:Population figures from the US Bureau of the CensusNumber of full-time, authorized state judgeships derived from Table 3 (page 16) of US Department of Justice, Bureau of Justice Statistics, State Court Organization 1998 <www.ojp.usdoj.gov/bjs/abstract/sco98.htm>Number of Hispanic state judges from American Bar Association, Directory of Minority Judges in the United States, 2000
29

OPENING THE COURTHOUSE DOORS: THE NEED FOR MORE HISPANIC-AMERICAN JUDGES
2000 19901990-2000
Number Change
1990-2000 Percent Change
Number in 2000
Number in 1990
1990-2000 Number Change
1990-2000 Percent Change
Alabama 75,830 24,629 51,201 207.9% 0 0 0 0.0%Alaska 25,852 17,803 8,049 45.2% 0 0 0 0.0%Arizona 1,295,617 688,338 607,279 88.2% 2 1 1 100.0%Arkansas 86,866 19,876 66,990 337.0% 0 0 0 0.0%California 10,966,556 7,687,938 3,278,618 42.6% 5 5 0 0.0%Colorado 735,601 424,302 311,299 73.4% 1 0 1 naConnecticut 320,323 213,116 107,207 50.3% 1 0 1 naDelaware 37,277 15,820 21,457 135.6% 0 0 0 0.0%District of Columbia 44,953 32,710 12,243 37.4% 1 0 1 naFlorida 2,682,715 1,574,143 1,108,572 70.4% 2 1 1 100.0%Georgia 435,227 108,922 326,305 299.6% 0 0 0 0.0%Hawaii 87,699 81,390 6,309 7.8% 0 0 0 0.0%Idaho 101,690 52,927 48,763 92.1% 0 0 0 0.0%Illinois 1,530,262 904,446 625,816 69.2% 2 0 2 naIndiana 214,536 98,788 115,748 117.2% 1 1 0 0.0%Iowa 82,473 32,647 49,826 152.6% 0 0 0 0.0%Kansas 188,252 93,670 94,582 101.0% 1 0 1 naKentucky 59,939 21,984 37,955 172.6% 0 0 0 0.0%Louisiana 107,738 93,044 14,694 15.8% 0 0 0 0.0%Maine 9,360 6,829 2,531 37.1% 0 0 0 0.0%Maryland 227,916 125,102 102,814 82.2% 0 0 0 0.0%Massachusetts 428,729 287,549 141,180 49.1% 0 0 0 0.0%Michigan 323,877 201,596 122,281 60.7% 0 1 -1 naMinnesota 143,382 53,884 89,498 166.1% 0 0 0 0.0%Mississippi 39,569 15,931 23,638 148.4% 0 0 0 0.0%Missouri 118,592 61,702 56,890 92.2% 0 1 -1 naMontana 18,081 12,174 5,907 48.5% 0 0 0 0.0%Nebraska 94,425 36,969 57,456 155.4% 0 0 0 0.0%Nevada 393,970 124,419 269,551 216.6% 0 0 0 0.0%New Hampshire 20,489 11,333 9,156 80.8% 0 0 0 0.0%New Jersey 1,117,191 739,861 377,330 51.0% 1 1 0 0.0%New Mexico 765,386 579,224 186,162 32.1% 1 2 -1 -50.0%New York 2,867,583 2,214,026 653,557 29.5% 2 0 2 naNorth Carolina 378,963 76,726 302,237 393.9% 0 0 0 0.0%North Dakota 7,786 4,665 3,121 66.9% 0 0 0 0.0%Ohio 217,123 139,696 77,427 55.4% 0 0 0 0.0%Oklahoma 179,304 86,160 93,144 108.1% 0 0 0 0.0%Oregon 275,314 112,707 162,607 144.3% 0 0 0 0.0%Pennsylvania 394,088 232,262 161,826 69.7% 1 0 1 naRhode Island 90,820 45,752 45,068 98.5% 0 0 0 0.0%South Carolina 95,076 30,551 64,525 211.2% 0 0 0 0.0%South Dakota 10,903 5,252 5,651 107.6% 0 0 0 0.0%Tennessee 123,838 32,741 91,097 278.2% 0 0 0 0.0%Texas 6,669,666 4,339,905 2,329,761 53.7% 10 8 2 25.0%Utah 201,559 84,597 116,962 138.3% 0 0 0 0.0%Vermont 5,504 3,661 1,843 50.3% 0 0 0 0.0%Virginia 329,540 160,288 169,252 105.6% 0 0 0 0.0%Washington 441,509 214,570 226,939 105.8% 0 0 0 0.0%West Virginia 12,279 8,489 3,790 44.6% 0 0 0 0.0%Wisconsin 192,921 93,194 99,727 107.0% 0 0 0 0.0%Wyoming 31,669 25,751 5,918 23.0% 0 0 0 0.0%
Grand Total 35,305,818 22,356,049 12,949,769 57.9% 31 21 10 47.6%
Puerto Rican Legal Defense and Education FundTable 3 - Hispanic Judges in the Federal Judiciary, 1990-2000
State
Hispanic Population Hispanic Federal Judges
(excluding Puerto Rico and US territories)
Sources:Population figures from the US Bureau of the CensusNumber of Hispanic federal judges from unpublished data compiled by Carlos G. Ortiz
30

A REPORT OF THE PUERTO RICAN LEGAL DEFENSE AND EDUCATION FUND (PRLDEF)
2000 19901990-2000
Number Change
1990-2000 Percent Change
Number in 2000
Number in 1990
1990-2000 Number Change
1990-2000 Percent Change
Alabama 75,830 24,629 51,201 207.9% 0 1 -1 -100.0%Alaska 25,852 17,803 8,049 45.2% 1 1 0 0.0%Arizona 1,295,617 688,338 607,279 88.2% 61 44 17 38.6%Arkansas 86,866 19,876 66,990 337.0% 0 0 0 0.0%California 10,966,556 7,687,938 3,278,618 42.6% 193 89 104 116.9%Colorado 735,601 424,302 311,299 73.4% 29 16 13 81.3%Connecticut 320,323 213,116 107,207 50.3% 5 0 5 naDelaware 37,277 15,820 21,457 135.6% 0 0 0 0.0%District of Columbia 44,953 32,710 12,243 37.4% 6 3 3 100.0%Florida 2,682,715 1,574,143 1,108,572 70.4% 40 25 15 60.0%Georgia 435,227 108,922 326,305 299.6% 1 0 1 naHawaii 87,699 81,390 6,309 7.8% 0 1 -1 -100.0%Idaho 101,690 52,927 48,763 92.1% 1 0 1 naIllinois 1,530,262 904,446 625,816 69.2% 17 16 1 6.3%Indiana 214,536 98,788 115,748 117.2% 3 2 1 50.0%Iowa 82,473 32,647 49,826 152.6% 0 0 0 0.0%Kansas 188,252 93,670 94,582 101.0% 1 1 0 0.0%Kentucky 59,939 21,984 37,955 172.6% 0 0 0 0.0%Louisiana 107,738 93,044 14,694 15.8% 0 4 -4 -100.0%Maine 9,360 6,829 2,531 37.1% 0 0 0 0.0%Maryland 227,916 125,102 102,814 82.2% 2 1 1 100.0%Massachusetts 428,729 287,549 141,180 49.1% 7 0 7 naMichigan 323,877 201,596 122,281 60.7% 2 3 -1 -33.3%Minnesota 143,382 53,884 89,498 166.1% 4 2 2 100.0%Mississippi 39,569 15,931 23,638 148.4% 0 0 0 0.0%Missouri 118,592 61,702 56,890 92.2% 4 1 3 300.0%Montana 18,081 12,174 5,907 48.5% 1 1 0 0.0%Nebraska 94,425 36,969 57,456 155.4% 1 0 1 naNevada 393,970 124,419 269,551 216.6% 4 7 -3 -42.9%New Hampshire 20,489 11,333 9,156 80.8% 0 0 0 0.0%New Jersey 1,117,191 739,861 377,330 51.0% 30 13 17 130.8%New Mexico 765,386 579,224 186,162 32.1% 104 91 13 14.3%New York 2,867,583 2,214,026 653,557 29.5% 56 26 30 115.4%North Carolina 378,963 76,726 302,237 393.9% 0 0 0 0.0%North Dakota 7,786 4,665 3,121 66.9% 0 0 0 0.0%Ohio 217,123 139,696 77,427 55.4% 4 2 2 100.0%Oklahoma 179,304 86,160 93,144 108.1% 0 0 0 0.0%Oregon 275,314 112,707 162,607 144.3% 4 1 3 300.0%Pennsylvania 394,088 232,262 161,826 69.7% 3 2 1 50.0%Rhode Island 90,820 45,752 45,068 98.5% 0 0 0 0.0%South Carolina 95,076 30,551 64,525 211.2% 0 0 0 0.0%South Dakota 10,903 5,252 5,651 107.6% 0 0 0 0.0%Tennessee 123,838 32,741 91,097 278.2% 0 0 0 0.0%Texas 6,669,666 4,339,905 2,329,761 53.7% 402 285 117 41.1%Utah 201,559 84,597 116,962 138.3% 2 1 1 100.0%Vermont 5,504 3,661 1,843 50.3% 0 0 0 0.0%Virginia 329,540 160,288 169,252 105.6% 0 1 -1 -100.0%Washington 441,509 214,570 226,939 105.8% 7 4 3 75.0%West Virginia 12,279 8,489 3,790 44.6% 0 0 0 0.0%Wisconsin 192,921 93,194 99,727 107.0% 3 0 3 naWyoming 31,669 25,751 5,918 23.0% 0 0 0 0.0%
Grand Total 35,305,818 22,356,049 12,949,769 57.9% 998 644 354 55.0%
Hispanic Population Hispanic State Judges
State
Puerto Rican Legal Defense and Education FundTable 4 - Hispanics in the State Judiciary, 1990-2000
(excluding Puerto Rico and US territories)
Sources:Population figures from the US Bureau of the CensusNumber of Hispanic state judges from American Bar Association, Directory of Minority Judges in the United States, 2000
31

OPENING THE COURTHOUSE DOORS: THE NEED FOR MORE HISPANIC-AMERICAN JUDGES
Hispanic % of Federal
Judges
Disparity Ratio
Hispanic % of State Judges
Disparity Ratio
Alabama 1.7% 0.0% -100.0% 0.0% -100.0%Alaska 4.1% 0.0% -100.0% 0.8% -80.4%Arizona 25.3% 13.3% -47.2% 18.5% -26.6%Arkansas 3.2% 0.0% -100.0% 0.0% -100.0%California 32.4% 7.2% -77.8% 12.2% -62.3%Colorado 17.1% 10.0% -41.5% 6.7% -61.0%Connecticut 9.4% 8.3% -11.4% 2.1% -77.7%Delaware 4.8% 0.0% -100.0% 0.0% -100.0%District of Columbia 7.9% 3.7% -52.9% 8.8% 12.3%Florida 16.8% 4.5% -72.9% 5.0% -70.2%Georgia 5.3% 0.0% -100.0% 0.1% -97.5%Hawaii 7.2% 0.0% -100.0% 0.0% -100.0%Idaho 7.9% 0.0% -100.0% 0.8% -89.9%Illinois 12.3% 5.9% -52.3% 1.8% -85.1%Indiana 3.5% 7.7% 118.0% 0.8% -78.4%Iowa 2.8% 0.0% -100.0% 0.0% -100.0%Kansas 7.0% 14.3% 104.0% 0.2% -96.7%Kentucky 1.5% 0.0% -100.0% 0.0% -100.0%Louisiana 2.4% 0.0% -100.0% 0.0% -100.0%Maine 0.7% 0.0% -100.0% 0.0% -100.0%Maryland 4.3% 0.0% -100.0% 0.6% -85.8%Massachusetts 6.8% 0.0% -100.0% 1.8% -72.9%Michigan 3.3% 0.0% -100.0% 0.3% -89.8%Minnesota 2.9% 0.0% -100.0% 1.4% -50.5%Mississippi 1.4% 0.0% -100.0% 0.0% -100.0%Missouri 2.1% 0.0% -100.0% 0.6% -72.2%Montana 2.0% 0.0% -100.0% 0.6% -68.4%Nebraska 5.5% 0.0% -100.0% 0.7% -87.1%Nevada 19.7% 0.0% -100.0% 2.9% -85.3%New Hampshire 1.7% 0.0% -100.0% 0.0% -100.0%New Jersey 13.3% 5.3% -60.4% 6.3% -52.4%New Mexico 42.1% 14.3% -66.0% 37.3% -11.4%New York 15.1% 2.9% -81.1% 1.6% -89.4%North Carolina 4.7% 0.0% -100.0% 0.0% -100.0%North Dakota 1.2% 0.0% -100.0% 0.0% -100.0%Ohio 1.9% 0.0% -100.0% 0.4% -81.5%Oklahoma 5.2% 0.0% -100.0% 0.0% -100.0%Oregon 8.0% 0.0% -100.0% 1.1% -86.0%Pennsylvania 3.2% 2.2% -32.3% 0.3% -90.7%Rhode Island 8.7% 0.0% -100.0% 0.0% -100.0%South Carolina 2.4% 0.0% -100.0% 0.0% -100.0%South Dakota 1.4% 0.0% -100.0% 0.0% -100.0%Tennessee 2.2% 0.0% -100.0% 0.0% -100.0%Texas 32.0% 16.9% -47.0% 13.8% -56.8%Utah 9.0% 0.0% -100.0% 0.9% -90.4%Vermont 0.9% 0.0% -100.0% 0.0% -100.0%Virginia 4.7% 0.0% -100.0% 0.0% -100.0%Washington 7.5% 0.0% -100.0% 1.7% -77.4%West Virginia 0.7% 0.0% -100.0% 0.0% -100.0%Wisconsin 3.6% 0.0% -100.0% 0.6% -82.4%
Table 5 - Hispanic Disparity Ratios for State and Federal Judgeships
by State, 2000
Puerto Rican Legal Defense and Education Fund
State JudgesFederal Judges
% Hispanic Population
State
(excluding Puerto Rico and US territories)
Sources:Population figures from the US Bureau of the Census
Number of Hispanic federal judges from unpublished data compiled by Carlos G. Ortiz
Number of Hispanic state judges from American Bar Association, Directory of Minority Judges in the United States, 2000
32

PRLDEF Puerto Rican Legal Defense and Education Fund protecting the civil and human rights of Puerto Ricans and the wider Latino community since 1972
Board of Directors
Carlos G. Ortiz, Esq. Chair
Maria Josefa Canino -Arroyo, Ed.D. Vice Chair
Ana M. Barrio, CPA Treasurer
Diana Correa, Esq. Secretary
Benito Romano, Esq. Member-at-large
José R. Sánchez, Ph.D. Member-at-Large
William F. Callejo, Esq. Gilbert F. Casellas, Esq.
Israel Colón Amy Gladstein, Esq.
Former Ambassador Gabriel Guerra-Mondragón David R. Jones, Esq. Felix A. Mantilla, Esq.
José S. Reynoso Eugene Rivera, CSW
Roberto F. Rosario, CPA
Honorary Directors Alba J. Rovira-Paoli, Esq.
Martin H. Zuckerman, Esq.
President and General Counsel Juan A. Figueroa
PRLDEF Institute for Puerto Rican Policy 99 Hudson Street, 14th Floor New York, N.Y. 10013-2815
212-739-7516 Fax: 212-431-4276 www.prldef.or g
Senior Policy Executive, PRLDEF
Director, PRLDEF Institute for Puerto Rican Policy Angelo Falcón (212-739-7516)
Policy Networking Program Coordinator Myra Y. Estepa (212-739-7499)
Civic Participation Program Coordinator Lucía Gómez (212-739-7501)
Special Projects Coordinator Minerva Delgado, M.P.P. (212-739-7500)
New York City Bilingual Education Project Policy Analyst
Shelley Rappaport, M. Ed. (212-739-7581)
Administrative Assistant Mildred Jurado (212-739-7516)
OP
ENIN
G TH
E COU
RTH
OU
SE DO
OR
S: THE N
EED FO
R M
OR
E HISP
AN
IC JUD
GES P
RLD
EF 2002