OptFlux: an open-source software platform for in silico metabolic engineering
Upload
independentCategory
view
0download
0
Free/Open Source vs Closed Source Software:Public Policies in the Software Market∗
Stefano Comino† Fabio M. Manenti‡
July 2004
Abstract
This paper analyzes the impact on social welfare of public policies supporting opensource software (OSS). The focus of the paper is on desktop applications such asOpenOffice and Linux for desktops. Desktop users can be divided between those whoknow about the existence of OSS, the “informed” adopters, and the “uninformed” ones;the presence of uniformed users leads to market failures that may justify governmentintervention. We study three policies: i) mandatory adoption, when government forcespublic agencies, schools and universities to adopt OSS, ii) information campaign, whenthe government informs the uninformed users about the existence and the characteris-tics of OSS, and iii) subsidization, when consumers are payed a subsidy when adoptingOSS. We show that a part from subsidization policies, which have been proved to harmsocial surplus, supporting OSS through mandatory adoption and information campaignmay have positive welfare effects. When software adoption is affected by strong net-work effects, mandatory adoption and information campaign induce an increase insocial surplus provided that they help the market to tip towards standardization.
J.E.L. codes: O38, L51, L63.Keywords: software market, open source software, mandatory adoption, informationcampaign, subsidization, network externalities.
∗Paper presented at the 2nd IIO Conference (Chicago), at the 7th Annual EUNIP Conference (Porto)and at the Industrial Organization Workshop (Naples, 2003). The seminar audiences at the Universities ofPadua and Trento are also acknowledged. We wish to thank Ines Macho-Stadler, David Waterman, DavidPerez-Castrillo, Gianni de Fraja, Benedetto Gui and Alessandro Rossi for insightful discussions. The usualdisclaimer applies.
†Dipartimento di Economia, Universita di Trento, Via Inama 5, 38100 TRENTO (Italy), Tel. (39) 0461882221, email: [email protected]
‡Corresponding author: Dipartimento di Scienze Economiche “M. Fanno”, Universita di Padova, Via delSanto 33, 35123 PADOVA (Italy), Tel. (39) 049 8274238, email: [email protected]

1 Introduction
Open source software is currently one of the most debated phenomena in the software in-
dustry, both theoretically and empirically. At the most basic level, the term open source
software simply means software for which the source code is open and available. The source
code is the set of written instructions that defines a program in its original form. “Availabil-
ity” implies that anybody can obtain the software and also the source code for free (or for a
nominal fee, usually media and shipping charges or online connection charges). A software
is said “open” when its source code can be modified by everybody.1
During the last ten years, open source software (OSS hereafter) has been flourishing
particularly in the market for high-end, sophisticated users. Apache is currently the most
popular software for web servers; its market share is about 60% of the total, more than
two times larger than Microsoft, its “closed source” commercial rival.2 Other examples
of well established open source software for sophisticated users are Sendmail, the dominant
messaging service program for routing and handling email by email servers, Free/Open BSD,
a server operating system and PERL, a programming language.3
Open source software packages are also available in the desktop, mass-market segment of
the industry. Two of the most prominent examples are OpenOffice, an open source suite for
office applications and Mozilla, a browser project initiated by Netscape.4 Contrary to the
software packages developed for professional high-end users, the open source software aimed
at targeting this segment of the market have not yet gained a significant market share.5
Perhaps the most popular open source project is the operating system Linux. Linux
is somehow peculiar; it grew in importance in the server market and, more recently, as a
desktop operating system it started competing with commercial software in the market for
low-end consumers.6
1All the details related to the open source software movement can be found at the web site
www.opensource.org.2Updated figures on active web servers can be found at www.netcraft.com.3For a complete list of the most successful open source projects, see the FLOSS report (Berlecon, 2002).4The graphic software “Gimp”, often called the “free Photoshop”, also belongs to this category. Similarly,
“Chandler” is a personal information manager intended for use in everyday information and communication
tasks such as composing and reading email. A plethora of open source applications including standard office
software, is also available for Palm computers; see www.palmopensource.com.5See Berlecon (2002), Bonaccorsi and Rossi (2003) and Evans and Reddy (2002) for further evidence.6Also Linux has gained significant market shares especially in the segment of the server operating systems.
2

The open source software is attracting a lot of attention not just in the computing and
in the academic communities but, recently, also in the political arena.7 Many governments
and municipalities around the world have already taken relevant steps in favor of open
source software usually aimed at helping the software to gain a sufficient installed base to
ignite the process of adoption; other countries are actually discussing which is the best way
to intervene in the software market and how to stimulate OSS.8 Various rationales have
been put forward to justify active government policies. Open source should be supported
because it is considered being technically superior with respect to the closed one and/or
because it is more stable and secure since it allows adopters to check and fix on their own
any possible bug and to optimize systems against viruses. Moreover, since open source is
usually available at nearly zero price, another common rationale for stimulating its adoption
in public administrations is based on budget concerns.9 In a more dynamic perspective,
the open source movement would deserve to be stimulated because its open nature provides
a better “environment” to spur innovation. The availability of the source code makes it
possible for software developers to improve upon the already existing programs.
With the relevant exception of Shapiro and Varian (2003) who strongly argue in favor
of Linux adoption in public administration because of its technical superiority and of its
open nature, the vast majority of the economic literature is skeptical about justifying forms
of government intervention in the software market. According to Evans and Reddy (2002)
there is no evidence of any market failure that would justify a governmental support in
favor of open source; Schmidt and Schnitzer (2003) go even further pointing out that any
active public policy favoring open source software always harms social welfare.10 These
See the FLOSS report (Berlecon, 2002).7There is already a relatively vast literature on OSS; the main issues addressed by this literature can
be grouped as follows: i) motivations to contribute to an OSS project, see Raymond (1999), Lakhani
and von Hippel (2003), and Lerner and Tirole (2002a) among others, ii) OSS licensing, see Lerner and
Tirole (2002b) and Valimaki (2003), and iii) competition between OSS and CSS, see Mustonen (2003) and
Casadesus-Masanell and Ghemawat (2003). Kuan (2001) looks at OSS as a result of consumer integration
into production and she investigates the market conditions that favor the emergence of OSS.8A clear, non technical and comprehensive discussion of government policies towards open source software
is in Hahn (2002).9It should be noticed that these rationales for public intervention coincide with users’ preferences; ac-
cording to the FLOSS Report, (Berlecon, 2002) the tree most important features that induce the adoption
of open source software are: better access protection, higher stability and lower licence fees.10Similarly, Smith (2002), stresses that is the marketplace rather than the policy arena to create the
3
authors observe that historically governments have a poor track record in selecting the best
technology through public intervention; they suggest that the choice of winners and losers
should be left to the marketplace, while governments should intervene only to ensure a level
playing field.
We are not fully convinced by the arguments against public intervention that have been
put forward; we believe that, especially in the mass-diffusion segment of the software market,
the level playing field cannot be taken for granted. An example may help to understand our
view. Consider the market for office applications; OpenOffice, available both under Linux
as well as under Windows, has been generally recognized as an extremely powerful and
versatile application.11 OpenOffice can be downloaded for free from the internet and it is
highly compatible with Microsoft Office; however, despite all these features its use is still
restricted to a small audience. In our view, this fact can be easily explained: the existence
and the features of OpenOffice are unknown to a large fraction of the potential adopters.
This example is emblematic and we believe that it may generalize to other open source
packages: the fact that the level playing field is not necessarily guaranteed is due to the very
essence of OSS, and this also makes the open source software a peculiar commodity. Contrary
to commercial vendors who make money on developing and selling their software and who
devote a considerable share of their revenues in campaigning their products,12 open source
developers do not obtain direct monetary rewards from their efforts; as a consequence, OSS
developers have little or no resources to advertise their products and to inform the potential
adopters. The presence of a large fraction of uninformed users ignoring the availability
or the characteristics of open source packages seems an intrinsic feature of the software
market, especially of the mass-diffusion segment where individuals are mostly uneducated
and unsophisticated users.
The aim of our paper is to analyze the impact on social welfare of the various forms of
right incentives to software developers. Bessen (2002) does not have a clear point in favor or against such
policies. However, he claims that the current patent protection of commercial software may be source of
social inefficiencies.11Just to take a relevant quotation from the Washington Post: “. . . after using the Windows version of
OpenOffice for the past week and a half, I can attest that it either matches or beats Microsoft Office in
features and ease of use, at the cost of slower performance on older computers . . . ”(Rob Pegoraro, “The
office suite and lets you see past Redmond, Washington Post, May 12, 2002.”)12To give an idea about the expenses in advertising by commercial firms, in the year 2002 Microsoft spent
the relevant amount of $ 909 millions for advertising in the US market. Data taken from www.adage.com.
4

interventions that have been proposed by many governments around the world; our model
is intended to describe competition in the segment of desktop, mass-market applications
(i.e. desktop operating systems, wordprocessors, spreadsheets or other office suites in gen-
eral) characterized, as discussed above, by the presence of a large fraction of unsophisti-
cated/uninformed users.
Our analysis moves from the contribution of Schmidt and Schnitzer (2003); the set up is
based on a very simple static model in which two software products are offered. The closed
source software is supplied by a commercial firm, while the open source is sold at marginal
cost by a fringe of independent developers.
Absent quality differences between products, we assume that potential adopters can be
segmented into two distinct categories: the informed users who know about the existence
of both the closed and the open source software and the uninformed ones who ignore the
existence and/or the characteristics of the open source alternative. Clearly, competition
between open and closed source software occurs only in the market for informed users and
we model it according to a standard Hotelling-like framework.13 The formal analysis is
divided in two sections. In Section 3 we consider the basic model; Section 4 extends this
framework to take account of a relevant feature of software markets, namely the presence of
network effects. Software products are extensively affected by network externalities since the
individual benefit from using a given package increases with the number of individuals having
adopted the same software or a compatible one. By including these effects into the model we
are able to understand better the impact of government intervention in the software market.
In order to characterize the market failures, we start by analyzing the pure market equi-
librium, that is the equilibrium when the government does not intervene, and then we show
under which circumstances an active government intervention may be desirable. The re-
maining sections of the paper are devoted to present the impact on social welfare of the
most commonly proposed government policies intended to correct these market failures.
To understand current governments thinking on open source it is useful to survey the
major public initiatives to support OSS.
13Other “competitive battlefields” that may fit our framework are the following: OpenOffice vs MS Office,
Gimp vs Photoshop, Linux for desktop vs MS Windows etc.
5

1.1 Government policies towards open source
Governments are great purchasers of computer software. As reported in Evans and Reddy
(2002), the US government alone spent $3.7 billion on software in 2000. A first and direct
public intervention in the software market is therefore very simple: whatever its merits
and characteristics, mandate adoption of OSS in public administration and at schools or
universities.
Many governments have already decided to support OSS in this way: in Latin America,
the Brazilian government passed a legislation that mandates OSS to be adopted in municipal
governments; in France, the government has decided to install OSS on desktops as part of
the project aimed at computerizing much of the country’s administration by 2007.14 In other
countries, pending legislations are waiting for parliamentary approval: in Italy too a similar
legislation is currently under discussion. The City of Austin (US) in January 2004 announced
that it would migrate several hundred Microsoft Office installations to OpenOffice.15
Other governments, such as Germany and Singapore, have also adopted a different ap-
proach. Singapore is offering tax breaks to companies that use the open source Linux op-
erating system instead of Windows; in Germany, an agreement has been reached between
the government and IBM that offers discounts on IBM machines with pre-installed Linux.
In both these examples, the adoption of OSS rather than the commercial alternative is
subsidized either through tax savings or hardware discounts.
A third policy, certainly less intrusive than the first two and for this reason also very
popular around the world, is based on supporting OSS through promotional campaigns. In
the US, many public education consortiums are promoting OSS. Just to take an example,
in North Mississippi, in August 2002 the local Education Consortium has adopted a pilot
program called “freedom to learn” aimed at campaigning OSS in public schools: students
have been introduced to OSS through 2002 and 2003 school years.16
Following these examples, it is possible to distinguish the various public initiatives to-
14This project is known as ADELE. See www.IDG.net.15The Israeli government has recently announced that agencies will continue to use Microsoft Office, but
that they will stop upgrading it; at the same time the government is promoting the use of open source
alternatives such as OpenOffice.16It must be noted that all the initiatives based on mandating public schools to adopt OSS also fall in this
third category: by using OSS at schools, students learn about OSS and this certainly constitutes a form of
promotional campaign.
6

wards OSS in the following three broad categories: i) mandatory adoption, ii) subsidization
and iii) information campaign.
The rest of the paper is organized as follows: Sections 2 and 3 present the basic model
under the simplification of no network effects; Section 4 extends the analysis to the case of
network externalities. In Section 5 we generalize our results and we discuss some open issues.
2 The model
2.1 Firm’s behavior
Competition occurs between a closed source software (CSS hereafter) and an open source
software (OSS). CSS is supplied by a single commercial firm while OSS is offered by a fringe of
independent developers. Products are horizontally differentiated and we model competition
using a standard Hotelling framework; the two products are located at the extremes of a
unit length segment: CSS at 0 and OSS at 1.
Open source software is sold at marginal cost while CSS is priced at p by its producer.
We assume zero marginal production cost for the two software and that the commercial
vendor is not able to discriminate consumers according to their location or to their type.
2.2 Consumers
There are two types of consumers: a) the “informed” users, i.e. those who know about the
existence of both CSS and OSS and that take their adoption decision comparing the utility
given by each alternative, and b) the “uniformed” users, i.e. those who ignore the existence of
OSS and that, therefore, consider only the closed source software when taking their adoption
decision. We assume for simplicity that the population of consumers is of mass 1; η is the
share of the uninformed, while 1 − η is that of the informed consumers. Irrespectively on
their type, consumers are uniformly distributed on a unit length segment.
A consumer located at x ∈ [0, 1] gets a net utility from buying the closed source software
or the open source alternative of respectively:
Uc = v + m(Nc)− tx− p and Uo = v + m(No)− t(1− x). (1)
where v is the gross utility from adopting the software and m(Ni) is the network externality,
that is the individual benefit of joining the network of size Ni, with i = c, o (c = closed,
7
o = open). Finally, t is a transportation cost and may be interpreted in many ways: the
cost of learning how to use the software, the installation cost or the cost of adapting other
software applications.17
In order to simplify the exposition and to derive analytical results in the first part of
the paper we do not consider network externalities; that is, we assume that m(Ni) = 0.
Network effects are reintroduced in Section 4 where we discuss how the presence of positive
externalities alters our main findings.18
3 Pure market equilibrium, market failures and gov-
ernment policies without network externalities
Let us assume for the moment that there are no network effects: m(Ni) = 0. In order to
highlight the presence and the characteristics of market failures, and therefore the scope for
a possible government intervention, we determine the pure market equilibrium, that is, the
outcome that arises without public policies in place; we then compare this equilibrium with
the social optimum.
3.1 Pure market equilibrium
The two software packages compete only in the market of the informed users. In this case,
given the price p charged by the producer of the closed source, the indifferent consumer is the
one who gets the same net utility from the two versions of the software. Formally, equating
17The model can be easily extended to incorporate vertical product differentiation and/or switching costs.
In particular, if the commercial vendor is the “incumbent” who offers an updated version of its software and
the OSS is the “entrant”, those users who adopt the latter software may incur into larger switching costs;
this scenario can be implemented by letting the gross benefit v from adopting OSS to be reduced by the
higher cost of switching. Provided that switching costs are not too large, our model still applies to this case.
Similar arguments hold for the case of vertically differentiated products.18It is interesting to note that absent network effects, our theoretical model resembles what observed in
the pharmaceutical industry where branded drugs face competition from generic drugs. These latter, which
are usually sold at a lower price, are often unknown to patients. To the best of our knowledge there is no
theoretical study on the effect of public policies supporting generic drugs. See Mestre Ferrandiz (2002) for
a recent contribution on competition between branded and generic drugs.
8

Uc = Uo given in expressions (1), the indifferent consumer is located at xi = t−p2t
.19
Uninformed users ignore that an open source software is available and confront the utility
that they receive when adopting CSS with the zero utility of not buying any software.
Therefore the indifferent uniformed consumer is the one located at xu = v−pt
, where xu
solves Uc = 0.20
Given xi, xu and the distribution of consumers among informed and uninformed types, the
profits for the CSS producer are π = p((1− η) xi + η xu). The firm cannot price discriminate
and from the first order condition it is easy to derive the profit maximizing price:21
p∗ =(1− η)
(1− η) + 2ηp∗i +
2η
(1− η) + 2ηp∗u. (2)
As shown in the above expression, p∗ is a weighted average between the optimal prices
p∗i = t2
and p∗u = v2
that the firm would charge if it were able to discriminate consumers
according to their type and where the weights of these two prices depend on the distribution
of consumers in the two segments of the market. Clearly, the larger (resp. smaller) the mass
of uninformed consumers (η high/resp. low), the closer p∗ is to p∗u (resp. p∗i ). In other words,
when setting p∗ the closed source software producer cares more of the segment of the market
with the larger magnitude.
Equilibrium market shares are obtained by replacing expression (2) into xi and xu:22
x∗i =t + 3 η t− 2 vη
4t (1 + η), and x∗u =
2 v − t + η t
2t (1 + η). (3)
In the segment of informed consumers, CSS is adopted by all those consumers located to
the left of x∗i and OSS by the others. On the contrary, in the segment of uninformed users,
CSS is adopted by all those consumers who are located to the left of x∗u; consumers located
further away from the CSS do not adopt any software at all.
Finally, having defined the equilibrium market allocations and the price, we can derive
the surplus of uninformed and informed consumers respectively:
Su = η
∫ x∗u
0
(v − tµ− p∗) dµ, (4)
19The subscript i stays for “informed”.20The subscript u stays for “uninformed”.21The second order condition is d2π
dp2 = − 1+ηt < 0, which is clearly always satisfied.
22Note that we need to impose restrictions on the parameters in order to ensure the existence of the model.
See the Appendix.
9

Si = (1− η)
[∫ x∗i
0
(v − tµ− p∗) dµ +
∫ 1
x∗i
(v − t(1− µ)) dµ
]. (5)
Total welfare is defined as the sum of consumers surplus and firm’s profit: W = Su+Si+π.
3.2 First and second best allocations
Let us now consider the socially optimal solution, namely the allocation that a welfare
maximizing planner/regulator would obtain by assigning consumers with one of the two
software packages. It is worth distinguishing between two cases: second best and first best.
We define the second best as the allocation chosen by the regulator under the constraint
that uninformed consumers can only adopt CSS;23 this is equivalent to say that the regu-
lator decides “who is going to adopt and what” but she takes as given the distribution of
consumers between informed and uninformed individuals. In this case, given that the two
software have the same gross valuation, v, the social optimum requires the minimization of
the transportation costs in the segment of informed consumers;24 conversely, in the segment
of uninformed consumers, the social surplus is maximized when all the individuals for which
the gross valuation v is larger than the transportation cost adopt the closed source software.
Remark 1 (Second best allocation). The second best is achieved when i) the informed con-
sumers adopt CSS for x ≤ 1/2 and OSS otherwise and ii) the uniformed consumers adopt
CSS for x ≤ min{v/t, 1}.
By first best we mean the situation in which the planner can also determine the type of
each consumer. This amounts to say that the government is able to decide the distribution
of consumers between informed and uninformed.
Remark 2 (First best allocation). The first best is achieved when i) all consumers are in-
formed (η = 0) and ii) those located at x ≤ 1/2 adopt CSS, while they adopt OSS otherwise.
23This definition has been provided by Mas-Colell, Whinston and Green (1995), page 819.24It can be easily verified that in order to ensure the existence of the model we need to impose that v > t
2 ;
in this case efficiency requires the segment of informed users to be fully covered.
10

By choosing η = 0, the planner is able to replicate any possible allocation that it can
be obtained when η > 0. Therefore, when there are no uninformed consumers, the social
welfare is at least as large as when η > 0. Moreover, it is socially optimal to allocate all the
(informed) consumers in a way that minimizes the transportation costs. As for the second
best, this occurs when consumers are equally split between the two products: those to the
left of 1/2 adopt CSS, while the remaining adopt OSS.
3.2.1 Market failures
Market failures can be easily determined by simple comparison of the social optimum with
the pure market equilibrium given in (3); our set-up encompasses three different failures,
which are summarized in the following remarks.
Remark 3 (Market failure 1). Too few informed consumers adopt CSS: x∗i < 1/2.
As already discussed, in the segment of informed consumers, social optimality would
require to split consumers equally between the two products in order to minimize trans-
portation costs. However, market forces do not lead to this outcome: since CSS is supplied
at p∗ > 0, while OSS is available for free, the latter is adopted by “too many” informed
consumers.
Remark 4 (Market failure 2). Conditional on the presence of uninformed consumers, η > 0,
too few adopt CSS, x∗u < min{v/t, 1}.
This failure relates to the monopolistic segment of the industry, that is that of uninformed
consumers. As for standard monopoly setting, too little amount of CSS is sold: there is a
deadweight loss due to the presence of a monopolistic producer.
Remark 5 (Market failure 3). Uninformed consumers do not make socially optimal adoption
decisions.
11
This failure is driven by the fact that uninformed consumers are unaware of the existence
of OSS. Among these consumers, those who would have optimally adopted OSS (i.e. the
individuals located close to the location of the open source software) either do not buy any
software at all or do adopt the wrong one. This means that due to their ignorance about the
existence of OSS, some uninformed consumers do not make the socially optimal adoption
decision and this leads to a market failure.
3.3 Government policies towards OSS
As we have discussed in the introduction, government policies towards OSS may take essen-
tially three forms. On the one side, governments may force agencies, schools or universities
to adopt OSS. Alternatively, a less intrusive policy may be based on informing people about
the existence and the characteristics of OSS. Finally, the government can subsidize the adop-
tion of the software open source through monetary incentives. We define the first policy as
mandatory adoption, the second as information campaign and the third as subsidization.25
The first two policies have the effect of changing the mass of consumers belonging to
the two types of informed and uninformed, while the third one has the effect of increasing
consumers valuation for OSS. Formally, we model these policies in the following way:
1. mandatory adoption: the government randomly selects an amount β ∈ (0, 1) of con-
sumers and forces them to adopt OSS.26 It is realistic to assume that, as for the closed
source producer, also the regulator ignores the location (i.e. the preferences) of each
consumer and also that she cannot distinguish between informed and uninformed users.
As a consequence, when β consumers are mandated to adopt OSS, the mass of informed
users reduces to (1−β) (1−η), while the mass of uninformed users reduces to (1−β) η.
2. information campaign: the government informs a share α of the uninformed consumers
25Clearly, the government may opt for a “policy mix” by combining two or more of these policies. Fur-
thermore, also without an explicit policy mix, both subsidization and mandatory adoption have intrinsically
an informative nature. Never the less, the aim of the paper is to study each policy in isolation from the
others, in order to disentangle their “plain” welfare effect. The evaluation of a policy mix is therefore a
simple combination of the results that we obtain for each policy and it can be easily derived.26More precisely, we consider the case in which the government imposes to these consumers to adopt OSS
provided that they get a positive net benefit (v − t(1− x) ≥ 0); in case v − t(1− x) < 0, they do not adopt
any software at all.
12

about the existence and the characteristics of OSS. As a consequence, the mass of
uninformed consumers becomes η − α, while that of the informed ones increases to
1− η + α.
3. subsidization: the government pays a subsidy s to every individual who adopts OSS.
Therefore, the gross consumer’s valuation of OSS becomes v + s.27
3.4 Mandatory adoption
Mandatory adoption is the most popular policy adopted by governments around the world.
With this policy the government forces some or all the public agencies, universities and
schools to adopt OSS.
The mass of informed consumers reduces to (1−η) (1−β), that of uninformed consumers
reduces to η (1−β), while β represents the mass of mandated consumers. Clearly, this policy
has the effect of reducing the mass of potential CSS adopters. However, the proportion of
informed to uninformed consumers remains unchanged. This fact implies that the weights
in expression (2) do not change and that the policy does not alter the equilibrium price p∗
nor the equilibrium indifferent consumers defined in expressions (3).
The following proposition summarizes the impact of mandatory adoption on total welfare.
Proposition 1. If the mass of uniformed consumers is sufficiently large, then mandatory
adoption increases social welfare. Formally there exists a unique η ∈ (0, 1) such that:
when η > η,dW
dβ> 0.
According to Proposition 1, the efficacy of the policy is driven by the presence of a large
fraction of uniformed users. When η is large, there are many individuals that do not buy any
software; let us call them as “inactive” users (i.e. those that do not know the existence of
the open source software and that at the same time do not buy the commercial software); by
mandating some these users to buy OSS, which is sold at a price of zero, the policy “forces”
them to enjoy a positive benefit. Clearly, the larger η, the more “inactive” individuals are
mandated to adopt OSS and the larger the total social benefit.
27A part from subsidization, we assume that the policies are implemented at zero cost. The introduction
of an implementation cost is straightforward.
13

Note that since the equilibrium price is unchanged, those individuals that are not man-
dated to adopt OSS receive the same amount of surplus while the mandated informed con-
sumers are clearly worse-off: the policy imposes them to adopt OSS and this restricts the
set of possible packages on which they can choose. Finally, since the mass of CSS potential
adopters is reduced, also the firm is harmed by the policy.
Summing up, mandatory adoption enhances social welfare when the positive effect on
the “inactive” individuals dominates the negative effect on the informed consumers and on
firm’s surplus. This occurs when the mass of uninformed consumers is sufficiently large.28
Proposition 1 is of particular relevance. Mandatory adoption is the most common policy
towards OSS and our set-up fits what observed in reality: as discussed in the introduction,
the presence of a large fraction of uninformed users who ignore the existence of OSS is
typical of the desktop mass-market segment of the software industry. Therefore, Proposition
1 suggests that promoting OSS applications through mandatory adoption is indeed a welfare
enhancing policy.
3.5 Information campaign
Through an information campaign, some uninformed consumers receive information about
the existence and the characteristics of OSS. Formally, this policy consists in moving a
fraction α ∈ [0, η] of consumers from the uninformed to the informed segment of the market.
As a consequence, the mass of consumers that remains uninformed reduces to η−α, while that
of informed becomes 1− η + α. In our analysis we assume that the government implements
such policy at no cost.
The study of this case closely resembles the one conducted when presenting the pure
market equilibrium. However, as the policy alters the proportion of informed to uninformed
consumers, the optimal price charged by the commercial producer changes. In particular,
since the proportion of informed consumers becomes larger, (2) converges towards p∗i .
The next proposition characterizes the effect on total welfare of the information campaign:
Proposition 2. Supporting the open source software through a costless information campaign
always increases welfare.
28This result contrasts with Schmidt and Schnitzer (2003) where mandatory adoption always hurts society;
the reason for this difference is that these authors do not consider the presence of uninformed consumers.
14
As for the case of mandatory adoption, the effect of the policy on producer’s surplus is
straightforward: since the policy shrinks the captive market of uninformed users, it undoubt-
edly harms the firm. To understand the effect of the information campaign on consumer’s
surplus we need to distinguish between two cases depending on whether the price charged for
the closed source software decreases or increases with α.29 Suppose that p∗ decreases with
α; in this case consumers are better-off. Consider the various types of users; while informed
consumers who adopt CSS benefit from a lower price, the policy does not have any impact
on those who adopt OSS. Similarly, the uninformed consumers who adopt CSS benefit from
a reduction in p∗ while those who do not adopt any software are unaffected. Finally, all the
uninformed consumers who become informed as a consequence of the campaign, are better-
off. If they adopt CSS they are charged a lower price, while if they adopt OSS they benefit
from a choice that was not available before.
From this discussion it is clear that when the policy induces the firm to charge a lower
price, the information campaign makes the market working better in all respects; each market
failure is lessened by the policy: it increases the share of consumers having adopted CSS
both in the segment of informed and in the segment of uniformed consumers (failures 1 and
2) and, obviously, it induces some previously uninformed users to take a more appropriate
decision (failure 3).
Furthermore, the information campaign always increases welfare, also when it induces
an increase in the price of the closed source software. In this case, market failures 1 and 2
become more severe but these negative effects are still dominated by the positive effect on
market failure 3. In other words, the fact that an additional fraction α of consumers is now
able to make a more informed adoption decision makes the proposed policy always welfare
enhancing.
3.6 Subsidization
The last policy under scrutiny is subsidization of OSS adoption. We model this policy by
assuming that the government pays a monetary transfer s to each individual who adopt the
open source software; formally, this amounts to assuming that the gross utility from adopting
OSS becomes v + s. Moreover, we also assume that the cost of the subsidy is entirely borne
29Since, as α increases, the optimal price converges to p∗i , then p∗ increases when p∗i > p∗u and decreases
otherwise.
15

by the society through lump sum taxation.30 The following proposition can be easily proved:
Proposition 3. Subsidizing the open source software always reduces welfare.
The policy induces the CSS producer to charge a different price for its software. Nev-
ertheless, to get more intuition of Proposition 3, consider first what happens if p∗ does not
change. The utility of all those consumers who adopt OSS both with or without the subsidy
increases of an amount s. However, this positive effect is exactly offset by the increase in
government expenditures and the net welfare effect is therefore zero. Similarly, also for those
consumers who adopt CSS there is no effect on social welfare: their utility does not change
nor the government pays any subsidy to them. On the contrary, for those consumers who are
induced by the subsidy to adopt OSS rather than CSS, the net effect on welfare is strictly
negative. The increase in the utility of these consumers does not compensate the increase in
government expenditure: without subsidies, CSS is their preferred software and when they
choose OSS instead, they certainly increase their utility but of an amount smaller than s.
On the top of these arguments we need to consider the effect of the subsidy on the optimal
price charged by the producer. It is possible to show that the firm, in order to protect its
market share, reacts to the subsidy by cutting the price. In terms of market failures, while
subsidizing OSS does not impact type 3 market failure, it mitigates failure 2 and it worsens
failure 1. Given that the subsidy induces the commercial software vendor to lower its price
then the deadweight loss in the uninformed segment is reduced. However, it is possible
to verify that the reduction in p∗ does not entirely compensate the subsidy payed to OSS
adopters and, as a consequence, OSS market share enlarges. This clearly accentuates market
failure 1.31
4 Public policies with network externalities
The above analysis has been conducted absent network effects. The presence of network
externalities is a recognized feature of software products and it is therefore interesting to
extend the model to take these effects into account.
30For simplicity, we assume that taxation does not have additional distortionary effects.31It is worth noticing that as long as the subsidization policy disseminates some information on the
existence of OSS, then the negative welfare effect shown in Proposition 3 is mitigated.
16

With network externalities the individual benefit from adopting a software is positively
affected by the number of other individuals having adopted the same software or a compatible
one. This effect lies on the simple observation that the more widespread a package, the easier
is to exchange files and information with other users and, therefore, the higher the utility
from adopting that particular software.32
We will consider the case of incompatible software so that the network effects associated
to one package only depend on the number of consumers adopting that particular package.33
The analysis will be conducted under the simplifying assumption of linear externalities;
formally, in expressions (1), this amounts to assume m(Ni) = θNi, where Ni corresponds to
the number of users of software i and θ ≥ 0 represents the strength of the externality.34
We proceed in the same way as in the previous section and we start by discussing the
socially optimal allocation; this will constitute the reference point for the subsequent analysis
of the welfare impact of the various policies towards OSS.
Proposition 4 (Second best with network effects). Compared to the case of no network
effects, with linear externalities the second best is achieved with more users assigned to CSS
both in the informed and in the uninformed segment of the market.
This proposition has a clear explanation. In the second best scenario, the planner takes
the mass of uninformed consumers as given. According to expressions (1), the presence of
network effects makes each software more valuable to consumers; this implies that in the
uninformed segment of the market it is optimal to have more users being assigned to CSS
32Despite the relevance of network externalities has been commonly accepted in software markets, few
econometric papers have tried to prove empirically the role of network effects in the software industry. See
Gandal (1994) and Brynjolfsson and Kemerer (1996).33We omit the analysis of compatibility for two different reasons: i) since under compatibility network
effects are the same for the two packages, the analysis closely resembles the one provided in the above section
and therefore it is of less theoretical interest and ii) the model with compatibility necessarily builds on ad-
hoc assumptions about the characteristics of network effects for uninformed users. We make the analysis of
compatibility available upon request.34Formally, Nc = (1 − η)xi + ηxu and No = (1 − η)(1 − xi). The theoretical literature on network
competition is extremely developed; often, the individual decision to adopt a given technology is assumed
being affected by his/her expectations on future installed base (see Katz and Shapiro, 1985). We follow a
simpler approach without consumers’ expectations, as in Shy (2001). Note also that the functional form for
the networks effects that we use together with the fact that we are not considering consumers’ expectations
guarantee that the equilibrium is unique.
17

than in Remark 1.
The larger second best market share for the commercial application in the segment of
informed users has a distinct explanation and it relies on the difference in the potential
installed base of the two packages; with uninformed users that can only be assigned to CSS,
the closed source software has a larger potential installed base. Therefore, to take advantage
of the larger network externalities associated to the commercial package, the government
finds it optimal to assign this software to a share of informed consumers which is larger than
the share that characterizes the second best without network effects. In other words, in the
segment of informed users, the regulator is no longer comparing two packages characterized
by the same gross utility as in Section 3, but it needs to take into account that CSS guarantees
a higher utility due to its larger installed base.35
Summing up, Proposition 4 shows that when the industry is affected by positive network
effects, it is optimal to have the market tipping towards standardization on one software.
Unfortunately, even in this simplified framework, we are not able to formally characterize
the impact of the various policies on social welfare.36 For this reason we need to resort to
numerical simulations in order to solve the model; the following sections are devoted to
present the numerical results for the three policies considered.
4.1 Mandatory adoption
In Figures 1 and 2 we plot the social welfare as a function of β for different degrees of the
network externalities. As it will be clear in a while, the amount of uninformed users, η, plays
a crucial role in the analysis; for this reason we consider two distinct market segmentations:
one with few and one with many uninformed users.37
35It can be verified, and the intuition goes straight, that the second best market shares of CSS are increasing
with the strength of the externality. Furthermore, when network effects are very strong, the second best
requires standardization towards CSS. Note also that in the first best scenario η = 0 and therefore the
potential installed base of the two software is the same: 1; this implies that when θ is sufficiently large, first
best is achieved with full standardization towards either CSS or OSS. A formal proof of these statements is
available upon request from the authors.36For the sake of completeness in the appendix we provide the formal procedure applied to derive the
welfare function with network externalities. The appendix focuses on the case of mandatory adoption; the
derivation of the social welfare for the other cases is similar and it is omitted for brevity.37All the plots shown in these sections have been drawn for v = 1.8 and t = 1.45; for each policy we have
considered the case of few uninformed consumers, η = 0.1, and the case of many uninformed consumers,
18

As shown, W (β) shifts upwards as θ gets larger: for any β, social welfare is higher the
stronger the externality due to the larger benefit that each individual obtains from software
adoption. Not surprisingly, with small network effects (θ low), Proposition 1 still applies:
the policy of mandating OSS adoption is welfare increasing when the share of uninformed
consumers is large and it is decreasing otherwise; as shown in Figures 1 and 2, for low levels
of θ, when η is small the welfare function is negatively sloped, while when η is large, W (β)
points upwards.
Fig 1: W (β) for low η Fig 2: W (β) for high η
The case with large network effects is more interesting. In line with the analysis of
the second best provided above, the general message is that the government intervention
increases welfare when it helps the market to tip towards the adoption of only one software.
Consider first the case of small η. In this scenario, the vast majority of consumers
is informed and, given that it is provided for free, OSS gains the largest users’ installed
base even without any policy. Under these circumstances, the effect of mandatory adoption
is therefore to enlarge even further the installed base of OSS and this increases the overall
η = 0.8. Finally, six different values of the strength of network effects have been considered, namely θ = 0.01,
0.05, 0.1, 0.2, 0.3 and 0.4. All these are reasonable values of the parameters; we have run a complete scan
of the parameters space and we have obtained plots with the same characteristics.
19

network effects and the welfare consequently. This is shown in Figure 1 where W (β) becomes
positively sloped for large values of θ.
When the number of uninformed consumers is large enough (η high), then, absent gov-
ernment intervention, CSS is the software with the largest installed base. In this case, the
impact of the policy depends on the amount of consumers that the government mandates to
adopt open source. When β is small, mandatory adoption reduces the market share of the
package with the largest installed base and this goes clearly against social welfare. On the
contrary, if β is sufficiently large, the policy becomes welfare enhancing: when the govern-
ment mandates many consumers to adopt OSS, then it makes open source as the software
with the largest installed base; this favors standardization and improves welfare. These
arguments explain why W (β) becomes U-shaped in Figure 2.
4.2 Information campaign
The analysis for the information campaign follows the same arguments. As shown in Figures
3 and 4, when network effects are small Proposition 2 is still valid: a costless information
campaign is welfare increasing (graphically, W (α) is positively sloped).
Things change with large network effects. Through an information campaign the govern-
ment makes some uninformed consumers aware of the existence of OSS and this increases the
market share of the open source software. As before, the policy enhances welfare provided
that it induces the market to tip towards OSS.
This always occurs when η is small since OSS is already the software with the largest
installed base (see Figure 3); when η is large, it is CSS rather than OSS to have a larger
installed base and W (α) becomes U-shaped. If the campaign reaches few uninformed con-
sumers it harms social welfare since it goes against standardization; on the contrary, if α is
large enough, then the campaign makes OSS the software with the largest installed base and
it makes the society better off.
20
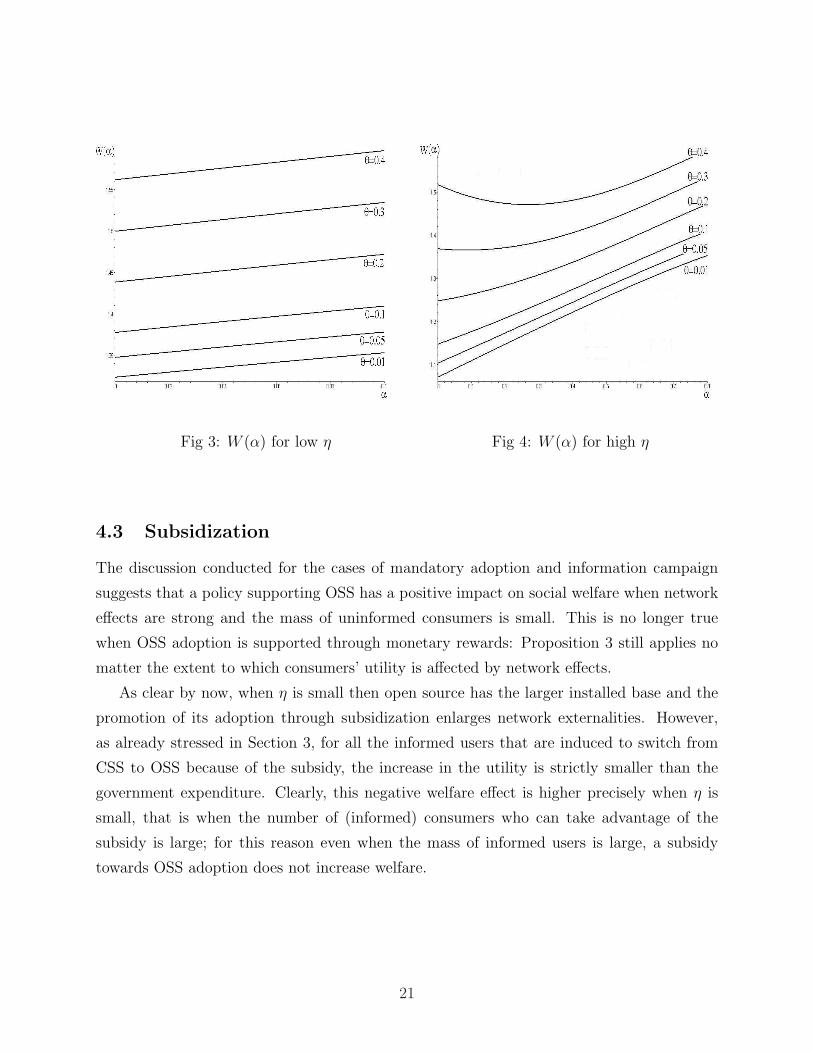
Fig 3: W (α) for low η Fig 4: W (α) for high η
4.3 Subsidization
The discussion conducted for the cases of mandatory adoption and information campaign
suggests that a policy supporting OSS has a positive impact on social welfare when network
effects are strong and the mass of uninformed consumers is small. This is no longer true
when OSS adoption is supported through monetary rewards: Proposition 3 still applies no
matter the extent to which consumers’ utility is affected by network effects.
As clear by now, when η is small then open source has the larger installed base and the
promotion of its adoption through subsidization enlarges network externalities. However,
as already stressed in Section 3, for all the informed users that are induced to switch from
CSS to OSS because of the subsidy, the increase in the utility is strictly smaller than the
government expenditure. Clearly, this negative welfare effect is higher precisely when η is
small, that is when the number of (informed) consumers who can take advantage of the
subsidy is large; for this reason even when the mass of informed users is large, a subsidy
towards OSS adoption does not increase welfare.
21

Fig 5: W (s) for low η Fig 6: W (s) for high η
5 Open issues and final remarks
In this paper we have analyzed the impact on social welfare of the three most popular
government policies in support of open source software that have been proposed in many
countries. The analysis has been conducted using a static model in which an open source
and a closed source/commercial software compete.
Our analysis is intended to describe competition in the mass-diffusion segment of the soft-
ware industry where users are often unsophisticated and, therefore, generally little informed
about the existence of open source alternatives to the most popular commercial software.
Moving from this observation, we have divided consumers according to their knowledge of
the open source: some consumers know the existence and the characteristics of the software
open source while others ignore it; in the first case they are said “informed”, while they are
“uninformed” otherwise. Competition occurs only in the segment of informed consumers.
The presence of uninformed consumers leads to market inefficiencies that may justify
government policies. We have started the analysis by considering a stylized software market
without network externalities; in this scenario, we have shown that a part from promoting
OSS through public subsidization, stimulating the adoption of open source desktop appli-
cations either through information campaigns aimed at informing the uninformed users or
by mandating OSS adoption in public agencies, schools and universities may have positive
22

welfare effects.
The model is then extended to take account of positive network effects. Through numer-
ical simulations, we have shown that with small network effects the conclusions of the basic
model are confirmed. When network effects get stronger, things may change; we have shown
that supporting OSS either through mandatory adoption or information campaign may in-
crease welfare provided that the public intervention helps the market to tip towards OSS.
Applying this analysis to the mass diffusion segment of the software market, characterized
by a large fraction of uninformed users, we have shown that with large network effects a
policy which stimulates OSS needs to be sufficiently drastic to induce welfare improvements.
The aim of our analysis has been to provide a simple and useful benchmark to evaluate
the social impact of the various policies in favor of OSS. The simplicity of our model rep-
resents its main weakness since it comes at the cost of neglecting some important features
of the real world. The most important limitation of our model is certainly its static na-
ture; we do not consider neither R&D activity from software producers nor firms entry and
compatibility strategies, which have all dynamic nature.38 Nevertheless, even in the absence
of dynamics, we believe that our model represents a useful starting point for analyzing the
static welfare effects of the various policies in the mass-diffusion segment of the market. As
we have pointed out in the introduction, many of those authors who argue against active
policies in the software market base their claims on the observation that governments are
often prone to make mistakes in “picking up the winner”. This is an important aspect
that we have implicitly ruled out by assuming that CSS and OSS are qualitatively identical
and, more importantly, by assuming that the government perfectly observes the quality of
the various software. This is clearly a relevant assumption but we believe that it has a
practical justification: the mass-diffusion segment of the market is typically made of unso-
phisticated/uneducated users who devote little time in searching for the available packages
and/or in collecting information on their characteristics. The assumption that government
agencies have some deeper information seems therefore plausible.
In relation to the widespread view that governments should intervene only to guarantee
a level playing field rather than selecting the (wrong) winner, it is interesting to note that in
some sense, our results go also in this direction: of the three policies presented in this paper,
38Whether public intervention in favor of open source encourages innovation it is still an extremely con-
troversial issue. See Shapiro and Varian (2003) and Schmidt and Schnitzer (2003) for a discussion.
23
the information campaign is the less intrusive one and, at the same time, it is the policy that
performs better in terms of welfare. By informing the individuals about the existence of OSS,
the government does not select the winning technology but she simply makes consumers in
the best position to choose, leaving them free to adopt their favorite software.
Finally, it remains to be noticed that the presence of a fraction of uninformed users is not
the only possible explanation for the poor performance of open source packages in the mass-
diffusion segment of the software market. As discussed,39 due to the presence of switching
costs, consumers may be locked-in to the dominant commercial software or, more simply,
there may be some degree of vertical differentiation between alternative products. Similarly,
a potential user might be prevented from adopting an open source software because it does
not come with adequate support services. However, we are convinced that the lack of relevant
information on open source products is an important part of the picture in the mass-diffusion
segment, even though it is not the unique explanation for its poor performance.
39See footnote 17.
24

References
Berlecon (2002). Free/Libre and Open Source Software (FLOSS): Survey and Study. Inter-
national Institute of Infonomics, University of Maastricht and Berlecon Research.
Bessen, J. (2002). What Good is Free Software? in Hahn (2002).
Bonaccorsi, A. and Rossi, C. (2003). Why Open Source Can Succeed. Research Policy,
32:1243–1258.
Brynjolfsson, E. and Kemerer, C. (1995). Network Externalities in Microcomputer Software:
An Econometric Analysis of the Spreadsheet Market. MIT Center for Information
Systems Research, working paper no. 265.
Casadesus-Masanell, R. and Ghemawat, P. (2003). Linux vs. Windows: Modeling Competi-
tion between Open-Source and Closed Software. Harvard Business School, mimeo.
Evans, D. S. and Reddy, B. (2002). Government Preferences for Promoting Open-Source
Software: a Solution in Search of a Problem. N.E.R.A. working paper.
Gandal, N. (1994). Hedonic Price Indexes for Spreadsheets and an Empirical Test of the
Network Externalities Hypothesis. RAND Journal of Economics, 25:160–170.
Hahn, R. W. (2002). Government Policy toward Open Source Software. AEI- Brooking Joint
Center for Regulatory Studies, Washington D.C.
Katz, M. L. and Shapiro, C. (1985). Network Externalities, Competition, and Compatibility.
American Economic Review, 75:424–440.
Kuan, J. (2001). Open Source Software as Consumer Integration Into Production. Haas
School of Business, University of California at Berkeley. Mimeo.
Lakhani, K. R. and von Hippel, E. (2003). How Open Source Software Works: ”Free”
User-to-User Assistance. Research Policy, 32(6):923–943.
Lerner, J. and Tirole, J. (2002a). Some Simple Economics of Open Source. Journal of
Industrial Economics, 50:197–234.
25

Lerner, J. and Tirole, J. (2002b). The Scope of Open Source Licensing. NBER working
paper 9363.
Mas-Colell, A., Whinston, M. D., and Green, J. R. (1995). Microeconomic Theory. New
York: Oxford University Press.
Mestre Ferrandiz, J. (2002). Essays on the Pharmaceutical Industry . PhD Thesis, Univer-
sitat Autonoma de Barcelona, mimeo.
Mustonen, M. (2003). Copyleft - The Economics of Linux and Other Open Source Software.
Information Economics and Policy, 15:99–121.
Raymond, E. (1999). The Cathedral and the Bazaar: Musings on Linux and Open Source
from an Accidental Revolutionary. Sebastapol, CA: O’Reilly and Associates.
Schmidt, K. and Schnitzer, M. (2003). Public Subsidies for Open Source? Some Economic
Policy Issues of the Software Market. Harvard Journal of Law & Technology, 16(2):474–
505.
Shapiro, C. and Varian, H. R. (2003). Linux Adoption in the Public Sector: An Economic
Analysis. Paper presented at the 2003 AEA annual conference.
Shy, O. (2001). The Economics of Network Industries. New York: Cambridge University
Press.
Smith, B. L. (2002). The Future of Software: Enabling the Marketplace to Decide. in Hahn
(2002).
Valimaki, M. (2003). Dual Licensing in Open Source Software Industry. Systems
d’Information et Management, 8(1):63–75.
26

Appendix
Pure market equilibrium: restrictions on the parameters. In order to ensure the existence of the
model, we need to check when the parameters satisfy the following conditions:
0 ≤ x∗i ≤ 1, 0 ≤ x∗u ≤ 1, U∗c = v − tx∗i − p∗ ≥ 0.
where p∗, x∗i and x∗u are given in expressions (2) and (3).
The first two conditions guarantee that at the market equilibrium the indifferent consumers lie
on the [0, 1] segment; the third condition ensures that the indifferent informed consumer gets non
negative utility. From the first condition derives that: v ≤ t(1+3η)2η , while from the second one:
t(1−η)2 ≤ v ≤ t(3+η)
2 . Finally, the indifferent informed consumer enjoys a non negative utility if:
v ≥ t(3+η)2(2+η) . Putting all these conditions together it is easy to verify that the model exists for:
v ∈ (v, v), where v =t(3 + η)2(2 + η)
, and v =t(3 + η)
2. (6)
Proof of Proposition 1. When the government extracts β consumers from the entire population and
forces them to adopt OSS, firm’s equilibrium profits are simply (1 − β) times the profits earned
without public intervention: π = (1−β) p((1− η) t−p
2t + η v−pt
); the optimal price is the same as in
the pure market equilibrium. Moreover, also the range of existence of the model is as in the pure
market equilibrium case.
Two cases must be considered: i) the gross utility v is not big enough and, among the mandated
consumers, only those located “non too far” from the right end of the segment adopt OSS, and
ii) v is so high that, irrespective of their location, all the selected consumers buy OSS. Formally:
i) v < t such that only those located in ( t−vt , 1) adopt OSS, and ii) v ≥ t. Note that v ∈ (v, v) so
that case i) is defined only for v ∈ (v, t) while case ii) is defined for v ∈ (t, v).
The net consumer surplus of the informed, the uninformed and the mandated consumers are re-
spectively:
Si = (1− η)(1− β)
[∫ x∗i
0(v − tµ− p∗) dµ +
∫ 1
x∗i(v − t(1− µ)) dµ
],
Su = η(1− β)∫ x∗u
0(v − tµ− p∗) dµ,
Sm = β
∫ 1
max{0, t−vt}(v − t(1− µ)) dµ.
27

where in the expression for Sm we have incorporated the two possible cases i) and ii). Let us
prove the proposition for case i); the proof for case ii) goes in the same way and it is omitted
for brevity.40 In this case, total welfare which is defined as the sum of consumers’ and producer’s
surplus, W = Si + Su + Sm + π, is:
W =((4(1− β)η2 + 8(η + β))v2 + t(1− β)(1− η)(4(3η + 4)v − t(3η + 5)))
16(1 + η)t.
Differentiating this expression with respect to β:
dW
dβ=−(3t2 − 12vt + 4v2)η2 − 2t(t− 2v)η − 16vt + 8v2 + 5t2
16 (1 + η) t.
The sign of this expression is given by the sign of the numerator which is a parabola in η, with
η ∈ (0, 1). It is easy to verify that at the extremes η = 0 and η = 1:
sign
{dW
dβ
} ∣∣∣∣η=0
= sign{8v2 − 16vt + 5t2}, sign
{dW
dβ
} ∣∣∣∣η=1
= sign{4v2}.
From simple inspection, it is immediate to check that at η = 0, dW/dβ < 0 for any v ∈ (v, t)
while at η = 1, dW/dβ > 0. This is sufficient to prove that there exists a unique value
η ∈ (0, 1) such that dW/dβ < 0 for η < η and dW/dβ > 0 otherwise.
Proof of Proposition 2. Firm’s profits are: π = p((1− η + α) t−p
2t + (η − α)v−pt
). Solving the first
order condition, firm’s optimal price is:41 p∗ = t (1−η+α)+2v (η−α)2 (1+η−α) .
Unlike mandatory adoption, with an information campaign firm’s optimal price changes with re-spect to the pure market case: we need to find the new range of parameters for the existence of themodel. It is possible to show that in this case, the model exists for v ∈ [v, v], where v = t(3+η−α)
2(2+η−α) ,
v = t(3+η−α)2 .
Replacing p∗ into the expressions for the indifferent consumers xi and xu and into the consumerssurpluses given in (4) and (5), we finally derive the total welfare:
W =4 (α− η) (α− 2− η) v2 − 4t
(η − 4− α− 6ηα + 3η2 + 3α2
)v + t2 (1− η + α) (3α− 3η − 5)
16t (1 + η − α). (7)
Differentiate with respect to α and get:
dW
dα=
(3 t2 + 4 v2 − 12 vt) (α− η) (α− 2− η) + 8 v2 + 7 t2 − 20 vt
16t (1 + η − α)2 . (8)
40Proof available on request.41The second order condition is d2π
dp2 = − 1+η−αt < 0 and it is always satisfied.
28

This function decreases with α; to see this, take the second order derivative d2Wdα2 = − (v−t)2
2t(1+η−α)3,
which, for α ∈ (0, η), is always negative: dW/dα is monotonically decreasing in α. In order
to verify that the welfare increases with α it is enough to show that dW/dα > 0 at α = η.
From expression (8): dWdα
∣∣α=η
= 20 vt−8 v2−7 t2
16t.
The sign of this expression is given by the sign of the numerator which is concave in v. It
is easy to verify that the numerator is positive at v = v and at v = v, which is sufficient to
guarantee that it is positive for any admissible value of v.
Proof of Proposition 3. Consider the market for the informed consumers. When the government
pays a subsidy s to all those individuals who adopt OSS, the indifferent consumer is located at xi,
where xi solves the following condition: v − p− txi = v + s− t(1− xi). The indifferent consumer
is therefore located at x∗i = t−p−s2t .
The location of the indifferent uniformed consumer does not change with respect the pure market
equilibrium and it is defined in (3). Firm’s profits are therefore: π = p((1− η) t−p−s
2t + η v−pt
).
Solving the first order condition, the optimal price is:42 p∗ = (t−s)(1−η)+2 η v2+2 η .
Replacing this price into the expressions for the indifferent consumers xi and xu and into the
consumers surpluses given in (4) and (5), we can derive the welfare as a function of the policy
parameter s. Moreover it is possible to verify that: dWds = − (1−η)(s+t(1−η)+7 sη+2 η v)
8t(1+η) < 0.
Proof of Proposition 4. The Proposition can be easily proved. In the second best scenario the
planner takes η as given and chooses the allocation (xi, xu) in order to maximize total welfare. Let
us define Bc(θ, x) = v + θNc − tx and Bo(θ, x) = v + θNo − t(1 − x) as the individual benefit of
adopting CSS and OSS respectively.
The second best market share in the segment of uninformed users is xsbu (θ) = min{1, x} where
x solves Bc(θ, x) = 0. Since, by construction, Bc(θ, x) > Bc(0, x), ∀ θ > 0 and ∀x ∈ [0, 1],
then xsbu (θ) ≥ xsb
u (0) ∀ θ > 0: with positive network effects, the second best is achieved with more
uninformed users assigned to CSS. Similar arguments apply to the informed segment of the market;
in this case, two scenarios are possible: either xsbi (θ) ∈ {0, 1}, namely there is a corner solution, or
xsbi (θ) ∈ (0, 1), namely the second best is an interior. In the first case, it cannot be that xsb
i (θ) = 0:
provided that there are uninformed users and these are assigned to CSS, then, due to larger installed
42The second order condition is d2πdp2 = − 1+η
t < 0 and it is always satisfied. Moreover, the model exists for
v ∈ [v, v], where in this case: v = (t−s)(3+η)2(2+η) , and v = t(3+η)−s(1−η)
2 .
29

base, assigning all informed consumers to CSS implies a strictly larger welfare. In the second case,
optimality requires indifference between CSS and OSS: Bc(θ, xsbi (θ)) = Bo(θ, xsb
i (θ)), ∀ θ ≥ 0.
Again, provided that there are uninformed users assigned to CSS, Bc(θ, 1/2) > Bo(θ, 1/2); this
implies that xsbi (θ) > 1/2 ∀ θ > 0 and it completes the Proof.
The Welfare function with network externalities. 43 In this appendix we show the procedure ap-
plied to derive the welfare function with mandatory adoption when the individual utility is affected
by network effects as in (1). We focus on the case with v > t so that all the consumers that are
mandated by the government do actually adopt OSS. A similar reasoning applies for v < t.With network effects the location of the indifferent informed and uninformed consumers are obtainedby solving the following system of equations:
{v + θ(xi(1− η)(1− β) + xuη(1− β))− txi − p = v + θ((1− xi)(1− η)(1− β) + β)− t(1− xi),
v + θ(xi(1− η)(1− β) + xuη(1− β))− txu − p = 0
where the first equation defines the indifferent informed consumer while the second one the
indifferent uninformed consumer. Let the locations of the indifferent informed/uninformed
consumer when the firm charges the price p, x∗∗i (p) and x∗∗u (p), be solution to this system of
equation, then the firm sets p to maximize its profit: π = p(1− β)((1− η)x∗∗i (p) + ηx∗∗u (p)).
From the first order condition:44
p∗ =
(t((1− η)2 + η β (1− η)
)+ (1− η) vη (1− β)
)θ − t2 (1− η)− 2 η tv
2 θ η (1− β) (1− η)− 2 t (1 + η).
The equilibrium indifferent consumers x∗∗i and x∗∗u can be obtained replacing this expres-
sion into x∗∗i (p) and x∗∗u (p). Equilibrium profits and the surplus enjoyed by informed and
uniformed consumers are respectively:
π = p∗(1− β)((1− η)x∗∗i + ηx∗∗u ),
Si = (1− η)(1− β)
[∫ x∗∗i
0(v + θ((1− η)(1− β)x∗∗i + η(1− β)x∗∗u )− tµ− p∗) dµ
+∫ 1
x∗∗i
(v + θ((1− η)(1− β)(1− x∗∗i ) + β)− t(1− µ)) dµ
],
43This is a sketch of the proof. Full details are available on request.44The second order condition has been verified.
30

Su = η(1− β)
[∫ x∗∗u
0(v + θ((1− η)(1− β)x∗∗i + η(1− β)(x∗∗u ))− tµ− p∗) dµ
],
while the net consumer surplus of those who are mandated to adopt OSS is:
Sm = β
[∫ 1
0
(v + θ((1− η)(1− β)(1− x∗∗i ) + β)− tµ) dµ
].
Total welfare is: W = Si + Su + Sm + π.
31
Copyright © 2022 FDOKUMEN