
Open online surgical education: The experience with hand surgery. Vaikunthan Rajaratnam, Louise...
182
Transcript of Open online surgical education: The experience with hand surgery. Vaikunthan Rajaratnam, Louise...


1 | P a g e
2 | P a g e
Table of Contents Preface ............................................................................................................................. 4
Professor Nabil Baydoun .............................................................................................................................. 4
Research Papers ................................................................................................................ 5
Knowledge and Beliefs Related to Cervical Cancer, Pap Smear Screening and HPV Vaccination
among Women in Umm Al Qawain, UAE ........................................................................... 5
Dr. Haleama Al Sabbah ................................................................................................................................. 5
Alya Saeed Al Haran ..................................................................................................................................... 5
Prostate cancer screening campaign for Emiratis: A risk-benefit analysis ......................... 23
Sara El Khadra ............................................................................................................................................. 23
Preventing Insurance Fraud in Dubai – A Risk Management Approach ............................. 43
Niyi Awofeso ............................................................................................................................................... 43
Samer Hamidi ............................................................................................................................................. 43
Mayada Moussa ......................................................................................................................................... 43
Moetaz El Sergani ....................................................................................................................................... 43
Effect of Virtual Reality on Breast Cancer Patients ........................................................... 57
Rasha A. Al-Malik ........................................................................................................................................ 57
Wadee Alhalabi .......................................................................................................................................... 57
Green Economy - Carbon Dioxide: From Pollution to Solution: Dubai’s Paradigm Shift for Carbon
Capture & Storage (CCS) and Utilization of Carbon Dioxide .............................................. 69
Rashed Karkain ........................................................................................................................................... 69
Detection of Cryptosporidium and Giardia in irrigation water of public parks in Dubai, United
Arab Emirates ................................................................................................................. 82
Munawwar A. Khan .................................................................................................................................... 82
Hessa S.S. Alkitbi ......................................................................................................................................... 82
Alia A.A. Aljanahi ........................................................................................................................................ 82
Rania Dghaim .............................................................................................................................................. 82
Leading cause of road traffic morbidity and mortality in the United Arab Emirates (UAE) and the
main adaptations to reduce it ......................................................................................... 90
Aisha Salem Mohammed............................................................................................................................ 90
Eating Disorders Prevalence and Determents in UAE among Emirati Young Females ...... 106
Alla Mansour ............................................................................................................................................ 106
Prevalence and Pattern of Traditional and Complementary Alternative Medicine Use in Diabetic
Patients in Dubai, UAE .................................................................................................. 123
Usama ALAlami ......................................................................................................................................... 123

3 | P a g e
Munawwar A. Khan .................................................................................................................................. 123
Khulood A. Saeed ..................................................................................................................................... 123
Surgical Education- The Experience With Hand Surgery ................................................. 132
Vaikunthan Rajaratnam ............................................................................................................................ 132
Solving Environmental Problems of Old Areas of Dubai: A Focus on Deira Gold Souq in Dubai
..................................................................................................................................... 148
Hawra S. Askari ....................................................................................................................................... 148
Haşim Atlan .............................................................................................................................................. 148
Survey of Occupational Health and Safety Practices at Latifa Hospital, UAE – staff nurses’
perspectives .................................................................................................................. 164
Kefah Hussni Aldbk ................................................................................................................................. 164
4 | P a g e
Preface Innovation Arabia 8, was held under the patronage of His Highness Sheikh Hamdan Bin Mohammed Bin
Rashid Al Maktoum, Crown Prince of Dubai and President of HBMSU. Innovation Arabia 8 took place in the
Address Hotel, Dubai Mall, in Dubai during the period 16 to 18 February 2015. The main theme of this year
conference is “Innovate, Collaborate, and Differentiate: Honouring the Past, Treasuring the Present, and
Shaping the Future”. This theme reflects the belief that, innovation is the path towards growth, progress
and a better tomorrow for the Arab World. Innovation Arabia is a scientific refereed event where thought
leaders, academics, and the professional community searching to exchange ideas, discuss trends, solutions
and challenges in the development of sustainable economies and societies in the Arab World through
innovation. Innovation Arabia will feature four important tracks:
• Quality and Business Management
• Smart Learning
• Health and Environment and
• Islamic Banking and Finance
The main objectives of Innovation Arabic are:
1. To discuss theoretical and applied research related to innovation in quality, e-learning, Islamic
Banking and Finance and Health and Environment.
2. To analyse current issues and challenges facing the Arab World and the role of innovation in creating
sustainable development.
3. To provide a forum for exchange of research ideas and practices and the creation of new ideas to
assess the current state of knowledge and development of the discipline in theory and practice.
4. To provide an environment for free discussion of new concepts, research developments, and
applications in innovation in quality, e-learning, Islamic Banking and Finance and Health and
Environment.
One important purpose of the conference was to highlight the significance of innovation to enhance the
UAE and the Arab world’s economic competitiveness. Innovation Arabia was the outcome of our belief that,
innovation is the path towards growth, progress and a better tomorrow for the Arab World. Innovation
Arabia should help to capitalize on the successes and the potential of this community.
This conference represented a small step forward, by giving scholars, researchers, thinkers and
practitioners the opportunity to share thoughts, debate issues, exchange knowledge and create consensus
on the ‘future’ and what might or might not happen.
The conference featured many other activities including many formal and informal networking
opportunities including an exclusive gala dinner, bringing together researchers, industry leaders from
international organizations, local and regional government entities and the corporate sectors and NGOs to
discuss and address trends, solutions and challenges in the development of sustainable economies and
societies in the Arab World through innovation.
Professor Nabil Baydoun
Chair, Innovation Arabia 8, 2015
5 | P a g e
Research Papers
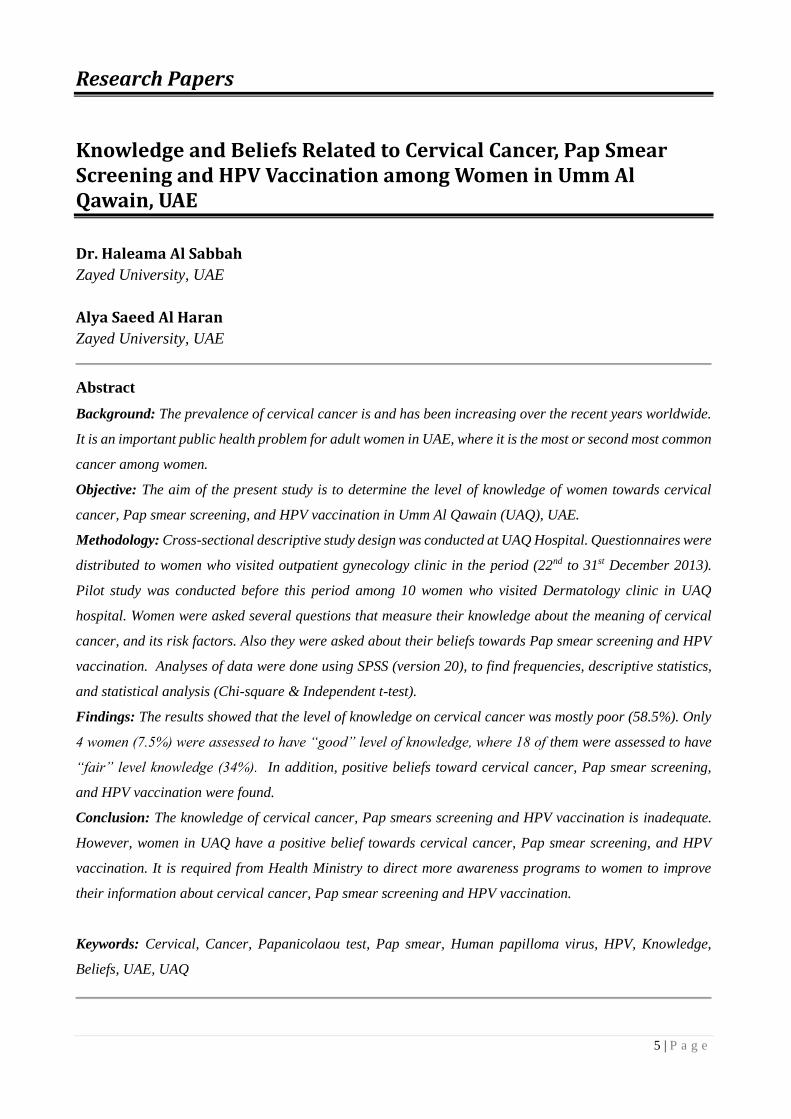
Knowledge and Beliefs Related to Cervical Cancer, Pap Smear Screening and HPV Vaccination among Women in Umm Al Qawain, UAE
Dr. Haleama Al Sabbah
Zayed University, UAE
Alya Saeed Al Haran
Zayed University, UAE
Abstract
Background: The prevalence of cervical cancer is and has been increasing over the recent years worldwide.
It is an important public health problem for adult women in UAE, where it is the most or second most common
cancer among women.
Objective: The aim of the present study is to determine the level of knowledge of women towards cervical
cancer, Pap smear screening, and HPV vaccination in Umm Al Qawain (UAQ), UAE.
Methodology: Cross-sectional descriptive study design was conducted at UAQ Hospital. Questionnaires were
distributed to women who visited outpatient gynecology clinic in the period (22nd to 31st December 2013).
Pilot study was conducted before this period among 10 women who visited Dermatology clinic in UAQ
hospital. Women were asked several questions that measure their knowledge about the meaning of cervical
cancer, and its risk factors. Also they were asked about their beliefs towards Pap smear screening and HPV
vaccination. Analyses of data were done using SPSS (version 20), to find frequencies, descriptive statistics,
and statistical analysis (Chi-square & Independent t-test).
Findings: The results showed that the level of knowledge on cervical cancer was mostly poor (58.5%). Only
4 women (7.5%) were assessed to have “good” level of knowledge, where 18 of them were assessed to have
“fair” level knowledge (34%). In addition, positive beliefs toward cervical cancer, Pap smear screening,
and HPV vaccination were found.
Conclusion: The knowledge of cervical cancer, Pap smears screening and HPV vaccination is inadequate.
However, women in UAQ have a positive belief towards cervical cancer, Pap smear screening, and HPV
vaccination. It is required from Health Ministry to direct more awareness programs to women to improve
their information about cervical cancer, Pap smear screening and HPV vaccination.
Keywords: Cervical, Cancer, Papanicolaou test, Pap smear, Human papilloma virus, HPV, Knowledge,
Beliefs, UAE, UAQ
6 | P a g e
Introduction
Cancer is a major health problem around the globe. Each year, tens of millions of people are
diagnosed with cancer around the world, and more than half of the patients eventually die from it. It
ranks the second most common cause of death in most of the countries, following cardiovascular
diseases, and it seems that it will soon become the number one killer in many parts of the world
(GLOBOCAN, 2008). In 2008, it was the cause for 7.6 million deaths (GLOBOCAN, 2008).
Moreover, deaths from cancer worldwide are expected to continue rising, with an estimated 13.1
million deaths in 2030 (GLOBOCAN, 2008). It is a generic term for a large group of diseases more
than 100 distinct diseases, which can affect any part of the body. It characterized by the uncontrolled
growth of abnormal cells in the body, and described as either malignant tumours or benign tumours
(Encyclopaedia Britannica, 2013).
There are many different types of cancer, differ between men and women. For instance, lung,
stomach, liver, colon, breast and cervical cancer, which cause the most cancer deaths each year
(GLOBOCAN, 2008). According to WHO, “about 30% of cancer deaths are due to the five leading
behavioral and dietary risks as high body mass index, low fruit and vegetable intake, lack of physical
activity, tobacco use, alcohol use” (WHO, 2013). Furthermore, there are many other causes that lead
to the transformation from a normal cell into a tumor cell. These changes are the result of the
interaction between a person's genetic factors and three categories of external agents, including:
physical carcinogens, such as ultraviolet and ionizing radiation; chemical carcinogens, such as
asbestos, aflatoxin (a food contaminant) and arsenic (a drinking water contaminant); and finally
biological carcinogens, such as infections from certain viruses, bacteria or parasites (WHO, 2013)
Cervical cancer is a major global health problem, with about 500,000 new cases and 250,000
deaths each year (Ullekh, October, 2013). Over the past decade, dedicated scientists, researchers,
clinicians, frontline health workers, community leaders and advocates have worked tirelessly to
bring cervical cancer to the world’s attention and to develop and apply the necessary knowledge and
technologies to reduce the second cancer killer of women around the world, and UAE especially. In
UAE, cervical cancer is the second commonest cancer in females. The Health Authority in Abu
Dhabi (HAAD) reports around 50-55 cases annually in the Emirate of Abu Dhabi with an incidence
of 7 per 100,000 women; most of them occur in young women who aged 35 to 55 years (HAAD,
2013).

7 | P a g e
Cervical cancer is a type of cancer that usually starts in the cervix, which is the lower part of
the woman’s uterus. There are two main types of cells on the cervix’s surface, squamous and
columnar cells, and the place where these two types of cells meet is referred to the transformation
zone. It has been identified that most cervical cancer actually starts from squamous cells. However,
cervical cancer starts at first with a condition that is referred to dysplasia, which is a precancerous
treatable condition if it was detected early through screening, the Papanicolaou test, also known as
Pap test. In addition to that, cervical cancer can be caused by a common virus called human
papilloma virus (HPV), a virus that is sexually transmitted. Statistics have shown that almost all
cervical cancer cases were as a result of HPV (National Cancer Institute, 2012).
Several risk factors can contribute to a woman developing the disease, such as, not getting
the HPV vaccine, poor economic status, and women whose mothers have taken the drug
diethylstilbestrol (DES) during their pregnancy in the early 1960s aiming to prevent miscarriage are
more susceptible to developing this type of cancer (Stevens, 2013; American Cancer Society, Inc.,
2012). HPV can affect any women who is sexually active, the body has the capability of clearing the
infection by its own, however, if the body did not, it develops into a chronic infection and eventually
the cells become cancernous cells. In addition, there are another risk factors that increase the
development of cervical cancer as the use of birth control pills for more than five consecutive years,
above three full-term pregnancies, having a full-term pregnancy at a young age, and having a
condition that alters the body’s immunity and having sexually transmitted diseases (Stevens, 2013).
As for the immunesuppersion, it realtes to the human immundefeciency virus (HIV) that is
causes AIDS and weakens and destroys the immunity system. When the immunity system is
weakened, the woman is more suscuptible to be infected by HIV where the body cannot fight the
infection and the precancerous cells develop into invasive cancerous cells rapidly (American Cancer
Society, Inc., 2012).
Finally, poverty is considered a risk factor to women developing cervical cancer because
women with low incomes cannot access adequate healthcare services, and are not able to afford the
costs of the vaccine or the Pap tests (American Cancer Society, Inc., 2012). As for the DES- related
cases, the FDA have banned the usage of the drug and so most of the daughters have passed the
highest risk age. Yet, doctors are still considering them at risk of developing the cancer (American
Cancer Society, Inc., 2012). Other risk factors, such as smoking, can act to increase the risk of
cervical cancer among women infected with HPV even more (National Cancer Institute, 2012).
8 | P a g e
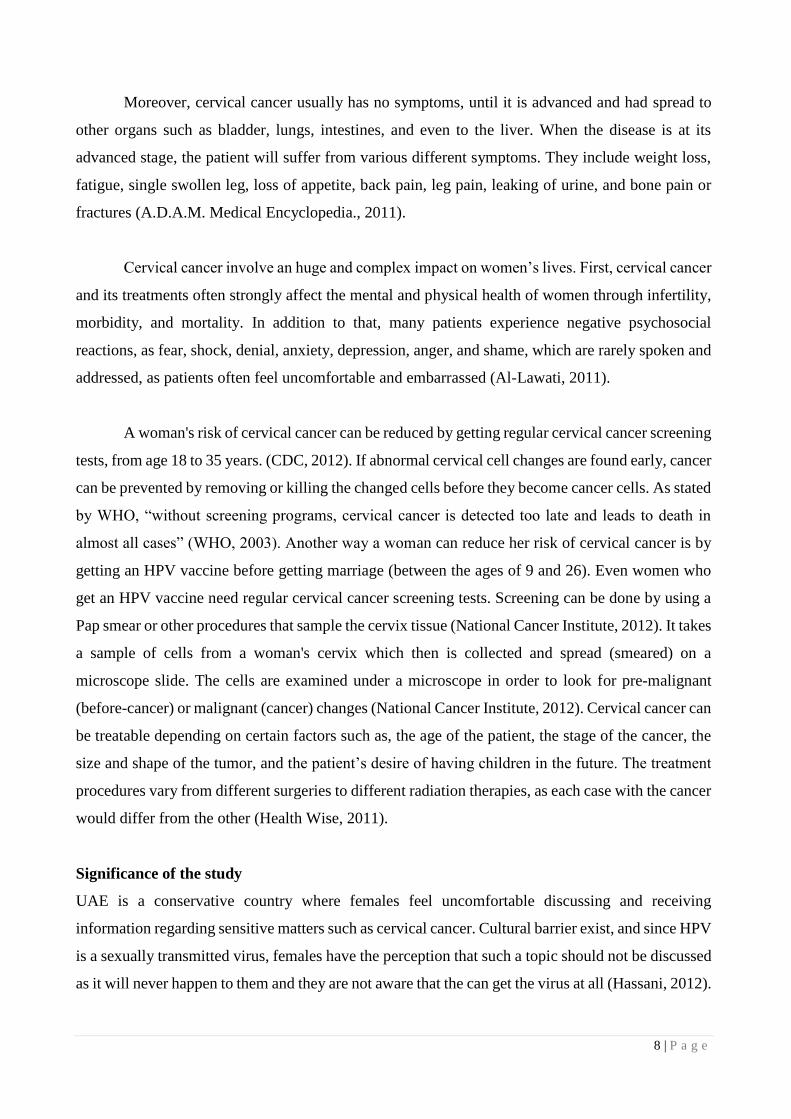
Moreover, cervical cancer usually has no symptoms, until it is advanced and had spread to
other organs such as bladder, lungs, intestines, and even to the liver. When the disease is at its
advanced stage, the patient will suffer from various different symptoms. They include weight loss,
fatigue, single swollen leg, loss of appetite, back pain, leg pain, leaking of urine, and bone pain or
fractures (A.D.A.M. Medical Encyclopedia., 2011).
Cervical cancer involve an huge and complex impact on women’s lives. First, cervical cancer
and its treatments often strongly affect the mental and physical health of women through infertility,
morbidity, and mortality. In addition to that, many patients experience negative psychosocial
reactions, as fear, shock, denial, anxiety, depression, anger, and shame, which are rarely spoken and
addressed, as patients often feel uncomfortable and embarrassed (Al-Lawati, 2011).
A woman's risk of cervical cancer can be reduced by getting regular cervical cancer screening
tests, from age 18 to 35 years. (CDC, 2012). If abnormal cervical cell changes are found early, cancer
can be prevented by removing or killing the changed cells before they become cancer cells. As stated
by WHO, “without screening programs, cervical cancer is detected too late and leads to death in
almost all cases” (WHO, 2003). Another way a woman can reduce her risk of cervical cancer is by
getting an HPV vaccine before getting marriage (between the ages of 9 and 26). Even women who
get an HPV vaccine need regular cervical cancer screening tests. Screening can be done by using a
Pap smear or other procedures that sample the cervix tissue (National Cancer Institute, 2012). It takes
a sample of cells from a woman's cervix which then is collected and spread (smeared) on a
microscope slide. The cells are examined under a microscope in order to look for pre-malignant
(before-cancer) or malignant (cancer) changes (National Cancer Institute, 2012). Cervical cancer can
be treatable depending on certain factors such as, the age of the patient, the stage of the cancer, the
size and shape of the tumor, and the patient’s desire of having children in the future. The treatment
procedures vary from different surgeries to different radiation therapies, as each case with the cancer
would differ from the other (Health Wise, 2011).
Significance of the study
UAE is a conservative country where females feel uncomfortable discussing and receiving
information regarding sensitive matters such as cervical cancer. Cultural barrier exist, and since HPV
is a sexually transmitted virus, females have the perception that such a topic should not be discussed
as it will never happen to them and they are not aware that the can get the virus at all (Hassani, 2012).
9 | P a g e
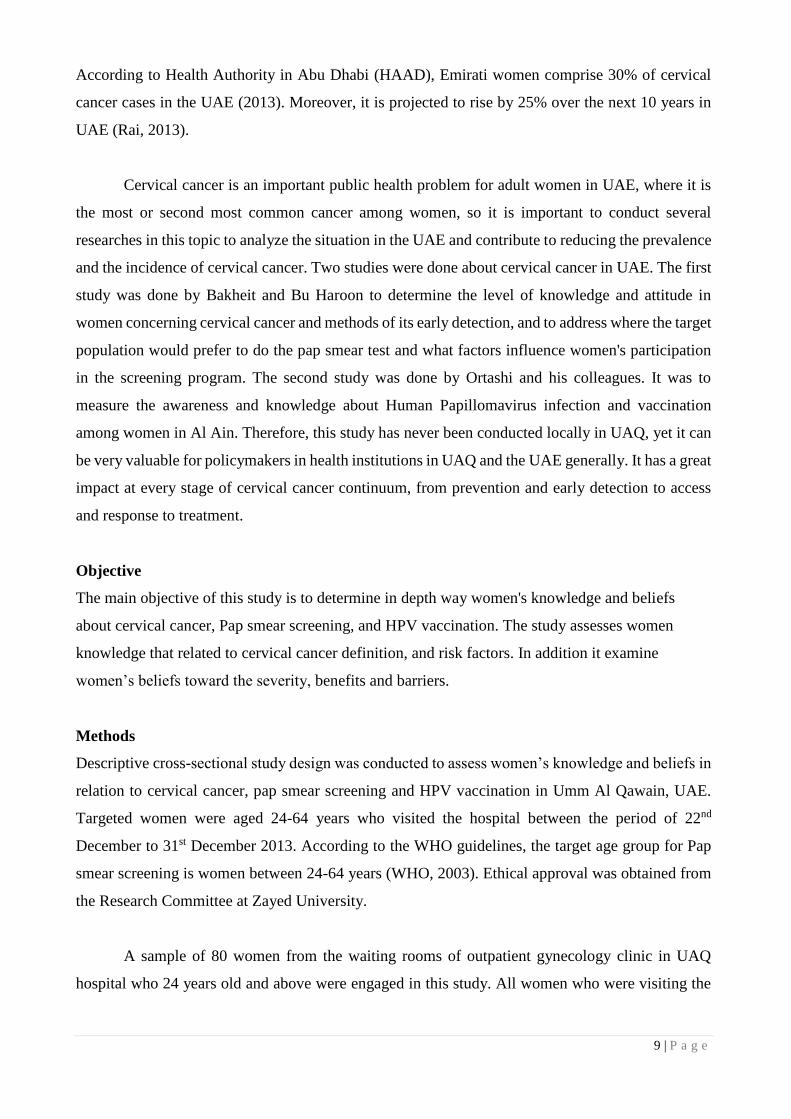
According to Health Authority in Abu Dhabi (HAAD), Emirati women comprise 30% of cervical
cancer cases in the UAE (2013). Moreover, it is projected to rise by 25% over the next 10 years in
UAE (Rai, 2013).
Cervical cancer is an important public health problem for adult women in UAE, where it is
the most or second most common cancer among women, so it is important to conduct several
researches in this topic to analyze the situation in the UAE and contribute to reducing the prevalence
and the incidence of cervical cancer. Two studies were done about cervical cancer in UAE. The first
study was done by Bakheit and Bu Haroon to determine the level of knowledge and attitude in
women concerning cervical cancer and methods of its early detection, and to address where the target
population would prefer to do the pap smear test and what factors influence women's participation
in the screening program. The second study was done by Ortashi and his colleagues. It was to
measure the awareness and knowledge about Human Papillomavirus infection and vaccination
among women in Al Ain. Therefore, this study has never been conducted locally in UAQ, yet it can
be very valuable for policymakers in health institutions in UAQ and the UAE generally. It has a great
impact at every stage of cervical cancer continuum, from prevention and early detection to access
and response to treatment.
Objective
The main objective of this study is to determine in depth way women's knowledge and beliefs
about cervical cancer, Pap smear screening, and HPV vaccination. The study assesses women
knowledge that related to cervical cancer definition, and risk factors. In addition it examine
women’s beliefs toward the severity, benefits and barriers.
Methods
Descriptive cross-sectional study design was conducted to assess women’s knowledge and beliefs in
relation to cervical cancer, pap smear screening and HPV vaccination in Umm Al Qawain, UAE.
Targeted women were aged 24-64 years who visited the hospital between the period of 22nd
December to 31st December 2013. According to the WHO guidelines, the target age group for Pap
smear screening is women between 24-64 years (WHO, 2003). Ethical approval was obtained from
the Research Committee at Zayed University.
A sample of 80 women from the waiting rooms of outpatient gynecology clinic in UAQ
hospital who 24 years old and above were engaged in this study. All women who were visiting the
10 | P a g e
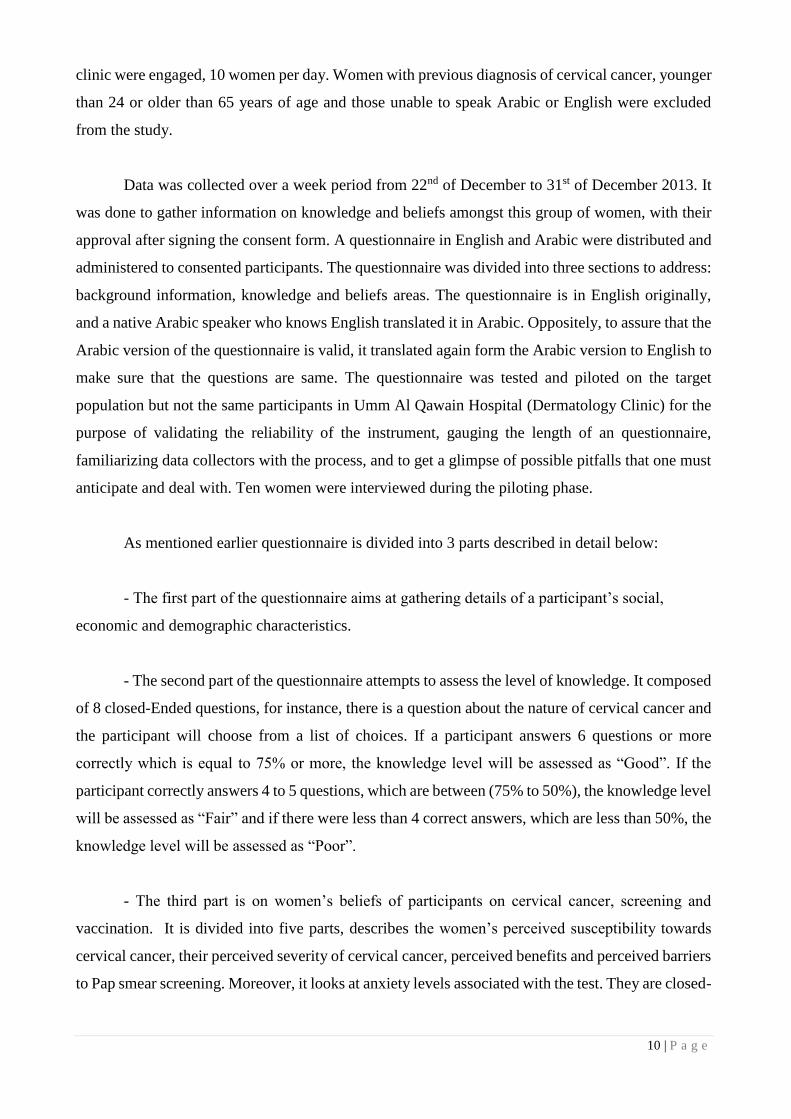
clinic were engaged, 10 women per day. Women with previous diagnosis of cervical cancer, younger
than 24 or older than 65 years of age and those unable to speak Arabic or English were excluded
from the study.
Data was collected over a week period from 22nd of December to 31st of December 2013. It
was done to gather information on knowledge and beliefs amongst this group of women, with their
approval after signing the consent form. A questionnaire in English and Arabic were distributed and
administered to consented participants. The questionnaire was divided into three sections to address:
background information, knowledge and beliefs areas. The questionnaire is in English originally,
and a native Arabic speaker who knows English translated it in Arabic. Oppositely, to assure that the
Arabic version of the questionnaire is valid, it translated again form the Arabic version to English to
make sure that the questions are same. The questionnaire was tested and piloted on the target
population but not the same participants in Umm Al Qawain Hospital (Dermatology Clinic) for the
purpose of validating the reliability of the instrument, gauging the length of an questionnaire,
familiarizing data collectors with the process, and to get a glimpse of possible pitfalls that one must
anticipate and deal with. Ten women were interviewed during the piloting phase.
As mentioned earlier questionnaire is divided into 3 parts described in detail below:
- The first part of the questionnaire aims at gathering details of a participant’s social,
economic and demographic characteristics.
- The second part of the questionnaire attempts to assess the level of knowledge. It composed
of 8 closed-Ended questions, for instance, there is a question about the nature of cervical cancer and
the participant will choose from a list of choices. If a participant answers 6 questions or more
correctly which is equal to 75% or more, the knowledge level will be assessed as “Good”. If the
participant correctly answers 4 to 5 questions, which are between (75% to 50%), the knowledge level
will be assessed as “Fair” and if there were less than 4 correct answers, which are less than 50%, the
knowledge level will be assessed as “Poor”.
- The third part is on women’s beliefs of participants on cervical cancer, screening and
vaccination. It is divided into five parts, describes the women’s perceived susceptibility towards
cervical cancer, their perceived severity of cervical cancer, perceived benefits and perceived barriers
to Pap smear screening. Moreover, it looks at anxiety levels associated with the test. They are closed-

11 | P a g e
ended questions, for instance, there are questions that asked the participant if they perceived that
they could have pre-cancer lesions and therefore they could be susceptible to cervical cancer and
also that they could have some level of risks either high or low. This part has been constructed by
using the Health Belief Model (HBM) as a conceptual framework.
The participants who were having appointments in gynecology clinic were given an
explanation the objectives of the study and what they will be involved in. Women with previous
diagnosis of cervical cancer, younger than 18 or older than 65 years of age and those unable to speak
Arabic or English were excluded from the study. Taking part in the study was optional and the role
of the participants in the study was explained. Furthermore, after the participants agreed on taking
part, participants were given an information sheet and consent form as to read it and sign it. Then,
the participants were asked to fill the questionnaire.
Analyses of data was undertaken using Statistical Package for the Social Sciences (SPSS)
version 20. Frequencies, descriptive statistics, and correlation, in addition to statistical analysis (chi-
square) were calculated. Moreover, Independent t-test where knowledge level and age means were
compared.
Knowledge level determination was calculated by specific criteria. If a participant answers 6
questions or more correctly which is equal to 75% or more, the knowledge level will be assessed as
“Good”. If the participant correctly answers 4 to 5 questions, which are between (75% to 50%), the
knowledge level will be assessed as “Fair” and if there were less than 4 correct answers, which are
less than 50%, the knowledge level will be assessed as “Poor”.
Results
Eighty women were approached for the study. Twenty declined to respond and seven were older
than 65years; in total 53 women were included in the study, making a response rate 66%. The mean
age of the participated women was 35 (SD ±7.206) ranged from 24 to 64 years old. Ages with highest
frequency were 37 and 39 years old.
Table 1 shows the demographic characteristics of the participated women. Eighty-three
percent of the sampled women were UAE nationals. The majority of them were workingwomen
(55.6%), while one third of them (30.2%) were unemployed. The majority of the women (81.1%)
were married; few were separated, divorced or widowed (9.5%) and 9.4% were single. Around eighty

12 | P a g e
percent of those who were married reported having children. The number of children per woman
was at an average of 3 (SD ±2.3). The range went from one child to 8 children with a mode of 3
children. More than half of the sampled women reached secondary school level of education
(54.7%). Close to half of them has a bachelor degree (44.5%). A small proportion (3.8%) had reached
primary level education or less (table 1).
Table 1: Socio-Demographic Characteristics of Study
Participants
No (%)
Nationality National
Non-national
45 (83.3%)
8 (16.7%)
Occupation Status Paid work
Retired
Unemployed
Studying
Housewives
30 (55.6%)
2 (3.8%)
16 (30.2%)
4 (7.4%)
1 (1.9%)
Highest level of
education
Less than primary
education
Primary education
Secondary education
Bachelors
1 (1.9%)
1 (1.9%)
29 (54.7%)
22 (44.5%)
Marital status Married
Separated or divorced
Widowed
Single
43 (81.1%)
3 (5.7%)
2 (3.8%)
5 (9.4%)
Having children Have children
Don’t have children
42 (79.2%)
11 (20.8%)
Knowledge:
Regarding the level of knowledge about cervical cancer, Pap smear screening and HPV
vaccination, a total of 8 questions were asked to assess the Knowledge level of the participated
women. Table 2 demonstrates the knowledge about cervical cancer, Pap smear screening and HPV
vaccination among the participated women.
Table 2: knowledge about cervical cancer, Pap smear screening and
HPV vaccination
No (%)
Knows the nature of cervical cancer 18
(33.3%)
Knows that Cervical Cancer is the 2nd cause of cancer
death for women in UAE
11
(20.8%)
Knows the number of cervical cancer deaths that
happen every year in UAE
2 (3.7%)
Knows the recommended number of Pap smear
screening test
26
(49.1%)
13 | P a g e
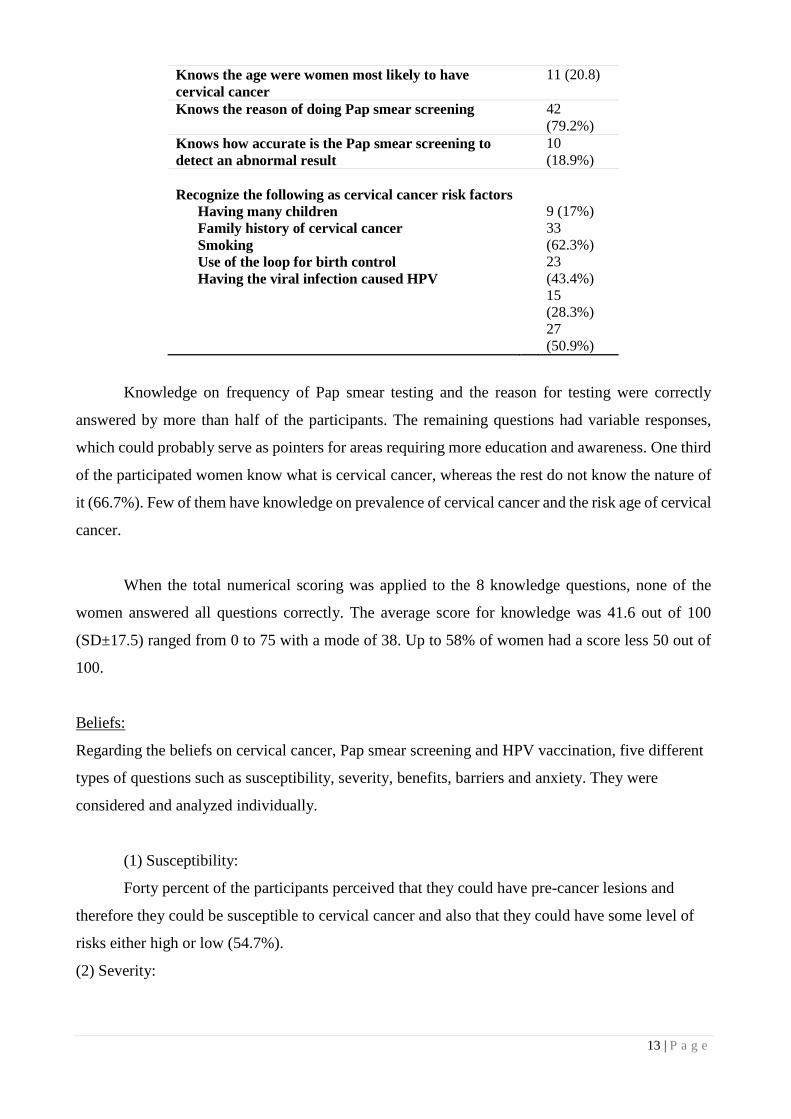
Knows the age were women most likely to have
cervical cancer
11 (20.8)
Knows the reason of doing Pap smear screening 42
(79.2%)
Knows how accurate is the Pap smear screening to
detect an abnormal result
10
(18.9%)
Recognize the following as cervical cancer risk factors
Having many children
Family history of cervical cancer
Smoking
Use of the loop for birth control
Having the viral infection caused HPV
9 (17%)
33
(62.3%)
23
(43.4%)
15
(28.3%)
27
(50.9%)
Knowledge on frequency of Pap smear testing and the reason for testing were correctly
answered by more than half of the participants. The remaining questions had variable responses,
which could probably serve as pointers for areas requiring more education and awareness. One third
of the participated women know what is cervical cancer, whereas the rest do not know the nature of
it (66.7%). Few of them have knowledge on prevalence of cervical cancer and the risk age of cervical
cancer.
When the total numerical scoring was applied to the 8 knowledge questions, none of the
women answered all questions correctly. The average score for knowledge was 41.6 out of 100
(SD±17.5) ranged from 0 to 75 with a mode of 38. Up to 58% of women had a score less 50 out of
100.
Beliefs:
Regarding the beliefs on cervical cancer, Pap smear screening and HPV vaccination, five different
types of questions such as susceptibility, severity, benefits, barriers and anxiety. They were
considered and analyzed individually.
(1) Susceptibility:
Forty percent of the participants perceived that they could have pre-cancer lesions and
therefore they could be susceptible to cervical cancer and also that they could have some level of
risks either high or low (54.7%).
(2) Severity:
14 | P a g e
About quarter (26.4%) of the women felt that cervical cancer is more severe than other types
of cancer. Forty one percent of the participants felt that cervical cancer has the same severity as other
forms of cancer (41.5%). Regarding the treatment of cervical cancer, the majority of the women
thought that treatment of cervical cancer is easy to tolerate (84.9%), and there is a good chance of
cure (71.1%).
(3) Benefits:
More than three quarters of the women perceived that pap smear test is beneficial since more
than three quarters of them felt that Pap smear testing detects pre-cancerous cells (77.4%), they will
be satisfied after having a pap smear test (69.8 %) and having a test regularly is valuable (71.7%)
and it will give them a sense of control (83%).
(4) Barriers:
For emotional barrier, more than one third of the women (37.7%) disagreed that having a Pap
smear test is painful. Whereas few of them agreed that it is painful (13.2%) and near about half of
them “don’t know” as they have never had a test done before (49.1%). Furthermore, most of the
participants (79.2%) disagreed that having a check is unpleasant and/or embarrassing, while the rest
agreed that it is unpleasant and/or embarrassing (20.8%). In addition, most of the sampled women
disagreed that health care in general is unpleasant (67.9%).
For the barrier of time, nearly half of the women did not think that it was difficult to take
time off from their work or university and go and have a Pap smear check while 41.5% agreed and
13.2% felt that its not applicable to them. This might be due to the fact that they have never had a
Pap test done. Majority of the participants (67.9%) did not think that it was difficult to get to a Pap
smear clinic, and more than half of them agreed that being busy and the priority for other things got
in the way of a Pap smear check (62.3%).
For economical barrier, most of the women agreed that Pap smear is necessary even if there
were no signs and symptoms (79.2%). Moreover, the sampled women disagreed with the statement
that it is unnecessary to go only for Pap smear test (83%) and 83% disagreed that going for a Pap
smear test was too expensive.
(5) Feeling of Anxiety:

15 | P a g e
More than a half of the sampled women (67.9%) disagreed that they will be afraid if
something wrong will be detected if they go for a Pap smear test. This might be due to religious
beliefs. Up to 53% were not uneasy to talk about cancer and 73.1% agreed that they would be worried
if they were found to have early signs of cervical cancer.
Age, marital status and occupation characteristics did not significantly affect the level of
cervical cancer knowledge among women, whereas the level of education was found to be highly
significant (P<0.001). On the other hand, knowledge score averages were compared with age
categories among women. It has been found that there is no significant relationship between them,
were t (51) = -0.115, p= 0.909.
The associations of the knowledge level with socio-demographic characteristics of the
women are shown in table 3.
Table 3: Associations of the knowledge level with socio-demographic
characteristics
No. P-value
Age 24-29 (13)
30-44 (37)
45-64 (3)
0.833
Education Low education (31)
High Education (22) P<0.001*
Occupation Have (30)
Don’t have (23) 0.114
Marital status Married (43)
Not married (10) 0.528
(n=53)
Discussion
The objective of this study was to assess the knowledge and beliefs about cervical cancer, Pap smear
screening, and HPV vaccination of women in UAQ Hospital in the emirate of Umm Al Qawain.
Fifty-three women were participated in this study. We achieved good response rate of 66%, and it is
considered as a good response because data collector was female which made it easier in approaching
women in the UAE community, which is a conservative community. The majority of the participated
women in this study were from UAE. The age range was 24 - 64 years and a mean age of 35 years.
They were mostly married and in paid work. Most attained a secondary and high education levels
and the average number of children per woman was 3. The study results on the demography of the
sampled women in the UAE was not far away from what was found by other similar studies in the

16 | P a g e
Arab region as Kuwait, where significant percentage of the society formed of professional expats
(Al Sairafi & Mohamed, 2009).
The knowledge by categorical grouping showed that in general, the level of knowledge on
cervical cancer was mostly poor (58.5%), whereas the rest women have either fair or good
knowledge (41.5%). The knowledge is relatively low compared with another countries in the Islamic
region like Turkey (45-46%) (Dursun et al., 2009; Ilter et al., 2010) and non-Islamic countries like
Belgium (50%) (Donders et al., 2008). It may be due to the conservative nature of UAE community.
Although public programs for HPV vaccine are done in the UAE, however the study demonstrated
that the awareness of women about cervical cancer, Pap smear screening and HPV vaccination in
UAE is still low. Previous research studies have mentioned Social and Cultural barriers to affect the
uptake of HPV vaccine in UAE (Ortashi et al., 2012).
In regards to women beliefs towards cervical cancer, Pap smear screening, and HPV
vaccination, it was analyzed that the majority of the women perceived that cervical cancer is severe
as the other forms of cancer and that chance of cure is good and it is worth putting up with the
treatment. Basing from this results, it showed that if majority of women have this positive belief, it
will motivate them to come forward and be tested and if any abnormal results are detected, then they
are ready to put up with the treatment since they felt that the there is a good chance of cure for
cervical cancer. However, about third of women irrespective of perceived susceptibility either don’t
know or don’t think that the treatment of cervical cancer is worth putting up with. This is an
important issue of concern since even though they may have a good knowledge and a positive
attitude, if they felt that they cannot put up with the treatment then it is of no use therefore these
women needs to be targeted and educated accordingly. They will need the full information about
treatment if they are to be fully protected. About 70% if women felt that there are a lot of benefits
from having a Pap smear test and this is a very positive belief. It is hoped that they will practice and
attend follow-up schedules.
Interestingly, in this study, education level was found to have strong association with
knowledge related to cervical cancer, Pap smear screening and HPV vaccination (p<0.001). This
finding is consistent with other studies where education level was found to be significant influence
the knowledge of cervical cancer (Eke et al., 2010; Al Sairafi & Mohamed, 2009). This may indicate
that educated women have better communication skills and can understand medical information well.

17 | P a g e
Moreover, this study found that age, occupation and social characteristics have any impact on women
knowledge. Similar findings have been reported in several studies (Eke et al., 2010).
This study has never been conducted locally in UAQ, yet it can be very valuable for policymakers
in health institutions in UAQ and the UAE generally. However, there are many different
limitations that may have encountered the study, as mentioned below:
The time for conducting this research was limited.The number of sampled women
approached is not sufficient to generalize the results among all women in UAQ.
Social desirability is an issue where women want to be seen favorably and may have denied
several facts that may lead to the assumption that they are aware about cervical cancer and have
positive beliefs about Pap test and HPV vaccination.
This study can be further improved and enhanced by conducting interviews with women to try to
reduce social desirability bias that may have occurred in current study. Interviews will also
increase the validity of the study and will help investigate issues in an in-depth way.
Conclusions and Recommendations
This study suggested that the knowledge of the cervical cancer is low in UAE, and there is strong
need for a comprehensive education about cervical cancer, Pap smear screening and HVP
vaccination.
Considering the results of the level of knowledge of the sampled women, more awareness
programs should be directed to women in to improve their information about cervical cancer, by this
they will understand the purpose of HPV vaccination and the Pap smear screening test, thus they
will come forward for vaccinating, testing and follow-up. A well-designed awareness program on
cervical cancer and the benefits of Pap screening would increase the awareness among women in
UAE. Moreover, better communication with health professional is important in raising awareness.
Also, the improvement of health care access should increase the rate of cervical cancer screening
and getting HPV vaccination. It is necessary to create cervical cancer prevention policies and
strategies at all levels of the health sector to make positive change. For inctance, organized screening
programs to reach the highest possible number of women at greatest risk of cervical cancer, and also
the inclusion of HPV vaccinations within Immunization Schedule in the country not just in Abu
Dhabi.

18 | P a g e
References
A.D.A.M. Medical Encyclopedia. (2011, December 15). Cervical cancer. Retrieved November 11st, 2013,
from PubMed Health: http://www.ncbi.nlm.nih.gov/pubmedhealth/PMH0001895/
Al Meer, F.M. & Aseel, M.T. & Al Khalaf, J. & Al Kuwari M.G. & Ismail, M. (2011).
Knowledge, attitude and practices regarding cervical cancer and screening among women visiting primary
health care in Qatar. Eastern Mediterranean Health Journal. 2011; 17(19).
Al Sairafia, M. & Mohamed, F. A. (2009). Knowledge, Attitudes, and Practice Related to Cervical Cancer
Screening among Kuwaiti Women. Medical Principles and Practice 2009;18:35–42. Retrieved December
3rd , 2013, from http://www.karger.com/Article/Pdf/163044
Al-Lawati, S. (2011). The burden of Human Papilloma Virus and cervical cancer in the Arab World. Middle
East Health. Retrieved December 3rd , 2013, from http://www.middleeasthealthmag.com/cgi-
bin/index.cgi?http://www.middleeasthealthmag.com/may2011/feature9.htm
American Cancer Society, Inc. (2012, March 13). Cervical Cancer. Retrieved November 10th, 2013, from
American Cancer Society: http://www.cancer.org/cancer/cervicalcancer/detailedguide/cervical-cancer-risk-
factors
Bakheit, N. & Dr. Bu Haroon, A. (2004). THE KNOWLEDGE, ATTITUDE AND PRACTICE OF PAP
SMEAR AMONG LOCAL SCHOOL TEACHERS IN THE SHARJAH DISTRICT. Middle East Journal
of Family Medicine, 2004; Vol. 4 (4).
Byrd, T. L., Peterson, S. K., Chavez, R. & Heckert, A. (February 2004). Cervical cancer screening beliefs
among young Hispanic women, Preventive Medicine (38)2 192-197. Retrieved December 8th, 2013, from
http://www.sciencedirect.com/science/article/pii/S009174350300241X
CDC. (2012). HPV Testing. Retrieved December 8th, 2013, from
http://www.cdc.gov/cancer/hpv/pdf/HPV_Testing_2012_English.pdf
Charakorn, C., Rattanasiri, S., Lertkhachonsuk, A., Thanapprapasr, D., Chittithaworn, S., & Wilailak, S.
(2011). Knowledge of Pap smear, HPV and the HPV vaccine and the acceptability of the HPV vaccine by
Thai women. Asia Pacific Journal Of Clinical Oncology, 7(2), 160-167. doi:10.1111/j.1743-
7563.2011.01392.x
Donati, S. & Giambi, C. & Declich, S. & Salmaso, S. & Filia, A. & Atti, M. & Alibrandi, Silvia Brezzi, M.
P. & Carozzi, F. & Collina, N. & Franchi, D. & Lattanzi, A. & Meda, M. & Minna, M. C. & Nannini, R. &
Gallicchio, G. & Bella, A. Knowledge, attitude and practice in primary and secondary cervical cancer

19 | P a g e
prevention among young adult Italian women, Vaccine, Volume 30, Issue 12, 9 March 2012, Pages 2075-
2082.
Dursun, P., Altuntas, B., Kuscu, E., Ayhan, A. (2009). Women’s knowledge about human papillomavirus
and their acceptance of HPV vaccine. Aust N Z J Obstet Gynaecol, 49, 202-6.
Eaker, S. & Adami, H.O. & Sparen, P. (2001). Attitudes to screening for cervical cancer: a population-
based study in Sweden. Cancer Causes and control 2001;12:519-528.
Eke, N., Ezeama, C., Eke, C., Eleje, G., Akabuike, J.C. & Ezebialu, I. (2010). Knowledge of Cervical
Cancer and its Screening Amongst Female Workers In Nnewi, Nigeria. AFRIMEDIC Journal, 1, 1.
Retrieved from http://www.ajol.info/index.php/afrij/article/view/86194/76034
Elit, L., Trim, K., Mohan, R., Nastos, S., & Harnish, D. (2009). The knowledge and attitudes of university
students concerning HPV vaccine and cervical screening. Clinical Medicine.Reproductive Health, 3, 1.
Retrieved from http://search.proquest.com/docview/1034877394?accountid=15192
Encyclopaedia Britannica. (2013). Cancer, from Encyclopaedia Britannica Online Academic Edition.
Retrieved December 3rd, 2013 from http://www.britannica.com/EBchecked/topic/92230/cancer
Esin, M. N., Bulduk, S., & Ardic, A. (2011). Beliefs about cervical cancer screening among turkish married
women. Journal of Cancer Education, 26(3), 510-5. Retrieved December 8th, 2013 from
http://dx.doi.org/10.1007/s13187-011-0198-y
Fylan, F. (1998). Screening for cervical cancer: a review of women’s attitudes, knowledge and behavior.
Bitish Journal of General Practice 1998;48:1509-1514.
Gharoro, E.P. & Ikeanyi, E.N. (2006). An appraisal of the level of awreness and utilization of the pap smear
as a cervical cancer screening test among female health workers in a tertiary health institution. International
Journal of Gynecology Cancer 2006;16:1063-1068.
GLOBOCAN (2008 ). Section of Cancer Information. Retrieved December 3rd, 2013 from
http://globocan.iarc.fr/factsheets/populations/factsheet.asp?uno=900
HAAD. (2013). Cervical Cancer. Retrieved December 3rd 2013, from Health Authority – Abu Dhabi
Website http://www.haad.ae/SimplyCheck/LinkClick.aspx?fileticket=f9uhqohl73o%3D&tabid=86
HAAD. (2012). Cervical Cancer…The silent killer. Retrieved December 3rd, 2013 from Health Authority –
Abu Dhabi website: https://www.haad.ae/haad/tabid/1213/Default.aspx
Hassani, Z. A. (2012, January 12). Awareness campaign starts to fight cancer. Retrieved November 10th,
2013, from The National: http://www.thenational.ae/news/uae-news/health/awareness-campaign-starts-to-
fight-cancer

20 | P a g e
Health Wise. (2011, February 22). Cervical Cancer Health Center. Retrieved November 11st , 2013, from
WebMD: http://www.webmd.com/cancer/cervical-cancer/cervical-cancer-topic-overview?page=2
Hsu, Y., Cheng, Y., Hsu, K., Fetzer, R.N., & Chou, C. (2011). Knowledge and beliefs about cervical cancer
and human papillomavirus among taiwanese undergraduate women. Oncology Nursing Forum, 38(4), E297-
304. Retrieved December 8th, 2013 from http://search.proquest.com/docview/876869009?accountid=15192
Ilter, E., Celik, A., Haliloglu, B., Unlugedik, E., Midi, A., Gunduz, T. & Ozekici, U. (2010). Women’s
knowledge of Pap smear test and human papillomavirus: acceptance of HPV vaccination to themselves and
their daughters in an Islamic society. Int J Gynecol Cancer, 20, 1058-62.
Montgomery, K. & Smith-Glasgow, M. E. (February 2012). Human Papillomavirus and Cervical Cancer
Knowledge, Health Beliefs, and Preventive Practices in 2 Age Cohorts: A Comparison Study. Gender
Medicine, 9(1), S55-S66. Retrieved December 8th, 2013 from
http://www.sciencedirect.com/science/article/pii/S1550857911002270
Lee-Lin, F., Pett, M., Menon, U., Lee, S., Nail, L., Mooney, K., & Joanne, I. (2007). Cervical cancer beliefs
and pap test screening practices among chinese american immigrants. Oncology Nursing Forum, 34(6),
1203-9. Retrieved December 8th, 2013 from
http://search.proquest.com/docview/223105138?accountid=15192
Muslim, N. (2012, May 13rd). Cervical cancer strikes younger women in UAE. Gulf News. Retrieved
November 18th, 2013, from: http://m.gulfnews.com/news/gulf/uae/health/cervical-cancer-strikes-younger-
women-in-uae-1.68601
Mutyaba, T. & Mmiro, F.A. & Weiderpass, E. (2006). Knowledge, attitudes and practices on cervical
cancer screening among the medical workers of Mulago Hospital, Uganda. BMC Medical Education
2006;6(13):4 pages.
National Cancer Institute. (2012, March 29). Cervical Cancer (Cancer of the Cervix). Medicine Net.
Retrieved November 11st, 2013, from: http://www.medicinenet.com/cervical_cancer/article.htm
Neilson, A. & Jones, R.K. (1998). Women’s lay knowledge of cervical cancer/cervical screening:
accounting for non-attendance at cervical screening clinics. Journal of Advanced Nursing 1998;28(3):571-
575.
Ortashi, O., Raheel, H., Shalal, M. & Osman, N. (2013). Awareness and Knowledge about Human
Papillomavirus Infection and Vaccination among Women in UAE. Asian Pac J Cancer Prev, 14 (10), 6077-
6080. Retrieved January 1st, 2014, from:
http://www.apocpcontrol.org/paper_file/issue_abs/Volume14_No10/6077-
6080%207.3%20Osman%20Ortashi.pdf

21 | P a g e
Ortashi, O., Raheel, H., Shalal, M. & Osman, N. (2012). Knowledge, attitude and practice of school nurses
in the United Arab Emirates about HPV infection and vaccine. Asian Pac J Cancer Prev, 13, 6481-4.
Retrieved January 1st, 2014, from:
http://www.apocpcontrol.org/paper_file/issue_abs/Volume13_No12/6481-
84%2011.27%20Osman%20Ortashi.pdf
Rai, B. S. (April, 2013). Cervical cancer common in UAE women. Retrieved December 3rd, 2013, from
Emirates 24/7 website http://www.emirates247.com/news/emirates/cervical-cancer-common-in-uae-
women-2013-04-12-1.502332
Roy, B., M.S., & Tang, T. S., P.H.D. (2008). Cervical cancer screening in kolkata, india: Beliefs and
predictors of cervical cancer screening among women attending a women's health clinic in kolkata, india.
Journal of Cancer Education, 23(4), 253-9. Retrieved December 8th, 2013 from
http://dx.doi.org/10.1080/08858190802189105
Stevens, I. (2013). Emirati females make up 30 percent of Cervical Cancer cases in the UAE. Arab Health
Blog. Retrieved December 3rd, 2013, from : http://blog.arabhealthonline.com/emirati-females-make-up-30-
of-cervical-cancer-cases-in-the-uae/
UAE Interact. (January 7th, 2007). UAE GETS CERVICAL CANCER VACCINE. Retrieved November 12nd,
2013, from : http://www.uaeinteract.com/docs/UAE_gets_cervical_cancer_vaccine/23410.htm
UAE Yearbook 2010. (2010). Health. Retrieved December 1st, 2013, from :
http://www.uaeinteract.com/uaeint_misc/pdf_2010/Yearbook2010_EN/?page=216#4
Ullekh, N. P. (October 20th, 2013). Fight against cervical cancer: Salim Shah's Sarfez promoting HPV
screening test in India. From Economic Times. Retrieved December 3rd, 2013, from :
http://articles.economictimes.indiatimes.com/2013-10-20/news/43200733_1_cervical-cancer-hpv-virus-
hpv-infection
WHO. (2003). State of the Art of New Vaccines Research and Development: Initiative for
Vaccine Research. 1–74. World Health Organization. Geneva, Switzerland.
WHO. (2013). Cancer. . World Health Organization. . Retrieved December 3rd, 2013, from
http://www.who.int/mediacentre/factsheets/fs297/en/
Yoo, G. J., Le, M. N., Vong, S., Lagman, R., & Lam, A. G. (2011). Cervical cancer screening: Attitudes and
behaviors of young asian american women. Journal of Cancer Education, 26(4), 740-6. doi:
http://dx.doi.org/10.1007/s13187-011-0230-2
http://www.apocpcontrol.org/paper_file/issue_abs/Volume13_No12/6481-84%2011.27%20Osman%20Ortashi.pdf

22 | P a g e
Zaman, S. (2012, January 12nd). Campaign launched to raise awareness on cervical cancer. Gulf News.
Retrieved December 3rd, 2013, from http://gulfnews.com/news/gulf/uae/health/campaign-launched-to-raise-
awareness-on-cervical-cancer-1.964769

23 | P a g e
Prostate cancer screening campaign for Emiratis: A risk-benefit analysis
Sara El Khadra
Hamdan Bin Mohammed Smart University, UAE
Abstract
Background: Prostate cancer is the second most common cancer among men worldwide, and the fourth in
the UAE. Prostate cancer is a serious disease, but most men diagnosed with it do not die as a result of the
disease. Considerable debate exists on whether screening for prostate cancer reduces disease-specific and
overall mortality and improves the quality of life of men. Over the past several years, leading urologists in
the UAE have been calling for a nation-wide prostate cancer screening programme for Emiratis.
Objectives: To forecast whether a prostate cancer mass screening campaign for Emiratis will potentially
reduce disease-specific mortality rate.
Materials and Methods: Papers on prostate cancer current epidemiology in UAE and the region countries
and in various countries in the world were researched; risk factors, early diagnosis technologies, diagnosis
and treatment outcomes, and the latest available guidelines for screening were reviewed from the literature,
summarized and projected on the UAE demographics.
Conclusion: 50 – 69 years old Emirati males as well as men concerned about prostate cancer should receive
clear and balanced information about the advantages and disadvantages of the PSA test, biopsy and
treatments for prostate cancer and they should be counseled about the important quality of life differences
between the options. This will enable men to make informed decisions about whether or not to have a PSA
test. In addition, proactive routine screening may be offered every two years to individuals with elevated
risks, such as family history of prostate cancer or chronic prostatitis. Importantly, more accurate screening
tests than first generation prostate specific antigen tests will be required in order to enhance the value of
prostate cancer screening.
Introduction:
Screening for prostate cancer is regarded as one of the most controversial topics in public health and
medical literature. Various publications, discussions and debates on this topic have been written and
published, as well as at 3 RCTs that were available in 2009. (Andriole et al, 2009) (Schröder, et al,
2009) (Hugosson, et al., 2010). Prostate cancer is a common term used to describe a common
malignant tumor, almost of glandular origin (adenocarcinoma), in the prostate gland. The prostate is
a gland found exclusively in males. It is located below the urinary bladder and in front of the rectum.
During puberty, the size of the prostate gland increases as a response to the rise in male hormones
(called androgens) in the body such as testosterone and dihydrotestosterone (DHT). The prostate
usually remains stable in size, or grows slowly in adults, as long as male hormones are present. In

24 | P a g e
younger men, it measures about the size of a walnut, but it can become enlarged in older men. The
prostate’s duty is to produce some of the fluid that protects and nourishes sperm cells in semen,
making the semen more liquid.
Epidemiology of prostate cancer- Global:
Prostate cancer is ranked the fourth most common cancer in both sexes combined the second most
common cancer in men worldwide (WCRF 2012). Males in the Americas region had the highest
rates of prostate cancer, followed by the European region. While the lowest rate of prostate cancer
was in the South East Asia Region. High income countries had approximately 10x the rate of prostate
cancer incidence of the lower middle income countries (WHO, 2008). In the United States the most
common cancer in men is prostate cancer with ASR 128.3/100,000 of all races, and the second cause
of cancer mortality with 20.8/100,000 for all races except Asian/Pacific men (CDC, 2011). While
in 2012 Prostate cancer incidence varied more than 25-fold worldwide; the rates were highest in
Australia/New Zealand and Northern America (ASR 111.6 and 97.2 per 100,000, respectively), and
in Western and Northern Europe, because the practice of prostate specific antigen (PSA) testing and
subsequent biopsy has become widespread in those regions. Incidence rates are also relatively high
in certain less developed regions such as the Caribbean (79.8), Southern Africa (61.8) and South
America (60.1), but remain low in Asian populations with estimated rates of 10.5 and 4.5 in Eastern
and South-Central Asia. Prostate cancer mortality is highly correlated to age, with older men scoring
the highest mortality rates (Ferlay et al, 2013). In the UK between 2010 and 2012, an average of
74% of prostate cancer deaths was in men aged 75 years and over, and more than 99% were in those
aged 55 years and over. Age-specific mortality rates rise sharply from around 55-59 of age, with the
highest rates in the 85+ age group (Cancer research UK, 2012) Martinique had the highest rate of
prostate cancer, followed by Norway and France (Figure 1) (WCRF, 2012).
227.2
129.7 127.3 123.9 123.1 119 115.2 114.9 114.6 114.2 107.2 106.6 105.2 98.2 96.6 94.4 93.2 92.2 91.3 90.9
0
50
100
150
200
250 Figure 1: The countries with the top 20 highest incidence of Age-Standardised Rate for
prostate per 100,000 in 2012 (WCRF, 2012)
25 | P a g e
Table 1:
Age Percentage
of men in whom
prostate cancer
was detected at
autopsy
(Sakr et al, 1996)
20–29 30–39 40–49 50–59 60–
69
70–
79
8 28 39 53 66 80
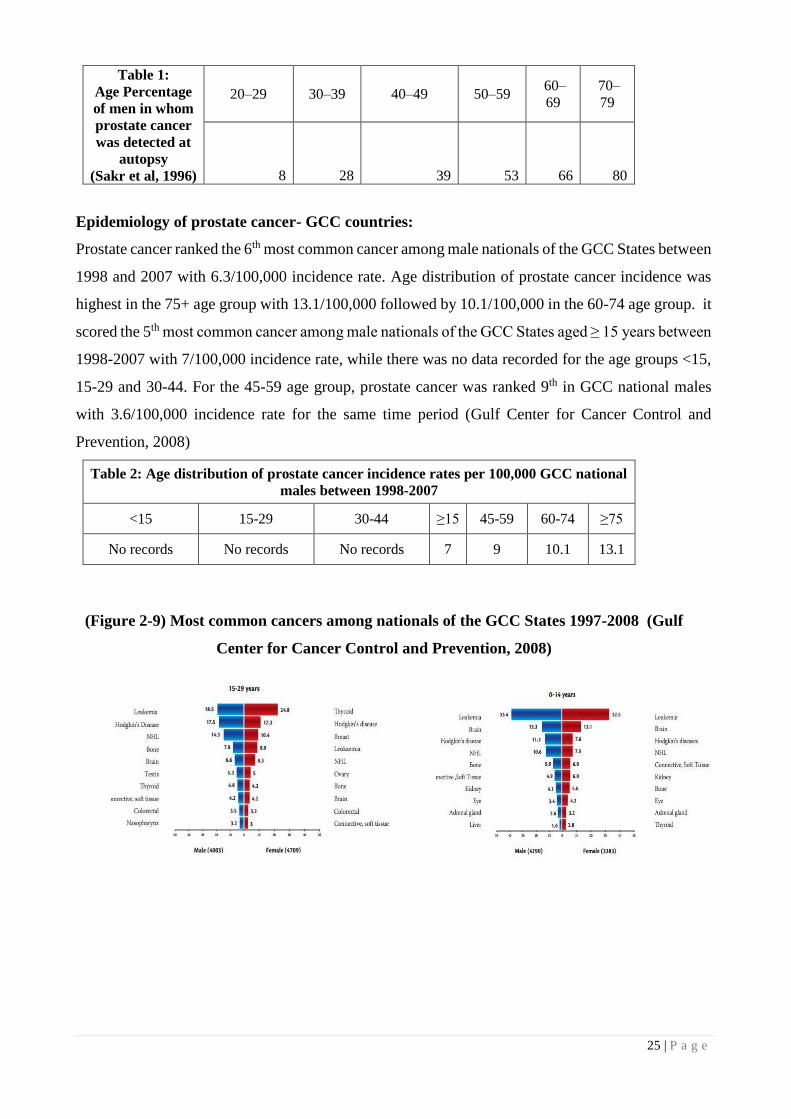
Epidemiology of prostate cancer- GCC countries:
Prostate cancer ranked the 6th most common cancer among male nationals of the GCC States between
1998 and 2007 with 6.3/100,000 incidence rate. Age distribution of prostate cancer incidence was
highest in the 75+ age group with 13.1/100,000 followed by 10.1/100,000 in the 60-74 age group. it
scored the 5th most common cancer among male nationals of the GCC States aged ≥ 15 years between
1998-2007 with 7/100,000 incidence rate, while there was no data recorded for the age groups <15,
15-29 and 30-44. For the 45-59 age group, prostate cancer was ranked 9th in GCC national males
with 3.6/100,000 incidence rate for the same time period (Gulf Center for Cancer Control and
Prevention, 2008)
Table 2: Age distribution of prostate cancer incidence rates per 100,000 GCC national
males between 1998-2007
<15 15-29 30-44 ≥15 45-59 60-74 ≥75
No records No records No records 7 9 10.1 13.1
(Figure 2-9) Most common cancers among nationals of the GCC States 1997-2008 (Gulf
Center for Cancer Control and Prevention, 2008)

26 | P a g e
Prostate cancer epidemiology in UAE:
Prostate cancer is ranked fourth most common cancer in UAE males between 1998 and 2007, it
accounted for 7.7% of all the reported cancer cases in men with average annual ASR Age
Standardized rate of 7.5/100,000 population. Prostate cancer appeared among those aged 55 years
and above. It is lowest ASR (4.7/100,000) was reported in 1999 and the highest (9.2/100,000) was
reported in 2006. Lung cancer was ranked 1st 9.3/100,000 (Lung cancer started to appear after the
age of 25 years in UAE males), followed by Colorectal 8/100,000 (started as early as 20 years of age
in UAE males) and Non-Hodgkin’s lymphoma 6.6/100,000 (NHL appeared with low incidence
Figure 3

27 | P a g e
during childhood. The incidence increases dramatically after age of 35 years to reach its maximum
peak at age 60 years). (Gulf Center for Cancer Control and Prevention, 2008)
Figure 10: Average Annual Age Specific Incidence Rates of Most Common Cancers in UAE, 1998-2007: Male
The majority of the patients were diagnosed between 51 to 60 years of age and that the
majority of patients were UAE nationals (44.0%), followed by patients from countries in the region,
i.e., Oman, Yemen, Syria, Jordan, and Egypt (40.5%). The majority of the patients (77.7%) presented
with an advanced disease ( Ghafoor et al 2003) According to this analysis the annual incidence of
prostate cancer was 4.5/100,000 male population.Out of all diagnosed cancer cases in males
(Emiratis and expatriates) in Abu Dhabi, 20% was due to prostate cancer (HAAD 2013), While
mortality rate of prostate cancer in Abu Dhabi for males (Emiratis and expatriates) was 3.1% (HAAD
2011) this rate slightly increased to 4.2% (HAAD 2013). No prostate cancer specific mortality data
reported for the UAE male population.
Figure 11: Causes of death in Abu Dhabi Trends (2001-2013) (HAAD 2013)

28 | P a g e
Table 4: Causes of death in Abu Dhabi 2012 (Age/Gender/Nationality) (HAAD 2013)
UAE demographic highlights:
The growth rate of the population in UAE decreased
from 5.87% in 1985-1990 to 5.09% in 1995-2000,
and then increased to 14.21% in 2005-2010. It is
projected that the growth rate of the population in
the UAE. Life Expectancy at Birth -for both sexes-
in the UAE gained 7.2 years from the period 1980-
1985 to the period 2005-2010, increasing from 68.7
in 1980- years to 72 in 1990 to 76 years in 2012. It
is projected to reach 82.7 years during the period
2045-2050. Around 7,800,000 expatriates lived in
UAE in 2013, representing 83.75 % of the total
population.
Projections show that female migrants
would represent 25.26 % of all migrants for that year. The annual net migration rate in UAE went
up from 31.6 migrants per 1,000 population during 1990-1995 to 121.1 migrants per 1,000
population during 2005-2010. Projections show that it will drop again to reach 6.4 migrants per 1,000
population during 2045-2050 (UN 2012).
UAE’s Population Age composition the proportion of the population under 15 years of age
has been decreasing since 1990 and is projected to continue this downward trend to the year 2050.
At the same time, the proportion of the working-age group (15-64) has been increasing since 1990,
where it rose from 68.0 % to reach 85.8 % in 2010. It is projected to reach a peak of 86.2 % in 2030
after which it will start a downward trend. The proportion of the elderly (65+) population declined
from 1.3 % in 1980 to 0.3 % in 2010. Projections show that the proportion of the elderly (65+)
population will start an upward trend afterwards and will reach 24.6 % in 2050. (UN 2012)
Table 5: Key Statistics in UAE UAE
Total Population 9’446’000
Median Age (years) 29
Aged under 15 (%) 14
Aged over 65 (%) 1
Annual growth rate (2002-2012) 10.5
Crude birth Rate (per 1000) 15.1
Crude death rate (per 1000) 1.1
People living in urban areas (%) 84.4
Fertility rate (per woman) 1.8
Life expectancy at birth (years)
1990
Both sexes
72
Life expectancy at birth (years)
2012
Both sexes
76
Healthy life expectancy at birth
(years) 2012- both sexes 67

29 | P a g e
Changing Age Structure: The population pyramid for UAE for the years 2010 and 2050
shows an imbalance in the age-sex composition due to the high immigration rates and dependence
on foreign workers. (UN 2012)
UAE’s Youth Population In 1985, youth (15-24) formed 14.3 % of the population in the UAE
(or 21.3 % of the working-age group). In 2010, the percentage increased to 23.0 % (or 26.8 percent
of the working-age group). The youth population is projected to decline and will reach 9.3 % in 2025
(or 11.1 % of the working age group), then it will increase to reach 11.2 % in 2030, only to decrease
again and will reach 7.30 % in 2045. It is expected to increase slightly afterwards to reach 7.5 % in
2050 (or 11.6 % of the working-age group). (UN 2012)
The percentage of UAE Nationals as a percentage of the total population is around 11.5%,
and is expected to decrease considerably if the current disparity in population growth rates between
Nationals and Expatriates continues. Dubai registers the highest recorded share of expatriates with a
share of 91% of the population, whilst a fairly high number of UAE Nationals live in Abu Dhabi,
decreasing the Expatriate share to 81%. The Northern Emirates of the UAE hold lowest share of
Expatriates, which currently stands at 78%, according to the latest statistics. Males in the UAE make
more than 75% of the total population, the majority of which belong to the working 20-45 year age
category.
14.21
2.52 2.03 1.59 1.43 1.36 1.27 1.08 0.84
0
2
4
6
8
10
12
14
16
Figure 12: UAE Population Growth Rate % 2005-2050 (UN 2012)
30 | P a g e
Risk factors for prostate cancer
There are three well-established risk factors for PCa- clinical prostate cancer- these are
Age: in developed countries, 82% of cases occur in men older than 65 years. To place this fact in
context, even on a world basis, 81% of cases occur in the elderly.
Ethnicity: African American men are more likely to develop prostate cancer compared with
Caucasian men and are nearly 2.5 times as likely to die from the disease. Conversely, Asian men
who live in Asia have the lowest risk.
Hereditary: If one first-line relative has PCa, the risk is at least doubled. If two or more
first-line relatives are affected, the risk increases 5 to 11 times. A minor proportion of individuals
with clinical prostate cancer (about 9%) have true hereditary clinical prostate cancer. This is
described as 3 or more affected family members or at least two relatives who have developed early
onset disease “before 55 of age (Hemminki, 20120). Men with hereditary clinical prostate cancer
usually have a 6 to 7 earlier onset of disease than other diagnosed cases (Hemminki, 2012. Incidence
of prostate cancer found during an autopsy is similar in various part of the world (Breslow 1977).
Nutrition and high in fat diet, alcohol consumption, exposure to UV radiation and chronic
prostatitis may have an aetiological impact. Moreover, there is no to date an evidence to suggest that
diet would reduce the risk of clinical prostate cancer. The outcome of the SELECT (Selenium and
Vitamin E Cancer Prevention Trial) was negative, and therefore vitamin E and selenium are not
recommended for the prevention (Lippman et al, 2009). In addition, a meta-analysis of 8 RCTs that
compared lycopene with a placebo did not find a significant reduction in the incidence (Illic & Misso,
2012). Nevertheless hypertension has found to increase PCa by 15%- and waist measurements>102
cm –has found to increase it by 56%- other metabolic syndrome components were insignificantly
associated (Esposito et al, 2013).
Screening for prostate cancer: (CancerResearch UK, 2012)
Population or mass screening is this context is defined as the systematic examination of
asymptomatic adult men who are at risk , and is usually initiated by health authorities. While early
detection or opportunistic/incidental screening, consists of individual case findings, which are
initiated by either the screened person and/or his physician. This primarily aims to reduce mortality
from prostate cancer and maintain quality of life as expressed by quality-of-life-adjusted gain in life
years (QUALYs).

31 | P a g e
There are currently several ways of determining the presence and/or extent of prostate cancers:
Digital rectal examination (DRE)
Benefits: It allows assessment of the prostate for signs of prostate cancer (hard, enlarged,
palpable nodules) or benign enlargement (smooth, firm, enlarged gland).
Limitations: normal to touch glands may still have a tumor. Sometimes cancers of the prostate
may produce changes detected on a DRE, but many early prostate cancers will not be detected
by DRE.
Trans-rectal ultrasound (TRUS)
Benefits: Examines and correctly determine the dimensions of the glad, but it primarily enables
precise needle placement in the prostate during systematic prostate biopsy
Limitations: It is not sufficiently reliable to exclude prostate cancer and should not be used to
screen asymptomatic men.
PSA testing is the most common method for screening for potentially detecting prostate
cancer. It involves taking a sample of blood to measure the concentration of PSA, a protein
produced by cells in the prostate gland. Elevated PSA levels may indicate the presence of
prostate cancer, but may also be caused by other conditions, such as benign prostate
enlargement or a prostatic infection.
Benefits of PSA testing: (NHRC, 2014)
Reassurance: when results are low or normal
Early detection: If prostate cancer is detected at an early stage, when it is still confined to
the prostate gland, there is an opportunity to commence early treatment.
Early treatment: may cure the disease, and as a result avoid loss of quality of life due to
advanced prostate cancer, and death from prostate cancer.
For every 1000 men tested, 2 men will avoid death from prostate cancer before 85 years of age
because of PSA testing. With greater benefit in men at high risk of prostate cancer, such as those
with a relatives history of the disease.
For every 1000 men tested, 2 men will avoid metastatic prostate cancer before 85 years of age
because of PSA testing
32 | P a g e
Harms of PSA testing: (NHRC, 2014)
False-positive results: For every 1000 men tested: - 87 men who do not have prostate cancer
will have a false positive PSA test that will lead to a biopsy. 28 men will experience a side
effect from the biopsy that they consider to be a moderate/major problem that may require
healthcare, and 1 will require hospitalization.
False-negative results: A false-negative test result occurs when a man’s PSA level is low
even though he actually has prostate cancer. False-negative test results may give a man, his
family, and his doctor false assurance that he does not have cancer, when he may in fact have
a cancer that requires treatment
Over diagnosis: For every 1000 men tested, 28 men will have prostate cancer diagnosed as
a result of the PSA test1 , many of whom would have remained asymptomatic for life (are
over diagnosed).
Over treatment: For every 1000 men tested, 25 men will choose to undergo treatment
(surgery or radiation) because of uncertainty about which cancers need to be treated, many
of whom would do well without treatment (are over-treated) . 7–10 of these 25 men will
develop persistent impotence and/or urinary incontinence, and some will develop persistent
bowel problems, due to treatment.
For every 2000 men tested, 1 man will experience a serious cardiovascular event, such as
myocardial infarction, due to treatment.
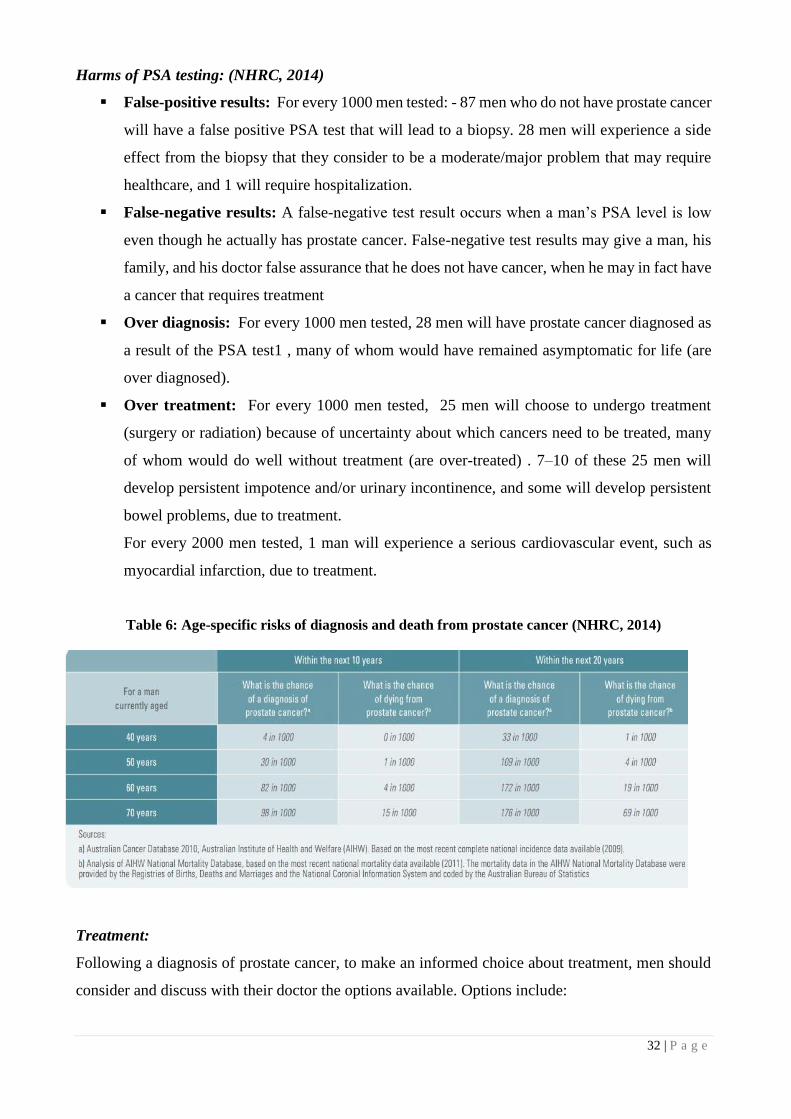
Table 6: Age-specific risks of diagnosis and death from prostate cancer (NHRC, 2014)
Treatment:
Following a diagnosis of prostate cancer, to make an informed choice about treatment, men should
consider and discuss with their doctor the options available. Options include:

33 | P a g e
■ Watchful waiting; ■ active monitoring; ■ radical prostatectomy ■ radiotherapy■ high-
intensity focused ultrasound (HIFU) ■ cryotherapy; and ■ adjuvant therapy. The various side effects
of treatment such as impotence, incontinence, bowel symptoms, infections, hospitalizations and a
considerable amount of anxiety should also be discussed.
Potential treatment side effects should be considered in the decision of whether or not to
undergo PSA testing, as some early prostate cancers detected through PSA testing will not result in
future health problems if left untreated (overdiagnosis), If these cancers are treated (over treatment),
any reduction in quality of life due to the side effects from the treatment may be considered an
unnecessary harm.
Table 7: Screening Recommendations of Major Societies (Limited to Guidelines Based on Systematic Reviews
and Updated Since the Publication of the European Randomized Study of Screening for Prostate Cancer and
Prostate, Lung, Colorectal, and Ovarian Screening Trial Randomized Controlled Trials) (Barry & Hayes, 2014)
Discussion
There have been calls for a national screening programme for prostate cancer, just as there are for
breast and cervical cancers (Bell, 2013)(The National report, 2014) (Todorova, 2013)

34 | P a g e
When considering population screening campaigns, the benefits and harms must be carefully
assessed, and the benefits should always outweigh the harms. Evidence-based research confirms that
the harms significantly outweigh the benefits with the current practices of PSA testing,. Prostate
cancer is largely a disease of older men, and diagnosis is less common below the age of 50 in UAE
(Ghafoor et al 2003)( Gulf Center for Cancer Control and Prevention, 2008) the high majority of the
individuals diagnosed (44%) in Ghafoor et al’s study were UAE nationals, this can be explained by
the increased number of UAE nationals in the elderly age group. Unlike developed countries,
publications and studies in UAE on the incidence rate is by far less than other western countries, this
could be explained by the less common PSA testing practices in UAE, underreporting and the
majority young population. Data on prostate cancer Mortality specific rates, hereditary involvement,
and outcomes of PSA testing and treatment in UAE is inadequate or not available, this could be due
to less attention from researchers, less/no reported data which itself can be explained by the other
more alarming causes of death, with 37% of Abu Dhabi deaths caused by cardiovascular disease that
strikes early in the population. With medical advancement, life expectancy at birth has increased in
UAE compared to previous decades, yet this increase was accompanied with reduced healthy life
expectancy. In our research this means that the proportion of individuals that potentially carry higher
PSA levels are more likely to have high burden of chronic diseases, that reduces the life expectancy
and potentially directs medical investigations away from prostate. 2050 Age distributions projections
in UAE forecasts an increase in the elderly (65+) population, with this increase we expect to have
more individuals to be diagnosed with high levels of PSA, this will in theory follow the high
incidence and low mortality patterns of other western countries, if genetic risk factors are ruled out.
Conclusion
50 – 69 years old Emirati males as well as men concerned about prostate cancer should receive clear
and balanced information about the advantages and disadvantages of the PSA test, biopsy and
treatments for prostate cancer and they should be counseled about the important quality of life
differences between the options. This will enable men to make informed decisions about whether or
not to have a PSA test. In addition, proactive routine screening may be offered every two years to
individuals with elevated risks, such as family history of prostate cancer or chronic prostatitis.
Importantly, more accurate screening tests prostate will be required in order to enhance the value of
prostate cancer screening.
Appendix 1: (UN 2012)

35 | P a g e
United Arab Emirates
Population by five-year age group and sex (thousands)
Medium variant
2000-2050
Year Age
Both sexes
combined Male Female
2000 0-4 259 132 127
5-9 266 137 130
10-14 242 125 117
15-19 197 104 93
20-24 286 192 94
25-29 410 300 109
30-34 401 301 100
35-39 361 279 82
40-44 271 216 54
45-49 154 125 29
50-54 88 70 18
55-59 40 31 9
60-64 20 13 7
65-69 14 9 6
70-74 7 4 3
75-79 4 2 2
80-84 2 1 1
85-89 2 1 1
90-94 0 0 0
95-99 0 0 0
100+ 0 0 0
2005 0-4 289 147 142
5-9 264 135 129
10-14 279 143 136
15-19 280 148 132
20-24 441 280 161
25-29 675 494 181
30-34 629 485 144
35-39 468 360 108
40-44 342 264 78
45-49 219 170 49
50-54 138 108 30
55-59 68 52 16
60-64 23 16 7
65-69 16 10 6
70-74 9 5 4
75-79 4 2 2
80-84 3 2 1
85-89 1 1 1
90-94 1 0 0
95-99 0 0 0
100+ 0 0 0
2010 0-4 538 273 265
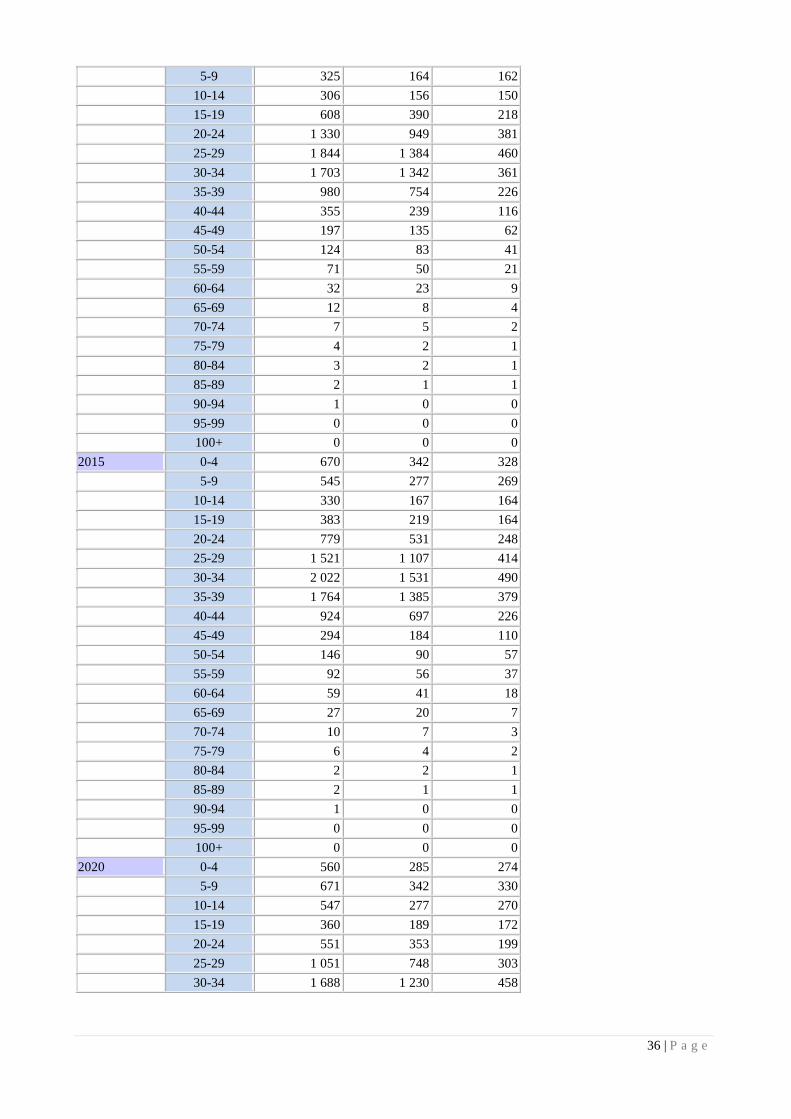
36 | P a g e
5-9 325 164 162
10-14 306 156 150
15-19 608 390 218
20-24 1 330 949 381
25-29 1 844 1 384 460
30-34 1 703 1 342 361
35-39 980 754 226
40-44 355 239 116
45-49 197 135 62
50-54 124 83 41
55-59 71 50 21
60-64 32 23 9
65-69 12 8 4
70-74 7 5 2
75-79 4 2 1
80-84 3 2 1
85-89 2 1 1
90-94 1 0 0
95-99 0 0 0
100+ 0 0 0
2015 0-4 670 342 328
5-9 545 277 269
10-14 330 167 164
15-19 383 219 164
20-24 779 531 248
25-29 1 521 1 107 414
30-34 2 022 1 531 490
35-39 1 764 1 385 379
40-44 924 697 226
45-49 294 184 110
50-54 146 90 57
55-59 92 56 37
60-64 59 41 18
65-69 27 20 7
70-74 10 7 3
75-79 6 4 2
80-84 2 2 1
85-89 2 1 1
90-94 1 0 0
95-99 0 0 0
100+ 0 0 0
2020 0-4 560 285 274
5-9 671 342 330
10-14 547 277 270
15-19 360 189 172
20-24 551 353 199
25-29 1 051 748 303
30-34 1 688 1 230 458
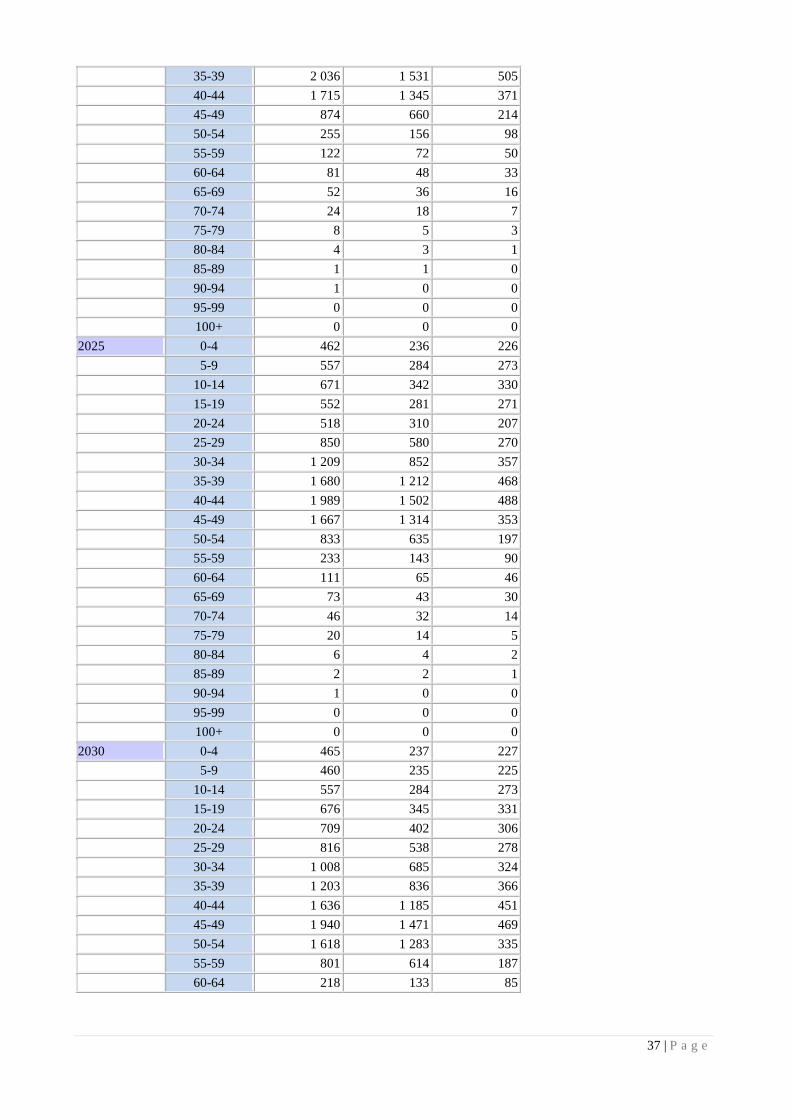
37 | P a g e
35-39 2 036 1 531 505
40-44 1 715 1 345 371
45-49 874 660 214
50-54 255 156 98
55-59 122 72 50
60-64 81 48 33
65-69 52 36 16
70-74 24 18 7
75-79 8 5 3
80-84 4 3 1
85-89 1 1 0
90-94 1 0 0
95-99 0 0 0
100+ 0 0 0
2025 0-4 462 236 226
5-9 557 284 273
10-14 671 342 330
15-19 552 281 271
20-24 518 310 207
25-29 850 580 270
30-34 1 209 852 357
35-39 1 680 1 212 468
40-44 1 989 1 502 488
45-49 1 667 1 314 353
50-54 833 635 197
55-59 233 143 90
60-64 111 65 46
65-69 73 43 30
70-74 46 32 14
75-79 20 14 5
80-84 6 4 2
85-89 2 2 1
90-94 1 0 0
95-99 0 0 0
100+ 0 0 0
2030 0-4 465 237 227
5-9 460 235 225
10-14 557 284 273
15-19 676 345 331
20-24 709 402 306
25-29 816 538 278
30-34 1 008 685 324
35-39 1 203 836 366
40-44 1 636 1 185 451
45-49 1 940 1 471 469
50-54 1 618 1 283 335
55-59 801 614 187
60-64 218 133 85

38 | P a g e
65-69 102 59 43
70-74 65 38 27
75-79 38 26 12
80-84 14 10 4
85-89 4 2 1
90-94 1 1 0
95-99 0 0 0
100+ 0 0 0
2035 0-4 529 270 259
5-9 462 236 226
10-14 460 235 225
15-19 562 288 274
20-24 832 466 366
25-29 1 007 629 378
30-34 975 643 332
35-39 1 003 669 333
40-44 1 160 810 350
45-49 1 589 1 157 433
50-54 1 891 1 440 451
55-59 1 575 1 252 323
60-64 766 587 179
65-69 202 123 79
70-74 92 53 39
75-79 55 32 23
80-84 29 20 9
85-89 9 6 3
90-94 2 1 1
95-99 0 0 0
100+ 0 0 0
2040 0-4 589 301 288
5-9 527 269 258
10-14 463 236 226
15-19 465 239 226
20-24 719 409 310
25-29 1 131 694 437
30-34 1 166 735 431
35-39 970 628 342
40-44 961 644 317
45-49 1 117 785 332
50-54 1 545 1 130 415
55-59 1 845 1 408 438
60-64 1 517 1 206 311
65-69 720 552 168
70-74 185 113 73
75-79 79 46 34
80-84 43 24 18
85-89 18 12 6
90-94 4 3 1

39 | P a g e
95-99 1 0 0
100+ 0 0 0
2045 0-4 591 302 289
5-9 587 300 287
10-14 527 269 258
15-19 467 240 227
20-24 622 360 262
25-29 1 018 637 381
30-34 1 290 799 491
35-39 1 160 720 441
40-44 928 603 325
45-49 919 620 299
50-54 1 077 762 315
55-59 1 507 1 104 402
60-64 1 785 1 362 423
65-69 1 438 1 143 294
70-74 664 509 156
75-79 161 98 64
80-84 62 35 27
85-89 28 16 12
90-94 9 6 3
95-99 1 1 0
100+ 0 0 0
2050 0-4 562 287 275
5-9 588 301 288
10-14 587 300 287
15-19 532 273 259
20-24 625 362 263
25-29 921 588 333
30-34 1 177 742 435
35-39 1 284 784 500
40-44 1 119 694 424
45-49 887 579 308
50-54 882 599 283
55-59 1 047 742 304
60-64 1 461 1 071 390
65-69 1 701 1 299 402
70-74 1 336 1 062 274
75-79 584 446 138
80-84 129 77 51
85-89 42 23 19
90-94 15 8 7
95-99 3 2 1
100+ 0 0 0
References

40 | P a g e
Andriole, G.L., Crawford, E.D., Grubb, R.L. 3rd, Buys, S.S., Chia, D., Church, T.R., Fouad, M.N.,
Gelmann, E.P., Kvale, P.A., Reding, D.J., Weissfeld, J.L., Yokochi, L.A., O'Brien, B., Clapp, J.D.,
Rathmell, J.M., Riley, T.L., Hayes, R.B., Kramer, B.S., Izmirlian, G., Miller,
A.B., Pinsky, P.F., Prorok, P.C., Gohagan, J.K., Berg, C.D.; PLCO Project Team (2009)
'Mortality results from a randomized prostate-cancer screening trial', N Engl J Med , 26(360), pp. 1310-9
[Online]. Available at: http://www.ncbi.nlm.nih.gov/pubmed/19297565 (Accessed: 1st February 2015).
Barry, M., Hayes, J, (2014) 'Screening for Prostate Cancer With the Prostate-Specific Antigen Test: A
Review of Current Evidence', JAMA, 311(11), pp. 1143-49 [Online]. Available
at: http://jama.jamanetwork.com/article.aspx?articleid=1841972 (Accessed: 1st February 2015).Bell, J.
(2013) 'Don't leave it too late, shyness can have tragic consequences', The National, 8th September, p.
Breslow N, Chan CW, Dhom G, et al. (1977) Latent carcinoma of prostate at autopsy in seven areas. The
International Agency for Research on Cancer, Lyons, France. Int J Cancer 20(5):680-8. Available at:
http://www.ncbi.nlm.nih.gov/pubmed/924691 (Accessed: 1st February 2015).
Cancer research UK (2012) Prostate cancer mortality statistics, Available
at:http://www.cancerresearchuk.org/cancer-info/cancerstats/types/prostate/mortality/uk-prostate-cancer-
mortality-statistics (Accessed: 1st February 2015).
Centers for disease control and prevention (2011) United States Cancer Statistics (USCS)- Top 10 cancers
, Available at:http://apps.nccd.cdc.gov/uscs/toptencancers.aspx (Accessed: 1st February 2015).
Esposito, K., Chiodini, P., Capuano, A., Bellastella, G., Maiorino, MI., Parretta, E., Lenzi, A., Giugliano, D.
(2013) 'Effect of metabolic syndrome and its components on prostate cancer risk: meta-analysis.', J
Endocrinol Invest., 36(2), pp. 132-9 [Online]. Available
at: http://www.ncbi.nlm.nih.gov/pubmed/23481613 (Accessed: 1st February 2015).
Ferlay J, Soerjomataram I, Ervik M, Dikshit R, Eser S, Mathers C, Rebelo M, Parkin DM, Forman D, Bray,
F. (2013) Cancer incidence and mortality worldwide: IARC CancerBase, Available
at: http://globocan.iarc.fr/Pages/fact_sheets_cancer.aspx(Accessed: 1st February 2015).
Ghafoor, M., Schuyten, R., Bener, A. (2003) 'Epidemiology of Prostate Cancer in United Arab
Emirates', Med J Malaysia, 58(5), pp. 713-16 [Online]. Available at:http://www.e-
mjm.org/2003/v58n5/Prostate_Cancer.pdf (Accessed: 1st February 2015).
Gulf Center for Cancer Control and Prevention (2008) Ten-Year Cancer Incidence among nationals of the
GCC country states 1998-2007, Saudi Arabia: Gulf Center for Cancer Control and Prevention.

41 | P a g e
Health authority Abu Dhabi (2011) Health statistics, Available
at:http://www.haad.ae/HAAD/LinkClick.aspx?fileticket=c-lGoRRszqc= (Accessed: 1st February 2015).
Health authority Abu Dhabi (2013) Health statistics, Available
at:http://www.haad.ae/HAAD/LinkClick.aspx?fileticket=LrAOka_Zx3Q%3d&tabid=349(Accessed: 1st
February 2015).
Hemminki K. Familial risk and familial survival in prostate cancer. World J Urol 2012 Apr;30(2):143-8.
Available at: http://www.ncbi.nlm.nih.gov/pubmed/22116601 (Accessed: 1st February 2015).
Hugosson, J., Carlsson, S., Aus, G., Bergdahl, S., Khatami, A., Lodding, P., Pihl, CG., Stranne, J.,
Holmberg, E., Lilja, H., (2010) 'Mortality results from the Göteborg randomised population-based prostate-
cancer screening trial.', Lancet Oncol, 11(8), pp. 725-32 [Online]. Available
at: http://www.ncbi.nlm.nih.gov/pubmed/20598634(Accessed: 1st February 2015).
Ilic ,D., Misso, M. (2012) 'Lycopene for the prevention and treatment of benign prostatic hyperplasia and
prostate cancer: a systematic review.', Maturitas, 72(4), pp. 269-76 [Online]. Available
at: http://www.ncbi.nlm.nih.gov/pubmed/22633187(Accessed: 1st February 2015).
Lippman, S.M., Klein, E.A., Goodman, P.J., Lucia, M.S., Thompson, I.M., Ford, L.G., Parnes, H.L.,
Minasian, L.M., Gaziano, J.M., Hartline, J.A., Parsons JK, Bearden JD 3rd, Crawford ED, Goodman GE,
Claudio J, Winquist E, Cook ED, Karp DD, Walther P, Lieber
MM, Kristal AR, Darke AK, Arnold KB, Ganz PA, Santella RM, Albanes D, Taylor PR, Probstfield JL,
Jagpal TJ, Crowley JJ, Meyskens FL Jr, Baker LH, Coltman CA Jr (2009) 'Effect of selenium and vitamin E
on risk of prostate cancer and other cancers: the Selenium and Vitamin E Cancer Prevention Trial
(SELECT).', JAMA,30(1), pp. 39-51 [Online]. Available
at: http://www.ncbi.nlm.nih.gov/pubmed/19066370(Accessed: 1st February 2015).
National health and medical research council NHRC- Government of Australia (2014)PSA Testing for
Prostate Cancer in Asymptomatic Men Information for Health Practitioners, Available
at:https://www.nhmrc.gov.au/_files_nhmrc/publications/attachments/men4d_psa_testing_asymptomatic_me
n_140304.pdf(Accessed: 1st February 2015).
Sakr WA, Grignon DJ, Haas GP, Heilbrun LK, Pontes JE, Crissman JD.(1996) Age and racial distribution
of prostatic intraepithelial neoplasia. Eur Urol 30, pp. 138–44.
Schröder, .FH., Hugosson, J., Roobol, M.J., Tammela, T.L., Ciatto, S., Nelen, V., Kwiatkowski, M., Lujan,
M., Lilja, H., Zappa, M., Denis, LJ., Recker, F., Berenguer, A., Määttänen, L., Bangma, C.H., Aus, G.,
Villers, A., Rebillard, X., van der Kwast, T., Blijenberg, B.G., Moss, S.M., de Koning, H.J., Auvinen, A.;
ERSPC Investigators (2009) 'Screening and Prostate-Cancer Mortality in a Randomized European Study', N

42 | P a g e
Engl J Med , 360(13), pp. 1320-8 [Online]. Available
at:http://www.nejm.org/doi/full/10.1056/NEJMoa0810084#t=articleDiscussion (Accessed: 1st February
2015)
Staff report (2014) Prostate awareness campaign launched, Available
at:http://gulfnews.com/news/gulf/uae/health/prostate-awareness-campaign-launched-1.1395374 (Accessed:
1st February 2015)
Todorova, V. (2013) Early screening vital in fight against prostate cancer, say UAE experts, Available
at: http://www.thenational.ae/uae/health/early-screening-vital-in-fight-against-prostate-cancer-say-uae-
experts (Accessed: 1st February 2015).
United nations department of economics and social affairs (2012) World Population Prospects: The 2012
Revision, Available at :http://esa.un.org/unpd/wpp/unpp/panel_indicators.htm Accessed: 1st February
2015).
World cancer research fund international (2012) Prostate cancer statistics, Available
at: http://www.wcrf.org/int/cancer-facts-figures/data-specific-cancers/prostate-cancer-statistics (Accessed:
1st February 2015)
World health organization (2008) Global health observatory data- Cancer mortality and
morbidity, Available at: http://www.who.int/gho/ncd/mortality_morbidity/cancer_text/en(Accessed: 1st
February 2015).

43 | P a g e
Preventing Insurance Fraud in Dubai – A Risk Management Approach
Niyi Awofeso
Hamdan Bin Mohammed Smart University, UAE
Samer Hamidi
Hamdan Bin Mohammed Smart University, UAE
Mayada Moussa
Hamdan Bin Mohammed Smart University, UAE
Moetaz El Sergani
Hamdan Bin Mohammed Smart University, UAE
Abstract
Health insurance fraud is a major challenge for healthcare managers in nations with health insurance
schemes, as it increases healthcare costs and raises patient premiums without improving quality of health
care. For example, in the United States alone, health insurance fraud was estimated to cost the health
insurance industry and insurance holders who co-pay for health services $68 billion in 2006. The European
Health care Fraud and Corruption Network stated that, in 2008, of the annual global health expenditure of
about US$ 5.3 trillion, at least 5%, or about US$ 260 billion, is lost to fraud. In the Gulf Cooperation Council
(GCC) region, whose member states have only recently commenced health insurance schemes, health
insurance fraud is currently estimated to cost residents and the insurance industry about $US 1 annually.
Dubai’s Mandatory Health Insurance Law 11 of 2013 currently being implemented in phases. The law states
that all residents and visitors to Dubai must have a minimum of basic healthcare coverage – Essential Benefits
Plan - by 2016. The more Dubai’s universal health insurance scheme matures, the greater the risk of health
insurance fraud. The cost of paying out fraudulent health insurance claims is ultimately recovered through
higher premiums – fraud therefore ultimately robs healthcare consumers or their sponsors. This article
reviews the scope of health insurance fraud and proposes a risk management approach for its prevention in
Dubai’s health system.
Keywords: Health Insurance, Fraud, Dubai, Risk Management
Introduction
Health financing is one of the building blocks of health systems. How societies finance health care,
and the proportion of national resources devoted to health, affects both the level of care different
44 | P a g e
segments of people can get and its quality. There are several established models for implementing
health financing functions— national health service systems, social health insurance funds, private
voluntary health insurance, community-based health insurance, and direct purchases by consumers.
These models embody three core health financing principles: Raise enough revenues to provide
individuals with a basic package of essential services and financial protection against catastrophic
medical expenses caused by illness and injury in an equitable, efficient, and sustainable manner;
Manage these revenues to pool health risks equitably and efficiently; Ensure the purchase of health
services in ways that are allocatively and technically efficient. In Rwanda for example, the mutual
health insurance scheme currently covers 93% of the population, and has been largely successful,
given socio-economic constraints, in achieving the above principles (Saskena et al, 2011). Private,
out–of-pocket funding for health services is the most inequitable form of health financing and,
unfortunately, the most common mode of health care financing in developing nations (The World
Bank, 2006).
Universal health insurance is regarded by global health agencies as a major positive health
transition, and a powerful public health concept. As an alternative to out-of-pocket payments, which
burden poor people with greater health care needs and impoverish millions every year, well
implemented health insurance schemes help spread the costs across whole populations, enabling
everyone to pay less for needed health services and reducing the risk of catastrophic healthcare
expenses. Such improved financial protection against huge medical bills enable families to save
more, increase economic activity and stimulate human and economic development. Universal health
coverage is an opportunity but not a guarantee for improved health and human development
outcomes – health insurance schemes need to be properly implemented and insulated from
inefficiencies like fraud for their benefits to be optimized.
Health insurance fraud is a major source of health system inefficiency in many nations. It
may be defined as an intentional act of deception by any person which has as its purpose the objective
of: obtaining a (financial or other) benefit or advantage related to the operation of a health insurance
scheme; or causing or exposing another person to a (financial or other) loss or disadvantage related
to the operation of a health insurance scheme, whether or not that act in fact achieves its intended
purpose. From a penal perspective, health care fraud is usually differentiated from health care abuse,
defined as an act by any person related to the operation of a health insurance scheme which is not in
accordance with the ethical standards and requirement of absolute good faith that should apply to all

45 | P a g e
insurance relationships, but does not include an act which amounts to healthcare insurance fraud.
(HAAD, 2010).
There are many forms of health insurance fraud. Insured persons may perpetuate fraud by
misrepresenting the identity of the recipient of care (including the fraudulent use of health insurance
cards by someone other than a policy holder to obtain services to which only the policy holder is
entitled); modifying medical documents so that someone other than the policy holder receives
medical benefits; or/and modifying medical documents so that a policy holder receives benefits for
which they are ineligible. Insurance payers may indulge in fraudulent activity by providing monetary
incentives to claims reviewers to deny or delay payments; systematically and deceitfully under-
valuing the amount owed to a health service provider with the intent to defraud, and/or; deliberately
misstating benefits in marketing materials. Health care providers may engage in fraudulent activities
by: soliciting payments or other benefits for providing services to which an individual is not entitled
to (i.e. receiving a bribe); improperly billing for healthcare services with the intention to receive
financial benefit such as by: billing for services, medicines that were not provided; billing with a
reimbursement code for a more complex and expensive procedure than was actually provided;
misrepresenting non-covered treatments as medically necessary covered treatments; billing
separately for procedures that normally are covered by a single fee; Billing more than once for the
same service; using a code number that does not apply to the procedure; colluding with other persons
to implement an arrangement that pays for services to which individual recipients are not entitled or
which were not in fact provided (HAAD, 2010).
The European Healthcare Fraud & Corruption Network estimates that 5% to 10% of the
current global $6.6 trillion health industry expenditure is lost to fraud, of which a significant
proportion is health insurance fraud. In the United States, which currently expends about $2.7 trillion
on health care annually, a national Health Care Fraud and Abuse Control Program (HCFAC) was
established under the Health Insurance Portability and Accountability Act of 1996 (HIPAA). The
Program is carried out jointly at the direction of the Attorney General and the Secretary of the
Department of Health and Human Services (HHS), acting through the Inspector General. The
Program aims to coordinate federal, state and local law enforcement activities with respect to health
care fraud and abuse. The HCFAC account has returned over $25.9 billion to the Medicare Trust
Funds since its inception in 1997 (including $4.1 billion in 2011), a tip of the iceberg, given estimates
that about $ 68 billion was lost to health care fraud in the United States in 2006 alone, according to
the National Health Care Anti-Fraud Association, out of about $700 billion lost to health care fraud

46 | P a g e
and other “wastes” - healthcare spending that can be eliminated without reducing the quality of care
(USDHHS & DJ, 2014; Kelly et al, 2009). In GCC nations, it is estimated that, currently, about $1
billion, or 10% of total health insurance claims, is fraudulent.
As the GCC health insurance industry is growing rapidly (As at 2014, Bahrain, Kuwait, and
Saudi Arabia have compulsory universal health insurance, while UAE, Kuwait and Oman are
implementing universal insurance policies) and as combined health spending in GCC nations
increase to a projected $79 billion by 2015, inefficiencies due to health insurance fraud are likely to
worsen unless coordinated and effective health insurance fraud control measures are implemented.
The authors review Dubai’s evolving health insurance system and highlight potential fraud risks. A
Risk management framework to facilitate health insurance fraud in Dubai is proposed.
Dubai’s Mandatory Health Insurance Scheme
UAE’s health insurance network and expenditure are growing rapidly, with Dubai’s Mandatory
Health Insurance Law 11 of 2013 currently being implemented in phases. The law states that all
residents and visitors to Dubai must have a minimum of basic healthcare coverage – Essential
Benefits Plan - by 2016. Dubai’s Statistics Centre estimated the population of Dubai at 2.1 million
in 2012, with approximately 76% male and 24% female. The majority of male expatriate residents
are blue-collar workers of Asian, South Asian or African origin, with only 11% under the age of 15
years and 1% over 60 years of age. Dubai’s Universal Health Coverage is based on mandatory
enrollment through employment, and gives health consumers a choice of seeking treatment with
government and/or private healthcare providers. Currently, the government owns four Dubai Health
Authority (DHA) hospitals with a capacity of 2063 beds, and 14 Primary Healthcare Centers. In
addition to DHA, the Ministry of Health – Dubai Medical District owns and operates 2 hospitals,
with a capacity of 284 beds, and 9 PHCs in Dubai. The private sector comprises of 22 hospitals,
with a capacity of 1468 beds, and over 1000 outpatient clinics and polyclinics. The total bed capacity
in Dubai is 3815 beds, or 1.9 beds per 1000 population. Dubai’s total health expenditure as
percentage of its GDP is 3.4%. In 2012, despite no mandatory health insurance, private insurance
expenditure as proportion of total health expenditure in Dubai was high, at 33%. Health insurance
companies are obliged to comply with all provisions of Dubai’s insurance law including providing
any information, data, or statistics such as medical file of beneficiary deemed necessary for
inspection, to DHA. By the time the scheme is fully implemented in 2016, it is envisaged that total
premiums will be 6 billion AED, up from the March 2014 total of 4 billion AED, of which 4.5 billion
AED will be contributed by white collar workers (DHA, 2014a).

47 | P a g e
According to DHA (2014b), in 2012, 9.934 billion AED was spent on health care in Dubai,
5.8 billion of which was spent in Dubai’s private health care sector. The total current expenditure
was funded as follows: Government 32%; Employers and corporations 45%, of which 36% of the
total expenditure was health insurance prepayments; Households 22%. The major recipients of
Dubai’s health care dollars were Hospitals – (48% of total receipts) and clinics/policlinics – (22%).
Based on types of care, curative care received 55%, while Preventive care received 6%, and was
mainly funded by the government. Interestingly, preventive services accounted for only 1% of health
insurance claims. Drugs and other medical goods received 20% of total healthcare funds.
The dual objectives of Dubai’s health insurance scheme are universal access and quality
health care provision. The access objective is to be achieved by making health insurance mandatory
for all residents and long term visitors to Dubai. The quality objective is to be achieved by
accreditation requirements as well as a competitive healthcare market in which patients can choose
their preferred providers. The Dubai Government funds the health insurance program for resident
UAE nationals as part of the Enaya scheme. Expatriates and their immediate dependents are
normally enrolled in health insurance schemes paid for by their employers. It is not permissible for
employers to deduct premiums from the employee or to reduce salary to mitigate the cost of health
insurance. Employees will have to pay only the deductible or coinsurance amounts specified under
the terms of the policy as well as any other treatment costs incurred which are not covered by the
policy or which are in excess of any policy limits. Only the 52 insurance companies holding Dubai
Health Insurance permits are permitted to enroll health consumers, but they cannot deny coverage
or impose special conditions for low income earners. Each year, DHA sets a price range within
which participating insurers must set their premium. For 2014, the range of premium for the
Essential Benefits Plan was set at between 500 and 700 AED per insured member. Funds are
prohibited from charging greater than 25AED above or below the approved band. The Health
Insurance Law requires that all medical expenses schemes must be established on a fully insured
basis. Annual upper aggregate claims limit for any insurance cover in UAE was set at 150,000 AED
for 2014. Health services excluded from insurance claims include healthcare services which are
deemed not medically necessary as well as all expenses relating to dental treatment, dental
prostheses, and orthodontic treatments (DHA, 2014c).
To date, no major case of health insurance fraud has been prosecuted in Dubai. However,
there are several reasons to consider Dubai as a high risk community for health insurance fraud. First

48 | P a g e
is novelty. Wide scale health insurance schemes are not yet well established in the Middle East.
Thus, there is not enough local experience on fraud prevention, and health insurance contexts in
OECD nations diverge significantly from that of the UAE (Rudman et al, 2009), making fraud
prevention measures more difficult to adapt. Second is demographics. At one end of the spectrum
are white collar expatriate staff many of whom are paying more than they should for insured health
services partly because they are told by health care providers that they suffer from conditions that
they do not have, pay for treatments that they do not need and are kept in hospital for longer than
they should be. At the lower end of the spectrum, about 60% of foreign workers in UAE are
expatriate manual workers who may be easily manipulated by health insurance companies due to
low health literacy and inadequate familiarity with how health insurance works (Patel et al, 2013).
Third, unlike the situation in most OECD nations, the biggest source of health insurance fraud –
health care providers – are privately owned in Dubai. The private health sector accounted for75.8%
of the total outpatient visits and 61.3% of the total inpatients in Dubai’s health system 2012. Given
the prime profit motive of private health facilities, the risk of health insurance fraud in private
hospitals is greater than in government hospitals which are not-for-profit outfits. Fourth, since
Dubai’s insurance law mandates that all approved health care services be insurable, the number and
diversity of service providers are likely to increase, creating more opportunities for health insurance
fraud.
Risk management approach for health insurance fraud prevention
Despite risk prevention activities being as old as the history of human civilization – organizations
and individuals continually seek to identify and reduce risks that threaten their existence – the
discipline of health care risk management is less than six decades old. It emerged in the United
States in the early 1970s when hospitals experienced rapid escalation of claims costs, and
subsequently insurance premiums. Health care risk management may be described as the systematic
process of using administrative directives, organizations and operational skills and capacities to
implement strategies, policies and improved coping capacities in order to lessen the adverse impacts
of medical errors, fraud, and inefficiencies in the production of healthcare goods and services. Health
insurance provision increases the risk of fraud depending on the mix of players and reimbursement
mechanisms, such as perverse payment incentives which encourage provision of unnecessary
services to patients. The health care market is characterized by asymmetrical information between
providers and consumers, and this situation increases fraud risk. Among fully insured health
consumers (such as most UAE citizens and highly paid expatriates), the risk of fraud is higher since

49 | P a g e
the marginal cost of health services to such consumers is nil. This effect is independent on consumer
behavior (Dionne, 1984).
An effective risk management program for preventing health insurance fraud has the
following structural elements; the approach should include a defined scope of risks to be managed,
including an examination of the risks that affect corporate image of health services or those that may
adversely affect consumers’ trust and confidence. Risk management approaches should adopt a mix
of techniques to prevent or reduce potential losses and preserve organizational assets. Also important
are laws, policies and procedures that ensure program uniformity, assist in communicating program
content, and authorize sanctions. The risk management process consists of five steps: (1) identify
and analyze loss exposure; (2) consider alternative risk techniques; (3) select what appears to be the
best risk management technique or combination of techniques; (4) implement selected techniques;
(5) monitor and improve the risk management program (Head & Kwok-Sze, 1999).
A critical starting point in analyzing health insurance fraud exposure is Risk Analysis - the
process of determining the potential severity of loss associated with an identified risk and the
probability that such a loss will occur. Risk managers need to give priority to determining the major
sources of fraud. Based on audits from the United States, health insurance fraud can be attributed to
one of five major categories of perpetrators; Providers and medical professionals; Hospitals and
facilities; Consumers and the public; Insurance companies and Third Party Administrators, and;
Brokers, agents and employees. Providers and medical professionals account for the majority of
fraud, or 72 per cent, while hospitals and facilities account for over eight per cent of all suspected
fraud cases according to an America’s Health Insurance Plans (AHIP, 2011) survey. Consumers
account for 10 per cent, and the final 10 per cent comes from all other sources, including brokers
and agents, laboratories, pharmacies, and employees. Determination of prevalence of health
insurance fraud by perpetrator categories through historical audit of fraud cases is an important step
in analyzing fraud exposure.
Established methods of risk identification systems include incident reporting – which uses
electronic or paper based data collection processes to provide early warning information about
unorthodox health insurance claims or practices, and generic occurrence screening - retrospective
random review of patients records by claims adjudicators to reconcile claims records with
documented clinical care provision. Closed claims data, which reveal the frequency and severity of
prior insurance payouts, provide valuable information that may guide current risk profiles.

50 | P a g e
Risk management techniques refer to the study and choice of feasible approaches for
addressing a given risk. Risk control is an important risk management technique for preventing
health insurance fraud. Loss prevention is a risk control technique that seeks to reduce the likelihood
of a fraudulent event occurring and the frequency of loss. A reliable approach to effective loss
prevention is the use of the fraud triangle. This model centers around three key factors present when
individuals or organized groups commit fraud: rationalization, opportunity, and motivation or
pressure (Cressey, 1953). Rationalization for fraud can take many forms but is typically an important
stimulus factor. For example, a physician might justify fraudulent practices by a self-belief that big
insurers are sitting on piles of money or that the company deserves the loss, having taken in
premiums from the poor contributors. Motivation, the perception of a need or a pressure is the key
factor, and it does not matter whether or not the motivation makes sense to others or is based in
reality. For some, the prospect of catastrophic health care expense may be invoked as motivation.
Pure greed may also be a factor, but this may be flavored with a sense of injustice, such as fraudulent
claims to cover treatment for a condition that the patient believed should have been diagnosed earlier.
Opportunities for health insurance fraud occur in environments with little perceived chance of getting
caught or penalized. Windows of opportunity exist for health insurance fraud when regulatory health
agencies have poor internal controls, weak processes and procedures. An effective health insurance
fraud deterrence program should directly target the three elements of the fraud triangle (Dean et al,
2013).
Selecting and implementing the most appropriate risk management techniques for preventing
health insurance fraud entails forecasting the effects that the available risk management options are
likely to have on health insurance fraud prevention, as well as prioritizing the adoption of each
technique based on feasibility, ease of use and cost-effectiveness. Insurance claims for unnecessary
use of ultrasound and other imaging investigations which provide little health benefits to patients
exemplify an area of fraud that requires effective risk management processes. In the United States
in 2007, Medicare health insurance scheme covered about 17 million ultrasound services in
ambulatory settings at a cost of $2.1 billion. Using claims audit techniques conducted in accordance
with US Quality Standards for Inspections, the US Health Department’s office of Inspector general,
which is mandated by Public Law 95-452 to prevent health insurance fraud, undertook claims audit
for ultrasound services reimbursed in 2007 and determined that 20 high-use regions accounted for
16 percent of Medicare insurance spending on ultrasound despite having only 6 percent of Medicare
beneficiaries. Nearly one in five ultrasound claims nationwide had characteristics that raise concerns

51 | P a g e
about whether the claims were appropriate. The five assessed characteristics were: Absence of a
preceding service claim from the ordering physician. This refers to an ultrasound ordered and
performed without a preceding Evaluation & Management encounter to generate an ultrasound-
addressable question; Use of suspect combinations of billing codes, such as billing for both a
complete abdominal scan and a scan of an individual organ within the abdominal cavity; Occurrence
of more than five ultrasounds provided to the beneficiary on the same day by the same provider;
Beneficiaries who had ultrasounds billed by more than five providers; Missing or invalid ordering
physician identifiers. The audit also found that a group of 672 health care providers each billed 500
or more ultrasound claims with questionable characteristics (Levinson, 2009).
Organizational structures, Legislations policies and procedures for addressing health
insurance fraud are important risk management approaches. In the United States, the Office of the
Inspector General in the Department of Health and Human Services undertakes fraud prevention
activities through the following component units: (a) The Office of Audit Services, which provides
auditing services for the Department’s health insurance sector as part of efforts to help reduce waste,
abuse, and mismanagement and promote economy and efficiency throughout the Health and Human
Services Department; (b) The Office of Evaluation and Inspections, which conducts national
evaluations on preventing fraud, waste, or abuse and promoting economy, efficiency, and
effectiveness of departmental programs; (c) The Office of Investigations conducts criminal, civil,
and administrative investigations of fraud and misconduct related to Health and Human Services
programs, operations, and beneficiaries. These fraud prevention units are in additional to dozens of
health insurance fraud prevention organizations in the public and private sectors. In the United
States, when Medicare and Medicaid were enacted in 1965, a single provision prohibited the making
of false statements to secure reimbursement. Currently, at least 12 health-care-specific civil,
criminal, and administrative anti-fraud laws and regulations have been enacted by the states and the
federal government (e.g. the 1996 Health Insurance Portability and Accountability Act) to prevent
health insurance fraud, providing a wide array of criminal, civil and administrative responses, with
a range of punishment from fines to life imprisonment (Hyman 2002).
Health insurance policies facilitate implementation, monitoring and improvement of
legislation and provide a framework for compliance. For example, the Abu Dhabi Health 2010
health insurance and abuse policy places health insurance fraud duties (e.g. reporting and policy
adaptation) on health insurance companies, third party administrators, healthcare organizations,
52 | P a g e
healthcare professionals, employers and insured persons who participate in the health insurance
scheme in Abu Dhabi.
Procedures, especially for insurance claims need to be properly detailed to reduce the risk of
negligent claims and to facilitate proof of health insurance fraud. In Australia, the Medicare Benefits
Schedule Book is a procedure manual that details eligibility for various categories of Medicare
(government health insurance) reimbursement to patients and general practitioners (Australian
government, 2012). Case studies of sanctions of stakeholders found guilty of Medicare insurance
fraud highlight the value of risk management approaches for fraud prevention. For example;
“A Queensland medical practitioner was required to repay about $45 000 to Medicare
Australia and was disqualified from prescribing Pharmaceutical Benefits Scheme medicines
for three years for inappropriate prescribing of painkillers. The practitioner came to
Medicare Australia’s attention when routine analysis of prescribing data showed concerning
levels of prescriptions for pain relief medication like pethidine and morphine. Medicare
Australia referred the practitioner to the Professional Services Review (PSR) for peer review.
The PSR found the practitioner had prescribed subsidised medicine for pain relief to patients
where it was not clinically necessary.” (Medicare Australia 2012).
Suggested strategies for preventing health insurance fraud in Dubai
With Dubai’s mandatory health insurance scheme progressing towards full coverage by 2016, it is
important to develop a risk management approach for health insurance fraud prevention.
Professional fraud prevention measures are not as common as opportunistic fraud in the health
insurance sector. However, opportunistic fraud is usually more difficult to prevent as perpetrators
(e.g. physicians and most employees) do not fit the “criminal” stereotype. It is useful to adopt an
overarching risk management framework for fraud prevention instead of the current reactive
approach, exemplified by the July 2013 announcement by Dubai Health Authority to set up a
regulatory agency to police private hospitals in the Emirate. A health insurance fraud prevention
department is required within the Dubai Health Authority to liaise with all stakeholders and provide
oversight regarding fraud prevention in public and private health sectors. The department’s roles in
relation to audit, supervision and oversight need to be clearly detailed. Second, the potentials of e-
claims for fraud detection will remain just that unless there are skilled fraud risk management
adjudicators to spot and investigate unusual trends using data analytics software. Examples of data
analysis for insurance fraud prevention include; calculation of statistical parameters in claims for
specified health service claims (e.g., averages, standard deviations, high/low values) – to identify

53 | P a g e
outliers that could indicate fraud; Classification – to find patterns amongst data elements; Joining
different diverse sources – to identify matching values (such as names, addresses, and account
numbers) where they shouldn’t exist; Duplicate testing – to identify duplicate transactions;
Validating entry dates – to identify suspicious or inappropriate times for postings or data entry (ACL,
2014).
Dubai’s Health Insurance Law grants powers to Dubai health Authority for regulating the
health insurance sector, but the scope and depth of theses powers in relation to fraud prevention are
vague. There is a need for publicly available policies and procedures on health insurance fraud, as
health consumers may be perpetrators of fraud or find themselves as unwilling participants in
fraudulent activities. Procedures for claims need to be properly spelt out. The electronic claims and
coding of claims is an important first step already effectively implemented by Dubai health authority.
In determining fraud, multiple approaches, including prospective audits and site inspections are
usually required, and some of these activities are best contracted to competent third part agencies
with international experience in health insurance fraud prevention. Accredited health insurance
companies in Dubai should also be encouraged to contribute to the formation of a central body for
fraud prevention.
Health literacy is an important strategy for fraud prevention in Dubai. Insured health
consumers need to be aware of their rights and obligations, and report suspicious billing practices.
This is especially important for expatriate manual workers who have no prior experience with health
insurance operations. White collar workers who have generous insurance schemes may also be
unwitting accessories of health care fraud if they are deceived into authorizing bogus insurance
claims. Health literacy should utilize multiple channels, including the Dubai Health Authority
website, to educate the public about health insurance processes, rights and obligations. In the spirit
of transparency, annual compliance case studies, similar to that of Medicare Australia (2012) should
be published to educate stakeholders about progress, trends and sanctions in relation to health
insurance fraud.
A controversial approach adopted by Dubai health authority is the use of “mystery shoppers”
– members of fraud prevention teams who masquerade as patients and orchestrate (or observe) fraud
related scenarios among health care providers. A similar approach was recently employed by the
Obama administration, using health policy officials to pose as patients to see how difficult it is to get
an appointment with a physician and other steps in the patient journey. Opponents of this approach
54 | P a g e
believe its routine use will lead to an erosion of trust in the Dubai Health Authority by the health
industry. The American Medical Association Council on Ethical and Judicial Affairs studied the
mystery shopper question and concluded that a sound program would include: The places that
unannounced visits will affect should know about the program; The information should be used for
improvement and not punitive actions; Mystery shoppers should not be the sole source of data for
evaluating clinical performance (or fraudulent practices); The program should not adversely affect
access to medical care by legitimate patients (AMA 2007).
The 2013 Health Insurance Law of Dubai, stated that Emirates Identity Authority will be
used as health insurance card. This integration of health insurance identification with the Emirates
identification card may assist in reducing fraud and abuse by ensuring accurate identification of the
insured and their eligibility for specified health plans.. This is because each Emirates identification
card contains an embedded computer chip (the Integrated Circuit Chip) which provides such smart
cards with built-in tamper resistance and the unique ability to store large amounts of data securely,
carry out functions on the card itself, and interact intelligently with a smart card reader. Emirates ID
smart card technology conforms to international standards such as ISO/IEC 7816 (Smart Card
Alliance, 2011).
Conclusion
With the ongoing implementation of Dubai’s mandatory health insurance scheme comes a
requirement to institute appropriate procedures to tackle health insurance fraud, which is estimated
to add about 10% in insurance premium charges and make health insurance expensive for many.
The current regulatory environment in Dubai is so far not developed enough to address the
complexity of professional and opportunistic fraud, particularly in the private health care sector. A
risk management approach is a useful overarching framework for developing the organizational
structures, workforce, data analytics systems and processes for effective health insurance prevention.
As health consumers may be active or unwitting perpetrators of health insurance fraud, it is important
that the Dubai Health Authority shares its policies and procedures with consumers by making such
documents accessible on its web site. Health literacy among consumers is another aspect of the
health insurance fraud prevention equation that requires urgent attention. Given that health care
professionals in the United States are the biggest contributors to health care fraud losses, ethics
training for Dubai’s health care professionals may require updating to incorporate the private sector
health professionals and emphasize the need to avoid acts that tantamount to health insurance abuse
or fraud.

55 | P a g e
References
ACL (2014). Fraud detection using Data Analytics in the insurance industry. Vancouver: ACL Services
Ltd.
America’s Health Insurance Plans. Research Brief: Insurers’ Efforts to Prevent Health Care Fraud. New
York: USA.
American Medical Association (2007). Resolution 11 "Secret shopper" patients. American Medical
Association House of Delegates Resolutions, Annual Meeting 2007. Chicago, IL: American Medical
Association.
Australian Government Department of Health and Ageing (2012). Medicare benefits schedule book,
category 2. Canberra: Commonwealth of Australia.
Cressey D (1953). Others people’s money: a study in the social psychology of embezzlement. Glencoe, IL:
Free Press.
Dean PC, Vazquez-Gozalez J, Fricker L (2013) Causes and Challenges of Healthcare Fraud in the US.
International Journal of Business and Social Science, 4, 1-4.
Dubai Health Authority (2014a). Health insurance mandate for Dubai healthcare providers. Dubai, UAE
Dubai Health Authority (2014b). Health Accounts System of Dubai, 2012. Dubai, UAE.
Dubai Health Authority (2014c). Health insurance law of Dubai – employers’ information pack. Dubai,
UAE.
Gionne D (1984). The effects of insurance on the possibilities of fraud. The Geneva Papers on Risk and
insurance, 32: 304-321.
Head GL & Kwok-Sze RW. Risk management for public entities. Malvern, Pa: Center for Advancement of
Risk Management Education, P 4-5.
Health Authority Abu Dhabi (2010). HAAD policy on health insurance fraud and abuse. Ref: HSF/FA/1.0.
Hyman D (2002). HIPPA and health care fraud: an empirical perspective. Cato Journal, 22, 151-178.
Kelly R (2009). Where can $700 billion be cut from the US health care system? White Paper, Thompson
Reuters. Ann Harbor: USA.
Levinson DR. Medicare Part B billing for Ultrasound. Washington DC: Department of Health & Human
Services.
56 | P a g e
Medicare Australia (2012). Compliance case studies, 2009-10. Canberra: Commonwealth of Australia.
Patel KK, West ML, Hernandez LM. Helping Consumers Understand and Use Health Insurance in 2014.
Institute of Medicine: Collaborative on Health Literacy and Access, Health Care Coverage, and Care of the
IOM Roundtable on Health Literacy, 29 May 2013.
Rudman WJ, Eberhard JS, Pierce W, Hart-Hester S. Healthcare Fraud and Abuse.
Perspectives Health Information Management. 2009; 6 (Fall): 1g. PMCID: PMC2804462.
Saksena P, Fernandes-Antunes A, Xu K, Musango L, & Carrin G (2011). Mutual health insurance in
Rwanda: Evidence on access to care and financial risk protection. Health Policy, 99: 203 – 209.
Smart Card Alliance (2011). Complementary Smart Card Guidance for the WEDI Health Identification
Card: Implementation Guide. NJ: Publication Number HCC-11002.
The World Bank (2006). Health Financing Revisited: a practitioner’s guide. Washington DC, World Bank.
US Department of Health and Human Services & Department of Justice (2014). Health Care Fraud and
Abuse Control Program Annual Report for Fiscal Year 2013. Washington DC.
57 | P a g e
Effect of Virtual Reality on Breast Cancer Patients
Rasha A. Al-Malik
Dar Alhekma university, Saudi Arabia
Wadee Alhalabi
King Abdulaziz University, Saudi Arabia
Effat University, Saudi Arabia
Abstract
Treatment of cancer disease depends heavily on patient’s psychology as well as clinical therapy. Victims of
Breast Cancer usually experience some common symptoms when they are exposed to chemotherapy
treatments as a part of its side effects. These symptoms could be depression, suspense, vomiting, nausea and
many others. Earlier literature reported that patients can control these symptoms if he or she believes so.
Imagery therapy is a well-known technique used to enhance patients' believe and boost his or her self-esteem
and confidence. This result in tremendous improvement in patient’s mind and inner feeling. Which clinically
improves the immune system. Imagery therapy is considered as a complementary psychological intervention
used in conjunction with conventional therapy. This kind of therapy creates a virtual world for cancer patients
to cope with their diseases and experience better life. Virtual Reality is a professional laboratory proven
method used as a tool to enable physicians and psychiatrists to lead their patients through huge obstacles of
depression during the treatment. Many VR environments and computer games were developed and tested to
enable health specialist help cancer patients in the treatment. This article discusses the effect of virtual reality
as one of the guided imagery techniques which distracts patients from stress and discomfort often associated
with chemotherapy. The paper shows how side effects such as nausea, vomiting, stress and severe pain are
alleviated. Some existing system are present herein, then we present our newly introduced system.
Keywords: Breast Cancer, Psychological Therapy, Guided Imagery, Computer Games, Virtual Reality
Introduction
Breast cancer's patients experienced depression, vomiting, nausea and suspense as a side effects for
being exposed to chemotherapy treatments. Consequently, physicians refer them to psychiatrists for
an assistance to create a vivid optimistic mental picture. This picture improves their inner feeling
and transfers patients to an enjoyable active lifestyle. We can split cancer treatments into two major
categories: conventional therapies and complementary therapies. The latter consists of different
therapeutic techniques one of them is imagery therapy. Imagination is the language used in human

58 | P a g e
mind and therapists believe that this healing instrument develop the ability of imagination which
have a great influence on the disease.
Many of cancer patients try to intercept with their inner feeling and inner body. This
interception could be achieved through a positive mental image. This method effectively controls
pain and other symptoms. Imagination of a huge army of white blood cells fighting cancer cells and
beating them, could be an example of positive imagination [2]. Many studies in this field confirm
that imagery therapy improves patient’s psychology and inner feeling, consequently boost the overall
patient health. In his study [1] Oyama reported that patients attempted to use imagery therapy as a
supplementary treatment beside cancer conventional therapies to support their immune system. The
author reported that VR technology is used to help patients accept their disease. The mental state of
cancer's patients changes step by step from denial of cancer to hope for a new cancer's treatment.
Sometimes patients retreat to suspicion of medical treatment and uneasiness regarding their future
life which result in irritation, depression then changed to acceptance and optimization.
The concept beyond imagery therapy is that it guides the human mind to gain comfort,
consequently enhances cure instead of fear and worry. All what patients has to do is to recollect
images that promote cure and lose of concentration on the disease. Virtual Reality and computer
games are considered as a tool to implement the imagery therapy effectively. It immerses the patient
in an environment full of attractions to gain concentration, this would provide patients with
emotional support and encourage them to practice an active lifestyle against cancer. Cancer patients
who are practicing an active positive lifestyle live longer than patients having negative lifestyle [1].
So, virtual reality and games are considered as an essential treatment for cancer patients, helping to
fix patient’s mental state and treating his or her neurosis [1] and [5].
Virtual Reality Therapy is one of the emerging and most effective applications, where
patients are exposed to stimuli in fully controllable environments. VR therapy has been successfully
implemented in various diseases, such as cancer (Figure 1,2),dentist (Figure 3) and phobia (Figure
4). Patients become immersed within a virtual environment, because he or she will have fewer
resources to focus on during the clinical examination or surgical operation. The idea is to recreate a
believable artificial environment that stimulates physical responses similar to those of a real
environment which can be individually controlled, replicated, and tailored to the patient’s
experiences. In some applications, patients see themselves engaging in various activities with virtual
people. In virtual reality, a user interacts with a computer-generated three-dimensional world
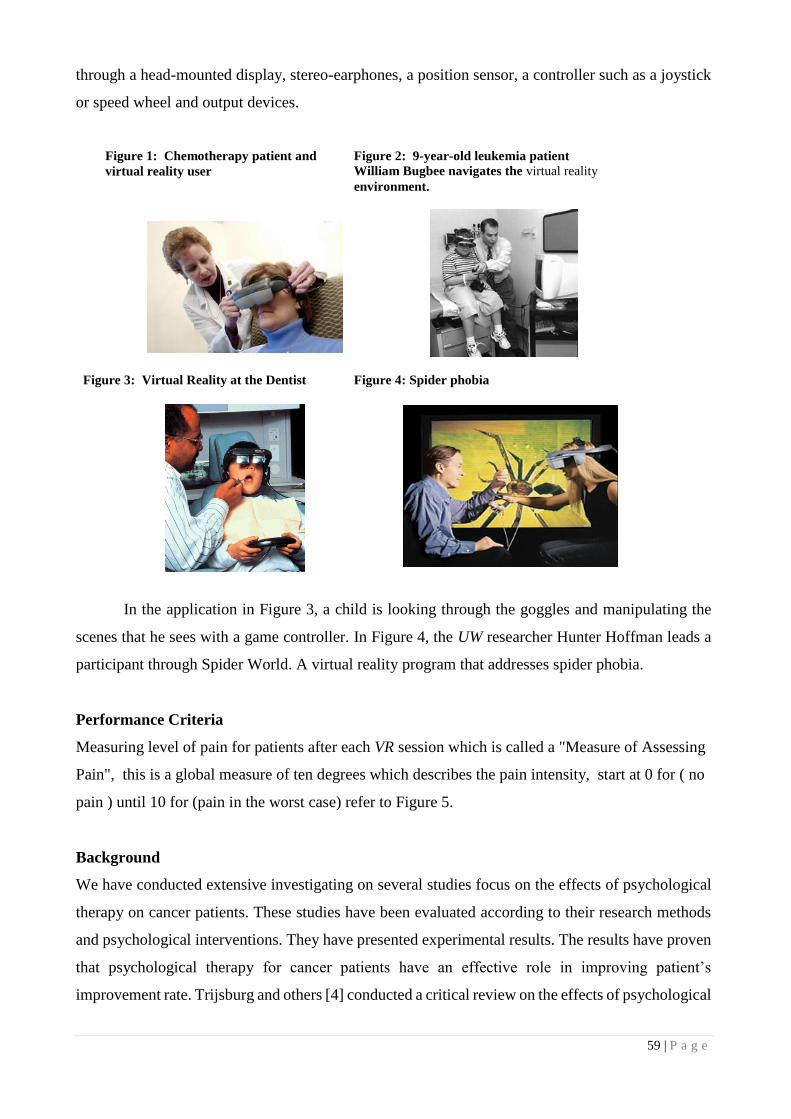
59 | P a g e
through a head-mounted display, stereo-earphones, a position sensor, a controller such as a joystick
or speed wheel and output devices.
Figure 1: Chemotherapy patient and
virtual reality user
Figure 2: 9-year-old leukemia patient
William Bugbee navigates the virtual reality
environment.
Figure 3: Virtual Reality at the Dentist
Figure 4: Spider phobia
In the application in Figure 3, a child is looking through the goggles and manipulating the
scenes that he sees with a game controller. In Figure 4, the UW researcher Hunter Hoffman leads a
participant through Spider World. A virtual reality program that addresses spider phobia.
Performance Criteria
Measuring level of pain for patients after each VR session which is called a "Measure of Assessing
Pain", this is a global measure of ten degrees which describes the pain intensity, start at 0 for ( no
pain ) until 10 for (pain in the worst case) refer to Figure 5.
Background
We have conducted extensive investigating on several studies focus on the effects of psychological
therapy on cancer patients. These studies have been evaluated according to their research methods
and psychological interventions. They have presented experimental results. The results have proven
that psychological therapy for cancer patients have an effective role in improving patient’s
improvement rate. Trijsburg and others [4] conducted a critical review on the effects of psychological

60 | P a g e
treatment on cancer patients. The authors reported that customized counseling has been shown to be
effective with respect to distress, self-concept, fatigue, and sexual problems. In her study [5],
Jacqueline Stenson reported that 70% of cancer victims use alternative therapies including dietary
supplements, acupuncture, hypnotism, massage therapy, guided imagery, magnets and biofeedback.
The author added that a recent study on more than 350 cancer patients indicates that breast cancer
group were the most likely to use imagery therapy and most of the respondents have improved their
health and mentality. The author reported that alternative medicine is widely used by people with
life-threatening diseases. She refers to a study conducted in Ohio State University-Columbus which
indicates that there is a strong sign to support that using imagery therapy improves the life quality
and in some situations it extend life expectations. Thus, cancer patients who used imagery therapy
when taking chemotherapy sessions felt that they became more relaxed, more ready for the
treatments and more positive than those who didn’t use this method. Rudolph [6] reported that she
has conducted a study on 80 women having an advanced breast cancer. The author used imagery
therapy to treat her patients and the result indicated that imagery therapy succeeded in improving
patient’s lifestyle and increase the number of cancer fighting cells. One of them is a study conducted
by Richardson and others [7], with the aim of comparing two group: imagery therapy and support
groups, in coping, life attitudes, immune function, quality of life, and emotional well-being after
breast cancer. 47 participants with breast cancer have been divided into three groups: Standard care
(N=15), Support group (N=16) and Imagery group (N=16).
Figure 5: Pain Assessment Scale Figure 6: Ben Duskin
Many thing have been measured in the study including: measuring improvement of immune
system, contains natural killer cell activity NK, plasma neopterin - a substance found in body fluids
and help to stimulate the immune system and other factors, the results were as follows:

61 | P a g e
For all women, interferon-gamma increased, neopterin decreased, quality of life improved,
and natural killer activity remained unchanged.
Comparing to the standard care group, the imagery therapy and support groups have
improvement in dealing with and tolerating the disease, and improvement in their views on the
meaning of life.
Comparing to support group, imagery participants have less stress, in addition to an
improvement in quality and functionality to their social life.
Another study conducted by Bakke, Purtzer, and Newton [8] in order to determine the
effectiveness of hypnotic-guided imagery on psychological well-being and immune function in
patients being treated for Stage I or II breast cancer. After 8-week imagery training program and at
3-month follow-up, NK cell number and activity, and psychological states were measured. The
results were reflected significant increases in improvement in depression and increase in absolute
number of NK cells, but these were not retained after the end of the treatment. Therefore, we can
note the positive impacts of hypnotic-guided imagery in the psychological state of patients even if
there were not retained after the treatment ended. Study by Kolcaba and Fox [9], to measure the
effectiveness of imagery therapy in improving and increasing the comfort feeling for women with
early stage breast cancer. 53 participants, aged (37-81), 80% European and 10% African American
with stage I or II breast cancer about to receiving radiotherapy. Participants were divided into two
groups:
26 participants in the experimental group, who were receiving imagery therapy through
listening to the audio recording once a day during the treatment period. 27 participants in the
control group.
The Radiation Therapy Comfort Questionnaire – around patients feeling regard to
radiotherapy – was conducted at three time points during the study:
Time 1 – before the intervention and the beginning of radiotherapy.
Time 2 – three weeks later. Or three weeks after time 1.
Time 3 – three weeks after completing radiotherapy.
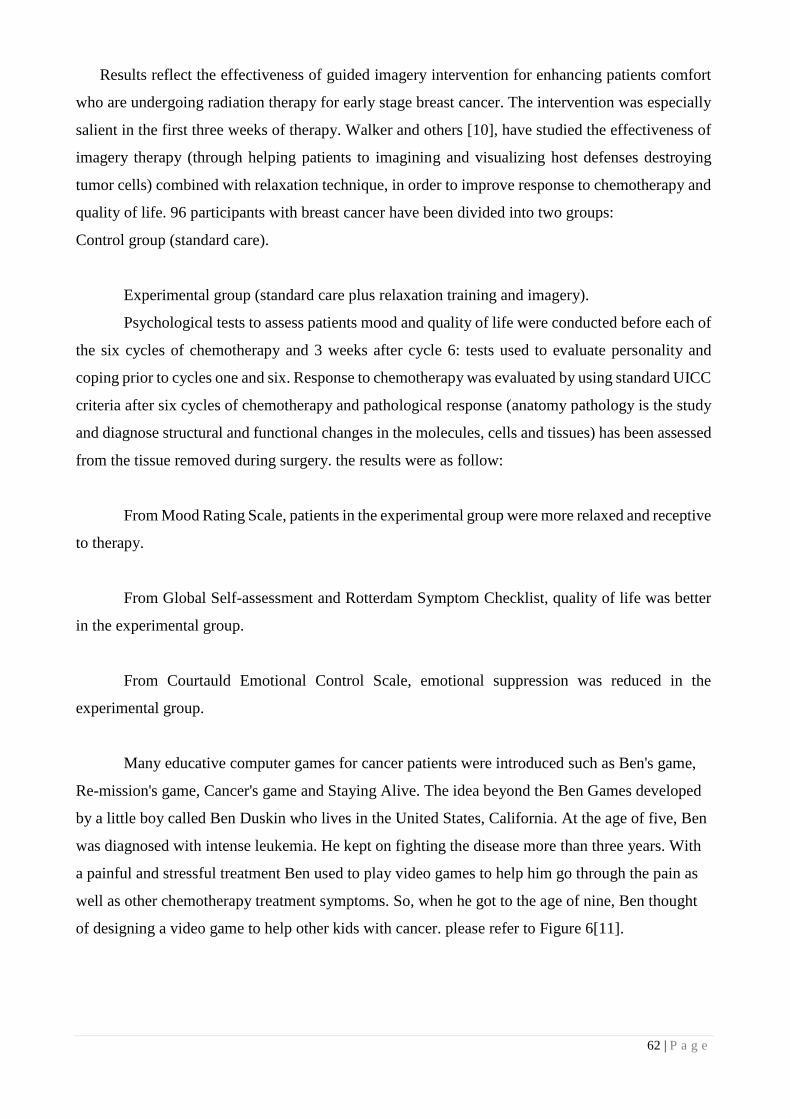
62 | P a g e
Results reflect the effectiveness of guided imagery intervention for enhancing patients comfort
who are undergoing radiation therapy for early stage breast cancer. The intervention was especially
salient in the first three weeks of therapy. Walker and others [10], have studied the effectiveness of
imagery therapy (through helping patients to imagining and visualizing host defenses destroying
tumor cells) combined with relaxation technique, in order to improve response to chemotherapy and
quality of life. 96 participants with breast cancer have been divided into two groups:
Control group (standard care).
Experimental group (standard care plus relaxation training and imagery).
Psychological tests to assess patients mood and quality of life were conducted before each of
the six cycles of chemotherapy and 3 weeks after cycle 6: tests used to evaluate personality and
coping prior to cycles one and six. Response to chemotherapy was evaluated by using standard UICC
criteria after six cycles of chemotherapy and pathological response (anatomy pathology is the study
and diagnose structural and functional changes in the molecules, cells and tissues) has been assessed
from the tissue removed during surgery. the results were as follow:
From Mood Rating Scale, patients in the experimental group were more relaxed and receptive
to therapy.
From Global Self-assessment and Rotterdam Symptom Checklist, quality of life was better
in the experimental group.
From Courtauld Emotional Control Scale, emotional suppression was reduced in the
experimental group.
Many educative computer games for cancer patients were introduced such as Ben's game,
Re-mission's game, Cancer's game and Staying Alive. The idea beyond the Ben Games developed
by a little boy called Ben Duskin who lives in the United States, California. At the age of five, Ben
was diagnosed with intense leukemia. He kept on fighting the disease more than three years. With
a painful and stressful treatment Ben used to play video games to help him go through the pain as
well as other chemotherapy treatment symptoms. So, when he got to the age of nine, Ben thought
of designing a video game to help other kids with cancer. please refer to Figure 6[11].

63 | P a g e
HopeLab organization have developed the “Re-mission's game” for different types of cancer
patients and specifically targeting teenagers. It consists of 20 levels and works on destroying cancer
cells and fighting extreme side effects. 375 cancer patients between the age of 13-29 enrolled in 34
medical center in the United States, Canada and Australia. Each of them were assigned to an
individual computer game loaded with popular games in addition to re-mission game. The research
resulted in making cancer patients have a full information on cancer and what happens inside their
bodies, also patients states have been improved clearly over time, please refer to Figure 7 [12].
The “Cancer game” was developed by Oda and Kristula. In this game patients visualize the
elimination of cancer cells, please refer to Figure 8 [13]. Many studies, which concerned with testing
virtual reality as a distraction tool, were conducted. In 1997 Kozarek and others [14], study the
ability of using virtual reality as a distraction tool to connect patients to the virtual environment.
With 50 participants who undergoing routine gastric laboratory procedures. 86% of participants
recalled to the effectiveness of the system.
In Japan 1998, Oshuga and others [14], developed virtual reality system "bedside wellness
system", which allows patients to walk around virtual forest while in bed. A number of screens with
corresponding sensors were distributed around bedside in order to carriage out images and sensations
(e.g., bird sounds, cool breezes) to patients. In addition, there was a foot devices for enhance and
control image's movement. 20 healthy subject have been participated in preliminary study employ
this system, and they suggested that the system helped them to relaxed. David and Alex [15]
presented a computer vision and virtual reality application which provides the tools for cancer
patients to allow for direct visualization and enables the user to easily control the environment at a
time when he or she is losing control of their lives. The author reported that visualization and imagery
boost the immune system to defend the body. David and Alex system which was dubbed "Staying

64 | P a g e
Alive" was able to provide some relaxation to patients which is an advantage in favor of the immune
system. Stress has been reported by scientists to retard the immune system [16]. Feldman and
Salzberg [17] shows that imagery reduces the stress and anxiety caused by cancer treatment. Similar
paper was presented by Decker and others [18] which supports Feldman and Salzberg in their
conclusion. In his paper [19], Siegal reported a great growing in the believe among people that
visualization and self-imagery technique influence the mind to encourage the body to make it realty
and truly defend the body from disease. Another fact was reported by Little in his work [20] that an
increase of 56% in the survival rate for cancer patient was achieved. "Staying alive" presents a
scenario in which patients can fight malignant cells and clear the environment while they are in the
blood stream.
Schneider and others [21] reported that when women use virtual reality intervention, they
have significant decreases in symptom distress, fatigue and anxiety. The authors conclude an
advantage of ease implementation in the clinical setting. In their work [22], Schneider and Hood
randomly selected their patients to receive the VR destruction intervention in one of the
chemotherapy treatment. 82% of the patients would like to use the VR system again. Patients feel
that the treatments were shorter which indicates a tolerable treatment. Schneider and others [23]
studies the VR intervention for older women with breast cancer. They study selected its participants
randomly to receive the VR distraction intervention during a chemotherapy treatment. The study
indicates that 100% of the participants were satisfied and would use the VR again. Participants
experienced no cybersickness. In another study Schneider and Workman [24] selected older children
to test the VR as a distraction intervention in chemotherapy. The main reason in attempting this
experiment was to describe the perceived effectiveness and feasibility of using VR as a distraction
intervention for older children in the age of 10-17, receiving chemotherapy. The study conclude that
82% of the children pointed out that chemotherapy treatment with VR was better than previous
chemotherapy treatment. 100% of the participants would like to use the VR again. The ease use of
the system which does not require previous experience or skill in any kind encourages patients to
participate the experiments. The study indicates that VR has the potential to enhance positive clinical
outcome.
Durham,n.c [25] described how chemotherapy patients eased their fatigue and discomfort by
solving a mystery and touring an art gallery. The goal of the study was to reduce anxiety, fatigue and
distress symptoms. In the study, women were asked to complete surveys about their symptoms
including distress, anxiety and fatigue level. The results showed that women who used virtual reality

65 | P a g e
during chemotherapy treatments reported significant decreases in symptom distress and fatigue level
immediately following the treatments. Moore R, Spiegel D in their study [26] explains that guided
imagery therapy is clearly not a cure for breast cancer, however it helps patients to feel as if they
have some sense of control over the progression of the disease in a situation that feels out of control.
It relieves pain as well. When VR is used with conventional medical treatment, imagery therapy
provides a noninvasive, inexpensive and necessary means of repairing this ruptured relationship
between the self, the body and the woman's social world by improving her lifestyle. Another study
conducted by Hoffman and others [13] supports the earlier research and proved that VR reduces pain
because it reduces the activity of centers which are responsible for sense of pain in the brain. This
effect could also be achieved by creating positive images.
Connecting patients with the outside world is a concern of Dr.Oyama [2]. The author reported
that treatment of cancer disease requires a long stay in the hospitals. This situation takes the patient
away from his family, relatives and friends. In this case, the patient may suffer from depression and
tumultuous. The author reported that we could use VR as a psychological treatment to connect
patients with the outside world. In the same paper the author added that the result of using the virtual
environment in the Kansi project in the nationality center hospital for tumors in Japan indicate that
patients who watch movies on different shows felt more relaxed. These patients use to forget reality
of being inside the hospital. It is also reduces side effects related to chemotherapy treatment such as
nausea, vomiting and stress.
Figure 9 Figure 10
Beating Cancer
At Umm Alqura University (UQU), we have developed a virtual reality software to enhance the
immune system and elevate pain. The system was dubbed "Imagery Way". It can be used for children
undergoing chemotherapy treatment as well as women suffering from breast cancer. Imagery Way
immerses patients in the environment and expected to attract children for the chemotherapy
66 | P a g e
treatment, because it changed the treatment session into an adventure. Figure (9, 10) give screenshot
for the Imagery Way. The system is in the development stage and was designed for breast cancer
and Acute Lymphoblastic Leukemia.
Conclusion
Usually, breast cancer victims suffer from stress, anxiety, fatigue and nausea as a result of the
diagnosis and treatment, which leads to poor response to chemotherapy, one of the most powerful
treatments that cancer patients may receive. Although chemotherapy may save patients, but it caused
heavy damage to their body. In addition, there are some patients could not bear such treatment and
complete it, because of fear. Thus, breast cancer patients may suffer from psychological problems in
addition to disease and treatment's pain. During the past years, the number of studies and research,
talking about psychological and social problems faced by cancer patients and their need of
psychotherapy, are increased. Psychotherapy has several methods, which varying depending on the
results of their effectiveness and impact, and how the patient accepts it. It has been found that the
distraction technique was one of the best psychotherapy methods, while it have the ability to attract
patients attention to things which was convenient to them. Imagery therapy is a kind of distraction
technique, which can relieve physical symptoms such as pain, fatigue, and distress, as well as
psychological symptoms such as uncomfortable feelings. Virtual reality considered to be one of the
successful imagery therapy methods that helps patients cope with chemotherapy, it's defined as a
way to immersed mind and body into a computer-generated environment in a naturalistic fashion.
Virtual reality is interactive, and it engages several senses simultaneously. This characteristics made
virtual reality to be one of the best distraction technique comparing with other such as humor and
relaxation therapy. Also, it is, as a distraction technique, provided a significant influence for breast
cancer patients in relieving chemotherapy symptoms side as distress and fatigue, and so facilitated
the completion of the treatment and overcome various stages of the disease.
References
[1] Spiegel D, Moore R, Imagery and hypnosis in the treatment of cancer patients, Oncology (Williston
Park), Aug;11(8):1179-89, 1997.
[2] Hiroshi Oyama, Virtual reality for palliative medicine, Ios Press: Amsterdam, Netherlands, 1998.
[3] Oyama H, Virtual reality for the palliative care of cancer, Stud Health Technol, Inform, 44:87-94, 1997.
[4] R. W. TRIJSBURG, F. C. E. VAN KNIPPENBERG, S. E. RIJPMA, Effects of Psychological
Treatment on Cancer Patients: A Critical Review, Psychosomatic Medicine 54:489-517, 1992.

67 | P a g e
[5] Jacqueline Stenson, http://www.chelationtherapyonline.com/PreventCancer/p55.htm
[6] Cindy Ann Rudolph, A study of the benefits of cancer patients engaging in complementary therapies,
December, 2002.
[7] Richardson MA, Post-White J, Grimm EA, Moye LA, Singletary-SE,-Justice-B, "Coping, life attitudes,
and immune responses to imagery and group support after breast cancer treatment.", Center for Alternative
Medicine Research, University of Texas-Houston-School-of-Public-Health,-USA.
[8] Bakke AC, Purtzer MZ, and Newton P, "The effect of hypnotic-guided imagery on psychological well-
being and immune function in patients with prior breast cancer.", Department of Pathology, Oregon Health
and Science University, Portland, OR 97201, USA. [email protected].
[9] Fox C & Kolacaba K, “The effects of guided imagery on comfort of women with early stage breast
cancer undergoing radiation therapy”, College of Nursing, University of Akron, Oncol Nurse, 1999 Jan-
Feb;67-72.
[10] Walker LG, Walker MP, Miller ID, and others, "Psychological, clinical and pathological effects of
relaxation training and guided imagery during primary chemotherapy.", Behavioural Oncology Unit,
University of Aberdeen, Medical School, Foresterhill, UK.
[11] http://express.howstuffworks.com/ep-ben-eric.htm
[12] Re-Mission™ Outcomes Study: A Research Trial of a Video Game Shows Improvement in Health
Related Outcomes for Young People with Cancer, 101 University Avenue, Suite 220 - Palo Alto, CA
94301-1638 hopelab.org.
[13] http://www.albright.edu/reporter/fall2003/games3.html
[14] Susan M. Schneider, PhD, RN, AOCN and others, "Virtual Reality as a Distraction Intervention for
Women Receiving Chemotherapy", CyberPsychology & Behavior ,Jun 2003, Vol. 6, No. 3 : 301 -307.
[15] Davide A.Becker & Alex Pentland, April 1997, ”Using A virtual Enviroment to Teach Cancer Patients
T'ai Chi, Relaxation and Self-Imagery”, MIT Media Laboratory.
[16] S. E. Sims. Relaxation training as a technique for helping patients cope with the experience of cancer: a
selective review of literature. Journal of Advanced Nursing, Sep 1987.
[17] H.C. Salzberg C. S. Feldman. The role of imagery in the hypnotic treatment of adverse reactions to
cancer therapy. J. S. C. Medical Association, May 1990.
[18] T. W. Decker, J. Cline-Elsen, and M. Gallagher. Relaxation therapy as an adjunct in radiation ontology.
Journal of Clinical Psychology, May 1992.

68 | P a g e
[19] Bernie Siegal. Love, Medicine, and Miracles: lessons learned about self-healing from a surgeon's
experience with exceptional patients. Harper and Row, 1986.
[20] Bill Little. Eight Ways to Take an Active Role in Your Health. Harold Shaw Publishing, 1994.
[21] Schneider SM, Prince-Paul M, Allen MJ, Silverman P, Talaba D, " Virtual reality as a distraction
intervention for women receiving chemotherapy." Oncology Nursing Forum – 2004 Feb – Vol. 31, No 1,;
81-8.
[22] Schneider, S. M. & Hood, L. E, "Virtual reality: a distraction intervention for chemotherapy."
Oncology Nursing Forum, v2007 Feb -Vol. 34, no. 1, pp. 39-46.
[23] Susan M. Schneider, Mathew Ellis, William T. Coombs, Erin L. Shonkwiler, Linda C. Folsom, "
Virtual Reality Intervention for Older Women with Breast Cancer" Mary Ann Liebert, Inc Publisher, 03,
6(3): 301-307
[24] Susan M. Schneider, M.L. Workman, "Virtual Reality as a Distraction Intervention for Older Children
Receiving Chemotherapy." Pediatric Nursing, Nov-Dec, 2000: 593-597
[25] DURHAM,N.C, ”Virtual Reality Helps Breast Cancer Patients Cope with Chemotherapy”, ,Jan
29,2004, Duke University School of Nursing and Case West Reserve Comprehensive Cancer Center.
[26] Moore R, Spiegel D, 1999, "Uses of Guided Imagery for Pain Control by African-American and White
Women with Metastatic Breast Cancer", Integrative Medicine Consult. 1999; 2(2/3): 115-126.

69 | P a g e
Green Economy - Carbon Dioxide: From Pollution to Solution: Dubai’s Paradigm Shift for Carbon Capture & Storage (CCS) and Utilization of Carbon Dioxide
Rashed Karkain
Hamdan Bin Mohammed Smart University, UAE
Abstract
This research paper is intended to assess the quantity of the present CO2 emissions from United Arab Emirates
(UAE) and compared to the other regions of the World. Accordingly, the paper will further support the
argument of opportunities of CO2 as a renewable energy and is in-line with UAE’s Green Economy initiatives.
This focuses on Carbon Capturing and Storage (CCS) technologies, global viewpoint as well as available
innovative technologies with solutions for CCS.
The study will also identify few potential opportunities as sources of CO2 emissions for immediate
implementation of CCS in the Emirate of Dubai. It raises the awareness for the importance of the CCS and
few promising pathways for utilization of CO2
Keywords: Carbon Capture and Storage; CO2 as Renewable Energy; Green Economy
Introduction
For years, Middle East and Gulf Countries have been looking into Carbon Dioxide (CO2) as a
pollutant or Greenhouse Gas (GHG) that contributes to Global Warming. However recent approach
towards climate change provides the ground and necessitates for a change of paradigm from
consumption to conservation in the region.
Globally there is a major change in paradigm towards utilization of CO2. “The increase in
CO2 emissions from fossil fuel burning and those arising from land use change are the dominant
cause of the observed increase in atmospheric CO2 concentration” (IPCC, 2011).
This paper will carry out an analysis of current and future of CO2 from global perspective
and a change in paradigm of CO2 to a renewable energy, rather than a pollutant. Accordingly it will
conclude Dubai’s future opportunity for alternative uses of CO2, which is also known as a renewable
energy. In fact it’s the only renewable energy that is available everywhere.

70 | P a g e
Green Economy
The Carbon Capturing and Storage (CCS) initiative is also within the framework of Dubai’s Green
Economy for Sustainable Development. "We liked to launch this national initiative (Green
Economy) to coincide with the World Future Energy Summit held in Abu Dhabi and attended by
delegations from 140 countries to reaffirm our commitment to the world that we seek hard to
diversify energy sources and preserve the environment so as to be a model for all countries that seek
to achieve the same goal” (H.H. Sheikh Mohammed Bin Rashid, 2012). The Green Economy
Initiative includes six major tracks as follow:
The first track aims to promote renewable energy, clean fuels and energy efficiency usage.
The second track intends to encourage investments in green economy and green technologies
and to create job opportunities for UAE citizens.
The third track, concerning the green city, includes urban planning, sustainable
transportation, and clean air initiatives
The fourth, dealing with climate change, aims to reduce carbon emissions, encourage organic
agriculture and preserve biodiversity.
The fifth track is set to rationalize the use of water and energy resources, encourage recycling
and raise environmental awareness.
The sixth track, on green technology, will focus on carbon capturing and storage technologies
plus generating energy from waste.
This research paper is therefore directly in line with track 6 of UAE’s Green Economy as
well as indirect but effective contribution to tracks 1, 2, 3 and 4.
Literature
In Dubai, CO2 is being generated and emitted into ambient air from variety of sources such as Power
Plants, Industrial Activities, Municipal Solid Waste Landfills as well as Sewage Treatment Plants.
Although Caron Credit provides the ground for minimizing the emissions, urbanizing cities like

71 | P a g e
Dubai will always have sources of CO2 emissions. Therefore there is a need in change of paradigm
from pollution to opportunity and to solutions.
“Capture of CO2 can be applied to large point sources. The CO2
would then be compressed
and transported for storage in geological formations, in the ocean, in mineral carbonates,
or for use in industrial processes” (Metz, Davidson, de Coninck, Loos, Meyer, 2011).
This concept is further channeled down to Human Behaviour. Dubai has an opportunity to
adopt a change in Paradigm of Human Behaiour on how to treat and respect the environment and
nature. “Another way of putting this is that humans are part of nature” (Luckett, 2004). “Human
activities are continuing to affect the Earth’s energy budget by changing the emissions and resulting
atmospheric concentrations of radiatively important gases and aerosols and by changing land surface
properties” (IPCC a5, 2011).
United Arab Emirates is one of the major Oil producer (refer to Table 1) and main exporters
within OPEC group, having an Oil Reserves of 97.8 Billion Barrels, equivalent to 8.1% of OPEC
Shares (refer to Graph 1). Fossil fuels are major source of emitting CO2 into ambient air. “The
amount of carbon the world can burn without heading for dangerous levels of global warming is far
less than the amount of fossil fuels left in the ground” (Fiona Harvey – The Guardian)1. “CCS
technologies have the potential to capture 90% of carbon dioxide (CO2) emissions from fossil fuel
power plants, enabling cleaner coal generation” (Carbon capture and storage - an answer to global
carbon emission concerns, 2012).
Table 1: United Arab Emirates Crude Oil Production by year2.
year production change
1980 1,709.00 NA
1981 1,474.00 -13.75 %
1982 1,250.00 -15.20 %
1983 1,149.00 -8.08 %
1984 1,146.00 -0.26 %
1985 1,193.00 4.10 %
1986 1,330.00 11.48 %
1987 1,541.00 15.86 %
1988 1,565.00 1.56 %
1989 1,860.00 18.85 %
1990 2,117.00 13.82 %
1991 2,386.00 12.71 %
1 http://www.theguardian.com/ 2 United Arab Emirates Crude Oil Production by year.
http://www.indexmundi.com/energy.aspx?country=ae&product=oil&graph=production (accessed 26 December 2013).

72 | P a g e
1992 2,266.00 -5.03 %
1993 2,159.00 -4.72 %
1994 2,193.00 1.57 %
1995 2,233.00 1.82 %
1996 2,277.65 2.00 %
1997 2,316.43 1.70 %
1998 2,345.30 1.25 %
1999 2,169.00 -7.52 %
2000 2,367.83 9.17 %
2001 2,205.00 -6.88 %
2002 2,082.00 -5.58 %
2003 2,348.14 12.78 %
2004 2,478.26 5.54 %
2005 2,535.43 2.31 %
2006 2,635.70 3.95 %
2007 2,602.59 -1.26 %
2008 2,681.02 3.01 %
2009 2,412.55 -10.01 %
2010 2,414.66 0.09 %
2011 2,679.18 10.95 %
2012 2,803.61 4.64 %
Graph 1: OPEC Share of World Crude Oil Reserves 20123
3 OPEC Share of World Crude Oil Reserves 2012. http://www.opec.org/opec_web/en/data_graphs/330.htm (accessed
26 October 2013).

73 | P a g e
“Carbon dioxide (CO2) capture and storage (CCS) is a process consisting of the separation
of CO2 from industrial and energy-related sources, transport to a storage location and long-
term isolation from the atmosphere.” (Metz, Davidson, de Coninck, Loos, Meyer, 2011).
According to the International Energy Agency (IEA), more than 70% of world’s electricity is being
generated using fossil fuel, which is main source of CO2 generation and emission into ambient air.
IEA (2009) further indicates that in Middle East and North Africa region, more than 41% of total
carbon emission is produced from power plants where electricity is generated and heat production
facilities.
As per graph 2, UAE stands amongst top five contributors to carbon emission in the region.
“CO2 increased by 40% from 278 ppm circa 1750 to 390.5 ppm in 2011” (IPCC, 2011).
Graph 2: Total in Million Tons of CO2 Emissions, 20094
It’s therefore essential the CO2 emissions are limited. This can be done by minimizing
human-related activities that results into production and release of CO2 into atmospheric. There are
possibilities that in there will be a need for removal of CO2 from ambient air. Therefore capturing,
4 http://www.carboun.com/wp-content/uploads/2012/11/Breakdown-of-Total-CO2-Emissions-by-
Sector-for-Middle-East-and-North-African-Countries3.png

74 | P a g e
transportation and storage of CO2 will be inline with objectives of reduction of such and
opportunities for reusability.
Image 1: An individual Country’s share of total global carbon emissions5
According to Carboun Website6 and as shown in Image 1 above, “the Arab world, which
constitutes 5% of the world’s population, emits just under 5% of global carbon emissions, and except
for Saudi Arabia, no single Arab country is responsible for more than 1% of global emissions. The
energy use of an average Arab person is still below the world average and less than half that of an
average European”. “To minimize the risks induced by climate change, specially the atmospheric
concentration of CO2 should be stabilized, probably at not exceeding twice the preindustrial level”
(Zwaan, Smekens, 2009).
However, one might be cautious as “Storing CO2 underground can acidify water in the
geological layer” (Zwaan, Smekens, 2009).
Government supports in forms of finance are essential parts of success and sustainability of
CCS, as current framework of CCS might not be financially feasible or self-generating revenue
projects. And in order to meet the emission reduction targets.
“Support plans generally have three main goals: reduce carbon emissions and prevent
climate change; improve energy security by diversifying the energy mix; and foster growth
by promoting competitiveness, job creation, and innovation in new industries” (Eyraud,
Clements, 2012)
5 http://www.carboun.com/category/carbon-emissions/
6 http://www.carboun.com/category/carbon-emissions/

75 | P a g e
“In Germany, for example, the Federal Ministry of Education and Research has recently
earmarked 100 million Euro for Technologies for Sustainability and Climate Protection –
Chemical Processes and use of CO2, with the objectives of lowering dependency on crude
oil and natural gas, using CO2 as a raw material, doubling energy productivity by 2020,
and reducing CO2 emissions by up to 40% by 2020” (Ondrey, 2013).
“China has become the third bioethanol producer, after the United States and Brazil, with
the production of bioethanol reaching 1.043 Mt in 2007” (Li, Wang, & Shen, 2010).
As per the article from Carbon capture and storage - an answer to global carbon emission
concerns (2012), “Three projects are currently being supported through the Masdar project: Emirate
Steel Industries, Emirates Aluminium CCS and Hydrogen Power Abu Dhabi”
Graph 3: Worldwide Energy Use by Energy Type7
Graph 3 indicates further indicates a change in paradigm in utilization of renewable energy
compared to other fuels. We can observe that globally renewable energy usage is expected to
dramatically increase by year 2025.
Available Technologies:
7 http://www.hydrogenambassadors.com/background/worldwide-energy-use-by-energy-type.php

76 | P a g e
“Emerging technologies in CCS can be carbonate-based systems, aqueous ammonia,
membranes, sorbents, metal organic frameworks, enzyme based system, and ionic liquids,
among others” (Carbon capture and storage - an answer to global carbon emission
concerns, 2012).
Promising pathways for the utilization of CO2
Polymer processing
Methane and Methanol production by using renewable energy sources
Enhanced Oil Recovery
Food processing, preservation and packaging
Beverage Carbonation
Coffee Decaffeination
Pharmaceuticals
Horticulture
Fire suppression
Winemaking
Pulp and Paper processing
Water treatment
Inerting
Graph 4: “Different pathways for utilization of CO2” (DNV, 2011)
As shown in Graph 4, “The recoverable energy density that would be available via the
combustion of methanol, ethylene, or methane, or the use of formic acid in fuel cells, is higher than
conventional energy storage technologies” (DNV, 2011).

77 | P a g e
Graph 4. “Products created from electrochemical CO2 conversion processes have
significantly more energy density than other energy storage technologies” (DNV, 2011).
Advantages
Reduced dependence from classical carbon sources (fossil fuels)
CO2 reduction to ambient air
Disadvantages
Generally, purification is required
Thermodynamically and kinetically demanding challenge
Overall energy balance, process and product specific
Competition with established products
Image 3: New Investment in Clean Energy by Region8
8 http://cleantechnica.com/2013/07/08/gulf-cooperation-councils-renewable-energy-targets-
considerable-or-weak/

78 | P a g e
Summary
“Reduction of CO2 emissions can be realised by means of a diverse portfolio of options covering
energy and material efficiency improvements, afforestation, increased use of renewable and nuclear
energy and decrease of the carbon intensity of fossil fuels” (Damen, André Faaij, & Turkenburg,
2006).
“CCS technology – also referred to as Carbon Capture and Sequestration, is an answer to
global carbon emission concerns, as it prevents the release of large amounts of CO2
emissions into the atmosphere from fossil fuel power plants” (Carbon capture and storage -
an answer to global carbon emission concerns, 2012).
Large point sources of CO2 include large fossil fuel or biomass energy facilities, major CO2
-emitting industries, natural gas production, synthetic fuel plants and fossil fuel-based hydrogen
production plants
Recommendations
To sustain is to increase the efficiency. “CO2 increased by 40% from 278 ppm circa 1750 to 390.5
ppm in 2011” (IPCC, 2011). “The increase in CO2 emissions from fossil fuel burning and those
arising from land use change are the dominant cause of the observed increase in atmospheric CO2
concentration” (IPCC, 2011).
A smart CO2 management can be summarized in Avoiding, Usage and Storage. Dubai has
an opportunity to shift the paradigm of CO2 From Pollution to Opportunity to Solution and to
establish Environmental Ethics Paradigm both a private as well as public sectors. Additionally,
Dubai can focus in forecasting the future sources of CO2 and analyze divers Qualities of carbon
dioxide. In depth analysis of current and future CO2 market size, as well as drivers are also
essential towards understanding the constraints of CO2 demand.
Domains of Concern
Dubai’s Paradigm Shift for Carbon Capture & Storage (CCS) and Utilization of Carbon
Dioxide requires attention from two different sets of domains as follow:
Key Player Domain
“All the three phases – capture, transport and storage requiring key players from different
domains, have taken initiatives for the deployment of CCS technology in the power sector”
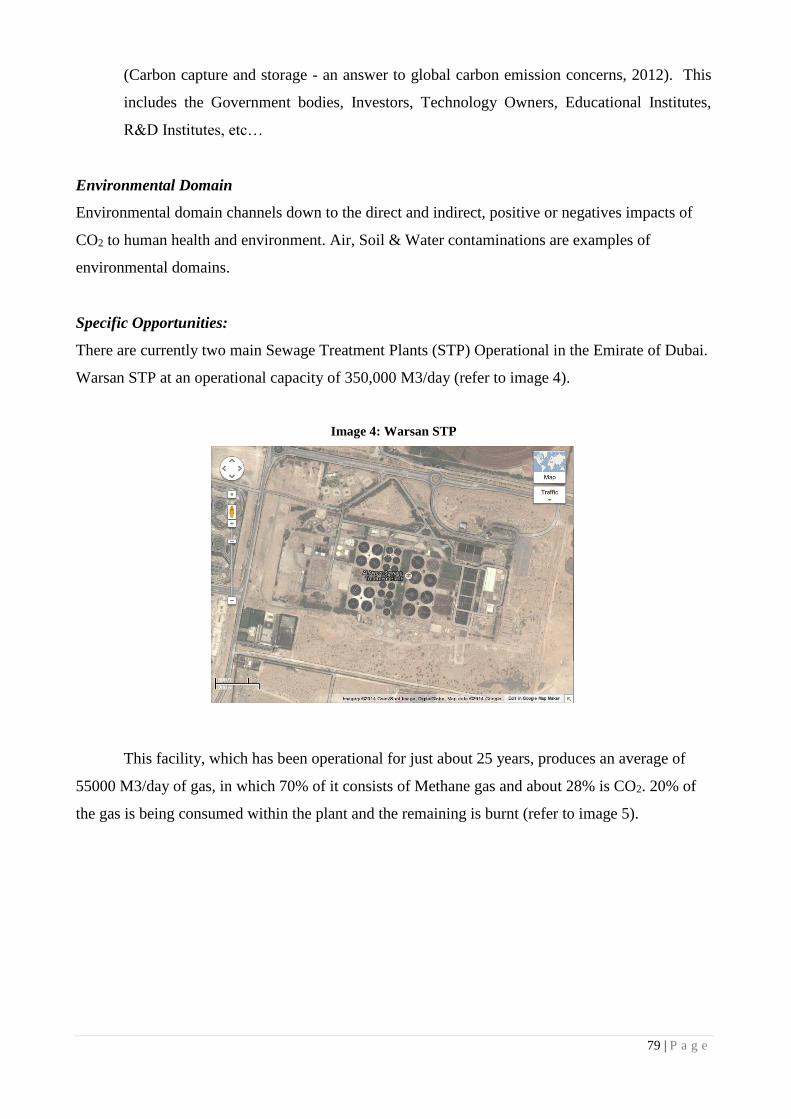
79 | P a g e
(Carbon capture and storage - an answer to global carbon emission concerns, 2012). This
includes the Government bodies, Investors, Technology Owners, Educational Institutes,
R&D Institutes, etc…
Environmental Domain
Environmental domain channels down to the direct and indirect, positive or negatives impacts of
CO2 to human health and environment. Air, Soil & Water contaminations are examples of
environmental domains.
Specific Opportunities:
There are currently two main Sewage Treatment Plants (STP) Operational in the Emirate of Dubai.
Warsan STP at an operational capacity of 350,000 M3/day (refer to image 4).
Image 4: Warsan STP
This facility, which has been operational for just about 25 years, produces an average of
55000 M3/day of gas, in which 70% of it consists of Methane gas and about 28% is CO2. 20% of
the gas is being consumed within the plant and the remaining is burnt (refer to image 5).

80 | P a g e
Image 5: Warsan STP Flare
Also Jebel Ali Sewage Treatment Plant, with an operating capacity of 260,000 M3/day,
operating since 2009 (Image 6), produces about 12,000 M3/day of gas, in which 70% is Methane
gas and 18% CO2. This gas is also flared (refer to image 7).
Image 6: Jebel Ali STP
Image 7: Jebel Ali STP Flare

81 | P a g e
Both these facilities have a great opportunity to shift the paradigm of CO2 from pollution to
solution, by implementing any of the best practices in Carbon Capture and Utilization projects.
Other Opportunities:
Power Plant’s Emissions and CCS
Municipal Solid Waste CCS
Industrial Activities CCS
References
Luc Eyraud, Benedict Clements (June 2012). Goring Green. Finance & Development.
Ondrey, G. (2013). CO2 UTILIZATION. Chemical Engineering, 120(7), 16-19. Retrieved from
http://search.proquest.com/docview/1428438613?accountid=33317
DNV. (2011). Carbon Dioxide Utilization Electrochemical Conversion of CO2 – Opportunities and
Challenges. DNV.
Li, H., Wang, L., & Shen, L. (2010). Potential CO2 emission reduction by development of non-grain-based
bioethanol in china. Environmental Management, 46(4), 555-64. doi:http://dx.doi.org/10.1007/s00267-009-
9418-1
Carbon capture and storage - an answer to global carbon emission concerns. (2012). (). London: Global
Data Ltd. Retrieved from http://search.proquest.com/docview/1112868831?accountid=33317
Luckett, S. (2004). Environmental paradigms, biodiversity conservation, and critical systems thinking.
Systemic Practice and Action Research, 17(5), 511-534.
Yan, d. Z., & Smekens, K. (2009). CO2 capture and storage with leakage in an energy-climate model.
Environmental Modeling & Assessment, 14(2), 135-148. doi:http://dx.doi.org/10.1007/s10666-007-9125-3
Damen, K., André Faaij, & Turkenburg, W. (2006). Health, safety and environmental risks of underground
CO2 storage - overview of mechanisms and current knowledge. Climatic Change, 74(1-3), 289-318.
doi:http://dx.doi.org/10.1007/s10584-005-0425-9
82 | P a g e
Detection of Cryptosporidium and Giardia in irrigation water of public parks in Dubai, United Arab Emirates
Munawwar A. Khan
Zayed University, UAE
Hessa S.S. Alkitbi
Zayed University, UAE
Alia A.A. Aljanahi
Zayed University, UAE
Rania Dghaim
Zayed University, UAE
Abstract
Purpose: In this study occurrence of Cryptosporidium and Giardia in irrigation water of selected public parks
in Dubai was evaluated.
Significance: The irrigation water used in the public parks is subject to contamination by Cryptosporidium
and Giardia, with potential hazards to the public health. The transmission of protozoan parasite infections
due to using of contaminated water has been reported in several countries. Therefore, it is essential to develop
a systematic monitoring and evaluation of irrigation water quality, both at the wastewater treatment plant
and at the end point of use such as irrigation systems of public parks to ensure compliance to existing water
quality guidelines.
Methods: The sampling of irrigation water from three public parks located in the emirate of Dubai was
performed twice a week over a period of one month during April-May, 2013. In total, 23 samples (6 irrigation
water samples from each park and 5 post chlorinated water samples from the sewage treatment plant) were
collected. A100 FLK Aqua-Glo G/C Direct Comprehensive Kit (Waterborne, Inc., New Orleans, LA) was
used to detect Cryptosporidium oocysts and Giardia cysts.
Results: The results have shown that seventeen out of 18 irrigation water samples (94.4 %) were positive for
Cryptosporidium and 7 samples (38.6 %) were positive for Giardia. All five samples collected from the
irrigation water source (i.e. post chlorination stage at sewage treatment plant) were found positive for
Cryptosporidium whereas, only one sample detected Giardia. Cryptosporidium oocysts were found to be in
the higher range (3-25 oocysts per liter) than that of Giardia cysts (1-6 cysts per liter).
Conclusion: In conclusion, the majority of the irrigation water samples were found contaminated with
Cryptosporidium oocysts, whereas a number of them were found positive for Giardia cysts. It is evident that
the protozoans are surviving the wastewater disinfection method of chlorination and in the public parks

83 | P a g e
irrigation network system. Therefore, regular monitoring of the irrigation water for protozoan parasites and
controlling their growth at the point of end use of treated wastewater are critical to reduce the risk of
environmental contamination with Cryptosporidium oocysts and Giardia cysts.
Keywords: Cryptosporidium oocysts; Giardia cysts; irrigation water; public parks
Introduction
Cryptosporidium and Giardia are protozoan parasites recognized as important waterborne disease
pathogens and are quite prevalent in various types of water environments (Sato et al. 2013; Xiao et
al., 2013). Their presence in water systems makes it essential to develop preventive strategies for
water and food safety (Lobo et al., 2009). These strategies are strongly linked to the unique features
of the parasites, which often make them remarkably suited for survival in the environment and
dissemination by water. Thus, both Cryptosporidium and Giardia have transmissive stages, that is,
oocysts and cysts, respectively, which are immediately infectious when excreted in faeces, and can
be transmitted by person-to-person or animal-to-person contact. (Oo)cysts are highly resilient to
environmental stress and standard water treatment technologies (Lobo et al., 2009). In the past,
several studies reported the presence of Cryptosporidium and Giardia in both raw and treated water
samples (Gennaccaro et al., 2003; Lobo et al., 2009). These studies indicated that Cryptosporidium
parvum, protozoan parasite, is a potential contaminant of reclaimed water and has been found to be
persistent in the environment and resistant to chlorination (Gennaccaro et al., 2003). A study in Italy
reported that chlorine-based disinfection tools cannot destroy the resistant stages of protozoan
parasites Giardia and Cryptosporidium; however, membrane ultrafiltration technology can
effectively remove Giardia and Cryptosporidium in the final filtered water (Lonigro et al., 2006).
The provision of fresh water supply to meet the country’s domestic, agricultural and
industrial needs became one of the greatest challenges that face the UAE (AlAmimi et al., 2014).
Recycled water generated after wastewater treatment process plays an important role as an additional
source of freshwater that would save the production of potable water. Nowadays, in the UAE,
wastewater goes through tertiary treatment to reduce the concentration of bacteria that is found in
secondary treated effluent (Al Ajmi et al., 2009). The use of reclaimed water in the UAE is limited
for irrigation of landscape areas, parks and streets in major cities, and most of the recycled water is
discharged in the sea. The recycled water is not used for agricultural irrigation purposes. This is
mainly due to concerns over health and environmental hazards, as well as public and social
approaches to the use of crops irrigated by recycled water (Al-Zubari, 1998). The presence of

84 | P a g e
pathogenic microorganisms in reclaimed water used for irrigation creates potential health hazards
for the exposed human population (Alonso et al., 2006). There are several possible routes of exposure
to pathogens in reclaimed water, such as (a) the consumption of drinking water and vegetable
products contaminated by reclaimed water and (b) the exposure to aerosols generated during spray
irrigation with reclaimed water (Yates, 1997).
In several countries, there are no requirements for testing recreational water and reclaimed
wastewater for the presence of Cryptosporidium and Giardia (Castro-Hermida et al., 2010). A
similar practice is common in the United Arab Emirates. In general, there are several categories of
very well maintained public parks in Dubai, which are expanding due to extensive development and
urbanization (AlAmimi et al., 2014). These public parks are irrigated by treated wastewater therefore
the risk of irrigated soil contamination by Cryptosporidium and Giardia can increase. Investigating
the occurrence of Cryptosporidium and Giardia in the irrigation water used in public parks is very
important to know whether the wastewater treatment methods utilized by the concerned
municipalities are adequate to reduce the occurrence of protozoan parasites. This study aimed at
collecting preliminary data on the occurrence of Cryptosporidium and Giardia in the irrigation water
of selected public parks in the emirate of Dubai.
Objectives
The purpose of this study is to investigate the quality of water used for irrigation purposes in Dubai
with respect to the occurrence of microbial parasites including Cryptosporidium spp. and Giardia
spp. This study evaluates if reclaimed water that is used for irrigation of public parks in Dubai could
be a source of threats or hazards for public health and environmental quality.
Methods
A prior approval for collecting irrigation water samples from selected public parks in Dubai was
obtained from Dubai Municipality (DM ) and concerned sections such as Drainage and Irrigation
Network Department, Sewage Treatment Plant Department and Public Parks and Horticulture
Department. Three public parks (Park-A, B and C) were selected along with the irrigation water
source, the Dubai STP (Sewage Treatment Plant) located in Al-Aweer area in Dubai. Park A was
nearest to the STP, park B was the farthest and park C was located in between park A and B.
The irrigation water sampling of these three public parks was performed twice a week over
a period of one month during April-May, 2013. Water samples were collected in pre-sterilized bottles

85 | P a g e
of 1 L. All samples were transported in refrigerated boxes with ice bags to the laboratory within one
hour of sampling. In total three points within each public park were chosen for sampling. At each
point duplicate samples (water) were collected. These three sampling points were: the storage or
reservoir tank (the first point of receiving irrigation water from the STP) in the park and two samples
each from a separate irrigation network pipe within the park. During every visit, duplicate samples
were collected from the STP disinfected effluent after the post-chlorination stage (the source of
irrigation water to the parks). In total, 23 samples (6 samples from each park and 5 from the sewage
treatment plant) were collected.
In order to detect Cryptosporidium oocysts and Giardia cysts, A100 FLK Aqua-Glo G/C
Direct Comprehensive Kit (Waterborne, Inc., New Orleans, LA) was used. The kit manufacturer's
protocol was used for the analysis of irrigation water samples for the detection of both parasites
(Zilberman et al. 2009).
Results
The results are summarized in the table 1. This study showed that 95.6% (22/23 samples) of the
tested water samples from the STP and parks were contaminated with Cryptosporidium oocysts
whereas only 35% (8/23 samples) samples were found positive for Giardia cysts. Figure 1 shows
detection of Cryptosporidium oocysts and Giardia cysts by direct immunofluorescence technique.
Table 1. Detection of Cryptosporidium & Giardia in irrigation water samples from three public parks and STP
(source) by direct immunofluorescence technique.
Protozoan parasite Water samples from
source (STP*)
n= 5
Percent (%) Irrigation water
samples
n=18
Percent (%)
Cryptosporidium 5 100 17 94.4
# of Cryptosporidium
oocysts range
(per liter)
2-4 - 5-25
-
Giardia 1 20 7 38.6
# of Giardia cysts range (per
liter)
0-3 - 1-6 -
*STP= sewage treatment plant (post chlorination stage)
Figure 1. Immunofluorescence image/s of Cryptosporidium oocysts labelled by fluorescent antibodies (A) bright
apple green colour viewed under the fluorescein filter, (B) Giardia cysts labelled by fluorescent antibodies.

86 | P a g e
Discussion
In this study, Cryptosporidium oocysts were found to be in higher range (2-25 oocysts per liter) in
the tested irrigation water samples than the Giardia cysts (1-6 cysts per liter) and that could be due
to actual low occurrence of Giardia cysts in reclaimed water. All five water samples from the STP
which was the source of reclaimed water distributed to the public parks were found positive for
Cryptosporidium oocysts, indicating that the reclaimed water used for irrigation parks was
contaminated by this parasite from the source. On the other hand, only one water sample out of 5
from the STP was found positive with Giardia cysts, however, different irrigation network sites
within 3 parks were found positive for same parasite. In other words, the presence or absence of
parasites in the irrigation water was not correlated to the source of contaminated irrigation water.
The reservoirs or irrigation network pipes of the parks could also be contaminated by other potential
sources. Cryptosporidium oocysts and Giardia cysts were observed in most of the water samples and
their numbers were possibly underestimated in this study. This is probably due to the amount of
water samples that collected were not enough as more and larger volumes of reclaimed water
samples should have been collected to give more precise results as suggested in earlier studies (Lobo
et al., 2009; Lonigro et al., 2006).
In this study, one of the public parks (park-B) tested for irrigation water microbial quality
was located far from the STP which was the source of reclaimed water used for irrigation of public
parks as compared to the park A and park C. Nevertheless, the nearest park to the STP was found
with higher number of Giardia cysts as compared with the parks located at more distance from the
STP. The pH of all tested water was found within the range of 6.0-7.0 with an average of all samples
6.57 which is within the recommended range 6-8 from the Dubai Municipality (DM). As per DM
the acceptable microbiological limits of treated wastewater for restricted and unrestricted irrigation
is generally based on protozoal vesicle of 1 > mg/L for maximum limits for restricted irrigation but
there is no set value for unrestricted irrigation (Dubai Municipality, 2011). Therefore, only a few
standards and criteria have been established in Dubai for the determination of the microbiological
quality of reclaimed water used for irrigation except for general criteria for E. coli and fecal

87 | P a g e
coliforms. Even the microbiological standards used by well-known organization such as US-EPA
have not specifically described the regular monitoring for presence of Cryptosporidium oocysts and
Giardia cysts in the reclaimed water (US-EPA, 2012).
According to Dubai municipality representative only fecal coliforms laboratory test is
conducted weekly and the result of this test can determine the concentration of chlorine used for the
disinfection of treated water. As of now, there is no requirement for the detection of parasites by the
laboratory testing the treated effluent in wastewater treatment facilities in the UAE. The monitoring
for protozoan parasites including Cryptosporidium has been included recently in the state of Florida
in the USA once every 2 years for larger facilities and once every 5 years for smaller facilities (US-
EPA, 2012). Sampling is also recommended at a single point following disinfection (Gennaccaro et
al., 2003). In this study, the laboratory analysis of the STP water samples indicated the presence of
Cryptosporidium oocysts in all the samples whereas only one sample was found positive for the
presence of Giardia cysts. The samples with fewer number of Giardia cysts in the water samples
could be due to their low numbers in the wastewater or their significant reduction due to chlorination.
The presence of protozoans parasites (especially Cryptosporidium) in most of the treated effluent
could be strongly related to their resistance to the chlorination process at the treatment plant as
described in a previous study (Lobo et al., 2009).
In this investigation, Cryptosporidium oocysts were detected in 95.6% of the reclaimed water
samples, however, in one study only 25% of final effluent samples were found positive (Gennaccaro
et al., 2003). A study in Portugal, also found that Cryptosporidium spp oocysts were present in 41.5%
of treated water samples, and Giardia spp. Cysts were detected in 25.6% of the samples(Lobo et al.,
2009). A high occurrence of Cryptosporidium oocysts in the treated wastewater could be related to
several factors. One of these factors could be high concentration of Cryptosporidium oocysts in the
wastewater which is treated at and finally discharged from the STP. Several earlier studies indicated
that waterborne diseases including cryptosporidiosis and giardiasis often go undetected and/or
unreported (Sato et al. 2013; Xiao et al., 2013; Gennaccaro et al., 2003). There is a need for
improving the detection and tracking of these pathogens in water. A previous study conducted in
Portugal concluded that Cryptosporidium spp. and Giardia spp. are widely distributed in source
water and treated water and the results of this study indicated a high occurrence of human pathogenic
Cryptosporidium in raw and treated water samples (Lobo et al., 2009). Other factors related to the
high occurrence of Cryptosporidium oocysts in the reclaimed water could be the high resistance to
chlorination treatment by this parasite, the poor treatment process followed by the STP, or the

88 | P a g e
availability of high concentration of nutrient for this parasite survival in the reclaimed water. An
earlier study was conducted for a period of one year to find out the effectiveness of the membrane
filtration system for the elimination of Giardia cysts and Cryptosporidium oocysts (Lonigro et al.,
2006). This study found negative results for all tested sample for the presence of Giardia cysts and
Cryptosporidium oocysts, thus indicating the effectiveness of the membrane filtration system as
more useful method for the removal of potentially pathogenic protozoan cysts from wastewater to
be used in agriculture (Lonigro et al., 2006). Therefore, regular monitoring of the irrigation water
for protozoan parasites and controlling their transmission at the point of end use using appropriate
technology are vital to reducing the risk of environmental contamination with protozoan parasites.
Acknowledgment
This study was supported by Zayed University RIF (research incentive fund) grant (activity
code: R13053). The authors are thankful to Dubai municipality for irrigation water sampling related
assistance.
References
Alonso, M.C., Dionisio, L.P.C., Bosch, A., Pereira de Moura, B.S., Garcia-Rosado, E., & Borrego, J.J.,
(2006). Microbiological quality of reclaimed water used for golf courses’ irrigation. Water Science &
Technology, pp.109-117.
AlAmimi, A. S., Khan, MA., & Dghaim, R. (2014). Bacteriological Quality of Reclaimed Wastewater used
for Irrigation of Public Parks in the United Arab Emirates. International Journal of Environmental Science
and Development, 5 (3), 309-312.
Al Ajmi, A., Salih, A.A., Kadim, I., Othman, Y. (2009). Chemical Constituents And Heavy Metals Contents
of Barley Fodder Prduced Under Hydroponic System in GCC Countries Using Tertiary Treated Sewage
Effluents. Journal of Phytology , 1 (6), 374-380.
Al-Zubari, W. (1998). Towards the establishment of a total water cycle management and re-use program in
the GCC countries. Desalination , 120, 3-14.
Castro-Hermida, J.A. García-Presedo, I. González-Warleta, M. Mezo, M. (2010). Cryptosporidium and
Giardia detection in water bodies of Galicia, Spain. Water Res., 44(20), pp. 5887-96.
Dubai Municipality Technical guideline number (13), June-2011. Environmental Regulations for the Reuse
of Treated Wastewater for Irrigation & Thermal Treated Sludge forAgricultural Purposes. Environment
Department. [Online] Available from: https://login.dm.gov.ae/wps/wcm/connect/56248854-31f1-498f-af29-
89 | P a g e
bc79c51f6e6f/Environmental+Regulations+for+the+Reuse+of+Treated+Wastewater.pdf?MOD=AJPERES
[Accessed 10 Jan. 2015].
Gennaccaro,A.L., McLaughlin, M. R., Quintero-Betancourt,W., Huffman, D.E. & Rose, J. B. (Aug.2003).
Infectious Cryptosporidium parvum Oocysts in Final Reclaimed Effluent. Applied And Environmental
Microbiology, 69 (8), 4983–4984.
Lobo,M.L., Xiao,L., Antunes, F. & Matos, O. (2009). Occurrence of Cryptosporidium and Giardia genotypes
and subtypes in raw and treated water in Portugal. The Society for Applied Microbiology, 48(0266-8254),
732-737.
Lonigro, A., Pollice, A., Spinelli,R., Berrilli,F., Di Cave,D., D'Orazi,C., Cavallo, p., & Brandonisio, O.
(2006). Giardia Cysts and Cryptosporidium Oocysts in Membrane-Filtered Municipal Wastewater Used for
Irrigation. Applied And Environmental Microbiology, 72 (12), 7916–7918.
Quintero-Betancourt, W. , Gennaccaro, A. L., Scott, T. M. & Rose, J. B. (2003). Assessment of Methods for
Detection of Infectious Cryptosporidium Oocysts and Giardia Cysts in Reclaimed Effluents. Applied And
Environmental Microbiology, 69 (9), 5380–5388.
Sato, M. Z. Galvani, A.T. Padula, J. A. Nardocci, A. C. Lauretto, M. de. S. Razzolini, M. T. P. Hachich, E.
M., (2013). Assessing the infection risk of Giardia and Cryptosporidium in public drinking water delivered
by surface water systems in Sao Paulo State, Brazil. Science of The Total Environment, 442 (1), pp. 389-396.
US-EPA 2012 guidelines for water resue. [Online] Available from: USEPA
http://nepis.epa.gov/Adobe/PDF/P100FS7K.pdf [Accessed 10 Jan. 2015].
Xiao, G. Qiu, Z. Qi, J. Chen, J. Liu, F. Liu, W. Luo, J. Shu, W. (2013). Occurrence and potential health risk
of Cryptosporidium and Giardia in the Three Gorges Reservoir, China. Water Research, 47 (5), pp. 2431-
2445.
Zilberman, A. Zimmels,Y. Starosvetsky, J. Zuckerman, U. Armon,R. (2009). A Two-Phase Separation
Method for Recovery of Cryptosporidium Oocysts from Soil Samples. Water Air Soil Pollut., 203, pp. 325–
334.

90 | P a g e
Leading cause of road traffic morbidity and mortality in the United Arab Emirates (UAE) and the main adaptations to reduce it
Aisha Salem Mohammed
Hamdan Bin Moahmmed Smart University, UAE
Abstract
My work mainly concentrate on describe the leading cause of road traffic morbidity and mortality in the
United Arab Emirates (UAE) and the main adaptations to reduce it. A number of public health issues
significantly contribute to morbidity and mortality in the UAE. In 2010 the United Arab Emirates ranked fifth
in the Region for road traffic fatalities, with a rate of 37.1 deaths per 100 000 population. Injuries account
for 21% of all deaths in the country, ranking as the second leading cause of death. High alarming rates of
roadway accidents on average. Lead the UAE to take many actions to reduce that, among the main action are
a rising the road traffic rules and regulation and awareness on the same time improve the health care service
for the patient from car accidents.
Introduction
The United Arab Emirates (UAE) is a country composed of seven emirates (Abu Dhabi, Ajman,
Dubai, Fujairah, Ras Al Khaimah, Sharjah, and Umm Al-Quwain), formed in 1971, (UAE) is a
rapidly developing country composed of a multinational population with varying educational
backgrounds, religious beliefs, and cultural practices, which pose a challenge for population-based
public health strategies. Population estimates: 4.1 million in 2005, 8.3 million in 2010). Indeed, mass
recruitment of migrant workers has created an unusual population structure; with the total UAE
population composed of approximately 11% (950,000) Emiratis, and the rest expatriates of varying
nationalities (1).
Materials and Methods
A retrospective study was conducted to retrieve peer-reviewed articles, literature review, data
collection, analysis and interpretation on road traffic morbidity and mortality in the United Arab
Emirates (UAE) and the main adaptations to reduce it for a period from 2011 to 2014,
Comprehensive searches of PubMed, Google, Google Scholar and World Health Organization
(WHO). That depending on Preventing Injuries: the Haddon Matrix (2).

91 | P a g e
And the lack of reliable data is a serious problem, I face in doing my Review manuscript, as
there is three different source of information about mortality "MOH , Abu Dhabi health authority
and Dubai health authority , so mainly I depend on data announced by officer in ministry of interior
in UAE.
Results
The "Sudden lane changes" which is pre event (primary prevention) and host person affected that
depend on driver skill. Were the main cause of road traffic morbidity and mortality in the UAE in
2014. And the second cause of road traffic morbidity is the failure to leave a sufficient amount of
distance between vehicles which is pre event (primary prevention) and host person affected that
depend on driver skill. And the second cause of mortality is the speed. The introduction of radar
system and speed cameras in 1994, speeding declined significantly. And the rules of wearing of seat
belts will be effective in reducing this substantial wastage of life and national resources, the country
increase the awareness, campaign, about road traffic accidents. These factor are pre event (primary
prevention) and host person affected that depend on driver skill and physical environment road
design and speed limits.
The main recommendation is to introduce the Trauma registries which are databases that
document trauma cases according to specific inclusion criteria. It designed to improve injury
surveillance and enhance trauma care, outcomes, and prevention.
Discussion of Road traffic accidents as a major cause of mortality and morbidity in United
Arab Emirates (UAE):
A number of public health issues significantly contribute to morbidity and mortality in the UAE (1).
In 2010 the United Arab Emirates ranked fifth in the Region for road traffic fatalities, with a rate of
37.1 deaths per 100 000 population. Injuries account for 21% of all deaths in the country, ranking as
the second leading cause of death. The predominant cause of injury is road traffic crashes. Road

92 | P a g e
traffic fatalities totaled 1056 in 2007, with males accounting for 87% of these deaths. The reported
number of non-fatal road traffic injuries was 11 155 in 2007 (2). High alarming rates of roadway
accidents on average, the past few years have witnessed about one fatality due to motor vehicle
crashes every eight hours, and more than 25 injuries per day (3). For the world, fatalities from road
crashes represented 2.1% of fatalities from all causes. The highest percentage was in the United Arab
Emirates (15.9%) (4).
The estimated economic loss due to fatalities and injuries reaches a total of about AED
20 billions annually ($6 billions). Each fatality costs about $1.92 million, while each severe injury
costs about $2.2 millions. Overall, the economic cost due to fatalities and injuries associated with
roadway crashes is approximately 2.5% of the UAE’s GDP. Rapidly increasing car ownership is
likely to worsen the situation (3).
The situation is different now that, the country has developed a good programme for
preventing and managing road traffic crashes. An awareness campaign, conducted especially through
schools, has been effective in reducing morbidity and mortality in connection with road traffic
crashes. The Ministry of Interior and National Transport Authority are the lead agencies and the
Ministry of Health is a collaborator. The country has a target-bound national strategy on road safety
with proper legislation and regulations.
Table (1)
Year
Accidents Injuries Deaths
2011 (5) 6,454 7,808 727
2012 (5) 6,700 7,586 628
2013 (6) 5,124 7,743 651
The table (1) summarizes data announced by ministry of interior in UAE, about the traffic
accident, and as it shown the number of accident decreased from 2011 to 2013 by around 1330 cases
less. The injuries from road traffic still high over three year period. The road traffic death per
100,000 in 2013 decrease to 6.5 which is good indicator over international level. The global map
shows the UAE with 12.7 road deaths per 100,000 populations, compared with 30.4 in Oman, 24.8
in Saudi Arabia, 16.5 in Kuwait, 14 in Egypt and 13.2 in Qatar. In the region only Bahrain had fewer,
with 10.5 in 2010. Regional figures are much higher than in countries such as the UK, which has
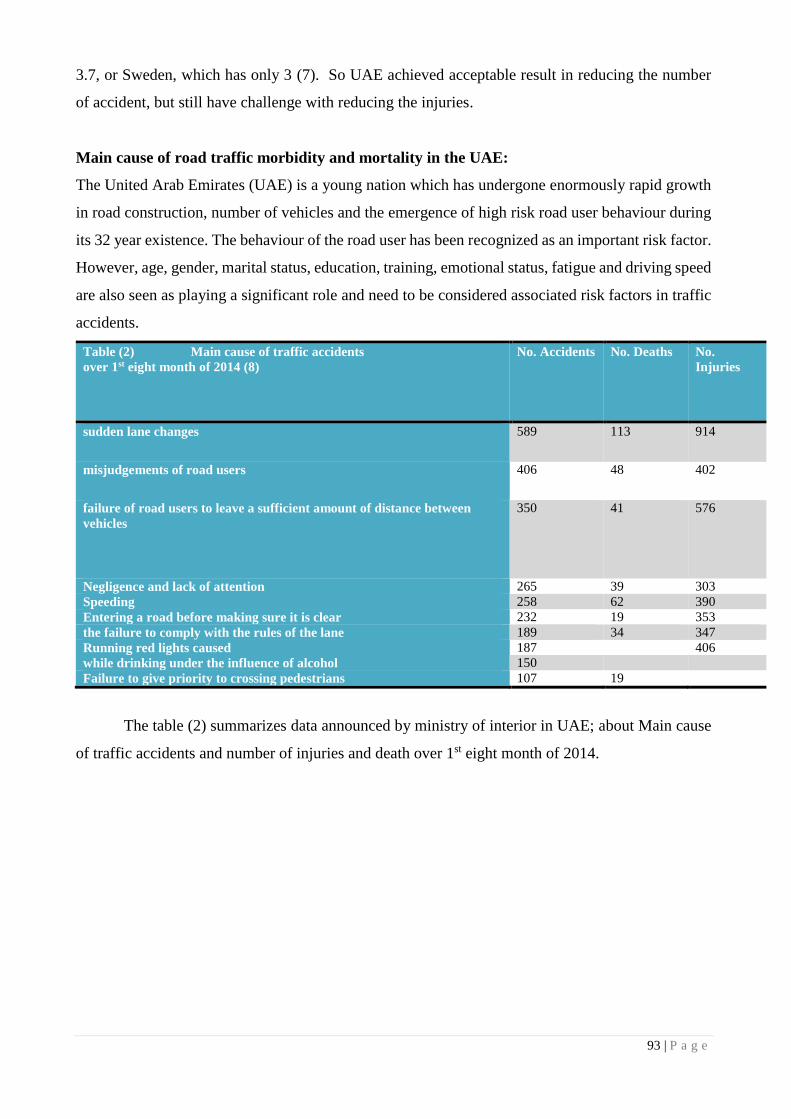
93 | P a g e
3.7, or Sweden, which has only 3 (7). So UAE achieved acceptable result in reducing the number
of accident, but still have challenge with reducing the injuries.
Main cause of road traffic morbidity and mortality in the UAE:
The United Arab Emirates (UAE) is a young nation which has undergone enormously rapid growth
in road construction, number of vehicles and the emergence of high risk road user behaviour during
its 32 year existence. The behaviour of the road user has been recognized as an important risk factor.
However, age, gender, marital status, education, training, emotional status, fatigue and driving speed
are also seen as playing a significant role and need to be considered associated risk factors in traffic
accidents.
Table (2) Main cause of traffic accidents
over 1st eight month of 2014 (8)
No. Accidents No. Deaths No.
Injuries
sudden lane changes 589 113 914
misjudgements of road users 406 48 402
failure of road users to leave a sufficient amount of distance between
vehicles
350 41 576
Negligence and lack of attention 265 39 303
Speeding 258 62 390
Entering a road before making sure it is clear 232 19 353
the failure to comply with the rules of the lane 189 34 347
Running red lights caused 187 406
while drinking under the influence of alcohol 150
Failure to give priority to crossing pedestrians 107 19
The table (2) summarizes data announced by ministry of interior in UAE; about Main cause
of traffic accidents and number of injuries and death over 1st eight month of 2014.
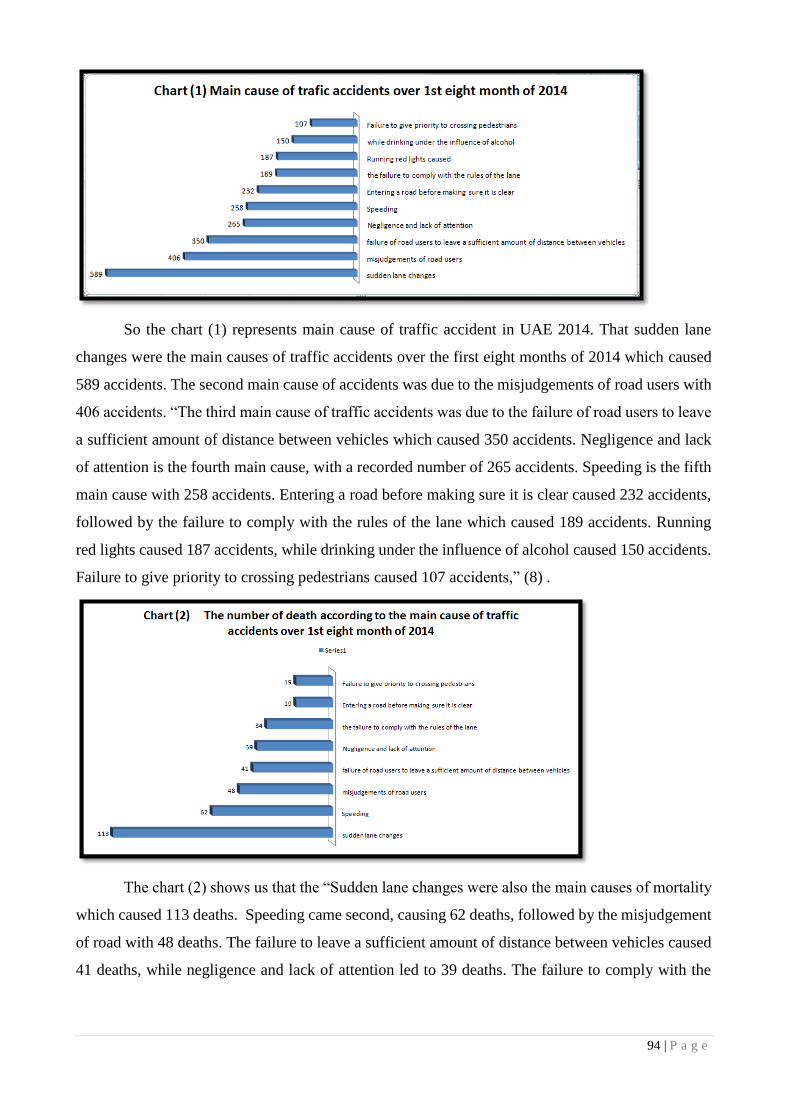
94 | P a g e
So the chart (1) represents main cause of traffic accident in UAE 2014. That sudden lane
changes were the main causes of traffic accidents over the first eight months of 2014 which caused
589 accidents. The second main cause of accidents was due to the misjudgements of road users with
406 accidents. “The third main cause of traffic accidents was due to the failure of road users to leave
a sufficient amount of distance between vehicles which caused 350 accidents. Negligence and lack
of attention is the fourth main cause, with a recorded number of 265 accidents. Speeding is the fifth
main cause with 258 accidents. Entering a road before making sure it is clear caused 232 accidents,
followed by the failure to comply with the rules of the lane which caused 189 accidents. Running
red lights caused 187 accidents, while drinking under the influence of alcohol caused 150 accidents.
Failure to give priority to crossing pedestrians caused 107 accidents,” (8) .
The chart (2) shows us that the “Sudden lane changes were also the main causes of mortality
which caused 113 deaths. Speeding came second, causing 62 deaths, followed by the misjudgement
of road with 48 deaths. The failure to leave a sufficient amount of distance between vehicles caused
41 deaths, while negligence and lack of attention led to 39 deaths. The failure to comply with the
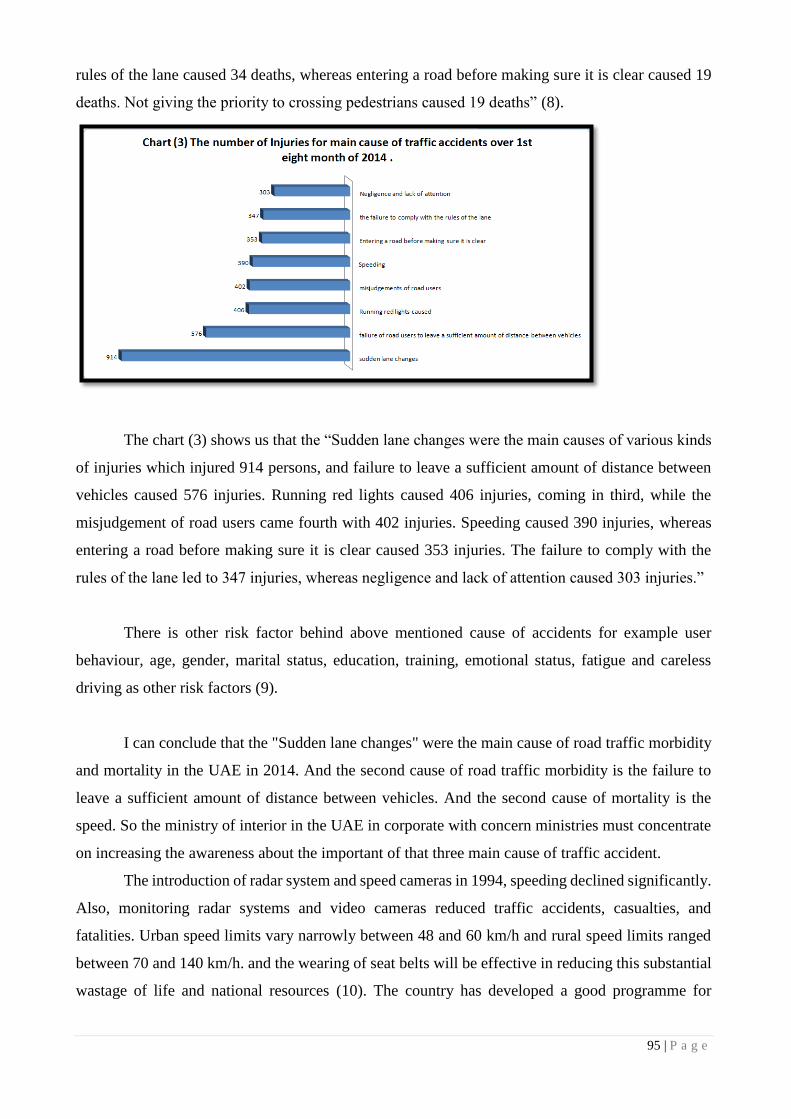
95 | P a g e
rules of the lane caused 34 deaths, whereas entering a road before making sure it is clear caused 19
deaths. Not giving the priority to crossing pedestrians caused 19 deaths” (8).
The chart (3) shows us that the “Sudden lane changes were the main causes of various kinds
of injuries which injured 914 persons, and failure to leave a sufficient amount of distance between
vehicles caused 576 injuries. Running red lights caused 406 injuries, coming in third, while the
misjudgement of road users came fourth with 402 injuries. Speeding caused 390 injuries, whereas
entering a road before making sure it is clear caused 353 injuries. The failure to comply with the
rules of the lane led to 347 injuries, whereas negligence and lack of attention caused 303 injuries.”
There is other risk factor behind above mentioned cause of accidents for example user
behaviour, age, gender, marital status, education, training, emotional status, fatigue and careless
driving as other risk factors (9).
I can conclude that the "Sudden lane changes" were the main cause of road traffic morbidity
and mortality in the UAE in 2014. And the second cause of road traffic morbidity is the failure to
leave a sufficient amount of distance between vehicles. And the second cause of mortality is the
speed. So the ministry of interior in the UAE in corporate with concern ministries must concentrate
on increasing the awareness about the important of that three main cause of traffic accident.
The introduction of radar system and speed cameras in 1994, speeding declined significantly.
Also, monitoring radar systems and video cameras reduced traffic accidents, casualties, and
fatalities. Urban speed limits vary narrowly between 48 and 60 km/h and rural speed limits ranged
between 70 and 140 km/h. and the wearing of seat belts will be effective in reducing this substantial
wastage of life and national resources (10). The country has developed a good programme for

96 | P a g e
preventing and managing road traffic crashes. An awareness campaign, conducted especially through
schools. The Ministry of Interior and Ministry of Health is a collaborator. The country has a target-
bound national strategy on road safety with proper legislation and regulations. (11)
Health care system in United Arab Emirates and its role in reducing the traffic accident
mortality and morbidity.
As all of us now in UAE we have three different health care systems, Ministry of Health
manages and operates health care facilities throughout the northern emirates and is responsible for
setting up and implementing policies, regulations, and standards toward achieving integrated health
care systems. Abu Dhabi was restructured into two entities: HAAD, Abu Dhabi’s regulative and
health policy body, and Abu Dhabi Health Services Company, that owns and operates hospital
facilities, ambulatory clinics, and primary health care clinics in Abu Dhabi. And Dubai Health
Authority which manage health care in Dubai.
Trauma is the cause of 10% of all deaths worldwide, and it is projected that road traffic deaths
will increase by 83% between 2000 and 2020 in developing countries. Trauma is a major health
problem in the United Arab Emirates (UAE). About 18% of the annual mortality in the UAE is due
to trauma and most of these are caused by road traffic collisions, Trauma affects mainly the young
productive population, which has a profound health and economical impact. (12).
In Dubai and under Dubai Health Authority, Rashid is the largest government hospitals. It
is a 400-bed facility, with an annual ED census of 140,000 patients a year. The hospital provides
postgraduate training in medicine and surgery, as well as the new EM program (13). The Centre is
one of the most reputable emergency medical centres in the Gulf region. It handles trauma and poly
trauma cases of patients in road accidents, fall and injuries, among others. The centre also works
with the UAE disaster management committee (14). On an average, the medical staffs at the centre
treats between 480 and 550 patients a day and this number is only expected to grow in the years to
come (15).
In Abu Dhabi, there is Al Ain Emergency Medicine Institute which provide highest standard of care
to patients using the latest technology and resources, deliver this care in a timely manner without
compromising on the standard of care. The Emergency Medicine Institute has 100,000 annual visits
and is recognized as the trauma centre for the city of Al Ain and the Eastern Region of Abu Dhabi.
97 | P a g e
In Ministry of health, the patient from accident receives the treatment in accident and
emergency (A&E) departments, which is staffed by general medical officers trained in medical or
surgical disciplines. These physicians would refer cases to specialists for their opinion and treatment
Responsibility for care often fell between these specialists, causing long length of stays in the A&E
departments. (16). And last refer the patient to Abu Dhabi or Dubai.
Regarding the type and severity of injuries from traffic accident there is lack of information
except studies done by two main Trauma Centres in UAE, Which is Rashes Centre and Al Ain
Centre, so I review 7 studies done by Al Ain Centre, you will found the review in table (3), the
studies used prospectively descriptive study method, and concentrate on different age groups and
cases treated in the centre, these studies recommendation was as following:
The need for effective application of motorcycle helmet law in the UAE, which is During the
event (→ secondary prevention), Host(person affected) warning of helmet , and the Social
environment by implementing low of compulsory wearing helmet for motorcycle driver.
Compulsory helmet use by bicycle riders and subsidising helmet cost should be adopted so
as to reduce morbidity and mortality of bicycle-related injuries. Which is during the event (→
secondary prevention), Host (person affected) warning of helmet, and the Social environment by
implementing low of compulsory wearing helmet for motorcycle driver.
Head and neck injury was the major type of injury causing death of patients aged 0–14 years; UAE
should adapt Child restrains in car low.the situation her during the event (→ secondary prevention),
Host (person affected wearing the seat belt). Post-event (→ tertiary prevention), related to Physical
environment (Emergency vehicle access to collision site) and Social environment (Continued
funding for emergency services).
After 245 patients were studied, the study concludes education and law enforcement
focusing especially on car/booster seat use is needed. Which is during the event (→ secondary
prevention), Host (person affected) warning of safety belt in the car , and the Social environment
by implementing low of compulsory wearing safety belt in the car.
More legal enforcement of seat belt usage is mandatory to reduce the severity of injury
caused by RTCs.

98 | P a g e
The study concludes legislation and education are needed to ensure use of seat belts by all
vehicles.
The study conclude that A relatively high frequency of traffic-related head injuries among
UAE children and youth, non use of safety restraints and/or other factors such as excess speed and
rollovers of 4-wheel drive vehicles.
All these recommendations can help the decision maker in UAE to set traffic roles and
regulation to decrease the road traffic numbers, on the same time gives the prober treatment for
patient from car accidents, and training for the medical staff. Prevention of trauma is the most cost-
effective method for reducing the death toll. One factor for potentially preventing trauma is to
monitor it through trauma registry surveillance systems.
Trauma registries are databases that document trauma cases according to specific inclusion
criteria. They are designed to improve injury surveillance and enhance trauma care, outcomes, and
prevention. It has been shown that trauma registries in developing countries are plausible and
valuable tools for injury surveillance (12).
Trauma registries provide large longitudinal databases for analysis and policy improvement. The
main factors leading to the successful establishment of a multi-center trauma registry are the
development of a concise data entry form, development of a user-friendly secure web-based database
system, the availability of a computer and Internet connection in each data collection center, funded
data entry personnel well trained in extracting medical data from the medical record and entering it
into the computer, and experienced personnel in trauma injuries and data analysis to continuously
maintain and analyze the registry (17). Analysis of a trauma registry as early as six months can lead
to useful information which has long term effects on the progress of trauma research and prevention
(18). In the UAE there is urgent need for national trauma registries database. This will play active
role in reducing traffic accidents mortility and morbidity.
Conclusions
Road traffic accidents continue to be a major cause of mortality and morbidity in the United Arab
Emirates, the country shows great effort to reduce the mortality per 100000 population , but more
action must be taken to save the wastage of life and national resources. The urgent need for national

99 | P a g e
trauma registries database. This will play active role in reducing traffic accidents mortality and
morbidity.
Host
(person affected) Agent or vehicle
Physical
environment Social environment
Pre-event
(→ primary
prevention)
The education of
children and
adolescents as future
road users and drivers
are a particular concern
for the Department with
its emphasis on road use
as a lifelong learning
process. The
Department aims to
further reduce the
number of children
affected in road
accidents through a
range of measures
including better road
safety education for
motorists and children
as well.
The Department of Transport
(DoT) in Abu Dhabi announced
the official launch of its Road
Services Patrol in September,
2011, in coordination with Abu
Dhabi Police
The new Road Service Patrol,
launched in coordination with
Abu Dhabi Police, includes
towing cars in cases of auto
failure from the main road and
moving them to safer locations
to ensure the safety of drivers
and the smooth flow of traffic.
Patrols are also equipped to
assist broken down vehicles and
offer services such as changing
tyres, identifying flat battery,
jumpstarting and topping up
fuel and coolant if needed, to
enable vehicles to reach the
closest petrol station in the
vicinity.
Transport Master Plans :In line with
its mission to regulate, plan and
develop an efficient and well-
integrated transport system that serves
the public interest by enhancing
mobility and delivering safe, secure
and environmentally responsible
Aviation, Maritime, Public Transport
and Highway sectors, the Department
of Transport has compiled a number
of Surface Transport Master
Plans (STMPs) that cover various
modes of transport in different areas
within the Emirate of Abu Dhabi.
During the event
(→ secondary
prevention)
Wearing seatbelt? Air bags working?
Size of car & crash resistance
Weather
conditions;
ice on road?
Quality of emergency
assistance;
Assistance from
bystanders
Post-event
(→ tertiary
prevention)
Ability to call for help
(phone available?);
Knows first aid?
Tendency of car to catch on fire
Emergency
vehicle access
to collision site
Continued funding
for emergency
services
References
1. An analysis of the health status of the United Arab Emirates: the ‘Big 4’ public health issues. Loney,
Tom, et al. s.l. : Glob Health Action. 2013; 6: 10.3402/gha.v6i0.20100., 2013.
http://www.ncbi.nlm.nih.gov/pmc/articles/PMC3566378/.
2. WHO. Country Cooperation Strategy or WHO and the United Arab Emirates 2012–2017. UAE : s.n.,
2012. http://www.who.int/countryfocus/cooperation_strategy/ccs_are_en.pdf.
3. Assessment of vehicle inspection and emission standards in the United Arab Emirates. Mohamed Y.E.
Selim, M.A. Maraqa, A.M.O. Mohamedb, Y.E. Hawasb. s.l. : Elsevier B.V, 2011.
http://www.sciencedirect.com/science/article/pii/S1361920911000058.

100 | P a g e
4. Mortality from Road Crashes in 193 Countries:A Comparison with Other Leading Causes of Death.
Schoettle, Michael Sivak and Brandon. s.l. : The University of Michigan-Sustainable Worldwide
Transportation, 2014. http://www.umich.edu/~umtriswt.
5. Kader, Binsal Abdul. Safety steps cut down UAE road fatalities. UAE : gulfnews, 2013 .
http://gulfnews.com/news/gulf/uae/safety-steps-cut-down-uae-road-fatalities-1.1156104.
6. Incorporated, Dubai Media. UAE road accidents killed 561 people in 2013. dubai : emirates247, 2014 .
http://www.emirates247.com/uae-road-accidents-killed-561-people-in-2013-2014-03-09-1.540962.
7. national, the. UAE has one of best road-death records in the Middle East. UAE : the national, 2013.
http://www.thenational.ae/uae/road-safety/uae-has-one-of-best-road-death-records-in-the-middle-east.
8. Secretariat, Minister of Interior's General. Traffic Accidents Decreased by 10.7 Percent in UAE over 8
Months. UAE : The UAE Minister of Interior's General Secretariat, Tactical Affairs and Security Media
Department , 2014 . http://me-newswire.net/news/12156/en.
9. Road traffic injuries in Al-Ain City, United Arab Emirates. Bener A1, Absood GH, Achan NV, Sankaran-
Kutty M. s.l. : pub Med - , 1992. http://www.ncbi.nlm.nih.gov/pubmed/1469673.
10. A Perspective on Motor Vehicle Crash Injuries and Speeding in the United Arab Emirates. Abdulbari
Bener, R. Alwash. 1, 2010, Vol. 3.
http://www.tandfonline.com/doi/abs/10.1080/15389580210519#.VIksgyw9TK8.
11. WHO. Country Cooperation Strategy for WHO and the United Arab Emirates 2012–2017. s.l. : World
Health Organization. Regional Office for the Eastern Mediterranean, 2012.
http://www.who.int/countryfocus/cooperation_strategy/ccs_are_en.pdf.
12. Towards a national trauma registry for the United Arab Emirates. Sami Shaban1*, Hani O Eid2, Ezedin
Barka3 and Fikri M Abu-Zidan1. doi:10.1186/1756-0500-3-187, s.l. : BioMed Central Ltd, 2010.
http://www.biomedcentral.com/1756-0500/3/187.
13. Robert Partridge, Michael Abbo and Alamjit Virk. Emergency medicine in Dubai, UAE. s.l. :
nternational Journal of Emergency Medicine, 2009. http://link.springer.com/article/10.1007/s12245-009-
0122-y/fulltext.html.
14. gulfnews. Rashid Hospital adds 160 beds to Trauma Centre . Dubai : Al Nisr Publishing LLC 2014. All
rights reserved. , 2013 . http://gulfnews.com/news/gulf/uae/health/rashid-hospital-adds-160-beds-to-trauma-
centre-1.1218199.
15. news, gulf. Trauma Care Centre of Rashid Hospital being expanded. Dubai : Al Nisr Publishing LLC
2014. , 2014. http://gulfnews.com/news/gulf/uae/health/trauma-care-centre-of-rashid-hospital-being-
expanded-1.1345916.
16. Saleh Fares, et al. Emergency medicine in the United Arab Emirates. s.l. : pubMed , 2014 .
http://www.ncbi.nlm.nih.gov/pmc/articles/PMC3904470/.
17. Towards a national trauma registry for the United Arab Emirates. Shaban S1, Eid HO, Barka E, Abu-
Zidan FM. PMID:, s.l. : pubMed . http://www.ncbi.nlm.nih.gov/pubmed/20618988.

101 | P a g e
18. The long term effects of early analysis of a trauma registry. Shaban S1, Ashour M, Bashir M, El-Ashaal
Y, Branicki F, Abu-Zidan FM. s.l. : pub Med , 2009. http://www.ncbi.nlm.nih.gov/pubmed/19930710.
19. Motorcycle-related injuries in the United Arab Emirates. Ashraf F. Hefnya. s.l. : Elsevier, 2011.
http://www.sciencedirect.com/science/article/pii/S0001457511001229.
20. Bicycle-related injuries requiring hospitalization in the United Arab Emirates. Ashraf F. Hefnya, Hani
O. Eid, Michal Grivnac,Fikri M. Abu-Zidana. s.l. : Elsevier B.V., 2011.
http://www.sciencedirect.com/science/article/pii/S0020138311002105.
21. Injury mortality and morbidity among children in the United Arab Emirates. Bener, A, Al-salman, Km
and Pugh, Rnh. s.l. : European Journal of Epidemiology, FEB 1998, Vol. 14, p. 2. http://proxy.hbmeu-
elibrary.com:9797/MuseSessionID=89ef2e9c3f451a21a438475c4e65c3aa/MuseProtocol=http/MuseHost=se
arch.proquest.com/MusePath/healthmanagement/docview/1017656044/abstract?source=fedsrch&accountid
=33317.
22. Pediatric and youth traffic-collision injuries in Al Ain, United Arab Emirates: a prospective study.
Grivna M1, Eid HO, Abu-Zidan FM. s.l. : pubMed, 2013. http://www.ncbi.nlm.nih.gov/pubmed/23861931.
23. Effects of seat belt usage on injury pattern and outcome of vehicle occupants after road traffic
collisions: prospective study. Abu-Zidan FM1, Abbas AK, Hefny AF, Eid HO, Grivna M. s.l. : pub Med ,
2012 . http://www.ncbi.nlm.nih.gov/pubmed/22187131.
24. Factors affecting anatomical region of injury, severity, and mortality for road trauma in a high-income
developing country: lessons for prevention. Eid HO1, Barss P, Adam SH, Torab FC, Lunsjo K, Grivna M,
Abu-Zidan FM. s.l. : PubMed National Center for Biotechnology Information, U.S. National Library of
Medicine, 2009. http://www.ncbi.nlm.nih.gov/pubmed/19117565.
25. Child and youth traffic-related injuries: use of a trauma registry to identify priorities for prevention in
the United Arab Emirates. Grivna M1, Barss P, Stanculescu C, Eid HO, Abu-Zidan FM. s.l. : pubMed
National Center for Biotechnology Information, U.S. National Library of Medicine, 2013.
http://www.ncbi.nlm.nih.gov/pubmed/23441946.
26. WHO. World report on road traffic injury prevention. s.l. : WHO.
http://www.who.int/violence_injury_prevention/publications/road_traffic/world_report/en/.
27. Injury mortality and morbidity among children in the United Arab Emirates. baner, A, Al Salman, K
and Pugh, R. s.l. : European Journal of Epidemiology- Kluwer Academic Publishers, 1998.
28. Road Traffic Accidents in the United Arab Emirates Compared to Western Countries. Bener, A,
Crundall, D. s.l. : Publisher: University Roma Tre, 2005, Vol. 6. http://trid.trb.org/view.aspx?id=758906.
29. Etiology and Patterns of Facial Fractures in the United Arab Emirates. Klenk, Gusztav MD and
Kovacs, Adam. 1, s.l. : Journal of Craniofacial Surgery, 2003, Vol. 14.
http://journals.lww.com/jcraniofacialsurgery/Abstract/2003/01000/Etiology_and_Patterns_of_Facial_Fractu
res_in_the.14.aspx.
30. Bicycle-related injuries requiring hospitalization in the United Arab Emirates. Hefny AF1, Eid HO,
Grivna M, Abu-Zidan FM. s.l. : pubMed , 2012, Vol. 9. http://www.ncbi.nlm.nih.gov/pubmed/21664613.

102 | P a g e
31. Road traffic accidents in Dubai, 2002-2008. Al Marzooqi AH1, Badi M, El Jack A. s.l. : pub Med ,
2010 . http://www.ncbi.nlm.nih.gov/pubmed/20566531.
32. A holistic approach for assessing traffic safety in the United Arab Emirates. Mohammad Nurul Hassana,
Yaser E. Hawas, Munjed A. Maraqa. s.l. : Elsevier B.V, 2012, Vols. Volume 45, March 2012, Pages 554–
564. http://www.sciencedirect.com/science/article/pii/S0001457511002466#bib0180.
33. emirates247. UAE road accidents kill 826 in 2010. [Dubai Media Incorporated. ] UAE : s.n., 2011.
http://www.emirates247.com/news/emirates/uae-road-accidents-kill-826-in-2010-2011-03-14-1.367865.
Preparation of Figures:
Chart (1)
Chart (2)
Chart (3)
Preparation of Tables:
Table (1)
Table (1)
Year
Accidents Injuries Deaths Road traffic death Per 100,000 Population
2011 (5) 6,454 7,808 727
2012 (5) 6,700 7,586 628
2013 (6) 5,124 7,743 651 6.5
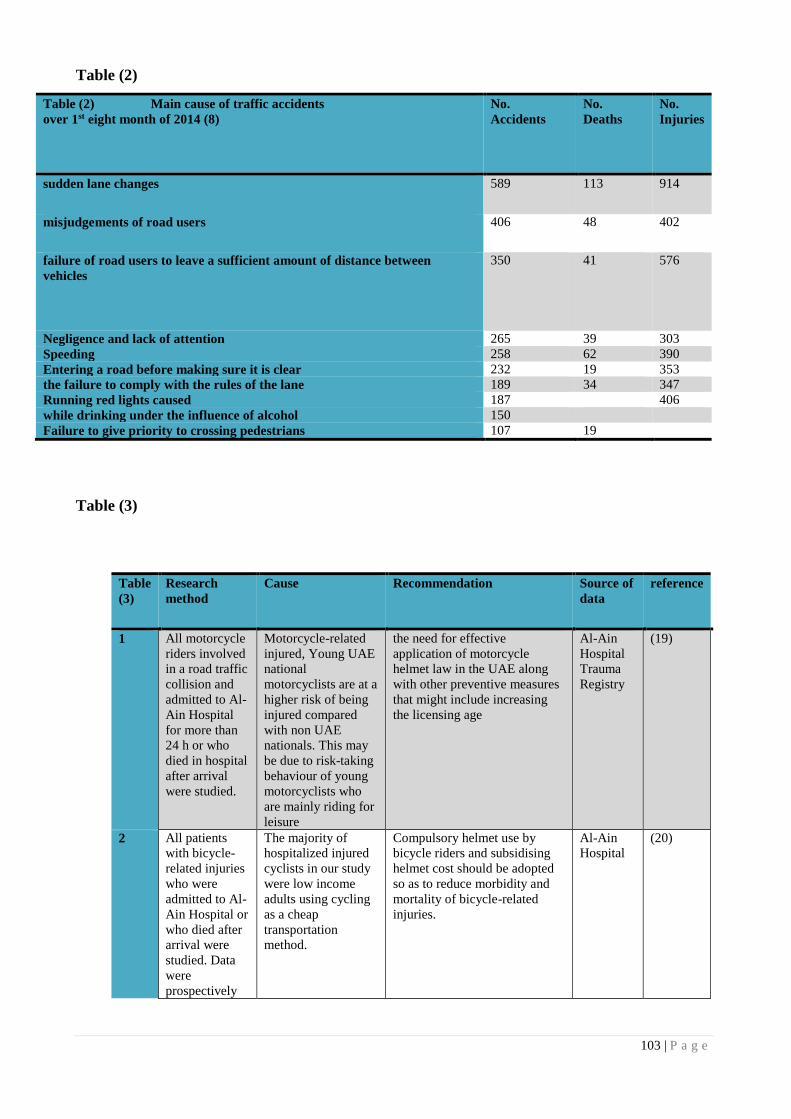
103 | P a g e
Table (2)
Table (2) Main cause of traffic accidents
over 1st eight month of 2014 (8)
No.
Accidents
No.
Deaths
No.
Injuries
sudden lane changes 589 113 914
misjudgements of road users 406 48 402
failure of road users to leave a sufficient amount of distance between
vehicles
350 41 576
Negligence and lack of attention 265 39 303
Speeding 258 62 390
Entering a road before making sure it is clear 232 19 353
the failure to comply with the rules of the lane 189 34 347
Running red lights caused 187 406
while drinking under the influence of alcohol 150
Failure to give priority to crossing pedestrians 107 19
Table (3)
Table
(3)
Research
method
Cause Recommendation Source of
data
reference
1 All motorcycle
riders involved
in a road traffic
collision and
admitted to Al-
Ain Hospital
for more than
24 h or who
died in hospital
after arrival
were studied.
Motorcycle-related
injured, Young UAE
national
motorcyclists are at a
higher risk of being
injured compared
with non UAE
nationals. This may
be due to risk-taking
behaviour of young
motorcyclists who
are mainly riding for
leisure
the need for effective
application of motorcycle
helmet law in the UAE along
with other preventive measures
that might include increasing
the licensing age
Al-Ain
Hospital
Trauma
Registry
(19)
2 All patients
with bicycle-
related injuries
who were
admitted to Al-
Ain Hospital or
who died after
arrival were
studied. Data
were
prospectively
The majority of
hospitalized injured
cyclists in our study
were low income
adults using cycling
as a cheap
transportation
method.
Compulsory helmet use by
bicycle riders and subsidising
helmet cost should be adopted
so as to reduce morbidity and
mortality of bicycle-related
injuries.
Al-Ain
Hospital
(20)
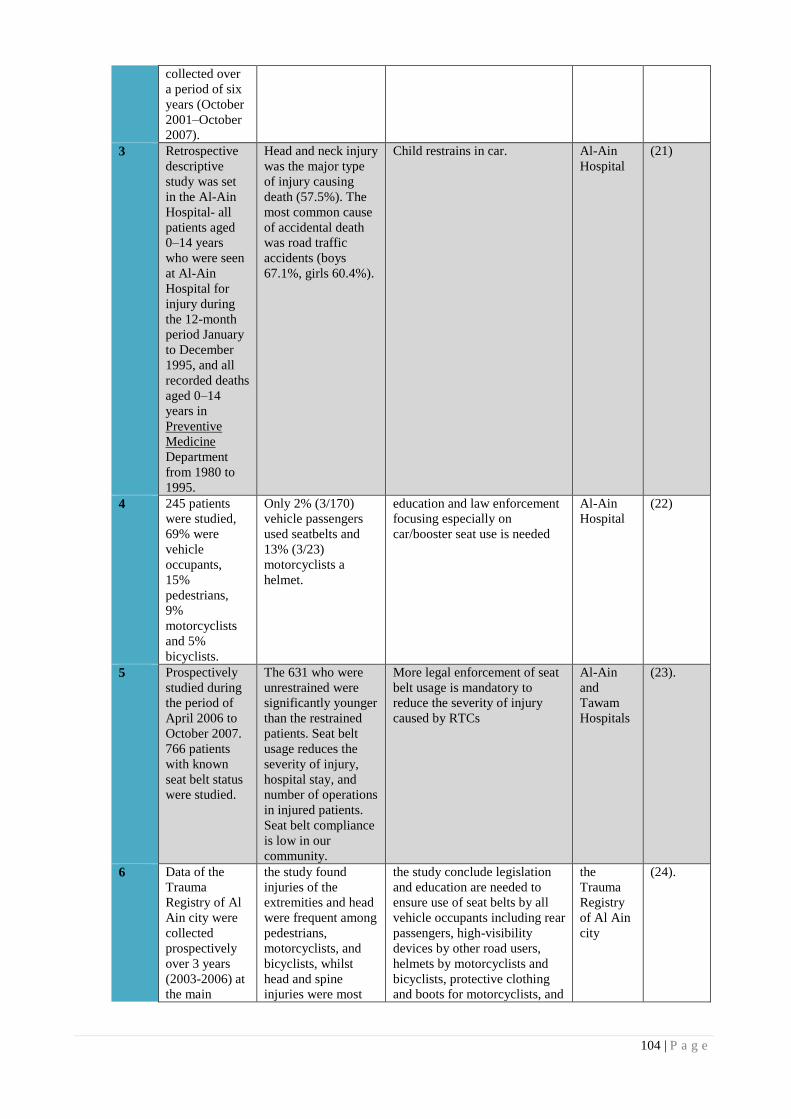
104 | P a g e
collected over
a period of six
years (October
2001–October
2007).
3 Retrospective
descriptive
study was set
in the Al-Ain
Hospital- all
patients aged
0–14 years
who were seen
at Al-Ain
Hospital for
injury during
the 12-month
period January
to December
1995, and all
recorded deaths
aged 0–14
years in
Preventive
Medicine
Department
from 1980 to
1995.
Head and neck injury
was the major type
of injury causing
death (57.5%). The
most common cause
of accidental death
was road traffic
accidents (boys
67.1%, girls 60.4%).
Child restrains in car. Al-Ain
Hospital
(21)
4 245 patients
were studied,
69% were
vehicle
occupants,
15%
pedestrians,
9%
motorcyclists
and 5%
bicyclists.
Only 2% (3/170)
vehicle passengers
used seatbelts and
13% (3/23)
motorcyclists a
helmet.
education and law enforcement
focusing especially on
car/booster seat use is needed
Al-Ain
Hospital
(22)
5 Prospectively
studied during
the period of
April 2006 to
October 2007.
766 patients
with known
seat belt status
were studied.
The 631 who were
unrestrained were
significantly younger
than the restrained
patients. Seat belt
usage reduces the
severity of injury,
hospital stay, and
number of operations
in injured patients.
Seat belt compliance
is low in our
community.
More legal enforcement of seat
belt usage is mandatory to
reduce the severity of injury
caused by RTCs
Al-Ain
and
Tawam
Hospitals
(23).
6 Data of the
Trauma
Registry of Al
Ain city were
collected
prospectively
over 3 years
(2003-2006) at
the main
the study found
injuries of the
extremities and head
were frequent among
pedestrians,
motorcyclists, and
bicyclists, whilst
head and spine
injuries were most
the study conclude legislation
and education are needed to
ensure use of seat belts by all
vehicle occupants including rear
passengers, high-visibility
devices by other road users,
helmets by motorcyclists and
bicyclists, protective clothing
and boots for motorcyclists, and
the
Trauma
Registry
of Al Ain
city
(24).
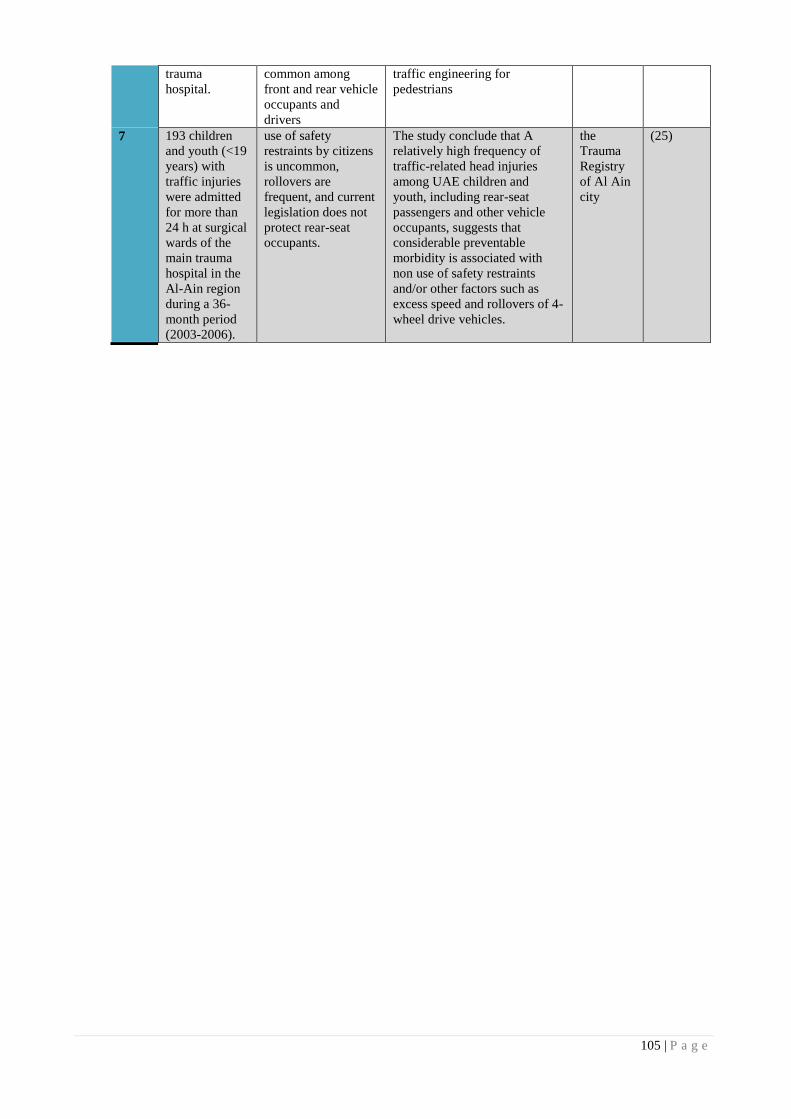
105 | P a g e
trauma
hospital.
common among
front and rear vehicle
occupants and
drivers
traffic engineering for
pedestrians
7 193 children
and youth (<19
years) with
traffic injuries
were admitted
for more than
24 h at surgical
wards of the
main trauma
hospital in the
Al-Ain region
during a 36-
month period
(2003-2006).
use of safety
restraints by citizens
is uncommon,
rollovers are
frequent, and current
legislation does not
protect rear-seat
occupants.
The study conclude that A
relatively high frequency of
traffic-related head injuries
among UAE children and
youth, including rear-seat
passengers and other vehicle
occupants, suggests that
considerable preventable
morbidity is associated with
non use of safety restraints
and/or other factors such as
excess speed and rollovers of 4-
wheel drive vehicles.
the
Trauma
Registry
of Al Ain
city
(25)

106 | P a g e
Eating Disorders Prevalence and Determents in UAE among Emirati Young Females
Alla Mansour
Hamdan Bin Mohammed Smart University, UAE
Abstract
Objective: To assess the prevalence of Disordered Eating Attitude (DEA), occurrence of self-induced vomiting
and body dissatisfaction in a representative sample of Emirati young females; and to investigate the
determinants of eating disorders.
Methods: A cross sectional study of a sample of 508 adolescent females were chosen through a stratified
randomization technique; where one section from each of the grade 10, 11 and 12 was chosen from each
public school (n-6) located in Sharjah in the UAE. All consenting students in the selected classes filled the
Eating Attitudes Test (EAT-26) and Body Figure Rating Scale (BFR). From the latter, body dissatisfaction
score was calculated. From the students who scored 20 or above on EAT 26 (cut off point for eating disorder)
and high on body dissatisfaction, a small sample was selected (n=52) and were included into one to one
interviews for further investigation on determinants of DEA.
Results: From the study sample, 37.8% scored at least 20 on EAT-26, and 65.2% had body dissatisfaction.
Significant relationships were seen between the following pairs: 1) EAT-26 and body dissatisfaction, 2) BMI
and body dissatisfaction, 3) occurrence of vomiting and EAT-26. After the in-depth interviews, the following
factors were noted as pre-detriments of eating disorders: 1) family has negatively influenced 76.9% of the
adolescent by emphasizing on thinness, verbal insults, and non-satisfaction with girls shapes and
appearances; 2) Media has negatively influenced 73.1% adolescents (western view of women, models, and
celebrates); 3) bullying at either home or school, because of either shape or weight negatively influenced
71% of the participants.
Conclusion: The study shows a high prevalence of eating disorder and body dissatisfaction among schools
girls in Sharjah. In addition, the major leading factors to these conditions are family, media, and bullying.
Educational campaigns are needed in schools and within families targeting eating disorders to prevent further
deterioration in health of the young generation in UAE.
Introduction
Eating disorders are one of the significant causes of physical and psychosocial morbidity among
adolescent girls and young adult women (Fairburn & Harrison, 2003). It is a worldwide issue that
requires huge efforts and researches to solve it. Previously, evidence indicated that the prevalence of
eating disorders (ED) among female adolescent is increasing in Western countries only (Mousa et
al., 2010). However, recently studies have discovered an unexpected high prevalence of ED among

107 | P a g e
Arab females in Arabian countries such as, Oman, Kuwait, Jordan, Syria, Egypt, and Saudi Arabia
(Musaiger, et al., 2013; Mousa et al., 2010; Okasha & Elkholy, 2012).
Moreover, the prevalence of ED is increasing in the UAE as well. UAE is one of the Gulf
countries, where 37.4% of adolescent females in Sharjah suffer from DEA (Musaiger, et al., 2013).
Many different factors are leading to ED in the world. Family, media, teasing, dieting, low
self-esteem, and anxiety are the identified determinants of ED in the world. However, unfortunately
there is no evidence of cultural determinants of ED in the UAE.
The aim of this study is (1) to update the literature on the current prevalence of DEA among
adolescent females in Sharjah high schools, and (2) to identify the prevalence of body dissatisfaction
among young Emirati females, (3) to evaluate the relationship between occurrence of vomiting and
DEA; (4) to identify the determinants of disordered DEA among young Emirati females.
Literature Review
Eating disorder prevalence in the World and Arabic region
Attitude and behavior related to eating disorders have become a worldwide issue, especially among
adolescent and young women (Chang et al., 2011). The growing prevalence of eating disorders
including Anroxia Nervosa (AN) and Bulimia Nervosa (BN), binge eating, and body dissatisfaction
(BD) is of high concern worldwide. Kluck (2008) mentioned that the prevalence of AN and BN rates
are between 1 and 5% among university students. Moreover, the prevalence of females in American
university students who scored very high in Eating Attitude Test (EAT) was 20% (Yager, Odea,
2008). In past decade evidence indicated that the prevalence of ED among female adolescent is
increasing in Western countries (Mousa et al., 2010). However, recent studies have concluded an
unexpected high prevalence of ED among Arab females in Arabian countries by using EAT
questionnaire; a questionnaire that have 26 questions related to various eating attitudes. A score of
20 points or above indicates Disordered Eating Attitudes (DEA). In Jordan, Mousa et al (2010(,
mentioned that 40.5% of adolescent girls scored at or above the cut-off points of EAT-26. In addition,
in Egypt 11.2% of sample of secondary school girls scored above the cut-off points of EAT-40
(Okasha & Elkholy, 2012). Moreover, the prevalence of DEA among high school female aged 15-
18 years was 42.8% in Kuwait, 32 % in Syria, and 42.7% in Jordan (Musaiger, et al., 2013).

108 | P a g e
Additionally, In United Arab Emirates (UAE), DEA has estimated to be 19.2% among 16 to
18 years girls in Al Ain city by using EAT-40 (Eapen, Mabrouk, & Bin-Othman, 2006) and 37.4%
in high school female student in Sharjah (Musaiger, et al., 2013).
DEA Determinants
Many different factors contribute to DEA among adolescents. Researchers in many regions have
identified different features. One of the most significant factors of DEA is family. The culture of a
family and the tendency for a family to emphasize on appearance, eating, thinness, and attractiveness
play an important role in affecting the daughter eating behaviors (Kluck, 2010). In addition, there is
an association between DEA and various psychological factors such as depression, anxiety, low self-
steam, and other socio-cultural factors such as mass media, peers, family influence (Musaiger, et al.,
2013). Moreover, criticisms, and bullying related to weight or food are increasing the risk of
developing an eating disorder in Western countries (Tsai, et al., 2011).
There are many different factors that appeared to have no significant relationship with DEA
such as socioeconomic status (Eapen, Mabrouk, & Bin-Othman, 2006, Neumark-Stainer&Hannan,
2000) and gender (Musaiger, et al., 2013; Kaluski, Natamba, et al., 2008).
UAE as a country is developing rapidly, economically and internationally. Cultural
transition, social change, westernization, and globalization make young generation at higher risk of
developing ED (Eapen, Mabrouk, & Bin-Othman, 2006).
All of the previously mentioned researches in UAE identified a high prevalence of DEA
among Emirati females. However, the need of an accurate, up to date prevalence number is missing.
Moreover, data about specific determinants and factors among the Emirati young females with DEA
are not available, which creates a gap in the literature. Identifying the specific determinants that
trigger young females to develop DEA needed to enable researchers to design effective health
promotion programs.
Research questions
RQ 1: Is DEA on the rise among adolescent schools girls in Sharjah as compared to previous
literature?
Null: DEA is not on the rise among adolescent schools girls in Sharjah as compared to previous
literature.

109 | P a g e
Alt: DEA is at the rise among adolescent schools girls in Sharjah as compared to previous literature.
RQ 2 : Do Emirati adolescent school girls have unique determinants to eating disorders different
form the published literature of other cultures?
Null: Emirati adolescent school girls do not have unique determinants to eating disorders different
from the published literature of other cultures.
Alt: Emirati adolescent school girls have unique determinants to eating disorders different from the
published literature of other cultures.
Study objectives
1- Identify current prevalence of DEA in Sharjah using EAT-26 questionnaire.
2- Identify prevalence of BD among Emirati adolescent school girls in Sharjah using BFR scale.
3- Evaluate the relationship between occurrence of vomiting and DEA.
4- Identify the specific determinants to DEA among Emirati adolescent schools girls in Sharjah
through unstructured individualized interviews between the dietitian and the student.
Methods
Participants and sampling
This cross-sectional study includes all public high schools in Sharjah. Female students aged 15–18
years were the target group in this study. Sample size was calculated with a 0.05 margin of error and
99% confidence intervals. Sharjah Educational Zone and Zayed University Human Subjects
Research Ethics committee approved the study ethically and facilitated school entry.
A random stratification sampling technique was used for classe selections. Initially, one
section of each grade from the grades 10, 11, 12 in each school selected randomly; after which all
students in that section that met the inclusion criteria were included in the study.
Participants were then selected according to the inclusion criteria which are: age (14-18),
grade (10, 11, 12), gender (female), location (Sharjah), school type (public), nationality (Emirati),
free of medical conditions. A formal consent form was sent to the students in the selected schools
(AlRifa, Roqia, Waset, Alqubaiba, Al Zahra, Al qarain). The ones that provided a signed consent
form were included in the study. Students who do not meet the inclusion criteria were excluded from
the study. Only government schools were included in the study, because Emiratis girls are commonly
in government school and the main target of the study was Emiratis girls. Boys excluded from the
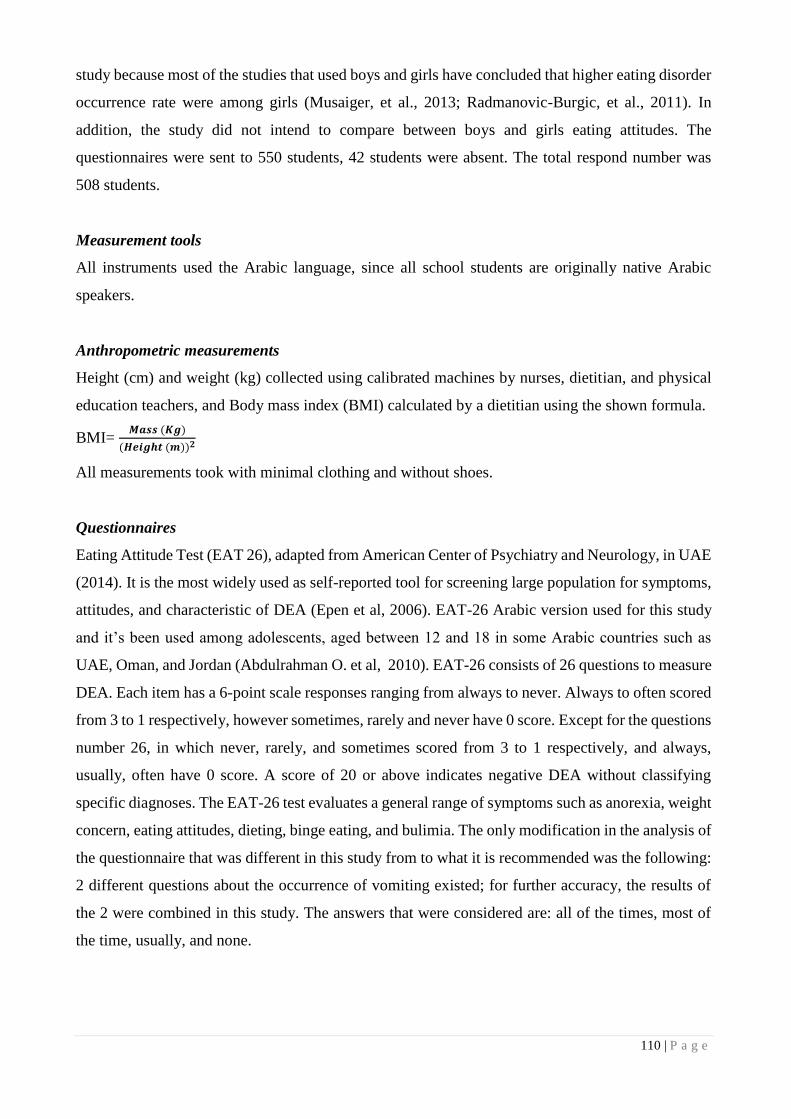
110 | P a g e
study because most of the studies that used boys and girls have concluded that higher eating disorder
occurrence rate were among girls (Musaiger, et al., 2013; Radmanovic-Burgic, et al., 2011). In
addition, the study did not intend to compare between boys and girls eating attitudes. The
questionnaires were sent to 550 students, 42 students were absent. The total respond number was
508 students.
Measurement tools
All instruments used the Arabic language, since all school students are originally native Arabic
speakers.
Anthropometric measurements
Height (cm) and weight (kg) collected using calibrated machines by nurses, dietitian, and physical
education teachers, and Body mass index (BMI) calculated by a dietitian using the shown formula.
BMI= 𝑴𝒂𝒔𝒔 (𝑲𝒈)
(𝑯𝒆𝒊𝒈𝒉𝒕 (𝒎))𝟐
All measurements took with minimal clothing and without shoes.
Questionnaires
Eating Attitude Test (EAT 26), adapted from American Center of Psychiatry and Neurology, in UAE
(2014). It is the most widely used as self-reported tool for screening large population for symptoms,
attitudes, and characteristic of DEA (Epen et al, 2006). EAT-26 Arabic version used for this study
and it’s been used among adolescents, aged between 12 and 18 in some Arabic countries such as
UAE, Oman, and Jordan (Abdulrahman O. et al, 2010). EAT-26 consists of 26 questions to measure
DEA. Each item has a 6-point scale responses ranging from always to never. Always to often scored
from 3 to 1 respectively, however sometimes, rarely and never have 0 score. Except for the questions
number 26, in which never, rarely, and sometimes scored from 3 to 1 respectively, and always,
usually, often have 0 score. A score of 20 or above indicates negative DEA without classifying
specific diagnoses. The EAT-26 test evaluates a general range of symptoms such as anorexia, weight
concern, eating attitudes, dieting, binge eating, and bulimia. The only modification in the analysis of
the questionnaire that was different in this study from to what it is recommended was the following:
2 different questions about the occurrence of vomiting existed; for further accuracy, the results of
the 2 were combined in this study. The answers that were considered are: all of the times, most of
the time, usually, and none.

111 | P a g e
The Body Figure Rating scale (BFR), (Harris CV, et al, 2007) consists of ten women’s body
shape images, weight classifications are based on measured BMI; underweight to class ׀׀׀ obesity,
each category has one or two body shape pictures shown in figure 1. Participants were asked to select
a body shape that represents their current shape, followed by the selection of their desired body
shape. The data calculated using an index for body satisfaction by measuring the discrepancy
between the actual and desired body shape. Underweight =1, normal = 2, overweight = 3, obese class
Then Actual-Desired Discrepancy was calculated using the .6= ׀׀׀ obese class ,5= ׀׀ obese class ,4= ׀
below formula:
𝐀𝐜𝐭𝐮𝐚𝐥 − 𝐃𝐞𝐬𝐢𝐫𝐞𝐝 𝐃𝐢𝐬𝐜𝐫𝐞𝐩𝐚𝐧𝐜𝐲 = 𝐷𝑒𝑠𝑖𝑟𝑒𝑑 𝐵𝑜𝑑𝑦 𝑆ℎ𝑎𝑝𝑒 − 𝐴𝑐𝑡𝑢𝑎𝑙 𝐵𝑜𝑑𝑦 𝑆ℎ𝑎𝑝𝑒
“ A zero “Actual-Desired Discrepancy” score indicated that the actual body size agreed with
the desired body size. A negative “Actual-Desired Discrepancy” score indicated that the
desired body size was smaller than actual body size. “Actual-Desired Discrepancy” scores
showed whether participants had unrealistic weight goals” (Tsai, Chang, Lien, & Wong,
2011).
For example, if the actual body shape was indicated as overweight ( the 3rd level in the body
shape scheme), and the chosen desired was normal wieght ( 1nd level in the body shape scheme) then
the difference would be: “desired Body Shape – Actual Body Shape”= “1” – “3” = “-2”; indicating
a desire to be less than the current status by two categories of BMI.
Unstructured individualized Interviews
Figure 1, The BFR scale conducted by Harris CV, et al, 2007.

112 | P a g e
Semi structured qualitative interviews were conducted for 52 students randomly chosen with
high Actual-Desired Discrepancy and DEA. One dietitian conducted the interviews. The selected
students first asked to explain possible reasons for BD, if student has difficulties in expressing, then
the interviewer suggested possible reasons based on the previous literature in Arab and non-Arab
population. Many different factors contributed to DEA according to previous literature. Families
play an important role in developing ED by emphasizing on “attractiveness and thinness” (Kluck. A
,2008. Kluck A. S., 2010). Moreover, being previously or currently obese or overweight was seen as
a pre-determinant of DEA; in addition to strong negative effect of mass media and peers (Musaiger,
et al., 2013). Finally, psychological factors such as anxiety, depression or low self-steam and,
criticism, bullying and food related harmful experiences (Tsai, Chang, Lien, & Wong, 2011).
Procedure
Schools were asked to provide the researcher with a recent student name lists, classes, and
nationalities. All of the public high schools in Sharjah were included in the study.
Classes were selected from the school by simple random method. The questionnaires were
coded according to the schools name and student classes in order to protect the privacy of the
students. Only the researchers had an access to the students’ names and classes. Participants were
asked to sign a consent form and then do the test, afterward height, and weight were measured in the
nurse’s room for each student separately. Completing the questionnaires required around 10 minutes
for each class and the measurements required around 20 minutes. Individualized interviews were
completed for 52 students with highest scores in EAT-26 and Actual-Desired Discrepancy.
Project Timeline
Ten weeks were needed for the actual study conduct. Two weeks were needed for obtaining the
approval of accessing schools form from Sharjah educational zone. Three weeks were used for data
collection and entering. Two weeks were used for conducting interviews, and three weeks were
required for analyzing data and writing the research.
Data analysis
Data were first entered in an Excel file. Then, data were analyzed by statistical tools: SPSS program
version 16. Descriptive statistics used for frequencies and means with standards deviation (SD); a
Cross-tabulation and chi square used to identify possible relationships between the categorical study
variables.

113 | P a g e
Results
Underweight percentage among Sharjah high school female students was unexpected based on their
measured BMI, which is 27.8%, followed by 30.4% who were overweight or obese.
Descriptive analysis of the results showed that 37.8 % of the participants were having risk of
DEA and 62.2 % were normal (Table 1.1).
Moreover, 65.2% of the students have BD (Table
1.2).
Table 1.1: Prevalence of DEA among Female Adolescents in Sharjah (N=508)
Table 1.2: Prevalence of Body Dissatisfaction among Female Adolescents in Sharjah (N=508)
A cross-tabulation between BMI and DEA using chi square showed no significant
relationship between the two. However, the P value approached significance.
Results showed that 39.7% and 44.1% of the underweight and the overweight respectively appeared
to be at risk of DEA measured by EAT 26 questionnaire (Table 2).
Table 2: Correlation between BMI category and DEA (508).
BMI Categories
Underweight Normal Overweight & Obese P-value
Eat 26
No Disorder EA ( <
20 score) 60.28% 67.77% 55.84% 0.060
DEA
(> 20 score ) 39.72% 32.23% 44.16%
* Chi Square was used for the analysis
One-way ANOVA was used for analyzing the correlation between a categorized variable
(BMI) and a continuous variable (EAT-26 results). Results showed that p value only approached
significance but stayed above 0.05 (Table 3).
n %
Without DEA 316 62.2
With DEA 192 37.8
n
%
Without BD 177 34.8
With BD 331 65.2
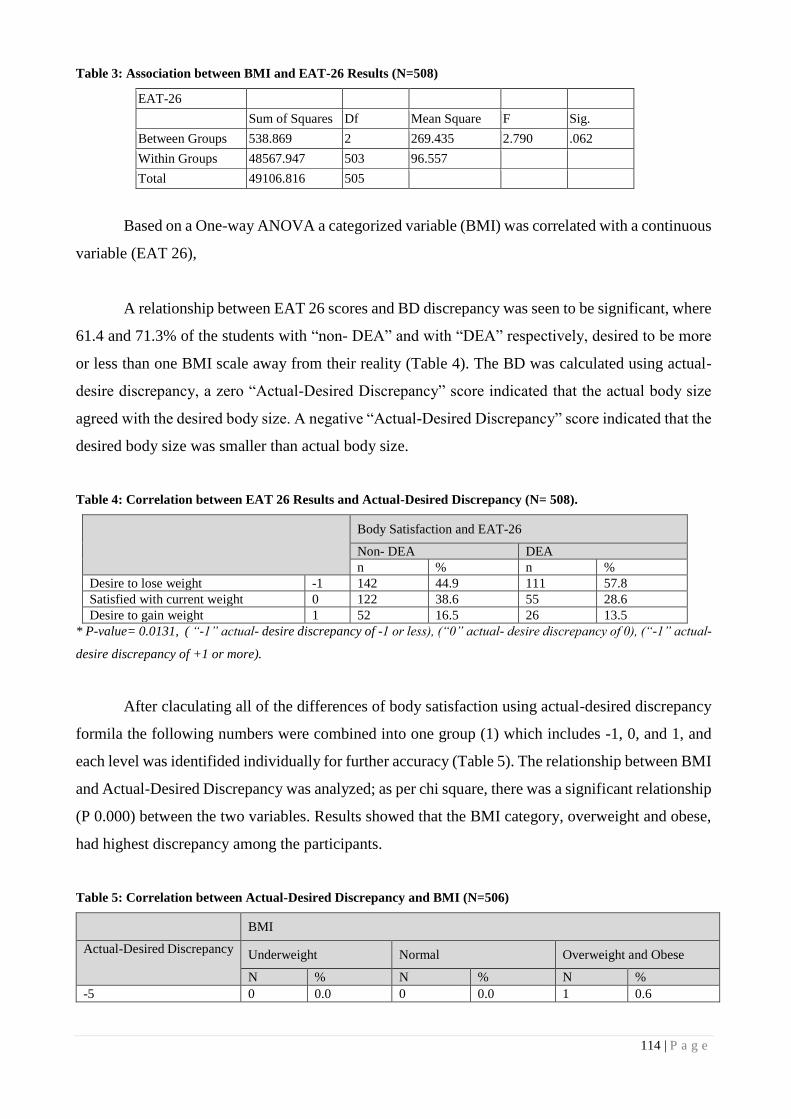
114 | P a g e
Table 3: Association between BMI and EAT-26 Results (N=508)
EAT-26
Sum of Squares Df Mean Square F Sig.
Between Groups 538.869 2 269.435 2.790 .062
Within Groups 48567.947 503 96.557
Total 49106.816 505
Based on a One-way ANOVA a categorized variable (BMI) was correlated with a continuous
variable (EAT 26),
A relationship between EAT 26 scores and BD discrepancy was seen to be significant, where
61.4 and 71.3% of the students with “non- DEA” and with “DEA” respectively, desired to be more
or less than one BMI scale away from their reality (Table 4). The BD was calculated using actual-
desire discrepancy, a zero “Actual-Desired Discrepancy” score indicated that the actual body size
agreed with the desired body size. A negative “Actual-Desired Discrepancy” score indicated that the
desired body size was smaller than actual body size.
Table 4: Correlation between EAT 26 Results and Actual-Desired Discrepancy (N= 508).
Body Satisfaction and EAT-26
Non- DEA DEA
n % n %
Desire to lose weight -1 142 44.9 111 57.8
Satisfied with current weight 0 122 38.6 55 28.6
Desire to gain weight 1 52 16.5 26 13.5
* P-value= 0.0131, ( “-1” actual- desire discrepancy of -1 or less), (“0” actual- desire discrepancy of 0), (“-1” actual-
desire discrepancy of +1 or more).
After claculating all of the differences of body satisfaction using actual-desired discrepancy
formila the following numbers were combined into one group (1) which includes -1, 0, and 1, and
each level was identifided individually for further accuracy (Table 5). The relationship between BMI
and Actual-Desired Discrepancy was analyzed; as per chi square, there was a significant relationship
(P 0.000) between the two variables. Results showed that the BMI category, overweight and obese,
had highest discrepancy among the participants.
Table 5: Correlation between Actual-Desired Discrepancy and BMI (N=506)
BMI
Actual-Desired Discrepancy Underweight Normal Overweight and Obese
N % N % N %
-5 0 0.0 0 0.0 1 0.6

115 | P a g e
-4 0 0.0 0 0.0 3 1.9
-3 1 0.7 2 0.9 19 12.3
-2 2 1.4 4 1.9 33 21.4
1 137 97.2 205 97.2 98 63.6
3 1 0.7 0 0.0 0 0.0
P value 0.000
* Chi Square was used for the analysis
¶ As described in the method above the ( “-5” a desire to have BMI that is 5 levels less),( “-
4” a desire to have BMI that is 4 levels less), ( “-3” a desire to have BMI that is 3 levels less),
( “-2” a desire to have BMI that is 2 levels less), ( “1” satisfied with current BMI, or a desire to have
BMI that is 1 levels less ),
( “3” a desire to have BMI that is 3 levels more).
Extraordinarily, 14.6 % of the students admitted vomiting. Data were analyzed to assess the
effect of EAT-26 results and BMI on occurrence of vomiting (table 6). A significant association
between EAT 26 and occurrence of vomiting was observed, with P value = 0.000. Moreover,
percentage distribution showed that 92% of participants without DEA had not experienced vomiting
yet only 74% was the case for the participants with DEA. In addition, no association was noted
between BMI and occurrence of vomiting, remarkably 11.3% and 19.7% of underweight and
overweight students admitted vomiting respectively.
Table 6: Effect of EAT 26 Results and BMI on Occurrence of Vomiting (N =508)
Occurrence of
Vomiting
EAT 26 BMI
Non-DEA DEA Underweight Normal Overweight
and Obese
% % % % %
NONE 92.4 74 88.72 89.5 80.3
Most of the time 4.1 7.8 3.76 3.5 8.2
Usually 2.2 9.4 4.51 4 6.1
All the time 1.3 8.9 3.01 3 5.4
P Value 0.000 0.266
* Chi Square was used for the analysis
Out of the students with highest DEA and Actual-Desired Discrepancy, 52 were randomly
chosen for unstructured individualized interviews. The results in table 5, showed that 76.9% of these
selected participants have been influenced by one or more of their family member including (parents,
sisters, brothers, and aunts) by emphasizing on thinness, verbal insults, and non-satisfaction with
girls shapes and appearances. In addition, media (western view of women, models, and celebrates)
have negatively influenced 73.1% of the participants. Moreover, 71.2% of the participants who were
obese or have been obese in the past were affected by their shape and developed DEA. Finally, 71%

116 | P a g e
of the participants who been bullied because of their shape or weight at either home or school or
both.
Table 7: Unstructured Interviews Answers (N=52)
% of
students
(n=52)
Answers
76.9 Family
73.1 Media
71.2 Obesity
69.2 A person in the family is dieting
50 Bullied at home only
40.4 Stress
34.6 Low confident
15.3 Bullied at school and home
5.77 Bullied at school only
Discussion
This was the first study in the UAE where in-depth interviews were conducted and culture specific
determinants of DEA were identified. Moreover, the study was able to identify an up-to-date
prevalence of DEA and body image dissatisfaction among adolescent school-girls aged 15-18 years
in Sharjah.
Prevalence of DEA in Sharjah
The results confirm the first hypotheses that DEA is at the rise among adolescent schools girls in
Sharjah as compared to previous literature. Descriptive analysis of the results showed that 37.8% of
the participants are having risk of DEA, which is greater the previous prevalence (23.4%) in 2006
by Eapen et al and that in 2013 (37.4%) by Musaiger, et al. among the same population.
The prevalence of DEA in other Arab countries was less than our finding. Oman and Saudi
Arabia had 29.4% and 24.6% of DEA respectively (Al-Adawi et al., 2002; Al-Subaie, 1999).
Moreover, Egypt and Syria had a prevalence of 11.2% and 32% of DEA (Okasha& Elkholy, 2012;
Musaiger, et al., 2013). However, Jordan and Kuwait had higher numbers of DEA than Sharjah
which are 40.5% and 42.8% respectively (Mousa, Mashal, Al-Domi & Jibril, 2010; Musaiger, et al.,
2013).
In comparable with international findings: Korea, Japan, Taiwan, and Italy; adolescent girls
had almost three times lower DEA (Yang, Choi,& Lee, 2001; Nishizawa et al., 2003; Tsai, et al,

117 | P a g e
2011; Marchesi, et al., 2001). In addition, Greece and Canada had 24.6% and 16% of DEA among
adolescent girls respectively (Costarelli, et al., 2011; Jones, et al., 2001).
BMI and DEA
Current study results show that 39.7% and 44.1% of the underweight and the overweight are
respectively appear to be at risk of DEA. The relationship between BMI and EAT 26 results is not
significant (P value: 0.060) yet it approached significance. For further clarification, we analyzed the
results using one- way ANOVA. The results were reaching significant because the total number of
participants with normal BMI is 229. However, only 52 have BMI that is more than 23 and the
majority has BMI that is less than 22, which affected the significant of the association between BMI
and EAT-26. Madanat, et al., 2007, have agreed with our finding. In line with this, earlier finding
have found that BMI did not affect EAT-26 score. Many other studied have opposed this finding
reporting that BMI was positively correlated with EAT-26 scores (Schulte & Thomas, 2013; Eapen,
et al., 2006; Kaluski, et al., 2008; Musaiger, et al., 2013; Costarelli, et al., 2011). One of the main
reasons of our finding not reaching significant is the sample size that is much smaller than previous
studies.
Body dissatisfaction and EAT-26 results
The current study indicates that 61.4% and 71.3% of the students with “non- DEA” and with “DEA”
respectively, desired to be approximately one or more BMI scale away from their reality. The
relationship between EAT-26 and BD is significant and it indicates that BD can be one of the major
risk factor that leads to eating disorder. Several studies are consistent with the present finding proving
that DEA is associated with BD (Tsai, Chang, Lien, & Wong, 2011;Tissot, et al., 2009;Schulte &
Thomas, 2013; Costarelli, et al., 2011; Eapen,et al., 2006).
Body dissatisfaction and BMI
In the current study, results showed that overweight and obese participants have the highest body
satisfaction discrepancy. These results were anticipated, because girls who are overweight or obese
are normally unsatisfied with their body and desire a normal weight. This creates BD. Thus, our
findings are in line with other researches stating that BD is significantly correlated with overweight
and obesity (Radmanovic-Burgic, Gaveic, & Burgic, 2011; Mousa, Mashal, Al-Domi, & Jibril, 2010;
Madanat, Brown, & Hawks, 2007).

118 | P a g e
Self-induced vomiting and EAT 26
Our finding shows that 26% of adolescent with DEA are inducing vomiting for weight lose proposes.
Spuriously, 7.6% of healthy adolescents without DEA have reported vomiting too. Unfortunately,
other researches, which were conducted in other countries, found smaller number of self-induced
vomiting than us. A study conducted in Israel showed that 14% of the school girls reported ever
made themselves vomit (Kaluski, et al., 2008). Additionally, in Canada 8.2% adolescents have
reported self-induced vomiting (Jones, et al., 2001). Another study have coducted in US by Kluck
A. S., 2010, which investigated that 20% of adolescents had Bulimic symptoms. As known vomiting
is a harmful behavior for food control and it is one of the major symptoms of bulimia. Moreover,
vomiting for reducing weight purposes is not healthy and it is an issue by itself even if there was no
bulimia diagnosis. Our finding indicates a significant relationship between vomiting and DEA.
Costarelli, et al., 2011, finding is supporting our finding about the assosiation between DEA and
vomiting.
Remarkably, our finding indicates no association between self-induced vomiting and BMI. However,
11.3% and 19.7% of underweight and overweight students were vomiting respectively.
Eating disorders determinants in the Sharjah
Family, media, obesity, and bullying were found to have strong influence on developing DEA among
adolescents in Sharjah.
While conducting interviews one girl had all of the anorexic symptoms, however no medical
diagnoses was preformed because it was not the purpose of the study.
The current study investigates different factors that can cause DEA among adolescents. The
data shoes that families influenced 76.9% of the students by emphasizing on thinness, negative
comments, and non-satisfaction with girls shapes and appearances. Receiving negative comments
from the parents or one of the family’s members was the major problem within the participants.
Although, some of the participant had ideal body shape with BMI ranges from 18 to 22, but they
thought that there are overweight because of their families’ point of views. Kluck A. S., 2010, found
that negative comments about the daughters’ weights or shapes by the parents are increasing their
BD. In contrast, adolescents who have healthy relationships with their parents seem to have less
concern about their body shape (Swarr & Richards, 1996). This finding is contradicting with the
previous thought that plump women are more attractive in UAE society (Musaiger A. O., 2011)
Indeed, this idea was common previously, however the huge economically and socio-psychological

119 | P a g e
status have changed it dramatically. Unfortunately, there is no recent study that investigate the
current preference of women shape and weight among UAE or Gulf Corporation Counsel “GCC”.
Our finding shows that Media is influencing 73.1% of the participants negatively. Media is
playing an important role in increasing the prevalence of ED among adolescents (The McKnight
investigators, 2003). Several studied have found a strong association between thin media image and
body image ( Field , et al., 1999; McCabe & Ricciardelli, 2001; Madanat et al., 2010, Ragab, 2007)).
Moreover, Mousa, et al., 2010, investigated that participents who were highly affected by media had
high level of body image disturbance, opposed with girls who were not affected by media were
healthier. Additionally (Madanat, et al., 2007), found that adolescents who were influenced by media
were 2.9 times more likely to want to lose weight compared with those who did not influenced by
media. Effort should be done to decrease the influence of media and westrealization pressure among
adolescent girls in UAE in order to prevent further increase in the prevalence of DEA.
Bullying in either home or school is influencing the adolescents with DEA by 71%.
Unfortunately, three cases of bullying where done by teachers in the school. Girls who were exposed
to negative comments regarding weigh from both parents and peers had doubled the probability of
revealing body image dissatisfaction (Mousa, Mashal, Al-Domi, & Jibril, 2010).
Limitations
Cross-sectional design that can not asses the progress of symptoms over time.
Recommendation
Increasing the awareness of DEA among families and teachers rather than adolescent
Further investigation is required for bulimia or self-induced vomiting for the same age group.
The authorities should initiate programs about the health impact of self-induced vomiting in
the high schools.
In depth researches about the ways and the places of bullying regarding to weight or shape
among the same age group is needed.
Conclusion
The study is aiming to update the prevalence of DEA among young Emirati adolescents. Moreover,
is to ascertain the prevalence of self-induce vomiting and BD among adolescents in Sharjah. Finally

120 | P a g e
is to specify the unique determinants of DEA among Emirati adolescent girls. EAT-26 questionnaire,
BFR scale, and individualize unstructured interviews were used to conduct the data.
The study shows a high prevalence of eating disorder, occurrence of self-induced vomiting and BD
among schools adolescents in sharjah high schools. Moreover, the major leading factors for DEA
are family, media, and bullying.
Finally, future studies should emphases on educational campaigns in schools and in the families
targeting eating disorders and it determinants to prevent further decline in health of the young
generation in UAE.
References
American center of Psychiatry and Neurology, in UAE .Eating-Attitudes-Test-EAT-26.
http://www.americancenteruae.com/wp-content/uploads/2012/10/Eating-Attitudes-Test-EAT-26.pdf
retrieved at 24 march 2014
Al-Adawi, S; Dorvlo, A; Burke, D T; Al-Bahlani, S; Martin, R G; Al-Ismaily, S;. (2002). Presence and
severity of anorexia and bulimia among male and female Omani and non-Omani adolescents. Journal of the
American Academy of Child and Adolescent Psychiatry, 41, 1124–1130.
Al-Subaie, A. (1999). Eating attitudes test in Arabic. Psychometric features andnormative data.
Neuroscience,, 4, 46–52.
Bradlyn, A., Coffman, J., Gunel, E., Cottrell, L., & Harris, C. V. (2007). BMI-based body size guides for
women and men: development and validation of a novel pictorial method to assess weight-related concepts.
international jornal of obesity, 1-7.
Costarelli, S., Antonopoulou , K., & Mavrovounioti, C. (2011). Psychosocial Characteristics in Relation to
Disordered eating attitudes in greek adolescents. European Eating Disorders Review, 19, 322–330.
Dobmeyer, A. C., & Stein, D. M. (2003). A prospective analysis of eating disoder risk factors: drive for
thinness, depressed mood, maladaptive congintion, and ineffectiveness. Eating Behaviors, 135-147.
Eapen, V., Mabrouk, A. A., & Bin-Othman, S. (2006). Disordered eating attitudes and symptomatology
among adolescent girls in the United Arab Emirates. Eating Behaviors, 7, 53-60.
Lieberman, M., Gauvin, L., Bukowskic, W. M., & White, D. R. (2001). Interpersonal influence and
disordered eating behaviors in adolescent girls The role of peer modeling, social reinforcement, and body-
related teasing. Eating Behaviors, 2, 215,231.
Fairburn , C. G., & Harrison, P. J. (2003). Eating disorders. The Lancet, 361, 407 - 416.

121 | P a g e
Field , A. E., Cheung , L., Wolf , A. M., Herzog , D. B., & Gortmake. (1999). Exposure to the mass media
and weight concerns among girls. American Academy of Pediatrics, E36.
Jones, J. M., Bennett, S., Olmsted, M. P., Lawson, M. L., & Rodin, G. (2001). Disordered eating attitudes
and behaviors in teenaged girls: a school-based study. Canadian Medical Assosiation or its licensors, 547-
551.
Kaluski, D. N., Natamba, B. K., Goldsmith, R., Shimony, T., & Berry, E. M. (2008). Determinants of
Disordered Eating Behaviors among Israeli Adolescent Girls. Routledge, 146-159.
Kluck, A. (2008). Family factors in the development of disordered eating: Integrating dynamic and
behavioral explanations. Eating Behaviors, 9, 471-483.
Kluck, A. S. (2010). Family influence on disordered eating: The role of body image dissatisfaction. Body
Image, 8-14.
Madanat, H. N., Lindsay, R., & Combell, T. (2010). Young urban women and the nutrition transition in
Jordan. Public Health Nutrition , 14, 599–604.
Madanat, H., Brown, R., & Hawks, S. (2007). The impact of body mass index and Western advertising and
media on eating style, body image and nutrition transition among Jordanian women. Public Health
Nutrition:, 10, 1039–1046.
Marchesi, C., Gariboldi, S., Maggini, C., & Ampollini, P. (2001). Risk Factores for Eating Disorders in
Italian Adolescents. Adolescent health, 29-385.
McCabe , M. P., & Ricciardelli, L. A. (2001). Parent, peer, and media influences on body image and
strategies to both increase and decrease body size among adolescent boys and girls. Adolescence.
Adolescence. , 36:225–240.
Mousa, T. Y., Mashal, R. H., Al-Domi, H. A., & Jibril, M. A. (2010). Body image dissatisfaction among
adolescent schoolgirls in Jordan. Body Image, 7, 46-50.
Musaiger, A. O. (2011). Overweight and obesity in Eastern Mediterranean Region Prevalence and possible
causes. Journal of Obesity, 407237, 17.
Musaiger, A. O., Al-Mannai, M., Tayyem, R., Al-Lalla, O., Ali, E. Y., Kalam, F., et al. (2013). Risk of
disorder eating attitudes among adolescent in seven Arab countries by gender and obesity: A cross-cultural
study. Appetite, 60, 162-167.
Neumark-Stztainer, D., & Hannan, P. J. (2000). Weight related behaviors among adolescent girls and boys.
Archives of Pediatrics and Adolescent Medicine, 154, 569-577.

122 | P a g e
Nishizawa, Y., Nishizawa, K., Kida, K., Hashiba, S., Saito, K., & Mita, R. (2003). Perception of self-
physique and eating behavior of high school students in. Psychiatry and Clinical Neurosciences, 57, 189–
196.
Okasha, T., & Elkholy, H. (2012). A synopsis of recent influential papers published in psychiatric journals (
2010-2011) from the Arab World. Asian Journal of Psychiatry, 5, 175-178.
Radmanovic-Burgic, M., Gaveic, Z., & Burgic, S. (2011). Eating attitudes in adolescent girls. Psychiatria
Danubia, 23, 64–68.
Ragab, S. (2007). Media Messages and Womens' Body Perceptions in Egypt. Georgia State University, 30.
Schulte, S., & Thomas, J. (2013). Relationship between eating pathology, body dissatisfaction and
depressive symptoms among male and female adolescents in the United Arab Emirates. Eating Behaviors,
14, 157-160.
Swarr, A. E., & Richards, M. H. (1996). Longitudinal effects of adolescents girls’ pubertal development,
perceptions of pubertal timing, and parental relation on eating problems. Developmental Psychology, 32,
630–646.
The McKnight investigators. (2003). Risk dactors for the onset of eating disorders in adolescent girls:
results of the Mcknight longitudinal risk factor study. The Amrican jornal of psychiatry, 248- 254.
Tissot, A., Crowther, J., & Lantzouni, E. (2009). Eating disordered risk factor diffrences in female
adolescents. Adolescent Health, 44.
Tsai, M.-R., Chang, Y.-J., Lien, P.-J., & Wong, Y. (2011). Survey on eating disorders related thoughts,
behaviors and dietary intake in female junior high school students in Taiwan. Asia Pac J Clin Nutr, 20, 196-
205.
Yager, Z., & O'dea, J. A. (2008). Prevention program for body image and eating disorders on University
campuses: a review of large, controlled intervention. Health Promotion International, 23, 173-189.
Yang, S., Choi, Y., & Lee, H. (2011). Eating attitudes, ego-identity, and self-esteem among the urban high
school girls. Korean Neuropsychiatric, 40, 477–486.

123 | P a g e
Prevalence and Pattern of Traditional and Complementary Alternative Medicine Use in Diabetic Patients in Dubai, UAE
Usama ALAlami
Zayed University, UAE
Munawwar A. Khan
Zayed University, UAE
Khulood A. Saeed
Zayed University, UAE
Abstract
Purpose: The current study explored the prevalence and pattern of traditional and complementary alternative
medicine (TCAM) use, its perceived benefits and possible impact on health outcomes amongst diabetics in
Dubai, UAE.
Significance: Diabetes is highly prevalent in the UAE, with diabetics potentially not complying with the
prescribed conventional medicines, or preferring to use of traditional and complementary alternative
medicines. The current study therefore sheds light on these two areas.
Methods: A descriptive cross-sectional pilot study was conducted in 4 healthcare facilities in Dubai using
quantitative data collection methods. Using a systematic random sampling method, 145 diabetic participants
completed a self-reported questionnaire. Measures in the questionnaire included traditional and
complementary alternative medicine use, and perceived benefits. SPSS version 21 was used for result
analysis. Chi-square test was used to confirm significance amongst various groups.
Results: Amongst 145 diabetic participants recruited, 66.9% were female, and 57.9% had undergraduate
degree. Majority of participants (95.2%) had type II diabetes. Participants age was between 20 to 79 years.
The prevalence of TCAM use amongst the participants was 21.4%, with the majority of users being female
(27.8%). TCAM use was more common amongst housewives (28.6%). None of the TCAM users had the
intervention prescribed by a health specialist, and the majority (51.6%) used it for the purpose of slowing the
progression of the disease. More than half (58.1%) of TCAM users reported receiving the desired effect, and
77.4% used TCAM in combination with the prescribed conventional medicine.
Conclusion: The current study confirmed the un-prescribed use of TCAM amongst participants in Dubai,
UAE. Further studies are required to elaborate on the interaction between TCAM and prescribed
conventional medicines.
Keywords: Alternative Medicine, Diabetes Mellitus, Traditional Therapies, Herbs

124 | P a g e
Introduction
Traditional medicine is defined by the World Health Organization (WHO) as a set of knowledge;
skills and practices integrated to different cultures, and is used in healing and maintenance of health.
Complementary Alternative Medicine (CAM) is not linked directly to traditional medicine of some
countries, nevertheless, it encompasses practices that aim to improve and maintain health (WHO,
2015). Examples on traditional and complementary alternative medicine (TCAM) varies from herbal
remedies, acupuncture, hijama to traditional Indian and Chinese medicines (Haad, 2015).
Diabetes mellitus is becoming a major public health issue worldwide due to its high
prevalence, and its association with other health complications. Recent International Diabetes
Federation figures revealed that 382 million people in the world live with diabetes, and this number
is projected to increase to 592 million by 2035 (International Diabetes Federation, 2015). In United
Arab Emirates (UAE), approximately 19% of the population are living with diabetes, and this
number is projected to elevate to 32% by 2020 (Diabetesuae, 2015). The socio-economic changes
that occurred have encouraged a sedentary lifestyle, and increased obesity rates. The preceding
factors are considered main contributors to the development of diabetes, and are preventable.
Diabetes management requires constant self-care. This involves adherence to components of the
treatment plan which includes following a healthy diet, being physically active, and receiving anti-
diabetic medicines.
Evidence points out to an increasing number of individuals using traditional and
complementary alternative medicine as a mode of disease management, including diabetes
(Eisenberg et al., 1998). This may have serious implications on the patient’s health when taken with
conventional medical treatments, or when patients abandon the conventional treatments in favor of
TCAM. The National Center for Complementary and Alternative Medicine reported that several
dietary supplements proved to be ineffective in treating diabetes, and were linked to side effects such
as hypoglycemia and kidney problems. Amongst them were chromium supplements used in
controlling diabetes, which were shown to have side effects such as kidney disease and muscular
problems. Herbal medicines like cinnamon have no clear benefits for diabetics. Nonetheless, it can
lead to liver disease, and hemorrhage due to interaction of coumarin substance in cinnamon with
blood thinners (NCCAM, 2015).
125 | P a g e
Objectives
Data is sparse regarding the usage of traditional and complementary alternative medicine amongst
diabetics in the UAE. To provide preliminary data for further studies, we set out to investigate the
prevalence and the pattern of traditional and complementary alternative medicine use amongst
diabetes patients in Dubai, to determine the perceived benefits of TCAM, and to determine the health
outcomes.
Methods
Study design and settings
This descriptive cross-sectional pilot study was conducted in 4 healthcare facilities in Dubai, UAE.
Similar studies had been conducted in other Emirates of the UAE. We therefore decided to conduct
the study in Dubai due to the differing cultural map compared to the other Emirates. The study used
a questionnaire as a quantitative method for data collection. Chosen healthcare facilities were
informed about the study through official e-mails, based on their request. Ethical approval was
obtained from the Zayed University Ethics Committee and the healthcare facilities. An inclusion
criterion was participants using TCAM on a daily basis. Furthermore, consent form was signed by
patients. After signing the consent, the researcher provided patients with instructions.
Questionnaires were completed in the waiting area without the presence of the researcher or
the health specialist.
Population and sampling
The pilot study participants consisted of 145 diabetic patients out of 385 sample size calculated using
the following equation, Sample Size = (Z-score)² * StdDev*(1-StdDev) / (margin of error)², with
95% confidence level, 0.5 standard deviation, and 0.05 confidence interval.
Out of 145 participants, 66.9% were females and 33.1% were males. Patients age group was between
20 to 79 years, and those under 18 years were excluded from the study.
The onset of diabetes starts at age of 18, and peaks from 20 to 79 years of age (Haad, 2015).
All participants were UAE nationals. The study involved patients with type I and type II diabetes,
excluding pregnant women with diabetes.

126 | P a g e
The method of sampling employed was systematic random sampling. Appointment list was
obtained from the participating healthcare facilities to determine the number of appointments in the
designated days. Every fifth patient was asked to take part in the study voluntarily.
Instrument
The research instrument was developed by the researchers, based on previous literatures by Naja et
al., (2014) and Wazaify et al., (2011). The questions were approved by health specialists. The
questionnaire was translated to Arabic to avoid language barriers. It was piloted on 10 diabetic
members of the community. The results of the pilot study were excluded from the study analysis.
Measures
Traditional and complementary alternative medicine
Patients were asked if they utilized TCAM as a mode of diabetes management. The responses
provided were: (yes/no). If the participants response was yes, then they were asked to specify
whether it was prescribed by health specialist, and if they used it in addition to the conventional
medicines. Moreover, participants reported reasons for taking TCAM.
Perceived benefits
Patients were asked if they experienced benefits from TCAM usage. The responses were: (yes/no).
They were then asked in a self-reported question if they experienced any complications that were
associated with TCAM.
Data Analysis
Data was analyzed using SPSS program version 21. Chi-square analysis test was used to test for any
significant differences between groups. Level of significance was set at p-value less than 0.05.
Results
Demographic Characteristics
Table 1 summarizes the demographic characteristics of the research participants, and the frequency
of using TCAM. Out 145 participants 21.4% use TCAM. Majority of participants were females
(66.9%), out of which they constituted the majority of TCAM users (27.8%). Significance difference
was observed between both genders with relation to TCAM use (p=0.009). More than half of
participants (57.9%) had undergraduate degree, 20% had high school certificate, and 20.7% of
participants had no formal education. The highest frequency of utilizing TCAM was amongst

127 | P a g e
participants with a high school certificate (27.6%) followed by ones with an undergraduate degree
(26.2%). The vast majority of participants had type II diabetes (95.2%). Participants age range was
20 to 79 years old. Around (39%) of participants were housewives, and they had the highest
frequency of TCAM usage (28.6%). Similarly, 28% of TCAM users were employees. Significant
different was found between housewives and self-employed participants (p= 0.029), Table 1.
Table 1- Demographic Characteristic of the Research Participants (n=145)
Characteristics Number Percent (%) Utilizing
TCAM
Number (%)
P-value
Gender Male
Female
48
97
33.1
66.9
4 (8.3)
27 (27.8)
P=0.009
Education Level No formal
education
High school
Undergraduate
degrees
Postgraduate
degrees
30
29
84
2
20.7
20.0
57.9
1.4
1 (3.3)
8 (27.6)
22 (26.2)
0
*
Type of Diabetes Type I
Type II
7
138
4.8
95.2
0
31 (22.5)
*
Age group 20-29
30-39
40-49
50-59
60-69
70-79
27
32
38
30
14
4
18.6
22.1
26.2
20.6
9.7
2.8
2 (7.4)
5 (15.6)
16 (42.1)
7 (23.3)
1 (7.2)
0
*
Employment
Status
Employee
Self-employed
Retired
Housewife
Student
50
24
3
56
12
34.5
16.5
2.1
38.6
8.3
14 (28.0)
1 (4.2)
0
16 (28.6)
0
P=0.026
*No significant difference
Pattern of TCAM Use
Table 2 shows the pattern of use of TCAM by diabetics. All TCAM users amongst the study
participants stated that they utilize TCAM without a prescription from the diabetes health specialist.
The most prominent reason for using TCAM was its effect in slowing the progression of the disease
(51.6%), followed by its perceived safety in comparison to conventional medicines (32.3%).
Amongst users of TCAM, 41.9% reported that they did not get the desired effect. However, the
58.1% received the desired effect stated that they had recommend the remedy to other diabetics.
Most of TCAM users said that they take it in addition to the prescribed conventional medications
(77.4%), while 22.6% said they have abandoned the conventional medicine because TCAM was

128 | P a g e
safer. Some of the common negative health outcomes reported by the users were hypoglycemia,
fatigue, slow heart rhythm, kidney damage, and impotence.
Table 2- Pattern of Use of TCAM by Diabetic Patients
Characteristics Percent (%)
Is the TCAM prescribed by
Diabetes Health
Specialist?
No 100.0
Why do you use TCAM? Slows the progression of
the disease.
Treats complications of
diabetes.
Safer compared to
conventional medicines.
51.6
16.1
32.3
Did you receive the desired
effect?
Yes
No
58.1
41.9
Did you take TACM with
the conventional
medicine?
Yes
No
77.4
22.6
Discussion
Popularity of traditional remedies as well as complementary and alternative medicines is indigenous
in the Middle East region, and the UAE is no different to that. The predominant reason for this
popularity is the belief that TCAM is natural, thus safer. However, use of TCAM in conjunction with
conventional drugs can have adverse consequences due to possible interactions with drugs, or lack
of evidence of safety (WHO, 2015).
This current study revealed that 21.4% of diabetics had used TCAM. The utilization of
TCAM was significantly associated with demographic variables such as gender, and employment
status. TCAM was widely used amongst females and housewives, 27.8% and 28.6% respectively.
Similar studies conducted in several Middle Eastern countries showed supporting results. Wazaify
et al., (2011), Al-Saeedi et al., (2015), Shtayeh et al., (2011), Al-Kindi et al.,(2011), Naja et al.,
(2014) and Al-Asadi et al., (2015) have shown that the prevalence of TCAM use amongst diabetic
patients in the studied-countries was high, yet the percentages varied. This can be attributed to
different definitions of TCAM used in the studies. A study conducted in the United States (USA)
also showed that diabetics are 1.6 times more likely to use TCAM compared to non-diabetics (Egede
et al., 1998). In Jordan, Saudi Arabia and Palestine , Wazaify et al., (2011), Al-Saeedi et al., (2015),
and Shtayeh et al., (2011) have shown that 18.1% ,33% and 51.9% of diabetic patients reported using
TCAM respectively, and the users were predominantly females. Although our study results didn’t

129 | P a g e
show significant association with level of education, TCAM use was more common amongst
participants with holders of high school certificate and Undergraduate qualifications. This result was
consistent with both studies conducted in USA and Lebanon. The study in Lebanon was conducted
to assess the prevalence and methods of TCAM use amongst diabetics. Out of 333 patients, 26.3%
of high school holders and 26.0% of university level degree holders use TCAM (Naja et al.,
2014).This can be explained by the fact that people with higher education might be interested in
updating their information about trendy methods used to improve the management of diabetes.
Alarmingly, all TCAM users in our study reported taking it without the prescription or
supervision of the diabetes health specialist. This result was consistent with another study conducted
in the Emirate of Ajman in the UAE, where 71.8% of the TCAM use was not through physician
prescription or supervision (Mathew et al., 2013). Similar finding was seen in the study conducted
in Palestine. Out of 1883 patients assessed, 68% did not refer to the physicians for prescription or
supervision on TCAM use (Shtayeh et al., 2011).
Furthermore, the majority of TCAM users in the current study reported using it together with the
conventional drugs. However, 22.6% reported using TCAM as a replacement for conventional drugs.
The main reason provided was their belief that TCAM was safer and more effective compared to
conventional drugs. Almost similar rate of diabetics abandoning the conventional drugs was seen in
Lebanon (20%) (Naja et al., 2014).The most prominent reason provided to use TCAM in the current
study was that it slows the progression of the disease. Similar result was observed in Palestine where
45.7% reported using TCAM to slow the progression of diabetes (Shtayeh et al. 2011). Nonetheless,
this study in addition to others showed that majority of TCAM users were satisfied with the results
(Shtayeh et al., (2011), Al-Kindi et al.,(2011), Naja et al., (2014), Al-Asadi et al.,(2015), Mathew et
al.,(2013).Despite that, special attention has to be given to those experiencing diabetes side effects.
In the current study, some TCAM users reported side effects such as hypoglycemia, fatigue, slow
heart rhythm, kidney damage, and impotence. Such conditions are of particular concern as diabetes
is the leading cause of many chronic diseases including chronic kidney disease; which can progress
to kidney failure (NCCAM, 2015).
Due to the limited sample size, further studies are required to acquire sufficient knowledge
on the prevalence and pattern of TCAM use amongst diabetic patients in the UAE. The information
can be used to develop clear guidelines on the use of TCAM in the UAE. It can also be incorporated
in clinical practices, and highlighted by diabetes health specialists when disseminating educational
information. Further studies are also required to elaborate on the possible physiological and

130 | P a g e
molecular mechanisms of action of TCAM, detailing their active constituents and the relationship of
that to potential specific benefits.
References
Al-Saeedi, M., Elzubier A.G., Bahnassi, A.A. & Al-Dawood, K.M. (2015) Patterns of belief and use of
traditional remedies by diabetic patients in Mecca, Saudi Arabia. Eastern Mediterranean Health Journal,
9(1-2), pp. 99-107.
Al-Kindi, R.M., Al-Mushrafi, M., Al-Rabaani, M. & Al-Zakwani, I. (2011). Complementary and
Alternative Medicine Use among Adults with Diabetes in Muscat Region, Oman. Sultan Qaboos University
Medical Journal, 11(1), pp. 62–68.
Al-Asadi, J.N. and Salih, N. (2015). Herbal remedies use among diabetic patients. Middle East Journal of
Family Medicine. 10(10), pp. 40-46.
Diabetesuae.ae (2015). Diabetes Facts | Diabetesuae. [Online] Available from:
http://diabetesuae.ae/diabetes/diabetes-facts [Accessed 5 Jan. 2015].
Egede, L., Ye, X., Zheng, D. and Silverstein, M. (2002). The Prevalence and Pattern of Complementary and
Alternative Medicine Use in Individuals With Diabetes. Diabetes Care, 25(2), pp.324-329.
Eisenberg, D., Davis, R., Ettner, S., Appel, S., Wilkey, S., Van Rompay, M. and Kessler, R. (1998). Trends
in Alternative Medicine Use in the United States, 1990-1997. JAMA, 280(18), pp.1569.
Haad.ae, (2015). [Online] Available from: https://www.haad.ae/HAAD/LinkClick.aspx?
fileticket=kbB6la3fsC8%3D&tabid=820 [Accessed 5 Jan. 2015].
Haad.ae, (2015). [online] Available from: http://www.haad.ae/HAAD/LinkClick.aspx?
fileticket=LrAOka_Zx3Q%3d&tabid=349 [Accessed 5 Jan. 2015].
International Diabetes Federation, (2015). Diabetes: facts and figures. [online] Available from:
http://www.idf.org/worlddiabetesday/toolkit/gp/facts-figures [Accessed 5 Jan. 2015].
Mathew, E., Muttappallymyalil, J., Sreedharan, J., John, LI, John, J., Mehboob, M. & Mathew, A. (2013).
Self-Reported Use of Complementary and Alternative Medicine among the Health Care Consumers at a
Tertiary Care Center in Ajman, United Arab Emirates. Ann Med Health Sci Res, 3(2), pp215–219.
Naja, F., Mousa, D., Alameddine, M., Shoaib, H., Itani, L. & Mourad, Y. (2014). Prevalence and correlates
of complementary and alternative medicine use among diabetic patients in Beirut, Lebanon: a cross-
sectional study. BMC Complementary and Alternative Medicine, 14, pp.185

131 | P a g e
NCCAM, (2015). Diabetes and Dietary Supplements. [online] Available from:
http://nccam.nih.gov/health/diabetes/supplements [Accessed 5 Jan. 2015].
Shtayeh, M.S., Jamous, R.M. & Jamous, R. (2012). Complementary and alternative medicine use amongst
Palestinian diabetic patients. Complementary Therapies in Clinical Practice, 18(1), PP.16-21
Wazaify, M., Afifi, F., El Khateeb, M. & Ajlouni, K. (2011). Complementary and alternative medicine use
among Jordanian patients with diabetes. 17th ed. [ebook] ElSevier Ltd., pp.71-75. Available at:
http://scholar.google.ae/scholar_url?url=http://www.researchgate.net/publication
/50986914_Complementary_and_alternative_medicine_use_among_Jordanian_patients_with_diabetes/file/
60b7d529596df35f2b.pdf&hl=en&sa=X&scisig=AAGBfm2UzZ8QYXO9jMSAQGAGO6PKOJyzmw&oi=
scholarr&ei=msKeVP_bOMOwUYOngKgL&ved=0CBoQgAMoADAA [Accessed 5 Jan. 2015].
WHO.int, (2015). WHO Traditional Medicine: Definitions. [online] Available from:
http://www.who.int/medicines/areas/traditional/definitions/en/ [Accessed 5 Jan. 2015].
WHO.int, (2015). WHO Diabetes. [online] Available from: http://www.who.int/mediacentre/
\factsheets/fs312/en/ [Accessed 5 Jan. 2015].

132 | P a g e
Surgical Education- The Experience With Hand Surgery
Vaikunthan Rajaratnam KTPH Alexandra Health, Singapore
Louise Crawford Tameside Hospital NHS Foundation Trust, UK
Richard Dias New Cross Hospital NHS, UK
Dominic Power UHB NHS FT, UK
Abstract
Digital education is changing the landscape of higher education and has the potential to improve education
opportunities for surgical trainees as they try to balance the demands of career, work-life and surgical
education. The aim of this project was to address these challenges with an online work-based learning
framework that offers self-paced, self-directed and on demand learning. The authors conceptualised,
developed and deployed an open online hand surgical learning program on the Moodle platform (learning
management system).
Hand and wrist injuries are an important component of the burden of health care cost. Education and training
are vital for quality care/ optimum outcomes of these patients. Current undergraduate curricula are
inadequate and do not allow for teaching hand surgery. Postgraduate hand surgery programs are exclusive
and are included as part of orthopaedic or plastic surgery programs.
The current need was for a program that is flexible and student-centred that allows for on-demand learning.
It has to be universally accessible, affordable and locally relevant.
With this back ground the authors developed the Moodle website, an open on line learning platform,
www.handsurgeryedu.com. This paper describes the processes for designing and developing an online
educational program in hand surgery from curricular development to open educational resource creation
and deployment with assessment online and analytics.
From the feedback of participants of the blended learning programs, and the analytics of the learning
management system we have found that it is possible to create and grow an online community of learners in
hand surgery education using Moodle as a learning management system. We found this platform augmented
post-graduate and undergraduate medical education and it is possible to enhance the learning experience of
students. It allows for better utilisation of face to face synchronous teaching. It also allows for universal
access to media rich digital assets.
Introduction

133 | P a g e
Hand injuries and ailments are common throughout the world, ranging from trigger thumb to
mutilating injuries requiring specialist surgery. The injuries of the hand and wrist annually account
for US$740 million and rank first in the order of most expensive injury types in the Netherlands.
They account for 1.1 million emergency room cases /year US and 270,000 hand referral/year UK(de
Putter et al., 2012). Quality care and optimum outcomes in the management of these patients requires
adequate breadth and knowledge in the form, function and ailments of the hand to prevent long-term
disability. Current undergraduate curricula are unable to deliver this knowledge set due to the
pressures of time and content, while current hand surgery programmes have exclusive entry
requirements, thus limiting access to the knowledge. Quality care and optimum outcomes in the
management of these patients require adequate breadth and depth of knowledge in the form, function
and ailments of the hand. The current undergraduate curriculum is unable to deliver this knowledge
set due to the pressures of time and content.
Hand surgery programmes that are currently available have exclusive entry requirements,
limiting access to the acquisition of this knowledge. They do not offer flexible and on-demand
learning that is centred around the student, or universally accessible and affordable while being
locally relevant.
A programme was needed for practising doctors who are or who would like to manage
patients with hand problems. It needed to be universally accessible with an e-learning platform and
modular in nature, catering to the complex learning needs of the working doctor embarking on
postgraduate medical education.
Using instructional design principles and a work-based learning framework, the authors
conceptualised, designed and developed a open on line learning program for hand surgery that was
universally accessible and affordable – an open on line course.
Literature review
The challenges of postgraduate medical education has been the ability to produce doctors fit for
purpose in the community. With the constraints of time and resources that are available for training,
any program needs to focus on the essentials of knowledge and skills that are required for the practice
of that speciality in the community that is safe. (Frank and Danoff, 2007). What is lacking in the
current postgraduate medical education is the inflexibility of the program, excessively long duration
of the curriculum and the non-learner centred approaches. (Cooke et al., 2010).”The traditional one

134 | P a g e
is time-based (a "tea-steeping" model, in which the student "steeps" in an educational program for a
historically determined fixed time period to become a successful practitioner)”(David Hodges,
2010). Competency-based medical education (CBME).has influence postgraduate medical education
in North America, (Long, 2000) (Carraccio et al., 2002) the United Kingdom (Brightwell and Grant,
2012), Germany and Australia (Hodge, 2007).(Frank et al., 2010b; )
“Competency-based education (CBE) is an approach to preparing physicians for practice
that is fundamentally oriented to graduate outcome abilities and organized around
competencies derived from analysis of societal and patient needs. It deemphasizes time-based
training and promises greater accountability, flexibility, and learner centeredness” (Frank
et al., 2010a).
To be able to develop a robust and meaningful competency-based curriculum an educational
needs must be performed.(Frank et al., 2010b) This can be in the form of practice profiling, task
analyses, community-based needs and the identification of entrustable professional activities (EPA)
for the speciality or subspecialty. (ten Cate, 2005.)
The fundamental principles of an instructional program is to first identify the needs of both
the learner and the community.(Woo et al., 2012) And therefore a community orientated curriculum
i.e. what are the key portfolio of cases seen in the community - is what a learner needs to know.
The development of entrustable professional activity (EPA) as defined by Ten Cate (2005),
is a critical part of professional work that can be identified as a unit, to be entrusted to a trainee once
sufficient competency has been reached. Here we can see therefore competency has been translated
and made manageable into task or activities that can be safely entrusted to the trainee who has
attained the level of ability.(ten Cate, 2005). EPA’s has been used recently in the development of
competency based postgraduate medical education.(Boyce et al., 2011) & (Mulder et al., 2010).
Mulder and group provided a framework and guidelines on how to develop an EPA based curriculum
for physician assistant training in Netherlands. The EPA concept assists curriculum design,
assessment and planning. The expanse of medical knowledge is growing so rapidly it is impossible
for students to be competent in all of the body of knowledge. By the process of identifying and
developing EPAs teachers have a tangible and valid framework to deliver teaching that is relevant
and contextual. EPAs also aids assessment and creates a measurable benchmark that can be linked
to various domains of competence.(ten Cate and Scheele, 2007)
135 | P a g e
Earlier findings demonstrate that with the appropriate design and use of technology, problem
based learning (PBL) used commonly in medical education, can be adapted for use with students in
higher education studying through open and distance education. (McLinden et al., 2006). Open
online instruction and courses requires new methods of course design, interaction among course
participants, and instructor preparation and support.(Crawford-Ferre and Wiest, 2012).
Understanding this concept of massive open on line courses (MOOC) is important as they are meant
to change the landscape of education of the future. Also known as the digital tsunami where
education now can be for everyone everywhere with universal accessibility.(Fei Mingming and Shi
Yanli, 2014). Various types of courses have been deployed online as a MOOC. It originally
commenced with the deployment of resource material from existing university courses online and
made available for free for members. It has been useful for most cognitive type of courses but
however for psychomotor skills courses this platform may not be useful in this current time.(Spector,
2014)
The great advantage of these massive open online courses is that they are able to reach many
learners and with proper principles of instructional designs can help learners excel. The problem will
be the overabundance of information being provided the lack of direction and the lack of structure
in these courses. It requires a lot of discipline and motivation by the learner to do on demand self-
paced learning. Educational currency, recognition and accreditation for learning has been difficult
to provide in some of these courses. The challenges of these massive open online courses has been
the sustainability,the credentialing and accreditation of these courses with robust assessment
tools.(Bragg, 2014)
Distance and on learning can support unique, high-quality medical educational experiences
that leverage the use of technology and global connectivity,(Goldner and Bollinger, 2012) In a recent
review Liyanagunawardena and co-workers presents evidence to suggest that MOOCs can be used
as a way to provide continuous medical education. It also shows the potential of MOOCs as a means
of increasing health literacy among the public. (Liyanagunawardena* and Williams*, 2014)
In transferring information from the producers to the consumer, the medium through which
this can be achieved can be through text, images, voice files, animation and videos. Learning objects
refers to small size reusable instructional component design for distribution over electronic media
inclusive of the Internet for use in different learning management system for access by multiple

136 | P a g e
users.(Alonso et al., 2008). The Institute of Electrical and Electronics Engineers (IEEE) defines a
learning object as "any entity, digital or non-digital, that may be used for learning, education or
training".(RISK, 2002).
Cloud computing (CC) is a concept of computing that is abstract, in nature to make the
functionalities and infrastructure of computing accessible and usable universally in a cost effective
manner. It is scalable and controlled computer infrastructure that hosts applications for the end-users.
CC is an area of computing that refers to providing customers with highly scalable IT capacitiess as
a service via the Internet. (Despotović-zrakić et al., 2012). Economics, simplification and
convenience of the way computing-related services are delivered seem to be among the main drivers
of cloud computing. (Sultan, 2010). Cloud computing is therefore the current trend in technology
that allows for end users to be able to tap the latest technology, services and resources to meet their
specific needs. This is cost effective and allows for scalability and reduces the need for large capital
investment and cost of maintenance and upgrades in hardware and software. The concept of paying
for the quantum of services used produced the functionality of CC of delivering infrastructure,
platforms and software as a service.(Vujin, 2011).Technology can be used to enhance knowledge
acquisition in the following ways:
Enhancing access and efficiency through digital multimedia.
Enhancing authenticity using video and the Internet.
Enhancing comprehensibility through learner control and multimedia annotations.
Providing meaningful and authentic communication opportunities. (Zhao and Kemp, 2012)
So in designing the instructional strategy, the capabilities of the technology has to be taken into
account so that the design of the learning material is robust to ensure engagement, interaction and
deep learning and understanding to occur. The use of an e-learning model by a simple conversion of
a PowerPoint slides by adding audio and converting to video will not encourage engagement and
interaction. The design process will have to take into account how to gain attention of the participant
and then test his prior knowledge and build on that with new knowledge and skills at all times
providing feedback for learning to occur. The learning has to be relevant to the context in which the
student is learning.(Reynolds and Caperton, 2011)

137 | P a g e
Research methodology
Curricular development
The authors developed the EPA for trainees in hand surgery by performing a practice analysis of a
tertiary hand surgery centre in the UK. The Birmingham Hand Centre (combining the New Queen
Elizabeth Hospital, and the Royal Orthopaedic hospital) comprises one of the largest tertiary referral
centres with 12 dedicated hand surgeons in the UK. They perform in excess of 5000 operations per
year inclusive of elective and trauma hand surgery.
The data for the current practice of hand surgery in the United Kingdom was obtained by
analysing the hospital information system (HIS) of the 2 hospital for the number and types of hand
surgery procedures performed over a 1 year period using the National Health Service UK Operating
Procedure Coding Systems codes for hand surgery. The incidence of hand surgery procedures was
ascertained by dividing the number of hand surgery cases by the total number of operations
performed. To understand the community needs for hand surgery the data was analysed for the
common conditions that were being seen in a busy tertiary Centre. Pareto analysis was chosen as this
is a formal technique which is useful in identifying commonest causes that needs to be addressed to
resolve of the majority of problems.(“Pareto analysis,” 2013).
Pareto Analysis of the current practice and the curriculum was performed using the following
rules:-
80% of the case mix in current practice will be the curriculum needed to be mastered by
dedicated hand surgeon independently and therefore will be the basis of the development of
the EPA’s for hand surgery. As the data used for the paper is surgical procedures, the EPA’s
developed was confined to the surgical based EPA’s only.
The steps involved in developing this analysis were as follows:-
The creation of a table listing the frequency of the various procedures done in a tertiary
referral centre.
Arranging this list in decreasing order of the frequency of the procedures in the community
Adding a cumulative percentage: to the table and plotting the causes on the x-axis and the
cumulative percentage of the y-axis.
The points in this graph was then connected to form a curve.
On the same graph, a bar chat of the various procedures was plotted on the X axis and the
frequency was plotted on the Y axis.

138 | P a g e
The line was drawn at the 80% on the y-axis parallel to the x-axis. This line was then dropped
to the point of intersection of the curve on the x-axis
This line then determine the important courses of surgery done in hands surgery practice on
the left-hand side and that review courses on the right-hand side of the graph.
Educational Resource development
Using Gagne’s 9 events of instruction, the curriculum, pedagogy, and assessment were developed
and open educational digital resource (OER) materials were created and distributed on an open online
learning management system (MOODLE). These included instructional videos, PowerPoint
presentations, text based resources and on line assessment of and for learning and Sharable Content
Object Reference Model (SCORM) compliant e learning objects covering the knowledge and skill
domains required for the specific task in the specific modules.
Video presentation of PowerPoint lectures
These were produced by adding audio files to PowerPoint presentation slides by the subject matter
experts and then saving them as a Windows Media Video (WMV) file.
This was a feature available with Office 2010 and above. These were then uploaded to a YouTube
channel already created by one of the authors (RV). (https://www.youtube.com/user/mrvairaj/)
Alternate method used for lectures given at synchronous teaching sessions, was preforming a screen
recording including audio, using a software (http://www.screencast-o-matic.com/)
Recently we have used the functionality in PowerPoint 2013, Office Mix (https://mix.office.com/).
This allows for enhancing PowerPoints into interactive online lessons or presentations. The add-in
provides the ability to record audio, video, and handwriting, and insert interactive elements like
quizzes, online videos and web pages. It includes a screen capture tool to record anything on the
screen.( e.g. https://mix.office.com/watch/m1dmslfid3n1)
E learning objects
On line interactions and engagement were promoted by using e learning objects on the subject matter
created using Articulate Storyline and deployed on the portal. These SCORM e learning objects
allowed for self-paced and self-directed learning to occur. It also provided for self-assessment of
higher order learning by the participants as it allowed for problem based and scenario based
learning.(Bonnetain et al., 2010). These were produced by RV who has experience in creating
SCORM compliant e learning objects.
139 | P a g e
Assessment
This was provided for by creating simple multiple choice questions into quiz form using the
functionality of the activities section of the learning management system MOODLE - the platform
where all the OER was deployed for distribution. It included problem based and scenario based
assessment created by Articulate Storyline. These assessment were used more as formative rather
than summative purposes.
Credentialing
Attempts are being made to use the ecosystem of badges to document knowledge, skills, and
competencies obtained with the online program and currently we are using the Perdana University
in Malaysia as a test bed on issuing digital badges as micro credentialing on knowledge attained with
certificates of completion.(Sandeen, 2013)
Deploying and distributing
An open source LMS (MOODLE) was chosen as the platform as it allows administration and
curriculum development. Subject matter experts and teachers can create courses with activities,
assessment and content management (creation, collation and curation). Content can be quickly and
easily updated and adjusted and the platform is SCORM compliant.(Wright and Reju, 2012)
Over a period of 3 years (2011 to 2014) this platform was used in blended teaching by RV to
maximise resources during the face to face clinical teaching of hand surgery for undergraduates and
post graduates in Singapore, Cambodia, Sri Lanka, Bangladesh and UK. All participants were
informed prior to the face to face sessions to register and study the materials online
(www.handsurgeryedu.com) .They were assessed on the knowledge acquired from the online
platform by an assessment performed on the day of the face to face session using a smart online live
student response system (www.socrative.com).
Results
At the Royal Orthopaedic Hospital where all elective surgery was performed the following are the
results of the analysis of all cases for a one year period.
Total hand cases in 1 year = 1237. Total day case activity for the hospital = 8493. 15% of
all day case activity was hand surgery. Therefore 10% of all orthopaedic operations done at the Royal
Orthopaedic Hospital for the year was related to hand surgery

140 | P a g e
At the University Hospital Birmingham NHS Foundation Trust, analysis of five years of
activity across trauma and orthopaedic service with some elective component which was removed
for this analysis. There were 24,480 cases performed during that period of time under the trauma and
orthopaedic services. 18,200 cases were count for by hand surgery patients. This accounted for 74%
of all activity in the trauma and orthopaedic services was confined to the hand and upper limb.
The Pareto analysis of the common procedures performed in the tertiary referral centre were
as follows. For hand trauma, the cases that made up for 80 % of volume were as follows in
importance:
Wound and soft tissue procedures, Tendon Surgery, Nerve and microsurgical repair, Hand
Fractures, Amputations and Terminalisation
As for Elective hand cases the common conditions were as follows:-
Nerve Decompression, Excision of swellings, Bony Procedures, Dupuytrens, Tendon and
Ligament Reconstruction, Trapeziectomy
Figure 1 Hand Trauma Pareto Chart

141 | P a g e
Figure 2 Hand Elective Pareto Chart
From the data obtained above, a list of EPA were developed as proposed by Mulder.(Mulder
et al., 2010). Modules were created from these to incorporate for OER creation for the online course
in hand surgery.
Anatomy and examination of the hand
Fingertip and nail bed injures
Hand and wrist fractures
Tendon injuries
Common conditions of the hand in clinical practice
Nerve injuries and their management
Painful conditions of the hand
Mutilating injuries of the hand
Optional List
Reconstruction in the hand
Assessing hand functions and outcomes
The growing hand
The stiff hand
Non - traumatic hand emergencies
Growths in the hand
Microsurgery for hands

142 | P a g e
Each module will provide a certificate of completion for micro credentialing and on completion
of all the prerequisite items for course to obtain a certificate of completion of the program.
Data Analytics of website
The use of the open online hand surgery website by learners was monitored using the inbuilt analytics
of the Moodle platform. Over a three-year period from 2011 to 2014, there are 2077 registered users
on this platform. The activity over this period which included for all roles and all activities is
summarised in the graph below. As can be seen as of 2013 the activities in the website has increased
significantly and is growing.
The activity (all types) levels in the 10 most active modules were as follows:-

143 | P a g e
Discussion & conclusion
In this paper we have described the processes on designing, developing and deploying an online
education programme in hand surgery. It is possible to develop a community oriented curriculum
using practice profiling and consensus development. E-learning with mobile and wireless
technologies is evolving and transforming education and introduces new learning environment and
requires new interactive and dynamic content to be produced.(Pereira and Rodrigues, 2013).
Through the use of instructional design principles it is possible to create digital resource materials
that are engaging and interactive using available software.
With the use of open online learning management system it is possible to deploy and
distribute these educational resources for universal access. Moodle is a useful platform for use in
open online education. By utilising these open educational resources in blended learning we have
been able to increase the activity and utilisation of these online resources. These allow for effective
utilisation of face to face times in a blended learning program. (Moffett and Mill, 2014). The very
nature of this educational resources allow for on demand, self-paced and self-directed learning to
occur.(Denton, 2012; Grant, 2014).
This study has shown that it is possible to grow the utilisation of an online educational
program with a strategy of incorporating them into a blended learning environment. The challenges
for the creation of an online education programme is the creation of digital educational resources. In

144 | P a g e
view of the narrow speciality of hand surgery is not always possible to curate these digital resources
and therefore some have to be created from scratch requiring competency and resources from subject
matter experts.
Further challenges will be in the form of encouraging subject matter experts to produce these
educational resources in an open format utilising creative Commons licensing.(Wright and Reju,
2012). It also requires faculty development programmes to impart competencies among subject
matter experts to develop digital educational resources.(Steinert et al., 2006). Issues in micro
credentialling and accreditation with the award of educational currency for lifelong learning needs
to be resolved.(Sandeen, 2013)
Implications for future research
Further research needs to address the effect of these online learning program in improving
competencies among doctors. Analytics needs to be utilised to identify learner needs and learning
styles to modify and improve on the OER.
Recommendations for further research would be in the area of comparing similar instructions
program using conventional methods and the open online program comparing the effectiveness and
satisfaction among the learners. It should also include stakeholder views on the use of open learning
platforms for surgical education.
References
Alonso, F., Lopez, G., Manrique, D., Vines, J.M., 2008. Learning objects, learning objectives and learning
design. Innov. Educ. Teach. Int. 45, 389–400. doi:10.1080/14703290802377265
Bonnetain, E., Boucheix, J.-M., Hamet, M., Freysz, M., 2010. Benefits of computer screen-based simulation
in learning cardiac arrest procedures. Med. Educ. 44, 716–722. doi:10.1111/j.1365-2923.2010.03708.x
Boyce, P., Spratt, C., Davies, M., McEvoy, P., 2011. Using entrustable professional activities to guide
curriculum development in psychiatry training. BMC Med. Educ. 11, 96. doi:10.1186/1472-6920-11-96
Bragg, A.B., 2014. MOOCs: Where to from here? Train. Dev. 1839-8561 41, 20–21.
Brightwell, A., Grant, J., 2012. Competency-based training: who benefits? Postgrad. Med. J. postgradmedj–
2012–130881. doi:10.1136/postgradmedj-2012-130881
Carraccio, C., Wolfsthal, S.D., Englander, R., Ferentz, K., Martin, C., 2002. Shifting paradigms: from
Flexner to competencies. Acad. Med. J. Assoc. Am. Med. Coll. 77, 361–367.
145 | P a g e
Cooke, M., Irby, D.M., O’Brien, B.C., 2010. Educating Physicians: A Call for Reform of Medical School
and Residency. John Wiley & Sons.
Crawford-Ferre, H.G., Wiest, L.R., 2012. Effective Online Instruction in Higher Education. Q. Rev.
Distance Educ. 13, 11–14.
David Hodges, B., 2010. A Tea-Steeping or i-Doc Model for Medical Education?: Acad. Med. 85, S34–
S44. doi:10.1097/ACM.0b013e3181f12f32
De Putter, C.E., Selles, R.W., Polinder, S., Panneman, M.J.M., Hovius, S.E.R., van Beeck, E.F., 2012.
Economic impact of hand and wrist injuries: health-care costs and productivity costs in a population-based
study. J. Bone Joint Surg. Am. 94, e56. doi:10.2106/JBJS.K.00561
Denton, D.W., 2012. Enhancing instruction through constructivism, cooperative learning, and cloud
computing. TechTrends 56, 34–41.
Despotović-zrakić, M., Simić, K., Labus, R., Milić, A., Jovanić, B., 2012. Scaffolding Environment for е-
Learning through Cloud Computing.
Fei Mingming, Shi Yanli, 2014. Research on development trends and problems of MOOC. J. Chem. Pharm.
Res. 6, 393–395.
Frank, J.R., Danoff, D., 2007. The CanMEDS initiative: implementing an outcomes-based framework of
physician competencies. Med. Teach. 29, 642–647. doi:10.1080/01421590701746983
Frank, J.R., Mungroo, R., Ahmad, Y., Wang, M., De Rossi, S., Horsley, T., 2010a. Toward a definition of
competency-based education in medicine: a systematic review of published definitions. Med. Teach. 32,
631–637. doi:10.3109/0142159X.2010.500898
Frank, J.R., Snell, L.S., Cate, O.T., Holmboe, E.S., Carraccio, C., Swing, S.R., Harris, P., Glasgow, N.J.,
Campbell, C., Dath, D., Harden, R.M., Iobst, W., Long, D.M., Mungroo, R., Richardson, D.L., Sherbino, J.,
Silver, I., Taber, S., Talbot, M., Harris, K.A., 2010b.
Competency-based medical education: theory to practice. Med. Teach. 32, 638–645.
doi:10.3109/0142159X.2010.501190
Goldner, B.W., Bollinger, R.C., 2012. Global health education for medical students: New learning
opportunities and strategies. Med. Teach. 34, e58.
Grant, P., 2014. Personalized learning. Iste, [Place of publication not identified].
Hodge, S., 2007. The Origins of Competency-based Training. Aust. J. Adult Learn. 47, 179.

146 | P a g e
Liyanagunawardena*, T.R., Williams*, S.A., 2014. Massive Open Online Courses on Health and Medicine:
Review. J. Med. Internet Res. 16, 1.
Long, D.M., 2000. Competency-based residency training: the next advance in graduate medical education.
Acad. Med. J. Assoc. Am. Med. Coll. 75, 1178–1183.
McLinden, M., McCall, S., Hinton, D., Weston, A., 2006. Participation in online problem-based learning:
Insights from postgraduate teachers studying through open and distance education. Distance Educ. 27, 331–
353.
Moffett, J., Mill, A.C., 2014. Evaluation of the flipped classroom approach in a veterinary professional
skills course. Adv. Med. Educ. Pract. 5, 415–425. doi:10.2147/AMEP.S70160
Mulder, H., Cate, O.T., Daalder, R., Berkvens, J., 2010. Building a competency-based workplace
curriculum around entrustable professional activities: The case of physician assistant training. Med. Teach.
32, e453–e459. doi:10.3109/0142159X.2010.513719
Pareto analysis, 2013. . Wikipedia Free Encycl.
Pereira, O.R.E., Rodrigues, J.J.P.C., 2013. Survey and analysis of current mobile learning applications and
technologies. ACM Comput. Surv. 46, 1–35. doi:10.1145/2543581.2543594
Reynolds, R., Caperton, I., 2011. Contrasts in student engagement, meaning-making, dislikes, and
challenges in a discovery-based program of game design learning. Educ. Technol. Res. Dev. 59, 267–289.
doi:10.1007/s11423-011-9191-8
RISK, U., 2002. Draft Standard for Learning Object Metadata.
Sandeen, C., 2013. Integrating MOOCS into Traditional Higher Education: The Emerging “MOOC 3.0”
Era. Change Mag. High. Learn. 45, 34–39. doi:10.1080/00091383.2013.842103
Spector, J., 2014. Remarks on MOOCS and Mini-MOOCS. Educ. Technol. Res. Dev. 62, 385–392.
doi:10.1007/s11423-014-9339-4
Steinert, Y., Mann, K., Centeno, A., Dolmans, D., Spencer, J., Gelula, M., Prideaux, D., 2006. A systematic
review of faculty development initiatives designed to improve teaching effectiveness in medical education:
BEME Guide No. 8. Med. Teach. 28, 497.
Sultan, N., 2010. Cloud Computing for Education: A New Dawn? Int J Inf Manag 30, 109–116.
doi:10.1016/j.ijinfomgt.2009.09.004
Ten Cate, O., 2005. Entrustability of professional activities and competency-based training. Med. Educ. 39,
1176–1177. doi:10.1111/j.1365-2929.2005.02341.x

147 | P a g e
Ten Cate, O., Scheele, F., 2007. Competency-based postgraduate training: can we bridge the gap between
theory and clinical practice? Acad. Med. J. Assoc. Am. Med. Coll. 82, 542–547.
doi:10.1097/ACM.0b013e31805559c7
Vujin, V., 2011. Cloud Computing in Science and Higher Education. Manag. 1820-0222.
Woo, K., Rowe, V.L., Weaver, F.A., Sullivan, M.E., 2012. The Results of a Needs Assessment to Guide a
Vascular Surgery Skills Simulation Curriculum. Ann. Vasc. Surg. 26, 198–204.
doi:10.1016/j.avsg.2011.05.045
Wright, C.R., Reju, S., 2012. Developing and deploying OERs in sub-Saharan Africa: Building on the
present. Int. Rev. Res. Open Distrib. Learn. 13, 181–220.
Zhao, F., Kemp, L.J., 2012. Integrating Web 2.0-based informal learning with workplace training. Educ.
Media Int. 49, 231–245. doi:10.1080/09523987.2012.738015

148 | P a g e
Solving Environmental Problems of Old Areas of Dubai: A Focus on Deira Gold Souq in Dubai
Hawra S. Askari
The British Univeristy in Dubai, UAE
Haşim Atlan
The British Univeristy in Dubai, UAE
Abstract
Introduction: Dubai is one of the most famous cities for its fast development and growth. In less than 50 years
this city made a significant fingerprint on the world’s map. It became one of the most desired tourist attraction
as well as living destinations in the world. Dubai is known as the commercial capital of Middle East. It also
hosts the world’s most unique projects. However, UAE with its entire fast development journey is having
significant environmental footprint in the world. Authorities and agencies in Dubai are aware of these
environmental facts and have already established projects to reduce this impact in 2012 as shown in Fig. 1
(WWF, 2014). There are suburb projects considering all aspects of sustainability and renewable energy in
large scales (Masdar City 2014). These fascinating projects all are built up from zero in the new parts of the
current cities. The most significant aspect of sustainability in Dubai is the aim of His Highness Sheikh
Mohammed bin Rashid Al Maktoum, ruler of Dubai, in getting ready to host the first carbon neutral Expo in
2020 (Gulf News, 2013). The new environmental consideration aspects are mostly implemented in the new
parts of Dubai while the old areas of this city are moving on with its old features. Since all parts of Dubai
will be evolved with the main assigned sites for Expo 2020, considering the old areas as a priority
representing the main concentration of the city heritage would definitely cherish the history of Dubai.
Aim: This research is aiming to provide a comprehensive sustainable package to provide solutions for the
current environmental problems in the old areas of Dubai. The main focus of this paper is the Gold Souq
Area in Dubai. Since the government is in the process of recording the Creek side as a historical area in the
city, this study could be very beneficial in order to solve the challenge the area is facing. However, the
sustainability package proposed in this research can be implemented on other parts of old areas in Dubai as
well as across the UAE due to the similarity in most of the conditions they have.
Methodology: Besides the literature review, the data and information of this research have been gathered
through the following methods:
Site Visits and Observation: The Gold Souq area has been known to the researcher over the past two years.
Different site visits and observations were made during the same period. The conducted visits were done
almost on daily bases over different times and seasons. These visits helped in gaining deeper knowledge of
the area and getting familiar with its complicity, in order to identify the nature of the occupants in that area
as well as to understand and experience the challenges the area is facing.

149 | P a g e
Surveys: Questionnaire-based surveys have been conducted to evaluate the general knowledge of people
about the Gold Souq area as well as extracting the challenges the area is facing from different point of views.
The survey targeted the following categories in both Arabic and English languages:
Emirati locals as the Gold Souq area were the main residential area for the local families before. Evaluating
how much people are still feeling attached to their old places as well as their concern towards their
environment is a priority.
Expats living in the UAE to evaluate the general knowledge of people toward the historical places of the
country they live in.
Workforce of the area.
Tourists of the area.
Results: The data and information gathered were based on the past two years’ observation, and supported
by the results from the conducted surveys.
The proposed solutions can be implemented based on different phases, so the changes will not be causing
further problems to the current situations. The completed project with all phases is aimed to improve the
existing situation of the Gold Souq are to propose a better environment by (1) Traffic reduction; (2) Improving
the air quality of the area by reducing the pollution; (3) Increasing and enhancing the walkability of the
region; (4) Waste management and control by recycling materials; (5) Providing clear guidance and
knowledge about the historical and cultural project; (6) Increasing the open and green spaces of the area;
(7) Public awareness towards adopting healthier lifestyle; and (8) Hospitality improvement.
Scope of Project: This proposal will target the area starting from Palm Deira metro station to the Abra side,
next to the Spice market. The Al Khaleej road leading to Shindagha tunnel will be excluded (see Fig. below).
Fig. : Scope of proposed project and solutions (Google Maps, 2014).
Conclusions: Overall this research aimed to solve the environmental issues in the old areas in Dubai. The
main proposed solution was about enhancing the walkability in the Gold Souq area and within this concept
other smaller solutions have been suggested to complete the sustainability package. Although the proposed
solutions might be focusing on the old Gold Souq area of Dubai, they can easily address wider regional issues
exist today. It is hoped that the comprehensive package to be adopted and implemented in the Gold Souq area
by the developers, practitioners working in projects in Dubai.
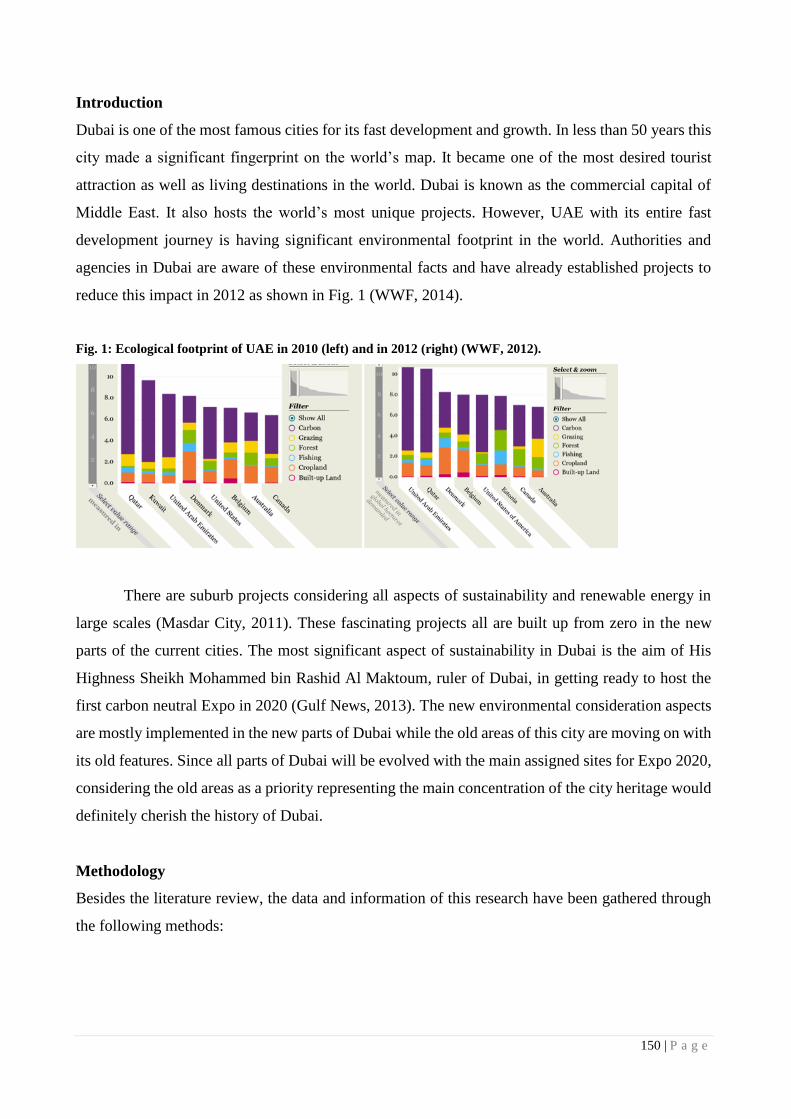
150 | P a g e
Introduction
Dubai is one of the most famous cities for its fast development and growth. In less than 50 years this
city made a significant fingerprint on the world’s map. It became one of the most desired tourist
attraction as well as living destinations in the world. Dubai is known as the commercial capital of
Middle East. It also hosts the world’s most unique projects. However, UAE with its entire fast
development journey is having significant environmental footprint in the world. Authorities and
agencies in Dubai are aware of these environmental facts and have already established projects to
reduce this impact in 2012 as shown in Fig. 1 (WWF, 2014).
Fig. 1: Ecological footprint of UAE in 2010 (left) and in 2012 (right) (WWF, 2012).
There are suburb projects considering all aspects of sustainability and renewable energy in
large scales (Masdar City, 2011). These fascinating projects all are built up from zero in the new
parts of the current cities. The most significant aspect of sustainability in Dubai is the aim of His
Highness Sheikh Mohammed bin Rashid Al Maktoum, ruler of Dubai, in getting ready to host the
first carbon neutral Expo in 2020 (Gulf News, 2013). The new environmental consideration aspects
are mostly implemented in the new parts of Dubai while the old areas of this city are moving on with
its old features. Since all parts of Dubai will be evolved with the main assigned sites for Expo 2020,
considering the old areas as a priority representing the main concentration of the city heritage would
definitely cherish the history of Dubai.
Methodology
Besides the literature review, the data and information of this research have been gathered through
the following methods:

151 | P a g e
Site Visits and Observation
The Gold Souq area has been known to the researcher over the past two years. Different site visits
and observations were made during the same period. The conducted visits were done almost on daily
bases over different times and seasons. These visits helped in gaining deeper knowledge of the area
and getting familiar with its complicity, in order to identify the nature of the occupants in that area
as well as to understand and experience the challenges the area is facing.
Surveys
Questionnaire-based surveys have been conducted to evaluate the general knowledge of people about
the Gold Souq area as well as extracting the challenges the area is facing from different point of
views. The survey targeted the following categories in both Arabic and English languages:
Emirati locals as the Gold Souq area were the main residential area for the local families
before.
Expats living in the UAE to evaluate the general knowledge of people toward the historical
places of the country they live in.
Workforce of the area.
Tourists of the area.
Glimpse of Dubai and the Gold Souq
Dubai was famous for trading even before the discovery of Oil. It was a link between different areas
by land and sea. Dubai ports were accommodating ships traveling from India to further countries. In
the past, Dubai was divided into two main parts while the Creek separated each of these areas from
each other. The only way people could access the other parts was to cross the creek by riding the
small boats, known as Abra, on a daily basis. Deira was the active trading area, and the main
residential area (Zabbal, 2001). It hosted the fish market as well as the gold market (known as the
Gold Souq). With the formation of United Arab Emirates in 1971 by the late Sheikh Zayed bin Sultan
Al Nahyan, significant developments happened in this region in all aspects and across all Emirates.
The Gold Souq area is located on the creek side in Deira. This area hosted the earliest markets
in Dubai, as well as being the main residential area for the families. At the urban level, it adopted

152 | P a g e
the past sustainable features known in the region. By time, people gradually moved out from these
old places, until it became a busy Souq with various commercial activities (Women Museum, 2012).
The main part is known as Sikkat Al Khail with all gold shop retails inside. Other areas include the
retail and wholesaler market for different products covering clothes, cosmetics, plates, nuts, beauty
products, bags and many more.
Besides being an active commercial area, the Gold Souq and its surroundings are one of the
main tourist attractions in the old side of Dubai. The old Gold Souq, the Women’s Museum, Spice
Souq and Al Ahmadia School are some of the historical attractions in this area.
Summary of Issues and Potential Solutions
The data and information gathered were based on the past two years’ observation, and supported by
the results from the conducted surveys. The following aspects are reflecting on some of these issues
considering both observations and again findings from surveys:
Traffic and Parking
All participants participated in the surveys concluded that there is a lot of traffic in the area, and most
importantly, the lack of parking spaces. Fig. 2 is showing the available parking spaces provided in
the area. In the morning (before 10 am), before the opening of the shops, it is easy to find a parking
space as the area is still not busy. This is also somehow applicable to the time zone between 1 to 4
pm on regular days as the shops are closed. However, in the evening time, traffic and crowd become
more that it gets very challenging to find a parking space. According to the workforce responses,
evening time is the peak time in the area. Also, during weekends the crowd is more all day long.
Fig. 2: Parking space distribution in the Gold Souq area (Google Maps, 2014).

153 | P a g e
Sanitary
The survey participants evaluated the sanitary of the area not so good as the other places in Dubai.
The believed people working in the Gold Souq should be educated more so not to damage or dirty
the place by their behaviour. However, depending on the nationality and the work position of the
workforce, some stated that it is a clean environment.
Food and Restaurants
The Gold Souq area does not have coffee shops and popular restaurants as seen in other parts of
Dubai. Over the past two years, some restaurants and coffee shops were opened, however since they
are not well-known or well-established they were not successful and therefore closed down after
some time. All of the participants demanded good coffee shops and proper restaurants as they stated
they would like to utilise such facilities, which will be also very good for their businesses in the area.
As for the visitors’ responses, they did not like the quality neither the services.
Direction
When the participants were asked about the direction and how easy it was for them to move around,
their responses varied. Some stated that they knew the areas and it was very easy for them to move
around; however some disagreed with this point and expressed that finding the area was very
confusing. These contradicting answers may be linked to the age of the participants. Most of the
participants from the elder generation were familiar with the area. This should be expected, as this
area was one of the main shopping areas before the shopping malls were built in Dubai, and people
used to visit this shopping district on a regular basis.
The following section is dedicated to some of the potential solutions based on observations
made by the researcher, which are also supported by the findings of surveys.
Walkability
Walkability is one of the most important factors in sustainable urban design. As defined by Abley
walkability is; “the extent to which the built environment is friendly to the presence of people living,
shopping, visiting, enjoying or spending time in an area” (2005). Walkability helps reducing
pollution caused by cars, instead offers healthier lifestyle and saves energy.
In the UAE, due to the hot weather conditions outdoors, people are heavily depending on
private transportation, which is the main reason behind causing high levels of CO2 emissions in

154 | P a g e
this country (Gulf News, 2013). Providing walkability solutions at urban levels will have huge
impact on reducing the significant CO2 emissions. The possibility of walkability is related to
different environmental, physical, social, and psychological aspects (Bhattacharyya and Mitra,
2013). The walkability of an area is measured by five main parameters; connectivity, linkage to
various types of transportation; fine grained and varied land use patterns; safety; as well as the
quality of paths.
Renewable Energy
Benefitting from the available renewable energy is a major step towards sustainable urban planning.
Two types of renewable energy are proposed to generate energy supply in the Gold Souq area; (1)
Solar energy; and (2) Dynamic energy.
Recycling Materials
To make the Gold Souq area a cleaner place and a healthier environment, improving its current
sanitary is a key component. Dubai municipality has clear guidelines and regulations to keep the area
clean. However, the current situation has shown difficult and the suggested methods are not followed
by all groups in the area. Using waste collecting machines like the vending machine concept can be
a good starting point. They are known as reserve vending and these machines can take the empty
water bottles or cans, light bulbs and batteries and return a receipt (Reverse Vending, 2014). In the
Gold Souq area, this theme can be adapted to make it more attractive, and the printed receipt can
have specific amount of points to be redeemed for money. This action will improve the sanitary by
keeping the trashcan surroundings clean.
Analyses and Survey Results
The analyses were conducted from several aspects’ point of views as well as the survey results have
been incorporated with those to support the findings. The following are the particular areas of
concern:
Walkability in Dubai
One of the main reasons directing people to choose other methods than walking is the extremely hot
weather condition in the UAE. The winter months are the only possible time for walking outside in
this region. The government has already started implementing some aspects of walkability concept
through equipping most beaches and parks by walking paths. Due to people’s interest in going to the
malls, “The Walk” located in Al Wasl road is a good example for walking encouragement, although
155 | P a g e
it may not have all the mentioned aspects for walkability. Also, one of the strong projects considering
walkability from all aspects and all seasons is the ‘Mall of the World’ in Dubai, which is expected
to finish in 10 years’ time (Gulf News, 2014). However, currently in the Gold Souq and similar areas,
all the people are forced to walk reasonable distance due to the nature of the environment there, no
matter what the weather conditions are. In these old areas large number of shops and buildings are
located in the small hidden Sikkas, without having any car access. According to Prof. Ghubash, this
feature is essential for the area, as the Gold Souq is hosting shops with precious items, this will
increase the level of security and safety for the shops. Also, it will allow people to observe and feel
the items closely (2014).
Connectivity in the Gold Souq
Even though walking is a healthy and environmental friendly habit, in urban design and planning,
an important aspect to be considered is how to reduce the walking distance as much as possible, to
allow people reach their destination faster with less effort. Connectivity is referred to as the path
networks of an area and how well these paths are connected together (Bhattacharyya and Mitra,
2013). Based on the survey conducted, the connectivity of the area was evaluated differently. The
responses of the people who are familiar with the area were positive and they stated that all places
are connected well with each other. However, the people who did not know the place and are
considered as new visitors to the environment stated that it is a very confusing area, forcing them to
go around for long time. It can be said that the area needs proper guiding and signage system to
direct the people who are not familiar with the space to help them move around without any
confusion.
Linkage to Various Types of Transportation
Providing the choice to switch to other modes of transportation is another factor in measuring the
walkability of the place (Bhattacharyya and Mitra, 2013). If people got tired of walking, or they are
carrying heavy things, allowing the access to cars, buses or trains is more convenient for people as
the area is a shopping area as well. This option is provided in the outer side of the Gold Souq. On
the main roads, pedestrians can benefit from cars, taxis and buses, as well as having access to metro.
On the other side, the inner part is very busy, and the available streets allow only one-way traffic.
Fine Grained and Varied Land Use Patterns
Having access to different daily life activity services should be integrated in a walkable city. The
standard walking distant for people is 1/4 of a mile which takes 10-20 min (Azmi and Abdul Karim,

156 | P a g e
2012). Services like bank, grocery, shops, cafés, etc. should be available within the mentioned
distance for people to benefit from (Bhattacharyya and Mitra, 2013). However, some of these
services are completely missing in the entire Gold Souq area and its surroundings such as cafés and
coffee shops. People have to walk for long distances in order to find a very basic grocery shops,
located in the hidden Sikkas. Even though the majority of the residents in the area are from the very
low-income category, the area is a very active environment having many tourists and all levels of
people visiting on daily bases. Thus, providing proper facilities serving all people is essential.
Safety
The safety of walkable cities is related to the environmental safety from the roads and cars in the
area, as well as the personal security (Bhattacharyya and Mitra, 2013). Even though the Gold Souq
is a very crowded area, all the space is monitored, the gold shops are equipped with alarm systems
and CCTV cameras linked to the Dubai police station, as this action is a requirement by the local
law. Police are available in every corner and ready to help and assist. Also, in Dubai people can get
fined if they cross the streets from the non-specified places. However, people are not obeying this
rule. Most people cross the streets from everywhere, to prevent longer walking distances, which is
exposing them more to possibility of having accidents with cars (Dubai Police, 2014). On the
personal security level, the pedestrian walks of the main roads are daily routes for large groups of
tourists. There are street sellers whom are taking the opportunity to offer their products, which may
seem as a high personal security risk, preventing tourists from interacting with other people on the
roads. This avoidance was experienced by the researcher while conducting the surveys with the
tourists in the area.
Quality of the Paths
The width of the pedestrian walk is important factor for their quality. The minimum standard width
should allow 2-3 person walk beside each other (Bhattacharyya and Mitra, 2013). The pedestrian
walks of main roads in the Gold Souq area are wide allowing large groups to walk together. However,
the sideways in the inner parts are very narrow, which is challenging to accommodate the large
number of pedestrians, leading walkers to shift to the street making it not safe, and this will increase
the traffic on the roads. Another fact for good quality pedestrian walk is their even level (Sutikno,
Aurjono and Kurniwan, 2013). As it makes walking easier for people and prevent water gatherings.
Even though the rain average is very low in UAE, during rainy days floods would happen causing
big pools of water in different places also remaining for long time. This is due to the uneven level of
pedestrian walks as well as the drainage system that needs improving. Also, having straight paths

157 | P a g e
with no upward slob helps improving the quality, and at the same time, encouraging people to walk
more with less effort.
Discussion and Proposal
This section is discussing the overall environmental solutions for the Gold Souq area. The proposed
solutions can be implemented based on different phases, so the changes will not be causing further
problems to the existing situations. The completed project with all phases is aimed to improve the
existing situation of the Gold Souq are to propose a better environment by (1) Traffic reduction; (2)
Improving the air quality of the area by reducing the pollution; (3) Increasing and enhancing the
walkability of the region; (4) Waste management and control by recycling materials; (5) Providing
clear guidance and knowledge about the historical and cultural project; (6) Increasing the open and
green spaces of the area; (7) Public awareness towards adopting healthier lifestyle; and (8)
Hospitality improvement.
Scope of Project
This proposal is targeting the area starting form Palm Deira metro station to the Abra side next to
the Spice market. The Al Khaleej road leading to Shindagha tunnel will be excluded. Fig. 3 is
indicating the area as shown from satellite view.
Fig. 3: Scope of proposed project (Google Maps, 2014).
Parking Spaces
The first phase of the project is to provide more parking spaces in the area. Fig. 4 shows the main
and current available parking spaces serving the entire busy area.

158 | P a g e
Fig. 4: Available parking in the Gold Souq area (Google Maps, 2014).
Fig. 4 is showing spaces for parking 1, 2 which is near the Gold Souq area, and parking 3 is
serving the fish market visitors. However, due to the lack of parking space, people visiting the Gold
Souq head to the fish market in the hope of finding parking, which is still challenging. Before, the
Gold Souq bus station was located next to the parking 2 zone as shown in orange in Fig. 5. Recently,
this function has been moved to near Palm Deira Metro station, which is now located besides the
parking 3 zone expressed in orange colour as shown in Fig. 5. The large empty area (used to be bus
station) can be utilised as a parking zone, providing much bigger parking spaces serving more people
coming to the area.
Fig. 5: Potential parking spaces in the Gold Souq area (Google Maps, 2014).
Providing multi-level car parking is a good solution for serving more number of cars in the
same limited land space. This parking project can be a very beneficial project for the Roads &
Transport Authority (RTA), as well as the private investors, by buying on of the available buildings
and turning into parking spaces. Offering annual and monthly membership plans for the regular

159 | P a g e
visitors of the Souq and the shop owners will be a sustainable way for income in this aspect. Another
possibility is to make parking spaces under the current parking zones. However, if this will be done
the project should be planned carefully to cause minimum distruption.
Walking Bridges and Walkability in the Gold Souq
Enhancing the walkability and starting better methods to manage this is as important as providing
the parking spaces since the Gold Souq area is a historical place and a tourist stop to experience the
old side of Dubai. The proposal is to present the area as an open museum with people walking around
and observing. This does not mean to stop all the commercial activities going on but creating another
level accommodating the walking tourists is a good solution. By creating a well-planned and well-
connected network of walking bridges, not only the activities will be separated, but also the crowd
of the people will be divided. The walking bridges network can be done in different phases since this
project requires a lot of trials and walkability audits to finalise the best route. Fig. 6 is showing the
initial walking bridges networks in the area by blue while green colour is showing the two metro
stations and pink colour on the other hand is showing the parking places.
Fig. 6: Proposed walking bridge network (Google Maps, 2014).
These bridges should be designed to be closed and have shading devices for the upper level as well
as serving the ground level. The sides can be closed with glass so the walking paths will be air
conditioned, during hot season, making it suitable for all the times. However, in the good weather
conditions, some of the window glasses can be opened to benefit from the cool fresh air. These
walking bridges will be wide enough to serve a large number of people/groups walking in the same
place.

160 | P a g e
Moreover, to increase the safety and personal security they should be equipped with cameras.
Security guards will prevent the street sellers from disturbing the walkers and tourists. These bridges
will have stairs as well as elevators for going up and down. Clear signage directing tourist to each of
the cultural places will be provided. In addition, next to each historical area tourist will go down visit
the site and then continue their journey to the next place from up. Different types of vending
machines for selling souvenir and different products could be distributed along the walking areas.
Allowing the tourist to buy what they like based on standardised prices. These machines can be
owned by the shops from the Souq and can supply their goods in these walking corridors. Also, since
the walking paths are wide enough one side will be equipped with moving walkways, similar to the
ones used in the airports projects (Dubai Airport Guide, 2014). To give a clear vision to the
pedestrians walking on the upper level, there will be enough space between the neighbouring
buildings and the bridges itself as graphically explained with the concept in Fig. 7.
Fig. 7: The walking bridge diagram.
After the first stage, different bridge connections will be made serving different categories of
people based on their needs. These bridges and routes can be addressed by different colours to show
the best and shortest way to get to the destination.
Overall Enhancements
The following enhancements are very important in raising the quality of the area as well as being
very good investments. They may seem simple but currently they are not available in the area.
(1) Food and Restaurants
After planning and implementing the proper walking bridges, providing more services will enhance
the place such as good restaurants and opening different famous coffee shops. As the area is lacking
Existing Building
Walking Bridge, Glass
with invisible solar
panels
Space between
Buildings and Bridge to
view the lower level
Covered from Top
Energy generating
walking area

161 | P a g e
these services, distributing them evenly on the entire area will accommodate all tourists, visitors and
the occupants as requested in the survey.
(2) Hotels and Hospitality
On the other hand, if one of the current low-class hotels in the middle of the Souq were to be invested
and turned into a proper 4-5 star ranked hotel, it will attract tourists in staying in the area and
experiencing the old side of Dubai.
(3) Awareness
Social media can play an important role in this sustainability package as well. Nowadays people are
very connected to their social media accounts and they check and interact regularly. Posting the tips,
new enhancements, status of each phase of the project, new shops or new services can educate a
large number of people about what is happening in a very short time and less effort.
Car Access and Transportation
The changing in the transportation system should be done at the very last stage of the project where
all services completed and operated. The walking bridges by the end will be having different routes
and lines, directing people to different areas based on their needs. These bridges are connected to the
parking buildings and different drop off areas. By the end, car access will be stopped to this place
particularly the main road of the Gold Souq (Al Khoor Street is highlighted in brown in Fig. 8) and
the entire two floors of the expressed area will be walking environment. However, small public
transportation, like the golf cars and mini vans will be available to drop off people to different areas.
Fig. 8: Al Khoor Street in the Gold Souq area highlighted in brown (Google Maps, 2014).
162 | P a g e
Moreover, hourly renting bicycles will be provided for the interested people. The renting
bicycle concept have been applied to many parks and walking areas. In this part making monthly
plan will also benefit the workforce of the areas. By stopping the private car access, the overall place
will be further enhanced; pollution caused by the cars will be reduced resulting in having better air
quality. With regard to the shops which need goods supply, on specific timing trucks will get access
to drop off the goods. Blocking the car access will allow more space for investment in different areas
as well as allowing for more landscaping and green spaces.
Conclusions
With the overall design strategy, the proposal aimed to preserve the historical features of the area
without removing their sense of uniqueness. Thus, adopting modern style for the bridges will show
the contrast of the past and present of the area. Also, it will represent the overall sense of Dubai and
the UAE, where the past and futuristic aspects are blended nicely together making the unique present.
On the whole, this research aimed to solve the environmental issues in the old areas in Dubai. The
main proposed solution was about enhancing the walkability in the Gold Souq area and within this
concept other smaller solutions have been suggested to complete the sustainability package.
Although the proposed solutions might be focusing on the old Gold Souq area of Dubai, they can
easily address wider regional issues exist today. It is hoped that the comprehensive package to be
adopted and implemented in the Gold Souq area by the developers, practitioners working in projects
in Dubai.
References
Anon, (2014). Gulf News [online]. [Accessed 1 Aug. 2014]. Available at:
http://gulfnews.com/business/general/dubai-s-mall-of-the-world-to-be-built-in-10-years-1.1357950
Ayre, J. (2014). Generating Electricity From The Weight Of Cars & Pedestrians. CleanTechnica. [online].
[Accessed 9 Aug. 2014]. Available at: http://cleantechnica.com/2013/12/16/generating-electricity-weight-
cars-pedestrians-system-developed-exploit-energy-passing-cars/
Azmi, D. and Abdul Larim, H. (2012). Implication of Walkability towards Promoting Sustainable
Neighbourhood. Social and Behavioral Sciences, 50(204), p.3.
Bhattacharyya, D. and Mitra, S. (2013). Making Siliguri a Walkable City. Procedia-Social and Behavioral
Sciences, 96, pp.2737-2744.
Dubai Police (2014). [online]. [Accessed 15 Aug. 2014]. Available at:
http://www.dubaipolice.gov.ae/dp/jsps/content/layout_content.do?contentCode=86056
163 | P a g e
Ghbuash, R. (2014). Women Museum. Interviewed by Hawra Askari [in person] Women's Museum UAE,
18 April 2014.
Masdar City, (2014). Masdar City [online]. [Accessed 8 May. 2014].
Available at: http://masdarcity.ae/en/27/what-is-masdar-city-/
Ohannessian, (2014). Transparent solar panels may be a window into the future. Tech Times.
Onyxsolar.com, (2014). Photovoltaic Transparent Glass For BIPV - Onyx Solar. [online]. [Accessed 16
Aug. 2014]. Available at: http://www.onyxsolar.com/photovoltaic-transparent-glass.html
Reversevending.co.uk, (2014). Reverse Vending Corporation - Reverse Vending Machines. [online].
[Accessed 18 Aug. 2014]. Available at: http://www.reversevending.co.uk
Sutikno, F., Surjono, and Kurniawan, E. (2013). walkability and pedestrian perception in malang city
emerging business corridor. Procedia Environmental Sciences, 17.
UAE has 'assets and skills' for Expo 2020. (2013). Gulf News.
WWF, (2014). 2010 Living Planet Report [online]. [Accessed 10 May. 2014]. Available at:
http://wwf.panda.org/about_our_earth/all_publications/living_planet_report/living_planet_report_timeline/2
010_lpr2/
Zabbal, S. (2001). I was a Witness. 1st ed. Abu Dhabi: Cultural Foundation.

164 | P a g e
Survey of Occupational Health and Safety Practices at Latifa Hospital, UAE – staff nurses’ perspectives
Kefah Hussni Aldbk
Hamdan Bin Mohammed Smart Univeristy, UAE
Abstract
Purpose: The aim of the study was to gain an insight of the factors affecting the nurse's perception on the
hospital Occupational Health and Safety.
Methodology/Approach: A descriptive study, took place in Latifa Hospital, 183 nurses from the maternity
unites, ICU, emergency department and delivery suite (N=183), selected through a purposive sampling
technique, have answered the questionnaire. The data analysis has been carried out through the Microsoft
Office Excel and the current version of Statistical Product and Services Solution (SPSS). During the data
analysis, percentage, frequency, mean and the standard deviation (SD) have been used.
Findings: the majority of the nurses were middle-aged (42%) between 35-44 years, with eminent educational
level as 76.2% of them have a bachelor degree, 63.9% are bed side nurses at the position of staff nurse-2
with 5-10 years of professional experience (40.4%). The variable related to training, competencies and safety
precautions had the highest mean of 2.96 ±0.03, moreover, the staff motivation, psychological support and
considerations had the lowest mean of 2.53 ± 0.01. Overall, the mean score of respondents’ perception ranged
between 2.52–2.99 which means the nurses responses have been displayed around “Yes”, reflecting a high
standards of OHS at the hospital (environment safety) or major defect (employee safety) depending on the
question.
Research limitations: The use of utilized a three point likert scale instead of a 5-point scale in the survey was
an obstacle toward assessing the data using more sophisticated statistical analysis
Practical implications: The majority of the nurses' responses in regards to the OHS practices at the hospital
were high or at least accepted. Despite the general positive feedback about the OHS standards at Latifa
Hospital, the study has shown some policy related issues. Therefore some aspects related to policies, risk
assessment, employee safety and motivation must be tackled in a systematic approach to improve the current
practices in relation to those factors.
Originality/value of paper: the first study that has tackled the occupational health and safety issues from
nurses perspectives in UAE.
Keywords: nurses, occupational health and safety, hospital
Introduction
Occupational health and safety (OHS) forces the companies or the organizations despite their size,
to do different arrangements of their own business to promote the health and safety of all the

165 | P a g e
individuals involved. Therefore, it is compulsory for any entity to develop several procedures that
will help in appraising its work including its assets and faults. That will help in creating a safe
environment for peoples at work and will protect their associates, employers, customers, families
and the whole community as a result. In the past, employers were not obliged by law to provide safe
work place for their employees or even to compensate for them in case of work injuries, until 1959
when the International Labour Organization proposed the concept of employer responsibility over
their employees safety from all health hazards that could threaten their health or life (Ilo.org, 2014).
The main environmental health hazardous in any work place are physical, chemical, biological,
mechanical or psychological depending on the type of work as all or some will be present
(Commonwealth of Australia, 2012). There are many factors contributing to the environmental
hazardous in hospitals starting from the layout and ending by the job nature effects (Tropmed.org,
2014). Since the early 1900s till date the safety consultants and the employers has adopted the three
E’s (Engineering, Education, and Enforcement) strategy to guide their practices toward occupational
health and safety environment (Wilde, 1998). Occupational health and safety training of employees
plays a vital role in the prevention of possible health injuries or hazardous that might occur due to
lack of training or knowledge (Papaleo, Cangiano & Calicchia, 2013). Nurses who makes more than
60% of any hospital staffs, are facing the major health and occupational hazardous in the workplace
including the extended duty hours, substantial workload, time limitation, tough or even complicated
responsibilities, the obligation to take care of patients with their families when they are in terminal
stage or nearing death, insufficient break time if any, underestimation by public or colleagues and
lack of administrative support, despite the fact that the nurses contribution to the individual’s and
community’s health can't be measured (McHugh, Kutney-Lee, Cimiotti, Sloane and Aiken, 2011).
Queensland Nurses' Union in Australia alarmed in their 2009 report that the nurses work
related pressure and tension are directly affecting their safety mainly after exhausting schedules or
overtime (Armstrong, 2009; Shipman and Hooten, 2007). Many researchers in their studies have
strongly indicated the strong relation between nursing as a profession and occupational related risks
including back pain, disk prolapse, chemical/ radiation exposure or even high levels of stress that
might lead to burnout or depression, usually the nurses burnout are related to the lack of power in
the organization despite the fact that the work can't be done without their massive input (Lorusso,
Bruno and L'abbate, 2007; El-Jardali and Lagacé, 2005). It has been empirically proven that the
empowerment of nurses through supportive work environment and adequate training and learning is
highly associated with error reduction, staff satisfaction and low turnover rates which are among the
main problem in the nursing profession (Rogers, Dean, Hwang and Scott, 2008; Clarke, 2007).
166 | P a g e
Moreover, a well-established healthcare systems that necessitate the employees' continuous
education and training based on their needs by enrolling them in regular training classes, physical
exams, and other methods of competencies are vital to provide a high quality care in a safe
environment to patients and employees (AAOHN Practice Committee, 2014). In the United State of
America there is a substantial amount of the national money going as a compensation of the direct
or the indirect occupational hazardous, that might exceed the national oncology budget, which at the
end will definitely affect the whole country (Leigh, 2011). Literature review of safety culture has
shown disagreement between researchers regarding the components of safety culture (Guldenmund,
2007). Some researchers have proposed 2 components of safety culture, while others have reached
up to 19 components, starting from the organization management and ending by the risk awareness
among the employees of the organization (Yang, Wang, Chang, Guo and Huang, 2009). Safety
culture indicators are categorized as formal versus informal standards. The formal standards in a
safety culture are the written organizational safety policies and procedures, such as OSHA
regulations, while the informal standards are not documented, but it will influence the safety culture
which might include the group norms, trust among employees, group accountability toward safety,
reward and punishment system in case of safe or unsafe behaviours (Rao, 2007). As a result,
improving the work settings and the hospital environment will improve the nurses’ occupational
health and safety conditions, which at the will affect the provided quality of patient care (Kanai-Pak,
Aiken, Sloane & Poghosyan, 2008).
Study Objectives
To inspect the effect of occupational health and safety on the hospital service delivery.
To detect any insufficiencies in the hospital’s health and safety procedures.
To measure the level of compliance to occupational health and the safety practices presented
by employers and employees.
This study was conducted to evaluate the current OHS status at one of Dubai Health Authority
Hospitals (Latifa); in the United Arab Emirates. Therefore the study has examined Latifa Hospital
occupational health and safety practices (employer) from the point of view of the nurses (employees).
Materials and Methods
This is a descriptive study, describe the current situation of occupational health and safety practices
Latifa Hospital from nursing perspective (Lance, Butts & Michels, 2006). After obtaining the
approval from the hospitals’ administration to conduct it (Appendix 1), a 183 nurses in the maternity

167 | P a g e
unites (N=183) has answered the questionnaire, keeping in consideration that it has been already
proven that the questionnaire survey allows respondents the needed time to think through the
questions and to provide the accurate answers. The methodology enlightened on the preliminary
phase, data collection, the population and sampling techniques, and data sources, data collection tool,
and data analysis strategy.
Pilot Study
During the preliminary phase the nurses' ability to complete the survey effectively , the questionnaire
reliability and validity has been tested. Ten nurses participated in the pilot phase from the maternity
unites, their feedback and comments on the questionnaire has been taken into consideration and the
tool was modified after that (Appendix 2). During this phase a few official meetings with the nursing
supervisor of the maternity units, and some unstructured interviews with some staffs facilitated the
establishment of an understanding about the proposed questionnaire feasibility and analysis
procedure relevance. During this phase the content reliability was tested using the Cronbach's Alpha,
and it was 0.862 for all the survey questions and the Cronbach’s Alpha ranged from 0.837–0.870 for
different dimensions, keeping in mind that any value of Cronbach's Alpha more than 0.7 is accepted
(Morse, 2012). Moreover, throughout the data analysis of the study, the participants responses of the
three likert scale survey was assigned to numerical values for statistical purposes; "Yes"→"3",
"No"→2 and "N/A"→1.
Setting
Latifa Hospital was built in 1987, it is one of the biggest maternity and children's hospital in UAE
and was built in 1987. The hospital was earlier known as Al Wasl hospital and was renamed Latifa
Hospital on the 4th of January, 2012 as per the orders of His Highness Sheikh Mohammed Bin Rashid
Al Maktoum, Vice-President and Prime Minister of the UAE and Ruler of Dubai to pay respect to
the loving memory of his late mother Sheikha Latifa Bint Hamdan bin Zayed Al Nahyan
(Dha.gov.ae, 2014). Latifa Hospital contains of 400 beds distributed on the following facilities:
Gynaecology, Obstetrics, Paediatrics, Paediatric Surgery and Thalassemia, these reinforced with all
the needed facilities and highly sophisticated equipment to give a high quality patient care at an
international level as the hospital has got the Joint Commission International Accreditation since
2007 (Dha.gov.ae, 2014).
168 | P a g e
Study Population
The nurses working in the maternity wards (6 wards), the Intensive Care Unit (ICU), the Delivery
Suite (DS) and the Emergency Department (ED) were included and the questionnaire was given to
them after getting their approval to participate in the study.
Sampling and Data Collection
A purposive sampling technique was used as the aim of the study was to check the occupational
health practices among nurses and the study targeted population was including them, therefore its
use was justified in this study (Morse, 2012; Zikmund, 2003). The data was collected during the
period from 26/04/2014 to 02/05/2014 including all the shifts, depending on the participants'
convenient time and the work load through all the units.
Questionnaire survey
Standardized structured questionnaire was administered to the nurses in the maternity units, ICU,
DS and ED to collect data on the concerned variables to assess the current occupational health and
safety status in the hospital. The questionnaire was including 4 basic questions on the nurses
demographic data (such as age, qualification, designation and years of experiences) and 28 questions
related to the occupational safety and health in the hospitals covering. In addition the three-likert
scale was used as ordinal ratings set-up for the surveys. There is no valuable literature variances in
the reliability and the validity stemming between all the types of likert scale including the five-likert
scale and the three likert scale (Jacoby and Matell, 1971), moreover participants are more able to
express their opinions on three-likert scale because they can focus on either on "Yes", No" or "N/A"
(Not Applicable), which in other wards means if they "Agree", "Disagree" or being "Neutral" (Allen
and Seaman, 2007)
Sample Size
The total number of nurses participated in the study was 200 nurses which indeed was equals to 200
question tools, after excluding the incomplete questionnaires (9 sample), and the questionnaires with
unclear selection or double answers (8 samples) the total sample size was 183 accepted tools;
therefore the sample size N= 183 nurses.
Data Analysis
The study data analysis which was quantitative was carried out through the Microsoft Office Excel
and the current version of Statistical Product and Services Solution (SPSS). In the evaluation of the

169 | P a g e
data, percentage, frequency, mean and the standard deviation (SD) have been used. The level of
significance (P value) was set at 5% (2 sided).
Results
The survey questionnaires (250) were distributed among the wards over one week, the return rate
was 80% as 200 were received back, 91.5% of the nurse has answered the questionnaire fully
(N=183). According to the demographic characteristics of nurses (Table1), 42.1% of all the nurses
are between 35-44 years old and 76.2% of them have a bachelor degree. 63.9% of them are in the
position of staff nurse-2 and 40.4% has 5-10 years of professional experience. The variables related
to training, competencies and safety precautions had the highest means of 2.96 ±0.03, in addition to
that, the staff motivations, psychological support and considerations had the lowest means of 2.53 ±
0.01. Overall, the mean of all the respondents’ perception on OHS ranged between 2.52–2.99 which
obviously means that the nurses’ responses have been displayed around scores on “Yes” and “No”
mainly.
Table 1: Nurses Demographic Characteristics (N= 183)
Demographic Data Frequency (N) Percentage (%)
Age
18 to 24 2 1.1
25 to 34 56 30.6
35 to 44 77 42.1
45 to 54 35 19.1
55 to 64 13 7.1
Qualification
Diploma 57 31.1
BSN 123 67.2
Master 2 0.5
MPHIL 1 0.25
Designation
HCA 1 0.5
AN 22 12.0
SN1 7 3.8
SN2 117 63.9
SN3 29 15.8
SSN 6 3.3
NS 1 0.5
Experience
< 5 Years 26 14.2
5-10 Years 74 40.4
11-15 Years 31 16.9
16-20 Years 12 6.6

170 | P a g e
21-25 Years 16 8.7
> 25 Years 24 13.1
From Table 2 and after analyzing the nurses' responses regarding the patients' related
occupational health and safety practices, 95.6% admitted the availability of OHS policies in the
hospital, the infection rate was monitored (98.4%), precautions against blood and body fluids are
taken (97.8%), patient/nurse ratio is balanced (61.2%), fit and suitable individuals are appointed for
positions (74.9%), disciplinary actions will be taken against negligence (95.6%), and 88.5% of the
nurses agreed that their management will act immediately in case of problems. The analysis of the
environmental related questions revealed that 87.4% of the nurses feels that the hospital environment
is convenient and safe, Broken/defective devices are not used (95.6%), the best equipment are
brought for the hospital (78.7%), precautions are taken against medical/toxic waste (98.9%),
organizational culture is established for safety (90.2%), warning signs and posters are displayed
appropriately (95.1%), the working environment is comfortable (76.5%), the availability of security
personnel in the hospital (97.3%), the security staffs generates effective solution to problems
(70.5%), regulations and job descriptions are available for instances such as fire/natural disasters
(99.5%), and 88% of the nurses felt that the heat, lighting and air conditioning are sufficient. When
analyzed the safety culture related questions, 79.2% felt that a regular data collection on employee
safety and high risk areas are regularly assessed and improved, availability of the occupational health
and safety committee (91.3%), protective devices can be found and used easily (95.6%), training on
personal safety including risk management and accidents (86.9%), occupational accidents are
monitored and recorded (93.4%) and the working hours are designed to maintain personnel safety
(78.1%). The employee safety questions revealed that 53.6% of the nurse felt that the social events
are planned to reduce the psychological pressure on the staff, motivation and satisfaction of all the
staff are observed and actions are taken (53.6%), arrangements are taken to protect nurses against
violent from patients or relatives (59.6%), employees are vaccinated against common infections
(89.65%) and 54.1% only felt that the staffs during pre/post maternity period are additionally
protected against working environment and conditions.
Table 2: Occupational Health and Safety Practices from Nurses' perspective
Occupational health and safety questions (N= 183) Yes% No%
N/A%
Patient Safety
There are written policies regarding occupational health safety 95.6 4.4 -
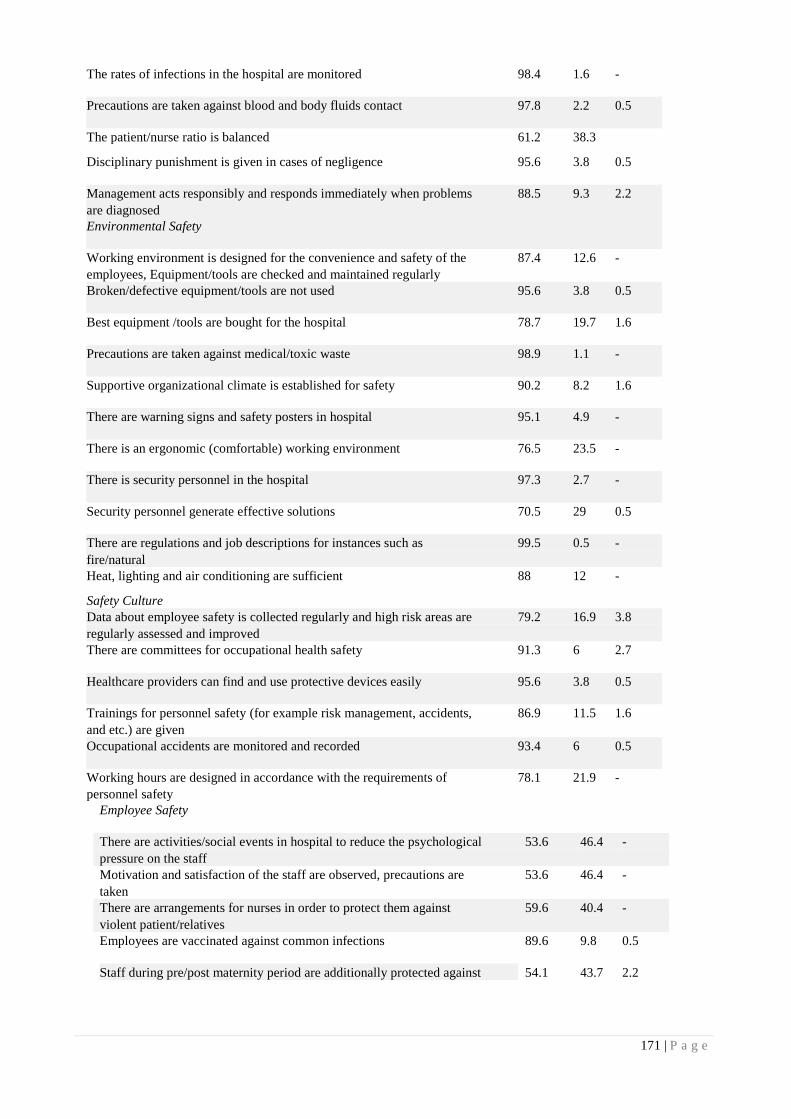
171 | P a g e
The rates of infections in the hospital are monitored 98.4 1.6 -
Precautions are taken against blood and body fluids contact 97.8 2.2 0.5
The patient/nurse ratio is balanced 61.2 38.3
Disciplinary punishment is given in cases of negligence 95.6 3.8 0.5
Management acts responsibly and responds immediately when problems 88.5 9.3 2.2
are diagnosed
Environmental Safety
Working environment is designed for the convenience and safety of the 87.4 12.6 -
employees, Equipment/tools are checked and maintained regularly
Broken/defective equipment/tools are not used 95.6 3.8 0.5
Best equipment /tools are bought for the hospital 78.7 19.7 1.6
Precautions are taken against medical/toxic waste 98.9 1.1 -
Supportive organizational climate is established for safety 90.2 8.2 1.6
There are warning signs and safety posters in hospital 95.1 4.9 -
There is an ergonomic (comfortable) working environment 76.5 23.5 -
There is security personnel in the hospital 97.3 2.7 -
Security personnel generate effective solutions 70.5 29 0.5
There are regulations and job descriptions for instances such as 99.5 0.5 -
fire/natural
Heat, lighting and air conditioning are sufficient 88 12 -
Safety Culture
Data about employee safety is collected regularly and high risk areas are 79.2 16.9 3.8
regularly assessed and improved
There are committees for occupational health safety 91.3 6 2.7
Healthcare providers can find and use protective devices easily 95.6 3.8 0.5
Trainings for personnel safety (for example risk management, accidents, 86.9 11.5 1.6
and etc.) are given
Occupational accidents are monitored and recorded 93.4 6 0.5
Working hours are designed in accordance with the requirements of 78.1 21.9 -
personnel safety
Employee Safety
There are activities/social events in hospital to reduce the psychological 53.6 46.4 -
pressure on the staff
Motivation and satisfaction of the staff are observed, precautions are 53.6 46.4 -
taken
There are arrangements for nurses in order to protect them against 59.6 40.4 -
violent patient/relatives
Employees are vaccinated against common infections 89.6 9.8 0.5
Staff during pre/post maternity period are additionally protected against 54.1 43.7 2.2

172 | P a g e
working environment and conditions
Table 3: Occupational Health and Safety Practices from Nurses' perspective
Occupational Health and Safety Questions (N= 183) Mean SD Range
Patient Safety 2.96 .205 2-3
There are written policies regarding occupational health safety 2.98 .127 2-3
The rates of infections in the hospital are monitored 2.98 .147 2-3
Precautions are taken against blood and body fluids contact 2.61 .501 1-3
The patient/nurse ratio is balanced 2.95 .241 1-3
Disciplinary punishment is given in cases of negligence 2.86 .403 1-3
Management acts responsibly and responds immediately when problems 2.87 .332 2-3
are diagnosed
Environmental Safety 2.95 .241 1-3
Working environment is designed for the convenience and safety of the 2.77 .459 1-3
employees, Equipment/tools are checked and maintained regularly
Broken/defective equipment/tools are not used 2.99 .104 2-3
Best equipment /tools are bought for the hospital 2.89 .368 1-3
Precautions are taken against medical/toxic waste 2.95 .217 2-3
Supportive organizational climate is established for safety 2.77 .425 2-3
There are warning signs and safety posters in hospital 2.97 .163 2-3
There is an ergonomic (comfortable) working environment 2.70 .472 1-3
There is security personnel in the hospital 2.99 .074 2-3
Security personnel generate effective solutions 2.88 .326 2-3
There are regulations and job descriptions for instances such as 2.75 .513 1-3
fire/natural
Heat, lighting and air conditioning are sufficient 2.89 .396 1-3
Safety Culture 2.95 .241 1-3
Data about employee safety is collected regularly and high risk areas are 2.85 .399 1-3
regularly assessed and improved
There are committees for occupational health safety 2.93 .278 1-3
Healthcare providers can find and use protective devices easily 2.78 .414 2-3
Trainings for personnel safety (for example risk management, accidents, 2.54 .500 2-3
and etc.) are given
Occupational accidents are monitored and recorded 2.53 .511 1-3
Working hours are designed in accordance with the requirements of 2.60 .492 2-3
personnel safety
Employee Safety 2.89 .330 1-3
There are activities/social events in hospital to reduce the psychological 2.52 .543 1-3
pressure on the staff
Motivation and satisfaction of the staff are observed, precautions are 2.53 .511 1-3
taken
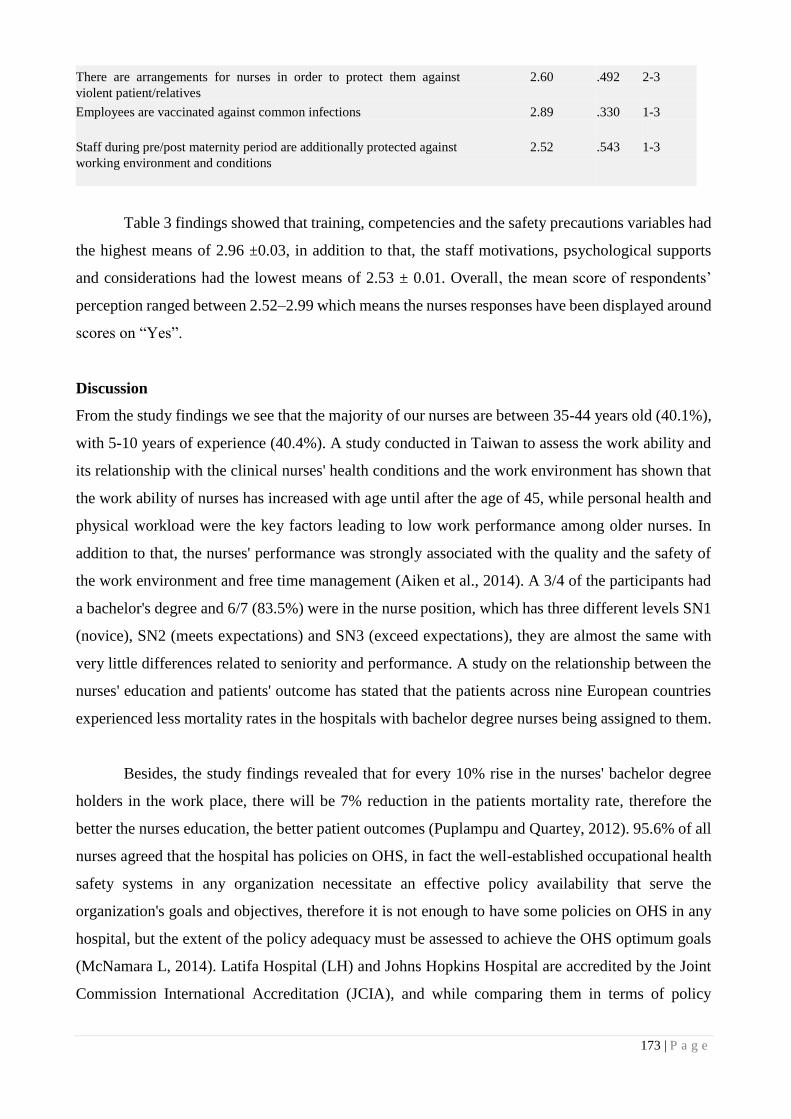
173 | P a g e
There are arrangements for nurses in order to protect them against 2.60 .492 2-3
violent patient/relatives
Employees are vaccinated against common infections 2.89 .330 1-3
Staff during pre/post maternity period are additionally protected against 2.52 .543 1-3
working environment and conditions
Table 3 findings showed that training, competencies and the safety precautions variables had
the highest means of 2.96 ±0.03, in addition to that, the staff motivations, psychological supports
and considerations had the lowest means of 2.53 ± 0.01. Overall, the mean score of respondents’
perception ranged between 2.52–2.99 which means the nurses responses have been displayed around
scores on “Yes”.
Discussion
From the study findings we see that the majority of our nurses are between 35-44 years old (40.1%),
with 5-10 years of experience (40.4%). A study conducted in Taiwan to assess the work ability and
its relationship with the clinical nurses' health conditions and the work environment has shown that
the work ability of nurses has increased with age until after the age of 45, while personal health and
physical workload were the key factors leading to low work performance among older nurses. In
addition to that, the nurses' performance was strongly associated with the quality and the safety of
the work environment and free time management (Aiken et al., 2014). A 3/4 of the participants had
a bachelor's degree and 6/7 (83.5%) were in the nurse position, which has three different levels SN1
(novice), SN2 (meets expectations) and SN3 (exceed expectations), they are almost the same with
very little differences related to seniority and performance. A study on the relationship between the
nurses' education and patients' outcome has stated that the patients across nine European countries
experienced less mortality rates in the hospitals with bachelor degree nurses being assigned to them.
Besides, the study findings revealed that for every 10% rise in the nurses' bachelor degree
holders in the work place, there will be 7% reduction in the patients mortality rate, therefore the
better the nurses education, the better patient outcomes (Puplampu and Quartey, 2012). 95.6% of all
nurses agreed that the hospital has policies on OHS, in fact the well-established occupational health
safety systems in any organization necessitate an effective policy availability that serve the
organization's goals and objectives, therefore it is not enough to have some policies on OHS in any
hospital, but the extent of the policy adequacy must be assessed to achieve the OHS optimum goals
(McNamara L, 2014). Latifa Hospital (LH) and Johns Hopkins Hospital are accredited by the Joint
Commission International Accreditation (JCIA), and while comparing them in terms of policy

174 | P a g e
adequacy, we see that LH is lagging behind in many areas, for example there is no policies on "Death
of LH Employee at LH Worksite", "Worker's Compensation" and the "Pro-Active Safety Risk
Assessment Policy" (Krein, Kowalski, Hofer & Saint, 2012). Furthermore, 98.4% of the nurses
agreed that the infection rates are monitored in the hospital, 97.8% said that precautions are taken
against blood and body fluids contact, in LH most of the policies on infection control and monitoring
are supported by the JCIA patient safety goals. The following key indicators are monitored by the
hospital to assure the safety of the hospital in terms of infection control:
All Healthcare Associated Infections (HAIs): compliance with hand washing.
Surgical site infections (SSI): for caesarean section.
Catheter Associated Urinary Tract Infections (CAUTI)
Central Venous Catheter Related Bloodstream infections (CRBSI)
Ventilator Associated Pneumonia (VAP)
Healthcare associated infections affect 5% of patients hospitalized in the United States each year,
the Central Venous Catheter Related Bloodstream infections are linked to 12%–25% of the reported
mortalities, so the LH strategies of infection rate monitoring are valid and effective (ANA, 2012;
Radwin, Cabral, Chen and Jennings, 2009). By touching another aspect we find that 61.2% of the
nurses said that the patient/nurse ration is balanced and 78.1% said that the working hours are
designed in accordance with the requirements of personnel safety. According to researchers if each
patient will have more direct contact time with his assigned nurse (30-40 minutes) on a daily basis,
he will have better health outcomes including less pressure ulcers, low risk of developing urinary
tract infections, urinary catheters, and reduction in the hospitalization period (Rogers, Hwang, Scott,
Aiken and Dinges, 2004). Extended working hours with insufficient staffing affects the nurses’
health, by increasing their risk of developing musculoskeletal disorders including back, neck, and
shoulder pain/injuries, hypertension, cardiovascular diseases, and psychological stress including
depression (El-Jardali, Dimassi, Jamal, Jaafar and Hemadeh, 2011; Vecchio, Scuffham and Hilton,
2009). In LH there are policies on nurse staffing ratios according to the patient’s condition (Appendix
3). Nursing shortage is affected by the poor social image of nurses in Arabs countries including UAE,
the job nature which necessitate the direct contact with patients from opposite gender, the prolonged
duty hours as well as the need to work on weekends and night shifts has made the UAE family's
reluctant to send their daughters for nursing (Johnstone and Kanitsaki, 2007). Thus has forced UAE
to depend mainly on overseas recruitments; which has high turnover rates due to the resignation
among its nurses after getting the training and experience of working in a JCIA well reputed
hospitals, they will resign for inside or outside UAE better job benefits. As a result of that shortage,

175 | P a g e
the other nurses in LH are obliged to do overtime duty or to breach the nurse/patient ration policy to
face the patients' needs. Besides a 91.3% of the nurses said that there are committees for occupational
health safety, 93.4% said that the occupational accidents are monitored and recorded, 86.9% said
that they are getting trainings for personnel safety, 79.2% said that the data about employee safety
is collected regularly and high risk areas are regularly assessed and improved. Nurses have critical
roles in the patient’s safety risk assessment and its management. Consequently, nurses need to be
equipped by education to succeed in the work field risk assessment and to be able to practice the risk
management while maintaining their own safety (Mostafa, 2009). The Occupational Health and
Safety Committee should assess regularly the high risk areas, report/document all incidents, prepare
the recommended corrective actions post incidents and conduct education on the aspects of loss
prevention in a facility (Threatanalysis.com, 2014). In LH the nurses responses shown some defect
in the committee functions, which indeed its functions are mainly related to facility management
activities (water, light and electricity), fire training and the compliance with JCIA standards of
facility safeties which was proven by the 99.5% of the nurses responses which supported the presence
of regulations and job descriptions for instances such as fire/natural and 98.5% said that there are
precautions taken by LH against medical/toxic waste. In other words, 97.3% of the nurses admitted
the fact of the security personnel availability in the hospital, 70.5% of then said that the security
personnel are able to generate effective solutions, 59.6% only believed in the availability of
arrangements for nurses in order to protect them against violent patient/relatives. In fact, there is no
hospital without risk and certain threats can be tolerable. The use of security personnel is a risk
adjusted intervention to assure the hospital safety, maintain the consistency of care delivery and
efficiently protects the staffs as well as the hospital properties (ANA, 2001). According to the
American Nurses Association less than 20% of nurses felt safe at their work place during the study
time, therefore nursing has been classified among the most risky occupation in relation to physical
assault (Catlette, 2005). Most of the violence against nurses occurs in the psychiatric wards, geriatric
wards, emergency departments and the waiting areas of the hospitals. In LH despite the physical
presence of the security personnel, the availability of the colour coded emergency response plan for
Suspected Aggressive Individuals (code black), still the nurses are at risk of different types of
violence from patients, relatives and other staffs in the hospital. That might be due to the female
domain of the occupation, the shortage of staffing which might lead to delay in service delivery
which might trigger patients or relative anger and the public assumptions that "violence" is part of
"nursing" therefore it should be tolerated. When asked the nurses if the motivation and satisfaction
of the staff are observed, precautions are taken and to reduce the psychological pressure on the staff
there are activities/social events taking place in the hospital only 53.6% said "Yes", and 54.1% of
176 | P a g e
the nurses agreed that staff during pre/post maternity period are additionally protected against
working environment and conditions. According to literature nurses are majority group in hospitals,
but the lack of motivation in nursing has been associated with negative effect on patient health and
safety. Healthcare workers including nurses are motivated mainly by intrinsic factors, implying that
this should be a target for effective employee motivation (Lambrou, Kontodimopoulos and Niakas,
2010). The amount of salary compensations, performance appraisal based bonus payments in
association with management support are highly associated with work motivation and employee
retention (Adzei & Atinga, 2012). In LH nurses are working under stressful events with low financial
and non-financial compensations; compared to the local (Abu Dhabi Health Authority) or the
international standards, despite the fact that they are functioning at an international levels (JCIA).
Study Limitations
The study was based on the assumption that the nurses in the designated hospital were honest and
provided accurate survey responses.
Some nurses were not very keen to share information about their assessment to the OHS in the
hospital as that the information might be published and can be used against the hospital.
The use of utilized a three point likert scale instead of a 5-point scale in the survey was an obstacle
toward assessing the data using more sophisticated statistical analysis.
Although respondents provided generally positive feedback about the OHS standards at
Latifa Hospital, the study did not adequately relate the few sub-optimal findings to demographic
variables or departments, which might be policy relevant.
Conclusion
In conclusion we can say that Latifa Hospital is favoured by the demographic characteristics of
its nurses, as the majority of the nurses age rages between 35-44 years, having 5-10 years of
experience and owing bachelor degrees mainly, as those factors are associated with positive impacts
on occupational health and safety practices in healthcare organizations. The majority of the nurses'
responses in regards to the OHS practices at the hospital were high or at least accepted. Some aspects
related to policies, risk assessment, employee safety and motivation must be tackled in a systematic
approach to improve the current practices in relation to those factors. LH should work on policy
extension to expand the current situation (policy on workers compensation) or in some cases to
enable current ones (Policy against violence). Expanding the role of OHS Committee in LH; to
manage areas like employee safety, security personnel roles in the hospital, and the enhancement of

177 | P a g e
the ergonomic workplace. Despite the fact that nurses shortage, work tension, burnout, lack of
motivations and the risk of violence continue to be stagnated issues in nursing since long time, but
the improvement of the work environment and the nurses empowerment will help in reducing its
effects on patients, nurses and healthcare system. Moreover, the organization should plan for social
activities and work related tension reduction programs for its nurses to reduce their job related
psychological pressure, exhaustion and the job lack of motivations. Finally, conducting similar
studies with larger sample group either in the same hospital or across other hospitals will help in the
generalizability of the finding and the assessment of the current situation progress.
References
AAOHN Practice Committee,. (2014). Advanced Practice Registered Nurses in Occupational Health
Settings. American Association Of Occupational Health Nurses, Inc, 62(3), 92-93.
Adzei, F., & Atinga, R. (2012). Motivation and retention of health workers in Ghana's district hospitals.J Of
Health Org And Mgt, 26(4), 467-485.
Aiken, L., Sloane, D., Bruyneel, L., Van den Heede, K., Griffiths, P., & Busse, R. et al. (2014). Nurse
staffing and education and hospital mortality in nine European countries: a retrospective observational
study. The Lancet, 383(9931), 1824-1830.
Allen, I., & Seaman, C. (2007). Likert scales and data analyses. Quality Progress, 40(7), 65-67.
ANA,. (2001). Nurses cite stress, overwork as top health, safety concern. American Nurse, 33(5), 1.
ANA,. (2012). Reduce The Risk of Health Associated Infection. In ANA's 6th Annual Nursing Quality
Conference. Georgia: The American Nurses Association.
Armstrong, F. (2009). Ensuring quality, safety and positive patient outcomes: Why investing in nursing
makes sense (pp. 3-37). Melbourne: Australian Nursing Federation. Retrieved from
http://anmf.org.au/documents/reports/Issues_Ensuring_quality.pdf
Catlette, M. (2005). A Descriptive Study of the Perceptions of Workplace Violence and Safety Strategies of
Nurses Working in Level I Trauma Centers. Journal Of Emergency Nursing, 31(6), 519-525.
Clarke, S. (2007). Hospital work environments, nurse characteristics, and sharps injuries. American Journal
Of Infection Control, 35(5), 302-309.
Commonwealth of Australia,. (2012). Environmental health risk assessment—Guidelines for assessing
human health risks from environmental hazards.

178 | P a g e
Dha.gov.ae,. (2014). Specialized Services. Retrieved 28 May 2014, from
http://www.dha.gov.ae/EN/Facilities/Hospitals/AlWaslHospital/SpecializedServices/Pages/default.aspx
Dha.gov.ae,. (2014). Who We Are (An Introduction, A History, and Accreditations). Retrieved 28 May
2014, from http://www.dha.gov.ae/EN/Facilities/Hospitals/AlWaslHospital/aboutus/Pages/WhoWeAre.aspx
El-Jardali, F., & Lagacé, M. (2005). Making Hospital Care Safer and Better: The Structure-Process
Connection Leading to Adverse Events. Healthcare Quarterly, 8(2), 40-48.
El-Jardali, F., Dimassi, H., Jamal, D., Jaafar, M., & Hemadeh, N. (2011). Predictors and outcomes of patient
safety culture in hospitals. BMC Health Services Research, 11(1), 45.
Guldenmund, F. (2007). The use of questionnaires in safety culture research – an evaluation. Safety
Science, 45(6), 723-743.
Ilo.org,. (2014). Origins and history. Retrieved 26 May 2014, from http://www.ilo.org/global/about-the-
ilo/history/lang--en/index.htm
Jacoby, J., & Matell, M. (1971). Three-Point Likert Scales Are Good Enough. Journal Of Marketing
Research, 8(4), 495.
Johnstone, M., & Kanitsaki, O. (2007). Clinical risk management and patient safety education for nurses: A
critique. Nurse Education Today, 27(3), 185-191.
Kanai-Pak, M., Aiken, L., Sloane, D., & Poghosyan, L. (2008). Poor work environments and nurse
inexperience are associated with burnout, job dissatisfaction and quality deficits in Japanese
hospitals. Journal Of Clinical Nursing, 17(24), 3324-3329.
Krein, S., Kowalski, C., Hofer, T., & Saint, S. (2012). Preventing Hospital-Acquired Infections: A National
Survey of Practices Reported by U.S. Hospitals in 2005 and 2009. Journal Of General Internal
Medicine, 27(7), 773-779.
Lambrou, P., Kontodimopoulos, N., & Niakas, D. (2010). Motivation and job satisfaction among medical
and nursing staff in a Cyprus public general hospital. Human Resources For Health, 8(1), 26.
Lance, C., Butts, M., & Michels, L. (2006). The Sources of Four Commonly Reported Cutoff Criteria: What
Did They Really Say?. Organizational Research Methods, 9(2), 202-220.
Leigh, J. (2011). Economic Burden of Occupational Injury and Illness in the United States. Milbank
Quarterly, 89(4), 728-772.
Lorusso, A., Bruno, S., & L'abbate, N. (2007). A Review of Low Back Pain and Musculoskeletal Disorders
among Italian Nursing Personnel. Industrial Health, 45(5), 637-644.

179 | P a g e
McHugh, M., Kutney-Lee, A., Cimiotti, J., Sloane, D., & Aiken, L. (2011). Nurses' Widespread Job
Dissatisfaction, Burnout, And Frustration With Health Benefits Signal Problems For Patient Care.Health
Affairs, 30(2), 202-210.
McNamara L,. (2014). Johns Hopkins Safety Policies. Hopkinsmedicine.org. Retrieved 3 June 2014, from
http://www.hopkinsmedicine.org/hse/policies/policiessections.html#Sec3
Morse, J. (2012). Qualitative health research. California: Left Coast Press.
Mostafa, G. (2009). Enhancing nurses' knowledge and awareness about risk management: system
design. Eastern Mediterranean Health Journal, 15(5).
Papaleo, B., Cangiano, G., & Calicchia, S. (2013). Occupational safety and health professionals' training in
Italy. Journal Of Workplace Learning, 25(4), 247-263.
Puplampu, B., & Quartey, S. (2012). Key Issues on Occupational Health and Safety Practices in Ghana: A
Review. International Journal Of Business And Social Science, 3(19), 151-156.
Radwin, L., Cabral, H., Chen, L., & Jennings, B. (2009). A protocol for capturing daily variability in
nursing care. Nursing Economic, 28(2), 95-105.
Rao, S. (2007). Safety culture and accident analysis—A socio-management approach based on
organizational safety social capital. Journal Of Hazardous Materials, 142(3), 730-740.
Rogers, A., Dean, G., Hwang, W., & Scott, L. (2008). Role of registered nurses in error prevention,
discovery and correction. Quality And Safety In Health Care, 17(2), 117-121.
Rogers, A., Hwang, W., Scott, L., Aiken, L., & Dinges, D. (2004). The Working Hours Of Hospital Staff
Nurses And Patient Safety. Health Affairs, 23(4), 202-212.
Shipman, D., & Hooten, J. (2007). Are nursing homes adequately staffed? The silent epidemic of
malnutrition and dehydration in nursing home residents. Until mandatory staffing standards are created and
enforced, residents are at risk. Journal Of Gerontological Nursing, 33(7), 15-18.
Threatanalysis.com,. (2014). Strategic Security Management. Retrieved 3 June 2014, from
http://www.threatanalysis.com/hospital.html
Tropmed.org,. (2014). Environmental and Occupational Health Issues in Hospitals. Retrieved 26 May
2014, from http://www.tropmed.org/rreh/vol1_2.htm
Vecchio, N., Scuffham, P., & Hilton, M. (2009). Mental health and hours worked among nurses.Australian
Journal Of Labour Economics, 12(3), 299.

180 | P a g e
Wilde, G. (1998). The concept of target risk and its implications for accident prevention strategies.
Occupational injury: Risk, prevention and intervention. Accident Analysis & Prevention, 82-105.
Yang, C., Wang, Y., Chang, S., Guo, S., & Huang, M. (2009). A Study on the Leadership Behavior, Safety
Culture, and Safety Performance of the Healthcare Industry. Proceedings Of World Academy Of Science:
Engineering & Technology, 53.
Zikmund, W. (2003). Business research methods. Mason, OH: Thomson/South-Western.