Integration of the Stiles–Crawford effect of the first kind
12
This article was downloaded by: [University of Waterloo] On: 15 December 2014, At: 11:27 Publisher: Taylor & Francis Informa Ltd Registered in England and Wales Registered Number: 1072954 Registered office: Mortimer House, 37-41 Mortimer Street, London W1T 3JH, UK Journal of Modern Optics Publication details, including instructions for authors and subscription information: http://www.tandfonline.com/loi/tmop20 Integration of the Stiles–Crawford effect of the first kind Jay M. Enoch a & Vasudevan Lakshminarayanan b a School of Optometry (Mail Code 2020) , University of California at Berkeley , Berkeley, California 94720-2020, USA b School of Optometry , University of Waterloo , Waterloo, Ontario N2V 2V8, Canada Published online: 20 Aug 2009. To cite this article: Jay M. Enoch & Vasudevan Lakshminarayanan (2009) Integration of the Stiles–Crawford effect of the first kind, Journal of Modern Optics, 56:20, 2240-2250, DOI: 10.1080/09500340903118533 To link to this article: http://dx.doi.org/10.1080/09500340903118533 PLEASE SCROLL DOWN FOR ARTICLE Taylor & Francis makes every effort to ensure the accuracy of all the information (the “Content”) contained in the publications on our platform. However, Taylor & Francis, our agents, and our licensors make no representations or warranties whatsoever as to the accuracy, completeness, or suitability for any purpose of the Content. Any opinions and views expressed in this publication are the opinions and views of the authors, and are not the views of or endorsed by Taylor & Francis. The accuracy of the Content should not be relied upon and should be independently verified with primary sources of information. Taylor and Francis shall not be liable for any losses, actions, claims, proceedings, demands, costs, expenses, damages, and other liabilities whatsoever or howsoever caused arising directly or indirectly in connection with, in relation to or arising out of the use of the Content. This article may be used for research, teaching, and private study purposes. Any substantial or systematic reproduction, redistribution, reselling, loan, sub-licensing, systematic supply, or distribution in any form to anyone is expressly forbidden. Terms & Conditions of access and use can be found at http:// www.tandfonline.com/page/terms-and-conditions
Transcript of Integration of the Stiles–Crawford effect of the first kind

This article was downloaded by: [University of Waterloo]On: 15 December 2014, At: 11:27Publisher: Taylor & FrancisInforma Ltd Registered in England and Wales Registered Number: 1072954 Registered office: Mortimer House,37-41 Mortimer Street, London W1T 3JH, UK
Journal of Modern OpticsPublication details, including instructions for authors and subscription information:http://www.tandfonline.com/loi/tmop20
Integration of the Stiles–Crawford effect of the firstkindJay M. Enoch a & Vasudevan Lakshminarayanan ba School of Optometry (Mail Code 2020) , University of California at Berkeley , Berkeley,California 94720-2020, USAb School of Optometry , University of Waterloo , Waterloo, Ontario N2V 2V8, CanadaPublished online: 20 Aug 2009.
To cite this article: Jay M. Enoch & Vasudevan Lakshminarayanan (2009) Integration of the Stiles–Crawford effect of the firstkind, Journal of Modern Optics, 56:20, 2240-2250, DOI: 10.1080/09500340903118533
To link to this article: http://dx.doi.org/10.1080/09500340903118533
PLEASE SCROLL DOWN FOR ARTICLE
Taylor & Francis makes every effort to ensure the accuracy of all the information (the “Content”) containedin the publications on our platform. However, Taylor & Francis, our agents, and our licensors make norepresentations or warranties whatsoever as to the accuracy, completeness, or suitability for any purpose of theContent. Any opinions and views expressed in this publication are the opinions and views of the authors, andare not the views of or endorsed by Taylor & Francis. The accuracy of the Content should not be relied upon andshould be independently verified with primary sources of information. Taylor and Francis shall not be liable forany losses, actions, claims, proceedings, demands, costs, expenses, damages, and other liabilities whatsoeveror howsoever caused arising directly or indirectly in connection with, in relation to or arising out of the use ofthe Content.
This article may be used for research, teaching, and private study purposes. Any substantial or systematicreproduction, redistribution, reselling, loan, sub-licensing, systematic supply, or distribution in anyform to anyone is expressly forbidden. Terms & Conditions of access and use can be found at http://www.tandfonline.com/page/terms-and-conditions

Journal of Modern OpticsVol. 56, No. 20, 20 November 2009, 2240–2250
Integration of the Stiles–Crawford effect of the first kind
Jay M. Enocha* and Vasudevan Lakshminarayananb
aSchool of Optometry (Mail Code 2020), University of California at Berkeley, Berkeley, California 94720-2020, USA;bSchool of Optometry, University of Waterloo, Waterloo, Ontario N2V 2V8, Canada
(Received 25 January 2009; final version received 15 June 2009)
In 1932/1933, Walter Stanley Stiles and Brian Hewson Crawford, sought to measure the area of the entrancepupil of their subject’s eyes. They assumed all portions of the entrance pupil of the eye contributed equally tovisual excitation. Their pupillometer did not function as hypothesized. Using photopic stimuli, they found light-rays entering the pupil center had greater capability to stimulate vision than rays penetrating peripheral portionsof the pupil. They deduced the reason for this failure, and discovered the Stiles–Crawford effect of the first kind(SCE-1), or ‘the directional sensitivity of the retina’. This important finding resulted in numerous fine studies, butintegration of excitation across the entrance pupil of the eye, per se, has been rarely considered. At a later date,Enoch, then Drum, addressed this problem. We address integration and specification of visual stimuli, considerconfounds, such as the effects of aberration-induced blur, and the means of mitigating confounds encountered.We consider use of adaptive optics for these purposes.
Keywords: visual stimulus; photometry; retinal illuminance; troland (and photopic and scotopic trolands);Stiles–Crawford effect of the first kind (SCE-1); integration of the SCE-1; methods of comparison of visualstimuli (bipartite fields, flicker photometry); aberrations of the eye (e.g. spherical aberration, chromaticaberration(s))
1. Introduction
1.1. The troland
In the vision science literature, the stimulus to vision isdefined as the product of (1) the luminance of theobject of regard, assessed in the plane of the entrancepupil of the eye, expressed in candelas/m2, and (2) thearea of the entrance pupil of the eye expressed in mm2.These values are expressed in either photopic or
scotopic ‘trolands’. This unit is named after the lateDr Leonard Troland [1–3].
1.2. It is time for a reasoned reassessment of‘the troland’, the unit of retinal illuminance
Leonard Troland, 1889–1932, died in a tragic accidentas a relatively young man. He left behind a respectable
body of research that led to the modern approach toassessment of retinal illuminance, the accepted unitused to specify the stimulus to vision [1–3]. We also callattention to the recent paper by Cheung et al., whichaddresses the standard units of optical radiation [4].
There remains, of course, the larger issue ofconsidering whether the currently employed means ofestimating/assessing the stimulus to vision (often
expressed today as ‘the photopic or the scotopic
troland’) might be improved and/or modified inorder to bring this form of analysis, and measurementunits employed, more effectively into parallel withother modern measures used in radiometry andphotometry.
Please note, the spectral response of the eye whenexposed to brighter/more intense stimuli exciting thecone-receptor dominant-photopic-visual-response-system(V�) differs from the rod-receptor-dominant-scotopic-visual-response-system (V 0�). The latter determina-tion(s) pertain to less intense visual stimuli. Readersare referred to the book by Wyszecki and Stiles forfurther discussion [5].
An ‘equivalent troland’ also has been defined. Thisunit makes use of specification of the Stiles–Crawfordeffect of the first kind, (SCE-1), in the entrance pupilwhere the stimulus has 50% effectiveness relative to thelevel of response determined at the SCE-1 peaklocation [6–9]. A more complete SCE-1 function, etc,can be inferred using data obtained with this approach.
1.3. The photometric efficiency factor
For completeness, we call attention to anotherapproach to integration of, and utilization of SCE-1data for photometric and other purposes. This is based
*Corresponding author. Email: [email protected]
ISSN 0950–0340 print/ISSN 1362–3044 online
� 2009 Taylor & Francis
DOI: 10.1080/09500340903118533
http://www.informaworld.com
Dow
nloa
ded
by [
Uni
vers
ity o
f W
ater
loo]
at 1
1:27
15
Dec
embe
r 20
14

on the ‘Photometric Efficiency (PE)’ Factor [10,11].
The PE is defined by the following ratio:
Effective light collected by pupil
=Actual light collected through the pupil:
This is an interesting concept, but it is not easy tocompute [10]. What is sought here is determination of
‘an equivalent entrance pupil size’ where all points inthe entrance pupil of the eye would theoreticallycontribute equally to the visual stimulus. Particularlyfor photopic vision, this equivalent pupil, would besmaller than the measured entrance pupil of the eye[10,11]. By using this approach, an integrated ‘equiva-lent entrance pupil’ of given diameter and area may bedetermined. In addition, an adjusted SCE-1 centrum[10,11] is provided by developing appropriate weight-ing factors for the asymmetries encountered.
Please remember, for different size pupils, thecenter of the entrance pupil may change by as muchas 0.5mm with dilation of the pupil [12]. For the samedilation of the eye pupil, usually this centrum is quitestable.
1.4. Current practice
The troland [1–3], as ordinarily computed, does nottake into consideration the Stiles–Crawford effects, norfactors associated with existing blur of the retinalimage, nor uncorrected-blur encountered when largeentrance pupil areas are included in the experimentaldesign (using a large natural, or a dilated pupil of theeye, or a decentered eye pupil). It is in our collectiveinterest to enhance the quality of determinations, toimprove the precision of measurements, to reconsiderunits used, and, thus, to correct deficiencies.
1.5. The argument presented in this paper
Here we address a number of aspects of these issues,and offer an approach to the solution of the resultantphotometric problems. We suggest incorporation ofthe integrated Stiles–Crawford effect of the first kind(SCE 1) [13–16] in photometric analyses when degra-dation of images caused by peripheral portions of theoptical elements of the eye (the cornea and the eye lens)are/have been effectively neutralized. Even though thisis still not a perfect solution to the specification of thevisual stimulus, it does represent an advance relative totechniques employed today. This will allow us to moveeffectively towards a finer estimate of the magnitude ofthe visual stimulus seen either by the experimentalsubject or patient tested.
2. The problem and an approach to its solution
2.1. Statement of the problem
When one seeks to determine effective ‘visual stimula-tion induced by radiant energy’ within the visiblespectrum (that is, light, the stimulus to vision) [9], andto integrate all energy entering within the entrancepupil of the eye [13], one needs to consider the Stiles–Crawford effect of the first kind (SCE-1) [13–16].As noted, SCE-1 is also known as the directionalsensitivity of the retina. The issues considered herehave rarely been treated adequately in experimentalprocedures. If one integrates data derived from point-by-point SCE-1 determinations (obtained by measur-ing responses obtained when using tiny aperturesimaged at a number of different locations in theentrance pupil of the eye), the resultant integratedfunction may not predict properly the visual resultobtained when different diameter areas in the entrancepupil of the eye are sampled (see below).
Most modern assessments of the integrated SCE-1are based upon point-by-point measurements of SCE-1determined experimentally at a number of discretepoints across the entrance pupil of the eye in a numberof meridians (commonly tested in two meridians, i.e.horizontal and vertical). These are then fitted by aparabolic function (proposed in 1937 both by Stiles(using a log base 10 relationship) [14,15] and Crawford(employing a loge or ln base e equation) [16] and thatfunction is then integrated around the entrance pupil(other functions have been proposed, for example aGaussian function by (Safir and Hyams [17], Burnset al. [18]), as well as the relationship used in figures inthis paper taken from Enoch [19,20]. A review ofvarious analytical expressions used to fit SCE-1 dataappears in Applegate and Lakshminarayanan [21].
In his dissertation, Lakshminarayanan recordedSCE-1 functions in a unique patient. This was a younglady born aniridic (without an iris), and (importantly)she had developed only marginal nystagmus (i.e. ca.¼ mm amplitude horizontal nystagmus – in others,it is almost always of greater amplitude!). She hadquite normal visual acuity. In this eye, not only wasthe SCE-1 recorded, but, in her case, it was possibleto assess better the associated side-lobes of SCE-1[22–24]. Assuming her data correspond to characteris-tic population (central lobe) SCE-1 patterns in normalobservers, then none of the above cited equationsadequately conforms to the SCE-1 coupled with theside lobes recorded in this unique patient/case.1
2.2. Confounds
Fundamentally, when an observer views a display or ascene in an eye with a relatively large natural-eye-pupil,
Journal of Modern Optics 2241
Dow
nloa
ded
by [
Uni
vers
ity o
f W
ater
loo]
at 1
1:27
15
Dec
embe
r 20
14

or with a dilated-iris resulting in an enlarged pupil (forpurposes considered here, let us say this occurs whenthe entrance pupil diameter is greater than 3mm), onemust consider both the SCE-1 and additional blureffects present in the peripheral portions of the corneaand the eye lens. These two factors affect perceivedbrightness of a stimulus!
For simplicity, assume we are testing at photopiclevels, the refraction of the individual has beenappropriately corrected for both spherical and astig-matic errors (first- and second-order aberrations), andthe observer is properly accommodated (or correctedvisually) for the object viewed. When point to pointassessments for SCE-1 in the entrance pupil of the eyeare properly determined and analyzed, the resultantuncertainty occurring is largely assignable to theremaining/residual blur of the retinal image (seebelow). This uncertainty is associated with blurinduced by peripheral corneal and eye lens aberrations.In discussions of related topics, the senior author hasreferred to this blur factor as a dirty variable; that is,this is an uncontrolled or poorly controlled factor bothin vision research and in clinical practice. Here, we donot consider a variety of anomalous optical conditionsencountered in clinical settings (e.g. keratoconus,cataracts, or aphakia, etc), or decentered and/ormisshapen irises/pupils, or intra-ocular lenses centeredor decentered, refractive surgery and its complications,movements/decentration(s) of contact lenses, binocularanomalies, etc.
Both the magnitude of blur or image degradationencountered, and the nature of a blurred image varywith accommodation of the eye, and, of course, withmismatches between the retinal plane and the plane offocus of the retinal image formed within the eye. Onceagain, note that the center of the entrance pupil of theeye varies naturally with pupillary dilation, and isvirtually always decentered to some extent relative tothe optical axis of the eye. Further, the optical axisof the cornea as best determined is not the same as thatof the eye lens (e.g. [28–30]). Simply stated, the opticalsystem of the eye is not a perfectly centric system.We also know that dilation does not affect the SCE-1function, per se (e.g. [31]). For radiometric and/orphotometric purposes, we seek the very best resultpossible depending on the level of accuracy required forthe task.
2.3. A bit of history
When Walter ‘Stanley’ Stiles and Brian HewsonCrawford first reported the SCE-1 effect in 1933 [13],their results were based upon data obtained from theirown eyes. And it is apparent that, by chance, their eyes
manifested little blur of the retinal image, and hence,the complications one often encounters during inte-gration of SCE-1 in the entrance pupil of the eye werelargely not encountered in their data [13]. In suchrelatively rare individuals, the point-by-point estimatesobtained in SCE-1 studies predict well the results ofintegrating such data across the entrance pupil of theeye. As another example of such an individual, see datapresented below for experimental subject B.W. [19,20].
Thus, a meaningful degradation of the retinalimage, caused by peripheral corneal and lenticularaberrations of the eye resulting in image blur, can alterthe effective integrated perceived luminance of thevisual stimulus (e.g. [18–20,32–36]). The results foundneed not be the same between eyes or individuals, noras predictable as SCE-1.
Collectively, these points have been demonstratedin a number of studies, particularly in those of Enochand co-workers [18,19,32,33] and Drum [34,35].
2.4. Today, a solution of the problem is possible byusing (in addition) adaptive optics (AO)techniques
What is needed is a joint test of the Stiles–Crawfordfunction using a suitable SCE-1 apparatus (e.g. [38])and utilization of one of a number of modern AdaptiveOptics (AO) devices capable of determining andcorrecting the incident wavefront in order to deliver acorrected or a nearly-corrected image at the retinal testlocus sampled. By such an approach, we have theability to determine more accurately the magnitude ofthe visual stimulus for the designated entrance pupilsize. This is achieved by correcting blur (and higherorder aberrations), adjusting or correcting for theSCE-1, and properly integrating the resultant data.Earlier, except for the use of small entrance pupildiameters, or by employing small imaged apertures (inexperiments) such corrections were not always possi-ble. Note, devices utilizing adaptive optics are movingtowards incorporation of a means of correction forchromatic aberrations in their designs or overallexperimental techniques.
2.5. If a non-monochromatic stimulus to vision isemployed
For a more complete treatment of stimuli which are notmonochromatic, one might use an achromaticapproach/technique proposed by Powell [39] or otherspecial lens(es), such as the one designed and used bythe late Gunter Wyszecki to correct the chromaticaberrations of the human eye (e.g. [5]). Using theWyszecki lens, Enoch made such adjustments in some
2242 J.M. Enoch and V. Lakshminarayanan
Dow
nloa
ded
by [
Uni
vers
ity o
f W
ater
loo]
at 1
1:27
15
Dec
embe
r 20
14

of his earlier research, and found this approach quiteuseful. Please note, the Wyszecki lens must be alignedcarefully with the optic axis.
2.6. A reasonable estimate is possible without fullapplication of adaptive optics
By correcting refraction and spherical aberration inannual zones within the eye pupil, and by usingmonochromatic stimuli, Enoch was, in 1956, able toapproximate a more complete correction of blur in theeyes of his subjects (see below) [19,20].
A rather similar research project to that of Enochwas conducted by Drum just a few years later [34,35].
These added issues relate to image formation in theretinal plane, and the assumption is made (oftenimplied, but rarely stated) that energy is transferredfrom a single plane into the rod and cone photo-receptor waveguides. One should realize that the livingcell is a highly complex entity (e.g. [43]). Cell mor-phology and dimensions (particularly cones) often altersignificantly across small/modest distances on theretina. Clearly, diffraction and interference effects, aswell as rapid changes occurring in the spatial retinalimage itself, are occurring across small distances aboutthe entrance to the photoreceptor waveguides. Forexample, it is useful to consider image alterationsoccurring over small distances about a plane of focus(both longitudinally and laterally) of the retinal image.As but one example, consider the contents of a paperby Bachinski and Bekkefi [40], and data recorded byEnoch and Fry [41] in greatly enlarged and simplifiedrod and cone receptor models assessed in the micro-wave spectrum. Without addressing such issuesfurther, here we suggest that a somewhat betterestimate of the retinal stimulus to vision per se isachievable by incorporating the integrated SCE-1function in a blur-corrected or blur-minimized retinalimage. We argue that this provides a better assessmentof the visual stimulus than that provided in whathas become a now ‘classical’ approach defined by thelate Leonard Troland many years ago, and which isstill used for assessing retinal illuminance [2,3], etc.So saying, there is more that needs considerationrelative to this topic in future (see below).
3. Sample point-by-point estimates of SCE-1 and
integrated SCE-1 data
3.1. Sample data from Stiles and Crawford (1933)
In this section, data are presented that demonstratereasonably the magnitude and nature of the errorsinduced in calibration and measurement without cor-rection of the defined errors encountered. While these
are not extreme errors, per se, these are real effects,they are readily correctable, and should be consideredin visual studies.
Data here are taken from the dissertation of Enoch[19,20] and the function utilized for integrations of‘relative directional sensitivity’ here indicated as ‘�’(plotted as a log10 scale) are defined as,
� ¼ 0:25ð1þ cos 9:5�Þ2 ð1Þ
� equals 1.0 at the peak of the SCE-1 curve; � is theangle of incidence of the ray of light at the retinalplane. A 1mm beam displacement in the entrance pupilof the eye alters the angle of incidence of the incidentray of light by 2.5� of oblique incidence at the retinalplane (based on computations using the constants ofthe Gullstrand schematic eye) [23].
This particular equation provides a bit better fit ofSCE-1 data [13–16] than the Stiles’, 1937 (log base 10)relationship [14] or Crawford’s 1937 (ln base e)Equation [16] for a parabola. It is used here to simplifytransfer of the figures employed below. Because theimprovements made when fitting SCE-1 data using thisrelationship were modest, the authors of this chapterhave not used this format for some years, and, rather,have used the more broadly employed Stiles 1937formulation14 in its stead.
log10 � ¼ ��r2: ð2Þ
In this equation, � is the measured relative visualsensitivity of the stimulus to vision (in trolands, log10scale); � is a constant defining the curvature of thisparabolic function; and r, in mm, is the distance of thepoint being sampled from the peak of the measuredSCE-1 function in the plane of the entrance pupil ofthe eye.
SCE-1 data shown in Figure 1 were takenfrom Stiles and Crawford [13] and were fitted byEquation (1) [19,20].
In their initial study, Stiles and Crawford, 1933,[13] were seeking to measure precisely the area of theeye pupil (as noted, their original instrument had beendesigned as a pupillometer). At the outset, theyhypothesized that energy passing through each partof the eye pupil contributed equally and proportion-ately to the retinal image and visual sensitivity. Theydiscovered the device gave data which were notconsistent with their a priori assumption, and theyproperly interpreted their results to indicate that therewas evidence for the presence of directional sensitivityof the retina, now known as SCE-1.
Their instrument sought to assess the integratedvisual response resulting from irradiating the entireentrance pupil, and for different size entrance pupils ofthe eye. Since they had little image blur in their own
Journal of Modern Optics 2243
Dow
nloa
ded
by [
Uni
vers
ity o
f W
ater
loo]
at 1
1:27
15
Dec
embe
r 20
14

eyes, the integrated result gave little evidence thatwhen the full pupil was measured, the resultantadditivity (of the contributions of different parts ofthe pupil) might also be different in eyes where therewere meaningful peripheral corneal and eye lensaberrations resulting in additional degradation (blur)of the retinal image. That is, they did not encounterother than near perfect additivity from integratingpoint by point SCE-1 determinations and comparingthem to full eye-pupil assessments. Thus, we need todifferentiate between (1) simple addition of thecontributions of the entire eye pupil area versus(2) that sum adjusted for the Stiles–Crawford effectof the first kind, and (3) the result obtained in eyeswhere there are meaningful aberrations in the periph-ery of the ocular lens system due to aberrations of theoptical elements of the eye.
3.2. Sample data from Enoch
Data were obtained from three well-trained graduatestudent subjects [19,20]. Subject B.W. had an eyewith fine optical properties. Both subjects R.V. and
A.M. had greater peripheral ocular aberrations intheir measured eyes than B.W., with subject A.M.exhibiting somewhat greater image degradation thanobserver R.V. Except for overall refractive correc-
tion, the single aberration measured independently aspart of this dissertation (1955/1956) was sphericalaberration [19,20]. The latter was achieved by usinga technique similar to one employed by Ivanoff [43].That is, the pupil was divided into discrete non-
overlapping annular zones, and the required refrac-tive correction was altered as needed within eachannular zone.
The SCE-1 was measured separately for both (1a)white light (obtained by using a ribbon filament lamprun at 16 amps, with the beam passing through a heatfilter), and paired neutral density filters; or (1b) by
appropriately adding a well-blocked interference filterhaving a near monochromatic green light band of light(peak l¼ 552 mm) into the same optical system.
A second variable was introduced in this experi-ment. There was the traverse of the test beam acrossthe entrance pupil of the eye employing (2a) an
instrument design where the ribbon-lamp-filamentwas imaged in the plane of the entrance pupil of theeye (a classic Maxwellian view instrument design) and,alternatively, (2b) the light source was imaged directlyupon the retina of the observer having passed through
the same number of surfaces and by using the samedimension beam image in the entrance pupil of the eye,and the same viewed stimulus target. This wasregarded as a non-Maxwellian view illuminationsystem. Each of these cases utilized a projected
aperture that subtended slightly less than 1mm diam-eter image in the entrance pupil of the eye. Differencesin measured SCE-1 results encountered for thesedifferent test conditions were very modest for allthree subjects. Direct comparisons were made using
both (3a) bipartite fields, and, separately (3b) flickerphotometry.
Figure 2 shows sample SCE-1 test data for subjectR.V. [19,20]. As is obvious, there were only smalldifferences between measured SCE-1 functions for thestated conditions. These data are presented as an
example of the many data sets acquired on all three ofJME’s subjects. Here, the peaks of his SCE-1 maximawere set at r¼ 0.0mm on the abscissa (Figure 2).
In Figures 3 and 4 the near monochromatic greenstimuli more closely matched the integrated SCE-1curve than did white light, and in the case of B.W. bothdata sets were in close approximation to the predicted
Figure 1. The 1933 SCE-1 data of Walter Stanley Stiles andBrian Hewson Crawford were adjusted such that the maximaof measured relative visual sensitivity functions were locatedat r¼ 0.0mm in their entrance pupils, and were assigned arelative sensitivity value of 1.0 (at/as the peak of these datafunctions). Radial distance settings, r, of the test beam in theentrance pupils of their eyes from the peaks of SCE-1 aredisplayed on the abscissa. The ordinate displays �(log10 scale). Data used in this illustration originated in thepaper by Stiles and Crawford, 1933 [13]. This illustrationwas copied from figure 1, [19,20]. Equation (1) was fitted tothese data. Reproduced with permission. Copyright (1958)by the Optical Society of America.
2244 J.M. Enoch and V. Lakshminarayanan
Dow
nloa
ded
by [
Uni
vers
ity o
f W
ater
loo]
at 1
1:27
15
Dec
embe
r 20
14

result obtained by integrating the SCE-1 data about
the entrance pupil of the observer’s eye [19,20].When integrating data obtained using white light
data (Figures 3 and 4), the added chromatic aberrations
apparently made little difference to B.W. (or he retainedhis focus about mid-spectrum?), while the ocular
chromatic aberrations noticeably affected the inte-
grated performance of subjects, R.V. and A.M. Theseare meaningful departures from predicted values.
In Figure 5, the additivity effect obtained when
placing an added �1.00 Diopter Spherical (DS) lens
(before the test eye of each subject) is shown for alimited number of different test aperture sizes projected
into the entrance pupil of the eye, and this result is
contrasted with the addition of a þ2.00 DS lens placedin front of the same eye (with the �1.00 DS lens
removed). The former lens (the �1.00 DS) makesthe test eye more hyperopic (‘far-sighted’), while the
þ2.00DS makes the same eye more myopic(‘near-sighted’). The test eye could at least partially
self-correct for the added �1.00 DS lens by accommo-dating upon the test target. That is, these were non-presbyopic test subjects, and their irises were dilatedusing a pharmaceutical agent that served (largely) tocause mydriasis (pupil dilation), i.e. this agent did notresult in marked strong cycloplegia (inhibition ofaccommodation). All tests were monocular. Here, we
asked, what effect did a modest change in sphericallens power have upon ‘additivity’ of SCE-1 in each ofthese subjects?
When a flicker photometric test method wasemployed [19,20], the blur of the retinal imageproved to have much less of an influence uponbrightness matches made by the subjects (note, theobservers had been instructed to compare the apparent
brightness of the central parts of the two flickeringfields). When this same technique was combined withuse of monochromatic, l¼ 552 mm, stimuli, thematches of all three subjects proved to be similar andclosely matched the integrated SCE-1 estimated curve.That is, all three subjects exhibited near perfect
additivity approximately matching the SCE-1
Figure 2. SCE-1 data for subject R.V. are presented as anexample of the many data sets acquired. His SCE-1 maximawere set at r¼ 0.0mm on the abscissa. Top: SCE-1 data areshown which were obtained for both white light andmonochromatic green light (552mm max.). Bottom: Bothdata sets were here were obtained using monochromaticlight. Two different optical conditions were employed, i.e. inone experiment, a Maxwellian beam traversed in the eyepupil, and in a second set of sessions, a non-Maxwellianbeam was used to traverse the entrance pupil of the eye.This illustration was taken from figure 14, Enoch, 1956,dissertation [19]; and figure 9 and Enoch, 1958, J. Opt. Soc.Am. A [20]. Reproduced with permission. Copyright (1958)Optical Society of America.
Figure 3. Figures 3 and 4 demonstrate the equivalent ofintegrated or ‘additivity’ diagrams for excitation enteringdefined entrance pupil areas. The straight line would predictperfect additivity of luminous stimuli entering the entrancepupil of the designated subject. The curved line incorporatesa correction for the integration of SCE-1 data about theentrance pupil of the eye (based upon use of Equation (2)).In figure 3 data for Subjects R.V. and A.M. are presented.
Journal of Modern Optics 2245
Dow
nloa
ded
by [
Uni
vers
ity o
f W
ater
loo]
at 1
1:27
15
Dec
embe
r 20
14
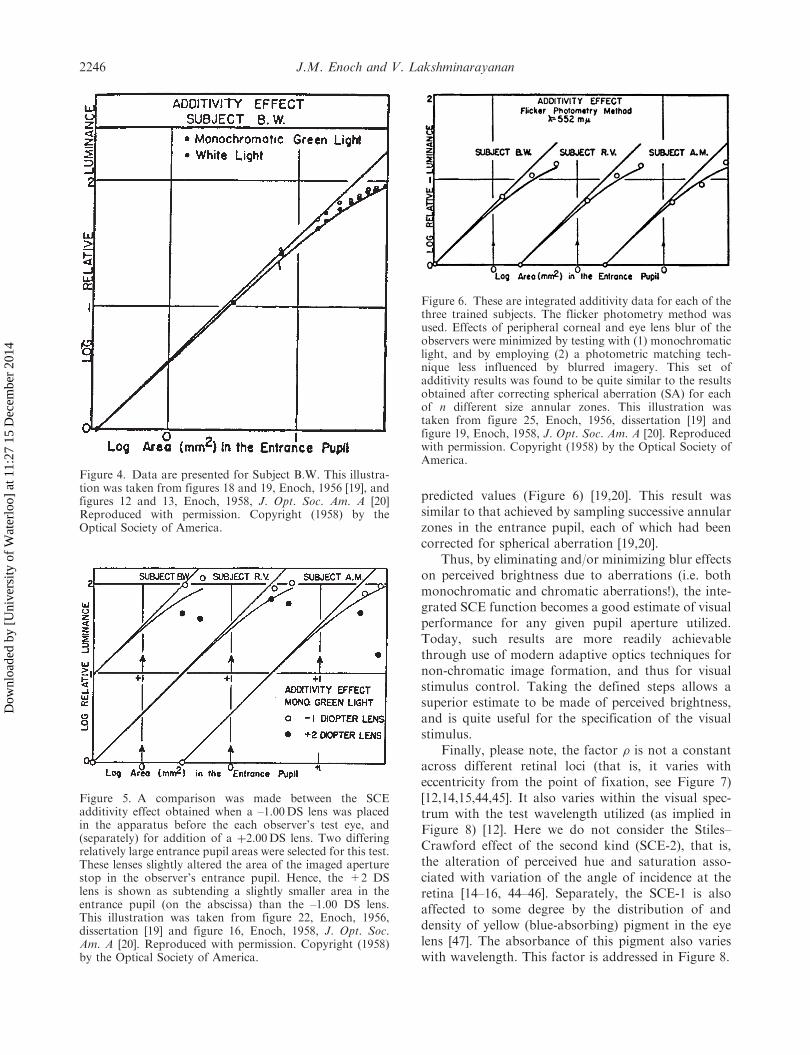
predicted values (Figure 6) [19,20]. This result wassimilar to that achieved by sampling successive annularzones in the entrance pupil, each of which had beencorrected for spherical aberration [19,20].
Thus, by eliminating and/or minimizing blur effectson perceived brightness due to aberrations (i.e. bothmonochromatic and chromatic aberrations!), the inte-grated SCE function becomes a good estimate of visualperformance for any given pupil aperture utilized.Today, such results are more readily achievablethrough use of modern adaptive optics techniques fornon-chromatic image formation, and thus for visualstimulus control. Taking the defined steps allows asuperior estimate to be made of perceived brightness,and is quite useful for the specification of the visualstimulus.
Finally, please note, the factor � is not a constantacross different retinal loci (that is, it varies witheccentricity from the point of fixation, see Figure 7)[12,14,15,44,45]. It also varies within the visual spec-trum with the test wavelength utilized (as implied inFigure 8) [12]. Here we do not consider the Stiles–Crawford effect of the second kind (SCE-2), that is,the alteration of perceived hue and saturation asso-ciated with variation of the angle of incidence at theretina [14–16, 44–46]. Separately, the SCE-1 is alsoaffected to some degree by the distribution of anddensity of yellow (blue-absorbing) pigment in the eyelens [47]. The absorbance of this pigment also varieswith wavelength. This factor is addressed in Figure 8.
Figure 4. Data are presented for Subject B.W. This illustra-tion was taken from figures 18 and 19, Enoch, 1956 [19], andfigures 12 and 13, Enoch, 1958, J. Opt. Soc. Am. A [20]Reproduced with permission. Copyright (1958) by theOptical Society of America.
Figure 5. A comparison was made between the SCEadditivity effect obtained when a –1.00DS lens was placedin the apparatus before the each observer’s test eye, and(separately) for addition of a þ2.00DS lens. Two differingrelatively large entrance pupil areas were selected for this test.These lenses slightly altered the area of the imaged aperturestop in the observer’s entrance pupil. Hence, the +2 DSlens is shown as subtending a slightly smaller area in theentrance pupil (on the abscissa) than the –1.00 DS lens.This illustration was taken from figure 22, Enoch, 1956,dissertation [19] and figure 16, Enoch, 1958, J. Opt. Soc.Am. A [20]. Reproduced with permission. Copyright (1958)by the Optical Society of America.
Figure 6. These are integrated additivity data for each of thethree trained subjects. The flicker photometry method wasused. Effects of peripheral corneal and eye lens blur of theobservers were minimized by testing with (1) monochromaticlight, and by employing (2) a photometric matching tech-nique less influenced by blurred imagery. This set ofadditivity results was found to be quite similar to the resultsobtained after correcting spherical aberration (SA) for eachof n different size annular zones. This illustration wastaken from figure 25, Enoch, 1956, dissertation [19] andfigure 19, Enoch, 1958, J. Opt. Soc. Am. A [20]. Reproducedwith permission. Copyright (1958) by the Optical Society ofAmerica.
2246 J.M. Enoch and V. Lakshminarayanan
Dow
nloa
ded
by [
Uni
vers
ity o
f W
ater
loo]
at 1
1:27
15
Dec
embe
r 20
14

As noted above, Bruce Drum addressed somesimilar issues from a somewhat different point ofview [34,35]. He also clearly demonstrated additivity ofthe SCE-1 to exist for all assessed tests and conditions.The simple fact is that SCE-1 and associated integratedresults are rather robust under quite a variety of testconditions.
4. Discussion
4.1. When do matters considered here warrantconsideration?
In all psychophysical studies, the demand for precisionis greater the more sensitive the determination, and themore complex the clinical problem encountered in thesubject or patient. The approach argued here isindicated whenever large or dilated pupils are used,particularly for tests of photopic vision! If a pupil isnot well centered, or is reasonably asymmetric, orrelatively non-responsive, or otherwise not normal, oneneeds to rule out any un-necessary variable. Similarly,if the SCE-1 is abnormal, or displaced from its naturalcentrum, then it is clearly advisable to pursue thematter further. Note, given retinal photoreceptorpacking properties, it is almost unheard of for rodsto be normally aligned if cones are found to bedisturbed in their orientations in a given retinal area,and visa versa.
Zwick and his co-workers (e.g. [48]) have studiedthe effects of laser exposures upon retinal survival,recovery, and/or lack thereof, mainly in snakes.In their experiments on animals, Zwick et al. used
Figure 7. This figure addresses the variation of � with eccentricity from the point of fixation (assume this locus corresponds tothe center of the fovea). This seemingly complex figure combines data from more than one paper on Stiles’ � factor(Equation (2)). Tests were performed at fixation, in the para-foveal area, and separately at a test locus located 35� from the pointof fixation. Horizontal and vertical in this figure refer to SCE-1 tests conducted in these two meridians within the entrance pupilsof human eyes. This figure is reproduced from figure 3.8 in Enoch and Tobey, 1980 (see [12], p. 99), and Enoch and Hope, 1973[44]. Reproduced with permission. Copyright (1980) and (1973) by Springer-Verlag and the Association for Research in Visionand Ophthalmology.
Figure 8. These data relate to values obtained from mea-sured human foveal SCE-1 functions (see [12], figure 3.13,p. 109) [15,47]. The upper curves present values of (�) logrelative sensitivity for different subjects measured ata number of different wavelengths. The upper data curvespresented were affected by the presence of yellow eye lenspigment(s), and the lower curves have been corrected forthese pigment effects. Please be aware that the density of theyellow lens pigments increases with age. This illustrationhas its origin in the data of Stiles, 1939 [15], with additionsobtained from the paper by Vos and Van Os, 1975 [47].These figures are reproduced with permission of the authorsand the publishers.
Journal of Modern Optics 2247
Dow
nloa
ded
by [
Uni
vers
ity o
f W
ater
loo]
at 1
1:27
15
Dec
embe
r 20
14

(1) sub-threshold laser exposures, (2) threshold burns,(3) above threshold burns, (4) and more severeexposures. These studies were backed up by recordedassessments made by individuals who have beenexposed to comparable laser burns. Such laser burnsresult in immediate and substantial disturbances inphotoreceptor alignments (often extending for somedistance about the burn site), and resultant early andlate sensitivity losses. Snake eyes have large photo-receptors visible directly through the animal’s naturalpupil in vivo, and they are available for study. Snakesare relatively non-reactive when exposed to highintensity laser light when sedated, and show relativelyrapid recovery if there remains a potential for recovery.A meaningful area of the retina is affected. They havecarefully documented recoveries and failures to recoverin their research.
One must remember that alignment of photorecep-tors with the center of the exit pupil of the eye ismaintained normally throughout life, except in caseswhere there has been some retinal disorder or disease[12,49,50], and in rare individuals or eyes where thiscontrol mechanism is apparently lacking ( see e.g. [12]).In a number of cases, the retina can recover if theinducing anomaly is corrected or self corrects (i.e. itremits) [51,52], but we have seen no recovery if themechanism itself is not present in an eye [12].So saying, residual scar tissue, local adhesions, orother impediments to recovery can alter the result.
As can be inferred from the above, and can be seenreadily in Figures 3–6, in the normal observer thesmooth, integrated SCE-1 function curve differs onlymodestly from the linear additivity curve until theentrance pupil diameter is above 3mm in diameter (seeTable 1).
Once again, looking at Figures 3 and 4, uncertaintyenters due to the presence of peripheral aberrationswithin the optical components of the eye. The effects are
greater for white light than monochromatic light.
Subject A.M. apparently manifests fewer aberrations
in his peripheral eye lens and cornea than observer V.R.;
and subject B.W. exhibits little effect due to such
aberrations. At the outset, it was pointed out that imageblur or degradation enters as a ‘dirty variable’. Without
correction of these degrading peripheral lens blur
factors, one introduces uncertainty. If one adds refrac-
tive error to the mix, the situation is made worse (seeFigure 5). If refractive and peripheral blur are corrected
or at least meaningfully minimized, then a SCE correc-
tion applied to such data predicts quite well the visual
stimulus presented to the observer (see Figure 6).Among other very interesting results, Makous and
his co-workers [53–59] and Applegate and
Lakshminarayanan [21] correctly point out, as can be
inferred from comments made above, for small pupil
apertures, certainly for 3mm diameter entrance pupils
(1.5mm radial distances) and perhaps a bit more, thetwo functions (the linear integrated result, and the
predicted integrated result obtained by incorporating
the SCE-1 function) differ only slightly if refraction is
well corrected, and the system is reasonably centeredupon the subject’s entrance pupil. Makous et al. have
also addressed, and thoughtfully considered, issues
regarding effects of coherence and non-coherence of
imagery, loci of adaptation, quantum activation rates
in photoreceptors, effects of orientation obliquity onexcitation processes, etc.
5. Teleological and developmental factors
In a sense, it is also useful to consider these visual
functions from a teleological point of view. It seemsmost apparent that the ultimate purpose(s) of the
SCE-1 and associated waveguide properties of retinal
photoreceptors is(are) to enhance the detection of
critical visual signal, both photopic and scotopic, andto help suppress intraocular stray light ‘noise’ present
within the ‘integrating-sphere- like’ eye (e.g. [12]). The
feedback mechanisms controlling receptor alignment
(under normal circumstances) and their directional
properties together serve to favor the detection ofdirected visual signal content passing through the
center of the exit pupil in the eyes of vertebrates.
(Note, the exit pupil is conjugate with the entrance
pupil of the eye.) In some invertebrates, the eyes servesimilarly, e.g. octopus, etc, or in a different (but
effectively comparable) fashion in the vast number of
other invertebrate species. These optical and anatom-
ical features serve to enhance greatly visual processes,
and, as such, play critical roles in vision and the survivalof species. This argument emphasizes the great
Table 1. Area in the entrance pupil of the human eye basedon the Gullstrand schematic eye.
Entrance Pupil Area
Solve for Radius andDiameter of Entrance Pupil
(Abscissa)* (mm2) Radius (mm) Diameter (mm)
10 1.78 3.5720 2.52 5.0530 3.09 6.1840 3.57 7.1450 3.99 7.9860 4.37 8.7470 4.72 9.44 (this diameter
is rarely achieved)
*The Abscissas in Figures 3–6 are plotted as Log10 EntrancePupil Area.
2248 J.M. Enoch and V. Lakshminarayanan
Dow
nloa
ded
by [
Uni
vers
ity o
f W
ater
loo]
at 1
1:27
15
Dec
embe
r 20
14
importance exerted by these mechanisms in evolution-ary processes.
Related to such matters, the attention of the readeris called to a remarkable recent paper by Detlev Arendtet al., in Science in 2004 [60]. These authors located aprimitive and ancient form of invertebrate aquaticworm, which had the usual paired invertebrate eyestructures as well as vertebrate-type, cylindrically-shaped photoreceptors containing cilia located in itsbrain in that area which controlled circadian rhythms.And the latter cells were also shown to contain a cone-type of opsin [60].
6. Conclusions
There is a need optimally to correct and control thequality of the images formed in the eye, and/or the eyeplus associated optical apparatuses. This is needed inorder to define better the observer’s stimulus to vision,and to understand, in a superior way, the observer’svisual responses. This will include (1) a satisfactorycorrection of refraction, i.e. lower order aberrations; (2)correction of higher order monochromatic aberrations,and also (3) correction of chromatic aberrations. Thetotality can be aided by utilization of modern adaptiveoptics (AO) techniques. In radiometric and photometricstudies, there is also need to include a factor thatcorrects for the Stiles–Crawford effect of the first kind(SCE-1), and that need increases with pupil diameter(above ca. 3.0mm), particularly for photopic vision.
Note, because we do not wholly understand thenature of the stimulus to accommodation, we shouldbe careful not to be too overly aggressive in seeking toeliminate all image blur. And, as pointed out in theintroductory remarks, it is time to reconsider thedefinition and units used to describe/define the troland.
In this paper, we only have considered monocularvisual corrections. For effective binocular results, it isclear that issues associated with maintaining anobserver’s comfort while performing extended binoc-ular visual tasks need to be carefully addressed in bothdesign and assessment of vision roles/function, includ-ing careful attention being paid to equating the sizes ofthe two retinal images (i.e. countering the effects ofaniseikonia), and fusion of those images. That is, indesign, we always need to address those additionalfactors affecting ocular motility and binocular fusion.Added material relevant to this discussion can befound in [61–69].
Note
1. (1) In most experiments measuring the SCE-1 performedin recent years, very small-size projections of the aperturestop of the test apparatus have been imaged in the plane
of the observer’s entrance pupil (i.e. they are usually lessthan 1mm in diameter). (2) This discussion is limitedto monocular testing. (3) Measured SCE-1 functionsobtained vary with wavelength (please see Figure 8).(4) We do not consider here recent discussions ofreflected, re-emitted, and projected light gathered fromthe retinal photoreceptor waveguides which can beassessed by reverse path irradiation/illumination).This relationship is commonly termed ‘the opticalSCE-1’ (e.g. [25–27]).
References
[1] Howard, J. Optics and Photonic News 2008, 19, 20–21.
[2] Troland, L.T. Psych. Review 1915, 22, 167–176.[3] Troland, L.T. J. Exp. Psych. 1917, 2, 1–34.[4] Cheung, J.Y.; Chunnilall, C.J.; Woolliams, E.R.;
Fox, N.P.; Mountford, J.R.; Wang, J.; Thomas, P.J.
J. Mod. Opt. 2007, 54, 373–396.
[5] Wyszecki, G.; Stiles, W.S. Color Science: Concepts, and
Methods, Quantitative Data and Formulae, 2nd ed.;
Wiley: New York, 1982.[6] Baron, W.S.; Enoch, J.M. Am. J. Optom. Physiol. Opt.
1982, 59, 338–341.
[7] Enoch, J.M. In Modern Ophthalmology, 1st ed.; Sorsby,
A., Ed.; Butterworths: Washington, DC, 1963; Vol. 1,
pp 202–289, Section I, Chapter 3.[8] Enoch, J.M.; Bedell, H.E. Am. J. Optom. Physiol. Opt.
1979, 56, 341–344.[9] Handbook of the Illumination Engineering Society (any
issue), Appendix, Conversion Factors, p. A-1.
[10] Atchison, D.; Scott, D.H.; Smith, G. Ophthalmol.
Physiol. Optics 2000, 20, 501–503.[11] Martin, L.C. Technical Optics, 1st ed.; Pitman: London,
1954; Vol. 2.[12] Enoch, J.M.; Tobey, Jr. F.L., Eds.; Vertebrate
Photoreceptor Optics; Springer-Verlag: Berlin,
Heidelberg, New York, 1981; Vol. 23.[13] Stiles, W.S.; Crawford, B.H. Proc. Roy. London, Ser. B
1933, 112, 428–450,.[14] Stiles, W.S. Proc. Roy. Soc. London, Ser. B 1937,
123 (B830), 90–118.
[15] Crawford, B.H. Proc. Roy. Soc. London, Ser. B 1937,
124 (B834), 81–96.[16] Stiles, W.S. Proc. Roy. Soc. London, Ser. B 1939, B127,
64–105.[17] Safir, A.; Hyams, L.; Philpott, J. Vision Res. 1971, 11,
819–831.[18] Marcos, S.; Burns, S. J. Opt. Soc. Am. A 1999, 16,
995–1004.[19] Enoch, J.M. Summated Response of the Retina to Light
Entering Different Parts of the Pupil. Dissertation, Ohio
State University, 1956.
[20] Enoch, J.M. J. Opt. Soc. Am. A 1958, 48, 392–405.[21] Applegate, R.A.; Lakshminarayanan, V. J. Opt. Soc.
Am. A 1993, 10, 1611–1623.[22] Lakshminarayanan, V. The Stiles–Crawford Effect in
Anirida. Ph.D. Dissertation, University of California,
Berkeley, 1985.
Journal of Modern Optics 2249
Dow
nloa
ded
by [
Uni
vers
ity o
f W
ater
loo]
at 1
1:27
15
Dec
embe
r 20
14

[23] Enoch, J.M.; Lakshminarayanan, V.; Yamade, S.
Perception 1986, 15, 777–784.[24] Lakshminarayanan, V.; Enoch, J.M.; Yamade, S.
In Advances in Diagnostic Visual Optics; Fiorentini, A.,
Guyton, D.L., Siegel, I.M., Eds.; Springer-Verlag:
Heidelberg, 1987; pp 28–32.[25] He, C.; Marcos, S.; Burns, S.A. J.Opt. Soc. Am. A 1999,
16, 2363–2369.[26] Kanis, M.J. Foveal Reflection Analysis in a Clinical
Setting. Dissertation, Utrecht University, the
Netherlands.[27] Gao,W.; Cense, B.; Zhang, Y.; Jonnal, R.S.; Miller, D.T.
Opt. Express 2008, 16, 6486–6501.[28] Helmholtz, H.v Helmholtz’s Treatise on Physiological
Optics, 3rd German ed., Vol. 1, English Translation by
J.P.C. Southall; Optical Society of America: Rochester,
NY, 1924.[29] Cui, C.; Lakshminarayanan, V. J. Opt. Soc. Am. A 1998,
15, 2488–2496.[30] Cui, C.; Lakshminarayanan, V. J. Mod. Opt. 2003, 50,
1743–1749.[31] Ronchi, L. Optica Acta 1955, 2, 47–49.
[32] Laties, A.M.; Enoch, J.M. Invest. Ophthalmol. 1971, 10,
69–77.
[33] Enoch, J.M.; Laties, A.M. Invest. Ophthalmol. 1971, 10,
959–970.
[34] Drum, B. Additivity of the Stiles–Crawford Effect for a
Fraunhofer Image. Dissertation, Ohio State University,
1973.[35] Drum, B. Vision Res. 1975, 15, 291–298.
[36] Bocchino, G. Ottica 1936, 1, 136–142.[37] Toraldo di Francia, G.; Sbrolli, W. G. Ronchi. 1947, 2,
100–104.[38] Enoch, J.M.; Hope, G.M. Invest. Ophthalmol. 1972, 11,
765–782, 1972.[39] Powell, I. Appl. Opt. 1981, 20, 4152–4155.[40] Bachynski, M.P.; Bekefi, G. J. Opt. Soc. Am. 1957, 47,
428–438.[41] Enoch, J.M.; Fry, G.A. J. Opt. Soc. Am. 1958, 48,
899–911.[42] Enoch, J.M.; Bedell, H.E.; Campos, E.C. Vision Res.
1978, 18, 123–124.[43] Ivanoff, A. Editions de la Revue d’Optique 1953.
[44] Enoch, J.M.; Hope, G.M. Invest. Ophthalmol. 1973, 12,
497–503.
[45] Enoch, J.M.; Stiles, W.S. Optica Acta 1961, 8, 329–358.[46] Walraven, P.L.; Bouman, M.A. J. Opt. Soc. Am. 1960,
60, 780–784.[47] Vos, J.J.; Os, F.L. v. Vision Res. 1975, 15, 749–751.
[48] Zwick, H.; Edsall, P.; Stuck, B.E.; Wood, E.; Elliott, E.;Cheramie, R.; Hacker, H. Vision Res. 2008, 48, 486–493.
[49] Rynders, M.; Grosvenor, T.; Enoch, J.M Optom. Vis.Sci. 1995, 72, 177–185.
[50] Enoch, J.M.; Werner, J.S.; Haegerstrom-Portnoy, G.;Lakshminarayanan, V.; Rynders, M. (Invited)
Journals of Gerontology: Biological Sciences 1999, 55A,B336–B351.
[51] Campos, E.C.; Bedell, H.E.; Enoch, J.M.; Fitzgerald,
C.R. Doc. Ophthalmol. 1978, 45, 381–395.[52] Enoch, J.M.; Fitzgerald, C.R.; Campos, E.C.
Quantitative Layer-by-Layer Perimetry: An Extended
Analysis; Grune and Stratton: New York, 1981.[53] Makous, W.; Schnapf, J. Program A.R.V.O. 1973,
88, 54.[54] McMahan, M.J.; MacLeod, D.I.A. J. Opt. Soc. Am. A
2001, 18, 2692–2703.[55] Schnapf, J.; Makous, W. Program A.R.V.O 1974, 26.[56] Chen, B.; Makous, W. J. Physiol. (Lond.) 1989, 414,
89–108.[57] McMahan, M.J.; Macleod, D.I.A. J. Opt. Soc. Am. A
2001, 18, 2692–2703.
[58] Makous, W. J. Opt. Soc. Am. A 1997, 14, 2323–2345,2332.
[59] Makous, W. In The Visual Neurosciences; Werner, J.,
Chapula, L.M., Eds.; MIT Press: Boston, 2004;pp 838–850 (Note: this paper corrects an erroneoustable in the prior reference).
[60] Arendt, D.; Tessmar-Raible, K.; Snyman, H.;
Dorresteijn, A.; Wittbrodt, J. Science 2004, 306, 869–871. See the interesting discussion of this paper byPennisi, E.; pp 796–797.
[61] Lundstrom, L.; Unsbo, P. J. Opt. Soc. Am. A 2007, 24,569–577.
[62] Applegate, R.A.; Donnelly, W.J. III; Marsack, J.D.;
Koenig, D.E.; Pesudovs, K. J. Opt. Soc. Am. A 2007, 23,578–587.
[63] Zhang, X.; Ye, M.; Bradley, A.; Thibos, L. J. Opt. Soc.
Am. A 1999, 16, 812–820.[64] Enoch, J.M. InVisual Science; Pierce, J., Levene, J., Eds.;
Indiana University Press: Bloomington, Indiana, 1971;pp 40–57.
[65] Metcalf, H. J. Opt. Soc. Am. A 1965, 55, 72–74.[66] Carroll, J.P. J. Opt. Soc. Am. 1980, 70, 1155–1156.[67] Palmer, D.A. J. Opt. Soc. Am. A 1985, 2, 1371–1374.
[68] Sloan, L.L. J. Opt. Soc. Am. 1940, 30, 271; Abstract.Arch. Ophthalmol. 1940, 24 (New Series, N.S.), 258–275.
[69] Fernandez, E.J.; Unterhuber, A.; Povazay, B.;
Hermann, B.; Artal, P.; Drexler, W. Opt. Express2006, 14, 6213–6225.
2250 J.M. Enoch and V. Lakshminarayanan
Dow
nloa
ded
by [
Uni
vers
ity o
f W
ater
loo]
at 1
1:27
15
Dec
embe
r 20
14
![[ Team LiB ] Crawford and Kaplan's J2EE Design Patterns ...](https://static.fdokumen.com/doc/165x107/63168edcf68b807f88034d1f/-team-lib-crawford-and-kaplans-j2ee-design-patterns-.jpg)