OOP E RAT OR C IEN C E ER IES - Amazon AWS
28
What can volunteer angler tagging data tell us about the status of the Giant Trevally (ulua aukea) Caranx ignobilis fishery in Hawaii: revisiting data collected during Hawaii’s Ulua and Papio Tagging Project 2000-2016 Timothy B. Grabowski 1 Erik C. Franklin 2 1 U.S. Geological Survey, Hawaii Cooperative Fishery Research Unit, University of Hawaii at Hilo, Hilo, Hawaii 2 Hawaii Institute of Marine Biology, School of Ocean and Earth Science and Technology, University of Hawaii at Manoa, Kaneohe, Hawaii Cooperator Science Series # 126-2017 COOPERATOR SCIENCE SERIES
-
Upload
khangminh22 -
Category
Documents
-
view
5 -
download
0
Transcript of OOP E RAT OR C IEN C E ER IES - Amazon AWS
What can volunteer angler tagging data tell us about the
status of the Giant Trevally (ulua aukea) Caranx ignobilis
fishery in Hawaii: revisiting data collected during
Hawaii’s Ulua and Papio Tagging Project 2000-2016
Timothy B. Grabowski1 Erik C. Franklin2
1U.S. Geological Survey, Hawaii Cooperative Fishery Research Unit, University of Hawaii at Hilo, Hilo, Hawaii
2Hawaii Institute of Marine Biology, School of Ocean and Earth
Science and Technology, University of Hawaii at Manoa, Kaneohe, Hawaii
Cooperator Science Series # 126-2017
CO
OPE
RA
TOR
SC
IEN
CE
SER
IES
ii
About the Cooperator Science Series: The Cooperator Science Series was initiated in 2013. Its purpose is to facilitate the archiving and retrieval of research project reports resulting primarily from investigations supported by the U.S. Fish and Wildlife Service (FWS), particularly the Wildlife and Sport Fish Restoration Program. The online format was selected to provide immediate access to science reports for FWS, state and tribal management agencies, the conservation community, and the public at large. All reports in this series have been subjected to a peer review process consistent with the agencies and entities conducting the research. For U.S. Geological Survey authors, the peer review process (http://www.usgs.gov/usgs-manual/500/502-3.html) also includes review by a bureau approving official prior to dissemination. Authors and/or agencies/institutions providing these reports are solely responsible for their content. The FWS does not provide editorial or technical review of these reports. Comments and other correspondence on reports in this series should be directed to the report authors or agencies/institutions. In most cases, reports published in this series are preliminary to publication, in the current or revised format, in peer reviewed scientific literature. Results and interpretation of data contained within reports may be revised following further peer review or availability of additional data and/or analyses prior to publication in the scientific literature. The Cooperator Science Series is supported and maintained by the FWS, National Conservation Training Center at Shepherdstown, WV. The series is sequentially numbered with the publication year appended for reference and started with Report No. 101-2013. Various other numbering systems have been used by the FWS for similar, but now discontinued report series. Starting with No. 101 for the current series is intended to avoid any confusion with earlier report numbers. The use of contracted research agencies and institutions, trade, product, industry or firm names or products or software or models, whether commercially available or not, is for informative purposes only and does not constitute an endorsement by the U.S. Government. Contractual References: Financial support for the collection of the tagging data used in this study was provided by the State of Hawaii and the U.S. Fish and Wildlife Service through the Financial Aid in Sportfish Restoration Program. Previously published documents that partially fulfilled any portion of this contract are referenced within, when applicable. (USGS IPDS #: IP-087902).
Recommended citation: Grabowski, T. B. and E. C. Franklin. 2017. What can volunteer angler tagging data tell us about the status of the Giant Trevally (ulua aukea) Caranx ignobilis fishery in Hawaii: revisiting data collected during Hawaii’s Ulua and Papio Tagging Project 2000-2016. U.S. Department of Interior, Fish and Wildlife Service, Cooperator Science Series FWS/CSS-126-2017, Washington, D.C. For additional copies or information, contact: Dr. Timothy Grabowski U.S. Geological Survey Hawaii Cooperative Fishery Research Unit University of Hawaii at Hilo Hilo, Hawaii 96720 Phone: (808) 932-7575 E-mail: [email protected]
1
What can volunteer angler tagging data tell us about the status of the Giant Trevally (ulua aukea) Caranx ignobilis fishery in Hawaii: revisiting data collected during Hawaii’s Ulua
and Papio Tagging Project 2000-2016
A report to Hawaii Department of Land and Natural Resources-Division of Aquatic Resources
TIMOTHY B. GRABOWSKI1 AND ERIK C. FRANKLIN2
1U.S. Geological Survey, Hawaii Cooperative Fishery Research Unit, University of Hawaii at Hilo, Hilo, Hawaii 96720 USA; email: [email protected] | [email protected]
2Hawaii Institute of Marine Biology, School of Ocean and Earth Science and Technology, University of Hawaii at Manoa, Kaneohe, Hawaii 96744 USA
September 2017

2
Acknowledgements
We thank the Hawaii Department of Land and Natural Resources Division of Aquatic Resources for the opportunity to revisit this dataset. C. Severance and A. Tagawa provided comments and suggestions that greatly improved an earlier draft of this manuscript. Financial support for the collection of the tagging data used in this study was provided by the State of Hawaii and the U.S. Fish and Wildlife Service through the Financial Aid in Sportfish Restoration Program. The Hawaii Cooperative Fishery Research Unit is jointly sponsored by the University of Hawaii System, the Hawaii Department of Land and Natural Resources, U.S. Geological Survey, and U.S. Fish and Wildlife Service. Any use of trade, firm, or product names is for descriptive purposes and does not imply endorsement by the U.S. Government.
3
Abstract
Giant Trevally (ulua aukea) Caranx ignobilis is one of the most highly prized and frequently targeted nearshore species. However, there is very little information on its current status in Hawaiian waters. This study uses mark-recapture data collected as part of recreational angler tagging program conducted by the Hawaii Department of Land and Natural Resources-Division of Aquatic Resources during 2000-2012. Mark-recapture data were used to estimate von Bertalanffy growth curve parameters and survivorship. Growth curves generated from the mark-recapture data suggested that Giant Trevally from the main Hawaiian Islands may be growing faster and reach a smaller maximum size than individuals in the Northwest Hawaiian Islands, but there are a number of issues rendering this conclusion uncertain. The survivorship of Giant Trevally was positively associated with age, in part due to ontogenetic habitat shifts that result in older fish moving to offshore habitats where they are less vulnerable to anglers. When compared to stock assessments performed using commercial landings data and fisheries-independent visual surveys, the mark-recapture data produced similar estimates for the average length of exploited fish, a metric highly negatively correlated to fishing mortality. These results emphasize the need for additional information on the biology of Giant Trevally in Hawaiian waters and suggest that the data collected from this recreational angler tagging program may be useful to generate reliable estimates of mortality for stock assessment purposes.
4
Introduction
Despite being among the most frequently targeted species by shoreline recreational anglers in Hawaii (Gaffney 2000; Friedlander and Dalzell 2004), relatively little information exists on the mortality and recruitment of fishes in the family Carangidae, commonly known as jacks. This lack of data makes assessing the effectiveness of management efforts difficult. While 23 species of carangids have been reported from Hawaii (Randall 2005), Bluefin Trevally (omilu) Caranx melampygus, Giant Trevally (ulua aukea) Caranx ignobilis, Greater Amberjack (kahala) Seriola dumerili and various species of small-bodied scad ('opelu) Decapterus spp. are generally the most abundant species in nearshore waters and thus, are the most frequently landed. Bluefin Trevally and Giant Trevally support substantial recreational/subsistence fisheries and small scale commercial fisheries. The most recent data available valued the recreational/subsistence fishery at approximately $31 million annually in 2000 (Gaffney 2000), or about $44 million when adjusted for inflation. However, declines in the numbers of carangids and in particular, a reduction in the number of captures of large individuals (> 45 kg) of Giant Trevally, have raised concerns that jacks were not being fished sustainably (Gaffney 2000; Friedlander and Dalzell 2004). More recently, length-based stock assessments suggest that these concerns are not unfounded. Nadon et al. (2015) presented a stock assessment using commercial landings and fisheries independent visual census data that suggested Giant Trevally is currently overfished, with a spawning potential ratio (SPR) of 21%. In contrast, Bluefin Trevally and Greater Amberjack, the other two carangid species included in the stock assessment, seem to be currently supporting sustainable levels of fishing pressure. However, Bluefin Trevally may not have the capacity to support additional fishing based on the current SPR estimates (Nadon et al. 2015). While there are disagreements regarding the conclusions drawn by Nadon et al. (2015) regarding the current status of the Giant Trevally stock in Hawaiian waters (A. Tagawa, Hawaii Department of Land and Natural Resources-Division of Aquatic Resources, pers. comm.), no other assessment of the stock has been performed using alternative methods to date.
However, there is a large dataset on Giant Trevally that can potentially offer additional insights on the status of the Giant Trevally stock in Hawaiian waters. The Hawaii Department of Land and Natural Resources-Division of Aquatic Resources (HDLNR-DAR) initiated an angler-tagging program in 1999 that recruited over 3,671 volunteer anglers from across the state who tagged 40,195 jacks representing 13 species (Tagawa and Tam 2006; A. Tagawa, HDLNR-DAR, pers. comm.). While the program successfully provided information on the movement, growth, and recruitment patterns of 11 species of jacks in Hawaii (Tagawa and Tam 2006), limitations of the analytical approaches for handling data from recreational angler-tagging programs available at the time prevented using these data to generate estimates of mortality. Recreational angler-tagging programs offer several advantages to more traditional mark-recapture study designs implemented by natural resource agencies, including a greater spatial and temporal coverage, the potential to tag a larger number of individuals, and enhancing ties between the fishing community and the agency (Lucy and Davy 2000; Henderson and Fabrizio 2014). Recreational angler-tagging programs have proved useful at providing insights on the movement and growth patterns of targeted species (Scott et al. 1990; Gillanders et al. 2001). However, the data
5
generated by angler-tagging programs can be problematic and has been difficult to use to estimate demographic parameters of interest to fisheries managers, such as mortality rates (Gillanders et al. 2001; Henderson and Fabrizio 2014). The problems with angler-tagging program data typically stem from the fact that the data are generally not at the same level of quality as those collected by a scientific survey. Such problems with angler-tagging program data can violate the assumptions of the statistical models used to analyze these data, such as the Cormack-Jolly-Seber model, rendering estimates of population parameters unreliable. More recently, approaches developed by Barker (1997), Barker et al. (2001), and Henderson and Fabrizio (2014) have shown promise in addressing the assumptions violated when using other models and generating realistic and reliable estimates of mortality rates. This represents an important advancement for fully utilizing angler-tagging program data to inform management decisions for data-deficient species. Therefore, the objective of this study was to evaluate the growth and mortality of Giant Trevally using the data collected through the Hawaii’s Ulua and Papio Tagging Project. These analyses were conducted to evaluate currently available data on Giant Trevally and identify data needs to better manage and monitor the population. Furthermore, we also assessed the feasibility of using the modeling approaches described by Henderson and Fabrizio (2014) to generate estimates of abundance, recruitment, and mortality for stock assessment purposes.
Methods
Data were collected as part of Hawaii’s Ulua and Papio Tagging Project conducted by the Hawaii Department of Land and Natural Resources – Division of Aquatic Resources. This project was a long-term, angler-based mark-recapture effort focused primarily on Giant Trevally and Bluefin Trevally. However, 11 additional species of carangids have been tagged as part of the project. The project was initiated in 1999 on the east side of Hawaii Island and was expanded statewide in 2000. The project ended in June 2012, but recaptures of tagged individuals have continued to be reported. The majority of anglers who have participated in the project were located on Oahu and accordingly, the majority of tagged fish and recaptures were reported from there. A full description of the tagging methods and project results through 2004 are provided by Tagawa and Tam (2006).
We used fork length (FL) at capture, FL at recapture, and time at liberty to fit a von Bertalanffy (1938) growth curve for Giant Trevally tagged and recaptured during 2000-2016 throughout the state using the methods described by Fabens (1965) and refined by Francis (1988). Growth curves were fitted for all observations pooled together and also for Hawaii, Maui Nui, Oahu, and Kauai-Niihau individually based on the original tagging location of each fish. Individuals recaptured after < 30 days at liberty were excluded from analysis. If an individual was recaptured multiple times, only the length and time at liberty from the final recapture event was used in the analysis.
We used the resulting von Bertalanffy growth curve to estimate the age at initial capture and constructed age-based and cohort-based catch curves for each year of data (2000-2016). For the analysis, a birthdate of 01 January was assumed for all individuals. Instantaneous mortality (Z) was estimated by performing a weighted regression analysis on the natural-log transformed count

6
data and age (Maceina and Bettoli 1998, Miranda and Bettoli 2007). We used an analysis of covariance (ANCOVA) to test the null hypothesis that Z as estimated from the catch curves did not vary among years. We used Z to calculate the annual survival (S) and mortality (A) rates using and 1 , respectively.
We used a Barker joint live-dead recovery model (Barker 1997, 1999) implemented in Program MARK v 8.2 (White and Burnham 1999) to estimate the probability of survival, harvest, and “resighting,” i.e., recapture and live release of a previously tagged individual, at each time step using the encounter history for each tagged individual. The Barker model has seven default parameters:
Si = the probability of an animal captured at i survives to i + 1;
pi = detection probability, i.e., the probability that a fish at risk of capture at i is captured at i;
ri = the probability that a fish is recaptured, harvested and reported at i + 1;
Ri = the probability that a fish is recaptured, released, and reported at i + 1;
R’i = the probability that a fish is recaptured between i and i + 1, released, and reported, but then dies;
Fi = the probability that a fish at risk of capture at i remains at risk of recapture at i + 1, e.g., a fish remains in the waters around Oahu at depths where it is accessible to anglers;
Fi’ = the probability that a fish not at risk of capture at i is at risk of capture at i + 1; a fish that has been at a different island or in deeper water moves back into the shallow, nearshore waters around Oahu.
In general, ri, Ri, and R’i are considered nuisance parameters from which it is difficult to interpret an overall recapture probability. However, they do contribute to the accuracy of estimates for Si (Slattery and Alisauskas 2002).
We used an interval of one month. When individuals were encountered multiple times within an interval, only the last encounter was considered for the encounter history. The Barker model is comparable to the more complex models presented by Henderson (2012) and Henderson and Fabrizio (2014). However, it should be noted that the models fitted for this study did not use identity of the angler tagging the fish as a covariate, nor did it account for tag retention or post-release mortality associated with handling and tagging.
Before starting analysis, we constructed a set of eight candidate models that incorporated different parameterizations to account for interannual variability, age class, and life history stage. For all analyses, we used Akaike’s Information Criterion for small sample sizes (AICc), ∆AICc values, and Akaike weights (wi) to select the best approximating model (Anderson et al. 2000). We considered any model that had ∆AICc ≤ 2 as competing and calculated variable weights to
7
assess the relative variable importance by summing the Akaike weights of models that included the variable of interest (Burnham and Anderson 2002).
For the models, we focused on Giant Trevally originally tagged in the waters around Oahu during 2003-2007. Recapture events occurring at other islands or of individuals originally tagged from other islands were censored from this analysis. We restricted the data set to Oahu during 2003-2007 for this preliminary analysis as it yielded robust dataset of over 6,000 individual fish that remained manageable in terms of covariates and computer processing time. Individuals were assigned to an age class at the time of initial capture as described above and allowed to age into different age classes. Age classes included young-of-year (YOY; ≤ 21 cm FL); three age classes of juveniles: age-1 (21-38 cm FL), age-2 (38-52 cm FL), and age-3 (52-65 cm FL), and one for adults age-4+ (> 65 cm FL). These age classes were selected to correspond to the size-specific habitat uses of Giant Trevally life history stages as noted by Tagawa and Tam (2006) where YOY used habitats at depths of 1.8-6.1 m, juveniles were found primarily at depths of 6.1-18.3 m, and adults occupied depths of 18.3-155.4 m.
Results
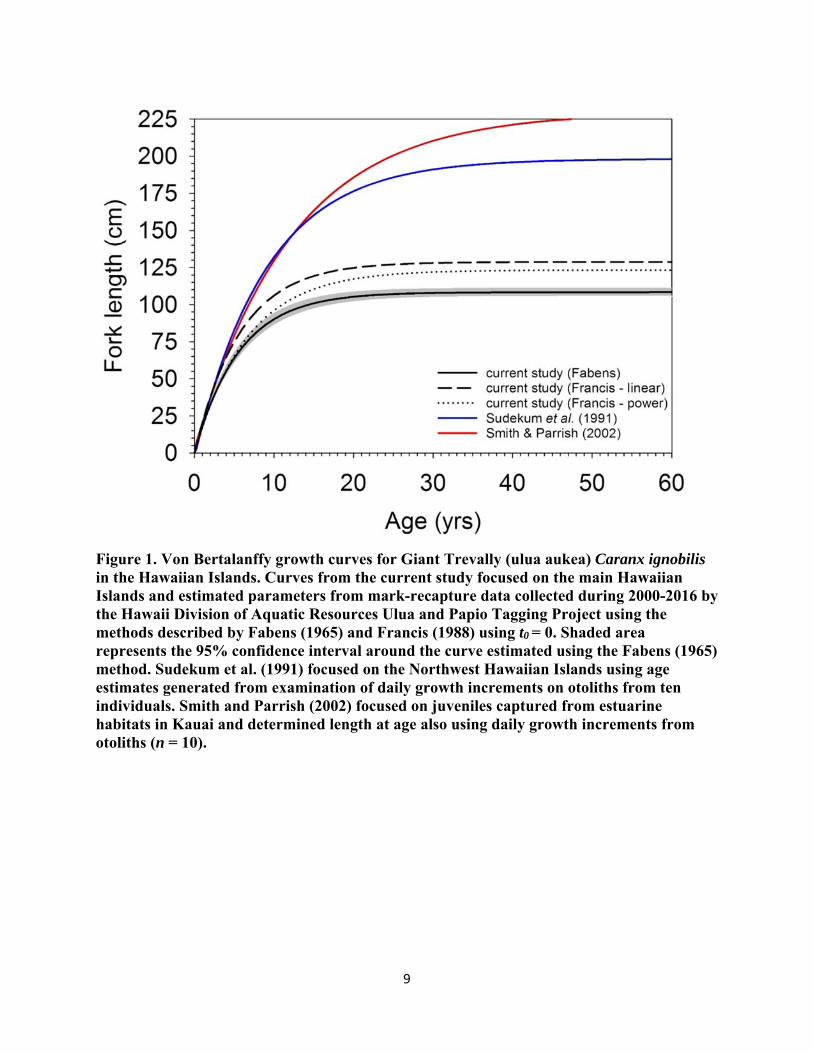
Giant Trevally initially captured from the waters around Hawaii and Kauai and Niʻihau tended to be larger at tagging and remained at liberty for a longer interval than did individuals captured from around Oahu and Maui Nui. (Table 1). There was also evidence to suggest that fish captured from Hawaii and Kauai and Niʻihau grew more slowly than counterparts from Oahu and Maui-Nui. However, the wide disparity in sample sizes, initial FL, and time at liberty potentially confound any comparisons of growth between islands (Table 1). The von Bertalanffy growth curves generated by the various approaches were in general agreement in their estimates of growth rate (k). However, the Fabens method produced a relatively low estimate for the theoretical maximum length (L∞) and high estimates for k compared to previous studies (Table 1, Figure 1). Furthermore, all three methods produced lower estimates of size-at-age relative to those from previously published studies of daily growth increments on the otoliths from a small number of juveniles (n=10) taken from estuarine habitat in Kauai (Smith and Parrish 2002) or a small number of individuals (n=10) taken from the Northwest Hawaiian Islands (Sudekum et al. 1991; Figure 1).
Upwards of 80% of Giant Trevally captured as part of Hawaii’s Ulua and Papio Tagging Project were < 3 years old. In general, Giant Trevally seem to be fully recruited to the nearshore fishery at age 1 (Figure 2). For reference, individuals ≥ 25.4 cm FL (10 inches) can be legally harvested for personal consumption in Hawai’i, which corresponds to individuals being between 1-2 years old upon entry to the recreational/subsistence fishery. Individuals ≥ 40.6 cm FL (16 inches) can be harvested commercially, which corresponds to being 2-3 years old upon entry to the commercial fishery. However, Giant Trevally do not reach sexual maturity until after reaching age 3, or approximately 53.3 cm FL (21 inches; Sudekum et al. 1991). The instantaneous mortality rate (Z) as estimated from the descending leg of the catch curves was 0.378 yr-1 (F1,160

8
= 354.08, P < 0.01, R2 = 0.71) and did not exhibit any meaningful interannual variation when catch curves from different years were compared (F16,160 = 0.94, P = 0.53; Table 2).
There was no selection uncertainty among our eight-model candidate set (Table 3). The model that received the most support (AICc = 11401.86, ΔAICc = 0.00, AICcwi = 1.00) incorporated the effects of age and year into the parameter estimates. Models incorporating only the effects of age class, life history stage, or interannual variability received levels of support comparable to that of the global and null models.
The estimates of annual survival, annual mortality, and instantaneous mortality for Giant Trevally from the best-supported model varied between age classes and years (Table 4; Appendix I). Annual survival rate for YOY Giant Trevally around Oahu during 2003-2007 averaged about 0.667, while those of juveniles (ages 1-3) and adults (ages 4+) were 0.759 and 0.849, respectively. These estimates of annual survival translated to instantaneous mortality rates that were considerably lower than those estimated using catch curves as described above or those estimated by Nadon et al. (2015). However, it seems that the assumption of constant mortality across ages within a cohort and between cohorts is not necessarily valid (Figure 3). The probability of being captured in a given year was highest for age-1 individuals (pi ≈ 0.20) and decreased rapidly with increasing age (Appendix I). There were insufficient data to estimate pi
for adult fish and to estimate the probability of fish remaining accessible to anglers (Fi) or returning to areas where they are vulnerable to anglers (F’i) in the best-supported model. However, models receiving less support indicated that both Fi and F’i tended to decrease with increasing age.
Conclusions
On their surface, the results of this study suggest that the status of the Giant Trevally fishery in the main Hawaiian Islands is better than what recent stock assessments conducted by Nadon et al. (2015) indicate. However, this re-examination of the data from the Hawaii Division of Aquatic Resources Ulua and Papio Tagging Project points to several issues of major concern in the fishery and highlights the lack of basic life-history information and fisheries statistics available for this species.
Our estimates of L∞ and k were considerably different than those reported in the literature by Sudekum et al. (1991) and Smith and Parrish (2002), suggesting that Giant Trevally in the main Hawaiian Islands may grow faster and reach a smaller maximum size than individuals in the Northwest Hawaiian Islands. However, there are a number of caveats to both the estimates of L∞ and k generated by the current study and those from published studies. Sudekum et al. (1991) fitted their growth curve to daily increment counts from the otoliths of ten individuals collected from the Northwest Hawaiian Islands during 1978-1983. Even though the fishes used by Sudekum et al. (1991) represented a wide-range of sizes, this was an extremely small sample size upon which to characterize the growth of any fish species, much less one as wide-ranging as Giant Trevally. Furthermore, the Northwest Hawaiian Islands differ from the main Hawaiian Islands oceanographically, climatologically, hydrologically, and ecologically, such as different
9
Figure 1. Von Bertalanffy growth curves for Giant Trevally (ulua aukea) Caranx ignobilis in the Hawaiian Islands. Curves from the current study focused on the main Hawaiian Islands and estimated parameters from mark-recapture data collected during 2000-2016 by the Hawaii Division of Aquatic Resources Ulua and Papio Tagging Project using the methods described by Fabens (1965) and Francis (1988) using t0 = 0. Shaded area represents the 95% confidence interval around the curve estimated using the Fabens (1965) method. Sudekum et al. (1991) focused on the Northwest Hawaiian Islands using age estimates generated from examination of daily growth increments on otoliths from ten individuals. Smith and Parrish (2002) focused on juveniles captured from estuarine habitats in Kauai and determined length at age also using daily growth increments from otoliths (n = 10).

10
Figure 2. Age-frequency distributions for Giant Trevally (ulua aukea) Caranx ignobilis captured in the main Hawaiian Islands during 2000-2016 as part of the Hawaii Division of Aquatic Resources Ulua and Papio Tagging Project. Age estimates were generated from a Von Bertalanffy growth curve fitted to the recapture data as described in Table 1.

11
Figure 3. Survivorship curves for Giant Trevally (ulua aukea) Caranx ignobilis as estimated from Barker joint live-dead recovery model (Barker 1997, 1999) and catch curves fitted to tagging data from the nearshore waters around the island of Oahu during 2003-2007 as part of the Hawaii Division of Aquatic Resources Ulua and Papio Tagging Project. Curves generated from the instantaneous mortality rates (Z), including and excluding estimated fishing mortality (F), generated as part of length-based stock assessments of Giant Trevally conducted by Nadon et al. (2015) are presented for comparative purposes.

12
Table 1. Mean time at liberty, mean initial and final fork lengths (FL), and Von Bertalanffy growth curve parameters (L∞ and k) of Giant Trevally (ulua aukea) Caranx ignobilis tagged and recaptured in the main Hawaiian Islands during 2000-2016 by the Hawaii Division of Aquatic Resources Ulua and Papio Tagging Project. Von Bertalanffy growth curve parameters were estimated from mark-recapture data using the method described by Fabens (1965) and the linear and power extensions of the Fabens model described by Francis (1988). Individuals were assigned to an island based on their initial tagging location.
n Mean (±SD)
time at liberty (yrs)
Mean (±SD) initial
FL (cm)
Mean (±SD) final FL
(cm)
L∞ (±SE) k (±SE)
Hawaii 100 1.644 ± 1.800 75 ± 26 82 ± 27 130.2 ± 9.78 0.087 ± 0.022Kauai and Ni’ihau 17 2.099 ± 3.114 52 ± 31 60 ± 33 99.8 ± 3.0 0.163 ± 0.025Maui Nui 37 0.964 ± 1.575 26 ± 16 36 ± 21 103.4 ± 7.2 0.207 ± 0.032Oahu 884 0.543 ± 0.839 25 ± 12 32 ± 15 103.6 ± 2.6 0.193 ± 0.008 Pooled 1038 0.690 ± 1.134 30 ± 21 38 ± 22 — —Fabens — — — — 108.4 ± 1.5 0.178 ± 0.005Fabens/Francis (linear) — — — — 128.8 0.174Fabens/Francis (power) — — — — 123.3 0.151

13
Table 2. Estimates of instantaneous mortality rate (Z), annual survival rate (S), and annual mortality rate (A) calculated from the descending leg of catch curves for Giant Trevally (ulua aukea) Caranx ignobilis captured in the main Hawaiian Islands during 2000-2016 by the Hawaii Division of Aquatic Resources Ulua and Papio Tagging Project. Estimates are provided for all available years as well as years for which the parameters were modeled (see Table 4).
Year Z (95% CI) S (95% CI) A (95% CI) All years (2000-2016) 0.378 (0.336-0.420) 0.685 (0.714-0.657) 0.315 (0286-0.343)
2003 0.584 (0.001-1.166) 0.558 (0.312-0.999) 0.688(0.001-0.688)2004 0.576 (0.301-0.851) 0.562 (0.427-0.740) 0.438 (0.260-0.573)2005 0.473 (0.253-0.692) 0.623 (0.500-0.776) 0.377 (0.224-0.500)2006 0.431 (0.240-0.622) 0.650 (0.537-0.787) 0.350 (0.213-0.463)2007 0.404 (0.307-0.501) 0.668 (0.606-0.736) 0.332 (0.264-0.394)

14
Table 3. Support for a priori candidate Barker joint live-dead recovery models (Barker 1997, 1999) used to estimate the probability of survival (S), detection (p), various recapture (r, R, R’) and movement scenarios (F, F’) of Giant Trevally (ulua aukea) Caranx ignobilis captured in the nearshore waters of the island of Oahu during 2003-2007 as part of the Hawaii Division of Aquatic Resources Ulua and Papio Tagging Project.
Model AICca ∆AICc wi Likelihood K
S(age,yr), p(age,yr), r(age,yr), R(age,yr), R’(age,yr), F(age,yr), F’(age,yr) 11401.86 0.00 1.00 1.00 50
Global model 11472.51 70.65 0.00 0.00 167
S(age,yr), p(age,yr), r(age,yr), R(age,yr), R’(age,yr), F=F’(age,yr) 11573.70 171.84 0.00 0.00 47
S(LHS), p(LHS), r(LHS), R(LHS), R’(LHS), F(LHS), F’(LHS) 11583.90 182.04 0.00 0.00 19
S(LHS), p(LHS), r(LHS), R(LHS), R’(LHS), F=F’(LHS) 11584.77 182.91 0.00 0.00 13
S(.), p(.), r(.), R(.), R’(.), F(.), F’(.) 11620.45 218.60 0.00 0.00 6
S(.), p(.), r(.), R(.), R’(.), F=F’(.) 11632.70 230.84 0.00 0.00 5
S(yr), p(yr), r(yr), R(yr), R’(yr), F(yr), F’(yr) 11887.75 485.90 0.00 0.00 29
S(yr), p(yr), r(yr), R(yr), R’(yr), F=F’(yr) 11928.73 526.87 0.00 0.00 26
S(age), p(age), r(age), R(age), R’(age), F(age), F’(age) 12043.90 642.04 0.00 0.00 25
S(age), p(age), r(age), R(age), R’(age), F=F’(age) 12091.55 689.70 0.00 0.00 23
aAICc = Akaike’s Information Criterion for small sample sizes, ∆AICc = differences in AICc, wi = Akaike weights, K = number of parameters

15
Table 4. Age and year-specific estimates of annual survival (S) and instantaneous mortality (Z) of Giant Trevally (ulua aukea) Caranx ignobilis captured in the nearshore waters of the island of Oahu during 2003-2007 as part of the Hawaii Division of Aquatic Resources Ulua and Papio Tagging Project. Estimates were generated using a Barker joint live-dead recovery model (Barker 1997, 1999). Cohorts are highlighted in different colors to allow tracking changes through time of annual survival.
Stage Age Year Cohort S (95% C.I.) Z YOY 0 2003 2003 0.618 (0.566-0.668) 0.481 0 2004 2004 0.598 (0.546-0.649) 0.514 0 2005 2005 0.752 (0.708-0.792) 0.285 0 2006 2006 0.663 (0.602-0.719) 0.411 0 2007 2007 0.704 (0.635-0.764) 0.352 Juvenile 1 2003 2002 0.658 (0.616-0.697) 0.419 1 2004 2003 0.638 (0.592-0.682) 0.449 1 2005 2004 0.782 (0.745-0.816) 0.245 1 2006 2005 0.700 (0.648-0.748) 0.356 1 2007 2006 0.738 (0.682-0.787) 0.304 2 2003 2001 0.715 (0.655-0.769) 0.335 2 2004 2002 0.698 (0.648-0.744) 0.360 2 2005 2003 0.825 (0.778-0.863) 0.193 2 2006 2004 0.753 (0.705-0.796) 0.283 2 2007 2005 0.787 (0.727-0.836) 0.240 3 2003 2000 0.786 (0.665-0.872) 0.241 3 2004 2001 0.771 (0.648-0.860) 0.260 3 2005 2002 0.873 (0.789-0.926) 0.136 3 2006 2003 0.817 (0.709-0.891) 0.202 3 2007 2004 0.843 (0.737-0.912) 0.171 Adult 4+ 2003 ≤1999 0.821 (0.690-0.905) 0.197 4+ 2004 ≤2000 0.809 (0.672-0.897) 0.212 4+ 2005 ≤2001 0.896 (0.807-0.947) 0.110 4+ 2006 ≤2002 0.848 (0.730-0.921) 0.164 4+ 2007 ≤2003 0.871 (0.772-0.931) 0.138
16
temperature regimes and productivity patterns, which could influence the growth patterns of Giant Trevally. While Smith and Parrish (2002) collected Giant Trevally from the main Hawaiian Islands, they also used a very small sample size (n = 10). In addition, the fish were all juveniles in a relatively narrow size range (6.4-15.8 cm FL) and were all collected from a single estuary on Kauai during 1989-1990. After determining the age of these individuals, Smith and Parrish (2002) pooled their data with that from Sudekum et al. (1999) to fit their growth curve. This combination is problematic not only because of the potential differences in growth associated with the temporal and spatial separation of the two samples, but also because the fish collected by Sudekum et al. (1999) were unlikely to have ever encountered estuarine conditions as juveniles.
Our results are not without a number of caveats warranting consideration. In particular, the tendency for the Fabens (1965) method and the various extensions proposed by Francis (1988) to underestimate L∞ is well documented (Francis 1988). This tendency is exacerbated by the fact that no tagged individuals > 100 cm FL have been recaptured to date. To illustrate the potential effect of the lack of large individuals in the sample, we added a single recapture event for the largest tagged individual (150 cm FL) after being at liberty for 30 days and experiencing no change in fork length. This single addition results in a growth curve with a theoretical maximum fork length (L∞ [± SE] = 207.8 ± 19.6 cm FL) much closer to that estimated by Sudekum et al. (1999) and Smith and Parrish (2002). However, the growth rate estimated from the addition of this single “datapoint” was (k ± SE) 0.237 ± 0.016 yr-1; dramatically higher than any other estimates. The lengths-at-ages generated from this artificial curve translates to individuals reaching the reported length at maturity before age-2. Admittedly, the probability of this artificial curve accurately representing the Giant Trevally population around the main Hawaiian Islands would be unlikely, but not impossible. Heavy fishing mortality can introduce a selective pressure on populations of exploited fish favoring sexual maturation at smaller sizes and younger ages. However, the growth curves generated from the results of the tagging study illustrate the need for thorough investigation of the life history parameters of Giant Trevally.
Even after accounting for the uncertainty associated with growth curve parameters discussed above, our results indicate that the majority of Giant Trevally landings from the nearshore fishery consists of sexually immature individuals that are captured before having the opportunity to spawn. This conclusion is predicated on the assumptions that the Von Bertalanffy growth curve parameters generated from the recapture data from the Hawaii Division of Aquatic Resources Ulua and Papio Tagging Project are reasonably accurate and that that the anglers volunteering for the program were fishing in a manner and in locations similar to those used by the fishery as a whole. While there are no data quantifying the effort expended by nearshore anglers targeting small juvenile (papio) Giant Trevally relative to that expended by anglers fishing for large adult (ulua) Giant Trevally from boats farther offshore, the Giant Trevally fishery in Hawaii is primarily shore-based (Gaffney 2000). Because the majority of anglers fishing for Giant Trevally are targeting juveniles, it is reasonable to infer that the majority of Giant Trevally captured in the recreational/subsistence fishery are ≤ 3 years old and are above
17
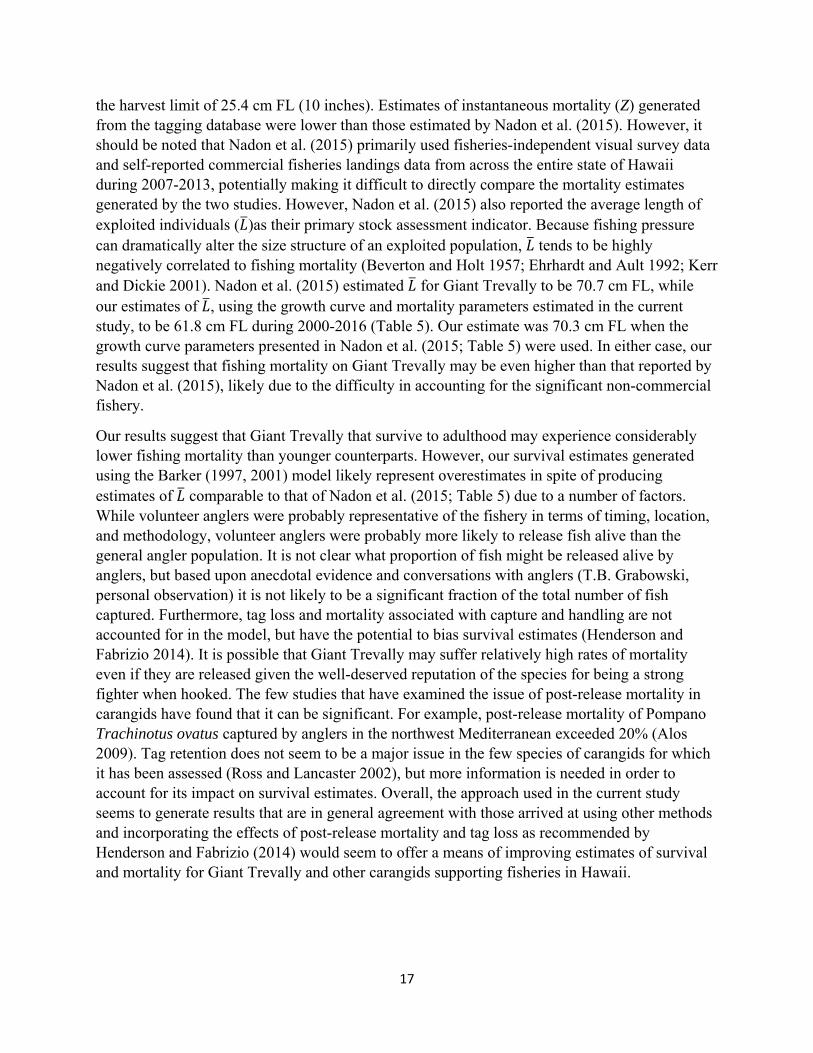
the harvest limit of 25.4 cm FL (10 inches). Estimates of instantaneous mortality (Z) generated from the tagging database were lower than those estimated by Nadon et al. (2015). However, it should be noted that Nadon et al. (2015) primarily used fisheries-independent visual survey data and self-reported commercial fisheries landings data from across the entire state of Hawaii during 2007-2013, potentially making it difficult to directly compare the mortality estimates generated by the two studies. However, Nadon et al. (2015) also reported the average length of exploited individuals ( )as their primary stock assessment indicator. Because fishing pressure can dramatically alter the size structure of an exploited population, tends to be highly negatively correlated to fishing mortality (Beverton and Holt 1957; Ehrhardt and Ault 1992; Kerr and Dickie 2001). Nadon et al. (2015) estimated for Giant Trevally to be 70.7 cm FL, while our estimates of , using the growth curve and mortality parameters estimated in the current study, to be 61.8 cm FL during 2000-2016 (Table 5). Our estimate was 70.3 cm FL when the growth curve parameters presented in Nadon et al. (2015; Table 5) were used. In either case, our results suggest that fishing mortality on Giant Trevally may be even higher than that reported by Nadon et al. (2015), likely due to the difficulty in accounting for the significant non-commercial fishery.
Our results suggest that Giant Trevally that survive to adulthood may experience considerably lower fishing mortality than younger counterparts. However, our survival estimates generated using the Barker (1997, 2001) model likely represent overestimates in spite of producing estimates of comparable to that of Nadon et al. (2015; Table 5) due to a number of factors. While volunteer anglers were probably representative of the fishery in terms of timing, location, and methodology, volunteer anglers were probably more likely to release fish alive than the general angler population. It is not clear what proportion of fish might be released alive by anglers, but based upon anecdotal evidence and conversations with anglers (T.B. Grabowski, personal observation) it is not likely to be a significant fraction of the total number of fish captured. Furthermore, tag loss and mortality associated with capture and handling are not accounted for in the model, but have the potential to bias survival estimates (Henderson and Fabrizio 2014). It is possible that Giant Trevally may suffer relatively high rates of mortality even if they are released given the well-deserved reputation of the species for being a strong fighter when hooked. The few studies that have examined the issue of post-release mortality in carangids have found that it can be significant. For example, post-release mortality of Pompano Trachinotus ovatus captured by anglers in the northwest Mediterranean exceeded 20% (Alos 2009). Tag retention does not seem to be a major issue in the few species of carangids for which it has been assessed (Ross and Lancaster 2002), but more information is needed in order to account for its impact on survival estimates. Overall, the approach used in the current study seems to generate results that are in general agreement with those arrived at using other methods and incorporating the effects of post-release mortality and tag loss as recommended by Henderson and Fabrizio (2014) would seem to offer a means of improving estimates of survival and mortality for Giant Trevally and other carangids supporting fisheries in Hawaii.

18
Table 5. Stock assessment parameter estimates generated for Giant Trevally (ulua aukea) Caranx ignobilis in the main Hawaiian Islands by Nadon et al. (2015) and from the current study using data collected as part of the Hawaii Division of Aquatic Resources Ulua and Papio Tagging Project. Parameters include theoretical maximum length (L∞) and growth rate (k) from the Von Bertalanffy growth curve, length at the maximum observed age (Lλ ), mean length at first capture (Lc ), average length of exploited fish ( , instantaneous mortality (Z), fishing mortality (F), natural mortality (M), annual survival (S), and annual mortality (A).
Current study
Nadon et al. (2015)
Z from catch curve; estimated VB parameters
Z from catch curve; VB
parameters from Nadon et al.
(2015)
Z from Barker model;
estimated VB parameters
Z from Barker model; VB parameters
from Nadon et al. (2015)
L∞ 217.0 128.8 217.0 128.8 217.0Lλ 152.3 127.1 152.3 127.1 152.3Lc 43.0 30.9 30.9 30.9 30.9
70.7 61.8 70.3 68.5 77.2 k 0.110 0.174 0.110 0.174 0.110Z 0.570 0.378 0.378 0.278 0.278F 0.300 — — — —M 0.270 — — — —S 0.566 0.685 0.685 0.757 0.757A 0.434 0.315 0.315 0.243 0.243

19
References
Alos J. 2009. Mortality impact of recreational angling techniques and hook types on Trachinotus ovatus (Linnaeus, 1758) following catch-and-release. Fisheries Research 95:365-369.
Anderson DA 2008.Model based inferences in the life sciences: A primer of evidence. Springer Science, New York, New York, USA.
Barker RJ. 1997. Joint modeling of live-recapture, tag-resight, and tag-recovery data. Biometrics 53:666-677.
Barker RJ, KP Burnham, and GC White. 2001. Encounter history modeling of joint mark-recapture, tag-resighting and tag-recovery data under temporary emigration. Statistics Sinica 14:1037-1055.
Beverton RJH and SJ Holt. 1957. On the dynamics of exploited fish populations. London: Chapman-Hall.
Burnham KP and DA Anderson. 2002. Model selection and multimodel inference: a practical information-theoretic approach, 2nd edition. Springer Science and Business, LCC, New York. 488 p.
Ehrhardt NM and JS Ault. 1992. Analysis of two length-based mortality models applied to bounded catch length frequencies. Transactions of the American Fisheries Society 121:115-122.
Fabens AJ. 1965. Properties and fitting of the von Bertalanffy growth curve. Growth 29:265-289.
Francis RICC. 1988. Maximum likelihood estimation of growth and growth variability from tagging data. New Zealand Journal of Marine and Freshwater Research 22:42-51.
Friedlander AM and P Dalzell. 2004. A review of the biology and fisheries of two large jacks, ulua (Caranx ignobilis) and omilu (Caranx melampygus), in the Hawaiian Archipelago. Pages 171-185 in AM Friedlander (ed.). Status of Hawaii’s coastal fisheries in the new millennium. Proceedings of the 2001 Fisheries Symposium sponsored by the American Fisheries Society, Hawaii Chapter, Honolulu, Hawaii. 230 p.
Gaffney R. 2000. Evaluation of the status of the recreational fishery for ulua in Hawai’i and recommendations for future management. DAR Technical Report 20-02. Hawaii Department of Land and Natural Resources, Division of Aquatic Resources, Honolulu. 42 p.
Gillanders BM, DJ Ferrell, and NL Andrew 2001. Estimates of movement and life-history parameters of Yellowtail Kingfish (Seriola lalandi): how useful are data from a cooperative tagging programme? Marine and Freshwater Research 52:179-192.
Haddon M. 2011. Modelling and quantitative methods in fisheries, 2nd edition. CRC Press, Boca Raton, Florida. 449 p.
20
Henderson MJ. 2012. Movement, growth, and mortality of Chesapeake Bay Summer Flounder based on multiple tagging technologies. Ph.D. dissertation. The College of William and Mary, Williamsburg, Virginia. 278 p. Available online at: http://web.vims.edu/library/Theses/Henderson12.pdf [accessed 19 May 2017]
Henderson MJ and MC Fabrizio. 2014. Estimation of Summer Flounder (Paralichthys dentatus) mortality rates using mark-recapture data from a recreational angler-tagging program. Fisheries Research 159:1-10.
Kerr SR and LM Dickie. 2001. The biomass spectrum: a predator-prey theory of aquatic production. Columbia University Press: New York.
Lucy J and K Davy. 2000. Benefits of angler-assisted tag and release programs. Fisheries 25:18-23.
Maceina MJ and PW Bettoli. 1998. Variation in Largemouth Bass recruitment in four mainstream impoundments on the Tennessee River. North American Journal of Fisheries Management 18:998-1003.
Miranda LE and PW Bettoli. 2007. Mortality. Pages 229-278 in CS Guy and ML Brow (eds.). Analysis and interpretation of freshwater fisheries data. American Fisheries Society, Bethesda, Maryland. 961 p.
Nadon MO, JS Ault, ID Williams, SG Smith, and GT DiNardo. 2015. Length-based assessment of coral reef fish populations in the main and Northwestern Hawaiian Islands. PLoS One 10(8):e0133960.
Randall JE. 2007. Reef and shore fishes of the Hawaiian Islands. Sea Grant College Program, University of Hawaii, Honolulu. 546 p.
Ross SW and JE Lancaster. 2002. Movements and site fidelity of two juvenile fish species using surf zone nursery habitats along the southeastern North Carolina coast. Environmental Biology of Fishes 63:161-172.
Scott EL, ED Prince, and CD Goodyear. 1990. History of cooperative game fish tagging program in the Atlantic Ocean, Gulf of Mexico, and Caribbean Sea, 1954-1987. American Fisheries Society Symposium 7:841-853.
Slattery SM and RT Alusauskas. 2002. Use of the Barker model in an experiment examining covariate effects on first-year survival in Ross’s Geese (Chen rossi): a case study. Journal of Applied Statistics 29:497-508.
Smith GC and JD Parrish. 2002. Estuaries as nurseries for the jacks Caranx ignobilis and Caranx melampygus (Carangidae) in Hawaii. Estuarine, Coastal, and Shelf Science 55:347-359.
Sudekum AE, JD Parrish, RL Radtke and S Ralston. 1991. Life history and ecology of large jacks in undisturbed, shallow, oceanic communities. Fishery Bulletin 89:493-513.

21
Tagawa AW and CKM Tam. 2006. Hawaii’s Ulua and Papio Tagging Project 2000 to 2004. DAR Technical Report 06-01. Hawaii Department of Land and Natural Resources, Division of Aquatic Resources. Honolulu. 75 p. Available online at: https://dlnr.Hawaii.gov/dar/files/2014/04/uluataggingrept.pdf [accessed 19 May 2017].
Von Bertalanffy L. 1938. A quantitative theory of organic growth. Human Biology 10:181-213.
White GC and KP Burnham. 1999. Program MARK: survival estimation from populations of marked animals. Bird Study 46:S120-S139.

22
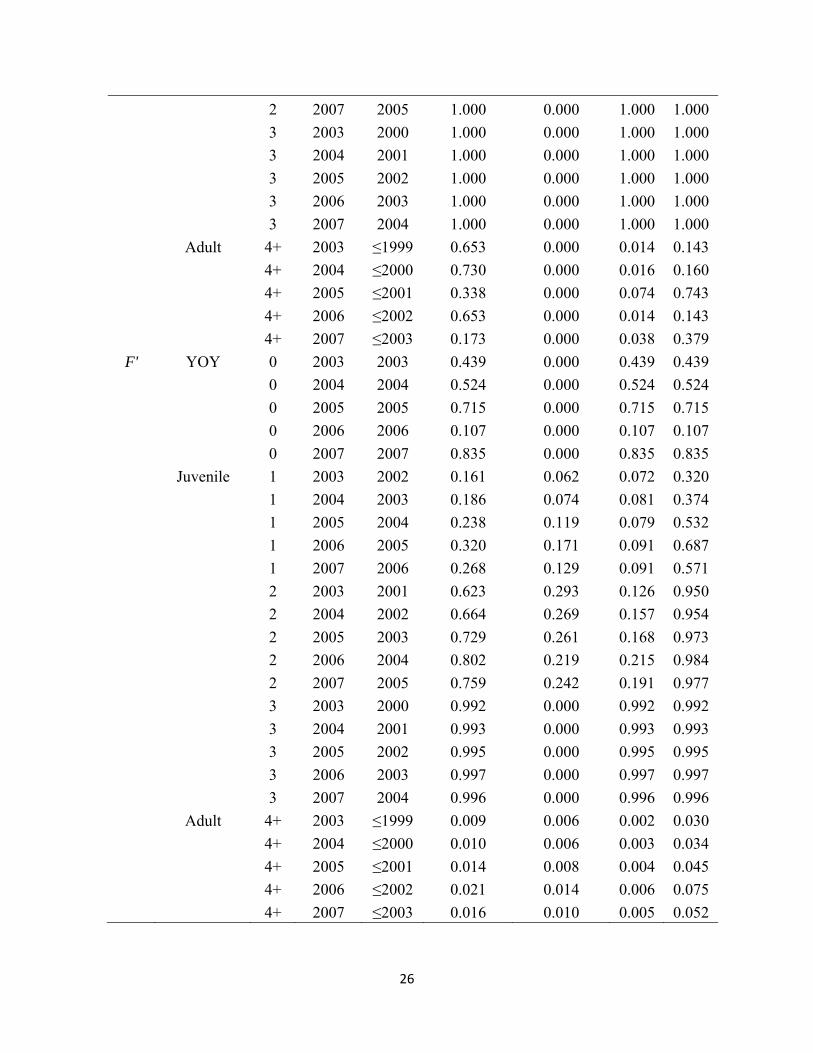
Appendix I. Parameter estimates of annual survival (S); detection probability (p); the probability that a fish is recaptured, harvested and reported (r); the probability that a fish is recaptured, released, and reported (R); the probability that a fish is recaptured, released, and reported, but then dies (R’); the probability that a fish at risk of capture remains at risk of recapture (F); and the probability that a fish not at risk of capture at returns to being at risk of capture (F’) of Giant Trevally (ulua aukea) Caranx ignobilis from a Barker joint live-dead recovery model (1997, 1999) fitted to mark-recapture data in the nearshore waters of the island of Oahu during 2003-2007 as part of the Hawaii Division of Aquatic Resources Ulua and Papio Tagging Project.
Stage Age Year Cohort Estimate S.E. 95% C.I.
S YOY 0 2003 2003 0.618 0.026 0.566 0.668
0 2004 2004 0.598 0.026 0.546 0.649
0 2005 2005 0.752 0.021 0.708 0.792
0 2006 2006 0.663 0.030 0.602 0.719
0 2007 2007 0.704 0.033 0.635 0.764
Juvenile 1 2003 2002 0.658 0.021 0.616 0.697
1 2004 2003 0.638 0.023 0.592 0.682
1 2005 2004 0.782 0.018 0.745 0.816
1 2006 2005 0.700 0.026 0.648 0.748
1 2007 2006 0.738 0.027 0.682 0.787
2 2003 2001 0.715 0.029 0.655 0.769
2 2004 2002 0.698 0.024 0.648 0.744
2 2005 2003 0.825 0.022 0.778 0.863
2 2006 2004 0.753 0.023 0.705 0.796
2 2007 2005 0.787 0.028 0.727 0.836
3 2003 2000 0.786 0.053 0.665 0.872
3 2004 2001 0.771 0.054 0.648 0.860
3 2005 2002 0.873 0.034 0.789 0.926
3 2006 2003 0.817 0.046 0.709 0.891
3 2007 2004 0.843 0.044 0.737 0.912
Adult 4+ 2003 ≤1999 0.821 0.054 0.690 0.905
4+ 2004 ≤2000 0.809 0.057 0.672 0.897
4+ 2005 ≤2001 0.896 0.034 0.807 0.947
4+ 2006 ≤2002 0.848 0.048 0.730 0.921
4+ 2007 ≤2003 0.871 0.039 0.772 0.931
p YOY 0 2003 2003 0.065 0.012 0.045 0.093
0 2004 2004 0.052 0.008 0.039 0.069
0 2005 2005 0.022 0.004 0.016 0.032

23
0 2006 2006 0.016 0.003 0.010 0.024
0 2007 2007 0.034 0.007 0.022 0.052
Juvenile 1 2003 2002 0.319 0.110 0.148 0.557
1 2004 2003 0.270 0.096 0.124 0.490
1 2005 2004 0.133 0.057 0.055 0.289
1 2006 2005 0.096 0.044 0.038 0.221
1 2007 2006 0.190 0.080 0.078 0.394
2 2003 2001 0.103 0.023 0.066 0.157
2 2004 2002 0.083 0.015 0.059 0.116
2 2005 2003 0.036 0.008 0.024 0.054
2 2006 2004 0.025 0.006 0.016 0.039
2 2007 2005 0.054 0.011 0.036 0.081
3 2003 2000 0.071 0.027 0.032 0.147
3 2004 2001 0.057 0.020 0.028 0.113
3 2005 2002 0.024 0.009 0.011 0.051
3 2006 2003 0.017 0.007 0.008 0.036
3 2007 2004 0.037 0.013 0.018 0.074
Adult 4+ 2003 ≤1999 1.000 0.000 1.000 1.000
4+ 2004 ≤2000 1.000 0.000 1.000 1.000
4+ 2005 ≤2001 1.000 0.000 1.000 1.000
4+ 2006 ≤2002 1.000 0.000 1.000 1.000
4+ 2007 ≤2003 1.000 0.000 1.000 1.000
r YOY 0 2003 2003 0.078 0.011 0.060 0.102
0 2004 2004 0.057 0.007 0.044 0.073
0 2005 2005 0.049 0.007 0.036 0.066
0 2006 2006 0.022 0.005 0.015 0.033
0 2007 2007 0.047 0.008 0.033 0.066
Juvenile 1 2003 2002 0.099 0.011 0.080 0.122
1 2004 2003 0.072 0.008 0.058 0.090
1 2005 2004 0.063 0.008 0.049 0.080
1 2006 2005 0.028 0.005 0.019 0.041
1 2007 2006 0.060 0.010 0.044 0.081
2 2003 2001 0.200 0.030 0.148 0.264
2 2004 2002 0.150 0.021 0.113 0.197
2 2005 2003 0.132 0.020 0.097 0.177
2 2006 2004 0.062 0.012 0.043 0.089
2 2007 2005 0.126 0.021 0.090 0.174

24
3 2003 2000 0.293 0.077 0.168 0.461
3 2004 2001 0.227 0.064 0.126 0.376
3 2005 2002 0.201 0.059 0.110 0.340
3 2006 2003 0.099 0.034 0.050 0.188
3 2007 2004 0.193 0.057 0.105 0.328
Adult 4+ 2003 ≤1999 0.108 0.043 0.048 0.225
4+ 2004 ≤2000 0.079 0.032 0.035 0.169
4+ 2005 ≤2001 0.068 0.028 0.030 0.150
4+ 2006 ≤2002 0.031 0.014 0.013 0.074
4+ 2007 ≤2003 0.065 0.028 0.028 0.145
R YOY 0 2003 2003 0.021 0.007 0.011 0.042
0 2004 2004 0.008 0.003 0.004 0.019
0 2005 2005 0.007 0.002 0.003 0.014
0 2006 2006 0.007 0.002 0.004 0.013
0 2007 2007 0.013 0.004 0.007 0.023
Juvenile 1 2003 2002 0.020 0.006 0.011 0.035
1 2004 2003 0.008 0.003 0.003 0.017
1 2005 2004 0.006 0.002 0.004 0.011
1 2006 2005 0.006 0.002 0.004 0.011
1 2007 2006 0.012 0.003 0.007 0.019
2 2003 2001 0.032 0.010 0.017 0.059
2 2004 2002 0.012 0.005 0.006 0.025
2 2005 2003 0.010 0.003 0.006 0.018
2 2006 2004 0.010 0.003 0.006 0.018
2 2007 2005 0.019 0.005 0.011 0.031
3 2003 2000 0.011 0.008 0.002 0.048
3 2004 2001 0.004 0.003 0.820 0.020
3 2005 2002 0.003 0.003 0.726 0.015
3 2006 2003 0.003 0.003 0.739 0.015
3 2007 2004 0.006 0.005 0.001 0.027
Adult 4+ 2003 ≤1999 0.491 0.000 0.000 1.000
4+ 2004 ≤2000 0.187 0.000 0.000 1.000
4+ 2005 ≤2001 0.154 0.000 0.000 1.000
4+ 2006 ≤2002 0.155 0.000 0.000 1.000
4+ 2007 ≤2003 0.284 0.000 0.000 1.000
R' YOY 0 2003 2003 0.096 0.023 0.060 0.151
0 2004 2004 0.030 0.010 0.015 0.057

25
0 2005 2005 0.010 0.013 0.790 0.115
0 2006 2006 0.187 0.000 0.000 1.000
0 2007 2007 0.800 0.000 0.000 1.000
Juvenile 1 2003 2002 0.013 0.013 0.002 0.087
1 2004 2003 0.004 0.004 0.377 0.037
1 2005 2004 0.001 0.002 0.350 0.043
1 2006 2005 0.232 0.000 0.000 1.000
1 2007 2006 0.991 0.000 0.552 0.554
2 2003 2001 0.587 0.000 0.421 0.422
2 2004 2002 0.169 0.000 0.121 0.121
2 2005 2003 0.559 0.000 0.400 0.401
2 2006 2004 0.103 0.000 0.075 0.751
2 2007 2005 0.441 0.000 0.040 0.399
3 2003 2000 0.938 0.000 0.094 0.938
3 2004 2001 0.270 0.000 0.027 0.270
3 2005 2002 0.893 0.000 0.089 0.893
3 2006 2003 0.165 0.000 0.016 0.165
3 2007 2004 0.705 0.000 0.007 0.705
Adult 4+ 2003 ≤1999 0.661 0.001 0.000 1.000
4+ 2004 ≤2000 0.190 0.000 0.000 1.000
4+ 2005 ≤2001 0.629 0.000 0.000 1.000
4+ 2006 ≤2002 0.116 0.000 0.294 0.296
4+ 2007 ≤2003 0.497 0.000 0.291 0.292
F YOY 0 2003 2003 1.000 0.000 1.000 1.000
0 2004 2004 1.000 0.000 1.000 1.000
0 2005 2005 1.000 0.000 1.000 1.000
0 2006 2006 1.000 0.000 1.000 1.000
0 2007 2007 1.000 0.000 1.000 1.000
Juvenile 1 2003 2002 0.141 0.057 0.062 0.292
1 2004 2003 0.155 0.065 0.065 0.327
1 2005 2004 0.079 0.045 0.024 0.226
1 2006 2005 0.141 0.089 0.037 0.411
1 2007 2006 0.042 0.036 0.007 0.206
2 2003 2001 1.000 0.000 1.000 1.000
2 2004 2002 1.000 0.000 1.000 1.000
2 2005 2003 1.000 0.000 1.000 1.000
2 2006 2004 1.000 0.000 1.000 1.000
26
2 2007 2005 1.000 0.000 1.000 1.000
3 2003 2000 1.000 0.000 1.000 1.000
3 2004 2001 1.000 0.000 1.000 1.000
3 2005 2002 1.000 0.000 1.000 1.000
3 2006 2003 1.000 0.000 1.000 1.000
3 2007 2004 1.000 0.000 1.000 1.000
Adult 4+ 2003 ≤1999 0.653 0.000 0.014 0.143
4+ 2004 ≤2000 0.730 0.000 0.016 0.160
4+ 2005 ≤2001 0.338 0.000 0.074 0.743
4+ 2006 ≤2002 0.653 0.000 0.014 0.143
4+ 2007 ≤2003 0.173 0.000 0.038 0.379
F' YOY 0 2003 2003 0.439 0.000 0.439 0.439
0 2004 2004 0.524 0.000 0.524 0.524
0 2005 2005 0.715 0.000 0.715 0.715
0 2006 2006 0.107 0.000 0.107 0.107
0 2007 2007 0.835 0.000 0.835 0.835
Juvenile 1 2003 2002 0.161 0.062 0.072 0.320
1 2004 2003 0.186 0.074 0.081 0.374
1 2005 2004 0.238 0.119 0.079 0.532
1 2006 2005 0.320 0.171 0.091 0.687
1 2007 2006 0.268 0.129 0.091 0.571
2 2003 2001 0.623 0.293 0.126 0.950
2 2004 2002 0.664 0.269 0.157 0.954
2 2005 2003 0.729 0.261 0.168 0.973
2 2006 2004 0.802 0.219 0.215 0.984
2 2007 2005 0.759 0.242 0.191 0.977
3 2003 2000 0.992 0.000 0.992 0.992
3 2004 2001 0.993 0.000 0.993 0.993
3 2005 2002 0.995 0.000 0.995 0.995
3 2006 2003 0.997 0.000 0.997 0.997
3 2007 2004 0.996 0.000 0.996 0.996
Adult 4+ 2003 ≤1999 0.009 0.006 0.002 0.030
4+ 2004 ≤2000 0.010 0.006 0.003 0.034
4+ 2005 ≤2001 0.014 0.008 0.004 0.045
4+ 2006 ≤2002 0.021 0.014 0.006 0.075
4+ 2007 ≤2003 0.016 0.010 0.005 0.052