On the Uneven Distribution of Innovative Capabilities and Why That Matters for Research, Extension...
29
INTERNATIONAL SERVICE FOR NATIONAL September 2006 AGRICULTURAL RESEARCH (ISNAR) DIVISION ISNAR Discussion Paper 7 On the Uneven Distribution of Innovative Capabilities and Why That Matters for Research, Extension and Development Policies Javier M. Ekboir, Manrrubio Muñoz, Jorge Aguilar, Roberto Rendón Mendel, José G. García Muñiz and J. Reyes Altamirano Cárdenas 2033 K Street, NW, Washington, DC 20006-1002 USA • Tel.: +1-202-862-5600 • Fax: +1-202-467-4439 • [email protected] www.ifpri.org IFPRI Division Discussion Papers contain preliminary material and research results. They have not been subject to formal external reviews managed by IFPRI’s Publications Review Committee, but have been reviewed by at least one internal or external researcher. They are circulated in order to stimulate discussion and critical comment. Copyright 2005, International Food Policy Research Institute. All rights reserved. Sections of this material may be reproduced for personal and not-for-profit use without the express written permission of but with acknowledgment to IFPRI. To reproduce the material contained herein for profit or commercial use requires express written permission. To obtain permission, contact the Communications Division at [email protected].
-
Upload
independent -
Category
Documents
-
view
0 -
download
0
Transcript of On the Uneven Distribution of Innovative Capabilities and Why That Matters for Research, Extension...

INTERNATIONAL SERVICE FOR NATIONAL September 2006 AGRICULTURAL RESEARCH (ISNAR) DIVISION
ISNAR Discussion Paper 7
On the Uneven Distribution of Innovative Capabilities and Why That Matters for Research, Extension and Development
Policies
Javier M. Ekboir, Manrrubio Muñoz, Jorge Aguilar, Roberto Rendón Mendel, José G. García Muñiz and J. Reyes Altamirano Cárdenas
2033 K Street, NW, Washington, DC 20006-1002 USA • Tel.: +1-202-862-5600 • Fax: +1-202-467-4439 • [email protected] www.ifpri.org
IFPRI Division Discussion Papers contain preliminary material and research results. They have not been subject to formal external reviews managed by IFPRI’s Publications Review Committee, but have been reviewed by at least one internal or external researcher. They are circulated in order to stimulate discussion and critical comment.
Copyright 2005, International Food Policy Research Institute. All rights reserved. Sections of this material may be reproduced for personal and not-for-profit use without the express written permission of but with acknowledgment to IFPRI. To reproduce the material contained herein for profit or commercial use requires express written permission. To obtain permission, contact the Communications Division at [email protected].

ii
iii
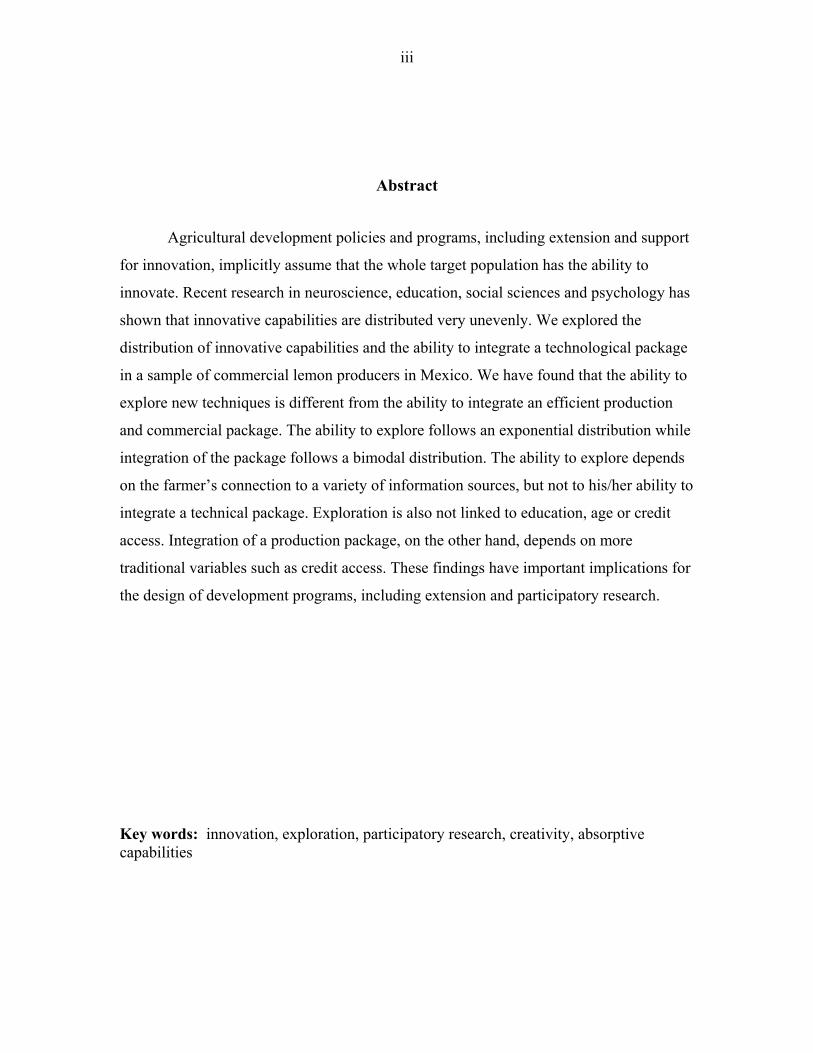
Abstract
Agricultural development policies and programs, including extension and support
for innovation, implicitly assume that the whole target population has the ability to
innovate. Recent research in neuroscience, education, social sciences and psychology has
shown that innovative capabilities are distributed very unevenly. We explored the
distribution of innovative capabilities and the ability to integrate a technological package
in a sample of commercial lemon producers in Mexico. We have found that the ability to
explore new techniques is different from the ability to integrate an efficient production
and commercial package. The ability to explore follows an exponential distribution while
integration of the package follows a bimodal distribution. The ability to explore depends
on the farmer’s connection to a variety of information sources, but not to his/her ability to
integrate a technical package. Exploration is also not linked to education, age or credit
access. Integration of a production package, on the other hand, depends on more
traditional variables such as credit access. These findings have important implications for
the design of development programs, including extension and participatory research.
Key words: innovation, exploration, participatory research, creativity, absorptive capabilities

iv

v
Contents
1. Introduction................................................................................................................. 1
2. The Nature of Innovative Capabilities....................................................................... 3
3. Understanding Individual Innovation Abilities ......................................................... 5
4. Collective Innovative Capabilities.............................................................................. 8
5. The Data.................................................................................................................... 10
6. The Nature and Distribution of Innovative Abilities ................................................ 11
7. Conclusions............................................................................................................... 18
References......................................................................................................................... 21
Tables Table 1: Descriptive statistics .......................................................................................... 13
Table 2: Regression of the number of times a farmer is among the first seven adopters
on farmers’ characteristics ................................................................................................ 14
Table 3: Regression of the number of techniques a farmer uses on farmers’
characteristics.................................................................................................................... 16
Figures
Figure 1: Distribution of farmer’s exploration of new techniques .................................. 16
Figure 2: Adoption patterns ............................................................................................. 17

vi

1. Introduction1
Agricultural development policies and programs, including extension and
support for innovation, implicitly assume that the whole target population has the ability
to innovate. This is evident in Rogers (2003) classification of innovators, early adopters,
early majority, late majority and laggards; a category of never adopter is not included.
Recent research in neuroscience (Camerer, Loewenstein and Prelec 2005; Vandervert
2003), education (Renzulli 2003) and psychology (Shavinina and Seeratan 2003),
however, has shown that innovative capabilities are distributed very unevenly. Even
more, innovative capabilities are specific to certain areas of activity; in other words,
creative scientists or artists usually have very poor capabilities to innovate in business
and vice versa. Recognition of these differences and their influence on innovation
capabilities can spur growth and poverty alleviation through better targeting of
development programs and the design of new instruments.
It is evident that people innovate often in many aspects of life (e.g., buying new
computers or adopting new consumption patterns). At the same time, a cursory
observation of developed economies indicates that very few people are entrepreneurs or
innovators; most people are employees, professionals or self employed in small
enterprises. These observations suggest that there may be different types of innovative
capabilities.
Innovation has been defined in different ways. In psychology and education it
has been defined as the ability to think new things, which may lead to new products or
processes. In the innovation systems literature, several definitions have been proposed
(OECD 1999); in this paper we define an innovation as anything new successfully
introduced into an economic or social process. Our definition leaves out an important
set of innovations: those that improve individual lives but do not have an impact on
society. In other words, it does not include personal improvement. It also stresses that
1 Javier Ekboir is senior researcher at the International Food Policy Research Institute; Manrrubio Muñoz, Jorge Aguilar, Roberto Rendon Mendel, Jose G. Garcia Muñiz and J. Reyes Altamirano Cardenas are professors at the Universidad de Chapingo, Mexico. The research that generated the data used in this paper was financed by the Fundacion Produce Michoacan.

2
an innovation is not just trying something new but successfully integrating a new idea
or product into a process that includes technical, economic and social components.2
Our definition also differs from the traditional view that sees innovations as
discrete, finished outputs, as reflected in the terms “product” and “process” innovations,
or diffusion of technologies. The traditional view also influenced traditional research
management procedures that focus on research outcomes (Alston, Norton and Pardey
1995) and extension programs that stress passing technical packages to farmers. Even
modern extension approaches, such as Farmer Field Schools, seek to help farmers adopt
specific techniques or develop definite skills (Tripp, Wijeratne and Viyadasa 2005)
rather than develop long term innovative capabilities.
This simplistic view of innovation, however, is not supported by the
development and diffusion of several important innovations, such as no-till agriculture
(Ekboir 2002), computers and hydraulic excavators (Christensen 2003). These
experiences show that particular innovations should be seen as components in long and
complex processes where technical, commercial and social factors have to be integrated.
Developing innovations that have an economic or social impact requires
innovators to be able to outperform other potential innovators. The reason why few
people are entrepreneurs is that competitive forces operate as a selection mechanism
attracting entrepreneurs into occupations where they can profit from their skills. Non-
entrepreneurs cannot survive in dynamic markets, because competition forces agents to
innovate often to maintain or increase their competitive advantages.3 In static markets,
though, non-innovators can survive because the pace of change is slower. This is
especially valid for small farmers who produce their own food, while small businesses
in other sectors have to make enough profits to cover, at least, the owner’s food needs.
The capabilities to innovate have two dimensions: individual and collective.
Collective innovation capabilities are important because actors seldom innovate in
2 Schumpeter (1950) introduced this distinction when he distinguished invention (a new idea) from innovation (implementation of the idea). 3 This phenomenon has been recognized, at least, in since Marx. Cochrane’s model of the technology treadmill (1958) is a modern version of the process.

3
isolation, but interacting with other actors in formal or informal networks (Christensen
and Raynor 2003; Ekboir 2002). Understanding individual innovative abilities is
important because organizations learn through their members and because most farms
(especially, small farms) in developing countries are managed by a single farmer or
household.
This paper analyzes the nature of innovative abilities and their distribution
among commercial farmers. The remainder of this paper is organized as follows.
Section 2 analyzes the nature of innovation capabilities. Section 3 reviews the literature
on individual innovation abilities while section 4 reviews recent discussions on
collective innovation capabilities. Section 5 describes the data used in the empirical
analysis presented in section 6. Section 7 concludes discussing the importance of
incorporating the differences in innovation capabilities in the design and
implementation of development programs, especially those targeted at increasing
agricultural production and development of high-value agriculture.
2. The Nature of Innovative Capabilities
The nature of innovative capabilities is the same in all innovators; the difference
lies in the strength of those abilities and the particular areas in which they are applied
(see sections 3 and 4). Even though the nature of the capabilities is similar, the strengths
determine the types of innovations individuals and organizations can develop; that is,
the “quantitative” differences have major “qualitative” consequences. For example,
many people can design a billboard for an advertisement, but very few can paint a
masterpiece. Also, the areas in which innovators operate influence the expression of
those capabilities; for example, scientists usually follow stricter rules to innovate than
artists (see sections 0 and 0).
Also, what is defined as an innovation depends on the particular context in
which it is introduced. In science and arts the main criteria for an innovation to be
accepted as such is novelty to the world. In these cases, innovation is a process of rare
events and only very few people are recognized as real innovators. On the other hand, in
most other areas of human activity, and especially in the innovation systems literature,
an innovation has to be new only to the adopting agent (Nelson and Rosenberg 1993).

4
For example, in the 1990s many Ghanaian small farmers adopted a no-till package for
maize production. One important component of the package was a sighting pole that
helped farmers walk in a straight line and plant the maize in rows (Ekboir 2002).
In areas other the arts and science, an innovation has two dimensions: one is the
innovation itself and the other the ability to integrate it into an effective package. While
the former is no longer a rare event, the second is. And the degree of novelty required to
succeed increases with development and globalization. Because the benchmark for an
innovation is not novelty to the world, but improvement of a process in prevailing local
conditions, many people qualify as innovators in local isolated markets. But as these
markets integrate into globalized ones, the marketing skills required to succeed in large,
anonymous markets are increasingly sophisticated. For example, a small farmer selling
maize in Nigeria needs different skills to sell in his village market than to Cargill.
This means that the capabilities to develop social or economic innovations are
intrinsically similar to those required for successful adoption, but used with different
goals and applied to different environments. To innovate, agents (e.g., individuals,
private firms or research institutes) must have the ability to create something new; to
achieve this they must integrate into formal or informal collaborations because
individually they usually do not have all the resources required (Ekboir 2002;
Christensen and Raynor 2003; Rycroft and Kash 1999). To use an innovation developed
by someone else, more than the ability to “create” new things, actors must have the
ability to integrate existing technical, managerial and marketing components into an
efficient package. In order to access the technical and commercial information farmers
need to adopt an innovation, they also have to integrate into formal or informal
networks.
Recognition of the differences in innovation capabilities across actors has led to
a review of the principles of the firm. It has been found that many farmers carry out
experiments on their own (Bellon 2001); however, few farmers are recognized as
technology leaders, and even fewer, have been able to develop new technologies. This
casual observation coincides with findings in other economic sectors that identified
persistent differences among firms in the same productive sector (Christensen 2003;
Henderson and Cockburn 2000; Teece Pisano and Shuen 2000).

5
This fact led to a new characterization of the firm, called the resource-based
vision of the firm. Rather than considering that firms maximize an objective function
subject to external constraints (a static vision), it is assumed that firms invest resources
to create idiosyncratic capabilities that enable them to relax the external restrictions and
create long-term competitive advantages (a dynamic and strategic vision). These
capabilities are unique to each firm, are difficult to copy or buy (Dosi, Nelson and
Winter 2000), and depend on individual and collective capabilities to innovate.
3. Understanding Individual Innovation Abilities
Almost every person is born with the basic physiological apparatus to innovate
(Vandervert 2003). In fact, people innovate continuously. Most innovations, however,
are not socially “important” because they do not transcend the innovator’s personal
experience (e.g., becoming better at yoga); on the other hand, some innovations are
“important” because they have an influence beyond the innovator (e.g., creating a
successful firm) and very few are “extremely important” because they have major
economic or social impacts (e.g., developing an AIDS vaccine). “What makes an
innovation an 'important' innovation or a deeply experienced 'insight' is a matter of its
cultural or organizational context, and its degree of generalization” (Vandervert 2003).
In this section we are concerned with the abilities of individuals who are capable of
creating “important” innovations; i.e., innovations with the potential of having social or
economic impacts.
An individual’s ability to innovate is not only innate, but also results from the
specific organization of idiosyncratic cognitive experiences. These experiences
influence the individual’s representations of reality, i.e., how an individual sees,
understands and interprets the environment in which he/she is immersed. The
cornerstone of individual innovation is the originality of the representations an
individual creates (Nickles 2003). Intelligent people, and particularly innovators, see,
understand and interpret their reality differently than the rest of the population. Their
representations are general, categorical, conceptually rich, complex and unique, all
which enables exceptional performance and achievements (Shavinina and Seeratan
2003). This unique representation is the basis for “seeing” what other people do not see.

6
Describing their representations as unique, does not mean that innovators have
supernatural abilities (Nickles 2003). They are human beings with a unique combination
of abilities operating in a particular environment that result in extraordinary outcomes.
Innovative individuals have above average general and specific abilities (but not
necessarily exceptional), show strong task commitment, and are creative (Shavinina and
Seeratan 2003; Renzulli 2003). The talent for innovation results from the interactions
among these three factors and not from being exceptional at one or two. Two other
factors that influence innovative abilities are personality and the environment
(Georgsdottir, Lubart and Get 2003).
The general abilities are the capacities to process information, to integrate
experiences and to have abstract thoughts, while the specific abilities are the capacities
to acquire specialized knowledge or skills.4 It has been shown that intellectually talented
individuals have an adequate, sophisticated and well structured knowledge stock, which
they can easily access. Task commitment is also defined as perseverance, specialized
practice and self confidence. There is no universally accepted definition of creativity,
but it is recognized that it is related to the ability to think what nobody else thought
(Georgsdottir, Lubart and Getz, 2003).
Even though there are no methods to measure these traits quantitatively, it is
accepted that innovators fall within the top 20 percent of each trait’s distribution
(Renzulli 2003). This implies that less than 1 percent of the general population can be
described as innovators.
Innovative abilities are not necessarily linked to formal education or good
grades, but to learning processes (Renzulli 2003). This does not mean that formal
education is not important. Formal education has an indirect effect on innovation by
enhancing the individual’s ability to process information and often by increasing his/her
specialized knowledge. In other words, innovative individuals can make better use of
information than most people.
4 Academic skills are one of the most important general abilities while the specific abilities include artistic or sports skills.

7
Creativity is highly variable. Even the most consistently creative individuals
have non-creative periods after intense and long creative experiences. Also, creativity
varies over lifetime. Einstein had his first idea of relativity when he was 16 years old; in
1905 (at the age of 25) he published three papers, each one worth a Nobel Prize. He
wrote his last major contribution in 1915, but remained a professor at renowned
universities for another forty years. The great majority of innovators in art and science
had similar experiences of decreasing innovative abilities over time (Miller 2000).
Task commitment and creativity can be developed in some people if they are
properly stimulated and trained in those activities in which they are talented, and if they
develop appropriate links with the environment (Renzulli 2003; Vandervert 2003). But
individual responses to the same stimuli are highly variable; even more, it is not
possible to predict which individuals will respond favorably to specific stimuli.
The nature of the training to develop innovative capabilities depends on the
particular areas in which those capabilities will be applied, for example, scientists
receive a more formal training than artists. There is strong evidence, though, creative
scientists benefit from being good artists and vice versa (Simonton 2003).
Some people (not all people) are innovative in certain occasions (not all
occasions), in certain moments (not all the time), in certain environments and in
particular areas of activity, e.g., dancing, biology or business (Renzulli 2003). No one is
an innovator or not an innovator in the same way as one is talented for sciences or
acting. Some people have a unique episode of important innovation in their lives, while
others maintain their innovative capabilities for a long time.5
The bases of an individual‘s innovative abilities are his/her ability to
conceptualize situations, the possession of specialized knowledge (in quantity and
quality) and the existence of a subjective mental space.6 The ability to conceptualize is
linked to the organization of the individual’s intellectual activity. The specialized
knowledge plays a critical role in intellectual performance and in the acquisition of new 5 For example, Giusepe Tomasi de Lampedusa wrote only one novel that became a literary masterpiece, while Edison was granted more than 2000 patents, more than any other individual in history. 6 Specialized knowledge is not equivalent to scientific knowledge.

8
knowledge. It has been shown that “intellectually gifted people are distinguished by an
adequate, well structured, well-functioning and elaborate knowledge base, which is
easily accessible for actualization at any time” (Shavinina and Seeratan 2003).
The conceptual structures and the stock of knowledge create subjective mental
spaces, a key component of cognitive experiences. Idiosyncratic differences in
flexibility, differentiation, integration, and hierarchical structures of the mental spaces
influence the cognitive attitude of individuals, and, thus their intellectual and creative
abilities.
In a study of African innovative farmers, Reij and Waters-Bayer (2001) found
that in most cases (a) they were male (probably reflecting gender biases in asset
ownership, education and cultural values); (b) they had strong personalities; (c) they
were relatively old and experienced; (d) they were relatively rich (which enabled them
to experiment more; (e) they had links with other regions (which served as sources of
new information); (f) they were full time farmers; (g) innovativeness and formal
education were not correlated; and (h) they tended to develop integrated agricultural
systems.
4. Collective Innovative Capabilities
Similarly to individuals, organizations have strong or weak innovative
capabilities. These capabilities are embedded in individuals (including managers,
technical personnel and line workers), the organization’s technology and structure, its
routines, culture and coordination procedures (Argote and Darr 2000). Even though
innovative organizations must have at least a few innovative individuals, this is not
required for the vast majority of members (Christensen and Raynor 2003). What is
required is that the organization creates an environment in which innovative individuals
can express their abilities and influence the organization.
Organizational factors and culture play a pivotal role because they define how
individual and collective capabilities are structured, coordinated and communicated. For
example, in 1973 the Xerox laboratory in Palo Alto developed a personal computer with
a graphic interface and a mouse (the basis for the first Apple computer), an operating

9
system that allowed running several programs simultaneously (bought by Bill Gates
who used it as the basis for Windows), Ethernet connectivity and the first WYSIWYG
word processor (Carayannis, Gonzalez y Wetter 2003).7 But Xerox’s institutional
culture, centered on photocopies and mainframe computers, prevented the senior
management from seeing the potential of these discoveries.
As was mentioned above, individuals and organizations (including firms and
informal networks) do not innovate in isolation, but interacting with other actors. The
ways in which these actors interact define their collective capabilities to innovate.
Individual abilities to innovate depend, partially, on innate characteristics.
Collective capabilities, on the other hand, are not constrained by given features because
organizations can incorporate individuals with required abilities. Their assimilation into
existing structures, however, can be difficult.
Collective capabilities depend on the collective culture of the institution or
network, and this culture changes very slowly (Schein 1991). Usually institutional
cultures value adherence to routines that have proved successful in the past. In other
words, organizations value stability over innovation (Bailey and Ford 2003). Creating
spaces where creativity can flourish in established organizations has always been
challenging.
By investing in the creation of innovative capabilities, groups of actors improve
their collective capability to absorb information generated by other actors and to use the
knowledge developed internally. The development of collective innovative capabilities
depends on the organizational culture and the existing capabilities; in other words, it is a
path dependent process.
Similar to individuals, organizations can seldom innovate in isolation and
integrate into innovation networks. Innovation networks are informal organizations that
succeeded in implementing collective action through consensus. The consensus is based
on trust among the members (Ekboir 2003; Rycroft and Kash 1999). In general, it is
7 WYSIWYG is the acronym for “what you see is what you get”.

10
more difficult for networks than individual organizations to survive long periods
because of the decentralized nature of the decision making process in the former.
However, several examples show that their emergence is relatively common (Ekboir
2002; Christensen 2003).
Even though formal education is not correlated with individual innovative
abilities, an educated work force is fundamental to develop collective innovative
capabilities. A more educated workforce can master sophisticated technologies more
easily, can better understand norms and rules that differ from the traditional culture and
can better interact with external sources of information, especially codified information.
5. The Data
The data were originally collected to map the technical and commercial
networks in which commercial lemon producers in the state of Michoacán, Mexico,
operate. The producers included in the survey were selected with a combination of
methods. First, an exploratory workshop with key experts was used to identify farmers
recognized as technological leaders. The second method was to draw a random sample
from the 4,762 lemon plots registered in the state in 2002. The third method, known as
snowballing, is commonly used in Social Network Analysis (Scott 2000). The farmers
selected with the first two methods were asked to identify their sources of technical and
commercial information (e.g., researchers, other farmers or input suppliers). These
sources were then surveyed and asked to identify their sources. The process was
repeated until the latest interviewees identified few new names. The final sample had 21
technological leaders, 66 farmers from the random sample and 44 identified by other
farmers.
The sampling methodology used in this paper is unusual because of the
inclusion of the leaders. It is known that the snowballing method can miss specific
groups of actors, if they are not very well connected or if the sample does not include a
large share of the network (Scott 2000). The technological leaders were included to
assess whether their patterns of interaction were different from the rest of the
population. Dummy variables were defined for each of the three categories of farmers.

11
The assumptions about farmer types used to design the sample were not
confirmed by the econometric analysis (see below). This fact, however, does not
invalidate the sampling procedure. The sample was designed to identify patterns of
interaction, not to estimate population parameters; thus, the sample did not have a
statistical design and the results cannot be extrapolated to the population. This is a
feature common to most samples in social network analysis (Scott 2000). The fact that
some of the farmers used to start the snowballing process were selected randomly,
allowed a “good estimate” of the interactions (Frank 1979). The addition of the leaders
only added to the sample information that would probably not have been obtained with
the random sample alone.
Participants in the workshop identified 30 good practices for the production of
lemon. Each farmer was asked which of those practices he/she used, in which year
he/she adopted the practice and who did he/she learned it from. This paper focuses on
the first seven adopters of each practice.
The survey showed that no farmer used the 30 practices identified in the
workshop. Even though this shows that the “experts” probably did not have a good
understanding of the economic value of each practice, it does not invalidate the analysis.
The practices that are not used are simply irrelevant for the analysis of adoption
patterns.
6. The Nature and Distribution of Innovative Abilities
It was argued above that the innovative capabilities required for the adoption of
innovations are basically the abilities to search for new information, to integrate
components into an efficient package, and to establish stable links with sources of
commercial and technical information. This section examines the determinants of
farmers’ exploration patterns and of integration of technical packages.
The section also explores whether farmers recognized as technology leaders by
their communities have the strongest innovative capabilities. Understanding whether
these farmers are really the most innovative is important because researchers and
extension agents usually seek to collaborate with them.

12
The list of the first seven farmers to adopt each innovation contains 80 names,
65 percent of the farmers surveyed. In other words, about two thirds of the farmers often
explore new, untested techniques. Considering that the leaders are only 16% of the
sample and those mentioned by other farmers represent 34%, farmers of all three
categories are among the explorers, indicating that the categories used to define the
sample do not fully reflect the farmers’ innovative capabilities. This finding is
confirmed by the econometric analysis below.
Table 1 shows the descriptive statistics of the variables used in the econometric
analysis. The dependent variables are the number of times a farmer was among the first
seven adopters of a particular technique and the total number of techniques a farmer
uses. The variables input supplier, technical advisor, yourself and another producer are
the number of techniques the respondent learned from each source. The total number of
techniques used by a farmer is larger than the summation of these variables because
farmers have learned some techniques from other sources (family, technical trips and
other sources). The variable “in degree” is the number of farmers that mentioned a
particular farmer as a source of technical information, representing how well connected
the farmer is in his/her community. Equipment is an index indicating how much farm
machinery such as a pick up or a tractor the farmer owns, a proxy for the farmer’s
wealth. Administration index indicates the number of management innovations adopted
by the farmer, indicating how good a manager he/she is. Rents, an index with value 1 if
the farmer rents land to produce lemon, is an indicator of profitability. Total external
references indicates the number of sources of technical information a farmer uses.

13
Table 1: Descriptive statistics
The system consisted of two equations, one for the number of times a farmer
was among the first seven adopters and the other for the number of techniques a farmer
used; the first equation is a proxy for the farmer’s exploration propensity and the second
of the farmer’s ability to integrate an effective production package. The equations were
estimated by OLS; a test for heteroskedasticity rejected the hypothesis of a non-identity
covariance matrix. The equations were also estimated as a system with three stages least
squares, but the results were basically identical to the OLS estimation.
The results of the estimation of the equation for the number of times a farmer
was among the first seven adopters are presented in table 2.
Variable Mean Standard deviation
Number of times among first 7 adopters (dependent variable)
3.5 2.89
Input supplier 0.34 0.79
Other farmer 1.1 1.29
Technical advisor 0.58 1.02
Yourself 1.4 1.60
Publication 0.05 0.27
In degree 2.79 0.47
Number of techniques used 11.11 4.17
Equipment index 0.71 0.04
Administration index 0.50 0.04
Rents 0.16 0.04
Total external references 9.49 0.64

14
Table 2: Regression of the number of times a farmer is among the first seven adopters on farmers’ characteristics
Variable Regression 1 Regression 2 Regression 3 Regression 4 Constant 0.54
(2.98) 0.46
(0.59) 0.54
(2.94) 3.37
(7.37) Leader -0.32
(-0.66) 2.34
(2.74) Referred farmer -0.75
(-1.14) Input supplier 0.63
(3.60) 0.62
(3.51)
Technical adviser 0.57 (5.62)
0.54 (5.64)
Yourself 0.85 (9.37)
0.86 (9.36)
Other farmer 0.66 (5.63)
0.65 (5.53)
Publication 1.20 (2.42)
1.15 (2.28)
In degree 0.10 (2.95)
0.26 (3.73)
0.12 (2.60)
Number of techniques used
0.21 (2.91)
Adjusted R2 0.86 0.31 0.86 0.12 Note: in all cases the number of observations is 80; t statistics are in parenthesis. The estimation method is OLS.
Regression 1 shows that the trial of new techniques is linked to the use of a
number of different sources of technical information and to the pattern of interactions
with other farmers. In other words, exploration is an attitude that involves actively
searching for new information from different sources and using that information to
identify potential new technologies.
A comparison between equations 1 and 2 shows that the trial of new practices
(exploration of emerging technical opportunities) is not linked to the total number of
techniques a farmer uses, which we use as a proxy for the quality of the technical
package used. The workshop of experts (including farmers and agronomists) identified
30 practices a good lemon farmer is supposed to use; thus, we assumed that the more
practices a farmer used the better the package was. This is a strong assumption since the
selection of the practices was not based on economic considerations, as shown by the
fact the no farmer uses all 30 practices. For the producers in the sample, however, the
practices not used are irrelevant for their exploration routines. In the absence of more
complete data on the farmers’ decision making process, we accepted the opinion of the
experts.

15
The coefficient for the number of practices a farmer uses in equation 2 is
significant but the R2 dropped substantially relative to equation 1, indicating that
exploration of new techniques is not influenced by the sophistication of the production
package the farmer is already using.
Regressions 3 and 4 show that the categories used to design the sample cannot
successfully explain the exploratory behavior of farmers. The coefficient for leaders in
equation 3 is not significant. Equation 4 regresses the times a farmer is among the first
adopters on the three categories used to select the sample. Even though the coefficient
for the leaders is significant, the R2 is only 0.12. This finding is important because
extension agents and researchers usually work with the recognized technology leaders.8
In other words, to increase the effectiveness of participatory research and extension, it is
necessary to define better criteria to identify innovative farmers and to target research
and extension programs.
The expected profitability of lemon production was captured by a question on
whether the farmer was willing to invest in lemon production in the near future. Another
important economic question was whether the farmers had access to credit. Both
variables were not significant (the results are not reported).
Regression 5 in table 3 shows that the number of techniques a farmer uses can
be explained by the farm equipment a farmer owns, his/her use of administrative
techniques, his/her attitude towards exploration (measured by the times he/she figures
among the first adopters) and whether he/she rents land for agricultural use. In
regression 6, the coefficient for the leaders is significant but has the wrong sign. Finally,
equation 7 shows that the categories used to define the sample have little explanatory
value; even though the coefficients are significant, the R2 is low.
8 In fact, extension agents in the survey area were asked to select from among the interviewees, farmers whom they would approach; the extension agents y mostly selected the technology leaders.

16
Table 3: Regression of the number of techniques a farmer uses on farmers’ characteristics Variable Regression 5 Regression 6 Regression 7 Constant 3.20
(5.07) 2.78
(4.37) 8.90
(13.14) Leader -1.69
(-2.33) 4.81
(3.96) Referred farmer 3.13
(3.36) Equipment 1.64
(2.14) 1.77
(2.37)
Administration 3.60 (4.40)
4.14 (5.00)
Times among first adopters
0.24 (2.64)
0.29 (3.19)
Total external references 0.41 (8.61)
0.43 (9.16)
Rents 1.53 (2.33)
1.13 (1.72)
Adjusted R2 0.74 0.76 0.18 Note: in all cases the number of observations is 80; t statistics are in parenthesis. The estimation method is OLS.
In the discussion on individual innovative capabilities it was argued that these
abilities had a very skewed distribution. If this were true, it should be expected that
exploration of new techniques should also have a skewed distribution. This hypothesis
is confirmed by the data. The adoption of new techniques by the first adopters follows
an exponential distribution with an exponent of -0.74 (t coefficient = -10.34) and a
constant of 2.73 (t coefficient = 22.24); the R2 is 0.90. The number of observations is
small, but still, they fit the exponential distribution very well (figure 1).
0
2
4
6
8
10
12
14
0 5 10 15 20 25
# of first farmers exploring a new technique
# of
tech
niqu
es e
xplo
red
by e
ach
farm
er
Figure 1: Distribution of farmer’s exploration of new techniques

17
Exploration of new alternatives is different from the ability to integrate an
efficient package. Figure 2 shows the distribution of the number of techniques used by
each farmer. The distribution has two modes, what we call a high technology package
with 13 practices and a low technology package with 6 or 7 practices. As was
mentioned above, the sample included only commercial farmers; in other words,
farmers who have competitive skills. Since this requires integrating several techniques,
few farmers can survive in the lower part of figure 2; in fact 31 farmers (39 percent of
the sample) use between 12 and 14 practices (the high technology package) and only 17
farmers (21 percent of the sample) use between 6 and 8 practices (the low technology
package). In a less competitive environment we would expect the low technology mode
to be much larger.9 Testing this hypothesis is left for further research.
02468
101214161820
0 2 4 6 8 10 12 14 16
# of adopting farmers
# of
tech
inqu
es a
dopt
ed b
y ea
ch fa
rmer
A comparison of figures 1 and 2 clearly shows that the distribution of techniques
adopted by each farmer is different from the ability to explore.
9 We expect this statement to be valid, independently of how the effectiveness of the technology package is measured. More efficient packages can actually reduce the number of practices required to produce the same output, as evidenced by no-till. But, we would still expect a two mode distribution (one mode for commercial farmers and the other for non-commercial farmers).
Figure 2: Adoption patterns

18
7. Conclusions
Rogers’ (2003) classification of innovators, early adopters, early majority, late
majority and laggards has been generally accepted as a true representation of a diffusion
process. A tacit assumption underlying this classification is that eventually, the whole
population will adopt the innovation. We have presented evidence that the assumption
and the classification do not properly describe the diffusion of economically or socially
“important” innovations, i.e., innovations that transcend the individual.
Important innovations cannot be characterized by the adoption of a single
innovation but by the integration of an effective package that includes both technical
and commercial components. To integrate these packages, innovators explore
alternative innovations and interact with other agents to access information and
resources. How early a farmer adopts a particular technique is only weakly related to
his/her ability to ingrate an efficient package. Rogers’ classification can be better
applied to what we call exploration (i.e., the adoption of discrete innovations) than to
integration of the whole package.
The exploration abilities have a very asymmetric distribution; in fact, we found
that the distribution follows a power law.10 A key feature of power laws is that most
observations are below average. In other words, a few individuals are very active
explorers, while some farmers explore sporadically and most farmers do not explore at
all but copy what others have found useful. The power law implies that average or
representative behaviors cannot properly represent exploration among farmers. In our
sample, 51 farmers (39 percent of the sample) were not among the first adopters of any
technique. Copying may not indicate that the farmer is not an innovator; his/her
innovative capabilities may concentrate in combining what has been tested by others
into an efficient technical and commercial package. A deeper exploration of the
relationship between exploration and integration is left for further research.
It must be noted that our sample included only commercial farmers. Schumpeter
and Cochrane argued that competition acts as a selection mechanism weeding out non-
10 The data does not allow us to test whether the data truly follow a power law or a log-normal distribution. But for the argument to be valid, all that is needed is a heavy-tailed distribution.
19
innovative actors from markets. If this argument is valid, the concentration of
innovators among commercial farmers is larger than in the general population. The
analysis of the distribution of innovative abilities among small farmers in developing
countries is left for further research, but if our argument is valid, it can have major
implications for the design of development policies (see below).
Exploration of technical alternatives in our sample depended on the farmer’s
ability to use a variety of sources of information, including the number of contacts
he/she has with other farmers, but was not related to formal education, age, experience
as a lemon producer, the expected profitability of lemon production or access to credit.
This finding agrees with the literature on individual innovative abilities and the
resource-based view of the firm that stress that the innovative abilities depend on innate
and acquired idiosyncratic factors that influence the way innovators see and explore the
world, and less with traditional external factors common to all producers, such as
market conditions or policies. In other words, external conditions are similar for all, but
the idiosyncratic factors determine how each actor can benefit or lose from the external
conditions. Integration of an efficient package, on the other hand, depended on
exploration abilities and on more traditional variables related to investment and
commercial abilities.
As was mentioned above, our findings have three important consequences for
the design and implementation of development policies and programs. First, contrary to
Rogers’ classification, some farmers in developing countries might not even have the
ability to become laggards. Investing resources in programs to increase productivity in
their farms would yield little economic growth (even though it may reduce food
insecurity). Second, as developing countries embark in market-led agricultural
development strategies, only a fraction of the farmers would be able to integrate into
markets. Even though this would accelerate economic growth and create employment in
rural areas, it would increase income discrepancies.
Third, what is an innovation is defined by the particular context in which the
“something new” is introduced. The more backward the context, the easier it is to
innovate. This means that many more people can benefit from training to improve

20
production of staple for self consumption than from a program to develop high-value
exports.
An adequate policy mix to accelerate growth and reduce poverty in rural areas
should include targeting productivity enhancing programs to innovators and for the rest
of the population implementing policies to reduce the cost of adjusting to a more
competitive environment, such as technical training. Targeting programs to innovators
is difficult as the literature on programs for gifted students has shown, but it could have
major positive impacts on rural societies. Exploration of the dynamics of innovation in
traditional societies and in emerging markets, and the analysis of specific policies based
on our findings is left for further research.
Our results also show that farmers traditionally recognized as leaders are not the
most active explorers of new technologies, do not have the best strategies to search for
new information, and often do not use the most effective technologies. This is important
for the design of participatory research and extension programs, because the extension
agents usually work with recognized leaders. Better identification of innovative
capabilities can increase the effectiveness of research and extension programs.
Understanding innovation capabilities is also important to assess the importance
of community-based approaches to development. If innovative capabilities have a
skewed distribution, these approaches may stifle innovation by forcing the most
innovative actors to adapt to a more conservative community. On the other hand,
community-based approaches may be effective to disseminate innovations that require
less specific capabilities, such as better health practices.
21
References
Alston, J.M., G.W. Norton and P.G. Pardey. 1995. Science under Scarcity: Principles and Practice of Agricultural Research Evaluation and Priority Setting, Ithaca:Cornell University Press.
Argote, L. and E. Darr. 2000. Repositories of Knowledge in Franchise Organizations. In Dosi, G., R.R. Nelson and S.G. Winter (eds.), The Nature and Dynamics of Organizational Capabilities, Oxford University Press, N.Y.
Bailey, J.R. and C.M. Ford. 2003. Innovation and Evolution: Managing Tensions Within and Between the Domains of Theory and Practice. In The International Handbook on Innovation, Shavinina, L.V. (ed.), UK:Pergamon.
Bellon, M.R. 2001. Participatory Research Methods for Technology Evaluation: A Manual for Scientists Working with Farmers. Mexico, D.F.: CIMMYT.
Camerer, C., G. Loewenstein and D. Prelec. 2005. Neuroeconomics: How Neuroscience Can Inform Economics. Journal of Economic Literature, XLIII (March 2005):9–64.
Carayannis, E.G., E Gonzalez and J.J. Wetter. 2003. The Nature and Dynamics of Discontinuous and Disruptive Innovations from a Learning and Knowledge Management Perspective. In The International Handbook on Innovation, Shavinina, L.V. (ed.), UK:Pergamon.
Christensen, C.M. 2003. The Innovator’s Dilemma: The Revolutionary National Bestseller that Changed the Way We Do Business. Harper Business Essentials, Harper Colllins Publishers, NY, 286 pages.
Christensen, C.M. and M.E. Raynor. 2003. The Innovator’s Solution. Creating and Sustaining Successful Growth. Cambridge, Mass.: Harvard Business School Press, pp. 304.
Cochrane, W.W. 1958. Farm Prices. Myth and Reality. Minneapolis, University of Minnesota Press.
Dosi, G., R.R. Nelson and S.G. Winter. 2000. Introduction: The Nature and Dynamics of Organizational Capabilities. In Dosi, G., R.R. Nelson and S.G. Winter (eds.), The Nature and Dynamics of Organizational Capabilities, New York:Oxford University Press.
Ekboir, J.M. 2003. Innovation Systems and Technology Policy: Zero Tillage in Brazil, Research Policy, 32:573-586.
Ekboir, J.M. 2002. Developing No-Till Packages for Small-Scale Farmers, in Ekboir, J. (ed.) World Wheat Overview and Outlook, Mexico, D.F.: CIMMYT.
Frank, O. 1979. Estimation of Population Totals vy Use of Snowball Samples. In Holland and Leinhardt (eds.) Perspectives on Social Networks. New York:Academic Press.
Georgsdottir, A.S., T.I Lubart and I. Getz, 2003. The Role of Flexibility in Innovation. In Shavinina, L.V. (ed.), The International Handbook on Innovation, UK:Pergamon.

22
Henderson, R. and I. Cockburn. 2000. Measuring Competence? Exploring Firm Effects in Drug Discovery. In Dosi, G., R.R. Nelson and S.G. Winter, (eds.) The Nature and Dynamics of Organizational Capabilities, Oxford University Press, N.Y.
Miller, A.I. 2000. Insight of Genius. Imagery and Creativity in Science and Art. 1st edition, MIT Press paperback, 482 pp.
Muñoz, M., R. Rendón, J. Aguilar, G. García and Reyes Altamirano. 2004. Redes de Innovación. Un Acercamineto a Su Identificación, Análisis y Gestión para el Desarrollo Rural. Mexico:Fundación Produce Michocacan.
Nelson, R. and N. Rosenberg. 1993. Technical Innovation and National Systems. In National Innovation Systems, A Comparative Analysis, Nelson, R. (ed.), Oxford University Press, N.Y.
OECD. 1999. Managing National Innovation Systems, Paris.
Reij, C. and A. Waters-Bayer (eds.). 2001. Farmer Innovation in Africa: A Source of Inspiration for Agricultural Development. UK:Earthscan Publications Ltd.
Renzulli, J.S. 2003. The Three-Ring Conception of Giftedness: Its Implications for Understanding the Nature of Innovation. In The International Handbook on Innovation, Shavinina, L.V. (ed.), UK:Pergamon.
Rogers, E. M. 2003. Diffusion of Innovations. (5th Edition). New York: Free Press.
Rycroft, R.W. and D.E. Kash. 1999. The Complexity Challenge: Technological Innovation for the 21st Century. Science, Technology, and the International Political Economy Series, A Cassell Imprint, NY.
Schein, E.H. 1991. Organizational Culture and Leadership, 2nd ed., San Francisco and Oxford: Jossey-Bass Publishers.
Schumpeter, J.A. 1950. Capitalism, Socialism and Democracy. New York:Harper.
Scott, J. 2000. Social Network Analysis. A Handbook. 2nd edition, London:Sage Publications Ltd. 208 pages.
Shavinina, L.V. and Seeratan, K.L. 2003. On the Nature of Individual Innovation. In The International Handbook on Innovation, Shavinina, L.V. (ed.), UK:Pergamon.
Simonton, D.K. 2003. Exceptional Creativity Across the Life Span: The Emergence and manifestation of Creative Genius. . In The International Handbook on Innovation, Shavinina, L.V. (ed.), UK:Pergamon.
Teece, D.J., G. Pisano and A. Shuen. 2000. Dynamic Capabilities and Strategic Management. In Dosi, G., R.R. Nelson and S.G. Winter (eds.), The Nature and Dynamics of Organizational Capabilities, New York:Oxford University Press.
Tripp, R., M. Wijeratne and V.P. Viyadasa. 2005. What Should We Expect from Farmer Field Schools? A Sri Lanka Case Study. World Development 33(10):1705:1720.
Vandervert, L.R. 2003. The Neurophysiological Basis of Innovation. In The International Handbook on Innovation, Shavinina, L.V. (ed.), UK:Pergamon.

ISNAR DISCUSSION PAPERS
7 On the Uneven Distribution of Innovative Capabilities and Why That Matters for Research, Extension and Development Policies, Javier M. Ekboir, Manrrubio Muñoz, Jorge Aguilar, Roberto Rendón Mendel, José G. García Muñiz and J. Reyes Altamirano Cárdenas, September 2006
6 The Private Sector in Agricultural R&D: Policies and Institutions to Foster its Growth in Developing Countries, Anwar Naseem, Steven Were Omamo, and David J. Spielman, August 2006
5 From “Best Practice” to “Best Fit”: A Framework for Analyzing Pluralistic Agricultural Advisory Services Worldwide, Regina Birner, Kristen Davis, John Pender, Ephraim Nkonya, Pooniah Anandajayasekeram, Javier Ekboir, Adiel Mbabu, David Spielman, Daniela Horna, Samuel Benin, and Marc Cohen, July 2006
4 Seeking a Common Path: Structuring Multistakeholder Dialogue on Agricultural Biotechnology in Africa, Klaus von Grebmer and Steven Were Omamo, July 2006
3 Agricultural Science and Technology Policy for Growth and Poverty Reduction, Steven Were Omamo and Anwar Naseem, November 2005
2 Innovation Systems Perspectives on Developing-Country Agriculture: A Critical Review, David J. Spielman, September 2005
1 Public Private Partnerships for Innovation-led Growth in Agrichains: A Useful Tool for Development in Latin America? Frank Hartwich, Carolina Gonzalez, and Luis-Fernando Vieira, September 2006