
On the Physics and Chemical Thermodynamics of Laser Cutting
166
DOCTORAL THESIS DIVISION OF MATERIALS PROCESSING 1993:114 D ISSN 0348-8373 On the Physics and Chemical Thermodynamics of Laser Cutting Anders Ivarson 111] TEKNISKA LSI HÖGSKOLAN I LULEÅ LULEÅ UNIVERSITY OF TECHNOLOGY JL!H
-
Upload
khangminh22 -
Category
Documents
-
view
3 -
download
0
Transcript of On the Physics and Chemical Thermodynamics of Laser Cutting

DOCTORAL THESIS DIVISION OF MATERIALS PROCESSING
1993:114 D ISSN 0348-8373
On the Physics and Chemical Thermodynamics of Laser Cutting
Anders Ivarson
111] TEKNISKA L S I HÖGSKOLAN I LULEÅ LULEÅ UNIVERSITY OF TECHNOLOGY
JL!H

DOCTORAL THESIS 1993:114P DIVISION OF MATERIALS PROCESSING ISSN 0348-8373
On the Physics and Chemical Thermodynamics of Laser Cutting
AKADEMISK AVHANDLING som med vederbörligt tillstånd av Tekniska Fakultetsnämnden vid Tekniska Högskolan i Luleå för avläggande av teknologie doktorsexamen kommer att offentligen försvaras i sal E 246 vid LuTH, fredagen den 7 maj 1993 kl 9 0 0 . Avhandlingen försvaras på engelska.
Fakultetsopponent: Dr William O'Neill, University of Liverpool, England
Anders Ivarson
TEKNISKA HÖGSKOLAN I LULEA
LULEÅ UNIVERSITY OF TECHNOLOGY

DOCTORAL THESIS DIVISION OF MATERIALS PROCESSING
1993:114P ISSN 0348-8373
On the Physics and Chemical
Thermodynamics of Laser Cutting
Anders Ivarson
m TEKNISKA LSI HÖGSKOLAN I LULEÅ LULEÅ UNIVERSITY OF TECHNOLOGY

Endast den som inte uträttar något i praktiken, kan undgå att göra fel.
Lenin

To...

PREFACE
Since the autumn of 1988 I have had the pleasure of working in the Laser Group of the Materials Science and Production Technology Department. My work has been in the field of laser cutting concentrating on the nature of the laser-material interactions involved. Laser cutting has been an industrial tool since the beginning of the 1970's. Since then the process has been considerably developed and is now used with great economic and technical success. This work is the result of six projects carried out at Luleå University of Technology. Al l the projects are concerned with various aspects of the laser-material interactions which generate a cut.
Several people have been important to my thesis work. I sincerely thank my supervisor Professor Claes Magnusson for his constant support and encouragement during this work. Dr. John Powell from whom I have received invaluable guidance, inspiring discussions and suggestions. Dr. John Kamalu for his support during my stay in Dundee, Scotland. A l l my colleagues and friends at the department deserve my gratitude for helping me and creating an excellent working atmosphere.
The present work has been financially supported by the Swedish National Board for Industrial and Technical Development (NUTEK).
Luleå, March 1993
Anders Ivarson
i

ABSTRACT
Over the past two decades CO2 laser cutting has grown from an obscure laboratory technique into an important branch of manufacturing engineering. Industrial application of the process has been extremely successful even though the cutting process is not thoroughly understood in detail. This thesis presents the results of a number of theoretical and experimental investigations aimed at increasing our understanding of the interactions which are responsible for the cutting process. The thesis is equally divided between experimental and theoretical work and involves chemical as well as physical analysis of the cutting mechanisms.
Although many of the conclusions reached are valid for a wide range of materials the main thrust of the work is concerned with the cutting of steels. The reasons for this are twofold:
A. Steel cutting is the prime source of the industrial growth of the subject
and,
B. The chemical and physical interactions involved in steel cutting are the most complex and the least understood.
This work has helped to clarify a number of features of the laser cutting process including the following:
1. The effects of process parameters on the efficiency of the cutting process.
2. The nature and rate of oxidation reactions in the cut zone (and therefore the level of thermal input from such reactions).
3. The source of cychc variations in oxidation rate which lead to the generation of striations on the cut edge when cutting mild steel.
4. The levels of reflection, conduction, convection and radiation of heat away from the cut zone.
5. The theoretical development and experimental verification of an energy balance for the cutting process.
Keywords: Laser cutting, Laser cutting mechanism, Laser-material interaction, Oxidation dynamics, Oxygen purity, Mild steel, Stainless steel, Acrylic.
iii

LIST OF PAPERS
This dissertation consists on the following six papers:
I J. Powell, A. Ivarson, L. Ohlsson, C. Magnusson, "Energy Redistribution in Laser Cutting", Accepted for publication in Welding in the World 1992, to be published during 1993 (EW document No. IE 110-90).
I I A. Ivarson, J. Powell, C. Magnusson, "Laser Cutting of Steels; Analysis of the particles ejected during cutting", Welding in the World, Vol. 30, No 5/6, 1992, pp. 116-125.
I I I A. Ivarson, J. Powell, L. Ohlsson, C. Magnusson, "Optimisation of the Laser Cutting Process for Thin Section Stainless Steels", Conf. Proc. of Materials Processing Symposium, ICALEO'91, San Jose, 1991, LIA-Vol. 74, Laser Institute of America, pp. 211-220.
IV A. Ivarson, J. Powell, J. Kamalu, C. Magnusson, "The Oxidation Dynamics of Laser Cutting of Mild Steel and the Generation of Striations on the Cut Edge", Accepted for publication in Journal of Materials Processing Technology 1993.
V A. Ivarson, J. Powell, J. Kamalu, G. Brodén, C. Magnusson, "The Effects of Oxygen Purity in Laser Cutting Mild Steel; A theoretical and experimental investigation", Accepted for publication in Lasers in Engineering 1992 (to be published during 1993).
V I A. Ivarson, J. Powell, C. Magnusson, "Factors Affecting the Efficiency of Inert Gas Laser Cutting", Submitted for publication in Lasers in Engineering.
iv

CONTENTS
Page
Preface i
Abstract iii
List of papers iv
Contents v
Introduction 1
Paper I Energy Redistribution in Laser Cutting 31
Paper I I Laser Cutting of Steels; Analysis of the 57 particles ejected during cutting
Paper UI Optimisation of the Laser Cutting Process 87 for Thin Section Stainless Steels
Paper IV The Oxidation Dynamics of Laser Cutting of 103 Mild Steel and the Generation of Striations on the Cut Edge
Paper V The Effects of Oxygen Purity in Laser Cutting 125 Mild Steel; A theoretical and experimental investigation
Paper V I Factors Affecting the Efficiency of Inert Gas 149 Laser Cutting
v

Ivarson; Introduction
Introduction
i

I var son; Introduction
INTRODUCTION
General Notes
Over the past twenty years or so the technique of CO2 laser cutting has become a widely accepted industrial tool. The growth of this technology has been accelerated by the advantages of the process as compared to more traditional profiling methods. Some of these advantages include:
* Extremely fine detail can be profiled because laser cutting process produces a narrow cut (0.1 - 0.5 mm) with a very small minimum turning radius (~0.1 mm).
* Almost any material can be profiled e.g. steels, plastics, non-ferrous metals and ceramics.
* Computer control ensures that the process is very accurate and flexible (job changeover can be achieved in under 5 minutes).
* Tooling costs are minimal as the only requirement for a new job is a new C.N.C. program.
* Heat affected zones and thermal distortion are minimised as compared to other thermal profiling methods.
* Laser cutting is a non contact profiling method which means that flexible materials can be cut without distortion. Also jigging and clamping can be kept to a minimum.
* The cut edge is generally clean, dross free and ready for use immediately after cutting.
* Cutting speeds are high (e.g. 1000 W laser: 3 mm thick mild steel; 3 m/min, 5 mm thick acrylic; 12 m/min).
The commercial growth of the subject has been accompanied by a surprisingly small amount of technical and scientific research into the physical and chemical interactions which takes place inside the cut zone. Fundamental questions about these interactions remain unanswered which is not really surprising when it is appreciated that an understanding of the process involves a great many branches of physics and chemistry from heat transfer to oxidation dynamics.
This thesis is the result of a series of experimental and theoretical investigations into the nature of the cutting process. The main body of the work
3

Ivar son; Introduction
is divided up into six papers which follow this introduction. The introduction itself is divided into the following parts:
* General Notes
- Laser cutting
- Materials investigated
- Laser beam characteristics
* Introduction to the Papers
- Paper I : Energy Redistribution in Laser Cutting
- Paper LT: Laser Cutting of Steels; Analysis of the particles ejected during cutting
- Paper HI: Optimisation of the Laser Cutting Process for Thin Section Stainless Steels
- Paper TV: The Oxidation Dynamics of Laser Cutting of Mild Steel and the Generation of Striations on the Cut Edge
- Paper V: The Effects of Oxygen Purity in Laser Cutting Mild Steel; A theoretical and experimental investigation
- Paper V I : Factors Affecting the Efficiency of Inert Gas Laser Cutting
Laser cutting
Laser cutting belongs to the large family of material removing or machining processes. In this section I will describe in simple terms how the laser cutting process works. For the purpose of this discussion the laser can be simply considered to be a heating device (the laser beam is described in further detail in the following section on Laser beam characteristics).
When the laser beam strikes the workpiece it results in heating. Heating of any material results in either chemical or physical phase changes (e.g. oxidation or melting). The cutting mechanism for any material can be identified by the type of phase changes involved. I will now describe the three different cutting mechanisms which are investigated in this thesis.
4

Ivarson; Introduction
Two of them are physical phase changes:
1. Vaporisation
2. Melting
and one is a combination of physical and chemical phase changes:
3. Melting and oxidation
Vaporisation
In vaporisation cutting the material is removed from the cut zone as vapour. Vaporisation is achieved if the laser beam heats the workpiece to temperatures above its boiling point. The vapour generated is removed from the cut zone by a gas jet acting coaxially with the laser, see figure 1. Vaporisation cutting is usually achieved for materials with low vaporisation temperatures and heats of vaporisation. The polymer Polymethyl Methacrylate (e.g. plexiglass) is laser cut by vaporisation as the main material removal mechanism. The resulting cut edge is of extremely good quahty with optically clear, polished, cut edges.
Melt cutting
In melt cutting the material is melted at the erosion front and ejected from the cut zone by a gas jet, see figure 1.
Laser beam
Ejected material (vapour or melt)
Figure 1. A schematic of laser cutting.
5

Ivar son; Introduction
In the case of melt cutting an inert gas jet (e.g. nitrogen) is used. The material is melted by the laser beam and blown out of the cut zone by the gas jet. The result is a clean and non oxidised cut edge which for example, in the case of stainless steel, can be welded without any post machining process.
Melting combined with oxidation
In the melting and oxidation cutting process an active gas jet, such as oxygen, is used. In this case the gas jet has two effects: As well as the molten material being blown out of the cut zone by the gas jet, the exothermic reaction between the gas jet and the molten material serves as a significant energy source to the cutting process. This additional energy input helps to accelerate the cutting process.
Materials investigated
It is possible to laser cut almost any material. The physical and chemical properties of the material to be cut do however have an influence on the effectiveness of the process. Of these properties the most important are the reflectivity and the thermal conductivity. Reflectivity is the ratio of the power reflected from a surface to the power incident on to it. Materials with low reflectivity are easier to laser cut than materials with high reflectivity. Metals like copper and silver are highly reflective and are therefore more difficult to laser cut than mild steel which has, compared to copper, a low reflectivity. Although this is true, laser cutting benefits from the fact that the reflectivity of metals substantially decreases with increased temperature.
The thermal conductivity describes the heat flow in the material. Low conductivity materials, such as acrylic, can be cut to much greater thicknesses and at higher speeds due to the fact that the heat does not leave the cut zone as it does for high conductivity materials (e.g. copper).
As mentioned above, almost any material can be laser cut, but I will only discuss those which were investigated in this thesis: Mild steel, stainless steel and acrylic.
Mild steel
The most widespread use of laser cutting is the profiling of mild steel. The typical laser power used for this process is between 500 and 1500 W. Oxygen is used as the processing gas which implies that an oxidation re-
6

Ivar son; Introduction
action takes place and increases the overall energy input to the cut zone as discussed previously.
Laser cut mild steel has a high quahty cut edge as well as a narrow heat affected zone (HAZ). The cut kerf width during laser cutting of mild steel is generally between 0.1 and 0.5 mm depending on the material thickness and processing parameters. Cuts are free from adherent dross and are perpendicular to the face of the steel sheet.
Figure 2 shows the cutting speeds available at a laser power of 1200 W for various thicknesses of mild steel (using oxygen as the processing gas).
0 1 2 3 4 5 6 7 8 9 10 Material thickness, d (mm)
Figure 2. Cutting speed as a function of material thickness for mild steel.
Stainless steel
Stainless steel can either be laser cut with an inert gas (nitrogen) or with an active gas (oxygen). The cut edge quality is related to the choice of processing gas. I f an oxide free cut edge is wanted, inert gas should be used. The result gives a cut edge that could be welded directly after the laser cutting process, without any post machining operation. In the case of laser cutting with an inert gas as opposed to oxygen, the cutting speed is reduced as well as the maximum material thickness. This due to the fact that the laser is the only heat source, the cutting gas in this case only provides kinetic energy to the cutting process.
While using an active gas, such as oxygen, the cutting mechanism is similar to laser cutting of mild steel. The energy input to the cut zone is twofold: The energy from the laser beam and the released exothermic energy from the oxidation reaction. Figure 3 shows the cutting speed as a
7

Ivar son; Introduction
function of material thickness using either nitrogen or oxygen as the processing gas.
c E
• Stainless steel Laser power 900 W
• Oxygen (7 bar)
—•— Nitrogen (10 bar)
0,5 1 1,5 2 2,5 Material thickness, d (mm)
Figure 3. Cutting speed as a function of material thickness and processing gas.
Acrylic
Acrylic is a transparent polymer with a low thermal conductivity as well as low reflectivity at the CO2 laser wavelength. These properties combined with its low sublimation temperature mean that acrylic is readily profiled by high intensity CO2 laser beams [1].
Acrylic is one of the most commonly laser cut materials in the industry. AU types of display and sign work are cut by laser rather than mechanical methods. The main reason for this is that the cut edge has a high quality polished edge, fme details can be produced and the cutting speed is very high (e.g. 10 m/min for 3 mm thick acrylic at a laser power of 400 W).
Laser beam characteristics
The question why one should use laser light for cutting instead of light from a traditional light source is relevant. The answer is that the laser light can be focused much more effectively than more traditionally generated light. White light from a light bulb is in fact a combination of many colours (or wavelengths). I f this light is focused by a lens the differing colours wil l be bent by differing amounts and focused to different positions, see figure 4a. Another feature of traditional light sources is that the light is non-parallel. I f non-parallel light is focused by a lens the so called focal point will be spread out, see figure 4b. Light
8

Ivar son; Introduction
from a CO2 laser is monochromatic, which means that it has only one colour (or wavelength). Further, laser light is parallel in nature. It is these two properties which allow laser light to be focused down to a small spot with a very high energy density, see figure 4c.
Focusing multiwavelength light produces a range of focus positions.
Non-parallel light also focuses over a range of positions.
Parallel, single wavelength laser light can be focused down to a small diameter, high intensity spot.
Figure 4. A comparison between the focusing of laser light and white light from other sources [2].
The discussion how a CO2 laser operates would be out of place in this thesis, but the following can be mentioned. The lasing medium in a CO2 laser is a combination of the gases carbon dioxide, nitrogen and helium. In simple terms it is possible to say that a CO2 laser employs electrical energy in the form of a glow discharge to excite CO2 molecules which then release energy in the form of photons at a wavelength of 10.6 micron in the infrared region of the electromagnetic spectrum [2-5].
The beam emitted from typical CO2 industrial lasers can have powers from a few watts up to 15-20 kW [6] with beam diameters of the order of 5 to 50 mm, which is called the "raw" beam. The "raw" beam is guided towards the workpiece by the use of high reflectivity mirrors [7] (polished copper or molybdenum mirrors) and focused onto the work-piece by a lens. The lens used for CO2 laser cutting is either made of GaAs or ZnSe [8-10]. The lens focuses the "raw" beam to a spot diameter of between 0.15 mm and 0.5 mm. This results in very high energy densities of typically 10 1 0 W/m 2 . At this level of energy intensity most materials can be thermally damaged to produce a cut.
9

Ivar son; Introduction
Introduction to the Papers
In this section I will introduce the papers which make up the remainder of the thesis. The six papers are:
Paper I : Energy Redistribution in Laser Cutting.
Paper I I : Laser Cutting of Steels; Analysis of the particles ejected during cutting.
Paper HI: Optimisation of the Laser Cutting Process for Thin Section Stainless Steels.
Paper IV: The Oxidation Dynamics of Laser Cutting of Mild Steel and the Generation of Striations on the Cut Edge.
Paper V: The Effects of Oxygen Purity in Laser Cutting Mild Steel; A theoretical and experimental investigation.
Paper VI : Factors Affecting the Efficiency of Inert Gas Laser Cutting.
At this stage the papers will be discussed in a purely conversational manner. The papers themselves can be found later in the thesis.
10

Ivar son; Introduction
Paper I: Energy redistribution in laser cutting
During laser cutting a dynamic equilibrium exists in the cut zone which balances the "incoming" energy and material with the "outgoing" energy and material. In paper I two experimental programs are described, one which examines the phenomenon of reflection of the laser beam in the cut zone, the other establishes the variation of conductive losses from the cut zone as a function of material thickness.
Reflection and transmission
The intention of this experiment was to investigate the reflection and transmission of the laser beam in the cut zone. Figure 5 shows the basic experimental arrangement. Acrylic sheet of a variety of thicknesses were cut at a constant cutting speed and laser power. Any surplus beam which has emitted from the bottom of the cut zone was collected on an acrylic block and thus evaporated a "beam print" in that block.
Laser beam
Cutting direction
Laser cutting head
< Nitrogen
Workpiece l l l l f ^ T Cut
Surplus beam (primary losses)
Beam print
Acrylic block
Figure 5. A schematic of the experimental arrangement for the reflectivity investigation.
It is clear from the experiments and calculations in paper I that any laser energy which was not consumed during the cutting process was emitted from the bottom of the cut zone and was then absorbed by the acrylic block to produce a mode print.
11

I var son; Introduction
These mode prints gave us a very interesting insight into the nature of the reflection and absorption in the cut zone. Almost all of the mode prints showed strong evidence of interference fringes. I f two beams of light of the same wavelength arrive in the same area by different paths they will give rise to alternating zones of constructive and destructive interference (figure 5, paper I). Knowing the distance between the fringes it is possible to calculate the angle of inclination (0°) between the two beams. From this the inclination of the cut front can be calculated. The two beams in our case are the "transmitted" portion of the beam which passed straight through the cut zone and the portion of the beam which was reflected off the cut zone.
The nature of the experiment carried out meant that we were initially observing reflections from the top of the cut zone in the absence of the underlying material. Calculations and measurements were carried out concerning the inclination of the cut front when cutting thicker sections. These showed that the portion of the beam reflected off the top of the cut zone could re-impinge on the lower part of the cut front (figure 9, paper / ) •
This experiment showed that single and multiple reflections can and do take place within the cut zone. Multiple reflection and absorption towards the bottom of cuts can result in a decrease in cut edge quality particularly in the case of acrylic sheet.
Conductive energy losses from the cut zone
It was decided in this experimental programme to investigate the level of thermal loss from the cut zone by conduction during laser-oxygen cutting of steels. Although heat is lost from the cut zone by reflection, radiation, convection and conduction it is the conductive losses which are of greatest importance when cutting metals.
Conductive losses can be measured by laser cutting any shape and then measuring the heat absorbed by the shape during cutting. As laser cutting is a dynamic process it is appropriate to express the conducted loss from the cut zone in terms of watts. The conductive loss measured as a function of material thickness are given in figure 6 (cutting parameters, see table 2, paper I).
12

I var son; Introduction
T
Mild steel (A)
Stainless steel (B)
A/d
B/d
' I 1 1 " I " " I " " I 1
1 2 3 4 5 6 Material thickness, d (mm)
Figure 6. The variation of conductive losses with material thickness for mild and stainless steels.
It is clear from figure 6 that as the material thickness increases the number of watts lost by conduction from the cut front increases in an approximately linear manner. This is in accordance with the theoretical arguments in paper I. The surprising feature of figure 6 is the actual values of the power loss from the cut zone. The laser power used during this experiment was 800 W but the thermal loss by conduction exceeds this value rather than being a proportion of it.
The answer to this energetic inputroutput imbalance lies in the role of oxygen in the cutting process. Oxygen combines with the elements in mild and stainless steel and at the same time releases substantial amounts of heat:
e.g. xFe + yO -> FexOy + Heat
As shown in figure 6 the number of watts leaving the cut zone increases with increased material thickness even though the power of the laser remained constant at 800 W. As a result of this it is clear that the ratio of laser power to oxidation reaction power decreases with increasing material thickness. This increase in power comes from an increase in the rate of the oxidation reaction. It is shown that this increase is related to an increase in the size of the cut front and therefore the oxygen-melt interaction area. This argument is backed up by the lines A/d and B/d in figure 6. The fact that the stainless steel line, B/d, is almost horizontal implies that the energetic conditions at the cut front are uniform whatever the
13

I var son; Introduction
thickness of material cut, i.e. the oxidation rate is proportional to the surface area of the cut front.
The diminution in the value A/d with increasing material thickness implies that the average temperature in the cut zone decreases with increasing material thickness when cutting mild steel. This cut front cooling is probably the result of a reduction in, or contamination of, the oxygen supply to the lower parts of the cut front [11].
This experiment showed that the laser energy and oxidation reaction energy always combine to produce a cut in oxygen assisted cutting of steels. The oxidation reaction becomes a progressively larger contribution to the cutting process as the material thickness is increased. The rate of the oxidation process is proportional to the surface area of the cut zone. Even though the oxidation energy input to the cut zone is increased with material thickness, the overall cutting process efficiency is decreased. This is the result of a disproportionate rise in thermal conductivity losses from the cut zone.
14

Ivarson; Introduction
Paper II: Laser cutting of steels; Analysis of the particles ejected during cutting
As mentioned earlier in this thesis the oxidation reaction during laser-oxygen cutting generates a great deal of energy. Paper II gives the results of a detailed examination of the particles ejected from the cut zone during laser cutting of mild and stainless steel. Particles ejected from the cut zone were collected and analysed to establish their chemical and physical characteristics.
The results from this extensive analysis have enabled the authors to estimate the heat generated by the oxidation process during cutting of both mild and stainless steels. In addition to this it has been possible to postulate oxidation histories for the particles.
Particles
For the purpose of this experimental programme the particles were collected in an non oxidising liquid quenchant as close to the bottom of the cut zone as possible, see figure 7.
Movement at
cutting speed, v
Laser cutting head
Cut edge
Ejected molten '.oxidised particles
Glycol-water mixture
Figure 7. A schematic of the experimental arrangement for the particle collection.
The use of a quenchant was necessary in order to freeze the particles in their ejected condition. Once the particles had been collected they were thoroughly examined chemically and physically. From these examinations it has been possible to establish the level of oxidation experienced by the steel during cutting. From this result it is possible to clarify the role of the oxidation reaction in the cutting process. In addition to this important result it has been possible to identify an oxidation history for the particles.
15

Ivar son; Introduction
This oxidation history reveals aspects of the oxidation reaction which can be used to further clarify the overall cutting mechanism.
The experimental results established that during laser cutting of mild steel approximately half the iron which leaves the cut zone is oxidised to FeO. From this an estimate of the energy released by this exothermic reaction can be made. This energy assists the cutting process and acts in conjunction with the laser beam to produce a cut line.
The average heat of oxidation, over the range of thicknesses (1-4 mm), was calculated to -580 W. This power can be added to the 900 W of the laser itself and the sum is the power input to the cutting process. The result, shown in paper II, indicate that the oxidation process contributes approximately 40% of the energy input to the cut zone and the laser provides the remaining 60%.
The oxidation of stainless steel during cutting is more complex than the mild steel case because the reaction involves the formation of three oxides (Fe203, Cr2Ü3 and NiO). The formation of the three oxides generates a great deal more heat than the simple oxidation of iron to FeO.
As a general approximation it can be taken that during laser cutting of stainless steel approximately 30% of the iron which leaves the cut zone is oxidised to Fe2Ö3 and approximately 30% of the chromium which leaves the cut zone is oxidised to Cr203 (NiO formation is negligible). From this an estimate of the energy released by the exothermic reactions can be made, and as for mild steel this energy assists the cutting process and acts in conjunction with the laser beam.
In the stainless steel case, the average heat of oxidation over the range of thicknesses investigated was calculated to ~610 W which can be added to the 900 W of the laser itself, i.e. as for mild steel the oxidation process contributes approximately 40% of the energy input to the cut zone and the laser provides the remaining 60%.
Optical microscopy examination of the particles, both for the mild steel case and the stainless steel case, showed a range of oxidation levels (see paper II). In the case of "mild steel" particles it was possible to identify five distinct oxidation stages. For the "stainless steel" particles it was possible to identify four stages. These particle types ranged from fully oxidised particles to an oxide shell surrounding a central metallic core.
16

I var son; Introduction
Paper III: Optimisation of the laser cutting process for thin section stainless steels
Industrial laser cutting is carried out with the laser in its continuous wave (c.w.) mode or in its pulsed mode. Paper III presents the results of an experimental programme investigating the effects of using a pulsed laser for laser-oxygen cutting of thin section stainless steels. It was discovered that if the pulsed conditions are optimised, the maximum cutting speed for a set average laser power could be increased by up to 15%.
In this case the optimum gas pressure for any laser-material combination is a complex parameter dependant upon the geometry of the cutting nozzle and the cut front [12]. The optimum gas pressure was 4.5 bar for the 1.0 mm thick material and 9.0 bar for the 2.0 mm thick material. These two pressures gave the highest rehable cutting speeds (13.0 m/min for 1.0 mm and 6.0 m/min for 2.0 mm) together with good cut quality.
During the pulsed laser cutting experimental programme the optimum pulse settings for maximum cutting speed were established. A wide range of pulse frequencies and pulse lengths were investigated for both thicknesses of material.
Paper III demonstrates that there is an optimum pulse frequency as well as pulse length for high speed cutting. For 1.0 mm thick stainless steel the maximum cutting speed possible (15 m/min) was achieved at a laser pulse length of 1.1 ms (which represents a mark:space ratio of 2:1) and a pulse frequency of 600 Hz. The two millimetre material gave complementary results. The best pulsed conditions for the 2.0 mm material were; pulse frequency=300 Hz, pulse length=1.67 ms. The maximum cutting speed possible was 6.3 m/min.
When the pulse frequency is optimised each pulse effectively drills a hole through the material and these overlapping holes form the cut line. For pulsed laser cutting there is also an optimum pulse length. At pulse lengths below the optimum value the cutting speed is reduced as a result of inter pulse cooling of the cut zone. Using pulse lengths greater than the optimum the maximum cutting speed possible falls off rapidly due to the fact that the pulsing acts as periodic fluctuations in a continuous beam rather than individual pulses (paper III, figure 7). It is the sharp spike of the pulse which accelerates the material removal process and therefore improves cutting speeds.
During c.w. laser cutting of stainless steel with oxygen the material removal process is one of continuous oxidation-melting and ejection. High speed pulsed laser cutting changes the material removal mechanism from melting-oxidation-ejection steady state, to a periodic explosive ejection of
17

Ivar son; Introduction
material from the top part of the cut. The mechanical energy of this localised explosion assists the expulsion of liquid material lower down the cut face and thus increases cutting speed.
Although paper III shows that pulsed laser cutting improves cutting speeds for thin section stainless steels the principle is not necessarily effective for thicker grades. The reasons for this reduction in effectiveness is that there must be a certain balance between the volume of material vaporised (~20-30%) by each pulse and the total amount of liquid which needs to be expelled from the cut zone. Vaporising 20-30% of a 5 mm thick section would involve very high energy pulses which are difficult to generate at the frequencies required for high speed cutting. Further, vaporisation of metals is less energy efficient than the melting-oxidation process. As thicker sections are cut by the pulsed laser technique the amount of material needed to be vaporised grows considerably. As more of the energy is consumed by the vaporisation process less is available for general melting of the cut zone material. This will have the effect of making the cutting process less efficient.
In spite of these arguments it is possible that multikilowatt pulsed lasers could have their performance improved by adapting the techniques presented in paper III for thicker section stainless steel.
18

Ivar son; Introduction
Paper IV: The oxidation dynamics of laser cutting of mild steel and the generation of striations on the cut edge
Paper IV concentrates on the phenomena which give rise to a cychc cutting event when a CO2 laser in conjunction with an oxygen jet is used to cut mild steel. The nature of the cut edge striation produced by the cyclic oxidation reaction is thoroughly explained and a possible oxidation cycle is postulated.
Direct observation of any laser-oxygen cut mild steel edge reveals that a regularly spaced pattern of striations exist as shown in figure 8.
Cutting direction
Figure 8. A typical cut edge generated in thin section (1.25 mm) mild steel cut by a CO2 laser in conjunction with an oxygen jet.
Work done by Arata, Miyamoto et al. [13] describes an ignition-extinction cycle which is the most widely accepted argument for the generation of striations. Although no clear explanation has ever been given for the extinction event. The aim of paper PV was to discuss the variations influences and phenomena which can extinguish the burning event initiated by the laser-oxygen combination.
The information provided in statements 1-7 in paper W suggests that the primary formation mechanism of striations is not one of the following:
a) Resolidification process b) Gas dynamics c) Melt burning d) Optical effects e) Time based fluctuations of power etc.
19

I var son; Introduction
The most likely sources of the formation mechanism are therefore:
a) Chemical thermodynamics in the iron-oxygen system
and
b) Viscosity and surface tension effects associated with the melt removal
Figure 9 shows what the basic situation is in the cut zone at any time.
Liquid Cutting direction
\ \ \ \ \ \ \ \ * * * • • • / , \ \ \ \ \ \ \ \
\ v W " \ \ \
vVFe + a \ \ \FeOvv \ \ \ \ \ \ \ \
\ \ \ \ \ \
•:Feo: /+P2; •::02
Figure 9. A schematic of the basic chemical situation in the cut zone.
The laser and oxygen jet (to the right in figure 9) heat and oxidise the material generating a chemical gradient within the melt from fully oxidised iron (FeO) on the outside surface to unoxidised iron on the inside near the hquid-sohd interface.
The primary cause of the fluctuations which generate the striations can be found by analysis of the oxidation dynamics of the cycle described by Arata, Miyamoto et al. [13]. Analysis of the oxygen transport phenomena needed to sustain this reaction can explain the more complex extinction part of the cycle in the following way:
In the absence of a chemical reaction the concentration of oxygen at a distance x from interface 4, figure 9, could be expressed as:
dC 7 r D — ^ ch. v
(1)
where: C = Oxygen concentration t = Time x = Distance
D = Diffusion coefficient
20

I var son; Introduction
When a chemical reaction is involved however, the curve of the concentration gradient changes as the reaction consumes a portion of the gas and gas transportation is thereby slowed down.
At interface 3, in figure 9, the chemical constitution of the melt is FeO with surplus oxygen to the right and surplus iron towards the left. Oxygen crossing this interface from right to left will have its progress impeded as it is consumed by reaction with the iron. This oxygen consumption gives rise to a much steeper gradient between interface 3 and 2 determined by a variant of equation (2) which can be expressed as foUows:
where F(C) accounts for the slowing of gas transport as a result of the consumption of the oxygen by reaction with iron.
This discussion (fuUy explained in paper IV) proposes a reaction front situated at interface 3. The movement of such a reaction front during the burning process which generates one striation can be drawn schematicaUy together with the changes in oxygen gradient, see figure 13 in paper IV.
The driving force behind the oxidation reaction is the Gibbs free energy which is related to the oxygen partial pressure. When the oxygen partial pressure faUs below a specific critical value for a given temperature the oxidation reaction wiU terminate.
Although the above argument helps to explain the ignition-burning-extinction cycle it does not elaborate on reasons behind the physical removal of material from the cut zone.
It is explained in paper PV that the effectiveness of the removal mechanism increases dramaticaUy during the burning part of the cycle as the result of a number of super imposed effects: a) The viscosity of the melt decreases as the reaction progresses, b) the surface tension of the melt decreases as the reaction progresses and c) the volume of liquid to be removed increases as the reaction progresses.
These three effects combined with the oxygen gradient theory put forward earlier are shown (in paper PV) to be the most probable source of striation generation.
(2)
21

Ivar son; Introduction
Paper V: The effects of oxygen purity in laser cutting mild steel; A theoretical and experimental investigation
Paper V in this thesis presents an experimental and theoretical investigation into the sensitivity of the laser-oxygen cutting process to impurities in the oxygen supply. As mentioned in papers I&II, the use of oxygen as a cutting gas when profiling mild steels has two important effects in the cut zone: 1) Paper II showed that the heat generated by the oxidation of iron contributes approximately half of the energy input to the cut zone. 2) The molten oxides produced in the cut zone do not adhere well to the surrounding solid steel and therefore a clean cut edge is generated {paper IV).
It is shown in paper V that the laser-oxygen process used for cutting mild steel is extremely sensitive to small amounts of contamination in the oxygen supply. Experimental work, figure 10, shows that cutting with a 2% impurity level in the oxygen can reduce the cutting speed by more than 50%.
100 99 98 97 96 95 94 93 92 91 90 Oxygen purity (%)
Figure 10. Cutting speed as a function of oxygen purity for 2.0 mm thick mild steel.
It is clear from this graph that the cutting process is dramatically suppressed as the contamination level rises to 10%. An impurity level of only 2% halves the optimum cutting speed, an effect which cannot be explained by a simple dilution argument.
22
Ivar son; Introduction
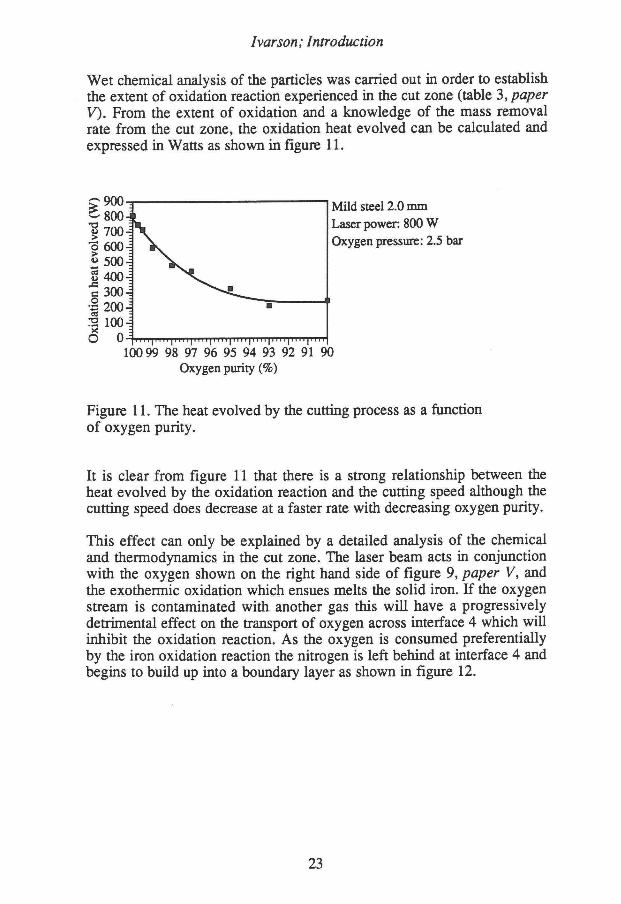
Wet chemical analysis of the particles was carried out in order to establish the extent of oxidation reaction experienced in the cut zone (table 3, paper V). From the extent of oxidation and a knowledge of the mass removal rate from the cut zone, the oxidation heat evolved can be calculated and expressed in Watts as shown in figure 11.
100 99 98 97 96 95 94 93 92 91 90 Oxygen purity (%)
Figure 11. The heat evolved by the cutting process as a function of oxygen purity.
It is clear from figure 11 that there is a strong relationship between the heat evolved by the oxidation reaction and the cutting speed although the cutting speed does decrease at a faster rate with decreasing oxygen purity.
This effect can only be explained by a detailed analysis of the chemical and thermodynamics in the cut zone. The laser beam acts in conjunction with the oxygen shown on the right hand side of figure 9, paper V, and the exothermic oxidation which ensues melts the solid iron. I f the oxygen stream is contaminated with another gas this will have a progressively detrimental effect on the transport of oxygen across interface 4 which will inhibit the oxidation reaction. As the oxygen is consumed preferentially by the iron oxidation reaction the nitrogen is left behind at interface 4 and begins to build up into a boundary layer as shown in figure 12.
C 900-g ^800h I 7004 I 600-1 « 500-i S 400-1 b 300-1
i 2 0 ° - -S 1004 o o^
Mild steel 2.0 mm Laser power: 800 W Oxygen pressure: 2.5 bar
23

Ivar son; Introduction
Fe+ FeO I 0 2
FeO +O2 I B (liq) (liq) j l ; (gas)
1 1 •
1 I I I 1 I I I
99.7%
0%
gradient
Figure 12. A schematic showing the build up of a barrier layer of nitrogen at the gas-liquid interface in the cut zone.
This boundary layer has a thickness 8 and has a direct effect on the diffusion rate of the oxygen into the iron which can be expressed as follows:
where j 0 2 = Diffusion rate of 0 2
D 0 j = Diffusion coefficient
Po2 = The partial pressure of 0 2 in the bulk gas
S = The boundary layer thickness
An increase in the boundary layer thickness decreases the oxygen diffusion rate which will have a direct effect on the oxidation reaction rate and therefore the heat supplied to the cut zone by the reaction. Considering equation (3) it is clear that a corruption of the oxygen supply to the cut zone will affect the partial pressure of the oxygen, p'o2, in the bulk gas.
24

Ivarson; Introduction
The deterrnination of actual values for d in the case of laser cutting would be extremely difficult but it is quite a simple matter to establish the tendency of 8 to rise rapidly if the oxygen cutting jet is contaminated.
The thickness of the barrier layer is determined by the volume of nitrogen left behind at the gas-liquid interface as the oxygen is consumed by the oxidation reaction. Calculations and statements in paper V imply that the cutting speed will be inversely proportional to the "nitrogen accumulation rate", which is confirmed by figure 13. It is clear that the curve follows the same basic shape as that for cutting speed.
140000 -120000
100000 80000
60000 -j
— 40000 -j
§20000
< o —
|= ~ 100 99 98 97 96 95 94 93 92 91 90 Oxygen purity (%)
Figure 13. The relationship between the reciprocal of the nitrogen accumulation rate and the oxygen purity.
The actual accumulation rates of nitrogen at the cut front will be lower than those shown in table 5, paper V, because the cut front is mobile and surrounded by a fast flowing gas jet. However, the trend of the accumulation rate to rise rapidly with the contamination level will remain true and is clearly the factor which is largely responsible for the sharp decrease in cutting speed.
25

Ivar son; Introduction
Paper VI: Factors affecting the efficiency of inert gas laser cutting
Inert gas laser cutting is a method of profiling materials by using a focused laser beam in conjunction with an inert gas jet. An energy balance which describes the equilibrium set up in the cutting zone during inert gas cutting is presented and analysed in paper VI. The analysis involves an experimental and theoretical examination of the individual components of the equation.
The energy balance can be expressed as follows:
Energy supphed to the cut zone = Energy used in generating a cut + Energy losses from the cut zone (by conduction, radiation etc.)
or as a simple formula, see equation (1), paper VI.
The work in paper VI concentrates on the various components of this equation, taking them one at a time and estimating their influence on the energy balance as a whole.
The energy inputs to the cut front are twofold in the case of high pressure inert gas laser cutting. The primary energy source is the laser itself which has a typical power of between 500 and 1500 Watts. After the primary losses are taken into account (see next paragraph) the total absorbed power will be of the order of 90% of the original value. The power of the gas jet can be calculated from standard gas formula if the geometry of the cutting nozzle and the cut zone are known as well as the gas pressure and type. The kinetic power of the gas jet entering the kerf can be calculated to give a figure of between 10 and 25 W.
Primary losses are divided into two: Reflected and transmitted light. These losses are difficult to estimate theoretically but can be measured experimentaUy (see figure 3&4, paper VI). The experiment showed that the order of magnitude of these primary losses for inert gas laser cutting is in the region of 10% (i.e. -100 W) of the original power of the laser beam which, as mentioned earlier, implies that approximately 90% is absorbed in the cut zone.
26

Ivar son; Introduction
It is possible to theoretically calculate the amount of power needed to produce a cut, Pcut- The value of P C M is dependent on the average temperature of the melt and the amount of vaporisation taking place during cutting. Experimental evidence suggests that the level of vaporisation is considerably less than 10% which leaves approximately 400 W to produce a cut.
Calorimetry can be used to measure the conductive losses from the cut zone. The results of such an experiment are presented in figure 14.
iPower: 900 W Gas: Nitrogen Nozzle pressure: 10 bar
• Conductive losses
Conductive losses '' • divided by material
thickness, d
1 1,5 2 2,5 3 Material thickness, d (mm)
Figure 14. Conductive losses as a function of material thickness for sample A-E (table I, paper VI).
The solid line in figure 14 shows that the conducted losses associated with inert gas laser cutting of stainless steels is in the region of 40-50% of the input power.
The broken line in figure 14 gives values of the conductive losses divided by the material thickness. The value of the dotted line decreases with increasing material thickness, which means that the thermal losses per unit cut front area decreases with increasing workpiece thickness. This is a strong evidence that the thermal gradient around the cut front has changed as a result of a reduction in the cut front temperature when cutting thicker sections.
It is possible to determine the level of radiation from a hot body by using Stefan-Boltzmann equation. In paper VI the maximum radiative heat loss possible is calculated as being approximately 10 W. It is clear therefore, that radiative heat loss from the cut zone is a minor contributor to the energy balance.
27

Ivar son; Introduction
The incident gas jet acting on the cut zone has one effect which aids the cutting process and another which acts as a thermal loss. The positive action is that of physical removal of molten material from the cut zone. This is combined with the secondary thermal loss of forced convective cooling.
The thermal loss by convection from any hot material to its surroundings can be described by the following equation:
Q = h A ( T w - T 0 J (4)
where; Q = Thermal loss by convection A = Surface area of hot zone h = Convection heat transfer coefficient
T w = Temperature of hot zone T» = Temperature of incident gas
Although equation (4) is very simple it involves one extremely complicated factor, which is the convection heat transfer coefficient, h. Vicanek and Simon [14] studied the momentum and heat transfer of an inert gas jet to the melt in laser cutting and developed an equation describing thermal loss by convection. By using Vicanek and Simon's equation the maximum convective losses are calculated as 19 W. This is a trivial level of loss compared to the incident laser power.
Finally, the energy balance can be expressed semi quantitatively for inert gas cutting of stainless steel from the information above:
Laser - Primary + Gas = Cutting + Conducted + Convective + Radiative power losses power power losses losses losses
-110% - -10% + -1% = -50% + -50% + -2% + -1%
This generalised view of the energy balance is a useful estimation of the importance of the various components of equation (1), paper VI, at moderate gas supply pressures (i.e. up to -14 bar in this case). It is clear, for example, that a change in thermal conductivity of the workpiece would have a far greater effect on the cutting speed than a similar change in cut front reflectivity.
28

I var son; Introduction
REFERENCES
1. Miyamoto, I . , Maruo, H., Arata, Y. Intensity Profile Measurement of Focused CO2 Beam Using PMMA", Conf. Proc. of Materials Processing Symposium, ICALEO'84, Boston, 1984, LIA-Vol. 44, Lasers Institute of America, pp. 313-320.
2. Powell, J . CO2 Laser Cutting (1993), Springer-Verlag London Ltd. (Publ.), ISBN 3-540-19786-9.
3. Chryssolouris, G. Laser Machining; Theory and practice (1991), Springer-Verlag New York (Publ.), ISBN 0-387-97498-9.
4. Steen, W. Laser Materials Processing (1991), Springer-Verlag London Ltd. (Publ.), ISBN 3-540-19670-6.
5. Das, P. Lasers and Optical Engineering (1991), Springer-Verlag New York Inc. (Publ.), ISBN 0-387-97108-4.
6. Luxon, J . T., Parker, D. E . Industrial Lasers and their Applications (1992), Prentice-Hall Inc. Englewood Cliffs (Publ.), ISBN 0-13-459538-6.
7. Petschke, U., Kramer, R., Wolff, U., Beyer, E . "Linkage of Laser and Handling Systems in Multistation Operation", Conf. Proc. Beam Diagnostics and Beam Handling Systems, ECO 1, 21-22 September, 1988, Hamburg, FRG, pp. 95-102.
8. Duley, W. W. Laser Processing and Analysis of Materials (1983), Plenum Press (Publ.), New York, ISBN 0-306-41067-2.
9. Reedy, H. E . , Herrit, G. L . "Comparison of GaAs and ZnSe for High Power CO2 Laser Optics", Conf. Proc. High Power CO2 Laser Systems and Applications, ECO 1,19-20 September, 1988, Hamburg, FRG, pp. 180-191.
10. Laser Materials Processing (1983), Bass, M. (Ed.), North-Holland Publishing Company (Publ.), Amsterdam, ISBN 0-444-86396-6.
29

Ivar son; Introduction
11. O'Niell, W., Gabzdyl, J.T., Steen, W.M. "The Dynamical Behaviour of Gas Jets in Laser Cutting", Proc. ICALEO'92, Orlando, USA, 25-29 October 1992.
12. Fieret, J . , Terry, M.J., Ward, B.A. "Aerodynamic Interactions During Laser Cutting", Proc. of SPIE 1986 Int. Symposium on Optical and Opto-Electronic Applied Science and Engineering, Québec City, Canada, 3-6 June 1986, pp. 53-62.
13. Arata, Y. , Maruo, H., Miyamoto, L , Takeuchi, S. "Dynamic Behaviour in Laser Cutting of Mild Steel", Trans, of the Japan Welding Research Institute, Vol. 8, No. 2 (1979), pp. 15-26.
14. Vicanek, M., Simon, G. "Momentum and Heat Transfer of an Inert Gas Jet to the Melt in Laser Cutting", J. of Physics D: Apphed Physics, 20 (1987), pp. 1191-1196.
30

Ivarson; Paper I
Paper I
Energy Redistribution in Laser Cutting
31

Ivarson; Paper I
Energy Redistribution in Laser Cutting
J. Powell*"1", A. Ivarson*, L. Ohlsson* and C. Magnusson*
* Luleå University of Technology Division of Materials Processing
S-951 87 Luleå,Sweden
+ Laser Expertise Ltd. Harrimans Lane, Dunkirk
Nottingham NG7 2TR, U.K.
ABSTRACT
This paper begins by describing laser cutting in terms of a simple energy balance. The various components of the equation are then described and investigated, particularly the thermal losses from the cut zone.
Two experimental programs are described, one of which examines the phenomenon of reflection of the laser beam in the cut zone, the other establishes the variation of conductive losses as a function of material thickness.
INTRODUCTION
During laser cutting a dynamic equilibrium exists in the cut zone which balances the "incoming" energy and material with the "outgoing" energy and material.
Inputs to the cut zone are usually only:
a) The laser energy
and,
b) The pressurised cutting gas jet (which may or may not be chemically reactive with the workpiece).
33

Ivarson; Paper I
Outputs from the cut zone are more numerous and complex in nature:
a) Sohd, liquid or gaseous material created in the cut zone and ejected to produce the cut.
b) The exhaust of the pressurised cutting gas jet. (Which may or may not have undergone chemical reaction with the workpiece e.g. xFe + yO —» FexOy in the case of mild steel cutting).
c) Energy in the following forms:
1. Conducted heat 2. Reflected laser light 3. Radiated light 4. Convected heat 5. Transmitted laser hght. (In this case transmitted does not
necessarily imply that the hght has passed through the material being cut - a small proportion of hght will pass direct through the cut zone without interacting with the cut front at all).
A simple energy balance for laser cutting can be expressed as:
Energy supphed to the cut zone = Energy used in generating a cut + Energy losses from the cut zone (by conduction, radiation etc.)
The word losses is used here to describe energy which does not contribute to the removal of material from the cut zone.
It is the aim of this paper to analyse various aspects of this energy balance paying particular attention to thermal losses from the cut zone. It can be shown by a simple theoretical analysis and experimental programme that the proportion of energy lost from the cut zone decreases with increasing cutting speed. This means that the efficiency of the cutting process increases with increasing cutting speed, a phenomenon which has profound effect on cutting speeds and on the maximum thickness any material which can be cut by a particular laser.
34

Ivarson; Paper I
THEORETICAL ANALYSIS
A Simple Energy Balance for Laser Cutting
The earlier statement:
Energy supplied to the cut zone = Energy used in generating a cut + Energy losses from the cut zone,
can be expressed by the following formula:
(P-b)t[(100-rf)/100] = E c u tldk + (tudk/2)(A+B+C) (1)
Considering a laser power P cutting a hne of length 1 in a time t.
where;
b= laser power transmitted through the cut zone without interaction with the cut front.
rf= the reflectivity of the cut zone expressed as a percentage. (N.B. 100-rf= absorbtivity as a percentage).
E c ut= specific energy needed to melt and remove one unit volume of material from the cut zone.
d= material thickness.
k= kerf width.
A= conductive loss function (power per unit area).
B= radiative loss function (power per unit area).
C= convective loss function (power per unit area).
It will be noticed that the reflective and transmitted losses from the cut zone are dealt within the left hand side of the equation whereas the conductive, convective and radiative losses are included in the right hand side.
The logic behind this approach is the consideration that the losses from the cut zone can be divided into two types, primary and secondary.
35

Ivarson; Paper I
Primary losses are those which leave the cut zone as they entered, as 10.6 urn radiation. These include only transmitted and reflected laser light.
Secondary losses are those which leave the cut zone after thermal transformation of some kind. These include the conducted, convected and radiated losses. (The broad spectrum of radiated hght may include a small proportion of 10.6 urn hght but this did not originally emanate from the laser and is therefore part of the secondary losses).
The secondary losses are a function of the temperature of the cutting front and its surface area in contact with the surroundings. The conductive losses are made from the convex face in contact with the substrate and the convective and radiative losses are made from the concave face exposed to the surrounding atmosphere as shown in figure 1. This schematic takes the simplified view that the cut front is the shape of half a thin walled tube which has been bisected along its length.
C E
Figure 1. A schematic of the simplified geometry of the cutting front.
Other points and simplified assumptions in equation (1) which may need some clarification are:
b: During cutting it is often the case that the trailing edge of the cut front does not extend to the full diameter of the incident laser beam. A proportion of the available hght therefore passes straight through the kerf without interacting with the cut front (transmitted losses).
rf: The reflectivity of the cut zone will be much less than the figures quoted for solid materials at ambient temperature. The cut zone has a higher absorptivity as a result of: its high temperature, the presence of absorptive oxides, its shaUow angle of incidence to the laser beam, its roughness and its absorptive layer of vapour.
36

Ivarson; Paper I
E c u t : As a first approximation the specific energy of cutting can be assumed to be a constant for any given material. Cuts in any chosen material have a similar appearance and can therefore be said to be cut by similar mechanisms. For the same reason the average temperature of the cutting front wih be assumed to be constant for a given material.
ldk: The volume of material removed to generate a cut of length 1 and width k in a material of thickness d. In the interest of simplification the kerf width is assumed to be constant.
7tdk/2: The surface area of the cutting zone, see figure 1. This is a great simplification as the cut zone is generally curved and inclined in nature. However, the shape described in figure 1 is a reasonable first approximation for our largely qualitative discussion.
A: In the interest of clarity, the conductive loss per unit area of cutting front wül be assumed to be constant for a given material.
B and C: Assuming a set average temperature of cutting front for a particular material, the convective and radiative losses per unit time can be assumed to be approximately proportional to the surface area of that front.
Discussion
The most interesting feature of equation (1) is that the energy used in cutting (E c u tldk) is independent of the time taken to carry out the cut. The losses however are proportion to the time taken. From this point it is clear that the proportion of "useful" to "wasted" energy wih change if the cutting speed is changed in order to cut material of a different thickness.
If the proportion of wasted energy is increased with decreasing cutting speed then the process will become less efficient if the process has to be slowed to cut thicker material.
To illustrate this point let us investigate what happens to equation (1) i f the cutting speed is changed as a result of decreasing the material thickness.
37

Ivar son; Paper I
The effect of decreasing the material thickness on cutting speeds
For the sake of discussion let us assume a possible doubling of the cutting speed when cutting a material of half the original thickness at the same laser power:
(P-b)(t/2)[(100-rf)/100] = Ecutl(d/2)k + (t/2)(jtd/2)(k/2)(A+B+C) (2)
doubling everything in equation (2) for comparision with (1):
(P-b)t[(100-rf)/100] = E c u tldk + (t/2)(7cdk/2)(A+B+C) (3)
or,
(P-b)t[(100-rf)/100] = Ecutldk + (Otdk/2)(A+B+C)/2 (4)
From equation (4) it is clear that the imbalance in the equation with respect to equation (1) is that the losses by conduction, convection and radiation have been halved. This being the case the thermal input (left) side of the equation has some energy to spare and t can be reduced by further increasing the cutting speed. Reducing t in this way restores the balance of the equation as the value of the left hand side of the equation is reduced at a greater rate than the right hand side which is only partially proportional to t.
This effect wiU be investigated in more depth in the following experimental section.
The limits on material thickness
With most cutting methods it is only necessary to decrease the cutting speed if a thicker section of material is to cut. In the case of laser cutting there is a clear maximum material thickness (for a particular laser-material combination) beyond which the cutting mechanism breaks down and cannot be reestablished at any speed. The reason for this is the relative increase in thermal losses from the cut zone as the cutting speed is decreased. Taking as an example steel cutting in oxygen: As for most metals, the most substantial thermal loss from the cut zone is by conduction. As the levels of conductive loss rise rapidly with increasing material thickness and the related drop in cutting speed, two effects become noticeable:
38

Ivarson; Paper I
1. The cut zone begins to spread laterally in a sporadic manner
and,
2. The removal of material from the bottom of the cut becomes inconsistent.
The first of these effects is a result of the general overheating of the area around the original cut zone as a result of conduction away from that zone. The area surrounding the cut zone reaches the temperature at which it can ignite in the oxygen stream and a widespread reaction takes place.
The second effect is due to the low average temperature of the melt compared to that created in thinner sections. This reduction in temperature is a result of the fact that so much energy is now being "wasted" by conduction, convection and radiation that not enough is available for the cutting process. Other features of the process such as chemical dynamics and fluid flow are also important contributors to the breakdown of the process but can be ignored for the purpose of this argument. (High pressure inert gas laser cutting of metals also experiences a rapid degradation in cutting mechanism above a certain thickness for a particular laser-material combination).
Low conductivity materials such as acrylic can be cut to much greater thicknesses as their cutting efficiency is a great deal higher than that of metals (ignoring the effects of oxidising reactions). An increase in thickness of the material does lead to a build up in the proportion of energy "wasted" but this is a much more gradual process than in the case of metals. The relatively low temperature of the cutting front keeps radiative heat losses to a minimum, (radiative heat loss is proportional to T 4 where T is the difference in temperature between the outer face of the cut front and the surrounding atmosphere). Conductive losses are low as the thermal conductivity is small. For these reasons many polymers can be cut at thicknesses an order of magnitude larger than those for metals.
In certain cases the losses from the "cut" zone are so large that cutting cannot be initiated. The most common example of this is copper sheet which cannot be cut at ah below a critical power density. For example a CW laser of below 500 W will be unable to initiate a cut zone in copper at thicknesses above foil grades. In this case the primary heat loss is due to reflectivity, aided by the high thermal conductivity.
39

Ivarson; Paper I
The implications of the energy balance argument to changes in laser power
Equation (1) implies that the cutting efficiency is proportional to the cutting speed and therefore to the laser power P. In practice this holds true only in a few specific cases and it is just as likely that the efficiency will remain steady or decrease with laser power if a broad range of applications is investigated. Cutting speeds wül generally rise with laser power in an approximately proportional manner except where very high power machines (>3 kW) are used. In the case of these higher powered machines cutting can be considerably slower than expected. The reason for this uncertainty of the effect of increasing power include the following:
a. I f two lasers are being compared (e.g. 500 W and 1200 W) it is probable that the higher power machine wih have an inferior mode quahty which wih not focus to a small spot as the low powered machine. This large focal spot wül produce wider cuts which wül render the process less efficient as more material wül have to be removed to generate the cut. This point is particularly relevant to machines with powers in excess of 3 kW.
b. The fluid dynamics of the cut zone play a strong role in determining the material removal (cutting) rate. At the higher cutting rates possible with a higher powered machine the inclination and geometry of the cut front may change and this will affect removal rates. The flow of the cutting gas jet may have to be increased to cope with the increased material removal rate. Above a limiting cutting speed the viscosity of the melt may become the rate determining factor.
c. As a result of the reduction in thermal losses to the workpiece when cutting at higher speeds, the thermal gradients around the cutting zone are more severe. The material along the cut line has not been as effectively preheated by the moving cut front and therefore requires more energy to become melted and ejected.
AN EXPERIMENTAL INVESTIGATION INTO PRIMARY (10.6 irn WAVELENGTH) ENERGY L O S S E S FROM
THE CUT ZONE
Introduction
Before describing the details of the foUowing experiment it is important to explain the use of acrylic (Polymethyl Methacrylate) material as a method of laser beam analysis.
40

Ivarson; Paper I
Acrylic is a transparent polymer with a low thermal conductivity and high absorbtivity at the CO2 laser wavelength of 10.6 urn. These factors, combined with its low sublimation temperature of 300 °C mean that acryhc is readily sublimated by high intensity CO2 laser beams [1]. The rate of ablation is directly related to the local energy intensity and therefore acryhc is widely used as a method of identifying the mode or cross sectional energy distribution in the beam. Areas of low intensity in the mode (e.g. the centre of a TEM01* mode) wül be revealed by local reduction in the depth of the evaporated print. On the other hand a good Gaussian mode beam will leave a circular impression in the acryhc which gets deeper towards the centre.
Mode prints of this type generaUy give only qualitative information but it is possible to quantify the results to give detaüed mode analysis [1]. As a rule of thumb however, even the qualitative nature of the method become unreliable if the depth to diameter ratio of a beam print exceeds 3:1 [2]. Deep mode prints tent to integrate out the anomalies in the laser mode as a result of internal reflection and the action of hot vapour on the solid material.
Acryhc can also be used as a measure of laser power. Miyamoto et al. [1] have demonstrated that it is possible to identify the energy needed for evaporation of a certain volume of acrylic material: H=3000 J/cm3. By establishing the volume of an evaporated mode print and the laser exposure time, it is possible to calculate the incident laser power.
One final introductory comment is that acrylic sheet is one of the most commonly laser cut material in industry. Al l types of display and sign work are cut by laser rather than mechanical methods. The main reason for the commercial interest in laser cutting of acrylics are:
a) It is possible to cut leaving a high quality polished edge.
b) Fine detaü can be cut.
c) Cutting speeds are high (e.g. 10 m/min for 3 mm thick acryhc at a laser power of 400 W).
The transparency of acrylic at visible wavelengths makes it an ideal material for cutting experiments involving analysis at the behaviour of the cut zone. For this reason acrylic was used as the workpiece material as weU as the analysis (mode print) material in the foUowing experiment.
41

Ivarson; Paper I
Experimental Procedure and Results
The following experiments were carried out with the intention of investigating reflection and transmission of the laser beam in the cut zone.
The basic experimental arrangement is shown in figure 2. The main experimental run involved cutting acryhc sheet of a variety of thickness at a constant cutting speed and laser power. Any surplus beam which has emitted from the bottom of the cut zone was coUected on an acrylic block and thus evaporated a "beam print" in that block. The beam print block and the laser remained stationary during cutting and the workpiece material was moved as shown in figure 2.
Figure 2. A schematic of the experimental arrangement for the reflectivity investigation.
Operating conditions were:
Laser power Cutting speed Length of cut Cutting time Air jet pressure Nozzle diameter Nozzle-workpiece standoff
325 W 13 mm/s 100 mm 7.7 sec. 20kPa 2.0 mm 2.0 mm
AU kept constant
Workpiece thickness: 0, 3, 6, 9, 12, 15,18, 21 mm
42

Ivarson; Paper I
The "zero thickness" cut was, of course, carried out without any work-piece in place, see figure 2, in order to establish a datum beam print of the uninterrupted beam at the position shown in figure 2. The exposure time for the beam print was 7.7 seconds as it was for all the subsequent prints taken during cutting.
Figure 3 shows photographs of some of the beam prints taken below the cut zone. As expected these mode prints show a general reduction in volume as the thickness of material being cut increases.
6 mm thick sample
Cross section Top view
15 mm thick sample
Cross section Top view
18 mm thick sample
Cross section Top view
Figure 3. Photographs of the mode prints created during the reflectivity experiments. N.B. the beam prints shown here are labelled according to the sample thickness cut during production, e.g. "6 mm thick sample" means that this is the beam print collected under the cut zone during the cutting of 6 mm acryhc sheet (see figure 2).
43

Ivar son; Paper I
This effect is shown graphicaUy in figure 4 from direct measurements of the mode imprint volume (vol. B line). Owing to the low conductivity of acrylic and the relatively low ablation temperature (300 °C), secondary thermal losses from the cut zone are low and it can be shown that the energy which was not coUected as a beam print was consumed during the cutting process. Although the cuts were not identified in cross section or exactly paraUel sided, an average kerf width of 0.4 mm was established for aU the cuts within an accuracy of ± 10%. For the 100 mm long cut carried out in each case, a 0.4 mm diameter kerf means that the total volume of material removed during cutting is given by figure 4 (vol. A line).
LA)
Thickness of material cut above beam print (mm)
Figure 4. Analysis of the amounts of acryhc evaporated. A: during the cutting process and B: during the generation of the beam prints. (N.B. Vol. A + Vol. B = 825 mm3).
Total Volume evaporated during cutting (mm3) = 100*0.4*thickness of workepiece
If the volume in cutting is added to the volume of the mode print for any thickness of cut material the sum is always equal to 825 mm 3 (± 60 mm 3), see figure 4. This figure gives a remarkably accurate measure of the laser power used i f Miyamotos [1] specific ablation energy of 3000 J/cm3 is used:
Volume removed from cut + volume of mode print = 825 mm 3
Specific ablation energy of acrylic = 3000 J/cm3,
44

Ivarson; Paper I
therefore energy consumed by cutting + mode printing = 2475 J
Cutting was achieved in 7.7 seconds therefore power needed = 321.4 W
This compares very well with the actual laser output power of 325 W.
It is clear from these figures that any laser energy which was not consumed during the cutting process was emitted from the bottom of the cut zone and was then absorbed by the acrylic block to produce a mode print.
On a qualitative level the mode print give us a very interesting insight into the nature of the reflection and absorption in the cut zone. AU the mode prints except those concerned with the 0, 3 and 6 mm thick cuts shown strong evidence of interference fringes. This effect is most pronounced in the mode print taken under the 15 mm thick cut. Interference patterns are generated, as the name suggests by the interference of one electromagnetic wave with another.
I f two beams of light of the same wavelength arrive in the same area by different paths they wül give rise to alternating zones of constructive and destructive interference. This principle is demonstrated in its simplest form in figure 5, which shows two converging plane wave fronts intersecting at a target.
Beam A Beam B
Figure 5. A schematic showing the generation of optical interference fringes as a result of the intersection of two converging plane wave fronts of equal wavelength.
\ A. beam A = A. beam B
sin 0 = A/d
45

Ivarson; Paper I
If one beam is inclined at 0 ° with respect to the other the foUowing formula links the distance between the fringes with that angle:
sin0=X/d
0= difference in path of the two beams X= wave length of the hght (same for both beams) d= the separation of the fringes
For the purpose of this discussion we are also considering the interaction of two converging beams of the same wavelength. In this case the two beams are:
1. the "transmitted" portion of the beam which passed straight through the cut zone and,
2. the portion of the beam which is reflected off the cut zone. The situation is described by figure 6. In normal optical experiments the interference fringes on a target exposed to two intersecting beams show up as alternating bright and dark zones. In this case however the intensity of either the reflected or transmitted beam is enough to evaporate the target material. "Bright" and "dark" zones of high and low intensity therefore act to evaporate the acryhc at higher or lower rates. In this way a ridge mode print is achieved.
Figure 6. The generation of interference fringes as a feature of the beam prints.
Incident laser light X=10.6 um
Beam print
Distance between two peaks=d
46

Ivarson; Paper I
Figure 7 demonstrates the change in fringe separation with 0 for 10.6 um radiation. It can clearly be seen that for fringes separated by the large values observed in the acryhc blocks (0.5-3.0 mm) the angle 0 must be very small. The angle of inclination of the reflecting surface, the cut front, must be 0/2 to achieve an angle of 0 between the reflected and the transmitted beam.
1 1 1 1 1 1 1 1 1 1 1 1 1 1 1 1 1 1 1 1 1 1 1 1 1 1 1 1 1 1 1
0 0,5 1 1,5 2 2,5 3 The angle between the two beams, 0°
Figure 7. Interference fringe separation as a function of the angle between the two converging beams.
Each mode print has a range of fringes separation distances which implies a range of cut front inclinations i.e. the cut front was slightly curved. Actual measurements of fringe separation and their implied 0/2 cut front inclination are given in table 1.
Table 1 Material No. of Max. fringe Min. fringe Max. 0/2 Min. 0/2 thickness visible separation separation (cut front (cut front
(mm) fringes (mm) (mm) inclination) inclination) 0 1 - - - -3 1 - - - -6 1 - - - -9 2 6 - - 3'0" 12 3 4 2.5 7'18" 4'30" 15 5 3.5 1.5 12'9" 5'12" 18 6 3.5 1.0 18'12" 5'12" 21 12 2.5 0.5 36'30" 7'18"
Direct measurement of the inclination of cut fronts reveal that the shape generally foUows the form given in figure 8. Near the top of the cut zone
47

Ivarson; Paper I
the angle of inclination is far less than 1° and this angle grows to 3-5° towards the bottom of the cut zone.
Cutting direction Angle of inclination 0°
Cut front
Angle of inclination 4°
Figure 8. An expanded tracing of the shape of a cut front in thick acryhc (21 mm) at the maximum cutting speed. Note the change in the angle of inclination from top to bottom.
The nature of the experiment carried out meant that we were initiaUy observing reflections from the top of the cut zone in the absence of the underlying material, i.e. we were cutting, for example, the top 12 mm of a 21 mm thick cut.
In this case the angle of inclination is extremely smaU and fringe separations of several millimetres could be expected. When cutting thicker sections however, our recorded fringe separations give no hint that cut front curvatures could be as high as the 3-5° observed in figure 8. The figures concerning the reflection of the cut front towards the top of the cut indicate that the reflected beam would reimpinge on the cut zone lower down. This principle is demonstrated in figure 9. This multiple reflection-absorption process could be responsible for the change in appearance of the cut edge from the top to the bottom, see figure 10.
Cut edge
Laser beam
1 Cut front
Figure 9. A schematic of multiple reflection and absorption in the cut zone.
48

Ivarson; Paper I
Cutting direction
Figure 10. A schematic of 21 mm thick acryhc cut at maximum speed. Note the generally rougher appearance of the bottom part of the cut.
If acryhc of a substantial thickness (e.g. >5 mm) is cut at maximum speed the top part of the cut edge is generally a great deal smoother than the lower part. This progressive increase in roughness could be a function of the curvature of the cut front and the reabsorption of reflected light from the top of the cut front. One further feature of the results which supports this hypothesis is the change in proportion of reflected and transmitted light which goes to make up the beam prints. When cutting the thin sections (0, 3, 6 mm) the transmitted beam is so superior in power to the reflected portion of the beam that interference fringes are not noticeable. As the thickness of the cut sample increases two effects combine to alter the reflected, transmitted ratio:
A. More hght which would be "transmitted" is absorbed in the cutting process.
B. The proportion of hght interacting with the cut zone increases as the size of the cut zone increases. The reflected light is a proportion of this "interacting" hght and therefore the amount to hght reflected increases.
If these trends simply continued in a linear manner with increasing sample thickness the mode prints would follow the foUowing two trends:
1. The mode prints would progress from the "non-fringed", transmission dominated types to fringed transmission-reflection to "non-fringed" reflection dominated types.
2. The volume of the mode prints would not tend to zero as the reflected power would continue to increase.
49

Ivar son; Paper I
As table 1 shows, the mode prints for this section (0, 3 and 6 mm) cutting show no sign of interference fringes as the transmitted beam is far more powerful than the reflected energy. Interference fringes are generated at moderate cut sample sections as a result of effects A and B above but these fringes are clearly evident even in the shallowest beam prints associated with cutting the maximum sections. This continued evidence of approximately equally powerful transmitted and reflected beams together with the tendency of the volume of the beam prints to approach zero indicates that after a certain thickness of the cut both portions of the beam experience considerable attenuation. The attenuation of the otherwise transmitted portion of the beam with increasing thickness is obviously due to an increase in beam-workpiece interaction as the inclination of the cut front increases to interact with the whole beam. The attenuation of the reflected part of the beam can only be attributed to reimpingement of already reflected light as shown in figure 9. It is therefore clear that the smoothest and flattest cut edges can only be achieved if the cut front is as near as possible perpendicular to avoid multiple reflections. Cut fronts of this geometry are only possible i f the cutting process is carried out at speeds considerably lower than the maximum possible for a particular work-piece-laser combination. This has been found to be the case in commercial practice where the best quality of cut edge is produced at 70% (±10%) of the maximum cutting speed.
AN EXPERIMENTAL INVESTIGATION INTO CONDUCTIVE ENERGY L O S S E S FROM CUT ZONE
Introduction
It was decided in this experimental programme to investigate the level of thermal loss from the cut zone by conduction during the laser-oxygen cutting of steels. Steels are the most commonly cut materials in laser profiling and although heat is lost from the cut zone by reflection, radiation, convection and conduction, it is the conductive losses which are of greatest importance.
Experimental Procedure and Results
Conductive losses can be measured by laser cutting any shape and then measuring the heat absorbed by the shape during cutting. The heat absorbed is equal to half the conducted losses from the cut zone for a cut length equal to the perimeter of the shape. (The other half of the conducted loss remains in the sheet from which the shape was cut). For the purpose of this experiment 50 mm diameter circles were cut in mild and stainless steel of a variety of thicknesses. AU cuts were carried out at maximum possible speed for any particular material thickness at the laser
50

Ivarson; Paper I
power used. Immediately after cutting the discs were placed in an insulated water bath and the absorbed heat was estabhshed by calorimetry. The direct results of this experiment are given in table 2.
Table 2. Results from conductive losses experiment
Laser power: 800 W Lens focal length: 127 mm Nozzle diameter: 1.2 mm Nozzle material standoff: 1.5 mm Cut disc diameter: 50 mm Sample Material Thickness Pressure Cutting Heat Gained
(mm) o 2
(bar) speed
(m/min) per disc
(J) A Mild steel 1.55 3.0 6.4 544 B Mild steel 2.9 2.3 3.15 1314 C Mild steel 4.8 1.5 1.8 2919 D Mild steel 8.0 1.0 0.8 7698
E St. steel 1.2 F St. steel 1.9 G St. steel 3.25 H St. steel 5.0
6.5 7.7 309 6.5 4.08 1077 6.5 2.4 2896 8.0 1.53 6521
The cutting speeds as a function of material thickness are shown in figure 11.
X54
Laser power 800 W
—•— Mild steel
— A — Stainless steel
i I I 1 1 1 1 1 1 1 1 1 1 1 1 1 1 1 1 1 1 I I 1111 n 11111111111
1 2 3 4 5 6 7 Material thickness, d (mm)
Figure 11. Maximum cutting speed as a function of material thickness for mild steel and stainless steel.
51

Ivarson; Paper I
As laser cutting is a dynamic process it is interesting to express the conducted loss from the cut zone in terms of watts. This is easily accomplished as follows:
Take, for example, sample A.
Cutting speed= 6.4 m/min
Heat gained by 50 mm disc as a result of laser cutting= 544 J,
therefore total heat lost by conduction during disc cutting= 1088 J
Time taken to cut disc= 1.47 seconds,
therefore conductive loss= 739 J/s= 739 W
The conductive losses, expressed in watts, are given in figure 12 for sample A-H.
2500-
§2000-Vi
1 1500J,
u •a 1000-
t. Mild steel (A)
• Stainless steel (BI
- s y
/
• A/d
o B/d
- S /
s -^^^^^^^^^ -. / ^ ^ ^ ^ - — -o 0
1 2 3 4 5 6 7 Material thickness, d (mm)
Figure 12. The variation of conductive losses (expressed in watts) with material thickness for mild and stainless steels.
Discussion
It was predicted earlier in this paper (equations (l)-(3)) that a reduction in the process efficiency with increasing material thickness would be associated with two effects:
52

Ivarson; Paper I
1. A disproportionate reduction in cutting speed with increasing material thickness and,
2. A disproportionate increase in thermal losses by conduction with increasing material thickness.
The information laid out in table 2 and graphicaUy in figures 11 and 12 support these predictions. A halving of material thickness aUowed cutting to take place at more than twice the original cutting speed. Doubling the material thickness more than doubles the thermal losses.
Figure 12 reveals some interesting insights into the cutting process itself. It is clear that as the material thickness increases the number of watts lost by conduction from the cut front increases in an approximately linear manner. This is accordance with the arguments put forward at the beginning of this paper. The surprising feature of figure 12 is the actual values of the power loss from the cut zone. The laser power used during this experiment was 800 W but the thermal loss by conduction exceeds this value rather than being a proportion of it. In the most extreme case note here (5 mm stainless steel) the cut front looses approximately 2100 W by conduction. The answer to this energetic inputroutput imbalance lies in the role of oxygen in the cutting process. Oxygen combines with the elements in mild and stainless steel and at the same time releases substantial amounts of heat:
e.g. xFe + yO -> FexOy+ Heat
A first approximation of the energy avaüable from this type of reaction is the Enthalpy of Formation:
Oxide Enthalpy of formation T 31
Laser cutting oxidation obviously takes place at elevated temperatures whereas these values are valid for the formation of the oxide at 293K or 20°C [3]. The figures are included here only to indicate the large amount of energy available from the oxidation process. A more quantitative de-taüed analysis of the thermodynamics of the oxidation process is presently being prepared by the authors. As the losses in figure 12 are expressed in watts it is clear that the number of watts leaving the cut zone increased
FeO Fe 20 3
Fe 3 0 4
-260 kJ/mol -822.2 kJ/mol -1117 kJ/mol
53

Ivarson; Paper I
rapidly with material thickness even though the power of the laser remained constant at 800 W. As a result of this it is clear that the ratio of laser power to oxidation reaction power decreases with increasing material thickness. In the extreme case of 5 mm stainless steel the total power entering the cut zone has to be well in excess of 2 kW (the conductive loss). This increase in power must come from an increase in the rate of the oxidation reaction. This increase in the rate of oxidation with thickness is not associated with a rapid rise in material removal rate as can be seen from the foUowing figures:
Table 3. Material Removal Rates Sample Material Thickness Cutting Kerf Material re
(mm) speed width moval rate (m/min) (mm) (mmVsec)
A Mild steel 1.55 6.4 0.30 49.60 B MUd steel 2.9 3.15 0.30 45.70 C Mild steel 4.8 1.8 0.35 50.40 D MUd steel 8.0 0.8 0.40 42.70
E St. steel 1.2 7.7 0.25 38.50 F St. steel 1.9 4.08 0.30 38.76 G St. steel 3.25 2.4 0.35 45.50 H St. steel 5.0 1.53 0.35 44.60
I f the increase in oxidation rate is not due to an increased amount of material being oxidised it must be related to an increase in the efficiency of the oxidising process. This increase in efficiency is a result of the elongation of the cutting front as the thickness of the material increases. Table 3 shows that material removal rates are similar throughout the range of thicknesses cut but as the size of the oxygen-melt interaction area increases (with material thickness) the rate of material oxidation can increase. This argument is backed up by dividing the values given in figure 12 by the thickness of the workpiece in each case, see figure 12 lines A/d and B/d. The fact that the stainless steel line B/d is almost horizontal implies that the energetic conditions at the cut front are uniform whatever the thickness of material cut (within this range), i.e. the oxidation rate is proportional to the surface area of the cut front.
The diminution in the value A/d with increasing material thickness implies that the average temperature in the cut zone faUs graduaUy with increasing material thickness for mild steel, i.e. the efficiency of the oxidation reaction decreases with material thickness. This diminution in efficiency in the case of mild steel could be the result of the contamination of the incident oxygen jet as a result of reaction with the carbon in the steel:
54

Ivarson; Paper I
C + C0 2 -> C0 2
This evolution of C0 2 can dilute the oxygen at the melt-gas interface towards the bottom of the cut. Dilution of the local concentration of oxygen will , of course, lead to a reduction in the efficiency of the oxidation reaction. In the case of thick section mild steels oxygen is in comparatively short supply as low pressures are required to suppress unwanted burning of the workpiece. Stainless steel on the other hand benefits from increasing oxygen pressure as the thickness of the workpiece increases. As a result of this the melt is supphed with a surplus of oxygen and the oxidation reaction is never suppressed.
Conclusion
Although this experimental work was carried out solely with the intention of analysing conductive losses at a constant laser power it is clear that the power supplied to the cut zone increases with material thickness. In spite of this increase in cutting power with thickness the conductive losses also increase at a rate sufficient to suppress the cutting speeds in accordance with the ideas put forward in equation (1), (2) and (3).
GENERAL CONCLUSION
This general and qualitative analysis of energy redistribution in laser cutting has revealed a large number of interesting points including:
1. Single and multiple reflections can and do take place within the cut zone.
2. Multiple reflection and absorption towards the bottom of cuts can result in a decrease in cut edge quahty particularly in the case of acrylic sheet.
3. The laser energy and oxidation reaction energy always combine to produce a cut in oxygen assisted cutting of steels.
4. The oxidation reaction becomes a progressively larger contribution to the cutting process as the material thickness is increased. At the maximum steel section for a particular laser power, the power of the oxidation reaction far exceeds the laser power.
55

Ivarson; Paper I
5. The efficiency and rate of the oxidation process is proportional to the surface area of the cut zone and is therefore proportional to the thickness of the sample.
6. The laser or laser-oxygen cutting process becomes less efficient as workpiece thicknesses increase.
ACKNOWLEDGEMENTS
The authors would like to thank the Swedish National Board for Techmcal Development for providing funding for this work. Thanks are also due to Mr. CD. Young of Laser Expertise Ltd., for the difficult job of photographing transparent acrylic samples and Mr. Göran Åberg at Luleå University of Technology for all help in the laser laboratory.
R E F E R E N C E S
1. Miyamoto, L , Maruo, H., Arata, Y. "Intensity Profile Measurement of Focused CO2 Beam using PMMA", Conf. Proc. of Materials Processing Symposium, ICALEO'84, Boston, 1984, LIA-Vol.44, Lasers Institute of America, pp. 313-320.
2. Sarchin, L . "CO2 Bum Samples-Are They Accurate?", Lasers and Optronics, Vol.6, No 7, July 1987, pp. 35-38.
3. Science Data Book, Tennent, R.M.(Ed.), ISBN 0050024876, Ohver & Boyd (Publ.).
56

Ivarson; Paper II
Paper II
Laser Cutting of Steels; Analysis of the particles ejected during cutting
57

I var son; Paper II
Laser Cutting of Steels; Analysis of the particles ejected during cutting
A. Ivarson*, J. Powell*+, C. Magnusson*
* Luleå University of Technology Division of Materials Processing
S-951 87 Luleå, Sweden
+ Laser Expertise Ltd. Harrimans Lane, Dunkirk Nottingham NG7 2TR, UK
ABSTRACT
This paper gives the results of a detailed examination of the particles ejected from the cut zone during CO2 laser cutting of mild and stainless steels. Cuts were carried out over a range of material thickness at the optimum speed for each at a laser power of 900 Watts. Particles ejected from the cut zone were coUected and analysed to establish their chemical and physical characteristics. Analysis techniques included; Scanning Electron Microscopy, wet chemical analysis, optical microscopy, metallography and particle sizing.
The results from this extensive analysis have enabled the authors to postulate oxidation histories for the particles. In addition to this it has been possible to estimate the heat generated by the oxidation process during cutting of both mild and stainless steels.
INTRODUCTION
Although a great deal of experimental and theoretical work has been published on the subject of CO2 laser cutting of steels, there is very little detailed information available concerning the nature of the particles ejected from the cut zone during cutting. The dominant mechanism for material removal during CO2 laser-oxygen cutting of steels is one of melting combined with oxidation. Vaporisation plays a negligible role as a result of the rather low temperature of the process (approximately 2000K). This level of temperature has been directly measured by the present authors and is also evident from optical observation of the process. Direct observation of the cutting zone reveals that the process radiates an intense level
59

Ivar son; Paper II
of light in the pale yellow band of the electromagnetic spectrum. A process which rehed heavily on evaporation as a material removal mechanism would radiate light in the higher temperature blue-violet range. (This blue-violet light is often observed in laser welding process where laser-material interaction times are longer and therefore temperatures are higher).
Material is ejected from the bottom of the cut zone in the form of molten droplets of oxidised metal, see figure 1.
Oxygen gas jet Laser beam
Nozzle
Cut zone
Ejected molten oxidised particles
Figure 1. A schematic of the cutting mechanism.
The level of oxidation and the range of size of these droplets can be easily examined after they have solidified. For the purpose of this experimental program the particles were coUected in a non oxidising hquid quenchant as close to the bottom of the cut zone as possible, see figure 2.
Movement at
cutting speed, v V i
Laser cutting head
Cut edge
Ejected molten oxidised panicles
Glycol-water V mixture
Figure 2. A schematic of the experimental arrangement for the particle coUection.
60

Ivar son; Paper II
The use of a quenchant was necessary in order to freeze the particles in their ejected condition. I f the particles were allowed to cool at their own rate in air the general level of oxidation would be much higher as a result of atmospheric oxidation.
Once the particles had been coUected from experimental cut runs in mild and stainless steel they were thoroughly examined chemicaUy and physi-caUy. From these examinations it has been possible to establish the level of oxidation experienced by the steel during cutting. From this result it is possible to clarify the role of the oxidation reaction in the cutting process. In addition to this important result it has been possible to identify an oxidation history for the particles. This oxidation history reveals aspects of the oxidation reaction which can be used to further clarify the overaU cutting mechanism.
EXPERIMENTAL PROCEDURE
The basic experimental arrangement for the coUection of particles ejected from the cut zone is shown in figure 2. The cutting parameters used during this experimental program are as foUows:
Table 1. Cutting parameters
Laser model: Rofin-Sinar 6000 Laser power: 900 W Lens focal length: 127 mm Nozzle diameter: 1.0 mm Nozzle material standoff: 1.0 mm
Sample Material Thickness Pressure Cutting speed (mm) 0 2 , (bar) (m/min) (mm/s)
A MUd steel 1 3.0 7.5 125 B MUd steel 2 3.0 5.1 85 C MUd steel 3 2.0 3.2 53 D MUd steel 4 2.0 2.1 35
E St. steel 1 4.5 8.0 133 F St. steel 2 7.0 3.9 65 G St. steel 3 7.0 2.5 42
61

Ivar son; Paper II
The chemical composition of the mild steel was:
Table 2. Mild steel composition
Fe C Mn P S wt(%) At/%)
99.41 99.06
0.08 0.37
0.45 0.46
0.03 0.054
0.03 0.052
For the general purpose of this discussion the mild steel can be assumed to be pure iron with a small addition (0.08%) of carbon.
The chemical composition of the stainless steel was:
Table 3. Stainless steel composition
Fe Cr Ni Mo S P Mn Si C wt(%) 65.875 18.0 10.5 2.5 0.03 0.045 2.0 1.0 0.05 At(%) 65.21 19.12 9.89 1.44 0.05 0.08 2.01 1.97 0.23
For each sample (A-G) the foUowing system was employed:
1. Cut approximately 30 m of the material (in several 100 mm passes) and coUect the ejected particles in the glycol-water mixture.
2. FUter and dry the coUected powder.
3. Establish particle size distribution by wetscreening.
4. Take a sample for wet chemical analysis.
5. Take a sample for Scaruiing Electron Microscopy.
6. Take a sample to be mounted in bakelite, ground and polished. This sample could then be used for a number of investigations as it revealed the polished cross sections of a large number of particles. Techniques used included: Electron microscopy, SEM chemical analysis by the energy dispersive x-ray method (EDX), optical microscopy (unetched) and optical microscopy after etching.
62

Ivar son; Paper II
RESULTS AND DISCUSSION
Particle Size Distribution
The particles were separated into a number of size ranges by the use of sieves with progressively diminishing mesh sizes. The results are given in table 4.
Table 4. Particle size distribution
Mild steel Proportion (%) of particles size range (urn)
Sample Thickness (mm)
0-38
39-53
54-75
76- 107- 151- 213- 301-106 150 212 300 425
426-600
A 1 B 2 C 3 D 4
1.24 4.12
2.5é 2.86 0.37 0.36
3.Ö2 2.61 0.36 0.56
18.37 39.39 24.44 7.87 2.08 7.08 29.13 26.01 15.24 7.44 1.20 16.98 25.97 25.93 16.99 1.67 4.39 21.10 20.42 21.37
1.03 5.52 11.06 30.13
Stainless steel Proportion (%) of particles size range (urn)
Sample Thickness (mm)
0-38
39-53
54-75
76- 107- 151- 213- 301-106 150 212 300 425
426-600
E 1 F 2 G 3
1.21 1.33 0.88
1.89 5.13 1.01
3.34 6.28 1.19
13.45 36.77 35.73 6.95 0.30 13.73 27.79 33.24 9.58 1.42 2.33 4.02 47.51 34.99 6.19
0.38 1.50 1.58
These results are given in graphical form in figures 3 and 4. For both the mild and stainless samples there is a general tendency for the particle size to increase as the thickness of the cut sample increases.
Mild steel 1 mm Mild steel 1 mm
— Mild steel 2 mm
- - - - - Mild steel 3 mm
Mild steel 4 mm Mild steel 4 mm
100 200 300 400 500 600 Particle size (urn)
Figure 3. Mild steel; Particle size distribution for different sample thicknesses.
63

I var son; Paper II
Particle size (|im)
Figure 4. Stainless steel; Particle size distribution for different sample thicknesses.
The general trend towards increased particle size as the sample thickness increases can be attributed to two major factors:
A. The vertical thrust of the cutting gas jet will diminish as the depth into the cut increases. This can reduce the abihty of the gas jet to spray hquid out of the bottom of the cut zone as the material section increases. The reduction in shearing action of the gas jet wih suppress the formation of the smallest sizes of particle.
B. It has been indicated by earlier work [1] that as the thickness of the sample increases, the average temperature of the melt in the cut zone decreases. This being the case the surface tension of the melt would increase. A higher surface tension would result in the formation of larger particles as the shearing action of the gas jet would be reduced.
Figure 3 shows a remarkable increase in the proportion of particles with a diameter of 300 |im or more for the 4 mm thick sample. Further examination of the samples revealed that a large number of the "4 mm" particles had welded themselves together in pairs after ejection from the cut zone. Whether this joining took place during flight or as a result of the collection process is not known at this point. Figure 5 shows an etched cross section of a typical welded pair of particles.
64

I var son; Paper II
Figure 5. An etched cross section of a pair of particles which have become welded together.
Chemical Analysis
Mild steel
Wet chemical analysis was carried out to estabhsh three values for each sample of powder. Those values were:
a) The amount of unoxidised iron.
b) The amount of oxidised iron.
c) The total amount of oxygen present.
From these three values a calculation can be carried out which establishes the various proportion of iron and its oxides (FeO, Fe203 and Fe304) which make up the material ejected from the cut zone.
The results of the chemical analysis are given in table 5.
Table 5. Chemical analysis of mild steel cut particles
Sample Thickness Free iron; Oxidised Total oxygen; (mm) wt(%) iron; wt(%) wt(%)*
A 1 43.7 42.6 13.0 B 2 46.7 40.9 13.0 C 3 45.1 46.1 13.0 D 4 37.0 49.1 13.5
•Experimental error 1-2%
Average 43.7 44.7 13.1
65

Ivarson; Paper II
At this stage of investigation the minor trend towards increased oxidation as material thickness is increased is less important than the general view given by the average values in table 5. As a first approximation it can be said that the ratio of oxidised to unoxidised iron is 1:1. Using the average values from table 5 we can calculate the proportions of the various oxides of iron present. The first step is to calculate the relationship between the number of oxygen and iron atoms in the oxide:
Average values:
Oxidised iron (wt%) = 44.7%
Total oxygen (wt%) =13.1%
Atomic weight of Fe= 55.847 Atomic weight of 0= 16.0
Therefore the relative proportion of iron and oxygen atoms:
Fe (44.7/55.847) : O (13.1/16.0)
0.80 :0.82
As this is approximately a 1:1 relationship it is clear that the great majority of the oxide will be FeO. Figure 6 shows the iron:oxygen equilibrium diagram which clearly indicates that the surplus oxygen could be present as Fe203 or Fe304. At this temperature of formation of the particles (approximately 2000K) we have a hquid phase L 2 which can be described as: FeO, FeOi.5 (Fe 20 3).
Weight Percent Oxygen S 10 15 M ts 30
1000-h L , + U 1 L , u
; ° «
:6O0- 131 575 1M9'C
1400-Ö L - « * )
U2C!C 1457*C
1200 —(7Fe) o 1 I
ii °£ /
cT
1000-
600 TW*C HufBdlt TranaienaaliM
aoa —(ar«)
MO*C
/Tram«. / N Ml'C
a io Fe
M 30 40 K Atomic Percent Oxygen
«
Figure 6. Equilibrium diagram, Fe-0 [4].
66

I var son; Paper II
Assuming that a 100 g sample of particles has been analysed. The average amount of oxidised iron is 44.7 g (from table 5), the amount of free iron is 43.1 g and the amount of oxygen combined with the oxidised iron is 13.1 g. Assuming that the oxide is wholly made up of a mixture of FeO and Fe203, the foUowing calculation reveals the proportions of the two oxides:
where; x = the number of moles of Fe203 in the 100 g sample y = the number of moles of FeO in the 100 g sample
[Fe 20 3] = the molecular weight of Fe2Ü3 = (2*55.847 + 3*16) g/mol [FeO] = the molecular weight of FeO = (55.847 + 16) g/mol
A = the weight of oxidised iron in the 100 g sample = 44.7 g B = the weight of oxygen in the 100 g sample = 13.1 g
rewriting equation (1)
x(2*55.847+3*16) + y(55.847+16) = 44.7 + 13.1 (2)
equation (2) can be divided into two equations, one dealing with the iron balance and the other dealing with the oxygen;
x*2*55.847 + y*55.847 = 44.7 (3) (iron)
x[Fe 20 3] + y[FeO] = A + B (1)
x*3*16 + y*16 = 13.1 (4) (oxygen)
the solution to (3) is
(3) => y =0.80-2x (5)
substituting (5) into (4) gives
16x = 0.3 (6)
(6) => x = 0.019 (7)
67

Ivar son; Paper II
substituting (7) into (5) gives
y = 0.762 (8)
This equation gives the ratio of the two oxides as foUows:
Fe 2 0 3 :FeO
1 : 40.1
Expressing this as molecular percentages in the oxide mixture:
Fe 2 0 3 :FeO
2.4% : 97.6%
This generalised result was supported by the electron microscopy and EDX-methods used to analyse the particles. Electron microscopy helped to identify the particles as fundamentaUy spherical, see figure 7.
Figure 7. Electron micrograph showing the spherical nature of the particles.
68

Ivarson; Paper II
Energy dispersive X-ray analysis (EDX) carried out on cross sections of these particles indicated a thin outer shell (<5um) of Fe203 surrounding a thicker layer (20-50u.m) of FeO which encased either a central sphere of iron or a suspension of FeO particles in an iron matrix. This distribution of the iron and its oxide is dealt with in greater detail later in the optical microscopy section.
Our major concern in identifying the oxide type dominant in the particles is to calculate the amount of heat generated during the oxidation process. This information is necessary in order to quantify the thermal input to the cutting process which is a combination of direct laser irradiation and the exothermic reaction.
As a general approximation it can be taken that during laser cutting of mild steel approximately half of the iron which leaves the cut zone is oxidised to FeO. From this an estimate of the energy released by this exothermic reaction can be made. This energy assists the cutting process and acts in conjunction with the laser beam to produce a cut line.
Table 6. Oxidation heat generated during cutting of mild steel
Sample Thickness Kerf Material re- Oxidation (mm) width
(mm) mo val rate (mm3/sec)
heat evolved (Watts)
A 1 0.23 28.75 515.2 B 2 0.21 35.7 643.9 C 3 0.22 35.0 618.2 D 4 0.22 30.8 540.9
Therefore the average heat of oxidation = 579.5 W.
The values of oxidation heat evolved in table 6 were calculated in the following manner:
Sample A:
Material thickness = 1.0 mm Cutting speed =7.5 m/min =125 mm/s Kerf width = 0.23 mm
Volumetric material removal rate = 28.75 mmVs
Mass removal rate = 0.224 g/s
69

Ivarson; Paper II
Assume half this mass of iron is converted to FeO, (see previous discussion).
Heat generated by
Fe + l /20 2 -> FeO AH=-257.58 kJ/mol (at 2000K) [3]
Mass removal rate = 0.002 mol/s
Calculations gives
Heat evolved = 515.2 W
This power can be added to the 900 Watts of the laser itself and the sum is the power input to the cutting process. Earlier work by the authors [1] showed that when cutting mild steel with 800 Watts of laser power, the thermal loss by conduction from the cut zone exceeded 800 watts at thicknesses above 2 mm. It is obvious therefore that a considerable amount of heat has to be generated by the oxidation process in order to carry out the cutting process. The results shown here indicate that the oxidation process contributes approximately 40% of the energy input to the cut zone and the laser provides the remaining 60%. From earlier work we know that more than half of this total energy input is lost from the cut zone by thermal conduction to the base material.
Stainless steel
Wet chemical analysis gave the foUowing results:
Table 7. Chemical analysis of stainless steel cut particles
Sample Thick Free Oxidised Free Oxidised Total Total Sample ness Fe; Fe; Ni; Ni; Or, O, (mm) wt(%) wt(%) wt(%) wt(%) wt(%) wt(%)
E 1 49.6 14.9 11.1 0.38 14.6 9.4 F 2 41.5 21.5 9.9 0.88 15.3 10.9 G 3 37.8 22.1 11.8 0.76 15.7 11.8
Average 43.0 19.5 10.9 0.67 15.2 10.7
70

Ivar son; Paper II
Earlier work by Powell [2] estabhshed that the oxide generated during laser cutting of stainless steel consisted of a mixture of Fe203, Cr203 and NiO.
Using wet chemical analysis it is unfortunately not possible to identify how much of the chromium has been oxidised. This figure can however be calculated using the same principles as those used in the earlier mild steel analysis.
x[Fe 20 3] + y[Cr 2 0 3 ] + z[NiO] = A + B + C + D (9)
where; x = the number of moles of Fe203 in the sample y = the number of moles of Q2O3 in the sample z = the number of moles of NiO in the sample
[Fe 20 3] = molecular weight of Fe 20 3 = (2*55.847 + 3*16) g/mol [Cr 2 0 3 ] = molecular weight of Cr 2 0 3 = (2*51.996 + 3*16) g/mol
[NiO] = molecular weight of NiO = (58.71 + 16) g/mol A = the weight of oxidised iron in the sample (g) B = the weight of oxidised chromium in the sample (g) C = the weight of oxidised nickel in the sample (g) D = the weight of oxygen in the sample (g)
Assuming, as before, that a 100 g sample of particles has been analysed and taking the average analysis values from table 7:
x(2*55.847+3*16) + y(2*51.996+3* 16) + z(58.71+16) =
19.5 + B + 0.67 + 10.7 (10)
Only x, y, z and B remain unknown, equation (10) can be spht up into 4 equations each dealing with a separate element:
x*2*55.847 = 19.5 (11) (iron) y*2*51.996 = B (12) (chromium)
z*58.71 =0.67 (13) (nickel) x*3*16+y*3*16+z*16 = 10.7 (14) (oxygen)
71

Ivar son; Paper II
From these equations x and z can be found:
x = 0.1716 z =0.0114
Substituting these values into equation (14) gives us a value for y:
y = 0.0445
Knowing y we can now solve equation (12) which gives us the foUowing:
Weight of oxidised chromium in sample = 4.63 g
The wet chemical analysis gives a value for the total chromium content (see table 7) and so it is possible to calculate the ratio of oxidised to unox-idised chromium:
Crfree • CToxidised 2.3 : 1
The values of x, y and z give the relative molecular proportions of the three oxides in the sample:
NiO
z
0.0114
Fe 2 0 3 : Cr 2 0 3
x : y
0.1746 : 0.0445
Expressed as percentage
(mol%) 75.75 % : 19.3 % : 4.95 %
(wt%) 78.5 % : 19.0 % : 2.5 %
This of course only considers the oxidised portion of the sample. A more complete picture of the average chemistry of the particles would be as foUows:
72

Ivar son; Paper II
Table 8. Chemical analysis of the stainless steel particles
Fe Fe2C>3 Cr Cr 2Q 3 Ni NiO
wt(%) 43 27.8 10.6 6.8 10.9 0.87
Earlier work by PoweU [2] and subsequent work by other authors has established that during the oxidation process chromium is oxidised prefer-entiaUy as it has the greatest affinity for oxygen of aU the aUoying elements present. This generaUy means that residual oxide layers left on the cut edge have a higher chromium content than the base material. As a result of this preferential oxidation the solidified melt underlying the oxidised edge has a depleted chromium level. These results would imply that the type of particle which has an outer oxidised crust surrounding a resolidified melt core would have a chromium enriched oxide layer and a chromium depleted core. These results have been verified by EDX analysis of this type of particle as can be seen in figure 8.
Fe, wt(%)
Or, wt(%)
Ni, wt(%)
9 * \
40 10 20 30
Distance from shell (um)
50
Figure 8. A cross section view and EDX scan across a particle with an outer oxide crust surrounding a metal core.
73

Ivar son; Paper II
From figure 8 it can be seen that the levels of Fe203 and Cr2<I)3 in the oxidised outer layer are both between 20 and 30 wt%. The underlying melt has a much lower chromium level than the base ahoy composition as a result of this preferential oxidation.
In view of this it may seen surprising that the chromium oxide levels revealed by the wet chemical analysis were not higher. In fact they were rather close to the base level of the alloy itself (compare the ratio of Fe2Ü3 and Cr2Ü3 in table 8 with the Fe and Cr values in table 3). Two reasons can be put forward to explain this apparent short fall in the observed amount of Q2O3 formation.
A. Wet chemical analysis could not directly measure the amount of chromium which had undergone the oxidation reaction. As a result of this the Q2O3 levels had to be calculated from the average oxygen wt% of 10.7%. Results for oxygen wt% in cases such as this are not wholly rehable and a fluctuation of two percentage points is weh within experimental limits (see table 7). The nature of our Cr2Ü3 level calculation means that relatively minor differences in the total oxygen level would greatly affect the result.
B. As we shall see in the foUowing section a large number of particles were almost completely oxidised and had no residual central metal core. In these cases the preferential oxidation of chromium at the outside surface does not affect the overaU result. I f ah the metal has been oxidised then the ratio of the oxides wih match the ratio of the original aUoying elements.
One final point about figure 8 is that oxide particles suspended in the body of the metaUic core can easily be identified by the fluctuations in the Fe and Cr lines at a distance of 35-45 urn from the outer sheU.
For stainless steel, as for müd steel, our major concern in identifying the oxide types dominant in the particles is to calculate the amount of heat generated during the oxidation process. This information is necessary in order to quantify the thermal input to the cutting process which is a combination of direct laser irradiation and the exothermic reaction.
The oxidation of stainless steel during cutting is more complex than the müd steel case dealt with earlier because the reaction involves the formation of three oxides (Fe203, Q2O3 and NiO) rather than two (FeO, Fe203). The formation of the three oxides generates a great deal more heat than the simple oxidation of iron to FeO as we can see from the foUowing:
74

I var son; Paper II
Stainless steel
2Fe + 3/202 -» Fe 20 3 AH=-826.72 kJ/mol (at 2000K) [3],
2Cr + 3/202 -> Cr 2 0 3 AH=-1163.67 kJ/mol (at 2000K) [3]
and
Ni + I/2O2 -» NiO AH=-248.23 kJ/mol (at 2000K) [3]
compared with
Mild steel
Fe + I/2O2 FeO AH=-257.58 kJ/mol (at 2000K) [3]
As a general approximation it can be taken that during laser cutting of stainless steel approximately 30% of the iron which leaves the cut zone is oxidised to Fe 2 0 3 and approximately 30% of the chromium which leaves the cut zone is oxidised to Cr 2 0 3 (NiO formation is negligible). From this an estimate of the energy released by the exothermic reactions can be made. This energy assists the cutting process and acts in conjunction with the laser beam to produce a cut line.
Table 9. Oxidation heat generated during cutting of stainless steel
Sample Thickness (mm)
Kerf width (mm)
Material removal rate (mmtysec)
Oxidation heat evolved
(Watts) E 1 0.27 35.9 578 F 2 0.29 37.7 608 G 3 0.32 40.3 648
Average oxidation heat evolved = 610 W
The values of oxidation heat evolved in table 9 were calculated in the following manner:
75

Ivarson; Paper II
Sample E:
Material thickness = 1.0 mm Cutting speed =8.0 m/min = 133 mm/s Kerf width = 0.27 mm
Volumetric material removal rate = 35.9 mm3/s
Mass removal rate = 0.28 g/s
Assume that 30% of the iron content (which is 65.875 wt(%), table 3) of this mass of stainless steel is converted into Fe2C>3, and 30% of the chromium content (which is 18.0 wt(%), table 3) is converted into Cr2Ü3.
Heat generated by the two chemical reactions
2Fe + 3/202 -*Fe 2 0 3 AH=-826.72 kJ/mol (at 2000K) [3] 2Cr+3/20 2 - > C r 2 0 3 AH=-1163.67 kJ/mol (at 2000K) [3]
Mass removal rate (Fe) = 0.3*0.65875*0.28/55.847= 9.9*10^ mol/s
Mass removal rate (Cr) = 0.3*0.18*0.28/51.996= 2.9*10^ mol/s
This gives
Heat evolved= 9.9*10^*826.72*103/2 + 2.9*1(H*1163.67*103/2 = 578 W
This power can be added to the 900 watts of the laser itself and the sum of these two is the power input to the laser process. As for mild steel, work was carried out in an earlier paper [1] which showed that conductive losses from the cut zone were extremely large. In the earlier work 800 watts of laser energy was used to cut stainless steel in thicknesses from 1 to 5 mm. Thermal losses by conduction rose in a linear manner with material thickness from 500 watts at 1 mm thick to 2100 watts at 5 mm (the maximum thickness possible). In view of these enormous thermal losses it is not surprising that the oxidation reaction supplies a great deal of heat to the cut zone. Although the average thermal output from the
76

Ivarson; Paper II
oxidation process (see table 9) was given as 610 watts it is the opinion of the present authors that this value may be considerably higher in reality. Further work wiU concentrate on more accurate methods of determining the level of chromium oxidation which is believed to be higher than the 30% used in this calculation. The results shown here indicate that the oxidation process contributes approximately 40% of the energy input to the cut zone and the laser provides the remaining 60%.
Optical Microscopy
Mild steel
For the purpose of optical microscopy a sample of the particles were imbedded in bakelite and then ground and polished to reveal a number of cross sections of particles. The view of a typical pohshed sample can be seen in figure 9.
Figure 9. A general view of polished cross sections of particles from mild steel (from 1 mm thick sample). N.B. Dark circles represent particles plucked from the mounting by the grinding-pohshing process.
Although figure 9 shows a general view of the particles coUected from the 1 mm thick sample it is fair to say that aU the samples were essentiaUy simUar in appearance although the diameter of the particles graduaUy increased with increasing material thickness (see the particle size distribution section).
77

Ivarson; Paper II
The particles display a range of levels of oxidation and it was possible to identify a number of examples of five distinct oxidation stages as shown in the following figures:
Stage 1. An FeO shell surrounding an iron core.
Stage 2. An FeO shell surrounding an iron core which contains small isolated spheres of FeO.
Stage 3. An FeO shell surrounding an iron core which contains small isolated spheres of FeO. In the centre a large number of these small spheres have combined to generate a large sphere of FeO.
0.05 mm
78

Ivarson; Paper II
Stage 4. An FeO sphere containing isolated spheres of iron.
Stage 5. A sphere of FeO. (As oxidation progresses from stages 1-5 oxide solidification pores become more apparent).
Figure 10. Oxidation stages for mild steel particles.
From these photographs it is clear that the oxidation history of a molten particle allowed to fully oxidise would be as foUows:
Stage 1: Surface oxidation.
Stage 2: Surface oxidation continues but oxide droplets leave the sheU and become incorporated in the central iron core.
Stage 3: As the population of iron oxide droplets grows they combine as a result of coUision and surface tension effects draw them together into a large central sphere.
Stage 4: The central oxide and the outer sheU grow towards each other and eventuaUy join thereby isolating the remaining droplets of iron.
Stage 5: Oxidation is completed and is foUowed by solidification.
N.B. The solidification mechanism of FeO often gives rise to pores in the oxide and at metal-oxide interfaces.
79

Ivarson; Paper II
This oxidation route has obviously been interrupted at various stages in the case of our sample. This interruption is obviously largely due to the instantaneous quenching of the ejected particles in the glycol-water mixture (see figure 2). On the other hand most particles would cool naturally before oxidation was 100% complete. The level of completion of their eventual oxidation would depend on such factors as ejection temperature, surface area to volume ratio and the local oxygen level in the atmosphere. What is perhaps surprising is that an appreciable number of particles were fully oxidised before being quenched and coUected. Figure 9 shows that most of the fuUy oxidised particles were smaUer than the average and this agrees weU with the principle that the particles with the largest surface area to volume ratio would oxidise most rapidly (i.e. a) 100 urn diameter sphere: surface area= 0.031 mm 2, volume= 0.00052 mm 3, b) 200 \im diameter sphere: surface area= 0.13 mm 2, volume= 0.0042 mm 3).
To confirm that the darker areas in the particles were in fact oxide and the lighter areas were metallic two checks were carried out. The first check was to etch the samples in 5% nitric acid and then to reexamine them. The final check was to carry out electron microscopic EDX scans on several particles. A typical etched "stage 3" particle is shown in figure 11.
Figure 11. A typical etched "stage 3" particle.
Figure 11 shows the etched micro structure of the rapidly solidified müd steel core. The FeO is unaffected by the etchant.
80

Ivar son; Paper II
The EDX examination gave results typified by those in figure 12.
100
90 ' —•— Mild steel 1 mm
0 10 20 30 40 50 60 70 80
Distance from shell (um)
Figure 12. EDX analysis of a "stage 1" particle.
This EDX trace clearly confirms that the outer shell of the particles is made up of FeO and the lighter core is unoxidised iron.
81

Ivar son; Paper II
Stainless steel
From the microscopic examination the oxidation mechanism of the molten stainless steel particles was found to be simpler than that for mild steel. Figure 13 shows a general view of a typical sample of particles.
Figure 13. A general view of a typical sample of particles.
At first view figure 13 may appear very similar to the general view of mild steel particles shown earlier. In fact this is not quite the case. In the case of mild steel samples the most interesting aspect of the oxidation process was the formation of stage 3, the central large sphere of oxide. With stainless steel this stage does not occur. The dark central portions in some of the samples shown in figure 13 were found to be either pores or bakelite mount which had filled those pores. This point is demonstrated by figure 14.
Figure 14. Pores and bakehte-mount filled pores in the stainless steel particles.
82

I var son; Paper II
Examples of all the other "mild steel type" oxidation stages (1, 2, 4 + 5) were numerous and examples are given in figure 15.
Stage 1. An oxide shell surrounds a central metallic core.
Stage 2. Parts of the oxide shell break away and become suspended in the central molten metal core.
Stage 3. The oxide grows from the outside inwards and by collision of the particles in the molten metal until only isolated particles of metal remain.
Figure 15. Oxidation stages for stainless steel particles.
83

Ivar son; Paper II
It can be seen that the oxidation history for molten stainless steel is similar to that discussed for müd steel. The difference between the two histories is the absence of a large central sphere in the case of stainless steel. This absence is probably the result of the different surface tension forces at play in the (Fe2C>3, Cr203)(Fe, Cr) system as compared with the (FeO)(Fe) system.
CONCLUSION
1. During laser-oxygen cutting of steels, material leaves the cut zone as partially oxidised droplets which range in size from 50 um to 500 urn in diameter.
2. As the material thickness increases there is a tendency for the ejected droplets size to increase.
3. When cutting müd steel approximately 50% of the iron is converted to FeO during the cutting process. (ThermodynamicaUy the small percentage of Fe203 formed is insignificant).
4. The oxidation of the iron to FeO during the cutting of mild steel contributes approximately 40% of the energy supphed to the cut front (the laser provides the remaining 60%).
5. During the cutting of stainless steel approximately 30% of the iron in the material is oxidised to Fe203. Also we calculated that 30% of the chromium is oxidised to Cr2Ü3 although we estimate that the actual figure could be higher. The role of Ni oxidation is negligible by comparison to the highly exothermic iron and chromium reactions.
6. In the case of stainless steels, on average, the laser contributed 60% of the energy input to the cut zone. The remaining 40% was supphed by the iron and chromium oxidation reactions. (This 40% may be considerably larger if chromium oxidation is, as suspected, more extensive than 30% by weight).
84

Ivarson; Paper II
7. When examined, the müd steel particles were found to exist in five distinct oxidation stages:
L A sphere of iron surrounded by a shell of FeO.
2. A sphere of iron containing a suspension of FeO droplets and surrounded by a sheU of FeO.
3. A central sphere of FeO surrounded by an iron suspension of FeO droplets which is in turn surrounded by a shell of FeO.
4. Isolated particles of iron in an FeO matrix.
5. A, generaUy porous, completely oxidised spheroid.
(N.B. in aU cases a smaU proportion of Fe203 was present, generaUy as an outermost sheU)
8. Stainless steel particles feU into one of four groups:
1. A sphere of metal surrounded by an Fe203 and Cr2Ü3 sheU.
2. A sphere of metal containing a suspension of oxide particles surrounded by an oxide sheU.
3. Isolated particles of metal in an oxide matrix.
4. A completely oxidised spheroid mostly made up of Fe203, Cr 2 0 3 and NiO.
ACKNOWLEDGEMENTS
The authors would hke to thank the foUowing individuals for their advice and assistance; Professor Bo Björkman, Dr. Ture Lindbäck, Mr Håkan Persson and Mr. Johnny Grahn, aU at Luleå University of Technology. Mr. Lars Jonsson at Bohden Mineral AB. FinaUy, we would like to thank the Swedish National Board for Technical Development for providing funding for this work.
85

Ivar son; Paper II
R E F E R E N C E S
1. Powell, J . , Ivarson, A., Ohlsson, L. , Magnusson, C. "Energy Redistribution in Laser Cutting". Accepted for publication in Welding in the world 1992. (HW document No. IE 110-90).
2. Powell, J . , Menzies, I.A. "Metallurgical Implications of Laser Cutting Stainless Steels". Conf. Proc. Power Beam Technology, Brighton, U.K., 10-12 sept., 1986, pp. 269-284.
3. Thermochemical Properties of Inorganic Substences, Barin, L, Knacke, O. (Ed), Springer Verlag, Düsseldorf, ISBN 3-514-00125-1.
4. Binary Ahoy Phase Diagrams, Thaddeus B. Massalski (Ed), American Society for Metals, 1986, ISBN 0-87170-262-2, pp. 1087.
86

Ivarson; Paper III
Paper III
Optimisation of the Laser Cutting Process for Thin Section Stainless Steels
87
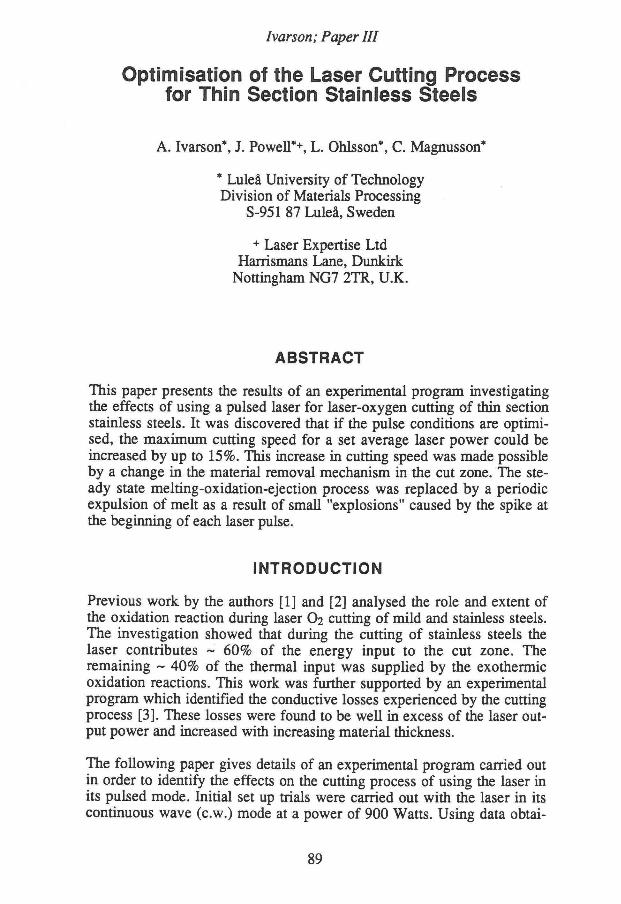
Ivar son; Paper III
Optimisation of the Laser Cutting Process for Thin Section Stainless Steels
A. Ivarson*, J. Powell**, L. Ohlsson*, C. Magnusson*
* Luleå University of Technology Division of Materials Processing
S-951 87 Luleå, Sweden
+ Laser Expertise Ltd Harrismans Lane, Dunkirk
Nottingham NG7 2TR, U.K.
ABSTRACT
This paper presents the results of an experimental program investigating the effects of using a pulsed laser for laser-oxygen cutting of thin section stainless steels. It was discovered that i f the pulse conditions are optimised, the maximum cutting speed for a set average laser power could be increased by up to 15%. This increase in cutting speed was made possible by a change in the material removal mechanism in the cut zone. The steady state melting-oxidation-ejection process was replaced by a periodic expulsion of melt as a result of small "explosions" caused by the spike at the beginning of each laser pulse.
INTRODUCTION
Previous work by the authors [1] and [2] analysed the role and extent of the oxidation reaction during laser 0 2 cutting of mild and stainless steels. The investigation showed that during the cutting of stainless steels the laser contributes ~ 60% of the energy input to the cut zone. The remaining ~ 40% of the thermal input was supplied by the exothermic oxidation reactions. This work was further supported by an experimental program which identified the conductive losses experienced by the cutting process [3]. These losses were found to be weh in excess of the laser output power and increased with increasing material thickness.
The foUowing paper gives detaüs of an experimental program carried out in order to identify the effects on the cutting process of using the laser in its pulsed mode. Initial set up trials were carried out with the laser in its continuous wave (c.w.) mode at a power of 900 Watts. Using data obtai-
89

Ivarson; Paper III
ned from these trials as a starting point a number of cutting experiments were carried out using the laser in its pulsed mode at different pulse frequencies and pulse lengths. These pulsed laser cuts were ah carried out at the same average power as the original c.w. trials (900 W). It wil l be demonstrated towards the end of this paper that for thin sections (1 + 2 mm) it is possible to change the mechanism of laser cutting under certain pulse conditions. This change in mechanism gives rise to an increase in efficiency which results in increased cutting speeds.
EXPERIMENTAL PROCEDURE
The basic experimental arrangement for this investigation is shown in figure 1.
Movement at <
cutting speed, v
Laser cutting head
Figure 1. A schematic of the experimental arrangement.
Cutting parameters used during this experimental programme are as foUows:
Table 1. Cutting parameters
Laser model: Rofin-Sinar 6000 Laser power: 900 W Lens focal length: 127 mm Nozzle diameter: 1.0 mm Stainless steel thickness: 1.0 and 2.0 mm Oxygen pressure: 2-10 bar Laser pulsing frequency: 100-2000 Hz Laser pulse mark:space ratio: 1:1 to 7:1
The laser was kept at an average power of 900 Watts throughout the experimental program.
90

Ivarson; Paper III
The composition of the stainless steel used is given in table 2. A 90 mm long cut was made along the centre line of a 100 mm * 100 mm plate in each case to produce a sample which would provide information about kerf width as weh as cut edge quahty.
Table 2. Stainless steel composition
Fe Cr Ni Mo S P Mn Si C wt(%) 65.875 18.0 10.5 2.5 0.03 0.045 2.0 1.0 0.05 At(%) 65.21 19.12 9.89 1.44 0.05 0.08 2.01 1.97 0.23
RESULTS AND DISCUSSION
Continuous Wave (c.w.) Set-up Trials
Preliminary set up trials carried out with the laser in its c.w. mode established the optimum gas pressures and maximum cutting speeds for the two thicknesses of material. The optimum gas pressure for any material-laser combination is a complex parameter dependant upon the geometry of the cutting nozzle and the cut front. Work by Fieret, Terry and Ward [4] has estabhshed that it is possible to decrease the pressure on the cut zone by increasing the supply pressure to the laser head. In experimental programs of this type the most reliable technique is to determine the optimum cutting pressure by cutting speed trials. The results of such trials carried out for 1.0 mm thick stainless steel are given in figure 2.
Figure 2. Cutting speed as a function of gas pressure for 1.0 mm thick stainless steel.
91

Ivarson; Paper III
The curve of figure 2 is typical of such "pressure:speed" experiments and foUows the findings of Fieret et al. [4]. It was decided to use a cutting pressure of 4.5 bar for the 1.0 mm material. Similar trials for the 2.0 mm material resulted in a choice of 9 bar as the cutting gas pressure. These two pressures gave the highest reliable cutting speeds together with good cut quality. The maximum cutting speeds recorded for the c.w. trials were:
For 1.0 mm material: 13.0 m/min (8.5 in/sec)
For 2.0 mm material: 6.0 m/min (3.9 in/sec)
The quality of the cut edges can be seen in figure 3.
Cutting direction M
Cutting direction ^
Figure 3. Photographs of the cut edges of 1.0 and 2.0 mm thick stainless steel cut at maximum speed with a c.w. laser power of 900 W.
The increase in pressure from 4.5 bar to 9 bar in the case of 2.0 mm was necessary in order to minimize dross adhesion to the lower edge of the cut.
Pulsed Laser Cutting
During this part of the experimental programme the optimum pulse settings for maximum cutting speed were established. A wide range of pulse frequencies and pulse lengths were investigated for both thicknesses of material. In each case the optimum pulse frequency was established first
92

Ivarson; Paper III
using a 1:1 mark-space (on-off) ratio at an average power of 900 Watts. Once the frequency was identified, a further series of cutting trials was carried out using different pulse lengths. These "pulse length" trials were aU carried out at the optimum pulse frequency and with the average power constant at 900 Watts.
Figure 4 shows the results of the "pulse frequencyxutting speed" investigation for the 1.0 mm thick material. It can be clearly seen that the maximum cutting speed of 13.9 m/min (9.1 in/sec) was achieved at a pulse frequency of 600 Hz. Using this pulsing frequency the laser pulse time was varied in the range from 0.84 ms to 1.46 ms. The cutting speeds available from each pulse length can be seen in figure 5.
14-
8^ u & BO
6 2
0- 1 1 1 j 1 1 1 j 1 1 1 1 1 1 1 j 1 1 1 1 1 1 1 1 1 1 1 1 I I i 1 1 1 1 1 I I i
Stainless steel 1.0 mm ower: 900 W
Gas: Oxygen Pressure: 4.5 bar Mark:space: 1:1
1 8 8 § 8
OO C 5 TS VO OO
Laser pulsing frequency (Hz)
Figure 4. Cutting speed as a function of laser pulsing frequency for 1.0 mm thick stainless steel (mark:space; 1:1).
1 6 ,
" " I " " I " " i " " i " " i " 0,9 1 1,1 1,2 1,3 Laser pulse length (ms)
Stainless steel 1.0 mm Power 900 W Pulse frequency: 600 Hz Gas: Oxygen Pressure: 4.5 bar
1,5
Figure 5. Cutting speed as a function of laser pulse length for 1.0 mm thick stainless steel (f=600 Hz).
93

Ivarson; Paper III
Figure 4 indicates that maximum cutting speeds are greatly reduced when low pulse frequencies are employed. The reason for this reduction in cutting speed can be attributed to two effects:
1. At low pulse frequencies (and using a mark:space ratio of 1:1) there is enough time between pulses for the material to substantially cool down between pulses. This cooling process helps to extinguish the exothermic oxidation reaction and reduces the overall efficiency of the cutting process
2. When pulsed cutting is optimised each pulse effectively drills a hole through the material and these overlapping holes form the cut line. In the case of low frequency pulsed cutting the pulses are excessively large to produce a single hole. The first part of the pulse to interact with the material pierces the material and the remainder of the pulse passes straight through the drilled hole without interacting with the workpiece. In this way a substantial amount of the laser energy is wasted.
As the pulse frequency is increased towards 600 Hz the pulses are large enough only to pierce the material without wastage. Also the pulses are close enough together to inhibit inter pulse cooling.
At higher frequencies than the optimum for this laser-material combination (i.e. >700 Hz) the pulses are of insufficient energy to fully pierce the material. As the pulses become smaller and more frequent the laser-material interaction reverts to the c.w. type with a constant melting-oxidation-ejection event taking place (see general note at the end of this paper).
This progression form individual hole drilling at the optimum pulse frequency to c.w. type cutting can be clearly seen in figure 6 which shows the 600 Hz cut edge in comparison with the 2000 Hz cut.
94

Ivarson; Paper III
Cutting direction <
600 Hz (markrspace; 1:1)
Cutting direction •
2000 Hz (mark:space;l:l)
Figure 6. A comparison between pulsed laser cut edges at 600 Hz (pulsed drilling) and 2000 Hz (c.w. type cutting).
Comparison of figures 6 and 3 shows that the cut carried out at a pulse frequency of 2000 Hz bears a close resemblance to the c.w. cut shown in the earlier figure.
Figure 5 demonstrates that there is an optimum pulse length for high speed cutting in the same way as there is an optimum pulse frequency. The maximum cutting speed is possible at a laser pulse length of 1.1 ms (which represents a mark:space ratio of 2:1). This new maximum speed of 15.0 m/min (9.84 in/sec) represents an increase over the c.w. value (13.0 m/min) of 15%.
At pulse lengths below this optimum value of 1.1 ms the cutting speed is reduced as a result of inter pulse cooling of the cut zone. Using pulse lengths greater than the optimum the maximum cutting speed possible falls off rapidly. To understand this phenomenon it is important to consider the pulse shape and the mark:space ratio of the pulses. At a pulse length of 1.4 ms and a frequency of 600 Hz the laser is on for 85% of the time. Under these conditions the pulse shape wih change in the manner shown schematically in figure 7.
95

Ivarson; Paper III
A mark: space ratio
= 2:1
N " " / ^ ^ ? S Average
time B
mark: space ratio = 5:1
S? u c W
Average
time
Figure 7. A comparison of laser output pulse characteristics at a constant frequency and average power but with increasing pulse length.
Figure 7A shows that at a mark:space ratio of 2:1 the pulses are individual events although there is no real " o f f time. This is because the electrical discharge in the plasma tubes takes a certain amount of time to decay to zero and therefore the lasing reaction can not be turned off instantaneously. A typical laser pulse has a large initial spike followed by a plateau followed by a gradual decay as shown in figure 7A. If pulses are generated so close together that the lasing reaction has no time to decay then an output similar to that shown in figure 7B can be expected. In this case the pulsing acts as a periodic fluctuation in an essentially continuous wave output (see general note at the end of this paper). The areas under the graphs in figure 7A and B are equal, to represent an equal average power but it can clearly seen that the sharp spike at the beginning of the pulse is only available when the pulses are adequately separated. It is this sharp spike which accelerates the material removal process and therefore improves cutting speeds.
96
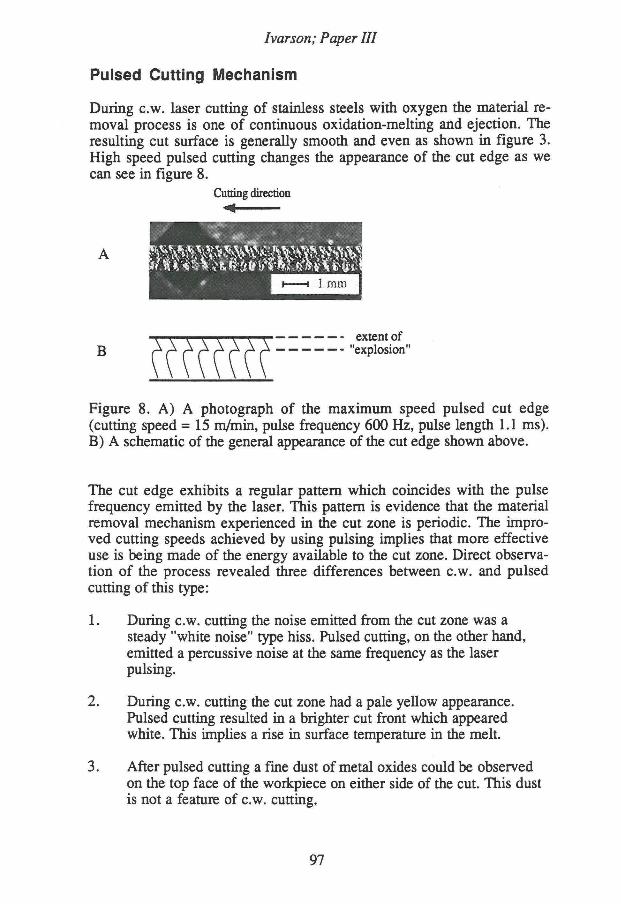
Ivar son; Paper III
Pulsed Cutting Mechanism
During c.w. laser cutting of stainless steels with oxygen the material removal process is one of continuous oxidation-melting and ejection. The resulting cut surface is generaUy smooth and even as shown in figure 3. High speed pulsed cutting changes the appearance of the cut edge as we can see in figure 8.
Cutting direction
Figure 8. A) A photograph of the maximum speed pulsed cut edge (cutting speed =15 m/min, pulse frequency 600 Hz, pulse length 1.1 ms). B) A schematic of the general appearance of the cut edge shown above.
The cut edge exhibits a regular pattern which coincides with the pulse frequency emitted by the laser. This pattern is evidence that the material removal mechanism experienced in the cut zone is periodic. The improved cutting speeds achieved by using pulsing implies that more effective use is being made of the energy available to the cut zone. Direct observation of the process revealed three differences between c.w. and pulsed cutting of this type:
1. During c.w. cutting the noise emitted from the cut zone was a steady "white noise" type hiss. Pulsed cutting, on the other hand, emitted a percussive noise at the same frequency as the laser pulsing.
2. During c.w. cutting the cut zone had a pale yehow appearance. Pulsed cutting resulted in a brighter cut front which appeared white. This implies a rise in surface temperature in the melt.
3. After pulsed cutting a fine dust of metal oxides could be observed on the top face of the workpiece on either side of the cut. This dust is not a feature of c.w. cutting.
97

Ivarson; Paper III
These three phenomena of pulsed cutting imply that periodic vaporisation is a feature of the cutting process. The vaporisation itself is likely to be directly responsible for only a small percentage of the material mass removal but it wih have the effect of accelerating hquid removal from the cut front.
The material removal mechanism suggested by the present authors involves the periodic "explosion" of the top part of the cut front as a result of exposure to an incoming "spike" of laser energy at the beginning of a pulse (see figure 7A). This locahsed "explosion" generates only a small amount of vapour but has the effect of reinforcing the action of the oxygen jet acting coaxiaUy with the laser beam. The two forces acting together remove the material at a higher rate than is possible by c.w. methods and thus cutting speeds can be increased.
Our discussion so far has concentrated upon the one millimetre thick material because at this thickness the results and discussion demonstrate the principle of pulsed cutting very clearly. The two millimetre material gave complementary results although the increase in cutting speed was only 5% over the c.w. values. The best pulsed conditions for the 2.0 mm material were; pulse frequency = 300 Hz, pulse length = 1.67 ms and an oxygen pressure of 9 bar. The maximum cutting speed possible was 6.3 m/min (4.12 in/sec). The type of cut edge generated can be seen in figure 9.
Cutting direction
A
B extent of
"explosion"
Figure 9. A) A photograph of the maximum speed pulsed cut edge of 2.0 mm thick stainless steel (cutting speed = 6.3 m/min, pulse frequency 300 Hz, pulse length 1.67 ms). B) A schematic of the general appearance of the 2.0 mm thick stainless steel cut edge.
98

Ivarson; Paper III
Comparison of figures 9A and 8A shows that the "exploded" upper portion of the cut edge is a smaller percentage of the removed material in the case of the 2.0 mm thick sample. This will account for the reduction in effectiveness of the "explosion" in assisting melt removal.
Comments on Cutting Thicker Materials
Although pulsed cutting has been shown to improve cutting speeds for thin section stainless steels the principle is not necessarily effective for thicker grades. The reasons for this reduction in effectiveness include the foUowing:
a. There must be a certain balance between the volume of material vaporised by each pulse and the total amount of hquid which needs to be expeUed from the cut zone. If the vaporised portion is ~ 20% - 30% then enough thrust is generated to improve the material removal rate of the molten material. For thin section stainless steels this level of vaporisation is easüy achieved as we have shown. Vaporising 20% - 30% of a 5 mm thick section would involve very high energy pulses which are difficult to generate at the frequencies required for high speed cutting. Each pulse is required to fuUy pierce the material and when high energy pulses are being used to achieve this penetration the cutting speed becomes limited by the repetition rate of the laser at that pulse energy.
b. In the case of thin section stainless steels the periodic vaporisation of the top layer of the cut has the side effect of helping to eject underlying melt. In general however, vaporisation of metals is less energy efficient than the melting-oxidation process usuaUy employed during c.w. laser cutting. As thicker sections are cut by the pulsed laser technique the amount of material needed to be vaporised grows considerably (kerf width tends to increase with material thickness). As more of the laser energy is consumed by the vaporisation process less is available for general melting of the cut zone material. This wiU have the effect of making the cutting process less efficient.
In spite of these arguments it is possible that multikilowatt pulsed lasers could have their performance improved by adapting the techniques presented here for thicker section stainless steel.
99

Ivar son; Paper III
General Note
Although this experimental program was used to investigate one specific type of pulsed laser-oxygen cutting of stainless steel, there is another technique which has shown benefits in certain applications. In some circumstances the melt pool generated during c.w. oxygen cutting of stainless steels can become intrinsicaUy unstable. This often happens when thicker sections (6 mm, 1/4" or more) are being profiled and generaUy gives rise to a poor quality cut. The situation can be improved by pulsing the laser at relatively high frequencies or with very short "laser o f f times. This type of pulsing, demonstrated in figure IB, does not improve cutting speeds but helps to stabüise the melt pool and results in improved quahty.
CONCLUSIONS
1. Using a constant laser average power it is possible to accelerate the cutting process by using a pulsed laser beam when cutting thin section stainless steel by the laser-oxygen method.
2. I f the pulsed conditions are optimised in the manner outlined in this paper it is possible to change the usual melting-oxidation-ejection steady state, to a periodic explosive ejection of material from the top part of the cut. The mechanical energy of this locahsed explosion assists the expulsion of hquid material lower down the cut face and thus increases cutting speed.
3. Using lasers in the usual range of powers for cutting (500 - 1500 Watts) this method of pulsed cutting only gives superior cutting speeds on thin section stainless steel (e.g. up to 2 mm)
ACKNOWLEDGEMENTS
The authors would hke to thank the foUowing individuals for their advice and assistance; M.Sc. Hans Engström, Mr. Göran Åberg for ah help in the laser laboratory and Mr. Johnny Grahn for the SEM investigation. FinaUy we would like to thank the Swedish National Board for Technical Development for providing fundings for this work.
100

Ivarson; Paper III
R E F E R E N C E S
1. Ivarson, A., Powell, J . , Magnusson, C. "The Role of Oxidation in Laser Cutting Stainless and Mild Steel". Journal of Laser Apphcations, Vol 3, No 3, 1991, pp. 41-45.
2. Powell, J . , Ivarson, A., Magnusson, C. "Laser Cutting of Steels; Analysis of the particles ejected during cutting". Welding in the World, Vol. 30, No. 5/6,1992, pp. 116-125.
3. Powell, J . , Ivarson, A., Ohlsson, L . , Magnusson, C. "Energy Redistribution in Laser Cutting". Accepted for publication in Welding in the World 1992. (HW document No. IE 110-90)
4. Fieret, J . , Terry, M.J., Ward, B.A. "Aerodynamic Interactions during Laser Cutting". Proc. of SPIE 1986 Int. Symposium on Optical and Opto-Electronic Applied Science and Engineering, Québec City, Canada, 3-6 June 1986, pp. 53-62.
101

Ivarson; Paper PV
Paper IV
The Oxidation Dynamics of Laser Cutting of Mild Steel and the
Generation of Striations on the Cut Edge
103

Ivarson; Paper N
The Oxidation Dynamics of Laser Cutting of Mild Steel and the Generation of Striations
on the Cut Edge
A. Ivarson*, J. Powell**, J. Kamalu*, C. Magnusson*
* Luleå University of Technology Division of Materials Processing
S-951 87 Luleå, Sweden
+ Laser Expertise Ltd. Harrimans Lane, Dunkirk
Nottingham NG7 2TR, U.K.
# University of Dundee Dept. of APEME
Dundee DDI 4HN, Scotland, U.K.
INDUSTRIAL SUMMARY
Over the past two decades CO2 laser cutting has grown from an obscure laboratory technique into an important branch of manufacturing engineering. The most commonly cut materials are steels and a great deal of industrial and scientific research has been carried out on the laser-material interactions which generate a cut. This paper concentrates on the phenomena which give rise to a cyclic cutting event when a CO2 laser in conjunction with an oxygen jet is used to cut mild steel. The nature of the cut edge striation produced by the cychc oxidation reaction is thoroughly explained and a possible oxidation cycle is postulated. It is demonstrated that the key to understanding the cychc nature of the cutting event is the self limiting nature of the oxidation of the steel in the cut zone.
ABSTRACT
This paper begins by explaining the nature of the striations generated on the cut edge of laser-oxygen cut mild steel. This detailed description of the striations and their possible formation mechanisms is followed by a theoretical discussion which concentrates on the oxygen gradients in the cut zone. The theoretical discussion supports and enlarges upon earlier work by Miyamoto and Arata et al. It is postulated that the iron oxidation reaction is self limiting as a result of changing oxygen gradients and par-
105

Ivarson; Paper PV
tial pressures within the melt. This self limitation of the reaction gives rise to a stop-start burning cycle in the cut zone which results in the formation of cut edge striations.
INTRODUCTION
Earlier work by the present authors [1] and [2] identified the chemistry of the particles ejected from the cut zone during oxygen assisted laser cutting of mild steels. The results of this work demonstrated that the material ejected from the cut zone was almost entirely made up of iron and FeO and that approximately half the iron had been oxidised. The oxidation of iron has two major effects on the cutting process; a) It supphes heat to the cut zone and b) It generates a low viscosity, low surface tension melt which does not adhere well to the solid material and is therefore easily removed from the cut zone. Direct observation of any laser-oxygen cut mild steel edge reveals that a regularly spaced pattern of striations exist as shown in figure 1. This repeating pattern is direct evidence that the cutting mechanism is cychc in nature.
Cutting direction ^
Figure 1. A typical cut edge generated in thin section (1.25 mm) mild steel cut by a CO2 laser in conjunction with an oxygen jet.
The first substantial work on this cychc reaction was carried out at Osaka University by Arata, Miyamoto et al. [3] and [4]. Although this work postulated an ignition-extinction cycle, as shown in figure 2, no clear explanation has ever been given for the extinction event. The ignition part of the cycle is much easier to understand because a focused high power
106

Ivarson; Paper PV
laser beam in conjunction with an oxygen jet will inevitably cause a mild steel sheet to exothermicaUy oxidise.
cf I •g 3 U I
Ignition Burning Extinction Generation of striations
Figure 2. A schematic of the cychc nature of laser-oxygen cutting of mild steel [3], [4].
In spite of the incompleteness of the Osaka model it still gives the most widely accepted argument for the generation of striations which are a common feature of ah mild steel cuts. It is the aim of this work to discuss the variations influences and phenomena which can extinguish the burning event initiated by the laser-oxygen combination. To open the discussion the authors would like to discuss the nature of striations themselves and to rule out a number of possible sources of their generation.
THE NATURE OF STRIATIONS
The foUowing section wiU deal with a number of fundamental features of striations and their generation as a series of statements and supporting comments. It should be clarified at this stage that the striations under discussions are of the primary type only. These primary striations can be observed throughout the cut depth of the material where thin section mild steel is cut by a laser-oxygen jet combination, see figure 1. When thicker sections are cut (i.e. more than ~2 mm), these primary striations generaUy cover only the top portion of the cut edge as shown in figure 3. The lower edge of the cut is covered in a secondary striation pattern which is less regular than the primary pattern but seems to be derived from it. The authors intend to investigate these secondary striations in future work. Throughout the remainder of this work any reference to striations should be taken to mean primary striations of the figure 1 and top of figure 3 type.
107

Cutting direction
Ivarson; Paper PV
Figure 3. A cut edge which shows primary (top half) and secondary (bottom half) striations.
Statement 1
"The striations are regularly spaced partial sections of ellipses", see figure 4.
The work of Arata, Miyamoto et al. referred to the generation of circular burn fronts and although this simplification is useful analyticaUy it is not entirely accurate. Experimental evidence shows that; a) The distance between striations (X in figure 4) increases with increasing cutting speed and b) the kerf width (k in figure 4) decreases with increasing cutting speed. These changes alter the geometry of the striation profiles which must therefore be described by a range of eUipses.
(x,y)
Figure 4. A schematic of the partial eUipse geometry of striations.
108

I var son; Paper PV
The variation of X and k can be expressed as changes in the major and minor axes of an eUipse (see figure 4). I f X and k are known the eUipse axes can be calculated from the basic equation for an eUipse as foUows
2 2 — + 2 - = l a 2 b 2
(1)
When y = 0;
IT = i (2) therefore, — = a (3)
For position (x,y) in figure 4;
- A f -,2 = 1 (4)
b = ( k / 2 - A ) '
( k / 2 r
(5)
This argument is supported by an experimental investigation carried out by the authors cutting 1.5 mm and 2.5 mm mild steel with a laser power of 400 Watts (Coherent Evelase 525:2). Cuts were made in both materials over a range of speeds from approximately half the optimum to just over the maximum cutting speed (e.g. 2.5 mm mild steel; Optimum cutting speed 21 mm/s, maximum 25 mm/s. Experimental range; 12.5-27 mm/s). Talysurf profiles taken along a line 0.5 mm from the top of the cut edge for the 2.5 mm samples are given in figure 5.
109

I var son; Paper PV
M Cutting speed, v=12.5 mm/s ^=102 \im
S 40-
1 P 1 1 T 1 1 1 1 1
S 40-1
•g 20>
1 2 3 4 5 6 7 8 9 10 (mm)
Cutting speed, v=16.7 mm/s X^llOum
1 2 3 4 5 6 7 8 9 10 (mm)
40'
201
Cutting speed, v=20.8 mm/s X= 120 urn
2 401 u •g20
i r
1 2 3 4 5 6 7 8 9 10 (mm)
Chitting speed, v=25 mm/s X=134 urn
I * 1 201
1 2 3 4 5 6 7 8 9 10 (mm)
Cutting speed, v=26.7 mm/s X=141 urn (not full penetration cut)
1 2 3 4 5 6 7 8 9 10 (mm)
Figure 5. Talysurf analysis of 2.5 mm mild steel cuts (trace taken 0.5 mm from top of cut edge).
The regularity of the striation event is quite clear as is the gradual increase in the striation wavelength (k) with cutting speed. The maximum kerf width measurements for these cuts and the 1.5 mm thick samples are given in figure 6 (these represent values for k in figure 3).
110

Ivarson; Paper IV
1,5 mm mild steel
2,5 mm mild steel
in i|n • 1111 I I i im [in i|n up ni[ nu i I I 111 I I I I
O 5 10 15 20 25 30 35 40 45 50 Cutting speed (mm/s)
Figure 6. Kerf widths for 1.5 mm and 2.5 mm mild steel.
From the decrease in kerf width with increasing cutting speed shown in figure 6 and the increase in X as shown in figure 5 it is now possible to calculate the eUipse geometry of the striation event (a+b) as described in figure 4. These calculations give the values shown in figure 7 and these results can be expressed as in figure 8 which demonstrates the changes in eUipse geometry with cutting speed.
I 111 111 I 111 111 I H 111 11 I [ 1 1 111 11
• a for 1,5 mm mild steel
—• - b for 1,5 mm mild steel
- A - a for 2,5 mm mild steel
b for 2,5 mm mild steel
5 10 15 20 25 30 35 40 45 50 Cutting speed (mm/s)
Figure 7. Dimensions of elhptical burn patterns versus cutting speed.
I l l

Ivarson; Paper PV
X (Ratio 1:1 i.e. circular event)
• 1,5 mm mild steel
—•— 2,5 mm mild steel
fn • • i in 11 I I I I i in i|i in i I I 111 in • 111111 I I I 111 in i
0 5 10 15 20 25 30 35 40 45 50 Cutting speed (mm/s)
Figure 8. The change in aspect ratio (a/b) of the elhptical burn patterns with cutting speed (for a clarification of a and b see figure 4).
The results show clearly that the striations are partial ellipses and also reveal one other important point about their generation which wih form our next statement:
Statement 2
"The generation of striations is not determined by a simple time dependant osciUation".
This statement is supported by the fact that the increase cutting speed of 100% from 12.5 mm/s to 25 mm/s shown in figure 5 is associated with an increase in X of only 31% from 102 urn to 134 p.m. I f the striation formation was due to a simple time dependant osciUation such as a power ripple in the laser supply then a doubling of the cutting speed would double the event wavelength on the cut edge. This does not happen in practice.
Statement 3
"The cusp of each striation is not made of resolidified material but represents the interface between the solid workpiece and the cut zone".
This statement is supported by figure 9 which shows an electron micrograph of a cut sample which had its top surface abraded before cutting.
112

Ivarson; Paper PV
Figure 9. An electron micrograph of a steel sample whos surface was abraded prior to cutting.
The continuation of the grinding lines right up to the edge of each striation shows that the cusps of the striations were not melted during cutting. This evidence undermines any theoretical argument based on striation formation as a result of resolidification phenomena or liquid phase rippling etc.
Statement 4
"Gas dynamics and shock waves set up in the cut zone are not primarily responsible for the geometry of the striations".
This point is more conjectural than statements 1-3 but it is supported by experimental evidence:
a) The oxygen pressure supplied to the cut zone can be changed by ±10% of the optimum value without changing the striation geometry.
b) The fastest cut shown in figure 5 has a similar striation geometry to the other samples at the top of the cut even though the cut was not fully penetrating. This partial closure of the bottom of the cut by liquid material would seriously effect the gas dynamics in the cut zone but has not changed the striation generation mechanism.
113

Ivarson; Paper PV
Statement 5
"There is no evidence to suggest that at a certain (high) cutting speed the cyclic reaction becomes steady state and a smooth cut edge is generated".
Although the idea of striation suppression as a result of steady state cutting has been postulated by a number of workers this has not been confirmed experimentally. Striations are stiU clearly apparent on the cut edges produced at the maximum possible speed for any laser-material combination. This point is clearly demonstrated in figure 5 where the striations show no signs of disappearing even though the maximum full penetration cutting speed (25 mm/s) is exceeded.
Statement 6
"Evaporation plays an extremely minor role in the removal of material from the cut zone and is not responsible for striation generation".
Direct observation of the cutting zone with digital optical pyrometry equipment has identified the surface temperature of the mild steel cut front to lie in the range from 1900K to 2300K which correlates well with the results of Miyamoto and Maruo [4]. The temperature increases from one end of the scale to the other as the cutting speed is increased (i.e. the average cutting front temperature is higher for thinner materials as they are cut at higher speeds).
Over this range of temperature the iron and the oxide mixture in the cut zone wih not experience boiling and vapour evolution wül be minor. This can be confirmed by simply observing the process. The colour of the cut zone wiU be a shade of yellow indicative of the temperature range mentioned. I f a substantial amount of boiling was taken place the cut zone would appear blue/violet in accordance with the required temperatures of approximately 3000K. This blue/violet colour can be observed during the laser welding process which is known to involve a boiling mechanism.
Statement 7
"For the purposes of striation generation the laser beam can be assumed to be merely a preheating device which initiates and accelerates the oxidation reaction".
Striation generation is not an optical phenomenon. Changes in the beam geometry (by defocusing etc.) or power will have an effect on the striation geometry but this will be a secondary thermal effect rather than an optical one. The principle is supported by the fact that flame cutting uses an oxygen/pre heat combination and also generates striations simUar to
114

Ivarson; Paper PV
those observed in laser cutting in the absence of any possible optical effects.
Conclusions from Statements 1-7
The information provided in statements 1-7 suggests that the primary formation mechanism of striations is not one of the foUowing:
a) Resolidification process
b) Gas dynamics
c) Melt boüing
d) Optical effects
e) Time based fluctuations of power input etc.
The most likely sources of the formation mechanism are therefore:
a) Chemical thermodynamics in the iron-oxygen system
and
b) Viscosity and surface tension effects associated with the melt removal.
These areas wül be discussed in the foUowing theoretical section.
A THEORETICAL DISCUSSION OF STRIATION GENERATION
The basic problem to the analysis of striation generation is to identify why a strongly cychc reaction should be established even though the available input energy (laser + oxygen stream) remains constant. In the interests of clarity the following discussion will deal with the subject using a qualitative phenomenological approach. This simplified approach often involves one variable at a time even though the variables themselves (reaction rate, temperature, diffusion coefficient etc.) are inter-related. Figure 10 shows what the basic situation is in the cut zone at any time.
115

Ivarson; Paper IV
Liquid Cutting direction
\ \ \ \ \ \ '
/ * / * * * • * / / / / / / / 4 *******
\ \ \ \ \ \ \ \ ,
/ / . . . / / , \ \ \ \ \ \ \ \ . ******** ******* A
\ \ \ \ \ \ \ \ fc
FeO:
:+02:: :-:-:o2;
Figure 10. A schematic of the basic chemical situation in the cut zone.
The laser and oxygen jet (to the right in figure 10) heat and oxidise the material generating a chemical gradient within the melt from fully oxidised iron (FeO) on the outside surface to unoxidised iron on the inside near the liquid-sohd interface. If the situation described by figure 10 was a steady state then striations would not be generated on the cut edge.
The primary cause of the fluctuations which generate the striations can be found by analysis of the oxidation dynamics of the cycle described by Arata, Miyamoto et al. (figure 2). It was mentioned earlier that it is a straight forward matter to understand that a focused laser beam in conjunction with an oxygen jet is capable of initiating the burning reaction. Analysis of the oxygen transport phenomena needed to sustain this reaction can explain the more complex extinction part of the cycle in the following way:
In the absence of a chemical reaction the concentration of oxygen at a distance x from interface 4 (see figure 10) could be expressed as:
dC=d_
dt dx dx (6)
where C = Oxygen concentration t = Time
x = Distance D = Diffusion coefficient
This would give a concentration gradient with a smooth curve of the type shown schematically in figure 11.
116

Ivarson; Paper PV
Oxygen poor Distance, x Oxygen rich interface interface
Figure 11. The type of concentration gradient curve given by equation (6).
When a chemical reaction is involved however, the curve of the concentration gradient changes as the reaction consumes a proportion of the gas and gas transportation is thereby slowed down. In the case of oxygen travelling through molten iron the strongly exothermic oxidation reaction Fe + I/2O2 —> FeO takes place all the time and the solubility of oxygen in iron is very low (1.5 At% at cut front temperatures of -2000K). The transportation of oxygen through liquid iron is therefore rather slow until the material is oxidised.
Referring back to figure 10 we can see that the oxygen gradient has the effect of producing three types of melt in the cut zone:
1. Oxygen rich FeO (interface 4 to 3)
2. An FeO/Fe mixture (interface 3 to 2)
and
3. Liquid iron (interface 2 to 1)
The oxygen gradient across the FeO at any time wih follow the type of curve determined by equation (6) and shown schematically in figure 11. However, the change in oxygen gradient across interface 3 wih not follow this smoothly descending curve. At this interface the chemical constitution of the melt is FeO with surplus oxygen to the right (in figure 10) and surplus iron towards the left. Oxygen crossing this interface from right to left wih have its progress impeded as it is consumed by reaction with the iron. This oxygen consumption gives rise to a much steeper gradient
117

Ivarson; Paper PV
between interfaces 3 and 2 determined by a variant on equation (6) which can be expressed as follows:
where the new factor F(C) accounts for the slowing of gas transport as a result of the consumption of the oxygen by reaction with iron. F(C) is a variable which is dependant on the concentration, temperature etc. as shown in the foho wing relationship:
F(C) = e- ( A / R T ) C(t) (8)
where A = Heat of activation of the reaction R = Gas constant T = Temperature C = Oxygen concentration
The overall gradient of oxygen concentration across the different zones can now be shown schematically, see figure 12.
Figure 12. A schematic of the oxygen gradient in the cut zone.
Figure 12 proposes a reaction front situated at interface 3. The movement of such a reaction front during the burning process which generates one striation can now be drawn schematically together with the changes in oxygen gradient.
118

Ivarson; Paper PV
1. Ignition
2. Burning
Fe Fe Fe+ FeO O2 FeO
O2
(solid) ( l iq : (Uquid) (Uquid) (gas)
3. Extinction
Oxygen ( A t % )
gradient
Fe Fe Fe+ FeO O2 FeO +O2
O2
( s o ü d ) (Uquid) (Uq) ( l iquid) (gas)
I
4. Re-igltition l 2 3 4 Mater ia l removed by gas je t
1 1 1 1 Fe
(solid)
Fe
(l iq)
Fe+ FeO ( l iq)
FeO
(Uq)
O2
(gas)
: \'/\ -
Interface 1 = M e l t f r o n t Interface 3 = Reaction f ron t
100%
' 5 0 % 2 t
a d f ^ ( A t % )
0%
Figure 13. The movement of the reaction front during one striation generation cycle.
Figure 13 shows the progression of the various interfaces during the oxidation cycle and provides a clue to extinction of the reaction. The reaction of iron to iron oxide can be assumed to take place at interface 3 when free oxygen joins with the free iron in the Fe+FeO mixture. The rate of this reaction is governed by the local pressure of the oxygen which is, in turn, determined by the oxygen gradient in the FeO+02 mixture between interfaces 3 and 4. As the distance between interfaces 3 and 4 grows dur-
119

Ivarson; Paper PV
ing the burning reaction the oxygen gradient decreases and the driving force behind the reaction diminishes.
The driving force behind the oxidation reaction is the Gibbs free energy which is related to the oxygen partial pressure as foUows:
AG = RTlog epo2 (9)
where R = Gas constant (8.314 J / molK)
T = Temperature (K)
Po2 = the oxygen partial pressure (atm)
When the oxygen partial pressure falls below a specific critical value for a given temperature the oxidation reaction wiU terminate. The EUingham diagram [5] can be used to estimate the critical pressure and in this case the value is in the order of ~10-7 bar (the temperature has been assumed to be close to the experimentally measured value of ~2000K).
Although figure 13 in combination with the above argument helps to explain the ignition-burning-extinction cycle it does not elaborate on the reasons behind the physical removal of material from the cut zone. The propulsive forces action to remove the melt are twofold:
a) Gravity
and
b) The kinetic energy of the oxygen jet in contact with the hquid surface.
The effectiveness of the removal mechanism increases dramatically during the burning part of the cycle as the result of a number of super imposed effects:
A. The viscosity of the melt decreases as the reaction progresses.
B. The surface tension of the melt decreases as the reaction progresses.
C. The volume of liquid to be removed increases as the reaction progresses.
120

Ivarson; Paper PV
Discussing these effects one at a time:
A. Viscosity
The viscosity of the molten iron and iron oxide (FeO) can be calculated from the foUowing equations [4], [6]:
Iron
T) = rioeCB/RT»
where t\q = 0.3699 mNs/m2
B =41.4 kJ/mol R = 8.3144 J/molK T = Temperature (K)
(10)
for FeO
T] = 1.1*10-5 e(25200/D ( I D
These equations give rise to the curves presented in figure 14.
14.
£10-
in
8 4.
- Fe (liquid)
j X . - • - FeO
r - " - * - * - *
1800 1850 1900 1950 2000 Temperature (K)
Figure 14. The viscosity of iron and iron oxide as a function of temperature.
The range of temperatures experienced by the various melts in the cut zone is from -1800K at the liquid-solid interface (interface 1, figure 13) to ~2000K on the surface (interface 4, figure 13). In the fully or partially oxidised regions (interfaces 2-4, figure 13) the temperature can be
121

Ivarson; Paper PV
assumed to be between 1900K and -2000K. Figure 14 therefore implies that the entire melt has a viscosity between ~6 and ~3 mNs/m2 (cp). This fairly uniform low value is responsible for two phenomena:
a) The ease of melt removed at low incident gas pressure (e.g. 1.0 to 3.0 bar)
and
b) The fact that pure iron is ejected in almost the same amounts as iron oxide [2]. The ejected spherical particles are usually a mixture of both iron and iron oxide which separate out on sohdification to give an iron rich core and oxide rich sheh, see figure 15.
Figure 15. A cross section of a typical particle ejected from the cut zone showing an iron oxide sheU surrounding an iron core [2].
B. Surface tension
There is a substantial difference between the surface tension of iron and that of iron oxide [5]:
Material Temperature Surface tension (K) (mN/m)
Fe 1800 1872 FeO 1700 585
Although exact figures are not available for these materials at the slightly higher temperatures experienced within the cut zone it is clear that the surface tension of FeO wih be substantially lower than that of iron. This wih have an effect on the internal structure of the mixture of Fe and FeO between interfaces 2 and 3 of figure 13. Within this mixture the iron wil l
122

Ivarson; Paper PV
tend to form spheres in the matrix of iron oxide in order to reduce the internal energy of the system. These iron spheres are -40% denser than the surrounding FeO and wül fall through the melt and may act as initiators to ejected particle formation. This theory is supported by the cross sectional chemistry of the ejected particles as demonstrated by figure 15 which shows an iron rich core surrounded by an oxide shell.
C. Liquid volume increase
It is clear from figure 13 that the volume of molten material in the cut zone wih increase during the burning reaction. As the distance between interfaces 1 and 4 increases the combined action of gravity and the oxygen jet wih tend to shear the melt from the hquid-solid interface (interface 1).
CONCLUSIONS
1. During oxygen-laser cutting of mild steels striations are generated on the cut edge. Some aspects of these striations are identified in statements 1-7 at the beginning of this paper.
2. The primary formation mechanism of striations is not one of the foUowing:
a) Resohdification process b) Gas dynamics c) Melt boiling d) Optical effects e) Time based fluctuations of power input etc.
3. The most likely sources of primary formation mechanism are:
a) A cyclic variation in the driving force of the oxidation reaction. This variation is brought about by changes in the oxygen partial pressure in the cut zone melt.
and
b) Viscosity and surface tension effects associated with melt removal.
4. An explanation of the extinction part of the oxidation cycle has been identified based on the changing oxygen gradient in the cut zone (see figure 13).
123

I var son; Paper PV
ACKNOWLEDGEMENTS
The authors would like to thank Professor Bo Björkman for inspiring discussions during the work, Mr. Greger Wiklund for help with computer scanning operations and Mr. Johnny Grahn for SEM investigations, ah at Luleå University of Technology. Finally we would like to thank the faculty board at Luleå University of Technology.
R E F E R E N C E S
1. Ivarson, A., Powell, J . , Magnusson, C. "The Role of Oxidation in Laser Cutting Stainless and Mild Steel". J. of Laser Applications, Vol. 3, No 3 (1991), pp. 41-45.
2. Powell, J . , Ivarson, A., Magnusson, C. "Laser Cutting of Steels; Analysis of the particles ejected during cutting". Welding in the World, Vol. 30, No. 5/6, 1992, pp. 116-125.
3. Arata, Y. , Maruo, H., Miyamoto, I . , Takeuchi, S. "Dynamic Behaviour in Laser Cutting of Mild Steel". Trans, of the Japan Welding Research Institute, Vol. 8, No 2 (1979), pp. 15-26.
4. Miyamoto, I . , Maruo, H. "The Mechanism of Laser Cutting". Welding in the World, Vol. 29, No 9/10 (1991), pp. 283-294.
5. F . D. Richardson, Physical Chemistry of Melts in Metallurgy Volume 2 (1974), Academic Press (Publ.), London, ISBN 0-12-587902-4.
6. Smithells Metals Reference Book (six edition,1983), Brandes, E. A. (Ed.), Butterworths (Publ.), London, ISBN 0-408-71053-5.
124

Ivarson; Paper V
Paper V
The Effects of Oxygen Purity in Laser Cutting Mild Steel;
A theoretical and experimental investigation
125

Ivar son; Paper V
The Effects of Oxygen Purity in Laser Cutting Mild Steel; A theoretical and experimental
investigation
A. Ivarson*, J. Powell** J. Kamalu*, G. Brodén0, C. Magnusson*
* Luleå University of Technology Division of Materials Processing
S-951 87 Luleå, Sweden
+ Laser Expertise Ltd. Harrimans Lane, Dunkirk
Nottingham NG7 2TR, U.K.
# University of Dundee Dept. of APEME
Dundee DDI 4HN, Scotland, U.K.
n AGA AB, S-181 81 Lidingö, Sweden
ABSTRACT
This paper presents an experimental and theoretical investigation into the sensitivity of the laser-oxygen cutting process to impurities in the oxygen supply. The prime cause of the process sensitivity has been identified as a build up of contaminant gas on the cut front surface. The build up of this boundary layer is greatly influenced by small changes in the level of contamination of the oxygen and can for example reduce cutting speed by -50% i f 98% pure oxygen is used rather than 99.75%.
INTRODUCTION
The growth of the laser cutting industry has been dominated by the profiling of steels. During steel cutting the focused laser beam is used in conjunction with a pressurised jet of oxygen as shown in figure 1. The high cutting rates achievable by this process are a result of the dual nature of the energy input from:
127

Ivarson; Paper V
A. The focused laser energy
and,
B. The exothermic reaction of the metal with oxygen.
Although this principle is true of mild and stainless steels the rest of this paper wih deal only with the chemical thermodynamics of mild steel cutting.
Laser cutting head
Movement at
Figure 1. A schematic of the cutting mechanism.
The use of oxygen as a cutting gas when profiling mild steels has two important effects in the cut zone:
1. The exothermic reactions of iron with oxygen generate a great deal of heat
and,
2. The molten oxides produced in the cut zone do not adhere weh to the surrounding solid steel and therefore a clean cut edge is generated, see figure 2.
128

Ivar son; Paper V
Cutting direction
Figure 2. A typical cut edge generated in thin section (1.25 mm) mild steel cut by a CO2 laser in conjunction with an oxygen jet.
Earlier work by the authors [1] has shown that the heat generated by the oxidation of iron contributes approximately half of the energy input to the cut zone (the laser obviously supphes the remaining half). Analysis of the particles ejected from the cut zone [2] has demonstrated that during the cutting process approximately half of the iron which leaves the cut zone is oxidised to FeO and a small amount (-1%) is oxidised to Fe203. The remaining material leaves the cut zone as unoxidised iron. The cut surface temperature is approximately 2000 K and at this temperature the heat generated by the oxidation reactions is:
Fe + I/2O2 -» FeO AH=-257.58 kJ/mol
2Fe + 3/202 -> Fe 2 0 3 AH=-826.72 kJ/mol
In simple terms then, the cutting process can be described as; a laser initiated oxidation reaction the products of which are ejected from the cut zone by the incident gas jet.
This paper is concerned with the surprisingly high sensitivity of the cutting process to smah levels of contamination in the oxygen jet. A general view of the description of the process given above might lead to the conclusion that 98% pure oxygen jet would cut with almost equal effectiveness to a 99.75% pure jet i f the contaminant gas does not give rise to any competing chemical reactions. Experimental work has shown that this is not the case [3 and 4], and that cutting with a 2% impurity level in the oxygen can reduce the cutting speed by more than 50%. This work wiU attempt to explain this anomaly by analysis of the chemical dynamics in the cut zone.
129

Ivarson; Paper V
EXPERIMENTAL PROCEDURE
The experimental part of this work concentrates on the foUowing three points:
1. To what extent is the optimum cutting speed reduced over an oxygen purity range from 99.998% to 90%?
2. How does the appearance of the finished cut change over this range?
3. How does the nature of the particles ejected from the cut zone change over this range?
These three points were examined as foUows:
1. Cutting speed trials
The cutting speed trials were very straight forward and involved cutting müd steel samples 2 mm thick under the following conditions:
Laser model: Rofin-Sinar 6000 Laser power: 800 W Lens focal length: 127 mm Nozzle diameter: 1.2 mm Nozzle-material standoff: 1.5 mm Position of focal point: On material surface Oxygen jet pressure: 2.5 bar Oxygen jet purity: 99.998%, 99.75%, 99.5%, 99.0%, 98.0%, 97.0%, 95.0%, 93.0%, 90.0%. (The impurity gas was nitrogen)
For each oxygen purity an optimum cutting speed was estabhshed which gave the highest speed best quality cut. (this optimum speed is generahy 80-90% of the absolute maximum cutting speed).
2. Cut examination
The cut appearance was observed opticaUy and microscopicaUy. The main points of interest being: a) the appearance of the cut zone during cutting, b) the presence of dross on the cut edge and c) the extent of the heat affected zone.
130

Ivarson; Paper V
3. Ejected particle analysis
Earlier work by the authors [1 and 2] has demonstrated the value of a fuh chemical and physical analysis of the particles ejected from the cut zone. Analysis of this sort can give valuable information about the various chemical reactions which take place in the cut zone. The basic experimental arrangement for the collection of particles ejected from the cut zone is shown in figure 3.
Movement at
Laser cutting head
Cutectøe
VV; Ejected molten '•'//.•oxidised particles
Glycol-water mixture /.
Figure 3. A schematic of the experimental arrangement for the particle coUection.
For each sample the following system was employed:
1. Cut approximately 7 m of the material (in several 100 mm passes) and coUect the ejected particles in the glycol-water mixture.
2. FUter and dry the cohected particles. 3. Take a sample for wet chemical analysis. 4. Take a sample to be mounted in bakelite, ground and polished. This
sample could then be used for a number of investigations as it revealed the polished cross sections of a large number of particles. Techniques used included: Electron microscopy, optical microscopy (unetched) and optical microscopy after etching.
131

Ivarson; Paper V
R E S U L T S
Cutting Speed
Figure 4 shows the results of the cutting speed trials as a function of the oxygen jet purity. It is clear from this graph that the cutting process is dramatically suppressed as the contaminant level rises to 10%. Experimental work by Nielsen [3] has shown that at higher contamination levels the cutting speed remains relatively constant at this 10% value.
100 99 98 97 96 95 94 93 92 91 90 Oxygen purity (%)
Figure 4. Cutting speed as a function of oxygen purity for 2.0 mm thick mild steel.
Another way of expressing these results as a percentage of the 99.998% cutting speed is given in table 1:
Table 1. Optimum cutting speeds over the range of oxygen purities
Sample Oxygen Cutting speed Cutting speed purity % (m/min) comparison
A 99.998 5.7 100% B 99.75 5.04 88.4% C 99.5 4.5 78.9% D 99.0 3.6 63.2% E 98.0 2.76 48.4% F 97.0 2.1 36.8% G 95.0 1.2 21.1% H 93.0 0.9 15.8%
I 90.0 0.7 12.3%
132

Ivarson; Paper V
Figure 4 and table 1 demonstrate the very high sensitivity of the process to contamination of the oxygen jet. An impurity level of only 2% halves the optimum cutting speed, an effect which cannot be explained by a simple dilution argument.
Cut Examination
General observation of the cutting process and the cut edges revealed two important points:
1. The adhesion of dross to the bottom of the cut edge became a problem at oxygen purities of less than 98.0%.
2. As the oxygen purity decreased the appearance of the cut front during cutting changed from a white yellow to a golden yellow indicating a general reduction in the cut front temperature.
Optical microscopy of polished and etched cross sections of the cuts showed a general increase in the extent of the Heat Affected Zone (HAZ) with decreasing oxygen purity. This is demonstrated by figure 5.
Oxygen purity: 99.75% 0 2 93% 0 2
A
Cutting speed: 5.04 m/min 0.9 m/min
Figure 5. The increase in the width of the heat affected zone as the oxygen purity (and therefore the cutting speed) decreases.
This increase in HAZ can be attributed to the effect of reducing the cutting speed. As the cutting speed is reduced the interaction time of the hot cut zone with the surrounding material is increased. In this case the interaction time has been increased by a factor of five and this has led to a more prolonged heating/cooling cycle at any point along the cut line. This increased cycle time gives rise to a larger HAZ as shown in figure 5. The
133

Ivar son; Paper V
noticeable broadening of the HAZ towards the bottom of the cut zone in figure 5b is attributable to two effects:
1. The melt-substrate interaction in the cut zone is greater at the bottom of the cut because ah the molten material must pass through this region to leave the cut zone.
2. The dross which sticks to the underside of the low purity oxygen cuts retains energy which it passes on to the substrate by conduction. This heat helps to prolong the heating-cooling cycle and thus increases the size of the HAZ.
Ejected Particle Analysis
Microscopy
Earlier work by the present authors [2] has shown that the particles ejected from a mild steel cut zone during high purity oxygen-laser cutting can be divided into five distinct types shown in figure 6.
Type 1, Type 2. Type 3.
Iron core + oxide shell. Iron core with small Oxide core, iron-oxide particles of oxide and mixture and oxide shell, an oxide shell.
Tvpe 4. Type 5.
Oxide matrix and shell Completely oxidised with isolated particles particle, of iron.
Figure 6. The five types of oxidised particle ejected during laser-oxygen cutting of mild steel with oxygen of the usual commercial purity of 99.75%. N.B. dark areas are FeO, lighter areas (e.g. the centre of type 1) are unoxidised iron [2].
134

Ivarson; Paper V
Figure 7 shows a cross section of a selection of the particles coUected when cutting sample A (table 1) with an oxygen purity of 99.998% and it is clear that ah the particle types shown in figure 6 are present.
Figure 7. A cross section of the particles coUected when cutting sample A (table 1). Note the presence of all the particle types identified in figure 6.
Similar examination of selections of particles from the other cut samples revealed the foUowing trends:
1. As the oxygen purity decreased the average diameter of the particles increased (Sample I particles had an average diameter of 350 urn as compared to sample A particles which had an average diameter of 150 urn).
2. As the oxygen purity decreased the number of types of oxide particle generated was reduced as shown in table 2.
135

Ivarson; Paper V
Table 2. Types of particles generated by the cutting process for various oxygen purities
Sample Oxygen purity %
Types of particles generated by the cutting process
A 99.998 1, 2, 3, 4 + 5 B 99.75 1,2, 3,4 + 5 C 99.5 1, 2, 3, 4 + 5 D 99.0 1,2,3,4 + 5 E 98.0 1, 2, 4 + 5 F 97.0 1, 2, 4 + 5 G 95.0 1+5 H 93.0 1 + 5 I 90.0 1 + 5
Figure 8 demonstrates this point with a cross section of particles coUected when cutting sample I . It is clear that only stage 1 and 5 particles are present and that the general size of the particles is higher than those shown for sample A in figure 7.
Figure 8. A cross section of the particles cohected when cutting sample I (table 1).
The general increase in particle size with decreasing oxygen purity is probably related to the reduction in cutting front temperature mentioned earlier. As the temperature of a liquid decreases its surface tension [5] and viscosity [6, 7] increases and it breaks up into larger droplets (particles) under the action of a gas jet.
136

Ivarson; Paper V
Chemical analysis
Wet chemical analysis was carried out in order to establish the extent of the oxidation reaction experienced in the cut zone. The results of this analysis are given in table 3.
Table 3. Chemical analysis of mild steel cut particles
Sample Oxygen Cutting Unoxidised Oxidised Oxygen purity speed iron iron
% (m/min) wt% At% wt% At% wt% At% A 99.998 5.7 41.9 31.7 45.2 34.2 12.9 34.1 B 99.75 5.04 41.9 31.4 44.6 33.4 13.5 35.2 C 99.5 4.5 40.3 30.1 46.1 34.4 13.6 35.5 D 99.0 3.6 38.7 28.5 47.0 34.7 14.3 36.8 E 98.0 2.76 35.3 25.7 49.8 36.3 14.9 38.0 F 97.0 2.1 27.6 19.3 55.2 38.6 17.2 42.1 G 95.0 1.2 13.6 8.9 64.9 42.3 21.5 48.9 H 93.0 0.9 6.5 4.0 68.9 42.7 24.6 53.3 I 90.0 0.7 3.1 1.9 71.6 43.9 25.3 54.2
The figures given in table 3 show that the level of oxidation of the particles increases as the oxygen purity decreases. This is a result of the reduction in cutting speed which increases the oxygen-melt interaction time at any position along the cut line. At first glance this increase in oxidation level seems to imply an increase in oxidation energy input to the cut front but in fact this is the reverse of the truth. The oxidation energy input is determined by the overall oxidation rate which actually reduces as the oxygen purity decreases. This reduction is the result of a decrease in the rate at which material is removed from the cut zone at the lower cutting speeds. There was no appreciable change in kerf width throughout the range of these experiments and so the mass removal rate from the cut zone is proportional to the cut speed.
From the information given in table 3 and a knowledge of the mass removal rate from the cut zone, the oxidation heat evolved can be calculated and expressed in Watts as shown in table 4. For example:
137

Ivarson; Paper V
Calculating the oxide distribution
Taking 100 g of partially oxidised particles for sample B, table 3 gives us the foUowing result:
The mass of oxidised iron = 44.6 g The mass of unoxidised iron = 41.9 g The mass of oxygen = 13.5 g
Assuming, from earlier work [2] that the only oxides which are present are FeO and Fe203, the foUowing equation is true:
x[Fe 20 3] + y[FeO] = A + B (1)
where; x = the number of moles of Fe 20 3 in the 100 g sample y = the number of moles of FeO in the 100 g sample
[Fe 20 3] = the molecular weight of Fe 20 3 = [2(55.847) + 3(16)] g/mol [FeO] = the molecular weight of FeO = [55.847 + 16] g/mol
A = the weight of oxidised iron in the 100 g sample = 44.6 g B = the weight of oxygen in the 100 g sample = 13.5 g
Equation (1) gives us the proportion of the two oxides as:
Fe 2 0 3 :FeO
0.72
94.7%
0.04
(mol%) 5.3%
Calculation the power of the oxidation reaction
For sample B:
Material thickness = 2.0 mm Cutting speed = 5.04 m/min = 84 mm/s
Kerf width = 0.23 mm
Volumetric material removal rate during cutting = 38.6 mm3/s
.-. Mass removal rate = 0.30 g/s 51.5% of the iron is converted to oxide (90.0% to FeO and 10.0% to Fe 20 3)
138

Ivarson; Paper V
Heat generated per mole:
Fe + l /20 2 -> FeO AH=-257.58 kJ/mol (at 2000K) [8] 2Fe + 3/202 -> Fe 2 0 3 AH=-826.72 kJ/mol (at 2000K) [8]
Calculation gives:
{FeO}
Mass removal rate = 0.90*0.9916*0.515*0.30/55.847 = 2.47*10-3 mol/s
(Fe203) Mass removal rate = 0.10*0.9916*0.515*0.30/55.847 = 2.74*1(H mol/s
Heat evolved = 2.47*10-3*257.58*103 + 2.74*10-4*826.72*103/2 = 749 W
Table 4. The heat evolved by the cutting process for each of the cut samples
Sample Oxygen purity %
Cutting speed Heat evolved (m/min) (W)
Heat evolved comparison
A 99.998 5.7 806 100% B 99.75 5.04 749 93% C 99.5 4.5 714 89% D 99.0 3.6 595 74% E 98.0 2.76 479 59% F 97.0 2.1 439 54% G 95.0 1.2 325 40% H 93.0 0.9 211 26% I 90.0 0.7 242 30%
(N.B. the addition of the 800 W of laser power to the oxidation heat evolved gives the total power input to the cutting zone)
It is clear from table 4 that there is a strong relationship between the heat evolved by the oxidation reaction and the cutting speed although the cutting speed does decrease at a faster rate with decreasing oxygen purity (see table 1). The difference between the two reduction rates could be attributable to the decrease in process efficiency experienced whenever the cutting is slowed down [9]. This decrease in efficiency is related to the increase in thermal losses from the cut zone (by conduction etc.) which result from the prolonged laser-material interaction time in any position along the cut line.
139

Ivarson; Paper V
DISCUSSION
The results given so far in this paper can only be explained by a detailed analysis of the chemical and thermo-dynamics in the cut zone. Figure 9 presents a schematic of the basic chemical situation in the cut zone at any time.
Figure 9. A schematic of the chemistry in the cut zone seen as a cross section along the centre line of the cut.
The laser beam acts in conjunction with the oxygen shown on the right hand side of figure 9 and the exothermic oxidation which ensues melts the solid iron. The liquid thus generated wih obviously be oxide and oxygen rich towards the right hand side of figure 9 and iron rich (and eventually pure iron) towards the left. Earlier work by the authors [10] has shown that interface 3 (figure 9) can be considered to be the reaction front with interface 1 as the liquid-solid interface and interface 4 the visible cut front.
If the oxygen stream is contaminated with another gas this wih have a progressively detrimental effect on the transport of oxygen across interface 4 which wih inhibit the oxidation reaction. As the oxygen is consumed preferentially by the iron oxidation reaction the nitrogen is left behind at interface 4 and begins to build up into a boundary layer as shown in figure 10.
140

Ivarson; Paper V
Fe+ FeO i ° 2
FeO +O2 i ° 2
(liq) (liq) m (gas) 1 1 1 1
1 I I I 1 I I I
99.7%
0%
gradient
Figure 10. A schematic showing the build up of a barrier layer of nitrogen at the gas-hquid interface in the cut zone.
This boundary layer has a thickness 8 and has a direct effect on the diffusion rate of the oxygen into the iron which can be expressed as foUows [11]:
Jo, = "Do, Po,
(2)
where j 0 2 - Diffusion rate of 0 2
Dq2 = Diffusion coefficient
Po2 - The partial pressure of 0 2 in the bulk gas
8 = The boundary layer thickness
Figure 11 demonstrates the effect of the boundary layer thickness on the diffusion rate of 0 2 . This dramatic decrease in diffusion rate wül have a direct effect on the oxidation reaction rate and therefore the heat supphed to the cut zone by the reaction.
141

Ivarson; Paper V
O 2 4 6 8 10 12 14 16 18 20 Boundary layer thickness (microns)
Figure 11. The effect of boundary layer thickness (8) on the oxygen diffusion rate jo2 (see equation 2).
The determination of actual values for 8 in the case of laser cutting would be extremely difficult but it is quite a simple matter to establish the tendency of 8 to rise rapidly if the oxygen cutting jet is contaminated.
For our simplified model let us assume that the cut front geometry does not change over the experimental range discussed earlier in this paper. This is a fair assumption because no appreciable change in kerf width was noted. In the interest of clarity the fohowing simplifications can also be made:
A. During cutting a steady flow of gas is consumed by transport across interface 4 (figure 9).
B. I f the solubility of nitrogen in FeO is ignored then the only gas crossing interface 4 is oxygen. Nitrogen is in effect filtered out by the interface and remains on its right hand side as a boundary gas layer as shown in figure 10.
Considering equation (2) it is clear that a corruption of the oxygen supply to the cut zone wih have two effects on the right hand side of the equation:
142

Ivarson; Paper V
1. po 2, the partial pressure of the oxygen in the bulk gas wih
decrease.
2. 8, the boundary layer thickness will be greater because more nitrogen is available for its production.
N.B. Both these effects will have an influence on the value of jo2» the oxygen diffusion rate which in turn controls the oxidation rate and therefore the cutting speed.
The partial pressure of the oxygen in the gases used can be easily calculated and are shown in table 5.
Table 5. The partial pressures of the oxygen in the cutting gas mixtures (calculated at a pressure of 1 bar).
Sample 0 2 At% O2 Partial pressure
A 99.998 0.99998 B 99.75 0.997 C 99.5 0.994 D 99.0 0.989 E 98.0 0.977 F 97.0 0.966 G 95.0 0.943 H 93.0 0.921 I 90.0 0.887
The values of O2 partial pressure given in table 5 are, of course, strongly related to the percentage of oxygen in the mixture and do not fall off rapidly in the same way as the cutting speed does (see figure 4). As the foUowing discussion wiU show it is the non linear growth of the barrier layer thickness which has the catastrophic effect on the cutting speed.
The thickness of the barrier layer is determined by the volume of nitrogen left behind at the gas-liquid interface as the oxygen is consumed by the oxidation reaction. The effective accumulation rate of nitrogen at the cut front can be calculated from the consumption rate of the oxygen and the level of nitrogen in the original mixture. The oxygen consumption rate for our samples can be calculated in the foUowing way:
143

Ivarson; Paper V
Sample A: Material thickness = 2.0 mm Cutting speed = 5.7 m/min = 95 mm/s Kerf width = 0.23 mm
Volumetric material removal rate during cutting = 2.0*95*0.23 =
43.7 mm3/s
.'. Mass removal rate = 0.34 g/s
From table 3;
The proportional of this mass which is oxidised is: 45.2/(41.9+45.2) = 52%
or, 0.177 g/s
0.177 g/s of FeO = 3.17*10-3 m o i / s
If 3.17*10-3 moles of iron are converted to FeO every second then the consumption rate of oxygen is also 3.17*10-3 mol/s.
From this value of the oxygen consumption rate it is possible to calculate the maximum rate of nitrogen accumulation at the liquid-gas interface:
3.17*10-3 mol/s oxygen in a 99.998 At% pure mixture with nitrogen is equivalent to 6.34* 10-8 mol/s of nitrogen.
The results of this calculation for ah the experimental samples are given in table 6.
Table 6. A calculation of the maximum accumulation rate of nitrogen at the gas-liquid interface.
Sample At% Oxygen consumption "Nitrogen accumulation rate (mol/s) rate" (mol/s)
A 99.998 3.17*10-3 6.34*10-8 B 99.75 2.88*10-3 8.67*10-6 C 99.5 2.75*10-3 1.66*10-5 D 99.0 2.28*10-3 2.54*10-5 E 98.0 1.84*10-3 4.34*10-5 F 97.0 1.68*10-3 5.90*10-5 G 95.0 1.23*10-3 7.41*10-5 H 93.0 1.10*10-3 9.40*10-5 I 90.0 9.03* 104 1.15*10-4
144

Ivarson; Paper V
Table 6 gives an indication of the maximum amount of gas available to the production of a barrier layer ignoring such effects as solution of the nitrogen in the liquid oxide and the removal of the nitrogen barrier by the fast flowing cutting gas jet.
To summarise the points made so far:
a) The cutting speed is related to the oxidation reaction rate (see table 4).
b) The reaction rate is proportional to the diffusion rate of O2 across interface 4 (see figure 9).
c) The diffusion rate is inversely proportional to the nitrogen barrier layer thickness (see figure 11).
d) The barrier layer thickness is proportional to the "nitrogen accumulation rate" (see table 6).
These statements imply that the cutting speed wih be inversely proportional to the "nitrogen accumulation rate". This point is confirmed by figure 12 which shows the relationship between the reciprocal of the "nitrogen accumulation rate" and the oxygen purity. It is clear that the curve foUows the same basic shape as that for the cutting speeds (see figure 4).
140000 '& a \~ 120000 -c 0 100000
•
"3 E 80000 -3 CJ
u 60000 KJ
itrog
en
§40000 -
itrog
en
0 S 20000 2 1—(
w 0 -100 99 98 97 96 95 94 93 92 91 90
Oxygen purity (%)
Figure 12. The relationship between the reciprocal of the nitrogen accumulation rate (taken from table 6) and the oxygen purity.
145

Ivarson; Paper V
The actual accumulation rates of the nitrogen at the cut front wih be lower than those shown in table 5 because the cut front is mobile and surrounded by a fast flowing gas jet. However, the trend of the accumulation rate to rise rapidly with the contamination level of the oxygen wih remain true and is clearly the factor which is largely responsible for the sharp decrease in cutting speed observed in figure 4. It was mentioned earlier in this paper that the work of Nielsen [3] had demonstrated that the low cutting speed achieved with 90% pure oxygen was not greatly affected by further increases in the contamination level. This is in agreement with our boundary layer model because in an actual cut zone the depth of the boundary layer would reach a limiting thickness determined by the flushing action of the incident gas jet. This point is demonstrated by figure 13 which shows that cutting speeds can be improved i f the flow of new gas into the cut zone is increased. The higher pressure jet acts as a more efficient contaminant removal mechanism and decreases the boundary layer thickness, 8, for any given oxygen purity level.
Figure 13. As the cutting gas pressure is increased from 2 bar to 3 bar the boundary layer thickness decreases and cutting speeds are improved.
146

Ivarson; Paper V
CONCLUSIONS
1. The laser-oxygen process used for cutting mild steel is extremely sensitive to smah amounts of contamination in the oxygen supply.
2. The prime cause for this sensitivity is the build up of a boundary layer of the contaminant on the hquid cut front surface.
3. The thickness of this boundary layer is rapidly increased with only a smah increase in the level of contaminant in the oxygen supply.
4. The presence of a boundary layer decreases the oxidation rate of the steel which lowers the thermal input to the cut zone and thus reduces the cutting speed.
5. Cuts made with oxygen contamination of over 2% wih tend to have resolidified dross adherent to the underside of the cut.
ACKNOWLEDGEMENTS
The authors would like to thank Professor Bo Björkman, Dr. Ture Lindbäck and Mr. Rune Gärd for inspiring discussions during the work, Mr. Göran Åberg for all help in the laser laboratory, Mr. Lars Frisk and Mr. Johnny Grahn for help with specimen preparation and SEM analysis, all at Luleå University of Technology. Mr. Lars Jonsson at Boliden Mineral AB. FinaUy, we would like to thank the faculty board at Luleå University of Technology.
R E F E R E N C E S
1. Ivarson, A., Powell, J . , Magnusson, C. "The Role of Oxidation in Laser Cutting Stainless and MUd Steel", J. of Laser Applications, Vol. 3, No 3, 1991, pp. 41-45.
2. Ivarson, A., Powell, J . , Magnusson, C. "Laser Cutting of Steels; Analysis of the particles ejected during cutting", Welding in the World, Vol. 30, No 5/6, 1992, pp. 116-125.
3. Nielsen, S.E. "Laser Cutting with High Pressure Cutting Gases and Mixed Cutting Gases", Thesis for degree of Doctor of Philosophy, Denmark University of Technology, 1985.
147

Ivar son; Paper V
4. Brodén, G., Ketting, H-O. "Einfluss der Reinheit des Schneidsauerstoffs beim Laserstrahlbrennschneiden", Schweissen und Schneiden, Vol. 48 (1989), Heft 8, pp. 379-382.
5. F.D. Richardson, Physical Chemistry of Melts in Metallurgy Volume 2 (1974), Academic Press (Publ.), London, ISBN 0-12-587902-4.
6. Smithells Metals Reference Book (six edition, 1983), Brandes, E.A. (Ed.), Butterworths (Publ.), London, ISBN 0-408-71053-5.
7. Miyamoto, L , Maruo, H. "The Mechanism of Laser Cutting". Welding in the World, Vol. 29, No 9/10 (1991), pp. 283-294.
8. Thermochemical Properties of Inorganic Substences, Brian, I . , Knacke, O. (Ed.), Springer Verlag, Düsseldotf, ISBN 3-514-00125-1.
9. Powell, J . , Ivarson, A., Ohlsson, L . , Magnusson, C. "Conductive Losses Experienced During CO2 laser Cutting", Submitted for pubhcation; J of Laser Applications.
10. Ivarson, A., Powell, J . , Kamalu, J . , Magnusson, C. "The Oxidation Dynamics of Laser Cutting of Mild Steel and the Generation of Striations on the Cut Edge", Submitted for publication; J of Materials Processing Technology.
11. Introduction to High Temperature Oxidation of Metals, N. Birks & G.H. Meier (Ed.), Edward Arnold Ltd. (Publ.), 1983, ISBN 0-7131-3464-X.
148

Ivarson; Paper VI
Paper VI
Factors Affecting the Efficiency of Inert Gas Laser Cutting
149

Ivarson; Paper VI
Factors Affecting the Efficiency of Inert Gas Laser Cutting
A. Ivarson*, J. Powell*+, C. Magnusson*
* Luleå University of Technology Division of Materials Processing
S-951 87 Luleå, Sweden
+ Laser Expertise Ltd. Harrimans Lane, Dunkirk
Nottingham NG7 2TR, U.K.
ABSTRACT
An energy balance which describes the equilibrium set up in the cutting zone during laser inert gas cutting is presented and analysed. The analysis involves an experimental and theoretical examination of the individual components of the equation. An assessment of the contribution of each component to the energy balance has thus been achieved.
INTRODUCTION
Inert gas laser cutting is a method of profiling materials (often stainless steel or titanium alloys) by using a focused laser beam in conjunction with an inert gas jet, see figure 1.
Movement at M
cutting speed, v
Laser cutting head
Nitrogen
Cut edge
Figure 1. A schematic of inert gas laser cutting.
The interactions in the cut zone can be described by an energy balance and it is the aim of this paper to investigate various aspects of this approach.
151

Ivarson; Paper VI
The energy balance can be expressed as follows:
Energy supplied to the cut zone = Energy used in generating a cut + Energy losses from the cut zone (by conduction, radiation etc.)
or as a simple formula:
(P-b)t[(100-rf)/100] + Q g = Ecutldk + (trtdk/2)(A+B+C) (1)
Considering a laser power P cutting a line of length 1 in a time t.
where;
b= laser power transmitted through the cut zone without interaction with the cut front.
rf= the reflectivity of the cut zone expressed as a percentage.
Qg= the mechanical power of the gas jet absorbed by the cut front.
Ecut= specific energy needed to melt and remove one unit volume of material from the cut zone.
d= material thickness.
k= kerf width.
A= conductive loss function (power per unit area).
B= radiative loss function (power per unit area).
C= convective loss function (power per unit area).
Equation (1) refers to a cut front with the geometry shown in figure 2. It is assumed that energy is absorbed by this cut front and then redistributed as "useful" energy (which generates the cut) and "losses" (which do not). This is, of course, a great simplification but it does help to clarify the situation for a largely qualitative analysis such as this one.
152

Ivarson; Paper VI
Figure 2. A schematic of the cut front geometry.
It wih be noticed that the reflective and transmitted losses from the cut zone are dealt with in the left hand side of the equation whereas the conductive, convective and radiative losses are included in the right hand side. The logic behind this approach is the consideration that the losses from the cut zone can be divided into two types; primary and secondary.
Primary losses are those which leave the cut zone as they entered; as 10.6 micron radiation. These include only transmitted and reflected laser hght.
Secondary losses are those which leave the cut zone after thermal transformation of some kind. These include the conducted, convected and radiated losses. (The broad spectrum of radiated light may include a smah proportion of 10.6 micron light but this did not originahy emanate from the laser and is therefore part of the secondary losses).
The secondary losses are a function of the temperature of the cutting front and its surface area in contact with the surroundings. The conductive losses are made from the convex face in contact with the substrate and the convective and radiative losses are made from the concave face exposed to the surrounding atmosphere, see figure 2.
One interesting feature of equation (1) is that the energy used in cutting (E c u tldk) is independent of the time taken to carry out the cut. The losses however are proportional to the time taken. From this point it is clear that the proportion of "useful" to "wasted" energy wih change if the cutting speed is changed in order to cut material of a different thickness [1].
The remainder of this work will concentrate on the various components of equation (1), taking them one at a time and estimating their influence on the energy balance as a whole. The analysis wih combine a theoretical approach with experimental results taken from typical inert gas laser cutting trials.
153

Ivarson; Paper VI
EXPERIMENTAL RESULTS
Samples of five thicknesses of stainless steel were cut under the fohowing conditions:
Laser model: Rofin-Sinar 6000 Laser power: 900 W Lens focal length: 127 mm Nozzle diameter: 1.0 mm Nozzle-material standoff: 0.8 mm Cutting gas: Nitrogen Nozzle supply pressure: 10 bar
Table 1. Maximum cutting speed as a function of material thickness
Sample Thickness Cutting speed (mm) m/min mm/s
A 1.0 8.1 135 B 1.5 4.8 80 C 2.0 3.6 60 D 2.5 2.52 42 E 3.0 1.92 32
Note: Ah samples were cut at the maximum possible speed capable of producing high quality, dross free cut edges.
This is the basic experimental set which will be referred to in the fohowing discussion. Individual experiments aimed at identifying specific components of equation (1) wih be explained whenever necessary.
ANALYSIS AND DISCUSSION
The Left Hand Side of Equation (1)
Energy inputs (P and Qg)
The energy inputs to the cut front are twofold in the case of high pressure inert gas laser cutting. The primary energy source is the laser itself which has a typical power (P) of between 500 and 1500 watts. After the primary losses are taken into account (see next section) the total absorbed power wih be of the order of 90% of the original value. (The original power should be measured at the workpiece position rather than at the laser output to account for energy losses off delivery optics).
154

I var son; Paper VI
The power of the gas jet (Qg) can be calculated from standard gas formula [2, 3] if the geometry of the cutting nozzle and the cut zone are known as weh as the gas pressure and type. The calculation is rather involved but to take a typical example:
Gas type: Nitrogen Supply pressure: 10 bar Nozzle diameter: 1.0 mm Pressure acting on the workpiece surface: 7 bar Kerf width: 0.2 mm
The velocity of the gas acting on the top surface of the workpiece can be calculated [2] and wih be of the order of 300 m/s. From this the kinetic power of the gas jet acting on the material surface can be estimated [3] to give a value of approximately 90 W. Only a fraction of this power wih be able to enter the kerf and this can be calculated [4] to give a figure of between 10 and 25 W. A proportion of this input power wih be transferred to the liquid leaving the cut zone although much of it wih remain associated with the gas jet as it leaves the bottom of the kerf. It is clear that as far as the energy balance (equation (1)) is concerned the mechanical power of the gas jet is a minor contributor to the energy input to the cut zone.
Primary losses (b and rf)
Primary losses (which leave the cut zone as 10.6 micron wavelength hght) are divided into two: Reflected and transmitted light. A few words of explanation of the terms b and rf may be of use here:
b: During cutting it is often the case that the trailing edge of the cut front does not extend to the fuh diameter of the incident laser beam. A proportion of the available hght therefore passes straight through the kerf without interacting with the cut front.
Tf. The reflectivity of the cut zone wih be much less than the figures quoted for sohd materials at ambient temperature. The cut zone has a higher absorptivity as a result of; its high temperature, its shallow angle of incidence to the laser beam, its roughness and its absorptive layer of vapour.
These losses are difficult to estimate theoretically but can be measured experimentally as shown in figure 3.
155
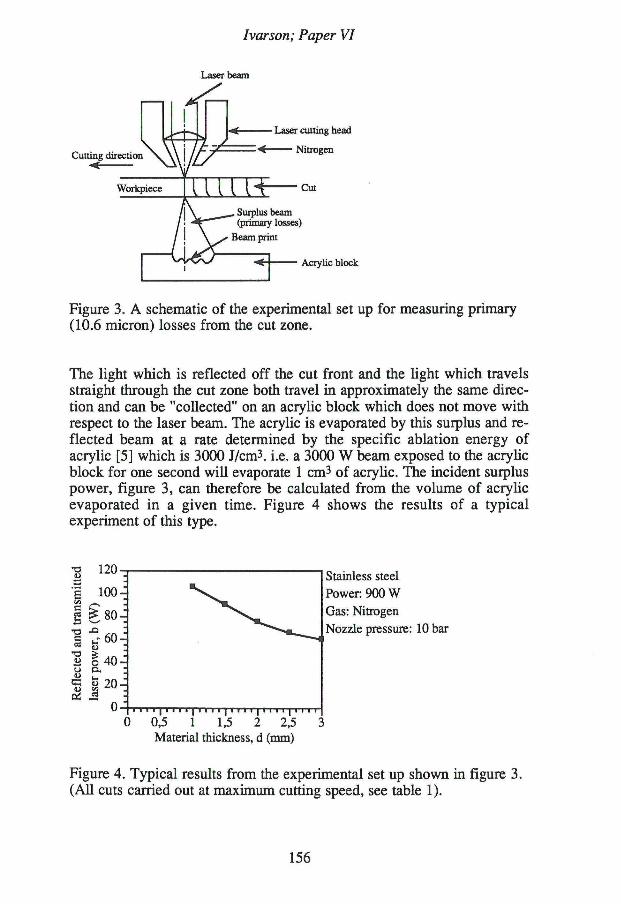
Ivar son; Paper VI
Laser beam
Cutting direction
Laser cutting head
< Nitrogen
Surplus beam (primary losses)
Beam print
Acrylic block
Figure 3. A schematic of the experimental set up for measuring primary (10.6 micron) losses from the cut zone.
The light which is reflected off the cut front and the hght which travels straight through the cut zone both travel in approximately the same direction and can be "coUected" on an acryhc block which does not move with respect to the laser beam. The acrylic is evaporated by this surplus and reflected beam at a rate determined by the specific ablation energy of acrylic [5] which is 3000 J/cm3. i.e. a 3000 W beam exposed to the acryhc block for one second wih evaporate 1 cm3 of acryhc. The incident surplus power, figure 3, can therefore be calculated from the volume of acryhc evaporated in a given time. Figure 4 shows the results of a typical experiment of this type.
• 1 1 1 1 1 1 1 1 1 1 1 1 1
0,5 1 1,5 2 2,5 Material thickness, d (mm)
Stainless steel Power: 900 W Gas: Nitrogen Nozzle pressure: 10 bar
Figure 4. Typical results from the experimental set up shown in figure 3. (AU cuts carried out at maximum cutting speed, see table 1).
156

Ivarson; Paper VI
It can be seen from figure 4 that the amount of primary losses from the cut zone decreases as the material thickness increases. This increase in absorptivity of the cut zone is a result of a change in its geometry. When thin section (e.g. 1.0 mm) material is being cut the cut front shape is similar to that described by figure 2. As the thickness of the workpiece is increased the shape of the cut front changes as shown in figure 5.
Figure 5. The change in geometry of the cut front with increasing thickness (schematic cross section).
The increase in cut front curvature means that the lag between the top of the cut front and the bottom is increased and hght can escape less easily from the bottom of the cut zone. Another feature of this type of cut front is that of multiple reflections and the reabsorption of light which has been reflected off the upper section of the cut front [1]. From the figures given in figure 4 it is clear that the order of magnitude of these primary losses for inert gas cutting is in the region of 10% of the original power of the laser beam which, as we mentioned earlier, implies that approximately 90% is absorbed in the cut zone.
The Right Hand Side of Equation (1)
The energy used in generating the cut (Ecutldk)
This factor is, of course, determined by the value of E c u t which can be called the specific cutting energy (per unit volume of cut). Analysis of this part of the equation would be simplified i f the temperature and removal mechanism experienced in the cut zone remained constant but this is not the case. Preliminary experimental work using electronic optical pyrometry has indicated that the temperature of the melt in the cut zone increases as the material thickness decreases (i.e. as the cutting speed increases). The temperatures are ah of the order of 3000K and generate intense violet and ultraviolet light which implies that a boiling reaction is involved in the material removal mechanism.
Thinnest sections Thicker sections
157

Ivarson; Paper VI
It is possible to theoretically calculate the amount of power needed to produce a cut. This can be achieved by using equation (2) [6].
P c u t = kdvp(c pAT + L f + m ' L v ) (2)
where; P c u t = Power (W) k = Kerf width d = Material thickness v = Cutting speed
p = Density (8.05 kg/dm3) Cp = Heat capacity of sohd (500 J/kgK)
AT = Difference between the cut melt temperature and the room temperature
L f = Latent heat of fusion (300 kJ/kg) Ly = Latent heat of vaporisation (6500 kJ/kg) m' = Fraction of material vaporised
The value of P c u t is of course highly dependent on the average temperature of the melt and the amount of vaporisation taking place during cutting. The way in which P c u t changes with the fraction of material vaporised is demonstrated in figure 6.
0 10 20 30 40 50 60 70 80 90 100 Fraction of material vaporised (%)
Figure 6. The relationship between the power needed to generate a cut (P c u t) and the fraction of material vaporised during cutting. Note: AT was estimated to change linearly from (Tm+T v)/2 for zero vaporisation [7] to T v for 100% vaporisation.
The actual amount of vaporisation taking place during cutting can be estimated from a knowledge of the energy consumed by the cutting process, hi the experimental case under consideration here the input to the cut zone is approximately 800 W (excluding primary losses). The losses by
158

Ivarson; Paper VI
conduction, radiation and convection add up to approximately 50% of this value which leaves only -400 W to produce the cut. It is therefore clear that the level of vaporisation is considerably less than 10% of the material leaving the cut zone. This is in agreement with experimental evidence which suggests that the majority of material leaves the cut zone as molten particles.
Conductive losses (Atxdk/2)
It is a simple matter to experimentally identify the conductive losses from the cut zone. I f a disc is cut from any material it wih have absorbed half the heat lost by conduction during cutting (the other half will , of course, be lost to the sheet from which it was cut).
Calorimetry can be used to measure the level of warming experienced by a number of discs of this type. The results of such an experiment are presented in figure 7.
Power: 900 W Gas: Nitrogen Nozzle pressure: 10 bar
• Conductive losses
Conductive losses • divided by material
thickness, d
1 1,5 2 2,5 3 Material thickness, d (mm)
Figure 7. Conductive losses as a function of material thickness for samples A-E (table 1).
The high conductivity of metals results in substantial losses which increase with material thickness. This increase results from the decrease in cutting speed which in turn leads to an extension of the cut front-substrate interaction time at any point along the cut line [8]. The solid line in figure 7 shows that the conducted losses associated with inert gas laser cutting of stainless steels is in the region of 40-50% of the input power.
The broken line in figure 7 gives values of the conductive losses divided by the material thickness. If this line was horizontal it would imply that the thermal loss by conduction was constant per unit area of the cut front
159

Ivarson; Paper VI
(figure 2). This would, in turn, imply the existence of similar thermal gradients around the cut zone for the range of thicknesses investigated. In these results however, the value of the dotted line decreases with increasing material thickness. This means that the thermal losses per unit cut front area decrease with increasing workpiece thickness. This is strong evidence that the thermal gradient around the cut front has changed as a result of a reduction in cut front temperature when cutting thicker sections. This point was mentioned in the earlier section on "the energy used in generating the cut", and is presently under investigation by the authors.
Radiative losses (Btndk/2)
It is possible to determine the level of radiation from a hot body by using Stefan-Boltzmann equation:
P r a d = A e o T 4 (3)
where; Prad = The power radiated per unit area A = Surface area of emitting body e = The emissivity of the material from which the radiation is
made a = Stefan-Boltzmann constant (5.67* IO"8 Wm- 2 K 4 ) T = The temperature of the hot body (K)
Although it would be difficult to experimentally determine the radiative heat loss from the cut zone it is a simple matter to calculate the maximum losses possible.
If the surface area of the cut front is taken as ndk/2 and the cut front temperature is known to lie in the region from 2700K to 3300K:
Surface area = -^p = 1.46 mm 2 (sample E, table 1, kerf width=0.31 mm)
Temperature = 3300 K
Emissivity = 1.0 (i.e. theoretical maximum)
Then,
P r a d = A e o T 4 = 9 . 8 W
160

Ivarson; Paper VI
The actual value of the radiative loss will be less than this as a maximum temperature and emissivity have been used for this calculation. It is clear therefore that radiative heat loss from the cut zone is a minor contributor to the energy balance, equation (1).
Convective losses (Ctodk/2)
The incident gas jet acting on the cut zone has one effect which aids the cutting process and another which acts as a thermal loss. The positive action is that of physical removal of molten material from the cut zone. This is combined with the secondary thermal loss of forced convective cooling. Figure 8 demonstrates the effect of increasing the supply of gas to the cut zone.
Stainless steel 2.0 mm Power: 900 W Gas: Nitrogen
8 9 10 11 12 13 14 15 16 17 18 Nozzle supply pressure, p N (bar)
Figure 8. Maximum cutting speeds as a function of nozzle supply pressure for 2.0 mm thick stainless steel.
It is clear that in the lower half of the range of pressures investigated (8-14 bar) the improved material removal mechanism acts to increase cutting speeds. The increase in convective coohng losses is overshadowed by this improvement. As supply pressures are increased above 14 bar the maximum cutting speed becomes suppressed apparently as a result of the continuing increase in convective thermal losses once the material removal mechanism has been optimised.
The thermal loss by convection from any hot material to its surroundings can be described by the fohowing equation [9]:
161

Ivarson; Paper VI
Q = h A ( T w - T O Q ) (4)
where; Q = Thermal loss by convection A = Surface area of hot zone h = Convection heat transfer coefficient
T w = Temperature of hot zone T» = Temperature of incident gas
Equation (4) is very simple. But it involves one extremely complicated factor, which is the convection heat transfer coefficient, h. A detailed analysis of equation (4) for the laser cutting process is out of the place in this paper. However, several authors have investigated this topic with various results. Vicanek and Simon [10] studied the momentum and heat transfer of an inert gas jet to the melt in laser cutting and developed the fohowing equation describing thermal loss by convection:
Q = AkATCpvodn"1 ) 1 / 2 Pr 1 / 3 h{y) (5)
where; Q = Thermal loss by convection X = Thermal conductivity k = Kerf width
AT — T ~Too P = Gas density vo = Gas velocity
d = Material thickness V = Gas viscosity Pr = Prandtl number= 0.7 (for most gases)
h(y) = Is a non dimensional function of order unity
If the relevant values for sample E (table 1) are put in this equation the maximum convective losses are calculated as 19 W. This is a trivial level of loss and is unlikely to be able to account for the reduction in cutting speeds at high pressures, see figure 8. One gas-cut zone interaction which may however account for high pressure cutting speed reduction is that of the suppression of vaporisation. It has already been stated that boiling and vaporisation play a part in the cutting process. The vapour pressure of stainless steel in the relevant temperature range is given as figure 9 [11].
162

Ivarson; Paper VI
Stainless steel
2700 2900 3100 3300 3500 Temperature (K)
Figure 9. The vapour pressure of stainless steel as a function of temperature.
The pressure acting on the top of the cut zone can be directly measured as a function of the supply pressure to the nozzle. The results of such measurements are given in figure 10.
Nozzle-material standoff: 0.8 mm
8 9 10 11 12 13 14 15 16 17 18
Nozzle pressure, P N (bar)
Figure 10. Workpiece pressure as a function of nozzle pressure.
It is clear that the pressures given in figure 9 and 10 cover the same basic range and so a suppression of the boiling reaction is possible. This vaporisation suppression is the subject of on going work by the present authors.
163

Ivarson; Paper VI
CONCLUSIONS
The energy balance can be expressed semi quantitatively from the information generated in this discussion:
Laser - Primary + Gas = Cutting + Conducted + Convective + Radiative power losses power power losses losses losses
-110% - -10% + -1% = -50% + -50% + -2% + -1%
This generalised view of the energy balance is a useful estimation of the importance of the various components of equation (1) at moderate gas supply pressures (i.e. up to ~14 bar in this case). It is clear, for example, that a change in thermal conductivity of the workpiece would have a far greater effect on the cutting speed than a change in material reflectivity.
At very high gas supply pressures changes in the gas-cut zone interactions begin to introduce factors not included in equation (1) e.g. vaporisation suppression. Preliminary experiments and analysis of these results imply that the cut front average temperature increases as the cutting speed is increased. This phenomenon and that of vaporisation suppression at high gas jet pressures are the subject of future work by the authors.
ACKNOWLEDGEMENTS
The authors would like to thank Dr. Ture Lindbäck for assistance with the chemistry, Mr. Göran Åberg, Mr. Åke Wesselheim and Mr. Robert Borgström for ah help in the laser laboratory, Mr. Lars Ohlsson for help with the piezo-electric transducer and Mr. Johnny Grahn for SEM analysis. FinaUy, we would hke to thank the Swedish National Board for Industrial and Technical Development (NUTEK) for providing funding for this work.
R E F E R E N C E S
1. Powell, J . , Ivarson, A., Ohlsson, L . , Magnusson, C. "Energy Redistribution in Laser Cutting". To be published in Welding in the World during 1993. (HW document No. IE 110-90).
2. Massey, B.S., Mechanics of Fluids (1989), Van Nostrand Reinhold (International) (Publ.), ISBN 0-278-00047-9.
164

Ivarson; Paper VI
3. Physics Handbook (fourth edition, 1987), Nordling, C, österman, J. (Ed.), Studentlitteratur (Publ.), Lund, ISBN 91-44-16574-9.
4. Zefferer, H., Petring, D., Beyer, E . "Investigations of the Gas Flow in Laser Beam Cutting", DVS-Bericht 135, DVS-Verlag, Düsseldorf, 1991, pp. 210-214.
5. Miyamoto, L , Maruo, H., Arata, Y. "Intensity Profile Measurement of Focused CO2 Beam using PMMA", Conf. Proc. of Materials Processing Symposium, ICALEO'84, Boston, 1984, LIA-Vol. 44, Laser Institute of America, pp. 313-320.
6. Luxon, J.T., Parker, D.E. Industrial Lasers and their Applications (1992), Prentice-Hah International Inc. (Publ.), ISBN 0-13-459538-6.
7. Petring, D., Abels, P., Beyer, E . "Absorption distribution on idealized cutting front geometries and its significance for laser beam cutting", Proc. of High Power CO2 Laser Systems and Applications, SPIE Vol. 1020, ECO 1, 19-20 September 1988, Hamburg, Germany, pp. 123-131.
8. Ivarson, A., Powell, J . , Kamalu, J . , Brodén, G., Magnusson, C. "The Effects of Oxygen Purity in Laser Cutting Müd Steel; A theoretical and experimental investigation", Accepted for publication in Lasers in Materials Engineering 1992 (to be pubhshed 1993).
9. Holman, J.P. Heat Transfer (1989), McGraw-Hül Book Company (Publ.), Singapore, ISBN 0-07-100487-4.
10. Vicanek, M., Simon, G. "Momentum and Heat Transfer of an Inert Gas Jet to the Melt in Laser Cutting", J. of Physics D: Apphed Physics, 20 (1987), pp. 1191-1196.
11. CRC Handbook of Chemistry and Physics (70th edition, 1989-90), Weast, R.C. (Editor in Chief), Chemical Rubber Company Inc. (Publ.), ISBN 0-8493-0470-9.
165