Urban Community Perception on Nighttime Leisure Activities in Improving Public Park Design
Upload
khangminh22Category
view
2download
0
HAL Id: hal-00317112https://hal.archives-ouvertes.fr/hal-00317112
Submitted on 1 Jan 2002
HAL is a multi-disciplinary open accessarchive for the deposit and dissemination of sci-entific research documents, whether they are pub-lished or not. The documents may come fromteaching and research institutions in France orabroad, or from public or private research centers.
L’archive ouverte pluridisciplinaire HAL, estdestinée au dépôt et à la diffusion de documentsscientifiques de niveau recherche, publiés ou non,émanant des établissements d’enseignement et derecherche français ou étrangers, des laboratoirespublics ou privés.
On the nature of nighttime ionisation enhancementsobserved with the Athens Digisonde
I. Tsagouri, A. Belehaki
To cite this version:I. Tsagouri, A. Belehaki. On the nature of nighttime ionisation enhancements observed with theAthens Digisonde. Annales Geophysicae, European Geosciences Union, 2002, 20 (8), pp.1225-1238.�hal-00317112�

Annales Geophysicae (2002) 20: 1225–1238c© European Geophysical Society 2002Annales
Geophysicae
On the nature of nighttime ionisation enhancements observed withthe Athens Digisonde
I. Tsagouri1 and A. Belehaki1
1Institute for Space Applications and Remote Sensing, National Observatory of Athens, Metaxa and Vas. Pavlou, P. Penteli15236, Greece
Received: 2 July 2001 – Revised: 19 March 2002 – Accepted: 22 March 2002
Abstract. True height electron density profiles observedwith the Athens Digisonde were analyzed together with geo-magnetic data indices for six magnetic storms in Septemberand October 2000 in an effort to define the ionospheric struc-ture during events of nighttime ionisation enhancements andto discuss the physical processes that may cause them. Anupwelling of the F2-layer, limited to the dark hemisphere,was evident in all storm events as the ionospheric responseto enhanced geomagnetic activity, but nighttime positive ef-fects and nighttime height enhancements are attributed to twodistinct mechanisms, according to our findings. Height en-hancements are wave-like disturbances and the time delayof their occurrence at middle latitudes depends on the in-crease rate of theAE index, and consequently, on the ratethat the solar wind input energy dissipates in the auroral iono-sphere. Thus, they most probably originated in the auroraloval region and propagated toward the equator-like TID dis-turbances, with a periodicity that depends on the ionisationdensity. On the other hand,foF2 increases do not share thesame wavy appearance, which could mean that they are notconnected to TIDs and are not of auroral oval origin. Theincreased nighttime density can only be speculated to be dueto increased downward fluxes from the plasmasphere.
Key words. Ionosphere (ionosphere-magnetosphere inter-actions; ionospheric disturbances; mid-latitude ionosphere)
1 Introduction
The ionosphere-thermosphere system response to geomag-netic storms is initiated at high latitudes, where energeticparticle precipitation, convection electric fields and associ-ated Joule heating are taking place. The Prolss (1993) phe-nomenological model represents one of the most popular de-scriptions of the ionospheric storm-induced effects, whichwas further extended by Fuller-Rowell et al. (1994; 1996), al-though in this model only daytime positive storm effects are
Correspondence to:I. Tsagouri ([email protected])
predicted. According to this description negative ionosphericstorm effects are attributed to neutral composition changes,while daytime positive effects are attributed to travelling at-mospheric disturbances (TADs). A TAD is a thermosphericphenomenon, which accompanies atmospheric gravity waves(AGWs). During a substorm associated energy injection atauroral latitudes, a whole spectrum of gravity waves is gen-erated. At some distance from the source region these waveswill be superimposed to form an impulse-like perturbation,the TAD, which moves with high velocity from auroral toequatorial latitudes (Bauske and Prolss, 1997). The AGWsand the TADs have been studied in great detail, usually byobserving the associated so-called travelling ionospheric dis-turbances (TIDs), which describe the effect of the TADs onthe ionosphere (Balthazor and Moffett, 1999). A particu-larly useful ionospheric tracer of TIDs was found to be thepeak height of the F2-layer,hmF2. In Prolss’s scenario, pos-itive storm effects are caused by an uplifting of the F2-layerat any mid-latitude station located in the sunlit hemisphere.The storm-induced effects scenario in the night-side hemi-sphere is different. Here, the lack of ionisation productionwill not allow for the formation of large positive effects, al-though TAD-associated changes in the layer height will beobservable at any local time.
Within the last few years, it was well confirmed that posi-tive storm effects are also observed in the night-side hemi-sphere (Oliver and Hagan, 1991; Burnside et al., 1991;Szuszczewicz et al., 1998; Tsagouri et al., 2000; Belehakiand Tsagouri, 2002). They are also predicted by numericalsimulations (Mansilla and Manzano, 1998) and many respon-sible mechanisms have been occasionally proposed. For ex-ample, Oliver and Hagan (1991), in a study of storm-inducedgravity waves, invoked the assumption of downward plas-maspheric fluxes as a source of enhanced nighttime densi-ties. This mechanism is an open issue even in normal con-ditions (Szuszczewicz et al., 1998). It is not ascribed to anystorm mechanism, although there is observational and theo-retical evidence for the existence of storm time gravity-wave-induced perturbations in atmospheric densities (Trinks and

1226 I. Tsagouri and A. Belehaki: On the nature of nighttime ionisation enhancements
Mayr, 1976; Mayr and Volland, 1976; Potter et al., 1976).These perturbations can cause ionospheric perturbations incombination with the ionisation existence in the night side.Burnside et al. (1991) attributed unusually high nighttimedensities to converging plasma flow in the F region due toa surprisingly large vertical shear in the meridional wind ve-locity, rather than to a decrease in the molecular gas densityand the subsequent reduction in the ion recombination rate(that may occur in the case of thermospheric downwelling),while Mansilla and Manzano (1998) considered an upliftingof plasma to higher altitudes as the main cause of nighttimepositive effects.
According to Fuller-Rowell et al. (1994), initial positivephases are wind driven effects observed in the daytime dur-ing the main phase of the storm, consistent with the consen-sus picture. They also maintain that if a positive phase isdriven by winds before dusk, it will rotate into the night-side and nighttime positive effects of this type have beenobserved (Szuszczewicz et al., 1998; Tsagouri et al., 2000).However, the understanding of positive phase observationsis not always so simple, such as in cases of nighttime initi-ated positive effects. Thermospheric downdwelling with anassociated decrease in mean-molecular-mass and an atten-dant reduction in dissociate recombination is a mechanisminvoked by Fuller-Rowell et al. (1994) to be present in therecovery phase. This could also be the case in the expansionphase. Downdwelling could be a candidate mechanism forpositive phase storms commencing at night (Szuszczewicz etal., 1998). In a recent work, Belehaki and Tsagouri (2002)demonstrated that the existence of a new source of ionisationis necessary to explain nighttime positive effects and, there-fore, the increased nighttime density can only be speculatedto be due to increased downward fluxes from the plasmas-phere (Rishbeth, 1987; Richards, 1994). In fact, the plas-maspheric flux term can also modify the value ofhmF2 andcontribute to the height increase (Szuszczewicz et al., 1998).
Finally, Belehaki and Tsagouri (2002) attributed the lati-tudinal effect in observation of nighttime ionisation enhance-ments at middle latitudes to the solar wind−magnetosphericcoupling conditions, which may cause a restriction in theneutral composition disturbance zone to higher latitudes. Insuch cases, the observation of the effects of plasmasphericfluxes at middle latitudes is more probable.
From the above short review in the recent literature, itis obvious that the question of the triggering mechanism ofnighttime ionisation enhancements observed systematicallyfrom middle latitude stations is not answered yet. In thiscontribution, we will make an effort to approach this problemby analyzing data from ionospheric soundings taken with theAthens Digisonde Portable Sounder (Reinisch, 1996). Thesystematic study of the calculated electron density profilesduring several storm intervals aims to determine the iono-spheric structure during events of nighttime ionisation en-hancements and to investigate the possible mechanisms thatproduce such type of disturbances.
2 Events overall perspective
This work is based on the study of three storm periods thatoccurred in September and October 2000. Six distinct mag-netic storms were determined. These events were studied indetail in the light of the global solar wind-magnetosphere-ionosphere interaction in a previous work (Belehaki andTsagouri, 2002), where the conditions under which night-time positive effects occur in the middle latitude ionospherewere determined and a possible mechanism that drives thesephenomena was also discussed. Regarding the ionosphericmechanism responsible for the height variations, it wasdemonstrated that during either positive or negative night-time effects, an upwelling of the F2-layer occurred in as-sociation with disturbed periods. To further investigate theimpact of the geomagnetic activity on the ionospheric struc-ture, and thus, the origin of positive storm phases, the iono-spheric response over Athens in height structure and in elec-tron density is studied in more detailed during selected mag-netic storms, using true height profile data from the Athens(103.5◦ E, 36.23◦ N geomagnetic) digisonde.
The Athens Digisonde Portable Sounder autoscalesthe ionograms and provides radio channel informationin real time. Data and ionograms are available inreal time on the World Wide Web via our home page(http://www.iono.noa.gr). Polarisation switching and multi-beam forming are the important prerequisites for success-ful autoscaling under disturbed and undisturbed conditions.Autoscaling algorithms find the leading edge of the O echotraces, i.e.h′(f ), and determine the standard ionospherecharacteristics. ARTIST software provides reliable verticalelectron density profiles, using the Chebyshev polynomialfitting technique (Reinisch and Huang, 1983; Huang andReinisch, 1996). Regarding the topside vertical electron den-sity profile, the new technique of Huang and Reinisch (2001)is applied. This method uses information from ground-basedionosonde measurements. The profile above the peak is ap-proximated by anα−Champan function, with a scale heightthat is derived from the profile shape at the F2 peak.
To have an indicator of the auroral oval activity, the valuesof the fourAE magnetospheric indices with 1 min resolu-tion are used, provided by WDC-C2 Kyoto (http://swdcdb.kugi.kyoto-u.ac.jp/wdc/). It has to be noted that these arethe preliminary values of theAE indices, which explain theexistence of some spikes. However, these artificially largevalues are discernible and thus, they do not affect the phys-ical information extracted by the indices. TheAE indexand also the jointAU andAL indices were introduced byDavis and Sugiura (1966) as a measure of the global auro-ral electrojet activity. TheAU and AL indices are moni-toring the eastward and westward electrojets, respectively,while theAE index, which is equal to the differenceAU–AL, corresponds to the separation betweenAU andAL en-velopes. It depends solely upon the maximum eastward andwestward electrojet currents and is independent of zonal cur-rents, if any, existing in the high-latitude ionosphere. TheAO index [AO = (AU + AL)/2] is “an approximate mea-

I. Tsagouri and A. Belehaki: On the nature of nighttime ionisation enhancements 1227
Fig. 1. The overview plot thatdescribes the ionospheric conditionsover Athens in response to geomag-netically disturbed conditions recordedfrom 29 September to 8 October 2000are presented. The development of theDst index is presented in the first panel,in hourly resolution. In the followingtwo panels, the 1-min values of theAU ,AL andAE indices are presented. Thevertical dotted lines indicate the localmidnight. The variations in the peakheight of the F2-layer are presented inthe fourth panel of Fig. 1. In termsof the d(hmF2)% deviations from thequiet values, the peak height of the F2-layer, together with the lower F2-layerboundary (hmF2–B0), are given in thefollowing panel, and finally, the rela-tive d(foF2)% deviations with respect toquiet values for this time interval fol-lowed by the d(ITEC)% variations areplotted in the two bottom panels. Thesolid lines represent the observed pa-rameters, while the dotted lines repre-sent their diurnal quiet time pattern.
sure of the equivalent zonal current” (Mayaud, 1980). Ac-cording to Akasofu (1981), theAE index is a very good in-dicator of the physical processes that occurred in the auro-ral ionosphere following an episode of enhanced solar windenergy input. The magnetosphere dissipates the input so-lar wind power partly to the auroral ionosphere as kineticpower of the auroral particles (UA = AE · 1015 erg/s) is lostin the ionosphere due to collisions and since Joule heating(Uj = 2 · 1015AE erg/s) is associated with electric currentflow in the resistive ionosphere. Hence, the use of auroralelectrojet indices may lead to useful information regardingthe amount of energy accumulated in the auroral ionosphereand consequently, transformed to kinetic and thermal energyduring the course of a substorm episode in the auroral iono-sphere.
To have a measure of the ring current injection rate as themagnetospheric response to the solar wind, the hourly valuesof the preliminaryDst index provided by WDC-C2 Kyotoare used (http://swdcdb.kugi.kyoto-u.ac.jp/wdc/).
29 September – 8 October 2000: The overview plot thatdescribes the ionospheric conditions over Athens in responseto geomagnetically disturbed conditions recorded during thisperiod is given in Fig. 1. The development of theDst indexis presented in the first panel, in hourly resolution. In the fol-lowing two panels, the one-minute values of theAU , AL andAE indices are presented. The vertical dotted lines indicatethe local midnight.
This period covers a time interval of 10 days and consistsof two distinct geomagnetic storms. The first geomagneticstorm is gradually driven and results from a low level so-
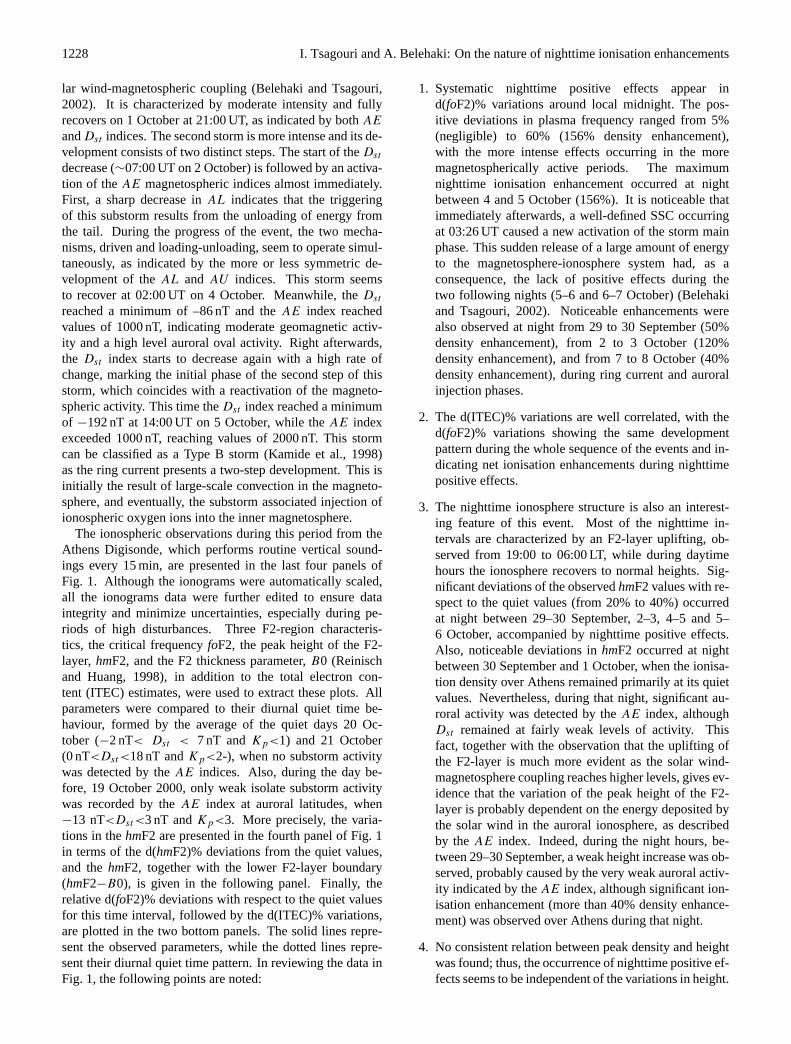
1228 I. Tsagouri and A. Belehaki: On the nature of nighttime ionisation enhancements
lar wind-magnetospheric coupling (Belehaki and Tsagouri,2002). It is characterized by moderate intensity and fullyrecovers on 1 October at 21:00 UT, as indicated by bothAE
andDst indices. The second storm is more intense and its de-velopment consists of two distinct steps. The start of theDst
decrease (∼07:00 UT on 2 October) is followed by an activa-tion of theAE magnetospheric indices almost immediately.First, a sharp decrease inAL indicates that the triggeringof this substorm results from the unloading of energy fromthe tail. During the progress of the event, the two mecha-nisms, driven and loading-unloading, seem to operate simul-taneously, as indicated by the more or less symmetric de-velopment of theAL and AU indices. This storm seemsto recover at 02:00 UT on 4 October. Meanwhile, theDst
reached a minimum of –86 nT and theAE index reachedvalues of 1000 nT, indicating moderate geomagnetic activ-ity and a high level auroral oval activity. Right afterwards,the Dst index starts to decrease again with a high rate ofchange, marking the initial phase of the second step of thisstorm, which coincides with a reactivation of the magneto-spheric activity. This time theDst index reached a minimumof −192 nT at 14:00 UT on 5 October, while theAE indexexceeded 1000 nT, reaching values of 2000 nT. This stormcan be classified as a Type B storm (Kamide et al., 1998)as the ring current presents a two-step development. This isinitially the result of large-scale convection in the magneto-sphere, and eventually, the substorm associated injection ofionospheric oxygen ions into the inner magnetosphere.
The ionospheric observations during this period from theAthens Digisonde, which performs routine vertical sound-ings every 15 min, are presented in the last four panels ofFig. 1. Although the ionograms were automatically scaled,all the ionograms data were further edited to ensure dataintegrity and minimize uncertainties, especially during pe-riods of high disturbances. Three F2-region characteris-tics, the critical frequencyfoF2, the peak height of the F2-layer, hmF2, and the F2 thickness parameter,B0 (Reinischand Huang, 1998), in addition to the total electron con-tent (ITEC) estimates, were used to extract these plots. Allparameters were compared to their diurnal quiet time be-haviour, formed by the average of the quiet days 20 Oc-tober (−2 nT< Dst < 7 nT andKp<1) and 21 October(0 nT<Dst<18 nT andKp<2-), when no substorm activitywas detected by theAE indices. Also, during the day be-fore, 19 October 2000, only weak isolate substorm activitywas recorded by theAE index at auroral latitudes, when−13 nT<Dst<3 nT andKp<3. More precisely, the varia-tions in thehmF2 are presented in the fourth panel of Fig. 1in terms of the d(hmF2)% deviations from the quiet values,and thehmF2, together with the lower F2-layer boundary(hmF2−B0), is given in the following panel. Finally, therelative d(foF2)% deviations with respect to the quiet valuesfor this time interval, followed by the d(ITEC)% variations,are plotted in the two bottom panels. The solid lines repre-sent the observed parameters, while the dotted lines repre-sent their diurnal quiet time pattern. In reviewing the data inFig. 1, the following points are noted:
1. Systematic nighttime positive effects appear ind(foF2)% variations around local midnight. The pos-itive deviations in plasma frequency ranged from 5%(negligible) to 60% (156% density enhancement),with the more intense effects occurring in the moremagnetospherically active periods. The maximumnighttime ionisation enhancement occurred at nightbetween 4 and 5 October (156%). It is noticeable thatimmediately afterwards, a well-defined SSC occurringat 03:26 UT caused a new activation of the storm mainphase. This sudden release of a large amount of energyto the magnetosphere-ionosphere system had, as aconsequence, the lack of positive effects during thetwo following nights (5–6 and 6–7 October) (Belehakiand Tsagouri, 2002). Noticeable enhancements werealso observed at night from 29 to 30 September (50%density enhancement), from 2 to 3 October (120%density enhancement), and from 7 to 8 October (40%density enhancement), during ring current and auroralinjection phases.
2. The d(ITEC)% variations are well correlated, with thed(foF2)% variations showing the same developmentpattern during the whole sequence of the events and in-dicating net ionisation enhancements during nighttimepositive effects.
3. The nighttime ionosphere structure is also an interest-ing feature of this event. Most of the nighttime in-tervals are characterized by an F2-layer uplifting, ob-served from 19:00 to 06:00 LT, while during daytimehours the ionosphere recovers to normal heights. Sig-nificant deviations of the observedhmF2 values with re-spect to the quiet values (from 20% to 40%) occurredat night between 29–30 September, 2–3, 4–5 and 5–6 October, accompanied by nighttime positive effects.Also, noticeable deviations inhmF2 occurred at nightbetween 30 September and 1 October, when the ionisa-tion density over Athens remained primarily at its quietvalues. Nevertheless, during that night, significant au-roral activity was detected by theAE index, althoughDst remained at fairly weak levels of activity. Thisfact, together with the observation that the uplifting ofthe F2-layer is much more evident as the solar wind-magnetosphere coupling reaches higher levels, gives ev-idence that the variation of the peak height of the F2-layer is probably dependent on the energy deposited bythe solar wind in the auroral ionosphere, as describedby theAE index. Indeed, during the night hours, be-tween 29–30 September, a weak height increase was ob-served, probably caused by the very weak auroral activ-ity indicated by theAE index, although significant ion-isation enhancement (more than 40% density enhance-ment) was observed over Athens during that night.
4. No consistent relation between peak density and heightwas found; thus, the occurrence of nighttime positive ef-fects seems to be independent of the variations in height.
I. Tsagouri and A. Belehaki: On the nature of nighttime ionisation enhancements 1229
12–16 October 2000: The overview plot for this event ispresented in Fig. 2 in the same format as in Fig. 1. At the be-ginning of this interval, the magnetosphere-ionosphere sys-tem was in a moderately disturbed state. The start of thisstorm can be determined as the time of occurrence of a SSCdetected at 22:28 UT on 12 October, which results in a rapidring current development and a rapid increase in allAE in-dices as well. The initial and main storm phases lasted forabout 6 h, as seen by theDst development. TheDst reacheda minimum of−63 nT. During this six-hour interval, theAE
index reached extremely large values (∼1500 nT), indicat-ing very strong Joule heating in the auroral oval. The stormrecovery phase lasted 9 h. Six hours later, a second grad-ually driven storm was detected. This storm had no initialphase. Its main phase lasted more than 24 h, due to slowly in-creasing southwardBz-IMF (Belehaki and Tsagouri, 2002).Probably, the large-scale magnetospheric convection causedthe slow development of the ring current, as indicated bythe slowly decreasingDst index. Indeed, the start of thisstorm was marked by the asymmetric enhancement ofAU
and AL indices recorded between 17:00 UT and 21:00 UTon 13 October. TheAU was severely disturbed and theAL
index decreased very slowly, indicating the energisation ofthe directly driven mechanism that directly dissipates the so-lar wind input energy in the auroral ionosphere. The last fourpanels present again the relative deviations ofhmF2 from thequiet day values,hmF2,hmF2-B0, d(foF2)% and d(ITEC)%.The diurnal quiet time behaviour at Athens, overplotted inthe sixth panel, is again formed by the average of the quietdays, 20 and 21 October. The main observations may besummarized as follows:
1. Negative effects are observed at night from 12 to 13 Oc-tober. This is the ionospheric response to the first stormevent that was caused by an SSC. This ionisation deple-tion event was accompanied by a very large increase inheight (almost 60%), initiated one hour after the sharpand large increase in theAE index (00:40 LT), whenAthens was still on the night side.
2. During the second night of this time interval (13 to14 October) that corresponds to the initial and mainphases of the second storm, positive nighttime effectsare evident over Athens. ThefoF2 deviations withrespect to the quiet values reached 20%. Noticeableheight enhancements were observed during that night.The time variation of d(hmF2) has the same behaviouras theAE index, shifted slightly in time: it is obviousthat the very large increase in height at 03:00 LT is re-lated to theAE increase detected at 00:00 LT.
3. The same pattern of ionisation enhancement withstronger intensity (this time a maximum of 70% wasrecorded) was observed during the next night (14 to15 October) and also during the last night of this stormevent interval (15 to 16 October), although its intensityis obviously attenuated. Although the magnetic storm
was in its recovery phase during the last two nights, sig-nificant auroral electrojet injections are still recorded byall AE indices. Thus, it is not surprising that despite thefact that the geomagnetic storm is in its recovery phase,the auroral activations produced significant height in-creases at night, which exceeded 20%.
4. The d(ITEC)% variations are well correlated to thed(foF2)% variations in both negative and positivephases. Once again, nighttime positive effects are as-sociated with total electron content enhancements.
5. Again, no consistent relation between the peak densityand height was found.
16–21 September 2000: This storm time interval is pre-sented in Fig. 3, which follows the format of Figs. 1 and 2.This event was the result of an interplanetary coronal massejection (ICME) detected in the analysis of ACE solar winddata by Belehaki and Tsagouri (2002). TheDst index wasalready depressed and theAE indices were activated prior tothe arrival of a fast forward shock approximately at 19:00 UTon 17 September. Immediately after the shock arrival, theDst index decreased very rapidly, reaching its minimumvalue of−172 nT at 23:00 UT on 17 September. TheAE
index reached values of 2000 nT, although there are somespikes exceeding the 2000 nT, but these might be attributedto the fact that these are preliminary values of theAE in-dex. The very sharp decrease in theAL index indicates avery sudden energisation of the westward auroral electrojetfed by the cross tail current disruption. While the systemrecovered, at 14:44 UT on 18 September a new SSC causeda deceleration inDst recovery and an intensification of theauroral electrojets, apparent inAE. Finally, at 06:00 UT on19 September, new storm activity is produced.Dst reachedthe minimum value of−80 nT on 19 September, which re-covered slowly until the end of the next day. During this lastevent, rather intense substorm activity is recorded, with theAE index having values up to 1000 nT. The behaviour of theionosphere at middle latitudes is presented in the last pan-els of the Fig. 3. The diurnal quiet time behaviour of eachparameter is now formed by the corresponding observationsduring the quiet day 11 September (9 nT< Dst <24 nT andKp<1), when no substorm activity was detected by theAE
indices. Also, during the day before, 10 September 2000, nosubstorm activity was recorded by theAE index at aurorallatitudes, when 0 nT<Dst<20 nT andKp<1. In reviewingthe data in Fig. 3, the following points are noted:
1. Nighttime ionospheric behaviour was characterized byionisation depletion during the two successive stormsdiscussed above. The d(foF2)% variations are well cor-related with d(ITEC)% variations.
2. Noticeable uplifting of the F2-layer is observed dur-ing the first two nights of this interval (16 to 17 and17 to 18 September), with the maximum increase inheight observed the second night of the major storm oc-currence and when theDst and AE indices recorded

1230 I. Tsagouri and A. Belehaki: On the nature of nighttime ionisation enhancements
Fig. 2. Same as Fig. 1 for the interval12–16 October 2000.
their maximum for this time interval. No significantheight increase was observed during the second stormevent. Indeed, the auroral oval activity expressed by theAE index was in low levels during this event, althoughsome peaks inhmF2 some hours after local midnighton 20 and 21 September coincide with enhancements ofthe auroral oval activity.
Summarizing the above observations we can note the fol-lowing first results: an upwelling of the F2-layer, limited tothe dark hemisphere, in response to enhanced geomagneticactivity, is evident in all of the storm events under study.These increases are common features of the ionospheric be-haviour during events of either ionisation depletions or en-hancements at night. They are apparent even in storm re-covery phases, always limited to the dark side hemisphere,
and the more intense effects occur during the more magneto-spherically active periods. Hence, one could say that their oc-currence and their characteristics (strength, LT initiation andduration) depend strongly on the auroral activity and theAE
index development, in particular. The following sections in-vestigate the characteristics of the observed height enhance-ments to explore the nature of these mechanisms.
3 Height enhancements characteristics
The 3-D plots of the true height variation for various plasmafrequencies during nighttime hours are presented below inan effort to study the nighttime ionospheric height structureduring disturbed periods. In Fig. 4, the density structure dur-ing the night between 20 and 21 October 2000 is presented.

I. Tsagouri and A. Belehaki: On the nature of nighttime ionisation enhancements 1231
Fig. 3. Same as Fig. 1 for the interval16–21 September 2000.
This is a very quiet interval and is taken as a reference. InFigs. 5 and 6, the density structure for two nights (2–3 Oc-tober and 13–14 October, respectively), during which ionisa-tion enhancements are observed over Athens, are presentedas characteristic examples. Finally, two nighttime intervals(17–18 September and 12–13 October) were selected as rep-resentative cases for ionisation depletion events and are pre-sented in Figs. 7 and 8.
During the night from 20 to 21 October 2000 (Fig. 4), ge-omagnetically quiet conditions lead to a rather normal iono-spheric height-density structure. No fluctuations are ob-served, except possibly for an abrupt rise around 23:00 LTand another one around sunrise, which are expected featuresof the nighttime ionospheric structure before sunrise (Rish-beth and Garriott, 1969; Oliver and Hagan, 1991).
Then we investigated the cases of nighttime positive ef-
fects. Two characteristic examples are presented in Figs. 5and 6. Intense fluctuations are evident in almost all of thenights under study. For all 5 cases of this group, some com-mon features can be reported:
1. Height fluctuations are always initiated around localsunset and seem to terminate around local sunrise. Dur-ing daytime hours, the fluctuations are totally absent.
2. The period of the fluctuations does not remain constantduring an event, and is not the same at all plasma fre-quencies, making it difficult to specify a typical period.In general, smaller periodicities (of 1 or 2 h) are ob-served before local midnight, while after local midnightthe periodicity is increased (to about 4 h) before the dis-turbance is totally attenuated. This observation may beconnected to the fact that the F2-layer is denser, before

1232 I. Tsagouri and A. Belehaki: On the nature of nighttime ionisation enhancements
20-21 October 2000
Fig. 4. The 3-D plot of the height vari-ation for plasma frequencies 2–12 MHzversus the local time for the night hoursbetween 20 and 21 October 2000. Thisis an undisturbed night taken as thequiet reference.
2-3 October 2000
Fig. 5. The 3-D plot of the height vari-ation for plasma frequencies 2–12 MHzversus the local time for the night hoursbetween 2 and 3 October 2000. Ioni-sation enhancement was observed overAthens.
local midnight. A tendency for increasingly smaller pe-riodicities at increasingly higher frequencies has alsobeen found.
3. The amplitude of the height fluctuation ranges from50 to 100 km, depending on altitude and/or frequency.
Nighttime periods characterized by negative storm effectsare discussed next. From the four cases reported in this in-vestigation, only two indicative examples are presented inFigs. 7 and 8, for the nighttime intervals of 17–18 Septemberand 12–13 October, respectively. Summarizing our results,we can report:
1. Wave-like perturbations in height can be clearly recog-
nized during all nights of ionospheric depletion. Onceagain, the disturbance started around local sunset anddeclines around local sunrise. During daytime hours,no propagating waves were observed.
2. The periodicity behaviour is similar to the pattern de-rived before, although the values are somewhat larger,typically 3 h before local midnight, and 4.5–5 afterward.This difference may be attributed to the fact that the F2-layer is less dense during ionisation depletion events.
In summary, the observed height variations have wave-likecharacteristics. Their periodicity ranges from 1 h to 5.5 h,tending toward smaller periodicities during ionisation en-
I. Tsagouri and A. Belehaki: On the nature of nighttime ionisation enhancements 1233
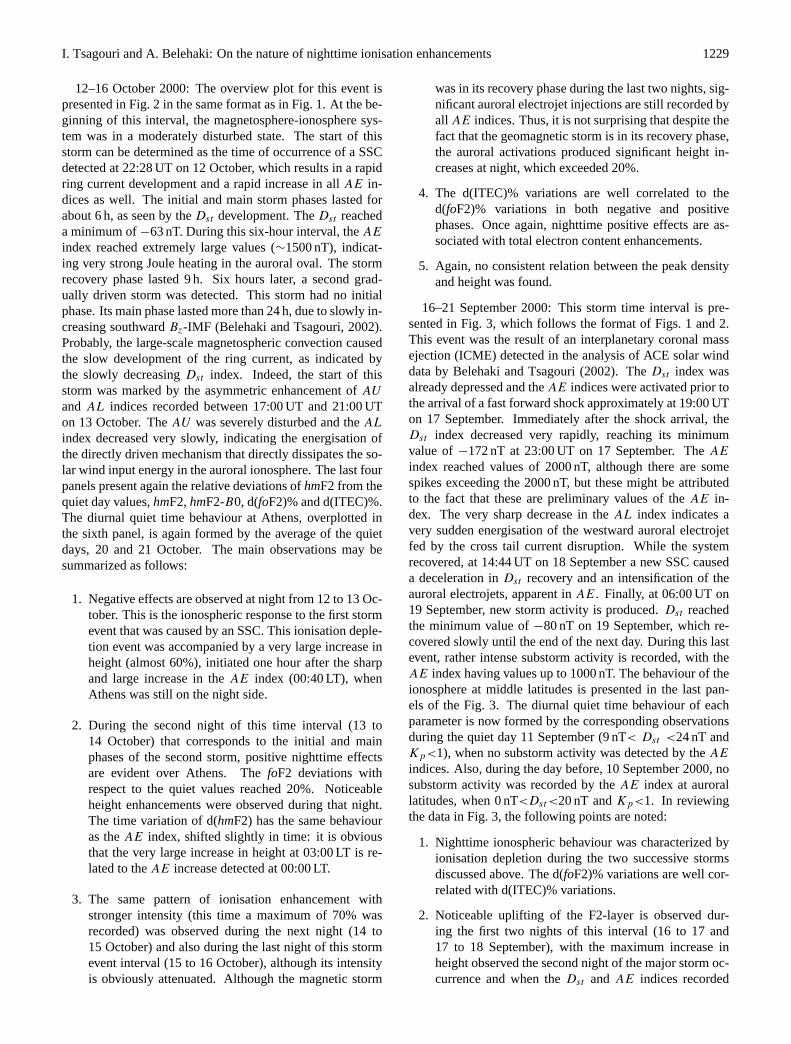
13 - 14 October 2000
Fig. 6. The 3-D plot of the height vari-ation for plasma frequencies 2–12 MHzversus the local time for the night hoursbetween 13 and 14 October 2000. Ion-isation enhancement was observed overAthens.
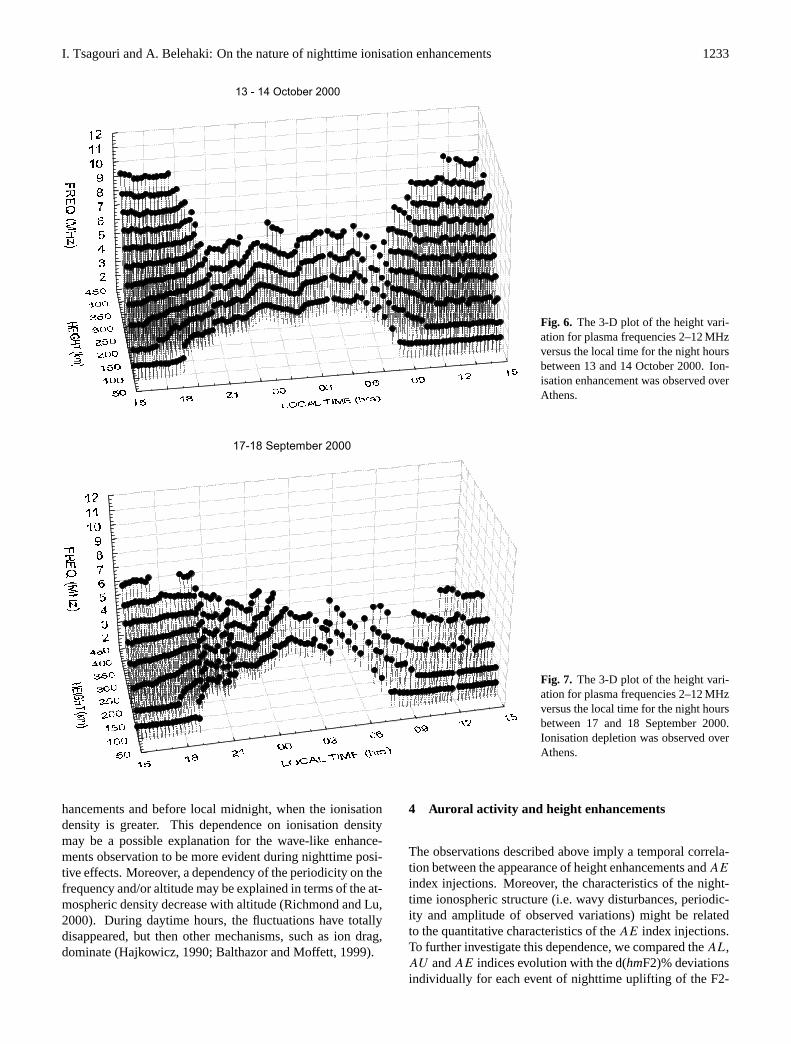
17-18 September 2000
Fig. 7. The 3-D plot of the height vari-ation for plasma frequencies 2–12 MHzversus the local time for the night hoursbetween 17 and 18 September 2000.Ionisation depletion was observed overAthens.
hancements and before local midnight, when the ionisationdensity is greater. This dependence on ionisation densitymay be a possible explanation for the wave-like enhance-ments observation to be more evident during nighttime posi-tive effects. Moreover, a dependency of the periodicity on thefrequency and/or altitude may be explained in terms of the at-mospheric density decrease with altitude (Richmond and Lu,2000). During daytime hours, the fluctuations have totallydisappeared, but then other mechanisms, such as ion drag,dominate (Hajkowicz, 1990; Balthazor and Moffett, 1999).
4 Auroral activity and height enhancements
The observations described above imply a temporal correla-tion between the appearance of height enhancements andAE
index injections. Moreover, the characteristics of the night-time ionospheric structure (i.e. wavy disturbances, periodic-ity and amplitude of observed variations) might be relatedto the quantitative characteristics of theAE index injections.To further investigate this dependence, we compared theAL,AU andAE indices evolution with the d(hmF2)% deviationsindividually for each event of nighttime uplifting of the F2-

1234 I. Tsagouri and A. Belehaki: On the nature of nighttime ionisation enhancements
12-13 October 2000
Fig. 8. The 3-D plot of the height vari-ation for plasma frequencies 2–12 MHzversus the local time for the night hoursbetween 12 and 13 October 2000. Ion-isation enhancement was observed overAthens.
layer. Since height enhancements were observed between18:00 and 06:00 in LT, we concentrated on this range ofhours, usingAE indices andhmF2 data with 15-min reso-lution. The variations of theAE indices, together with thed(hmF2)% deviations for the night intervals presented in theprevious section, are shown in Fig. 9(a–d). The following as-sumptions were made in order to study the effect of auroralenergy injection on ionospheric height variations: first, weconsider as significant height deviations those exceeding the10% level with respect to normal height values. Second, weregard as a reasonable threshold for the auroral activity af-fecting the ionosphere at geomagnetic latitudes over Athens(36.23◦ N) the value of 300 nT forAE. Auroral activationsthat causeAE disturbances with less than 300 nT produceheight variations of less than 10%.
The AE indices, together with the d(hmF2)% deviationsfor the night of 2–3 October, are presented in Fig. 9a. Theenergy injection, indicated by theAE index’s rapid increasestarting at 18:30 LT, seems to result in the first height distur-bance (of about 20%) 2 h later. A very smooth deviation inboth auroral electrojet indices, implying direct deposition ofthe solar wind energy to the auroral ionosphere that startedat 01:45 LT, led to a gradual increase in theAE index. Theheight enhancement followed with a time delay of 35 min.
The night of 12–13 October (Fig. 9b) is the most inter-esting one, since it is the most representative of our studycorresponding to ideal conditions. TheAE index was reallylow from 19:00 to about 03:00 LT and no significanthmF2deviations were observed at Athens. At 03:25 LT, a singlerapid increase in theAE index was recorded (theAE indexreached its maximum value 1300 nT in 45 min), indicatingthat the unloading mechanism in energy dissipation is thedominant one and this time, the associated height rise startedalmost simultaneously (with a 5-min delay). The maximumhmF2 deviation was about 55% for this night. During next
night (Fig. 9c), a gradual increase in theAE index led to aprolonged increase inhmF2 with a 90-min delay. The max-imum deviation inhmF2 was 35%. Finally, theAE indices,together with the d(hmF2)% deviations for the night of 17–18 September, are plotted in Fig. 9d. This night is definitelythe most complicated case encountered in this study. Here,prolonged high level activity, described by intense variationsin the AE index (evident also in both auroral oval activityindices), resulted in a consistent increase inhmF2. At theend of this event, the deviation inhmF2 reached 60% withrespect to normal values.
The above observations and the corresponding resultsfrom the analysis of all nighttime intervals analyzed in thisstudy are summarized in Table 1. The dates of the auroraassociated F2-layer uplifting and the start time of each en-ergy ejection event is noted in the first column of Table 1,while the next three columns refer to auroral energy injec-tion characteristics: the maximum value of theAE index foreach event is given in the second column, the duration of eachevent in hours is noted in the third column and the estimatedamount of the dissipated Joule heating in the auroral oval isshown in the fourth column. The last two columns give in-formation about the related height enhancement events: themaximum (%) deviation of thehmF2 with respect to the nor-mal values is given in the fifth column, while the last columnshows the observed time delay in between the energy injec-tion events at auroral latitudes, and the height enhancementsobserved at middle latitude ionosphere.
In conclusion, we denote that energy deposition at aurorallatitudes triggers a F2-layer height enhancement that is ob-servable at middle latitudes at F2-layer altitudes with a timedelay. No consistent relation was detected between heightenhancement characteristics (magnitude or time delay) andthe individual activity of each auroral electrojet separately(westward or eastward), but their combined effect seems to

I. Tsagouri and A. Belehaki: On the nature of nighttime ionisation enhancements 1235
Fig. 9. The development ofAL, AU andAE indices is compared with the d(hmF2)% deviations individually for four events of nighttimeuplifting of the F2-layer. The night hours between 18:00 LT and 06:00 LT are presented in this figure for the nights between 2–3 October(a),12–13(b) and 13–14(c) and 17–18 September(d). The events of height enhancements and theAE peak that caused them are marked withthe grey colour.
Table 1. Summary of the auroral oval energy injection events in conjunction with the ionospheric height enhancements at middle latitudes
Date and start time Max AE (nt) Duration of the Dissipated Joule Max Time delayejection event (h) energy (1021erg) d(hmF2)% (min)
29–30 Sept., 02:45 UT 590 3.0 11.1 15 13530 Sept.–1 Oct., 19:45 UT 598 1.3 4.2 19 6030 Sept.–1 Oct., 22:40 UT 851 4.3 18.3 31 1052–3 Oct., 18:30 UT 970 3.0 14.0 23 1202–3 Oct., 01:45 UT 577 4.0 13.8 35 354–5 Oct., 20:27 UT 1211 2.5 12.2 30 1054–5 Oct., 23:20 UT 923 4.5 18.5 41 505–6 Oct., 18:15 UT 1319 4.0 26.4 32 1655–6 Oct., 00:10 UT 534 2.0 7.2 37 13512–13 Oct., 03:25 UT 1259 2.5 20.2 56 513–14 Oct., 01:00 UT 592 5.0 15.7 35 9014–15 Oct., 00:50 UT 599 2.0 7.3 26 5517–18 Sept., 22:35 UT 2341 6.5 37.6 65 7018–19 Sept., 00:50 UT 415 1.0 3.1 30 16519–20 Sept., 23:55 UT 580 4.0 12.8 30 170
better describe the ionospheric structure response.To better organize the above findings and in an effort to
quantitatively relate the auroral activity with the ionosphericresponse at middle latitudes, the rate ofAE index increasewas estimated for the most clear cases, and is presented inFig. 10 as a function of the time delay in height enhancementobservations with reference to the onset of an energy dissi-pation episode. It is obvious that the time delay of height en-hancements increases with the decreasingAE index deriva-tive, indicating that the height enhancements are strongly as-sociated to the rate of the solar-wind energy dissipation at the
auroral ionosphere. Sudden release of the energy at aurorallatitudes is followed after a short time delay (probably lessthan 5 min) by an uplifting of the F2-layer (see, for example,the 12–13 October event in Fig. 9b), while gradually drivenenergy dissipation may affect the ionospheric structure a fewhours later (see, for example, the driven event of 13–14 Oc-tober presented in Fig. 9c). Since the Athens Digisonde ob-serves significant height enhancement only when theAE ex-ceeds 300 nT, the dissipated energy may also be a key param-eter for height disturbance observations at middle latitudes.In support of this, we present the maximum percentage of

1236 I. Tsagouri and A. Belehaki: On the nature of nighttime ionisation enhancements
y=23.643-10.069*log10(x)
Time Delay (min)
d(AE
)/dt (
nT/m
in)
0
4
8
12
16
20
0 50 100 150 200
Fig. 10.The rate ofAE index increase, estimated for 12 clear casesof nighttime height enhancements, as a function of the time delayin height enhancements observation with reference to the onset ofan energy dissipation episode.
hmF2 variation versus the dissipated Joule energy in the au-rora causing the F2 uplifting event in Fig. 11a, and versus themaximum value of theAE index for each event in Fig. 11b.A clear dependence is evident there, although uncertaintiesin the estimation of the relevant quantities do not allow us todetermine the exact form of the dependence.
Assuming that the height enhancements propagate fromauroral latitudes to middle latitudes, such as TID distur-bances, and that the time delay is related to the propagationvelocity of them, the above statement also holds for the prop-agation velocities’ behaviour and may be an explanation forthe large range of velocities that have been reported. Moreprecisely, studies based on meridionally spaced “chains” ofionosondes give high velocity values. For example, Hajkow-icz and Hunsucker (1987) found an equatorward propaga-tion velocity of about 800 m/s and a constant period of about135 min. Similar results were reported by Yeh et al. (1994)in a study based on spaced TEC measurement from geosta-tionary satellite signals, and from ionosonde chains. Theirderived velocities correspond more to the meridional veloc-ity component of the disturbance front than to the true phasevelocity of TID propagation. Taking into account any de-viation from the equatorward propagation, these estimatedvalues correspond to much smaller phase velocities. On theother hand, whenever the spaced beam reception methodwas used at the EISCAT incoherent scatter station, the de-termined phase velocities never exceeded 400 m/s (Ma et al.,1998). Measurements from the MU radar gave even smallerestimates (averaging about 240 m/s) (Oliver et al., 1997),while Super-DARN (Hall et al., 1999) velocities were simi-lar to TID velocities. Furthermore, Afraimovich et al. (2000)devised a technique for determining TID parameters usingGPS-arrays whose elements can be selected from a large setof GPS stations and determined a phase velocity of about300 m/s.
Supposing that the source region of the observed distur-
Max AE (nT)
Max (hmF2)%
10
20
30
40
50
60
70
200 600 1000 1400 1800 2200 2600
Dissipated Joule Energy (1021 erg)
Max (hmF2)%
10
20
30
40
50
60
70
0 5 10 15 20 25 30 35 40 45
Fig. 11. (a)The maximum d(hmF2)% variation versus the dissi-pated Joule energy in the aurora causing the F2 uplifting event.(b)The maximum d(hmF2)% variation versus the maximum value ofAE index for each event.
bances is the auroral oval region (∼60◦) and assuming thatthey propagate in an equatorward direction, rough estimatesof their propagation velocities can be made. In the cases pre-sented above, the propagation velocity ranges from 270 m/sto 1280 m/s, which again correspond better to the meridionalvelocity component of the disturbance front than to the truephase velocity propagation. But since deviation of the az-imuth of TID propagation from the equatorward direction tothe westward direction by 10–20◦, on average, has been re-ported (Oliver et al., 1997; Ma et al., 1998; Hall et al., 1999;Afraimovich et al., 2000), the true phase velocities may bemuch smaller.
5 Discussion and conclusions
In an effort to define the ionospheric structure at middle lat-itudes during events of nighttime ionisation enhancements,three storm periods in September and October 2000 were an-alyzed, when six distinct magnetic storms were determined.These storms were also analyzed by Belehaki and Tsagouri(2002) in light of the global solar wind-magnetosphere-ionosphere interaction using solar wind data, magnetosphericindices and ionospheric observations from an EW and NS

I. Tsagouri and A. Belehaki: On the nature of nighttime ionisation enhancements 1237
chain of middle latitude stations for each storm event. Thedata analysis gave evidence that the solar wind conditionsleading to storm events, which are reflected inDst develop-ment, are closely related to the occurrence of nighttime posi-tive effects at middle latitudes. In particular, it was found thatsystematic nighttime positive effects were observed at mid-dle latitudes during gradually driven magnetic storms. Aninteresting remark was that they were always associated withF2 peak height enhancements. The opposite, however, wasnot always valid, since peak height enhancements could alsobe followed by nighttime ionisation depletions.
The height variations for various plasma frequencies dur-ing nighttime hours were studied in detail with observationsfrom the Athens Digisonde. The height enhancements wereestimated to be as much as 60% from their correspondingquiet values, having wave-like characteristics, which werefound to be quite similar in both ionisation enhancement anddepletion periods. Their periodicity ranges from 1 h to 5.5 h,with a tendency for smaller periodicities to occur during ion-isation enhancements and before local midnight, when theionisation density appears greater. This dependence on ioni-sation density may be a possible explanation for the wave-like enhancement’s observation to be more evident duringnighttime positive effects. Moreover, a dependence of theperiodicity and of the amplitude on the frequency and/or al-titude was indicated that might be explained in terms of theatmospheric density dependence on altitude (Richmond andLu, 2000). A rather consistent feature is their rapid attenua-tion in daytime. This attenuation is attributed to the ion dragthat retards the gravity wave propagation associated with thehigh ionization density of the F-region in daytime (Hajkow-icz, 1990; Balthazor and Moffett, 1999).
Investigating the effect of the auroral oval activity on theionospheric response over Athens, the relation of theAE in-crease rate with the time delay in observing height enhance-ments was determined with reference to the onset of eachenergy dissipation episode. It is concluded that the time de-lay of height enhancement increases with decreasing theAE
time derivative, indicating that the occurrence of height en-hancements is strongly associated with the rate of the solar-wind energy dissipation in the auroral ionosphere.
Taking into account the wave-like character of height en-hancements and their correlation with the auroral oval activ-ity, these perturbations they may be considered as TID man-ifestations. Assuming then that they propagate from aurorallatitudes to middle latitudes, such as TID disturbances, andthat the time delay is related to their propagation velocity,the above statement also holds true for the propagation ve-locities’ behaviour and may be an explanation for the largerange of velocities that have been reported. TID consider-ation could justify a possible explanation for ionisation en-hancements (Prolss, 1993; Miller, 1997), although the lackof ionisation in the night-side hemisphere does not supportany traditional scenario in ionisation enhancements attribu-tion. Indeed, no consistent relation between the F2 peak den-sity and height variations were found, so it follows that thevariations in the two ionospheric parameters are attributed to
two distinct mechanisms. Moreover, the height increases arecommon features of the ionospheric behaviour during eventsof either ionisation decreases or increases at night. This is inconfirmation of the storm scenario proposed by Prolss (1993)in which changes in layer height are predicted for any lo-cal time. An additional feature that supports the idea thata new source of ionisation is responsible for the observednighttime ionisation enhancements is the very good correla-tion between the ITEC deviations from their quiet values andthe foF2 deviations. Since a net increase of ionisation is ob-served during nighttime ionisation enhancements, it followsthat the responsible mechanism cannot simply be an internalredistribution of ionisation.
The plasmaspheric fluxes’ scenario fits very nicely to ourfindings and agrees with what was previously suggested (e.g.Rishbeth, 1987; Richards, 1994). The possibility of observ-ing its effects is a question of geomagnetic latitude and of so-lar wind conditions that triggered the magnetic storm (Bele-haki and Tsagouri, 2002). The launch of waves from the au-roral oval in any activation of auroral electrojets, accordingto our findings, is an additional mechanism, which occursindependently of the feeding with ionisation from the plas-masphere.
Summarizing, we can conclude that nighttime ionisationenhancements and nighttime F2 uplifting are attributed totwo distinct mechanisms. Height enhancements are wave-like disturbances that most probably originate in the auroraloval region and propagate toward the equator-like TID dis-turbances. Their observation depends on the ionisation den-sity of the ionosphere, which makes their appearance dur-ing ionisation depletion periods less evident. On the otherhand, nighttime ionisation enhancements observed in termsof foF2 do not share the same wavy appearance, which maymean that they are not connected to TIDs, nor to auroraloval origin. The increased nighttime density can only bespeculated to be due to increased downward fluxes from theplasmasphere (Rishbeth, 1987; Richards, 1994). In fact,the plasmaspheric flux term can also modify the value ofhmF2 and be a contributor to the increased height observa-tion (Szuszczewicz et al., 1998).
Acknowledgements.We are grateful to the WDC-C2 for Geomag-netism, Kyoto for providing the provisionalDst -index and prelim-inary AE indices. This work was supported by the General Sec-retariat for Research and Technology of the Greek Ministry forDevelopment under the research project “Installation and develop-ment of a fully automated Digisonde by the National Observatoryof Athens” (http://www.iono.noa.gr).
Topical Editor M. Lester thanks B. Reinisch and another refereefor their help in evaluating this paper.
References
Afraimovich E. L., Kosogorov. E. A., Leonovick, L. A., Palamart-couk, K. S., Perevalova, N. P., and Pirog, O. M.: Determiningparameters of large scale travelling ionospheric disturbances ofauroral origin using GPS-arrays, J. of Atmospheric and Solar-Terrest. Physics, 62, 553–565, 2000.

1238 I. Tsagouri and A. Belehaki: On the nature of nighttime ionisation enhancements
Akasofu S.-I.: Energy coupling between the solar wind and themagnetosphere, Space Sci. Rev., 28, 121–190, 1981.
Balthazor R. L. and Moffett, R. J.: Morphology of large scale travel-ling atmospheric disturbances in the polar thermosphere, J. Geo-phys. Res., 104, 15–24, 1999.
Bauske R. and Prolss, G. W.: Modelling the ionospheric responseto travelling atmospheric disturbances, J. Geophys. Res., 102,14 555–14 562, 1997.
Belehaki A. and Tsagouri, I.: On the occurrence of storm inducednight-time ionisation enhancements at ionospheric middle lati-tudes, J. Geophys. Res. (in press), 2002.
Burnside, R. G., Templey, C. A., Sulzer, M. P., Fuller-Rowell, T. J.,Torr, D. G., and Roble, R. G.: The neutral thermosphere at Are-bico during geomagnetic storms, J. Geophys. Res., 96, 1289–1301, 1991.
Davis, T. N. and Sugiura, M.: Auroral electrojet activity indexAE
and its universal time variations, J. Geophys. Res., 71, 785–801,1966.
Fuller-Rowell, T. J., Codrescu, M. V., Moffett R. J., and Quegan, S.:Response of the thermosphere and ionosphere to geomagneticstorms, J. Geophys. Res., 99, 3893–3914, 1994.
Fuller-Rowell T. J., Codrescu, M. V., Rishbeth, H., Moffett R. J.,and Quegan, S.: On the seasonal response of the thermosphereand ionosphere to geomagnetic storms, J. Geophys. Res., 101,2343–2353, 1996.
Hajkowicz, L. A.: A global study of traveling ionospheric distur-bances (TIDs) followinga step-like onset of auroral substorms inboth hemispheres, Planet. Space Sci., 38, 913–923, 1990.
Hajkowicz, L. A. and Hunsucker, R. D.: A simultaneous observa-tion of large scale periodic TIDs in both hemispheres followingthe onset of auroral disturbances, Planet. Space Sci., 35, 785–791, 1987.
Hall G. E., MacDougall, J. W., Cecile, J.-F., Moorcroft, D. R., andSt.-Maurice, J. P.: Finding gravity wave source positions usingthe Super Dual Auroral Radar Network, J. Geophys. Res., 104,67–78, 1999.
Huang, X. and Reinisch, B. W.: Vertical electron density profilesfrom the Digisonde network, Adv. Space Res., 18, 6, 121–129,1996.
Huang, X. and Reinisch, B. W.: Vertical total electron content fromionograms in real time, Radio Sci., 36, 335–342, 2001.
Kamide Y., Yokoyama, N., Gonzalez, W., Tsurutani, B. T., Daglis,I. A., Brekke, I., and Masuda, I.: Two-step development of geo-magnetic storms, J. Geophys. Res., 103, 6917–6921, 1998.
Ma S. Y., Schlegel K., and Xu, J. S.: Case studies of the propaga-tion characteristics of auroral TIDs with EISCAT CP2 data usingmaximum entropy cross-spectral analysis, Ann. Geophysice, 42,161–167, 1998.
Mansilla G. A. and Manzano, J. R.: Some theoretical aspects ofionospheric storms at middle latitudes, Annali di Geofisica, 4,511–517, 1998.
Mayaud P. N.: Derivation, Meaning and Use of Geomagnetic In-dices, AGU Geophysical Monograph, Series, 1980.
Mayr H. G. and Volland, H.: Composition waves in the thermo-sphere, J. Geophys. Res., 81, 671–676, 1976.
Miller, C. A.: Electrodynamics of midlatitude spread F2. A new the-ory of gravity wave electric fields, J. Geophys. Res., 102, 11 533–11 538, 1997.
Oliver W. L. and Hagan, M. E.: Simulation of a gravity wave overthe middle and upper atmosphere radar, J. Geophys. Res., 96,9793–9800, 1991.
Oliver W. L., Otsuka, Y., Sato, M., Takami, T. and Fukao, S.: Aclimatology of F region gravity wave propagation over the mid-dle and upper atmosphere radar, J. Geophys. Res., 102, 14 449–14 512, 1997.
Potter W. E., Kayser D. C., and Mauersberger, K.: Direct mea-surements of neutral wave characteristics in the thermosphere,J. Geophys. Res., 81, 5002–5012, 1976.
Prolss, G. W.: On explaining the local time variation of ionosphericstorm effects, Ann. Geophysicae, 11, 1–9, 1993.
Reinisch, B. W.: Modern Ionosondes, in: Modern Ionospheric Sci-ence, (Eds) Kohl, H., Ruster, R., and Schlegel, K., EuropeanGeophysical Society, 37191 Katlenburg-Lindau, Germany, 440–458, 1996.
Reinisch, B. W. and Huang, X.: Automatic Calculation of ElectronDensity Profiles from Digital Ionograms, 3, Processing of Bot-tomside Ionograms, Radio Sci., 18, 477–492, 1983.
Reinisch, B. W. and Huang, X.: Finding better B0 and B1 parame-ters for the IRI F2-profile function, Adv. Space Res., 22, 6, 741–747, 1998.
Richards, P. G., Torr, D. G., Buonsanto, M. J., and Sipler, D. P.:Ionospheric effects of the March 1990 magnetic storm: Compar-ison of theory and measurement, J. Geophys. Res., 99, 23 359–23 365, 1994.
Richmond, A. D. and Lu, G.: Upper-atmospheric effects of mag-netic storms: a brief tutorial, J. of Atmospheric and Solar-Terrest.Physics, 62, 1115–1127, 2000.
Rishbeth, H., Fuller-Rowell T. J., and Rodger, A. S.: F-layer stormsand thermospheric composition, Phys. Scr., 36, 327–336, 1987.
Rishbeth, H. and Garriott, O. K.: Introduction to IonosphericPhysics, Academic Press New York and London, 1969.
Szuszczewicz, E. P., Lester, M., Wilkinson, P., Blanchard, P.,Abdu, M., Hanbaba, R., Igarashi, K., Pulinets, S., and Reddy,B. M.: A comparative study of global ionospheric responsesto intense magnetic storm conditions, J. Geophys. Res., 103,11 665–11 684, 1998.
Trinks, H. and Mayr, H. G.: Large scale neutral composition gravitywaves in the thermosphere observed by ESRO 4, J. Geophys.Res., 81, 4023–4026, 1976.
Tsagouri I., Belehaki, A., Moraitis, G., and Mavromichalaki, H.:Positive and negative ionospheric disturbances at middle lati-tudes during geomagnetic storms, Geophys. Res. Lett., 27, 3579–3582, 2000.
Yeh, K. C., Ma, S. Y., Lin, K. H., and Conkright, R. O.: Globalionospheric effects of the October 1989 geomagnetic storm, J.Geophys. Res., 99, 6201–6218, 1994.
Copyright © 2022 FDOKUMEN