On the design of information-processing and decisionmaking organizations
20
September 1982 LIDS-P-1241 ON THE DESIGN OF INFORMATION-PROCESSING AND DECISIONMAKING ORGANIZATIONS* by Kevin L. Boettcher** Alexander H. Levis** *This work was supported by the US Air Force Office of Scientific Research under contract No. AFOSR-80-0229. This is an invited paper to be presented at the 5th International Conference on Analysis and Optimization of Systems, December 14-17, 1982, Versailles, France. **The authors are with the Laboratory for Information and Decision Systems, M.I.T., Cambridge, MA 02139.
-
Upload
independent -
Category
Documents
-
view
1 -
download
0
Transcript of On the design of information-processing and decisionmaking organizations

September 1982 LIDS-P-1241
ON THE DESIGN OF
INFORMATION-PROCESSING AND DECISIONMAKING ORGANIZATIONS*
by
Kevin L. Boettcher**
Alexander H. Levis**
*This work was supported by the US Air Force Office of Scientific Researchunder contract No. AFOSR-80-0229. This is an invited paper to be presentedat the 5th International Conference on Analysis and Optimization of Systems,December 14-17, 1982, Versailles, France.
**The authors are with the Laboratory for Information and Decision Systems,M.I.T., Cambridge, MA 02139.

Report Documentation Page Form ApprovedOMB No. 0704-0188
Public reporting burden for the collection of information is estimated to average 1 hour per response, including the time for reviewing instructions, searching existing data sources, gathering andmaintaining the data needed, and completing and reviewing the collection of information. Send comments regarding this burden estimate or any other aspect of this collection of information,including suggestions for reducing this burden, to Washington Headquarters Services, Directorate for Information Operations and Reports, 1215 Jefferson Davis Highway, Suite 1204, ArlingtonVA 22202-4302. Respondents should be aware that notwithstanding any other provision of law, no person shall be subject to a penalty for failing to comply with a collection of information if itdoes not display a currently valid OMB control number.
1. REPORT DATE SEP 1982 2. REPORT TYPE
3. DATES COVERED 00-09-1982 to 00-09-1982
4. TITLE AND SUBTITLE On the Design of Information-Processing and DecisionmakingOrganizations
5a. CONTRACT NUMBER
5b. GRANT NUMBER
5c. PROGRAM ELEMENT NUMBER
6. AUTHOR(S) 5d. PROJECT NUMBER
5e. TASK NUMBER
5f. WORK UNIT NUMBER
7. PERFORMING ORGANIZATION NAME(S) AND ADDRESS(ES) Massachusetts Institute of Technology,Laboratory for Information andDecision Systems,77 Massachusetts Avenue,Cambridge,MA,02139-4307
8. PERFORMING ORGANIZATIONREPORT NUMBER
9. SPONSORING/MONITORING AGENCY NAME(S) AND ADDRESS(ES) 10. SPONSOR/MONITOR’S ACRONYM(S)
11. SPONSOR/MONITOR’S REPORT NUMBER(S)
12. DISTRIBUTION/AVAILABILITY STATEMENT Approved for public release; distribution unlimited
13. SUPPLEMENTARY NOTES
14. ABSTRACT
15. SUBJECT TERMS
16. SECURITY CLASSIFICATION OF: 17. LIMITATION OF ABSTRACT
18. NUMBEROF PAGES
19
19a. NAME OFRESPONSIBLE PERSON
a. REPORT unclassified
b. ABSTRACT unclassified
c. THIS PAGE unclassified
Standard Form 298 (Rev. 8-98) Prescribed by ANSI Std Z39-18

ON THE DESIGN OF
INFORMATION-PROCESSING AND DECISIONMAKING ORGANIZATIONS*
Kevin L. Boettcher
Alexander H. Levis
Laboratory for Information and Decision Systems
Massachusetts Institute of Technology
Cambridge, MA 02139/USA
ABSTRACT
An effectiveness measure for comparing alternative organizational structures is
derived and then applied to the evaluation of two three-person organizations. The
modeling and analysis of the organizations is carried out using an information
theoretic framework in which decisionmakers are described by a two-stage model
consisting of a situation assessment and a response selection stage. The total rate
of internal processing of each decisionmaker is constrained by bounded rationality,
while the performance of the organization must satisfy specified goals. The inter-
relationship between performance and bounded rationality is expressed in a general-
ized strategy space that forms the basis for the effectiveness analysis.
I. INTRODUCTION
A command control and communications (C3)system is defined as the collection of
equipment and procedures used by commanders and their staff to process information,
arrive at decisions, and communicate these decisions to the appropriate units in the
organization in a timely manner. Implicit in this definition is the notion that the
role of the human decisionmaker is central to the design of organizations and the
C3 systems that support them. A basic model of an interacting decisionmaker, appro-
priate for a narrow but important class of problems, was introduced by Boettcher
and Levis [1]. In subsequent work, Levis and Boettcher [2],[3] considered the model-
ing of organizations consisting of multiple decisionmakers that form a team. In
this paper, consideration is given to comparing alternative organizational structures
which have been modeled using the methodology already developed.
*The work was supported by the US Air Force Office of Scientific Research undercontract No. AFOSR-80-0229.

An information theoretic framework is used for both the modeling of the indivi-
dual decisionmaker and of the organization. The basic departure from previous models
is in the modeling of the internal processing of the inputs to produce outputs. This
processing includes not only transmission (or throughput) but also internal coordi-
nation, blockage, and internally generated information. Consequently, the limita-
tions of humans as processors of information and problem solvers are modeled as a
constraint on the total processing activity. This constraint represents one inter-
pretation of the hypothesis that decisionmakers exhibit bounded rationality [4].
The task of the organization is modeled as receiving signals from one or many
sources, processing them, and producing outputs. The outputs could be signals or
actions. The input signals that describe the environment may come from different
sources and, in general, portions of the signals may be received by different members
of the organization. Consideration in this paper will be restricted to structures
that result when a specific set of interactions is allowed between team members. In
this case, each team member is assigned a specific task, whether it consists of
processing inputs received from the external environment or from other team members,
for which he is well trained and which heperforms again and again for successively
arriving inputs. The overall mapping between the stimulus (input) to the organiza-
tion and its response (output) is determined by the internal decision strategies of
each decisionmaker. The total activity of each DM as well as the performance mea-
sure for the organization as a whole are expressed then in terms of these internal
decision strategies. For each set of admissible internal decision strategies, one
for each DM, a point is defined in the performance-workload space. The locus of all
such points is characteristic of the organizational structure. For particular
bounded rationality and performance constraints applied in this space, the effective-
ness of a given organizational structure can be assessed and then compared to alter-
native structures.
In the next section, the model of the interacting organization member is re-
viewed. In the third section, the extension of the methodology to teams with
acyclical information structures is reviewed by presenting results from the model-
ing of two specific three-person organizational structures. In the fourth section,
a method for comparing alternative organizational structures is presented and applied
to the two structures considered in section three.

II. MODEL OF THE ORGANIZATION MEMBER
The complete realization of the model for a decisionmaker (DM) who is inter-
acting with other organization members and with the environment is shown in Fig. 1.
The detailed description and analysis of this model has been presented in [1]. There-
fore, only concepts and results needed to model the organization are described in
this section. The presentation is similar to that in [3].
Z Z' v'
q ,X) h_ .
Figure 1 Single interacting decisionmaker model-
Let the organization receive from the environment a vector of symbols, X'. The
DM receives x which is a noisy measurement of a portion, x', of X'. The vector x
takes values from a known finite alphabet according to the probability distribution
p(x). The quantity
H(x) = - Ep(x) log 2 p(x) (1)x
is defined to be the entropy of the input measured in bits per symbol generated. The
conditional entropy is defined as
H (z) = - p(x (Z) p(zx) log2 P(zx) (2)x z
If input symbols are generated every T seconds on the average, then T, the mean
symbol interarrival time, is a description of the tempo of operations [5].
The situation assessment stage consists of a finite number U of procedures or
algorithms fi that the DM can choose from to process the measurement x and obtain
the assessed situation z. The internal decisionmaking in this stage is the choice
of algorithm f. to process x. Therefore, each algorithm is considered to be active1

or inactive, depending on the internal decision u. In this paper, it is assumed that
the algorithms f. are deterministic. This implies that once the input is known and
the algorithm choice is made, all other variables in the first part of the SA stage
are known. Furthermore, because no learning takes place during the performance of
a sequence of tasks, the successive values taken by the variables of the model are
uncorrelated, i.e., the model is memoryless. Hence, all information theoretic
expressions appearing in this paper are on a per symbol basis.
The vector variable z', the supplementary situation assessment received from
other members of the organization, combines with the elements of z to produce z.
The variables z and z are of the same dimension and take values from the same alpha-
bet. The integration of the situation assessments is accomplished by the subsystem
which contains the deterministic algorithm A.
If there is no command input vector v' from other organization members, then
the response selection strategy p(v1z) specifies the selection of one of the algo-
rithms h, that map z into the output y. The existence of command input v' modifies
the decisionmaker's choice v. A final choice v is obtained from the function
b(v,v'). The latter defines a protocol according to which the command is used, i.e.,
the values of v determined by b(v,v') reflect the degree of option restrictioneffected
by the command. The result of this process is a response selection strategy p(vlzv !)
in place of p(vl.z).
The mutual information or transmission or throughput between inputs x,z', andv'
and outputs y and z, denoted by T(x,z',v:y,z) is a description of the input-output
relationship of the DM model and expresses the amount by which the outputs are re-
lated to the inputs:
Gt = T(x,z',v':y,z) = H(x,z',v) + H(y,z) - H(x,z',v',y,z)
= H(z,y) - H , ,(z,y) (3)
A quantity complementary to the throughput Gt is that part of the input infor-
mation which is not transmitted by the system. It is called blockage and is defined
as
G = H(x,z',v') - G (4)b -- t
In this case, inputs not received or rejected by the system are not taken into
account.
In contrast to blockage is a quantity that describes the uncertainty in the
output when the input is known. It may represent noise in the output generated
within the system or it may represent information in the output produced by the
system. Generalizing this concept to include the total system uncertainty which
remains when the input is known gives the quantity Gn:n
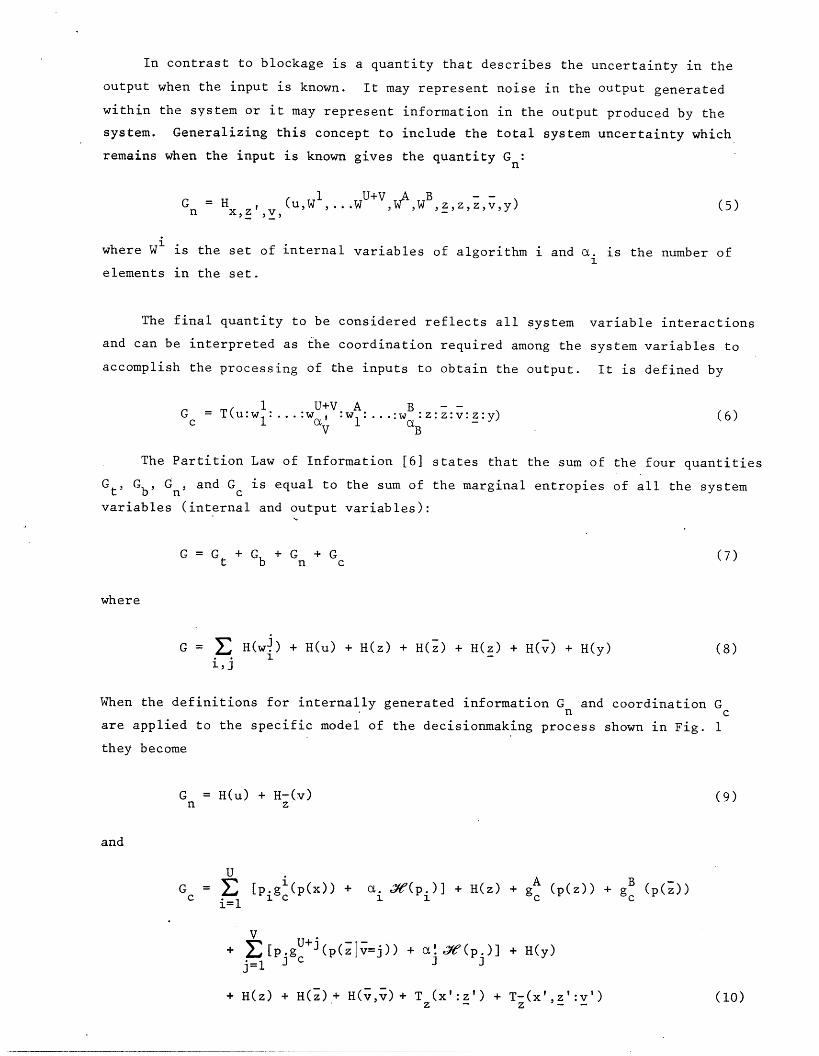
G = H ,, (u,Wl,...w U+V,wW ,z,z,,v,y) (5)n x,z ,v,
where W i is the set of internal variables of algorithm i and a. is the number of
elements in the set.
The final quantity to be considered reflects all system variable interactions
and can be interpreted as the coordination required among the system variables to
accomplish the processing of the inputs to obtain the output. It is defined by
1 U+V A BG = T(u:w :...:w :l:...:w zz zy (6)
V B
The Partition Law of Information [6] states that the sum of the four quantities
Gt, Gb, G , and G is equal to the sum of the marginal entropies of all the system
variables (internal and output variables):
GG G G + G +G (7)t b n c
where
G = E H(wj) + H(u) + H(z) + H(z) + H(z) + H(v) + H(y) (8)1i,j
When the definitions for internally generated information Gn and coordination G-
are applied to the specific model of the decisionmaking process shown in Fig. 1
they become
G = H(u) + H-(v) (9)n z
and
U A BGc [pigl(p(x)) + ai J'(Pi)] + H(z) + gc (p(z)) + g (p(Z))c il ic 1 1 c c
j=1
+ H(z) + H(z) + H(v,v) + T (x':z') + T-(x',z':v') (10)z - Z - -

The expression for G shows that it depends on the two internal strategies p(u)n
and p(vlz) even though a command input may exist. This implies that the command in-
put v' modifies the DM's internal decision after p(viz) has been determined.
In the expressions defining the system coordination, Pi is the probability that
algorithm fi has been selected for processing the input x and pj is the probability
that algorithm h. has been selected, i.e., u=i and v=j. The quantities g represent
the internal coordination of the corresponding algorithms and depend on the distri-
bution of their respective inputs. The quantity is the entropy of a random vari-
able that can take one of two values with probability p:
_J(p) = - p logp - (l-p) log(l-p) (11)
The quantity G may be interpreted as the total information processing activity
of the system and, therefore, it can serve as a measure of the workload of the or-
ganization member in carrying out his decisionmaking task.
III. TEAMS OF DECISIONAMKERS
In order to define an organizational structure, it is necessary to specify
exactly the interactions of each decisionmakerwithin the organization. A decision-
maker is said to interact with the environment when he receives inputs directly from
sources or when he produces outputs that are all or part of the organization's out-
put. The internal interactions consist of receiving inputs from other DMs, sharing
situation assessments, receiving command inputs, and producing outputs that are
either inputs or commands to other DMs. If these interactions are shown graphically
in the form of a directed graph, then the organizational forms being considered
have directed graphs which do not contain any cycles or loops. The resulting
decisionmaking organizations are defined as having acyclical information structures,
This restriction in the structure of the organizations is introduced to avoid dead-
lock and also messages circulating within the organization. It prohibits a DM from
sending commands to other DMs from which he is receiving command inputs. However,
simultaneous sharing of situation assessment information is allowed.
The types of information-processing and decisionmaking organizations that can
be modeled using the methodology are discussed in detail in [3]. A simple example
has been constructed to illustrate the approach based on aspects of the problem of
organizing batteries of surface to air missiles. Let a trajectory of a target be
defined by an ordered pair of points located in a rectangle that represents a two-
dimensional (flat) sector of airspace. From the ordered pair, the speed and direction
of flight of the target can be determined. On the basis of that information either
fast or a slow missile could be fired or no missile fired at all. The overall task,

then, is to observe the targets, identify their speed and direction, and select an
appropriate response. The size of the sector and the frequency of target arrivals
is such that a single decisionmaker cannot perform the task; it is necessary to
design an organization.
Two specific three-person organizational structures are considered. The first,
Organization A, is a pure parallel structure and is defined as follows. The rectan-
gular sector is divided into three equal subsectors and a decisionmaker is assigned
to each one. Each DM is capable of observing only the points that appear in his sub-
sector. He can assess the situation, i.e., estimate the trajectory, and select the
response, i.e., which weapons to fire, for targets with trajectories totally within
his subsector. This is the case when both points that define the target are within
his subsector. Since it is possible for trajectories to "straddle" the subsector
boundaries, it is necessary that situation assessment information be shared. Thus,
DM1 and DM 2 share information that relates to their common boundary. Similarly, DM2
and DM3 share information that relates to targets that cross their common boundary.
To keep the computational effort small the situation assessment stages of DMland DM3
are assumed to contain a single algorithm f; that of DM2 contains two algorithms,
f and f2. In contrast, the response selection stage of DM2 contains a single
algorithm h, while the RS stages of DM1 and DM6 contain two algorithms h and h2,
i=1,3. Therefore, the internal decision strategies are p(u2), p(vllz 1) and p(v31z3).
The detailed structure of this organization is shown in Figure 2.
Analytic expressions for the total processing activity of each decisionmaker
are obtained by specializing the expressions (3), (4), (9), and (10) given in
section one.
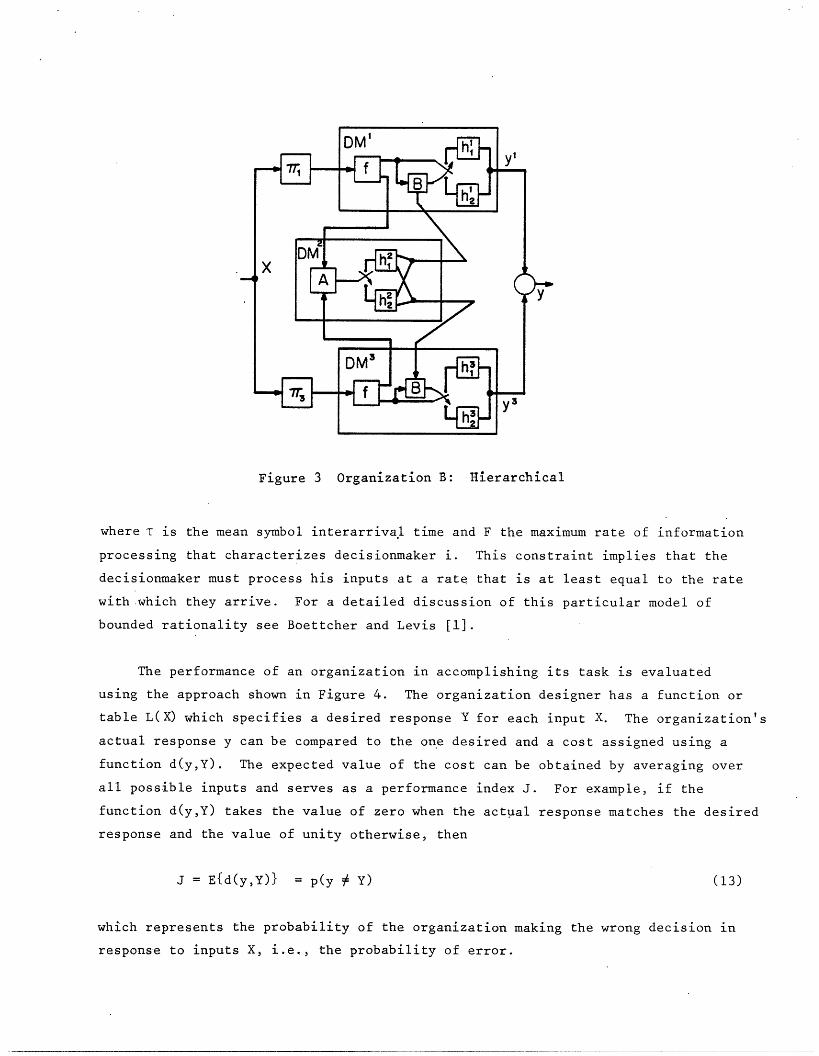
The second organization, Organization B, contains a decisiomaker who performs
a supervisory function and is defined as follows. The rectangular sector is divided
into two equal subsectors for which DMI and DM3 are responsible for assessing the
situation and selecting a response. The two DMs do not share situation assessment
between themselves; however, data from the area adjacent to the boundary between
DM1 and DM3 is transmitted to the coordinator or supervisor, DM2, who resolves
conflicts and assigns targets either to DM1 or to DM3 , as appropriate. This is
accomplished through command inputs v12 1 and v'2 3 from the coordinator to the two
commanders, where the first superscript designates the decisionmaker of origin and
the second denotes the DM of destination. The commanders, in turn, exercise their
response yl and y3, respectively. Again, for computational simplicity, it is as-
sumed that DM1 and DM3 have a single algorithm f for their SA stage and two algo-i i
rithms h and h for the RS stage. The coordinator, DM2, has an algorithm A for
processing the assessed situations z112and z'3 2and two algorithms, h 2 and h2 , in the

DM3
Figure 2 Organization A: Parallel
RS stage. The internal decision strategies are p(vllzl), p(v2 Iz2) and p(v3 1z3).
The structure of this organization is shown in Figure 3.
The complete organization design in each case consists of the partition of the
organization input, the specification of all the algorithms f, h, A and B, and the
protocols for information exchange. For a given probability distribution on the
targets, the total processing activity of each decisionmaker can be computed for
the design as a function of internal decision strategies. To evaluate the design,
it is necessary to account for the bounded rationality of organization members as
well as to consider the organization's performance of the overall task.
Bounded Rationality and Performance Evaluation
The quantitative notion that the rationality of a human decisionmaker is not
perfect, but is bounded, has been modeled as a constraint on the total activity G:
i i i i i3. .G =G G G t G + < F T (12)
t b n c -
DM /
IDM 7
Figure 3 Organization B: Hierarchical
Figure 3 Organization B: Hierarchical
where T is the mean symbol interarrival time and F the maximum rate of information
processing that characterizes decisionmaker i. This constraint implies that the
decisionmaker must process his inputs at a rate that is at least equal to the rate
with which they arrive. For a detailed discussion of this particular model of
bounded rationality see Boettcher and Levis [1].
The performance of an organization in accomplishing its task is evaluated
using the approach shown in Figure 4. The organization designer has a function or
table L(X) which specifies a desired response Y for each input X. The organization's
actual response y can be compared to the one desired and a cost assigned using a
function d(y,Y). The expected value of the cost can be obtained by averaging over
all possible inputs and serves as a performance index J. For example, if the
function d(y,Y) takes the value of zero when the actual response matches the desired
response and the value of unity otherwise, then
J = E{d(y,Y)} = p(y # Y) (13)
which represents the probability of the organization making the wrong decision in
response to inputs X, i.e., the probability of error.

X ORGANIZATION Y(A or B)
Figure 4 Performance evaluation of an organization.
Organizational Decision Strategies
As stated earlier, once the structure of the organization is determined, the
actual values of total processing activity for DM , G , and the value of organiza-
tional performance J are functions of the internal decision strategies selected
by each decisionmaker. Let an internal decision strategy for a given decisionmaker
be defined as pure, if both the situation assessment strategy p(u) and the response
selection strategy p(vlz) are pure, i.e, an algorithm f is selected with probability
one and an algorithm h is selected also with probability one when the situation
assessed as being z:
Dk = {p(u=r) = 1; p(v=slz=2) = 11 (14)
for some r, some s, and for each z element of the alphabet Z. There are n possible
pure internal strategies,
n = u.vM (15)
where U is the number of fi algorithms in the SA stage, V the number of h. algorithms
in the RS stage and M the dimension of the set.Z. All other internal strategies are
mixed [7] and are obtained as convex combinations of pure strategies:
nD(Pk) = p kDk (16)
where the weighting coefficients are probabilities.

Corresponding to each D(Pk) is a point in the simplex
, P> 0 V k (17)k=l
The possible strategies for an individual DM are elements of a closed convex hyper-
polyhedron of dimension n-l whose vertices are the unit vectors corresponding to
pure strategies.
Because of the possible interactions among organization members, the value of
G depends not only on Di(pk) but also on the internal decisionsof the other decision-
makers. For the two structures under consideration, a pure organizational strategy
is defined as a triplet of pure strategies, one from each DM :
A = {D1 D2 D3} (18)k,L,m k' Z, m
Independent internal decision strategies for each DM, whether pure or mixed, induce
a behavioral strategy [7] for the organization, which can be expressed as
A= A (19)ktm k,,m Pk P Pm (19)
1 2 3where Pk' p., and pm are the probabilities of using pure strategies, Dk, D and Dm,
respectively. Because each DM is assumed to select his strategy independently of
other DMs, the strategy space of the organization S0 is determined as the direct
sum of the individual DM strategy spaces:
S° = S1 ( S2 e S3 (20)
where Si denotes the individual DM strategy space. The dimension of S is
(n -l) + (n -1) + (n -1). For the specific structures of Organizations A and B~~1 2
n = n = 4 and n = 2. Thus the possible organizational strategies are elements of1 3 2
a 7- dimensional closed convex hyperpolyhedron. The locus of performance and
workload is constructed parametrically as A ranges over S :
Performance-Workload Loci
For organizations A and B the performance workload space is four-dimensional,
namely (J, GC,G2,G3). The G of each decisionmaker is a convex function of the A,
eq. (19), in the sense that
G (A) > E G i(Ak,,m)Pk Pt Pm (21)k,m,m

where Ak, is is defined in eq. (18). The result in eq. (21) follows from the def-where Ak,L,m.
inition of G as the sum of the marginal entropies of each system variable, eq. (8),
and the fact that the possible distributions p(w), where w is any system variable,
are elements of a convex distribution space determined by the organization decision
strategies, i.e.,
p(w) £ {p(w) p(w) = { P(w)Ak, m)pk Pt Pm, (22)k,£,m
The performance index of the organization can also be obtained as a function of
A. Corresponding to each Ak,,m is a value of Jkx,m of the performance index.
Since any organization strategy being considered is a weighted sum of pure strategies,
the organization's performance can be expressed as
J(A) Jk, ,m Pk Pt Pm (23)k,£,m
From eqs. (21) and (23), it is possible to construct the locus of possible
(J, G1,GZ,G3) points parametrically by varying A. To illustrate the characteristics
of this four-dimensional locus, it is convenient to examine projections into spaces
of lower dimension. Because of the similarity of DM' and DM3 in each organization,
the projections into the (J,G1), (J,G2) and (J,G1,G2) spaces are representative of
the organization and are shown in Figure 5(a,b) and 6(a,b).
4.5
4.0
3.5 -
J3.0
2.5-
0 o _ I I I I I I I15 20 25 30 1 35 40 45 50 55
Fig. 5(a) Performance-Workload locus for DM1 in Organizations A and B
Preliminary assessment of the two structures shows that Organization B is able
to achieve a better performance than A. However, the realizable performances are
overlapping, that is,depending on the particular strategies chosen, A may at times
be better than B with respect to performance. In addition, the effect of a decision-
maker's bounded rationality must also be considered. For DMI eq.(12) takes the formof a hyperplane orthogonal to the Gi iand the value of F may be such that only
of a hyperplane orthogonal to the G axis and the value of F T may be such that only
4.5
4.0
3.5
3.0
2.5 B
15 20 25 30 35 40 45 50 55G:
Fig. 5(b) Performance-Workload locus for DM2 in Organizations A and B
a subset of the original locus satisfies the processing load constraint.
The possible constraints or design objectives expressed in terms of J and T
necessitate a method for evaluating alternative designs as a function of these
quantities. In the present case, the choice is restricted to be between the two
proposed structures. If the design criterion is such that J < 5.0 is required and
T is large enough, then both structures are acceptable. -Conversely. for T small
J
4.0
3.0
2.0
1.0 I
10 20 130 1 40 50,X 10& /
I/I I
20 /
30
40G'
Figure 6(a) Projection of Performance-Workload locus ofOrganization A in (J,G1,G2) space

Ji
4.0
3.0
2.0
G'
Figure 6(b) Projection of Performance-Workload locus ofOrganization B in (J,G1,G2) space
enough and/or a performance requirement of J < 2, neither design is appropriate.
Suppose, however, that F1 = F3 = 20 bits/sec and F2 = 25 bits/sec. Then for T = 2
secs/symbol and a performance objective of J < J = 4 it is not apparent which design
is preferable. A means of making this assessment is the subject of the next section.
IV. ASSESSING AND COMPARING ALTERNATIVE ORGANIZATION DESIGNS
From the viewpoint of the organization designer, specification of a structure
means the allocation of information processing and decisionmaking tasks to the orga-
nization's members so that the overall task is performed without anyone being over-
loaded. In the implementation of a designed structure, however, individual decision-
makers select their own internal decision strategies independently of all other or-
ganization members. For given constraints on processing load and performance, a
particular structure can yielda broad range of performance depending on the actual
strategies chosen by the DMs. The designer must therefore also assess the likeli-
hood that strategies which are organizationally acceptable will be selected, i.e.,
it must be insured that individual decision strategies are mutually consistent.
Organization design begins with a. set of specifications to be met, a task to be
performed. With the present framework, the designer proposes a particular structure
and specifies the protocols and sets of procedures to be used by individual organi-
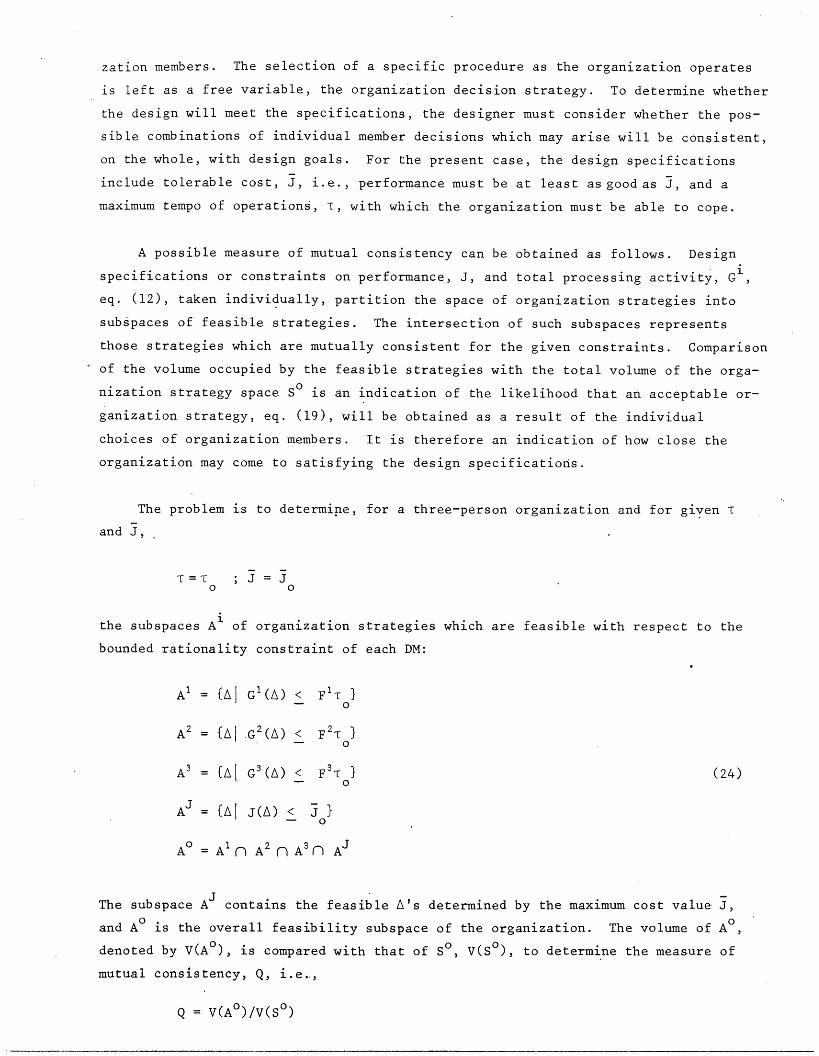
zation members. The selection of a specific procedure as the organization operates
is left as a free variable, the organization decision strategy. To determine whether
the design will meet the specifications, the designer must consider whether the pos-
sible combinations of individual member decisions which may arise will be consistent,
on the whole, with design goals. For the present case, the design specifications
include tolerable cost, J, i.e., performance must be at least as good as J, and a
maximum tempo of operations, T, with which the organization must be able to cope.
A possible measure of mutual consistency can be obtained as follows. Design
specifications or constraints on performance, J, and total processing activity, Gi ,
eq. (12), taken individually, partition the space of organization strategies into
subspaces of feasible strategies. The intersection of such subspaces represents
those strategies which are mutually consistent for the given constraints. Comparison
of the volume occupied by the feasible strategies with the total volume of the orga-
nization strategy space S° is an indication of the likelihood that an acceptable or-
ganization strategy, eq. (19), will be obtained as a result of the individual
choices of organization members. It is therefore an indication of how close the
organization may come to satisfying the design specifications.
The problem is to determine, for a three-person organization and for given T
and J,
0 0
the subspaces Ai of organization strategies which are feasible with respect to the
bounded rationality constraint of each DM:
Al = {Aj G1(A) < F'T }_ O
A2 = {A. G2 (A) < F2 T }-- 0
A3 = {AI G3(A) < F3 T } (24)- O0
AJ = {AI J(A) < J }
A° = Al n A2 n A3n A
The subspace A contains the feasible A's determined by the maximum cost value J,
and A is the overall feasibility subspace of the organization. The volume of A° ,
denoted by V(A°), is compared with that of S° , V(S° ), to determine the measure of
mutual consistency, Q, i.e..,
Q = V(A°)/V(S° )

In general, Q is a monotonic function of J and T, with minimum zero and maximum one.
The former case, Q = 0, implies that no combination of strategies of individual
decisionmakers will satisfy the design specifications, while the latter implies
that all organizational strategies are feasible, i.e., satisfy the bounded ratio-
nality and performance constraints.
The general characteristics of the various partitions of S which arise are
subjects of current research. For the two organizational structures A and B of
the example, however, the quantities in eqs. (24) are well-defined and can be
computed to illustrate how one might compare and evaluate alternative structures
using the measure Q.
The two independent variables in Q are the performance constraint J and the
minimum task interarrival time T. Therefore, Q can be plotted as a function of J
and T. The results for Organization A, the parallel structure, are shown in Fig. 7.
Since low values of T imply fast tempo and low values of J imply almost error-free
performance, it follows that for low T and J the value of Q is zero. As the con-
straints are relaxed, more and more organization strategies become feasible until
all are feasible. This is shown by the surface Q = 1 in Fig. 7.
10
0
Figure 7 Mutual consistency measure Q vs. J and T for Organization A.
Contours of constant Q have been plotted in the (J,T) plane for each organiza-
tion and are shown in Figs.8 and 9. The shaded regions in each case represent
values of J and T for which the entire space of strategies is feasible or for which
no strategies are feasible. It is possible that a practical design consideration
might be to make sure that Q is equal to unity at the design specifications (J T )
Furthermore, it may also be desirable that the boundary of the unity contour be
maintained a reasonable distance away from the design specifications, Such a consi-
deration would provide for margins in the design to compensate for uncertainties

caused by unmodeled effects. On the other hand, it may well be that a likelihood
of 80%, say, in selecting an acceptable organization strategy (Q = 0.8) provides
adequate assurance that the design specifications will be met on the average
Q 0-=1.o.<~ //0 774 1 / / ,-5.0
Q = 0.6 4.0Q =O.4
1.0
0.43 and, 01, ru, i0.0T 2.5 2.0 1.5 1.0 0.5 0.0
Figure 8 Constant Q loci for Organization A
Consider now the specific characteristics of the two organizations at hand. It
is evident that organization B is able to meet a more stringent requirement on J than
Organization A. However, r can cope with faster tempos of operation than B. If the
design specifications are (Jo,) = (2.0, 4.0) then the values of Q for A and B are
0.43 and 0.51, respectively. This implies that B is awmore effective structure, in
the sense that at that particular point a greater percentage of the possible strat-
egies of Organization B yield satisfactory operation of the organization than those
of A. Of course, depending on the desired or anticipated operating point, the com-
parison of Q values may result in the opposite conclusion. It is also necessary to
consider how robust the value of Q is with respect to variations about an operating
point. This requires information on the sensitivity of Q which can be determined
from the surfaces generated as shown in Fig. 7 or can be assessed from the equi-Q
contours shown in Figures 8 and 9.
/741Q~~~~~- 5.0
Q = 0.8 00 =:0.6 3.0
Q = 0.0ZJ/ // /1.0
- 0.0T 2.5 2.0 1.5 1.0 0.5 0.0
Figure 9 Constant Q loci for Organization B

V. CONCLUSION
In recent work, an approach to modeling an evaluation of information processing
and decisionmaking organizations has been developed. The emphasis has been on de-
scribing an organization in a generalized performance-workload space where the per-
formance refers to organizational performance and workload to the workload of each
individual member. In this paper, a quantitative procedure has been presented for
comparing alternative organizational structures. It is based on a comparison of
how well the alternative structures can satisfy the design specifications for a
minimum tolerable performance and for maximum tempo of operations.
REFERENCES
[1] K. L. Boettcher and A. H. Levis, "Modeling the Interacting Decisionmaker with
Bounded Rationality," IEEE Trans. Sys., Man and Cybernetics, Vol. SMC-12,
pp. 334-344, 1982.
[2] A. H. Levis and K. L. Boettcher, "Modeling Teams of Interacting Decisionmakers
with Bounded Rationality," Proc. IFAC/IFIP/IFORS/IEA Conf. on Analysis Design
and Evaluation of Man Machine Systems, Pergamon Press, London, September 1982.
[3] A. H. Levis and K. L. Boettcher, "Decisionmaking Organizations with Acyclical
Information Structures," Proc. 21st IEEE Conference on Decision and Control,
Orlando, FL, Dec. 1982.
[4] J. G. March, "Bounded Rationality, Ambiguity, and the Engineering of Choice,"
Bell Journal of Economics, Vol. 9, 1978, pp. 587-608.
[5] J. S. Lawson, Jr., "The Role of Time in a Command Control System," Proc.
Fourth MIT/ONR Workshop on C3 Systems, LIDS-R-1159, MIT, Cambridge, MA 1981.
[6] R. C. Conant, "Laws of Information Which Govern Systems," IEEE Transactions
on Systems, Man, and Cybernetics, Vol. SMC-6, pp. 240-255.
[7] G. Owen, Game Theory, W. B. Saunders Company, Philadelphia, PA, 1968.