
On prediction in orthognathic surgery - GUPEA
106
On prediction in orthognathic surgery Analysis of 2D and 3D techniques from multiple perspectives Martin Bengtsson Department of Oral and Maxillofacial Surgery Institute of Odontology Sahlgrenska Academy at University of Gothenburg
-
Upload
khangminh22 -
Category
Documents
-
view
1 -
download
0
Transcript of On prediction in orthognathic surgery - GUPEA
On prediction in orthognathic surgery
Analysis of 2D and 3D techniques from multiple perspectives
Martin Bengtsson
Department of Oral and Maxillofacial Surgery Institute of Odontology
Sahlgrenska Academy at University of Gothenburg

Cover illustration: Prediction of mandibular asymmetric surgical movement. Performed by Martin Bengtsson. Facilitated by Simplant® PRO 12.00 OMS (Materialise corp., Leuven, Belgium. www.materialise.com).
On prediction in orthognathic surgery © Martin Bengtsson 2018 [email protected] http://hdl.handle.net/2077/54192 ISBN 978-91-629-0404-3 (PRINT) ISBN 978-91-629-0405-0 (PDF) Printed in Gothenburg, Sweden 2018 by BrandFactory

To Maria
Josef, Simon & Ester
Forgiveness is the answer to the child’s dream of a miracle by which what is broken is made whole again, what is soiled is made clean again.
Dag Hammarskjöld, 26 Dec 1956

On prediction in orthognathic surgery Analysis of 2D and 3D techniques from multiple
perspectives
Martin Bengtsson
Department of Oral and Maxillofacial Surgery, Institute of Odontology Sahlgrenska Academy at University of Gothenburg
Gothenburg, Sweden
ABSTRACT
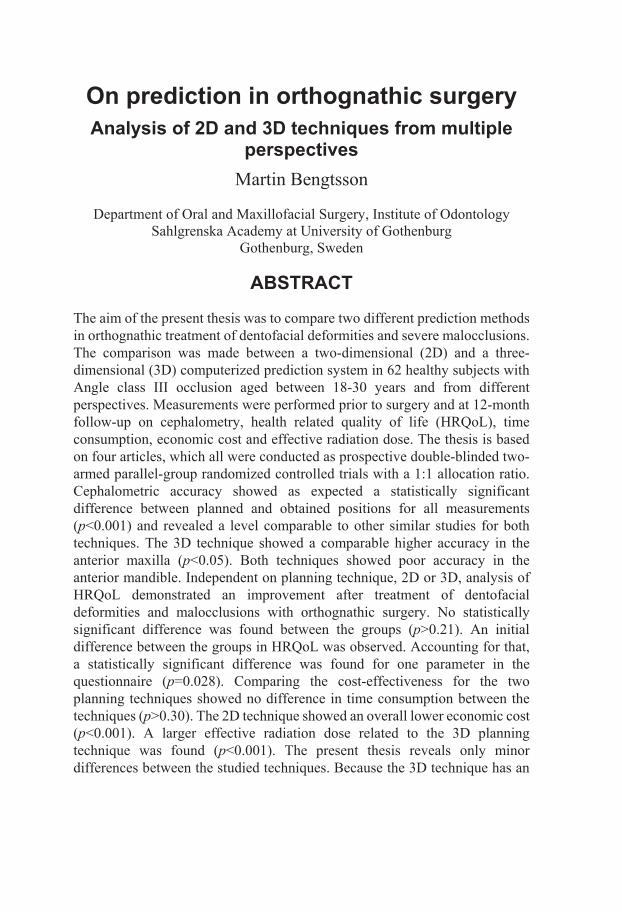
The aim of the present thesis was to compare two different prediction methods in orthognathic treatment of dentofacial deformities and severe malocclusions. The comparison was made between a two-dimensional (2D) and a three-dimensional (3D) computerized prediction system in 62 healthy subjects with Angle class III occlusion aged between 18-30 years and from different perspectives. Measurements were performed prior to surgery and at 12-month follow-up on cephalometry, health related quality of life (HRQoL), time consumption, economic cost and effective radiation dose. The thesis is based on four articles, which all were conducted as prospective double-blinded two-armed parallel-group randomized controlled trials with a 1:1 allocation ratio. Cephalometric accuracy showed as expected a statistically significant difference between planned and obtained positions for all measurements (p<0.001) and revealed a level comparable to other similar studies for both techniques. The 3D technique showed a comparable higher accuracy in the anterior maxilla (p<0.05). Both techniques showed poor accuracy in the anterior mandible. Independent on planning technique, 2D or 3D, analysis of HRQoL demonstrated an improvement after treatment of dentofacial deformities and malocclusions with orthognathic surgery. No statistically significant difference was found between the groups (p>0.21). An initial difference between the groups in HRQoL was observed. Accounting for that, a statistically significant difference was found for one parameter in the questionnaire (p=0.028). Comparing the cost-effectiveness for the two planning techniques showed no difference in time consumption between the techniques (p>0.30). The 2D technique showed an overall lower economic cost (p<0.001). A larger effective radiation dose related to the 3D planning technique was found (p<0.001). The present thesis reveals only minor differences between the studied techniques. Because the 3D technique has an

advantage for the group of patients with asymmetry it would be the technique recommended for any case in the clinical setting.
Keywords: Orthognathic surgery, Dentofacial deformity, Three-dimensional, Two-dimensional, Computer-aided surgical simulation, Virtual surgical planning, Prediction, Cephalometry, Randomized controlled trial, Blinded case-controlled cohort study
ISBN: 978-91-629-0404-3 (PRINT)
ISBN: 978-91-629-0405-0 (PDF)

SAMMANFATTNING PÅ SVENSKA Frågeställning/hypotes Syftet var att undersöka om valet av planeringsteknik inför kirurgisk behandling av grava bettfel påverkar behandlingsresultat, livskvalitet och planeringskostnad. Hypotesen var att en modernare tredimensionell teknik (3D) ger ett bättre behandlingsresultat jämfört med en tvådimensionell teknik (2D). Bakgrund Behandling av grava bettfel involverar oftast både tandreglering och kirurgisk förflyttning av käkarna. Behandlingen tar ca 2 år och behandlingsresultatet är beroende av en noggrann planering innan behandlingsstart. Material Studien omfattade 2 x 31 (62) patienter med gravt underbett som behandlades med kirurgisk förflyttning av käkarna. Metoder Prospektiv, randomiserad, två-armad, blindad fall-kontrollstudie. Patienterna fördelades enligt följande: a) Testgrupp: 3D preoperativ planeringsteknik. b) Kontrollgrupp: 2D preoperativ planeringsteknik. Jämförelseanalys mellan status före och efter behandling utfördes med mätningar i röntgenbilder, av patientupplevd livskvalité, av tid, kostnad och stråldos. Resultat 57 patienter av 62 inkluderade fullföljde studien. Bortfallet var pga uteblivande vid uppföljning. Ur profilperspektiv noterades en god överensstämmelse mellan planerad behandling och slutresultat för båda planeringsteknikerna. Mätning av livskvalitet visade en klar förbättring efter behandling för båda grupperna, men till en något högre grad i testgruppen. Testgruppen visade högre ekonomisk kostnad och högre stråldos. Den totala tidsåtgången var likvärdig. Slutsatser Studien visade ett likvärdigt och gott resultat för de båda planeringsteknikerna avseende överenstämmelse mellan planerad behandling och slutresultat samt patientnöjdhet. Dock har 3D tekniken ett övertag när det gäller patienter med asymmetriska avvikelser. Jämförelse av ekonomi och stråldos visade högre värden för 3D tekniken, medan total tidsåtgång var likvärdig.


Martin Bengtsson
1
LIST OF ARTICLES This thesis is based on the following studies, referred to in the text by their Roman numerals.
I. Bengtsson M, Wall G, Miranda-Burgos P, Rasmusson L. Treatment outcome in orthognathic surgery - A prospective comparison of accuracy in computer assisted two and three-dimensional prediction techniques. J Craniomaxillofac Surg 2017. DOI 10.1016/j.jcms.2017.01.035
II. Bengtsson M, Wall G, Greiff L, Rasmusson L. Treatment outcome in orthognathic surgery - a prospective randomized blinded case-controlled comparison of planning accuracy in computer-assisted two- and three-dimensional planning techniques (part II). J Craniomaxillofac Surg 45 (2017) pp. 1419-1424 DOI 10.1016/j.jcms.2017.07.001
III. Bengtsson M, Wall G, Larsson P, Becktor JP, Rasmusson L. A comparison of treatment outcome of patient reported quality of life in Orthognathic Surgery between computer assisted two and three-dimensional planning techniques: a randomized double-blinded active-controlled clinical trial. Am J Orthod Dentofacial Orthop. Accepted for publication 2017-12-30.
IV. Bengtsson M, Wall G, Becktor JP, Rasmusson L. Treatment outcome in Orthognathic Surgery - a randomized double-blinded active-controlled clinical comparison of cost-effectiveness in computer assisted two- and three-dimensional planning techniques. Submitted.
On prediction in orthognathic surgery
2
CONTENT ABBREVIATIONS .............................................................................................. 4 DEFINITIONS IN SHORT .................................................................................... 5 1 INTRODUCTION ........................................................................................... 7
1.1 Survey of the field ................................................................................. 8 1.2 Dentofacial deformities ....................................................................... 10 1.3 Diagnostics and treatment planning .................................................... 11
1.3.1 Cephalometry .............................................................................. 11 1.3.2 Prediction .................................................................................... 17
1.4 Evaluation and predictability .............................................................. 19 1.4.1 Cephalometry .............................................................................. 20 1.4.2 Health related quality of life ........................................................ 21 1.4.3 Radiation dose ............................................................................. 23 1.4.4 Cost-Effectiveness analyzes ........................................................ 26
2 AIM ........................................................................................................... 27 2.1 Specific aims ....................................................................................... 27
3 SUBJECTS AND METHODS ......................................................................... 28 3.1 Subjects ............................................................................................... 28 3.2 Methods ............................................................................................... 30
3.2.1 Cephalometric measurements ...................................................... 33 3.2.2 Quality of life .............................................................................. 40 3.2.3 Cost-Benefit ................................................................................ 41 3.2.4 Statistical methods and analysis .................................................. 43 3.2.5 Ethical considerations ................................................................. 44
4 RESULTS ................................................................................................... 46 4.1 Subjects ............................................................................................... 46 4.2 Drop-outs ............................................................................................ 47 4.3 Cephalometry ...................................................................................... 48
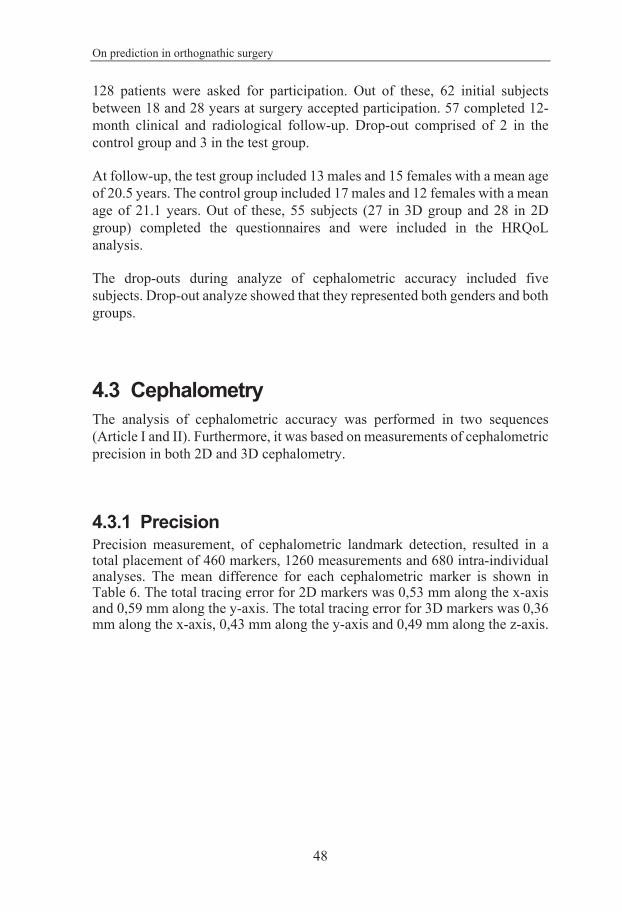
4.3.1 Precision ...................................................................................... 48

Martin Bengtsson
3
4.3.2 Accuracy ...................................................................................... 49 4.4 Health Related Quality of Life ............................................................ 55
4.4.1 Measurement of HRQoL ............................................................. 58 4.4.2 Comparisons of HRQoL with accuracy ....................................... 58 4.4.3 Test retest for HRQoL ................................................................. 60
4.5 Cost Effectiveness Analyze ................................................................. 60 4.5.1 Measurement of time consumption ............................................. 60 4.5.2 Measurements of economic cost ................................................. 61 4.5.3 Measurements of radiation dose .................................................. 62 4.5.4 Measurements of cost-effectiveness ............................................ 63
5 DISCUSSION .............................................................................................. 65 5.1 Comments on study design ................................................................. 65 5.2 Comments on material ........................................................................ 66 5.3 Comments on methods ........................................................................ 67 5.4 Comments on results ........................................................................... 69
6 CONCLUSION ............................................................................................ 74 6.1 Clinical implications ........................................................................... 75
7 FUTURE PERSPECTIVES ............................................................................. 76 ACKNOWLEDGEMENT .................................................................................... 78 REFERENCES .................................................................................................. 81 APPENDIX ...................................................................................................... 88
On prediction in orthognathic surgery
4
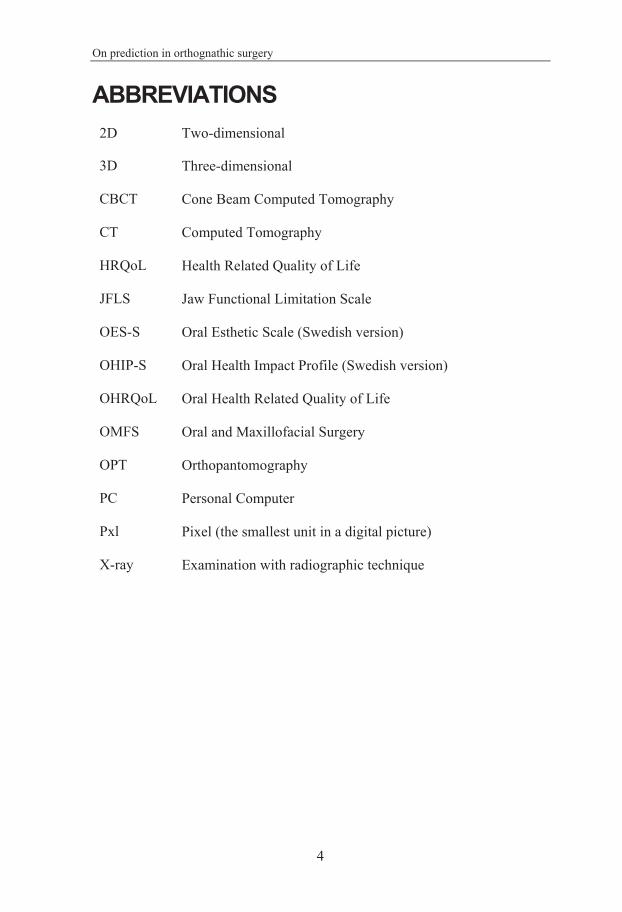
ABBREVIATIONS 2D Two-dimensional
3D Three-dimensional
CBCT Cone Beam Computed Tomography
CT Computed Tomography
HRQoL Health Related Quality of Life
JFLS Jaw Functional Limitation Scale
OES-S Oral Esthetic Scale (Swedish version)
OHIP-S Oral Health Impact Profile (Swedish version)
OHRQoL Oral Health Related Quality of Life
OMFS Oral and Maxillofacial Surgery
OPT Orthopantomography
PC Personal Computer
Pxl Pixel (the smallest unit in a digital picture)
X-ray Examination with radiographic technique
Martin Bengtsson
5
DEFINITIONS IN SHORT Bimaxillary surgery Surgical correction of both jaws
Cephalometry Measurements in a radiographic image of the facial bones
Field of view The area which is covered by a picture
Genioplasty Surgical technique to move the frontal tip of the mandible
Le Fort I Osteotomy Surgical technique to move the upper jaw
Malocclusion Bite problems
Mandible Lower jaw
Maxilla Upper jaw
Orthodontic Therapeutic nonsurgical movements of the teeth
Orthognathic A way to describe the position of the jaws in the visceral skeleton
Postnormal occlusion Over bite
Prediction Method to simulate a postsurgical treatment outcome
Prenormal occlusion Undershot
Sagittal Split Osteotomy Surgical technique to move the lower jaw forwards or backwards
Service center Global specialist support center for computerized surgical planning and fabrication of customized surgical guides (for example wafers)

On prediction in orthognathic surgery
6
Tomography Three-dimensional radiographic technique
Vertical ramus osteotomy Surgical technique to move the lower jaw backwards
Wafer Customized surgical guide for jaw corrections
Martin Bengtsson
7
1 INTRODUCTION Today there is an increasing demand on facial ideals and esthetics which gives us the challenge to succeed our efforts when trying to fulfill the patient’s wishes. The role of preoperative prediction in orthognathic surgery could therefore not be overestimated. Some colleagues say that more than half of the surgical treatment is done in the planning phase. Two-dimensional (2D) cephalometric treatment planning does not include features such as planning possibilities for asymmetrical deformities and prediction of soft tissue changes in the frontal aspect. Often has a clinical feeling for such changes developed together with an increasing experience of the surgeon. Hence, decisions are depending on subjective judgments. However, in an early surgical career there is a need for more technical support in decision making on facial soft tissue changes.
Orthognathic treatment is common in maxillofacial centers. Units with a relative low number of patients each year have a need for logical and easy equipment for treatment planning. However, it takes more time to gather experience in a small unit with relatively low number of patients. Thus, there is a need for more technical support in decision making in treatment planning. This is facilitated by an equipment easy to handle, fairly inexpensive and building on commonly used methods such as 2D radiographs, dental casts and 2D photographs.
In prediction of orthognathic treatment, it is important to gather all information before making the final decision. These are clinical records, dental casts, radiographs, photographs, subjective and objective treatment needs and patient expectations. There is a pedagogical advantage to gather as much as possible of this information in one kind of record-type such as a computer program. The newest software allows gathering of radiographs, photographs, head position and dental casts before treatment planning1-4. This reduces the risk of losing precision in prediction of dental function, dental esthetics and the facial appearance. In other words, if prediction is performed in all different recordings separately, the risk of adding several planning errors increases. Gathering of several different recordings prior to prediction, also increases the possibility to compensate for the lack of precision in the single one of them. One example of this is that a dental cast model could compensate for the lack of precision in reproducing the dental occlusion in a CT. Another example is that a CT could show the relations between hard and soft tissue better than a photograph could do.
On prediction in orthognathic surgery
8
Patient satisfaction is one important perspective of this project. This is also one subject of priority in the DUET´s database on knowledge gaps (National Health Services database on uncertainties about the effects of treatment, former NHS DUET now https://www.evidence.nhs.uk). Even if there is a lack of scientific studies on patient’s self-perceived outcome, there is also a lack of controlled and randomized prospective studies on modern surgical orthognathic treatment planning.
The implementation of this type of knowledge will positively affect the patient experience of treatment results through more secured and validated treatment planning methods.
1.1 Survey of the field Severe malocclusions have since the beginning of 20th century been managed with both orthodontic and surgical methods5. In the early years, most cases were treated with only surgical or only orthodontic methods, but since the beginning of the 1970´s there have been an increasing collaboration between these two specialties. Today, the method of choice is often a combined treatment.
Hullihen performed the first known surgical treatment of a malocclusion in 18496. In the early years, the surgical treatment was focused on mandibular corrections. In the early 1960´s the sagittal split osteotomy was introduced7. Osteotomy in the maxilla was already described in 1927 by Wassmund 8, but was not completely included into the treatment arsenal of orthognathic surgery until the early 1970’s9.
Treatment planning of severe malocclusion has since the 1920´s involved profile radiograph10. In the early years it was only used for rough diagnostics. Cephalometric measurements were introduced later and were at that time used only at research institutions and universities with access to the cephalometric equipment11. In the early 1950´s when Margolis introduced his head holder12, the profile radiograph became a common tool in treatment planning. Since then the treatment planning has been dealing with both the relations between the maxilla and mandible, and the relations between the jaws and the visceral skeleton and the scull base13. In the 1960´s the awareness of the relation between the jaws and the horizontal plane was introduced. It was by that time discovered that the positioning of the patient’s head was an important factor. The expression natural head position was invented14-16.
Martin Bengtsson
9
In most maxillofacial centers, treatment prediction is usually based upon clinical examination, 2D radiographs, photographs and dental casts. Some centers use computer based software for cephalometric measurements and treatment prediction. These computer programs were introduced already in the late 1960´s17,18 but became commercially available first in the 1980´s and were widely spread in the 1990´s. Some of them are mainly used as diagnostic tools, but more advanced programs are suitable as treatment prediction assistance19.
Computed tomography (CT) became a widely spread radiographic method in the later part of the 20th century, and is today accessible from any maxillofacial center. Together with the development of the CT technique the development and the usage of computerized methods to study the radiographic images with different computer software’s has increased20. At the same time, three-dimensional (3D) computerized predictions of orthognathic treatments have become possible21,22. However, the idea that every dentofacial diagnosis should be based on three dimensions is not new. It was already stated by Simon in 192323. Until a few years ago, the 3D computer programs have been mostly accessible in research settings. Some software companies and service centers have released programs to the market for a fairly reasonable prize. Examples of that are Simplant® PRO 12.00 OMS (Materialise corp., Leuven, Belgium. www.materialise.com) and Dolphin 3D® (Dolphin Imaging, California, US. www.dolphinimaging.com).
The absence of scientific evaluation of 3D techniques for planning and treating severe malocclusion with orthognathic surgery is apparent. It is partly caused by a rapid digital, technical and electronical evolution during the last decades. The reports available are mainly descriptions of innovations of new digital techniques, and are not evaluating the effects on treatment20-22. There have been reports on older methods of prediction and accuracy19, and the results are satisfying from an objective point of view but are not involving the patients’ perspective.
In the Swedish database of Statens beredning för medicinsk utvärdering (SBU http://www.sbu.se/sv/kunskapsluckor-sok) of anticipated gaps of scientific knowledge, there is one example from the area of malocclusion in which this research project will lead closer to understanding (“Ortodonti som en del i en multidisciplinär betthabilitering vid kraniofaciala syndrom och/eller defekter med för individen kvarvarande bett- och tandpositionsavvikelser hos vuxna”).
In National Health Services (NHS former DUET, now https://www.evidence.nhs.uk) database on uncertainties about the effects of treatment there are a few examples of topics demanding for further research
On prediction in orthognathic surgery
10
(“The impact of malocclusion/orthodontic treatment need on the quality of life”, “Stability after bilateral sagittal split osteotomy advancement surgery with rigid internal fixation”), and in this area, it is judged to be a gap in knowledge.
1.2 Dentofacial deformities Deformities of the face are divided into facial deformities and dentofacial deformities. The dentofacial deformities are far more common than the facial deformities. The facial deformities consist of malformations of the jaws affecting the occlusion, and severe effects are visible in the upper face and midface, i.e. in patients with different facial syndromes like Crouzon, Apert and Treacher Collins. They represent only 0.001% of the population. Dentofacial deformities, likewise affecting both the function and the appearance, are 50-100 times more common as these rare syndromes of facial deformity. Another deformity associated with a severe malocclusion is Cleft-Lip-Plate, which is represented in 0,2% of the population.
The dentofacial deformities include both the dentition and the jaws. Epidemiological surveys reveal that about 5 % of the western population has dentofacial disproportions of a magnitude that affect both function and facial aesthetics.
There are degrees of the magnitude of deformity, and classifications of different deviations from an “ideal” appearance. Angle5 made a classification in the beginning of the 20th century. He classified the occlusion into mild discrepancies (I), postnormal occlusion (II) and prenormal occlusion (III)5. Several attempts to make classifications of jaw discrepancies have followed24, and many of these relate to different cephalometric analyses. Today there are different means to describe the positioning of the jaws; intermaxillary like open basal occlusion or in relation to the scull base like mandibular retrognatism, maxillary prognatism etc.
There are also means to describe the soft tissue or facial appearance, like long face, dish face etc.
Martin Bengtsson
11
1.3 Diagnostics and treatment planning Several modern cephalometric and prediction systems are developed and used as a combination of diagnostic tools and treatment planning facilities. It is necessary to bear in mind that the diagnostic tool should be used to assist but not to decide the treatment. This is a mistake that could lead into a historic and outdated way of treatment planning where the movements of teeth and facial skeleton aims only for a normalization of cephalometric measurements. However, this does not imply that cephalometric measurements are outdated as a descriptive tool for malposition of facial structures, but should together with other examinations, like clinical measurements photographs, patient wishes and prediction, act in a concerted way of deciding the treatment. Based on this, the description of 2D and 3D techniques are divided into separate subheadings, describing cephalometry and prediction separately.
1.3.1 Cephalometry Cephalometric measurements are performed in a radiographic image of the facial bones. It is usually performed in 2D lateral, 2D frontal or 3D radiographic images.
1.3.1.1 Two-dimensional cephalometry The development of the cephalometric methods has mainly been concerned with reliability of different measurement methods, both for diagnostics and prediction. Cephalometric markers (Figure 1) of both hard and soft tissue landmarks are used and analyzed according to their relations in distance, angles and planes25,26. Systematic evaluations and combinations of the measurements have been performed. Several authors have made their names in textbooks. The Downs analysis, Steiner analysis, Sassouni analysis, Harvold analysis, McNamara analysis and Ricketts analysis are examples. Cephalometric measurements have since the 1930´s been performed on analogue profile radiographs11. Already in 1960´s cephalometry was digitalized17,18. Computer programs for digitalized cephalometry became commercially available for clinicians in late 1980’s. Several software programs were independently developed, like Dolphin Imaging®, Facad®, Dentofacial Planner®, Nemoceph®, Quick Ceph® and Vistadent®27,28. Some of them are still in the market and evolving with improved function, human-machine interface and visualization.
On prediction in orthognathic surgery
12
Salzmann29 stated that cephalometric measurements can:
• show dimensional relationship of the craniofacial components. • reveal manifestations of growth and developmental abnormalities. • aid in treatment planning. • help to analyze changes obtained. • assist in evaluating the effectiveness of different orthodontic
treatment procedures. • show dentofacial growth changes after treatment is completed.
There have also been attempts to evaluate radiographs from a frontal aspect with cephalometric markers, like the Ricketts or the Grummons frontal cephalometric analysis30,31. However, even if a combination of a frontal and a lateral should add one dimension to the records, it still does not give a full three-dimensional volume to analyze.

Martin Bengtsson
13
Figure 1. Cephalometric markers placed in a profile radiograph using the cephalometric software Facad®. Anatomic landmarks of the hard and soft tissues are used (precision measurement 2D cephalometry). Reference markers are placed on the frontal head-supporting bar.

On prediction in orthognathic surgery
14
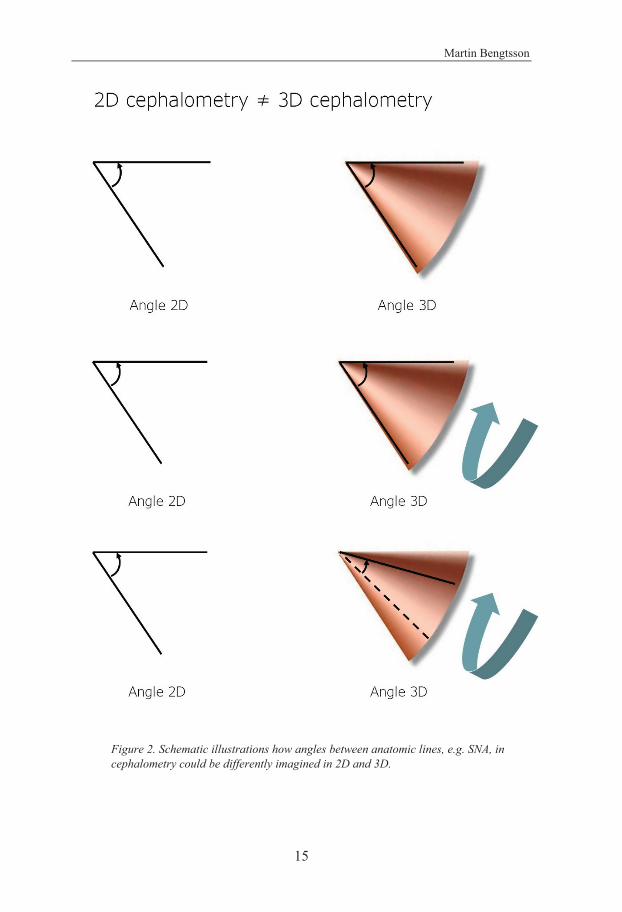
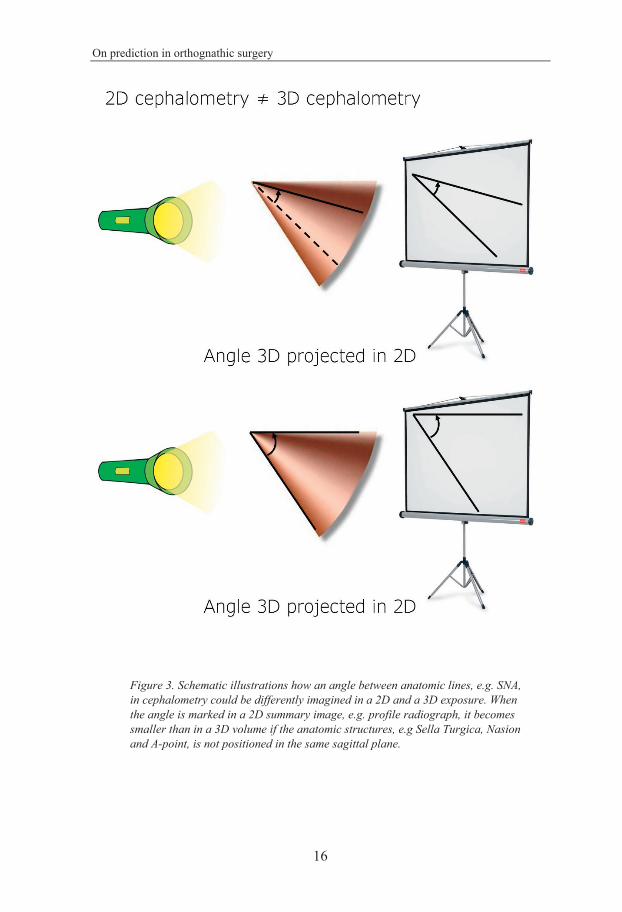
1.3.1.2 Three-dimensional cephalometry Like cephalometry in 2D, the 3D cephalometry is based on placement and measurements of markers and their relations. The development of 3D cephalometry started simultaneously with the introduction of 3D imaging in orthodontics and orthognathic surgery32. Initially, the same markers as in 2D cephalometry were used. This might lead to confusion because the measurement in 2D and 3D differ. For example, SNA in 2D cephalometry is different from SNA in 3D cephalometry. Figure 2 and 3 show an example of how angles are differently interpreted in 2D and in 3D. The same is true for distances. To make this simple, the cephalometric value for a distance, as well as for an angle in the same patient is always larger in 3D than in 2D cephalometry. E.g. when the distance between Condylion and Incisor Superior is measured in 2D, it is smaller than in 3D cephalometry. However, the clinical relevance for this is debated33. With time, 3D specific cephalometric markers, and subsequently 3D specific cephalometric analysis has been introduced34. However, a cephalometric reference system, with a range of normal values, and with its variations due to ethnical background, like what is present for 2D cephalometry, endured. Due to the present differences between 2D and 3D cephalometry, the process of thorough validation of such cephalometric systems have to be initiated from the beginning of their introduction4. This is also true for precision measurements in 3D cephalometry. These processes are comparable with the processes needed upon digitalization of 2D cephalometry in the 1980’s.
Recently, studies on 3D cephalometry have also included measurements of areas and volumes35. It is also highlighted how 3D imaging can facilitate a better accuracy in clinical recordings36. A special interest has been drawn to the study of the facial midline, mainly because the challenge to measuring it correctly in the clinical setting combined with its fundamental importance to the treatment outcome37.
Martin Bengtsson
15
Figure 2. Schematic illustrations how angles between anatomic lines, e.g. SNA, in cephalometry could be differently imagined in 2D and 3D.
On prediction in orthognathic surgery
16
Figure 3. Schematic illustrations how an angle between anatomic lines, e.g. SNA, in cephalometry could be differently imagined in a 2D and a 3D exposure. When the angle is marked in a 2D summary image, e.g. profile radiograph, it becomes smaller than in a 3D volume if the anatomic structures, e.g Sella Turgica, Nasion and A-point, is not positioned in the same sagittal plane.
Martin Bengtsson
17
1.3.2 Prediction Prediction of, or to foresee, a therapeutic outcome, is highly valued in treatment planning.
1.3.2.1 2D prediction The term 2D prediction originates from analogue radiographic and photographic images. The prediction consists of measurements in the lateral cephalogram with the use of cephalometric hard and soft tissue profile markers. It is sometimes also based on measurements and movements in the profile photographic image. However, this type of traditional prediction method is not only based on 2D recordings, but also includes a clinical examination and analysis of dental casts.
Several software programs for cephalometric analysis and prediction have been developed, like Dolphin Imaging®, Facad®, Dentofacial Planner®, Nemoceph®, Quick Ceph® and Vistadent®27,28. Some of them are still on the market and developing. A development area of great interest has been the simulation of soft tissue changes upon movements of hard tissue components. Different models of calculation and transference techniques have been tested. Elaborations of connections between hard and soft tissue compartments have included linear- and surface based techniques. Evaluation of accuracy of simulations have included different levels of proportional soft tissue reactions based on a sizeable database of multiple patient recordings of facial simulations29.
1.3.2.2 3D prediction Simple 3D prediction methods are not at all new. A patient with a post-normal intermaxillary relation can be asked to protrude the mandible to an ideal dental position and the effect on the soft tissue can be assessed. Even if this method is quite reliable, it has some limitations. The patient cannot pre-operatively simulate all movements possible to perform with a surgical procedure. Furthermore, it is not possible to register movements of the bone segments with this kind of prediction. Today, the CT technique, computer software and the scanned dental casts help the surgeon to see the changes in three dimensions, both in hard and soft tissues.
Digitalized 3D prediction became available with the invention of the PC and the CT in the 1980’s. However, the commercialized software programs for 3D analyses and prediction in orthognathic surgery were not introduced until in the beginning of this century. There are several reasons for this. Firstly, the data material and the visualization effects of these programs required a
On prediction in orthognathic surgery
18
computer capacity that was, at this time, larger than was possible for most clinical units to invest in. Secondly, for ordinary orthognathic surgery patients, the 2D system was already satisfying, in clinical use and there were no clinical studies available showing 3D systems with equal or higher quality.
Early attempts and case reports were presented in the mid 2010’s. These were often performed on complex cases where traditionally 2D prediction had shortcomings. Examples of such diagnoses were craniofacial syndromes, complex pan facial fractures or reconstructive surgical planning1,20,22,38-40. From these studies, including only few subjects, the 3D techniques began to spread into consecutive cases of orthognathic surgery41-43. However, due to large differences in radiation exposure, the 2D technique still was preferred. Recently, the increased quality of a 3D imaging technique with lower radiation exposure, the CBCT, has become interesting. However, due to its’ qualities in hard tissue imaging and relatively high imaging contrast, its capability in soft tissue imaging and field of view has been questioned44-46. It fulfills the requirements as a tool for hard tissue movements and template fabrication. However, the prediction accuracy and its’ ability as a tool for facial imaging in orthognathic surgery planning, still needs to be clinically evaluated44,47.
The descriptions of the purpose of virtual planning are often divergent. Focus sometimes is on facial prediction as a result of skeletal and dental movements41,42. In other studies, the main goal is on planning of surgical movements and template fabrication48-50. When different prospective studies on virtual surgical planning are compared, it is important to distinguish between different purposes. A difference in purpose often means a difference in point of enrollment and allocation in the study. For example, when comparing prediction between methods, the subjects must be included and allocated before decision on the surgical treatment. Likewise, on comparison of the accuracy of virtual surgical movements and template accuracy, the subjects should be included and allocated after decision of the treatment, but prior to surgery. Consequently, the design of a study determines the outcome of it.
Comparative studies of different prediction techniques in orthognathic surgery are rare. Attempt with meta-analysis has been made51. However, the recorded available studies are divergent and thus difficult to compare.
1.3.2.3 Predictability Treatment planning systems, that through prediction guidance, facilitate planning of a treatment, are usable only if the outcome is fairly in accordance with the prediction. No system is exactly correct, and will never be. i.e. there
Martin Bengtsson
19
will always be a measurable discrepancy between prediction and outcome. Evaluation of the prediction method is performed on comparison with the final treatment outcome and expressed as accuracy.
Predictability is the ability of the planning systems to perform conformity between prediction and outcome. The concept of predictability in orthognathic treatment planning is not a new issue. From the introduction of cephalometric measurements there have been numerous reports on this topic10-17,19,52. To secure a high standard in their clinical use, all new planning systems need to be evaluated according to their predictability.
1.3.2.4 Usability of prediction Several purposes are seen among users of treatment planning systems. The purposes range from the early learning phase, when the young clinician from elaborating in images and drawings experiences the outcome from treatment decisions, to the experienced clinician’s usage in prediction, index manufacturing and treatment evaluation. However, independent of what experience the user has, it is important to remember the limitations of each system, and that the system is just a tool, dictated by the user’s decisions. Any planning system that becomes a supervisor for the clinician, will develop into a hazard for the patients.
1.4 Evaluation and predictability Evaluation of outcome of orthognathic treatment could be performed from several perspectives. Historically, there are examples of evaluation from a patient, a doctor, a layperson and a parents’ perspective. Examples of evaluation techniques have been radiographic measurements, photographic measurements, anthropometry, measurements of QoL, time measurements, economic measurements, measurements of radiation dose etc.
Predictability, is the ability of the planning systems to perform conformity between prediction and outcome. It is important to evaluate the quality of the prediction before trusting in it. Similar to the evaluation of treatment outcome, the analyze of predictability can be performed in several ways. Among the most commonly used are cephalometric measurements, but photographic judgements and anthropometric measurements are other examples.
To measure conformity between prediction and outcome on comparison, at least two measurements of the same variable (e.g. SNA), before and after treatment are needed. Measurements before and after treatment within the
On prediction in orthognathic surgery
20
same cohort (i.e. the studied subjects are their own reference instead of having the group as the reference), increase the reliability and are preferred52.
1.4.1 Cephalometry Cephalometric evaluation of predictability contains at least two occasions of placement of cephalometric markers, pre- and postoperatively. Several studies use a second occasion directly after surgery38,53,54. The reason for this, is to avoid having relapse of the surgical movement as a confounding factor. However, if the prediction aims to simulate the final result, the second occasion of measurement should be performed after finalizing the treatment, postoperative orthodontics included.
Cephalometric markers should represent the region that should be measured. There are several sets of markers available. They perform a suggested set of measurements. Examples of these are McNamara, Ricketts, Bergen, Arnett, Downs, Steiner, Tweed etc. The evaluator can choose one of these sets or build a customized set of markers and measurements to suite the purpose of the evaluation.
Measurements of cephalometric markers relation to each other are possible in several ways. Examples are distances between markers, distances between lines, distances between a marker and a line and angles. Evaluation of predictability is based on superimposition. i.e. two sets of cephalometric measurements are related to each other and compared. To enable such comparison, there is a need for a reference system (Figure 10). A reference in superimposition should consist of an anatomic or an external structure that was unaffected during the orthodontic or surgical movements, are easy to localize, and visible in all included images. Cephalometric markers or lines in the cranial base are often used in 2D measurements, while intact anatomic structures, such as bone surfaces, could preferably be used in 3D.
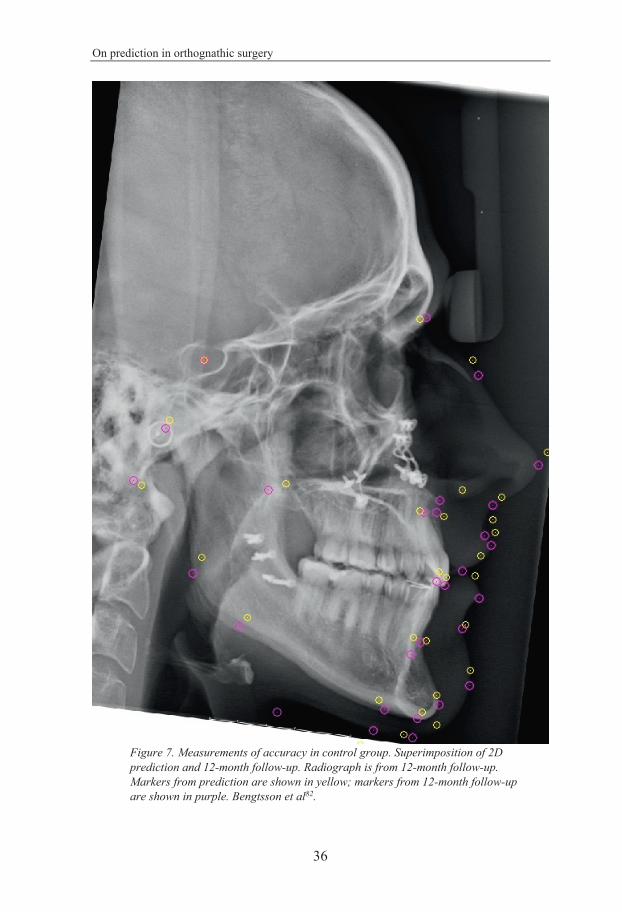
1.4.1.1 Accuracy Accuracy is the degree of conformity between prediction and outcome, i.e. how close in relation to the outcome was the prediction (Figure 7 and 9)? As mentioned above this comparison is based on two occasions of marker placements and measurements.
Martin Bengtsson
21
1.4.1.2 Precision Cephalometric precision is the ability to place a marker in the same anatomic point in the same image on repeated occasions. How exact is the person who places the cephalometric markers able to place them in the same position again? Or, if the measurements are based on several individuals performing the measurements – How much do they differ in placing the markers (Figure 8 and 10)? On evaluation of accuracy, it is important to also account for the variance between individuals, inter-individual variance, and between different occasions performed by the same individual, intra-individual variance.
If the error of precision exceeds the one of accuracy within the same cephalometric measurement, the level of accuracy is unknown due to imprecise measurements. To trust in a finding of accuracy, the error of precision must be smaller.
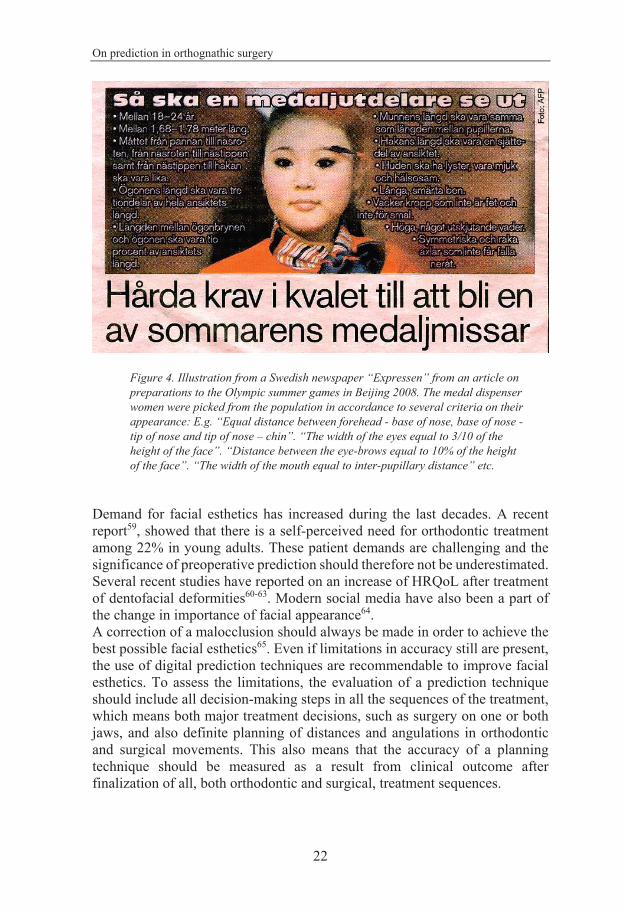
1.4.2 Health related quality of life Indications for treatment of severe malocclusions with a combination of orthodontic and surgical approach is both functional and esthetical. A successful treatment outcome is satisfying from both a professional and a patient perspective55. The patient’s wish for treatment is often based upon a combination of malfunction and a need for better facial and dental appearance56,57. There is also a general knowledge that the patient’s HRQoL is depending on appearance and self-esteem. An attractive face presumably contributes to a more successful life and also contributes to the person’s self-esteem58. There are examples of these attitudes commonly accepted in our civilizations. Fashion industry, entertainment and film industry as well as political interests rely the close relation between appearance and success (Figure 4).
On prediction in orthognathic surgery
22
Figure 4. Illustration from a Swedish newspaper “Expressen” from an article on preparations to the Olympic summer games in Beijing 2008. The medal dispenser women were picked from the population in accordance to several criteria on their appearance: E.g. “Equal distance between forehead - base of nose, base of nose - tip of nose and tip of nose – chin”. “The width of the eyes equal to 3/10 of the height of the face”. “Distance between the eye-brows equal to 10% of the height of the face”. “The width of the mouth equal to inter-pupillary distance” etc.
Demand for facial esthetics has increased during the last decades. A recent report59, showed that there is a self-perceived need for orthodontic treatment among 22% in young adults. These patient demands are challenging and the significance of preoperative prediction should therefore not be underestimated. Several recent studies have reported on an increase of HRQoL after treatment of dentofacial deformities60-63. Modern social media have also been a part of the change in importance of facial appearance64. A correction of a malocclusion should always be made in order to achieve the best possible facial esthetics65. Even if limitations in accuracy still are present, the use of digital prediction techniques are recommendable to improve facial esthetics. To assess the limitations, the evaluation of a prediction technique should include all decision-making steps in all the sequences of the treatment, which means both major treatment decisions, such as surgery on one or both jaws, and also definite planning of distances and angulations in orthodontic and surgical movements. This also means that the accuracy of a planning technique should be measured as a result from clinical outcome after finalization of all, both orthodontic and surgical, treatment sequences.

Martin Bengtsson
23
Measurements of the patients self-perceived HRQoL have frequently been performed by Patient Reported Outcome Measures (PROM). These are often conducted by validated questionnaires, of which many are constructed towards a specific situation, functionality and disease66-71. Some of these HRQoL questionnaires are linked and validated to certain analyze, such as EuroQoL (EQ-5D)72, which gain the opportunity to study the changes from other perspectives. However, such measurements are often based upon general health reports and does not focus on the local anatomic region. Measuring HRQoL changes in a specific region claims more detailed questionnaires on the region of interest73. Questionnaires for outcome measurements in orthognathic surgery could be found in Oral Health Related Quality of Life (OHRQoL). Examples of such questionnaires are Oral Health Impact Profile 49 – Swedish version (OHIP-S)66,71, Jaw Functional Limitation Scale (JFLS)74 and Orofacial Esthetic Scale – Swedish version (OES-S)68,69. To cover all wanted aspects of the measurement it is also possible to combine questionnaires. To measure the precision of the questionnaire, e.g. intra-individual variation, a test-retest (reliability test) of the questionnaires69,71 with a time span between the moments of measures, shows the reliability of the questionnaire. In accordance with praxis for psychometric measurements75 and with another sample registration on orofacial esthetics, a limit for participation of 75% of the questions to be answered is suggested70.
1.4.3 Radiation dose Evaluating the usability of a new radiographic imaging method in orthognathic surgery treatment planning must include measurement of radiation dose. It is well known that ionizing radiation can have a negative effect on living tissues. Quantification and measurements of tissue reactions on ionizing radiation is called dosimetry.
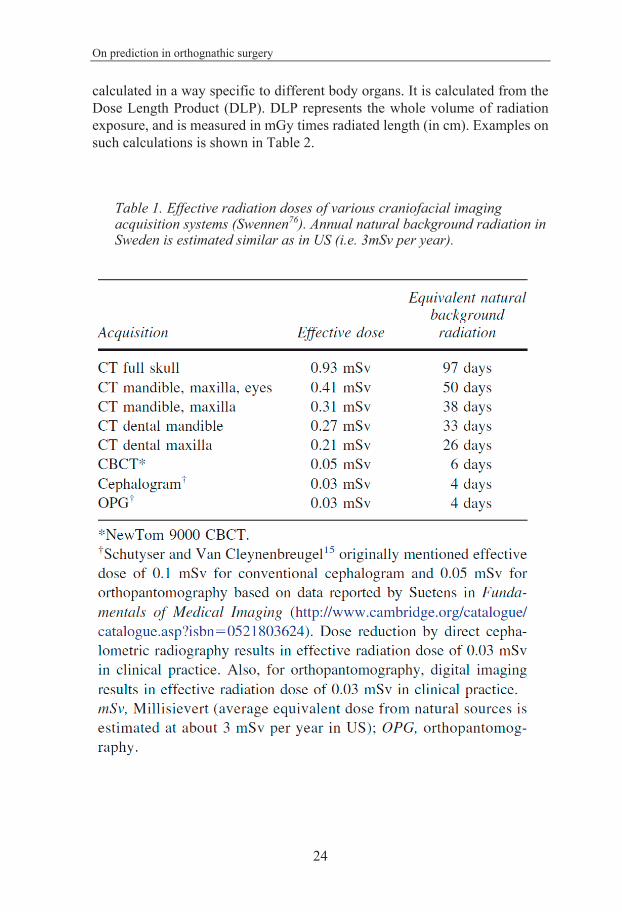
The human body receives radiation from the environment throughout its whole life, i.e. background radiation. The dose received due to health care purposes is often expressed in terms of the background radiation. Examples of that is seen in Table 1. Given radiation, measured in Gray (Gy), in health care diagnostics and treatment is measured differently than received dose. The latter is a quantity, calculated based on tissue sensitivity, and measured in Sievert (Sv).
The radiation dose delivered to the tissue of interest is often referred to as the effective radiation dose (risk for tissue reaction, e.g. cancer risk), and is
On prediction in orthognathic surgery
24
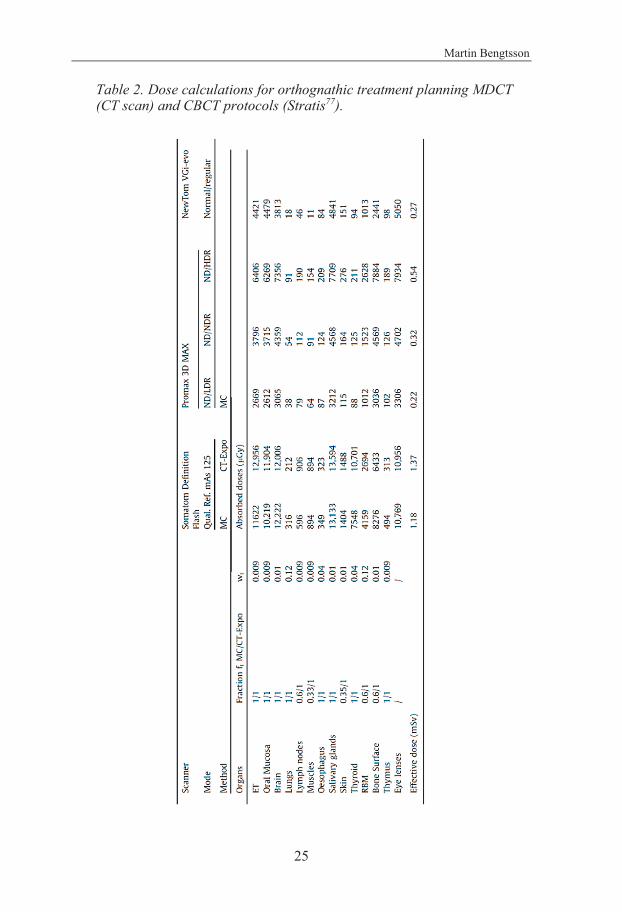
calculated in a way specific to different body organs. It is calculated from the Dose Length Product (DLP). DLP represents the whole volume of radiation exposure, and is measured in mGy times radiated length (in cm). Examples on such calculations is shown in Table 2.
Table 1. Effective radiation doses of various craniofacial imaging acquisition systems (Swennen76). Annual natural background radiation in Sweden is estimated similar as in US (i.e. 3mSv per year).
Martin Bengtsson
25
Table 2. Dose calculations for orthognathic treatment planning MDCT (CT scan) and CBCT protocols (Stratis77).
On prediction in orthognathic surgery
26
Commonly used in dosimetry are also Computed Tomography Dose Index (CTDI), measured in mGy. It reflects the absorbed dose in a phantom model and its usability in clinical settings is thereby limited.
Examination specific values for different radiographic settings for effective dose and DLP have been calculated using “Monte Carlo” simulations. Separate simulations are needed for different tissue maturity and for newly developed radiographic techniques78.
1.4.4 Cost-Effectiveness analyzes On comparing investment and outcome in a clinical setting it is common to use a cost-benefit analysis (CBA), a cost-effectiveness analysis (CEA) or a cost-utility analysis (CUA).
A CBA is used to quantify, in monetary terms, the costs of a project and comparing them with the benefits. CEA considers the outputs produced by a project, which are not measured in monetary terms (lives saved, quality of life gained, illness prevented) and is frequently used in health-care analysis. CUA involves looking at whether an action should be undertaken. It looks at the cost of the action compared to the increase in utility. In health economics this is particular with regard to whether someone should be treated or not79
Even if there is an overlap between the analyses, the measurements and the statistical analysis differ depending on which type of analysis that was proposed.
In orthognathic treatment it is interesting to compare costs with outcome. In the present project, when comparing two different planning techniques, a CEA is used and the differences in cost are weighted against the differences in cephalometric accuracy and HRQoL.
A common measurement used in CEA and in CUA is quality adjusted life years (QALY). To enable a comparison on QALY there has to be a validated instrument to translate the measurements from. This is for example present for a generic health state measure, EuroQol (EQ-5D)72. However, when decided to use a measure that, better than EQ-5D, represent the local facial/oral status, OHIP, this opportunity up to now disappears. The lack of a validated material to transform OHIP data into QALY, results in a CEA comparing economical costs with non-monetary outcome measures (like accuracy and HRQoL).
Martin Bengtsson
27
2 AIM The overall aim for this thesis was to evaluate if a 3D prediction computer software contributes to treatment planning in orthognathic surgery and to compare it with the traditional 2D method. The hypothesis was that the use of three dimensions in predicting orthognathic surgery is superior to two dimensions with regards of predictability, treatment outcome and effectiveness. The comparison has been performed from several aspects.
2.1 Specific aims • To compare the accuracy of a 2D with a 3D prediction
produced by the computer-assisted simulation system for orthognathic surgery for the correction of class III facial deformities by single jaw and/or bimaxillary surgery.
• To measure the accuracy for each method, 2D and 3D, in preoperative treatment planning compared with 12-month follow-up.
• To compare pre-surgical with postsurgical patient satisfaction (HRQoL) when surgery is predicted and planned by the 2D method and the 3D method, and to compare the HRQoL results between the methods.
• To compare any difference in the patient’s self-perceived (HRQoL) outcome, with the results from cephalometric measurements of accuracy in the present cohort.
• To compare the economic costs, time consumption and the radiation dose between 2D and 3D planning techniques in orthognathic treatment.
• To assess the costs and benefits from cephalometric accuracy and PROMS of computer aided 2D surgical prediction and planning and compare it with the costs and benefits of a 3D method.
On prediction in orthognathic surgery
28
3 SUBJECTS AND METHODS
3.1 Subjects Sixty-two consecutive patients aged between 18 to 30 years from Department of Oral and Maxillofacial Surgery, The University Hospital of Skåne, Lund, Sweden with diagnosed Angle class III occlusion were included in the project. The degree of malocclusion deviated at a minimum of 5 mm in sagittal and/or vertical aspects from normal occlusion measured as inter-incisal distance. Patients with severe systemic disease, drug abuse, poor psychic status or disease in the temporomandibular joint were excluded.
The patients were referred to the center with request of a combined orthodontic and surgical treatment and were included after completion of pre-surgical orthodontic treatment and prior to surgical treatment. In all subjects, the treatment was planned with both 2D and 3D computer assisted prediction. All examinations, treatment planning and follow-ups were performed during 2011 to 2016.
Intervention
The subjects were, following treatment planning with both a 2D and a 3D technique, and prior to surgery, randomly divided into test and control group. The control group, was treated according to the 2D prediction and the test group, was treated according to the 3D prediction. A flow chart diagram is shown in Figure 5.
Randomization
Prior to surgical treatment, the subjects were randomly allocated to test or control group. Every subject was randomly permuted after treatment planning with both techniques. No changes to the two treatment options (2D and 3D) were made after randomization. Allocation concealment was achieved with an envelope containing 31 allocation cards numbered 2D and 31 allocation cards numbered 3D. The card was blindly withdrawn from the envelope and after registration discarded. The randomization ensured a 1:1 allocation into the groups.
Martin Bengtsson
29
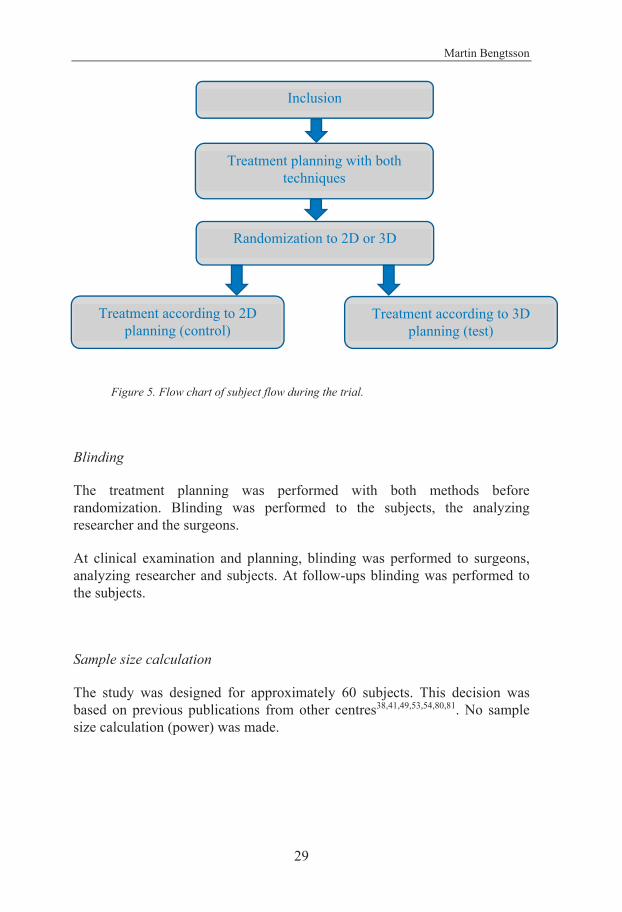
Figure 5. Flow chart of subject flow during the trial.
Blinding
The treatment planning was performed with both methods before randomization. Blinding was performed to the subjects, the analyzing researcher and the surgeons.
At clinical examination and planning, blinding was performed to surgeons, analyzing researcher and subjects. At follow-ups blinding was performed to the subjects.
Sample size calculation
The study was designed for approximately 60 subjects. This decision was based on previous publications from other centres38,41,49,53,54,80,81. No sample size calculation (power) was made.
Inclusion
Treatment planning with both techniques
Randomization to 2D or 3D
Treatment according to 2D planning (control)
Treatment according to 3D planning (test)

On prediction in orthognathic surgery
30
3.2 Methods All studies included in this thesis were conducted as prospective, parallel group, randomized two-arm parallel double-blinded active-controlled clinical trials with a 1:1 allocation ratio. No changes to the design were performed after commencement.
At the first visit to the Maxillofacial Unit, after completed pre-surgical orthodontics, the patients were asked to participate in the study. If the patients accepted to participate they were, following treatment planning with both 2D and 3D technique, and prior to surgery, randomly divided into test and control group (Figure 6).
All subjects were examined clinically, 2D radiography, 3D radiography, 2D photographic technique, and dental casts.
The 2D radiographic examination was performed using orthopantomography (OPT), a profile and a frontal projection. The 3D examination was performed using CT scan. The 2D software used was Facad® (Ilexis AB, Linköping, Sweden. www.ilexis.se) and the 3D software used was Simplant® PRO 12.02 OMS (Materialise corp., Leuven, Belgium. www.materialise.com).
All radiographic examinations were performed at the Department of Radiology, Skåne University Hospital, Lund, Sweden. Subjects were, prior to surgery and at 12-month follow-up, examined with a OPT, a profile, a frontal projection and a CT.
The profile and posterior-anterior projections were obtained in a cephalostat with a focus-film distance of 165 cm, a linear magnification of 9,3 % and with 70 kV. The settings could vary 10% depending on the size of the patient from the following:
Time of exposure: Profile projection: 53 ms
Posterior–Anterior projection: 84 ms Milliampere-second: Profile projection: 16 mAs
Posterior-Anterior projection: 25 mAs

Martin Bengtsson
31
Figure 6. Flow chart of method flow during the trial.
Inclusion. Clinical examination.
Radiographic examination, cephalometry and treatment
planning with both techniques. HRQoL questionnaire.
Randomization to 2D or 3D. Coding.
Super positional measurements of
cephalometric markers. Analysis of cephalometric
accuracy, precision, HRQoL questionairres, cost, radiation dose and time measurements.
Super positional measurements of
cephalometric markers. Analysis of cephalometric
accuracy, precision, HRQoL questionairres, cost,
radiation dose and time measurements.
12-month follow-up. Radiographic examination
and cephalometry with both techniques. HRQoL questionnaire. Time
measurements on radiographic examinations
and on planning setup. Measurement of effective
radiation dose.
12-month follow-up. Radiographic examination
and cephalometry with both techniques. HRQoL questionnaire. Time
measurements on radiographic examinations
and on planning setup. Measurement of effective
radiation dose.
Allocation
Enrollment
Follow-Up
Analysis
Treatment according to 2D planning.
Treatment according to 3D planning.
Drop-out analysis Drop-out analysis
Refused to participate Assessed for eligibility
Time measurements on radiographic
examinations and on planning setup. Measurement of
effective radiation dose. Re-test cephalometry
and HRQoL questionnaire.
On prediction in orthognathic surgery
32
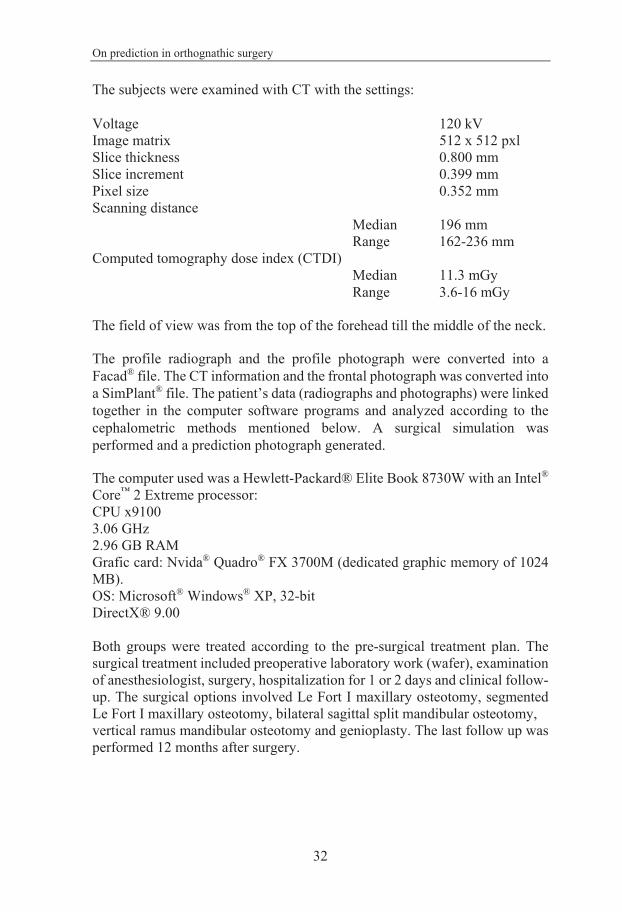
The subjects were examined with CT with the settings:
Voltage 120 kV Image matrix 512 x 512 pxl Slice thickness 0.800 mm Slice increment 0.399 mm Pixel size 0.352 mm Scanning distance
Median 196 mm Range 162-236 mm
Computed tomography dose index (CTDI) Median 11.3 mGy Range 3.6-16 mGy
The field of view was from the top of the forehead till the middle of the neck.
The profile radiograph and the profile photograph were converted into a Facad® file. The CT information and the frontal photograph was converted into a SimPlant® file. The patient’s data (radiographs and photographs) were linked together in the computer software programs and analyzed according to the cephalometric methods mentioned below. A surgical simulation was performed and a prediction photograph generated.
The computer used was a Hewlett-Packard® Elite Book 8730W with an Intel® Core™ 2 Extreme processor: CPU x9100 3.06 GHz 2.96 GB RAM Grafic card: Nvida® Quadro® FX 3700M (dedicated graphic memory of 1024 MB). OS: Microsoft® Windows® XP, 32-bit DirectX® 9.00 Both groups were treated according to the pre-surgical treatment plan. The surgical treatment included preoperative laboratory work (wafer), examination of anesthesiologist, surgery, hospitalization for 1 or 2 days and clinical follow-up. The surgical options involved Le Fort I maxillary osteotomy, segmented Le Fort I maxillary osteotomy, bilateral sagittal split mandibular osteotomy, vertical ramus mandibular osteotomy and genioplasty. The last follow up was performed 12 months after surgery.
Martin Bengtsson
33
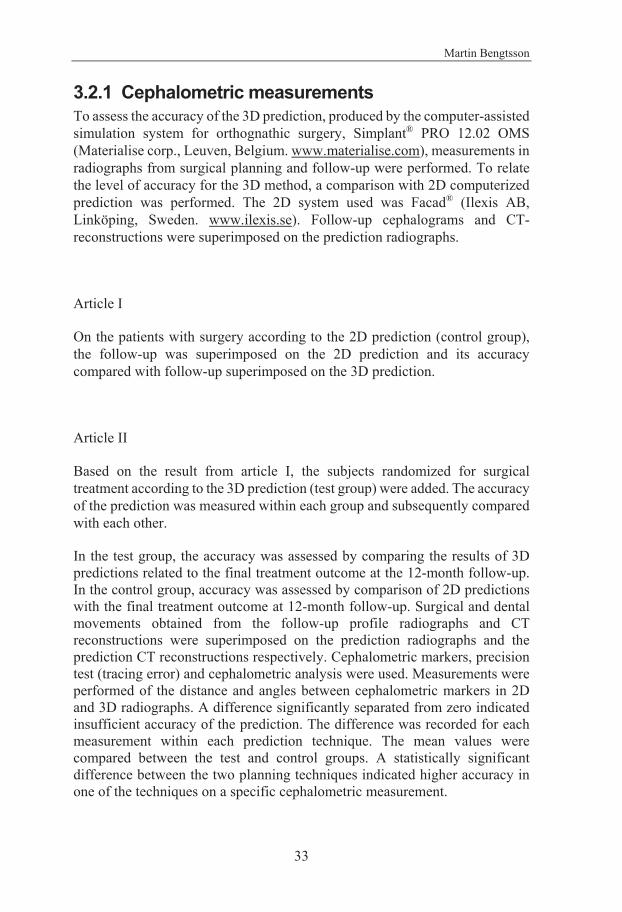
3.2.1 Cephalometric measurements To assess the accuracy of the 3D prediction, produced by the computer-assisted simulation system for orthognathic surgery, Simplant® PRO 12.02 OMS (Materialise corp., Leuven, Belgium. www.materialise.com), measurements in radiographs from surgical planning and follow-up were performed. To relate the level of accuracy for the 3D method, a comparison with 2D computerized prediction was performed. The 2D system used was Facad® (Ilexis AB, Linköping, Sweden. www.ilexis.se). Follow-up cephalograms and CT-reconstructions were superimposed on the prediction radiographs.
Article I
On the patients with surgery according to the 2D prediction (control group), the follow-up was superimposed on the 2D prediction and its accuracy compared with follow-up superimposed on the 3D prediction.
Article II
Based on the result from article I, the subjects randomized for surgical treatment according to the 3D prediction (test group) were added. The accuracy of the prediction was measured within each group and subsequently compared with each other.
In the test group, the accuracy was assessed by comparing the results of 3D predictions related to the final treatment outcome at the 12-month follow-up. In the control group, accuracy was assessed by comparison of 2D predictions with the final treatment outcome at 12-month follow-up. Surgical and dental movements obtained from the follow-up profile radiographs and CT reconstructions were superimposed on the prediction radiographs and the prediction CT reconstructions respectively. Cephalometric markers, precision test (tracing error) and cephalometric analysis were used. Measurements were performed of the distance and angles between cephalometric markers in 2D and 3D radiographs. A difference significantly separated from zero indicated insufficient accuracy of the prediction. The difference was recorded for each measurement within each prediction technique. The mean values were compared between the test and control groups. A statistically significant difference between the two planning techniques indicated higher accuracy in one of the techniques on a specific cephalometric measurement.
On prediction in orthognathic surgery
34
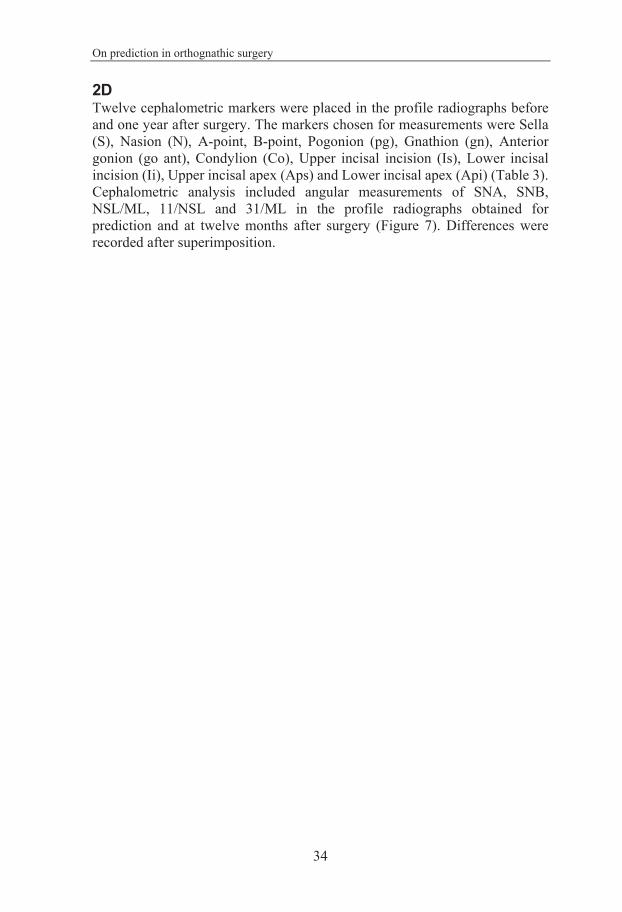
2D Twelve cephalometric markers were placed in the profile radiographs before and one year after surgery. The markers chosen for measurements were Sella (S), Nasion (N), A-point, B-point, Pogonion (pg), Gnathion (gn), Anterior gonion (go ant), Condylion (Co), Upper incisal incision (Is), Lower incisal incision (Ii), Upper incisal apex (Aps) and Lower incisal apex (Api) (Table 3). Cephalometric analysis included angular measurements of SNA, SNB, NSL/ML, 11/NSL and 31/ML in the profile radiographs obtained for prediction and at twelve months after surgery (Figure 7). Differences were recorded after superimposition.

Martin Bengtsson
35
Table 3. Landmark/line/plane/angle definitions. Abbreviations: NSL, Sella-nasion line; ML, mandibular plane; 11, upper incisor; 31, lower incisor.
Name Definition
Sella (S) Central point of sella turcicaNasion (N) Most anterior point of frontonasal suture in
midsagittal planePoint A Innermost point on contour of premaxilla between
anterior nasal spine and incisor toothPoint B Innermost point on contour of mandible between
incisor tooth and bony chinPogonion (Pg) Most anterior point of hard tissue chinGnathion (Gn) Most anterior and inferior point of hard tissue
mentonAnterior gonion (Go ant)
Most anterior and inferior point of the mandibular angle
Condylion (Co) Most lateral point on the surface of the mandibular head
Incisor superior (Is) Most anterior point of upper incisorIncisor inferior (Ii) Most anterior point of lower incisorApicale superior (Aps)
Most superior point of upper incisor
Apicale inferior (Api)
Most inferior point of lower incisor
SNA Angle connecting points S, N, and ASNB Angle connecting points S, N, and BNSL/ML Angle formed by NSL and ML planes11/NSL Angle formed by 11 long axis and NSL plane 31/ML Angle formed by 31 long axis and ML plane
On prediction in orthognathic surgery
36
Figure 7. Measurements of accuracy in control group. Superimposition of 2D prediction and 12-month follow-up. Radiograph is from 12-month follow-up. Markers from prediction are shown in yellow; markers from 12-month follow-up are shown in purple. Bengtsson et al82.

Martin Bengtsson
37
3D The measurements in the 3D recordings were performed with the same markers as in 2D except for Gonion anterior and Articulare, which was separated into left and right, making the number of markers to be fourteen. Markers were placed in the 3D volume. The two CT scan volumes, the predicted and the twelve months follow up, were superimposed to detect the difference between them (Figure 8 and 9).
Figure 8. Precision measurement 3D. GoL - left gonion, Aps - upper incisal apex, Api - lower incisal apex, Is - upper incisal incision, Ii - lower incisal incision, A - a-point, B - b-point, Pog - pogonion. “2” after abbreviation indicates second measurement. Bengtsson et al83.
On prediction in orthognathic surgery
38
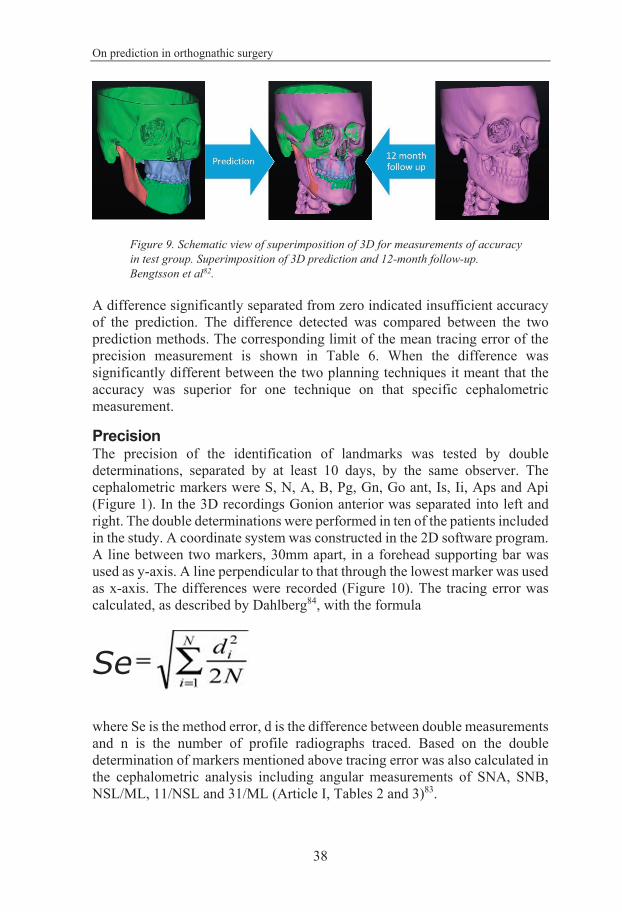
Figure 9. Schematic view of superimposition of 3D for measurements of accuracy in test group. Superimposition of 3D prediction and 12-month follow-up. Bengtsson et al82.
A difference significantly separated from zero indicated insufficient accuracy of the prediction. The difference detected was compared between the two prediction methods. The corresponding limit of the mean tracing error of the precision measurement is shown in Table 6. When the difference was significantly different between the two planning techniques it meant that the accuracy was superior for one technique on that specific cephalometric measurement.
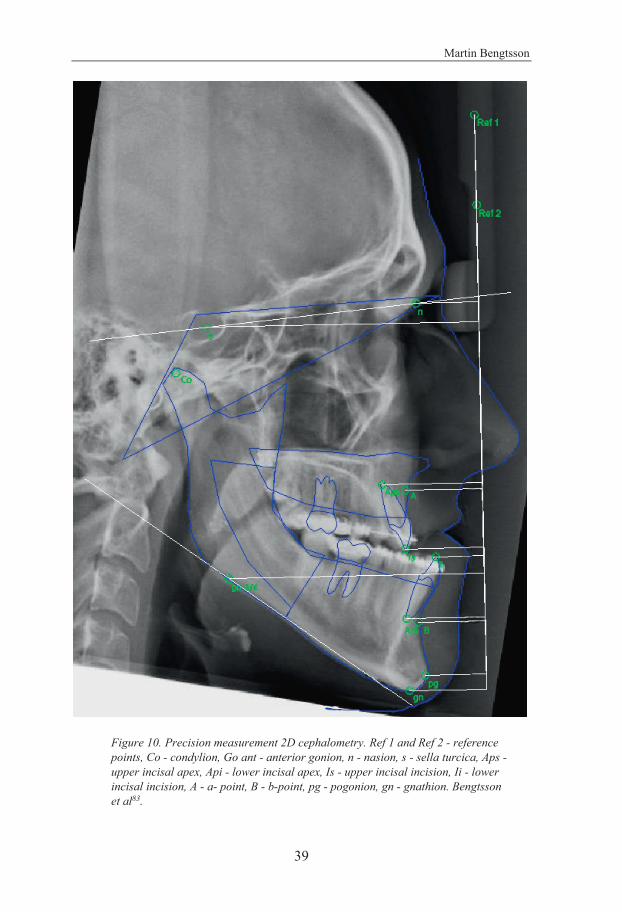
Precision The precision of the identification of landmarks was tested by double determinations, separated by at least 10 days, by the same observer. The cephalometric markers were S, N, A, B, Pg, Gn, Go ant, Is, Ii, Aps and Api (Figure 1). In the 3D recordings Gonion anterior was separated into left and right. The double determinations were performed in ten of the patients included in the study. A coordinate system was constructed in the 2D software program. A line between two markers, 30mm apart, in a forehead supporting bar was used as y-axis. A line perpendicular to that through the lowest marker was used as x-axis. The differences were recorded (Figure 10). The tracing error was calculated, as described by Dahlberg84, with the formula
Se
where Se is the method error, d is the difference between double measurements and n is the number of profile radiographs traced. Based on the double determination of markers mentioned above tracing error was also calculated in the cephalometric analysis including angular measurements of SNA, SNB, NSL/ML, 11/NSL and 31/ML (Article I, Tables 2 and 3)83.
Martin Bengtsson
39
Figure 10. Precision measurement 2D cephalometry. Ref 1 and Ref 2 - reference points, Co - condylion, Go ant - anterior gonion, n - nasion, s - sella turcica, Aps - upper incisal apex, Api - lower incisal apex, Is - upper incisal incision, Ii - lower incisal incision, A - a- point, B - b-point, pg - pogonion, gn - gnathion. Bengtsson et al83.
On prediction in orthognathic surgery
40
2D compared with 3D Due to the difficulties in comparisons of 2D cephalometric measurements with 3D cephalometric measurements mentioned above (Chapter 1.3.1.2.), the comparison was made based on distances between markers instead of changes in the coordinates of the markers. A distance includes all present dimensions in a measurable environment, i.e. two dimensions in 2D and three dimensions in 3D. If instead changes in a coordinate system are used, it includes two recordings (x and y) in 2D and three recordings (x, y, and z) in 3D. Distance measurements of accuracy within each group were obtained before comparison between the groups. Consequently, it was possible to compare the accuracy between the studied groups with the same type of measurement – the distance.
3.2.2 Quality of life The aim of this study was to compare the pre-surgical and post-surgical patient satisfaction on the facial appearance, the oral function and the psychosocial function in the test group and the control group. Measurements of self-perceived psychometric factors (HRQoL) and body image by questionnaires were performed.
All subjects were asked to fill in three different questionnaires combined as one set, including both general, regional, esthetical and functional aspects of HRQoL (Appendix). The questionnaires were sent to the subjects prior to clinical examination and delivered in person to the surgeon. The answers were obtained before surgery and in a repeated set, at follow-up, 12 months after surgery. The questionnaires used were Oral Health Impact Profile 49 – Swedish version (OHIP-S)66,71, Jaw Functional Limitation Scale (JFLS)74 and Orofacial Esthetic Scale – Swedish version (OES-S)68,69. Three questionnaires leaving in total 77 questions (OHIP-S: 49, JFLS: 20, OES-S: 8). Two additional questions on general health were added to the questionnaire, which in total included 79 questions.
OHIP-S, JFLS and OES-S questionnaires were combined into one set in the order mentioned. The order was decided with the questionnaire on general health first and with the local anatomical questions last. In accordance with praxis for psychometric measurements75 and with another sample registration on orofacial esthetics, a limit for participation of 75% of the questions to be answered was set70. Some questions were not applicable to all subjects. For example, regarding dentures, which was not present for any of the subjects. These questions were calculated using median imputation.
Martin Bengtsson
41
The two questions on general health were presented separately (Gen Health 1 and Gen Health 2). One question on the subjects rating of their general appearance in OES was extracted and also presented separately (Gen App).
The questions in the OHIP-S questionnaire were categorized into Oral function (F), Oro-facial Appearance (A), Oro-facial Pain (P) and Psychosocial Impact (PI). OHIP-S was analysed both with a total score and a domains score based on the categories mentioned.
The JFLS and the OES questionnaires were analysed with total scores.
The questions were unweighted, i.e. each question was equally contributing to the total score.
For the variables presented in the tables, a decreasing value in the OHIP, Gen Health 1, Gen Health 2 and JFLS questionnaires indicated increasing HRQoL, while a decreasing value in the OES and Gen App indicated decreasing HRQoL. Thus, comparing pre- and postoperative measurements this sometimes led to negative values (Table 10).
Reliability To test the reliability of the method, a test and retest of the questionnaires, with a time span of at least two weeks, in 23 randomly chosen subjects69,71 was performed.
Validation The validity, that the test measure what we want to enlighten, of a method is important and must be tested prior to a broad use of the test. In the present project the focus on validity of the HRQoL method is represented by previous validated HRQoL measurements67-71,74 in the anatomical area of interest.
3.2.3 Cost-Benefit The time spent on pre-surgical examination and treatment planning and follow-up 12 months after surgery was measured. Measurements were performed of the sequences that were estimated to differ between 2D and 3D technique. These were radiographic examination and preparation/setting of the planning software. All other sequences involved, such as clinical examination, photographic examination, dental impressions, face-bow transference, treatment decisions, fabrication of surgical templates and surgery, were assumed identical between the techniques. The measurements were recorded
On prediction in orthognathic surgery
42
with a minutes and seconds scale and commenced at the start of the radiographic examination and at the start of the set-up process in either prediction software. Endpoint for time measures was when the radiographic examination stopped and when the set-up sequence in the prediction software was finished.
Since all subjects were planned with both 2D and 3D technique before randomization, time measurements were possible in all subjects for both 2D and 3D techniques. However, due to expected initial learning curve, time measurements were not performed on the first 30 subjects.
Except for the comparison of time consumption, the techniques were also compared regarding economic cost and radiation dose. The fixed economic costs included radiographic examination and software license. All other costs included during the treatment were estimated equal for the two planning techniques.
The tariff in Swedish currency ($) for radiographic examinations was at the time for examination obtained from the Department of Radiology, Skåne University Hospital, Lund, Sweden.
Information about economic cost for the software license were obtained from the manufacturers (Ilexis AB, Linköping, Sweden. www.ilexis.se and Materialise corp., Leuven, Belgium. www.materialise.com).
Time consumption in the planning phase was transformed into economic costs by taking mean salary for a Swedish Oral- and Maxillofacial Surgeon 2014 and specifying it to $/minute.
Economic comparison between the techniques was performed by comparison of fixed economic costs for radiographic examination, software and calculated costs for time consumption during the surgical planning.
For all included subjects, effective radiation dose (mSv) from CT examination was calculated from Dose-Length Product (DLP) with a factor 0.0019 mSv/mGycm 18. A mean value of pre-surgical and 12 months follow up examination was calculated for each subject. From these values (n=57), a mean, median, standard deviation and range were presented for the 3D radiographic technique, and its relation to other comparable radiographic techniques of the facial skeleton was shown. For 2D radiographic techniques data were fixed and were obtained from the Department of Radiology, Skåne University Hospital, Lund, Sweden.
Martin Bengtsson
43
To compare the methods regarding cost-effectiveness, the outcome in time consumption and economical costs was weighted against differences in preoperative and follow up for cephalometric accuracy and HRQoL measurements. This was performed using calculations of cost per change of one point in the Oral Health Impact Profile (OHIP) outcome according to Hulme et al73.
3.2.4 Statistical methods and analysis Analysis of cephalometric measurements
For each cephalometric measurement, mean values and confidence intervals were calculated. A non-parametric statistical method, Fisher’s test for pair comparisons, was used when testing tracing errors between the first and second measurements for the 10 patients with double determinations (Article I and II). The same test was used when the accuracy within each group (control and test) was compared. The Fisher’s permutation test was used for comparison of accuracy between the test and control group. Significant was set at p<0.05. Two-sided p-values were used.
Analysis of HRQoL
Comparison of the differences in HRQoL (Article III) between the groups according preoperative measurements and changes between pre- and postoperative measurements was made with Fisher’s permutation test.
Due to observed initial differences in HRQoL between the groups, a comparison was made with multivariable linear regression model when comparing groups with respect to changes between pre- and postoperative measurements. This was performed in order to test if initial differences between the groups could affect the comparison between the methods. Then the change between pre- and postoperative measurement was the dependent variable and the treatment group and the variable with observed initial difference were independent variables.
The reliability test, performed as a test-retest, was analyzed with the intraclass correlation coefficient (ICC). To test the changes of test-retest, Fisher’s test for pair comparisons was used. Pearson’s correlation coefficient was calculated between test and retest.

On prediction in orthognathic surgery
44
Analysis of cost-effectiveness
Mean values and standard deviations were calculated. Fisher´s test for pair comparisons, was used when testing differences in time consumption between the 2D and 3D technique (Article IV). The limit for significant difference was set to p<0.05. Two-sided p-values were used.
A difference in OHIP was found, although not significant (p=0.65). On estimation of this difference in OHIP, calculations on differences in cost and time consumption per gained OHIP-point were performed.
3.2.5 Ethical considerations To compare 2D and 3D planning techniques, it was necessary to examine the patients with additional radiography, meaning an increased radiation dose. All patients were informed about the increased exposure and that participation in the study was voluntary. Informed written consent was obtained from all subjects included. The research protocol was evaluated and approved by the Regional Ethical Committee in Gothenburg, Sweden, Dnr 011-11.
Martin Bengtsson
45
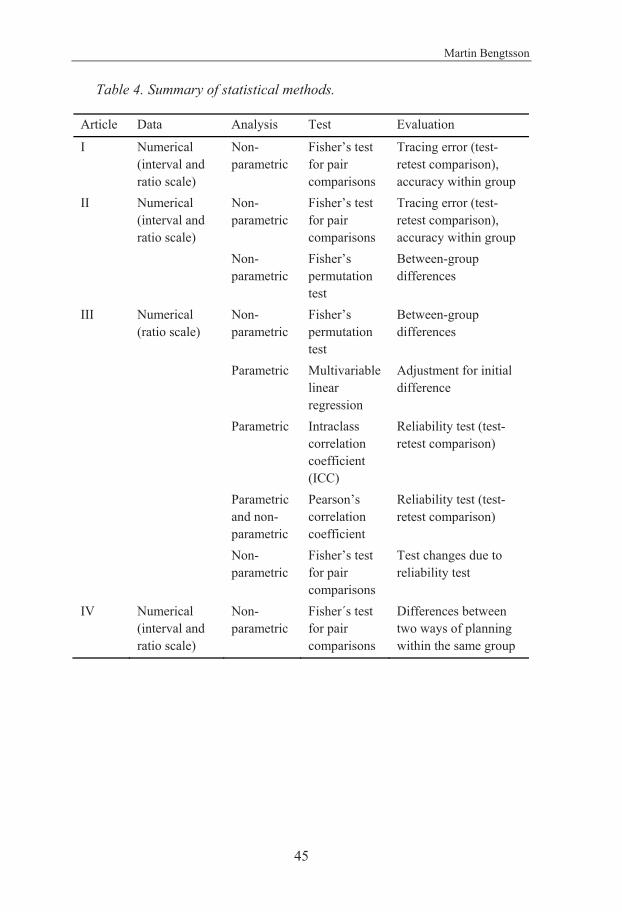
Table 4. Summary of statistical methods.
Article Data Analysis Test Evaluation
I Numerical (interval and ratio scale)
Non-parametric
Fisher’s test for pair comparisons
Tracing error (test-retest comparison), accuracy within group
II Numerical (interval and ratio scale)
Non-parametric
Fisher’s test for pair comparisons
Tracing error (test-retest comparison), accuracy within group
Non-parametric
Fisher’s permutation test
Between-group differences
III Numerical (ratio scale)
Non-parametric
Fisher’s permutation test
Between-group differences
Parametric Multivariable linear regression
Adjustment for initial difference
Parametric Intraclass correlation coefficient (ICC)
Reliability test (test-retest comparison)
Parametric and non-parametric
Pearson’s correlation coefficient
Reliability test (test-retest comparison)
Non-parametric
Fisher’s test for pair comparisons
Test changes due to reliability test
IV Numerical (interval and ratio scale)
Non-parametric
Fisher´s test for pair comparisons
Differences between two ways of planning within the same group
On prediction in orthognathic surgery
46
4 RESULTS
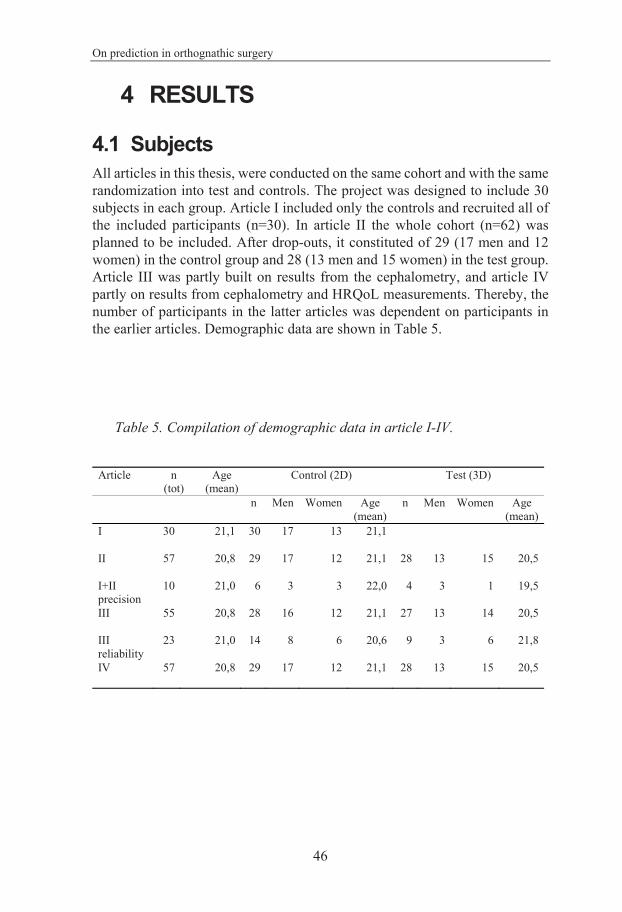
4.1 Subjects All articles in this thesis, were conducted on the same cohort and with the same randomization into test and controls. The project was designed to include 30 subjects in each group. Article I included only the controls and recruited all of the included participants (n=30). In article II the whole cohort (n=62) was planned to be included. After drop-outs, it constituted of 29 (17 men and 12 women) in the control group and 28 (13 men and 15 women) in the test group. Article III was partly built on results from the cephalometry, and article IV partly on results from cephalometry and HRQoL measurements. Thereby, the number of participants in the latter articles was dependent on participants in the earlier articles. Demographic data are shown in Table 5.
Table 5. Compilation of demographic data in article I-IV.
Article n (tot)
Age (mean)
Control (2D) Test (3D)
n Men Women Age (mean)
n Men Women Age (mean)
I 30 21,1 30 17 13 21,1
II 57 20,8 29 17 12 21,1 28 13 15 20,5
I+II precision
10 21,0 6 3 3 22,0 4 3 1 19,5
III 55 20,8 28 16 12 21,1 27 13 14 20,5
III reliability
23 21,0 14 8 6 20,6 9 3 6 21,8
IV 57 20,8 29 17 12 21,1 28 13 15 20,5

Martin Bengtsson
47
4.2 Drop-outs In Figure 11, CONSORT flow chart the dropouts in the study of HRQoL are shown.
Figure 11. CONSORT flow chart of subject flow during the HRQoL (Article III). Numbers of subjects within parenthesis.
On prediction in orthognathic surgery
48
128 patients were asked for participation. Out of these, 62 initial subjects between 18 and 28 years at surgery accepted participation. 57 completed 12-month clinical and radiological follow-up. Drop-out comprised of 2 in the control group and 3 in the test group.
At follow-up, the test group included 13 males and 15 females with a mean age of 20.5 years. The control group included 17 males and 12 females with a mean age of 21.1 years. Out of these, 55 subjects (27 in 3D group and 28 in 2D group) completed the questionnaires and were included in the HRQoL analysis.
The drop-outs during analyze of cephalometric accuracy included five subjects. Drop-out analyze showed that they represented both genders and both groups.
4.3 Cephalometry The analysis of cephalometric accuracy was performed in two sequences (Article I and II). Furthermore, it was based on measurements of cephalometric precision in both 2D and 3D cephalometry.
4.3.1 Precision Precision measurement, of cephalometric landmark detection, resulted in a total placement of 460 markers, 1260 measurements and 680 intra-individual analyses. The mean difference for each cephalometric marker is shown in Table 6. The total tracing error for 2D markers was 0,53 mm along the x-axis and 0,59 mm along the y-axis. The total tracing error for 3D markers was 0,36 mm along the x-axis, 0,43 mm along the y-axis and 0,49 mm along the z-axis.
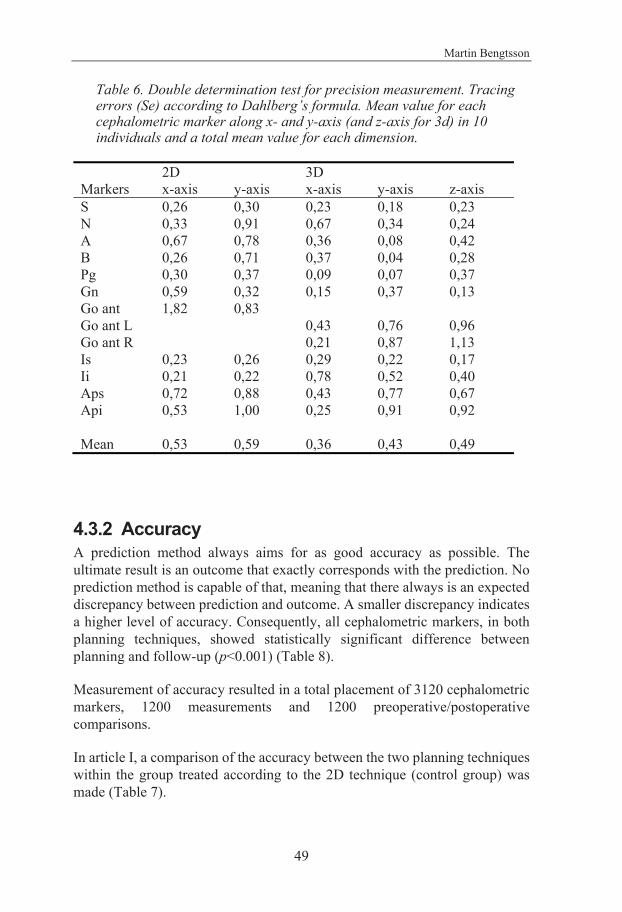
Martin Bengtsson
49
Table 6. Double determination test for precision measurement. Tracing errors (Se) according to Dahlberg’s formula. Mean value for each cephalometric marker along x- and y-axis (and z-axis for 3d) in 10 individuals and a total mean value for each dimension.
2D 3D Markers x-axis y-axis x-axis y-axis z-axis S 0,26 0,30 0,23 0,18 0,23 N 0,33 0,91 0,67 0,34 0,24 A 0,67 0,78 0,36 0,08 0,42 B 0,26 0,71 0,37 0,04 0,28 Pg 0,30 0,37 0,09 0,07 0,37 Gn 0,59 0,32 0,15 0,37 0,13 Go ant 1,82 0,83 Go ant L 0,43 0,76 0,96 Go ant R 0,21 0,87 1,13 Is 0,23 0,26 0,29 0,22 0,17 Ii 0,21 0,22 0,78 0,52 0,40 Aps 0,72 0,88 0,43 0,77 0,67 Api 0,53 1,00 0,25 0,91 0,92 Mean 0,53 0,59 0,36 0,43 0,49
4.3.2 Accuracy A prediction method always aims for as good accuracy as possible. The ultimate result is an outcome that exactly corresponds with the prediction. No prediction method is capable of that, meaning that there always is an expected discrepancy between prediction and outcome. A smaller discrepancy indicates a higher level of accuracy. Consequently, all cephalometric markers, in both planning techniques, showed statistically significant difference between planning and follow-up (p<0.001) (Table 8).
Measurement of accuracy resulted in a total placement of 3120 cephalometric markers, 1200 measurements and 1200 preoperative/postoperative comparisons.
In article I, a comparison of the accuracy between the two planning techniques within the group treated according to the 2D technique (control group) was made (Table 7).

On prediction in orthognathic surgery
50
Table 7. (Opposite side). Difference between planning and outcome in the control group within each planning technique (n=30). Test between planning and outcome in the control group within each planning technique (test1). Test between the accuracy of 2D and 3D (test2).
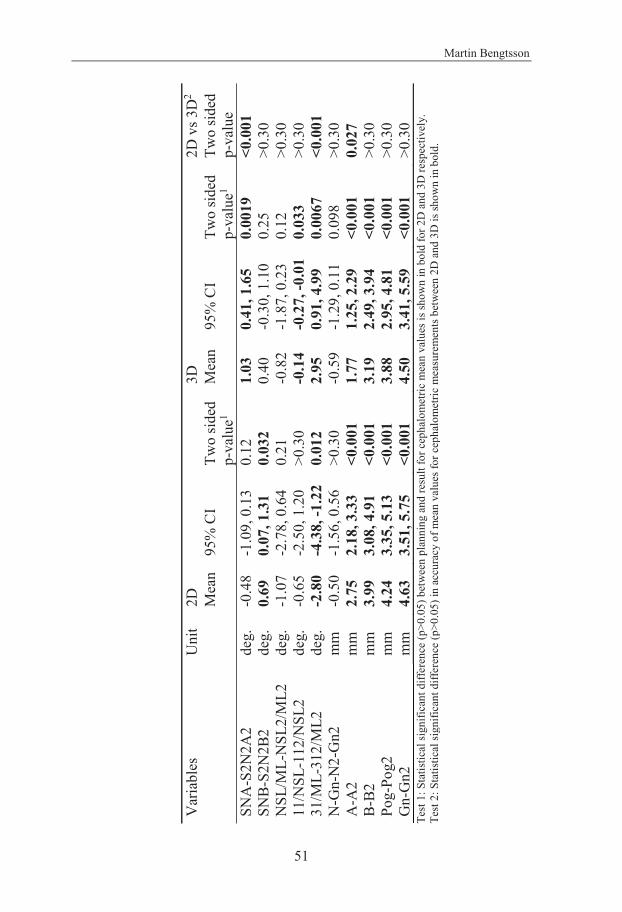
Martin Bengtsson
51
Var
iabl
es
Uni
t 2D
3D
2D
vs 3
D2
Mea
n 95
% C
I Tw
o sid
ed
p-va
lue1
Mea
n 95
% C
I Tw
o sid
ed
p-va
lue1
Two
sided
p-
valu
e SN
A-S
2N2A
2 de
g.
-0.4
8 -1
.09,
0.1
3 0.
12
1.03
0.
41, 1
.65
0.00
19
<0.0
01
SNB-
S2N
2B2
deg.
0.
69
0.07
, 1.3
1 0.
032
0.40
-0
.30,
1.1
0 0.
25
>0.3
0 N
SL/M
L-N
SL2/
ML2
de
g.
-1.0
7 -2
.78,
0.6
4 0.
21
-0.8
2 -1
.87,
0.2
3 0.
12
>0.3
0 11
/NSL
-112
/NSL
2 de
g.
-0.6
5 -2
.50,
1.2
0 >0
.30
-0.1
4 -0
.27,
-0.0
1 0.
033
>0.3
0 31
/ML-
312/
ML2
de
g.
-2.8
0 -4
.38,
-1.2
2 0.
012
2.95
0.
91, 4
.99
0.00
67
<0.0
01
N-G
n-N
2-G
n2
mm
-0
.50
-1.5
6, 0
.56
>0.3
0 -0
.59
-1.2
9, 0
.11
0.09
8 >0
.30
A-A
2 m
m
2.75
2.
18, 3
.33
<0.0
01
1.77
1.
25, 2
.29
<0.0
01
0.02
7 B-
B2
mm
3.
99
3.08
, 4.9
1 <0
.001
3.
19
2.49
, 3.9
4 <0
.001
>0
.30
Pog-
Pog2
m
m
4.24
3.
35, 5
.13
<0.0
01
3.88
2.
95, 4
.81
<0.0
01
>0.3
0 G
n-G
n2
mm
4.
63
3.51
, 5.7
5 <0
.001
4.
50
3.41
, 5.5
9 <0
.001
>0
.30
Test
1: S
tatis
tical
sign
ifica
nt d
iffer
ence
(p>0
.05)
bet
wee
n pl
anni
ng a
nd re
sult
for c
epha
lom
etric
mea
n va
lues
is sh
own
in b
old
for 2
D a
nd 3
D re
spec
tivel
y.
Test
2: S
tatis
tical
sign
ifica
nt d
iffer
ence
(p>0
.05)
in a
ccur
acy
of m
ean
valu
es fo
r cep
halo
met
ric m
easu
rem
ents
bet
wee
n 2D
and
3D
is sh
own
in b
old.

On prediction in orthognathic surgery
52
In article II, which is a continuation of article I, the accuracy in both groups (test and control) was evaluated and subsequently compared (Table 8). The evaluation within each planning technique was performed in two different ways:
• Absolute mean data, which is a comparison between planning and outcome by measuring differences between planned and obtained cephalometric positions (Table 8).
• Non-absolute mean data, comparing planning and outcome according to the direction of the mismatch. This shows whether the planned amount of surgical movement was larger or smaller than the final outcome (i.e. if the planning is over- or underestimating the outcome) (Table 9).
Table 8. (Opposite side). Absolute mean data of the difference between planning and outcome (accuracy), 3D and 2D techniques (n = 57).
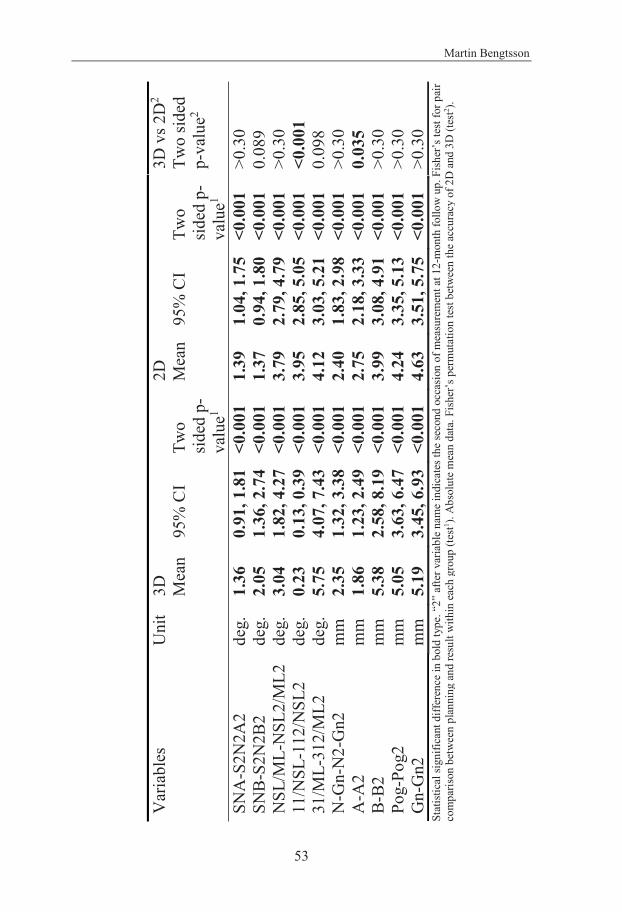
Martin Bengtsson
53
Var
iabl
es
Uni
t 3D
2D
3D
vs 2
D2
M
ean
95%
CI
Two
sided
p-
valu
e1
Mea
n 95
% C
I Tw
o sid
ed p
-va
lue1
Two
sided
p-
valu
e2
SNA
-S2N
2A2
deg.
1.
36
0.91
, 1.8
1 <
0.00
1 1.
39
1.04
, 1.7
5 <0
.001
>0
.30
SNB-
S2N
2B2
deg.
2.
05
1.36
, 2.7
4 <0
.001
1.
37
0.94
, 1.8
0 <0
.001
0.
089
NSL
/ML-
NSL
2/M
L2
deg.
3.
04
1.82
, 4.2
7 <0
.001
3.
79
2.79
, 4.7
9 <0
.001
>0
.30
11/N
SL-1
12/N
SL2
deg.
0.
23
0.13
, 0.3
9 <0
.001
3.
95
2.85
, 5.0
5 <0
.001
<0
.001
31
/ML-
312/
ML2
de
g.
5.75
4.
07, 7
.43
<0.0
01
4.12
3.
03, 5
.21
<0.0
01
0.09
8 N
-Gn-
N2-
Gn2
m
m
2.35
1.
32, 3
.38
<0.0
01
2.40
1.
83, 2
.98
<0.0
01
>0.3
0 A
-A2
mm
1.
86
1.23
, 2.4
9 <0
.001
2.
75
2.18
, 3.3
3 <0
.001
0.
035
B-B2
m
m
5.38
2.
58, 8
.19
<0.0
01
3.99
3.
08, 4
.91
<0.0
01
>0.3
0 Po
g-Po
g2
mm
5.
05
3.63
, 6.4
7 <0
.001
4.
24
3.35
, 5.1
3 <0
.001
>0
.30
Gn-
Gn2
m
m
5.19
3.
45, 6
.93
<0.0
01
4.63
3.
51, 5
.75
<0.0
01
>0.3
0 St
atis
tical
sign
ifica
nt d
iffer
ence
in b
old
type
. “2”
afte
r var
iabl
e na
me
indi
cate
s the
seco
nd o
ccas
ion
of m
easu
rem
ent a
t 12-
mon
th fo
llow
up.
Fish
er’s
test
for p
air
com
paris
on b
etw
een
plan
ning
and
resu
lt w
ithin
eac
h gr
oup
(test1 ).
Abs
olut
e m
ean
data
. Fis
her’s
per
mut
atio
n te
st b
etw
een
the
accu
racy
of 2
D a
nd 3
D (t
est2 ).
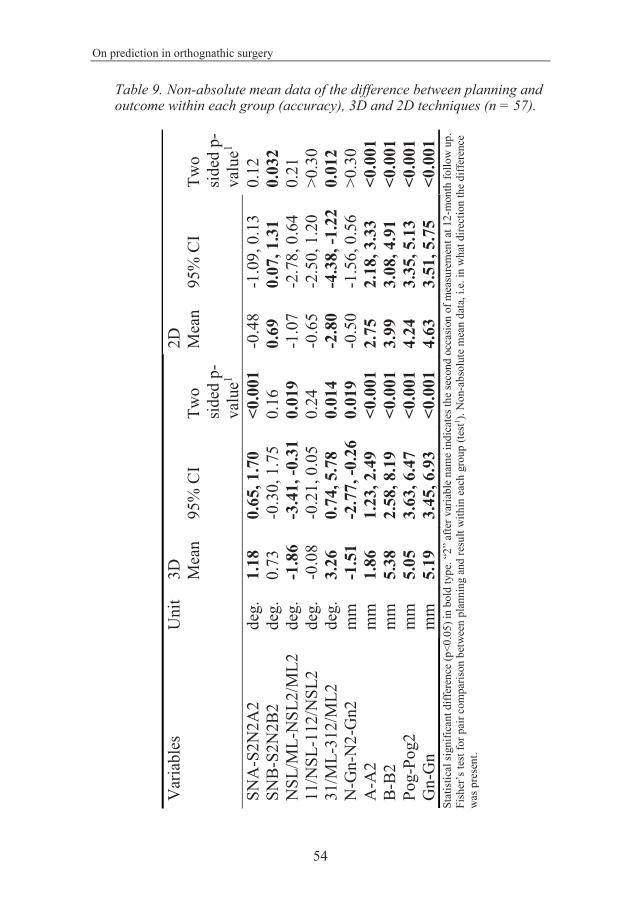
On prediction in orthognathic surgery
54
Table 9. Non-absolute mean data of the difference between planning and outcome within each group (accuracy), 3D and 2D techniques (n = 57).
Var
iabl
es
Uni
t 3D
2D
Mea
n 95
% C
I Tw
o sid
ed p
-va
lue1
Mea
n 95
% C
I Tw
o sid
ed p
-va
lue1
SNA
-S2N
2A2
deg.
1.
18
0.65
, 1.7
0
<0.0
01
-0.4
8 -1
.09,
0.1
3 0.
12
SNB-
S2N
2B2
deg.
0.
73
-0.3
0, 1
.75
0.16
0.
69
0.07
, 1.3
1 0.
032
NSL
/ML-
NSL
2/M
L2
deg.
-1
.86
-3.4
1, -0
.31
0.01
9 -1
.07
-2.7
8, 0
.64
0.21
11
/NSL
-112
/NSL
2 de
g.
-0.0
8 -0
.21,
0.0
5 0.
24
-0.6
5 -2
.50,
1.2
0 >0
.30
31/M
L-31
2/M
L2
deg.
3.
26
0.74
, 5.7
8 0.
014
-2.8
0 -4
.38,
-1.2
2 0.
012
N-G
n-N
2-G
n2
mm
-1
.51
-2.7
7, -0
.26
0.01
9 -0
.50
-1.5
6, 0
.56
>0.3
0 A
-A2
mm
1.
86
1.23
, 2.4
9 <0
.001
2.
75
2.18
, 3.3
3 <0
.001
B-
B2
mm
5.
38
2.58
, 8.1
9 <0
.001
3.
99
3.08
, 4.9
1 <0
.001
Po
g-Po
g2
mm
5.
05
3.63
, 6.4
7 <0
.001
4.
24
3.35
, 5.1
3 <0
.001
G
n-G
n m
m
5.19
3.
45, 6
.93
<0.0
01
4.63
3.
51, 5
.75
<0.0
01
Stat
istic
al si
gnifi
cant
diff
eren
ce (p
<0.0
5) in
bol
d ty
pe. “
2” a
fter v
aria
ble
nam
e in
dica
tes t
he se
cond
occ
asio
n of
mea
sure
men
t at 1
2-m
onth
follo
w u
p.
Fish
er’s
test
for p
air c
ompa
rison
bet
wee
n pl
anni
ng a
nd re
sult
with
in e
ach
grou
p (te
st1 ). N
on-a
bsol
ute
mea
n da
ta, i
.e. i
n w
hat d
irect
ion
the d
iffer
ence
w
as p
rese
nt.
Martin Bengtsson
55
Comparing 2D planning with outcome within the control group resulted in a statistically significant difference for the following cephalometric markers; A-point, B-point, Pogonion and Gnathion (p<0.001). The cephalometric measurements that showed statistically significant difference were SNB and 31/ML (p<0.032) (Article I).
Comparing 3D planning with outcome within the control group resulted in statistically significant difference for the following cephalometric markers: A-point, B-point, Pogonion and Gnathion (p<0.001). The cephalometric measurements that showed statistically significant difference were; SNA, 11/NSL and 31/ML (p<0.033).
In article I, on comparison between the two techniques, the only cephalometric marker that showed statistically significant difference was the A-point (p=0.027). Subsequently, also SNA showed a statistically significant difference (p<0.001). Table 7 shows a statistically significant difference for ML/31. However, on comparison of absolute difference there are no statistically significant difference (Table 8). The reason for this is that the difference is because the groups deviate at different directions from equal.
Comparing accuracy for test and control group (Article II) showed statistically significant difference for 11/NSL-112/NSL2 and for A-A2 (p<0.05) (Table 8). Compared to other studies on accuracy53,85,86, both groups showed an equally high level of accuracy for SNA and SNB. The test group also presented a relatively high level of accuracy for 11/NSL and for the A-point.
4.4 Health Related Quality of Life An indication of difference between the studied groups at baseline, initiated a comparison with multivariable linear regression model when comparing groups with respect to changes between pre- and postoperative measurements (Table 10). This was performed in order to test if initial differences between the groups could affect the comparison between the methods. Then the change between pre- and postoperative measurement was the dependent variable and the treatment group and the variable with observed initial difference were independent variables.
On prediction in orthognathic surgery
56
Clarification of Table 10 and 11: For the variables presented a decreasing value in the OHIP, Gen Health 1, Gen Health 2 and JFLS questionnaires indicated increasing HRQoL, while a decreasing value in the OES and Gen App indicated decreasing HRQoL. Thus, on comparison of pre- and postoperative measurements this sometimes led to negative values.
Table 10. (Opposite side). Mean values and 95% CI of HRQoL measurements of the two treatment groups. Test of the initial differences between the test group (3D) and the control group (2D) prior to treatment

Martin Bengtsson
57
Vari
able
s 3D
(tes
t)
2D (c
ontr
ol)
D
iffer
ence
bet
wee
n
trea
tmen
t gro
ups
(95%
CI)
Tw
o-si
ded
p-va
lue
2D v
s 3D
N
Mea
n 95
% C
I
N
Mea
n 95
% C
I
Gen
der
31
52%
fem
ale
31
42
% fe
mal
e
1.0
(-1.6
, 3.6
)
0.61
G
en A
pp
29
4.4
8 3
.61,
5.
35
27
5
.00
4.0
2,
5.98
-0.5
2 (
-1.8
0,
0.76
)
0.48
O
ES
29
35.0
7 29
.50,
40.
64
27
38
.33
32.9
0, 4
3.76
-3.2
6 (-1
0.88
, 4
.36)
0.47
JF
LS
30
33.2
8 21
.43.
45.
13
28
37
.54
24.8
0, 5
0.28
-4.2
6 (-2
1.25
, 12.
73)
0.
62
OH
IP to
tal
30
53.9
8 41
.64,
66.
32
29
61
.26
49.8
9, 7
2.63
-8.2
8 (-2
4.72
, 8
.16)
0.38
O
HIP
oro
-faci
al p
ain
30
8.4
0 6
.59,
10.
21
30
11
.30
9.5
0, 1
3.10
-2.9
0 (
-5.4
0, -
0.40
)
0.03
3 O
HIP
ora
l fun
ctio
n 28
19
.28
14.8
2, 2
3.74
29
20.1
0 16
.70,
23.
51
-0
.82
( -6
.28,
4.
64)
0.
76
OH
IP p
sych
osoc
ial i
mpa
ct
30
16.4
1 10
.78,
22.
07
29
19
.09
13.8
7, 2
4.31
-2.6
8 (-1
0.23
, 4
.87)
0.48
O
HIP
oro
-faci
al a
ppea
ranc
e 30
10
.38
8.2
2, 1
2.54
29
10.3
4 7
.88,
12.
81
0
.04
( -3
.16,
3.
24)
0.
98
OH
IP 1
4-S
30
13.3
4 9
.63,
17.
05
29
15
.05
11.4
1, 1
8.69
-1.7
1 (
-6.7
9,
3.37
)
0.50
O
HIP
5-S
30
6
.12
4.8
1,
7.43
30
7.1
9 5
.87,
8.
51
-1
.07
( -2
.89,
0.
75)
0.
24
Gen
Hea
lth 1
30
2
.20
1.8
2,
2.59
30
2.0
0 1
.74,
2.
26
0
.20
( -0
.25,
0.
65)
0.
47
Gen
Hea
lth 2
30
2
.80
2.4
2,
3.19
29
2.8
3 2
.49,
3.
17
-0
.03
( -0
.53,
0.
47)
0.
98

On prediction in orthognathic surgery
58
4.4.1 Measurement of HRQoL No statistically significant differences (p>0.21) were found between test and control group comparing variables in difference between preoperative and follow-up measurements univariate (Table 11).
An observed initial difference between the groups gave rise to a comparison between test and control group when adjusting for differences in OHIP oro-facial pain at baseline (Table 10). This comparison revealed a statistically significant difference in the change between preoperative and follow-up in OHIP oral function, 4.8 (95% CI: 0.5-9.1) (p=0.028) when adjusting for baseline OHIP oro-facial pain. On the same comparison, however, OHIP total still showed no statistically significant difference between the groups (p=0.079).
Comparing HRQoL pre- and postoperative for both groups showed that the scores for OES and for the question on the patient’s general appearance (Gen App) increased, indicating an increased impression of the patient’s quality of life for both groups. Likewise, a decrease of the scores for OHIP-S, JFLS and the two questions of patient’s general health (Gen Health 1 and Gen Health 2) indicated an increased impression of the patient’s quality of life for both groups (Table 11).
4.4.2 Comparisons of HRQoL with accuracy Accuracy and HRQoL were prior to comparison assessed separately. Both groups presented an overall high cephalometric accuracy. Out of 10 cephalometric measurements, accuracy differed for 11/NSL-112/NSL2 and for A-A2 between the two groups. The test group showed a higher level of accuracy82.
OHIP total (representing overall HRQoL measurement) showed no statistically significant difference between the groups (p=0.079). When adjusting for baseline OHIP oro-facial pain (Table 10), a statistically significant difference in the change between preoperative and follow-up in OHIP oral function, 4.8 (95% CI: 0.5-9.1) (p=0.028) was shown.
Together, the findings in HRQoL and cephalometric accuracy revealed consistent results showing similar changes between preoperatively and follow-up in both groups. Considering analysis on cephalometry in the anterior maxilla and adjustment for initial differences in OHIP-oro-facial pain, changes were presented to a higher level in the test group.
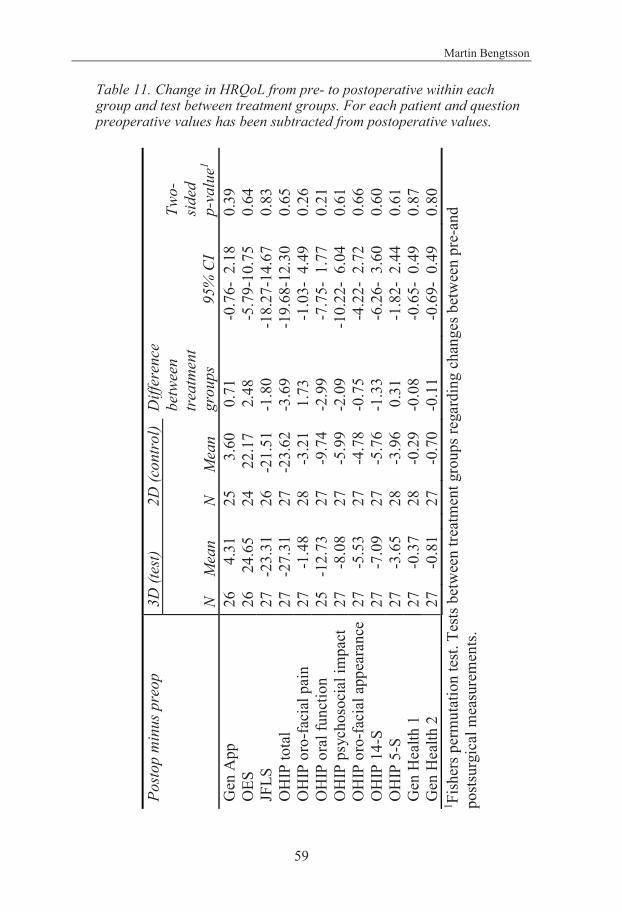
Martin Bengtsson
59
Table 11. Change in HRQoL from pre- to postoperative within each group and test between treatment groups. For each patient and question preoperative values has been subtracted from postoperative values.
Post
op m
inus
pre
op
3D (t
est)
2D
(con
trol
) D
iffer
ence
be
twee
n tr
eatm
ent
grou
ps
95
% C
I
Two-
side
d
p-va
lue1
N
Mea
n
N
Mea
n G
en A
pp
26
4.
31
25
3.60
0
.71
-0.
76-
2.18
0.
39
OES
26
2
4.65
24
22.
17
2.4
8 -
5.79
-10.
75
0.64
JF
LS
27
-23.
31
26
-2
1.51
-1
.80
-18.
27-1
4.67
0.
83
OH
IP to
tal
27
-27.
31
27
-2
3.62
-3
.69
-19.
68-1
2.30
0.
65
OH
IP o
ro-fa
cial
pai
n 27
-
1.48
28
-3.
21
1.7
3 -
1.03
- 4.
49
0.26
O
HIP
ora
l fun
ctio
n 25
-1
2.73
27
-9.
74
-2.9
9 -
7.75
- 1.
77
0.21
O
HIP
psy
chos
ocia
l im
pact
27
-
8.08
27
-5.
99
-2.0
9 -1
0.22
- 6.
04
0.61
O
HIP
oro
-faci
al a
ppea
ranc
e 27
-
5.53
27
-4.
78
-0.7
5 -
4.22
- 2.
72
0.66
O
HIP
14-
S 27
-
7.09
27
-5.
76
-1.3
3 -
6.26
- 3.
60
0.60
O
HIP
5-S
27
-
3.65
28
-3.
96
0.3
1 -
1.82
- 2.
44
0.61
G
en H
ealth
1
27
-0.
37
28
-
0.29
-0
.08
-0.
65-
0.49
0.
87
Gen
Hea
lth 2
27
-
0.81
27
-0.
70
-0.1
1 -
0.69
- 0.
49
0.80
1 Fi
sher
s per
mut
atio
n te
st. T
ests
betw
een
treat
men
t gro
ups r
egar
ding
cha
nges
bet
wee
n pr
e-an
d po
stsur
gica
l mea
sure
men
ts.
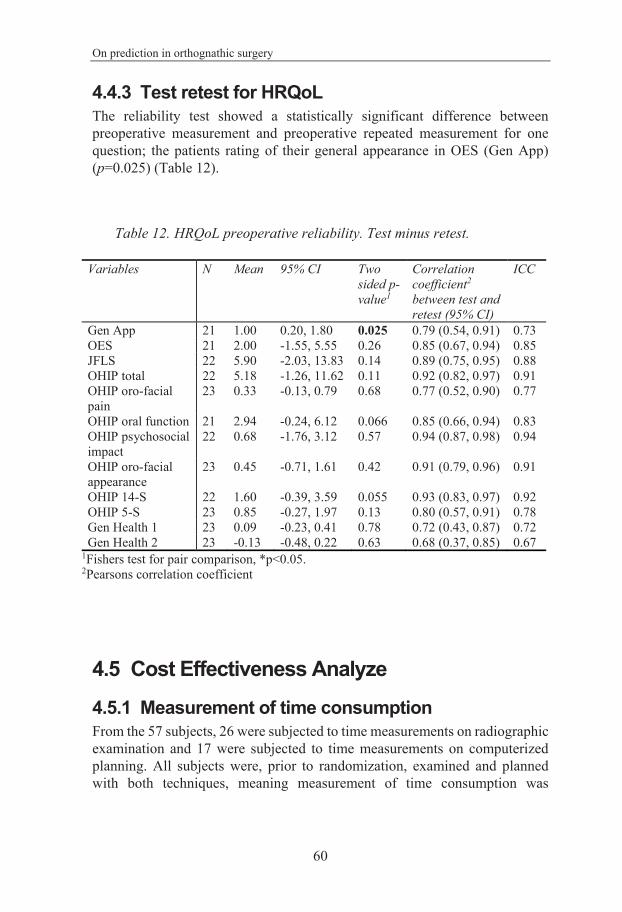
On prediction in orthognathic surgery
60
4.4.3 Test retest for HRQoL The reliability test showed a statistically significant difference between preoperative measurement and preoperative repeated measurement for one question; the patients rating of their general appearance in OES (Gen App) (p=0.025) (Table 12).
Table 12. HRQoL preoperative reliability. Test minus retest.
4.5 Cost Effectiveness Analyze 4.5.1 Measurement of time consumption From the 57 subjects, 26 were subjected to time measurements on radiographic examination and 17 were subjected to time measurements on computerized planning. All subjects were, prior to randomization, examined and planned with both techniques, meaning measurement of time consumption was
Variables N Mean 95% CI Two sided p-value1
Correlation coefficient2
between test and retest (95% CI)
ICC
Gen App 21 1.00 0.20, 1.80 0.025 0.79 (0.54, 0.91) 0.73 OES 21 2.00 -1.55, 5.55 0.26 0.85 (0.67, 0.94) 0.85 JFLS 22 5.90 -2.03, 13.83 0.14 0.89 (0.75, 0.95) 0.88 OHIP total 22 5.18 -1.26, 11.62 0.11 0.92 (0.82, 0.97) 0.91 OHIP oro-facial pain
23 0.33 -0.13, 0.79 0.68 0.77 (0.52, 0.90) 0.77
OHIP oral function 21 2.94 -0.24, 6.12 0.066 0.85 (0.66, 0.94) 0.83 OHIP psychosocial impact
22 0.68 -1.76, 3.12 0.57 0.94 (0.87, 0.98) 0.94
OHIP oro-facial appearance
23 0.45 -0.71, 1.61 0.42 0.91 (0.79, 0.96) 0.91
OHIP 14-S 22 1.60 -0.39, 3.59 0.055 0.93 (0.83, 0.97) 0.92 OHIP 5-S 23 0.85 -0.27, 1.97 0.13 0.80 (0.57, 0.91) 0.78 Gen Health 1 23 0.09 -0.23, 0.41 0.78 0.72 (0.43, 0.87) 0.72 Gen Health 2 23 -0.13 -0.48, 0.22 0.63 0.68 (0.37, 0.85) 0.67
1Fishers test for pair comparison, *p<0.05. 2Pearsons correlation coefficient
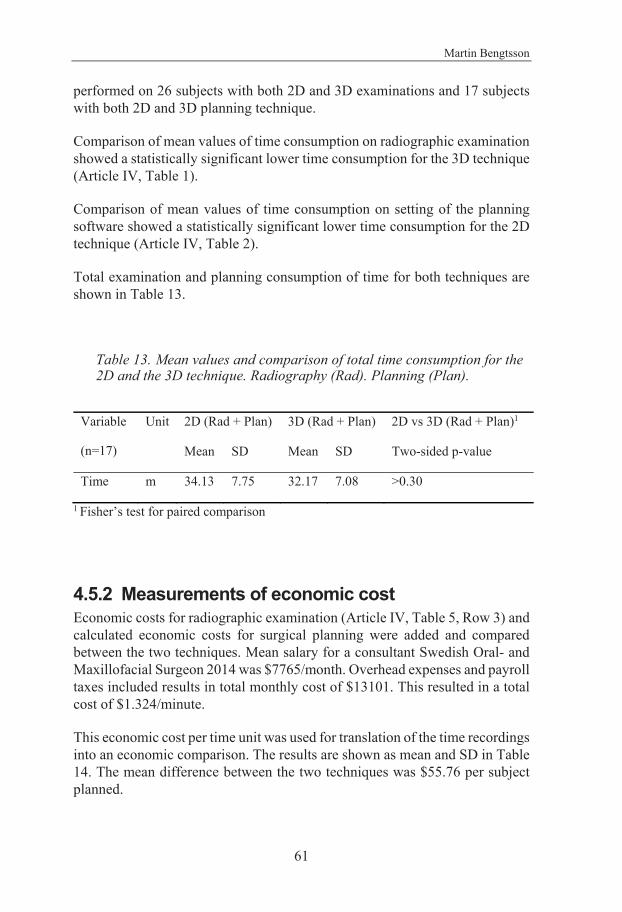
Martin Bengtsson
61
performed on 26 subjects with both 2D and 3D examinations and 17 subjects with both 2D and 3D planning technique.
Comparison of mean values of time consumption on radiographic examination showed a statistically significant lower time consumption for the 3D technique (Article IV, Table 1).
Comparison of mean values of time consumption on setting of the planning software showed a statistically significant lower time consumption for the 2D technique (Article IV, Table 2).
Total examination and planning consumption of time for both techniques are shown in Table 13.
Table 13. Mean values and comparison of total time consumption for the 2D and the 3D technique. Radiography (Rad). Planning (Plan).
Variable
(n=17)
Unit 2D (Rad + Plan) 3D (Rad + Plan) 2D vs 3D (Rad + Plan)1
Mean SD Mean SD Two-sided p-value
Time m 34.13 7.75 32.17 7.08 >0.30
1 Fisher’s test for paired comparison
4.5.2 Measurements of economic cost Economic costs for radiographic examination (Article IV, Table 5, Row 3) and calculated economic costs for surgical planning were added and compared between the two techniques. Mean salary for a consultant Swedish Oral- and Maxillofacial Surgeon 2014 was $7765/month. Overhead expenses and payroll taxes included results in total monthly cost of $13101. This resulted in a total cost of $1.324/minute.
This economic cost per time unit was used for translation of the time recordings into an economic comparison. The results are shown as mean and SD in Table 14. The mean difference between the two techniques was $55.76 per subject planned.
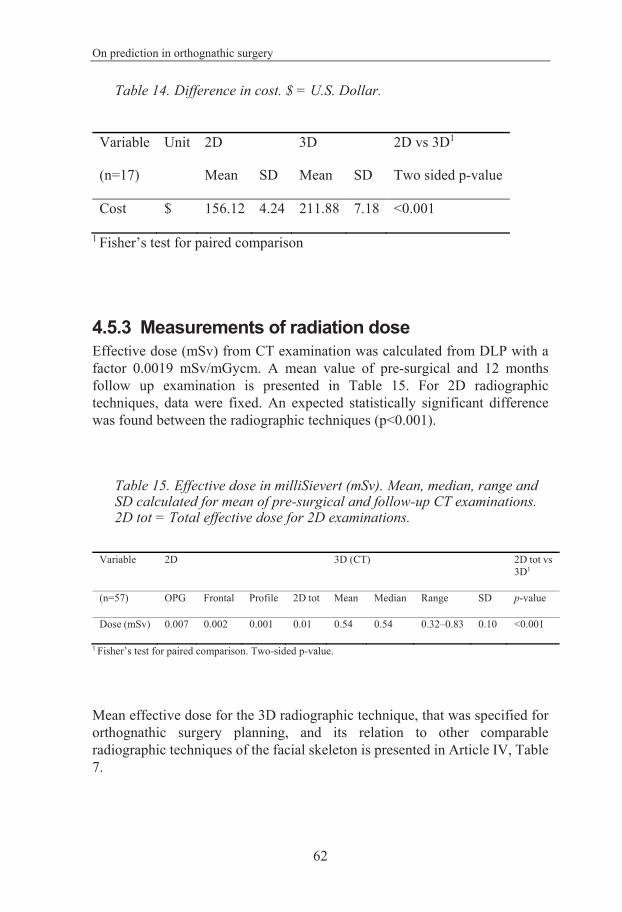
On prediction in orthognathic surgery
62
Table 14. Difference in cost. $ = U.S. Dollar. Variable
(n=17)
Unit 2D 3D 2D vs 3D1
Mean SD Mean SD Two sided p-value
Cost $ 156.12 4.24 211.88 7.18 <0.001
1 Fisher’s test for paired comparison
4.5.3 Measurements of radiation dose Effective dose (mSv) from CT examination was calculated from DLP with a factor 0.0019 mSv/mGycm. A mean value of pre-surgical and 12 months follow up examination is presented in Table 15. For 2D radiographic techniques, data were fixed. An expected statistically significant difference was found between the radiographic techniques (p<0.001).
Table 15. Effective dose in milliSievert (mSv). Mean, median, range and SD calculated for mean of pre-surgical and follow-up CT examinations. 2D tot = Total effective dose for 2D examinations.
1 Fisher’s test for paired comparison. Two-sided p-value.
Mean effective dose for the 3D radiographic technique, that was specified for orthognathic surgery planning, and its relation to other comparable radiographic techniques of the facial skeleton is presented in Article IV, Table 7.
Variable 2D 3D (CT) 2D tot vs 3D1
(n=57) OPG Frontal Profile 2D tot Mean Median Range SD p-value
Dose (mSv) 0.007 0.002 0.001 0.01 0.54 0.54 0.32–0.83 0.10 <0.001
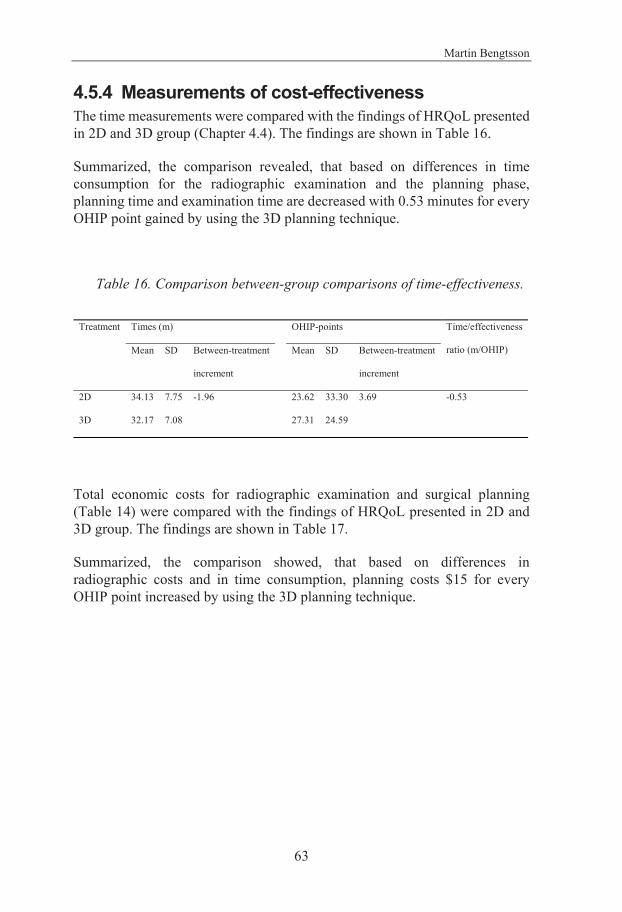
Martin Bengtsson
63
4.5.4 Measurements of cost-effectiveness The time measurements were compared with the findings of HRQoL presented in 2D and 3D group (Chapter 4.4). The findings are shown in Table 16.
Summarized, the comparison revealed, that based on differences in time consumption for the radiographic examination and the planning phase, planning time and examination time are decreased with 0.53 minutes for every OHIP point gained by using the 3D planning technique.
Table 16. Comparison between-group comparisons of time-effectiveness.
Total economic costs for radiographic examination and surgical planning (Table 14) were compared with the findings of HRQoL presented in 2D and 3D group. The findings are shown in Table 17.
Summarized, the comparison showed, that based on differences in radiographic costs and in time consumption, planning costs $15 for every OHIP point increased by using the 3D planning technique.
Treatment Times (m) OHIP-points Time/effectiveness
ratio (m/OHIP) Mean SD Between-treatment
increment
Mean SD Between-treatment
increment
2D 34.13 7.75 -1.96 23.62 33.30 3.69 -0.53
3D 32.17 7.08 27.31 24.59
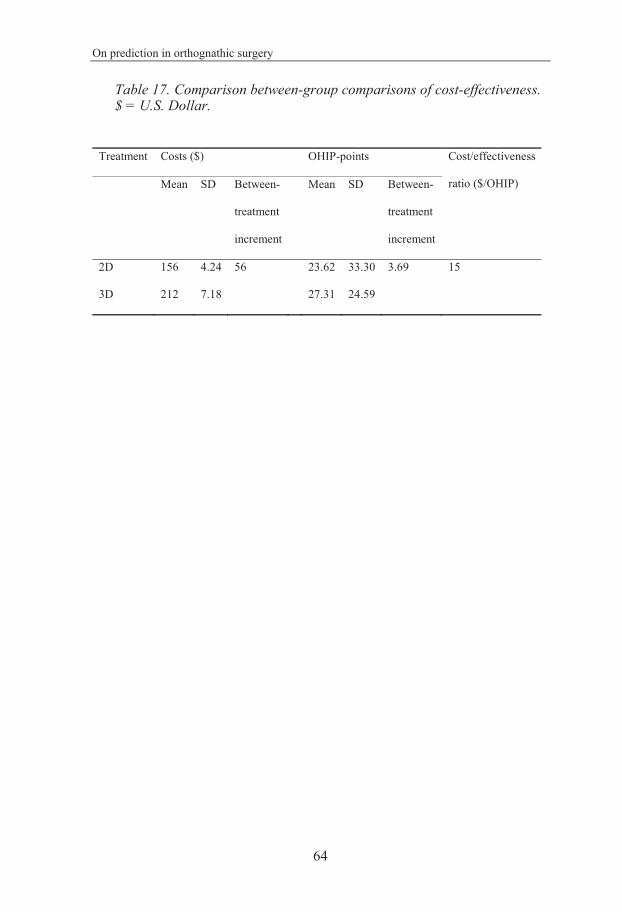
On prediction in orthognathic surgery
64
Table 17. Comparison between-group comparisons of cost-effectiveness. $ = U.S. Dollar.
Treatment Costs ($) OHIP-points Cost/effectiveness
ratio ($/OHIP) Mean SD Between-
treatment
increment
Mean SD Between-
treatment
increment
2D 156 4.24 56 23.62 33.30 3.69 15
3D 212 7.18 27.31 24.59
Martin Bengtsson
65
5 DISCUSSION
5.1 Comments on study design All studies in this thesis were conducted as prospective, parallel group, randomized, two-arm parallel double-blinded, active-controlled clinical trials with a 1:1 allocation ratio. As being randomized controlled trials, the design and the order of randomization (enrollment, planning and allocation) minimizes the risk of confounding or bias of the results. The order of treatment planning and randomization, that the planning with both methods was performed prior to randomization, also reduced the risk of having the knowledge of patient group affecting treatment planning and thereby adding favour to the technique used for surgery.
When treating severe malocclusions, a highly predictable long-term result is of utmost importance for the patients. Based on this, measurement of the final treatment outcome is the most important measurement for assessment of accuracy of preoperative planning and HRQoL measurements. This is why the design of the studies was based on follow-up at 12 months after surgery instead of an immediate postoperative control. Hence, the follow-up of cephalometric outcome, HRQoL outcome and CEA were performed simultaneously and the comparison of these measurements became more reliable.
The risk of having relapse as a confounding factor increase when the follow-up is delayed. However, when the distribution of treatment methods is randomized within a controlled, normally distributed cohort, the risk of having relapse, associated with different methods or levels of movements, is equally distributed between the two groups.
Several studies on accuracy of planning techniques have been conducted on selected surgical movements41,53,54,87. Hence, the decision of which surgical treatment that should be used is not based on the planning technique studied. One advantage of using a planning technique is the prediction aiding in the decision of which specific surgical treatment that should be used. To allow participation of the planning technique in the process of choosing a specific surgical treatment, it is important that the study of treatment planning should be based on inclusion of subjects before decision of the surgical treatment.
On prediction in orthognathic surgery
66
5.2 Comments on material The subjects chosen for these studies were aged between 18 and 30. This limitation was set to make the studied subjects representable for the majority of the patients with a treatment need for orthognathic corrections. By limit the range of age also reduced the risk of having age as a confounding factor, which was favorable from all studied aspects (e.g. relapse, PROMS).
The computerized prediction technique is of great value for planning surgical and orthodontic corrections of malocclusion. Still, because of the limitations in accuracy of digital soft tissue prediction techniques, the patient’s own physical simulations (when possible to perform) could be superior to the computerized technique. For example, this is often easily done predicting mandibular advancement in a single jaw correction, asking the patient to protrude the mandible. For this reason, only class III malocclusions, with or without a presence of asymmetry or vertical discrepancy, were included in the present study.
The distribution of gender showed a slight majority of males in the control group and a slight majority of females in the test group. Michel et al88 suggests there are differences in HRQoL related to gender among adolescents in Europe, where females showed a greater declination of HRQoL with age than the males did. This could mean that there is a risk having gender as a confounding factor, if the sexes are not equally distributed in the test and control group. In the present project, this could result in a lower HRQoL in the test group compared with the control group. However, considering small differences in gender distribution and that the results did not tend be consistent with the gender-confounding risk, the results in the present cohort could not be explained by a difference in gender distribution.
The number of subjects included was not based on a sample size calculation (power analysis). The reason was that such calculation must be based on an estimate of difference, which we did not have at the time of data collection. This was true for both analysis of cephalometric accuracy, HRQoL and cost-effectiveness. The number of subjects was based on previous studies instead38,41,49,53,54,68,69,71,74,80,81.
In the study on cephalometric accuracy (Article I and II), the small size of the drop-out cohort and its equal distribution in the groups, led us to assume that they had no impact on the outcome.
Martin Bengtsson
67
In the study on HRQoL, the drop-out, due to incomplete answers, comprised of 2 out of 57 subjects and was equally distributed between the groups. This did not affect the statistical analysis and a drop-out analysis of these two subjects was not made. Further, as being a one-year follow-up study on young adults, the number of the drop-outs is interpreted as low.
The number of subjects measured for radiation dose (n=57) differ from those measured for radiographic time consumption (n=26) and planning time consumption (n=17). The reason for this is because the first 30 subjects were not measured for time consumption due to an expected longer learning curve on the 3D technique compared with the 2D technique. The 2D technique has been used since more than 20 years in the present clinical setting.
5.3 Comments on methods The validity, that the test measure what we want to enlighten, and the reliability, that the measurement represents the variable of interest only, of a method is important. In the present project the focus on validity is represented by chosen cephalometric markers and measurements in an area of high esthetical impact, the anterior part of the face, previous validated HRQoL measurements67-71,74 in the anatomical area of interest and a broad concept of CEA, for example time measurements, financial costs and radiation dose. The reliability is represented by a test-retest protocol, performed in both the cephalometric and in the HRQoL measurements.
Comparing a 2D image with a 3D image of the same anatomical region is demanding and not free from challenges4. In addition, previous studies showed that the cephalometric measurements in 3D are still evolving and not until now sufficiently evaluated or consistently used51,89. In the present project, on comparison of accuracy between 2D and 3D, cephalometry solely of distances between markers were used. Additionally, cephalometric analyses of accuracy were only performed separately within the test and control group prior to comparison between the groups82,83. Hence, it was avoided to directly compare a 2D with a 3D cephalometric measurement (Chapter 3.2.1).
On prediction in orthognathic surgery
68
The accuracy of surgical treatment of severe malocclusions is dependent on three main sequences:
1. preoperative planning
2. transfer of planning to surgery (surgical template)
3. surgical precision/relapse
Previous studies on 3D planning have focused on more than one of these sequences38,41,53,54,80,81. The present project was designed to measure the planning sequence alone. Accordingly, it describes the importance of preoperative planning phase with a higher precision. The outcome of this project is therefore important.
Despite this, one could criticise the project for not taking all preoperative sequences into account when comparing two methods. One sequence that often differs between 2D and 3D is the transfer of the planning to surgery. Using service centres, when 3D planning a case, often comes with an additional service of digital template fabrication90, but also with an additional economic cost. However, a 2D planning method always requires a dental technician fabricated template on dental casts.
There are examples of previous studies on CEA comparing 2D and 3D planning techniques in orthognathic treatment91,92. However, these studies lack a fair comparison. Because professional support was used in the 3D setting, meaning it became the more time-effective planning method, the results from these trials probably have been the opposite if a service centre has done the 2D set-up instead and an OMFS has done the 3D set-up.
When evaluating orthognathic treatment, it is interesting to compare costs with outcome. In this thesis, when comparing two different planning techniques, a CEA was used and the differences in cost were weighted against the differences in cephalometric accuracy and HRQoL. Measurements of time consumption, financial costs and radiation dose were done in a similar manner for both studied techniques.
Similar to other studies on radiation dose in radiographic examination of the facial skeleton, the comparison was made upon data of effective dose76.
A common measurement used in CEA is quality adjusted life years (QALY). To enable a comparison on QALY there has to be a validated instrument to

Martin Bengtsson
69
translate the measurements from. This is for example present for a generic health state measure, EuroQol (EQ-5D) 29. However, when decided to use a measure that, better than EQ-5D, represent the local facial/oral status, OHIP, this opportunity up to now disappears. Upon designing the present project, one article with CUA on QALY in orthognathic treatment has been found93. However, analyses used in this article was not thoroughly described and could therefore not be used as a guide. The lack of a validated material to transform into QALY in the present study, is why it is instead conducted as an CEA, comparing economical costs with outcome measures on HRQoL between the two tested planning techniques.
A recently published article on CEA of the oral region have used analysis with both EQ-5D and OHIP73. The reason for this is similar as for the present study. I.E. OHIP was included due to concerns that the EQ-5D may not be sensitive enough to detect changes in the studied oral region.
5.4 Comments on results The overall findings from the present project on comparison between 2D and 3D prediction in orthognathic treatment are presented in Conclusion (Chapter 6). The implications of the outcome from this thesis are presented in Clinical implications and future perspectives (Chapter 6.1 and 7).
The comparison of cephalometric accuracy showed a higher accuracy in the anterior maxilla for the 3D technique, but for both techniques the level of accuracy was high and comparable to other studies85,86. Mandibular markers showed the lowest level of accuracy which was in accordance with Olszewski et al., claiming their weak intra-individual reproducibility86. Olszewski et al. also draw the same conclusion as the present study, that these measurements should not be used for diagnostic or treatment guidance without other clinical recordings.
The level of precision in the test-retest methodology is similar to other studies on intra-individual reproducibility of placement of cephalometric markers94-97. Extrapolating these findings into precision of cephalometric analysis, results in increased error of precision. This could be the result of adding two or more markers into the same measurement and thereby adding their errors of precision to each other. This becomes more obvious when adding markers with a larger error of precision to each other, i.e. 31/ML. The error of precision increases further when a third dimension, z-axis in 3D, is added83. Thus, the largest error of precision was observed in analyze of a combination of markers with high error of precision in three dimensions, i.e. 31/ML.
On prediction in orthognathic surgery
70
The measurements of differences between planned and obtained positions were obtained primarily without recording of direction (absolute findings). However, the registration also recorded in what direction the difference was present, based on non-absolute mean values. Thereby the result showed if the planned amount of surgical movement was larger or smaller than the final outcome. This was described as under- and overestimation.
The 3D technique showed a tendency to overestimate, meaning that a larger anterior movement was planned than the final outcome showed. Statistically significant differences were found for all measurements except for SNB. This was not found for 2D and could indicate a stronger tendency for overestimation with 3D than with 2D.
The risk of having relapse as a confounding factor when the follow-up is delayed is discussed above. In the present project, the A-point showed the highest accuracy. Even if no statistically significant difference was found between 2D and 3D, the 3D technique showed high accuracy for other maxillary measurements as well, such as 11/NSL and SNA. Early relapse is thought to be a cofactor for weaker accuracy. Some studies found a low degree of early relapse in the anterior maxilla35,98. Thus, according to the findings in the present project, the impact of early relapse on accuracy in this region could be estimated as low.
As stated above, despite a statistically significant higher accuracy for the 3D technique in the anterior maxilla, both techniques presented accuracies comparable to findings in other studies. Based on this and on the natural advantage of the 3D technique in patients with asymmetry99, it would be the technique recommended for any case in the clinical setting.
The results from HRQoL measurements indicated an increased quality of life in both 2D and 3D groups. By means of a reliability test, the improvements at 12-month follow-up was shown regardless of initial differences between the groups. Posnick et al presented only postoperative data, without comparison to preoperative measurement 100. This indicated a high level of postoperative satisfaction but did not show improvement of HRQoL.
All HRQoL variables except Gen Health 1 (both groups), OHIP orofacial pain (test group) and OHIP psychosocial impact (control group) showed statistically significant difference (p<0.01) between measurements prior to treatment and at 12-months follow-up. However, considering the statistically significant difference between preoperative measurement and repeated preoperative measurement for the patients rating of their general appearance (Gen App), the
Martin Bengtsson
71
improvement of this single variable is doubtful. The results are in accordance with other studies on HRQoL in orthognathic surgery60,101.
The difference in increase of OHIP - oral function, after adjusting for baseline discrepancies for OHIP oro-facial pain, between the groups was statistically significant (p=0.028). It is doubtful that this finding, within a fraction of the HRQoL measurement, based on a study with a limited number of participants, could support evidence of a difference between the studied planning techniques. Consequently, this detection in the present HRQoL analysis need to be verified in a larger cohort. If a difference exists, it might be linked to the difference in accuracy in the anterior maxilla, which might also affect the function. Thus, this higher level of accuracy might explain the detected higher level of oral function.
Generally, despite the difference in accuracy for the A point and for 11/NSL, the findings showed an improvement of HRQoL for both groups. Notable is also an improvement of HRQoL even if a weaker mandibular accuracy generally was shown. These findings indicate that, independent of planning technique, treatment of dentofacial deformities and severe malocclusions with orthognathic surgery provide the patients with a clear improvement of their self-perceived HRQoL. This is in accordance with findings from other studies60-63.
The improvement shown in HRQoL for both groups indicates that treatment of dentofacial deformities and malocclusions with orthognathic surgery could be recommended independent of planning technique. Comparison reveals minor differences and it is unclear if these findings have any clinical relevance.
Article IV clearly shows a statistically significant difference in consumption of time between the two methods. It is not surprising that the planning set-up takes longer time for a 3D technique compared with a 2D technique. Examples of steps that add to the consumption of time is a more advanced system of cephalometry, heavier data files and a segmentation processes with an additive dimension for the 3D technique.
Perhaps more surprising is the finding of time consumption in the phase of radiographic examination. Even if a radiographic 2D technique is less complex than a 3D, it was more time-consuming to perform. An explanation to this, is that the 2D radiographic set-up in the present trial consisted of three separate examinations, i.e. panoramic, profile and anterior-posterior view. The performance of examination, thus meant logistic moments between the radiographic machines in 2D technique, while the 3D examination was
On prediction in orthognathic surgery
72
performed in one machine alone. However, this is how the examinations usually are performed and the trial thereby well represents the settings in most centers for orthognathic surgery.
Interestingly, the outcome of measurements of time consumption in the two chosen phases showed advantage in time consumption for one technique at a time. Above, the reason for this is discussed. Combining the two measured phases into a total comparison erases these separate differences. If a service centre had been used, the difference in planning time measurement would probably be erased, thus resulting in an advantage in total time consumption for the 3D technique. This is also showed in previous studies91,92.
This actualizes a discussion however a time consuming radiographic examination (three different 2D examinations), even though with a lower radiation dose, could be advocated. Decreasing the number of radiographic examinations, also decreases the time consumption and thus the cost. This suggests that a modern radiographic technique should perform with high quality, low radiation dose and a minimal amount of examination procedures. Or as Xia et al stated it to be “faster, cheaper and better outcome”90. Perhaps, this could be delivered after further development of the CBCT technique into an improved imaging of the soft tissues and a decreased radiation dose.
Today, there are already possibilities to combine different recording techniques to fulfil these wishes. An example is combining CBCT with 3D photography2. This results in high quality imaging of the hard tissues from CBCT and of the facial surface of the soft tissues from the 3D photograph. However, converting one registration into two certainly increases the time consumption, thus the cost. Machines performing these two registrations in only one setting are, due to facial support bars, up to now inadequate in soft tissue surface registration.
The results from comparison of economical cost showed a statistically significant difference where the 3D technique was more expensive. This finding could seem to be in contradiction to the findings in total time measurements, where the studied techniques showed equality. However, these results were based on time measurements on both radiographic examination and on planning, whereas the examination time was not used in the economic comparison due to fixed examination costs. Consequently, the difference in planning time affects the outcome of the economical comparison.
Comparison of effective radiation dose in the radiographic examinations were presented in mean values and ranges for the present cohort. The measured
Martin Bengtsson
73
radiation doses for the head examinations were in accordance with other studies77.
The use of a multi-slice CT scan in treatment planning, leading to a large increase of radiation dose when comparing with 2D radiographs, is debated. However, modern computerized planning techniques for orthognathic surgery treatment gives an acceptable accuracy based on specified settings for CT examination. These settings give a decreased radiation dose compared to a full dose multi-slice CT scan as shown in Article IV. This actualizes the question if a milder increase of the radiation dose advocates the use of a 3D planning technique. As already discussed above, a combination of a 3D photographic registration and a CBCT acquisition would give acceptable hard and soft tissue imaging quality. However, adding registrations might lead to discrepancies upon calibration in the interface between them and increase time consumption.
Comparing cost-effectiveness between the two techniques in the present project showed no statistically significant difference in total time consumption, but accounting for the difference measured, it affects the CEA, where every gained OHIP point also gains 0.53 minutes in time consumption.
A lower total economic cost was shown for the 2D technique upon adding fixed radiographic examination costs to calculated planning time costs. The main reason for this discrepancy is a higher fixed radiographic cost for the 3D technique. Subsequently this discrepancy also affects the CEA, where every gained OHIP point showed an increased cost of $15 when using 3D instead of 2D.
An even larger difference is evident if fixed economic cost for the software programs are added. Adding these costs to the present cohort, by dividing the fixed economic costs (Article IV, Table 5) with the number of subjects, results in increased cost of $272 per gained OHIP-point when using 3D, a huge difference between the techniques. However, an investment in a modern technique is often based on a forecast analysis, meaning that there might be a limit in number of patients treated annually advocating the purchase.
Recently, free open-source software for 3D treatment planning in orthognathic treatment have been made available102. The implementation of such programs fundamentally changes the perspective upon investment. However, it is up to now unclear how the prediction quality of free open-source software is, when compared to present planning techniques.
On prediction in orthognathic surgery
74
6 CONCLUSION • Both 2D and 3D techniques showed high cephalometric
accuracy in predicting facial outcome. However, in patients with asymmetric malocclusion and/or facial appearance the 3D technique has an obvious advantage.
• In the anterior maxilla, cephalometric accuracy showed a statistically significant difference between 2D and 3D, with an advantage for 3D. Both techniques indicated a high accuracy in predicting facial outcome except for mandible markers.
• Independently of planning technique used, 2D or 3D, HRQoL demonstrated an equal improvement after treatment of dentofacial deformities and malocclusions with orthognathic surgery.
• Despite a difference in cephalometric accuracy, both 2D and 3D planning techniques showed equally high improvement of HRQoL.
• The cost-effectiveness for the two planning techniques are equal in terms of total time consumption. The 2D technique showed an overall lower economic cost and a lower effective radiation dose.
Martin Bengtsson
75
6.1 Clinical implications The present comparison between two planning techniques in orthognathic treatment of severe malocclusions indicated that there is a significant difference in cephalometric accuracy between the two methods with a higher accuracy for 3D in the anterior maxilla. Despite this, both techniques presented a level of accuracy comparable to other studies and indicates that there is only a minor difference between the techniques. Because the 3D technique has an advantage for the group of patients with asymmetry, it would be the technique recommended for any case in the clinical setting. However, due to a higher radiation dose and a higher economic cost, it should be restricted to selected cases.
The variance in precision of mandible markers indicated that these measurements should not be used as diagnostic or treatment guidance without other clinical recordings.
Based on the small advantage in time consumption for the 3D technique in the planning phase, and the advantage for the 2D technique in economic costs, recommendations tend to deviate. This could imply that environmental factors, such as a budget of an Oral- and Maxillofacial department, or the level of workload, would lead to different results when choosing a system. Taking the initial investment cost into the comparison leads to even greater differences in economic costs, but that difference is decreasing as a result of increased number of treated patients.
The improvement shown in HRQoL for both groups indicates that treatment of severe dentofacial deformities and malocclusions with orthognathic treatment could be recommended independent of which planning technique used.
On prediction in orthognathic surgery
76
7 FUTURE PERSPECTIVES Systematic evaluation of new techniques within health care tend to evolve slower compared to the invention and commercialization of them. To keep a high-quality level of evaluated modern health care methods in our service towards the patients, it must be an effort to scientifically evaluate all new techniques that creates an interest on the health care facility market. This must be the bottom line of efforts. However, the optimal goal would be a research level in health care professionals that are leading the inventions, thus providing the manufactures with the ideas. Through this collaboration the development of new techniques would be fruitful, where health care professionals provide the need and manufactures give the solutions.
From the present thesis, potential offspring could be foreseen in several future research projects:
• Further comparison between different planning techniques in orthognathic surgery treatment. Objective evaluation of the dento-facial aesthetic outcome by noninvolved persons from different backgrounds. Standardized judgment of differences in facial esthetics between photographs taken preoperatively and at 12-month follow-up.
• The accuracy of outcome compared to planning of direct transport of predicted movements in a 3D technique into navigation surgical technique. This evaluates the role of navigation technique in orthognathic surgery.
• Evaluation of the navigation technique in orthognathic surgery on its role of achieving correct position of the condylar head.
• Evaluation of the navigation technique in orthognathic surgery on its role of replacing the use of surgical templates.
• Evaluation of surgical precision by comparison of planning and outcome at one-week follow-up.
• Evaluation of printed surgical templates. New series of orthognathic surgery with the test group treated with printed templates and the control group with traditional dental-technician fabrication.
• Evaluation of the use of 3D photographs in combination with CBCT in prediction of orthognathic surgery. Comparison with the present material.

Martin Bengtsson
77
• Evaluation of the use of 3D photography in monitoring postoperative swelling after orthognathic surgical treatment.
On prediction in orthognathic surgery
78
ACKNOWLEDGEMENT The work, upon which this thesis is based, was conducted mainly in co-operation with the Department of Oral and Maxillofacial Surgery, the Sahlgrenska Academy, Gothenburg University and the Department of Oral and Maxillofacial Surgery, Skåne University Hospital, Lund. I would like to express my thankfulness and gratitude to all those who had contributed and have made this thesis possible. In particular I would like to thank:
My supervisors
Lars Rasmusson, PhD, professor and main supervisor, for accepting me as doctoral student, sharing experience and friendship. For guidance through this academic journey and being at hand 24-7.
Gert Wall, PhD, for encouraging discussions, for sharing your deep experience in cephalometry, for bearing with me even after retirement and last but not least for being a good friend.
Jonas Becktor, PhD, associate professor, for being a supporting side-kick, for sharing your experience within orthognathic surgery, academic writing and for opening possibilities for me to fulfill my research plans.
Lennart Greiff, PhD, professor, for valuable reflections, for encouraging and support, for willingness and good friendship.
My co-authors
Pernilla Larsson-Gran, PhD, for being a friend and colleague for many years, for sharing your unique experience within oral health related quality of life research and for letting me take advantage of your global contact net within this topic.
Patricia Miranda-Burgos, PhD, for initial research plans and start-up support, for being understanding and forbearing.
79
My valuable supporters
Mikael Korduner, my closest chief at the Department of Oral & Maxillofacial Surgery, for showing the patience and generosity required to meet the needs of having a part time doctoral student in your staff.
Helen Bergendorff, senior surgery dental nurse, for being by my side at work, day in and day out, for your struggle and patience, for our charred laughs and for bearing with both my presence and absence during this project.
The staff at the Department of Oral & Maxillofacial Surgery, University Hospital of Skåne, Lund, for working harder during my absence, for challenging discussions and inspiring me into new ideas of research.
Helena Johansson, PhD in statistics, for professional statistical support, for bearing with my not so deep knowledge of statistical analysis, for teaching me wisely and forbearing and for working over hours when needed.
Charlotta Englesson-Sahlström, former closest chief at the Department of Oral & Maxillofacial Surgery, for your encouragement, friendship and support.
The staff at the Department of Oral Radiology, University Hospital of Skåne, Lund, for your patience, support and interest in this project. For providing excellent radiographic material during all these years.
Louise Åkesson, PhD, for a notorious work with radiological measurements and evaluation of radiation doses for preparation to the ethical approval.
Boel Kullendorff, PhD, for sharing knowledge in the field of radiology, encouragement and advises.
Lars Weber, PhD, for professional support, sharing of your deep knowledge and guidance in radiation exposure measurements.
Agneta Marcusson, PhD, associate professor, for discussions, advise and suggestions in the early phase of the projects. For benchmarking, substantial help with photographic analyses and interest in the project.
Eva-Karin Korduner, PhD, For substantial help with photographic analyses and interest in the project.
Erica Bäck, for substantial help with photographic analyses and interest in the project. Last but not least for being a good friend and family.

On prediction in orthognathic surgery
80
Björn Olaisson, for substantial help with photographic analyses and interest in the project. For being my long-lasting mentor and last but not least for being a good friend.
Jens Larsson, for substantial help with photographic analyses and interest in the project. For being a friendly colleague in the reconstructive team and for interesting project discussions.
Jaime Gatenõ, PhD, professor and pioneer in the present research area, for your generosity as having me as your guest in Houston 2013. For inspiration and kindness to me and my family. For inspiring discussions during the project.
James Xia, PhD, professor and pioneer in the present research area, for your generosity and sharing inspiration during my visit in Houston 2013. For interesting discussions.
Maria Silfverschiöld, for sharing your experience in health care economics and for interesting discussions.
Sven Kreiborg, PhD, professor, for sharing your knowledge and for kind answers and benchmarking in this project.
My parents Inga and Kjell Bengtsson, for generosity, supporting, loving and caring.
My parents in law, Elsie and Ingvar Lennartsson, for generosity and friendship.
My children Josef, Simon and Ester, for giving me all your love, inspiration and joy.
My beloved wife Maria, for love, support and wisdom, for being my one and only soul mate and for bearing with me throughout our joined life.
Grants This thesis and the studies presented were made possible in part by personal grants to Martin Bengtsson from the Scandinavian Association of Oral and Maxillofacial Surgeons, from the Southern Region within the Swedish Dental Association and from the Swedish Association of Oral and Maxillofacial Surgeons.
81
REFERENCES
1. Gateno J, Xia JJ, Teichgraeber JF, Christensen AM, Lemoine JJ, Liebschner MA et al. Clinical feasibility of computer-aided surgical simulation (CASS) in the treatment of complex cranio-maxillofacial deformities. J Oral Maxillofac Surg 2007;65:728-734. 2. Tian K, Xue Z, Liu X, Wang X, Li Z. Recording and Transferring Head Positions to the Virtual Head Using a Multicamera System and Laser Level. J Oral Maxillofac Surg 2015;73:2039 e2031-2039 e2013. 3. Xia JJ, Gateno J, Teichgraeber JF, Yuan P, Chen KC, Li J et al. Algorithm for planning a double-jaw orthognathic surgery using a computer-aided surgical simulation (CASS) protocol. Part 1: planning sequence. Int J Oral Maxillofac Surg 2015;44:1431-1440. 4. Xia JJ, Gateno J, Teichgraeber JF, Yuan P, Li J, Chen KC et al. Algorithm for planning a double-jaw orthognathic surgery using a computer-aided surgical simulation (CASS) protocol. Part 2: three-dimensional cephalometry. Int J Oral Maxillofac Surg 2015;44:1441-1450. 5. Angle EH. Some studies in occlusion. Angle Orthod 1968;38:79-81. 6. Hullihen SP. Case of elongation of underjaw and distortion of face and neck, caused by burn, successfully treated. Am J Dent Surg 1849;9:157. 7. Obwegeser H. The Indications for Surgical Correction of Mandibular Deformity by the Sagittal Splitting Technique. Br J Oral Surg 1964;1:157-171. 8. Wassmund M. Frakturen und Luxationen des Gesichtschades: Verlag von Herrmann Meuser.; 1927. 9. Bell WH. Le Forte I osteotomy for correction of maxillary deformities. J Oral Surg 1975;33:412-426. 10. Moorrees CF. Twenty centuries of cephalometry. In: Jacobsen A, editor. Roentgenographic cephalometry. Chicago: Quintessence; 1995. p. 17-35. 11. Broadbent BH. A new X-ray technique and its application to orthodontia. Angle Orthod 1931;19:93-114. 12. Wahl N. Orthodontics in 3 millennia. Chapter 8: The cephalometer takes its place in the orthodontic armamentarium. Am J Orthod Dentofacial Orthop 2006;129:574-580. 13. Downs WB. Variations in facial relationships; their significance in treatment and prognosis. Am J Orthod 1948;34:812-840. 14. Moorrees CF. Natural head position--a revival. Am J Orthod Dentofacial Orthop 1994;105:512-513. 15. Moorrees CF, Gron AM. Principles of orthodontic diagnosis. Angle Orthod 1966;36:258-262. 16. Moorrees CFK, M.R. Natural head position, a basic consideration in the interpretation of cephalometric radiographs. Am J Phys Anthropol 1958;16:213-234.
On prediction in orthognathic surgery
82
17. Ricketts RM. The evolution of diagnosis to computerized cephalometrics. Am J Orthod 1969;55:795-803. 18. Schendel SA, Eisenfeld JH, Bell WH, Epker BN. Superior repositioning of the maxilla: stability and soft tissue osseous relations. Am J Orthod 1976;70:663-674. 19. Cousley RR, Grant E. The accuracy of preoperative orthognathic predictions. Br J Oral Maxillofac Surg 2004;42:96-104. 20. Westermark A, Zachow S, Eppley BL. Three-dimensional osteotomy planning in maxillofacial surgery including soft tissue prediction. J Craniofac Surg 2005;16:100-104. 21. Gateno J, Teichgraeber JF, Aguilar E. Computer planning for distraction osteogenesis. Plast Reconstr Surg 2000;105:873-882. 22. Gateno J, Teichgraeber JF, Xia JJ. Three-dimensional surgical planning for maxillary and midface distraction osteogenesis. J Craniofac Surg 2003;14:833-839. 23. Graber TM. Orthodontic therapy an exercise in decision making. Trans Eur Orthod Soc 1972:215-230. 24. Otuyemi OD, Jones SP. Methods of assessing and grading malocclusion: a review. Aust Orthod J 1995;14:21-27. 25. Baumrind S, Frantz RC. The reliability of head film measurements. 2. Conventional angular and linear measures. Am J Orthod 1971;60:505-517. 26. Baumrind S, Frantz RC. The reliability of head film measurements. 1. Landmark identification. Am J Orthod 1971;60:111-127. 27. Erkan M, Gurel HG, Nur M, Demirel B. Reliability of four different computerized cephalometric analysis programs. Eur J Orthod 2012;34:318-321. 28. Naoumova J, Lindman R. A comparison of manual traced images and corresponding scanned radiographs digitally traced. Eur J Orthod 2009;31:247-253. 29. Salzmann JA. Orthodontic planning in prepaid dental programs. Am J Orthod 1966;52:56-58. 30. Grummons D, Ricketts RM. Frontal cephalometrics: practical applications, part 2. World J Orthod 2004;5:99-119. 31. Grummons DC, Kappeyne van de Coppello MA. A frontal asymmetry analysis. J Clin Orthod 1987;21:448-465. 32. Kobayashi T, Ueda K, Honma K, Sasakura H, Hanada K, Nakajima T. Three-dimensional analysis of facial morphology before and after orthognathic surgery. J Craniomaxillofac Surg 1990;18:68-73. 33. Yitschaky O, Redlich M, Abed Y, Faerman M, Casap N, Hiller N. Comparison of common hard tissue cephalometric measurements between computed tomography 3D reconstruction and conventional 2D cephalometric images. Angle Orthod 2011;81:11-16. 34. Matsuno I, Kawakami M, Yamamura M, Ishikawa H, Kudou A, Nakamura S et al. [Three-dimensional morphological analysis for craniofacial deformity]. Nihon Kyosei Shika Gakkai Zasshi 1990;49:291-301.
83
35. Bailey L, Cevidanes LH, Proffit WR. Stability and predictability of orthognathic surgery. Am J Orthod Dentofacial Orthop 2004;126:273-277. 36. Claes P, Walters M, Clement J. Improved facial outcome assessment using a 3D anthropometric mask. Int J Oral Maxillofac Surg 2012;41:324-330. 37. Gateno J, Jajoo A, Nicol M, Xia JJ. The primal sagittal plane of the head: a new concept. Int J Oral Maxillofac Surg 2016;45:399-405. 38. Xia JJ, Gateno J, Teichgraeber JF, Christensen AM, Lasky RE, Lemoine JJ et al. Accuracy of the computer-aided surgical simulation (CASS) system in the treatment of patients with complex craniomaxillofacial deformity: A pilot study. J Oral Maxillofac Surg 2007;65:248-254. 39. Xia JJ, Gateno J, Teichgraeber JF. A new paradigm for complex midface reconstruction: a reversed approach. J Oral Maxillofac Surg 2009;67:693-703. 40. Troulis MJ, Everett P, Seldin EB, Kikinis R, Kaban LB. Development of a three-dimensional treatment planning system based on computed tomographic data. Int J Oral Maxillofac Surg 2002;31:349-357. 41. Tucker S, Cevidanes LH, Styner M, Kim H, Reyes M, Proffit W et al. Comparison of actual surgical outcomes and 3-dimensional surgical simulations. J Oral Maxillofac Surg 2010;68:2412-2421. 42. Van Hemelen G, Van Genechten M, Renier L, Desmedt M, Verbruggen E, Nadjmi N. Three-dimensional virtual planning in orthognathic surgery enhances the accuracy of soft tissue prediction. J Craniomaxillofac Surg 2015;43:918-925. 43. Chapuis J, Schramm A, Pappas I, Hallermann W, Schwenzer-Zimmerer K, Langlotz F et al. A new system for computer-aided preoperative planning and intraoperative navigation during corrective jaw surgery. IEEE Trans Inf Technol Biomed 2007;11:274-287. 44. Swennen GR, Mollemans W, Schutyser F. Three-dimensional treatment planning of orthognathic surgery in the era of virtual imaging. J Oral Maxillofac Surg 2009;67:2080-2092. 45. Swennen GR, Mollemans W, De Clercq C, Abeloos J, Lamoral P, Lippens F et al. A cone-beam computed tomography triple scan procedure to obtain a three-dimensional augmented virtual skull model appropriate for orthognathic surgery planning. J Craniofac Surg 2009;20:297-307. 46. Plooij JM, Maal TJ, Haers P, Borstlap WA, Kuijpers-Jagtman AM, Berge SJ. Digital three-dimensional image fusion processes for planning and evaluating orthodontics and orthognathic surgery. A systematic review. Int J Oral Maxillofac Surg 2011;40:341-352. 47. Moerenhout BA, Gelaude F, Swennen GR, Casselman JW, Van Der Sloten J, Mommaerts MY. Accuracy and repeatability of cone-beam computed tomography (CBCT) measurements used in the determination of facial indices in the laboratory setup. J Craniomaxillofac Surg 2009;37:18-23. 48. Sun Y, Luebbers HT, Agbaje JO, Schepers S, Vrielinck L, Lambrichts I et al. Accuracy of upper jaw positioning with intermediate splint fabrication after virtual planning in bimaxillary orthognathic surgery. J Craniofac Surg 2013;24:1871-1876.
On prediction in orthognathic surgery
84
49. Aboul-Hosn Centenero S, Hernandez-Alfaro F. 3D planning in orthognathic surgery: CAD/CAM surgical splints and prediction of the soft and hard tissues results - our experience in 16 cases. J Craniomaxillofac Surg 2012;40:162-168. 50. Gateno J, Xia J, Teichgraeber JF, Rosen A, Hultgren B, Vadnais T. The precision of computer-generated surgical splints. J Oral Maxillofac Surg 2003;61:814-817. 51. Stokbro K, Aagaard E, Torkov P, Bell RB, Thygesen T. Virtual planning in orthognathic surgery. Int J Oral Maxillofac Surg 2014;43:957-965. 52. Loh S, Heng JK, Ward-Booth P, Winchester L, McDonald F. A radiographic analysis of computer prediction in conjunction with orthognathic surgery. Int J Oral Maxillofac Surg 2001;30:259-263. 53. Hsu SS, Gateno J, Bell RB, Hirsch DL, Markiewicz MR, Teichgraeber JF et al. Accuracy of a computer-aided surgical simulation protocol for orthognathic surgery: a prospective multicenter study. J Oral Maxillofac Surg 2013;71:128-142. 54. Marchetti C, Bianchi A, Bassi M, Gori R, Lamberti C, Sarti A. Mathematical modeling and numerical simulation in maxillo-facial virtual surgery (VISU). J Craniofac Surg 2006;17:661-667; discussion 668. 55. Ackerman JL, Proffit WR. Communication in orthodontic treatment planning: bioethical and informed consent issues. Angle Orthod 1995;65:253-261. 56. Borah GL, Rankin MK. Appearance is a function of the face. Plast Reconstr Surg 2010;125:873-878. 57. Johnston C, Hunt O, Burden D, Stevenson M, Hepper P. Self-perception of dentofacial attractiveness among patients requiring orthognathic surgery. Angle Orthod 2010;80:361-366. 58. Berscheid E, Gangestad S. The social psychological implications of facial physical attractiveness. Clin Plast Surg 1982;9:289-296. 59. Salih FN, Lindsten R, Bagesund M. Perception of orthodontic treatment need among Swedish children, adolescents and young adults. Acta Odontol Scand 2017;75:407-412. 60. Silva I, Cardemil C, Kashani H, Bazargani F, Tarnow P, Rasmusson L et al. Quality of life in patients undergoing orthognathic surgery - A two-centered Swedish study. J Craniomaxillofac Surg 2016;44:973-978. 61. Kurabe K, Kojima T, Kato Y, Saito I, Kobayashi T. Impact of orthognathic surgery on oral health-related quality of life in patients with jaw deformities. Int J Oral Maxillofac Surg 2016;45:1513-1519. 62. Palomares NB, Celeste RK, Miguel JA. Impact of orthosurgical treatment phases on oral health-related quality of life. Am J Orthod Dentofacial Orthop 2016;149:171-181. 63. Murphy C, Kearns G, Sleeman D, Cronin M, Allen PF. The clinical relevance of orthognathic surgery on quality of life. Int J Oral Maxillofac Surg 2011;40:926-930.
85
64. Fardouly J, Diedrichs PC, Vartanian LR, Halliwell E. Social comparisons on social media: the impact of Facebook on young women's body image concerns and mood. Body Image 2015;13:38-45. 65. Arnett GW, Gunson MJ. Facial planning for orthodontists and oral surgeons. Am J Orthod Dentofacial Orthop 2004;126:290-295. 66. Hagglin C, Berggren U, Hakeberg M, Edvardsson A, Eriksson M. Evaluation of a Swedish version of the OHIP-14 among patients in general and specialist dental care. Swed Dent J 2007;31:91-101. 67. Larsson P. Methodological studies of orofacial aesthetics, orofacial function and oral health-related quality of life. Swed Dent J Suppl 2010:11-98. 68. Larsson P, John MT, Nilner K, Bondemark L, List T. Development of an Orofacial Esthetic Scale in prosthodontic patients. Int J Prosthodont 2010;23:249-256. 69. Larsson P, John MT, Nilner K, List T. Reliability and validity of the Orofacial Esthetic Scale in prosthodontic patients. Int J Prosthodont 2010;23:257-262. 70. Larsson P, John MT, Nilner K, List T. Normative values for the Oro-facial Esthetic Scale in Sweden. J Oral Rehabil 2014;41:148-154. 71. Larsson P, List T, Lundstrom I, Marcusson A, Ohrbach R. Reliability and validity of a Swedish version of the Oral Health Impact Profile (OHIP-S). Acta Odontol Scand 2004;62:147-152. 72. Brennan DS, Spencer AJ. Mapping oral health related quality of life to generic health state values. BMC Health Serv Res 2006;6:96. 73. Hulme C, Yu G, Browne C, O'Dwyer J, Craddock H, Brown S et al. Cost-effectiveness of silicone and alginate impressions for complete dentures. J Dent 2014;42:902-907. 74. Ohrbach R, Larsson P, List T. The jaw functional limitation scale: development, reliability, and validity of 8-item and 20-item versions. J Orofac Pain 2008;22:219-230. 75. Streiner DN, G. Cairney, J. Health Measurement Scales – a practical guide to their development and use. Oxford: Oxford University Press; 2014. 76. Swennen GR, Schutyser F. Three-dimensional cephalometry: spiral multi-slice vs cone-beam computed tomography. Am J Orthod Dentofacial Orthop 2006;130:410-416. 77. Stratis A, Zhang G, Lopez-Rendon X, Politis C, Hermans R, Jacobs R et al. Two examples of indication specific radiation dose calculations in dental CBCT and Multidetector CT scanners. Phys Med 2017;41:71-77. 78. Shrimpton PC, Jansen JT, Harrison JD. Updated estimates of typical effective doses for common CT examinations in the UK following the 2011 national review. Br J Radiol 2016;89:20150346. 79. Higgins AM, Harris AH. Health economic methods: cost-minimization, cost-effectiveness, cost-utility, and cost-benefit evaluations. Crit Care Clin 2012;28:11-24, v. 80. Mazzoni S, Badiali G, Lancellotti L, Babbi L, Bianchi A, Marchetti C. Simulation-guided navigation: a new approach to improve intraoperative
On prediction in orthognathic surgery
86
three-dimensional reproducibility during orthognathic surgery. J Craniofac Surg 2010;21:1698-1705. 81. Zinser MJ, Mischkowski RA, Sailer HF, Zoller JE. Computer-assisted orthognathic surgery: feasibility study using multiple CAD/CAM surgical splints. Oral Surg Oral Med Oral Pathol Oral Radiol 2012;113:673-687. 82. Bengtsson M, Wall G, Greiff L, Rasmusson L. Treatment outcome in orthognathic surgery-A prospective randomized blinded case-controlled comparison of planning accuracy in computer-assisted two- and three-dimensional planning techniques (part II). J Craniomaxillofac Surg 2017;45:1419-1424. 83. Bengtsson M, Wall G, Miranda-Burgos P, Rasmusson L. Treatment outcome in orthognathic surgery - A prospective comparison of accuracy in computer assisted two and three-dimensional prediction techniques. J Craniomaxillofac Surg 2017. 84. Dahlberg G. Standard error and medicine. Acta Genet Stat Med 1949;1:313-321. 85. Kaipatur N, Al-Thomali Y, Flores-Mir C. Accuracy of computer programs in predicting orthognathic surgery hard tissue response. J Oral Maxillofac Surg 2009;67:1628-1639. 86. Olszewski R, Tanesy O, Cosnard G, Zech F, Reychler H. Reproducibility of osseous landmarks used for computed tomography based three-dimensional cephalometric analyses. J Craniomaxillofac Surg 2010;38:214-221. 87. Stokbro K, Aagaard E, Torkov P, Bell RB, Thygesen T. Surgical accuracy of three-dimensional virtual planning: a pilot study of bimaxillary orthognathic procedures including maxillary segmentation. Int J Oral Maxillofac Surg 2016;45:8-18. 88. Michel G, Bisegger C, Fuhr DC, Abel T, group K. Age and gender differences in health-related quality of life of children and adolescents in Europe: a multilevel analysis. Qual Life Res 2009;18:1147-1157. 89. Grauer D, Cevidanes LS, Styner MA, Heulfe I, Harmon ET, Zhu H et al. Accuracy and landmark error calculation using cone-beam computed tomography-generated cephalograms. Angle Orthod 2010;80:286-294. 90. Xia JJ, Phillips CV, Gateno J, Teichgraeber JF, Christensen AM, Gliddon MJ et al. Cost-effectiveness analysis for computer-aided surgical simulation in complex cranio-maxillofacial surgery. J Oral Maxillofac Surg 2006;64:1780-1784. 91. Resnick CM, Inverso G, Wrzosek M, Padwa BL, Kaban LB, Peacock ZS. Is There a Difference in Cost Between Standard and Virtual Surgical Planning for Orthognathic Surgery? J Oral Maxillofac Surg 2016;74:1827-1833. 92. Wrzosek MK, Peacock ZS, Laviv A, Goldwaser BR, Ortiz R, Resnick CM et al. Comparison of time required for traditional versus virtual orthognathic surgery treatment planning. Int J Oral Maxillofac Surg 2016;45:1065-1069. 93. Cunningham SJ, Sculpher M, Sassi F, Manca A. A cost-utility analysis of patients undergoing orthognathic treatment for the management of dentofacial disharmony. Br J Oral Maxillofac Surg 2003;41:32-35.
87
94. Liu YT, Gravely JF. The reliability of the 'Ortho Grid' in cephalometric assessment. Br J Orthod 1991;18:21-27. 95. Gravely JF, Benzies PM. The clinical significance of tracing error in cephalometry. Br J Orthod 1974;1:95-101. 96. Wall G, Rosenquist B. Accuracy of cephalometry in measurements of postoperative migration of the maxilla after Le Fort I osteotomy. Int J Adult Orthodon Orthognath Surg 1996;11:105-115. 97. Stabrun AE, Danielsen K. Precision in cephalometric landmark identification. Eur J Orthod 1982;4:185-196. 98. Proffit WR, Turvey TA, Phillips C. The hierarchy of stability and predictability in orthognathic surgery with rigid fixation: an update and extension. Head Face Med 2007;3:21. 99. Berssenbrugge P, Berlin NF, Kebeck G, Runte C, Jung S, Kleinheinz J et al. 2D and 3D analysis methods of facial asymmetry in comparison. J Craniomaxillofac Surg 2014;42:e327-334. 100. Posnick JC, Wallace J. Complex orthognathic surgery: assessment of patient satisfaction. J Oral Maxillofac Surg 2008;66:934-942. 101. Nicodemo D, Pereira MD, Ferreira LM. Effect of orthognathic surgery for class III correction on quality of life as measured by SF-36. Int J Oral Maxillofac Surg 2008;37:131-134. 102. Stokbro K, Thygesen T. A 3-Dimensional Approach for Analysis in Orthognathic Surgery-Using Free Software for Voxel-Based Alignment and Semiautomatic Measurement. J Oral Maxillofac Surg 2017.

On prediction in orthognathic surgery
88
APPENDIX

89
OHIP-S

Käkkirurgiska kliniken
Postadress: Käkkirurgiska Kliniken, Skånes universitetssjukhus, 22185 Lund Telefon (växel): 046-17 11 00 Webb: www.skane.se/sus
Frågeformulär till dig som deltar i studie i samband med käkoperation
Hur ofta under det senaste året har Du upplevt följande situationer, p g a problem med Dina tänder, mun, proteser eller käkar?
Markera med ett kryss i den kolumn som bäst motsvarar Ditt svar. Markera med kryss i "E/T"-rutan om Du anser att frågan ej är tillämpbar för Dig.
E/T Utmärkt Mycket bra
Bra Ganska dålig
Dålig
1 Hur bedömer Du att Ditt allmänna hälsotillstånd är?
2 Hur bedömer Du att Din munhälsa är?
E/T Mycket ofta
Ganska ofta
Ibland Ganska sällan
Aldrig
3
Svårigheter med att tugga någon form av mat
4 Svårigheter med att uttala ord
5
Lagt märke till en tand som inte ser ut som den ska
6 Känt att Ditt utseende har påverkats
7 Känt att Du haft dålig andedräkt
8 Känt att smakförmågan har försämrats
9
Har haft mat som fastnat i tänderna eller proteserna
10
Känt att Din matsmältning har försämrats
11
Känt att Dina proteser inte har passat ordentligt
12 Har haft smärta i Din mun
13 Varit öm i käken

Käkkirurgiska kliniken
Postadress: Käkkirurgiska Kliniken, Skånes universitetssjukhus, 22185 Lund Telefon (växel): 046-17 11 00 Webb: www.skane.se/sus
2
E/T Mycket ofta
Ganska ofta
Ibland Ganska sällan
Aldrig
14 Har haft huvudvärk
15
Har haft känsliga tänder vid intag av varm eller kall mat eller dryck
16 Har haft tandvärk
17 Har haft smärtor i tandköttet
18 Har haft obehag med att äta mat
19 Har haft ömma ställen i munnen
20 Har haft obekväma proteser
21 Har varit oroad p g a tandproblem
22 Känt Dig osäker
23 Känt Dig eländig
24 Känt Dig besvärad med Ditt utseende
25 Känt Dig spänd
26 Funnit att Ditt tal varit otydligt
27
Personer har missuppfattat en del av de ord Du har sagt
28
Känt att det har varit mindre smak i maten
29 Inte kunnat borsta tänderna ordentligt
30
Har varit tvungen att undvika äta viss mat
31 Har haft en otillfredsställande kost
32 Har inte kunnat äta med Dina proteser
33 Undvikit att le
34 Har varit tvungen att avbryta måltider
35 Din sömn har blivit störd
36 Varit upprörd

Käkkirurgiska kliniken
Postadress: Käkkirurgiska Kliniken, Skånes universitetssjukhus, 22185 Lund Telefon (växel): 046-17 11 00 Webb: www.skane.se/sus
3
E/T Mycket
ofta
Ganska ofta
Ibland Ganska sällan
Aldrig
37 Haft svårt att koppla av
38 Känt Dig deprimerad
39 Din koncentration har påverkats
40 Blivit generad
41 Undvikit att gå ut
42
Varit mindre tolerant mot Din make/maka eller familj
43
Haft besvär med att komma överens med andra människor
44 Varit något irriterad på andra människor
45
Haft svårighet med att utföra de vardagliga sysslorna
46 Känt att Din allmänhälsa har försämrats
47 Lidit någon ekonomisk förlust
48
Har varit oförmögen med att uppskatta andra människors sällskap
49
Känt att livet i allmänhet har varit mindre tillfredsställande
50 Varit totalt oförmögen att fungera
51 Har Du varit oförmögen att arbeta fullt ut
______________________________ _______________________________________
Datum Namnunderskrift
_______________________________________
Namnförtydligande

On prediction in orthognathic surgery
90
JFLS
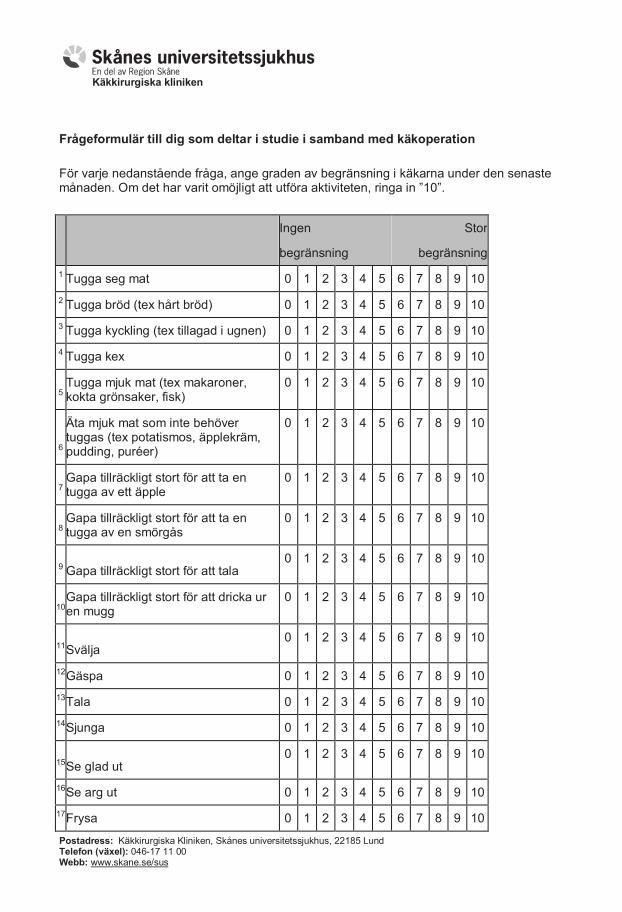
Käkkirurgiska kliniken
Postadress: Käkkirurgiska Kliniken, Skånes universitetssjukhus, 22185 Lund Telefon (växel): 046-17 11 00 Webb: www.skane.se/sus
Frågeformulär till dig som deltar i studie i samband med käkoperation
För varje nedanstående fråga, ange graden av begränsning i käkarna under den senaste månaden. Om det har varit omöjligt att utföra aktiviteten, ringa in ”10”.
Ingen
begränsning
Stor
begränsning
1 Tugga seg mat 0 1 2 3 4 5 6 7 8 9 10
2 Tugga bröd (tex hårt bröd) 0 1 2 3 4 5 6 7 8 9 10
3 Tugga kyckling (tex tillagad i ugnen) 0 1 2 3 4 5 6 7 8 9 10
4 Tugga kex 0 1 2 3 4 5 6 7 8 9 10
5
Tugga mjuk mat (tex makaroner, kokta grönsaker, fisk)
0 1 2 3 4 5 6 7 8 9 10
6
Äta mjuk mat som inte behöver tuggas (tex potatismos, äpplekräm, pudding, puréer)
0 1 2 3 4 5 6 7 8 9 10
7
Gapa tillräckligt stort för att ta en tugga av ett äpple
0 1 2 3 4 5 6 7 8 9 10
8
Gapa tillräckligt stort för att ta en tugga av en smörgås
0 1 2 3 4 5 6 7 8 9 10
9 Gapa tillräckligt stort för att tala
0 1 2 3 4 5 6 7 8 9 10
10
Gapa tillräckligt stort för att dricka ur en mugg
0 1 2 3 4 5 6 7 8 9 10
11 Svälja
0 1 2 3 4 5 6 7 8 9 10
12 Gäspa 0 1 2 3 4 5 6 7 8 9 10
13 Tala 0 1 2 3 4 5 6 7 8 9 10
14 Sjunga 0 1 2 3 4 5 6 7 8 9 10
15 Se glad ut
0 1 2 3 4 5 6 7 8 9 10
16 Se arg ut 0 1 2 3 4 5 6 7 8 9 10
17 Frysa 0 1 2 3 4 5 6 7 8 9 10

Käkkirurgiska kliniken
Postadress: Käkkirurgiska Kliniken, Skånes universitetssjukhus, 22185 Lund Telefon (växel): 046-17 11 00 Webb: www.skane.se/sus
2
Ingen
begränsning
Stor
begränsning
18 Kyssas 0 1 2 3 4 5 6 7 8 9 10
19 Le 0 1 2 3 4 5 6 7 8 9 10
20 Skratta 0 1 2 3 4 5 6 7 8 9 10
______________________________ _______________________________________
Datum Namnunderskrift
_______________________________________
Namnförtydligande

91
OES-S
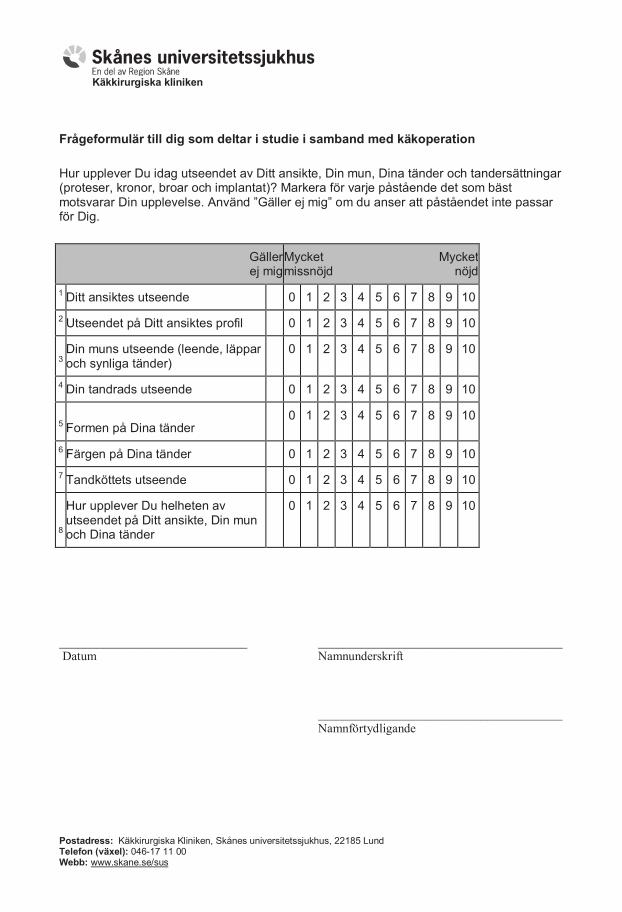
Käkkirurgiska kliniken
Postadress: Käkkirurgiska Kliniken, Skånes universitetssjukhus, 22185 Lund Telefon (växel): 046-17 11 00 Webb: www.skane.se/sus
Frågeformulär till dig som deltar i studie i samband med käkoperation
Hur upplever Du idag utseendet av Ditt ansikte, Din mun, Dina tänder och tandersättningar (proteser, kronor, broar och implantat)? Markera för varje påstående det som bäst motsvarar Din upplevelse. Använd ”Gäller ej mig” om du anser att påståendet inte passar för Dig.
Gäller ej mig
Mycket missnöjd
Mycket nöjd
1 Ditt ansiktes utseende 0 1 2 3 4 5 6 7 8 9 10
2 Utseendet på Ditt ansiktes profil 0 1 2 3 4 5 6 7 8 9 10
3
Din muns utseende (leende, läppar och synliga tänder)
0 1 2 3 4 5 6 7 8 9 10
4 Din tandrads utseende 0 1 2 3 4 5 6 7 8 9 10
5 Formen på Dina tänder
0 1 2 3 4 5 6 7 8 9 10
6 Färgen på Dina tänder 0 1 2 3 4 5 6 7 8 9 10
7 Tandköttets utseende 0 1 2 3 4 5 6 7 8 9 10
8
Hur upplever Du helheten av utseendet på Ditt ansikte, Din mun och Dina tänder
0 1 2 3 4 5 6 7 8 9 10
______________________________ _______________________________________
Datum Namnunderskrift
_______________________________________
Namnförtydligande