Automated quality-assessment for UML models in ... - GUPEA
84
Automated quality-assessment for UML models in open source projects Master’s thesis in Software engineering BASSEM HUSSEIN Department of Software Engineering CHALMERS UNIVERSITY OF TECHNOLOGY UNIVERSITY OF GOTHENBURG Gothenburg, Sweden 2019
-
Upload
khangminh22 -
Category
Documents
-
view
2 -
download
0
Transcript of Automated quality-assessment for UML models in ... - GUPEA

Automated quality-assessment for UMLmodels in open source projectsMaster’s thesis in Software engineering
BASSEM HUSSEIN
Department of Software EngineeringCHALMERS UNIVERSITY OF TECHNOLOGYUNIVERSITY OF GOTHENBURGGothenburg, Sweden 2019


Master’s thesis 2019
Automated quality-assessment forUML models in open source projects
BASSEM HUSSEIN
Department of Software EngineeringChalmers University of Technology
University of GothenburgGothenburg, Sweden 2019

Automated quality-assessment for UML models in open source projectsBASSEM HUSSEIN
© BASSEM HUSSEIN, 2019.
Supervisor: Michel Chaudron, Department of Software EngineeringSupervisor: Truong Ho-Quang, Department of Software EngineeringExaminer: Jennifer Horkoff, Department of Software Engineering
Master’s Thesis 2019Department of Software EngineeringChalmers University of Technology and University of GothenburgSE-412 96 GothenburgTelephone +46 31 772 1000
Gothenburg, Sweden 2019
iv

Automated quality-assessment for UML models in open source projectsBassem HusseinDepartment of Software EngineeringChalmers University of Technology and University of Gothenburg
AbstractUnified Modelling Language (UML) provides the facility for software engineers tospecify, construct, visualize, and document the artifacts of a software system and tofacilitate communication of ideas [1, 2]. It is shown in many studies [9, 14, 16] thatthe quality of UML models has an impact on the quality of software systems. It isnot easy, and often a time-consuming task to maintain a good quality of UML mod-els throughout the development process. For that reason, in many projects, UMLmodels are left outdated as the projects go on. This will lead to a gap between thesoftware design (reflected in UML models) and the actual implementation [4]. Thegoal of this thesis is to automate the process of assessing the quality of UML modelsin open source projects. We chose the design science research methodology to carryout this thesis to achieve the thesis goal. The result of this thesis is UML-Ninja,which is a web tool that can automatically assess the quality of UML models inopen source projects based on metrics and rules. The resulted tool (UML-Ninja)was evaluated based on 15 interviews with researchers, students, and practitioners.Researchers, students, and practitioners found UML-Ninja and the automated ap-proach behind it can help them to obtain a better assessment of UML models qualityas well as improving the quality of UML models.
Keywords: UML, Quality metrics, Quality assessment, Automation, FOSS.
v


AcknowledgementsI would like to express my heartfelt gratitude to my supervisors Michel Chaudronand Truong Ho-Quang, for guiding me and supporting me throughout the thesis.The constant feedback that i received from them during the thesis helped me alot. I would like to extend my gratitude to my examiner, Jennifer Horkoff, and hervaluable comments. I would also like to thank all the participants that participatedin the interviews. Their feedback was really valuable to and critical for this thesis.
Bassem Hussein, Gothenburg, May 2019
vii


Contents
List of Figures xiii
List of Tables xv
1 Introduction 11.1 Statement of the problem . . . . . . . . . . . . . . . . . . . . . . . . 21.2 Research questions . . . . . . . . . . . . . . . . . . . . . . . . . . . . 41.3 Purpose of the study . . . . . . . . . . . . . . . . . . . . . . . . . . . 41.4 Disposition . . . . . . . . . . . . . . . . . . . . . . . . . . . . . . . . 5
2 Background and related work 62.1 Identifying UML models from open source project . . . . . . . . . . . 62.2 Classifying and extracting data from UML models . . . . . . . . . . . 62.3 UML models quality . . . . . . . . . . . . . . . . . . . . . . . . . . . 7
3 Research methodology 113.1 Awareness of the problem . . . . . . . . . . . . . . . . . . . . . . . . 123.2 Suggested design . . . . . . . . . . . . . . . . . . . . . . . . . . . . . 133.3 Development . . . . . . . . . . . . . . . . . . . . . . . . . . . . . . . 133.4 Evaluation . . . . . . . . . . . . . . . . . . . . . . . . . . . . . . . . . 13
3.4.1 Procedure . . . . . . . . . . . . . . . . . . . . . . . . . . . . . 143.5 Conclusion . . . . . . . . . . . . . . . . . . . . . . . . . . . . . . . . . 19
4 Design and Implementation of UML-Ninja 204.1 Data collection . . . . . . . . . . . . . . . . . . . . . . . . . . . . . . 20
4.1.1 Identifying potential UML files . . . . . . . . . . . . . . . . . 204.1.2 Filtering UML files . . . . . . . . . . . . . . . . . . . . . . . . 22
4.2 Data analysis . . . . . . . . . . . . . . . . . . . . . . . . . . . . . . . 234.2.1 Data extraction . . . . . . . . . . . . . . . . . . . . . . . . . . 234.2.2 Quality Metrics calculator . . . . . . . . . . . . . . . . . . . . 234.2.3 RESTful API interface . . . . . . . . . . . . . . . . . . . . . . 24
4.3 Data presentation . . . . . . . . . . . . . . . . . . . . . . . . . . . . . 244.3.1 Repositories list page . . . . . . . . . . . . . . . . . . . . . . . 264.3.2 Repository page . . . . . . . . . . . . . . . . . . . . . . . . . . 27
4.3.2.1 Repository information . . . . . . . . . . . . . . . . . 284.3.2.2 Commit history box: . . . . . . . . . . . . . . . . . . 284.3.2.3 "Issues to watch out for" box . . . . . . . . . . . . . 29
ix

Contents
4.3.2.4 UML process . . . . . . . . . . . . . . . . . . . . . . 294.3.2.5 UML content . . . . . . . . . . . . . . . . . . . . . . 294.3.2.6 UML files . . . . . . . . . . . . . . . . . . . . . . . . 30
4.3.3 UML (class diagram) page . . . . . . . . . . . . . . . . . . . . 304.3.3.1 class diagram information . . . . . . . . . . . . . . . 304.3.3.2 Metrics . . . . . . . . . . . . . . . . . . . . . . . . . 314.3.3.3 Classes . . . . . . . . . . . . . . . . . . . . . . . . . 32
4.3.4 Compare page . . . . . . . . . . . . . . . . . . . . . . . . . . . 334.3.5 Metrics definition page . . . . . . . . . . . . . . . . . . . . . . 33
5 Results 365.1 Iteration 0 . . . . . . . . . . . . . . . . . . . . . . . . . . . . . . . . . 36
5.1.1 Awareness of the problem . . . . . . . . . . . . . . . . . . . . 365.1.2 Suggested design . . . . . . . . . . . . . . . . . . . . . . . . . 365.1.3 Development . . . . . . . . . . . . . . . . . . . . . . . . . . . 375.1.4 Evaluation . . . . . . . . . . . . . . . . . . . . . . . . . . . . . 38
5.2 Iteration 1 . . . . . . . . . . . . . . . . . . . . . . . . . . . . . . . . . 385.2.1 Awareness of the problem . . . . . . . . . . . . . . . . . . . . 385.2.2 Design . . . . . . . . . . . . . . . . . . . . . . . . . . . . . . . 385.2.3 Development . . . . . . . . . . . . . . . . . . . . . . . . . . . 395.2.4 Evaluation . . . . . . . . . . . . . . . . . . . . . . . . . . . . . 395.2.5 Evaluation results . . . . . . . . . . . . . . . . . . . . . . . . . 40
5.2.5.1 Category: Use of UML . . . . . . . . . . . . . . . . . 405.2.5.2 Category: Assessing the quality of UML . . . . . . . 425.2.5.3 Category: Use of UML-Ninja . . . . . . . . . . . . . 425.2.5.4 Category: Advantages . . . . . . . . . . . . . . . . . 435.2.5.5 Category: Limitations . . . . . . . . . . . . . . . . . 45
5.2.6 Usability of UML-Ninja . . . . . . . . . . . . . . . . . . . . . 465.3 Iteration 2 . . . . . . . . . . . . . . . . . . . . . . . . . . . . . . . . . 47
5.3.1 Awareness of the problem . . . . . . . . . . . . . . . . . . . . 475.3.2 Design . . . . . . . . . . . . . . . . . . . . . . . . . . . . . . . 475.3.3 Development . . . . . . . . . . . . . . . . . . . . . . . . . . . 475.3.4 Evaluation . . . . . . . . . . . . . . . . . . . . . . . . . . . . . 475.3.5 Evaluation results . . . . . . . . . . . . . . . . . . . . . . . . . 48
5.3.5.1 Category: Use of UML . . . . . . . . . . . . . . . . . 485.3.5.2 Category: Assessing the quality of UML . . . . . . . 505.3.5.3 Category: Use of UML-Ninja . . . . . . . . . . . . . 515.3.5.4 Category: Advantages . . . . . . . . . . . . . . . . . 525.3.5.5 Category: Limitations . . . . . . . . . . . . . . . . . 53
5.3.6 Usability of UML-Ninja . . . . . . . . . . . . . . . . . . . . . 54
6 Discussion 566.1 Research questions . . . . . . . . . . . . . . . . . . . . . . . . . . . . 566.2 Threats to validity . . . . . . . . . . . . . . . . . . . . . . . . . . . . 60
6.2.1 Construct validity . . . . . . . . . . . . . . . . . . . . . . . . . 606.2.2 Internal validity . . . . . . . . . . . . . . . . . . . . . . . . . . 606.2.3 External validity . . . . . . . . . . . . . . . . . . . . . . . . . 61
x

Contents
6.3 Research Ethics . . . . . . . . . . . . . . . . . . . . . . . . . . . . . . 616.3.1 Informed consent . . . . . . . . . . . . . . . . . . . . . . . . . 616.3.2 Anonymity and confidentiality . . . . . . . . . . . . . . . . . . 616.3.3 Fraud . . . . . . . . . . . . . . . . . . . . . . . . . . . . . . . 61
7 Conclusion and Future work 637.1 Conclusion . . . . . . . . . . . . . . . . . . . . . . . . . . . . . . . . . 637.2 Future work . . . . . . . . . . . . . . . . . . . . . . . . . . . . . . . . 64
xi

Contents
xii

List of Figures
1.1 Software documentation . . . . . . . . . . . . . . . . . . . . . . . . . 3
2.1 Quality Model [16] . . . . . . . . . . . . . . . . . . . . . . . . . . . . 92.2 Relations between metrics and rules and characteristics [16] . . . . . . 10
3.1 Design Science Research Cycle [6] . . . . . . . . . . . . . . . . . . . . 113.2 SUS standard questions [29] . . . . . . . . . . . . . . . . . . . . . . . 173.3 SUS score ranking [32] . . . . . . . . . . . . . . . . . . . . . . . . . . 18
4.1 UML-Ninja components and connectors diagram . . . . . . . . . . . . 214.2 Formats for storing UML models [5] . . . . . . . . . . . . . . . . . . . 224.3 UML-Ninja sitemap . . . . . . . . . . . . . . . . . . . . . . . . . . . . 264.4 Repositories list page . . . . . . . . . . . . . . . . . . . . . . . . . . . 274.5 Repository page . . . . . . . . . . . . . . . . . . . . . . . . . . . . . . 284.6 Repository commit history chart . . . . . . . . . . . . . . . . . . . . . 294.7 UML files view . . . . . . . . . . . . . . . . . . . . . . . . . . . . . . 304.8 Class diagram information view . . . . . . . . . . . . . . . . . . . . . 314.9 Class diagram metrics view . . . . . . . . . . . . . . . . . . . . . . . 324.10 Classes view . . . . . . . . . . . . . . . . . . . . . . . . . . . . . . . . 334.11 Compare page . . . . . . . . . . . . . . . . . . . . . . . . . . . . . . . 344.12 Metrics definition page . . . . . . . . . . . . . . . . . . . . . . . . . . 35
5.1 Zero iteration design . . . . . . . . . . . . . . . . . . . . . . . . . . . 375.2 Iteration 1: Coding results for category: Use of UML . . . . . . . . . 415.3 Iteration 1: Coding results for category: Assessing the quality of UML 425.4 Iteration 1: Coding results for category: Use of UML-Ninja . . . . . . 435.5 Iteration 1: Coding results for category: Advantages . . . . . . . . . . 445.6 Iteration 1: Coding results for category: Limitations . . . . . . . . . . 455.7 Iteration 2: Coding results for category: Use of UML . . . . . . . . . 485.8 Iteration 2: Coding results for category: Assessing the quality of UML 505.9 Iteration 2: Coding results for category: Use of UML-Ninja . . . . . . 515.10 Iteration 2: Coding results for category: Advantages . . . . . . . . . . 525.11 Iteration 2: Coding results for category: Limitations . . . . . . . . . . 53
xiii

List of Figures
xiv

List of Tables
2.1 Metrics and Rules [16] . . . . . . . . . . . . . . . . . . . . . . . . . . 8
4.1 Metrics and rules supported by UML-Ninja . . . . . . . . . . . . . . . 25
5.1 Iteration 1 identified limitations . . . . . . . . . . . . . . . . . . . . . 465.2 Iteration 1: Average SUS scores . . . . . . . . . . . . . . . . . . . . . 465.3 Iteration 2 identified limitations . . . . . . . . . . . . . . . . . . . . . 545.4 Iteration 2: Average SUS scores . . . . . . . . . . . . . . . . . . . . . 55
xv

List of Tables
xvi

1Introduction
The software architecture (SA) of a system is the set of structures needed to reasonabout the system, which comprises software elements, relations among them, andproperties of both [17]. (SA) Provides an overview of the whole system, and itcontains the models and the design decisions that are made during the architecturedesign process. The SA design process is an essential and important part of thesoftware development process. SA models are often represented by Unified ModellingLanguage (UML) [3]. UML provides the facility for software engineers to specify,construct, visualize and document the artifacts of a software system and to facilitatecommunication of ideas [1, 2].
Maintaining a good quality of software UML models throughout the developmentprocess is not easy and often a time-consuming task. For that reason, in manyprojects, UML models are left outdated as the projects go on [5, 18]. This oftenleads to a gap between the software design (reflected in UML models) and theactual implementation [4]. It is shown in many studies [9, 14, 16] that quality ofsoftware design (UML models) has an impact on the quality of the software system.Therefore, we need to assess the quality of UML models. Moreover, to make theprocess easier and feasible, the process could be automated by developing a serviceor a tool that performs the quality-assessment of the UML models automatically.The quality assessment process will help in keeping track of the UML models duringthe software development process. If the quality assessment process is automated,it can be easily integrated as a step in the continuous integration (CI) chain or as apart of DevOps. This will help to assess how well UML models are and how it canbe improved through the development process.
The thesis aims to automatically assess the quality of the UML models in Free/OpenSource Software (FOSS). For commercial software development, the use of UMLmodels has been introduced and commonly accepted to be a part of the software de-velopment process. However, commercial projects are very reluctant to share modelsbecause they believe these reflect critical intellectual property and/or insight intotheir state of IT-affairs, which make it not easily accessible and challenging to study.In (FOSS) development, all the project artifacts are publicly accessible, which makesit more accessible and easier to study and collect data. (FOSS) Development charac-terized by dynamism and distributed workplaces, code remains the key developmentartifact [19]. Little is known about the use of UML in FOSS.
1

1. Introduction
Researches in the software modeling area have done some effort to collect exam-ples of UML models from (FOSS) project that use modeling, but the results areoften limited [21]. The work done by Hebig et al. [5] aims to systematically mineGitHub projects to answer the question when models if used, are created and up-dated throughout the whole project’s life-span. Hebig et al. [5] present a databasethat includes a list of 3 295 open source projects which include together 21 316UML models. However, Hebig et al. [5] work aim to identify UML models if usedin FOSS, and it doesn’t include assessing the quality of UML models.We aim to build a system that automatically assesses the quality of the UML models.We will name the system UML-Ninja. Such a tool could assist different stakeholdersin different cases of use in the software engineering field. By stakeholders, we meanpotential users who will take advantage of UML-Ninja. For example:
• Practitioners: A practitioner can be a software developer, tester, or solutionarchitect involved in a software project. As a practitioner, you would like tosee the current status of the project’s UML models quality and be able torecognize and rectify any issues with UML models.
• Student: As a student, you would like to check the quality of your UML modelsin your course projects so that you can improve it.
• Researcher: As a researcher, you would like to collect data for further researchand analysis or collect data regarding quality of UML models in softwareprojects for empirical studies. A researcher could also be wanting to compareone project with another in terms of what UML models are used and thequality of UML models.
UML-Ninja will be a web tool that will allow the different stakeholders to assess thequality of UML models in (FOSS) by presenting and visualizing the data collected ina dashboard. This is done by crawling and analyzing data from GitHub repositories,and according to quality assessment metrics, the tool will display an overview of theproject quality in terms of UML models. The quality check is on the model leveland not code level.
1.1 Statement of the problem
Software documentation consists of three main parts, user documentation, require-ments documentation, and software architecture design documentation (SAD), asshown in Figure 1.1. User documentation is about how the software is used, andit describes the software features and how it can be used to complete a specifictask. Requirement documentation contains what the software does or shall do. Itis produced and consumed by all the stakeholder. It is used more for communi-cation purposes throughout the development process between all the stakeholdersinvolved in the development process. Software architecture design documentation(SAD) describes how the software is structured [17], how the system is split intomultiple components, and how these components are connected and communicating.SAD should also contain all the design decision made and patterns used to constructsuch software. Some practices can be used to create SAD such as the use of text
2

1. Introduction
documentation and UML models, updating and versioning, naming conventions andnavigation.
Figure 1.1: Software documentation
This thesis focus will be the SAD and more specifically, the UML models. Thestudy aims to automatically perform the quality assessment for UML models inopen source projects. Our goal can be achieved by developing a system that canperform the quality assessment process automatically on a given project. To be ableto develop the desired system, we shall have to tackle some problems on the way.Firstly, mining open sources projects repositories to extract UML models files is adifficult and complicated process. Extracting data from UML files to be able toevaluate it is a complex process. UML files can be stored in many different formats,e.g., images or XMI based files; these formats can also include other information thanmodels. Research efforts [5, 20] have been made to tackle each problem separately,but they are not integrated into one system. Secondly, the quality assessment ofUML models is a challenge itself. Some research efforts have been made to tacklethis challenge, for example, the work done by Chaudron et al. [16], which presents aquality model for managing UML-based software development. This model enablesidentifying the need for actions for quality improvement already in the early stagesof the life-cycle.The first major challenge of this thesis is to build a system that integrates the worksthat have been done into one system and adding more functionality to make theautomated quality assessment process possible. The second major challenge is toevaluate the usefulness of such a system to different stakeholders (e.g., researchers,students, practitioners). Since the system doesn’t exist, so there was no evaluationdone before.
3

1. Introduction
1.2 Research questions
This section presents the research questions (RQ) this thesis is answering. The re-search questions consist of three main questions; the first RQ is divided into threesub-questions (SQ). The research questions are formulated as follows:
• RQ1: How to automatically assess the quality of UML modelling in opensource projects?– SQ1.1: How to assess the quality of UML models?– SQ1.2: How to assess the quality of use of UML models in software
development processes?– SQ1.3: How to visualize feedback to different stakeholders with a given
result of quality metrics?• RQ2: Can metrics and feedback provided by UML-Ninja help the stakeholders
(e.g., researchers, students, practitioners) to obtain a better assessment of thequality of UML models?
• RQ3: What are stakeholders (e.g. researchers, students, practitioners) per-ceptions of the use of UML-Ninja in improving the quality of UML models?
The scope of RQ1 refers to the automated process of assessing the quality of UMLmodels. RQ1 is complemented by three SQ. The first SQ is scoped towards how canwe assess the quality of UML models using metrics and rules that can be automati-cally calculated given the data collected from FOSS repositories. The second SQ isscoped towards assessing the quality of the UML process in software projects. UMLprocess includes e.g., contribution ratio to see how many people actively contributeto UML. The third SQ is scoped towards the feedback that can be provided to dif-ferent stakeholders using the results calculated from the metrics and rules that areautomatically calculated.In RQ2, we aim to answer if the feedback provided by the system could help stake-holders to make a better assessment of the quality of UML models.The scope of RQ2 refers to stakeholders perceptions of UML-Ninja as a tool thatcan help to improve the quality of UML models given the feedback provided by thesystem.
1.3 Purpose of the study
The purpose of the study is making the quality assessments process of UML modelseasier and more feasible by developing online service for performing the quality-assessment process (UML-Ninja).The study will also report the usefulness of the UML-Ninja for different stakeholders(e.g., researchers, students, practitioners) by allowing them to evaluate the useful-ness and the usability of tools.
4

1. Introduction
1.4 DispositionThis document provides the reader with a comprehensive description of the thesisresearch. In the remainder of this document, we present the background and relatedwork related to the subject of the thesis in chapter 2. Following that in chapter3, we present the methodology we used to conduct the research. Next, we presentthe results for the design science iterations in chapter 5. Following that chapter,we present the design and implementation of the system (UML-Ninja) developedas a part of the thesis in chapter 4. The discussion and reflection of the researchquestions and the relevant threats to validity are presented in chapter 6 — finally,The conclusion and future work in chapter 7.
5

2Background and related work
This chapter discusses the background and related work about the quality assess-ment of UML models. The problem of automatically performing quality assessmentfor UML models is divided into sub-problems in this section; we will list each iden-tified related work for each sub-problem.
2.1 Identifying UML models from open sourceproject
Identification and comprehension of UML models in (FOSS), Reggio et al. [7] inves-tigated the types of UML diagrams used based on diverse available resources such asonline books, university courses, tutorials, or modeling tools but this work was donemainly manually. On the other hand, Karasneh et al. [7] use a crawling approachto fill an online repository with model images automatically.But the work mentioned above focused on repositories that include just UML modelsthese repositories were created for teaching purposes, so these repositories seldominclude other artifacts than the models, making it impossible to study the modelsin the environment of actual projects.The work done by Hebig et al. [5], is the closest one towards an automated system toidentify UML models in (FOSS) by systematically mining GitHub projects to extractUML models (if used) and find when they were created and updated throughout thewhole project’s life-cycle. As a result of their work, they created a database calledLindholmen DB [15]. Lindholmen DB includes a list of all projects with a summaryper project, including the number of identified UML files and the file format (.xmi,.uml, .jpg, .jpeg, .svg, .bmp, .gif, or .png) of the UML files in each project. It alsoincludes a list of links to all identified UML files. This work will be used as a part ofUML-Ninja to retrieve UML models from (FOSS) repositories to be able to performthe quality assessment process. The UML retrieval process in Lindholmen DB isnot completely automated; some parts of the retrieval process are done manually.However, our aim with UML-Ninja is to make the retrieval process automatically.
2.2 Classifying and extracting data from UMLmodels
UML models can be stored in many different formats, e.g. images or XMI based files.Classifying and extracting data from XMI or UML formats is not a big challenge
6

2. Background and related work
since they are XML based formats. However, classifying and extracting data fromimages is a difficult and complicated process to perform. Firstly regarding classifyingUML models from image formats, Ho-Quang et al. [22] investigate image featuresthat can be effectively used to classify images as class diagrams. Ho-Quang et al.[22] use an automatic learning approach with a training set of 1300 images, and witha success rate (90%-95%). Ho-Quang et al. [22] work will be used as a part of theUML-Ninja tool to classify UML models from images.Secondly, regarding extracting UML models data from image formats, Karasneh etal. [20] have published research to tackle this problem. They created a tool calledImg2UML [20] that can extract UML class models from pixmap images and exportsthem into XMI files that can be read by a commercial CASE tool. Karasneh et al.[20] reported that the accuracy of the "Img2UML" system is: 95% for rectanglesclasses, 80% for relationships and 92% for text recognition.However, they do not use an automatic learning approach, but a fixed set of clas-sification criteria. In this sense, the "IMG2UML" tool will be a part of the desiredsystem to make the quality assessment process possible.
2.3 UML models qualityThe quality of UML models has an impact on the quality of software systems, andit is shown in many studies. For example, the work of Ariadi (Chapter 6) [14] ex-plained the link between the level of details (LOD) in UML and the defect density.Ariadi used two types of UML models, which is class diagrams and sequence di-agram in the study because they are the most commonly used. Ariadi concludedthat there is a significant correlation between (LOD) in UML and the defect densityof the associated implementation classes, the classes that have higher LOD tend tohave a lower defect density in their implementation. The work of Ariadi et al. [9]also prove that the use of UML modeling potentially reduces the defect density inthe software system.
The impact of UML models on the quality of software systems is the main mo-tivation to perform a quality assessment on UML models. Therefore, metrics andrules have to be applied to UML models to make it possible to determine the qual-ity of UML models. The work of Chaudron et al. [16] proposed a quality modelfor UML models. This model considers the different uses of models in a projectas well as the phase in which a model is used as shown in Figure 2.1. This modelenables identifying the need for actions for quality improvement, by analyzing theUML models using metrics/rules suggested by the quality model. Actions can beidentified to improve the UML model quality according to the results of applyingthe UML models metrics/rules. The quality model is divided into a three-level de-compositional structure as shown in Figure 2.1. The first level of the quality modelis the primary use of the artifact either in the development phase or in the main-tenance phase. The second level of the quality model contains the purposes of theartifact it describes why the artifact is used. These purposes are related to differentphases in the life-cycle of the product. The third level of the quality model containsthe inherent characteristics of the artifact. The characteristics concepts of the qual-
7

2. Background and related work
Name Description Ref
Ratios Ratios between number of elements(e.g. number of methods per class) [16]
DIT Depth of Inheritance Tree [11, 12]Coupling The number of other classes a class is related to. [11]
Cohesion Measures the extent to which partsof a class are needed to perform a single task [11]
Class Complexity The effort required to understand a class [10]
Fan-InThe number of incoming association relations of a class.Measures the extent to which other classes usethe class provided services.
[16]
Fan-OutThe number of outgoing association relations of a class.Measures the extent to which the class usesservices provided by other classes.
[16]
Naming Conventions Adherence to naming conventionsDesign Patterns Adherence to design patternsNCL Number of crossing lines in a diagram [13]
Multi defs. Multiple definitions of an element (e.g. class)under the same name. [16]
Comment Measures the extent to which the model contains comment.Example: lines of comment per class. [16]
Table 2.1: Metrics and Rules [16]
ity model cannot be measured directly from the artifact. The characteristics canbe measured by a set of metrics/rules that are related to each characteristic. Thequality model relates the third level that present characteristics to a set metrics andrules as shown in Figure 2.2.Several efforts have been made to produce meaningful metrics and rules that couldmeasure the quality of UML models. Figure 2.2 list some of these metrics andrules in relation to relevant quality characteristics of UML models. The metricsand rules used in Ninja-UML should be quantifiable. Table 2.1 shows the list ofmetrics/rules, their definition and prior works that have provided a way to calcu-late the metrics/rules. The availability of these metrics in UML-Ninja, however,depends on the type of data that Lindholmen DB [5] (the database we shall buildour system upon) can provide. Some of these metrics/rules that are listed in Table2.1 can be hard to measure with the data provided by Lindholmen DB. For example,quantifying number of cross lines in a diagram might be challenging, as LindholmenDB does not offer any information about this. Design pattern might be difficult toquantify as well, since Lindholmen DB seems not to store multiplicity of association.
Regarding the automatic assessment of UML models, SDMetrics [23] is an object-oriented design measurement tool used to measure the structural properties of UMLmodels. It provides a big catalog of UML metrics and rules. We believe that SD-Metrics is a powerful tool, but it has some limitations. SDMetrcis only supportUML files in XMI format. It only presents the metrics information of a UML filein the form of tables and histograms. Furthermore, it does not allow the user tovisualize multiple UML files simultaneously to make it easier for the user to comparethem. It does not facilitate the process of automatically identifying UML files; the
8

2. Background and related work
user is required to pick the desired file for the tool to analyze explicitly. Addition-ally, SDMetrics is only focused on the content of UML models; it does not focuson the UML process. SDMetrics does not provide metrics for UML process, suchas UML commit ratio or contributor ratio. With UML-Ninja we will try to tacklethe identified limitations for SDMetrcis. UML-Ninja aims to automate the processof identifying and assessing the quality of UML models with minimal interactionfrom the user. Furthermore, we aim to support more UML formats not only XMIas well as allowing the user to work with multiple UML files simultaneously. WithUML-Ninja we will focus on both UML content and UML process metrics.
Figure 2.1: Quality Model [16]
9

2. Background and related work
Figure 2.2: Relations between metrics and rules and characteristics [16]
10

3Research methodology
This chapter explains the methodology of this research. Along with the researchmethodology, we also discuss how we obtained the research questions and how thisresearch is carried out to address them.
Figure 3.1: Design Science Research Cycle [6]
The research methodology that we follow in this thesis is the design science researchmethodology [6]. The design science methodology helps in addressing unsolved andimportant problems in new and innovative ways. Therefore, we chose the designscience research methodology for this thesis research, which enables us to developand study the approach of the automated quality assessments of UML models. Thisdesign science research method consists of the following activities: awareness of theproblem suggested design, development, evaluation, and conclusion, as shown inFigure 3.1. In this thesis, we followed the steps presented in Figure 3.1 in threeiterations. After the evaluation step for each iteration, the feedback collected wereanalyzed, and we started a new iteration by identifying new problems and enhance-ments from the feedback received. In the first iteration, we investigated possible
11
3. Research methodology
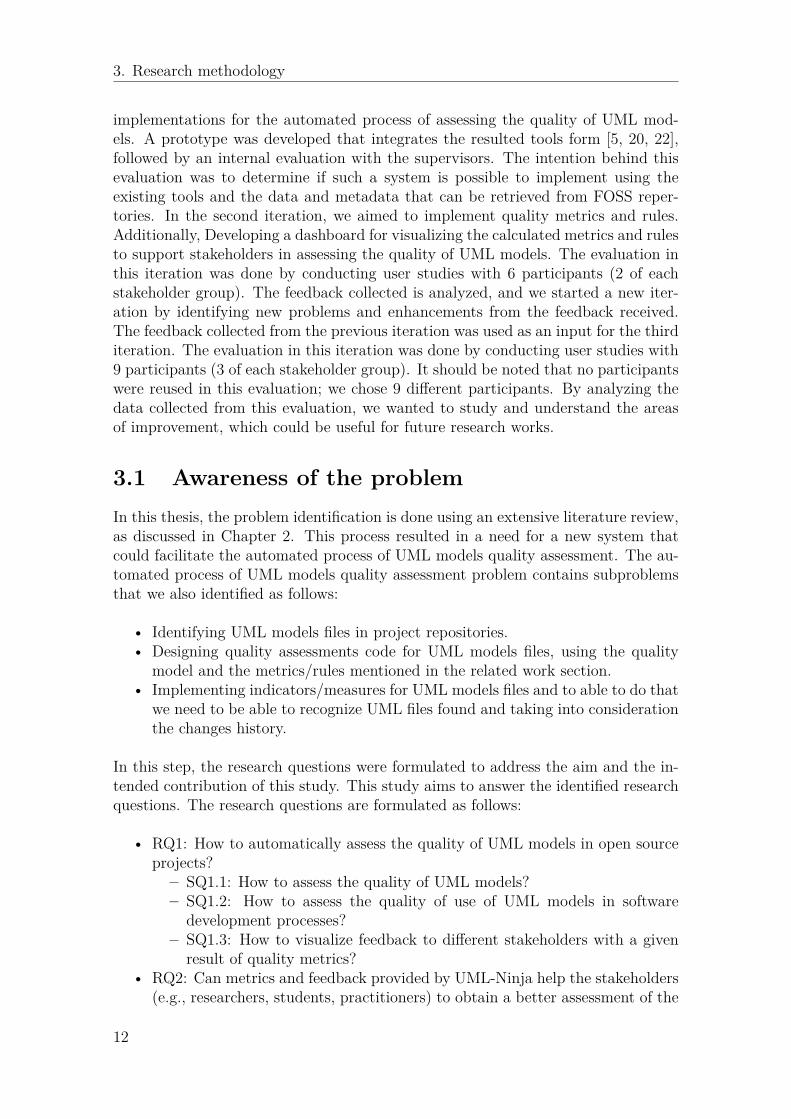
implementations for the automated process of assessing the quality of UML mod-els. A prototype was developed that integrates the resulted tools form [5, 20, 22],followed by an internal evaluation with the supervisors. The intention behind thisevaluation was to determine if such a system is possible to implement using theexisting tools and the data and metadata that can be retrieved from FOSS reper-tories. In the second iteration, we aimed to implement quality metrics and rules.Additionally, Developing a dashboard for visualizing the calculated metrics and rulesto support stakeholders in assessing the quality of UML models. The evaluation inthis iteration was done by conducting user studies with 6 participants (2 of eachstakeholder group). The feedback collected is analyzed, and we started a new iter-ation by identifying new problems and enhancements from the feedback received.The feedback collected from the previous iteration was used as an input for the thirditeration. The evaluation in this iteration was done by conducting user studies with9 participants (3 of each stakeholder group). It should be noted that no participantswere reused in this evaluation; we chose 9 different participants. By analyzing thedata collected from this evaluation, we wanted to study and understand the areasof improvement, which could be useful for future research works.
3.1 Awareness of the problemIn this thesis, the problem identification is done using an extensive literature review,as discussed in Chapter 2. This process resulted in a need for a new system thatcould facilitate the automated process of UML models quality assessment. The au-tomated process of UML models quality assessment problem contains subproblemsthat we also identified as follows:
• Identifying UML models files in project repositories.• Designing quality assessments code for UML models files, using the quality
model and the metrics/rules mentioned in the related work section.• Implementing indicators/measures for UML models files and to able to do that
we need to be able to recognize UML files found and taking into considerationthe changes history.
In this step, the research questions were formulated to address the aim and the in-tended contribution of this study. This study aims to answer the identified researchquestions. The research questions are formulated as follows:
• RQ1: How to automatically assess the quality of UML models in open sourceprojects?– SQ1.1: How to assess the quality of UML models?– SQ1.2: How to assess the quality of use of UML models in software
development processes?– SQ1.3: How to visualize feedback to different stakeholders with a given
result of quality metrics?• RQ2: Can metrics and feedback provided by UML-Ninja help the stakeholders
(e.g., researchers, students, practitioners) to obtain a better assessment of the
12

3. Research methodology
quality of UML models?• RQ3: What are stakeholders (e.g., researchers, students, practitioners) per-
ceptions of the use of UML-Ninja in improving the quality of UML models?
3.2 Suggested designIn this thesis, the suggested solution is to develop a system that can automaticallyperform the process of quality assessment for UML models. The intention of devel-oping the proposed system is to automate the quality assessment of UML models ina given project, by collecting data and metadata from GitHub repositories. Further-more, identify all the UML model files, as well as helping stakeholder in assessing thequality of UML models by calculating meaningful metrics from the data collected.
3.3 DevelopmentTo answer RQ1, we had to analyze how such a system can be implemented. Firstlywe implemented a prototype that integrates the resulted tools from previous re-searches that are discussed in the related work chapter 2 as one automated system.The main purpose of this prototype is to answer SQ1.1 and SQ1.2 by automaticallycollecting the data needed for calculating the quality metrics to make the qualityassessment process of UML models possible. Secondly, we built a visualization com-ponent to able to provide the desired feedback to stakeholders. The main purpose ofthe visualization component is to answer SQ1.3. The UML-Ninja chapter 4 containsa complete description of the development process of UML-Ninja.
The development process consisted of several iterations, as several iterations haveto be conducted to tweak UML-Ninja to the initial requirements. Every iterationwill contribute to the knowledge contributions of the project as shown in Figure 3.1.
3.4 EvaluationIn this step we aim to answer RQ2 and RQ3 and thereby to find out how stakeholdersperceive the new artifact and the new automated technique proposed. To obtaintheir perception, we decided to perform qualitative user studies. The qualitativeuser studies would help us in exploring participants views, their understanding andexperiences of the artifact (UML-Ninja). Furthermore, we wanted to know howparticipants perceive the system (UML-Ninja) and the feedback that the system(UML-Ninja) provides. Results from such evaluations typically include opinionsand suggestions. Moreover, we wanted to recognize areas of improvement, whichcould be useful for future research works. Additionally, we wanted to know if thesystem (UML-Ninja) could help participants to obtain a better assessment of thequality of UML models. Therefore, as we are concerned about stakeholders viewson such a system as well as the metrics and rules that the system offers, we wantedto achieve the following evaluation goals.
13

3. Research methodology
• Evaluate whether participants could understand and use the system (UML-Ninja).
• Identify whether the participants could use the system (UML-Ninja) to obtaina better assessment of the quality of UML models.
• What are the advantages and limitations of such a system?• Identify whether the participants could use the system to improve the quality
of UML models.Since such a system and the automated approach used are new, the participants hadno prior experience with such a system. That will make it difficult to understandthe participant’s perception of the system. This leads us to perform a user study.The user study involves tasks or scenarios that the user has to perform during thestudy. In other words, tasks are activities the participants of a study should performas a part of an evaluation. Using the task in the user study made it possible forus to evaluate whether participants could understand and use this system. More-over, through the evaluation task, we wanted to understand if the system can helpparticipants to achieve a better quality assessment of UML models as well as im-proving the quality of UML models. After knowing whether the participants couldunderstand the technique, we wanted to identify other outcomes such as advantagesand limitations of the system (UML-Ninja). By identifying the advantages of theresults, it would help us to emphasize the importance and contribution of the newlyproposed system. Knowing the limitations would help in improving the system.The outcomes of the evaluation, such as advantages and weakness of the system arestudied qualitatively after conducting the user studies.
3.4.1 ProcedureThe design of the user study involves the following four activities.
• Choosing participants: In this user study, we targeted participants who areto some degree experienced with UML models and software development. Wesent an invitation for voluntary participation to the user study via personalnetworks of the supervisors and the author. In the invitation, the followinginformation was clearly mentioned:– Date and time for the interview– Description of the system (UML-Ninja) and feedback that it offers.– A short description of the study.– expected time and duration of the study as well as the expected amount
of work from the participants.We tried to choose participants that are representative to be able to get themost realistic feedback about the tool. We chose participants from the threestakeholder categories: students, developers, and practitioners. All partici-pated in the study have good English knowledge, and this made us carry outthe process in the English language. They have also had the needed knowledgeabout UML models and the impact of the UML models on software quality.
14

3. Research methodology
• Evaluation task: In this study, we made use of prescribed tasks, because thesystem (UML-Ninja) and the automated technique behind it are rather newto the participants. The evaluation task was steered towards answering if thesystem (UML-Ninja) helps participants to achieve a better quality assessmentof UML models, hence helping them to improve the quality of UML models.A preprocessed (by UML-Ninja) repository was used in the task. The projectcontains UML models (class diagrams); some of these UML models have somequality issues. The evaluation task is split into five steps, as follows:
1. Each participant were given the repository’s UML models (Class dia-grams).
2. Each participant were asked to assess the quality of the given UMLmodelsusing their current method of assessing the quality. This can be doneeither using another software or by doing a manual review of the UMLmodel.
3. We introduced UML-Ninja to the participant, and we made sure that wego through all the functions and features of UML-Ninja. Furthermore, wemade sure that all the participants received the same information aboutUML-Ninja.
4. After introducing the UML-Ninja, each participant were asked to useUML-Ninja to assess the quality of the same UML models.
5. Furthermore, each participant were asked if they can improve the qualityof UML models that has quality issues, using the feedback provided byUML-Ninja.
• Data collection: For data collection, we used interviews. To elicit the opin-ions and feelings about using the system, we made use of standardized, struc-tured, open-ended questions for the interview questions. The interview ques-tions consist of three parts, as follows:
Interview questions part 1: Part 1 consists of 6 questions concerningthe participant’s background of UML models, how they use it, and what typesof UML models they often use.1. How would you describe yourself as (Developer, Student, Researcher,
other)?2. How often do you use UML models in software projects?
(a) Very often(b) Moderate(c) Rarely(d) Not at all
3. If you are using UML models at all, can you describe in your words whatdo you use it for?
4. In which stage of the project do you use UML models?5. What types of UML models do you often use?
15

3. Research methodology
6. How do you see the impact of UML models on the quality of softwaresystems? and why?
Interview questions part 2: Part 2 consists of 8 open-ended questionsconcerning the usefulness of the system (UML-Ninja). The participants willbe asked if and how the tool could help them in accomplishing their tasks interms of assessing the quality of UML models in a project. They will also beasked questions regarding the limitations of the tool and possible indicatorsand features that could be implemented in UML-Ninja. The questions of part2 are as follows:
1. Do you assess the quality of UML models? if yes, How often and for whatreason?
2. Do you think the UML-Ninja tools can help you accomplish your task ofassessing the quality of UML models?
3. If yes how do you compare UML-Ninja with your current way of checkingthe UML models quality in terms of ease of use?
4. Does the tool motivate you to perform model quality check more often?How would this benefit the modeling practices in your project(s)?
5. Do you think such a tool will motivate you to improve the quality of UMLmodels?
6. What are your thoughts about the automated quality assessment of UMLmodels approach taken by UML-Ninja?
7. What are your thoughts about the indicators (Metrics and rules) thatUML-Ninja offers, in terms of relevance?
8. Do you have any ideas for indicators or features that can be implementedin UML-Ninja?
16

3. Research methodology
Figure 3.2: SUS standard questions [29]
Interview questions part 3: Part 3 of the questions are focused on evalu-ating the usability of UML-Ninja using the System Usability Scale (SUS) [29]standard questions. SUS is one of the standards and reliable ways to eval-uate usability [30]; it consists of 10 questions with five response options forrespondents. The choices are based on a 5-point scale, ranging from "Stronglyagree" to "Strongly disagree". The SUS questions form used in the interviewsis shown in Figure 3.2. Evaluating usability is important because we wantUML-Ninja to be user-friendly and easy to use.
The structure of the evaluation interviews was divided as follows:
– Introduction: (3 min) A verbal introduction of the research and UML-Ninja was given to the participant. The participant was informed on theprocedure and had the right to discontinue the interview at any time theywished to.
– Interview questions part 1: (5 min) The participant was introduced
17

3. Research methodology
to the list of prospective stakeholders of UML-Ninja along with the in-terview questions part 1.
– Evaluation task part 1: (10 min) The participant was introduced tothe evaluation task. Furthermore, the participant was asked to assess thequality of chosen UML models using their current method of assessingthe quality. Their current method can be using a computer software(SDMertcis) or manually.
– Hands-on Tutorial: (7 min) A hands-on tutorial was given to the par-ticipant while explaining various functions and elements of UML-Ninja.
– Exploration: (10 min) The participant was requested to freely explorethe tool and clarify any issues he/she experienced when operating it.
– Evaluation task part 2: (10 min) The participant was asked to assessthe quality of chosen UML models using UML-Ninja.
– Interview questions part 2 and 3: (15 min) The participant was thenposed with open-ended questions regarding the usefulness of the tool fol-lowed by SUS standard questions for usability.
• Data analysis: After the data from the interviews were collected. The in-terview data were then analyzed using the coding [31] method. Coding is oneof the methods used in the qualitative data analysis, especially the analysis ofinterview data. It is the process of capturing essential words or phrases from aset of data that give the same ideas, themes, and categories [31]. Before start-ing the coding process, a list of codes was created based on the motivation ofthe evaluation that was discussed earlier. Once we had the list of codes, webegan coding the interviews data.As mentioned earlier in the procedure activity, we are using SUS standardquestions [29] to evaluate the usability of the system (UML-Ninja). SUS cal-culations produce a single number that represents a composition measure ofthe overall usability of the tool being evaluated. SUS score values have arange of 0 to 100; it should be noted that it is not a percentage value. Theinterpretation of SUS score according to [32] is shown in Figure 3.3.
Figure 3.3: SUS score ranking [32]
18

3. Research methodology
3.5 ConclusionThe conclusion step is the last step in the design science research methodology. Thisphase could be the end of a research cycle, or it can lead to starting new researchiteration. The final step of a research effort is typically the result, in this stepthe results need to be communicated to practitioners and researcher so that it willcontribute in the design science knowledge and contributions as shown in Figure3.1.
19

4Design and Implementation of
UML-Ninja
In this chapter, the design and implementation of UML-Ninja will be covered. Themain intention of building UML-Ninja is to answer RQ1. The main functionality ofUML-Ninja is to automatically assess the quality of UML models to help stakehold-ers to obtain a better quality assessment.The main quality attributes that drive the design and development of UML-Ninjaare usefulness, usability, and flexibility.
• Usefulness: Checking if the tool does what it is supposed to as well as helpingstakeholders to accomplish their tasks more efficiently. Furthermore, checkingif the tool can help to accomplish tasks more efficiently.
• Usability: Checking if the tool is easy to use and understand.• Flexibility: Checking if the tool is flexible enough to modify. Adaptable to
other products as well as easy to integrate with other standard 3rd partycomponents.
The development of UML-Ninja consists of four main components: data collection,data analysis, RESTful API interface component, and data presentation, as shownin figure 4.1.
4.1 Data collectionThis component is mainly based on the work done by Hebig et al. [5]. However,UML-Ninja automates the whole process. The main functionality of this componentis collecting data needed for the quality assessment process. The data required isobtained from GitHub using GitHub API. The data collection component is dividedinto two steps as following:
4.1.1 Identifying potential UML filesTo understand how UML-Ninja searched for UML files, it is important to understandhow these files are created and stored. Based on Hebig et al. [5] work Figure 4.2illustrates the different sources of UML files (at the bottom in green). Furthermore,UML models can be created manually as manual drawing (sketching). It can alsobe created using tools that have drawing functionality, or dedicated modeling tools,
20

4. Design and Implementation of UML-Ninja
Figure 4.1: UML-Ninja components and connectors diagram
21

4. Design and Implementation of UML-Ninja
Figure 4.2: Formats for storing UML models [5]
such as StarUML or Argo UML. It is possible as well to generate UML models basedon the source code. This large variety of tools lead to a wide range of ways in whichUML models are represented by files, as shown in 4.2 in blue.Manual sketches are sometimes digitized, thus lead to image files of diverse formats.Tools with drawing capabilities can either store the UML models as images, such as.jpeg and .png or .bmp, or may have tool specific formats, e.g., "pptx". Dedicatedmodeling tools work with tool specific file formats, e.g., the Enterprise Architecttool stores files with a ".eap" extension. Other tools store UML files in a "standard"formats such as ".UML" and ".XMI".As a consequence, when searching for UML files, many different file types need to beconsidered. UML-Ninja search for potential UML files using heuristic filters basedon the creation and storage nature of UML files. However, UML-Ninja only detectsUML files standard formats, as well as image formats.
4.1.2 Filtering UML filesNot every image, .XMI or .UML file is UML. Therefore, the filtering process isneeded to check whether the collected files are UML files or not. Standard UMLformats (.XMI and .UML) and images formats each has it is own filtration process asfollowing: Filtering UML images All identified image is download to the UML-Ninjaserver. Unreadable images were eliminated from the process. Duplicate images wereautomatically detected, and representative images were added to the candidate list.To detect duplicate images, an open source .NET library "Similar images finder" wereused to calculates differences between their RGB projections to say how similarthey are. The similarity threshold is set at 95% since it gave the best detectionrate, according to Hebig et al. [5]. It’s almost impossible to find reasonable UMLcontent in icon-size images; thus, images with less than 128 x 128 were excludedfrom the candidate list. The final images candidate list were classified as UMLor non-UML images by using a UML classifier created by Ho-Quang et al. [22].
22

4. Design and Implementation of UML-Ninja
However, this classifier is only able to classify class diagrams from images thereforall UML images are classified as a class diagram. This classifier is using a machinelearning algorithm that was trained by a set of 1 300 images. Filtering StandardUML formats (.XMI and .UML) Firstly UML-Ninja runs a duplicate detection on.XMI and .UML files by comparing hash values of the file contents. Standard UMLformats (.XMI and .UML) are special form of XML format. XMI is a standardformat that should enable the exchange of models between different tools. In theory,it should be simple to identify whether an XML file. We can determine if theXML file contains UML model or not based on the schema reference in the XMLfor example, the following three schema references to the UML: "org.omg/ UML","omg.org/spec/UML", and "http://schema.omg.org/spec/UML". Therefore UML-Ninja search with a simple search function for these schema references in all XMIand UML files detected and if found the file will be classified as UML file. Each typeof UML type has different XML representation according to the schema references.UML-Ninja can automatically classify class diagrams, sequence diagrams, use casediagrams, and activity diagrams from standard UML formats.
4.2 Data analysisAfter the process of identifying UML files is done, a list of UML files in differentformats is produced as discussed in the section before. The data analysis componenttakes this list of UML as an input, and it extracts data needed for calculating qualitymetrics. The data analysis process is divided into two steps as following:
4.2.1 Data extractionIn this step, UML-Ninja will extract all the data and metadata needed for eachidentified UML file to be able to calculate the quality metrics. Firstly UML-Ninjadownloads all the metadata from GitHub such as commits, contributors and someother metadata about the repository itself (for example: first and last commit,founder of the repository, ... ). This process is done using a python script thatdownloads all metadata needed in a JSON format from GitHub. Then UML-Ninjasaves all metadata to a local database. Secondly, UML-Ninja extracts data fromthe UML file content. Each UML formats (images, .XMI and .UML) has it is ownprocess. For .XMI and .UML files, UML-Ninja has a parser component that parsesthe content of these files and then saves it to the local database. For image formats,UML-Ninja converts class diagram images to XMI format using IMG2UML [8]. Theproduced XMI file is sent to the XMI parser to parse the content of the XMI andsave it to the database.
4.2.2 Quality Metrics calculatorAfter the data extraction step is done, now it is time to calculate all the qualitymetrics that UML-Ninja support. The quality metrics are based on the qualitymodel by Chaudron et al. [16] and SDMetrics [23]. Table 4.1 shows the list ofmetrics, their level, their type, definition, and prior works that have provided a way
23

4. Design and Implementation of UML-Ninja
to calculate the metrics.The Quality Metrics calculator component does do not support all metrics andrules suggested by Chaudron et al. [16] due to limitations on the collected datain the "Data extraction" step. As a result, some of the metrics and rules couldn’tbe calculated with the given data. For example, quantifying the number of crosslines in a diagram (NCL) is challenging, as the tools used and data collected doesnot provide any data about the multiplicity of the associations. Moreover, Designpattern metrics is difficult to quantify as well, since the tools used and data collecteddoes not provide any data about that. The quality model introduces by Chaudronet al. [16], doesn’t always explain how the metrics can be calculated, for example,complexity, cohesion, naming conventions, and level of details metrics. SDMetrics[23] provides a big metrics catalog that includes the mentioned metrics. Therefore,SDMetrics [23] metrics definition is used to be able to calculate these those metrics.Several research efforts [33, 34] have been made to identify a meaningful thresholdfor quality metrics. The work done by Filó et al. [33] used an empirical methodto identify identifying thresholds for 17 object-oriented software metrics using 111system. Filó et al. [33] suggested three levels for the thresholds: Good/Common,Regular/Casual, and Bad/Uncommon. The UML-Ninja metrics calculator uses thesuggested Bad/Uncommon level as metrics threshold for the following metrics.
• For the Depth of inheritance tree (DIT), the threshold is 4.• For the number of classes (NOC), the threshold is 28.• For the number of methods (NOM) per class, the threshold is 14.• For the number of fields (NOF) per class, the threshold is 8.
Furthermore, other metrics have a threshold of 1, such as the number of unusedclasses, number of god classes, and the number of classes with long parameter listoperations. If the calculated value if a specific metric is higher than or equal thethreshold, UML-Ninja will display a warning, as will be discussed in Section 4.3.
4.2.3 RESTful API interfaceThe RESTful API interface component is an interface between UML-Ninja and othersystems or components that uses HTTP protocol to retrieve data from UML-Ninja inJSON format. This component can be used by any external system, hence this willmake UML-Ninja fixable and scalable. As shown in Figure 4.1, the data presenta-tion component is using the RESTful API interface component to retrieve the datait needs. The RESTful API interface component function as the communicationchannel between the UML-Ninja back-end and front-end.
4.3 Data presentationThe Data presentation component aims to present the data and metadata collectedabout the UML models. Furthermore, displaying the calculated values for the qual-ity metrics and rules. This will allow stakeholders to easily assess the UML quality,as well as getting an indication on how to improve the quality of UML models. TheData presentation component presents data and metadata in a visually appealing
24

4. Design and Implementation of UML-Ninja
Metric Level Type Description RefUML commit ratio Repository UML process Ratio between UML files commits and all commitsEditable UML ratio Repository UML process Ratio between editable UML files and all UML filesUML contributor ratio Repository UML process Ratio between UML contributors and all contributors
Number of diagrams Repository UML content Total number of each identified diagram (class diagram,use case diagram, ... )
Unused classes Diagram UML content Number of classes that have no child classes, dependencies,or associations [25]
DIT Diagram UML content The maximum length of a path from a class to a root class inthe inheritance structure of the class diagram [11, 12]
Number of classes Diagram UML content Total number of classes [35]Coupling Diagram UML content The number of other classes a class is related to. [11]
Complexity Diagram UML content
The number of relationships between classes and interfaces inthe class diagram.There is a dependency from class or interface C to class orinterface D if:- C has an attribute of type D.- C has an operation with a parameter of type D.- C has an association, aggregation, or compositionwith navigability to D.
- C has a UML dependency or usage dependency to D.- C is a child of D.- C implements interface D.
[23, 28]
LOD Diagram UML contentThe ratio of attributes with signature to the total number ofattributes of a class + the ratio of operations with parametersto the total number of operations of a class
[14]
Cohesion Diagram UML content
This is the average number of internal relationships perclass/interface, and is calculated as the ratio ofComplexity+1 to the number of classes and interfacesin the class diagram.
[23, 28]
Multi-defs Diagram, Class UML content Multiple definitions of an element (e.g. class) under thesame name. [16]
Naming Conventions Class UML content Adherence to naming conventions recommended by theguideline in the UML standards [24]
Number of attributes Class UML content Total number of attributes [35]Number of operations Class UML content Total number of operations [35]Fan-in Class UML content The number of incoming association relations of a class. [16]Fan-out Class UML content The number of outgoing association relations of a class. [16]God classes Class UML content The class has more than 60 attributes and operations. [26, 27]
LongParList Operation Class UML content The operation has a long parameter list with five ormore parameters.. [23, 27]
Table 4.1: Metrics and rules supported by UML-Ninja
manner to support stakeholders in making decisions. Furthermore, it structures anddisplays the information from high to low abstraction.The Data presentation component is divided into five pages as shown in the Figure4.3.
• Repositories list page.• Repository page.• UML (class diagram) page.• Compare page.• Metrics definition.
25

4. Design and Implementation of UML-Ninja
Figure 4.3: UML-Ninja sitemap
4.3.1 Repositories list page
The Repositories list page is the home page of UML-Ninja. From this page, the usercan access the two main functions of UML-Ninja, which are:
• Automatically assesses the quality of UML model from a GitHub repository.• Displaying the data collected about the repository and it’s identified UML
models, as well as displaying the quality assessment information of an alreadyproceed repository.
The first function is implemented as shown on the top box of Figure 4.4. This boxcontains an input field as well as a clickable button named process. The user en-ters the desired GitHub repository URL in the input field and clicks on the processbutton. UML-Ninja will send the user request to its back-end to start processingthe repository. The user will be provided by progress feedback. As soon as theprocessing is finished, the user will be notified.The second main function of the repositories page is represented as a list of reposi-tories (projects) shown as cards for all processed repositories. The cards are shownunder the top box in Figure 4.4. Each repository card show some metadata aboutthe repository such as name, creator, first commit, the last commit, the number ofcontributors, and the number of identified UML files. The user has the possibilityto search with the repository name or the repository creator name as well. There isalso a possibility to sort repositories by the following field:
• Number of UML files• Number of Editable UML files• Number of contributors• Number of UML files contributors
26

4. Design and Implementation of UML-Ninja
• Number of commits• First commit• Last commit
Each repository card could have one or more badge from the following badges:
• Editable UML: If the repository contains UML files in editable format (.XMIor .UML).
• UML naming conversions: If all identified UML files follows UML namingconventions [24] in a given repository.
• Correctness: If each UML files in a given repository follow the following tworules:– The UML file doesn’t contain multiple definitions of an element (e.g.
class) under the same name.– The UML file doesn’t contain unused classes.
The main intention behind developing these badges is to motivate stakeholders toenhance the quality of UML models. There is also a possibility to filter repositorieswith badges, as shown in Figure 4.4. Moreover, each card has two clickable buttonslocated on the bottom of the card. The first button allows the user to navigate tothe repository page on GitHub; the second one is for showing more details aboutthe repository by navigating to the Repository page.
Figure 4.4: Repositories list page
4.3.2 Repository pageThe user will be navigated to the repository page, as soon as the view buttonlocated on each repository card on the repositories page 4.4 is clicked. The mainfunctionality of this page is to provide an overview of the selected repository, andit’s identified UML files. The repository page is divided into six different views:
27

4. Design and Implementation of UML-Ninja
repository information, commit history chart, "Issues to watch out for" box, UMLprocess, UML content, and UML files as shown in Figure 4.5.
Figure 4.5: Repository page
4.3.2.1 Repository information
This box shows metadata about the repository such as name, creator, first commit,the last commit, total number of commits, number of editable UML files identified(.XMI and .UML), the total number of identified UML files and a button that linksto the repository page on GitHub.
4.3.2.2 Commit history box:
Is a multi-line chart that represents the repository commit history as shown in Figure4.6. The x-axis represents the commit date and time, and the y-axis represents thenumber of committed files. The multi-line chart contains two lines; the red oneis representing the commits that contain identified UML files, and the blue oneis representing the commits that contain other files than UML files (e.g., sourcecode). This chart gives the user an idea about the development methodology ofthe project. For example, if the project follows the Waterfall software developmentmethodology, it could be that all the UML files are committed at the start of theproject and the UML files are not updated throughout the process. On the otherhand, if the software development methodology is Agile, the UML files might beupdated more frequently.
28

4. Design and Implementation of UML-Ninja
Figure 4.6: Repository commit history chart
4.3.2.3 "Issues to watch out for" box
In this box, UML-Ninja presents indicators that need attention from the user. Theseindicators can be on the repository level or the Identified UML files level, for exam-ple:
• The repository contains class diagrams with unused classes.• The repository contains class diagrams with multi-defined items (classes or
attributes under the same class).• The repository contains class diagrams with DIT value higher than the thresh-
old.
4.3.2.4 UML process
In this view, UML-Ninja presents qualitative features regarding the process of UMLin the selected repository, for example, UML commits ratio, editable UML ratio,and UML contributors ratio. As shown in Figure 4.5, the data are presented asthree progress bars. The UML process indicators are implemented because of sev-eral reasons, including the importance of the indicators and value they add to theassessment of UML models, the type of available data about the repositories, timeconstraints and the level of complexity of indicator. Data regarding repositories isdifferent than a local software project. For example, data about every change in aGitHub repository is stored under GitHub’s version control system, whereas, thisdoes not apply to a local software project. UML-Ninja uses the data that was acces-sible and stored during the data analysis process discussed earlier, to implement therespective indicators. For example, to calculate the UML contributor ratio metrics,UML-Ninja stores the data about the number of people who added and updated theUML models as well as the total number of project contributors. The same for theUML commit ratio UML-Ninja stores all the commit history retrieved from GitHuband flag the commits that contain UML files.
4.3.2.5 UML content
This view presents an overview of the types of the identified UML models as wellas the count of each type. As shown in Figure 4.5. UML-Ninja can identify (classdiagram, sequence diagram, use-case diagram, and activity diagram). However,UML-Ninja has some limitation on identifying UML models. UML-Ninja can iden-tify class diagrams from image formats, .XMI format, and .UML format. On theother hand, UML-Ninja can’t identify sequence diagrams, use-case diagrams, and
29

4. Design and Implementation of UML-Ninja
Figure 4.7: UML files view
activity diagrams from image formats, but it can only identify them from .XMIformat and .UML format.
4.3.2.6 UML files
This view lists all identified UML files as cards, as shown in Figure 4.7. Eachcard contains information about the UML file such as UML type, UML file name,creator, created date, format (image format, XMI or UML). For UML files in imageformat, the UML file image will be displayed on each card. Moreover, each cardshows some of the overviews of the quality metrics that UML-Ninja calculates foreach identified UML class diagram. These metrics are number of classes, depth ofinheritance tree (DIT), number of multi-defined objects, number of unused classes,and max coupling. These metrics are represented as a radar chart, as shown inFigure 4.7. Each card has two buttons; the first button is for adding the file to thecompare list. The other is for navigating to "UML (class diagram) page" to showmore information about the selected UML file.
4.3.3 UML (class diagram) pageUML-Ninja only supports class diagrams quality metrics as discussed earlier; hence,the primary purpose of the UML page is to show information and quality metricsfor class diagrams. The user will be navigated to the UML page when the viewbutton on the class diagram card on the UML files view is clicked. The UML pageis split into three views: class diagram information, metrics, and classes. The usercan navigate between these views by clicking on the tab menu bar located on thetop of Figure 4.8.
4.3.3.1 class diagram information
The class diagram information view displays metadata about the class diagram aswell as class diagram image if the class diagram is in image format. These metadata
30

4. Design and Implementation of UML-Ninja
are: class diagram name, commit date and time, and creator as well as two buttons.The first button is for navigating to the GitHub page for this class diagram, andthe other is for adding the class diagram to the compare list. Moreover, if the classdiagram is in image format, the class diagram information view allows the user todownload the XMI file generated from the IMG2UML [20] tool discussed in the dataextraction step discussed earlier in this chapter.
Figure 4.8: Class diagram information view
4.3.3.2 Metrics
In this view, the class diagrams metrics are displayed. The motivation behind theclass diagrams metrics that are currently implemented is based on the quality modelintroduced by Chaudron et al. [16] and SDMetrics [23]. The supported metrics forthe UML class diagrams shown in Figure 4.9 are:
• Number of classes• Fan-in• Fan-out• Number of unused classes• Coupling• Complexity• Cohesion• Number of multi-defined objects• Depth of inheritance tree• Number of god classes• Level of details• Number of classes follow UML naming conventions that are recommended by
the guideline in the UML standards [24]• Number of classes with long parameter list operations
According to Chaudron et al. [16] quality model, each metrics is connected to char-acteristics. Therefore we implemented a filter function that allows the user to filtermetrics by characteristic as shown on the top of Figure 4.9. These characteristicsare purposed by Chaudron et al. [16] quality model.
31

4. Design and Implementation of UML-Ninja
Additionally, If the calculated value of a specific metric is higher than or equal thethreshold, UML-Ninja will highlight the value of the metric in a red circle as shownin Figure 4.9.
Figure 4.9: Class diagram metrics view
4.3.3.3 Classes
This view shows a list of all the classes exists in the selected class diagram. Eachclass is represented as a card that contains information and indicators about theclass, as shown in Figure 4.10. The information displayed for each class are: classname, number of attributes, number of operations, Fan-in, Fan-out, and coupling.Moreover, four indicators can be displayed for each class. Those indicators are:
• If the class is following naming conventions or not.• If the class is a god class.• if the class is unused.• If the class has a long parameter list operation.
This view provides a sorting function, as shown in Figure 4.10. The user can sortclasses by all supported class level metrics: Number of attributes, Number of oper-ations, Fan-in, Fan-out, and coupling. This view also presents a histogram for thevalue distribution for the chosen metrics.
32

4. Design and Implementation of UML-Ninja
Figure 4.10: Classes view
4.3.4 Compare pageAs discussed in the UML files view 4.3.2.6 and class diagram information view4.3.3.1, UML-Ninja allows users to add class diagrams to the compare list. Theclass diagrams can be from the same project or a different project. This functionenables the user to compare the quality of two or more class diagram using the resultscalculated by the quality metrics. All the metrics that UML-Ninja support (shownon Table 4.1) will be displayed on this page. Each class diagram is represented asa column in the compare page, as shown in Figure 4.11. There is also a possibilityto remove file by file from the compare list by clicking on the red remove button onthe top right side of each UML file card.
4.3.5 Metrics definition pageThis page display all metrics and rules supported by UML-Ninja . Furthermore,this page describes each metrics, how it is calculated and related work, as shown inFigure 4.12.
Technology choicesUML-Ninja is developed using modern web technologies. The back-end is writtenin C# using Microsoft’s latest framework .NET Core 2.2 [36]. The front-end isdeveloped using the Angular 7 [37]. For creating charts, two chart libraries wereused: Plotly [38] and Chartjs [39].
33

4. Design and Implementation of UML-Ninja
Figure 4.11: Compare page
34

4. Design and Implementation of UML-Ninja
Figure 4.12: Metrics definition page
35

5Results
In this chapter, the implementation of the research methodology will be discussed.As discussed earlier in the methodology chapter 3, we follow the design scienceresearch methodology in three iterations. This chapter discusses the three iterationsin details.
5.1 Iteration 0In this section iteration 0 of the design science methodology will be discussed. Thisiteration is the first step towards answering RQ1.
5.1.1 Awareness of the problemIn this iteration we aim to solve the following problems:
• Identifying UML models files in FOSS repositories.• Extracting data and metadata from UML models files.
Research efforts [5, 20] have been made to tackle each problem separately, but theyare not integrated into one system. This iteration aims to integrate the resultedtools [5, 20] into one system.
5.1.2 Suggested designTo be able to solve the identified problems in the previous step, the data collectionand the data analysis components were designed, as shown in Figure 5.1. These twocomponents are designed to integrate the work mentioned earlier [5, 20]. Further-more, saving the data collected to a local database.
• Data collection: The main functionality of this component is collecting dataneeded for the quality assessment process. The data required is obtained fromGitHub using GitHub API. The output of this step is a list of UML files indifferent formats.
• Data analysis: The data analysis component takes this list of UML as aninput, and it extracts the data needed for calculating quality metrics.
36

5. Results
Figure 5.1: Zero iteration design
5.1.3 Development
The aim for the development in this iteration is to automate the process of identi-fying UML models from GitHub repositories. Additionally, Extract data and meta-data needed for the quality assessment process. The development in this iterationis mainly based on the work done by Hebig et al. [5]. However, we aim to auto-mate the process. Therefore, resulted tools form [5, 20, 22] needs to be integratedinto one system to make the automated process possible. The development in thisiteration involved modifications to the existing tools. For example, we modified the"img2uml" tool create by Karasneh et al. [20] from a windows desktop application toa command line script. Additionally, modifications were done to the GitHub crawler(python script) that obtains potential UML files from GitHub repositories. Someother tools were rewritten completely such as "UMLDetect". "UMLDetect" is a thetextual UML identifier (for .uml, .xmi files). Furthermore, developing the data col-lection component and data analysis component, as discussed in the design section5.1.2. Moreover, the core development of the back-end and the database were done.
37

5. Results
There is always a certain rate of inaccuracy in the existing automated systems/toolsused to identify and extract from images. Thus this will directly affect UML-Ninjaaccuracy rate. For example, the class diagram image classifier accuracy rate is be-tween (90%-95%). Moreover, the reported accuracy of the "Img2UML" system is:95% for rectangles classes, 80% for relationships and 92% for text recognition.
5.1.4 EvaluationThe Zero evaluation iteration was conducted approximately one month after thestarting of the project. This evaluation iteration was done internally with the su-pervisors. The intention behind this evaluation was to determine whether implementof such a tools is feasible using the existing tools and whether the data and metadatacan be retrieved from FOSS repositories. Furthermore, we aimed to find out whichmetrics and rules can be automatically calculated given the data collected.Most importantly, getting early feedback is essential to steer the project in theright direction. It should be noted that throughout the project time frame, weeklyevaluation meetings were performed with the supervisors on updates and progress.One recurring theme in the feedback sessions was the design of the User Interfaceand the shape of the graphs and dashboard.
5.2 Iteration 1In this section iteration 1 of the design science methodology will be discussed. Therationale behind this iteration is to answer the research questions.
5.2.1 Awareness of the problemTo answer RQ1 and the three sub-question: SQ1.1, SQ1.2 and SQ1.3, we have tosolve the following problems:
• Implementing quality metrics and rules for UML models.• Developing a dashboard for visualizing the calculated metrics and rules in a
visually appealing manner to support stakeholders in assessing the quality ifUML models.
To answer RQ2 and RQ3, UML-Ninja has to be evaluated. As mentioned in theresearch methodology chapter 3, the evaluation will be done as user studies. Detailsof the evaluation are discussed in the evaluation section 5.2.4.
5.2.2 DesignTo be able to solve the identified problems, new components were added to theUML-Ninja components and connectors diagram, as shown in Figure 4.1. The com-ponent "quality metrics calculator" was added to the data analysis component. Themetrics and rules supported by UML-Ninja are implemented and calculated in the"quality metrics calculator" component. Table 4.1 represents a list of metrics andrules supported by UML-Ninja. The "RESTful API interface" component is anothermain component that was added. The "RESTful API interface" component is an
38

5. Results
interface between UML-Ninja and other systems or components that uses HTTPprotocol to retrieve data from UML-Ninja in JSON format. This component func-tion as the communication channel between the UML-Ninja back-end and front-end.In addition to "RESTful API interface" component, the "Data presentation" compo-nent was added, this component function as the UML-Ninja front-end. The primarypurpose of the "Data presentation" component is to present the data and metadatacollected. Furthermore, display the calculated values for the supported quality met-rics and rules.
5.2.3 DevelopmentThe development in this iteration is split into three main parts.
• Modifying the data analysis component by adding the Quality metrics calcu-lator.
• Developing the "RESTful API interface" component that works as a commu-nication channel between UML-Ninja back-end and the front-end.
• Developing the "Data presentation" component, which is the UML-Ninja front-end.
5.2.4 EvaluationHalfway through the project time frame, the first evaluation iteration was conducted.This evaluation iteration aims to collect early feedback about the usability and use-fulness of the system (UML-Ninja). As mentioned in the research methodologychapter 3, this evaluation iteration was done by conducting user studies. The datacollected were analyzed and then used to identify problems and new features. Asdiscussed in the research methodology chapter, the data collection method used isconducting interviews. In this iteration, we conducted interviews with 6 participants(2 of each stakeholder group). Two students were studying software engineeringmaster program at the University of Gothenburg. The two researchers are Ph.D.students at the department of software engineering at the University of Gothen-burg. Furthermore, two practitioners with about ten years of experience in the fieldof software development. The two practitioners are software developers working attwo different consulting companies located in Gothenburg.The collected data from the interviews were then analyzed using the coding method.After the interviews data were collected, the data were read twice to get familiarwith the data. The next step after that was to perform the coding on the interviewdata to capture the key phrases/sentences. At the beginning of the process, wecreated a list of codes and divided them into five categories corresponding to thegoals of the interview questions, as follow:
1. Category: Use of UML(a) FREQUENCY(b) STAGE(c) IMPACT ON SOFTWARE QUALITY(d) TYPE
39

5. Results
(e) REASON2. Category: Assessing the quality of UML
(a) METHOD(b) FREQUENCY
3. Category: Use of UML-Ninja(a) BETTER QUALITY ASSESSMENT(b) IMPROVE UML(c) MOTIVATE TO CHECK UML QUALITY
4. Category: Advantages(a) USABILITY AND EFFICIENCY(b) METRICS AND RULES
5. Category: Limitations(a) NEW FEATURES(b) BUGS(c) POSSIBILITY FOR IMPROVEMENT
The first category consists of four codes emphasizing the use of UML. It covershow often the interviewees use UML, in which stage of the project, type of UMLthey use, the reason they use it for, and how they see the impact of using UMLon the quality of software. The second category has two codes. The codes aimto inquire if the interviewees asses the quality of UML or not when they do it andhow. The third category consists of three codes, capturing the interviewee’s opinionson the use of UML-Ninja. This category is mainly about if UML-Ninja helps theinterviewees to assess the quality of UML, improve the quality of UML, and if UML-Ninja motivates them to check the quality of UML. The fourth category consists oftwo codes capturing the advantages of UML-Ninja. This category includes twocodes: USABILITY AND EFFICIENCY and METRICS AND RULES. The fifthcategory has three codes. The codes aim to capture the limitations of UML-Ninjaas bugs, Possibility for improvement, and feature requests.
5.2.5 Evaluation resultsThe data collected from the interviews were analyzed using the coding method, asexplained in Section 5.2.4. In this section, the results from the coding are presentedby mind maps for five coding categories in the following sub-sections. Each mindmap consists of three objects: the blue rectangle represents the coding category, theyellow rectangle represents code, and the gray rectangle represents coded data fromthe interview data. The gray rectangle has a number in parentheses representingthe number of times it appears in the interview data.
5.2.5.1 Category: Use of UML
Figure 5.2 illustrate the codes and their coded data under the category "Use ofUML". The category has four codes: FREQUENCY is for the data that providesinformation on the frequency of using UML. STAGE is used for the data that pro-vides information about in which stage of the project UML is used. TYPE is for thedata that provides information about which type of UML stakeholders often use.
40

5. Results
REASON to represent the reason why they use UML. IMPACT ON SOFTWAREQUALITY explains how stakeholders see the impact of using UML on software qual-ity.
As we observed after coding the interviews data, the interviewees use UML dif-ferently. As shown in Figure 5.2, we noted three different levels of the frequencyof using UML: very often, rarely and moderate. Moreover, interviewees use UMLmainly for communication purposes as well as to get a broader overview of the sys-tem they develop, as represented with the REASON code. Furthermore, we foundthat the stage that UML is used at varying between interviewees. As shown inFigure 5.2, the STAGE code has three different coded data: Design, Analysis, andTesting. One interviewee (Researcher) mentioned that they use UML in the testingphase, as quoted below.
“We use UML in the testing phase, if the application we develop useUML models as input”
Another interviewee (Practitioner) mentioned that they use UML models in the de-sign phase, as quoted below.
“We use UML early in the design phase for reasoning and getting anoverview. ”
Figure 5.2: Iteration 1: Coding results for category: Use of UML
We found that the types of UML often used are: Class diagrams, sequence diagrams,and use case diagrams represented as TYPE code shown in Figure 5.2. Finally,
41

5. Results
Interviewees expressed their opinion about the impact of UML on software qualityrepresented as IMPACT ON SOFTWARE QUALITY code shown in Figure 5.2.Interviewees see the impact between moderate and high.
5.2.5.2 Category: Assessing the quality of UML
Figure 5.3: Iteration 1: Coding results for category: Assessing the quality ofUML
The codes and coded data for category "Assessing the quality of UML" are shown inFigure 5.3. The "Assessing the quality of UML" category has two codes: METHODand FREQUENCY. METHOD is for the data that provides information about thecurrent method used to assess the quality of UML. FREQUENCY is for the datathat gives information about the frequency of assessing the quality of UML.
As observed for the "Assessing the quality of UML", the interviewees don’t use anycomputer software to assess the quality of UML, they do it manually. Furthermore,we found that not all interviewees do assess the quality of UML and if they do theydo it manually. The interviewees that assess the quality of UML often do it aftermaking changes to the UML to make sure that it is correct after the change is done.
5.2.5.3 Category: Use of UML-Ninja
Figure 5.4 illustrate the coding results for "Use of UML-Ninja" category. Thecategory "Use of UML-Ninja" has three codes: BETTER QUALITY ASSESS-MENT, IMPROVE UML, and MOTIVATE TO CHECK UML QUALITY. BET-TER QUALITY ASSESSMENT is for the data obtained about if UML-Ninja pro-vides a better quality assessment over the method that the interviewees currentlyuse. IMPROVE UML is for the data collected about if UML-Ninja help in improv-ing the quality of UML. MOTIVATE TO CHECK UML QUALITY is for the datathat provides information about if UML-Ninja could be a motivation to check thequality of UML.
42

5. Results
Figure 5.4: Iteration 1: Coding results for category: Use of UML-Ninja
All interviewees found that UML-Ninja has the potential to help them in assessingthe quality of UML. Additionally, Interviewees prefer UML-Ninja over their currentway, for example, an interviewee (Practitioner) mentioned in the quote below.
“My current way of assessing the quality is manual review. I preferUML-Ninja because it offers the facility to assess the quality of UMLand represent that as numbers (Metrics)”
Furthermore, Interviewees (Student) do find that UML-Ninja will help them to im-prove the quality of UML models, for example an interviewee mentioned in the quotebelow.
“The tool automates the process; it guides me on how can I improvemy UML. It also gives me indications about problems that I might notknow about or see ”
Moreover, we found that UML-Ninja is perceived as a motivation to perform UMLquality assessment, for example an interviewee (Practitioner) mentioned in the quotebelow.
“yes, the tool motivate me. Especially when I want to ensure a goodquality of a model for code generation purposes. ”
5.2.5.4 Category: Advantages
Figure 5.5, shows that the codes and the coded data for the category "Advantages".The "Advantages" category has two codes: USABILITY AND EFFICIENCY, MET-RICS AND RULES. The code USABILITY AND EFFICIENCY is for data relatedhow the interviewees perceive UML-Ninja in terms of usability and efficiency. MET-RICS AND RULES is for the data related to the advantages of the metrics and rulesprovided by UML-Ninja.
43

5. Results
Figure 5.5: Iteration 1: Coding results for category: Advantages
As noted from the coded data, interviewees found the metrics and rules provided byUML-Ninja are relevant, enough, and useful as interviewees (Practitioner, Student)mentioned in the quotes below.
“It is good and relevant. it makes it easy to detect problems.”
“I think they are relevant for me. Moreover, they are enough.”
Interviewees (Practitioner, Researcher) found UML-Ninja and the automated ap-proach behind it, make the quality assessment easier and time efficient as mentionedin the quotes below:
“I think a fully automated approach to assess the quality of UML mod-els is very needed and it reduce a lot of effort.”
“It is a good approach, and the tool is going in the right direction”
Another advantage for using UML-Ninja, according to interviewees (Researcher)that UML-Ninja makes it easy to compare UML as quoted below.
“Adds numeric measure to model. Makes it comparable.”
44

5. Results
Furthermore, interviewees found that the feedback provided by UML-Ninja couldhelp them in improving the quality of UML. UML-Ninja makes it easier to assessthe quality of UML models as well as detecting quality issues. UML-Ninja makes iteasy for them to find what needs to be improved in the UML.
5.2.5.5 Category: Limitations
Figure 5.6: Iteration 1: Coding results for category: Limitations
Figure 5.6, illustrate the codes and the coded data for the category "Limitations".The "Limitations" category has three codes: BUGS, POSSIBILITY FOR IMPROVE-MENT, and NEW FEATURES. BUGS is for data related to the bugs detected inUML-Ninja by the interviewees. POSSIBILITY FOR IMPROVEMENT is usedfor the data that provides Information about UML-Ninja functions that can beimproved. NEW FEATURES is for the possible new features that can be imple-mented in UML-Ninja to make a better system. Interviewees identified list of bugs,
45

5. Results
new features and enhancements as shown in Table 5.1
Limitation TypeRedesigning the look and feel New featureSort and filter function for the repositories list page New featurePossibility to sort classes with class level metrics (fan-in, fan-out, .. ) New featureDisplay detected issues for each class in the class list view New featureRewards (badges), for example, if all UML models in a project follow the UMLnaming conventions, this project will get the "naming conventions" badge. New feature
A summary for identified issues in the repository dashboard New featureFilter metrics with characteristics New featureReplace complicated charts with easy to understand ones EnhancementMaking pages more compact by removing tabs when it is not needed EnhancementMake the navigation more accessible by implementing breadcrumb navigation EnhancementHelp function to describe metrics and how it’s calculated EnhancementThe date and time are displayed wrongly BugNavigating between pages is slow BugCompare page is not working BugInformation displayed twice in the repository list page Bug
Table 5.1: Iteration 1 identified limitations
5.2.6 Usability of UML-Ninja
Usability measurement MeanQ1: Willing to use the system 4.50Q2: Complexity of the system 1.67Q3: Ease of use 4.33Q4: Need of support to use 2.00Q5: Integrity of functions 4.33Q6: Inconsistency 1.67Q7: Intuitiveness 3.50Q8: Cumbersomeness to use 1.17Q9: Feeling confident to use 3.67Q10: Required learning-effort 2.83Total SUS Score 77.50
Table 5.2: Iteration 1: Average SUS scores
As mentioned in the methodology chapter 3, we are using SUS standard questions toevaluate the usability of UML-Ninja. Each of the individual scores on the questionranges from 0 to 4. Questions 1, 3, 5, 7, and 9, representing the positive aspects ofusability. The score contribution is the value of choice minus 1. For example, forquestion 1, if the value of the choice is 3, the score is 2. Questions 2, 4, 6, 8, and10, representing the negative aspects of usability. The score contribution is 5, minusthe value of the choice. For example, for question 2, if the value of the choice is 3,the score is 2. Table 5.2 show the mean for each question as well as the Total SUS
46

5. Results
score. Total SUS score values have a range of 0 to 100; it should be noted that it isnot a percentage value. The Total SUS score we achieved for UML-Ninja’s usabilityin this iteration was: 77.50. According to the SUS scale shown in Figure 3.3 is asolid grade C, which is good but not excellent.
5.3 Iteration 2In this section iteration 2 of the design science methodology will be discussed. Thisiteration intends to enhance UML-Ninja according to the feedback collected fromiteration 1 as well as conducting a new evaluation iteration.
5.3.1 Awareness of the problemThe feedback collected from the previous iteration is used as an input for this it-eration. The limitations 5.2.5.5 discussed in the evaluation of iteration 1 are thechallenges for this iteration.
5.3.2 DesignThe Design of UML-Ninja will remain the same as shown in Figure 4.1, however, newfeatures, enhancements, and bug fixes will be done to enhance UML-Ninja accordingto the feedback collected.
5.3.3 DevelopmentThe development in this iteration involved enhancement, adding new features andbug fixing as shown in Table 5.1
5.3.4 EvaluationAfter the new developments were finished, a new evaluation iteration was conducted.The intention behind this evaluation iteration is to get more feedback about thesystem usability and usefulness from different stakeholders. By evaluating the datacollected from this iteration, we wanted to study and understand the areas of im-provement, which could be useful for future research works.
In this iteration, we conducted interviews with 9 participants (3 of each stakeholdergroup). It should be noted that none of the participants from Iteration 1 werereused in this evaluation. Three students were studying software engineering mas-ter program at the University of Gothenburg/Chalmers University of technology.Three practitioners, one is working as a software architect and two software de-velopers working for different consulting companies located in Gothenburg. Thepractitioner’s experiences are between 5 and 12 years of experience. Moreover, bothsoftware developed holds a Bachelor degree in computer science, and the softwarearchitect holds a Master degree in software engineering.Furthermore, our choice of researchers was much broader. We chose three researchers
47

5. Results
from three different countries, and their primary research field is software engineer-ing. The first researcher is working as Associate Professor at the University of Chile,and the second is working as Associate Professor at Universidad Rey Juan Carlos,the third researcher is a Post Doc Researcher at the Technical University of Munich.It should be noted that the last three user studies with researchers were conductedvia Skype.
5.3.5 Evaluation resultsIn this section, we will present the evaluation results for iteration 2. The sameprocedures were performed as in iteration 1. Moreover, the same categories andcodes were reused in iteration 2 as well.
5.3.5.1 Category: Use of UML
Figure 5.7: Iteration 2: Coding results for category: Use of UML
Figure 5.7 illustrate codes and coded data for the "Use of UML" category. Thestage UML is used at is different from interviewee to another. As shown in Figure5.7, the STAGE code has four different coded data. UML is used in the Design,implementation, maintenance, or at any stage of the project life cycle as reportedby the interviewees. An interviewee (Practitioner) mentioned that they use UML
48

5. Results
both in the Design phase and implementation phase, as quoted below.
“We use UML in the entire of design stage and some in implementa-tion stage. ”
Another interviewee (researcher) mentioned that they use UML in any stage of theproject as quoted below.
“We use UML in any stage. ”
We observed that the frequency of using UML is between moderate and rarely asrepresented by the code FREQUENCY shown in Figure 5.7. The primary reasonsof using UML are represented with the REASON code shown in Figure 5.7. Asobserved, interviewees use UML primarily for communication purposes and to getan overview about the system architecture before they start developing it as well asgetting a better understanding of the system, as quoted below.
“ We use UML to design the system and for communication purposes.”
“ We use UML To get an overview of the solution and the code.”
“ Viewing architecture components and the relationship between thecomponents.”
One interviewee (Researcher) mentioned that they use UML for reverse engineeringpurposes, as quoted below.
“ We use UML for Reverse engineering for software quality assess-ment.”
For the types of UML used, interviewees often use the following types:
• Class diagram• Component and connectors diagram• Sequence diagram• Use case diagram• State machine.
Finally, interviewees see the impact of UML on the software quality between mod-erate and high as represented with code IMPACT ON SOFTWARE QUALITY inFigure 5.7.For the "Use of UML" category, We didn’t observe significant differences in theresults between iteration 1 and iteration 2. We noted minor differences such asinterviewees use more types of UML, and they use UML at any stage of the project.
49

5. Results
5.3.5.2 Category: Assessing the quality of UML
Figure 5.8: Iteration 2: Coding results for category: Assessing the quality ofUML
Figure 5.8 shows codes and coded data for category "Assessing the quality of UML".Not all interviewees do assess the quality of UML. But, when they do, they manuallyreview the UML to check the quality as represented with METHOD code shown inFigure 5.8. However, one interviewee (Researcher) is using SDMetrics [23] to assessthe quality of UML. Furthermore, we observed that interviewees do assess the qualityof UML, after doing modifications to the UML, as quoted below.
“I do assess the quality of UML When I intend to do changes withinthe UML models. It is for ensuring the quality of the software system.”
Moreover, interviewees assess the quality of UML when they implement a complexfeature, to make sure that the UML is correct and with good quality before theystart the implementation of the feature as quoted below.
“I do assess the quality of UML, every time I have to implement acomplex feature that requires to make sure it is correct and with goodquality.”
Additionally, We found that interviewees do assess the quality of UML when theywant to do a quality inspection.We observed differences in the results between iteration 1 and iteration 2 for the"Assessing the quality" category such as, one interviewee use SDMetrcis to assessthe quality of UML. Furthermore, interviewees assess the quality of UML for qualityinspection purposes as well as before implementing a complex feature.
50

5. Results
5.3.5.3 Category: Use of UML-Ninja
Figure 5.9: Iteration 2: Coding results for category: Use of UML-Ninja
Figure 5.9 illustrate the coding results for "Use of UML-Ninja" category. Inter-viewees found that UML-Ninja could help them in assessing the quality of UML.Additionally, interviewees prefer UML-Ninja over reviewing the UML manually, asinterviewees (Practitioner, Student) mentioned in the quotes below.
“UML Ninja is quicker and more consistent than the manual check.Applying the metrics as rules manually would take too much time.”
“UML-Ninja is doing the process in a systematical way and with moreprecision. In terms of ease of use, it is straightforward to use andindicative.”
“Now I use manual review, UML-Ninja allows for further possibili-ties.”
Moreover, an interviewee (Researcher) that uses SDMetrics [23] mentioned that hecould use UML-Ninja beside using SDMetrics [23]. UML-Ninja is easier to use, butSDMertcis [23] provides much more metrics than UML-Ninja as quoted below.
“ I’m more convenience with SDMetrics because it provided a biggerlist of metrics and rules. However, I could use UML-Ninja as a partof my assessment tools, because, UML-Ninja is easier to use and un-derstand. UML-Ninja gives an intuitive graphical representation forthe metrics and rules. UML-Ninja is automated, with SDMetrics Ihave to choose file by file manually to assess the quality. UML-Ninjaalso takes into consideration the process of creating UML.”
Furthermore, Interviewees do find that UML-Ninja could help them to improve thequality of UML models, as interviewees (Student, Practitioner) mentioned in thequotes below.
51

5. Results
“Yes, it will motivate you. It will increase the quality of UML, andfinding the problem earlier when it simple, and it will decrease thetech. dept.”
“Yes. It would help me improve the quality of the models I create andensure that I am following standards.”
For the "Use of UML-Ninja" category, We did not observe differences in the resultsbetween iteration 1 and iteration 2.
5.3.5.4 Category: Advantages
Figure 5.10: Iteration 2: Coding results for category: Advantages
Figure 5.10, represent the observed advantage of UML-Ninja. Interviewees perceivethe metrics and rules provided by UML-Ninja as relevant and useful, as representedby the code METRICS AND RULES shown in Figure 5.10. One of the Interviewees(Researcher) reported that the metrics and rules provided by UML-Ninja are notenough. The interviewee (Researcher) uses SDMetrics to assess the quality of UML.SDMetrics provides a bigger catalog of metrics and rules than UML-Ninja. Inter-viewees found UML-Ninja and the automated approach behind it, make the qualityassessment easier, effective, and time efficient as mentioned in the quotes below:
“It makes it easier to assess the quality if it is manual, people will notdo it. And it is error born because it is a human activity. it will alsobe useful to see the feedback from the tool in the sprint review.”
52

5. Results
“Automating the process of quality assurance is positive because itsaves time and ensures consistency.”
“The automated quality assessment (UML-Ninja) seems to be reason-able, intuitive, and easy to use.”
For the "Advantages" category, We didn’t observe significant differences in the resultsbetween iteration 1 and iteration 2. The only noted difference was that one of theinterviewees reports that the metrics and rules provided by UML-Ninja are notenough for his workflow.
5.3.5.5 Category: Limitations
Figure 5.11: Iteration 2: Coding results for category: Limitations
Figure 5.11, illustrate the codes and the coded data for the category "Limita-tions".The "Limitations" category has two codes: POSSIBILITY FOR IMPROVE-MENT, and NEW FEATURES. Interviewees identified list of enhancements andnew features as shown in Table 5.3.
The quotes below represent the limitations mentioned by the interviewees.
“UML-Ninja needs to support some metrics for visual indicators (e.g.,how many colors are used in the model? How many crossing lines?).”
53

5. Results
Limitation TypeEasier integration with GitHub EnhancementToDos should be first (Possible issues to watch out for) EnhancementLess info at first, more information on demand. EnhancementDifferent dashboard layout for different stakeholder category. New featureCode correlation metrics. New featureWarning for not updated UML files. New featureUser-defined Metrics. New featureShow repository contributors as a list. New featureCommit history for each UML New featureContinuous quality monitoring New featureMetrics for visual indicators (how many colors? How many crossing lines?) New featureUser-defined metrics threshold New featureExtract metrics values as JSON New featureSupport for more metrics (SDMetrics) New feature
Table 5.3: Iteration 2 identified limitations
“A feature that I would like to see in UML-Ninja would be to relatethe content of the diagram to the actual code and indicate how goodthe diagrams are in the context of the code.”
“Continuous monitoring will be helpful and will add more value toUML-Ninja.”
“User-defined Threshold, more metrics (SDMetrics provide more info)will be my feature request.”
We observed that none of the limitations that were found in iteration 1 were repeatedby the interviewees in iteration 2. In fact during the interviews the issues found inUML-Ninja in the first iteration were fixed.
5.3.6 Usability of UML-NinjaTable 5.4 show the mean for each question as well as the Total SUS score. Total SUSscore values have a range of 0 to 100; it should be noted that it is not a percentagevalue. The Total SUS score we achieved for UML-Ninja’s usability in iteration 2 was:85.71. According to the SUS scale shown in Figure 3.3 is a solid grade B, which isan excellent score. The calculated SUS score is significantly higher compared to thevalue of iteration 1, which is 77.50. That indicates that the usability of the tool hasbeen improved since the iteration 1.
54

5. Results
Usability measurement MeanQ1: Willing to use the system 4.14Q2: Complexity of the system 1.71Q3: Ease of use 4.57Q4: Need of support to use 1.43Q5: Integrity of functions 4.29Q6: Inconsistency 1.43Q7: Intuitiveness 4.43Q8: Cumbersomeness to use 1.00Q9: Feeling confident to use 4.14Q10: Required learning-effort 1.71Total SUS Score 85.71
Table 5.4: Iteration 2: Average SUS scores
55

6Discussion
In this chapter, we present four sections. The first section presents answers to theresearch questions. The second section discusses different validity threats that wehave encountered and how we mitigated them. The third section discusses researchethics.
6.1 Research questions
RQ1: How to automatically assess the quality of UML models in opensource projects?
RQ1 is mainly scoped to how can we build a system that automates the processof assessing the quality of UML models. In this thesis, we introduced an ap-proach to automate the process of assessing the quality of UML models inFOSS projects. As a result, we built a tool (UML-Ninja) that follows thisapproach, as discussed in Chapter 4. The implementation of the tool indicatesthat the automated approach of the quality assessment is technically possible andapplicable.However, to be able to develop such a system, we faced some challenges. To be ableto Identify and extract data from GitHub repositories resulted tools form [5, 20, 22]had to be integrated into one system. The integration process was challengingsince the mentioned tools were written in different programming languages (Python,C++, and Java). Additionally, the integration process involved modifications to theexisting tools. For example, we modified the "img2uml" tool create by Karasnehet al. 20 from a windows desktop application to a command line script. Addition-ally, modifications were made to the GitHub crawler (python script) that obtainspotential UML files from GitHub repositories. Some other tools were rewritten com-pletely such as "UMLDetect". "UMLDetect" is a textual UML identifier (for .uml,.xmi files).There is always a certain rate of inaccuracy in the existing automated systems/toolsused to identify and extract from images. Thus, this will directly affect UML-Ninjaaccuracy rate. For example, the class diagram image classifier accuracy rate isbetween (90%-95%). The accuracy of the "Img2UML" system is 95% for rectanglesclasses, 80% for relationships and 92% for text recognition. This inaccuracy ratemade really difficult to accurately extract form low-resolution images. We faced thischallenge in two directions. Firstly, we added the "Filtering UML files" step in the
56

6. Discussion
"Data collection", to filter all low resolution and small image from the identificationprocess as discussed in Chapter 4. Secondly, We implemented UML-Ninja usingplug-in mechanisms, making it a flexible system to make it easy to replace thecurrent tools and services with others that have a higher accuracy rate.In comparison with SDMetrics, UML-Ninja automates the process of identifying andassessing the quality of UML models. However, with SDMetrics, the user is requiredto pick the desired file for the tool to analyze explicitly.
SQ1.1: How to assess the quality of UML models?
To be able to answer this questions we had to investigate what UMLmetrics and rules that can be automatically calculated using the datacollected from FOSS repositories. We based our metrics choice on thework done by Chaudron et al. [16] and SDMetrics [22]. From Chaudronet al. [16] and SDMetrics [22] suggested metrics, we could implement 16metrics, as shown in Table 4.1. However, some remaining challenges were nottackled in this thesis. For example, UML-Ninja does not support all metrics andrules suggested due to limitations on the collected data by the tools and servicesthat the system depends on. For example, quantifying the number of crossing linesin a diagram (NCL) is challenging, as the tools used and data collected does notprovide any data about the multiplicity of the associations. Moreover, Design pat-tern metrics is difficult to quantify as well, since the used tools and collected datado not provide any data about that. Besides, the aim is to automate the qualityassessment process for all types of UML models. In fact, for now, we only have thetechnology for one type of UML models, which is a class diagram. As a result ofthis limitation, the system only supports class diagram metrics. The large catalogof metrics and rules supported by SDMetrics is another challenge that remains un-solved in this thesis. Furthermore, user-defined metrics is another SDMetrics featurethat UML-Ninja does not support.
SQ1.2:How to assess the quality of use of UML models in softwaredevelopment processes?
To be able to address this question we need to investigate what UML process metricsthat can be calculated using the data collected from FOSS repositories. From thedata collected, we could implement three UML process metrics as shown in Table4.1. For example, for UML contributor ratio we could retrieve the data about thenumber of people who added and updated UML models as well as the total numberof project contributors. Furthermore, by retrieving all repository commits and flagthe commits that contain UML files, we could calculate the UML commit ratio.Finally, by identifying all UML files and their types, we could calculate the EditableUML ratio. The "UML commit ratio", "Editable UML ratio" and "UML contributorratio" are one of the contributions of this thesis, since they were not supported bySDMetrics or other identified related work.
57

6. Discussion
SQ1.3: How to provide feedback to different stakeholders with a givenresult of quality metrics?
To answer the third part (SQ1.3) of the RQ1, we implemented the "Data presenta-tion" component. The "Data presentation" component is discussed in Section 4.3.The main goal of this component is to present the data and metadatacollected for the UML models. Besides, displaying the calculated valuesfor the quality metrics and rules. The "Data presentation" componentpresents the repository data and metadata in a visually appealing mannerto support stakeholders in assessing the quality of UML models as wellas making decisions on how to improve the quality of UML models. UML-Ninja presents the calculated values for metrics and rules as a simple chart. Thesecharts make it easier for the stakeholders to get a visualized overview of the qualityof UML models. On the other hand, SDMetrics only presents the metrics informa-tion of a UML file in the form of tables and histograms. Furthermore, UML-Ninjaallows the user to visualize multiple UML files simultaneously to make it easier forthe user to compare them. However, this feature is not supported by SDMetrics.Additionally, we evaluated the feedback provided by UML-Ninja by conducting 15user studies in two iterations. The feedback obtained from the evaluation iterationswere used to improve the feedback supplied by UML-Ninja. During the evaluationinterviews, interviewees report that UML-Ninja is useful in pointing out UML de-sign problems, but it will be even better if it can give rewards for good quality UMLmodels. That is why we implemented the badges feature, as discussed in Chapter4. The badges aim to motivate stakeholders to enhance the quality of UML models.
RQ2: Can metrics and feedback provided by UML-Ninja help the stake-holders (e.g., researchers, students, practitioners) to obtain a betterassessment of the quality of UML models?
From the data collected during the user studies, we obtained answers for RQ2. Dur-ing the user studies, participants used UML-Ninja to perform a prescribed task.This task was to assess the quality of UML models using their current way of assess-ing the quality and with UML-Ninja. We found that one of the participants usesSDMetrics to assess the quality of UML models. The remaining participants do notuse any computer software to assess the quality of UML, but they do it manually.All 15 participants who took part in the user study managed to use thefeedback provided by UML-Ninja to assess the quality of UML modelsin the given task. All participants reported that the metrics and rulessupplied by UML-Ninja are relevant and useful. Additionally, Partici-pants reported that UML-Ninja is time efficient to use than their currentway of assessing the quality of UML. The participant who uses SDMetricsfound UML-Ninja time efficient over SDMetrics, because UML-Ninja automates theprocess of assessing the quality of UML. Moreover, SDMetrics supports only UMLmodels in .XMI file format. However, UML-Ninja supports .XMI, .UML as wellas image formats. SDMetrics has its advantages, such as the big metrics and rulescatalog that SDMetrics support. However, UML-Ninja is built to be flexible andeasy to extend. According to the data collected from the user studies, we see that
58

6. Discussion
UML-Ninja has the potential in helping stakeholders (e.g., researchers, students,practitioners) to obtain a better assessment of UML models. The two evaluationiterations that were conducted showed the advantages of using UML-Ninja. Theadvantage of using UML-Ninja are shown in the mind maps in the following Figure5.4, 5.5, 5.9, and 5.10.
RQ3: What are stakeholders (e.g., researchers, students, practitioners)perceptions of the use of UML-Ninja in improving the quality of UMLmodels?
The answer to this question is obtained from the data collected during the userstudies. Participants found that UML-Ninja is easy to use and time efficient overtheir current way of assessing the quality of UML models as addressed in RQ2.The SUS score calculated for both evaluation iterations (77.50 and 85.71, respec-tively) supports what the participants reported about the usability of UML-Ninja.Participants perceive UML-Ninja as a motivation to check the qualityof UML. Checking the quality of UML more often will lead to improv-ing the quality of UML. Furthermore, one of the advantages reported byparticipants that UML-Ninja makes it easier to detect issues. Detectingand visualizing issues in an easy way will lead to improving the quality ofUML. The data collected from the user studies emerged that participantsperceive that UML-Ninja could help in improving the quality of UML. Aswe observed during the interviews, participants see UML-Ninja as a tool that helpsin assessing the quality of UML. Moreover, the majority of participants manuallycheck UML quality, and that is not time efficient and easy to use compared to anautomated tool.Feature requests and enhancements were reported in Iteration 1 that was taken inconsideration while improving the tool in Iteration 2 such as: "Display detectedissues for each class in the class list view" and "A summary for identified issues inthe repository dashboard". UML-Ninja can identify issues such as:
• Class diagrams with unused classes.• Class diagrams with a high coupling (more than 10).• Class diagrams with multi-defined items (classes or attributes under the same
class).• Class diagrams with DIT more than 5.• Classes that do not follow UML naming conventions.• God class.• Classes with long parameter list operation.
Display a summary of identified issues will allow the user to identify areas of improve-ments easily. This will lead to better UML models quality. The implementation ofthose features was also one of the factors that lead to the significant increase of theSUS score in Iteration 2.Implementing more metrics and rules is one of the challenges reported by the inter-viewees in the second evaluation round. This challenge has remained unsolved inthis thesis. However, it should be taken into consideration and a future challenge.By supporting more metrics and rules, will increase UML-Ninja ability in detectingquality issues hence improve the UML models quality.
59

6. Discussion
Continuous quality monitoring is a feature that was requested by an interviewee inthe second evaluation round. This feature aims to assess the quality of UML modelsautomatically after each UML commit. Thus, this will lead to quicker feedback fromUML-Ninja about the quality of UML. Continuous quality monitoring is anotherchallenge that remained unsolved in this thesis.
6.2 Threats to validityIn this section, the relevant threats to validity are discussed and how we tried tomitigate them. Four aspects of validity threats were considered.
6.2.1 Construct validityDue to some constraints, not all interviews were in-person interviews. Some inter-views were conducted over Skype. This can lead to a threat to validity. To mitigatethis threat, we included a brief introduction about UML-Ninja and the purpose ofthe study in the invitation email. Additionally, we presented a brief introductionbefore each interview.The is a possibility that the participants interpret the interview questions differentlyfrom each other. To mitigate this threat, We double check with each participant toinsure that they understand the question correctly. Examples were used in case theparticipant needed more explanation.
6.2.2 Internal validityUML-Ninja calculates quality metrics and provides feedback on basis of automatedextraction of UML models from various inputs, including textual and image files.There is always a certain rate of inaccuracy in the existing automated systems/toolsused by UML-Ninja. For example, from low-resolution images result in inaccuratedata extraction from class diagram images. This could affect the accuracy of thefeedback provided by UML-Ninja. However, We do not have much control over thesethreats; they are potential threats to validity and cannot be ruled out. To mitigatethis threat, We tried to reduce the rate of inaccuracy during the development andthe integration process.
With UML-Ninja, we aim to automate the quality assessment process for all typesof UML models. In fact, for now, we only have the technology for one type of UML,which is a class diagram. To mitigate this threat, we implemented UML-Ninja us-ing plug-in mechanisms, making it a flexible system that can easily be extended tosupport more UML types. For example, researchers will be able to plug-in their sys-tem for classifying and/or extracting contents of UML sequence diagrams, activitydiagram, etc.
The experience and background of the participants may influence their feedback.For example, a participant who may not think UML is important may find UML-
60

6. Discussion
Ninja not useful or necessary. We mitigated this threat by making sure that theprospective participants had some degree of competence regarding UML.
6.2.3 External validityWe can foresee that we will not be able to reach the opinions of all researchers,students, or practitioners. Therefore, there is always a risk of not covering needs fromeverybody. We mitigate this threat by choosing stakeholders that are representativeto be able to get the most realistic feedback about the tool.
6.3 Research EthicsWe took two important things into account when conducting this thesis, harm thatmight happen to participants involved in this thesis work, and reporting everythingwith honesty. This section discusses the actions taken to minimize the risk of harmto the participants and to the way we report the results.
6.3.1 Informed consentIn this thesis, we had 15 participants in total involved in the evaluation interviews.To minimize the risk of harm, we provided each participant with a clear descriptionof the study and expected time and duration of the study, as well as the expectedamount of work from each participant. Furthermore, the description included theinformation about the author and supervisors names and universities. Each partic-ipant was also informed about what kind of information was needed as part of thestudy. In addition to that, the participants were not forced to take part in any workin the study.
6.3.2 Anonymity and confidentialityThe data collected during the interviews, including personal information, were anony-mous. Before the interview, each participant was asked for permission to record theconversations. The recordings and transcripts were kept anonymous and confiden-tial. During the data analysis process, all data that could disclose the participant’sidentities were removed, to ensure that there would be no physical harm to them.Furthermore, to prevent psychological distress and discomfort they might face aftergiving their information as a part of this thesis work.
6.3.3 FraudIn this thesis, fraud was also considered. The fraud may happen when collecting,analyzing, and reporting the results from the study. The data in the study arereal and not made up as well as the methods we used to get them are explainedclearly. Moreover, the data were not manipulated or discarded in order to get thedesired outcome. To get the most benefit from the study, we report everything both
61

6. Discussion
negative and positive results. Most importantly, we have not taken someone else’swork without giving the credits to them.
62

7Conclusion and Future work
In this chapter, we present two sections. The first section covers the conclusion ofour thesis work. In the second section, we discuss the proposed future work.
7.1 Conclusion
This thesis has two main challenges. The first challenge is to build a tool that auto-mates the quality assessment process of UML models in open source projects. Thesecond challenge is to evaluate the usefulness of such a tool to different stakeholders(e.g., researchers, students, practitioners). To tackle these challenges, we used thedesign science research methodology in three iterations. As a result, We introducedUML-Ninja, which is an online web tool with a dashboard. The goal of UML-Ninjais to help stakeholders in assessing the quality of UML models in software projects.
To evaluate UML-Ninja usefulness and usability, 15 user studies were conductedacross two iterations with participants from three different stakeholders category:students, developers, and researchers. The user studies were done as semi-structuredinterviewers in two iterations. Participants reported that UML-Ninja has the poten-tial in helping them to obtain a better quality assessment of UML models becauseit is easy to use and time efficient. Furthermore, participants perceive UML-Ninjaas motivation to assess the quality of UML models. The motivation, in turns, willhopefully lead to improvements in the quality of UML models. Finally, several lim-itations of UML-Ninja were presented and explained. These limitations were takenas inputs for future improvement of the tool across iterations of the study.
The first contribution of this thesis is UML-Ninja tool. UML-Ninja is the firstattempt to automate the assessment of UML models quality in FOSS projects.UML-Ninja is implemented using plug-in mechanisms, making it a flexible systemthat can easily be extended to support more UML types. For example, researcherswill be able to plug-in their system for classifying and/or extracting contents of UMLsequence diagrams, activity diagram, etc. The second contribution is the evaluationof the usefulness of UML-Ninja in assisting users to perform the quality assessmentof UML models in their projects. We found that such an automated tool couldbe used to motivate the users to ensure the quality of UML models within theirprojects.
63

7. Conclusion and Future work
7.2 Future workBased on the feedback received in the last evaluation phase, UML-Ninja can beimproved in many ways. From evaluation iteration 2 results, we identified a list oflimitations that are good candidates for future work. Future research work includesimplementing more metrics, such as source code correlation metrics and visual indi-cators metrics. Moreover, a new feature that allows users to create custom metrics aswell as thresholds. Another possible future work is better integration with GitHubthat makes easier to choose repositories. The new integration with GitHub includescontinuous monitoring and quality assessment for UML models.Text and UML models are two practices that can be used to create software ar-chitecture design documentation (SAD). With UML-Ninja, we aimed to assess thequality of UML models. We think that extending UML-Ninja to assess the qualityof Text is another possible future work.Finally, we evaluated UML-Ninja on FOSS project, we think that evaluating UML-Ninja on commercial software is another possible future work.
64

References
[1] M. Shahin, P. Liang, M.R. Khayyambashi, “Architectural design decision: Ex-isting models and tools”, in: Proceedings of the Joint 8th Working IEEE/IFIPConference on Software Architecture 3rd European Conference on Software Ar-chitecture (WICSA/ECSA), Cambridge, UK, pp. 293-296, 2009.
[2] P. Clements, F. Bachmann, L. Bass, D. Garlan, J. Ivers, R. Little, R. Nord, J.Stafford, Documenting Software Architectures: Views and Beyond, 2nd Edition.
[3] Rich Hilliard. Using the UML for Architectural Description. Integrated Systemsand Internet Solutions, Inc., 2000.
[4] Eliasson, Ulf Heldal, Rogardt Pelliccione, Patrizio Lantz, Jonn. (2015). Ar-chitecting in the Automotive Domain: Descriptive vs Prescriptive Architecture.Proceedings - 12th Working IEEE/IFIP Conference on Software Architecture,WICSA 2015. 10.1109/WICSA.2015.18.
[5] Hebig, Regina Ho-Quang, Truong Chaudron, Michel Robles, Gregorio Fernán-dez, Miguel. (2016). The quest for open source projects that use UML: miningGitHub. 173-183. 10.1145/2976767.2976778.
[6] Vaishnavi, V., Keuchler, W. (2004, January 20). Design Research in InformationSystems Association for Information Systems. Retrieved December 11, 2007.
[7] G. Reggio, M. Leotta, and F. Ricca. Who knows/uses what of the uml: Apersonal opinion survey. In Model-Driven Engineering Languages and Systems,pages 149–165. Springer, 2014.
[8] B. Karasneh and M. R. V. Chaudron. Online img2uml repository: An onlinerepository for uml models. In EESSMOD@ MoDELS, pages 61–66, 2013.
[9] Nugroho, Ariadi Chaudron, Michel. (2009). Evaluating the Impact of UMLModeling on Software Quality: An Industrial Case Study. MoDELS. 181. 181-195. 10.1007/978-3-642-04425-014.
[10] J. Muskens, C. F. J. Lange, and M. R. V. Chaudron. Experiences in applyingarchitecture and design metrics in multi-view models. In Proceedings of EU-ROMICRO 2004, Rennes, France, August 2004.
[11] S. R. Chidamber and C. F. Kemerer. A metrics suite for object-oriented design.IEEE Transactions on Software Engineering, 20(6):476–493, 1994.
[12] M. Genero, M. Piattini, E. Manso and G. Cantone, "Building UML class dia-gram maintainability prediction models based on early metrics," Proceedings. 5thInternational Workshop on Enterprise Networking and Computing in HealthcareIndustry (IEEE Cat. No.03EX717), Sydney, NSW, Australia, 2003, pp. 263-275.doi: 10.1109/METRIC.2003.1232473
65

References
[13] H. C. Purchase, L. Colpoys, M. McGill, D. Carrington, and C. Britton. UMLclass diagram syntax: an empirical study of comprehension. In Australian sym-posium on Information visualisation, volume 9, pages 113–120, September 2001.
[14] Nugroho, Ariadi. (2018). The effects of UML modeling on the quality of soft-ware.
[15] R. Hebig, T. Ho Quang, G. Robles, and M. R. V. Chaudron. List of identifiedprojects with uml and replication package. http://oss.models-db.com
[16] C. F. Lange and M. R. V. Chaudron, "Managing Model Quality in UML-Based Software Development," Proceedings. 13th IEEE International Workshopon Software Technology and Engineering Practice(STEP), Budapest, 2005, pp.7-16.
[17] Len Bass, Paul Clements, and Rick Kazman. 2012. Software Architecture inPractice (3rd ed.). Addison-Wesley Professional.
[18] Marian Petre. 2013. UML in practice. In Proceedings of the 2013 InternationalConference on Software Engineering (ICSE ’13). IEEE Press, Piscataway, NJ,USA, 722-731.
[19] O. Badreddin, T. C. Lethbridge, and M. Elassar. Modeling practices in opensource software. In Open Source Software
[20] B. Karasneh and M. R. V. Chaudron, "Img2UML: A System for Extract-ing UML Models from Images," 2013 39th Euromicro Conference on SoftwareEngineering and Advanced Applications, Santander, 2013, pp. 134-137. doi:10.1109/SEAA.2013.45
[21] H. Störrle, R. Hebig, and A. Knapp. An index for software engineering models.In International Conference on Model Driven Engineering Language
[22] T. Ho-Quang, M. R. V. Chaudron, I. Sam´uelsson, J. Hjaltason, B. Karasneh,and H. Osman. Automatic classification of uml class diagrams from images.In Proceedings of the 2014 21st Asia-Pacific Software Engineering Conference- Volume 01, APSEC ’14, pages 399–406, Washington, DC, USA, 2014. IEEEComputer Society.
[23] J. Wüst. SDMetrics. http://sdmetrics.com/, last accessed: March 17, 2019,2019.
[24] Object Management Group, "OMG Unified Modeling Language Specification",Version 1.5, OMG Adopted Formal Specification formal/03-03-01, 2003.
[25] A. Riel, "Object-Oriented Design Heuristics", Addison Wesley, 1996.[26] W. Brown, R. Malveau, H, McCormick, T Mowbray, "AntiPatterns: Refactor-
ing Software, Architectures, and Projects in Crises", Wiley, 1998.[27] M. Fowler, "Refactoring: Improving the Design of Existing Code", Addison
Wesley, 1999.[28] R. Martin, "Agile Software Development: Principles, Patterns, and Practices",
Prentice Hall, 2003.[29] Brooke, John. "SUS: a retrospective." Journal of usability studies 8.2: 29-40,
2013.[30] Bangor, A., Kortum, P. T., Miller, J. T. "An empirical evaluation of the System
Usability[31] Wicks, David. (2017). The Coding Manual for Qualitative Researchers (3rd
edition)The Coding Manual for Qualitative Researchers (3rd edition) Johnny
66

References
Saldaña Sage 2015 ISBN-13: 978-1473902497. Qualitative Research in Organiza-tions and Management: An International Journal. 12. 169-170. 10.1108/QROM-08-2016-1408.
[32] A. Bangor, P.T. Kortum, and J.T. Miller. "Determining What Individual SUSScores Mean: Adding an Adjective Rating Scale." Journal of Usability Studies,4(3), 114-123, 2009.
[33] Filó, T.G., Bigonha, M.A. (2015). A Catalogue of Thresholds for Object-Oriented Software Metrics.
[34] Kecia A.M. Ferreira, Mariza A.S. Bigonha, Roberto S. Bigonha, Luiz F.O.Mendes, Heitor C. Almeida, Identifying thresholds for object-oriented softwaremetrics, Journal of Systems and Software, Volume 85, Issue 2, 2012, Pages 244-257, ISSN 0164-1212, https://doi.org/10.1016/j.jss.2011.05.044.
[35] Genero M., Piattini M. and Calero, C.: “Early Measures for UML Class Dia-grams” L Objet, vol. 6, no. 4, Hermes Science Publications, pp. 489- 515, 2001.
[36] AspNetCore. [online] Available at: https://github.com/aspnet/AspNetCore[Accessed 10 May 2019].
[37] Angular. [online] Available at: https://angular.io/ [Accessed 10 May 2019].[38] Plotly. [online] Available at: https://plot.ly/ [Accessed 10 May 2019].[39] chartjs. [online] Available at: https://www.chartjs.org/ [Accessed 10 May 2019].
67

References
68