On pre-test sensitisation and peer assessment to enhance ...
196
ON PRE-TEST SENSITISATION AND PEER ASSESSMENT TO ENHANCE LEARNING GAIN IN SCIENCE EDUCATION USING ICT TO RELIEVE TEACHERS’ TASKS Floor Bos
-
Upload
khangminh22 -
Category
Documents
-
view
2 -
download
0
Transcript of On pre-test sensitisation and peer assessment to enhance ...

ON PRE-TEST SENSITISATION AND PEER ASSESSMENT TO ENHANCE LEARNING GAIN IN SCIENCE EDUCATION
USING ICT TO RELIEVE TEACHERS’ TASKS
Floor Bos

DOCTORAL COMMITTEE Chairman: Prof. dr. H. W. A. M. Coonen University of Twente Promoters: Prof. dr. A. Pilot University of Utrecht Prof. dr. J. M. Pieters University of Twente Assistant promoter: Dr. C. Terlouw Saxion Hogeschool Enschede Members: Prof. dr. M. J. Goedhart University of Groningen Prof. dr. W. R. van Joolingen University of Twente Prof. dr. W. A. J. M. Kuiper University of Utrecht Prof. dr. ir. A. J. Mouthaan University of Twente Prof. Dr. rer. nat. B. Ralle University of Dortmund Prof. dr. M. Valcke University of Gent
Bos, A.B.H.
On pre-test sensitisation and peer assessment to enhance learning gain in science education. Using ICT to relieve teachers’ tasks Thesis University of Twente, Enschede. ISBN 978-90-365-2930-3 DOI 10.3990/1.9789036529303
Cover: Courtesy of NASA Cartoons: Ria de Graaf Layout: Sandra Schele Press: PrintPartners Ipskamp - Enschede
© Copyright, 2009, A.B.H. Bos All rights reserved. No part of this book may be produced in any form: by print, photocopy, microfilm, or any other means without written permission from the author.

ON PRE-TEST SENSITISATION AND PEER ASSESSMENT TO ENHANCE LEARNING GAIN IN SCIENCE EDUCATION
USING ICT TO RELIEVE TEACHERS’ TASKS
DISSERTATION
to obtain the degree of doctor at the University of Twente,
on the authority of the rector magnificus, prof. dr. H. Brinksma,
on account of the decision of the graduation committee to be publicly defended
on Wednesday the 2nd of December 2009 at 15.00
by
Antonius Bernardus Hendrikus Bos
born on the 23rd of August 1950
in Renkum, the Netherlands

Promoters: Prof. dr. A. Pilot, Universiteit Utrecht Prof. dr. J.M. Pieters, Universiteit Twente Assistant promoter dr. C. Terlouw, Saxion Hogescholen, Enschede This dissertation has been approved by the promoters and assistant promoter.

i
DANK (Acknowledgements in Dutch) Net als succes heeft ook dit boek vele vaders (en énige moeders) die mijn erkentelijkheid verdienen.
Allereerst wil ik mijn encadrant Cees Terlouw bedanken. Hij haalde me naar Twente, gaf me enorm veel ruimte om écht relevante problemen aan te pakken, liet mij experimenteren, dat het een lieve lust was, gaf mij zeer nuttige aanwijzingen. Zo gaf hij me de tip om nog een vierde groep aan mijn design toe te voegen, zodat er een volwaardig Solomon 4 Group Design ontstond. Met zijn tomeloze energie kwam Cees echter pas goed op dreef als er theoretische kaders in het zicht kwamen. Als er iemand mijn beeldscherm rood kleurde, dan was hij het wel en dat is heel louterend en vormend. Ook overtuigde Cees mij er meermalen van, dat ik vooral door moest gaan.
Van mijn andere encadrant én directeur de thèse, Albert Pilot, kan een PhD-student alleen maar dromen. Altijd goed geluimd, vriendelijk, scherpzinnig, een wetenschappelijke rots in de branding. Hij kan goed worden omschreven met het Jiddische woord Mensch (mentsh). Alberts opmerkingen kwamen vaak in minuscule groene zinnen in de marge. Als het commentaar digitaal werd aangeleverd, gaf de systeemklok doorgaans een tijdstip ver na 0.00 u aan, met als record 03.23 u.
Ook Cees werkte vooral ’s avonds en ’s nachts aan mijn teksten. Cees en Albert waren er ook om mij daadwerkelijke steun te geven in de tijd, dat mijn teerbeminde vanwege ziekte alle zorg en aandacht nodig had.
Verder gaat mijn dank uit naar de medewerkers van de faculteit Gedrags-wetenschappen. Jules Pieters, mijn tweede promotor, becommentarieerde op de valreep fris van de lever het eerste en het laatste hoofdstuk, waardoor deze stukken nog scherper, duidelijker en consistenter werden. Sandra Schele zorgde ervoor, dat mijn boek fraai opgemaakt bij de drukker kwam. Pieter Boerman dank ik voor de ruimte die hij me gaf. Pauline Teppich stond altijd klaar voor steun op afstand en Fer Coenders, ook Nijmeegse chemicus en lotgenoot, dank ik

ii
voor de discussies en de vriendschap. Dit laatste geldt ook voor de andere medewerkers van ELAN. Op conferenties en tijdens colloquia geven ze mij een vertrouwd gevoel.
Grande Dame Henny Kramers-Pals was degene, waar ik menig fundamenteel pedagogisch-didactisch discours mee heb gevoerd, maar was ook de initiële trait-d’union met mijn begeleiders. Ze fungeerde daarnaast als de complexerende cola die toch wat roestige bouten uit titaanromp van haar lastigste ANW-student wist los te krijgen.
Mijn collegae/lotgenoten van Chemie Didactiek in Utrecht, Gjalt Prins en Marijn Meijer alsook hun mentor Astrid Bulte dank ik voor de kritische commentaren en de gezelligheid tijdens de conferenties en workshops in Utrecht, Dortmund en Bremen en de onderwijsresearchdagen.
Het Simquest-team, inz. Wouter van Joolingen, Jan van der Meij, Koen Veermans en Ton de Jong wil ik bedanken voor het uitwisselen van de kennis, ondersteuning en software tijdens en na het GeDos project.
De collegae uit Deventer, met name Paul van Puijenbroek, Gilles Harkes en Gep Mook wil ik bedanken voor hun rol als onafhankelijke assessors. Arno Jansen, Jo Smit en Romain Rijk ben ik erkentelijk voor het vertrouwen, de ruimte en het mogelijk maken van de detachering.
In het bijzonder gaat mijn dank uit naar Harrie Braam, die onbaatzuchtig zijn beoordelingsexpertise ter beschikking stelde.
Aan Hans Overgoor en David-Samuel Di Fuccia is dank verschuldigd voor hun linguïstische bijdrage.
In deze rij mogen Dick Hake (VS) en John Hattie (Nieuw-Zeeland) niet ontbreken. Ik wil deze bijzondere wetenschappers bedanken voor hun constructieve, kritische opmerkingen en voor hun bijdrage als native speaker.
Van de paar duizend leerlingen die mij de afgelopen vier decennia duidelijk maakten hoe je natuurwetenschap moet doceren, ben ik vooral de paar honderd ‘participants’ dankbaar, die zich door mij de laatste jaren lieten overtuigen, dat meedoen aan een onderwijskundig experiment leuk en vooral héél leerzaam is. Met name de ICOSA-leerlingen hebben door hun enthousiasme ervoor gezorgd, dat lesgeven ook na lange tijd en ook in dit millennium uiterst plezierig en inspirerend kan zijn.

iii
Drie oud-leerlingen dank ik in het bijzonder: Bram, Wouter en Annemieke hebben míj opgevoed, maar ook laten zien hoe ver je kunt komen met talent en hoe belangrijk een degelijke middelbare schoolopleiding is. Zij hebben me ook geholpen door proefkonijn te zijn en hun expertise op gebied van interface design en hun technologische en wetenschappelijke kennis met mij te delen. Ten slotte verbleekt veel van dit alles bij de steun die ik jaar in jaar uit van mijn vrouw heb gehad. Zij cijferde zichzelf weg en hield mij uit de wind wanneer ik als kluizenaar achter mijn PC zat om experimenten te ontwerpen of literatuur te doorvorsen en maakte me weer mens als ik uit mijn studeerkamer tevoorschijn kwam. Vandaar, dat ik dit boek aan haar opdraag. Derhalve :
“Dit boek is voor Evely”.
iv
“Peer Assessment”

v
TABLE OF CONTENTS
1. INTRODUCTION AND RESEARCH OVERVIEW 1
1.1 Background to this study 1 1.2 A preliminary exploration 3 1.3 Pre-test sensitisation and peer assessment in a broader
theoretical context 8 1.3.1 Instructional functions 10 1.3.2 Schema theory 12 1.3.3 Feedback 14
1.4 Participants 16 1.5 An overview of the chapters 19
2. THE EFFECT OF A PRE-TEST IN AN INTERACTIVE, MULTIMODAL
PRE-TRAINING SYSTEM FOR LEARNING SCIENCE CONCEPTS 27
2.1 Introduction 27 2.2 Theoretical framework 28
2.2.1 Multi Modal or Mayer-Moreno theory (MMT) 28 2.2.2 Pre-training principle and prior knowledge 30 2.2.3 Prior knowledge and assessment 31 2.2.4 Research model 32 2.2.5 Research questions 33
2.3 Method 34 2.3.1 Design 34 2.3.2 Participants 35 2.3.3 Instruments 35 2.3.4 The treatment 36 2.3.5 General procedure 40 2.3.6 Scoring procedure 40

vi
2.3.7 Statistical Analysis 40 2.3.8 Calculating learning gains 40
2.4 Results 42 2.4.1 Primary results 42 2.4.2 Effect size and learning gain 43 2.4.3 Grouping scores by question type (multiple choice or
short-answer) 44 2.5 Conclusions 45 2.6 Discussion 46 2.7 Appendix 49
3. THE EFFECT OF PEER ASSESSMENT ON SCIENTIFIC WRITING
PERFORMANCE OF SECONDARY SCHOOL PEER ASSESSORS 51
3.1 Introduction 51 3.2 Theoretical framework 53
3.2.1 The learning processes 53 3.2.2 Learning-to-write or writing-to-learn? 53 3.2.3 Instructional design 54 3.2.4 Feedback 55 3.2.5 Peer assessment 56 3.2.6 Research questions 58 3.3.A Method experiment A 58
3.3.A.1 Design of experiment A 58 3.3.A.2 Participants in experiment A 60 3.3.A.3 Instruments in experiment A 60 3.3.A.4 Assessment procedure and statistical analysis 61
3.4.A Results of experiment A 62 3.4.A.1 Primary results 62 3.4.A.2 Gender effects and male-only analysis 63 3.4.A.3 Nearest neighbour analysis 64 3.4.A.4 Analysis of results on the level of the different
marking criteria 64 3.3.B Method experiment B 65
3.3.B.1 Design of experiment B 65 3.3.B.2 Participants in experiment B 66
3.4.B Results of experiment B 67 3.5 Conclusions and discussion 68

vii
4. LEARNING BY MARKING. THE LEARNING GAIN OF THE PEER
ASSESSOR IN SECONDARY SCIENCE EDUCATION 71
4.1.1 Background and theoretical framework 71 4.1.2 Research Questions 75 4.2.A Method experiment A 75
4.2.A.1 Experimental design and procedures 75 4.2.A.2 Participants 76 4.2.A.3 Instruments and materials 77 4.2.A.4 Correction procedure, statistical analysis, and
estimation of learning gain 77 4.3.A Results 79
4.3.A.1 Research question 1: What is the learning gain for the peer assessor himself in a conventional setting? 79
4.3.A.2 Differences between peer assessors 80 4.2.B Method experiment B 80 4.2.B.1 Experimental design and procedures 80 4.2.B.2 Participants 83 4.2.B.3 Instruments, materials and estimation of learning
gain 83 4.3.B Results 84
4.3.B.1 Research question 2: Does peer assessment with or without a preceding pre-test produce a learning gain for the assessor in an ICT-supported setting? 84
4.3.B.2 The effect of the pre-test 86 4.4 Conclusions and discussion 86
5. PRE-TEST SENSITISATION IN GUIDED DISCOVERY LEARNING
USING SIMULATIONS IN PRE-UNIVERSITY CHEMISTRY EDUCATION 93
5.1 Introduction 94 5.1.1 Rationale 94 5.1.2 Educational software as a possible solution 94 5.1.3 Computer simulations 95 5.1.4 Theory of functional instructional design 96
5.1.4.1 Pre-testing: Activation of prior knowledge 96 5.1.4.2 Peers giving just-in-time human support 97

viii
5.1.5 The Van Hiele level theory as a possible framework for design on the meso level 98
5.1.6 Interface design of the simulation environment using the Cognitive Theory of MultiModal Learning (“MMT”) 100
5.1.7 The research questions 101 5.2 Material and Methods 102
5.2.1 Experimental design 102 5.2.2 Participants 103 5.2.3 Instruments 103 5.2.4 The learning material in the treatment 104 5.2.5 Procedure 107 5.2.6 Scoring procedure 109 5.2.7 Statistical analysis 109 5.2.8 Calculating learning gains 109 5.2.9 Time scale classification 110 5.2.10 Power calculations 110
5.3 Results 110 5.3.1 Research questions 1 and 2 110 5.3.2 Research question 3 113
5.4 Conclusions 114 5.4.1 What is the learning gain of guided discovery learning in
a three-tier designed simulation-based learning environment on a near time scale (i.e. one hour)? 114
5.4.2 What are the contributions of pre-testing and/or peer support to the learning gain on a near time scale? 114
5.4.3 What is the learning gain on a distal time scale (i.e. after 2 months)? 115
5.5 Discussion 115
6. A TOOL FOR MEASURING EFFECTIVENESS OF INSTRUCTIONAL
TREATMENTS 119
6.1.1 Introduction 119 6.1.2 Problems with pre-testing 121 6.2.1 Method 125 6.2.2 Participants, instruments, procedures 126 6.3.1 Results 127 6.3.2 Comparison of methods for estimation of B 129

ix
6.3.3 The relationship between exponent B and average normalized gain <g> by Hake 130
6.3.4 Power considerations using classical analysis versus Learning Gain Exponent calculations 133
6.4 Conclusions and discussion 134
7. RETROSPECTION 137
7.1 Overview of the results by chapter 138 7.2 Compiled results 143 7.3 “A preliminary exploration ” revisited: what caused the
difference? 145 7.4 Some theoretical and methodological considerations 147
7.4.1 The nature of educational-psychological theories and design 147 7.4.2 Measuring differences between groups: Solomon Four
Group Design 149 7.4.3 Adequately measuring learning gain 149
7.5 Limits of this research and issues for further research 152 7.5.1 Motivation 153 7.5.2 Experimental group 154 7.5.3 Time scale 154
ENGLISH SUMMARY 157
NEDERLANDSE SAMENVATTING 161
CURRICULUM VITAE 165
PUBLICATIONS 167
REFERENCES 169
LINK TO SOME SUPPLEMENTARY RELEVANT FILES:
http://www.utwente.nl/elan/onderzoek/PhDthesisABHBos.zip

x

1
CHAPTER 1 Introduction and research overview This chapter starts on a macro-level (socio-economic) and micro-level (the author’s experience). On socio-economic level the Baumol effect will be introduced as an inducement to perform this research. In section 1.1 it is described, why it is relevant to investigate new learning arrangements that are more effective and also save teacher time. In the next section (1.2) an early preliminary exploration will be described, that was performed by the author long before the actual PhD work. On a micro-level the outcomes of this exploration sparked the interest in educational research and demonstrated the urge for alternative effective and efficient learning arrangements. This thesis will focus on pre-test sensitisation and peer assessment as measures to enhance learning, but these measures do not operate in a vacuum. They only can operate as part of a comprehensive learning arrangement. The broad framework of a learning arrangement is given in section 1.3, using instructional design theory as a starting point. This theoretical approach is meant (1) to give some ordering of theoretical elements and (2) to highlight some relevant theoretical aspects that were omitted in the following chapters. It must be noted that each of the Chapters 2 to 6 is a more or less independent unit with its own specific theoretical framework. After this, in section 1.4 some general data on the participants and the educational context will be presented. The introduction will end with a schematic overview of the other chapters (section 1.5).
1.1 BACKGROUND TO THIS STUDY
The availability of subject teachers in chemistry, mathematics, and physics for students in classroom sessions has decreased dramatically in the Netherlands in the last two decades. One reason for this decrease was the implementation of a new pre-university curriculum. In this implementation the teachers' task was

2
supposed to change from knowledge transfer and certification to coaching and facilitating partly self-directed learning, occasionally in cooperative small group settings. This task change resulted in a decrease in the direct availability of the teacher as a subject matter expert. Another reason for this decrease was a reduction in study load in the implementation of the new curriculum. This also contributed to the reduction of the availability of teachers in science and mathematics lessons (Tweede_Fase_Adviespunt, 2005). The reduction of teacher time per student appears to be a major international trend (OESO, 2007; Ritzen, 2006; Roes, 2001). The reduction of face-to-face contact and decreasing student/staff ratios appears to be neither typically Dutch nor incidental. Some 40 years ago the theory of unbalanced growth of Baumol already predicted this trend. According to Baumol the productivity growth of education is typically low compared to the technologically advanced (primary) sectors of the economy (Baumol, 1967). In the long run this would make education not only invaluable but also expensive. The costs of education as part of the “stagnant” sector would rise persistently and cumulatively (Baumol, Blackman, & Wolff, 1985), and productivity would decrease. The trend shown in Figure 1 aligns with the Baumol effect. Since the predictions by Baumol have been confirmed for the Western world, even if there are some optimistic views (Oulton, 2001; Van der Ploeg, 2007), from a macro-economic perspective it is wise to investigate arrangements that make education less “stagnant”.
Figure 1 Government Expenditure on Education (% of Gross Domestic Product) in
the Netherlands (CBS, 2009a)

3
An obvious measure to decrease the growing gap between productivity in the stagnant educational sector and the technologically advanced primary sector, is the introduction of technology in education. So it is necessary to look for ways to increase the effectiveness of the new technological processes and to explore possible cross-overs with the various types of existing learning processes. In science education, for example, the deep learning of science concepts requires labour-intensive stimulation in many ways (Songer, 2007; Treagust, 2007). From this point of view it is relevant to investigate ways of deep learning of science concepts that are more effective and also save teacher time.
1.2 A PRELIMINARY EXPLORATION
In the last decade of the previous millennium, a few years before the official experiments with the new curriculum (de Tweede Fase) started in secondary education in the Netherlands, the author asked the headmaster of his school for pre-university education permission to perform a preliminary educational exploration in Chemistry. In order to avoid experimenter effects (Hawthorne- and John Henry-effects), there was no explicit announcement of the exploration to students and colleagues. The purpose of the exploration was to try out proposed new teaching principles (see below) in an ecological situation. The author’s main drive was curiosity about new ways of teaching. Some of the proposed outcomes were rather appealing, aiming for autonomous, active, life-long learners. To the author it seemed possible to get better results with less teacher effort. The guidelines for the new approach were deduced from brochures and pamphlets. This information originated from the Ministry of Education, Science & Culture and centres for school improvement, e.g. the Studiehuisreeks (Simons & Zuylen, 1995a). At that time also the book “Leren en Instructie” (Learning and Instruction) (Boekaerts & Simons, 1993, 1995) was recommended to the teachers involved. An English version of the same educational views was published a few years later as principles of “New Learning” (Simons, van der Linden, & Duffy, 2000). The proposed learning outcomes were (and still are) highly valuable. The outcomes had to be: (1) durable, (2) flexible, (3) functional, (4) meaningful and (5) application-oriented (Simons et al., 2000) : Durable: non scolae sed vita discimus [We do not learn for school but for life] is written on the entrance of the late-mediaeval Latin School in Deventer - Life Long Learning needs a firm base.
4
Flexible: the possibility of applying the learned material in a new situation. Functional: refers to a just-in-time, just-in-place character. Meaningful: real understanding of a few basic principles with far-reaching importance for understanding is more important than superficial understanding of many facts that become outdated anyhow. Application-orientated: students should know the possible applications and their conditions of use (Simons & Zuylen, 1995b). The essentials of the new approach comprised the creation of active learning environments, with an emphasis on independent, self directed, self testing, and self paced learners. Metacognitive abilities were the new target instead of subject matter knowledge. The teachers' task was supposed to change from transferring knowledge and assessing to coaching and facilitating self-directed learning. Under ideal conditions—small groups of motivated students, the author as a motivated teacher and (by present standards) lots of face-to-face time—an exploration in line with the principles described above was performed. In the classroom situation all students in year 4 of a six-year pre-university, secondary school (average age 15.5 years, 51% Female) participated (N=57). The students were divided into two equivalent groups. Two classes (N=34) acted as the trial group. One class (N=23) formed the conventional group. The average school results on a 1 to 10 scale for the school subject Chemistry in the preceding half year of the trial group (6.91 ± 1.24, N=34)1 did not differ significantly from the school results of the control group (6.95 ± 1.36, N=23) : F(1,55) = 0.0165, p=0.898. A relatively easy and coherent part of the curriculum (carbon chemistry) was chosen. In order to make the new approach possible, new comprehensive instructional material was written. The subject matter was divided into five modules. For each module, two 50-minute lessons were available. For the whole trial, five weeks were available, including some holidays. The same course material was available for both the trial and conventional groups, including a kit with plastic molecular models for demonstrations. In the trial group, the teacher adapted the proposed new role as metacognitive guide. The only whole-class instruction in the trial group consisted of a process- oriented instruction, best ways of learning in this specific domain, different ways to tackle problems, suggestions for planning, evaluation and reflection (Learning to 1 The expression 6.91 ± 1.24 is in APA format : M = 6.91, SD = 1.24.
5
Learn). The students in the trial group had to study the material in a self-directed, self-regulated fashion, although collaboration was stimulated. No direct instruction or explanation of subject matter by the teacher was given. If a student asked a question, the answer was not given directly, but a solution had to be found by the student himself. In a Socratic fashion the coach asked directive questions, redirecting to the course material. In the instructional material comprehensive problems and questions were given. After solving problems, sample solutions were available for self-testing. All problems and questions were twofold. If the problem was not solved appropriately the first time, a second trial was possible; sample solutions for the duplicate set of problems and questions were present, enabling self-testing. The students that originated from primary reform schools (Montessori and Dalton schools) immediately recognized this approach. From the teacher’s rich repertoire in the conventional group one specific, well-tried teacher-centred approach was chosen to form a sharp contrast with the trial group. Each 50-minute “classical”, conventional lesson started with a small anecdote or a popular introduction to the new subject and brief review of necessary subject matter of previous lessons. Thereupon new names, concepts, and relationships were presented, sometimes with the use of (plastic) molecular models. Computers were not available in the classroom in 1995, since the computer/student ratio was 1/75 at that time. For this reason chalk and blackboard was extensively used in this instruction stage. Students made extensive annotations during this instruction. As a rule, this whole-class instruction stage lasted less than 8 minutes. After this short whole-group instruction, the students were invited to read the text on the same subject matter and make exercises. The students were suggested to work in groups of two, but they were also free to work alone. In all cases the overall process was not to be disturbed; working was the rule, so excessive walking or talking was not allowed. The atmosphere was informal, friendly, and quiet. The teacher walked around and gave brief explanations and provided feedback on the exercises. He mostly answered questions in a non-Socratic way, but sometimes answered them in a Socratic way. After 10-15 minutes the exercises were reviewed and correct solutions were given. This cycle was repeated once or twice in each lesson, depending on group speed and the complexity of the subject matter.

6
On three occasions during the 10-lesson course a 15-minute flash test was given. These tests were comprised of the same type of questions present in the learning material, and were announced in the preceding lesson. Only near transfer was needed to make the test. The flash tests were graded by the teacher, and discussed in the next lesson. The exploration was in an ecological situation, so the targets were set by the prevailing curriculum. Of course the targets were the same for both groups. The targets were explicitly and comprehensively operationalised by sample questions and problems in the instructional material. They were of the same complexity and difficulty as the post-test. The position of each student was recorded at the end of the eighth lesson, after the conventional group had “completed” module 4 (as planned). At that moment the complete conventional group was about to start with module 5. In Figure 2 the arrow indicates this position. Only a few trial students were already working with module 5. The two bars on the right of the arrow indicate these students that are ahead of the conventional group.
Figure 2 Graph showing in what module the students are working at the end of the
eighth 50-minute lesson. The conventional group is about to begin with module 5, indicated by the arrow
After completing module 5 a post-test was given to both groups. The results, depicted are depicted in Figure 3. The trial group scored (on a 0 to 100 scale) a post-test average of 45.4 ± 18.1 (M ± SD). The conventional group had an average score of 73.7 ± 16.9.

7
The difference was statistically (and educationally) significant F (1,55) = 35.4 (p= 1.91.10-7). The effect size (Cohen, 1988) of this approach was d = -1.62. From the exploration the urge followed to add measures to the applied new approach. The exploration marked the start of thinking about effective and efficient alternative learning arrangements. Later, at the start of working on this thesis two measures appeared to be promising: (1) pre-test sensitisation in order to increase effectiveness and (2) peer assessment for both increasing effectiveness and efficiency in combination with the use of ICT-supported learning processes.
Figure 3 Box plots of post-test scores of the 1995 trial and conventional group. The
box represents the inter quartile range which contains the 50% of values. The line inside the box represents the mean. The whiskers indicate highest and lowest values, excluding an outlier (= open circle)
Since it was an ecological exploration, it was necessary to “repair” the damage. Five more conventional lessons were given to the trial groups. Following this, the stronger students had reached the same level as the conventional group, while the weaker students kept their arrears. The author was puzzled by the result of the exploration. What precisely had caused the difference? His curiosity was aroused.
8
A few years after the exploration, this implementation of the new curriculum was enforced for all disciplines at the author’s school. The regime was virtually equivalent to the one in the trial group and the rules were simple: no direct instruction, no testing and no exceptions. On top of this, face-to-face time was reduced to half of what it had been before. The author had the feeling that his major didactical tools were banned. Being aware of the Baumol unbalanced growth (Baumol, 1967; Baumol et al., 1985), the author had no illusions that face-to-face time would ever come back. There was an urge to look for feasible, creative alternatives to do more in less time and without the major teacher tools such as direct instruction and assessment. In a subsidiary occupation the author was professional designer of decision support software for a large 4000-employee social organisation, so he knew the potential power of ICT and how to make it work. In the new millennium he switched from professional software engineering to the field of educational technology. This discipline has two aspects. The scientific aspect is to explore why things work. The engineering aspect is to design new methods and tools for ICT solutions. The problem solver has to be practical: if something works, it works. The power lies within the combination of the two aspects. In the next decade the author started to read, think, explore, design, experiment and think again. This book is the highly formalised story of this quest.
1.3 PRE-TEST SENSITISATION AND PEER ASSESSMENT IN A BROADER
THEORETICAL CONTEXT
Within the context of the curriculum reform, of which the characteristics have been discussed above, and with the experience form the experiment described above, the question became pertinent whether it would be possible to design a teaching and learning arrangement that could meet the new requirements. Arrangements that would both be effective, in order to achieve the learning outcomes, and efficient, to achieve the outcomes with less teaching time, were desired. This thesis describes a couple of studies that have been directed to achieve these objectives. The general research question encompassing the various studies is:
What are the characteristics of an alternative learning arrangement, that is both effective and requires less teacher time?

9
The question is focused on two promising measures: (1) pre-test sensitisation and (2) peer assessment. The first measure might enhance effectiveness of a subsequent intervention. Peer assessment, on the other hand, relieves the task of the teacher and contributes to higher efficiency, but might have more interesting effects (by subsequently increasing effectiveness). Both measures can be connected to a main learning process. In this section a framework for the design of an integral learning process is outlined, that can serve as a context for the two specific measures as well. The theoretical approach in this section is meant (1) to give some ordering of theoretical elements and (2) highlights some relevant theoretical aspects that could not be given in the articles Chapter 2 to 6. It must be noted that each of these chapters is a paper with its own specific theoretical framework. The educational application of Information and Communication Technology (ICT) in optimal settings is obvious and promising in order to contribute to efficient and effective teaching (Osborne & Hennessy, 2003), since the teacher might be relieved by a balanced use of the versatile possibilities of interactive, multimodal courseware. However, success or failure of ICT applications depends on some critical factors. Valdez et al (2000) point out the congruence between courseware design and the target instructional environment (Valdez et al., 2000). Educational ICT tools require a very careful design and proper embedding in an overall instructional approach (O. De Jong & Taber, 2007). Theoretical grounding is needed for both design of the intervention and for the proper embedding and in fact, in this thesis a multilevel, multilateral theoretical approach is used. Within an overall theory of instructional design more specialized sub theories can further explain the effectiveness and efficiency of the measures that are proposed before. On the one hand, the first measure aimed at increasing effectiveness, can be substantiated by cognitive psychological approaches, like the Schema Theory and the Cognitive Theory of MultiModal Learning (MMT) by Mayer and Moreno. On the other hand, to increase efficiency, theories on feedback and assessment can be used: a framework based on feedback by Sadler. Van Hiele’s Level theory (originating from Mathematics education) can also be applied in order to hypothesize the effectiveness of the core of the learning arrangement.

10
In this introductory chapter the coherence and broad outlines of the general theoretical framework and consecutive theories are presented. These theories are further elaborated in the studies that are to be reported in the subsequent chapters. Relevant theoretical and methodological details in the context of a specific study are given in the appropriate chapters.
1.3.1 Instructional functions
The broad theoretical approach in this thesis starts by using an overall functional instructional design theory. In this theory “Instructional function” is a central concept. An instructional function (Terlouw, Kramers-Pals, & Pilot, 2003) is defined as an essential, generally formulated activity that has to be performed in order to reach some specified learning result. Earlier research (Kramers-Pals, 1994; Mettes, Pilot, & Roossink, 1981b; Terlouw, 1987; Terlouw, Kramers-Pals, & Pilot, 2004) learned that an approach based on the instructional-learning theory of Gal’perin (Arievitch & Haenen, 2005) was fruitful. In Gal’perin’s theory of learning and instruction a stepwise instructional strategy is postulated in order to realize processes that are necessary to complete a learning task: building up the motivation, orienting on the learning tasks, practicing the learning task in a sequence of practicing the material, and the verbal and mental level. Both learning processes and results have to be evaluated in an increasingly self-regulated way. In Table 1 (next page) an overview of the conditional and main functions is given (Terlouw et al., 2003). These functions are more extensively described by Terlouw (Terlouw, 1993). Schema theory, details follow in next section 1.3.2, gives a clear perspective on the conditional instructional function #2 (connecting with the initial situation of the learner) as well as the main function of Orienting. Schema theory is also part of the theoretical foundation of cognitive load theory, which in turn has been incorporated in The Cognitive Theory of MultiModal Learning (“MMT”) by Mayer and Moreno (2005a). The main instructional functions of Orienting and Practice can be specified at a meso level by Van Hiele’s Level theory. This theory originates from Mathematics Education and is outlined in Chapter 5.

11
Table 1 Instructional functions of the instructional design model (Terlouw et al., 2003) Instructional functions Conditional functions 1. Motivating 2. Connecting with the initial situation of the learner 3. Giving insight into the intended final level of learning results Main functions Orienting
4. Discovering and acquiring information about knowledge elements and
the problem approach 5. Making operational: knowledge elements and the problem approach Practicing 6. Practicing the use of knowledge elements and the problem approach 7. Giving feedback 8. Giving the opportunity to reflect Testing
9. Investigating which learning results have been reached, and whether
they are in accordance with the norm Orienting and Practice ultimately demand some form of interface. Mayer Moreno theory, mentioned above, provides practical guidelines for building interactive courseware. The main instructional function Testing appears to be of a critical importance. A practical, effective framework dealing with feedback issues is given by Sadler (D. R. Sadler, 1989) and Hattie (Hattie & Timperley, 2007). Some highlights will be given in section 1.3.3. In two contexts Vygotsky introduces the Zone of Proximal Development (ZPD) (Shayer, 2003). The ZPD determines the lower and upper bounds at which instruction should be pitched (Vygotsky, 1978). It is created in the interaction between the learner and his social environment; therefore, it is a dynamic attribute of an individual student in a particular activity setting. Vygotsky explicitly mentioned peers in his description of the zone of proximal development: "the distance between the actual developmental level as determined by independent problem solving and the level of potential development as determined through problem solving under adult guidance or in collaboration with more capable peers" (Vygotsky, 1978, p.86). In the experiment of Chapter 5, peer support is put into the instructional framework. The learner gets immediate support, adjusted to the needs of that very moment. As the peer speaks and points at the screen the learners get auditory and visual supporting

12
information. Theory indicates that the range of skills that can be developed with peer collaboration exceeds what can be attained by the learner alone. In Figure 4 the relationship between the Instructional Design Theory and the specifying theories is schematised as well as the linked processes.
Figure 4 Multi faceted theoretical approach and points of application in a schematic
learning arrangement. This scheme is meant for broad orientation. The main focus in this thesis is on two aspects: pre-test sensitisation (bottom left) and peer assessment (bottom right)
1.3.2 Schema theory
Schema theory is hardly a cutting edge theory, since the concept was already used by Kant (Kant, 1787; Veenbaas & Visser, 2004) and coined by Bartlett (Bartlett, 1932).

13
However, the usability and contextual validity of a theory must be the reason for its use and not its age. Around 1980 schema theory was used frequently (Rumelhart & Orthony, 1977), but after 25 years the concepts in this theory are still useful. Prior knowledge and background knowledge are synonyms, implicitly referring to schemata and scripts (Strangman et al., 2004). Also from a constructivist point of view, the schema concept is suitable in educational science (Derry, 1996; McVee, Dunsmore, & Gavalek, 2005). According to schema theory, concepts are clusters of knowledge, strongly interrelated and stored in long term memory. They often have a hierarchical structure that describes more complex, nested concepts. Schema theory describes the interaction of incoming data with the existing knowledge by a process of selection, abstraction, interpretation and integration (Benjafield, 2006). The initial accretion stage (accumulation of new facts and information) is followed by an intermediate tuning stage (slow modification of structures) and leads to a final restructuring phase (new schemata are constructed). Meaningful learning can take the form of a continuous multistage process, but is not necessarily sequential. Learners may shift from one stage to the other, back and forth. Activation of relevant existing knowledge networks of schemata in the long term memory prior to the acquisition of new knowledge can facilitate connection to new information. The concept of class or object in computer science can be recognised as a highly formalised representation of the schema concept as defined by Rumelhart & Orthony (1977). The use of the class concept (Stroustrup, 1999), in the computer language C++ and related newer languages (Java, Delphi, C#), has led to a radical paradigm shift in software development, although the essentials of classes are concealed in object-oriented programming environments by the use of visual components. Drag and drop activities do not require full understanding of the complex processes and relationships underlying the moving screen pictograms. Investigating the functions of educational objects (classes) for defining and designing instruction and more specific scientific courseware, could further contribute to effective use of these concepts. Schemata play a key role in the cognitive load theory (CLT) by Sweller (Sweller, 2005a), which forms an integrative part of the cognitive theory of multimodal learning by Moreno & Mayer. With the implicit use of the schema concept basic

14
cognitive low level processes can be understood, with implications for the design of interactive and technological educational tools (see chapters 2 and 4). On another level, schema theory is important to understand the essential difference between meaningful learning and rote learning. The learning of fragmented, isolated facts leads to inert knowledge, whereas learning aimed at the (re)construction of integrated coherent mental structures (i.e. schemata) leads to flexible, transferable knowledge (Mayer, 2005c). Pre-test sensitisation, which plays a role in Chapter 2, can be understood in terms of its reactivation of memory traces of existing schemata, making them more accessible (Lasry, Levy, & Tremblay, 2008; Van Parreren, 1970)
1.3.3 Feedback
Giving feedback, explicitly mentioned in instructional function number 7 in Table 1, is of course connected to instructional function # 9 (testing). According to Hattie and Timperley, this function exerts one of the most powerful influences on learning and achievement (Hattie & Timperley, 2007). From Hattie’s study on a synthesis of 800 reviews involving 50,000 effect sizes (Hattie, 2008; Hattie & Timperley, 2007) it can be concluded that feedback with an effect size of d=0.79 belongs to the highest influences on achievement in Hattie’s synthesis, along with direct instruction (d=0.93), reciprocal teaching (d=0.86), and students’ prior cognitive ability (d=0.71). (See Fig. 5).
Figure 5 Effect sizes of various influences on achievement (data from Hattie &
Timperley, 2007)

15
Peer assessment is one the focal points of this thesis. Normally, assessing student products and giving feedback on them is a complex, yet essential task for a teacher. Sadler (1989) is placing assessment in the centre of the learning process by giving it a clear function: feedback actively decreases the gap between the reference level (the learning outcome being aimed and the actual level of performance (D. R. Sadler, 1989). A secondary goal is the transfer of teachers' knowledge on assessment criteria to students, making self-monitoring by students possible. Giving assessment in the form of a single mark can hardly be considered feedback. Stated explicitly (Roossink, 1990; D. R. Sadler, 1989) the student: 1. has to possess a notion of what performance or product is expected (the
reference level). 2. must have the chance to compare his actual level with the reference level. 3. will have to engage in an appropriate action to decrease the gap. Figure 6 displays a schematic overview of the cyclical process of assessment and feedback, derived from principles introduced by Sadler (1989) and discussed above. Feedback as part of this cyclical process plays a key role in chapters 3 and 4.
Figure 6 The assessment and feedback cycle. The focus in parts of this thesis is on the
learning effects of the peer assessor

16
1.4 PARTICIPANTS
In order to assess external validity and to understand the salient outcomes of this thesis it is necessary to have some idea about the type of students that participated in the studies. Therefore in this section some general quantitative data will be presented. Experiments in this research project were performed with students from the upper level of a pre-university secondary school (in Dutch VWO). The upper level stage of the 6 year pre-university education lasts 3 years. In the experiment only those students who took chemistry, physics, and mathematics (“the Nature profile”) participated. In this research the average age at the start of year 4 was 15.5 ± 0.5 yr. 52% of the students were female. The participants may be considered typical for students of this Nature profile, but are not a random sample of their age group. At the end of primary school, 85 percent of Dutch pupils make an independent nationwide test at age 11.5 years (Citogroep, 2009a). The test score is used as one of the indicators for recommending type of secondary education. A test score between 545 and 550 indicates the type of school where the experiment took place. In Figure 7, (1) nationwide data, (2) data of the town where the studies took place, and (3) available data of the participants are compared. From this graph it may be concluded that (a) the pupils in town “D” form a representative sample and (b) the population the highest scoring students are dominantly present in the experimental groups. As stated before, this figure is helpful to assess external validity and to understand the salient outcomes of this thesis.

17
Figure 7 Relative frequencies of scores for the “CITO test” at the end of primary
education (1) Curve: relative frequency nationwide data (N=278304) (Citogroep, 2009b).2 (2) Dots: relative frequency of pupils in the town “D”, where the experiments
took place (N=2806). (3) Bars: relative frequency of scores of participants (Nature-profile) (Average 545.6, N=193).
2 At the right at abscissa = 550 an artefact can be spotted. It is a ceiling effect.

18
There was a reason to choose participants 15.5 years and older. Adolescence to early adulthood is a period of dramatic transformation in the healthy human brain. According to Piaget, an adolescent has reached the end of the stage of formal operations when his cognitive structural equipment has fully matured. His potential to reason or think as an adult is present (Wadsworth, 1984). This view is supported by Westenberg, who combines neurological data with psychosocial development (Westenberg, 2008). A check on the cognitive maturation in adolescence of the students participating in the research of this thesis can be found in Figure 8. The author has used in 2004 the Lawson Classroom Test of Scientific Reasoning (Coletta & Philips, 2005; Lawson, 1987) to study this cognitive maturation at the school where the other studies took place. The test was given to 174 comparable pre-university students in 6 classes. In Figure 8 the results are presented. The data indicate that students around age 15.5 years are very close to the maximum.
Figure 8 Average scores (0-100 scale) of the Lawson Classroom Test of Scientific
Reasoning as a function of age. Participants (N=174) are groups from different years of the same secondary school for pre-university education where the experiments took place
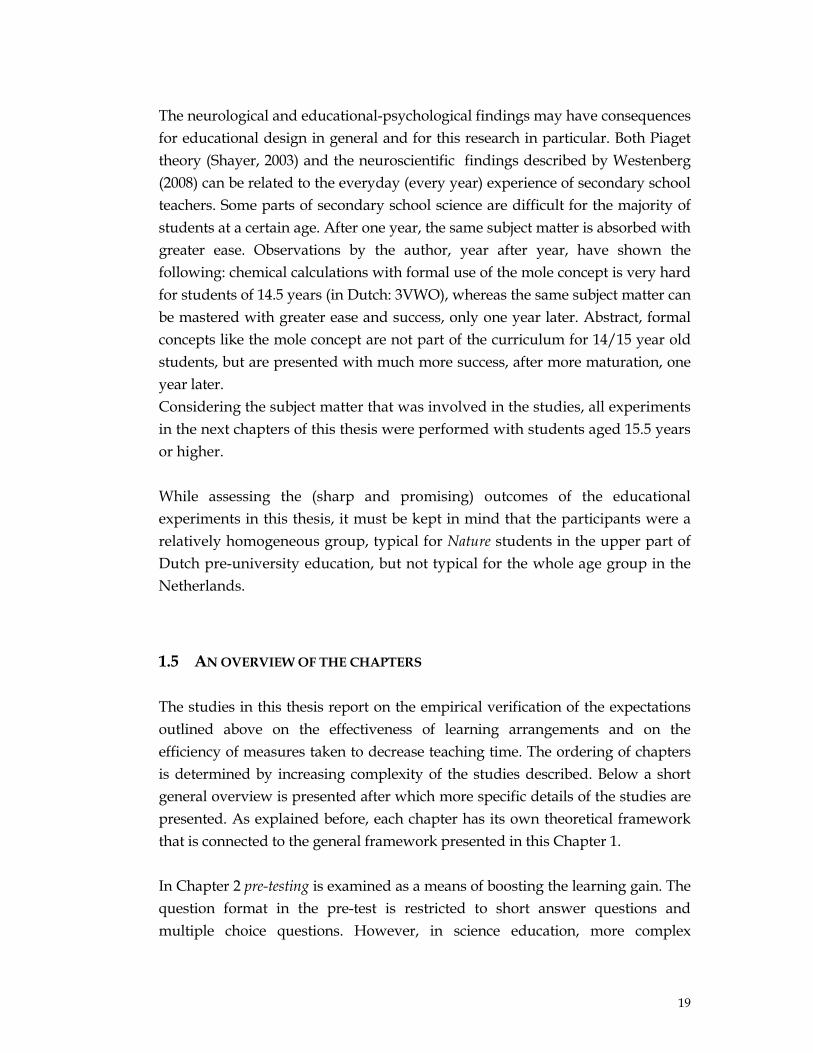
19
The neurological and educational-psychological findings may have consequences for educational design in general and for this research in particular. Both Piaget theory (Shayer, 2003) and the neuroscientific findings described by Westenberg (2008) can be related to the everyday (every year) experience of secondary school teachers. Some parts of secondary school science are difficult for the majority of students at a certain age. After one year, the same subject matter is absorbed with greater ease. Observations by the author, year after year, have shown the following: chemical calculations with formal use of the mole concept is very hard for students of 14.5 years (in Dutch: 3VWO), whereas the same subject matter can be mastered with greater ease and success, only one year later. Abstract, formal concepts like the mole concept are not part of the curriculum for 14/15 year old students, but are presented with much more success, after more maturation, one year later. Considering the subject matter that was involved in the studies, all experiments in the next chapters of this thesis were performed with students aged 15.5 years or higher. While assessing the (sharp and promising) outcomes of the educational experiments in this thesis, it must be kept in mind that the participants were a relatively homogeneous group, typical for Nature students in the upper part of Dutch pre-university education, but not typical for the whole age group in the Netherlands.
1.5 AN OVERVIEW OF THE CHAPTERS
The studies in this thesis report on the empirical verification of the expectations outlined above on the effectiveness of learning arrangements and on the efficiency of measures taken to decrease teaching time. The ordering of chapters is determined by increasing complexity of the studies described. Below a short general overview is presented after which more specific details of the studies are presented. As explained before, each chapter has its own theoretical framework that is connected to the general framework presented in this Chapter 1. In Chapter 2 pre-testing is examined as a means of boosting the learning gain. The question format in the pre-test is restricted to short answer questions and multiple choice questions. However, in science education, more complex

20
problems with complex answers are often more appropriate. Assessment of these student products demands human intervention. Since teacher time is limited, a solution for assessment time has to be found. In Chapter 3 peer computer- supported assessment of scientific reports is examined as a possible solution. An interesting product of peer-assessment is the learning effect on the assessor himself. In Chapter 4 the focus is on learning gain through the combination of pre-testing as well as peer assessment. The most complicated experiment in Chapter 5 comprises pre-testing as well as the application of peer support. In the design of the main intervention in this experiment, the specification of the instructional functions Orienting and Practice demands special attention. In the accompanying activities peer assessment is used also in the training of the supporting peers. From a methodological point of view, Chapter 6 may be the most promising. The focus in this chapter is on an analysis of the tool developed for measuring learning gain in the former chapters. The findings in a relatively simple intervention reveal a strong relationship between pre- and post-test. This can be used to gauge the effectiveness of educational interventions. Below the chapters are outlined in a more detail. In the lower part of Figure 4 a schematic view of a learning arrangement has been shown. In the five studies in this book the focus is on certain aspects. In the schematic views that go with each chapter the focus of the experiment is visible in an oval form with 100% opacity. Overlap of process rectangles signifies the degree of integration of the constituent processes. The focus of the study in Chapter 2 is depicted in Figure 9.
Figure 9 Focus of the study in Chapter 2

21
In Chapter 2 the effect of pre-testing prior to an interactive, multimodal pre-training treatment has the focus. Assessment of prior knowledge at the start of a treatment has a bad reputation in methodology. For decades the effect of assessment is known under the name pre-test sensitisation, from test methodology as an unwanted side effect (Shadish, Cook, & Campbell, 2002). Two aspects are reported: An undesired effect when the pre-test is used as a post-test and hence is taken
for the second time. It is considered a threat to the internal validity of the experiment.
The interaction between the pre-test and the treatment (Lana, 1959, 1960, 1969). The Solomon Four Group Design (S4GD) (Shadish et al., 2002; Solomon, 1949) is an experimental set-up making it possible to investigate effects in relation to pre-testing. The second effect (interaction between the pre-test and the treatment) is also known as pre-test sensitisation. It might be interesting from an educational point of view as it can be considered a way to activate prior knowledge in line with the Mayer Moreno Theory. In this study the answers to the following questions are answered: 1. What is the effect of interactive, multimodal pre-training treatment with or
without a pre-test? 2. Is there an interaction between the pre-test and the main treatment? 3. Is there a difference between the effects of a pre-test that consists of short-
answer questions (SAQ) and one that consists of multiple choice questions (MCQ)?
4. Is time-on-task a significant variable? The focus of the study in Chapter 3 is depicted in Figure 10.
Figure 10 Focus of the study in Chapter 3

22
Scientific communication is an important instructional goal in secondary science programs. Although writing is deemed complex, students rarely receive systematic or formal training in writing scientific texts since the overloaded programs in secondary science education hardly allow for writing assignments. Another reason according to Sternberg (2003) is an apparent widespread delusion that students receive sufficient training in writing through informal channels, and will acquire the necessary skills on their own (Sternberg, 2003). However, one cannot expect to get good science reports from students without teaching them how to write them. Therefore, the general problem addressed in this study concerns the design of an effective and efficient training situation by using peer assessment in a science curriculum for learning scientific report writing. Under the right conditions students might be able to perform a portion of teacher tasks by doing peer assessment. Furthermore, an important by-product of the assessment of the work of a fellow student is the learning effect on the assessor him- or herself. Both students who assess and students who are assessed are offered the possibility of learning from their mistakes and improving their learning results. Two birds are killed with one stone: the peers partly relieve the teacher from a labour intensive task (efficiency) and self-monitoring in the learning process is fostered (effectiveness). Two experiments are needed to answer the following research questions: 1. Does the writing of a scientific report followed by pencil-and-paper peer
assessment lead to significantly better writing of a scientific report of peer assessors?
2. What type of (marking) criteria is significantly improved by this arrangement?
3. Does computerized peer assessment in the process of practice lead to a significantly improved writing of a scientific report of peer assessors?
The focus of the study in Chapter 4 is depicted in Figure 11. In the learning cycle as described by Sadler (1989), the learner is normally a student whose work has been assessed and who gets feedback from the teacher. But the learner can also be the assessor who is assessing the output of another student, who applies the criteria, decides on feedback, and learns from these activities. The focus of this study is on the learner who is peer assessor.

23
Figure 11 Focus of the study in Chapter 4 The importance of students’ taking responsibility for their own learning as well as reducing the teachers’ correction burden is a good reason for peer- and self-assessment of formative tests. Moreover, the learning effect on the assessor himself is underexposed in the literature, making research relevant, because it could be a third good reason for grading by students. Because the learning gain of the peer assessor himself is not clear yet, the study described in Chapter 4 will concentrate on measuring this effect. In formative testing this learning effect might be more important than the precision and accuracy of the grading given by the students. The result of formative testing has a function in the learning process, and is of minor importance for allocation, selection or certification. In contrast to summative testing the focus in formative testing is on feedback, reflection, diagnosis and monitoring of the learning process (William & Black, 1996). In this chapter the two issues concerning peer assessment will be addressed by the following research questions: 1. What is the learning gain for the peer assessor himself in a conventional
setting? 2. Does (formative) peer assessment with or without a preceding pre-test
produce a learning gain for the assessor in an ICT-supported setting? The focus of the study in Chapter 5 is depicted in Figure 12.

24
Figure 12 Focus of the study in Chapter 5 The efficient use of Information and Communication Technology (ICT) is a promising opportunity to increase the effectiveness of learning scientific subject matter. Computer simulations can contribute much to meaningful learning. The learners actively evaluate and expand their prior knowledge, and reconstruct their conceptions and naive notions. However, scientific discovery learning based on simulations does not always give clear univocal learning outcomes (T. De Jong & van Joolingen, 1998). In this chapter a three-tier approach for design of effective courseware for simulation-based scientific discovery learning is presented, based on a theory of functional instructional design, the Van Hiele's level theory, and the cognitive theory of MultiModal learning. Pre-testing is implemented for the activation of prior knowledge, and peer support is implemented to give the learners just-in-time human support. The research questions addressed in this study are: 1. What is the learning gain of guided discovery learning in a three-tier
designed simulation-based learning environment on a near time scale of about one hour?
2. What are the contributions of pre-testing and/or peer support to the learning gain on a near time scale?
3. What is the learning gain on a distal time scale of about 2 months? In this study the tests comprise questions that cannot be solved by simple retrieval. The study in Chapter 6 addresses a fundamental, methodological issue: “how to gauge the effectiveness of a learning process”. Calculating the effect size is the customary method, but three problems are connected with this approach : (1) in order to attain sufficient statistical power, this method requires a large number of

25
participants, (2) precious information is lost and (3) pre-test scores are not used appropriately (in the case of a pre-post design of course). An alternative approach is suggested, based on empirical data from a very elementary learning process, making use of the testing effect: ask the learner a question, let him produce an answer, and give him feedback on the answer. This elementary set up is depicted in Figure 13.
Figure 13 Focus of the study in Chapter 6 The questions to be answered in this chapter are: 1. What is the relationship between pre- and post-test data? 2. What is the best way to evaluate the model parameter from experimental data? 3. What is the relationship between the model parameter and the gain defined
by Hake (1998)? 4. What is the statistical power of the method using the model parameter as
learning gain measure? In Figure 14 a schematic overview of the focus in the studies is given. In the final Chapter 7 the results of chapters 2 to 6 will be summarized, after which these results will be compiled and discussed. Then the preliminary exploration in section 1.2 will be discussed, using the spin-off of the PhD work on this thesis. The role of theory in general and the theoretical framework in section 1.3 will be evaluated. The methodological issues of design and instruments will be treated next, as well as the limitations of the study. Some new research issues will be formulated that have arisen during these studies and are worthwhile for further investigation. After that, the usability of the results will be sketched, e.g. for further curricular development in science education, the context-based approach. Finally, some indication of external validity and learning effects on a far time scale will be given.

26
Chapter 2 Pre-test
sensitisation &
pretraining
Chapter 3 Peer assessment
of a scientific publication
Chapter 4 Pre-test
sensitisation &
peer assessment
Chapter 5 Pre-test
sensitisation & peer support
Chapter 6 A Tool for Measuring
Effectiveness of Instructional Treatments
Figure 14 Schematic overview of the focus in the studies
27
CHAPTER 2 The effect of a pre-test in an interactive, multimodal pre-training system for learning science concepts3 ABSTRACT
In line with the cognitive theory of multimedia learning by Moreno & Mayer (2007) an interactive, multimodal learning environment was designed for the pre-training of science concepts in the joint area of physics, chemistry, biology, applied mathematics, and computer sciences. In the experimental set up a pre-test was embedded in order to increase the effect of the treatment. The pre-test consisted of short-answer and multiple choice questions. The results show a high learning gain, especially after applying a pre-test. The learning gain was insignificant if no treatment followed the pre-test. The pre-test effect did not depend on the question type. Time-on-task was not a significant variable.
2.1 INTRODUCTION
Teacher time is becoming more and more a scarce commodity as the result of the gradual reduction of face-to-face contact, at least in Europe (OESO, 2007). This teacher time reduction is a compelling reason to investigate the effectiveness of proposed alternatives such as more efficient educational arrangements. A promising efficient alternative appears to be the application of Information and Communication Technology (ICT), since to some extent the teacher might be relieved by a balanced use of the versatile possibilities of interactive, multimodal courseware. 3 Paper presented at ORD 2005 (Bos, Terlouw, & Pilot, 2005), EARLI 2007 (Bos, Terlouw, &
Pilot, 2007a). Published in Tijdschrift voor Didactiek der β-wetenschappen (A.B.H. Bos, C. Terlouw, & A. Pilot, 2008a). Accepted for Educational Research and Evaluation (Bos, Terlouw, & Pilot, 2009).

28
The cognitive theory of multimedia learning by Moreno & Mayer (2007) offers five design principles that makes it possible to test the claims for effectiveness of ICT-based interactive multimodal environments (Moreno & Mayer, 2007). In this paper the study concerns one of the design principles: the pre-training principle.
2.2 THEORETICAL FRAMEWORK
2.2.1 Multi Modal or Mayer-Moreno theory (MMT)
The Mayer-Moreno cognitive-affective theory (see Figure 1) deals with student learning in interactive multimodal learning environments that “use two different modes to represent the content knowledge: verbal and non-verbal. (…) Students are presented with a verbal representation of the content and a corresponding visual representation of the content” (Mayer & Moreno, 2007, 310). Next to multimodality, interactivity is another essential characteristic of these learning environments. Interactivity in this context is the use of multidirectional communication. Types of interaction are dialoguing (e.g. learner receives questions and feedback on answers), controlling (e.g. learner determines own pace), manipulating (e.g. learner sets parameters for a simulation), searching (e.g. learner seeks information on internet), and navigating (e.g. learner clicks on a menu for selection of an information source) (Mayer & Moreno, 2007, 310). How do students learn in such interactive multimodal learning environments? The theory by Mayer et al. is strongly connected to the more fundamental Cognitive Load Theory (CLT) (Sweller, 1988, 2005a). Both MMT and CLT combine aspects of human cognitive architecture. An accumulated empirical research base gives support for three assumptions about human learning: (a) humans possess separate systems for processing pictorial and verbal material (dual-channel assumption), (b) each channel is limited in the amount of material that can be processed at one time (limited-capacity assumption), (c) meaningful learning involves cognitive processing including building connections between pictorial and verbal representations (active-processing assumption) (Mayer & Moreno, 2003). These assumptions also make clear that “a potential challenge for learning from interactive multi modal environments is that the processing demands may exceed the processing capacity of the cognitive system, a situation we call cognitive overload” (Mayer & Moreno, 2007, 314). For this reason they examined the

29
relationship between the cognitive demands imposed by the learning environment and the desired learning outcomes. Four processes are important during student learning: extraneous processing, representational holding, essential processing, and generative processing (Mayer, 2005d; Moreno & Mayer, 2007) .
Figure 1 A cognitive-affective model of learning with media (Moreno & Mayer, 2007,
p. 314) ‘Extraneous processes’ originate usually in poorly designed instructional materials resulting in cognitive processes that are not necessary for making sense of the new materials. ‘Representational holding’ is a special subclass of the former process and concerns cognitive processes aimed at (unnecessarily) holding a mental representation in working memory during the meaning-making process. Both unnecessary processes waste the learner’s limited processing capacity. ‘Essential processing’ comprises the cognitive processes for the mental selection of the new information that is represented in working memory. The amount of essential processing asked for can also exceed the processing capacity of the cognitive system. ’Generative processing’ finally are the cognitive processes that make sense of the new information by mentally organising the new information into a coherent structure (a schema), and by integrating the new knowledge representation with prior knowledge (see also assumption (c) above). Mayer & Moreno (2007) propose five empirically based principles of instructional design for interactive multimodal learning environments in order to reduce extraneous processing and representational holding, manage essential processing, and foster generative processing (Table 1).

30
Table 1 Five Instructional Design (ID) Principles Guided activity Essential and generative processing is promoted by prompting learners to
engage in selection, organisation, and integration of incoming data. Reflection Essential and generative processing is promoted in the process of
meaning making. Feedback Especially explanatory feedback reduces extraneous processing. Learners
can use the proper schemata to repair misconceptions. Self-pacing The learner is allowed to process chunks of information of appropriate
complexity. Pre-training When relevant prior knowledge is activated or provided, new
information is integrated more easily. This study will focus on one of the ID-principles, the pre-training principle, and the specification of this ID principle for application in the design of an interactive multimodal learning environment for science in the upper level of secondary education.
2.2.2 Pre-training principle and prior knowledge
A solution to reduce cognitive overload in the processes of selection, organisation, and integration of relevant information in an instructional message is pre-training: people learn more deeply from a multimedia message when they know the names and characteristics of the main concepts (Mayer, 2005d). In a typical experiment, Mayer and co-workers provided learners with the names and characteristics of the components of mechanical systems (tire pumps and brakes). The second stage focused on how each component is functioning within the system. Students in the pre-training group performed better than students in other groups on tests of transfer and retention (Mayer, Mathias, & Wetzell, 2002). In seven out of seven comparable experiments with an interactive, multimodal computer based set up, it was shown that people learn better when they know the names and basic characteristics of the main concepts. A median effect size of d=0.92 was reported. The effect is the highest with low-experience learners, indicating that high experience learners are less likely to encounter essential overload (Mayer, 2005d). The theoretical rationale for this principle is that the essential cognitive load is reduced: the learner is equipped with prerequisite knowledge that is essential to build coherent schemata in the pre-training stage. The classic view of Rumelhart and Norman suggests three qualitatively different kinds of learning: (a)

31
restructuring or schema creation, the process whereby new schemata are created; (b) accretion, or the encoding of new information in terms of existing schemata; and (c) tuning or schema evolution, or the slow modification and refinement of a schema (Rumelhart & Norman, 1978). In this view the pre-training as presented in the experiments on pre-training is connected to process (a). Essential chunks of prior knowledge have to be present or activated before they can be integrated with incoming new information. Activation of prior knowledge by asking questions before a treatment might result in the same cognitive load levelling or peak shaving intended by the pre-training principle of MMT. Essential processing demands are reduced when relevant schemata have been retrieved from long term memory and processed immediately before the main learning stage (Mayer, 2005b). The same process of retrieval of information occurs when an answer to a relevant question has to be formulated. Strangman, Hall & Meijer (2004) also indicate the positive influence of asking questions in their review on activating prior knowledge. Asking questions about prior knowledge in a learning situation is perceived as a form of assessment by teachers and learners and is considered by them as a relevant activity (Strangman, Hall, & Meyer, 2004).
2.2.3 Prior knowledge and assessment
Dochy, Segers, & Buehl (1999) surveyed thoroughly the role of prior knowledge and the influence of the assessment method of prior knowledge. There is a strong relationship between prior knowledge and students’ performance: 92% of the 183 reviewed studies report positive effects. Between 30 and 60% of the variance is explained by prior knowledge. The method of assessment of prior knowledge strongly influences the outcomes of learning. Objective assessment methods are connected with positive outcomes. Less objective assessment methods such as familiarity ratings and self-estimations, do not result in positive outcomes, but are useful to find explanations for effects of prior knowledge on performance. The general conclusion of the review of Dochy et al. (1999) is that prior knowledge is indeed an effective aid for learning. It is also suggested that students’ reflections on the outcomes of assessment of their prior knowledge may have a facilitating effect on their learning (Dochy, Segers, & Buehl, 1999). Assessment of prior knowledge at the start of a treatment has a bad reputation in research. For decades the effect of assessment is known under the name pre-test

32
sensitisation from test methodology as an unwanted side effect (Shadish, Cook, & Campbell, 2002). Two aspects are reported: An undesired effect occurs when the pre-test is used as a post-test and hence is
taken for the second time. It is considered a threat to the internal validity of the experiment.
The interaction between the pre-test and the treatment (Lana, 1959, 1960, 1969).
The Solomon Four Group Design (S4GD) (Shadish et al., 2002; Solomon, 1949) is an experimental set up making it possible to investigate effects in relation to pre-testing (see the methods section). The second effect (interaction between the pre-test and the treatment) is also known as pre-test sensitisation. It might be interesting from an educational point of view as it can be considered a way to activate prior knowledge in line with MMT described above. From 32 studies in a meta-analysis concerning pre-test sensitisation effects Wilson & Putnam (1982) selected 132 results out of 164 in which randomised groups were used. A pre-test effect was found that cannot be safely ignored: an average effect size of d= 0.22 (range between –0.55 and +4.06) was found, with a strong influence of type of outcome, age, and time between pre- and post-test. The effect does not appear to be uniform across the psychological domains. 81 % of the cognitive effects were positive. In other domains (affective, attitude, personality) this fraction was much smaller. Cognitive gains (average effect size d= 0.43) are the largest with memory and practice effects when pre- and post-test are the same. The studies reported were not considered exhaustive enough to provide definitive statements about conditions for variation of pre-test sensitisation (Willson & Putnam, 1982), but from the study of Strangman et al. (2004) it seems also plausible that making explicit the prerequisite knowledge of students may contribute to activation effectiveness. A student makes knowledge explicit e.g. by formulating an answer to a question that is intrinsic to open questioning (Strangman et al., 2004).
2.2.4 Research model
On two levels the model in this study is in accordance with the pre-training principle of Moreno & Mayer (2007). An interactive multimodal treatment is built as a pre-training, in which the prior knowledge is provided. The objective is to learn the names and characteristics of science concepts, as an orientation base for further curricular activities in the forthcoming weeks in the disciplines General Science, Chemistry, and Information Science.

33
Within this treatment a pre-training is specified with a pre-test that sensitises or activates the prior knowledge. In Figure 2 this nested set-up is displayed, in which (a) a pre-test activates prior knowledge, directly followed by (b) a treatment in which prior knowledge is provided for science courses later. The effect of the treatment after the post-test (dotted in the figure) is not a part of this study.
Figure 2 The nested application of pre-training in this experiment. The pre-test is a form of pre-training for the main treatment. The treatment is meant as a pre-training on a larger scale
2.2.5 Research questions
The acquisition of the names and characteristics of some science concepts might be effective. In an interactive, multimodal system, concepts can be made operational by means of interactive assignments and immediate feedback. Literature on the effect of pre-testing lends support to the idea of activation by assessment of prior knowledge as a didactical treatment at the beginning of a new cycle in the learning process: -The presence of the effect and interaction of the pre-test with the treatment
constitute the first two research questions. -In an automated environment the use of closed questions is the most obvious,
especially when immediate feedback is to be given. Making prior knowledge explicit by formulating answers to open questioning might have a stronger impact, but answers to open questions are difficult to handle automatically. This leads to a third question: does the pre-test effect also depend on the type of questions? Taking into account the results of Dochy et al. (1999) and Strangman et al. (2004) we will focus on two specific types: closed multiple choice questions and (open) short-answer questions.

34
-The chosen design indicates that not all the participants have the same time-on-task. A fourth research question deals with alternative explanations, in which time-on-task plays a role (Worthen, Van Dusen, & Sailor, 1994).
More specific research questions are as follows: Research question 1: What is the effect of interactive, multimodal pre-training
treatment with or without a pre-test? Research question 2: Is there an interaction between the pre-test and the
treatment? Research question 3: Is there a difference between the effects of a pre-test that
consists of short-answer questions (SAQ) and one that consists of multiple choice questions (MCQ)?
Research question 4: Is time-on-task a significant variable?
2.3 METHOD
In the next section the design, participants, instruments, treatment (material), procedure, scoring, statistical analysis, and gain estimation will be discussed.
2.3.1 Design
The Solomon Four Group Design (S4GD) (Shadish et al., 2002; Solomon, 1949) is an experimental set-up making it possible to investigate effects in relation to pre-testing. Two groups (one experimental and one control group) perform a pre-test and a post-test. Two other groups (again one experimental and one control group) only make a post-test (see Table 2). A potential pre-test effect is revealed by comparing both control groups. In this way internal validity is increased. Next to this, the Solomon group design is especially useful in studying pre-test-treatment interaction effects, by means of an analysis of variance. Simpler designs may have advantages. For instance, they need less participants and the organisation is less complicated. Despite this, the S4GD is recommended for science education research (Scharfenberg, Bogner, & Klautke, 2006). In this study two equivalent pre-tests were used (see instruments section). Pre-test A was given to one half of the students of groups 2 and 4. Pre-test B was given to the other half of groups 2 and 4.

35
Table 2 Solomon Four Group design without pre-test with pre-test without treatment group 1 group 2 with treatment group 3 group 4
2.3.2 Participants
184 students participated in the main experiment immediately after summer holidays. 84 students from year 4 of a six year pre-university school (in Dutch 4VWO), average age 15.5 years, participated in the main experiment. 30 randomly chosen students of the same type participated in a retest of the multiple choice parts of the pre-tests. 70 randomly chosen students of the same type from years 4, 5, and 6 of the same school participated in a calibration of the instruments.
2.3.3 Instruments
One set of 32 short answer questions (SAQ) was made covering all subject matter elements. A similar set of 32 questions on the same elements was made, but these questions were in multiple choice (MC) form. Questions from the first set were randomly assigned to pre-tests A or B and the corresponding question to pre-tests B or A. Two MC questions were not assigned. In this way two practically identical pre-tests were made, comprising 16 short-answer questions (SAQ) and 15 multiple choice questions. The tests were created using the commercially available Wintoets authoring system. Since this authoring system had extended digital presentation facilities and was able to record all kinds of process data, it was also used to make the learning material (= treatment X) as well as the post-test on the same platform. Another advantage was that the participants were confronted with only one interface for both pre- and post-tests as well as the treatment. The post-test was made up of 32 questions: 24 questions requiring an answer of one or fewer words, six fill-in-the-blank questions and two questions requiring a numerical answer. A post-test with open questions was chosen to avoid the gambling element connected with multiple choice questions. This gambling causes higher error variances and lower precision (Zimmerman, 2003). Polytomous graded open questions especially appear to be more reliable than multiple choice questions, but unequivocal a priori statements on validity differences are hard to give, since

36
the domain and purpose of the testing have great influence (Kuhlemeier, Steentjes, & Kleintjes, 2003). On the one side, open questions are usually more difficult than multiple choice questions because answering an open question requires construction of an answer, lacks the possibility of back reference via the choice items, and makes giving a correct answer by elimination of implausible answers impossible. On the other hand, sensitisation open questions could be advantageous because of the need to construct the answer. Finally, no feedback was given at either test. The instruments were calibrated in a separate experiment. Criteria for equivalence of tests require (a) no difference between the average scores, (b) high linear correlation between the outcomes, and (c) equality of the standard deviations. In the calibration experiments participants (n=70) made tests with questions that were randomly chosen from the three tests. The scores were grouped by origin of the questions (pre-tests A, B, or the post-test) and the resulting scores were analysed. a. No significant differences between the scores of the tests were found F(2,207)
= 0.388 (p=0.679). b. A high intraclass correlation coefficient was calculated ICC (3,1) = 0.875
(model: two way mixed, single measure). c. The standard deviations were practically the same. From this it was
concluded that the three tests were equivalent. Cronbach’s alpha for the assembled tests in this experiment was 0.955. A robust means of assessing the reliability of a test is a re-test with the same type of participants. In a retest of the multiple choice parts of the pre-tests with 30 of the same type of students the same average scores were found as in the experiment: F(1,71) = 0.007 ( p = 0.934).
2.3.4 The treatment
The educational target of the treatment was a pre-training on the subject matter present in the curriculum in the first weeks at the beginning of the 4th year of the secondary school. Planned curricular activities included the following: Chemistry: atomic theory, molecular structure, and a part of organic chemistry
especially on behalf of biology. General Science: a lecture from a professor in theoretical physics on structure
of matter combined with poster presentations by the students on the same subject matter (Bais, 2004).

37
General science/Physics/Chemistry/English: a multidisciplinary project on nanotechnology "Oscillating cantilevers" (Ilic & Craighead, 2004)
General Science/German: "Nukleare Mikrobatterien" (Schroeder, 2004). Computer science: colour-coding systems.
It was a challenge to link these very diverse subjects into one logical aggregate. Actually the material for pre-training comprised a number of small computer assignments in order to give a pre-training on new science concepts. Several graphical representations were shown and assignments given in the computer program. The system responded immediately on answers for assignments with concise feedback. More specific the elements of the treatment were as follows: Use/application of a science data book (BINAS, 2004). Explication and operationalisation of knowledge of elementary particles and
forces. Use of powers of ten and logarithmic plots. Awareness of the most abundant elements in the human body (HOCN) and
trace elements. Introduction of conventional colour schemes in molecular modelling. Use of colour generation on computer screens.
After an information screen explained the purpose of the treatment to the students, the next screen (paraphrasing a popular Dutch expression) stated “that it is not possible to make an elephant from a mosquito”; however, at an atomic and molecular level the components appear to be quite the same. After explanation of the concept of order of magnitude students were asked to compare mosquito and elephant masses by means of a table with agreed prefixes of units with multiples in powers of 10 (BINAS, 2004, Table 2). If students desired, the use of the Graphical Calculator was explained. Next to this it was asked explicitly to use the index to find information on structure of matter (BINAS, 2004, Table 26). Since the central figure in this table starts with a metal cube, the concept of molecule is not shown. The student was asked to state this missing concept (see Figure 3).

38
Figure 3 An example of an assignment for activating a science concept. The
assignment is: The cube shown is a piece of metal, which doesn’t contain [right answer = molecules] (Source: (BINAS, 2004)
The next assignment was to give a translation of the Greek word άτομος using BINAS, 2004, Table 2 (the Greek alphabet). As extra information the 19th century origin of the specific use of the word was given. Via simple to be answered questions and by using the appropriate BINAS-Table 26 the attention was focused to concepts such as hadrons, leptons, exchange particles, and elementary forces. An animation of a quark interaction with a gluon was also shown in the treatment of this table. As a form of verbalisation the students were asked to draw a schematic map on a photocopy of this table. In line with the concept order of magnitude is the logarithmic axis. After explanation of the principle of an axis like that, the student was asked to pick the log axis from three different axes shown (a linear, a logarithmic, and a fantasy axis). The use of this type of display was demonstrated by showing the dimensions of a proton, atom, bacterium, mosquito, and a human on one axis. In this way it was easy to get an idea of the usual structure size in nanotechnology. Via the theme oscillating cantilevers—devices that make it possible to gauge the mass of a few thousand atoms—the focus was set on extreme large numbers and small dimensions. Figure 4 shows the most important atom types (elements) in the human body as shown by Table 34 in BINAS (2004) (composition of earth, human body etc.). In this histogram a logarithmic ordinate (y-axis) is used. The same data were also shown using a pie diagram. The students were asked to name the most frequent elements in the human body using the CPK-colours. Figure 4 shows how the element P in Table 34 in BINAS was put in the spotlight. This section was closed by an explanation of the concept of trace elements with a reading text on anaemia and iron and cobalt deficiencies (and of course with simple questions on the subject).
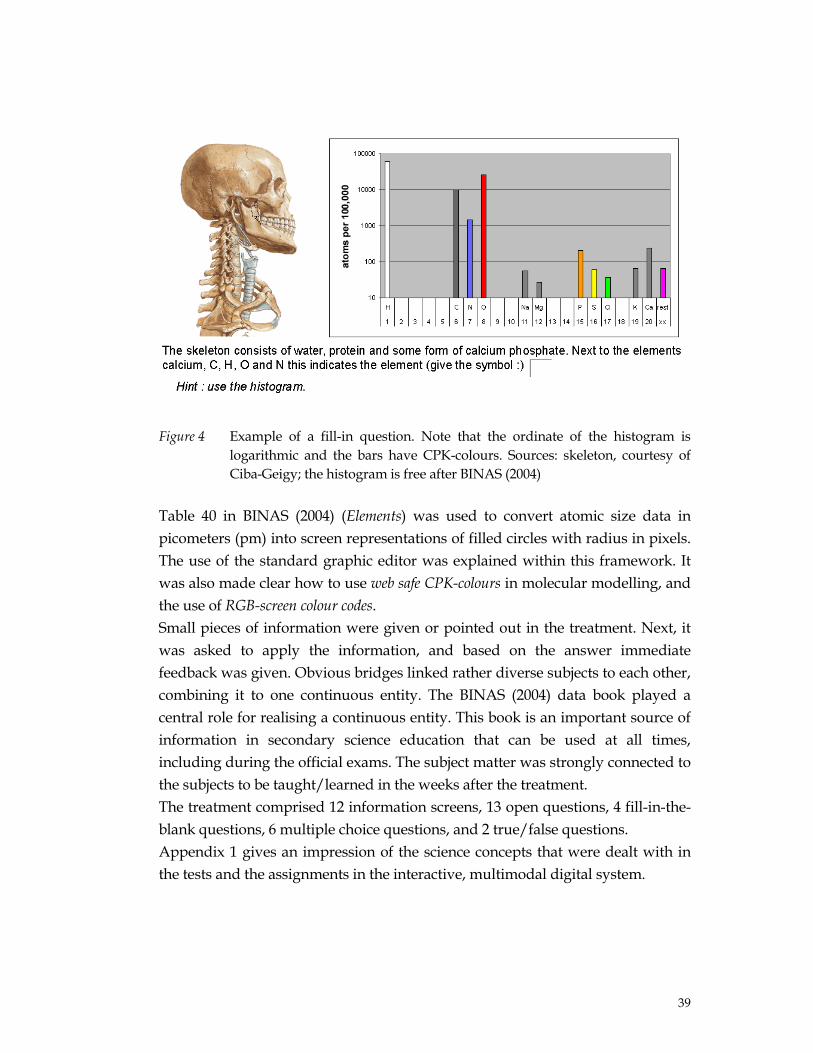
39
Figure 4 Example of a fill-in question. Note that the ordinate of the histogram is
logarithmic and the bars have CPK-colours. Sources: skeleton, courtesy of Ciba-Geigy; the histogram is free after BINAS (2004)
Table 40 in BINAS (2004) (Elements) was used to convert atomic size data in picometers (pm) into screen representations of filled circles with radius in pixels. The use of the standard graphic editor was explained within this framework. It was also made clear how to use web safe CPK-colours in molecular modelling, and the use of RGB-screen colour codes. Small pieces of information were given or pointed out in the treatment. Next, it was asked to apply the information, and based on the answer immediate feedback was given. Obvious bridges linked rather diverse subjects to each other, combining it to one continuous entity. The BINAS (2004) data book played a central role for realising a continuous entity. This book is an important source of information in secondary science education that can be used at all times, including during the official exams. The subject matter was strongly connected to the subjects to be taught/learned in the weeks after the treatment. The treatment comprised 12 information screens, 13 open questions, 4 fill-in-the-blank questions, 6 multiple choice questions, and 2 true/false questions. Appendix 1 gives an impression of the science concepts that were dealt with in the tests and the assignments in the interactive, multimodal digital system.

40
2.3.5 General procedure
The students were informed that they were to participate in an educational experiment. The subject matter was connected to the lessons in General Science, Chemistry, and Computer Science that would be delivered in the next weeks. Participation would have no negative consequences. Group 1 took the post-test. This took about 15 minutes. Group 2 took pre-test A or pre-test B and immediately thereafter the post-test. Taking the pre-test (A or B) took about 10 minutes and the post-test 15 minutes. Group 3 started with the main treatment. Completing the assignments (“X”) took about 40 minutes. The post-test took about 15 minutes. There were no breaks between the parts. Group 4 took pre-test A or pre-test B and immediately thereafter worked through the main treatment and finally took the post-test. Again there were no breaks between the parts.
2.3.6 Scoring procedure
The computer scored the multiple choice questions. A correction for guessing -1/(k-1) was applied to the pre-test scores of multiple choice questions, with k=4 for four choice questions and k=2 for true/false questions. All answers to open questions were stored in the format (question-ID, student-ID, answer) in a relational database. Using a strict answer protocol the open answers were scored by two independent correctors. In only 1 % of the cases a discrepancy between the two correctors was found. In this case the average score of the two judges was taken.
2.3.7 Statistical Analysis
An analysis of variance was executed with SPSS v. 11 and Statistica v. 6.0 A test-item analysis was done with the TIAPLUS program version 2.1. PS version 2.1 (Dupont & Plummer, 1998) was used for the power calculations.
2.3.8 Calculating learning gains
It is not possible to calculate learning gains if only post-test results are taken into account, since pre-treatment levels have to be known also. Two problems have to

41
be dealt with: the sensitising pre-test, and the correction for individual or group pre-treatment levels. As explained earlier, the Solomon Four Group Design is a solution for the first problem. A pre-test corrected learning gain calculation has been devised for solving the second problem. In several test-retest experiments concerning the school subjects French, Computer Science, Biology, and Chemistry a strong empirical relationship between pre and post-test was found. This relation can be used in order to calculate a pre-test corrected learning gain. An explanation is as follows: If pre-test scores are divided by the maximum pre-test score, and this variable is called x, (x = pre-test score/maximum pre-test score 0 ≤ x ≤ 1) and the same is done with the post-test scores and the maximum post-test score, and this variable is called y, the growth factor f = y/x can be described with the power function f = x –B. The exponent B is a robust measure of the learning gain in pre-test/treatment/post-test designs (‘OXO’-designs). Normally the post-test score is larger than the pre-test score (otherwise nothing seems to be learned); therefore the exponent B is between 0 and 1. Statements of statistical significance of differences between learning gains can be supported using estimations of the error in the parameter B. A nominal categorization of the knowledge growth exponent B is depicted in Table 3 which is based on a calibration with data from a review of Hake (Hake, 1998a, 1998b). Table 3 Nominal scale for the knowledge growth exponent B
Exponent Gain characterization B ≤ 0.40 “low” 0.40 < B < 0.60 “average” B ≥ 0.60 “high” Conservative calculations with power = 0.80, alpha = 0.05, a difference in B-values of 0.1, a standard deviation = 0.05 and group size ratio m = 0.68 gives a minimal sample size of 6. In this study cell numbers (27, 15, 16, and 26) are above this number. A special problem gives the gain calculation for the group without pre-test. Formal gain calculation is impossible since the group does not take a pre-test, but on the basis of the equivalence of the 4 groups an estimation of the group gain B may be calculated from B = - log( <y> / <x> ) / log( <x> )

42
The angle brackets <...> signify group averages and scores are normalized so that 0 < <y> < 1 and 0 < <x> < 1. This method using group averages may (1) yield lower B values than when individual student scores are used, and (2) reveal no information on the B parameter error. The classical effect size categories according to Cohen (1988) are reported. Cohen suggested that as a very rough rule of thumb d = 0.2, 0.5, and 0.8 imply respectively “small,” “medium,” and “large” effects. Effect sizes of more than 3 standard deviations calculated with Cohen’s method are considered extreme (Cohen, 1988). At this point it should be stressed again, that effect size is not the same as learning gain.
2.4 RESULTS
2.4.1 Primary results
In Table 4 the average scores ± standard deviations are given for pre-test A and pre-test B (maximum =100%). Table 4 Pre-test results for group 2 and 4, pre-test A and B. Average scores ± standard
deviations (maximum =100%) Pre-test A Pre-test B Total N Group 2 16.94 ± 12.12 15.79 ± 10.02 16.36 ± 10.76 16 Group 4 21.84 ± 7.31 16.71 ± 10.69 19.18 ± 9.41 27 Total 19.97 ± 9.46 16.37 ± 10.22 18.13 ± 9.90 N 21 22 43
In Table 5 the results of an ANOVA are given for the corrected pre-test scores with factor (1) pre-test A or B and factor (2) groups 2 or 4. No significant differences are found. No interaction is found. The groups and the two pre-tests seem to be equivalent. Table 5 Results of an ANOVA of pre-test scores F(1,39) p Pre-test A or B 0.999 0.324 Group 2 or 4 0.858 0.36 Pre-test*Group 0.404 0.529
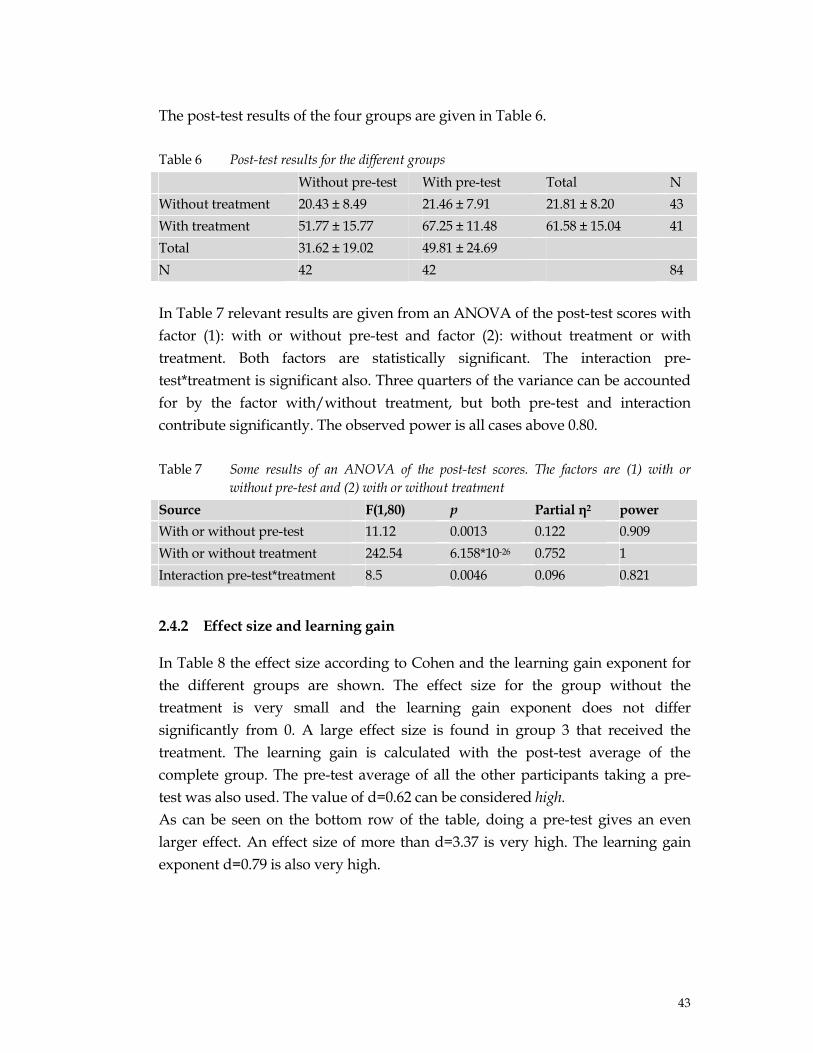
43
The post-test results of the four groups are given in Table 6. Table 6 Post-test results for the different groups Without pre-test With pre-test Total N Without treatment 20.43 ± 8.49 21.46 ± 7.91 21.81 ± 8.20 43 With treatment 51.77 ± 15.77 67.25 ± 11.48 61.58 ± 15.04 41 Total 31.62 ± 19.02 49.81 ± 24.69 N 42 42 84 In Table 7 relevant results are given from an ANOVA of the post-test scores with factor (1): with or without pre-test and factor (2): without treatment or with treatment. Both factors are statistically significant. The interaction pre-test*treatment is significant also. Three quarters of the variance can be accounted for by the factor with/without treatment, but both pre-test and interaction contribute significantly. The observed power is all cases above 0.80. Table 7 Some results of an ANOVA of the post-test scores. The factors are (1) with or
without pre-test and (2) with or without treatment Source F(1,80) p Partial η2 power With or without pre-test 11.12 0.0013 0.122 0.909 With or without treatment 242.54 6.158*10-26 0.752 1 Interaction pre-test*treatment 8.5 0.0046 0.096 0.821
2.4.2 Effect size and learning gain
In Table 8 the effect size according to Cohen and the learning gain exponent for the different groups are shown. The effect size for the group without the treatment is very small and the learning gain exponent does not differ significantly from 0. A large effect size is found in group 3 that received the treatment. The learning gain is calculated with the post-test average of the complete group. The pre-test average of all the other participants taking a pre-test was also used. The value of d=0.62 can be considered high. As can be seen on the bottom row of the table, doing a pre-test gives an even larger effect. An effect size of more than d=3.37 is very high. The learning gain exponent d=0.79 is also very high.

44
Table 8 The effect size d according to Cohen (1988) and the learning gain exponent for the different groups
Effect size B B (grp) group 2 with pre-test, without treatment 0.19 0.10 ± 0.071 group 3 without pre-test, with treatment 2.48 0.62 group 4 with pre-test, with treatment 3.37 0.79 ± 0.021
2.4.3 Grouping scores by question type (multiple choice or short-answer)
The scores given on each question in the post-test by experimental group 4 students were grouped to the type of the connected question in the pre-test. The results are depicted in Table 9. An ANOVA revealed no significant differences (p = 0.52). Table 9 Post-test scores of group 4 (with pre-test and with treatment) grouped by pre-test
question type Question type in pre-test Average Std. Dev. N Short-answer question 69.6 45.5 340 Multiple choice question 71.7 43.8 338 Total 70.6 44.7 678 The time for the combined group needed for completing pre- and post-test as well as the treatment are given in Table 10. The table shows an enormous variation. The fastest students outperform the slowest in speed by a factor of 3 to 5. Table 10 Time (minutes) spent on pre-test, treatment and post-test and the sum of these three pre-test treatment post-test total time Mean 11.104 41.186 13.475 65.765 Std. Deviation 2.813 9.779 4.944 14.197 Minimum 6.400 19.150 5.300 30.967 Maximum 18.350 62.250 25.217 95.450 In order to investigate the influence of time on task, a linear regression analysis of the variable total time spent (pre-test + treatment + post-test) and the variable post-test score was performed. The correlation coefficient R = -0.035 was not significant (p=0.865). Also no significant linear relationships were found between post-test score and pre-test time (R = -0.152, p=0.458), time needed for the treatment (R=-0.059, p=0.774) and the post-test time (R = 0.103, p=0.774).

45
An alternative hypothesis that time-on-task is a significant variable is not supported by these findings. There were significant correlations, however, between time needed for pre-test and the treatment (R =0.502 p=0.00901) and time needed for post-test and treatment (R=0.406, p= 0.0396), indicating that when students work fast during the pre- and post-tests they also work fast during the rest of the treatment. As indicated above, the post-test results seem not to be related to this speed (i.e. time-on-task). In a further analysis, the time-on-task for groups 2 and 4 were compared to each other. There was no difference between the time needed for completing the treatment F(1,39) = 1.136 (p=0.293) or completing the post-test F(1,39) = 1.164 (p=0.287). A univariate Anova was executed, where post-test score was the dependent variable; taking a pre-test or not was the fixed factor and the total time spent on tests and treatment was a covariate. As was found in already another analysis above (Table 7), doing the pre-test gave a significant difference F(1,38) =10.437 (p=0.003), but the total time was not significant F(1,38)=0.124 (p=0.727). The alternative hypothesis that time-on-task in this experiment is a significant variable is also not supported by this second analysis. These findings appear to contradict research showing time-on-task as a predictor of performance (Admiraal, Wubbels, & Pilot, 1999; Cotton, 2001), but most research is done on a distal time scale (a few months), and it must be emphasized that relevant time-on-task is important (Wellman & Marcinkiewicz, 2004). The data presented in this study suggest that spending a marginal extra time of 10 minutes making a pre-test on an immediate timescale is much more effective than spending 10 extra minutes on the rest of the treatment.
2.5 CONCLUSIONS
Research question 1: What is the effect of an interactive, multimodal pre-training with or without a pre-test? With different measures the conclusion is the same: doing a pre-test increases the effect of a treatment significantly and substantially. The effect size increases from d= 2.5 to d=3.4. The learning gain exponent increases from B=0.62 to B=0.79. If no treatment followed the pre-test the learning gain was practically absent.

46
Research question 2: Is there an interaction between the pre-test and the treatment? From the post-test data a significant interaction between pre-test and treatment can be concluded. Research question 3: Is there a difference in effect between a pre-test that consists of short-answer questions (SAQ) and one that consists of multiple choice questions (MCQ)? The effect of short-answer questions did not differ significantly from the effect of multiple choice questions. Research question 4: Is time-on-task a significant variable? There was no support for an alternative hypothesis that the amount of time spent on the tasks was a significant variable.
2.6 DISCUSSION
The highest effect size (d=3.4) and the highest learning gain (B ≈ 0.8) in a pre-training for learning science concepts are found when a pre-test is directly followed by a focused interactive computer based lesson with assignments and direct feedback. A high effect size (d=2.5) and a high learning gain (B ≈ 0.6) are also already achieved without pre-testing. Only applying the pre-test will not result in a significant learning gain. Therefore, from an instructional perspective, it is relevant to connect pre-testing directly with a teaching strategy that consists of a good explanation, followed by questions and immediate feedback in order to enhance learning. The results are encouraging for the designer of interactive, multimodal courseware. Obviously the clear evidence based guidelines for pre-training from Mayer-Moreno Theory (MMT) can be used fruitfully in the production of educationally relevant material. It must be kept in mind, however, that many of the experiments that form the basis of MMT are in the field of natural science and technology. There are some doubts that the successes of MMT can be extended or generalised to any domain. In the discipline of educational science, for instance, the positive findings of the cognitive theory of multimedia learning could not be replicated (De Westelinck, Valcke, De Craene, & Kirschner, 2005). Noteworthy in

47
the research of De Westelinck et al. was a significantly higher performance in a case where text was studied without external graphical representations. The participants in this study appeared to have problems because of inadequate experience with or knowledge of the iconic sign system used (De Westelinck et al., 2005). Other authors also state that the use of text and graphical images together does not guarantee success since the effectiveness of external representations is the product of a complex interaction between (a) the properties of the representation, (b) the demands of the task and (c) within-subject factors such as prior knowledge and cognitive style (Cox, 1999). The subject matter of the experiment in this study was situated in the same knowledge domain as most of the experiments from Mayer et al. The interpretation and use of pictures, diagrams, graphs, symbols and formulae is an essential part of education for the type of students participating in this experiment. The doubts of De Westelinck et al. are of little concern in the natural sciences, but may be of importance for example in social sciences. In addition to the guidelines from MMT, following the review of Strangman et al. (2004), the good results in the current study can be explained from a combination of teaching strategies that are considered effective: activating prerequisite knowledge by asking questions before (pre-test), building up prerequisite knowledge using direct instruction, and asking questions and giving feedback. The type of pre-test-questions—multiple choice or short-answer—does not matter according to our study. Moreover, no significant pre-test-effect was found with two-choice questions in an adjoining experiment, and it is not to be expected that such an effect will be found in a large-scale experiment. However, because the short-answer questions are not so different from the multiple choice questions used in this study, it is possible that real open questions will make a difference. From the perspective of educational efficiency, there is a problem here: The available off-the-shell-software for the automatic scoring of open questions is still time consuming for teachers, because a lot of checking of the semi-automated scoring is necessary. Therefore, taking into account the effectiveness of the instructional strategy applied in our study and the need for educational efficiency, it looks obvious to apply a digital, interactive multimodal system with multiple choice pre-test questions. The last also offers the opportunity—something we did not do in our study for experimental reasons—to give immediate feedback on the answers given. It is to be expected that the application of a combination of pre-test and immediate feedback will lead to significantly higher learner gains than the application of a pre-test alone.

48
From the results in this report, two kinds of help for instructional practice could follow. The first is the idea that the design of the experiment could serve as an instructional design for an introductory (science) module. The instructional design consists of a digital multimodal learning environment in which a multiple choice pre-test with immediate feedback is embedded, directly followed by a number of screens with digitally controlled assignments, also with immediate feedback. Students can work with such an introductory module before the new course(s) in their own chosen time, pace, and place. Process results of students from this introductory module could be interesting for the teacher at the beginning of the new course to take into account for the teaching. Such an approach is not new: The Computer Assisted Instruction -package SCOOR (Paulides & Pilot, 1996)—a program meant for detecting and removing deficiencies in the knowledge-base of starting students of Professional Higher Education—is a comparable approach. However, the pre-test in the CAI-package SCOOR has an allocating function—students are allocated to one or more specific modules dependent on the pre-test-score—and not a sensitising function, but the pre-test could work in this way. A high learning gain (B = .73) could be calculated from (still) available pre-test / post-test data of a group of students that followed the SCOOR chemistry module. For the non-SCOOR group B = .12 (SCOOR, 1986). An even higher learning gain can be expected, taking into account the increase of multimedia opportunities and asynchronous access of the present digital systems. As a second help for the instructional practice, a discussion point can be posed: Pre-test sensitisation—maybe in combination with other forms for activation and building up prerequisite knowledge—could be helpful for concept development in the context-concept approach in innovative science education in secondary education (Bulte et al., 2005). For a smooth execution of tasks within the context chosen it is necessary that relevant conceptual networks are available and transfer of these networks is possible. This appears to be a problem (Pilot & Bulte, 2006). Also, Strangman et al. (2004) indicate that the mere use of authentic situations does not automatically lead to the development of prerequisite knowledge. Pre-test sensitisation could facilitate availability and transfer of existing conceptual networks. A strategy for activating and building up prerequisite knowledge should also be followed in order to stimulate learning in authentic situations. The results found in this experiment can, perhaps, play a role in this instructional design.

49
2.7 APPENDIX

50

51
CHAPTER 3 The effect of peer assessment on scientific writing performance of secondary school peer assessors4 ABSTRACT
In two experiments with control group design, the learning gain of a writing assignment for a scientific report in the upper level of pre-university education was gauged. In a first experiment the overall gain of writing a scientific report and doing a peer assessment was measured. An “average” learning gain was found with an effect size of d=0.876. This effect was still present after correction for gender differences by a male-only analysis. The effect was still significant after checking for possible selection bias by a nearest neighbour analysis. In a second experiment the differential gain of the two components (writing-assessing) was measured. No learning gain was connected to the writing, whereas the peer assessment was entirely responsible for the measured “average” learning gain with an effect size of d=1.47.
3.1 INTRODUCTION
Scientific communication is an important instructional goal in secondary education science programs. In our society it is obviously necessary to have a sound knowledge of science laws and principles. Next to this it is also necessary to communicate effectively about science, requiring productive communication skills such as scientific writing, information representation, and knowledge presentation (B. Campbell, Kaunda, Allie, Buffler, & Lubben, 2000). In the new chemistry 4 Paper presented at ORD 2008 (A.B.H. Bos, C. Terlouw, & A . Pilot, 2008b). Submitted.

52
program for the Netherlands, it is explicitly stated that “the student must be able to communicate in public adequately on the subject matter” (CEVO, 2008). There appears to be uncertainty about which genre and what kind of writing practices should be advocated in schools. In context-based education, combined with inquiry-based instruction (Bulte, Westbroek, de Jong, & Pilot, 2006) the choice of genre is obvious. The investigative learners have to keep track of procedures and data, make meaning of results, and communicate what they have found to others. Van Rens, Pilot and Van Dijk (2004) propose for such an educational environment the genre of a full paper to a journal. Either way, the scientific report is still recognized as the key genre of the scientific method (Prain, 2006). Therefore, in this paper we will limit our focus to the writing of a scientific report. Although writing is considered to be a complex problem-solving process (Rijlaarsdam, Van den Berg, & Couzijn, 2004), students rarely receive systematic or formal training in writing scientific texts (Kovac & Sherwood, 1999). There may be two reasons for this: a. Doing writing assignments is rather time consuming because it requires
regular practice and feedback (Davis, 2005). In the overloaded programs in secondary science education it is not easy to include writing assignments.
b. Since courses in how to report experiments are rare, Sternberg concludes that there appears to be a widespread misconception that students receive sufficient training in writing through informal channels and will acquire the necessary skills on their own (Sternberg, 2003).
However, one cannot expect to get good science reports from students without teaching them how to write them. Therefore, the general problem addressed in this study concerns the design of an effective and efficient training situation in a science curriculum for learning to write a scientific report. Since the participants in this study are pre-university students, the expected products are not at the university level. Therefore, it might be more appropriate to speak of a proto scientific report, but for the sake of brevity the prefix proto will be omitted. In this study the feasibility and effect of implementing peer assessment will first be explored, especially the effect on the assessors. The knowledge from this pilot experiment will be used for design and evaluation of the second experiment with attention to procedural fine tuning and improving efficiency by computerization.

53
3.2 THEORETICAL FRAMEWORK
Research about effective teaching and learning of writing can be organized into three themes (Rijlaarsdam et al., 2004): (1) the learning processes at the student level, (2) the relationship between learning-to-write and writing-to-learn, and (3) how to teach writing. After reviewing some relevant aspects of the learning process, it will be made clear why it is wise to limit the scope of this study to learning-to-write. Thereupon a general model for instructional design will be adapted in order to design systematically an instructional arrangement. To make the instructional arrangement viable special attention will be given to efficient and effective feedback from peer assessors.
3.2.1 The learning processes
The writing process is generally considered to be a cognitively high-demanding problem-solving task with a high cognitive load (Hayes & Flower, 1980; Kellogg, 2001; Torrance & Galbraith, 2006). This is especially the case with such a complex genre as writing a scientific report (Hayes & Flower, 1980). Hayes and Flower distinguish between (a) processes that take place in the task environment like description of the topic, problem definition, motivational processes, and the use of former texts; (b) cognitive processes in order to retrieve all kinds of knowledge (declarative, procedural, situational, and strategic) (T. De Jong & Ferguson-Hessler, 1996) from long term memory about the topic and writing plans; (c) planning processes like generating knowledge and ideas, organizing the knowledge and the ideas, and goal setting; (d) revising processes in order to improve an existing text; (e) monitoring processes that control all the processes for improving; and the material writing process as such, usually using information and communication technology (ICT). These processes also make clear that, although ICT has decidedly improved tools for communication, and extensive help resources are available, technology alone does not write a scientific paper (Davis, 2005).
3.2.2 Learning-to-write or writing-to-learn?
Some authors claim that writing is a potent tool for learning that might offer compensation for the time invested (Bangert-Drowns, Hurley, & Wilkinson,

54
2004). Writing could be used for shaping, clarifying, and consolidating emerging knowledge (Prain, 2006). Writing could also contribute to the recall, comprehension, and transfer of content matter (Klein, Piacente-Cimini, & Williams, 2007). Investing time in learning-to-write could be more worthwhile if it would also lead to better comprehension of scientific concepts and theories. However, besides a rise in cognitive load by combining learning-to-write and writing-to-learn (Kieft, 2006), the effects of writing-to-learn interventions in school settings on content achievement appear to be inconsistent (Ackerman, 1993; Klein, 1999; Penrose, 1992; Tynjälä, Mason, & Lonka, 2001) (Penrose, 1992; Ackerman, 1993;Klein, 1999; Tynjälä, Mason & Lonka, 2001), and with an average effect size of d=0.26 ± 0.40, rather small (Bangert-Drowns et al., 2004). Of course, the comprehension of scientific concepts and theories involved in the experiment are demonstrated in a scientific report; however, since the cognitive load may be high already, the main focus of the instructional arrangement in this study concerns the application of standards and guidelines for a scientific report in which the right application of scientific concepts and theories is only a component (e.g. in the interpretation of the results). In short, there are good reasons to focus in this study on learning to write a scientific report. (Writing-to-learn may be a small, unavoidable bonus, however).
3.2.3 Instructional design
Mastering the art of writing, like other learning processes for complex problem solving, needs the systematic design of an instructional arrangement in which the learning task for writing a scientific report is embedded. As mentioned before, an informal setting is not effective. Prior research on learning to solve complex problem tasks (Mettes, Pilot, & Roossink, 1981a; Mettes et al., 1981b; Terlouw, 1993; Terlouw et al., 2003) showed that an approach based on the instructional-learning theory of Gal Perin (Arievitch & Haenen, 2005) can be fruitful. In Table 1 an overview is given of the instructional functions that have to be fulfilled. The actual choice of content matter is dictated by the instructional functions 1-5. Later on in this section and in the methods section the actual measures of how each of these functions is fulfilled in this study can be found.

55
Table 1 Instructional functions of the instructional design model Instructional functions Conditional functions 1. Motivating 2. Connecting with the initial situation of the learner 3. Giving insight into the intended final level of learning results Main functions Orienting
4. Discovering and acquiring information about knowledge elements and
the problem approach 5. Making operational: knowledge elements and the problem approach Practicing 6. Practicing the use of knowledge elements and the problem approach 7. Giving feedback 8. Giving the opportunity to reflect Testing
9. Investigating which learning results has been reached, and whether it is
in accordance with the norm For the kind of relatively small tasks as used in this experiment, Van Merriënboer advocates a whole-task approach, since the learner should quickly acquire a complete view of the task. In order to reduce the cognitive load of the complexity in the beginning of the learning process a simple but authentic task is given. The simplifying conditions are relaxed in later stages in this case by gradually choosing more complex tasks (Van Merriënboer, 1997). Taking into account the need for effectiveness and efficiency, the main focus in this study is on function 7, “Giving Feedback”, an essential function, that is one of the most powerful influences on learning and achievement (Hattie & Timperley, 2007). According to Hattie and Timperley this function exerts one of the most powerful influences on learning and achievement. Surprisingly only a few studies have systematically investigated its meaning (Hattie & Timperley, 2007). In the next section this theme will be highlighted.
3.2.4 Feedback
The student with a writing assignment is, as demonstrated, confronted with a multitude of problems. This complex task can only be mastered in a multi-cycle process in which feedback and reflection are essential. The learning effect will be

56
limited if feedback and reflection on the writing process and product are not realized (Black & William, 1998). Moreover, feedback and reflection on (intermediate) results can improve the orienting basis for writing, i.e. acquiring information on the knowledge elements and problem approach (viz. functions 4 and 5 in Table 1 (Arievitch & Haenen, 2005). For this improvement the student should: a. understand what performance or product is expected (the reference level), b. have the opportunity to compare his/her actual level with the reference level
and, c. engage in an appropriate action to decrease the gap by expanding the
orienting basis through feedback and reflection (Roossink, 1990; D. R. Sadler, 1989; Terlouw, 1993; Terlouw et al., 2003).
What should be the form and content of feedback? A teacher commenting in detail on a writing process and product, and explaining in a one-to-one oral session how a student’s product meets the criteria, is a high quality form to give worthwhile feedback. Unfortunately, a teacher is confronted with time constraints in pre-university education; a teacher is under enormous time pressure. Inevitably, this must lead to a reduction of quantity and quality of feedback (Gibbs & Simpson, 2004). Further, scaffolding meta-cognitive processes for developing self-regulation of learning strategies appears to be unhelpful: the provision of feedback in this meta-cognitive framework showed no significant relationship with effect size (Bangert-Drowns et al., 2004). A possible reason might be that the meta-cognitive content of the feedback is too general to be useful for students. A feasible alternative form to save teacher time could be the transfer of some teacher tasks to the students themselves, especially the use of formative peer assessment for realizing feedback. The reference basis for feedback concerns the writing format provided, and with that, the content is directly connected with the performance asked for, and not of a general meta-cognitive character. Can peer assessment provide a solution?
3.2.5 Peer assessment
Under the right conditions students are quite capable of performing a portion of teacher tasks, especially where assessments of low-order cognitive skills are involved (Zoller, 1999; Zoller, Tsaparlis, Fatsow, & Lubezky, 1997).

57
Low-order cognitive skills (LOCS) may not be the final target of education, but they are precursors of high-order skills. In secondary pre-university education, with students at the very beginning of their scientific education, basic skills and elementary algorithms form a substantial part of the curriculum. Assessment of relatively simple student products can be seen as a first step on the long road to the mastery of evaluation and self-assessment products of higher order skills. Also, based on what is known about cognitive load, it looks productive to start with the lower-order cognitive skills. Boud and Falchikov (1989) conclude that the marking by peer students did not deviate much from the rating by teachers. The highest agreements are found where only one judgement was given and well-understood criteria were used. The assessment of typical academic products such as tests, essays, and presentations gave a higher agreement than practical skills. Nevertheless, it is still an open question as to which marking criteria—based on the general format for a scientific report—are more or less applicable in the instructional arrangement designed for peer-assessors in a scientific writing process. Furthermore, an important by-product of a fellow student’s assessment of the work is the learning effect on the assessor himself. “Average” to “high” learning gains have been reported for the peer assessor in a computer-assisted instructional setting (Bos, Terlouw, & Pilot, 2007b). The explanation for the effect is that a peer assessor acquires a clearer view on the criteria of the performance asked (the conditional function no. 3 in the model in Table 1). Moreover, by assessing peers, a student (a) concretely operationalises the performance criteria (see no. 5 under main functions in Table 1) and (b) concretely compares an actual level with a reference level. In this way a peer assessor reflects on his own performance and also gives feedback to himself. So it seems relevant to involve peers in (formative) assessment in order to realize feedback. Both the students, who assess, and the students, who are assessed, are offered the opportunity to gather experience by learning their mistakes and improving learning results. Two birds are killed with one stone: the peers partly relieve the teacher from a labour intensive task (efficiency) and self-monitoring in the learning process is fostered (effectiveness) (see no. 7, 8, and 9 in the instructional design model in Table 1). Considering the general problem addressed and following the theoretical framework described above, this study focuses on the research questions below.

58
3.2.6 Research questions
1. Does the writing of a scientific report followed by pencil-and-paper peer assessment lead to significantly better writing of a scientific report of peer assessors?
2. What type of (marking) criteria is significantly better met by this arrangement?
3. Does a computerized peer assessment embedded in a process of practice lead to significantly better writing of a scientific report of peer assessors?
Two educational experiments are needed. Questions (1) and (2) are treated in experiment A and are preparatory for the computerized peer assessment of question 3. Question (3) is the focus in experiment B.
3.3.A Method experiment A
First we will discuss the design, the participants, the instruments, correction procedure, and statistical analysis. Then the results of experiment A will be described in section 3.4.A. 3.3.A.1 Design of experiment A A group of 23 students was chosen at random from a total of 78 students from year 5 of a six-year pre-university school. Intervention X1: The students were asked to participate voluntarily in an instructional experiment. The instruction on chemical aspects of a quantitative chemical experiment took about 10 minutes. Doing this chemical experiment (a quantitative estimation of the cation binding capacity of a zeolite using an EDTA–titration) took about 25 minutes. The students were given a two-page paper on the chemical background of the experiment and were given 15 minutes to study this paper. Observation 1, O1: A week later, the students were given some typical data from the experiment. They were asked to write a report within one hour using a supplied general format of a scientific report. A more or less detailed version of the IMRaD-format (Introduction, Methods, Results, and Discussion), as presented in Successful Lab Reports, is the standard to be used. Essentially this format is not different from the format used in social sciences (Lobban & Schefter, 1992; Sternberg, 2003).
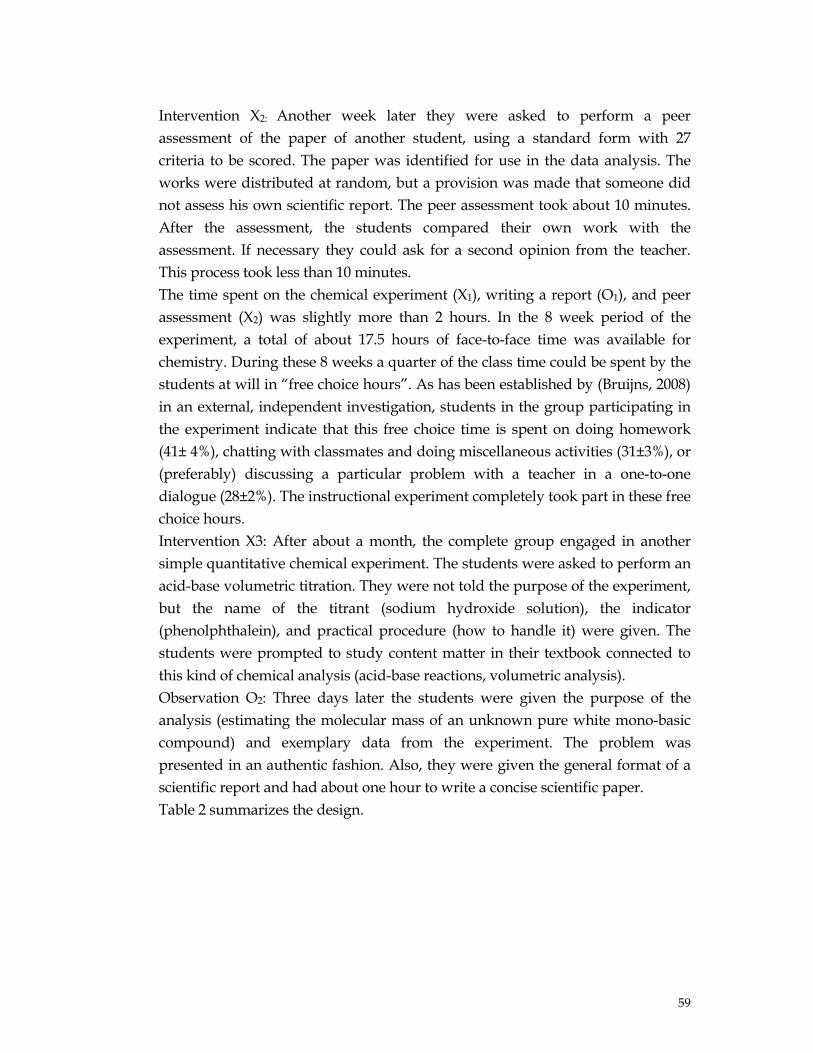
59
Intervention X2: Another week later they were asked to perform a peer assessment of the paper of another student, using a standard form with 27 criteria to be scored. The paper was identified for use in the data analysis. The works were distributed at random, but a provision was made that someone did not assess his own scientific report. The peer assessment took about 10 minutes. After the assessment, the students compared their own work with the assessment. If necessary they could ask for a second opinion from the teacher. This process took less than 10 minutes. The time spent on the chemical experiment (X1), writing a report (O1), and peer assessment (X2) was slightly more than 2 hours. In the 8 week period of the experiment, a total of about 17.5 hours of face-to-face time was available for chemistry. During these 8 weeks a quarter of the class time could be spent by the students at will in “free choice hours”. As has been established by (Bruijns, 2008) in an external, independent investigation, students in the group participating in the experiment indicate that this free choice time is spent on doing homework (41± 4%), chatting with classmates and doing miscellaneous activities (31±3%), or (preferably) discussing a particular problem with a teacher in a one-to-one dialogue (28±2%). The instructional experiment completely took part in these free choice hours. Intervention X3: After about a month, the complete group engaged in another simple quantitative chemical experiment. The students were asked to perform an acid-base volumetric titration. They were not told the purpose of the experiment, but the name of the titrant (sodium hydroxide solution), the indicator (phenolphthalein), and practical procedure (how to handle it) were given. The students were prompted to study content matter in their textbook connected to this kind of chemical analysis (acid-base reactions, volumetric analysis). Observation O2: Three days later the students were given the purpose of the analysis (estimating the molecular mass of an unknown pure white mono-basic compound) and exemplary data from the experiment. The problem was presented in an authentic fashion. Also, they were given the general format of a scientific report and had about one hour to write a concise scientific paper. Table 2 summarizes the design.
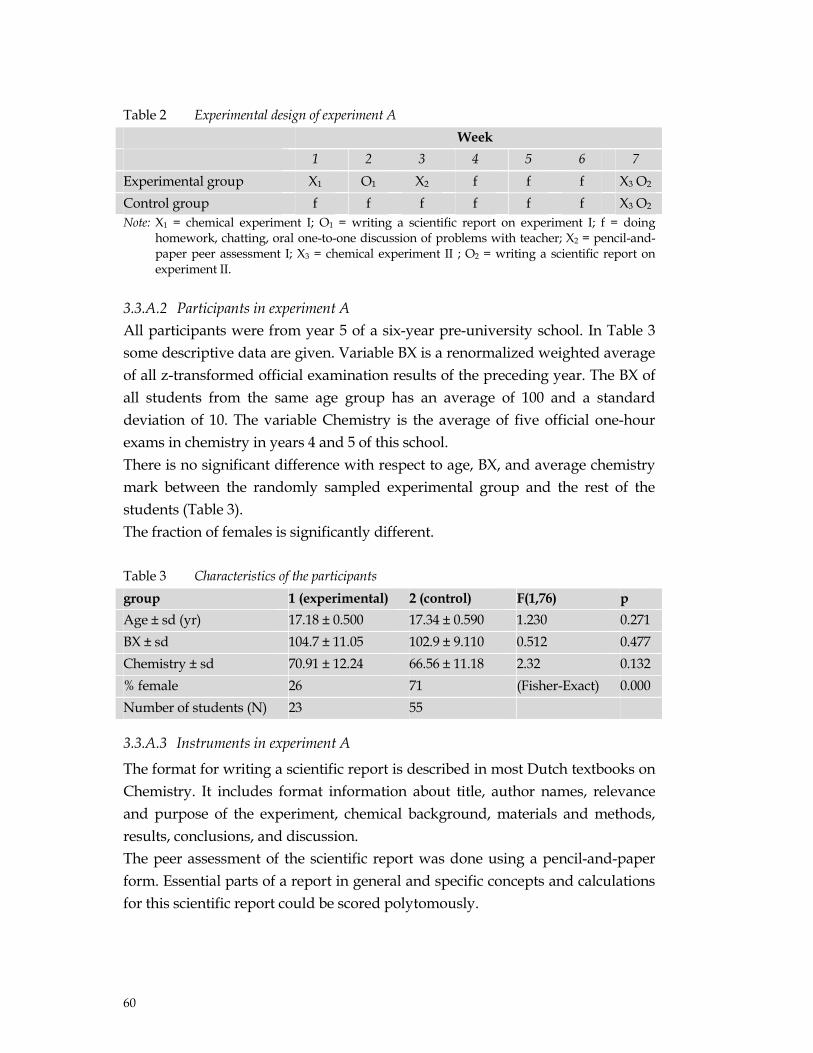
60
Table 2 Experimental design of experiment A Week 1 2 3 4 5 6 7 Experimental group X1 O1 X2 f f f X3 O2 Control group f f f f f f X3 O2 Note: X1 = chemical experiment I; O1 = writing a scientific report on experiment I; f = doing
homework, chatting, oral one-to-one discussion of problems with teacher; X2 = pencil-and-paper peer assessment I; X3 = chemical experiment II ; O2 = writing a scientific report on experiment II.
3.3.A.2 Participants in experiment A All participants were from year 5 of a six-year pre-university school. In Table 3 some descriptive data are given. Variable BX is a renormalized weighted average of all z-transformed official examination results of the preceding year. The BX of all students from the same age group has an average of 100 and a standard deviation of 10. The variable Chemistry is the average of five official one-hour exams in chemistry in years 4 and 5 of this school. There is no significant difference with respect to age, BX, and average chemistry mark between the randomly sampled experimental group and the rest of the students (Table 3). The fraction of females is significantly different. Table 3 Characteristics of the participants group 1 (experimental) 2 (control) F(1,76) p Age ± sd (yr) 17.18 ± 0.500 17.34 ± 0.590 1.230 0.271 BX ± sd 104.7 ± 11.05 102.9 ± 9.110 0.512 0.477 Chemistry ± sd 70.91 ± 12.24 66.56 ± 11.18 2.32 0.132 % female 26 71 (Fisher-Exact) 0.000 Number of students (N) 23 55
3.3.A.3 Instruments in experiment A
The format for writing a scientific report is described in most Dutch textbooks on Chemistry. It includes format information about title, author names, relevance and purpose of the experiment, chemical background, materials and methods, results, conclusions, and discussion. The peer assessment of the scientific report was done using a pencil-and-paper form. Essential parts of a report in general and specific concepts and calculations for this scientific report could be scored polytomously.

61
The format for writing a scientific report was derived from the guidelines for authors of scientific magazines (Analytical_Chemistry, 2008; Nature, 2008). It includes Title, Authorship, Abstract, Introduction, Methods, Results, Conclusion, and Discussion. Since the paper had to be written under controlled conditions, with no external information sources except a chemistry data book (BINAS, 2004), the introduction was shorter than in a real scientific report and the reference section was absent. 3.3.A.4 Assessment procedure and statistical analysis The grading of the scientific report was supported by use of the computer application Wintoets v.3.0. This commercially available authoring system is normally used to make computerized tests. For this occasion it was reconfigured to score the scientific report. Thirty-seven items could be scored separately. In Table 4 a general description of some criteria is given. Table 4 Examples of marking criteria for the scientific report Type of criterion Example Format Are all subsections (introduction, methods, results, discussion)
recognizable? Form Is correct language used? Relevance Is the purpose and relevance of the experiment given? Chemical relations Is the relationship between molecule A and molecule B stated
and used? Chemical orthography Are the right chemical formulae used in the equations? Observations Is colour change X to Y noted? Measurements Are the primary results presented, either graphical or numerical? Primary result Is the property sought calculated correctly? Statistical Is the error of the desired property correctly stated? Reflection Is the deviating value discussed? Since the gender composition of the experimental group was different from the control group (see Table 3), it seemed wise to perform a male-only, as well as a nearest neighbour analysis, in order to have a more precise comparison of the experimental and control group. For the male-only analysis, all male participants in the experimental group were compared to all male participants in the control group. In the nearest neighbour analysis the variables gender, BX, and average chemistry mark (acm) were used as relevant variables to form more precise

62
comparable groups. The quasi continue variables BX and average chemistry mark were z-transformed: if the average of the BX over the complete group is BXav and the standard deviation is SDbx, then for student # i with BXi the value Zi BX= (BXi –BXav)/SDbx. The same applies to the average chemistry mark. In a computerized procedure, a student (# i) from the control group is randomly chosen. From the control group the student (#j) was sought with minimal distance D, where D2 = (ZiBX – ZjBX) 2 + (Ziacm- Zjacm) 2. Both actions, male-only analysis, as well as nearest neighbour analysis, are not without risk. The degrees of freedom are much smaller than in the statistical tests with the complete control group. As a consequence, type II errors lie in ambush. PS version 2.1.31 (Dupont & Plummer, 1998) was used for the power calculations. Post hoc power calculations were calculated with α = 0.05 and with the sample sizes from the experiments. The statistical power has to be 0.80 or higher. Learning gain was calculated according to Bos et al. (Bos, Terlouw, & Pilot, 2007c). Statistical analysis of test data was performed with SPSS 11.0, Vista 6.4, Graphical Analysis 3, Statistica 6.0, and specific software of the authors, written in C++ with C++Builder of Borland version 4.
3.4.A Results of experiment A
3.4.A.1 Primary results In Table 5 the scores for both assignments are given on a 0-100 scale. Table 5. Results for two scientific report assignments scores ( 0 -100 scale) group 1 (exp.) 2 (control) F(1,76) p
(a) Scientific report I (O1) 27.74 ± 11.04
-
(b) Scientific report II (O2) 63.47 ± 19.61
47.69 ± 16.67
13.09 5.33.10-4
number of students (N) 23 55 For the Scientific report II, the experimental group scored significantly higher than the control group (p < 0.001) Cronbach’s alpha for the Scientific report assignment II was 0.8416 (Nstudents = 78, Nitems = 38). The scientific report assignment II was graded by two independent professional judges. The coefficient of correlation between the two judges was 0.979 (N=78).

63
The post hoc calculated statistical power was 0.977. If assignment (a) is considered to be a pre-test and the result for assignment (b) as a post-test, then apparently the learning gain (B) for the experimental group was 0.672 ± 0.048 which can be designated as high. As can be seen from Table 5, the result of assignment (a) for the experimental group is lower than the result for assignment (b) for the control group. This difference can have at least two causes: Assignment (a) was formative and assignment (b) was summative. The
students are more inclined to look into the theory and prepare themselves for a summative examination. The results for summative tests are reported to be significantly larger than for formative tests (Chevins, 2005).
The theoretical implications of assignment (a) may be much more difficult and/or the task was more difficult.
Therefore, a more conservative learning gain is calculated after correcting scientific report outcome results with a back and forth z-transformation to get an average and standard deviation equal to group 2. In this case the learning gain is 0.432 ± 0.087. This is an “average” learning gain (Bos et al., 2007c). This is corroborated by the effect size according to Cohen (1998) d = 0.87. Compared to the literature findings of Bangert-Drowns et al. (2004) this effect size belongs to the top 7% (= 93rd percentile) and can be considered “high” in this research arena. 3.4.A.2 Gender effects and male-only analysis. The control group was large enough to investigate gender effects. In this group no significant gender differences were detected on the variables BX, average Chemistry marks, and Scientific report II. In the experimental group the fraction of male participants was much larger than in the control group. As an extra check, a male-only analysis of the results of assignment (b) was performed. The results can be found in Table 7. The scores for assignment (b) are on the 0-100 scale. The post hoc calculated statistical power was 0.807.

64
Table 6 Comparison of BX, average chemistry marks, and scores for assignment (b) of all male participants
group 1 (experimental) 2 (control) F(1,32) p BX ± sd 104.5 ± 11.6 102.9 ± 11.1 0.163 0.690 Chemistry ± sd 70.6 ± 13.0 69.8 ± 14.0 0.032 0.859 (b) Scientific report II ± sd (O2)
61.4 ± 21.5
44.9 ± 21.3
4.94
0.0336
number of MALE students (N)
17
16
The difference between experimental group and control group is significant ( p = 0.0336). 3.4.A.3 Nearest neighbour analysis As described in the methods section, the nearest neighbour to each participant in the experimental group was sought using the variables BX and Chemistry average. The comparison of these two groups is given in Table 7. The scores for assignment (b) are on the 0-100 scale. The post-hoc calculated statistical power is 0.912. The experimental group shows significantly higher scores for the scientific report II (p = 0.0166). Table 7 Comparison of participants in the experimental group with a group of nearest
neighbours Group 1 (experimental) 2 (control) F(1,44) p Age ± sd (yr) 17.18 ± 0.500 17.21 ± 0.437 0.0435 0.836 BX ± sd 104.7 ± 11.05 104.9 ± 9.47 0.00513 0.943 Chemistry ± sd 70.91 ± 12.24 69.7 ± 12.22 0.1222 0.728 (b) Scientific report II ± sd (O2)
63.47 ± 19.61
51.05 ± 13.69
6.206
0.0166
Number of students (N)
23
23
3.4.A.4 Analysis of results on the level of the different marking criteria For each of the 37 criteria, the average score of the experimental group for a particular criterion was compared to the average score for the same criterion in the control group. For 9 criteria the experimental group scored significantly higher than the control group (p < 0.05). In Table 8 these criteria are displayed.

65
Table 8 Criteria with significant differences between the two groups Nature of the criterion F(1,76) p Intermediate truncation of figures 8.643 0.00435 Correct calculation of molecular masses 7.218 0.00886 Stating a final conclusion (average with standard error) 6.573 0.01233 Mentioning approximate pH in equivalence point + consequence
5.743 0.01902
Describing equipment used 5.104 0.02674 Segmenting the text by using section titles 5.028 0.02785 Stating the colour change during the experiment 4.824 0.03112 Discussing interference by CO2 4.600 0.03517 Stating the correct acid/base stoechiometry 3.968 0.04996 Conclusion in more general terms: the trained group performed significantly better (p<0.05) with (1) correct scientific calculations, (2) better insight into the analytical chemical background, (3) more explicit in stating the different steps in the scientific reasoning, (4) more often used a clear lay out, (5) more precise in describing the observations, and (6) more often stated a final conclusion. From this analysis it could also be concluded that the students in both groups had more problems with the (chemical) content matter than with the format.
3.3.B Method experiment B
As in experiment A, we first will describe the design, the participants, the instruments, correction procedure, and statistical analysis. After that the results of experiment B will be described 3.3.B.1 Design of experiment B A group of 26 students from year 5 of a six-year pre-university school was asked to volunteer in this instructional experiment. The group was randomly divided into two equivalent parts. All students did the same chemical experiment as described in the experiment A above (estimating the molecular mass of an unknown pure white monobasic compound) (X1). They were given about one hour to write a concise scientific report I (O1). This procedure was identical to the one described in experiment A. At this stage the students did not get any feedback on the scientific report or experiment.

66
The next week the students performed (X2) a different chemical experiment: reaction of variable amounts of magnesium ribbon with a fixed volume of hydrochloric acid solution. Next, the excess acid was determined with sodium hydroxide solution. The students were asked to investigate the relationship between the mass of the magnesium and the amount of sodium hydroxide solution needed for the neutralisation. Along with this they were also asked to calculate the concentration of both the hydrochloric acid and the sodium hydroxide. The next week the experimental group performed (X3) a computerised peer assessment of the scientific report I (O1) of two unknown peers. The reference group was allowed to do homework assignments. During the next hour both groups wrote a concise scientific report on chemical experiment II (O2). This paper was assessed in the same way as described in experiment A. Table 9 summarizes the design. Table 9 Experimental design of experiment B Week 1 2 3 4 Experimental group X1 O1 X2 X3 O2 Control group X1 O1 X2 O2 Note: X1 = chemical experiment I; O1 = writing a scientific report on
chemical experiment I ; - at this stage no feedback of any kind; X2 = chemical experiment II; X3 = computerised peer assessment of report I (O1); O2 = writing a scientific report on chemical experiment II.
3.3.B.2 Participants in experiment B All participants were from year 5 of a six-year pre university school. In Table 10 some descriptive data are given. Variable BX (called the BX), a renormalized weighted average of all z-transformed official examination results of the preceding period, was used. The BX of all students from the same age group has an average of 100 and a standard deviation of 10. The variable Chemistry is the score of the official one hour exams in chemistry in the preceding period. As can be seen in Table 10, there is no significant difference with respect to gender, BX, and average Chemistry mark between the randomly sampled experimental group and the rest of the students.

67
Table 10 Some relevant data on the participants group 1 (experimental) 2 (control) F(1,24) p BX ± sd 101.96 ± 11.07 101.62 ± 8.87 0.0077 0.931 Chemistry ± sd 74.31 ± 13.55 72.69 ± 10.25 0.1176 0.735 % female 23 15 (Fisher-
Exact) 1
number of students (N)
13 13
3.3.B.3 Instruments, correction procedure, and statistical analysis in experiment B The instruments, correction procedure, and experiment B were identical to those in experiment A, but in experiment B a repeated measures ANOVA was also performed.
3.4.B Results of experiment B
In Table 11 the scores for the assignments (b) and (c) are given on a 0-100 scale. Table 11 Results for both assignments for the two groups group 1 (exp.) 2 (control) (b) Scientific report I (O1) 26.28 ± 8.79 25.19 ± 5.29 (c) Scientific report II (O2) 46.15 ± 20.28 22.58 ±10.10 Number of students (N) 13 13 Cronbach’s alpha for the Scientific report-assignment II (c) was 0.833 (Nstudents=26, Nitems= 45). The post hoc calculated statistical power was 0.831. The Scientific report assignment II (c) was graded by two independent professional judges. The coefficient of correlation between the two judges was 0.976 (N=26). An ANOVA of the scores of experiment (b) showed no difference between the experimental group and the control group: F(1,24) = 0.1467 (p = 0.705). A repeated measures ANOVA of the test scores of experiment (b) and experiment (c) showed that the difference between the two groups was significant: F(2,23) = 6.919 (p = 0.00444). If assignment (b) is considered to be a pre-test and the result for assignment (c) as a post-test, then the learning gain (B) for the experimental group was 0.441 ± 0.087. This can be designated as “average”. The learning gain for the control group

68
was -0.06 ± 0.086. Apparently the control group did not learn anything. This difference between the two groups is significant (p = 0.000365). The effect size according to Cohen (1998) d = 1.47. Compared to the literature findings of Bangert-Drowns et al. (2004) this effect size is belongs to the highest reported in literature.
3.5 CONCLUSIONS AND DISCUSSION
From the results in experiment A, we may draw the conclusion that applying peer assessment on writing a scientific report leads to the significantly better writing of a scientific report. The learning gain is at least of “average” size. This learning gain (B≈0.4) almost completely explains the difference between the experimental group and the control group in experiment A. Compared to other interventions, the effect size is to be considered high. This conclusion stands, even after correcting for possible selection bias by a male-only and a nearest neighbour analysis. We actually combined a variant with two pre-experimental designs: a one-group pre-test/post-test design and a static group comparison (D. T. Campbell & Stanley, 1963). Cook and Campbell (1979) categorize these designs as a special subcategory within the quasi-experiments: the non-equivalent control group designs that often do not permit reasonable causal inferences (Cook & Campbell, 1979). Fortunately the two designs generally compensate each other for some sources of internal invalidity (history, testing, instrumentation, regression, selection, and mortality). A rival explanation in terms of maturation seems not plausible considering the short period of time in which the experiment was executed. In the design of both experiments the effects of pre-testing is not accounted for. The external validity could have been increased by using a full Solomon Four-Group design, but in such a design the number of participants in each of the groups would be reduced and the statistical power reduced below acceptable limits. On the other hand, Bos, Terlouw, and Pilot (2007) argue that from a pedagogical perspective one should profit from a pre-test interaction effect with the experimental variable (Bos et al., 2007a). A selection bias could mean a validity threat. For example, in the experiment A the fraction of male participants was much larger than in the control group (Table 4). However, the results of the male-only analysis—comparing males from the experimental group with males in the control group—corroborated the main

69
effect found while the participants with other characteristics did not differ significantly (see Table 7). Although in both experiments A and B no gender effects have been found, it must be noted that in the group of students that participated in this investigation, the females outnumbered the males by 3:1. This ratio is rather extreme, although girls are over-represented in Dutch pre-university education (CBS, 2008). Nevertheless, there is always a chance for an interaction of selection and the experimental variable, but in the nearest neighbour analysis, the experimental group also performed significantly better. This corroborated the general positive findings, but since both kinds of validity for experiment A could be improved, a replication in a more controlled design could give more evidence about the effects and learning gain found. Therefore, in experiment B, a pre-test/post-test control group design on a tighter schedule was used. From this experiment B, it can be concluded that writing without any feedback or reflection does not produce any learning gain. Peer assessment fulfils the functions of feedback and reflection on the writing process and products. This supports our arguments in the theoretical considerations about the relevance of the functions of giving feedback (7) and giving opportunity to reflect (8). In the design of the experiments we carefully enacted both functions and from observations we can conclude that both functions were fulfilled to a high degree. The results enhance the argumentation for this underlying instructional theory and the strategies on feedback and reflection that are based on this theoretical framework. A pre-test/post-test control group design was applied, and with that the internal validity was secured. Concerning the external validity the following was revealed: Because we also found in the replication experiment B the same positive results as in experiment A, we definitely have more confidence in the external validity of the results of both experiments taken together. The conclusion about the “average” learning gain of applying peer assessment contrasts strongly with the statement in the review of Bangert-Drowns et al. (2004) who did not find a significant influence of feedback on the outcomes of writing assignments. This might be, as a first explanation, related to the way the learning results were assessed, the type of items that were scored and the norms applied (Table 4). In this study the scoring was focused on the communicative quality of the report and on the content elements that were related directly to this report. Other studies might have focused more on the learning of content matter in a kind of writing-to-learn versus a learning-to-write method with learning content matter as a mere side effect. A second explanation might be the quality of enacting the

70
functions of feedback and reflection in our study, on which we specifically focused. The kind of feedback given and reflection elicited by doing a peer assessment was directly connected with the demands of the learning task to be done and not of a meta-cognitive character that is much more general. The last kind of feedback increases the cognitive load, because it asks much more from students. The third explanation, finally, is that the use of different measures in the instructional design in order to decrease the cognitive load—the learning task, the kind of feedback, and reflection—was a favourable condition for the learning gain. However, there could be an alternative explanation for the higher learning gain: the experimental group had more time-on-task. In similar experiments, though, time-on-task was not a significant variable when explaining learning outcomes on this time scale. The peer assessment activity did not take much time, but it appeared to have a major impact on the learning outcomes. Formally the control group spent an equal amount of time, but in our opinion it’s not the amount of time that counts, but the quality of time spent. First-rate education is a mix of both carefully chosen, planned teacher guided activities and flexible student-directed learning. Peer assessment can also be combined with a self-assessment. That can be done through the same automated procedure as described in experiment B. We expect that the learning gain by this activity can be increased a little. After all, while doing the assessment of another student’s work, the assessor can get a clear picture of the criteria he has to meet, whereas in assessing his own work, the student can only experience the difference between his own writing and the reference level that is, in our opinion, a much softer influence. Yet perhaps starting with self-assessment followed by peer assessment will make a difference. This should, therefore, be a study for future research.

71
CHAPTER 4 Learning by marking. The learning gain of the peer assessor in secondary science education5 ABSTRACT
Since teacher time tends to be a scarce commodity, it is relevant to investigate whether transfer of assessment tasks to students can relieve teacher tasks. It is also relevant to investigate a possible learning gain to the peer assessor himself when performing a peer assessment. In a quasi-experimental design in secondary science education students assessed a complete paper-and-pencil test of a peer. In this case the assessors showed an “average” learning gain. The learning effect on the assessors was more closely examined in a computer-supported experiment, where students applied explicit scoring criteria to authentic pre-selected samples of answers of peers. The highest learning gain in this digital environment was found when students took a pre-test before applying scoring criteria to answers of peers.
4.1.1 Background and theoretical framework
In the last decade of the 20th century the available time for lessons in science subjects has steadily decreased in pre-university education in the Netherlands. In the Dutch system roughly 20% of the 15-18 yr old students follow a three-year upper level pre-university course. About 45% of them choose an ‘N-profile’ i.e. a stream with emphasis on science subjects (CBS, 2009b). The gradual reduction of face-to-face contact appears to be a European trend and is also present in the Netherlands (OESO, 2005, 2007). An approximate 50 percent reduction of science teacher time has been revealed in the Netherlands (Tweede
5 Paper presented at ORD 2006 (Bos, Terlouw, & Pilot, 2006), ESERA 2007 (Bos et al., 2007b),
published in Pedagogische Studiën (A.B.H. Bos, C. Terlouw, & A . Pilot, 2008c), submitted.

72
Fase Adviespunt, 2002). The updated 2007 version of the Dutch curriculum shows an even worse situation. An average Dutch student meets a subject teacher in a group of up to 32 students by and large two hours a week on a regular basis. This calls for an efficient and effective use of scarce teacher time. The application of formative testing in instructional processes results in a higher success rate as found in the survey by Black and William (1998); however, formative testing generates an efficiency problem (Black & William, 1998). A full-time Dutch science teacher has to deal with 200-300 students. Grading of tests will consume a relatively large part of the available teacher time. The use of Information and Communication Technology (ICT) is an obvious efficiency measure for organising and evaluating student production in all phases of the learning process. Multiple choice questions are implemented quite easily in a computerised environment; however, the use of that type of question may not be valid, considering the educational objectives. Assessing some scientific objectives calls for other types of test instruments. Graphical products, sketches, structural formulas, extensive calculations and step-by-step reasoning may be required. For the assessment of this type of student production human intervention is indispensable yet unfortunately very time consuming. A science teacher has to choose between spending his time on explaining complex concepts and relationships, facilitating learning during lab exercises, or on the other hand, spending time on testing and grading. It is necessary to have a quantitative picture of the accompanying effects to make a balanced choice. It is also necessary to find effective measures that are not time consuming (efficiency). Formative testing might be interesting and effective, but is there an efficient solution for the excessive grading time? Initiating student cooperation is a feasible solution in order to reduce grading time. Students can assess the work of their peer-students and give feedback. This phenomenon is found rather frequently, especially in higher education (Dochy, Admiraal, & Pilot, 2003; Dochy, Segers, & Sluijsmans, 1999; Topping, 1998). Next to economic reasons (most of the time the students are not paid) and despite negative reactions of the students (doing the work that normally has to be done by the teacher) (Clifford, 1999; Wen & Tsai, 2006), there are also theoretical considerations in engaging students in evaluation activities. The transfer of teacher tasks to students may have organisational motives, but is also in line with constructivist’s ideas (Bruner & Olson, 1973). Giving more responsibility to the learners for their own learning has a logical consequence: the transfer of traditional teacher tasks to the student. The assessment of the work of peers fits in this view and makes forms of formative testing feasible.

73
Quite extensive research has been done on self- and peer assessment. The main focus of quantitative research is on the relationship between student and staff scores. The conclusions are as follows: students, in general, give lower grades than teachers (Falchikov & Goldfinch,
2000). low-performing students overestimate themselves (Boud & Falchikov, 1989). students awarded lower grades than their teacher to the best performing
students (Sadler & Good, 2006). gender is not important if the grading is blind, (Falchikov, 1997) but according
to Pope (2005) female assessors have more problems. Literature supplies some other findings and recommendations. Sadler and Good (2006) recommend blind grading for legal and privacy reasons. Zoller, Tsaparlis, Fatsow & Lubezky (1997) differentiate between the assessment of Higher-Order Cognitive Skills (HOCS) like critical thinking, asking questions, reasoning, and solving new and badly defined problems and Lower-Order Cognitive Skills (LOCS), connected to simple recall of knowledge or application of known theories in familiar contexts or solving problems by familiar algorithms. In the last category (LOCS) they find no difference between the assessment of the professors and their students in various scientific disciplines. There is a big gap however between untrained students and the professors when it comes to the assessment of activities that require higher-order cognitive skills (Zoller et al., 1997). According to Stefani (1994) the understanding of assessment criteria is beneficial to students. An assessment partnership of tutors and students enhances a meaningful learning process and the development towards autonomous, independent and reflective learners. According to Orsmond, Merry & Reiling (2002) formative assessment by students allows for the learning of subject-specific knowledge, meaningful discussions, and formative feedback during a course. The construction of criteria by the students could be a next step in student assessment activities. Reports on this issue give an unclear view. Langan et al. (2005) report, that students did not achieve higher grades when they participated in the development of assessment criteria. However, while training future teachers in primary education in defining criteria, Sluijsmans, Brand-Gruwel & van Merriënboer (2002) came to mixed conclusions. The students became better assessors, and scored sometimes better, sometime worse on subject matter related performance (Sluijsmans, Brand-Gruwel, & van Merriënboer, 2002; Sluijsmans, Brand-Gruwel, van Merriënboer, & Martens, 2004).

74
There are more indications that the empirical evidence for beneficial effects of self- and peer assessment is not really very strong. This view is supported by the survey of Boud & Falchikov (1989) on self-assessment, in which they state that a part of the quantitative research on this matter is of poor quality. The same opinion is found in a survey on peer assessment of Falchikov and Goldfinch (2000) concerning the 1959-1999 period. The study shows a uniform distribution of low quality studies over all decades. This qualification is not found in old or recent publications. By contrast, Davies, Kumtepe & Aydeniz (2007), Minjeong (2005), and Chapman & Bloxham (2004) found definite benefits of peer assessment. They all refer to evidence from a study by Bloxham & West (2004), but the last authors are actually much more modest in their statements. They call their work a small-scale, largely qualitative study and not a major contribution to research in this field. Finally, Sadler & Good (2006) remarked that statistically rigorous research attempting to analyze the effect of student grading appears to be rare. In order to measure the effect on the student assessor they perform an experiment with a group of 100 general science students (aged 13 years old). After making a test (mainly in the field of biology) one quarter of the group graded their own test, half the group graded the test of a peer, and one quarter graded nothing (the control group). Approximately one week after the administration and grading of the first test, the same test was administered under the same conditions as the first. The teacher also graded the tests. The main conclusion is that students who graded their peers’ tests did not significantly improve more than the control group, but students who corrected their own tests improved dramatically. Two results are noteworthy: (a) there is no pre-test effect and (b) peer assessment has a much smaller effect than self-assessment. An explanation for this could be as follows: Sub (a) : an effect of the pre-test on the post-test could be expected since the
participants take an identical test shortly after each other (Willson & Putnam, 1982).
Sub (b): there is no sound explanation for the difference between the effects of self- and peer-grading.
A complicating factor is the high average score of the first test, because there is a good chance of a ceiling effect. The authors report a skewed frequency distribution, characteristic of a ceiling effect (P. M. Sadler & Good, 2006). In summary, it can be concluded that the educational literature does not provide a strong base of empirical evidence for learning effects of peer assessment. A further quantitative grounding is needed with attention paid to the methodical

75
design. The importance of taking the responsibility for their own learning as well as reducing the teachers’ correction burden are two good reasons for peer- and self-assessment of formative tests. Moreover, the learning effect on the assessor himself is underexposed in the literature. It could be a third good reason for grading by students. Because the learning gain of the peer assessor himself is not clear yet, this study will concentrate on measuring this effect. In formative testing this learning effect might be of greater importance than precision and accuracy of the grading given by the students. The result of formative testing is of little importance for allocation, selection or certification. In contrast with summative testing the focus is on feedback, reflection, diagnosis and monitoring of the learning process (William & Black, 1996). The first section of this study will examine the learning gain of the assessor in a pilot using a pre/post-test design with a control group. The pre-test is different from the post-test in order to prevent an effect of pre-test on the post-test. In the second part a pre/post-test assessment experiment will be supported by ICT. In this second experiment a special design will be used to check for the pre-test effect.
4.1.2 Research questions
In this study the two issues concerning peer assessment will be addressed by the following questions: 1. What is the learning gain for the peer assessor himself in a conventional setting? 2. Does peer assessment with or without a preceding pre-test produce a learning gain for
the assessor in an ICT-supported setting? Two separate experiments will be used to answer these questions.
4.2.A Method experiment A
In this section the design as well as the outline of both research and instructional set-up of the two experiments will be discussed, followed by details of the participants. After this the subject matter and the test instruments will be treated. Finally, data processing will be dealt with: the grading procedure, statistical analysis and calculation of the learning gain.
4.2.A.1 Experimental design and procedures
By means of a two stage randomisation (Bos et al., 2008a) 36 students from a school for pre-university education were divided into two (equivalent) groups. All students took a pre-test (O1). In the next step each student in one of the two

76
groups (group 1) was given a correction model of the pre-test. Using the model a randomly chosen pre-test of another anonymous student could be graded. The other group did not participate in this activity and was isolated from group 1. Following Cook and Campbell (1979) a difference is made between making the test and the following activity (the grading). Here we define the grading of the work of another student (the peer assessment) as the treatment (X). After the peer assessment group 1 took the post-test (O2). At the same time group 1 was performing the peer assessment, the other group took the post-test. Since this was an ecological (classroom) experiment, the second group performed a peer assessment also but after the post-test. The scheme of this design was summarized as follows: for group 1: R O1 X O2 for group 2: R O1 O2 ( X ).
4.2.A.2 Participants
For experiment A 36 students pre-university students were divided into two equivalent groups by means of a two-step randomisation. A renormalized weighted average of all z-transformed official examination results of the preceding semester, called the BX, was used. The BX of all students in the same age group has an average of 100 and a standard deviation of 10. The two-stage computerised procedure of randomisation was applied as follows: a student was chosen randomly from the student population, and then his nearest neighbour, a student with the same gender and with minimal BX difference, was sought. Subsequently the first student was randomly assigned to group 1 or group 2 and the other student to the other group. Three students were not able to be present during the complete experiment. 33 students participated in the experiment. The two groups turned out to be the equivalent regarding age, BX, and gender as could be demonstrated by means of an F-test and a Fisher-exact test. Some data of these two groups are depicted in Table 1. Table 1 Participant data in experiment A
group→ 1 (O1 X O2) 2 (O1 O2) p
Age ± sd (yr) 15.9 ± 0.32 16.0 ± 0.47 0.46a
BX ± sd 103.4 ± 10.4 104.0 ± 9.21 0.87a
% female 76 69 0.50b
participants (N) 17 16 Note: a by F-test; b by Fisher Exact-test

77
4.2.A.3 Instruments and materials
For experiment A a conventional pencil-and-paper test was used consisting of 24 questions and assignments. Instead of a name, a 6-figure student number was used as identification. On the form with the assignments there was space to write down the answers. For the peer assessment in the correction model the answer to each question or assignment was divided into 4 essential elements. For each element one point could be awarded. In case of doubt a question mark ought to be placed. The post-test consisted of 15 short answer questions that were different from the pre-test, but on the same subject matter. The pre-test took about 25 minutes, the peer assessment (the treatment) between 12 and 15 minutes, and the post-test took about 15 minutes. The subject matter of experiment A was in the first chapter of a standard textbook on introductory chemistry (Franken, Kabel-van den Brand, & Korver, 1998) with the following subjects: the structure and mass of atoms; the Periodic System; metals, salts, and molecular compounds; and forces in and between molecules and hydrogen bridges. A sample of an assignment is depicted in Figure 1.
Figure 1 Example of a pre-test question in experiment A
4.2.A.4 Correction procedure, statistical analysis, and estimation of learning gain
Two teachers independently executed the assessment of the free format questions in the tests of experiment A using a detailed correction procedure. Except for one question (on H-bridges) no systematic difference between the two assessors was found. The correlation coefficient between the two assessments was 0.99. In case of a difference, the average score of the two assessors was taken as a staff score and used for further calculations.

78
Maximum scores were put to 100. The average normalized gain <g> was been calculated according to (Hake, 1998a, 1998b) with the formula
<g> = ( post-testav – pre-testav )/(100 – pre-testav ) where post-testav is the average post-test score and pret-testav is the average pret-test score (Hake, 1998a, 1998b). Applying Bos’ method (Bos et al., 2008a) a second calculation of learning gain was performed. Experimental data in several designs and different disciplines show a power law relationship between pre- and post-test scores. A plot of log (post-test/pre-test) against log(pre-test/100) shows a straight line through the origin. The slope of the line is the learning gain exponent B. The pre- and post-test scores of each individual participant were entered in a special computer application. A non-linear least squares fit was performed, yielding a value for B as well the deviation in this parameter. By means of a t-test the significance of differences in B was established. By means of simulations it has been established that the method gives more accurate results and a much smaller probability of type II errors (false negative results) than the conventional method based on effect sizes. In some cases the experimental design leads to groups of participants that do no pre-test. As an alternative a rough estimation of learning gain can be calculated with the formula
B = log (post-testav/pre-testav) / log (pre-testav/100) where post-testav is the average of the post-test scores of the group, but pre-testav is the average pre-test score of equivalent groups. (Note: Practically the same formula can be used for calculating the gain for an individual participant.) Compared to the method where individual pre- and post-test data are used, B-values are somewhat more conservative. In these cases it is not possible to estimate parameter errors. If group averages are used for calculation of B-values, the subscript “cat” is used (Bos et al., 2007c). A nominal categorization of the knowledge growth exponent B is depicted in Table 2, which is based on a calibration with data from a review of Hake (Hake, 1998b) With respect to the empirically estimated parameter it is customary to give the standard error of the mean Se. The relation between the standard deviation sd and se is Se = Sd/√ν in which ν are the degrees of freedom.

79
Effect sizes according to Cooper were also calculated (Cooper, 1998). Table 2 Nominal scale for the learning gain exponent B (Bos et al., 2007c) exponent learning gain typology
B ≤ 0.40 “low”
0.40 < B < 0.60 “average”
B ≥ 0.60 “high”
4.3.A Results
4.3.A.1 Research question 1: What is the learning gain for the peer assessor himself in a conventional setting?
In Table 3 the average scores and learning gains are given for the pre-test A and pre-test B (maximum =100%). Table 3 The results and learning gains of experiment A
group →1 (O1 X O2) 2 (O1 O2) p
Pre-test (max=100) average ± sd 52.7 ± 15.9 48.9 ± 15.0 0.483a
Post-test (max=100) average ± sd 69.1 ± 20.1 46.6 ± 22.0 0.004a
Average normalised gain <g> ± se 0.39 ± 0.067 0.00 ± 0.069 0.0004b
Learning gain exponent B ± se 0.35 ± 0.17 -0.17 ± 0.17 0.0001b Note: a by F-test; b by t-test The pre-test values did not differ significantly; the two groups were equivalent. The tests showed a high internal consistency: Cronbachs alpha for the pre-test was 0.665 (P<10-3) and for the post-test 0.783 (P<10-3). There was a strong linear correlation between pre- and post-test (group 1: R=0.812 P>0.9999; group 2: R= 0.875 P> 0.9999). The conclusion is that peer assessment leads to a significant learning effect on the peer assessor himself. If the gain is calculated according to Hake (1998) the classification ‘average gain’ would be noted for group 1, and would be typical of ‘interactive engagement’ types of education. The slightly negative learning gain exponent B calculated for group 2 indicates a slightly more difficult pre-test in comparison with the post-test. After correction for this an 'average gain' is found for group 1. The effect size according to Cooper was d=1.07 (Cooper, 1998).

80
On the average the pre-test scores given by the students (48.8 ± 14.6) were slightly lower than staff scores. The effect size calculated according to Cooper (Cooper, 1998) was d= -0.13. A paired t-test gave a statistical significant difference of -2.0, t (32) =-2.58 P=0.015. 4.3.A.2 Differences between peer assessors The individual normalized learning gains did vary strongly between the peer assessors. In order to investigate a relation between BX, the treatment X, and gain <g> the students were divided into 3 subsets (BX ≤ 100; 100 < BX < 110; BX ≥ 110). No significant interaction between treatment and BX-group was found. The results of a two-way-ANOVA without interaction are given in Table 4. Table 4 Two-way-ANOVA of the variable gain <g> with factors (a) BX-group and (b)
treatment (X) Source Sum-of-Squares Df Mean-Square F-Ratio p Treatment (peer assessment) 1.14 1 1.14 17.98 0.0002 BX-group 1,2,3 0.52 2 0.26 4.13 0.0263 All sources 1.67 3 0.56 8.75 0.0003 Error 1.84 29 0.06 Total 3.51 32 The conclusion is that a small gain is found in BX-groups 1 and 2, and a high gain in BX-group 3—the students with relatively high results for school exams in different school subjects (BX-group 3) have the highest learning gain. Analysis of gender-based discrepancies of the peer assessor did not show any difference (p=0.87), and it does not matter whether the peer assessor is a girl or a boy.
4.2.B Method experiment B
4.2.B.1 Experimental design and procedures In order to distinguish the effect of peer assessment from the pre-test effect, to eliminate quality differences in work to be assessed, and to actuate, monitor, and register the application of the criteria, a second, computerised set-up was designed. This peer assessment included digital scans of answers from a paper-and-pencil test made earlier by similar students. In a pilot study a quadratic relationship between the learning effect of assessment and the score of the graded work was found. Our explanation is that in a very bad test not much is to be graded, whereas in a perfect test the assessor can apply the criteria more

81
superficially. On the basis of this relation, the selection criterion for a suitable answer was that the answer was not completely wrong or entirely correct. The answers originated not from 1 student but from 22 different students. The selected 22 answers were connected to 23 different issues (subject matter). In the last answer 2 different issues were being treated. On each piece of subject matter, two new homologous short answer questions were made. One half of these 46 new questions were assigned to a pre-test and the rest to an equivalent but different post-test. Instead of dividing the participants into experimental and control groups, a variant of the quasi-experimental ‘Separate Sample Pre-test-Post-test Control Group Design’ (D. T. Campbell & Stanley, 1963) was used. In this case both the pre-test as well as the treatment (peer assessment) were randomly assigned to the students. The post-test was administered to all participants. This design is related to the Four Group Design (Campbell en Stanley, 1963). In this study random assignment of pre-test and treatment items to the participants formed four groups.
Figure 2 Diagram indicating probabilities of 4 possibilities : pre-test yes/no X peer
assessment yes/no The technique in this experiment could be called orthogonal randomisation, since there are two dimensions: the participants, and at right angles (orthogonal) the treatment elements. Traditionally randomisation of participants takes place. In this very experiment the randomisation takes place in the other dimension of the treatment elements. In our study each person is present in all four groups by means of the random assignment of a part of the pre-test and treatment items.

82
The mode of operation was as follows (see Table 5): from the pool of 23 pre-test questions for each participant 12 randomly chosen questions were selected and presented for answering (O1). Subsequently, 12 out of 22 digitally scanned (pencil-and-paper) answers to strongly related questions were randomly chosen. The 12 questions and answers were displayed together with a correction model, showing clear and explicit criteria for assessing the answer. When the assessment accorded with the correction model, the feedback "OK" was given, but if the criteria were not applied correctly, a more extensive feedback was displayed (X). Finally a complete set of 23 short answer questions were given as a post-test (O2) There is a 12/23 = 52.2% chance that a certain question will be present in the pre-test and a 12/22 = 54.5% chance that a certain issue will be present for assessment (X). On the issue level 4 possibilities emerge as shown in Table 5 and Figure 2. Table 5 Experimental design of experiment B with the probability that a certain question
shows up in the pre-test (O1), or that a certain issue is assigned to be assessed and appropriate feedback on the assessment is given (X)
Non-assessed Assessed Total Not present in pre-test O2 .217 XO2 .261 .478 Present in pre-test O1O2 .237 O1XO2 .285 .522 Total .455 .545 The advantage of this design is that everyone performs a unique experiment, but on average the total group does the same. Every participant receives at random a subset from the pool of pre-test questions and assessment assignments, so on average each participant does the same. Both external and internal validity are guaranteed (D. T. Campbell & Stanley, 1963), although diffusion may threaten the internal validity because the exchange of information between the groups can lead to mutual influence. In the design used in experiment B each participant is present is each group (category). It is possible that activities of a participant in one piece of subject matter influence the performance in another task. This is a form of “transfer” that is not undesirable from an educational point of view, but also leads to fewer differences in post-test scores between the categories, making the research findings somewhat less significant. It must be emphasised that the product of these peer assessment activities was not a mark for one individual student, since the 22 answers to be assessed were given by 22 different students.

83
The explicit purpose was the application of students’ marking criteria under controlled conditions. 4.2.B.2 Participants For experiment B the same type of students (n = 44) as in experiment A was selected: age 16.2 ± 0.4 year, 25 % male. As described above, the experimental groups were formed not by randomised assignment of people to groups, but by random selection of pre-test questions and treatment items (orthogonal randomisation). 4.2.B.3 Instruments, materials and estimation of learning gain With the test authoring system Wintoets 3.0 the pre- and post-test, as well as the assessment instrument, were constructed. Digitally scanned questions with student answers from a prior test were recorded in 400 x 400 pixel gif format. To dichotomously score elements of the displayed answer the so-called multiple-multiple choice question format was used. In this type of question more than one answer item can be ticked as right. An example of this type of question is given in Figure 4. Each question and student answer displayed was accompanied with a correction model. The students showed no problems working in this way, though initially they had to adapt themselves from the test mode, in which they had to generate an answer themselves, to the assessment mode in which they had to verify the correctness of someone else's answer. At first glance the question of Figure 3 seems to be asking for an elementary fact that can be recalled from memory. It must be kept in mind however, that myriads of this kind of model can be constructed, so the student has to perform a cognitive process (counting the carbons, counting attached hydrogen atoms, and deducing the presence of pi-bonds, etc.). In order to evoke the described cognitive process three different types of plastic models of molecules were photographed, and also different display modes of molecular modelling software were used. The pre-test (12 questions) took 13.0 ± 3.9 minutes, the assessment (12 assignments) took 8.5 ± 3.1 minutes, and the post-test (23 question) took 15.0 ± 3.9 minutes.

84
Figure 3 Screen shot of an assessment assignment in experiment B, in which the
participant checks whether criteria are met The subject matter in experiment B consisted of an introduction to organic chemistry with the following subjects: types of molecule models; alkyl-groups; radicals, carbocations, carbanions; unsaturated compounds; (cyclo-)alkanes, alkenes, and alkynes; (cis/trans) isomers; aldehydes and ketones; and carbonic acids. Learning gain was calculated according to Hake (1998) and Bos et al. (2007). Effect sizes were calculated according to Cooper (1998).
4.3.B Results
4.3.B.1 Research question 2: Does peer assessment with or without a preceding pre-test produce a learning gain for the assessor in an ICT-supported setting?
In Table 6 pre- and post-test results are given for the four design categories. Note: as stated in the Method section, the gain in categories C0 and C1 are calculated with category averages, using pre-test averages from the other categories. This gave a rough indication of gain.

85
Table 6 The results in experiment B for four design categories Design category C0 C1 C2 C3
post-test only
peer assessment only
pre-test only
pre-test + peer assessment
Pre-test ± sd (max=100) - - 20.7 ± 14.0 24.9 ± 14.0 Post-test ± sd (max=100) 39.5 ± 17.4 47.9 ± 16.6 37.9 ± 17.3 55.7 ± 16.0 Average normalized gain <g> ± se 0.21 (cat) 0.32 (cat) 0.31 ± 0.053 0.41 ± 0.039 Learning gain exponent B ± se 0.37 (cat) 0.50 (cat) 0.32 ± 0.13 0.61 ± 0.076 The difference in average pre-test values of category C2 and category C3 is not significant. F (1,526) = 1.92 (P=0.17) as could be expected, since categories are formed at random and hence it may be presumed that all categories are equivalent. The average pre-test value of categories 2 and 3 together is 23.0 ± 14. This value is used as a reference for the learning gain calculations of the no-pre-test category C0 and category C1. For a visual impression of the differences between pre- and post-test values in Figure 4 average values ± Se are depicted. The reliability of the post-test was satisfactory: Cronbachs alpha = 0.85 (P<10-3).
Figure 4 Average pre- and post-test scores ± Se for the different categories.

86
4.3.B.2 The effect of the pre-test In order to investigate the significance of the differences in post-test results a Bonferroni analysis was performed. The results are in Table 7. Table 7 Significance (p) according to Bonferroni of differences between design categories in
post-test results Design-category C0 C1 C2
post-test only
peer assessment only
pre-test only
C0 post-test only - C1 peer assessment only 0.14 - C2 pre-test only 1 0.035 - C3 pre-test + peer assessment 4.6 10-5 0.14 3.4 10-6 The highest post-test results are found in category C3, i.e. when a student is pre-tested on an issue and assesses a related question, answered by a peer student (category C3 = pre-test & peer assessment). In that category the result is significantly higher than in the reference category C0 (no pre-test, no treatment) and significantly higher than category C2 (only a pre-test, no peer assessment). The result of peer assessment and pre-test (category C3) is not significantly higher than with peer assessment without pre-test (category C1). The difference between category C2 and category C0 is not significant either. Taking a pre-test with the pre-sensitisation as its purpose makes sense only when a peer assessment (treatment) follows. Effect sizes (Cooper, 1998) compared to category C0 were for category C1: d=0.49; for category C2: d=-0.09; and finally for category C3: d=0.97. With the average pre-test values of categories C2 and C3 the average normalized gain <g> and the learning gain exponent B for categories C0 and C1 were calculated. The gain accorded with Hake's criteria (Hake, 1998b), as well as the criteria by Bos et al. (Bos et al., 2007c): “low” for categories C0 and C2, and “average” for category C1. The learning gain for category C3 was “high”.
4.4 CONCLUSIONS AND DISCUSSION
In summary, the following conclusions can be drawn from the two research questions.

87
Experiment A. The application of a conventional (paper-and-pencil) peer assessment leads to a significant learning effect on the peer assessor. An “average” learning gain was measured. A noteworthy result is that better students learn more than weaker students. Experiment B. In a digital learning environment the combination of a sensitising pre-test and peer assessment, as well as peer assessment alone, leads to a significant learning effect for the peer assessor. The learning gain for the peer assessment alone was only “average”. The learning gain for the combination of sensitising pre-test and peer assessment was high. It also became clear that it is not relevant to enact only a pre-test without a subsequent learning activity. In a supplementary analysis, the learning gain of the individual participants in experiment B were compared with the average semester results for the official Chemistry exams. The Chemistry average was significantly correlated with the average school examination results for the subject chemistry (R = 0.302 p = 0.049). In both experiment A and B the better students learn more from peer assessment than the weaker ones. From the experiments, the conclusion can be drawn that assessing the work of a fellow student is effective for the learning of the assessor himself. An alternative explanation for the learning gain in experiment A seems to be that in the assessment students do an extra exercise with the relevant knowledge and problem approach. From the perspective of the learning assessor that is indeed the case. However, from the perspective of a teacher—and this is a different perspective—there is a takeover of the assessment function by students, and in our opinion this is the strongest argument that peer assessment is effective and efficient. Regarding experiment B, the higher mean average scores for the condition 'peer assessment only’ and the condition ‘pre-test and peer assessment only' (see Table 6) can be compared with the condition ‘pre-test only’ or 'post-test only'. The difference perhaps can be explained by the fact that in the first two conditions the subjects have seen a same or related question in the treatment as in the post-test (interaction of treatment with the post-test). An independent post-test in experiment B might have led to a stronger conclusion. Our result seems contrary to the results of Sadler and Good (2006). They found a learning effect (B ≈ 0.50) when the students assessed their one own work, but no effect for the assessment of the work of other students. A possible explanation might be the occurrence of a type II error, an improper reporting of ‘no effect’.

88
The reported data suggest that the probability of such an error is likely. A second explanation for the difference between the effects of assessing their own work as opposed to the assessment of work of other students could be found in student’s having greater interest in their own work than that of an anonymous fellow student, especially if the assessor sees no advantage in the difficult correcting of someone else's work. Boud and Falchikov (1989) state correctly that the assessment also should be rewarded. The experiments A and B in this paper focused on learning new science concepts in secondary education and the assessors using criteria provided by the teacher. The results cannot be generalized without restrictions, or compared with other arrangements, for example, in higher education. So, in the training of teachers in higher education components like ‘defining criteria', 'writing a qualitative assessment', and 'giving feedback' can be effective and relevant (Sluijsmans and Prince, 2006). However, this does not exclude the use of other forms of checking activities a priori, as the forms used in this study for applying assessment criteria that are set by the teacher and the checking of the correct application thereof. We see this as a first step in developing higher order cognitive skills in science subjects (Zoller 1999, Zoller et al., 1997). The students in this report had just started with a science subject. It seems premature to have these students developing their own assessment criteria in this context. Because the accuracy and precision of the assessments by students compared with those by teachers were of secondary importance in our view, we did not describe any details about that in the section on results of experiment A. As indicated in the literature review, students in general give somewhat lower scores than professionals. We have also found such differences. These differences between the official scores and peer assessments are statistically significant, but they are very small (in the order of 2% of the total scores). In the aforementioned meta-analysis of 48 studies (Falchikov and Goldfinch, 2000) students on average also give slightly lower scores. Falchikov & Goldfinch (2000) give a weighted average effect size of d= -0.02. Observation of the process of evaluation gives a possible explanation for this effect size found. When an answer is somewhat different from the correction model students tend to decide that the answer is wrong, while a teacher quickly recognizes and appreciates the merits of an alternative solution.
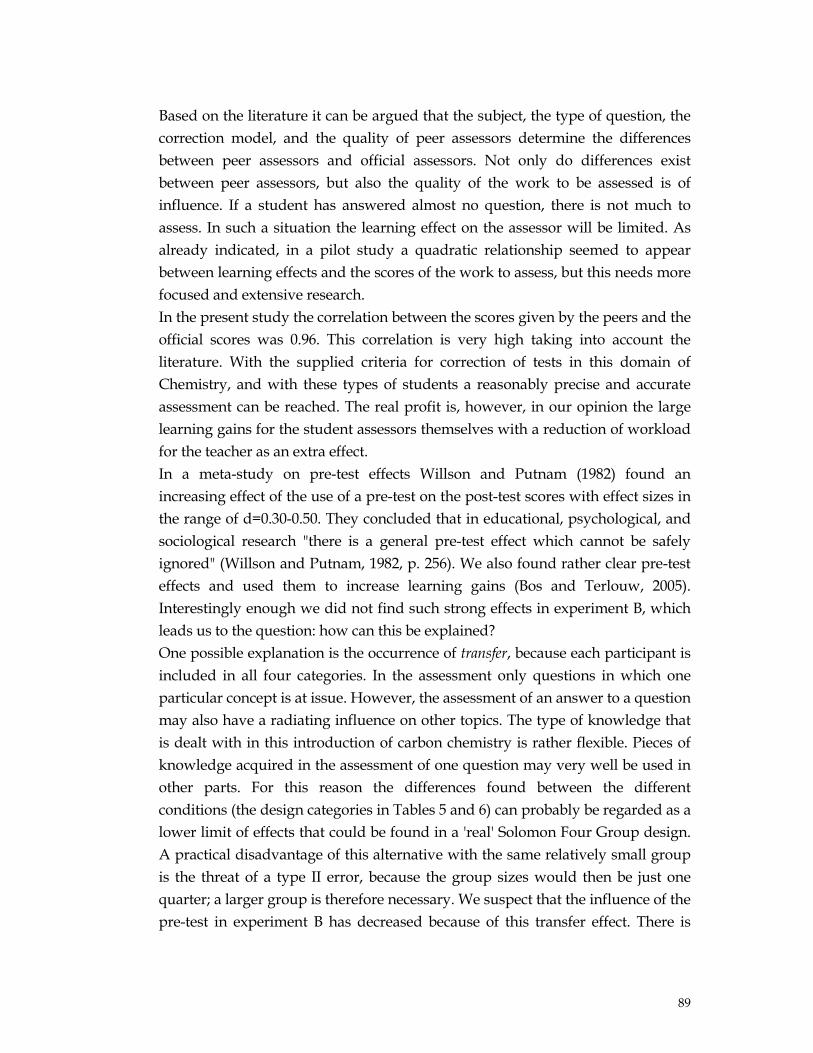
89
Based on the literature it can be argued that the subject, the type of question, the correction model, and the quality of peer assessors determine the differences between peer assessors and official assessors. Not only do differences exist between peer assessors, but also the quality of the work to be assessed is of influence. If a student has answered almost no question, there is not much to assess. In such a situation the learning effect on the assessor will be limited. As already indicated, in a pilot study a quadratic relationship seemed to appear between learning effects and the scores of the work to assess, but this needs more focused and extensive research. In the present study the correlation between the scores given by the peers and the official scores was 0.96. This correlation is very high taking into account the literature. With the supplied criteria for correction of tests in this domain of Chemistry, and with these types of students a reasonably precise and accurate assessment can be reached. The real profit is, however, in our opinion the large learning gains for the student assessors themselves with a reduction of workload for the teacher as an extra effect. In a meta-study on pre-test effects Willson and Putnam (1982) found an increasing effect of the use of a pre-test on the post-test scores with effect sizes in the range of d=0.30-0.50. They concluded that in educational, psychological, and sociological research "there is a general pre-test effect which cannot be safely ignored" (Willson and Putnam, 1982, p. 256). We also found rather clear pre-test effects and used them to increase learning gains (Bos and Terlouw, 2005). Interestingly enough we did not find such strong effects in experiment B, which leads us to the question: how can this be explained? One possible explanation is the occurrence of transfer, because each participant is included in all four categories. In the assessment only questions in which one particular concept is at issue. However, the assessment of an answer to a question may also have a radiating influence on other topics. The type of knowledge that is dealt with in this introduction of carbon chemistry is rather flexible. Pieces of knowledge acquired in the assessment of one question may very well be used in other parts. For this reason the differences found between the different conditions (the design categories in Tables 5 and 6) can probably be regarded as a lower limit of effects that could be found in a 'real' Solomon Four Group design. A practical disadvantage of this alternative with the same relatively small group is the threat of a type II error, because the group sizes would then be just one quarter; a larger group is therefore necessary. We suspect that the influence of the pre-test in experiment B has decreased because of this transfer effect. There is

90
indeed a lower result at the assessment without a pre-test; however, the difference with the combination of pre-test and assessment is not significant. A second possible explanation could be the use of the method of comparison according to Bonferroni. The conservative nature of this method quite likely reduces the risk that significant differences are found for the post-test values of the condition 'only pre-test' in experiment B (see Category C2 in Tables 5 and 6). From the results of this study we therefore draw no negative conclusions regarding the positive effects of pre-test—especially when (in view of this study’s results) the pre-test provides immediate feedback. We suspect that the abovementioned transfer reduced the power to distinguish between the various effects. In a real Solomon Four Group design with a sufficient number of participants in the group a significant difference will indeed be found. The disadvantage of the use of effect sizes is clearly visible in the experiment B. The results are compared with a reference-group (Category C0) and not with the individual pre-test scores. Because there is probably also a learning effect by the above mentioned transfer in category C0, the effects seem smaller than the gain measurements through the growth exponent B, where the (individual) post-test results are compared with individual pre-test results. Without a pre-test the learning effect in the reference group would have gone unnoticed through the usual effect measurements. We see here a strong argument in favour of the O1XO2 design. In other words, in a research design aimed at determining the learning gain, a pre-test should always be involved (Hake, 2001). The learning mechanisms behind these effects can be described in terms of activating existing schemata by means of pre-testing, and strengthening relations between schemata by focus and rehearsal during the assessment process. Applying a combination of both appears to be a promising and powerful driving force in a meaningful learning process.

91
Figure 5 Electronic formula of nitrogen dioxide showing something “odd”. Authentic
test answer

92

93
CHAPTER 5 Pre-test sensitisation in guided discovery learning using simulations in pre-university chemistry education6
ABSTRACT
Since face-to-face contact is becoming scarcer, it is relevant to look for more effective methods of science education that also save teacher time. A computer-based simulation environment was built using principles from (a) a general theory of instructional functions for the overall instructional framework, (b) Van Hiele’s level theory, and (c) Mayer’s cognitive theory of learning from interactive multimodal environments. Specific measures fostering effectiveness that also save teacher time were (1) pre-test sensitisation and (2) peer support. The assessment of prior knowledge by a pre-test was meant to activate relevant scientific concept networks. The function of peer support was giving just-in-time support, immediate feedback, and the reduction of cognitive load. The effects of both pre-test sensitisation and peer support were estimated in an extended Solomon Four Group research design. The subject matter in the computer simulation comprised concepts from chemical reaction kinetics. The results showed a high learning gain, especially when pre-tests were used and peer support was available. After two months the effect of pre-testing was still significant.
6 Paper presented at ORD2008 (Bos et al., 2008b), submitted.

94
5.1 INTRODUCTION
5.1.1 Rationale
At the start of the new millennium in the Netherlands a new educational system for 15 to 18 year- old pre-university students was introduced with a specific view on the learning process in which the students are in fact more responsible for their own learning and more emphasis is given to the student’s own initiative. The teachers' task more or less was supposed to change from knowledge transfer and certification to coaching and facilitating the partly self directed learning, occasionally in cooperative small group settings. At the same time, at student level, the availability of teachers in science and mathematics has been reduced dramatically by reducing face-to-face contact hours (Tweede_Fase_Adviespunt, 2005). Since this reduction may prove to be a major international trend (OESO, 2007; Ritzen, 2006; Roes, 2001), it is necessary to look for ways of increasing the effectiveness of the various types of learning processes, the more since the deep learning of science concepts requires stimulation in many ways. Taking into account the gradual, irreversible reduction of face-to-face contact, it is relevant to investigate effective ways of learning that also save teacher time.
5.1.2 Educational software as a possible solution
The efficient use of Information and Communication Technology (ICT) in optimised settings seems to be a promising possibility to increase the effectiveness of learning scientific subject matter. Next to the standard off-the-shelf software suites and ubiquitous standard digital technology that can be used in any discipline, the science teacher can apply easy to use specific hard- and software, making it possible to retrieve, store, transform, analyse, model and display experimental data (Osborne & Hennessy, 2003). In his review Valdez et al (2000) conclude that success or failure of ICT applications depends critically on the congruence between courseware design and the target instructional environment (Valdez et al., 2000). From this view Watson (2001) states, that the focus on technological novelties is too large, and on the educational functionality, too low. Moreover, too much emphasis is on the development of lower skills and superficial forms of learning than on more complex and deeper forms, and that too much attention is paid to data gathering than to mental development (Watson, 2001). Especially higher goals and objectives from Bloom’s taxonomy

95
(application, analysis, synthesis, and evaluation) (Bloom, 1956) are neglected, reducing the educational potential of ICT-applications (Watson, 2001). De Jong and Taber (2007) also conclude that there is potential of multimedia tools on the basis of a small survey on teaching multiple meanings of complex chemical reactions. But, in all cases, these tools require a very careful design and proper embedding in an overall instructional approach (O. De Jong & Taber, 2007)
5.1.3 Computer simulations
In science education the use of computer simulations seem to give an interesting contribution to meaningful learning. The learners actively evaluate and expand their prior knowledge and reconstruct their (mis-)conceptions and naive beliefs. A part of the operational instructional activities can be handled by an easy to implement computer system giving idealised dynamic visual representations of natural processes without the need of complicated, costly, or impossibly hard to perform experiments (Hennessy et al., 2007). Because scientific processes are often complex and counterintuitive, simulations can be a starting point for further explanations, clarifications, and discussions necessary to the construction of more abstract, general and explanatory knowledge frameworks (Driver, Asoko, Leach, Mortimer, & Scott, 1994). In simulation based scientific discovery learning the main task for the learner is to infer the underlying relations in the model or to state and test a hypothesis. Typically, in the simulation environment the learner can manipulate input variables and study the effect on output variables (T. De Jong et al., 1998). De Jong & Van Joolingen (1998) state that there is no clear and univocal outcome in favour of simulation based discovery learning (T. De Jong & van Joolingen, 1998). It does not always lead to positive learning outcomes. The task of finding relations or stating and testing a hypothesis appears to be difficult for learners because they have no idea what the hypothesis should look like, are unable to analyse or interpret data, do not use all possibilities of the simulation environment, or are led by considerations leading in the wrong direction. Therefore, both De Jong and Van Joolingen (1998) plea for a guided discovery approach in order to overcome the problems mentioned. In his review of three decades of literature on discovery learning. Mayer (2004) also states that guided discovery learning usually worked while pure discovery learning did not (Mayer, 2004). Veermans (2003) did research with support for learners using metacognitive measures inside the simulation software. It appeared that various versions of intelligent support with more or less formal heuristic support did not lead to

96
changes of the post-test (the same as the pre-test) though this could be expected on metacognitive-theoretical grounds (Veermans, 2003). Van der Meij and De Jong (2006) used independently dynamically linked representations as a kind of support in simulation based discovery learning. The reported data showed low learning gains (Van der Meij & De Jong, 2006). We conclude from the research results that the theoretical learning approach and the derived kinds of learner support underlying the courseware of simulation based scientific discovery learning were not effective. Moreover, congruence between courseware design and the instructional environment also requires attention. We propose a theoretical three-tier approach for effective courseware for simulation-based scientific discovery learning in order to take these points into account. This three-tier approach concerns a theory of functional instructional design, the Van Hiele's level theory, and the cognitive theory of MultiModal learning.
5.1.4 Theory of functional instructional design
A congruence between courseware design and the target instructional environment can be achieved by using an overall functional instructional design theory in which courseware can realize one or more instructional functions. “Instructional function” is a central concept in a functional instructional design theory. An instructional function (Terlouw et al., 2003) is defined as an essential, generally formulated activity that has to be performed in order to reach some specified instructional goal. Conditional and main instructional functions are distinguished. In the next two sections the focus is on two special measures that can realize some of these instructional functions: pre-testing and peer support. 5.1.4.1 Pre-testing: Activation of prior knowledge Pre-testing can realize conditional instructional functions such as “giving insight of intended final learning results”, “motivating”, and “connecting with the initial situation”, thereby activating prior knowledge. Prior knowledge has a marked effect on learning outcomes. In a survey, Dochy et al. reported the role of prior knowledge and the influence of the assessment method of prior knowledge (Dochy, Segers, & Buehl, 1999): There is a strong relation between prior knowledge and performance: 92% of the 183 reviewed studies report positive effects. Between 30 and 60% of the variance is explained by prior knowledge. The method of assessment of prior knowledge

97
strongly influences the outcomes of learning. Objective assessment methods are connected with positive outcomes. Not or less objective assessment methods such as familiarity ratings and self-estimations do not result in positive outcomes, but are useful to find explanations for effects of prior knowledge on performance. The general conclusion of Dochy’s review is that activating prior knowledge is indeed an effective aid for learning new knowledge. It is suggested that students’ reflection on their prior knowledge by assessment may have a facilitating effect on their learning. These conclusions give support for the idea of activation by assessment of prior knowledge as a didactical intervention at the beginning of a new cycle in the learning process. The effect of a pre-test is also known from test methodology as an unwanted side effect (Shadish et al., 2002). Two aspects reported are as follows: 1. The testing-effect occurs when the pre-test is also used as a post-test and hence
is taken for the second time. It is considered as a threat to the internal validity of the experiment.
2. The interaction effect between the pre-test and the treatment (Lana, 1959, 1960, 1969).
Lana and King (Lana & King, 1960) analysed the nature of this pre-test sensitisation and pointed at similar learning factors as the before mentioned Dochy et al. (Dochy, Segers, & Buehl, 1999). Strangman et al. (2004) report several other strategies in order to activate prior knowledge, including reflection and recording, interactive discussion, explanatory answering, computer-assisted activation, and concept mapping (Strangman et al., 2004). Most of these strategies require a great deal of teacher time. In the perspective of the reduced presence and availability of the teacher that impels the search for effective and efficient instructional means, and taking into account the findings of Dochy et al., it seems promising to activate prior knowledge by pre-testing (Dochy, Segers, & Buehl, 1999). Deployment of ICT can minimize teacher overload. 5.1.4.2 Peers giving just-in-time human support As explained in section 1.1, teachers are increasingly unavailable. However, in learning situations in which abstraction processes take place human support is indispensable; just-in-time support is even critical (Berry & Broadbent, 1984; T. De Jong & van Joolingen, 1998). Peer support could be a solution for this capacity problem since it can realize main instructional functions such as giving feedback during practice, promoting reflection, and reducing cognitive load (see section 1.6).

98
A survey concerning a large number of studies on cooperative small group learning, reported that this form of learning leads to better performance, longer retention, less time consumed, and a more positive attitude compared to individual or classroom learning. A meta analysis of 21 studies on college science education reports a performance effect size of d=0.42 and an attitude effect size of d=0.82 (Springer, Stanne, & Donovan, 1999). The highest effect size (d=0.72) was found with solving typical non-linguistic science problems in a cooperative group setting (Qin, Johnson, & Johnson, 1995). Peer support is a special form of cooperative learning, so positive effects on learning may be expected. The use of support from a peer student also finds a theoretical grounding in Vygotsky’s Sociocultural Theory (Arievitch & Haenen, 2005). In Vygotsky's concept of zone of proximal development, more capable peers provide scaffolding. This helps learners to perform tasks they would otherwise not be able to perform (Vygotsky, 1978). Another theoretical foundation for the use of peer support comes from MMT (Moreno & Mayer, 2007). This theory will be used also for interface design and be explained further in section 1.6. Dynamic graphs are usually presented in a simulation environment. These impose a heavy cognitive load on the visual channel of the working memory. If a peer gives relevant information simultaneously, two input channels instead of one can work partially independent at full capacity in the processing of verbal and pictorial material. The learners profit from the peers in collaborative settings because they experience lower levels of cognitive load (Mayer, 2005b). Not only may the tutees benefit from support. Peer support has an effect on both tutor and tutee. The learning effect on the tutor is found to be the strongest, especially on tutors with high prior knowledge (O'Donnell & Dansereau, 2000). This may be considered as a bonus, since the present study mainly focuses on the (weaker) effect of peer interaction on the tutee
5.1.5 The Van Hiele level theory as a possible framework for design on the meso level
As can be found in section 1.3, the deployment of a simulation environment with a well designed interface, allowing hands-on activities in a scientific context, does not guarantee meaningful learning. There must be some implicit or explicit smart guidance for the learner, but with enough freedom to become cognitively active (Mayer, 2004).

99
In this section the level theory of Van Hiele (1986) will be introduced as a framework for the construction and sequencing of the different modules in the simulation software. The content matter in this study concerns the concept of reaction speed in the domain of Physical Chemistry. This central concept in Chemical reaction kinetics can be described in a formal model that has to be acquired by a process of abstraction. In the educational design, measures are taken that gradually lead to abstraction and modelling. According to Van Hiele’s level theory of learning, the essence of optimal learning of abstract concepts is the cyclical breakthrough to higher abstraction levels (Van Hiele, 1986). The most distinctive property of these various levels of thinking is their discontinuity. There is no simple coherence between the schemata in the various levels. The activities on a higher level are characterised by a different language with new concepts or the use of old concepts with a different meaning and/or contextual linkage. Reflection on a lower level is a characteristic and important activity after the breakthrough to the next level. Once a higher level is attained, it is easy to use concepts on a lower level. Offering education on an abstraction level (far) above the actual abstraction level of a learner is not a fruitful activity. Superficial, non-connected, and volatile knowledge with low near transfer and no far transfer is acquired rather than insight and comprehension. Using the Popper terminology (Popper & Eccles, 1981), Van Hiele speaks of World 1, the world of the visible structures and phenomena. By means of individual mind abstraction, World 2, the individual knowledge, is built. World 3 is the common human knowledge entered and maintained by communication. Each abstraction level of thinking and argumentation has its own language and arguments that are only valid at that level. The level descriptions of the theoretical framework of Van Hiele for the learning of abstract concepts are used in order to describe the design principle for the simulation in more detail: On the lowest level, the Van Hiele-level 0, also known as the Gestalt level, only observations in World 1 are made. Since Van Hiele deals with geometry, in which the visual aspect is very important, he calls the zero level the visual level. Language is inadequate in transferring visual structures from one person to another. At the zero level, Van Hiele states that it is much better if a part of the real structure (the Gestalt in World 1) can take over the task of the language: As the saying goes, “a picture is worth a 1000 words”. On level 1, the descriptive analytical/schema level, learner statements on properties that are not visual but can be made visual or be schematised, characterize the activities.

100
On level 2, the informal deductive level, mental operations and abstract symbols and definitions characterize the activities. Concepts on this level are typically non-visual or relate to non-visual matters. On level 3, the theoretical deductive level, structures on the second level that are studied in a formal way characterize the activities. For most students the transition from one level to the next is not easy. Therefore, the teacher and the educational material have to stimulate learner activity. In this study the main focus is on Van Hiele-level 2.
5.1.6 Interface design of the simulation environment using the cognitive theory of MultiModal Learning (“MMT”)
At a basic level the design of the interface needs attention. In simulation literature, the strongest empirical evidence is connected with questions about interface design (Rieber, 2005). The cognitive theory of learning from interactive multimodal environments (MMT) of Moreno & Mayer (2007) provides practical guidelines for building this type of interactive courseware. In this section a brief review of these principles will be explained. The section on Material and Methods will show what principles from MMT are explicitly used in interface design (Moreno & Mayer, 2007). Computer assisted learning is promoted using pictures (illustrations, graphs, animations, photos, video) aligned with words (written or spoken) in multimedia instruction. Cognitive research provides support for three assumptions that can be used specifically for the design of suitable learning material: a. Humans possess separate systems for processing pictorial and verbal material
(dual-channel assumption). It may explain why learners perform better on both retention and transfer tests, where words and pictures offer learning material. Learning is considered to be information processing in this framework. From a vast amount of incoming data, relevant information has to be selected and associated to existing knowledge. Two input channels instead of one can work partially independent of each other, at full capacity in the processing of verbal and pictorial material (Mayer, 2005c).
b. Each of the dual channels is limited in the amount of material that can be processed at one time (limited-capacity assumption). In human working memory a handful of chunks (or cognitive elements) can be present for a few seconds. The mental activity caused by retrieving stored information, combined with selected incoming data which is then stored in long term memory is called cognitive load. A part of the cognitive load is not necessary

101
for the learning process. It is called extraneous load, typically resulting from badly designed instruction. Reduction of extraneous load in learning material is relatively easy by weeding (removal of interesting but non-essential material) and avoiding redundancy. Information is called redundant if it is presented in several ways. Redundant information imposes an extraneous cognitive load that interferes with learning (Sweller, 2005b).
c. Meaningful learning involves cognitive processing including building connections between pictorial and verbal representations (active-processing assumption) (Mayer & Moreno, 2003). It could be a metaphor for the necessary conscious, effortful activity on the part of the learner resulting in long-term learning (Muller, Sharma, & Reimann, 2008).
In summary: the instructional functions to be realized for the learning of the scientific concepts are fostered by applying pre-test sensitising and peer support as promising instructional measures. Because the deployment of simulation software is not always a guarantee for successful learning—especially during an abstraction process as in this case—implicit guidance is built in. Van Hiele’s level theory is used to implicitly guide the abstraction process. Finally, simulation software is built using guidelines for the interface from a theory on multimodal learning. The three-level theoretical approach for the framework of design and use of simulation software is shown in Table 1. Table 1 Three-tier theoretical foundation for building and deployment of simulation based
courseware Level Theory Object of design Focus macro level theory of functional
Instructional design framework of instructional functions
orchestration of essential instructional activities
meso level
Van Hiele's level theory
schema acquisition design
coherent schema building
micro level cognitive theory of MultiModal Learning
multimodal interface design limited IO capacity
5.1.7 The research questions
1. What is the learning gain of guided discovery learning in a three-tier designed simulation-based learning environment on a near time scale (i.e. one hour)?
2. What are the contributions of pre-testing and/or peer support to the learning gain on a near time scale?
3. What is the learning gain on a distal time scale (i.e. after 2 months)?
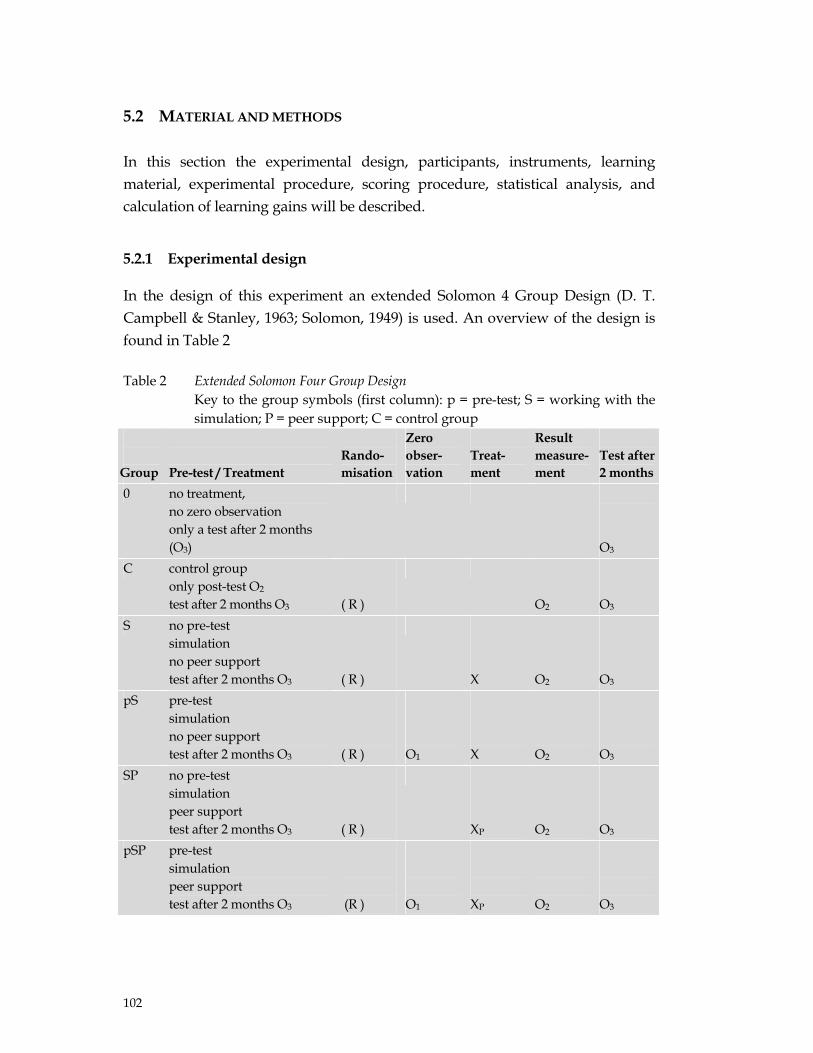
102
5.2 MATERIAL AND METHODS
In this section the experimental design, participants, instruments, learning material, experimental procedure, scoring procedure, statistical analysis, and calculation of learning gains will be described.
5.2.1 Experimental design
In the design of this experiment an extended Solomon 4 Group Design (D. T. Campbell & Stanley, 1963; Solomon, 1949) is used. An overview of the design is found in Table 2 Table 2 Extended Solomon Four Group Design Key to the group symbols (first column): p = pre-test; S = working with the
simulation; P = peer support; C = control group Group
Pre-test / Treatment
Rando-misation
Zero obser-vation
Treat-ment
Result measure-ment
Test after 2 months
0 no treatment, no zero observation only a test after 2 months (O3)
O3
C control group only post-test O2 test after 2 months O3
( R )
O2
O3
S no pre-test simulation no peer support test after 2 months O3
( R )
X
O2
O3
pS pre-test simulation no peer support test after 2 months O3
( R )
O1
X
O2
O3
SP no pre-test simulation peer support test after 2 months O3
( R )
XP
O2
O3
pSP pre-test simulation peer support test after 2 months O3
(R )
O1
XP
O2
O3

103
5.2.2 Participants
The upper level stage of pre-university education lasts 3 years. From the population of 169 students from the upper level of a pre-university school, 69 students were selected from the second year. These students took chemistry, physics, and mathematics and took the course for the first time. Two groups of 16 students were selected by means of a computerised randomisation procedure. A control group of 8 students was selected randomly (group C). During the experiment one student was absent. His data were eliminated from the total dataset. Some characteristics of the groups are given In Table 3. Table 3 Characteristics of the control group and experimental groups control group
( C ) groups without peer support ( S )
groups with peer support ( ‘SP’ )
Chemistry marks ± sd 7.05 ± 0.74 7.05 ± 0.80 7.14 ± 0.80 age ± sd (year) 16.3 ± 0.24 16.5 ± 0.26 16.4 ± 0.23 % male 50 44 40 N 8 16 15 ANOVA of the 6 subgroups showed equivalence of the groups with respect to age (p = 0.312) and average Chemistry marks (p = 0.960). A Pearson X2 test demonstrated the equivalence concerning gender (p = 0.28). A group of 16 peer tutors was chosen randomly from comparable students from the next higher year. On the average this group of peer tutors was one year older.
5.2.3 Instruments
The pre-test comprised nine open questions and problems. Two questions were meant to connect to prior knowledge (Strangman et al., 2004): the global influence of temperature, the reaction velocity, and factors that could decrease the reaction time. A third question was asked for practical matters (how to gauge reaction velocity). A fourth question could be answered using an analogy from the velocity concept in physics. The pre-test had a double function: assessing prior knowledge and by that activating prior knowledge. The assessment of prior knowledge made it possible to calculate the learning gain of the simulation.
104
The post-test consisted of seven questions and was different but comparable to the pre-test. In both tests screenshots with diagrams from the computer simulation were used.
5.2.4 The learning material in the treatment
The simulation was built with SimQuest, an authoring system meant to design, build, and use learning environments based on computer simulations (Van Joolingen & de Jong, 2003). The SimQuest authoring system is a fine educational research instrument. It has logging features that makes it possible to monitor learners, while they are working in the learning environment. It has been used also to study the behaviour of the authors themselves, while they design learning environments (Pieters, Limbach, & De Jong, 2004). The conceptual model of the speed of a chemical reaction was modelised in a quantitative, dynamic, and structured computer simulation. As described in the previous section, a learning process involving abstract concepts and relations is necessary to get familiar with the subject of reaction kinetics. The educational design of the courseware using the levels of abstraction from the Van Hiele theory (1986) is described in the previous section. The learning activities were elaborated in more detail as follows: The simulation started on the visual level. Observations could be made of a digitally manipulated photograph of a lab beaker filled with a red fluid. By clicking on a button a digital clock started running and gradually the liquid colour changed into blue. From a textual introduction it was made clear that the psycho-synthetical dye Roman Red (RR) was being converted into Byzantine Blue (BB) according to the reaction equation RR → BB. Without the need of intricate reflections or calculations from the students in this experiment it was intuitively clear that a chemical reaction was occurring. In the terminology of Van Hiele a strong structure could be observed, meaning that there was a high predictability. In the very beginning of the learning process the robustness was an advantage. The student activity was limited to simple observation and connection to former experience with chemical reactions. A student confronted with the first operational screen (see Figure 1) automatically would start clicking and sees things happen. The process could be restarted over and over again at will. As a result visual characteristics of the reaction process became familiar to the student.

105
Figure 1 The first operational screen of the learning environment with structures for
activities on the visual level In order to leave this level of pure perceptive actions and to break through to the next level of abstraction, the analytical/schema level, the students were asked to perform simple measurements. The students were prompted to change the temperature and make the influence of the temperature on the course of the reaction explicit. After completing this and before going to the next step, the conclusion was displayed in the common language of this level: “increasing the temperature increases the reaction rate”, a phenomenon that could be observed or verified by the students without complex discussions. The main purpose of the activities in this stage of guided orientation was an initial informal introduction to concepts and main relations. In order to make more precise measurements possible and give an experimental base for the concept of reaction time that would be introduced later on, the binary optical sensor was put into the spotlight. It was a small sign that most students had not yet noticed, and disappeared after 90% of the Roman Red was converted. With the aid of this sensor the effect of the catalyst was measured. This stage was already more abstract, but still coupled with the directly perceptible. The difference with the former pure visual level was the possibility of mental actions. To enhance the abstract character, a drawing of a beaker next to the photo of the lab beaker was also given. In the drawing a bright red coloured rectangle gradually turned bright blue.

106
Figure 2 The student was asked to deduce the relation between [RR] and [BB] from
the diagram(s). This required activities on the deductive/theoretical level To get to the next level, the informal deductive/theoretical level, a concentration/ time diagram together with a model of the beaker was shown on the screen. In the diagram the gradual decrease of Roman Red concentration was made clear. The student was asked to estimate the time needed to convert 90% of the dye. The concept of reaction time was introduced not by definition but concurrent with student activity. When the original visual structure was disappearing in the background and mental operations were executed, passing to a higher level was stimulated. The concentration/time diagram now could take the function of a new visual structure in a new learning stage. On this level, reflection on the lower levels was possible, but both new and old words were used with different meanings. The crux was the simultaneous display of a structure that the learner had become familiar with together with a new coupled structure. With this new structure operations had to be executed and the learning stage started again. The mass balance, reaction velocity and the characteristic of a first order reaction were introduced in this way. Some procedural and declarative knowledge was necessary for these activities: the concepts catalyst, congruence, similarity, direct proportionality, tangent line,
107
and first derivative. Next to this the students had to be able to convert a graphical representation of a straight line into an algebraic expression, including calculating the value of the slope of a straight line. The simulation environment offered the student 12 discrete assignments. There was a clear, logical sequence, but it was possible to change the order, for example, by going back to a former assignment. All answers to questions and all user interface events such as mouse clicks were recorded digitally in order to facilitate further analysis of the student/system interaction. At the end of each assignment an overview of essential content matter was displayed. The following guidelines of the theory by Mayer et al. (2005a) were implemented in the simulation environment: Application of the multimedia principle: on every screen both text and
dynamic pictorial material (graphs and animated pictures) was present. Avoiding split attention: all relevant information was on screen. Segmenting: the content matter was divided in 12 bite-size modules. Pacing: the learners had full control over the pace of the screens, so they had
enough time for deep processing. It was possible to go back to previous modules at will.
Weeding: interesting but irrelevant textual and graphical material was removed. Signalling: essential items were pointed at with arrows, highlighted, coloured,
or encircled. Spatial/temporal contiguity: printed text was placed near corresponding
graphics simultaneously. Redundancy: no multiple sources of the same information were given. Guided activity: by prompting, learners were encouraged to engage in
selection, organization, and integration of the new information. (See also the paragraph on the Van Hiele level theory).
Explanatory feedback: the learners were provided with proper on line schemas to repair misconceptions.
5.2.5 Procedure
The experiment was performed at the very start of the new school year. The peer tutors from the next higher class received thorough training. The training consisted of (1) receiving a few very short instructions ( <10 minutes), (2)

108
doing relevant exercises, (3) working through the simulation, (4) doing a test, (5) performing a peer assessment of this very test, and (6) working through the simulation again. It was easy to work through the simulation, since there was a high grade of intuitivity in interface design. It could be assumed that the active domain knowledge of the students in the experimental groups was limited to a non-quantitative notion that the reaction rate can be increased by a temperature rise or by using a catalyst. The concept of speed in physics was known. For the students in the experimental group the simulation environment was new. A peer tutor was coupled with each student in the experimental group for peer support. At the start a pre-test was given to half of the experimental group that was chosen randomly. This group was called the pSP-group (see Table 2). All students completed the pre-test within 20 minutes. The other half of the students, the SP-group, spent the 20 minutes reading a comic strip (Asterix). After taking the pre-test or reading the comic strip all these students were asked to work through the simulation. The tutor instruction was simple: "help your tutee in every possible way". The average time needed for the simulation for all participants was 42.94 ± 9.11 minutes (range 29.58 - 61.78 min.). The fastest students outperformed the slowest by a factor 2. Immediately after the experiments the students of this group were isolated in a separate classroom in order to take the post-test under official school exam conditions. For the post-test 30 minutes were available. All students completed the test within this time. The group of students that did the experiment without peer support were treated the same way. The control group, students that did not work with the simulation were given the post-test in a third classroom, without pre-test (group C). After exactly two months all students took part in an official school Chemistry examination. The content matter comprised chemical reaction kinetics and equilibrium theory. The first part of the exam was related to the subject of this study. Concentration/time diagrams of the reaction 2P → Q were given and the student was asked to deduce the stoeichiometry of this reaction. In a second diagram the speed/time diagram of the same process was shown and the student was asked how the second diagram could be derived from the first. In the third question on the subject the student was asked to show in a simple way that the process involved was of the second order (i.e. the rate is directly proportional to the square of the concentration).

109
5.2.6 Scoring procedure
The pre- and post-tests were atomised to the level of meaningful items. The tests were scored dichotomously by two external independent teachers. If there was a different score for a particular item, the average of the two scores was taken.
5.2.7 Statistical analysis
An analysis of variance and a multiple comparison according to Bonferroni (significance level 5%) had been executed with SPSS. A two-way ANOVA was performed with the VISTA 6 statistical package. PS version 2.1.31 (Dupont & Plummer, 1998) was used for the power calculations. A test-item analysis was done with the TIAPLUS program version 2.1.
5.2.8 Calculating learning gains
Learning gain exponents (B) were calculated from pre- and post-test data. In Table 4 (next page) a nominal scale for B-values is given (Bos et al., 2007c). Table 4 Nominal scale for the learning gain exponent B Exponent Gain characterisation B ≤ 0.40 “Low” 0.40 < B < 0.60 “Average” B ≥ 0.60 “High” In order to calculate gain for groups that did not make the pre-test, averages from comparable groups were used. This method using group averages may (1) yield lower B values than when individual student scores are used, and (2) reveal no information on the B parameter error (Bos et al., 2007c). The gain according to Hake was also calculated (Hake, 1998a, 1998b). Effect size categories according to Cohen were calculated (Cohen, 1988). Cohen suggested that as a very rough rule of thumb d = 0.2, 0.5, and 0.8, and imply respectively “small,” “medium,” and “large” effects. Effect sizes of more than 2 standard deviations calculated with Cohen’s method are considered to be extreme.

110
5.2.9 Time scale classification
In this research time intervals are classified after inspiration by Hickey et al. (Hickey, Zuiker, Taasoobshirazi, Schafer, & Michael, 2006). The classification is shown in Fig.3.
Figure 3 Classification of time intervals. The main experiment and observations are done on a near time scale. Another observation is done after two months.
5.2.10 Power calculations
PS version 2.1.31 (Dupont & Plummer, 1998) was used for the power calculations. Post hoc power calculations for the knowledge growth exponent B with α = 0.05, a power of 0.80 and an educationally significant increase of the 50% of this exponent gave a minimal sample size of 7 students per cell. In all cases the cell size is equal or above this number.
5.3 RESULTS
5.3.1 Research questions 1 and 2
1. What is the learning gain of guided discovery learning in a three-tier designed simulation- based learning environment on a near time scale (i.e. one hour)?
2. What are the contributions of pre-testing and/or peer support to the learning gain on a near time scale?
In Table 5a and 5b the average scores for pre and post-tests are given. Table 5a and 5b Primary pre- and post-test results (A) pre test group score ± sd in % N pS 4.63 ± 1.60 17.1 8 pSP 3.71 ± 2.04 13.8 7

111
(B) post-test group score ± sd in % N C 8.02 ± 3.55 29.7 8 S 11.80 ± 2.04 43.7 8 pS 15.09 ± 4.96 55.9 8 SP 14.33 ± 3.75 53.1 8 pSP 18.79 ± 2.69 69.6 7 The pre-test scores of the pS and the pSP groups did not differ significantly: F(1,13) =0.940 (p=0.35). Cronbach’s alpha for the pre-test was 0.946. Cronbach’s alpha for the post-test was 0.743. The correlation coefficient between the scores of the two judges for both tests was 0.98. In Table 6 the learning exponent B, the average normalized gain, as well as effect sizes by Cohen are given. Table 6 Learning exponent B, the average normalized gain <g>, and the effect size d group pS group pSP Learning gain exponent B (Bos et al., 2007) B ± Se 0.51 ± 0.10 0.76 ± 0.035 Average normalized gain <g> (Hake, 1998a,1998b) <g> 0.34 0.59 Effect size (Cohen, 1988) 2.8 6.3 The learning gain exponent (Bos et al., 2007c) of the group pS is to be characterized as average and for the group pSP as high (cf. Table 3). From the Hake gain the same conclusions can be drawn (Hake, 1998a, 1998b). The learning gain exponent B of group pSP is significantly higher than that of the PS group (p=0.040). The effect size of the pSP group may be called extreme compared to the classic, non interactive interventions (Anderson, Corbett, Koedinger, & Pelletier, 1995). The learning gain exponents calculated by using group averages are displayed in Table 7. Table 7 The learning gain exponents calculated by using group averages Group Exponent B C 0 S 0.318 pS 0.521 SP 0.479 pSP 0.701
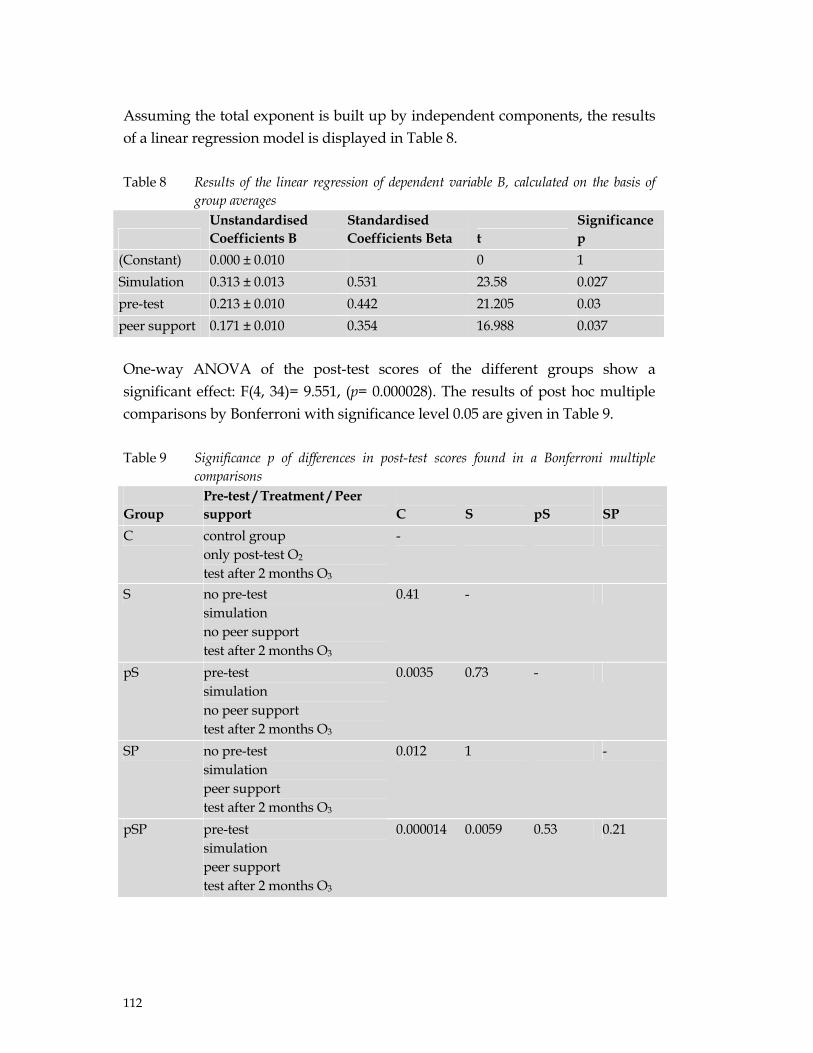
112
Assuming the total exponent is built up by independent components, the results of a linear regression model is displayed in Table 8. Table 8 Results of the linear regression of dependent variable B, calculated on the basis of
group averages
Unstandardised Coefficients B
Standardised Coefficients Beta t
Significance p
(Constant) 0.000 ± 0.010 0 1 Simulation 0.313 ± 0.013 0.531 23.58 0.027 pre-test 0.213 ± 0.010 0.442 21.205 0.03 peer support 0.171 ± 0.010 0.354 16.988 0.037 One-way ANOVA of the post-test scores of the different groups show a significant effect: F(4, 34)= 9.551, (p= 0.000028). The results of post hoc multiple comparisons by Bonferroni with significance level 0.05 are given in Table 9. Table 9 Significance p of differences in post-test scores found in a Bonferroni multiple
comparisons Group
Pre-test / Treatment / Peer support
C
S
pS
SP
C control group only post-test O2 test after 2 months O3
-
S no pre-test simulation no peer support test after 2 months O3
0.41 -
pS pre-test simulation no peer support test after 2 months O3
0.0035 0.73 -
SP no pre-test simulation peer support test after 2 months O3
0.012 1 -
pSP pre-test simulation peer support test after 2 months O3
0.000014 0.0059 0.53 0.21

113
A two-way ANOVA of post-test data is shown in Table 10. The groups that took a pre-test scored significantly higher than the groups that did not. This effect is enhanced when peer support is also present. Table 10 Two-way ANOVA of post-test data Source SS Df MS F-ratio p
Peer Support 73.91 1 73.91 5.98 0.0201
Pre-test 115.06 1 115.06 9.31 0.0049
All Sources 188.97 2 94.49 7.65 0.0022
Error 345.99 28 12.36
Total 534.96 30
5.3.2 Research question 3
What is the learning gain after 2 months (a distal effect)? In Table 11 the learning results after two months were measured by the relevant part of the official school examination in Chemistry. Table 11 Results of the relevant part of the official school examination after 2 months group score ± sd in % n 0 5.34 ± 2.75 41.1 45 C 5.94 ± 2.52 45.7 8 S 6.41 ± 2.84 49.3 8 pS 8.32 ± 3.14 64.0 7 SP 4.16 ± 2.94 32.0 8 pSP 6.79 ± 3.71 52.2 7 Cronbach’s alpha for the relevant part of the test was 0.44. There was no significant difference between the scores of the control group in the experiment (group C) and the students that did not take part in the experiment at all F(1,51) = 0.329 (p=0.57). This leads to the conclusion that taking a pre-test without any following immediate treatment appears to have no effect. An ANOVA of the school examination results of all groups does not show a significant difference F(5,77) = 2.069 (p=0.078).

114
Table 12 Significance (p) of differences in test scores after 2 months found in Bonferroni multiple comparisons
Groups 0 S+SP 0 not involved in the experiment - S+SP did no pre-test 1 - pS+pSP made a pre-test 0.048 0.113 After aggregating the students into a group that took a pre-test, a group that did not take a pre-test, and into a group that did not participate in the experiment at all, a significant difference is found (see Table 12). This difference is found between students in the experiment that took a pre-test and students that were not involved in the experiment at all (p=0.048). The difference is not significant when students in the experiment did not take the pre-test (see Table 12).
5. 4 CONCLUSIONS
5.4.1 What is the learning gain of guided discovery learning in a three-tier designed simulation-based learning environment on a near time scale (i.e. one hour)?
A low learning gain is found using the learning environment without pre-testing and without peer support.
5.4.2 What are the contributions of pre-testing and/or peer support to the learning gain on a near time scale?
Compared to the control group, post-test scores are significantly higher when a pre-test is taken, in groups with peer support as well as in groups without peer support.
An “average” gain is found using the learning environment in combination with pre-testing or in combination with peer support.
A high learning gain is found using the learning environment in combination with both pre-testing and peer support.
The pre-testing has a significantly higher effect than peer support.

115
5.4.3 What is the learning gain on a distal time scale (i.e. after 2 months)?
After two months there is still a significant difference in scores between students outside the experiment and students in the experimental groups that took a pre-test. This difference is not present when students in the experiment did not take the pre-test.
5.5 DISCUSSION
As shown by the results, the highest learning gain (B=0.76) is realized if a pre-test is made immediately before the treatment and peer support is present. The joint influence of activities with the simulation and take a pre-test is still measurable after two months, though the groups with and without peer support have to be joined to make the effect statistically significant. Although the power calculations indicate that cell sizes were sufficiently high, the latter finding accentuates the Achilles heel of this kind of research: small numbers of participants. An alternative explanation for the pre-test effect could be that students who take the pre-test spend a little extra time (for taking the test). In order to investigate the influence of time on task, a regression analysis of the variable total time spent on the simulation and the dependent variable post-test score was performed. The fixed factors chosen were taking a pre-test or not, and the presence of peer support or not. The factor pre-test or not was significant (p= 0.00916). The factor peer support or not was also significant (p=0.0457). The independent variable TIME was not significant F(1,26)= 0.002344. (p=0.962). An alternative hypothesis that time-on-task is a significant variable was not supported by these findings. Quite different theoretical perspectives have been used in the framework. On the highest level the systematic fulfilment of the instructional functions (Terlouw, 1993) is dealt with. In this study emphasis is on two distinct design principles, namely the application of (1) pre-test sensitisation and (2) peer support. The extra learning gain connected with pre-testing found in this study can be explained by the activation of prior knowledge as a result of asking questions in advance, concurrent with the review of Strangman (2004). An existing schema of a conceptual model is activated, that can be the anchorage for accretion of new knowledge and know-how. More comprehension of the abstract concepts and relations can be generated in the learning process afterwards.

116
One of the underlying principles accounting for the extra learning gain due to peer support can be found in the decrease of cognitive load as described by Mayer’s multimedia theory (2005a). The peer tutor points at dynamic pictures at the screen while explaining at the same time. In this way the learner receives visual and auditory information simultaneously. A noteworthy start for further research is the shift in character of the peer support in the course of the assignments. The support shifts from a purely technical support (where to click, where to look on the screen, where to respond etc.) to more abstract support (reflecting on meaning of observations and relating them to concepts). The second type of peer support especially draws the attention to the social aspect of the learning, viz. the peer tutor acting in the zone of proximal development (Vygotsky, 1978). As this zone is dynamically created in the interaction between the learner and the peer tutor in this particular simulation environment, the peer tutor can adapt very precisely and just-in-time to the specific needs of the learner. Furthermore, it appeared to be practical to apply the Van Hiele Level theory to a field different than mathematics learning. In this study the content matter was in the field of Physical Chemistry. Students experience the content matter in this field as abstract and difficult (Nicoll & Francisco, 2001). Apparently an effective educational design starts at a concrete level. Following Van Hiele, at this level concepts are intuitively clear (the Van Hiele level 0). In the learning process the levels are shifted with relative ease by doing guided activities. The transfer to another level is a critical moment, at which the objects on the preceding level have to be understood and made familiar with in order to operate on the next, more abstract level. The elegance of working with simulations is the advantage that the parameters (in this case the activation energy and the influence of the catalyst on this energy, reaction constant, and concentrations) can be chosen on educational grounds. For practical reasons the reaction must have a proper speed, neither too fast nor too slow. The catalyst chosen in the simulation is not very efficient. It accelerates the reaction only by a factor of 3. A real catalyst in the chemical laboratory might accelerate the reaction a thousand times, but in that case it is difficult for students to do precise measurements. The experiment can be repeated at will, and does not produce environmental pollution. Virtual chemicals are not hazardous. But these advantages of the use of a simulation must not be regarded as a plea for the

117
complete substitution of the real laboratory practice. Working with real chemicals and chemical equipment is a non-replaceable starting point. A student recognizes the simulation of a chemical reaction only if he has some real experimental experience. He has to have seen, smelled, or felt real chemicals to do activities at the first Van Hiele level.

118

119
CHAPTER 6 A tool for measuring effectiveness of instructional treatments7 ABSTRACT
In three different experiments a strong power law relationship yi = xi1-B was found between the pre-test values xi and post-test values yi of individual students, as well as the corresponding relationship <y> = <x>1-B between average group pre-test <x> and average group post-test <y> values. The exponent B in this law is a pre-test-corrected learning gain, since its correlation with pre-test scores is relatively small. A nominal scale for calculated B-values is suggested. The best method for assessing B is a combination of a plot for visual checking of test data followed by a numerical non-linear least squares fit for estimating parameter B and its error. The use of group averages appears to give systematically low B values. It is shown that if pre- and post-test scores are relatively precise, then comparing learning gain exponents has a much higher statistical power than the use of effect sizes representing the post-tests of control and test groups. Even with a relatively small number of participants, the exponent B yields an accurate gauge of treatment effectiveness.
6.1.1 Introduction
The use of a pre/post-test quasi experimental design in educational experiments has many advantages, especially when both pre- and post-test scores are used to estimate learning gains. A case example from an unpublished experiment of one of the authors showed the following data: a group of 45 students was randomly divided into two groups. All of these students completed a pre-test. The control group (n=22) had an average pre-test score of 43.8 ± 22.8 (on a 0-100 scale), and
7 submitted

120
the experimental group (n=23) had an average pre-test score of 42.3 ± 19.8. The difference between the two averages was not statistically significant as could be seen at first glance (effect size d = .07) and from an F-test, F(1,43)=0.054 (p=0.817). The control group was submitted to some intervention (“ X- ”) and the experimental group to a variant of this intervention (“ X+”). The average post-test score of the control group was 69.8 ± 16.6. The experimental group scored 76.7 ± 14.6. It is now more obvious (d = .44) that there are differences, but still the F-test suggested that was not statistically significant F (1,43)=2.105 (p=0.154). Normally, this would have been the end of this experiment, since this kind of result (non-significance) is less likely to be published, a phenomenon known as publication bias (Dear & Begg, 1992). In this case, unfortunately, a type II error (a false negative conclusion) occurred. The method using learning gain exponents, to be presented in this paper, would have shown another outcome. The results of both interventions would be classified as “high”. The learning gain of the control group was 0.612 ± 0.015, and the learning gain of the experimental group was 0.710 ± 0.021. In contrast with the finding in the previous paragraph, a t-test would indicate that the difference between these two learning gains was both practically and statistically significant (p= 0.000404). The reasons for occurrence of this type II error are: 1. Precious information is lost: The performance of the individual participants is
lost via the averaging process. From group averages it is no longer possible to distinguish the differential behaviour of the participants. If a valid formal model is available, much more information from the same data source can be extracted. Frequently linear models are implicitly assumed, whereas often other (e.g. non-linear) relationships may be more appropriate (Hays, 1988).
2. Pre-test scores are not used appropriately: In the case example above, the inference leading to a potentially wrong conclusion was essentially based on post-test data. The pre-test data served only to check for pre-experimental equivalence of the groups. If there is a valid formal relationship between pre- and post-test results, pre-and post-test results of individual participants could be used to describe the learning process.
3. The number of participants is too limited: In many quantitative experiments only post-test results are used to measure an effect. Large numbers of participants

121
are required, especially when heterogeneous groups are involved. Often this is a problem in ecological conditions. About one third of the quantitative educational experiments have 50 or less participants, and 1/5 of the experiments have 30 or fewer participants. These data can be estimated from the Hattie’s database, a synthesis of 800 reviews involving 50,000 effect sizes (Hattie, 2008; Hattie & Timperley, 2007). These fractions of 1/3 and 1/5 may be substantially higher if published and unpublished experiments are taken together, taking into account that publication of results is less likely (“publication bias”) when the number of participants is low (although Hattie included many doctoral dissertations in his review also).
A power calculation for a two-sided independent t-test with two groups of 25 participants, with a type I error α set at = 0.05, a difference in population means δ =0.5 and the within group standard deviation σ=1 gives a statistical power of 0.405, far below the usual acceptable limit of 0.80 (Dupont & Plummer, 1998). The relevance of the method proposed in this paper for educational researchers is that: a. a precise and accurate estimation of learning gain is given, b. smaller numbers of participants are needed, c. gain and not differences in post-test results are revealed, d. information on the validity of the model is available.
6.1.2 Problems with pre-testing
An experimenter is confronted with major practical and methodological problems if the difference of student performance before and after the intervention is to be gauged. For decades an effect of assessment before the main intervention is known under the name pre-test sensitization (Willson & Putnam, 1982) as an unwanted side effect (Shadish et al., 2002). Two aspects are reported: 1. An undesired effect when the pre-test is used as a post-test and hence is
taken for the second time. It is considered a threat to the internal validity of the experiment.
2. The interaction between the pre-test and the treatment (Lana, 1959, 1960, 1969). The first effect can be eliminated by using two equivalent instruments for pre- and post-test. They can be calibrated in separate, auxiliary experiments.

122
To check for the second effect, more sophisticated designs can be useful. The Solomon Four Group Design (S4GD) (Van Engelenburg, 1999; Solomon, 1949) provides an excellent example. It involves a first set of two groups. Each is formed by a randomization procedure. The first set consists of a control and a test group that is each given a pre-test, the treatment, and the post-test. The second set consists of a control and a test group that is each given the treatment, and the post-test, but no pre-test. The S4GD has two advantages: (1) The pre-test given to the first set gives an indication of the degree of equivalence of the control and test groups after the randomization. If there is a statistical significant difference between the average pre-test scores of the two pre-test groups the whole experiment may be flawed. (2) Because the first set of control and test groups is given a pre-test and the other set is not given a pre-test, the S4GD design makes the potential pre-test sensitization (Willson & Putnam, 1982) visible if it exists. A practical disadvantage of the S4GD is the threat of a type II error because the participants have to be assigned to four groups and group sizes become small. Provided enough participants are available and enough care is taken to make valid instruments some major problems have been solved, but another major obstacle remains: how to relate pre- to post-test scores? Many arguments regarding measuring change were discussed in the 1960-70’s (Bereiter, 1963). Cronbach & Furby in their famous article “How we should measure ‘change,’ - or should we?” pointed to the unsuitability of gain scores, since they tend to have lower reliability than the original measures themselves (Cronbach & Furby, 1970). Instead of this, for random experiments, Cronbach recommended an analysis of covariance with a pre-test as a covariate (Cronbach, 1992). In essence, this approach assumes linear relationships (Hays, 1988). In the case of linear relationships, statistical parameters can be approximated with relatively simple closed equations. Instead of gain, the outcome of the intervention is in many cases reported as an effect size based only upon the difference in post-test scores of the test and control groups. In the psychological literature various effect sizes are defined: e.g., “Δ” defined by Glass (Glass, 1976) [the same as the “effect size” used by Bloom (Bloom, 1984)], and “d” defined by Cohen (Cohen, 1988). Effect sizes generally express the difference between two groups with different treatment in terms of the number of standard deviations. For example Cohen’s d is defined as:

123
d = |ma – mb | / [ (sda2 + sdb2)/2]0.5 . . . . . . . . . . . . . (1) where ma and mb are population means and where the denominator is the root mean square of standard deviations for the A- and B-group means. It is or comes close to the “pooled standard deviation.” It should be stressed that effect size is not the same as gain. Gain is defined as a function of both post-test and pre-test scores. In contrast, it is not necessary to have pre-test results in order to calculate Cohen’s d. The effect may be determined using post-test scores of different treatment groups. Although in the Psychology/Education/Psychometric community pre/post testing is commonly dismissed as a valid gauge of intervention effectiveness [see e.g., (Suski & Banta, 2009)], pre/post testing is gradually gaining a foothold in such disciplines as physics education. In order to compare the effectiveness of different types of mechanics courses (Hake, 1998a, 1998b) analyzed the results of 62 courses in high schools, colleges, and universities. As a "rough measure" of average effectiveness of a course the average normalized gain <g> for a course was defined as the actual average gain (<y> – <x>) divided by the maximum possible average gain: (1 – <x>), i.e.
<g> = (<y> – <x>) / (1 - <x>) . . . . . . . . . . . . . . . . .(2) where the angle brackets <........> signify averages over entire courses, and scores are normalized so that 0 < <y> < 1 and 0 < <x> < 1. On the basis of this approach, "High-g" courses were categorized as those with <g> > 0.7 and "Low-g" courses as those with <g> < 0.3. The average normalized gain was used to demonstrate a nearly two-standard deviation superiority of courses using “interactive engagement” methods over those using “traditional” methods. Here interactive engagement methods were defined (Hake, 1998b) as “ those designed at least in part to promote conceptual understanding through interactive engagement of students in heads-on (always) and hands-on (usually) activities which yield immediate feedback through discussion with peers and/or instructors”. As discussed by Hake (Hake, 2002a, 2002c), it was later found that the normalized gain had earlier been used independently by Hovland et al. (Hovland, 1949), who called it the “effectiveness index” and Ghery (Ghery, 1972),
124
who called it the “gap closing parameter”. In recent physics educational research literature the term “normalized gain” is normally employed. Next to its simple form and its intuitive appeal, this class average normalized gain <g> is widely used because it compensates to some extent for the variable average pre-test scores in different courses. Thus it can be regarded as a pre-test-corrected learning gain. An indication that this compensation takes place follows from low correlations between average normalized gain <g> and average pre-test scores <x> (Hake, 1998a, 1998b). In this way it was possible to meaningfully compare the effectiveness of courses with a wide range of average pre-test scores ranging from 18% (a Dutch high school) to about 70% (Harvard). It should be indicated that Hake also discussed [see e.g., footnote #46 of (Hake, 1998b) and (Hake, 2002a, 2002b)] single-student normalized gain, that is, for the i-th student,
gi = (yi – xi) / (1 – xi) . . . . . . . . . . .. . . . . . . . . . . . . . (3) and the two ways of calculating an average normalized gain: (a) from Eq. (2) and (b) from
<g> = (∑ i = 1 to N g i)/ N . . . . . . . . . . . . . . . . . . . . . . . . . (4) where N is the number of students in the class who take both the pre-test and the post-test. According to Hake, for group sizes N > ~ 20, equations (2) and (4) give <g>’s within about 5% of one another (Hake, 1998a, footnote #46). Summarizing: a. Given the problems with pre-testing, measuring effect size with post-test
scores is the dominant means of gauging learning effects. This method requires large numbers of participants, especially when a Solomon 4 Group Design is used. Low statistical power is a real problem.
b. The use of differences between pre- and post-test scores in order to calculate gain is not recommended by most psychologists, education specialists, and psychometricians.

125
Using a pre-test as a covariate in ANCOVA is sometimes advised, based (among other assumptions) on linear relationships.
c. Hake’s approach is appealing and widely adapted in Physics educational research. In the Hake model the relationship between pre- and post-test scores is (as a rough estimate) assumed to be of the form y = (1-g)*x+g.
Linear models are used in all the approaches above, where pre-tests play a role. This leads to the most important research question in this report: a. Can pre- and post-test scores be used to gauge the relative effectiveness of an
instructional method for different students in a class or the relative average effectiveness of different instructional methods?
The answer is “Yes” if pre- and post-test scores can be used to generate a (non-linear) model parameter which has a low correlation with pre-test scores. Once an answer to “a” has been established, the next research questions are: b. What is the best way to evaluate the model parameter from experimental
data? c. What is the relationship between the model parameter and the normalized
gain defined by Hake? d. What is the statistical power of the method using the model parameter as
learning gain measure?
6.2.1 Method
To answer question “a”, three different tests were given to students. The same test served as pre-test and post-test and—in fact—the intervention is a testing effect. To answer the other questions, computer simulations were used. Some numerical methods will be proposed for evaluation of model parameters with simulated test data. Computer simulations were also used to answer the last three questions.

126
6.2.2 Participants, instruments, procedures
In three experiments 131 students (average age 17 years) studying Chemistry, Information Science, or French were selected from a school for pre-university education. Computer tests consisted mainly of fill-in-the-blank and multiple choice questions. The computer was programmed to react to a wrong answer by immediately showing the student the correct answer. The questions were presented in random order, as were the four alternative responses to each of the multiple choice questions. It was explained to the students that although the average result of all tests would contribute in a marginal but positive way to the final grade determined by a final exam that was to follow after a few weeks, the tests, if taken seriously, would most likely assist them to achieve higher grades in the final exam. The students were asked to take the test at least twice. Table 1 shows the various parameters that characterize the three experiments A, B, and C of this study. Table 1 Test data for experiments A, B, C.
Experiment A: Information Science
Experiment B : French
Experiment C: Chemistry
Number of students 32 27 72 % Female 24 26 44 # questions 27 40 51 # fill-in-the-blank questions 22 40 49 # multiple choice 5 0 2 Avg. test time (min.) 6.1 7.5 19.7 Tests / student 3.6 4.5 2 # Pre / post test pairs 70 94 72 In Experiment A (Information Science), the students were asked to study a 40-page chapter of their textbook at home. In Experiment B (French), 40 words were selected from an article in a popular French scientific magazine targeted for youth. For each sentence in French one word was underlined and the contextual translation of the word in correct Dutch was asked. The words were selected using different frequency classes (i.e. common words as well as rare words were asked). For Experiment C (Chemistry), a chapter on organic chemistry was

127
assigned as homework prior to the test. From the material in the chapter (reaction types, oxidation of simple carbon compounds, industrial synthesis of epoxyethane) relevant questions were constructed.
6.3.1 Results
In experiment A all 31 students took the test twice, 21 students took the test three times—see the abscissa of Figure 1—and one student even took the test eight times. The average scores for experiment A (in % of max score) are displayed in Figure 1. Each time the test was administered the average scores increased, and with each iteration the increase in average scores decreased. This would be expected and is consistent with the negative correlation of actual gain (y –x) with x as seen by Neuman (Neuman, 1989) and Hake (Hake, 1998b) for class-averages.
Figure 1 Average percentage scores vs. trial number for experiment A. N is the
number of students engaging in each trial. The Tukey box plot indicates the minimum and maximum scores, the lower and upper quartiles, the median, and the outliers (circles)
When a student takes the test more than once, test # n-1 can be considered as a pre-test, test # n as a post-test. The score of the pre-test for student #i is called xi. The score of the post-test is called yi. The next diagram shows a double logarithmic plot of yi/xi against xi (for experiment A).
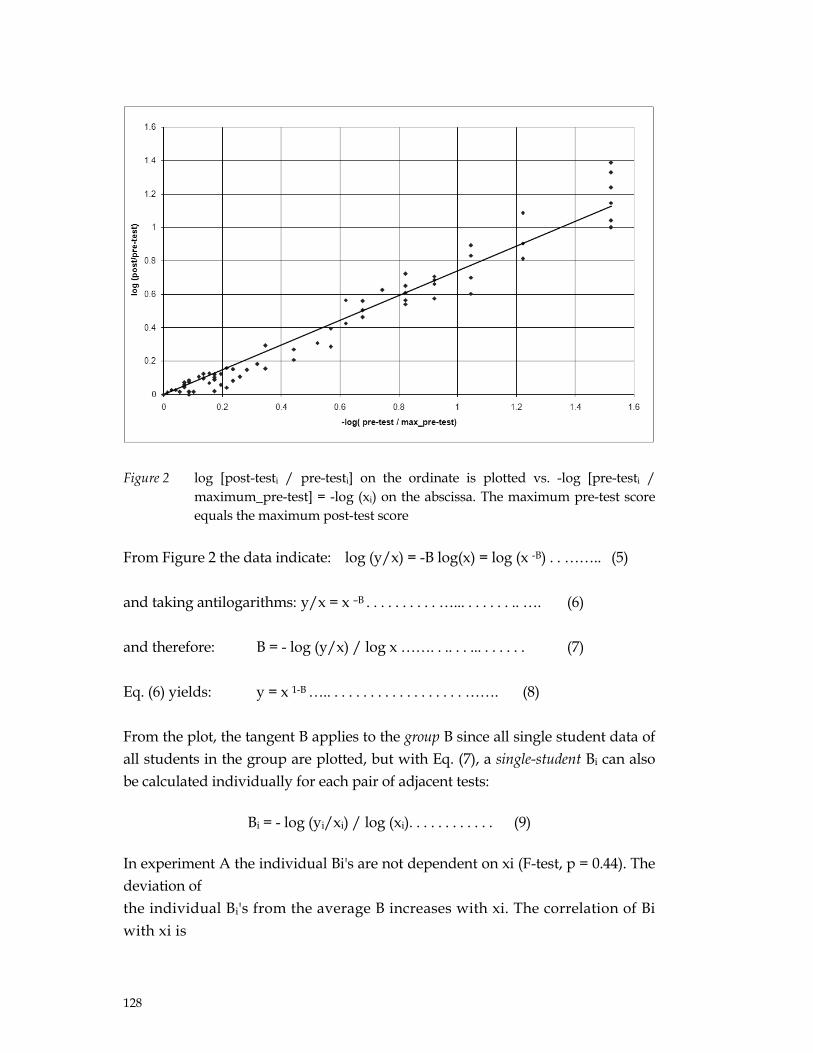
128
Figure 2 log [post-testi / pre-testi] on the ordinate is plotted vs. -log [pre-testi /
maximum_pre-test] = -log (xi) on the abscissa. The maximum pre-test score equals the maximum post-test score
From Figure 2 the data indicate: log (y/x) = -B log(x) = log (x -B) . . …….. (5) and taking antilogarithms: y/x = x –B . . . . . . . . . . …... . . . . . . .. …. (6) and therefore: B = - log (y/x) / log x ……. . .. . . ... . . . . . . (7) Eq. (6) yields: y = x 1-B ….. . . . . . . . . . . . . . . . . . . ……. (8) From the plot, the tangent B applies to the group B since all single student data of all students in the group are plotted, but with Eq. (7), a single-student Bi can also be calculated individually for each pair of adjacent tests:
Bi = - log (yi/xi) / log (xi). . . . . . . . . . . . (9) In experiment A the individual Bi's are not dependent on xi (F-test, p = 0.44). The deviation of the individual Bi's from the average B increases with xi. The correlation of Bi with xi is
129
not statistically significant (R = -0.159, Df = 68, p=0.19), justifying an alternative title of this chapter “A Pre-test-Corrected Learning Gain.” Similar results as in experiment A are found in experiment B and C. The values for the exponent B ± SE are for Information Science 0.74 ± 0.015 (n=70), for French 0.68 ± 0.015 (n=94) and for Chemistry 0.66 ± 0.012 (n=72). The correlation coefficients of the regression lines in the double logarithmic plots (such as Figure 2) are 0.978, 0.961 and 0.930.
6.3.2 Comparison of methods for estimation of B
Several methods are available to estimate B. To get some idea about the outcome of different methods of estimating B from pre/post-test data, simulation procedures were invoked. A uniform pseudo random generator was coded in C++ using Borland’s C-Builder version 4 for use in the Monte Carlo procedures. Instead of the built-in 2-byte random library function, an algorithm adapted from a subtractive method by Knuth (Knuth, 1981) and making use of 32 bit integer arithmetic was employed. These uniform deviates were transformed to a normally distributed deviate using an algorithm ported from a Pascal routine by Press (Press, 1989), also based on Knuth. The statistical subroutines written in the C++ software were tested by comparing them with results obtained with the statistical package SPSS v.11.01 and the curve fitting program Graphical Analysis 3.1. Incomplete Beta and Gamma Functions coded in C++ were compared with values given in the Handbook of Mathematical Functions (Abramowitz & Stegun, 1968). From a variety of numerical and graphical methods for estimating B, the following were chosen: a. Calculate the slope from log (yi/xi) against -log (xi) plots (as in Figure 2). The
slope of the regression line has the value B. b. In an iterative numerical procedure estimate, the least squares fit of
experimental yi values with xi1-B a value of B and its error can be found. c. A plot of log (yi) vs. log (xi) gives a straight line, in accordance with Eq. (8) y =
x1-B. The slope of the regression line has the value 1-B. d. As indicated above in Eq. 9, for each set of data points of a single student (xi
,yi), Bi can be calculated using the formula Bi = - log (yi/xi)/log (xi) . . . . . . . . . . . . . ……………. (9)
130
Since the deviation of individual Bi's from the average B increases linearly with xi, a weighting factor 1/xi is appropriate in averaging Bi’s to obtain the group average B. B values were calculated in a series of Monte Carlo simulations from a hypothetical student population with normally distributed pre- and post-test values calculated with the assumed power relationship with normally distributed errors ranging from 3 to 30% superimposed on pre- and post-test values. If robustness of a method is defined as giving an accurate and precise estimation of B under varying conditions, it was found that method “a” is the most robust if outlying log fi and -log xi values (log fi ≥ 2 and/or -log xi ≥ 2) in plots similar to Figure 2 are neglected. This is because extreme data point values have an extreme influence on the estimated slope in logarithmic plots. These can be seen via visual inspection of the plots. If a data point is an outlier and the reason for this is obvious (e.g. a student aborting a test after answering one question), omission can be considered. The error in parameter B is of crucial importance in assessing the statistical significance of differences between experimental outcomes. From the Monte Carlo simulations it can be concluded that the most precise (reproducible) and accurate estimation of the error in B can be made using method “b”. These findings were implemented in a C++ -computer program that took the slope of log (f) versus -log(x) as a starting point for an iterative non-linear curve fitting of y = x(1-B). A Newton-Raphson like first order approximation was used in order to find the least squares minimum and to calculate the parameter error. If two sets of experimental data, such as that for experiment A, are analyzed by this computer program, the statistical significance p of the difference in the estimated B's is given by a Student-t-test.
6.3.3 The relationship between exponent B and average normalized gain <g> by Hake
Even if the individual student data are not available for an analysis of B, a conservative estimation of B (i.e., estimated B lower than the actual B) is possible using group averages.

131
An example of the use of group averages is Hake’s analysis of data for various traditional and interactive engagement mechanics courses. As indicated above in Eq. (2), Hake defined an average normalized gain <g> as
<g> = (<y> – <x>) / (1 - <x>) . . . . . . . . . . . .(2) If it is assumed that Eq. (8), which describes experiments A, B, and C (at least approximately) applies to the group data analyzed by Hake, then Eqs. (2) and (8) yield
<g> = (<y> – <x>)/ (1 - <x>) = (<x>1-B – <x>) / (1 - <x>) . . . . . . . . . . (10) From each pair of randomly chosen <x>, <y> values with <x> < <y> , 0 < <x> < 1 and <y> � 1 : (a) B may be calculated from
B = - log (<y> / <x>) / log ( <x> ) . . . . . . . . . . . . . . (11) and (b) the normalized gain <g> may be calculated from equation 2. In Figure 3 these <g> and B values are displayed by small dots. The relationship between B and <g> appears to be somewhat fuzzy, with g ≤ B.
Figure 3 <g> (Hake) vs. B (Bos) as discussed in the text. The large circles are derived
from the <x>, <y> data of Hake (1998a). The curve is found by numerical integration combined with quadratic regression of average <g> values on B (see Table 2).

132
The average value of <g> (<<g>>) for a certain B can be found by integration of <g> over a definite <x>-interval. In Table 2 average values of <<g>> for B-values over the interval 0 < <x> < 1 are given. The numerical integration was performed with Maple version 7. Table 2 Average value of <g> = <<g>> for fixed B-values over the <x> interval between 0
and 1 B <<g>> 0 0 0.1 0.0690 0.2 0.1385 0.3 0.2154 0.4 0.2984 0.5 0.3885 0.6 0.4868 0.7 0.595 0.8 0.7148 0.9 0.8488 1 1 By using the data of Table 2 in a quadratic regression of <<g>> on B, it was found that <<g>> can be approximated with the function <<g>> = 0.5B2 +0.5B (R = 0.9998). The solid curve in Figure 3 is the function <g> = ½B2 + ½B. The (unweighted) coefficient of correlation between the experimental (Hake) data and this function is 0.982. The estimation of B by using group averages is conservative, because measured Bs tend to be systematically smaller than the Bs that are used in the model in the Monte Carlo routine. This difference between calculated and actual values of B increases with precision of pre- and post-test and is caused by ceiling and floor effects, since the floor effect may increase the apparent pre-test average and the ceiling effect may decrease the apparent post-test average. In both cases lower B-values are calculated. Using Hake’s data, a suggestion for a nominal scale of pre-test-corrected learning gains could be as follows:
B ≤ 0.40: “Low” 0.40 < B < 0.60 : “Average” B ≥ 0.60 : “High”

133
6.3.4 Power considerations using classical analysis versus Learning Gain Exponent calculations
Several experimental situations were simulated in order to estimate the power of the classical method of comparing post-test scores only in terms of effect sizes, versus determination of B in the power law y= x1-B (method 'b') as proposed in this article. One of these experiments is described here in detail: two sets of post-test scores with group sizes N = 28 were generated using normally distributed pre-test scores with mean 0.50 and standard deviation 0.15. Post-test scores corresponding to B = 0.66 were used for one set, and post-test scores corresponding to B = 0.55 were used for the other set. Upon the pre- and post-test and B-values, normally distributed errors were superimposed and the statistical significance of the differences of the outcomes between the two sets were calculated. The relative errors in pre- and post-tests were equal and varied between 0 and 30%. An error of 1% on the B values was set. The post-test scores of both data sets were compared using a double-sided Student t-test ("classical method"). Also, the gain exponents B and the parameter errors were calculated with our software and compared with a double-sided Student t-test. If p was higher than 0.05, a type II error was indicated. This procedure was repeated 10,000 times giving an indication of type II error frequency, denoted by β. The power of a test is defined as 1-β. The power and the statistical significance level α are strongly interdependent. Usual values are α = 0.05 and 1-β is 0.80 (Dupont & Plummer, 1998). In Figure 4 the power is given as a function of the error in pre/post-test (in %). As can be expected, the power decreases with increasing error. In the classical method using differences between post-test scores, only in this particular case, the power of 0.80 is never attained. In the method of calculating and comparing Bs the power is higher than 0.80 if the errors in pre- and post-test do not exceed 11%. In all other similar trials similar results were found—even with a small number of students (e.g., N=10)—the power of the method described in this article using pre- and post-test data approached unity. In contrast, the power was far below the acceptable value of 0.80 when the classical method of comparing only post-test scores was used.

134
Figure 4 Power as a function of error in pre- and post-test. Upper curve: estimation and comparison of B-values. Dotted curve: comparing post-test data only (classical method)
6.4 CONCLUSIONS AND DISCUSSION
In three very different contexts (Chemistry, French, and Information Science) in comparable experimental settings, we found a strong, definite power law relation y = x 1-B between pre-test x and post-test y values of individual students. The parameter B can also be derived from (a) using average post-tests <y> and pre-tests <x> or (b) by averaging Bis of individual students as determined from yi = xi1-B. That Bs derived by using single student data and group averages agree with one another, which suggests that a rough analysis can be carried out, even when single student data are not available. A serious flaw is the systematic decrease of accuracy caused by floor and ceiling effects, especially using group averages. Although a strong power law relation between pre- and post-test results in very different contexts was found, it must be emphasized that in other experimental settings other relationships may prove to be appropriate. It is noted, that in

135
cognitive psychology power laws (with other independent variables) seem to be ubiquitous (Ritter & Schooler, 2002). While other relationships may be found in other settings that lead to a better fit, the purpose of the model stays the same: elucidating deeper relationships or the impact of different types of interventions. By plotting log(y/x) against log x (as in Fig. 2) there is an opportunity for a rapid inspection of the data, and this leads to a dampening of the noise in pre- and post-test. If some aberration of normal test procedure happens (e.g. a student aborting the test) these data are spotted easily (via the visual plots) and could be inspected (and possibly omitted). For error calculations we prefer the fitting of data (x,y) to the function f(x) = x (1-B), without any transformations except normalizing the x and y values in the interval (0,1). The visual inspection also allows us to check for validity of the instrument. If too many data points are in the vicinity of the origin, a potential ceiling effect is possible. These data points have little influence on the estimation of B, however, but another test could be more appropriate. So, for several reasons, a combination of the visual inspection of the log(y/x) against -log x followed by the least squares curve fitting procedure for estimation of B and the error in B is advised. The model is not in conflict with experimental data in the literature. Both experimental data and simulations show a strong relationship between the data in the review and the model proposed by Hake, and the model presented in this report. The average normalized gain can be approximated by <<g>> = 0.5B2 + 0.5B. The reported negative correlation between pre-test scores and change is reproduced within simulations using the model. The pre-test/treatment/post-test design, in combination with gain calculations (including estimating parameter errors) seem to have a very high statistical power even with small numbers of students. The availability of precise and accurate tests is crucial. Very small differences in learning gains can be traced giving the opportunity to evaluate subtle effects. The authors are greatly indebted to Prof. dr. Richard R. Hake, Indiana University Emeritus, USA, and Prof. dr. John Hattie; Faculty of Education, The University of Auckland, New Zealand for thorough and fundamental review of this article and their wise and inspiring remarks.

136
Chapter 2 Pre-test Sensitisation & Pretraining Chapter 3
Peer Assessment of a scientific publication Chapter 4 Pre-test Sensitisation & Peer Assessment Chapter 5
Pre-test Sensitisation & Peer Support Chapter 6 A Tool for Measuring Effectiveness of Instructional Treatments Figure 1 Schematic overview of the focus in the studies.
137
CHAPTER 7 Retrospection Besides the introduction of a new curriculum in secondary education in the Netherlands starting from 1999/2000, also a reduction in the availability of a subject teacher in chemistry, mathematics and physics for students in classroom sessions took place. Especially the time reduction will decrease the educational productivity, taking into account that the same learning goals should be attained, if no measures are taken. Actually the mere time reduction in the availability of teachers without taking alternative measures is a typical example of the stagnant character of education compared to the technologically advanced (primary) sectors of the economy (Baumol, 1967). An obvious measure to decrease the growing productivity gap is to introduce technology to make education less stagnant, and with that more efficient. However, firstly a measure should be effective. For this reason this thesis also looked for ways to increase the effectiveness of learning processes. Therefore, two threads (leitmotivs) were present in this thesis. Firstly, investigating arrangements for deep learning of science concepts that are effective. Secondly, at the same time, applying educational ICT tools that promised to be efficient by saving teacher time. In this chapter the results of the five experiments will be summarized. In the first section (7.1) an overview will be given of the results by chapter, followed by a section (7.2) with a review of the integral results of the five experiments for the two red ‘effectiveness’ and ‘efficiency’. In the next section (7.3) the preliminary exploration described in Chapter 1 is discussed. This preliminary exploration formed an important personal reason for this thesis. Is there a spin-off from the theories applied in and the results of the five experiments for a better understanding in the form of explanations for the difference found? In section 7.4. some theoretical and methodological considerations will be given and finally, in section 7.5. the limits of the research and propose some issues for further research will be considered.
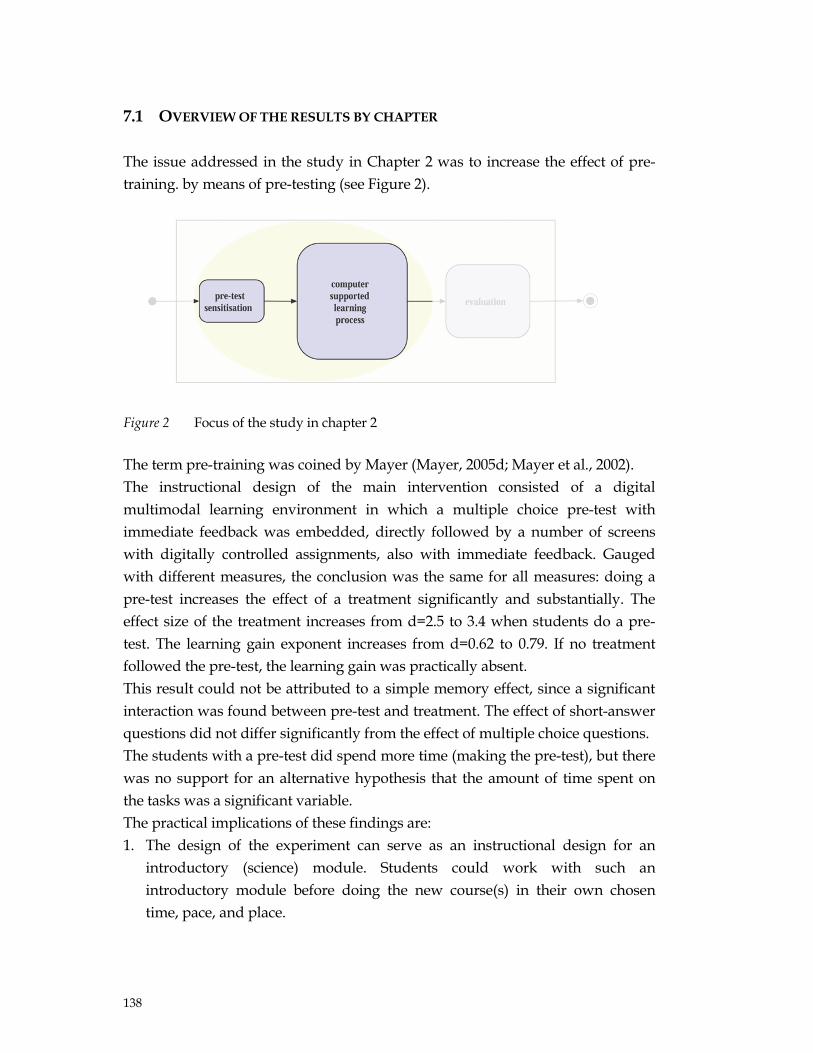
138
7.1 OVERVIEW OF THE RESULTS BY CHAPTER
The issue addressed in the study in Chapter 2 was to increase the effect of pre-training. by means of pre-testing (see Figure 2).
Figure 2 Focus of the study in chapter 2 The term pre-training was coined by Mayer (Mayer, 2005d; Mayer et al., 2002). The instructional design of the main intervention consisted of a digital multimodal learning environment in which a multiple choice pre-test with immediate feedback was embedded, directly followed by a number of screens with digitally controlled assignments, also with immediate feedback. Gauged with different measures, the conclusion was the same for all measures: doing a pre-test increases the effect of a treatment significantly and substantially. The effect size of the treatment increases from d=2.5 to 3.4 when students do a pre-test. The learning gain exponent increases from d=0.62 to 0.79. If no treatment followed the pre-test, the learning gain was practically absent. This result could not be attributed to a simple memory effect, since a significant interaction was found between pre-test and treatment. The effect of short-answer questions did not differ significantly from the effect of multiple choice questions. The students with a pre-test did spend more time (making the pre-test), but there was no support for an alternative hypothesis that the amount of time spent on the tasks was a significant variable. The practical implications of these findings are: 1. The design of the experiment can serve as an instructional design for an
introductory (science) module. Students could work with such an introductory module before doing the new course(s) in their own chosen time, pace, and place.

139
2. Pre-test sensitisation—in combination with other forms for activation and building up prerequisite knowledge—could be helpful for concept development in the context-concept approach in innovative science teaching in secondary education (Bulte et al., 2005).
3. Applying a pre-test only will not result in significant learning. Therefore, from an instructional perspective, it is relevant to connect pre-testing directly with a teaching strategy that consists of a good explanation, followed by questions and immediate feedback.
4. It is advisable to use multiple choice questions for pre-sensitising, since they can easily be implemented in an automated environment and have the same effect as short answer questions.
In two experiments reported in Chapter 3 with a control group design, the learning gain of the assessment of a writing assignment for a scientific report in the upper level of pre-university education was gauged.
In a first experiment, the overall gain of writing a scientific report in combination with doing a peer assessment was measured. An “average” learning gain was found with an effect size of d= 0.87. This effect was still present after correction for gender differences by a male-only analysis. The effect was also significant after checking for possible selection bias by a nearest neighbour analysis.
Figure 3 Focus of the study in chapter 3

140
In a second experiment, the differential gain of the two combined components (writing & peer assessing) was measured. In this experiment the formative peer assessment was computer supported (see Figure 3). No learning gain was connected to the writing, whereas the peer assessment was entirely responsible for the measured “average” learning gain with an effect size of d=1.47. Obviously it is possible and effective to perform a computer-assisted peer assessment, so the second experiment can be seen as a proof-of-principle. The large effect size can be explained by (1) a relatively homogenous composition of the group of participants (see Chapter 1) and (2) a very sharp definition of criteria, at least for these students, after a prior training by peer assessment. The focus of the experiment reported in Chapter 4 was the effect of assessing the work of a peer on the assessor him/herself. The first quasi experiment was a reconnaissance using an assessment of a complete paper-and-pencil test. The learning effect on the assessor was significant, showing a learning gain with an effect size d = 1.07, that falls in the category “average” learning gain. The second (computer supported) experiment, using orthogonal randomisation, indicated that the application of peer assessment had a significant learning effect on the peer assessor, showing an “average” learning gain with an effect size d=0.49. The combination of a sensitising pre-test and peer assessment increased the learning gain to “high” with an effect size d=0.97. It also became clear that it is not relevant to enact only a pre-test without a subsequent learning activity. Another noteworthy result was that better students as assessor learn in this situation more than weaker students.
Figure 4 Focus of the study in chapter 4

141
For the instructional practice, the design of the second, computer-supported experiment is interesting. Students applied explicit scoring criteria to authentic pre-selected samples of peer answers (see Figure 4). By doing this, the students got a better understanding of these criteria. Next to this they did an extra exercise with the relevant knowledge and problem approach. From the perspective of the teacher it could be seen as a first step to take over the (formative) assessment function by students, which is both effective and efficient.
Figure 5 Focus of the study in chapter 5 The most complicated experiment, both in framework and in execution, was described in Chapter 5 (see Figure 5). A computer-based simulation environment was designed using a three-level theoretical approach. The testing of the simulation environment took place in a Solomon Four Group Design. Although the number of participants was low, clear results were found. A low learning gain was found using the learning environment without pre-testing and without peer support. The learning gain could be increased to an “average” level by pre-testing or by peer support, whereas a high learning gain was found using the learning environment in combination with both pre-testing and peer support. The pre-testing had a significantly higher effect than peer support. The factorial increase of B can be summed (see Figure 6). All these effects were measured on a near time scale (i.e. one hour), and after two months (a far time scale) there was still a significant difference in scores between students not involved in the experiment and students in the experimental groups that took a pre-test. This difference was not present when students in the experiment did not take the pre-test.

142
Figure 6 Learning gain (B) associated with the factors: S = simulation, p = pre-test, P =
peer support. To the left the separate values, to the right the factors combined
The effect on the supporting peers was outside the focus of the experiment, but the following was an interesting finding. A pre-test was made as part of the training of the supporting peers (different from the one that was used in the intervention). Peer assessment of this test was also performed. After the experiment the supporting peers showed nearly maximum test scores, yielding B values approaching unity.
Figure 7 Focus of the study in chapter 6

143
In Chapter 6 the fundamental problem of gauging the effectiveness of instructional methods was addressed. In three different experiments a strong power law relationship yi = xi1-B was found between the pre-test values xi and post-test values yi of individual student i, as well as the corresponding relationship <y> = <x>1-B between average group pre-test <x> and average group post-test <y> values. The exponent B in this law is a pre-test-corrected learning gain, since its correlation with pre-test scores is relatively small. The value of B is theoretically between 0 and 1, but values above 0.85 are rare. A nominal scale for calculated B-values was suggested:
B ≤ 0.40 : “Low” 0.40 < B < 0.60 : “Average” B ≥ 0.60 : “High”
The best method for assessing B is a combination of a plot for visual checking of test data followed by a numerical non-linear least squares fit for estimating parameter B and its error. The use of group averages appears to give systematically low B values. It is shown that if pre- and post-test scores are relatively precise, then comparing learning gain exponents has a much higher statistical power than the use of effect sizes representing the post-tests of control and test groups. Even with a relatively small number of participants, the exponent B yields an accurate gauge of treatment effectiveness. This makes quasi-experimentation with small groups possible.
7.2 COMPILED RESULTS
In table 1 a review of the experimental results is given. The columns with effect sizes and learning gain exponents are related to one of the threads, effectiveness, whereas the focus in the last column is on the other thread, efficiency, by saving teacher time.

144
Table 1 Compiled results of the experiments
From the columns on effectiveness (effect size and learning gain exponent), it can be concluded that both pre-test sensitisation and peer assessment have a significant influence. From the last column it can be seen, that the transfer of certain teacher tasks to ICT-based tools and to students is feasible. A further quantification of efficiency lies outside the scope of this research project, however. Regarding the effectiveness, the most concise formulation of the quantitative compilation of the experimental results is: pre-test sensitisation causes an increase of the learning gain exponent B of a subsequent intervention by 0.2 and peer assessment an increase of B by 0.3 - 0.4. These increases can be detected easily, using a high-power analysis such as described in Chapter 6. In this thesis the pre-test had a double function: (1) it made gain estimations possible, and (2) it was a means to increase the effectiveness of the subsequent learning intervention. In a practical situation, function (1) is of limited use, but the combination of function (2), pre-testing (and intermediate testing) with peer assessment offers a very powerful instrument to boost learning gains. An increase of B by 0.2 appears small, but it must be kept in mind that it is an increase in an exponent. In the Netherlands school system, marks are presented on a 1-10 scale. A mark below 5.5 is called insufficient. For decades in Dutch secondary education the average of Dutch marks (also in the national school examinations) is around 6.3 and 25% of the marks have been “insufficient”.

145
When the learning gain is increased by 0.2 (ceteris paribus) the number of insufficient marks would decrease below 4%.
7.3 “A PRELIMINARY EXPLORATION” REVISITED: WHAT CAUSED THE
DIFFERENCE?
During the PhD work the author studied a lot of literature, and acquired a deeper insight into the mechanisms of the learning processes. As a result, some comments of understanding can be made on the exploration described in section 1.2. What caused the difference (effect size d = -1.62) between the trial set up and the approach in the conventional group? The trial lessons were typical for the subsequent implementation of the new curriculum (around 1999) at the school where the exploration in this thesis took place. The lessons consisted of one cluster of activities: reading text, answering questions, solving problems, checking the answers. Once in a while the teacher was asked for help. By design, whole-class group instruction on subject matter was omitted completely. After a few lessons the students were scattered over several different modules, so whole-class instruction would not have been practical anyway. Students were (and are) not alike, but some subject matter gave difficulties for a lot of them. The teacher had to help with the same problem over and over again, a potential efficiency pitfall. From experimental data it could be estimated that the teachers’ overall effectiveness was decimated compared to a whole-class instruction. Without complex experimenting and calculations this is obvious, since the teacher was coaching only one student out of 30 at a time. This one-to-one setting is a very effective way of instruction, but the effect is limited to a small fraction of the whole group. If each student has a different problem from every other student, individual help may be efficient, but often in science education students encounter the same problem. Short group instruction limited to these “epidemic” problems might be justifiable, but a teacher offering one-to-one help for one student is priceless (in a double sense). In the conventional group the lesson was structured into two or three cycles. A small anecdote at the start triggered curiosity and drew attention. A brief review of the necessary content matter of previous lessons had the effect of activating prerequisite prior knowledge. The effect of activating schemata prior to the main learning process has been theoretically grounded in Chapter 2.

146
A clear, 8-minute instruction was followed by practice in a small group setting. Since the students were synchronously working on the same module, it was quite easy to check whether they had understood the subject matter, and it was possible to give alternative ways to learn and understand. This form of immediate feedback took full advantage of the teachers’ expertise and allowed different forms of interaction. Variety is the spice of life, so dividing lessons into several functional parts, comprising a balanced mixture of demonstrations, experiments, instruction and practice is effective and not a priori unpleasant. On three occasions during the 10-lesson course a 15-minute flash test was given. In the light of the studies in this thesis and the adhering theory, the two important decisive differences between the trial group and the conventional group appear to be: (1) the short 8-minute instructions and (2) the flash testing. 1. Short 8-minute instructions The small 8-minute direct instruction was one of the characteristic differences between the trial group and the conventional group. With an “average” effect size of d= 0.93, according to Hattie, direct instruction has the highest impact on student achievement (Hattie & Timperley, 2007). The mechanism accountable for this effect could be explained by Mayer’s cognitive theory of learning from interactive multimodal environments (Mayer, 2005b). The teacher was talking and writing on a blackboard while asking questions to students and adapting continuously and immediately to the needs of individuals in his audience. In fact, this is a “prehistoric” form of a dual channel approach (Paivio, 1986). In Chapters 2 and 6 the theory of Mayer has been discussed in detail. Next to this, a first processing of the content matter occurred when students made annotations. 2. Flash testing The second influential difference was the flash testing followed by review. In the conventional group, the students took a 15-minute flash test three times. The flash tests were graded by the teacher and meticulously reviewed in the next lesson. These tests were mainly formative since the scores contributed to a weight of up to 20% of the final mark of the summative test at the end of the course.

147
The application of formative testing in instructional processes results in a higher success rate as found in the survey by Black and William (1998), with typical effect sizes between d=0.4 and d=0.7. Learning and formative testing are indivisible, provided enough feedback on tests is given. The student must receive guidance to improve. Feedback can take several forms, such as discussion and reflection between peers and between teacher and student. A test can be a starting point for reflection and can be used to evoke understanding. In Chapter 2 the effect of testing as a means of activation of schemata has been highlighted. The findings in Chapter 4 suggest that the learning gain could have been improved by peer assessment.
7.4 SOME THEORETICAL AND METHODOLOGICAL CONSIDERATIONS
7.4.1 The nature of educational-psychological theories and design
PhD’s with a background in the Natural Sciences may have a hard time to get accustomed to theory in the behavioural sciences. By nature a theory in the behavioural sciences is different from a theory in Physics and Chemistry (and the other natural sciences, of course). Although there may be a dispute amongst scientists regarding the interpretation of world-wide events, there is little disagreement about Newton’s law F = m.a. This is in sharp contrast with disputes between behavioural scientists over fundamental issues (Simons, 2006; Werf van der, 2006). A few reasons for this discrepancy are easy to trace. 1. The number of “participants” in the Natural Sciences (molecules, ions, nano
particles) are difficult to conceive. Try to imagine the number of molecules in a millimole of hydrochloric acid, and compare this to the number of participants in a huge, practically impossible educational experiment with a staggering number of 600 students: the degrees of freedom differ by eighteen orders of magnitude.
2. At least the behaviour of the chemical and physical “participants” is similar and since they act in large numbers their behaviour is predictable. Although there are four 4 types of natural hydrochloric acid (and a small dozen synthetic), they all have invariably the same acidic properties, day after day, all over the world. The 600 participants in the fictitious educational experiment

148
are all different and behave differently each day; this is because both participants and contexts differ each day.
3. The language in Chemistry and Physics and other natural sciences is highly formalized, abstract, and has, to a high extent, a mathematical substrate. The language of the natural sciences is not natural at all. In behavioural science the language is more natural, less abstract and hardly formalized, and as a result, there is a real or supposed disagreement on practically everything on every level.
Educational research is the hardest science of all. Broad theories and ecological generalizations often fail because they cannot incorporate the huge context effects and the myriad of interactions. As a result of this, it is not unusual that school reform movements have trouble replicating effects from site to site (Berliner, 2002). Some researchers see educational psychological theory as instrumental. “There is nothing as practical as a good theory” (K. Lewin, cited in (Marrow, 1977)), and in fact the theories depicted in section 1.3 appeared in the experiments to be very useful instruments for instructional design of efficient and effective learning situations for science, in particular chemistry. Reasoning back, also the more general functional Instructional Design Theory grounded in the research of Gal’Perin (Terlouw, 1993; see section 1.3.), appeared to be useful. We considered the theories used as design instruments in the experiments as specifications of this more general ID theory. Moreover, this ID-theory, using instructional functions, realized the connections between the theories and the connection between the theories and the instructional practice. An explanation: The Mayer-Moreno theory (incorporating the Schema theory), in particular, provided very useful guidelines for the designer, since the theory (1) builds on empirical evidence with data that originate mainly from the same type of disciplines, (2) is linked to a clear theoretical base, and (3) is tested on the same type of (ICT-) tools as used in this thesis (Mayer, 2005a). The validity of this theory in other disciplines than Science education is aptly questioned (De Westelinck et al., 2005). The framework by Sadler gave a clear view on the nature of feedback (D. R. Sadler, 1989). This nature and the importance of feedback was further clarified by Hattie (Hattie & Timperley, 2007). The impact of the possible role of peers in supporting and assessing each other agreed with Vygotski’s idea of the Zone of Proximal Development (Vygotsky, 1978). Finally, Van Hiele’s level theory was useful in the construction and sequencing of the different modules in the simulation software. This theory has its roots in Mathematics Education, but apparently has shown its worth in other disciplines.

149
7.4.2 Measuring differences between groups: Solomon Four Group Design
In this study the Solomon Four Group Design (S4GD) (Shadish et al., 2002; Solomon, 1949) was used. The focus of a major part of this thesis is on the effect of pre-testing and the interaction of the pre-test on the main intervention. The real power of this research design was revealed during the work. A potential pre-test effect is revealed by comparing both control groups. In this way internal validity can increased. Next to this, the Solomon group design is especially useful in studying pre-test-treatment interaction effects, by means of an analysis of variance. Simpler designs may have advantages. For instance, they need less participants and the organisation is less complicated. Despite this, the S4GD is recommended for science education research (Scharfenberg et al., 2006). In this thesis Orthogonal Randomisation, Two-step Computerised Randomisation (using the BX, average Chemistry marks and gender) as well as the related Nearest Neighbour Analysis were methodological measures to eliminate the problem of small groups to some degree, but offered a challenge to the reviewers also.
7.4.3 Adequately measuring learning gain
A promising finding in this study is the strong relationship between pre-test and post-test and its application in order to gauge learning gain. The method using the model described in Chapter 6, allows tracing very small differences in learning gain, giving the opportunity to evaluate subtle effects even with small number of participants (which is the case normally). A substantial part of quantitative educational research is in vain, because the statistical power of the evaluation method is often too low, considering the limited number of participants.
Figure 8 The difference between precision and accuracy If an underlying model is accepted, the estimation of the model parameter does not need a lot of measurements, provided the experimental results are accurate

150
and precise. The terms precise and accurate are related, but have different meanings (see Figure 8). Precise means a small variance, accurate means how the average tends to the “real” value. To calculate the density of a pure substance, for example, only two measurements will do: volume and mass. The underlying simple model is known (ρ=m/V). The experiment can be replicated a few times to get some idea about the error. As a rule, in educational/psychological science, the effect of a process is gauged without a quantitative model. Sometimes a factor is included and a linear relationship with the dependent variable is assumed, or in other cases, the connected probability density function is assumed to be Gaussian. It is not always sure that these assumptions are not violated, but certainly this approach demands large numbers of participants. Effect size is the customary way to compare experimental and control groups in quantitative educational research, but its characteristics and reliability can be disputed. The numerator is the difference between group averages. During the process of averaging, information on the individual participants is lost. The denominator is a kind of a pooled standard deviation. If heterogeneous groups are used, the standard deviations and the denominator increase. As a result the effect size decreases. The impact of this way of reporting the effectiveness of one intervention compared to another can be demonstrated by calculation the power, thus allowing to estimate the necessary number of participants in advance. For example, in order to detect an effect size d= 0.4, the group size has to be 100 using typical student data with a pooled standard deviation of 16 (on a 0-100 scale), a significance level of α=0.05 and a statistical power of (1-β) =0.80 (Dupont & Plummer, 1998). In literature an effect size of d=0.4 is an average value (Hattie & Timperley, 2007). In this case this effect size corresponds with a small learning gain exponent B = 0.2. In actual practice, in Dutch secondary education it is hard to assemble this number of 200 participants (2 groups of 100 participants). The requirements are less restricted if the method proposed in Chapter 6 is used: applying the B-law instead. To demonstrate this, the data from an unpublished experiment are presented. A group of 19 students (age 16 years) took a paper-and-pencil pre-test and spent an hour building models of molecules with a freeware molecular modelling program. Each participant was supported by a

151
trained peer. After one hour they took a paper-and-pencil post-test that was different from the pre-test. The equivalence of pre- and post-test was established in a separate, independent experiment. The results are in displayed in Figure 9. Although compared to the experiments described in Chapter 6, the length and nature of the intervention is completely different, the pre-test differed from the post-test, and the test format is different, the data still obey the power law. Figure 9 Diagram from pre- and post-test data. The main intervention in between
lasted one hour. The pre-test is different from the post-test, but the tests are equivalent
With the specially built computer application, it was possible to calculate the B-value: B = 0.73 ± 0.023. When B > 0.6 the learning gain is regarded as “high”. From this diagram the goodness-of-fit of the data with the “B-law” can be inspected. Suppose this intervention had to be compared to another less potent intervention, and suppose the effect size was expected to be d=0.4. With the same parameters used in the power analysis above, the number of participants in one group can be calculated: 4 (i.e. 2 groups of 4 are needed instead of 2 groups of 100). For quantitative educational research the implications of the method are considerable. This is hardly science fiction. These data are from an experiment that was really executed.

152
The relationship between effect size and B is quite complicated, since the effect size is calculated with group standard deviations and differences in group averages after the intervention. To get some idea of the relationship between effect size and B for the population in this thesis, a random 2078 examination marks of 247 students over 28 disciplines were retrieved and converted to a 0-100 scale. The mean was 62.5 ± 15.3. The distribution curve was a little bit skewed to the left (the skewness = -0.22). The marks were treated as post-test marks, and using different B values, corresponding pre-test data were calculated. From these figures effect sizes were calculated. The histogram and the relationship between effect size and B are displayed in Figure 10. From this graph, the nominal scale for B-values appears to be harsh. The graph gives a perspective on the high effect sizes in chapters 2, 5 and 6 in this thesis. It must be kept in mind that an effect size only displays differences between two groups after an intervention. Pre-test level is not corrected for.
Figure 10 The relationship between Effect size and Learning Exponent B for the typical
student output data displayed in the histogram (mean = 62.5 ± 15.3 n=2078).
7.5 LIMITS OF THIS RESEARCH AND ISSUES FOR FURTHER RESEARCH
The studies described in this thesis have their limitations, such as the quantitative approach and the focus on certain aspects. The experiments were in an ecological

153
situation, with consequences due for the characteristics of participants and educational background. The discussion on limitations and issues for further research is restricted to the more obvious.
7.5.1 Motivation
A major concern and often neglected, affective issues have not explicitly been dealt with in this study. The first conditional instructional function (motivating the student) was outside the focus of this thesis, but may be of decisive importance. In general, the emphasis on prerequisite skills and ability to learn in the cognitive domain has dominated instructional design theory (Keller, 2000). Keller points to the learners’ motivation as a critical factor and claims that motivational theory ought to be at the heart of instructional design. The ARCS model of Motivation by Keller is an outline of a problem-solving process that systematically approaches motivation. His ARCS-model distinguishes four major motivational determinants: triggering attention (A) by the learner, communicating relevance (R) of the instructional objectives, stimulating confidence (C) of the learner, and creating effects that are satisfying (S) for the learner. Although no explicit research was done on this topic, also Gal’perin stresses the importance of motivation at the start of a learning process. This requires the learning content to be presented as a meaningful whole. First, students have to understand and accept the affective, motivational and cognitive value of the to-be-acquired knowledge before appropriating and being able to use it (Haenen, 2001). From a different starting point, recent science curriculum reforms arrive at the same motivational issues. Relevance to the students is mentioned explicitly by Gilbert (Gilbert, 2006) as a problem to be solved, along with the ornateness (overloadedness) of curricula that are filled with isolated facts and the lack of transfer (Gilbert, 2006). Context based approaches with a selection of content on a need-to-know basis are advocated as a fruitful to meet these challenges (Bulte et al., 2005; Bulte et al., 2006; Pilot & Bulte, 2006). Contexts that are supposed to be meaningful for students might involve perceptual arousal, motive matching, familiarity, success expectation and intrinsic satisfaction, as predicted by the ARCS model that may potentially fulfil the first instructional function. Further research asks for specification and differential impact of the components mentioned. The application of new teaching insights is not exclusively related to specific curriculum characteristics. The educational arrangements as suggested in this

154
thesis do not oppose the tenets of the science curriculum reforms. In fact, such measures as pre-test sensitisation, peer support and peer assessment, and computer interventions designed using Mayer Moreno Theory and Van Hiele can be integrated into a variety of arrangements, including the ones that are designed with new objectives from science curriculum reforms. The assessment tool presented in Chapter 6 and the methodological approaches in the other chapters can help gauge the effects of the proposed new arrangements.
7.5.2 Experimental group
The groups participating in the experiments were relatively homogeneous. The students were motivated since they were convinced that participation would be beneficial. As a result of this homogeneity, extraordinarily large effect sizes could be detected. Since dispersion of B-values for homogeneous groups of motivated students is expected to be small, in the process, the B-law was discovered, and that legitimated small group sizes afterwards. It could be interesting to examine the robustness and validity of the relationships and the magnitude of the effects under other experimental conditions. Experimental results in other disciplines, such as geography, other school types, such as vocational schools, and other age groups, such as post-adolescents, may contribute to the external validity of the findings in this thesis.
7.5.3 Time scale
Other questions to be solved are time-related. The experiments were performed on a near time scale. To investigate effects on a longer time scale extensive experimenting may be needed. There are reasons to believe that pre-test sensitisation only works on a near time scale. If this is true, this would have implications for both teachers and researchers. Teachers should plan the pre-test intervention immediately before the main intervention, if they want to have a maximum interaction of the pre-test with the main intervention. Researchers might be interested in measuring pre-test levels as cleanly as possible. In order to avoid interactions, they could plan their pre-test long before their experiment. A Solomon Four Group Design could check for undesired side effects in any case. These considerations are based on indications and assumptions, but ought to be corroborated in a more detailed research.

155
In most experiments in this thesis the object of study was a relatively moderate portion of subject matter. Also the time frame was, as already mentioned, limited. Instruction and testing were on a near time scale. Does the application of the proposed arrangements lead to improvements on a far time scale? As an indication, the results of the national exam in Chemistry for those secondary school students involved in the different experiments in this research project, can be compared with the students of all other schools in the Netherlands. The percentage of students choosing the subject as a discipline for further studies at the university level can give a second indication. Below are some preliminary, tentative results on these two topics. (A) A difference between the students involved in the studies and the students from the national sample. Two different groups of students (N=44 and N=42) participated in the experiments of the studies in this thesis. The first group participated for 1.5 years, the other group for 2.5 years. Their results in the national A-level Chemistry examination (on a 0-100 scale 67.45 ± 13.68 and 73.52 ± 12.55) were compared to random samples from all over the Netherlands (58 ± 15, N=2253 and 62 ± 14, N=2237). Because of differences in standard deviation, it is appropriate to use the Welch t-test for a test on the significance of the differences. The degrees of freedom in a Welch t-test are calculated (and practically but not necessarily equal to the number of participants in the small sample). The performance of the groups participating in the experiments exceeded the national sample. The difference is extremely significant for both experimental groups of students: t(45) = 4.5437 ( p=4.3.10-5, N=44) and t(42)=5.8806 ( p=1.10-6, N=42) . (B) The number of students choosing a related university program. One of the teachers’ tasks is to pass the torch. Of the group of students 20% have decided to study Chemistry or Chemical Technology at the university level. This percentage is about 10 times the choice rate of the control group of students since only 1.9 % of all Dutch students in that year chose Chemistry or Chemical Technology at the university level. A limitation on drawing conclusions from these results is that only one teacher was involved in this experiment, the researcher. So comparison with more generations of students might provide more insight in the results. In conclusion face-to-face time in education will be reduced as a result of unbalanced growth. This trend was predicted by Baumol in 1967. For this reason,

156
“doing more in less time” is a challenge that is probably structural. It was one of the driving forces of this thesis. A new major reduction in face-to-face time for Chemistry and Physics has been implemented in the newest version of the Dutch secondary school curriculum (de Vernieuwde Tweede Fase). Therefore, the game is not over.

157
ENGLISH SUMMARY In this thesis ways of deep learning of science concepts are investigated, that are more effective and also save teacher time. The main part of this thesis focuses on designing, optimising, and studying the embedding of two types of interventions: pre-testing and peer assessment, both supported by or combined with ICT-tools. Chapter 1 starts with background at the macro-level (socio-economic) and the micro-level (the author’s experience). The gradual, irreversible reduction of teacher time—as predicted by Baumol—underlines the necessity of augmentation of teacher effectiveness and efficiency, and of alternative educational arrangements. Deploying Information and Communication Technology (ICT) based tools is promising, provided they are optimised and congruent with the educational environment. Chapter one also describes an experiment with puzzling outcomes, underpinning the necessity of alternative, effective and efficient learning arrangements. Chapter 1 also addresses the general issue and related issues of the theoretical framework used in this thesis precedes the presentation of some general data on the participants and the educational context. The introduction ends with a schematic overview of the chapters describing five empirical ecological (“classroom”) studies. In the first study, pre-test sensitisation is used intentionally to boost the learning gain of the main intervention (Chapter 2). The by-effect of pre-testing is feared for methodological reasons, but can be beneficial for instructional purposes. The main intervention is an interactive, multimodal learning environment, designed for the pre-training of science concepts in the joint area of physics, chemistry, biology, applied mathematics, and computer sciences. The results show a high learning gain, especially after applying a pre-test. Data analysis shows a high interaction of the pre-test with the intervention. The learning gain is negligible if no treatment follows the pre-test.

158
For practical application of pre-testing as a design principle it is important to note that the pre-test effect of multiple choice questions is the same as the effect short answer questions. The former are much easier to handle in an ICT-environment. In the second study (Chapter 3), the learning gain is studied and is connected to the peer assessment of a scientific report. In authentic research practices a report is a natural end product, but one cannot expect to get good science reports from students without teaching them how to write them. In the first part, the overall gain of writing a scientific report in combination with doing a peer assessment on these reports was measured. An “average” learning gain was found with an effect size of d=0.876. This effect was still present after correction for gender differences by a male-only analysis. The effect was also significant after checking for possible selection biases by a nearest neighbour analysis. In a second experiment, the differential gain of the two components (writing and assessing) was measured. No learning gain was connected to the writing, whereas the computer-supported peer assessment appeared to be entirely responsible for the measured “average” learning gain with an effect size of d=1.47. Computerised assessment of the report of a peer, with understandable, sharp criteria gave the assessor a clear view of the intended targets. In the third study (Chapter 4), the focus is on the transfer of assessment tasks to students in order to relieve the tasks of the teacher. It is also relevant to investigate a possible learning gain to the peer assessor himself when performing a peer assessment. In a quasi-experimental design in secondary science education students assess a complete paper-and-pencil test of a peer. In this case the assessors show an “average” learning gain. The learning effect on the assessors is more closely examined in a computer-supported experiment, where students apply explicit scoring criteria to authentic pre-selected samples of answers of peers. An orthogonal randomisation is part of the experimental design. The highest learning gain in this digital environment was found when students made a pre-test before applying scoring criteria to answers in peer assessment. The most complex fourth study (Chapter 5) focuses on the design and learning effect of a computer-based simulation environment. The subject matter consists of reaction kinetics, an abstract part of Physical Chemistry.

159
The design is grounded in a multifaceted theoretical approach, comprising a general theory of instructional functions for the overall instructional framework, Van Hiele’s level theory, and Mayer’s cognitive theory of learning from interactive multimodal environments. Peer support is intended to give just-in-time support, immediate feedback, and a reduction of cognitive load. Peer assessment is invoked in the training of the students who give support. A pre-test is used to activate relevant scientific concept networks. The differential effects of both pre-test sensitisation and peer support are estimated in an extended Solomon Four Group research. The results show a high learning gain, especially when pre-tests are used and peer support is available. After two months, the effect of pre-testing is still significant. The set up in this experiment can be used as a blueprint for the design of effective interventions.
In Chapter 6 an alternative is presented to gauge the effectiveness of educational arrangements. Reporting effect sizes is the customary way to do so, but three problems are connected to the customary method: (1) in order to attain enough statistical power, this method requires a large number of participants, (2) precious information is lost and (3) pre-test scores (if available) are not used appropriately. An alternative approach is suggested, based on empirical data. In three different experiments (Chemistry, French and Information Science) a strong power law relationship yi = xi1-B is found between the pre-test values xi and post-test values yi of individual students, as well as the corresponding relationship <y> = <x>1-B
between average group pre-test <x> and average group post-test <y> values. The B in the exponent is proposed as a pre-test-corrected learning gain, since its correlation with pre-test scores proves to be relatively small. A nominal scale for calculated B-values is suggested. The best method for assessing B is a combination of a plot for visual checking of test data followed by a numerical non-linear least squares fit for estimating parameter B and its error. The use of group averages appears to give systematically low B values. It is shown that if pre- and post-test scores are relatively precise, then comparing learning gain exponents gives a much higher statistical power than the use of effect sizes representing the post-tests of control and test groups.
160
A computer program has been written for evaluation of B-values from raw pre- and post-test scores of two different experiments. The exponents B are estimated as well as the significance of their differences. The practical advantage of the proposed method is experimenting with a very small number of participants. In the final chapter (Chapter 7), the results of Chapters 2 to 6 are summarized. After that, the preliminary exploration mentioned in Chapter 1 is discussed, using the spinoff of this thesis. The role of theory in general and of the theoretical framework in the different studies is evaluated. The methodological issues of design and instruments are addressed and discussed, as well as the limitations of the study. Some new research issues that have arisen during this research and are worthwhile for further investigation are formulated. After that, the usability of the results is sketched, e.g. for new curricular development and reform in science education, the context-based approach. Finally, some indications of external validity and learning effects on a far time scale are given.

161
NEDERLANDSE SAMENVATTING Over pretestsensitivering en peer assessment ter vergroting van leerwinsten in natuurwetenschap-pelijk onderwijs. Inzetten van ICT om de taak van de leraar te verlichten In dit proefschrift worden leerarrangementen onderzocht, die bedoeld zijn om het diepe leren van natuurwetenschappelijke concepten te stimuleren. Het doel is om arrangementen te ontwerpen, die effectief zijn, maar geen extra tijdsdruk op leraren leggen. Het belangrijkste deel van dit proefschrift gaat over het ontwerp, optimaliseren en bestuderen van het inbedden van twee soorten interventies : pretesten en formatieve peer assessment (het beoordelen van het werk van de ene leerling door de ander), al of niet ondersteund door of in combinatie met ICT-producten. Hoofdstuk 1 start met de achtergrond van dit onderzoek op macro-niveau (socio-economisch) en op micro-niveau (een ervaring van de auteur). De door Baumol (1967) voorspelde onevenwichtige groei van diverse economische sectoren, resulteert in een onomkeerbare reductie van contacttijd tussen docenten en leerlingen. Dit onderstreept het belang van een onderzoek naar een hogere effectiviteit en efficiency van de inzet van leraren, ook in alternatieve onderwijsarrangementen. De benutting van ICT-oplossingen, mits toegesneden op de onderwijssituatie is veelbelovend. In hoofdstuk 1 wordt ook een onderwijskundig experiment uit 1995 beschreven met een resultaat dat meer vragen oproept dan beantwoordt. Verder behandelt hoofdstuk 1 het uiteindelijke thema, een schets van enkele onderdelen van het theoretisch kader alsook wat algemene gegevens over de deelnemers. De inleiding eindigt met een schematisch overzicht van de vijf hoofdstukken, waarin onderwijskundige experimenten worden beschreven. In de eerste studie (hoofdstuk 2) wordt pretestsensitivering gebruikt om het leereffect van de hoofdinterventie te versterken. Pretesten wordt door

162
methodologen gevreesd, omdat het een zuivere meting van het effect van de hoofdinterventie verstoort. Voor educatieve toepassingen is dit juist een extra kans om de effecten te vergroten. De hoofdinterventie in dit onderzoek is een interactieve voortraining als voorbereiding op lessen in de natuurwetenschappen, informatica en wiskunde. Er wordt een “hoge” leerwinst ten gevolge van deze interactieve training gemeten, vooral als er een pretest wordt afgenomen. Als na de pretest niet meteen een verdere onderwijsactiviteit volgt, is de leerwinst verwaarloosbaar. Uit de gegevensanalyse blijkt een significante interactie tussen de pretest en de hoofdinterventie. In een geautomatiseerde leeromgeving zijn meerkeuzevragen gemakkelijker af te handelen dan open vragen. De praktische vraag naar het effect van verschillende vraagtypen is daarom ook onderzocht. Er is echter geen verschil in leerresultaten gemeten tussen het effect van meerkeuzevragen en kort-antwoordvragen. Het praktisch belang is, dat een pretest met meerkeuzevragen, onmiddellijk voorgaand aan een onderwijskundige interventie, tot hogere leerwinsten leidt. In de tweede studie (hoofdstuk 3) is het leerproces door het corrigeren van een ’wetenschappelijke’ publicatie van een medescholier het onderwerp. Een verslag van een experiment met de indeling van een wetenschappelijke publicatie, kan een natuurlijk sluitstuk zijn van authentiek experimenteel onderzoek door leerlingen. Als men van dergelijke publicaties een hoge kwaliteit verwacht, moet het schrijven ervan worden aangeleerd. De benodigde tijd voor correctie van en geven van terugkoppeling op dergelijke producten, trekt echter een zware wissel op de docent. In het eerste deelexperiment wordt een “gematigd” bruto leereffect van het schrijven en nakijken van een dergelijke publicatie gevonden met een effectgrootte van 0,88. Ook na controle voor een meisjes/jongens-effect en na een naaste buur-analyse is het leereffect statistisch significant. In een tweede deelonderzoek wordt de invloed van de twee componenten (schrijven en nakijken) afzonderlijk gemeten. Het schrijven op zich geeft geen leerwinst, maar het computer-ondersteund nakijken daarentegen is volledig verantwoordelijk voor de “gematigde” leerwinst (effectgrootte = 1,47). Het praktisch belang is de grote leerwinst doordat een leerling terugkoppeling krijgt op zijn werk en dat het computer-ondersteund nakijken met behulp van duidelijke, begrijpelijke criteria de nakijkers een duidelijk beeld geeft van wat er van hen verwacht wordt.

163
In de derde studie (hoofdstuk 4) wordt nader gekeken naar de gecontroleerde en ondersteunde overdracht van beoordelingsactiviteiten van docent naar leerling, teneinde de docent te ontlasten. De gebruikte beoordelingen hebben voornamelijk een formatief karakter. Deze toetsen worden primair gebruikt om het leren te bevorderen. Het praktisch belang is, dat het maken van een voortoets en het beoordelen van het werk van een medeleerling het leereffect kunnen vergroten. Vooral het leereffect op de nakijkende leerling is hier van belang. Allereerst wordt in een quasi-experimentele opzet de leerwinst van het nakijken van een complete papieren toets gemeten. De leerwinst is “gemiddeld” te noemen. Het leereffect door het nakijken van het werk van een medeleerling wordt nader onderzocht in een gecomputeriseerd onderwijs, waarbij leerlingen nakijkcriteria toepassen op van tevoren speciaal uitgezochte en ingescande antwoorden van medeleerlingen. In het onderzoek wordt orthogonale randomisatie toegepast. De hoogste leerwinst wordt vastgesteld, als voordien een pretest-activering van een bepaald deelonderwerp heeft plaatsgevonden. Het vierde, meest ingewikkelde experiment (hoofdstuk 5) betreft het leren van reactiekinetiek, een onderdeel van de fysische chemie, met behulp van een simulatieprogramma. Vanuit een overkoepelende didactische theorie worden leerfuncties gespecificeerd met behulp van de niveautheorie van Van Hiele op mesoniveau en de cognitieve theorie van het leren met behulp van multimodale interactieve omgevingen van Moreno-Mayer op microniveau. Daarnaast wordt ondersteuning door medeleerlingen gebruikt, alsook pretest-sensitivering. De ondersteunende leerlingen worden vooraf getraind, waarbij het maken van een toets en het nakijken ervan onderdeel van de training is. Om de diverse effecten te kunnen onderscheiden wordt een Viergroeps-Onderzoeksopzet volgens Solomon gebruikt. Het werken met de simulatieomgeving geeft een “hoge” leerwinst, vooral als er een pretest wordt afgenomen en er ondersteuning door een getrainde medeleerling is. Het effect is na twee maanden nog meetbaar. De opzet van het onderwijs in dit experiment kan als een blauwdruk worden gebruikt voor het ontwerp van effectieve interventies. In hoofdstuk 6 wordt een alternatieve maat voorgesteld om het effect van een educatief arrangement vast te stellen. De gebruikelijke manier om zoiets te rapporteren is het berekenen van de effectgrootte, maar hieraan kleven drie ernstige bezwaren: (1) om voldoende groot statistisch vermogen te krijgen zijn

164
grote aantallen deelnemers nodig, (2) er gaat belangrijke informatie over de individuele deelnemers verloren en (3) er wordt geen optimaal gebruik gemaakt van pretest gegevens (indien aanwezig). Op basis van empirische gegevens wordt een alternatieve benadering voorgesteld. Bij drie verschillende experimenten in de vakken Scheikunde, Frans en Informatica, is een sterk verband gevonden tussen voor- en natoets. Het verband tussen de pretoetsscore xi en de natoetsscore yi van individuele leerlingen blijkt te kunnen worden beschreven met yi = xi1-B voor de individuele leerlingen. Voor groepsgemiddelden <x> en <y> wordt een analoog verband vastgesteld: <y> = <x>1-B . De waarde B kan worden geïnterpreteerd als een voor de pretest-gecorrigeerde leerwinst, omdat de correlatiecoëfficiënt van B met de pretestscores gering en niet significant is. Er wordt een nominale schaal voor B voorgesteld. De B-waarden die met behulp van groepsgemiddelden worden bepaald, blijken systematisch aan de lage kant te zijn. Een diagram voor visuele inspectie in combinatie met een numerieke niet-lineaire kleinste kwadraten-aapassing blijkt bij nader onderzoek de beste methode te zijn om B en de fout in B uit leerlinggegevens te bepalen. Het blijkt verder, dat met behulp van redelijk precieze voor- en natoetsen het vergelijken van B-waarde van een experimentele groep met die van een controlegroep een veel hoger statistisch vermogen heeft dan de gebruikelijke methode met effectgroottes. Er is een speciale computerapplicatie geschreven om B, de fout in B en de significantie van een verschil te bepalen uit ruwe voor- en natoetsscores. Het praktisch belang van de voorgestelde methode is de mogelijkheid om ook met geringe aantallen deelnemers toch relevante kwantitatieve educatieve experimenten te doen.
In het slothoofdstuk (7) worden de resultaten van de hoofdstukken 2 t/m 6 nog eens bij elkaar gezet en wordt het experiment uit paragraaf 1.2 besproken met behulp van de spin-off van het werk aan dit proefschrift. Vervolgens wordt een bespreking van theorie in het algemeen en het in de studies gebruikte theoretisch kader uit paragraaf 1.3 gegeven. De methodologische aspecten van de onderzoeksontwerpen en de gebruikte methoden worden hierna beschouwd, alsook de beperkingen van dit onderzoek. Nieuwe onderwerpen die nuttig zijn voor vervolgonderzoek worden aangestipt. De bruikbaarheid van de resultaten, bij voorbeeld voor nieuwe onderwijs-ontwikkelingen in het scheikundeonderwijs worden geschetst. Tenslotte worden enige aanwijzingen met betrekking tot de externe validiteit en leereffecten op een verre tijdschaal gegeven.

165
CURRICULUM VITAE Als broekje van nog geen 17 jaar verliet Floor Bos (bouwjaar 1950) het ouderlijk huis om in Nijmegen een studie scheikunde te volgen. Ondanks een turbulent studentenleven (Bos was o.m. praeses van het Nijmeegs Nihilisten Dispuut Caralĩo) werd in 1970 na drie jaar het kandidaatsexamen fysische chemie alsook het kandidaatsexamen biochemie afgelegd. In deze periode volgde hij uit interesse de colleges puberteitspsychologie en algemene didactiek. Voor een doctoraalstage met twee hoofdvakken (chemische farmacologie en biochemie) verhuisde hij naar de medische faculteit van de toenmalige Katholieke Universiteit (nu: Radboud Universiteit). Het farmacologische werk betrof naast chemisch-analytische en organisch-synthetische activiteiten in het kader van drug-design, het farmacokinetisch meten en modelleren van de absorptie, metabole en renale klaring van harddrugs. Het werk op de afdeling biochemie betrof het automatiseren van de evaluatie van biofysico-chemische metingen in het kader van de bepaling van de quaternaire structuur van alfa-crystallines. In deze periode studeerde hij ook culturele antropologie. In 1972 werd het doctoraal examen met deze twee hoofdvakken afgelegd, met als uitbreiding “capita uit de theoretische chemie”. En passant werd de eerstegraads onderwijsbevoegdheid gehaald. Al vanaf augustus 1970 werden lessen scheikunde gegeven aan het illustere Geert Groote College in Deventer en nadien ook lessen in natuurkunde, informatica en algemene natuurwetenschappen. Op deze school bekleedde hij tot 1996 diverse schoolorganisatorische sleutelfuncties (thesaurier, informatie-manager, diverse controllerfuncties, ICT-innovator, coördinator oude en nieuwe technologie, coördinator buitenlesactiviteiten, ICT-opleider van staf, admini-stratie en collegae, lid benoemingsadviescommissies). Hij nam zitting in de medezeggenschapsraad, net lang genoeg om met succes een lokale scholenfusie tegen te houden. In deze periode was hij ook voorzitter van interscholaire commissies van de Stichting Carmel College en blies hij trombone in het school-orkest. Bos is Ehrenmitglied der Deutschen Fachgruppe. Naast zijn onderwijsbaan bleef Bos vanaf 1973 werken voor de afdeling Biochemie (RU) waar hij computerapplicaties schreef om mathematisch/

166
statistische problemen van promovendi op te lossen. Daarnaast studeerde met succes één jaar Nederlands en was medewerker van het Tijdschrift voor Gerontologie en Geriatrie vanwege het schrijven van een doctoraalscriptie over de moleculaire basis van veroudering. Uit lijfsbehoud werden al deze activiteiten echter allengs beperkt tot een vrijwel volledige onderwijsbaan in combinatie met één dag research aan de RU tot 1981. In 1982 werden Micro-Informatica I en II gepubliceerd, twee leerboeken om wiskunde B-leerlingen inzicht te geven in numerieke methoden. Na een periode met advieswerk in het midden en kleinbedrijf (snelle fourieranalyses ter voorspelling van seizoensgebonden prijzen), het geven van diverse ICT-trainingen en cursussen aan professionals, bouwde hij op een administratief computersysteem van het Deventer Ziekenhuis de nodige systeemsoftware om niet-lineaire parameters van Pearson III kansdichtheids-verdeling van patiëntgegevens te berekenen met het oog op normaalwaarden. Tussen 1983 en 1996 spendeerde hij naast zijn hoofdbaan alle tijd aan een megaproject: het ontwerpen, bouwen en onderhouden van een dedicated decision support system van een grote maatschappelijke instelling met 1000 werknemers en 4000 clienten. Bij een landelijke scan kreeg deze instelling het predicaat “witte raaf op gebied van informatievoorziening”. Terzelfder tijd was hij ontwerper van een registratiesysteem voor het algemeen maatschappelijk werk, dat in dertig steden door het hele land draaide. In deze periode verdiepte hij zich aan de Utwente in Bestuurskunde. Vervolgens werkte hij een paar jaar (back office) als software engineer voor een internetbedrijf. Rond de eeuwwisseling ging hij meer en meer werk voor de UTwente verrichten, als ontwikkelaar van aansluitingsmodules (afd. Chemische Technologie & ELAN) en met de bouw van een digitale leeromgeving (afd. Instructie-technologie). Ook zijn eerstegraads onderwijsbevoegdheid ANW werd in 2000 aan de UTwente behaald, met astronomie als bijzonder aandachtsveld. In 2003 werd hij uitgenodigd research te doen onder auspiciën van instituut ELAN en vanaf 2004 is Bos parttime gedetacheerd bij dit instituut. In 2004 won hij een Jet-Net-prijs voor een samenwerkingsproject met AKZO-Nobel voortvloeiend uit The Industrial-Educational Partnership. Bos is sinds het einde van de vorige eeuw vice-voorzitter (en interim-voorzitter) van het wetenschappelijk gezelschap Panta (opgericht 1892) en Grandmaster of the International Curmudgeon Lodge of Deventer, The Netherlands. Sinds 1973 is hij zeer gelukkig getrouwd met Evely, de lieftallige moeder van een interaction designer, een fysicus en een medica.

167
PUBLICATIONS PEER-REVIEWED JOURNAL ARTICLES
Bos, A. B. H., Terlouw, C., & Pilot, A. (2008). Het effect van een sensitivering door een pretest op de verwerving van natuurwetenschappelijke begrippen (The effect of pre-test sensitising on the acquisition of science concepts). Tijdschrift voor Didactiek der β-wetenschappen, 25(1&2), 25-50.
Bos, A. B. H., Terlouw, C., & Pilot, A. (2008). Leren door te corrigeren. De leerwinst van de leerlingbeoordelaar bij het nakijken van het werk van medeleerlingen in het voortgezet bètaonderwijs. Pedagogische Studiën, 85, 420-433.
Bos, A. B. H., Terlouw, C., & Pilot, A. (2009). The effect of a pre-test in an interactive, multimodal pre-training system for learning science concepts. Educational Research and Evaluation, xx, xxx-xxx (accepted for publication)
CONFERENCE CONTRIBUTIONS
Bos, A. B. H., Terlouw, C., & Pilot, A. (2005). Met ICT gevoelig maken voor het leren van bètabegrippen. Paper presented at the ORD 2005, Meten en Onderwijskundig Onderzoek, Gent (Belgium).
Bos, A. B. H., Terlouw, C., & Pilot, A. (2006). Het leereffect op de peerassessor van conventioneel en gecomputeriseerd Peer Assessment in voorgezet bèta-onderwijs. ORD 2006, Samen kennis ontwikkelen. Amsterdam: Onderwijscentrum VU.
Bos, A. B. H., Terlouw, C., & Pilot, A. (2007a). The effect of pretest sensitizing in a digital system on the acquisition of science concepts. EARLI 2007. Budapest, Hungary.

168
Bos, A. B. H., Terlouw, C., & Pilot, A. (2007b). Het effect van pretest-sensitisatie bij ontdekkend leren met behulp van een simulatie in het voortgezet onderwijs. Paper presented at the ORD 2007, Zorgvuldig en Veelbelovend Onderwijs, Groningen.
Bos, A. B. H., Terlouw, C., & Pilot, A. (2007c). The learning effect of peer assessors in conventional and computerized peer assessment in pre-university chemistry education, Esera 2007. Malmö University, Malmö, Sweden.
Bos, A. B. H., Terlouw, C., & Pilot, A. (2008). Het leereffect van een peer assessment van een protowetenschappelijke publicatie op de peer-beoordelaar zelf in het voortgezet bèta-onderwijs. Paper presented at the ORD 2008, Licht op Leren, Eindhoven.
BOOKS
Bos, A. B. H. (1982a). Micro-informatica (Vol. 1). Leiden: H.E. Stenfert-Kroese B.V.
Bos, A. B. H. (1982b). Micro-informatica (Vol. 2). Leiden: H.E. Stenfert-Kroese B.V.

169
REFERENCES Abramowitz, M., & Stegun, I. A. (1968). Handbook of mathematical functions (5th ed.). New
York: Dover Publ. Inc.
Ackerman, J. M. (1993). The promise of writing to learn. Written Communication, 10(3), 334-370.
Admiraal, W., Wubbels, T., & Pilot, A. (1999). College teaching in legal education: Teaching method, students’ time-on-task, and achievement. Research in Higher Education, 40(6), 687-704.
Analytical_Chemistry. (2008). Author’s guide to Analytical Chemistry. Retrieved April, 24, 2008, from http://pubs.acs.org/paragonplus/submission/ancham/ancham_authguide.pdf
Anderson, J. R., Corbett, A. T., Koedinger, K. R., & Pelletier, R. (1995). Cognitive tutors: lessons learned. The Journal of the Learning Sciences, 4(2), 167-207.
Arievitch, I. M., & Haenen, J. P. P. (2005). Connecting sociocultural theory and educational practice : Galperin's approach. Educational Psychologist, 40(3), 155-165.
Bais, S. (2004). Nooit meer rechtdoor. Over het wankele evenwicht tussen waarneming en verbeelding. Deventer: Thieme.
Bangert-Drowns, R. L., Hurley, M. M., & Wilkinson, B. (2004). The effects of school-based writing-to-learn interventions on academic achievement: A meta-analysis. Review of Educational Research, 74, 29-58.
Baumol, W. (1967). Macroeconomics of unbalanced growth: The anatomy of urban crisis. American Economic Review, 57, 415-426.
Baumol, W., Blackman, S., & Wolff, E. (1985). Unbalanced growth revisited: Asymptotic stagnancy and new evidence. American Economic Review, 75(4), 806-817.
Benjafield, J. G. (2006). Cognition (3rd ed.). New York: Oxford University Press.
Bereiter, C. (1963). Some persisting dilemmas in the measurement of change. In C. W. Harris (Ed.), Problems in Measuring Change (pp. 3-20). Madison WI: University of Wisconsin Press.
Berliner, D. C. (2002). Educational Research: The hardest science of all. Educational Researcher, 31(8), 18-20.
Berry, D. C., & Broadbent, D. E. (1984). On the relationship between task performance and associated verbalizable knowledge. The Quarterly Journal of Experimental Psychology, 36A, 209-231.
BINAS. (2004). Informatieboek havo/vwo voor het onderwijs in de natuurwetenschappen (Science data book for secondary education). Groningen, The Netherlands: Wolters-Noordhoff.
170
Black, P., & William, D. (1998). Assessment and classroom learning. Assessment in Education., 5(1), 7-74.
Bloom, B. S. (1956). Taxonomy of Educational Objectives. Handbook I: Cognitive Domain. London: Longmans.
Bloom, B. S. (1984). The 2 sigma problem: The search for methods of group instruction as effective as one-to-one tutoring. Educational Researcher, 13, 4-16.
Boekaerts, M., & Simons, P. R. J. (1993). Leren en instructie (Leaning and instruction) (1st ed.). Assen: Dekker en Van de Vegt.
Boekaerts, M., & Simons, P. R. J. (1995). Leren en instructie. Psychologie van de leerling en het leerproces. (Learning and instruction. Psychology of the student and the learning process) (2nd, revised ed.). Assen: Van Gorcum.
Bos, A. B. H., Terlouw, C., & Pilot, A. (2005). Met ICT gevoelig maken voor het leren van bètabegrippen. Paper presented at the ORD 2005, Meten en Onderwijskundig Onderzoek, Gent (Belgium).
Bos, A. B. H., Terlouw, C., & Pilot, A. (2006). Het leereffect op de peerassessor van conventioneel en gecomputeriseerd Peer Assessment in voorgezet bèta-onderwijs, ORD 2006, Samen kennis ontwikkelen. Amsterdam: Onderwijscentrum VU.
Bos, A. B. H., Terlouw, C., & Pilot, A. (2007a). The Effect of Pretest Sensitizing in a Digital System on the Acquisition of Science Concepts., EARLI 2007. Budapest, Hungary.
Bos, A. B. H., Terlouw, C., & Pilot, A. (2007b). The learning effect of peer assessors in conventional and computerized peer assessment in pre-university chemistry education, Esera 2007. Malmö University, Malmö, Sweden.
Bos, A. B. H., Terlouw, C., & Pilot, A. (2007c). A Pretest-Corrected Learning Gain, from http://www.utwente.nl/elan/onderzoek/publicaties/elandoc/2007/2007-004.pdf
Bos, A. B. H., Terlouw, C., & Pilot, A. (2008a). Het effect van een sensitivering door een pretest op de verwerving van natuurwetenschappelijke begrippen (The effect of pre-test sensitising on the acquisition of science concepts). Tijdschrift voor Didactiek der β-wetenschappen, 25(1&2), 25-50.
Bos, A. B. H., Terlouw, C., & Pilot, A. (2008b). Het leereffect van een peer assessment van een protowetenschappelijke publicatie op de peer-beoordelaar zelf in het voortgezet bèta-onderwijs. Paper presented at the ORD 2008, Licht op Leren, Eindhoven.
Bos, A. B. H., Terlouw, C., & Pilot, A. (2008c). Leren door te corrigeren. De leerwinst van de leerlingbeoordelaar bij het nakijken van het werk van medeleerlingen in het voortgezet bètaonderwijs. Pedagogische Studiën, 85, 420-433.
Bos, A. B. H., Terlouw, C., & Pilot, A. (2009). The Effect of a Pre-test in an Interactive, Multimodal Pre-training System for Learning Science Concepts. Educational Research and Evaluation, xx, xxx-xxx.
Bruijns, B. B. (2008). Instructional characteristics of free choice hours. Enschede, The Netherlands: University of Twente.

171
Bulte, A., Klaassen, K., Westbroek, H., Stolk, M., Prins, G., Genseberger, R., et al. (2005). Modules for a new chemistry curriculum. Research on the meaningful relation between contexts and concepts. In P. Nentwig & D. Waddington (Eds.), Making it relevant. Context based learning of science (pp. 273-299). Munster: Waxmann.
Bulte, A., Westbroek, H., de Jong, O., & Pilot, A. (2006). A research approach to designing chemistry education using authentic practices as contexts. International Journal of Science Education, 28(9), 1063-1086.
Campbell, B., Kaunda, L., Allie, S., Buffler, A., & Lubben, F. (2000). The communication of laboratory investigations by university entrants. Journal of Research in Science Teaching, 37(8), 839-853.
Campbell, D. T., & Stanley, J. C. (1963). Experimental and quasi-experimental designs for research. In (pp. 55). Chicago: Rand McNally.
CBS. (2008). Aantal leerlingen in het voltijd voortgezet onderwijs. Voorburg/Heerlen, The Netherlands: Centraal Bureau voor de Statistiek.
CBS. (2009a). Retrieved May, 6, 2009, from http://statline.cbs.nl/StatWeb/search/?Q=historische+cijfers+onderwijs&LA=NL
CBS. (2009b). Statline. Retrieved July, 4, 2009, from http://statline.cbs.nl/
CEVO. (2008). Werkversie Syllabus Scheikunde Havo en Vwo bij het Examenprogramma van Nieuwe Scheikunde.
Chevins, P. F. D. (2005). Lectures replaced by prescribed reading with frequent assessment: enhanced student performance in animal physiology. British Educational E-Journal (Vol. 5, pp. 5-1).
Citogroep. (2009a). Cito Eindtoets Basisonderwijs.
Citogroep. (2009b). Terugblik en resultaten 2009. Retrieved May, 23, 2009, from http://www.cito.nl/po/lovs/eb/bestanden/Cito_EB09_Terugblik.pdf
Cohen, J. (1988). Statistical power analysis for the behavioral science (2nd ed.). Hillsdale, NJ: Lawrence Earlbaum Associates.
Coletta, V. P., & Philips, J. A. (2005). Interpreting FCI scores: Normalized gain, preinstruction scores, and scientific reasoning ability. American Journal of Physics, 73(12), 1172-1182.
Cook, T. D., & Campbell, D. T. (1979). Quasi-experimentation. Design & Analysis Issues for Field Settings. Chicago: Rand McNally College Publishing Company.
Cooper, H. (1998). Synthetizing research, A guide for literature reviews (3rd ed.). Thousand Oaks, CA: Sage Publications.
Cotton, K. (2001). Educational Time Factors. Retrieved Nov. 17, 2007, from http://www.nwrel.org/scpd/sirs/4/cu8.html
Cox, R. (1999). Representation construction, externalised cognition and individual differences. Learning and Instruction, 9, 343-363.
Cronbach, L. J. (1992). Four Psychological Bulletin Articles in Perspective. Psychological Bulletin, 112(3), 389-392.

172
Cronbach, L. J., & Furby, L. (1970). How we should measure "change"- or should we? Psychological Bulletin, 74(1), 68-80.
Davis, M. (2005). Scientific Papers and Presentations, Effective Communication Skills in Science. (2 ed.). San Diego: Academic Press.
Dear, K., & Begg, C. (1992). An Approach for Assessing Publication Bias Prior to Performing a Meta-Analysis. Statistical Science, 7(2), 237-245.
Dochy, F., Admiraal, W., & Pilot, A. (2003). Peer- en co-assessment als instrument voor diepgaand leren : bevindingen en richtlijnen. Tijdschrift voor Hoger Onderwijs, 4.
Dochy, F., Segers, M., & Buehl, M. M. (1999). The relation between assessment practices and outcomes of studies: The case of research on prior knowledge. Review of Educational Research, 69(2), 145-186.
Dochy, F., Segers, M., & Sluijsmans, D. (1999). The use of self-, peer-, and co-assessment in higher education: a review. Studies in Higher Education, 24(3), 331-350.
Driver, R., Asoko, H., Leach, J., Mortimer, E., & Scott, P. (1994). Constructing scientific knowledge in the classroom. Educational Researcher, 23, 5-12.
Dupont, W. D., & Plummer, W. D. (1998). Power and Sample Size Calculations for Studies Involving Linear Regression. Controlled Clinical Trials, 19, 589-601.
Van den Ende, J. (1954). Cijfers op de middelbare school. Paedagogische Studiën, 31, 69-129.
Van Engelenburg, G. (1999). Statistical Analysis for the Solomon Four-Group Design. Enschede: Twente Univ. Faculty of Educational Science and Technology.
Franken, P. W., Kabel-van den Brand, M. A. W., & Korver, E. J. (1998). Chemie Overal (Vol. vwo NG/NT 1). Houten: Educatieve Partners Nederland B.V.
Ghery, F. W. (1972). Does Mathematics Matter ? In A. Welch (Ed.), Research Papers in Economic Education (pp. 142-157): Joint Council on Economic Education.
Gibbs, G., & Simpson, C. (2004). Conditions Under Which Assessment Supports Students’ Learning. Learning and Teaching in Higher Education, 1, 3-31.
Gilbert, J. K. (2006). On the nature of 'context' in chemical education. International Journal of Science Education, 28(9), 957-976.
Glass, G. V. (1976). Primary, secondary, and meta-analysis of research. Educational Researcher, 5(10), 3-8.
Haenen, J. P. P. (2001). Outlining the teaching–learning process: Piotr Gal’perin’s contribution. Learning and Instruction, 11, 157-170.
Hake, R. R. (1998a). Interactive-engagement methods in introductory mechanics courses, from http://www.physics.indiana.edu/~sdi/IEM-2b.pdf
Hake, R. R. (1998b). Interactive-engagement vs. traditional methods: A six-thousand-student survey of mechanics test data for introductory physics courses. American Journal of Physics, 66, 64-74.
Hake, R. R. (2002a). Assessment of Physics Teaching Methods. Paper presented at the Proceedings of the UNESCO-ASPEN Workshop on Active Learning in Physics, Univ. of Peradeniya, Sri Lanka.

173
Hake, R. R. (2002b). Lessons from the physics education reform effort. Ecology and Society, 5(2), 28.
Hake, R. R. (2002c). Assessment of Student Learning in Introductory Science Courses. Paper presented at the 2002 PKAL Roundtable on the Future: Assessment in the Service of Student Learning, Duke University.
Hattie, J. (2008). Visible Learning. A synthesis of over 800 Meta-Analyses Relating to Achievement. London and New York: Routledge - Taylor & Francis Group.
Hattie, J., & Timperley, H. (2007). The power of feedback. Review of Educational Research, 77(1), 81-112.
Hayes, J. R., & Flower, L. S. (1980). Identifying the organization of writing processes. In L. W. Gregg & E. R. Steinberg (Eds.), Cognitive processes in writing: An interdisciplinary approach (pp. 3-30). Hilldale, NJ: Lawrence Erlbaum Associates.
Hays, W. L. (1988). Statistics. Orlando, Fa: Holt, Rinehart and Winston inc.
Hennessy, S., Wishart, J., Whitelock, D., Deaney, R., Brawn, R., Velle la, L., et al. (2007). Pedagogical approaches for technology-integrated science teaching. Computers & Education, 48, 137-152.
Hickey, D. T., Zuiker, S. J., Taasoobshirazi, G., Schafer, N. J., & Michael, M. A. (2006). Balancing Varied Assessment Functions to Attain Systemic Validity: Three is the Magic Number. Studies in Educational Evaluation, 32, 180-201.
Van Hiele, P. M. (1986). Structure and insight, A theory of mathematics education. Orlando: Academic Press, INC.
Hovland, C. I. (1949). A baseline for measurement of percentage change. In P. F. Lazarsfeld & M. Rosenberg (Eds.), The language of social research: a reader in the methodology of social research. (pp. 77-82): Free Press.
Ilic, B., & Craighead, H. G. (2004). Attogram detection using nanoelectromechanical oscillators. Journal of Applied Physics, 95(7), 3694-3703.
De Jong, O., & Taber, S. T. (2007). Teaching and Learning the Many Faces of Chemistry. In S. K. Abell & N. G. Lederman (Eds.), Handbook of Research on Science Education (pp. 631-652). Mahwah, N.J.: Lawrence Erlbaum Ass. Publ.
De Jong, T., & Ferguson-Hessler, M. G. M. (1996). Types and qualities of knowledge. Educational Psychologist, 31, 105-113.
De Jong, T., Van Joolingen, W. R., Swaak, J., Veermans, K. H., Limbach, R., King, S., et al. (1998). Self-directed learning in simulation-based discovery environments. Journal of Computer Assisted Learning, 14, 235-246.
De Jong, T., & van Joolingen, W. R. (1998). Scientific Discovery Learning with Computer Simulations of Conceptual Domains. Review of Educational Research, 68(2), 179-201.
Van Joolingen, W. R., & de Jong, T. (2003). SimQuest: authoring educational simulations. In T. Murray, S. Blessing & S. Ainsworth (Eds.), Authoring Tools for Advanced Technology Educational Software: Toward Cost-Effective Production of Adaptive, Interactive and Intelligent Educational Software: Kluwer Academic Publishers.

174
Keller, J. (2000). How to integrate learner motivation planning into lesson planning: The ARCS model approach, VII Semanario. Santiago, Cuba.
Kellogg, R. T. (2001). Competiton for Working Memory among Writing Processes. American Journal of Psychology, 114(2), 175-191.
Kieft, A. (2006). The effects of adapting writing instruction to students' writing. . Free University of Amsterdam, Amsterdam.
Klein, P. D. (1999). Reopening inquiry into cognitive processes in writing-to learn. Educational Psychology Review, 11(3), 203-270.
Klein, P. D., Piacente-Cimini, S., & Williams, L. A. (2007). The role of writing in learning from analogies. Learning and Instruction, 17(6), 595-611.
Knuth, D. E. (1981). Seminumerical Algorithms. In The Art of Computer Programming (2nd ed., Vol. 2, pp. 116 ff). Reading, Mass.: Addison-Wesley.
Kovac, J., & Sherwood, D. W. (1999). Writing in Chemistry: An Effective Learning Tool. Journal of Chemical Education, 76(10), 1399-1403.
Kramers-Pals, H. (1994). Leren oplossen van verklaringsproblemen in het scheikunde-onderwijs. Unpublished thesis, Universiteit Twente, Enschede.
Kuhlemeier, H., Steentjes, M., & Kleintjes, F. (2003). De gelijkwaardigheid van open en meerkeuzevragen bij wiskunde. Effecten van vraagtype en scoringswijze op gemeten vaardigheden, betrouwbaarheid, moeilijkheid en afnametijd. Arnhem.
Lana, R. E. (1959). Pretest-treatment interaction effects in attitudinal studies. Psychological Bulletin, 56, 293-300.
Lana, R. E. (1960). A further investigation of the pretest-treatment interaction effect. Journal of Applied Psychology, 43, 421-422.
Lana, R. E. (1969). Pretest Sensitization. In Rosenthal & Rosnow (Eds.), Artifacts in Behavioral Research (pp. 93-109). New York: Academic Press.
Lana, R. E., & King, D. (1960). Learning factors as determiners of pretest sensitization. Journal of Applied Psychology, 44, 189-191.
Lasry, N., Levy, E., & Tremblay, J. (2008). Making Memories, Again. Science, 320, 1720.
Lawson, A. (1987). Classroom test of scientific reasoning: Revised pencil-paper edition. Tempe, AZ: Arizona State University.
Marrow, A. J. (1977). The practical theorist: The life and work of Kurt Lewin. (2nd ed.). New York: Teachers College Press.
Mayer, R. E. (2004). Should there be a three-strikes rule against pure discovery learning? American Psychologist, 59(1), 14-19.
Mayer, R. E. (2005a). Cognitive theory of multimedia learning. New York Cambridge University Press.
Mayer, R. E. (2005b). Cognitive theory of multimedia learning. In R. E. Mayer (Ed.), The Cambridge handbook of multimedia learning (pp. 31-48). New York Cambridge University Press.
175
Mayer, R. E. (2005c). Introduction to multimedia learning. In R. E. Mayer (Ed.), The Cambridge handbook of multimedia learning (pp. 1-16). New York Cambridge University Press.
Mayer, R. E. (2005d). Principles for managing essential processing in multimedia learning: segmenting, pretraining, and modality principles. In R. E. Mayer (Ed.), The Cambridge handbook of multimedia learning (pp. 169-182). New York Cambridge University Press.
Mayer, R. E., Mathias, A., & Wetzell, K. (2002). Fostering understanding of multimedia messages through pre-training: evidence for a two-stage theory of mental model construction. Journal of Experimental Psychology: Applied, 8(3), 147-154.
Mayer, R. E., & Moreno, R. (2003). Nine ways to reduce cognitive load in multimedia learning. Educational Psychologist, 38(1), 43-52.
Van der Meij, J., & De Jong, T. (2006). Supporting students’ learning with multiple representations in a dynamic simulation-based learning environment. Learning and Instruction, 16, 199-212.
Van Merriënboer, J. (1997). Training complex cognitive skills (pp. 83-99). Englewood Cliffs, NJ: Educational Technology Publications.
Mettes, C. T. C. W., Pilot, A., & Roossink, H. J. (1981a). Linking factual and procedural knowledge in solving science problems: A case study in a thermodynamics course. instructional Science, 10, 333-361.
Mettes, C. T. C. W., Pilot, A., & Roossink, H. J. (1981b). Teaching and learning problem solving in science. Journal of Chemical Education, 58(1), 51-55.
Moreno, R., & Mayer, R. E. (2007). Interactive multimodal learning environments. Educational Psychology Review, 19, 309-326.
Muller, D., Sharma, M., & Reimann, P. (2008). Raising cognitive load with linear multimedia to promote conceptual change. Science Education, 92(2), 278-296.
Nature. (2008). Formatting guide to authors. Retrieved April, 24 2008, from http://www.nature.com/nature/authors/gta
Neuman, W. L. (1989). Which students learn the most and why? A replication and extension of the Szafran pretest study. Teaching Sociology, 17(1), 19-27.
Nicoll, G., & Francisco, J. (2001). An Investigation of the Factors Influencing Student Performance in Physical Chemistry. Journal of Chemical Education., 78(1), 99-102.
O'Donnell, A. M., & Dansereau, D. F. (2000). Interactive effects of prior knowledge and material format on cooperative teaching. Journal of Experimental Education, 68(2), 101-118.
OESO. (2005). Education at a Glance: OECD indicators. Paris: OESO.
OESO. (2007). Education at a Glance: OECD indicators. Paris: OESO.
Osborne, J., & Hennessy, S. (2003). Literature review in Science Education and the role of ICT: promise, problems and future directions (No. 6). Bristol: NESTA Future Lab.
Oulton, N. (2001). Must the growth rate decline? Baumol's unbalanced growth revisited. Oxford Economic papers, 53, 605-627.
Paivio, A. (1986). Mental Representations: A Dual Coding Approach. Oxford: Oxford Science Publications.

176
Van Parreren, C. (1970). Psychologie van het leren. In (3 ed., Vol. II, pp. 97-104).
Paulides, J. P., & Pilot, A. (1996). SCOOR for Windows. In M. van Geloven & A. Pilot (Eds.), Multimedia in het hoger onderwijs. Groningen: Wolters-Noordhoff.
Penrose, A. M. (1992). To write or nor to write. Effects of task and task interpretation on learning through writing. Written Communication, 9(4), 465-500.
Pieters, J. M., Limbach, R., & De Jong, T. (2004). Designing learning environments: Process analysis and implications for designing an information system. International Journal of Learning Technology, 1(2), 147-162.
Pilot, A., & Bulte, A. M. W. (2006). The use of "contexts" as a challenge for the chemistry curriculum: its successes & the need for further development and understanding. International Journal of Science Education, 28(9), 1087-1112.
Van der Ploeg, F. (2007). Sustainable social spending and stagnant public services : Baumol's cost disease revisited, from http://cadmus.iue.it/dspace/bitstream/1814/7335/1/ECO-2007-34.pdf
Popper, K. R., & Eccles, J. C. (1981). The Self and its brain. Heidelberg, London, New York: Springer International.
Posthumus, K. (1940). Middelbaar onderwijs en schifting. De Gids(104), 24-42.
Prain, V. (2006). Learning from writing in secondary science: Some theoretical and practical implications. International Journal of Science Education, 28(2), 179-201.
Press, W. H. (1989). Numerical Recipes in Pascal. In The Art of Scientific Computing (1st ed., pp. 213-226). Cambridge: Univ. Press.
Qin, Z., Johnson, D. W., & Johnson, R. T. (1995). Cooperative versus competitive efforts and problem solving. Review of Educational Research, 65(2), 129-143.
Rieber, L. P. (2005). Multimedia Learning in Games, Simulations, and Microworlds. In R. E. Mayer (Ed.), The Cambridge Handbook of Multimedia Learning (pp. 549-568). New York: Cambridge University Press.
Rijlaarsdam, G., Van den Berg, H., & Couzijn, M. (2004). Effective learning and teaching of writing. A Handbook of writing in education. (2nd ed.). Boston: Kluwer Academic Publishers.
Ritter, F. E., & Schooler, L. J. (2002). The learning curve. In International encyclopedia of the social and behavioral sciences. (pp. 8602-8605). Amsterdam: Pergamon.
Ritzen, J. (2006). Hoger onderwijs tussen kennis en koopje. TH&MA(1).
Roes, T. (2001). De sociale staat van Nederland. (Vol. 2001-14). Den Haag: SCP.
Roossink, H. J. (1990). Terugkoppelen in het natuurrwetenschappelijk onderwijs, een model voor de docent. Unpublished PhD. dissertation Universiteit Twente, Enschede.
Rumelhart, D., & Norman, D. (1978). Accretion, tuning, and restructuring: Three modes of learning. In J. Cotton & R. Klatzky (Eds.), Semantic factors in cognition (pp. 37-43). Hillsdale, N.J.: Lawrence Erlbaum Associates.

177
Rumelhart, D., & Orthony, A. (1977). The representation of knowledge in memory. In R.C.Anderson, R.J.Siro & W.E.Montague (Eds.), Schooling and the acquisition of knowledge (pp. 99-137). Hillsdale, NJ: Lawrence Erlbaum Associates.
Sadler, D. R. (1989). Formative assessment and the design of instructional systems. Instructional Science, 18, 119-144.
Sadler, P. M., & Good, E. (2006). The impact of self- and peer-grading on student learning. Educational Assessment, 11(1), 1-31.
Scharfenberg, F. J., Bogner, F. X., & Klautke, S. (2006). The suitability of external control-groups for empirical control purposes: a cautionary story in science education research. Electronic Journal of Science Education, 11(1).
Schroeder, B. (2004). Nukleare Mikrobatterien, from http://www.heise.de/bin/tp/issue/r4/dl-artikel2.cgi?artikelnr=18351&zeilenlaenge=72&mode=html
Shadish, W. R., Cook, T. D., & Campbell, D. T. (2002). Experimental and Quasi-Experimental Designs for Generalized Causal Inference. Boston: Houghton Mifflin.
Shayer, M. (2003). Not just Piaget; not just Vygotsky, and certainly not Vygotsky as alternative to Piaget. Learning and Instruction, 13, 465-485.
Simons, P. R. J. (2006). Hoe je een karikatuur van het nieuwe leren om zeep helpt. Pedagogische Studien, 83(1), 81-85.
Simons, P. R. J., van der Linden, A. A. M., & Duffy, T. (2000). New Learning. Dordrecht: Kluwer Academic Publishers.
Simons, P. R. J., & Zuylen, J. G. G. (1995a). Studiehuisreeks. Tilburg: MesoConsult.
Simons, P. R. J., & Zuylen, J. G. G. (1995b). Van zelfstandig werken naar zelf verantwoordelijk leren. [From independent work to self-directed learning] In R. J. Simons & J. G. G. Zuylen (Eds.), De didactiek van leren leren, Studiehuisreeks (Vol. 4). Tilburg: MesoConsult.
Sluijsmans, D., Brand-Gruwel, S., & van Merriënboer, J. (2002). Peer assessment training in teacher education: effects on performance and perceptions. Assessment & Evaluation in Higher Education, 27(5), 443-454.
Sluijsmans, D., Brand-Gruwel, S., van Merriënboer, J., & Martens, R. (2004). Training teachers in peer-assessment skills: effects on performance and perceptions. Innovations in Education and Teaching International, 41(1), 59-78.
Solomon, R. L. (1949). An extension of control group design. Psychological Bulletin, 46, 137-150.
Songer, N. B. (2007). Digital resources versus cognitive tools: A discussion of learning science with technology. In S. K. Abel & N. G. Lederman (Eds.), Handbook of research on science education (pp. 471-491). Mahway, NJ: Lawrence Erlbaum Associates, Inc.
Springer, L., Stanne, M. E., & Donovan, S. E. (1999). Effects of small-group learning on undergraduates in science, mathematics, engineering and technology: A meta-analysis. Review of Educational Research, 69(1), 21-51.
Sternberg, R. J. (2003). The psychologist’s companion. A guide to scientific writing for students and researchers. (4 ed.). Cambridge, UK: Cambridge University Press.

178
Strangman, N., Hall, T., & Meyer, A. (2004). Background knowledge instruction and the implications for UDL implementation. Retrieved October 23 2006 from http://www.cast.org/publications/ncac/ncac_backknowledgeudl.html
Stroustrup, B. (1999). An overview of the C++ programming language. In S. Zamir (Ed.), Handbook of object technology (pp. 1-23). Boca Raton, Florida: CRC Press LLC.
Suski, L., & Banta, T. W. (2009). Assessing student learning: A common sense guide (2nd ed.). Oxford: Wiley.
Sweller, J. (1988). Cognitive load during problem solving: Effects on learning. Cognitive Science, 12, 257-285.
Sweller, J. (2005a). Implications of cognitive load theory for multimedia learning. In R. E. Mayer (Ed.), The Cambridge handbook of multimedia learning (pp. 19-30). New York: Cambridge University Press.
Sweller, J. (2005b). The redundancy principle in multimedia learning. In R. E. Mayer (Ed.), The Cambridge handbook of multimedia learning (pp. 159-167). New York Cambridge University Press.
Terlouw, C. (1987). De FUNDES-procedure in onderwijsontwikkeling. Evaluatie van een procedure van onderwijsontwikkeling voor het leren probleemoplossen. Universiteit Twente, Enschede.
Terlouw, C. (1993). A model for instructional development: integration of theory and practice. In C. Terlouw (Ed.), Instructional development in higher education: theory and practice. Amsterdam: Thesis Publishers.
Terlouw, C., Kramers-Pals, H., & Pilot, A. (2003). Effects of heuristics for monitoring the process of solving and checking explanation problems in chemistry. Paper presented at the ESERA 2003 Conference Research and Quality in Science Education, Noordwijkerhout, The Netherlands.
Terlouw, C., Kramers-Pals, H., & Pilot, A. (2004). Over het leren aanpakken van eindexamenopgaven bij scheikunde in het voortgezet onderwijs. [On learning to solve chemistry final examination assignments in secondary education]. Tijdschrift voor Didactiek der β-wetenschappen, 21(2), 107-144.
Topping, K. (1998). Peer assessment between students in colleges and universities. Review of Educational Research, 68(3), 249-276.
Torrance, M., & Galbraith, D. (2006). The processing demands of writing. In C. A. MacArthur, S. Graham & J. Fitzgerald (Eds.), Handbook of writing research (pp. 67-80). New York: Guildford.
Treagust, D. F. (2007). General instructional methods and strategies. In S. K. Abell & N. G. Lederman (Eds.), Handbook of research on science education (pp. 373-391). Mahwah, NJ: Lawrence Erlbaum Associates.
Tweede_Fase_Adviespunt. (2005). Zeven jaar Tweede Fase, een balans, from www.tweedefase-loket.nl
Tynjälä, P., Mason, L., & Lonka, K. (2001). Writing as a learning tool: integrating theory and practice. In P. Tynjälä, L. Mason & K. Lonka (Eds.), Studies in writing, vol. 7. (Vol. 7, pp. 7-23). Dordrecht: Kluwer Academic Publishers.

179
Valdez, G., McNabb, M., Foertsch, M., Anderson, M., Hawkes, M., & Raack, L. (2000). Computer-based technology and learning: Evolving uses and expectations. (rev. ed.). Oakbrook, IL: NCREL.
Veermans, K. H. (2003). Intelligent Support for Discovery Learning. Universiteit Twente, Enschede.
Vygotsky, L. S. (1978). Mind in society. The development of higher psychological processes. Cambridge, MA: Harvard University Press.
Wadsworth, B. J. (1984). Piaget's theory of cognitive and affective development (3 ed.). White Plains: Longman inc.
Watson, W. M. (2001). Pedagogy before Technology: Re-thinking the Relationship between ICT and Teaching. Education and Information Technologies, 6(4), 251-266.
Wellman, G. S., & Marcinkiewicz, H. (2004). Online learning and time-on-task:: Impact of proctored vs. un-proctored testing. Journal of Asynchronous Learning Networks, 8(4), 93-104.
Werf van der, G. (2006). Oud of nieuw leren? Of liever gewoon leren? Pedagogische Studien, 83(1), 74-81.
De Westelinck, K., Valcke, M., De Craene, B., & Kirschner, P. (2005). Multimedia learning in social sciences: limitations of external graphical representations. Computers in Human Behavior, 2005, 555-573.
Westenberg, P. M. (2008). De jeugd van Tegenwoordig. Leiden, The Netherlands: University of Leiden.
Wilbrink, B. (1985). Toetsen en Testen in het Onderwijs. Den Haag: SVO.
William, D., & Black, P. (1996). Meanings and Consequences: a basis for distinguishing formative and summative functions of assessment? British Educational Research Journal, 22(5), 537-548.
Willson, V. L., & Putnam, R. R. (1982). A meta-analysis of pretest sensitization effects in experimental design. American Educational Research Journal, 19(2), 249-258.
Worthen, B. R., Van Dusen, L. M., & Sailor, P. J. (1994). A comparative study of the impact of integrated learning systems on students' time-on-task International Journal of Educational Research, 21(1), 25-37.
Zimmerman, D. W., Williams, R.H. (2003). A new look at the influence of guessing on the reliability of multiple-choice tests. Applied Psychological Measurement, 27(5), 357-371.
Zoller, U. (1999). Scaling-up of higher-order cognitive skills-oriented college chemistry teaching: An action-oriented Research. Journal of Research in Science Teaching, 36(5), 583-596.
Zoller, U., Tsaparlis, G., Fatsow, M., & Lubezky, A. (1997). Student self-assessment of higher order cognitive skills in college science teaching. Journal of College Science Teaching, 27, 99-101.

180

181
“Educational Evaluation”

182