Oil Security Issues in Asia and the Pacific - Asian ...
52
ADB ECONOMICS WORKING PAPER SERIES OIL SECURITY ISSUES IN ASIA AND THE PACIFIC David Isaak NO. 400 July 2014 ASIAN DEVELOPMENT BANK
-
Upload
khangminh22 -
Category
Documents
-
view
3 -
download
0
Transcript of Oil Security Issues in Asia and the Pacific - Asian ...

ADB ECONOMICSWORKING PAPER SERIES
OIL SECURITY ISSUES IN ASIA AND THE PACIFICDavid Isaak
NO. 400
July 2014
ASIAN DEVELOPmENT BANk

ADB Economics Working Paper Series
Oil Security Issues in Asia and the Pacific
David Isaak
No. 400 2014
David Isaak is a Distinguished Associate at FACTS Global Energy.
asIan deVeloPment Bank

Asian Development Bank6 ADB Avenue, Mandaluyong City1550 Metro Manila, Philippineswww.adb.org
© 2014 by Asian Development BankJuly 2014ISSN 1655-5252Publication Stock No. WPS146578
The views expressed in this paper are those of the author and do not necessarily reflect the views and policies of the Asian Development Bank (ADB) or its Board of Governors or the governments they represent.
ADB does not guarantee the accuracy of the data included in this publication and accepts no responsibility for any consequence of their use.
By making any designation of or reference to a particular territory or geographic area, or by using the term “country” in this document, ADB does not intend to make any judgments as to the legal or other status of any territory or area.
Note: In this publication, “$” refers to US dollars.
The ADB Economics Working Paper Series is a forum for stimulating discussion and eliciting feedback on ongoing and recently completed research and policy studies undertaken by the Asian Development Bank (ADB) staff, consultants, or resource persons. The series deals with key economic and development problems, particularly those facing the Asia and Pacific region; as well as conceptual, analytical, or methodological issues relating to project/program economic analysis, and statistical data and measurement. The series aims to enhance the knowledge on Asia’s development and policy challenges; strengthen analytical rigor and quality of ADB’s country partnership strategies, and its subregional and country operations; and improve the quality and availability of statistical data and development indicators for monitoring development effectiveness.
The ADB Economics Working Paper Series is a quick-disseminating, informal publication whose titles could subsequently be revised for publication as articles in professional journals or chapters in books. The series is maintained by the Economics and Research Department.
Printed on recycled paper

CONTENTS
ABSTRACT
I. INTRODUCTION 1
II. OIl IN CONTExT 2 A. Crude Oil Price Outlook B. Oil Pricing Policies in Asia and the Pacific
III. OIl PRICES 4 A. Crude Oil Price Outlook B. Oil Pricing Policies in Asia and the Pacific
IV. OIl DEMAND 11 A. Composition by Product and End Use B. Outlook
V. OIl SUPPly 22 A. Production Outlook for Developing Asia B. Import Requirements C. The Growing Importance of Product Trade D. Reliance on Middle East Oil Exports E. Crude Quality and Refining Capabilities
VI. CRITICAl ISSUES IN OIl SECURITy 30 A. Traditional and Contemporary Views on Oil Security B. Pricing Policies C. Oil Stocks and Oil-Sharing Agreements D. Gas and Unconventional Gas Sources E. The Challenge of International Maritime Organization Bunker Regulations F. Refinery Configuration as a Security Issue G. Product Specifications as a Security Issue H. Overseas Investment and International Trading I. Destructive Competition? VII. ENERGy AND FINANCIAl MARkETS IN ASIA 39 A. The Futures Market B. Energy Information Administration Energy and Financial Markets Initiative C. Oil Futures Markets in Asia as an Instrument for Security
VIII. SUMMARy OF POlICy RECOMMENDATIONS 42 REFERENCES 44

AbSTrACT
By 2010, demand for oil in developing Asia substantially exceeded that of North America and Europe combined, but demand for natural gas has been expanding rapidly and countries with large coal resources have used them instead of oil wherever possible. The goal of oil security is to make domestic economies and the international market adaptable to changes in availability and price. Increasing oil production and decreasing demand; producing more alternatives; and increasing stocks, fungibility, and market responsiveness augment security while subsidies diminish it. The threat today is not targeted cutoffs; it is price spikes, and strategic reserves can help counter them. lack of specification restricts the free flow of petroleum products and therefore decreases regional energy security; fungibility would be greatly increased if there were some degree of standardization. In 2010, 76% of all Middle East exports went to Asia, but oil from the Middle East and Africa will not satisfy the growing Asian demand. Asian refining capacity cannot, however, cope with the large undeveloped resources in the Americas from super-heavy deposits or tar sands. A flourishing benchmark futures market east of Suez would help to ensure fair pricing and to moderate long-term price fluctuations.
keywords: oil security, energy, Asia and the Pacific
JEl: Q31, Q40, Q41

1Oil Security Issues in Asia and the Pacific
I. IntroductIon
The term “energy security” has meant many things over the decades since the first oil crisis in 1973 and 1974. For most although not all energy analysts, it has come to denote far more than simply tying up a diverse portfolio of crude oil supply contracts. Not all crudes are usable in all refineries, and price impacts can be crippling even if there is no cutoff of supply. Price controls—particularly subsidies—can result in huge economic costs and can cause massive distortions. Furthermore, almost no one consumes crude oil; instead, oil products with various degrees of substitutability with other fuels are consumed. While a political scientist might have been perceived as a good guide to energy security in the 1970s, today energy security demands an understanding of technology, economics, and environmental science in addition to an understanding of politics.
This paper examines oil in the context of other energy sources then moves on to the outlook for oil prices and the implications of current forecasts, the demand for oil and for oil products by sector, fuel substitution and oil supply, the outlook for production in developing Asia, the importance of product trade, reliance on particular regions, and the critical role of refinery capabilities. Finally, oil security is discussed with a focus on specific problems and possible remedies.
II. oIl In context
Almost every graph of energy demand in Asia and the Pacific shows the same general picture: a curve or set of stairs that moves steeply upward. Figure 1 is a standard example and shows the tremendous growth in primary energy demand in developing Asia from 1990 through 2010.
Figure 1: Developing Asian Primary Energy Demand by Source (million tons of oil equivalent)
Source: ADB estimates.
The most prominent feature of the chart is growth. Primary energy demand more than doubled between 1990 and 2010. In 1990, developing Asian demand was about the same as North American demand, but by 2010, demand in developing Asia substantially exceeded that of North America and Europe combined. Furthermore, there was growth in every primary energy source from coal to oil to “others” which in this figure include geothermal, wind, solar, peat, and miscellaneous energy sources, but in developing Asia more than 90% of this is biomass, biofuels, and other agricultural waste. More than half of that bioenergy is from the People’s Republic of China (PRC) alone.
Charts like these are invariably so dominated by the impression of growth that the changes in consumption patterns are often hidden. Rapid growth is happening across all energy sources, but the rates of increase are very different among fuels. Between 1990 and 2010, the use of coal and natural gas nearly tripled, nuclear increased to five times its 1990 level, but oil demand, on the other hand, increased to “only” about 240% of its 1990 level. In other words, although oil showed extraordinary demand growth by standards elsewhere in the world, it showed comparatively restrained growth compared to other fossil fuels or to nuclear energy.
739 920
2,133 419 689
992
155
232
450
480
531
593
-
500
1,000
1,500
2,000
2,500
3,000
3,500
4,000
4,500
5,000
1990 2000 2010
OthersHydroNuclearNatural GasOilCoal
Source: ADB estimates.

2 ADB Economics Working Paper Series No. 400
The most prominent feature of the chart is growth. Primary energy demand more than doubled between 1990 and 2010. In 1990, developing Asian demand was about the same as North American demand, but by 2010, demand in developing Asia substantially exceeded that of North America and Europe combined. Furthermore, there was growth in every primary energy source from coal to oil to “others” which in this figure include geothermal, wind, solar, peat, and miscellaneous energy sources, but in developing Asia more than 90% of this is biomass, biofuels, and other agricultural waste. More than half of that bioenergy is from the People’s Republic of China (PRC) alone.
Charts like these are invariably so dominated by the impression of growth that the changes in consumption patterns are often hidden. Rapid growth is happening across all energy sources, but the rates of increase are very different among fuels. Between 1990 and 2010, the use of coal and natural gas nearly tripled, nuclear increased to five times its 1990 level, but oil demand, on the other hand, increased to “only” about 240% of its 1990 level. In other words, although oil showed extraordinary demand growth by standards elsewhere in the world, it showed comparatively restrained growth compared to other fossil fuels or to nuclear energy.
The result has been a dramatic shift in the composition of primary energy demand. Figure 2 puts this shift in the context of Europe and North America and of latin America, another rapidly developing region.
Figure 2: Primary Energy Demand by Region
(% by Source)
The result has been a dramatic shift in the composition of primary energy demand. Figure 2 puts this shift in the context of Europe and North America and of Latin America, another rapidly developing region.
Figure 2: Primary Energy Demand by Region
(% by Source)
Sources: ADB estimates; British Petroleum (BP). 2012. BP Statistical Review of World Energy June 2011. London; International Energy Agency (IEA) 2012a. Energy Balances of OECD Countries. Paris: Organisation for Economic Co-operation and Development (OECD) and IEA; IEA. 2012b. Energy Balances of Non-OECD Countries. Paris: OECD and IEA.
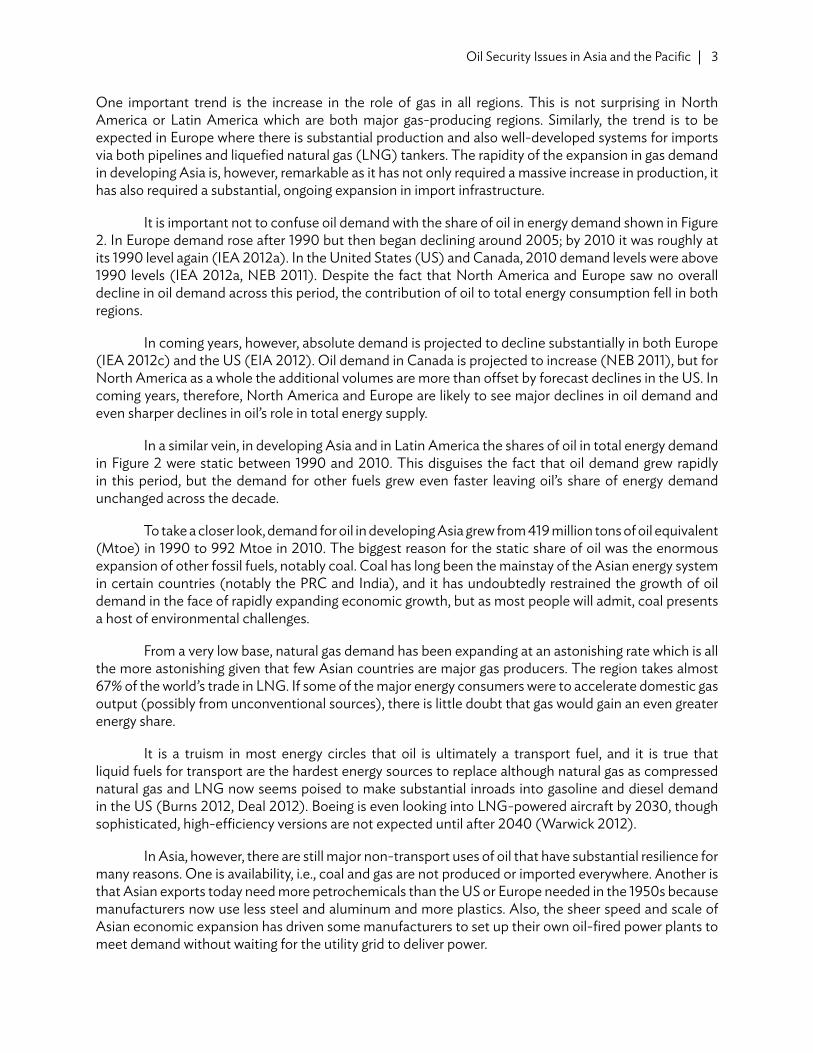
One important trend is the increase in the role of gas in all regions. This is not surprising in North America or Latin America which are both major gas-producing regions. Similarly, the trend is to be expected in Europe where there is substantial production and also well-developed systems for imports via both pipelines and liquefied natural gas (LNG) tankers. The rapidity of the expansion in gas demand in developing Asia is, however, remarkable as it has not
22%28%
4%
40%
20% 16%5%
49%
41%37%
45%
23%
37%33%
45%
23%
23% 16%
16%
8%26%
26% 22%
10%
8% 13%
1%
9%
13% 3%
9%
26%
4% 4%
25% 26%
5% 9% 14%
0%
10%
20%
30%
40%
50%
60%
70%
80%
90%
100%
OthersHydroNuclearNatural GasOilCoal
|------- 1 9 9 0-------| |------- 2 0 1 0-------|
Sources: ADB estimates; British Petroleum (BP). 2012. BP Statistical Review of World Energy June 2011. london; International Energy Agency (IEA) 2012a. Energy Balances of OECD Countries. Paris: Organisation for Economic Co-operation and Development (OECD) and IEA; IEA. 2012b. Energy Balances of Non-OECD Countries. Paris: OECD and IEA.
3Oil Security Issues in Asia and the Pacific
One important trend is the increase in the role of gas in all regions. This is not surprising in North America or latin America which are both major gas-producing regions. Similarly, the trend is to be expected in Europe where there is substantial production and also well-developed systems for imports via both pipelines and liquefied natural gas (lNG) tankers. The rapidity of the expansion in gas demand in developing Asia is, however, remarkable as it has not only required a massive increase in production, it has also required a substantial, ongoing expansion in import infrastructure.
It is important not to confuse oil demand with the share of oil in energy demand shown in Figure 2. In Europe demand rose after 1990 but then began declining around 2005; by 2010 it was roughly at its 1990 level again (IEA 2012a). In the United States (US) and Canada, 2010 demand levels were above 1990 levels (IEA 2012a, NEB 2011). Despite the fact that North America and Europe saw no overall decline in oil demand across this period, the contribution of oil to total energy consumption fell in both regions.
In coming years, however, absolute demand is projected to decline substantially in both Europe (IEA 2012c) and the US (EIA 2012). Oil demand in Canada is projected to increase (NEB 2011), but for North America as a whole the additional volumes are more than offset by forecast declines in the US. In coming years, therefore, North America and Europe are likely to see major declines in oil demand and even sharper declines in oil’s role in total energy supply.
In a similar vein, in developing Asia and in latin America the shares of oil in total energy demand in Figure 2 were static between 1990 and 2010. This disguises the fact that oil demand grew rapidly in this period, but the demand for other fuels grew even faster leaving oil’s share of energy demand unchanged across the decade.
To take a closer look, demand for oil in developing Asia grew from 419 million tons of oil equivalent (Mtoe) in 1990 to 992 Mtoe in 2010. The biggest reason for the static share of oil was the enormous expansion of other fossil fuels, notably coal. Coal has long been the mainstay of the Asian energy system in certain countries (notably the PRC and India), and it has undoubtedly restrained the growth of oil demand in the face of rapidly expanding economic growth, but as most people will admit, coal presents a host of environmental challenges.
From a very low base, natural gas demand has been expanding at an astonishing rate which is all the more astonishing given that few Asian countries are major gas producers. The region takes almost 67% of the world’s trade in lNG. If some of the major energy consumers were to accelerate domestic gas output (possibly from unconventional sources), there is little doubt that gas would gain an even greater energy share.
It is a truism in most energy circles that oil is ultimately a transport fuel, and it is true that liquid fuels for transport are the hardest energy sources to replace although natural gas as compressed natural gas and lNG now seems poised to make substantial inroads into gasoline and diesel demand in the US (Burns 2012, Deal 2012). Boeing is even looking into lNG-powered aircraft by 2030, though sophisticated, high-efficiency versions are not expected until after 2040 (Warwick 2012).
In Asia, however, there are still major non-transport uses of oil that have substantial resilience for many reasons. One is availability, i.e., coal and gas are not produced or imported everywhere. Another is that Asian exports today need more petrochemicals than the US or Europe needed in the 1950s because manufacturers now use less steel and aluminum and more plastics. Also, the sheer speed and scale of Asian economic expansion has driven some manufacturers to set up their own oil-fired power plants to meet demand without waiting for the utility grid to deliver power.
4 ADB Economics Working Paper Series No. 400
The famous energy economist Paul Frankel observed that the important thing to understand is that oil is a liquid (Frankel 1946). This seems obvious, but it is profound. Oil is easy to store and is the easiest fossil fuel to transport. Unlike coal, it can be pumped from place to place, and unlike gas it does not have to travel under continuous pressure. Add to this the fact that one oil product or another can do anything that other fuels can do and it is no wonder that oil demand continues to grow in Asia. That said, given its expense and its political nature, it is also not at all surprising that other sources of energy in Asia are growing faster.
The danger with oil continues to be that its production costs are typically a small percentage of its market price. With prices today over $100/barrel, there are still fields with production (“lifting”) costs under $10/barrel (EIA 2009). While it is true than in some cases the cost of finding low-cost oil adds substantially to the true cost, those upfront costs are “sunk costs” and do not determine when the field will be withdrawn from production. Even if finding and developing costs are included, production costs can still be a small fraction of the market price. In contrast, for most renewables, some coal, and much new lNG, production costs are a large percentage of the market price. In the past, this meant that oil prices could slump substantially without curtailing production and could ruin the economics of many competing energy sources. Most policy makers worry about how high oil prices might go, but one of the big questions is how low oil prices can go over a prolonged period.
III. oIl PrIces
A. Crude Oil Price Outlook
In the last few years, most forecasts showed a slow and steady upward climb toward $120–$150/barrel in 2030, although some had higher-case alternatives. More recently, sentiments have changed. Although many of the forecasts still point to prices of $130/barrel or more in 2030, many are now looking at a near-term easing or even decline across the rest of the present decade.
Figure 3 shows the US Energy Information Administration (EIA) current forecast (EIA 2012); the FACTS Global Energy (FGE) most recent forecasts (FGE 2012a, 2012b); and the International Energy Agency (IEA) forecasts from the World Energy Outlook 2012 (IEA 2012c). It should be noted that these forecasts all operate on a slightly different basis. For EIA, it is the weighted average import price into the US; for IEA it is the weighted average import price into IEA members; for FGE, it is the market price of Dubai crude. These forecasts therefore differ significantly even in historical years such as 2010 and 2011.

5Oil Security Issues in Asia and the Pacific
Figure 3: Recent Crude Oil Price Forecasts (2011 $/barrel)
EIA = Energy Information Administration, FGE = FACTS Global Energy, IEA = International Energy Agency, US = United States.
Sources: Government of the United States, Energy Information Administration (EIA). 2012. Annual Energy Outlook 2012. Washington, DC; IEA. 2012c. IEA World Energy Outlook 2012. Paris: OECD and IEA; FACTS Global Energy (FGE). 2012a. Spring 2012 Asia–Pacific Oil Databook I: Supply, Demand, & Prices. london; and FGE. 2012b. Fall 2012 Asia–Pacific Oil Databook I: Supply, Demand, & Prices. london
Earlier forecasts from the Organization of the Petroleum Exporting Countries (OPEC) also foresaw prices in the $85–95/barrel range through the end of the decade (IEF 2012) though the most recent OPEC forecasts have become somewhat more bullish. The World Bank (2013b) sees a slow decline of prices through 2015. The near-term softness in the market foreseen in many projections is due to a number of factors. One is high prices suppressing demand; another is the boom in shale-based light crudes in the US foreseen by both IEA and EIA (IEA 2012, EIA 2012). A final factor is changing demand in the developed world. New energy-efficiency fleet standards (Bastani, Heywood, and Hope 2012),
hybrid cars, and alternative fuels are all cutting into demand in Europe and North America. The legendary invincibility of growth in US demand for gasoline has proved to be an illusion. Demand has been on a slow downward trend since 2007; many expect that trend to accelerate. The emergence of the US as a major gasoline exporter has been a consequent surprise (EIA 2012).
Is there a floor price for oil? There must be, but it is easy to quarrel about how it is set; many assessments have been wrong in the past. Until recently, the EIA attempted to assess the upstream costs of producing conventional oil and gas in major regions around the world (Table 1). One problem with interpreting the numbers is that the costs of both gas and oil are mixed together, but since they

6 ADB Economics Working Paper Series No. 400
are often co-produced this is arguably a better indicator than a methodology that attempts to attribute production costs between the two. One of the benefits of the EIA approach is that it separates lifting costs (the actual cost of operations) from the original exploration and development (finding costs). Both of these are important, but over a span of a few years, it is the lifting costs that determine the minimum price of oil.
Table 1: Energy Information Administration Assessment of Conventional Oil and Gas Production Costs, 2011 ($ per barrel of oil equivalent)
Lifting Costs Finding Costs Total Upstream Costs
United States – Average 12.77 22.63 35.40
Onshore 13.35 19.55 32.90Offshore 10.58 43.52 54.10
All Other Countries – Average 10.43 15.86 26.30
Canada 13.31 12.66 25.96Africa 10.81 36.71 47.52Middle East 10.37 7.33 17.70Central & South America 6.51 21.42 27.93
Note: Energy Information Administration’s 2009 dollars were converted to 2011 dollars by the author. Source: Government of the United States, Energy Information Administration (EIA). 2009. How much does it cost to produce crude oil and natural gas? Frequently Asked Questions.
As the table shows, the total upstream costs vary from $17.70 to $54.10/barrel, but the actual operating costs (lifting costs) for conventional oil are still all below $15/barrel which is not much of a floor in the shorter term. What complicates the picture is that unconventional oil—oil sands, bitumens, and shale liquids—now contribute a significant and growing percentage of world oil supply.
IEA has compiled estimates of production costs for oil including unconventional oil and oil from new production regimes (Table 2). Although they do not break out lifting costs, they do suggest that even very common practices such as enhanced oil recovery have significantly higher prices than the classic oilfields of the Middle East.

7Oil Security Issues in Asia and the Pacific
Table 2: International Energy Agency Estimates of Oil Production Costs, 2011 ($/barrel)
Oil sourceProduction cost($/barrel range)
Middle East/North Africa oilfields 6 29Other conventional oilfields 6 41CO2-enhanced oil recovery 6 84Deep/ultra deep-water oilfields 33 68Enhanced oil recovery 33 86Arctic oilfields 33 104Heavy oil/bitumen 33 71Oil shales 54 118
CO2 = carbon dioxide.
Note: International Energy Agency’s 2008 dollars were converted to 2011 dollars by the author. Source: International Energy Agency (IEA). 2008. IEA World Energy Outlook 2008. Paris: Organisation for Economic Co-operation and Development (OECD) and IEA.
Bernstein Research (Mackenzie 2012) has studied the costs of the top 50 listed oil and gas companies and has concluded that the marginal cost of oil production has now reached more than $90/barrel. If demand is strong, this marginal cost strongly influences the price and also may be a good indicator of longer-term pressures, but this says little about how far prices can drop over a shorter-term horizon. Marginal costs are also very reflective of miscalculations—projects that cost more than expected—and of strategic investments or experimental production schemes.
Hydrofracturing (fracking) shale introduces a new factor into the market. Unlike conventional oil development when exploration costs can be very high, much of the cost of fracking is operational. The overall costs are estimated at $50–$70/barrel in the US (Bullis 2012), but the exploration costs are a small proportion of this. This argues that if costs were to fall toward shale liquid production costs that the supply response would be fairly swift and would tend to drive prices back up. If liquids from shale grow as many now predict, they may offer a new and more responsive floor. This would seem to argue that oil prices are likely to stay above $70/barrel in the longer term; the total production costs shown in Table 2 suggest that there are longer-term pressures that will tend to draw prices upward.
Under this outlook, it seems unlikely that oil will severely challenge alternatives on a prolonged basis although some renewable energy projects may come under pressure. At the same time, the likelihood that oil prices will soar above $150/barrel for long periods also seems improbable. The most likely outlook at present is that the world is in for an extended period of high—but not necessarily climbing—oil prices.
B. Oil Pricing Policies in Asia and the Pacific
A comprehensive analysis of oil pricing policies in the region would comprise a major study. Over the years, many Asian economies created two problems with their pricing policies. First, many have had subsidized/controlled oil prices that encourage excess consumption and place large financial demands on the central government. Second, governments have often adopted differential fuel pricing policies that have had unintended consequences.

8 ADB Economics Working Paper Series No. 400
The problems with subsidized energy prices are most obvious in energy importers: When world prices rise, governments find that the costs can become crippling. Direct subsidies from government coffers are not the only problem. Some countries that have encouraged international oil companies to develop refineries locally discovered that no one is willing to build a refinery and import crude oil at market prices when faced with a controlled market in domestic products.
Subsidies face a political conundrum. When oil prices are low, it seems like the ideal time to remove subsidies as the relative impact would be low, but it is also easy for the government to pay for subsidies. When prices rise steeply, eliminating subsidies has a greater impact on consumers. Very few countries are willing to emulate the PRC in 2008 and launch price reforms in the middle of an oil price spike.
Subsidies are often explained as a means of ensuring energy for the poor. While this is a laudable goal, subsidizing prices for everyone to benefit a single group is inefficient and encourages overconsumption. Most economists would argue that giving the poor cash to spend as they wish is the only efficient means of helping them though such a scheme is easier to propose than to implement. In any case, most governments are now aware that subsidies are problematic and most that still subsidize energy prices are trying to move toward market pricing.
Differential pricing is a constant temptation for policy makers; in many ways it is more insidious economically than subsidies. There have been many examples in Asia over the years. For instance, Indonesia’s low kerosene prices began as an effort to encourage low-income households to burn kerosene instead of cutting down the forest for firewood, but producers had to add massively expensive hydrocrackers to refineries to keep pace with demand, and at one point, the electric utility was burning kerosene to generate power. A similar situation emerged when Thailand kept kerosene prices low for similar reasons. Enterprising Thais soon figured out they could buy cheap kerosene, convert it into diesel fuel, and then sell the diesel at much higher prices.
Most of the more egregious differential pricing policies have been corrected although subsidies on household liquefied petroleum gas (lPG) may become a problem in coming years. Subtle and not-so-subtle problems like duties, however, remain. It is not uncommon for finished products to face high duties while “refinery feedstock” faces much lower ones. This means that some refiners have imported “reduced crude” as a feedstock and promptly resold it as fuel oil. Some refiners have even bought diesel on the external market, converted it into fuel oil, imported the mixture as a heavy feedstock for distillation, and then distilled the diesel back out at a much lower cost than importing the diesel directly. Many governments have decided that diesel is a “productive” use of energy while gasoline is a “consumptive” use of energy and have priced them accordingly. As might be expected, the result is usually an influx of diesel-powered passenger cars. The point is that differential pricing can easily distort both demand and business decisions. keeping oil prices below external market prices is a recipe for serious fiscal problems and for driving up demand. A government is certainly justified in keeping oil prices above external market prices to dampen demand or to internalize perceived externalities, but deviating significantly from external market prices can also have insidious consequences.
Figure 4 shows gasoline and diesel pump prices in selected Asian Development Bank (ADB) members and a few Western countries. The US has no policy on differential pricing and also has comparatively low crude prices and highway taxes. It therefore offers a kind of reference case: no subsidies and no policy-based pricing. In principle, one would expect that diesel would cost more per gallon or barrel than gasoline since diesel has more energy per unit of volume, but pricing seldom reflects

9Oil Security Issues in Asia and the Pacific
this. Except in Pakistan, the United kingdom (Uk), and the US, gasoline is always priced at a higher rate—often much higher. There is no obvious connection between these policies and levels of development: Bangladesh; Hong kong, China; and New Zealand all share this policy. One thing that is notable, however, is that there is a definite correlation between being a crude exporter and maintaining low pump prices. While the pump prices are not outrageously low (as in Saudi Arabia or Venezuela), it is notable that six of the seven countries with the lowest prices are Brunei Darussalam, Indonesia, kazakhstan, Azerbaijan, Malaysia, and Viet Nam. Domestic pricing policies are not often thought of as energy-security issues, but they have a significant effect on them. Artificially low prices eat away at domestic energy supplies or in the case of importing countries push their imports to higher levels. In addition to the general level of pricing, a pattern of pricing that is not related to the prevailing relationships on the external market can produce all manner of distortions that make it difficult for governments to manage their energy infrastructures or to respond to external market changes.

10 ADB Economics Working Paper Series No. 400
Figure 4: World Bank Pump Prices for Selected Countries, 2010 ($/barrel)
PRC = People’s Republic of China.Source: World Bank. 2013a. World Development Indicators.

11Oil Security Issues in Asia and the Pacific
IV. oIl demand
A. Composition by Product and End Use
Statistics on the demand for oil today are quite good in terms of consumption by product, but numbers by sector are much less precise as they are gathered from domestic sources and governments use different classification systems. Transport and power are the two sectors that are generally well defined although certain aspects of power generation get mixed with the industry sector at times. Despite the imprecise nature of the data, use patterns by sector are vital for projecting future total demand. The FACTS Global Energy (FGE) data system draws on both standard sources such as the Beyond 20/20 (B2020) of the International Energy Agency (IEA) system as well as domestic statistics and on contributions from local specialists, but the numbers are far from perfect and are constantly revised. That said, it is hard to understand where growth will occur and where there are opportunities for substitution without relying on these estimates.
Asia is the most diverse region in the world, so there are exceptions to most generalizations. There are, however, some features that separate Asia as a whole from other regions. The role of coal is the most obvious example, but there are also differences in end uses of oil that set Asia apart from the Euro–American paradigm that tends to dominate energy analysis. A qualitative description of the Euro–American paradigm would probably include the following beliefs.
• The least substitutable use for oil is in transport; therefore, the transport share of the energy use of a barrel tends to be 67% or more.
• Power is the most substitutable use for oil, so oil tends to get driven out of power.
• Industrial uses of oil are also readily driven out.
• The direct use of oil in the residential and commercial sector is minor and declining.
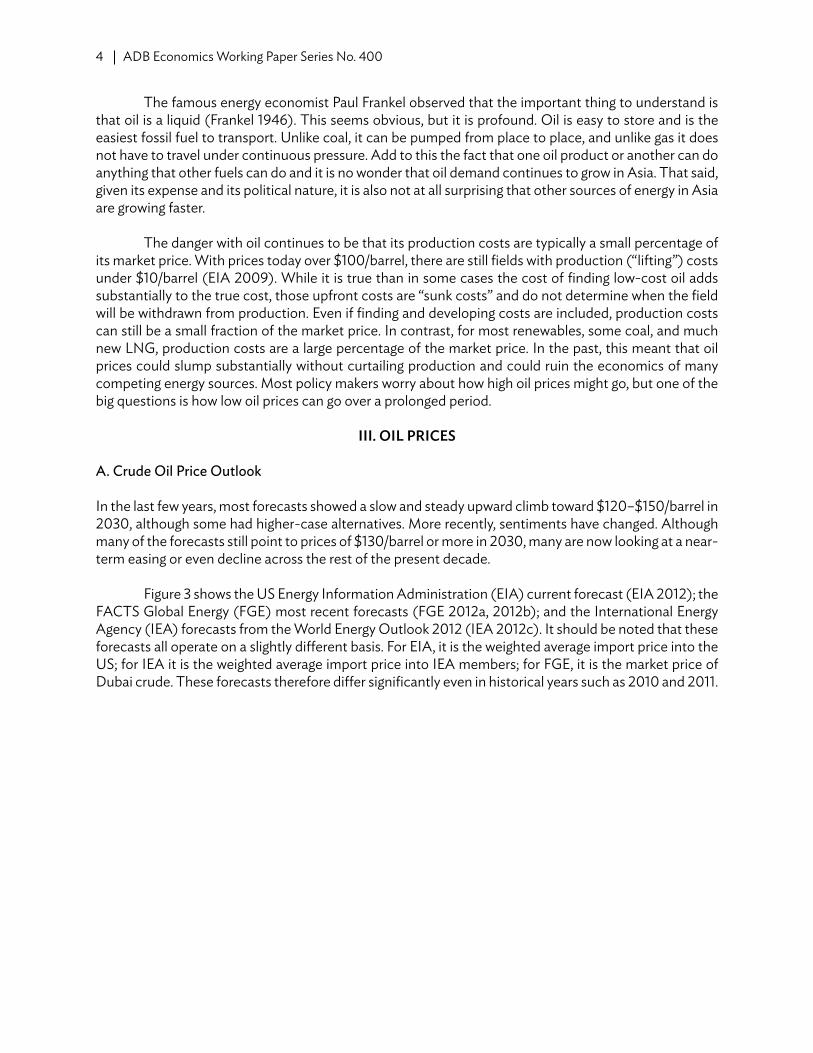
Figure 5 illustrates many of the characteristics of Asian oil demand that deviate from the paradigm as well as some that agree with it. The share of oil in the power sector has been severely squeezed since 1980 although its absolute volume grew through 2000. After 2000, its share and its volume both fell. Despite this, it is difficult to drive oil out of power altogether in rapidly developing economies; non-oil utility power supplies are often countered by local or private generation to support new industries or communities. This can be seen most readily in the People’s Republic of China (PRC) where the use of oil as fuel in utilities is virtually zero, but in remote areas or in new industrial developments, oil is still burned; this pattern may persist for many years. These users may switch from oil as alternatives become available or as utility supplies expand, but new users without access to alternatives or utility supplies will probably emerge. The power sector share of oil demand will probably continue to decline, but the fall in the absolute volume of oil demanded will be relatively slow.
Oil in transport (including international bunkers) has indeed grown steadily in both volume and share, but it is only recently that transport has approached half of Asian demand. The industrial use of oil has seen steady growth and since 1990 has even increased its share of demand. (Industrial use here includes heavy construction and therefore picks up “other” products such as bitumen.) Most of this is not, however, conventional industrial heat or engine power. Currently about 50% is petrochemical feedstock and another 25% is products such as lubes, waxes, and bitumen. Process heat and similar traditional industrial uses of oil are generally flat in volume terms and account for only about 25% of
12 ADB Economics Working Paper Series No. 400
industrial use. Although this segment of industrial demand will tend to be pushed out by alternatives, vigorous growth in feedstock and “other” uses is expected (FGE 2012c).
A surprising feature of the Asian market to many is the steady growth in residential and commercial uses of oil. This sector maintained a relatively steady share of demand and even increased its share from 1990 to 2000. There has recently been a decline, but the absolute volume continues to grow as demand increased by 3.3% annually from 2000 to 2010. This aggregation hides many different kinds of uses, but the dominant ones are middle distillates for space heating in East Asia (especially in the Republic of korea) and cooking and lighting fuels (mostly liquefied petroleum gas and kerosene) in many developing countries (IEA 2012d, 2012e).
Figure 5: Oil Demand by Sector in Developing Asia, 1970–2010 (1,000 barrels/day)
0
5,000
10,000
15,000
20,000
25,000
1970 1980 1990 2000 2010
Others
ResCom
Power
Transport
Industry
31%
12%
11%
40%
42%
48%
26%29%
11%
6%
27%
24%
31%
28%
14%
10%
11%18%
36%
10%
ResCom = residential and commercial sector. Sources: International Energy Agency (IEA). 2012d. Energy Statistics of OECD Countries. Paris: OECD and IEA; IEA. 2012e. Energy Statistics of Non-OECD Countries. Paris: OECD and IEA; and, FACTS Global Energy (FGE). 2012c. FGE Databook Database System. london.
It is reasonable to ask if most of these contrasts with the Euro–American paradigm are not simply the result of stages of development, i.e., as developing Asian economies become richer, would they not also begin to fit the Euro–American mold? The answer is yes and no. Australia and New Zealand not only fit the Euro–American paradigm but are even ahead of the curve. Shares of transport in total oil demand are currently around 76% in Australia and 88% in New Zealand. Oil for power generation and for residential and commercial use is nearly nonexistent, and industrial use is small and declining (IEA 2012a).
The situation in Japan is quite different. The share of oil for power generation to total oil was low prior to the Fukushima nuclear accident, but oil in industry has always been important. In 2010, industry

13Oil Security Issues in Asia and the Pacific
still accounted for more than 33% of demand—a higher share than in developing Asian countries. Most is for petrochemical feedstock—a demand not easily substituted by other energy sources. The residential and commercial use of oil has also been high in Japan at times accounting for nearly 20% of demand. This has been restrained by greater use of other fuels—primarily gas from liquefied natural gas imports and substituting electricity for fossil fuels (IEA 2012a).
Transport’s share of oil demand in Japan is still well below 50% in part because they drive less than Americans and Australians, but it is also because they use so much more oil in other sectors notably in industry. Petrochemical production, particularly chemicals from naphtha, is a relatively non-substitutable use of oil as are many of the other minor inputs into industrial uses such as lubes and waxes. In Japan and in the Republic of korea, oil is indeed being driven out of the power sector, and as gas reticulation expands, it will slowly be pushed out of the residential and commercial sector as well. The general pattern of demand in these two countries is nevertheless distinctly Asian rather than Western. Indeed, as Figure 6 shows, there is a good argument for an “Asian” and even an “East Asian” pattern of oil demand by sector. Australia and New Zealand fit the Euro–American paradigm perfectly, but they are extreme outliers in the overall picture. Overall, the pattern in the PRC looks a good deal like that in Japan. In some ways, this should not be too surprising. The PRC adopted the same essential strategies of export-led, manufacturing-based growth that were pioneered by Japan and developed further by the Republic of korea. Since this strategy was adopted in a very different oil price environment, however, the PRC has moved directly to a pattern that is quite similar to its Northeast Asian neighbors.
Figure 6: Asian Oil Demand by Sector and Grouping, 2010 (% share)
8
34 34 29
8242 44 50
7 57
15 13 96 4 4
0
20
40
60
80
100
ANZ Japan PRC OtherDeveloping Asian
Countries
Others
ResCom
Power
Transport
Industry
ANZ = Australia and New Zealand, PRC = People’s Republic of China, ResCom = Residential and commercial sector. Sources: International Energy Agency (IEA). 2012d. Energy Statistics of OECD Countries. Paris: OECD and IEA; IEA. 2012e. Energy Statistics of Non-OECD Countries. Paris: OECD and IEA; and, FACTS Global Energy (FGE). 2012c. FGE Databook Database System. london.

14 ADB Economics Working Paper Series No. 400
Liquefied Petroleum Gas (LPG)
lPG is one of two “refined products” that are often derived from the primary production of oil or even gas rather than from refining. lPG production from primary sources has been expanding rapidly in the Middle East and is now the main source of lPG exports from that region. lPG now accounts for about 9% of all oil-product demand in developing Asia. Over the last decade, lPG demand expanded more rapidly than overall oil demand at 6.1% per annum (IEA 2012d, 2012e; FGE 2012c).
lPG is used in many different sectors. Small amounts have been burned in the power sector sometimes as the most readily available fuel and sometimes to meet emission standards (the latter primarily in Japan). By far the largest use of lPG in developing Asia is in the residential and commercial sector; it consumes 67% and its share is steadily growing (Figure 7). In many economies, this is the result of deliberate policies to encourage substituting cheaper lPG for scarce domestic kerosene or to switch away from biomass to prevent deforestation.
The industrial use of lPG is complex and is steadily falling; there is scope for more to be pushed out if alternatives such as gas are available. As the price of naphtha has risen, lPG as a petrochemical feedstock has grown rapidly (14% per annum over the last decade). This growth is likely to continue but at much lower rate; most of this expansion in use has been as a co-feed with naphtha, and most existing units are now taking as much lPG as they can manage. There will be additional growth as a feedstock, but new increments of demand for lPG as chemical feed already require substantial capital investments (Chung 2013). lPG is now supplementing rather than displacing naphtha.
Figure 7: Liquefied Petroleum Gas Demand by Sector in Developing Asia, 2010 (% share)
Sources: International Energy Agency (IEA). 2012d. Energy Statistics of OECD Countries. Paris: OECD and IEA; IEA. 2012e. Energy Statistics of Non-OECD Countries. Paris: OECD and IEA; and, FACTS Global Energy (FGE). 2012c. FGE Databook Database System. london.

15Oil Security Issues in Asia and the Pacific
At one time, lPG was a major emerging transport fuel especially for fleet vehicles such as taxis. Growth continues in this area, but the dominant and growing use by far is in the residential and commercial sector. The PRC, India, and Indonesia among others have turned to lPG as cooking fuel to dampen what seemed like an uncontrollable surge in kerosene demand.
Naphtha
Naphtha is used almost solely in the industry sector although India has at times burned naphtha in gas turbines for power generation. Apart from a small volume blended to solvents, the main use is feed to ethylene crackers. Naphtha in 2010 accounted for about 15% of all oil product demand in Asia—the third largest exceeded only by diesel and gasoline (IEA 2012d, 2012e; FGE 2012c). Naphtha demand has grown at 7.8% per annum over the last decade. The engine of this growth has been the PRC where naphtha demand increased from 344,000 barrels/day in 2000 to more than 1.1 million barrels per day in 2010. Other newer producers such as Singapore and Thailand have also seen rapid growth, and the petrochemical sector in the Republic of korea continues to expand.
Naphtha feedstock is only somewhat substitutable. Ethane from natural gas can be cracked into ethylene, but this does not produce the valuable propylene or butylene by-products needed for more advanced plastics and rubbers. lPG can produce propylene and butylene, but only heavier feedstock produces substantial volumes of the by-product “pyrolysis gasoline,” which is the main source of aromatic building blocks in petrochemicals.
Gasoline
Most accept the generalization that gasoline is solely a transport fuel, and this is approximately true, but it is also an important fuel for some farm machinery and agricultural equipment. There is no clean line between the two sectors. As mentioned previously, gasoline has faced considerable price discrimination in many Asia economies as a consumptive fuel. Faced with a “middle distillate bulge” in the barrel, many governments began moderating this price discrimination in the 1990s, and gasoline demand began to grow more rapidly. In 2010, gasoline demand accounted for 17% of oil-product demand and had grown by 5.6% per annum over the previous decade. While this growth rate is expected to moderate as development in Asia proceeds, gasoline’s share of the barrel is expected to increase though not nearly to the levels seen in North America or Australia (FGE 2012b).
Jet Fuel
Jet fuel by definition should be purely for transport otherwise it should be classed as kerosene. In 2010, jet fuel made up only about 5% of Asian demand (less than lPG) but had a high growth rate from 2000 of 6% per annum. The demand for jet fuel is expected to grow significantly and to increase its share of the barrel (FGE 2012b).
Kerosene
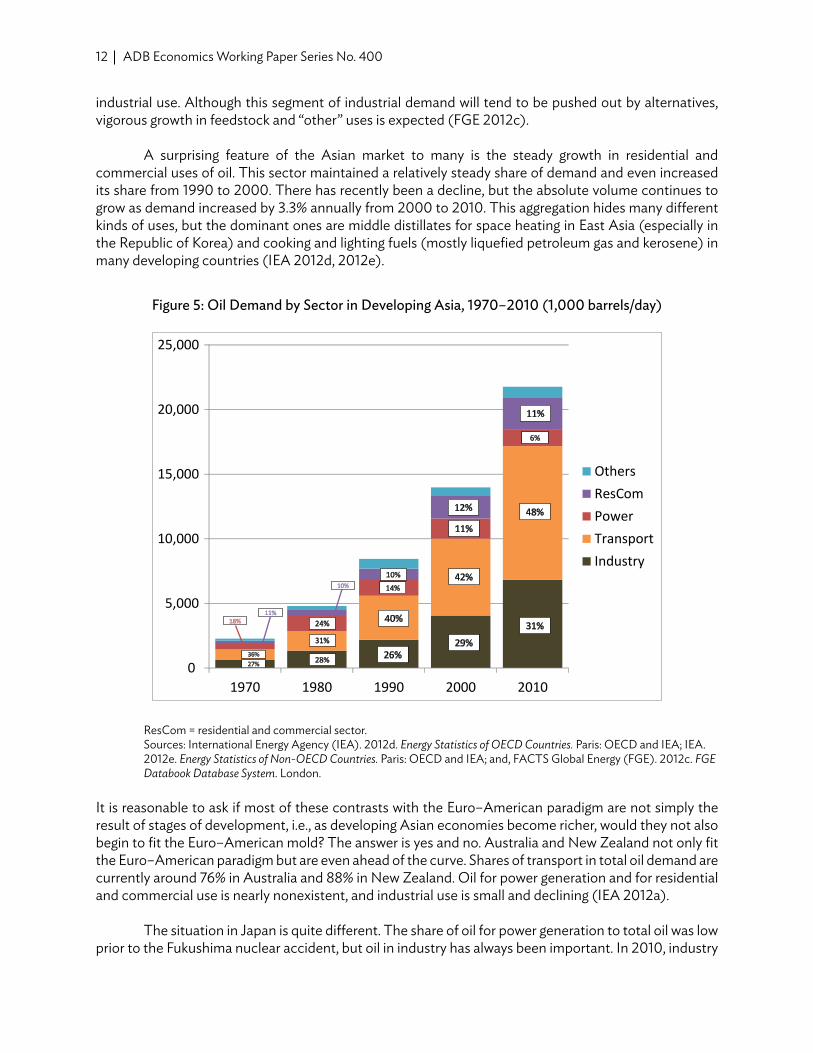
kerosene has never been one of the dominant products in the Asian demand barrel, but it was the most politically charged product as the cooking fuel of the poor as well as the main heating fuel in Japan and the Republic of korea. In 1980, kerosene accounted for about 8% of all oil product demand in Asia and was still above 7% in 1990, but demand peaked in 1999 and has fallen rapidly in the last decade at –4.9% annually so that in 2010 kerosene accounted for only 2% of oil demand in developing Asia (FGE 2012b). As Figure 8 shows, demand for kerosene is still overwhelmingly concentrated in the residential and commercial sector.
16 ADB Economics Working Paper Series No. 400
Figure 8: Kerosene Demand by Sector in Developing Asia, 2010 (% share)
Residential and commercial
84%
Other industries12%
Agriculture1%
Others3%
Sources: International Energy Agency (IEA). 2012d. Energy Statistics of OECD Countries. Paris: OECD and IEA; IEA. 2012e. Energy Statistics of Non-OECD Countries. Paris: OECD and IEA; and, FACTS Global Energy (FGE). 2012c. FGE Databook Database System. london.
The industrial use of kerosene might seem surprising, but it is also known as fuel oil #1, i.e., a very light diesel. What Figure 8 cannot show is how effectively governments have driven kerosene demand downward. Much of the impetus for change came from the Asian financial crisis in 1997 when many governments found themselves with plummeting currencies and high oil subsidies. As Figure 9 shows, over the following years a combination of price reforms and fuel substitution efforts not only curtailed growth in kerosene demand but ultimately reversed it.

17Oil Security Issues in Asia and the Pacific
Figure 9: Kerosene Demand by Sector in Developing Asia, 1970–2010 (1,000 barrels/day)
0
100
200
300
400
500
600
700
800
90019
70
1972
1974
1976
1978
1980
1982
1984
1986
1988
1990
1992
1994
1996
1998
2000
2002
2004
2006
2008
2010
OthersAgricultureIndustryResCom
ResCom = residential and commercial sector.Sources: International Energy Agency (IEA). 2012d. Energy Statistics of OECD Countries. Paris: OECD and IEA; IEA. 2012e. Energy Statistics of Non-OECD Countries. Paris: OECD and IEA; and, FACTS Global Energy (FGE). 2012c. FGE Databook Database System. london.
Price reform was an important factor in many economies, but in all of them the availability of alternative fuels was also important. This included not only lPG substitution campaigns but also the spread of natural gas reticulation in some.
Diesel (Gasoil)
Diesel is the dominant fuel accounting for 31% of oil product demand in developing Asia in 2010. Diesel probably has the widest range of use by sector of any oil product playing several roles in transport (road, rail, domestic waterborne, and international shipping bunkers) and in industry, power, home and commercial heating, and agriculture. Demand for diesel generally grows at rates somewhat greater than those for general oil, and absolute demand has grown in every sector. Growth in power has been the weakest at less than 2% per annum over the last decade. The use of diesel in agriculture has also been in the range of 2%–3% annually while growth in all forms of transport and in the residential and commercial sector has been over 5% annually. As Figure 10 shows, transport use accounted for about 62% of diesel demand in 2010 (57% in 2000). In this regard, Asia might be seen as moving toward the Euro–American paradigm.

18 ADB Economics Working Paper Series No. 400
Figure 10: Diesel/Gasoil Demand by Sector in Developing Asia, 2010 (%)
Sources: International Energy Agency (IEA). 2012d. Energy Statistics of OECD Countries. Paris: OECD and IEA; IEA. 2012e. Energy Statistics of Non-OECD Countries. Paris: OECD and IEA; and, FACTS Global Energy (FGE). 2012c. FGE Databook Database System. london.
One challenge for Asia will be to slow the growth in diesel demand in the residential and commercial sector. Unlike kerosene that is used mainly in households, diesel tends to often be used for central heating in commercial or public establishments some of which (government buildings for instance) are arguably less price-sensitive than households, so small-scale measures such as making lPG locally available in cylinders will have little impact.
Fuel Oil
In the continuum of oil substitutability, jet fuel sits at one end (presently no substitutes) and fuel oil at the other (many substitutes). Fuel oil is generally used for direct heating and therefore finds itself in competition with coal and gas in many applications; it further competes with virtually any energy source in power generation. The major exception is use in transportation. Although fuel oil is not commonly thought of as a transport fuel, it is still used in some rail transport and is the dominant fuel in international marine bunkers. It should be noted that all of the figures discussed here include marine bunkers as part of demand. This is contrary to the practice of IEA and other groups that treat bunkers as a kind of export with no importer. In a way, the IEA view makes sense as the demand is arguably shared between the

19Oil Security Issues in Asia and the Pacific
loading port and the destination port. In practice, however, ignoring bunker demand gives a very distorted picture of energy needs as export-led economies in Asia rely on bunkers to move their exports. As Figure 11 shows, bunkers should not be ignored as they amount to 42% of fuel oil demand and are growing while other major uses are declining.
Figure 11: Asian Fuel Oil and Direct-Burned Crude Demand, 1970–2010 (1,000 barrels/day)
0
500
1,000
1,500
2,000
2,500
3,000
3,500
1970 1972 1974 1976 1978 1980 1982 1984 1986 1988 1990 1992 1994 1996 1998 2000 2002 2004 2006 2008 2010
Others
Other transport
Bunkers
Industry
Power
Direct use crude
Note: Direct use is primarily direct burning but includes small petrochemical feed use. Sources: International Energy Agency (IEA). 2012d. Energy Statistics of OECD Countries. Paris: OECD and IEA; IEA. 2012e. Energy Statistics of Non-OECD Countries. Paris: OECD and IEA; and, FACTS Global Energy (FGE). 2012c. FGE Databook Database System. london.
The changes in Asian fuel oil demand over the last 4 decades tell a dramatic story. Figure 11 includes direct-burned crude typically used in the power sector as a fuel-oil substitute. Japan—not included in Figure 11—has long been the largest burner of crude in Asia largely because local sulfur emission constraints make burning of even low-sulfur fuel oil impossible in some areas, but other countries such as the PRC also burn substantial volumes of crude largely because of transport constraints. (For the record, Asia is not the sole crude-burning region. Huge volumes are burned in Saudi Arabia and Iraq and some in kuwait.)
The price increases of the 1980s sharply curtailed the use of both crude and fuel oil in power generation, but the rapid growth of Asian economies in the 1990s soon drove demand for power generation upward again. In the last decade, this use of oil was again squeezed down reaching an historic low in 2009.

20 ADB Economics Working Paper Series No. 400
The industry sector has followed essentially the same pattern as the power sector—a price-induced squeeze in the 1980s, an economy-driven expansion in the 1990s, and a gradual phase-down in the last decade. In fact, the picture would be a remarkable downward trend since the mid-1990s were it not for bunkers. In 1995, bunkers were about 15% of fuel oil/direct-use crude demand in Asia as opposed to 42% in 2010; they are likely to constitute half of fuel oil demand (including direct-use crude) in the near future.
As long as Asia remains the main exporter of manufactured goods to the world, bunker demand seems set to continue growing. That does not necessarily mean than fuel-oil bunkers will continue to grow, however, as forthcoming International Maritime Organization regulations on sulfur emissions will challenge the entire system of relying on high-sulfur fuel oil for marine transportation.
Other Oil Products
Taken together, “other” oil products—bitumen, petroleum coke, lubes, waxes, and miscellaneous minor products—amount to about 8% of Asian oil demand. This is small but is higher than the shares of jet fuel or kerosene. These are primarily non-energy products and are mostly attributed to the industry sector if heavy construction is included. As development proceeds, the use of these other fuels tends to grow rapidly as infrastructure expands and manufacturing becomes more sophisticated. In developing Asia, that means that demand for these fuels is likely to grow rapidly in the next few decades before settling down to maintenance levels.
B. Outlook
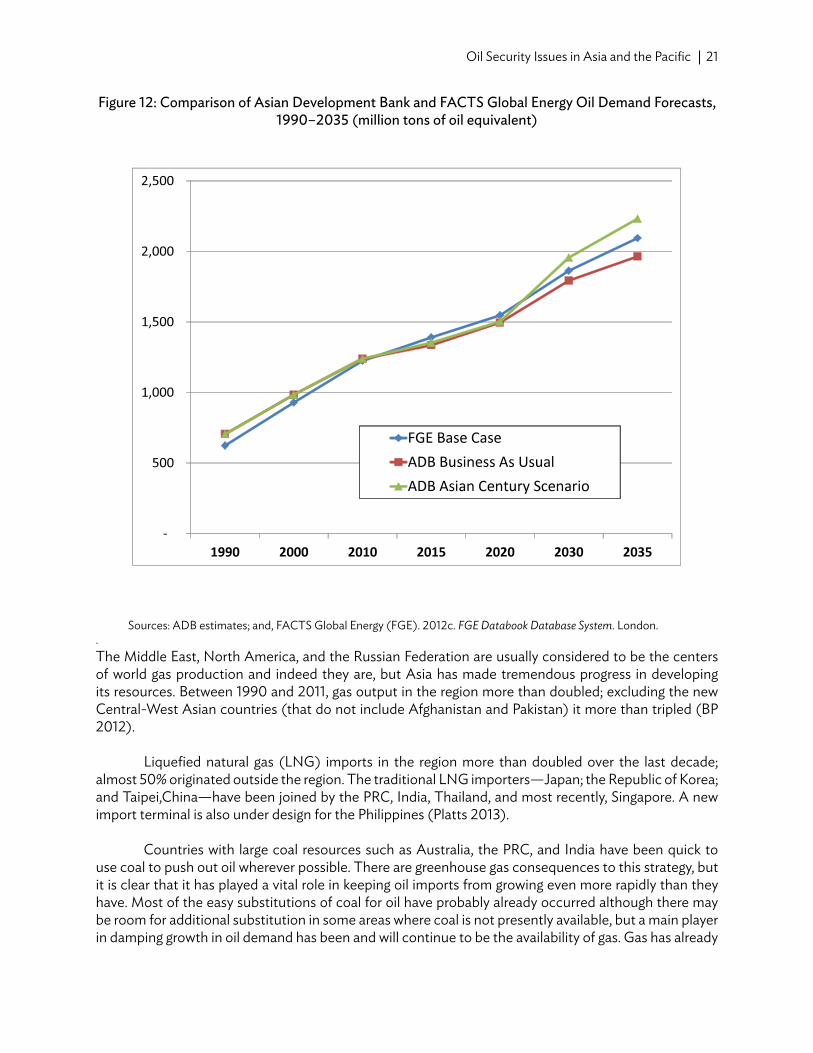
Broad energy balances such as the ADB Asian Century scenario (ACS) are generally conducted in aggregated form with tons of oil equivalent of primary fuels as the main denominator. More commercially oriented analyses like those done by FGE tend to focus on individual fuels as the primary unit. FGE published forecasts run only to 2030, so it was necessary to extend them to 2035 by trending individual product growth rates. In addition, FGE works in volume (thousand barrels per day) rather than mass (million tons per year), and conversions between these units are based on assumed densities rather than recorded data. It was therefore pleasing to discover that up and down across the forecast period, the FGE base forecast for oil demand in Asia is within a few percentage points of the ADB scenarios (Figure 12). Indeed, in percentage terms the disagreements in the forecasts are of the same size as the disagreements in the estimates of 1990 and 2000 historical consumption (5%–6%).
21Oil Security Issues in Asia and the Pacific
Figure 12: Comparison of Asian Development Bank and FACTS Global Energy Oil Demand Forecasts, 1990–2035 (million tons of oil equivalent)
Sources: ADB estimates; and, FACTS Global Energy (FGE). 2012c. FGE Databook Database System. london..The Middle East, North America, and the Russian Federation are usually considered to be the centers of world gas production and indeed they are, but Asia has made tremendous progress in developing its resources. Between 1990 and 2011, gas output in the region more than doubled; excluding the new Central -West Asian countries (that do not include Afghanistan and Pakistan) it more than tripled (BP 2012).
liquefied natural gas (lNG) imports in the region more than doubled over the last decade; almost 50% originated outside the region. The traditional lNG importers—Japan; the Republic of korea; and Taipei,China—have been joined by the PRC, India, Thailand, and most recently, Singapore. A new import terminal is also under design for the Philippines (Platts 2013).
Countries with large coal resources such as Australia, the PRC, and India have been quick to use coal to push out oil wherever possible. There are greenhouse gas consequences to this strategy, but it is clear that it has played a vital role in keeping oil imports from growing even more rapidly than they have. Most of the easy substitutions of coal for oil have probably already occurred although there may be room for additional substitution in some areas where coal is not presently available, but a main player in damping growth in oil demand has been and will continue to be the availability of gas. Gas has already

22 ADB Economics Working Paper Series No. 400
had a major impact in residential and commercial demand, and it readily substitutes for oil in power generation and in non-feedstock uses in industry. In the US, low-priced gas from shale is now penetrating the transport sector and is expected to have a growing impact on oil demand (kelley-Detweiler 2012).It is impossible to say what Asia would look like today without growth in gas consumption. As an upper limit, if we assume that all of the growth in gas demand between 1990 and 2011 displaced potential oil demand on an Mtoe basis, then current oil demand in Asia could be higher by 33%—nearly 9 million barrels/day of additional oil.
Oil and gas are not freely fungible, but they are more fungible than oil and coal. The most dramatic supply-side option for keeping oil demand growth somewhat restrained is to introduce more gas. Thus, the potential in Asia for shale gas, coal-bed methane, and other unconventional gas is perhaps the most important question about the future of oil.
V. oIl suPPly
A. Production Outlook for Developing Asia
Asian economies are active exporters of high-quality, sweet crudes, but frequently they maintain their exports only by importing lower-grade crudes and refined products. Asia is not a crude-rich region. Only three countries—Azerbaijan, PRC, and kazakhstan—produce more than a million barrels/day. Indonesian production has been just under 1 million barrels/day for several years, and unless trends change, it seems to be in a state of slow decline. Although growth prospects are good for the frontier areas in new Central-West Asia, there is presently little expectation of major increases in output in other parts.
The fact that analysts are not expecting an oil production boom in Asia does not rule one out. Oil production is full of surprises, and forecasts running 10 years ahead are often shown in retrospect to have been quite naïve. That said, prospecting has been undertaken with great urgency in most of Asia for the last 3 decades, so the chances of massive, undetected, conventional reserves seem small.
There are two possibilities that might change the picture at least to some degree. In some economies, exploration by multinationals is either not allowed or is restricted to only the most challenging—rather than the most promising—areas. Some of the multinationals suggest that crude reserves could be increased considerably if they were “invited in” to more promising geological areas presently controlled by national oil companies. It is impossible to rule this assertion out, but it should be taken lightly.
The second possibility is that oil production could increase based on unconventional sources. There are no large deposits of oil sands or bitumen in Asia, so the only open question is what might be offered by liquids from shale. This has been significant in the US where many of the shale deposits have been “wet” (containing lPG and heavier liquids on up to what are effectively full-range crude oils) or “dry” (containing mostly methane and ethane). So far most of the Asian shales explored tend to be dry, but it is far too early to draw any conclusions.
Under the circumstances, there is little choice but to adopt the outlook in Figure 13 based on what is understood about the near future which gives the FGE oil production outlook through 2020 extended through 2035 by applying the 2015–2020 growth rates for each country/grouping.
23Oil Security Issues in Asia and the Pacific
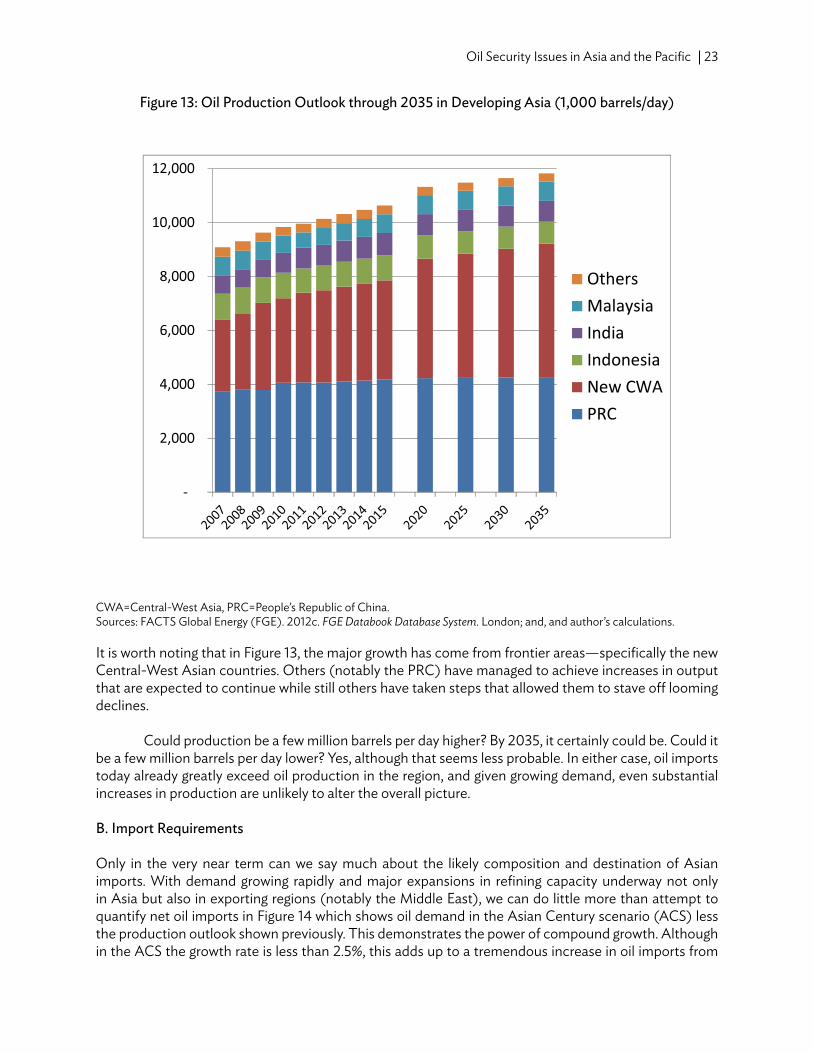
Figure 13: Oil Production Outlook through 2035 in Developing Asia (1,000 barrels/day)
CWA=Central -West Asia, PRC=People’s Republic of China.Sources: FACTS Global Energy (FGE). 2012c. FGE Databook Database System. london; and, and author’s calculations.
It is worth noting that in Figure 13, the major growth has come from frontier areas—specifically the new Central -West Asian countries. Others (notably the PRC) have managed to achieve increases in output that are expected to continue while still others have taken steps that allowed them to stave off looming declines.
Could production be a few million barrels per day higher? By 2035, it certainly could be. Could it be a few million barrels per day lower? yes, although that seems less probable. In either case, oil imports today already greatly exceed oil production in the region, and given growing demand, even substantial increases in production are unlikely to alter the overall picture.
B. Import Requirements
Only in the very near term can we say much about the likely composition and destination of Asian imports. With demand growing rapidly and major expansions in refining capacity underway not only in Asia but also in exporting regions (notably the Middle East), we can do little more than attempt to quantify net oil imports in Figure 14 which shows oil demand in the Asian Century scenario (ACS) less the production outlook shown previously. This demonstrates the power of compound growth. Although in the ACS the growth rate is less than 2.5%, this adds up to a tremendous increase in oil imports from

24 ADB Economics Working Paper Series No. 400
under 11 million barrels/day in 2010 to 31.3 million barrels/day in 2035 which means in 2035 developing Asia will import nearly 3 barrels of oil for every 1 imported today.
Figure 14: Net Oil Imports through 2035 in Developing Asia (1,000 barrels/day)
Sources: ADB estimates; author’s calculations.
To put those numbers in perspective, in 2011 Middle East exports of oil—including both crude and products—amounted to 18.9 million barrels/day (BP 2012). Total world exports of oil amounted to 53.5 million barrels/day (Figure 15). In other words, if world oil exports remained constant, by 2035 under the ACS, Asia would be taking nearly 60%. How plausible is such a scenario? It is not wholly implausible. Such an increase in imports will put pressure on the market, but Asia is already the largest importing region in the world. In 2010 total oil imports (including Australia, Japan, and New Zealand) were slightly greater than North America and Europe combined (Figure 15).

25Oil Security Issues in Asia and the Pacific
Figure 15: Regional Shares of Total Oil Imports, 2010 (1,000 barrels/day)
FSU = former Soviet Union, MMb/d = million barrels per day.Source: British Petroleum (BP). 2012. BP Statistical Review of World Energy June 2011. london.
If US and European oil demand continues to contract and oil production and exports continue to gradually increase (as is happening currently notably in the US and Iraq), and countries continue to set policies that limit growth in oil demand, then it is possible that Asian imports could increase to the levels predicted. If not, it will be a battle that will drive crude prices up.
C. The Growing Importance of Product Trade
At one time, the Asia and Pacific trade patterns were simple. Most countries with refineries imported crude and made up any deficits with product imports, mostly from Singapore. The growth of Middle East’s export refining and gas processing (which produces steadily increasing volumes of naphtha and liquefied petroleum gas exports) offered a new source of products. As Asian refining increased on the heels of soaring Asian oil demand, more countries entered the product market as exporters as well as importers. Today the PRC, India, Japan, Malaysia, the Republic of korea, and Thailand all typically export more than 200,000 barrels/day each of refined products; India and the Republic of korea each export well over 1 million barrels/day. India and the Middle East are beginning to create a reliable arbitrage between the Atlantic Basin and Asia, and Asian cargoes of various products, notably diesel, sometimes move to Europe (IEA 2013).

26 ADB Economics Working Paper Series No. 400
In 2000, product imports accounted for about 25% of Asian oil supply; in 2011 they had expanded to about 31% (FGE 2012b). This may sound like a modest change, but it occurred at a time when Asian demand was expanding rapidly, so the result was an increase in product imports of more than 70%. The Asian trade in products is now huge with 8.3 million barrels/day of imports and nearly 6 million barrels/day of exports.
At one time the product market was “thin” enough that a growing deficit in a single importer could have a major impact on the overall availability of a given product. In general, this is not as true today simply because the market has expanded so much. Because of the bewildering—and constantly shifting—array of product specifications in different countries, however, a given grade of a product can still be too thin, and import levels can cause serious market distortions. All in all, the development of a large and active product market has given individual countries and refiners more flexibility in meeting demand, but steps could be taken to make the market more useful and effective.
D. Reliance on Middle East Oil Exports
The Middle East is of course the world’s largest exporting region and the source most importers look to for the marginal barrel of crude. The Middle East is a strategic oil center of great importance, and most Americans and some Europeans will stipulate that a major military presence in the Mideast Gulf is needed to guarantee the security of oil imports. Oil is a relatively unified market, so a disruption anywhere affects everyone, but few voters or politicians understand that logic, so the situation in Figure 16 is potentially explosive. In 2010, just over 10% of all Middle East exports went to Europe; less than 10% went to North America; 76% went to Asia. It would be easy for Asia to accommodate all Middle Eastern exports.
Figure 16: Destination of Middle Eastern Oil Exports, 2010 (% share)
0
10
20
30
40
50
60
70
80
Asia Europe North America Africa Latin America
Developing Asia:
56%
Developed Asia:
20%
Source: British Petroleum (BP). 2012. BP Statistical Review of World Energy June 2011. london.

27Oil Security Issues in Asia and the Pacific
In practice, this will not happen although US imports from the Middle East apart from Saudi Arabia and Iraq have dropped to nearly zero. Corporate connections will keep some volumes of oil flowing westward. For example, Saudi Aramco now owns substantial refining capacity in the US and will use at least some of it for their own crude. There are also investments by multinationals that will tend to move some volumes west because of tactical considerations. In terms of physical capabilities, however, North America and Europe no longer really need Middle Eastern oil.
This creates a politically fraught situation. The obvious problem is the large US military presence in the gulf. In a time of budget austerity, will spending US dollars to defend Asian oil supplies sound like a popular campaign slogan? On the other hand, will stepping aside to allow a major Asian military presence in the gulf be popular? There is another angle to this situation, however. The Asia and Pacificregion dominates the market for Middle Eastern oil to a remarkable extent which ought to give the buyers increased leverage.
E. Crude Quality and Refining Capabilities
As mentioned previously, the Asia and Pacific region is not crude rich, but the crudes it produces are primarily low sulfur (sweet). The most famous tend to be medium-to-light crudes such as Minas (Indonesia) and Tapis (Malaysia), but there are also ultra-heavy sweet crudes such as Duri (Indonesia), Pyrenees (Australia), and Qinghuangdao or QHD(offshore PRC). Many of the larger refiners in the region have negligible crude production (Japan, the Republic of korea, and Taipei,China) or production far short of demand (India). Their refining systems developed on a mix of sweet Asian crudes coupled with an ever growing share of sour Middle Eastern crudes.
Other countries, notably the PRC and Indonesia, have long supplied the bulk of their own needs, so most of their refining was constructed to handle only low-sulfur crudes. In the PRC, many refineries were constructed of mild steel that literally cannot withstand high-sulfur crudes. As imports have mounted, Indonesia has relied on importing sweet crudes from other Asian sources as well as from West Africa. The PRC initially followed this pattern (and still imports African crudes), but it soon became apparent that it would have to become a major importer of sour crudes from the Middle East.
Coupled with a gradual tightening of environmental standards around the region, most Asian refiners have faced ongoing trade-offs between scarce, expensive sweet crudes and the large capital costs of installing capacity to handle sulfur. Although it might seem that the logical thing to do is build extensive desulfurization, the decision is not so simple because crude oil is not desulfurized; rather, the intermediate products created after the crude has been distilled into its various cuts are. The heavier the cut, the more difficult and costly it is to desulfurize and the higher the percentage of sulfur it contains. For example, in a crude like Arab light containing 1.8% sulfur, the gasoline cut will contain about 0.025% sulfur while the fuel oil cut will contain more than 3%. What is more, the fuel oil will generally contain almost all of the other difficult contaminants such as metals as well as the bulk of the noncombustibles (ash).
In practice, it is even slightly more complex. The straight-run fuel oil—the portion of the oil that still has not boiled at 650°F (343°C)—is typically sent on to a vacuum distillation tower that splits it into vacuum gas oil (650–1050°F) and vacuum bottoms (> 1050°F). This results in a further concentration. The vacuum gas oil from Arab light contains about 2.4% sulfur; the vacuum bottoms contain 4.2% sulfur and virtually all of the metals.
28 ADB Economics Working Paper Series No. 400
A hydrotreater to desulfurize gasoline or diesel at a typical refinery costs tens of millions of dollars; a hydrotreater for vacuum gas oil can cost hundreds of millions, but one to desulfurize and demetallize straight-run fuel oil (or worse, vacuum bottoms) typically costs around a billion dollars. For this reason, desulfurizing is seldom undertaken simply to produce low-sulfur fuel oil for sale. Once the fuel oil—or portions of it—is desulfurized, it is usually more valuable as cracker feed than on the low-sulfur fuel oil market.
“Crackers” are units in refineries that take large, heavy molecules and break them into lighter molecules in the gasoline, kerosene, and diesel range. The most common of these are fluid catalytic crackers and hydrocrackers. These generally take vacuum gas oil as their feedstock, though some of them can run on desulfurized and demetallized full-range fuel oil. Such units are comparatively uncommon and are called “resid” crackers (typically abbreviated as RFCCs and RHDCs.)
Cracking in a given unit is never 100%, so some form of cracked fuel oil is usually returned. In most refineries, this cracked material is usually blended with the vacuum bottoms and the mixture is called “cracked fuel oil” which is typically used as ship bunkers or in power generation. Any fuel oil sold without any cracked material blended into it is called virgin fuel oil and generally sells at a premium as virgin fuel oil can be sent for cracking while cracked fuel oil generally cannot be cracked again.
Except in the rare cases where whole fuel oil is desulfurized and demetallized and run to a resid fluid catalytic cracker or hydrocracker, a typical cracking refiner has a ready outlet for vacuum gas oil but ends up with a substantial amount of vacuum bottoms that are often very high in sulfur and even when made from low-sulfur crudes, usually high in metals and very difficult to process except in a unit called a coker. Cokers take vacuum bottoms or even whole fuel oil and thermally crack them into lighter products leaving behind a large quantity of petroleum coke that contains most of the metals and much of the sulfur. The heavy liquids—coker vacuum gas oil—can with some pretreating be sent on as cracker feed to fluid catalytic crackers or hydrocrackers, and the lighter liquids can be used as blendstock in finished products though they are relatively low in quality and may require considerable treatment before blending. The coker is a vital element in most full conversion refineries, i.e., those that produce little or no fuel oil. In the US, fuel oil is now less than 4% of the product barrel starting from crudes that in many cases yield more than 50% fuel oil on distillation.
There are many ways to gauge refinery capabilities. The Nelson Complexity Index, for example, is a good measure of sophistication but gives an undue weight to complex units such as lubes or alkylation. In terms of what a refinery can do to convert fuel oil to lighter products, the easiest to understand is the cracking-to-distillation ratio. This is simply the capacity of each kind of major cracking unit divided by the crude capacity of the refinery. (Visbreakers and thermal crackers are excluded from these totals because most of them do comparatively little in the way of conversion.) Figure 17 offers an overview of the cracking-to-distillation ratio by type and region as of the end of 2012.

29Oil Security Issues in Asia and the Pacific
Figure 17: Cracking-to-Distillation Ratios for Various Regions, 2012 (%)
PRC= People’s Republic of China.Sources: kootungal, l. 2012. 2012 Refining Survey. Oil and Gas Journal. 110 (12); FACTS Global Energy. 2012d. Fall 2012 Asia–Pacific Oil Databook III: Refinery Configuration and Construction london; and, author’s calculations.
The US has the highest cracking-to-distillation ratio with cracking capacity amounting to about 55% of crude capacity. The US also has the highest ratio of coking to distillation; in fact, 40% of all coking in the world is in the US. This reflects a long history of imports of very heavy, generally high-sulfur crude oils from Canada, Mexico, and Venezuela as well as a very low demand for fuel oil. What is perhaps more surprising is the fact that the PRC ranks just behind the US with a cracking-to-distillation ratio of about 45% and holds nearly 25% of the world’s coking capacity. (Note that these figures are all based on statistics gathered directly from sources in the PRC; most data in industry journals underreport PRC refining capacity by a substantial amount.)
The PRC has long minimized fuel oil use and has tried to squeeze every drop of light products out of a barrel of oil. The country has had the technology to build both cokers and fluid catalytic crackers since the 1970s and has developed some advanced cracker designs that have been licensed in other countries. The PRC has cut fuel oil consumption to about 6% of its demand barrel; 33% is for ship bunkers (FGE 2012c).
The rest of Asia lags far behind the PRC, but fuel oil is still about 13% of the demand barrel. Asia excluding the PRC is quite similar to Europe in cracking ratios. Some of this reflects European access to
30 ADB Economics Working Paper Series No. 400
lighter crudes, but it should be noted that European refining is on the decline (with present utilization under 80%), so even though European consumption of fuel oil is only around 9% of the demand barrel, there is less fuel oil to be cracked than the crude capacity might suggest. In the rest of the world, fuel oil demand remains rather high at about 16% of the demand barrel (BP 2012).
At present, Asia is expanding and rationalizing refining simultaneously. Capacity is being closed in Australia and Japan, and new capacity is being built most notably in the PRC, India, Malaysia, Pakistan, and Singapore. By 2020, the overall result should be an expansion of 15% in crude capacity accompanied by an expansion of 16% in coking, 11% in catalytic cracking, and 20% in hydrocracking. The net result is a slight increase in the overall cracking-to-distillation ratio (FGE 2012d, Author’s calculations).There are two main reasons to focus on cracking that are discussed further in sections F.5 and F.6, respectively. The first is that the planned International Maritime Organization regulations may severely cut current fuel oil demand in bunkers, and the second is that limited cracking and upgrading limits the kinds of crudes that can be processed.
VI. crItIcal Issues In oIl securIty
A. Traditional and Contemporary Views on Oil Security
Arguably the concept of oil security dates back to Winston Churchill’s time as First lord of the Admiralty of the United kingdom when a comprehensive program was undertaken to ensure the reliable availability of oil at all of Britain’s “coaling stations” around the globe. More recent concerns, however, grew out of the oil crises of the 1970s and early 1980s and were highly colored by the Arab Oil Embargo that attempted to deny oil supplies to certain economies or groups of economies. Price increases and perceived shortages following the Iranian revolution increased concern about what could be done to maintain ongoing supplies of oil in the event of a disruption.
In fact, it is not clear that there were physical shortages that were not caused by excess stockpiling and keeping vehicle tanks full. The rapidity of price increases also may have led to speculative hoarding when oil companies were afraid to sell stocks of crude or product on a given day because the price might be much higher on the next. The economic dimension was always a concern of governments, even if it was overshadowed in public debate by the threats to the security of the physical supply. In the name of protecting their economies and eliminating profiteering, many (including for a time the US) introduced price controls to keep prices low. As might be expected, price ceilings and controls had their own consequences in terms of demand distortions and impacts on national treasuries. The US freed up prices in 1980, but price caps and subsidies of various sorts remained widespread in Asia throughout the 1980s, and even today not all domestic prices are market related. As the market has matured with neither Organization of the Petroleum Exporting Countries (OPEC) nor the multinationals able to control prices or destinations, the concept of “the oil weapon” has quietly evaporated. Oil certainly remains a tool of political influence, but it is a flimsy weapon. Oil kept flowing through the two gulf wars, and supplies are still readily obtainable despite the current sanctions against Iran. While loss of supply from a given source may be inconvenient as in the 1991 Gulf War when supplies of oil from kuwait dropped to zero, there was no supply crisis for any individual economy. The market responded with a price spike then rapidly cooled down. Indeed, it is difficult to find instances of physical cutoffs of oil based on anything other than natural disasters. About the only case anyone can cite is from the PRC to the Democratic People’s Republic of korea, but the cutoff of subsidized oil to a tiny country receiving the bulk of its oil through a single pipeline is not a lesson for the oil market at large.Similarly, although not all price subsidies have yet vanished, many governments would like to eliminate

31Oil Security Issues in Asia and the Pacific
them if it were politically feasible. If assuring physical supply is not the challenge, and insulating domestic economies from the market is deemed neither wise nor practical, then what is oil security? The goal of oil security is to increase the resiliency of domestic economies and the international market to the effects of changes in the terms of oil supply. The “terms of oil supply” encompass changes in availability domestically and internationally as well as changes in prices. Resiliency involves adapting to change with minimal economic dislocations. Change is inevitable though unfortunately not predictable. The role of governments should be to help take advantage of changes when beneficial and to reduce their harm when they are challenging. This concept of resiliency is a useful touchstone in evaluating policy options. The following measures tend to increase oil security.
• Increase oil production. This seems so obvious, but there is a corollary: It doesn’t matter too much who is producing the oil. If Country A increases oil output, then it is clearly the main beneficiary, but Country B also benefits because A now imports less oil or even becomes an exporter.
• Decrease oil demand. Once again, the main beneficiary is the country that cuts its oil demand, but the region and the market all benefit.
• Increase production of alternatives to oil. This may not only decrease oil demand as such but also offers substitution options if oil prices suddenly increase.
• Increase stocks of energy/oil. In the short term, stocks act as if supply on the market had increased. Once again, the effect is beneficial no matter who holds the stocks.
• Increase fungibility. Anything that allows energy to move more freely to where it is needed makes the system more resilient to disturbances. This can mean more transport infrastructure, or more flexible refineries, or increased harmonization of product specifications. It can also mean concentrating on oil alternatives that are readily substitutable in critical end uses rather than on the total of British thermal units produced.
• Increase market responsiveness. This covers a broad set of issues including domestic pricing policies, market transparency, using hedging and futures markets, and a greater number of participants in the market.
B. Pricing Policies
As discussed previously, pricing is one area where governments often introduce serious distortions into the economy. The problems with keeping all oil prices too low are obvious: Demand is encouraged to expand at an unrealistic rate, and the difference between market prices and the domestic price is paid for somewhere in the system. The problem is most obvious when the treasury pays directly for subsidies, but indirect subsidies such as setting the prices a national oil company may charge incur at least the same level of economic loss. In fact, the losses could be larger in indirect subsidies because company investment decisions are likely to be distorted; at a minimum, the incremental value of finding more oil is undervalued.
More subtle problems occur when governments choose to subsidize or to control only a few fuel prices. The resulting distortions can take on many forms. In extreme cases, fuel smuggling can become rampant as can adulterating products. If a national oil company is responsible for supply, huge capital investments may be made in refining to keep up with demand for the subsidized product. In few cases do such price subsidies benefit only the group to which they are directed; fuel subsidies for the poor are often
32 ADB Economics Working Paper Series No. 400
enjoyed by the rich as well, and in many cases businesses are able to find ways to take advantage of the subsidized fuel for their own purposes. Once a subsidy becomes entrenched, it develops a constituency and becomes hard to remove.
Systems involving subsidies do not tend to be resilient as they are attempting to form a dike between the force of the market and a portion of the domestic economy. History shows that such systems tend to succumb to economic pressure, and the adjustment that follows can be unpleasant and can result in dislocations. There are two arguments for fuel subsidies. One is that they support the poor, but the best way to accomplish this is to give the intended beneficiaries money, not to restructure the entire pricing system. Second is that they support energy-intensive businesses. That is bound to be the case, but it also tends to increase rather than decrease oil demand and exposure to changes in the oil market.
Policies that hold prices at above-market levels are not uncommon and have long been in place in Europe. They usually involve taxes, often a combination of value-added and flat taxes. Taxes that keep prices above levels in the external market obviously depress demand and reduce reliance on oil, but if they are too high, they may also depress overall economic growth. Obviously, higher prices discourage businesses that depend on cheap energy supplies, so some economic activity may be shifted to other locations, but in terms of oil security this may not be a bad thing.
Higher prices for oil also make alternatives more competitive and provide a cushion for them if oil prices take a sudden fall. Above-market oil prices also offer a policy option denied to subsidies: If prices rise too high, the extra taxes or charges can be reduced. In particular, there is the option of temporarily pegging value-added taxes at a flat rate rather than letting them rise in proportion to the external market.
In summary, oil subsidies decrease oil security. Market-based prices create fewer distortions and economic losses. Prices well-above levels on the world market may also have economic consequences that increase oil security by reducing growth in demand, supporting alternatives, and if needed, adding a tax that can in principle act as a cushion if prices soar too high.
C. Oil Stocks and Oil-Sharing Agreements
Oil stockpiling is a simple and appealing concept as it increases the amount of oil available to an economy. One of the International Energy Agency’s (IEA) most basic rules is that every member must hold a minimum of 90 days of the previous year’s net oil imports (2004). The idea of minimum stockholding is to some extent an extension and formalization of what many might consider good business practice. For many governments, it also has the appeal that the main burden could be on the private sector; refiners could simply be required by law to hold a certain number of days of oil the same way that a minimum amount of working capital must be held in a bank. The analogy is, however, faulty. Money held long-term in the bank earns interest. Oil held in tanks, on the other hand, does not accrue interest. It takes money to build and maintain the tanks, money to buy the oil to fill them, and money in terms of opportunity costs to have capital tied up and not employed.
Holding large stocks is costly, and companies—even national oil companies—tend to resist stringent stockpiling rules. When such a rule was instituted in Thailand, the refiners pointed out (correctly) that the concept as originally proposed gave substantial price advantages to product importers who had to hold only a certain number of days of product stocks but did not have to hold crude. This sort of problem can be solved by adjusting holdings to make them equal.

33Oil Security Issues in Asia and the Pacific
The IEA stocking policy does not mean that the logical level is similar for everyone. A major oil producer can argue that from its perspective the resource in the ground is a stock although it is in fact less accessible and responsive than oil in a tank at a terminal. In fact, IEA members that are net oil exporters are exempted from the strategic stockpile requirements. A country like Singapore where most oil imports are just passing through either as crude to be reexported as products or as products to be re-sold does not face a threat to domestic supplies even if stocks are kept at very low levels relative to total sales.
Japan and the Republic of korea hold strategic stocks in excess of IEA requirements. Thailand, the PRC, and Taipei,China have major strategic reserves, and the PRC has major expansion plans. India is developing an ambitious strategic reserve system. Plans for strategic reserves have also been made in the Philippines (Hook 2011).
One of the most interesting proposals for stockholding was the one discussed several years ago by the Republic of korea and Saudi Aramco. The idea was that Saudi Aramco wanted large holdings of crude in East Asia for marketing reasons, and the Republic of korea wanted ready access to crude in case of a market disruption. The plan was that the Saudis would store their oil there and draw on it as desired unless a supply emergency occurred in which case korean refiners would have right of first access. Although “first access” suggests a major advantage—one that probably does not really exist short of a war in the immediate vicinity—the idea of exporters holding stocks in the importing region is intriguing. Today, with concerns over the Straits of Hormuz, it may be time to revisit this concept.
The Republic of korea has been innovative in other ways regarding storage. PEDCO, the nation’s petroleum development corporation, has a large strategic storage system against emergencies. In times of price spikes but no real threat of a cutoff, korean refiners have been allowed to draw “loans” of physical barrels from PEDCO tanks and then repay them with barrels purchased later when market prices decline. In this way, the “strategic” reserve has had a practical, tactical effect on costs and prices. Whether curbing price spikes in a PEDCO-style approach justifies the amount of public money invested is questionable. If, however, a government has already decided to hold a major strategic stockpile, the PEDCO experience suggests that there may be more creative approaches to managing the stock than the sit-and-wait-for-an-emergency method used by the US for its strategic petroleum reserve.
Oil stockpiling naturally leads to oil-sharing agreements. One original IEA goal was to ensure effective oil sharing in the event of a major disruption, but this key element of the 1970s mission has gradually assumed a much lower profile. As a history of the IEA notes (Bamberger 2004), “By the time of the 1994 Commission Decision, however, the IEA’s emergency response policy had evolved toward greater emphasis on coordinated oil stock drawdowns accompanied by related measures such as demand restraint, fuel switching and surge production, as distinct from oil sharing.”
To some extent, this change in emphasis reflects the change in the world oil market since the days of the oil crises in the 1970s and 1980s. At the time of the Arab oil embargo, control of world distribution and pricing was firmly in the hands of the major oil companies. OPEC did an effective job of wresting control away from the majors but was unable to maintain control over transport and trading. (OPEC devoted a good deal of research into how to maintain a worldwide system of destination controls and failed to find a solution.) What emerged in the 1980s and 1990s was a real international market in oil with prices driven by spot trading and eventually by active futures markets.
That said, there has been continued interest in oil-sharing agreements. The Association of Southeast Asian Nations Petroleum Security Agreement of 1986 provided for oil-sharing in the event
34 ADB Economics Working Paper Series No. 400
of a shortfall of 10% of supply in any member, and this was updated by a new agreement and protocol in 2009 (Nicholas 2009). The agreement, however, specifies only that oil will be provided on a best-endeavor basis; there is no central mechanism for administration. Such an agreement could indeed be useful if a single member faced a physical cutoff of oil supply while the others did not. In today’s market, such an event would more likely be the result of a natural disaster than of politics. In the 21st century oil market it is hard to imagine a political or international event that would be so targeted as to cut off supply to one economy and not neighboring ones. Such an event is easy to imagine in the liquefied natural gas (lNG) market, however, as controlled source-to-destination channels are still the dominant means of sales, but oil is no longer delivered through such specific channels.
In 2007, Japan and the Republic of korea signed an agreement to share supplies from their strategic reserves in the event of an emergency (kang and lee 2007). Japan also announced that it would be open to oil-sharing agreements with other countries with the Japanese strategic reserves as the main holding reserve. An agreement has also been concluded with New Zealand, and the Philippines also expressed interest (Marasigan and Isla 2011).
When most oil was controlled from source to destination by either large integrated oil companies or by exporters, it was reasonable to worry about targeted cutoffs; oil-sharing plans were an important response to this problem. Today the market faces many challenges, but the scenario of targeted cutoffs is one of the least likely. One place where oil-sharing agreements could play an important role, however, is in regional stockpiles. Centralized storage serving many economies could make good sense, but the conditions for drawing on and sharing the oil would need careful thought. D. Gas and Unconventional Gas Sources
As discussed previously, perhaps the most important unknown in future Asian oil demand is future Asian gas supply. Gas is relatively fungible with oil in a number of important end-use sectors and offers an efficient, easily handled substitute (after some changes in equipment) in others. Beyond the issue of gas as such, one of the unpredicted results of shale-gas development in the US was the increase in shale liquid output, both liquefied petroleum gas and actual crude oil. Now that the structures and plays are better understood, increasing attention is being devoted to developing those structures where the liquids predominate. What had been the “shale gas revolution” has changed into the “shale liquid revolution” with gas as a useful by-product. Shale is not equitably distributed in Asia nor is coal that can be the source for coal-bed methane. Once again, such developments help ease pressure on the international oil market either directly (shale liquids) or indirectly (gas reducing oil demand). There are thus benefits to the region as a whole even if it appears that only the resource owner is profiting.
E. The Challenge of International Maritime Organization Bunker Regulations
At present, the International Maritime Organization (IMO) has ruled that international bunker fuels can contain a maximum of 3.5% sulfur by weight (down from the 4.0%–4.5% that was once common). There are, however, regions called emission control areas where the standards are much tighter. The first was the Baltic/North Sea where bunker sulfur was limited to a maximum of 1%. The European Union (EU) also allows no more than 0.1% sulfur fuel to be burned while in EU ports. In August 2012, the emission control area for North America began phasing in also lowering bunker sulfur to 1%. Puerto Rico

35Oil Security Issues in Asia and the Pacific
and the Virgin Islands will follow in 2014, and the Mediterranean, Australia, and other areas are likely to in coming years (Meech 2010). The big change will come in 2015 when the limit in emission control areas is dropped from 1.0% to 0.1% sulfur. There are almost no crudes that produce 0.1% sulfur fuel oil, and although refiners have known about the coming standards for years, it appears no investments in desulfurization have been made to meet them. In general, refiners are assuming that some other measures will have to be adopted. The problem becomes more pressing toward the end of the decade. At present, the IMO plans to limit all non-emission control area fuels to 0.5% sulfur after 2020, a rather large drop from 3.5%. Since the majority of the world’s bunkers are still 3.5% sulfur, there is a good deal of concern that this new standard cannot be physically met. The IMO will meet in 2018 to rule whether the new standard will be imposed in 2020 or whether it will be delayed to 2025; most observers are betting on the latter. It seems clear that there will not be enough low-sulfur fuel oil—either 0.1% or even 0.5% sulfur—to meet the demand. There will be plenty of cracked, high-sulfur fuel oil, however, that will have lost its natural market.
At present, there are three major contenders for meeting the future specifications. The first is low-sulfur diesel which can easily meet the 0.1% limit. Most vessels traveling in and out of emission control areas would probably need dual tanks to switch to diesel when they are transiting. Diesel of 0.5% sulfur is now widely regarded as high-sulfur diesel and would be in ample supply if there were a market for it. Still, this involves a major dislocation in the market greatly expanding diesel demand and shrinking demand for fuel oil. The second contender is onboard sulfur scrubbers. This would allow ships to burn higher-sulfur fuels and remove the sulfur as well as most of the nitrogen oxides and particulates. Most of the scrubbers remove sulfur 92%–95% efficiently, so scrubbing probably still would not allow a ship to burn 3.5% sulfur fuel oil in an emission control area though scrubbed 1% fuel oil would work. The investment, of course, is huge, and the technology is still in the developmental stages.
The third possibility is lNG. Many ship owners are betting on this for ships trading within emission control areas mostly in coastal traffic. At present, it is hard to envision a worldwide lNG bunkering system to support all international trade.
Unless onboard scrubbers win the day, high-sulfur fuel oil will be in long supply. This suggests that countries may wish to consider leaving room for onshore consumption such as in power plants with scrubbers or that an expansion of coking capacity may be needed to convert it into lighter products. In short, the new IMO rules pose a looming problem whose implications are still far from clear.
F. Refinery Configuration as a Security Issue
Refinery configurations are primarily a commercial issue, but they do have security implications. Ultimately this goes back to the goal of increasing fungibility. Very simple refineries have no cracking and little or no desulfurization. To meet specifications in most markets, a refinery like this will have to choose a very specific, narrow set of crude oils—most likely light, low-sulfur, expensive crudes. The refiners in this position will be in direct competition with each other for the limited supply of such crudes and will tend to bid up the price.
Specialty crudes may flow in one direction when almost all other crude flows are moving in another. In extreme cases, the market price of the crude may be higher than the value of what the average

36 ADB Economics Working Paper Series No. 400
refiner can make from it, and the crude will move to only a handful of locations rather than interacting with the market. True, fungibility will return if the crude is converted into products, but this situation cuts into the flexibility of the market.
A more important and relevant example is the plight of Canadian bitumen. Produced from oil sands, the material is so heavy that it sinks in water and requires diluents (called dilbits) to flow through a pipeline. It is this sort of crude that is planned to be exported to the US through the proposed keystone xl pipeline that was rejected by President Obama in January 2012 (Eilperin and Mufson 2012) but is due to be reconsidered in the near future. The Canadians took steps not to remain reliant on a single nation as a sole outlet by making plans to build an export pipeline to the Pacific and move the super-heavy crude to oil-hungry Asian buyers, but enthusiasm for the plan has quietly vanished. The problem is that there are no obvious customers in Asia. Bitumen crudes are useful only to refiners with heavy cracking capacities, especially coking. Although the PRC has considerable coking capacity, much of it is in the interior and is devoted to local crudes. In terms of handling bitumen as a feedstock, there are only a handful of refiners in Asia that can.
Apart from the potential for shale liquids that tend to be light and low in sulfur, most of the world’s untapped, unconventional oil resources are in the Canadian oil sands or in a belt that wraps around the western and southern edge of the Caribbean from Mexico to Venezuela to Trinidad and Tobago. These are all super-heavy crudes or tar sands or bitumen deposits, and the main outlet for the heavier grades is the US. Developing these deposits is slowing down because they have no markets beckoning; in effect they are cut off from the world oil market.
In a more logical world, the US would absorb more of these super-heavy crudes which match US refining configurations and export some of the surplus of light, sweet crudes (from shale) to where they are needed, but US law prohibits exporting crude without a specific (and difficult-to-obtain) exemption. So the oil locked up in the Americas does not have a major effect on the market and is not being developed. Blame US policy but also blame refinery configurations in Asia. Demand for oil is soaring, and the region is already consuming most of its own output, most of the output from the Middle East, and a big slice of production from Africa. The large undeveloped resources are in the Americas, but Asia, the world’s largest consuming and importing region, cannot make use of most of them.
G. Product Specifications as a Security Issue
Most oil-product specifications apart from international fuels like bunker and jet fuel are a matter of national environmental policy, and except for the fact that wind and water know no boundaries, this does not seem like a regional issue. Unfortunately, the lack of coordination in specifications from country to country acts as a barrier to the free flow of petroleum products and therefore has the effect of decreasing regional energy security. In a crisis, even if products were in surplus in one country, they might not be usable in another facing a shortfall.
It might seem like this is simply a matter of passing legislation that would allow product specifications to be loosened in times of emergency, and in some cases such measures would indeed solve the problem. In other cases, however, it is not nearly that simple. For example, catalytic converters on automobiles can be poisoned by levels of lead or sulfur that are acceptable in the gasoline blends of many countries, and equipment can be disrupted or function at lower efficiency if not run on the fuel for which it has been designed and tuned. The truth is that many product specifications around the world are essentially protectionist measures disguised as environmentalism.
37Oil Security Issues in Asia and the Pacific
If there were ever an oil issue that could be solved by regional consultation and harmonization this is it, though it is far too much to expect that all of Asia will converge on a single set of specifications. To some extent, environmental quality is a luxury of development, and not every economy can afford to accelerate to the levels of product quality in Japan, for example, though some details of the specifications in Japan could be questioned. What may be possible is to settle on agreed levels of specifications. For example, if market leaders in diesel/gasoil are 0.5% sulfur, 0.25% sulfur, 0.05% sulfur, and 50 parts per million sulfur, then a country should not move to a standard of 0.35% sulfur or 0.1% sulfur. Similarly, one country insisting on a 60 minimum cetane number and another on a 56 minimum cetane index only complicates international trade. This may in fact be the goal of some companies and even some national oil companies, but it constrains oil security. There is no need to adopt a uniform set of specifications, but it should be possible to agree on where limits are needed.
The greater the degree of harmonization among product specifications, the more economies can assist each other in times of market disruption or in the event of refinery disasters or unexpected downtimes. In addition, the greater the degree of harmonization, the more efficient the markets will tend to become for each product. Products with specifications that apply to only a small segment of consumption are notorious for falling out of step with other segments of the market. Both of these factors—the ability to offer assistance with product supplies and the increased size and liquidity of markets—can greatly enhance regional energy security.
H. Overseas Investment and International Trading
Investment in overseas exploration and production is a useful way to increase oil security, but it is often misunderstood as there continues to be an emphasis on the physical supply chain from the oil source back to the country. It may be logical to carry physical volumes of a new crude to a home country especially if it requires special processing and the company can make coordinated investments in refining to handle it. In some cases, however, it may make more sense to sell the crude on the market and buy another if the transportation hurdles are too high or if the crude is poorly suited for the home market. There have been a number of cases in which a national oil company has invested in a distant project and has been forced to bring the oil back for use in domestic refining. It makes for good newspaper headlines and photo opportunities, but it may not make good economic sense.
In any case, overseas investment by Asian oil companies should be encouraged. Oil exploration and production require massive (and increasing) capital expenditures, and it only makes sense that Asian importers should make capital available to the industry and share in the profits. In some cases, national oil companies may be invited to invest where private companies would not be welcome.
Overseas investment also increases the number of participants in the market. This leads directly to international trading. Traders are still looked upon with a degree of suspicion by some as they seem to simply buy and sell without necessarily producing anything. This may be true, but typically traders are acting on behalf of producers or consumers, and in oil, traders are often closely involved in arranging transport and in packaging larger or mixed product cargoes. Because barriers to entry are low, trading houses quickly see excess profits whittled away by competitors.
This not only makes for a more flexible market, it also increases transparency. The more participants there are in the market, the harder it is to keep secrets, and the greater the number of transactions, the greater the chance of discovering accurate prices. While the futures market deals in paper barrels (see G.1), the physical trading market deals in real, “wet” barrels that need to be exchanged by a particular date. For individual oil products and specific crudes, the spot market is the key pricing

38 ADB Economics Working Paper Series No. 400
mechanism, and a reliable spot price requires a large number of transactions by a large number of unrelated participants. Some spot markets like the low-sulfur waxy residue market in Singapore have become increasingly unreliable simply because there are not enough individual sales.
In terms of physical delivery, at the margin it is the traders in wet barrels who fill in unexpected supply gaps and structure actual delivery. A large, diverse trading market increases fungibility and transparency and is to the benefit of everyone.
I. Destructive Competition?
As presently constructed, sellers of crude and products in the Middle East are an oligopoly; OPEC members (Iran, Iraq, kuwait, Qatar, Saudi Arabia, and the United Arab Emirates) are open about their intentions to try to control prices for their own benefit while Bahrain, Oman, and yemen are essentially going along. On the other side of the transaction are all the Asian oil importers, some negotiating for supply through individual companies, others through national oil companies, and some via joint-venture refineries with Middle Eastern national oil companies.
The largest structure in today’s oil trading is a virtual pipeline that runs from the Middle East to Asia carrying 76% of its oil exports; as mentioned previously, without much realignment in current trading patterns, Asia could take all of it. Without Middle Eastern exports, Asia would be in deep trouble, but without Asia as an export destination, the Middle East would be in trouble just as deep because the rest of the world does not need or want an extra 15 million barrels/day of oil.
Why are the economies in the world’s largest oil-importing region generally paying a premium for crudes and nervous about supply arrangements? The suppliers are an oligopoly and the buyers are a diverse, unorganized market comprising some private companies, some state-owned companies, some governments, some multinationals, and some companies partly owned by the sellers. It is classic example of divide and conquer: The buyers are in competition with each other rather than with the sellers. Can this dynamic be changed? In principle yes, but in practice most Asian buyers tend to regard other Asian buyers as “the competition.” This is the weakest possible position for collective bargaining. A buyer’s alliance is definitely worth exploring as without Asia, Mideast oil would be homeless.
Although it must seem as if the oil-surplus nations are in an enviable position, it is worth keeping in mind that their economies have fluctuated more extremely than any in Asia. When the price of oil is too high, it is an occasion for nervousness; when the price of oil is too low, it is an occasion for despair. Oil is a major concern in Asia as well, but it is one concern among many. In the Middle East, it is the primary concern. In the 1980s, there was an ineffectual producer–consumer dialogue that mainly involved discussions between European importers and Middle Eastern exporters. Today a similar dialogue between Asian importers and Middle Eastern exporters might find substantive issues to discuss. Finally, an unpleasant reality is that the US is spending billions to protect oil supplies that mainly flow to Asia. This makes sense in terms of the market, but it is hard to explain to voters. Ultimately, Asian countries have a greater vested interest in the Straits of Hormuz than do Washington, DC or Brussels. This is also an issue that ought to be considered in any discussions.

39Oil Security Issues in Asia and the Pacific
VII. energy and FInancIal markets In asIa
A. The Futures Market
There is probably no more controversial issue in oil than the effects of the futures markets on prices. There are good arguments that the futures market has acted to increase transparency and has established a worldwide benchmark that sellers cannot ignore; there are equally compelling arguments that futures markets increase price volatility.
Volatility is not always a bad thing. From 1973 to the early 1980s, market prices were to a great extent governed by the expectations of a handful of oil companies and a handful of oil exporters all nervously watching the movement of spot prices (which they also influenced). The system responded only slowly to changes in external circumstances, e.g., from 1979 to 1984, oil prices increased at the same time that demand fell steeply.
The emergence of futures markets let a wider array of participants assess signals from the market and also allowed companies to take out insurance against unanticipated price movements, i.e., to hedge. The futures market often overreacts, often exaggerates trends, and frequently actually moves in illogical directions given the information at hand, but it also corrects itself rapidly. A short spike or trough in the futures market is better than a multiyear disequilibrium in the price of actual crude deliveries.
It is worth noting that the OPEC nations refused for many years to recognize the relevance of the futures markets, but this changed dramatically when Saudi Aramco based its crude prices to North America on the New york Mercantile Exchange (NyMEx) West Texas intermediate (WTI) contracts and its prices to Europe on InterContinental Exchange (ICE) Brent contracts. (This has changed recently as the crude situation in the US has shifted. WTI is now severely underpriced relative to the world market, and the Saudis have adopted pricing to North America on the basis of the Argus Sour Crude Index.) Although the Dubai Mercantile Exchange (DME) was established in 2007 trading contracts on the average of Dubai + Oman prices, Saudi Aramco continues to price its exports to Asia as a premium over Dubai (which amounts to only 60,000 barrels/day of crude) rather than on the DME futures price.
In understanding the role of futures markets, it is important to distinguish between commercial and noncommercial participants. Commercial participants are in the oil business and take positions in the futures market to hedge against physical trades and decisions they are making in the real world. (In some cases, they are also acquiring oil for delivery through the futures exchange, but this is a tiny fraction of the total number of contracts.) There is no question that the futures market provides a vital function for them. Noncommercial participants are investors who are not using the futures market to procure or hedge oil supply. In some cases they are seeking to use oil as a hedge against exposure in other areas; in some cases they are simply speculating hoping to profit by predicting which way the market will move. Speculators have a bad image, but they provide a critical element in the futures market: financial liquidity. For every futures contract sold, there must be a counterparty to buy it; noncommercial participants increase the number of potential counterparties. Since speculators are also more inclined to turn their contracts over rapidly seeking better positions, they add to the overall liquidity of the market.
In the US, there were limits on the involvement of noncommercial participants until 2000 when changes in the laws allowed a much greater degree of noncommercial involvement. Prior to 2000, noncommercial contracts on NyMEx stayed below 30% of the total; at the time of the large oil-price spike in 2008, noncommercial contracts on NyMEx soared to about 55% of the total. The correlation has led to claims that speculation caused or at least sharply accentuated the 2008 price spike. Medlock and

40 ADB Economics Working Paper Series No. 400
Jaffe (2009) suggest that measures should be enacted to return noncommercial participants to lower levels. Others point out that although prices promptly fell in the 2009 recession, they rapidly climbed again in 2010 and 2012 suggesting that the high prices of 2008 were driven by market fundamentals that were temporarily undermined by the financial conditions of 2009 (Jickling, Millar, and Nerurkar 2011). This issue is still a topic of ongoing debate and research.
B. Energy Information Administration Energy and Financial Markets Initiative
By 2009, claims and counterclaims about the role of the futures market in avoiding or creating market distortions had become heated. At this time, Richard Newell, the new EIA administrator, announced the Energy and Financial Markets Initiative with goals under four headings.
• Expanded collection and publication of data. The traditional EIA data gathering efforts have been supplemented with other data to increase market transparency. The goal is to fill in the gaps between physical market conditions and the movements of energy prices in financial markets and to make information on market fundamentals more widely available.
• New analytical reports. In the EIA’s own words (Commodities Now 2009), the goal of this effort is to, “…develop analytical reports that identify the many factors potentially influencing oil and other energy prices—including consumption, production, inventories, spare production capacity, geopolitical risks, speculation, hedging, investment, and exchange rates—and describe the relationship of these factors to prices, the timeframes over which these relationships tend to hold, and the mechanisms underlying them.” This rather sweeping agenda also will feed into existing price forecasts by attempting to quantify uncertainty bands around forecast numbers.
• Outreach efforts. The twin goals of this effort are to assemble panels of experts on the relationship between energy and finance and also to make the results of studies on the topic available to the public including to investors.
• Interdepartmental coordination. The EIA has established working relationships with the Commodity Futures Trading Commission, the Department of the Treasury, the Federal Energy Regulatory Commission, the Federal Reserve, the Federal Trade Commission, and the Securities and Exchange Commission.
This initiative should be understood as both a research effort and as a tool for increasing market transparency as transparency is critical to the efficient functioning of a futures market.
To date, the main results have been a number of new publications and data services as well as some collaborative research efforts. A good deal of academic research on the 2008 price spike has also been sponsored, but no definitive conclusions have been reached. There is some evidence that it was driven by market fundamentals, but there are also suggestions that the trends in the market fundamentals may have helped create a “bubble” in the price (Newell 2011).
Additional research should help to clarify these matters, but the emerging consensus is that although futures markets may contribute to very short-term price volatility, they are incapable of creating persistent price changes. Put another way, without a futures market, prices might not rise quite as high, but they also might stay high longer. Speculators are not a group with a common objective; one may attempt to move the market higher but another will be acting to move it lower.
41Oil Security Issues in Asia and the Pacific
C. Oil Futures Markets in Asia as an Instrument for Security
For crude oil buyers or sellers or for refiners, futures markets are a fundamental form of insurance; hedging is a way of buying a fallback position on tactical moves in the market and limiting losses. For Asia, the problem with the NyMEx and ICE futures markets as they stand is that they are ultimately so thin and so distantly related to the markets they serve. A Japanese refiner taking positions in WTI and Brent is buying some insurance against movements in prices in his own crude slate, but major futures markets operating locally based on crudes of interest in the region would be much more useful.
The DME Dubai/Oman contract does offer a logical alternative to NyMEx WTI or to ICE Brent. As discussed before, almost all Middle Eastern oil moves to Asia, so a futures contract based on two Middle Eastern crudes with long histories of spot trading offers an important option for buyers in Asia who wish to hedge their exposures. Although the DME has been successful and is now firmly established, it is a puzzle that it has not become a rival in size to NyMEx or ICE. After all, the Middle East-to-Asia oil trade is now the largest oil flow in the world. DME is dominated by physical trade compared to NyMEx or ICE where paper trade is the rule. Companies in Asia should be encouraged to use DME to hedge as its connection to the Asian market is direct while Brent is distant and WTI is at least for a few years disconnected from the world oil market.
There is a larger question here than individual company hedging, however. In November of 2012, Japan announced plans to open a futures market in liquefied natural gas (lNG) by 2014. lNG buyers seldom need to hedge. Contracts run for long terms and are very specific, usually take-or-pay with tight ranges of volume, so opportunities for hedging are limited. Japan is hoping to create a real market in lNG, one in which the futures price will create a market indicator that sellers cannot ignore when offering contracts. One contribution NyMEx and ICE futures markets have made is to provide public, open price benchmarks. The prices may be volatile, but the sheer number of transactions means that they are not subject to manipulation (as opposed to certain thin spot markets). Once a futures market is established and trading at a high rate, it becomes difficult for sellers to ignore. DME has not crossed this threshold. Rather than setting prices for the region, it is still a place where buyers go to procure physical crude.
It is both amusing and disturbing that the NyMEx WTI contract is no longer a market indicator and in Asia, the largest oil market, there is no established, highly traded market indicator. The only price clarity is provided by the ICE Brent contract—a group of crudes produced on the other side of the world. A major futures market east of Suez would have many benefits, but one of the biggest would be to establish Asian-driven pricing that would help control pricing behavior and link it to a market large enough that manipulation would be impossible. The DME seemed to hold out this promise and may still work at that level but not until paper trades rather than wet barrels play a major role.
If the DME cannot succeed as a market indicator—and that remains to be seen—what other possibilities are there? The only crude with the volume and potential to step into this role is the Russian Federation’s Eastern Siberia–Pacific Ocean (ESPO) pipeline crude. This is a crude oil with an increasing volume of exports into East Asia that is lower in sulfur than many and therefore arguably a better match to Asian crudes, though not to Asian crude imports.
ESPO is a possible basis for a futures market, but there are many unresolved questions about how such a market would be structured. The way ESPO is priced today, most of the contracts are based on Dubai and Murban—two Middle Eastern crudes. In any case, a futures market price east of Suez

42 ADB Economics Working Paper Series No. 400
would greatly improve clarity in Asian oil pricing. It matters little whether the basis is DME, or ESPO, or both. The problem is not the basis of the contract—Dubai and Oman are perfect representatives of Asian imports—the problem is that importing companies in Asia have chosen not to use the DME for hedging, and noncommercial participants are still on the sidelines.
VIII. summary oF PolIcy recommendatIons
1. Oil Product Subsidies
In general, overall price subsidies are less of a problem in Asia today than in past as many of the most egregious issues have been addressed. Pricing levels still, however, remain a challenge in some economies. A more subtle problem is differential pricing among different fuels as it often creates unpredicted distortions. If social welfare is the goal, oil-pricing policies are a very crude tool. Pricing above external-market levels can have adverse effects if carried too far, but pricing above the external market can also have benefits in terms of supporting the development of other resources and slowing the growth in demand for oil.
2. Oil Stockpiles and Oil-Sharing Arrangements
Oil stockpiles are a useful cushion against extreme fluctuations in the market; in fact, keeping low levels of stock might even be characterized as bad business practice. The big threat in today’s market is not targeted cutoffs of oil supplies as this is no longer a practical proposition. Today the problem is one of price spikes, and there is no doubt that strategic reserves can help counter them.
To date, however, strategic oil reserves have not generally been used to their full potential. In the Republic of korea, the borrow-and-repay option is an excellent union of national strategy and tactical considerations, and the concept of allowing major exporting countries to store oil locally is one that could enhance oil security while offering commercial advantages. The concept in Japan of allowing other countries to participate in their national strategic oil reserve is also important. Regional or multi-country reserves may make more sense than national stockpiling.
There is nothing wrong with oil-sharing agreements, but the problem that they anticipate—the cutoff of supply to a single country—is improbable in today’s market. Such agreements are still useful in the event of natural disasters, and some sort of oil-sharing or drawdown agreement needs to be in place for sharing centralized tanks.
3. Unconventional Gas
The gas supply is perhaps the greatest unknown in future Asian oil demand. It is to everyone’s benefit to characterize Asia’s unconventional gas and potential shale liquid resources as soon as possible.
4. Refining Configuration
Most Asian refineries are poorly equipped to deal with the super-heavy crudes of the Americas—the largest remaining undeveloped oil resources. This does not mean that there should be a regional policy initiative on refining, but crude exports from the Middle East and Africa will not be sufficient to cope with growing demand.
43Oil Security Issues in Asia and the Pacific
5. Harmonization of Product Specifications
Oil cannot flow freely when there are differing product specifications; fungibility would be greatly increased if there were some degree of standardization. This does not mean that every country must adopt a uniform set of specifications, but it should be possible to agree on where limits are needed.
6. Overseas Investment and Trading
Overseas investment and trading by Asian companies are sometimes advocated as a way of obtaining dedicated oil resources. There are many other potential benefits. Overseas expansion by Asian oil companies should be encouraged to enhance energy security.
7. Consumer–Producer Dialogue
Asia now consumes about 76% of all Middle Eastern oil exports, yet Asian buyers pay premiums. The time may be ripe to have a multilateral discussion on terms and guarantees. Obviously a discussion with all buyers is not practical, but if even a few of the largest buyers (PRC, India, Japan, and the Republic of korea) opened a dialogue, there could be room for reducing uncertainty on both sides of the table. Furthermore, although it is a delicate issue, the security of Middle Eastern exporters is now more important to Asian importers than to the US. This issue has not been widely recognized, but it is reaching a stage where it needs to be discussed.
8. Futures Markets East of Suez
Futures markets have transformed how business is done in oil, but there is not yet a benchmark futures market east of Suez. The Dubai Mercantile Exchange (DME) is up and running, yet it hasn’t become a touchstone for pricing or even hedging because there are not enough paper transactions. Even though Dubai and Oman are excellent representatives of Asian imports from the Middle East, the DME is still underused. There are options for other futures markets such as the Eastern Siberia–Pacific Ocean (ESPO); the problem is not the crude basis but that trading on those markets remains underdeveloped. The result is that events in the North Sea affect Asian prices more than dynamics within Asia do. Rather than fearing the futures markets, Asian governments should be encouraging companies to use them for hedging. Whether it is DME, or ESPO, or both, flourishing futures markets in Asia would help to ensure fair pricing and to moderate long-term price fluctuations.
Asia is already the world’s largest oil-importing region, larger than North America and Europe combined. In any scenario, this disproportionate role seems bound to increase which will make Asia a region increasingly dependent on oil imports and will make oil security a prominent economic and political issue. With this great dependency, however, comes a massive increase in market power. Asia is now the center of the world oil market, but the world—and Asia—have not yet realized it.

44 Reference
reFerences
Bamberger, C. 2004. The History of the International Energy Agency 1974–2004: IEA The First 30 Years. Volume 4: Supplement to Volumnes I, II & III. Paris: Organisation for Economic Co-operation and Development (OECD)/IEA.
Bastani, P., J.B. Heywood, and C. Hope. 2012. U.S. CAFE Standards: Potential for Meeting Light-Duty Vehicle Fuel Economy Targets, 2016–2025. Cambridge, MA: MIT Energy Initiative. http://web.mit. edu/sloan-auto-lab/research/beforeh2/files/CAFE_2012.pdf
British Petroleum (BP). 2012. BP Statistical Review of World Energy June 2011. london. http://www. bp.com/statisticalreview
Bullis, k. 2012. Shale Oil Will Boost U.S. Production, But It Won’t Bring Energy Independence. MIT Technology Review. 15 November. http://www.technologyreview.com/news/507446/shale-oil- will-boost-us-production-but-it-wont-bring-energy-independence/
Burns, J. 2012. Natural Gas in Transport: Tomorrow’s Fuel Today. Presentation at the 17th International Conference and Exhibition on liquefied Natural Gas (lNG 17). Houston. 16–19 April. http:// www.gastechnology.org/Training/Documents/lNG17-proceedings/7-5-James_Burns_354.pdf
Chung, J. 2013. Asian Petrochemical Feedstock Market Outlook. Paper at lPGC Japan 2013 Exchange Seminar. Tokyo. 31 January. http://www.lpgc.or.jp/corporate/exchange seminar2013presentation/9_jiwon_chung_opis.pdf
Commodities Now. 2009. EIA launches Energy and Financial Markets Initiative. 9 September. http:// www.commodities-now.com/news/power-and-energy/655-eia-launches-energy- and-financial-markets-initiative.html
Deal, A.l. 2012. What Set of Conditions Would Make the Business Case to Convert Heavy Trucks to Natural Gas? – A Case Study. NEPI Working Paper. Tulsa, Ok: National Energy Policy Institute. http://nepinstitute.org/publications/what-set-of-conditions-would-make-the-business- case-to-convert-heavy-trucks-to-natural-gas-%e2%80%93-a-case-study/
Eilperin, J. and S. Mufson. 2012. Obama Administration Rejects keystone xl Pipeline. Washington Post. 18 January. http://articles.washingtonpost.com/2012-01-18/national/35440450_1_keystone- xl-kerri-ann-jones-oil-sands
FACTS Global Energy (FGE). 2012a. Spring 2012 Asia–Pacific Oil Databook I: Supply, Demand, & Prices. london.
———. 2012b. Fall 2012 Asia–Pacific Oil Databook I: Supply, Demand, & Prices. london.
———. 2012c. FGE Databook Database System. london.
———. 2012d. Fall 2012 Asia–Pacific Oil Databook III: Refinery Configuration and Construction london. Frankel, P. 1946. Essentials of Petroleum. New york: Frank Cass and Company.

45Reference
Government of the United States, Energy Information Administration (EIA). 2009. How Much Does It Cost to Produce Crude Oil and Natural Gas? Frequently Asked Questions. http://www.eia.gov/ tools/faqs/faq.cfm?id=367&t=5
———. 2012. Annual Energy Outlook 2012. Washington, DC. http://www.eia.gov/forecasts/archive/ aeo12/
———. 2013. US Exports of Crude Oil and Petroleum Products. EIA website. http://www.eia.gov/dnav/ pet/pet_move_exp_dc_NUS-Z00_mbblpd_a.htm
Government of Canada, National Energy Board (NEB). 2011. Canada’s Energy Future: Energy Supply and Demand Projections to 2035—Energy Market Assessment. http://www.neb-one.gc.ca/clf-nsi/ rnrgynfmtn/nrgyrprt/nrgyftr/2011/nrgsppldmndprjctn2035-eng.html
Hook, l. 2011. Asia moves to shore up strategic oil reserves. Financial Times. 2 March. http://www.ft.com/ cms/s/0/7fec8ae8-44fe-11e0-80e7-00144feab49a.html#axzz2gWkNfat
International Energy Agency (IEA). 2008. World Energy Outlook 2008. Paris: Organisation for Economic Co-operation and Development (OECD) and IEA.
———. 2012a. Energy Balances of OECD Countries. Paris: OECD and IEA.
———. 2012b. Energy Balances of Non-OECD Countries. Paris: OECD and IEA.
———. 2012c. World Energy Outlook 2012. Paris: OECD and IEA. http://www.worldenergyoutlook.org/ publications/weo-2012/
———. 2012d. Energy Statistics of OECD Countries. Paris: OECD and IEA.
———. 2012e. Energy Statistics of Non-OECD Countries. Paris: OECD and IEA.
———. 2013. Oil Information 2013. Paris: OECD and IEA.
International Energy Forum (IEF). 2012. Introductory Paper. Paper prepared by IEF in consultation with the International Energy Agency (IEA) and the Organization of the Petroleum Exporting Countries (OPEC) for IEA–IEF–OPEC Symposium on Energy Outlooks in Riyadh, Saudi Arabia, on 23–24 January. http://www.ief.org/_resources/files/events/2nd-iea-ief-opec-symposium- on-energy-outlooks/introductory-paper.pdf
Jickling, M., R.S. Millar, and N.Nerurkar. 2011. Speculation, Fundamentals, and Oil Prices. Washington, DC: Congressional Research Service. http://www.hsdl.org/?view&did=718960
kang, D. and J.-y. lee. 2007. Japan–[Republic of] korea Relations: Treading Water, little Progress. Comparative Connections. 9 (2). pp. 147–157. http://csis.org/files/media/csis/pubs/0702qjapan_ korea.pdf
kelley-Detweiler, P. 2012. Acceleration of the Natural Gas Highway. Forbes. 13 November. http://www. forbes.com/sites/peterdetwiler/2012/11/13/acceleration-of-the-natural-gas-highway/

46 Reference
kootungal, l. 2012. 2012 Refining Survey. Oil and Gas Journal. 110 (12).
Mackenzie, k. 2012. Marginal Oil Production Costs are Heading towards $100/Barrel. Financial Times— FT Alphaville. 2 May. http://ftalphaville.ft.com/2012/05/02/983171/marginal-oil-production- costs-are-heading-towards-100barrel/?
Marasigan, F. and P.A. Isla. 2011. Oil-Sharing Deals Pitched for Philippines. Business Mirror. 3 March. http://www.abs-cbnnews.com/business/03/06/11/oil-sharing-deals-pitched-philippines
Medlock III, k., and A. Jaffe. 2009. Who is in the Oil Futures Market and How Has it Changed? Houston: Rice University, James A. Baker III Institute for Public Policy.
Meech, R. 2010. Emission Control Areas (ECAs). Presentation at the International Maritime Organization Regional Workshop on the Ratification and Implementation of Marpol Annex VI. Athens. 26–27 October. http://www.euromedtransport.eu/Fr/image.php?id=2174
Newell, R. 2011. Energy and Financial Markets Overview: Crude Oil Price Formation. IEA presentation to the American Society of Petroleum Engineers, Capital Section, in Washington, DC on 23 February. http://www.eia.gov/pressroom/presentations/newell_02232011.pdf
Nicholas, F. 2009. ASEAN Energy Cooperation: An Increasingly Daunting Challenge. Paris: Institut Francais des Relations Internationales (IFRI). http://www.ifri.org/?page=contribution-detail&id=5481&id_ provenance=103&provenance_context_id=16.&style=big&lang=uk
Platts. 2013. Shell Proceeds with FEED for lNG Import Facility in Philippines. Platt’s Oilgram News. 2 July. http://www.platts.com/latest-news/natural-gas/singapore/shell-proceeds-with-feed-for-lng- import-facility-27146929
Warwick, G. 2012. lNG Propulsion—A Cool Idea? Aviation Week Online. 19 March. http://www. aviationweek.com/Blogs.aspx?plckBlogId=Blog:a68cb417-3364-4fbf-a9dd-4feda680ec9c&p lckPostId=Blog%3Aa68cb417-3364-4fbf-a9dd-4feda680ec9cPost%3A00f49124-7f6b-4fec- 9bdb-fae7095ba3b1
World Bank. 2013a. Pump Price for Gasoline (US$ per liter). World Development Indicators. http://data. worldbank.org/indicator/EP.PMP.SGAS.CD (accessed 31 January 2013)
———. 2013b. Commodity Prices Have Weakened in Response to New Capacity. World Economic Prospects.Washington, DC. http://web.worldbank.org/WBSITE/ExTERNAl/ExTDEC/ ExTDECPROSPECTS/ExTGBlPROSPECTSAPRIl/0,,contentMDk:23419347~menuPk:9210 356~pagePk:2470434~piPk:4977459~theSitePk:659149,00.html

Oil Security Issues in Asia and the Pacific
This paper asserts that the goal of oil security is to make domestic economies and the international market adaptable to changes in availability and price. Measures that can strengthen oil security include increasing oil production and decreasing demand; producing more alternatives; and raising stocks, fungibility, and market responsiveness. Subsidies, however, tend to diminish oil security.
About the Asian Development Bank
ADB’s vision is an Asia and Pacific region free of poverty. Its mission is to help its developing membercountries reduce poverty and improve the quality of life of their people. Despite the region’s many successes,it remains home to approximately two-thirds of the world’s poor: 1.6 billion people who live on less than $2a day, with 733 million struggling on less than $1.25 a day. ADB is committed to reducing poverty throughinclusive economic growth, environmentally sustainable growth, and regional integration.
Based in Manila, ADB is owned by 67 members, including 48 from the region. Its main instruments forhelping its developing member countries are policy dialogue, loans, equity investments, guarantees, grants,and technical assistance.
ASIAN DEVELOPMENT bANK6 ADB Avenue, Mandaluyong City1550 Metro Manila, Philippineswww.adb.org