
October 13-16, 2019 Warsaw, Poland - Asian-Pacific ...
715
October 13-16, 2019 Warsaw, Poland Thirty-First Asian-Pacific Conference on International Accounting Issues 2019 Virtual Solutions For Digital Economy: Accounting & Beyond
-
Upload
khangminh22 -
Category
Documents
-
view
0 -
download
0
Transcript of October 13-16, 2019 Warsaw, Poland - Asian-Pacific ...
October 13-16, 2019Warsaw, Poland
Thirty-First Asian-Pacific Conference on International Accounting Issues 2019
Virtual Solutions For Digital Economy: Accounting & Beyond


Contents
Conference Advisory Committee Members 4
Conference Executive Committee 5
Conference Assistants 5
Best Paper Awards Selection Committee 5
Reviewers for papers 6
Conference Program 7
Profiles� 28
Conference�Host,�Patrons,�Partners�and�Sponsors� 38

4
Conference Advisory Committee Members
Ali Peyvandi (Chair), California State University, Fresno, U.S.A.
Susan Henderson (Vice Chair), California State University, Fresno, U.S.A.
Marie-Jose Albert-Batt, Burgundy School of Business, Dijon, France
Dhia AlHashim, California State University, Northridge, U.S.A.
Bhabatosh Banerjee, Indian Institute of Management Calcutta (IIMC), India
C.S. Agnes Cheng, The Hong Kong Polytechnic University, Hong Kong
Rong-Ruey Duh, National Taiwan University, Taiwan
Keitha Dunstan, Bond University, Australia
Alvaro Gasca Neri, EY, Mexico
Sidney Gray, The University of Sydney, Australia
Siti Nurwahyuningsih Harahap, Universitas Indonesia, Indonesia
Mostafa K. Hassan, Qatar University, U.A.E.
Joanna Ho, University of California Irvine, U.S.A.
Simon Ho, Hang Seng Management College, Hong Kong
In Ki Joo, Yonsei University, Korea
Susela Devi K. Suppiah, SUNWAY University, Malaysia
Peter Kajüter, University of Münster, Germany
Danuja Kunpanitchakit, Chulalongkorn University, Thailand
Yue Li, University of Toronto, Canada
Marc Massoud, Claremont McKenna College, U.S.A.
Salima Paul, University of Plymouth, U.K.
Shirley Polejewski, University of St. Thomas, U.S.A.
Behnaz Quigley, Marymount University, U.S.A.
Edson Luiz Riccio, University of Sao Paulo, Brazil
Katherine Schipper, Duke University, U.S.A.
Cindy Yoshiko Shirata, Tsukuba Gakuin University, Japan
Sylvia Veronica Siregar, Universitas Indonesia, Indonesia
Tom Smith, University of Queensland, Australia
Benjamin Tai, California State University, Fresno, U.S.A.
Tony van Zijl, Victoria University of Wellington, New Zealand
Thirty-First�Asian-Pacific�Conference�on�International�Accounting�Issues

5
Conference Executive Committee
Conference Assistants
Best Paper Awards Selection Committee
Marek Rocki, Rector, SGH Warsaw School of Economics, Poland
Ali�Peyvandi,�Asian-Pacific�Conference�on�International�Accounting�Issues,�U.S.A.
Anna�Karmańska,�Director,�Institute�of�Accounting,�SGH�Warsaw�School�of�Economics,�Poland
California State University, Fresno:
Crystal Cui, California State University, Fresno, U.S.A.
Debbie Koehler, California State University, Fresno, U.S.A.
Jeff�Solano,�California�State�University,�Fresno,�U.S.A.
SGH Warsaw School of Economics:
Katarzyna Bareja, SGH Warsaw School of Economics, Poland
Magdalena�Giedroyć,�SGH�Warsaw�School�of�Economics,�Poland
Katarzyna Klimczak, SGH Warsaw School of Economics, Poland
Małgorzata�Mierzejewska,�SGH�Warsaw�School�of�Economics,�Poland
Magdalena Zadroga, SGH Warsaw School of Economics, Poland
and other colleagues from Institute of Accounting, SGH Warsaw School of Economics, Poland
Susela Devi K. Suppiah, Chair, SUNWAY University, Malaysia
Peter Kajüter, University of Münster, Germany
Albert Tsang, York University, Canada

6
Reviewers for papers
Susan Henderson, California State University, Fresno, U.S.A.
Bhabatosh Banerjee, Indian Institute of Management Calcutta (IIMC), India
K.C. Chen, California State University, Fresno, U.S.A.
C.S. Agnes Cheng, The Hong Kong Polytechnic University, Hong Kong
Rong-Ruey Duh, National Taiwan University, Taiwan
Adrian Gepp, Bond University, Australia
Siti Nurwahyuningsih Harahap, Universitas Indonesia, Indonesia
Joanna Ho, University of California Irvine, U.S.A.
Simon Ho, Hang Seng Management College, Hong Kong
Janice Hollindale, Bond University, Australia
Gary Monroe, UNSW Sydney, Australia
Susela Devi K. Suppiah, SUNWAY University, Malaysia
Peter Kajüter, University of Münster, Germany
Hyung Tae Kim, California State University, Fresno, U.S.A.
Danuja Kunpanitchakit, Chulalongkorn University, Thailand
Shu Lin, California State University, Fresno, U.S.A.
Fernando Parra, California State University, Fresno, U.S.A.
Salima Paul, University of Plymouth, U.K.
Ali Peyvandi, California State University, Fresno, U.S.A.
Tatyana Ryabova, California State University, Fresno, U.S.A.
Cindy Yoshiko Shirata, Tsukuba Gakuin University, Japan
Sylvia Veronica Siregar, Universitas Indonesia, Indonesia
Benjamin Tai, California State University, Fresno, U.S.A.
Tony van Zijl, Victoria University of Wellington, New Zealand

7
Sunday, October 13
� 12:00�p.m.�–�5:00�p.m.�General registration / Foyer
� 3:00�p.m.�–�4:00�p.m.�Workshop – 1 / Amsterdam/Athens
International Business Communication Standards, IBCS®, as a concept for unified visual notations of
management reports, presentations and dashboards
Workshop Leader:
Edyta Szarska, IBCS Institute Trainer, Poland
� 6:00�p.m.�–�8:00�p.m.�Welcome Reception / Foyer
Welcome Remarks:
Jacek Prokop, Vice Rector, International Relations, SGH Warsaw School of Economics, Poland
Ali�Peyvandi,�Conference�Chairman,�Asian-Pacific�Conference�on�International�Accounting�Issues,�U.S.A.
Anna�Karmańska,�Director,�Institute�of�Accounting,�SGH�Warsaw�School�of�Economics,�Poland
Conference Program

8
Monday, October 14
� 8:00�a.m.�–�5:00�p.m.�General Registration / Foyer
� 8:30�a.m.�–�9:15�a.m.�Opening Ceremony / Grand Ballroom
Master of Ceremonies: Tomasz Wielicki, Professor Emeritus, California State University, Fresno, U.S.A.
Welcoming Remarks: Ali�Peyvandi,�Conference�Chairman,�Asian-Pacific�Conference�on�International�Accounting�Issues,�U.S.A.
Krzysztof�Kozłowski,�Vice�Rector,�Provost,�SGH�Warsaw�School�of�Economics,�PolandJustyna Adamczyk, Director, Department of Accounting and Audit, Ministry of Finance, PolandBodo Richardt, President, European Federation of Accountants and Auditors, Germany
� 9:15�a.m.�–�10:15�a.m.�Keynote Speech / Grand Ballroom
What is the place for ethics in the digital economy? Paul Dembinski, Dr.h.c., Director, Observatoire de la Finance, Switzerland
New technologies in finance – case of Warsaw Stock Exchange Marek Dietl, President, Warsaw Stock Exchange, Poland
� 10:15�a.m.�-�10:30�a.m.�Coffee Break / Foyer
� 10:30�a.m.�–�11:45�a.m.�The Oxford Debate / Grand Ballroom
The thesis: Virtual solutions in digital economy will cause more financial turbulence
Marshal and Debate Expert: Grzegorz Nawrocki, Journalist, Poland
Secretary of the Debate:Michał�Kaczmarski,�Institute�of�Accounting,�SGH�Warsaw�School�of�Economics,�President,�Management�Board,�National�Organization�for�the�Verification�of�Drug�Authenticity,�Poland
Conference Program
Thirty-First�Asian-Pacific�Conference�on�International�Accounting�Issues

9
Speakers:
Vikas�Aggarwal,�Regional�Head,�Policy�–�Emerging�Markets,�Association�of�Chartered�Certified�
Accountants, U.K.
Mira Mech, Head, Global Business Services Center /Board Member, AkzoNobel, Poland
Przemysław�Mencel,�FCMA,�CGMA,�Group�CFO,�Etrose�Holding�Grupa�Raisead,�Poland
Mikołaj�Pindelski,�Head,�Principles�for�Responsible�Management�Education�Chapter�Board�
Member, SGH Warsaw School of Economics, Poland
Beata Seta, Global Operation Manager - Signify, Poland
Agnieszka Stachniak, Vice Director, Department of Accounting and Auditing, Ministry of Finance, Poland
Commentators:
Paul Dembinski, Dr.h.c., Director, Observatoire de la Finance, Switzerland
Michael Favere-Marchesi, President, Canadian Academic Accounting Association, Canada
Bodo Richardt, President, European Federation of Accountants and Auditors, Germany
Tomasz Wielicki, Professor Emeritus, California State University, Fresno U.S.A.
Audience:
Participants�of�the�31st�Asian-Pacific�Conference�on�International�Accounting�Issues
� 11:45�a.m.�–�12:15�p.m.�An Appeal for a Global Ethics Framework and a Tool-Kit for Ethics
Self-Assessment / Grand Ballroom
Anna�Karmańska,�Director,�Institute�of�Accounting,,�SGH�Warsaw�School�of�Economics,�Poland,�
Grzegorz Nawrocki, Journalist, Poland
� 12:15�p.m.�–�1:30�p.m.�Luncheon / Foyer
Host:
Hanna Godlewska-Majkowska, Vice Rector, Outreach, SGH Warsaw School of Economics, Poland
10
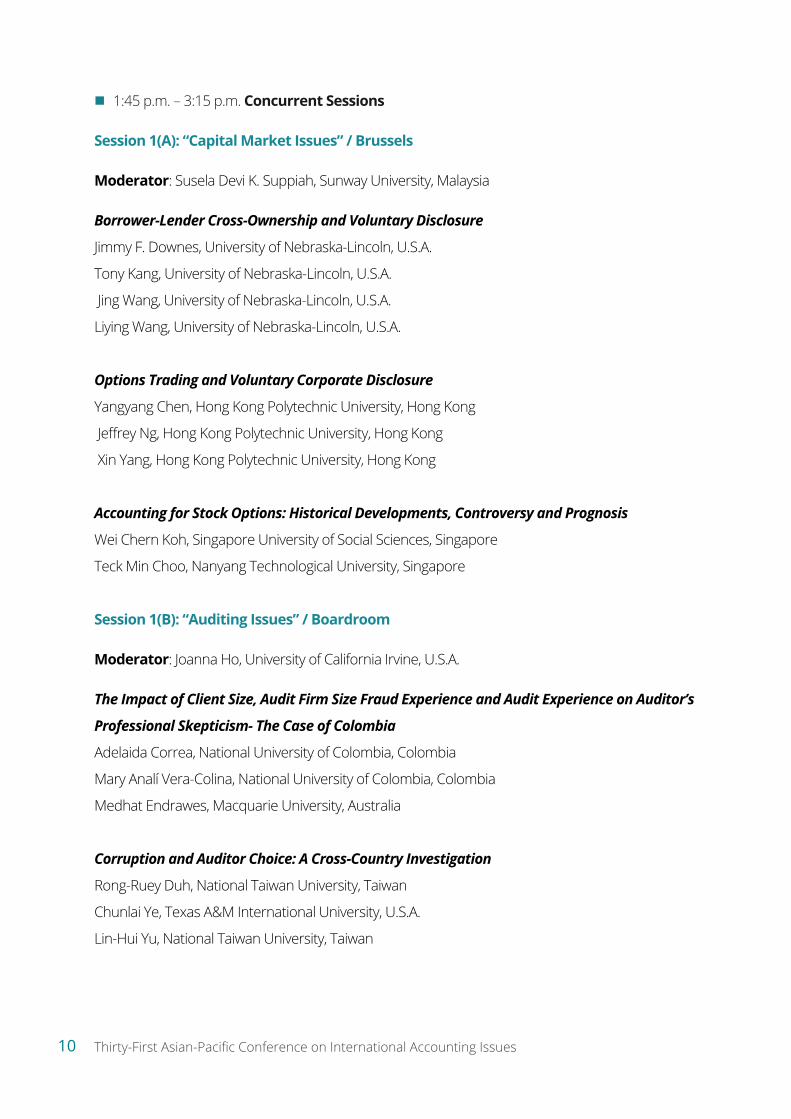
� 1:45�p.m.�–�3:15�p.m.�Concurrent Sessions
Session 1(A): “Capital Market Issues” / Brussels
Moderator: Susela Devi K. Suppiah, Sunway University, Malaysia
Borrower-Lender Cross-Ownership and Voluntary Disclosure
Jimmy F. Downes, University of Nebraska-Lincoln, U.S.A.
Tony Kang, University of Nebraska-Lincoln, U.S.A.
Jing Wang, University of Nebraska-Lincoln, U.S.A.
Liying Wang, University of Nebraska-Lincoln, U.S.A.
Options Trading and Voluntary Corporate Disclosure
Yangyang Chen, Hong Kong Polytechnic University, Hong Kong
�Jeffrey�Ng,�Hong�Kong�Polytechnic�University,�Hong�Kong
Xin Yang, Hong Kong Polytechnic University, Hong Kong
Accounting for Stock Options: Historical Developments, Controversy and Prognosis
Wei Chern Koh, Singapore University of Social Sciences, Singapore
Teck Min Choo, Nanyang Technological University, Singapore
Session 1(B): “Auditing Issues” / Boardroom
Moderator: Joanna Ho, University of California Irvine, U.S.A.
The Impact of Client Size, Audit Firm Size Fraud Experience and Audit Experience on Auditor’s
Professional Skepticism- The Case of Colombia
Adelaida Correa, National University of Colombia, Colombia
Mary Analí Vera-Colina, National University of Colombia, Colombia
Medhat Endrawes, Macquarie University, Australia
Corruption and Auditor Choice: A Cross-Country Investigation
Rong-Ruey Duh, National Taiwan University, Taiwan
Chunlai Ye, Texas A&M International University, U.S.A.
Lin-Hui Yu, National Taiwan University, Taiwan
Thirty-First�Asian-Pacific�Conference�on�International�Accounting�Issues

11
External Auditors’ Reliance on Management’s Experts: The Effects of a Pre-Engagement Conversation
and Past Auditor-Client Relationship
Prerana Agrawal, The University of Western Australia, Australia
Isabel Z. Wang, The Australian National University, Australia
David�Woodliff,�The�University�of�Western�Australia,�Australia
Session 1(C): “Financial Accounting Issues” / Vienna
Moderator:�Monika�Łada,�University�of�Science�and�Technology,�Poland
An Empirical Investigation of The Effect of Powerful CFOS on Disclosure Quality
Lutfa Tilat Ferdous, La Trobe University, Australia
Kamran Ahmed, La Trobe University, Australia
Darren Henry, La Trobe University, Australia
Why Does Large Pay Disparity Adversely Affect Firm Performance in Korea?
Jeongtaek Kim, Korea University, Korea
Characteristics of High-Growth Firms in Thailand
Kanitsorn Terdpaopong, Rangsit University, Thailand
Bernice Kotey, University of New England, Australia
Nam Hoang, University of New England, Australia
Session 1(D): “Corporate Social Responsibility Issues” / Rome
Moderator:�Mikołaj�Pindelski,�SGH�Warsaw�School�of�Economics,�Poland
Stakeholder Importance and Corporate Social Responsibility: Evidence from a Quasi-Natural
Experiment
CS Agnes Cheng, Hong Kong Polytechnic University, Hong Kong
Xiaohui Li, Hong Kong Polytechnic University, Hong Kong
Zeyu Sun, University of International Business and Economics, China
Jing Xie, Hong Kong Polytechnic University, Hong Kong

12
Does CSR Really Enhance Sustainability? A Perspective of Business Cycle
Kwang Hwa Jeong, Kangwon National University, Korea
Sejoong Lee, University of Seoul, Korea
Developing a Corporate Sustainability Reporting Framework in an Emerging Economy
Bita Mashayekhi, University of Tehran, Iran
Hossein Shaker Taheri, Islamic Azad University-Islamshahr, Iran
Mehdi Momeni Taheri, Islamic Azad University-Islamshahr, Iran
Session 1(E): “Managerial Accounting Issues” / Paris
Moderator: Fernando Parra, California State University, Fresno, U.S.A.
Job Hopping and Innovation Efficiency: Evidence from China
Yuan Yuan Hu, Massey University, New Zealand
Jing Jia, University of Tasmania, Australia
Zhongtian Li, Queensland University of Technology, Australia
Baoshan Tao, Zhejiang Sci-Tech University, China
Limited Availability in Crowdfunding Projects – Guarantee for Profitability?
Alexander Fox, Ilmenau University of Technology, Germany
Jana Neuland, Ilmenau University of Technology, Germany
Can Board Diversity Have an Effect on Decision Making for Investment? – A Preliminary Analysis of
Corporate Governance in Japan
Chieko Matsuda, Tokyo Metropolitan University, Japan
Session 1(F): “Corporate Governance Issues” / Sofia
Moderator:�Zbigniew�Polański,�SGH�Warsaw�School�of�Economics,�Poland
Corporate Governance and Investment Decisions: An Experimental Study on Real Investors
ATM Tariquzzaman, Victoria University of Wellington, New Zealand
Ian Eggleton, Victoria University of Wellington, New Zealand
Tony van Zijl, Victoria University of Wellington, New Zealand
Thirty-First�Asian-Pacific�Conference�on�International�Accounting�Issues

13
Does Corporate Governance Disclosure Play the Role of Information Feedback in Korea?
Jun Yeung Hong, Korea University, Korea
Sook Min Kim, Solbridge International School of Business, Korea
Seung Weon Yoo, Korea University, Korea
Does the Board of Commissioner Monitor Business Strategies Effectively?
Dianwicaksih Arieftiara, Universitas Pembangunan Nasional Veteran Jakarta, Indonesia
Session 1(G): “International Financial Reporting Standards Issues” / London
Moderator: Cindy Yoshiko Shirata, Tsukuba Gakuin University, Japan
IFRS Adoption and Earnings Quality: Evidence from a Staged Convergence Approach
D’yan Sukartha, Queensland University of Technology, Australia
Stuart Tooley, Queensland University of Technology, Australia
Peter Green, Queensland University of Technology, Australia
Institutional Theory Perspective on Recording and Managing Asset Data in the Public Health
Sector
Nirmala Nath, Massey University, New Zealand
Yuan Yuan Hu, Massey University, New Zealand
Shirley Chan, Auckland District Health Board, New Zealand
� 3:15�p.m.�–�3:30�p.m.�Coffee Break / Foyer

14
� 3:30�p.m.�–�5:00�p.m.�Concurrent Sessions
Session 2(A): “Capital Market Issues” / Brussels
Moderator: C.S. Agnes Cheng, The Hong Kong Polytechnic University, Hong Kong
Analysis of Insolvency Risks and Financial Performances of Banks in Thailand
Metjiranont Theeraseth, Ubon Ratchathani University, Thailand
Sodsongkrit Metcha, Ubon Ratchathani University, Thailand
Is there Evidence of Post-Earnings Announcement Drift in Latin America?
Ervin Black, University of Oklahoma, U.S.A.
Gerlando Lima, University of Illinois, U.S.A.
Verônica Santana, University of Sao Paulo, Brazil
Do Investors Exploit Bank Earnings Management Information to Earn Profits in Stock Markets: A
Case of Asia Pacific?
Nguyen N.T. Vo, Eastern International University, Vietnam
Thai V.H. Nguyen, RMIT University Vietnam, Vietnam
Duc T.H. Phan, RMIT University, Australia
Session 2(B): “International Financial Reporting Standards Issues” / London
Moderator:�Edyta�Łazarowicz,�SGH�Warsaw�School�of�Economics,�Poland
Accountability and Aggressive Financial Reporting Judgments
Peipei Pan, Macquarie University, Australia
Chris Patel, Macquarie University, Australia
Comprehensive Income and Credit Risk: Evidence from Japan
Tomohiro Suzuki, Asia University, Japan
Koreyoshi Seki, Asia University, Japan
IFRS Adoption and Seasoned Equity Offering Underperformance
Solomon Opare, Victoria University of Wellington, New Zealand
Muhammad Nurul Houqe, Massey University, New Zealand
Tony van Zijl, Victoria University of Wellington, New Zealand
Thirty-First�Asian-Pacific�Conference�on�International�Accounting�Issues
15
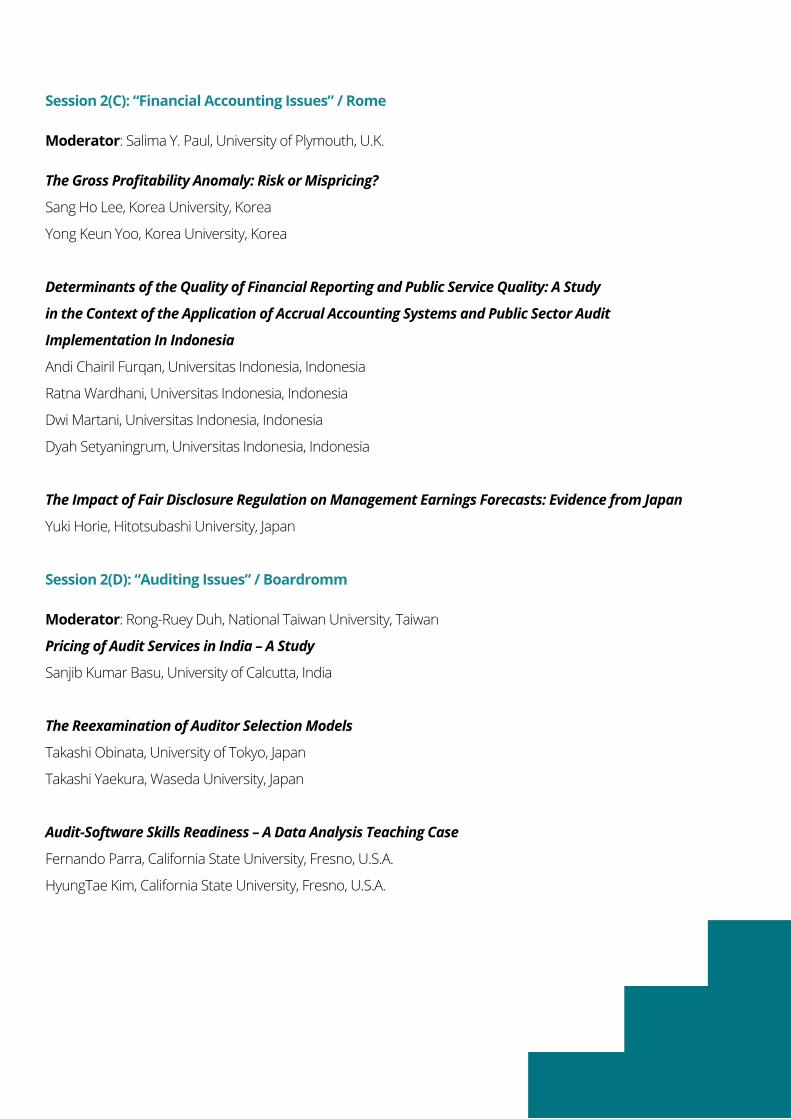
Session 2(C): “Financial Accounting Issues” / Rome
Moderator: Salima Y. Paul, University of Plymouth, U.K.
The Gross Profitability Anomaly: Risk or Mispricing?
Sang Ho Lee, Korea University, Korea
Yong Keun Yoo, Korea University, Korea
Determinants of the Quality of Financial Reporting and Public Service Quality: A Study
in the Context of the Application of Accrual Accounting Systems and Public Sector Audit
Implementation In Indonesia
Andi Chairil Furqan, Universitas Indonesia, Indonesia
Ratna Wardhani, Universitas Indonesia, Indonesia
Dwi Martani, Universitas Indonesia, Indonesia
Dyah Setyaningrum, Universitas Indonesia, Indonesia
The Impact of Fair Disclosure Regulation on Management Earnings Forecasts: Evidence from Japan
Yuki Horie, Hitotsubashi University, Japan
Session 2(D): “Auditing Issues” / Boardromm
Moderator: Rong-Ruey Duh, National Taiwan University, Taiwan
Pricing of Audit Services in India – A Study
Sanjib Kumar Basu, University of Calcutta, India
The Reexamination of Auditor Selection Models
Takashi Obinata, University of Tokyo, Japan
Takashi Yaekura, Waseda University, Japan
Audit-Software Skills Readiness – A Data Analysis Teaching Case
Fernando Parra, California State University, Fresno, U.S.A.
HyungTae Kim, California State University, Fresno, U.S.A.

16
Session 2(E): “Earnings Management Issues” / Paris
Moderator: Katarzyna Bareja, SGH Warsaw School of Economics, Poland
The Influence of the Succession Sources of Senior Executives on the Earnings Management
Huang Hong, Shanghai Normal University, China
Liu Haiyu, Shanghai Normal University, China
Integrated Reporting and Earnings Quality: The Moderating Effect of Agency Cost
Victoria A. Obeng, La Trobe University, Australia
Kamran Ahmed, La Trobe University, Australia
Seema Miglani, La Trobe University, Australia
Removing the Camouflage: the Effects of Analyst Gaap Earnings Forecast on Manager’s
Classification Shifting Practice
Tatyana Ryabova, California State University, Fresno, U.S.A.
Shu Lin, California State University, Fresno, U.S.A.
Harry Hui Xia, California State University, Fresno, U.S.A.
Session 2(F): “Accounting Education Issues” / Vienna
Moderator:�Rafał�Grabowski,�SGH�Warsaw�School�of�Economics,�Poland
Business Schools’ Roles in Developing Transnational Managers
Jia Wang, California State University, Fresno, U.S.A.
Ali Peyvandi, California State University, Fresno, U.S.A.
International Graduate School in Accountancy – Experience and Development
Suga Yoko, Tohoku University, Japan
Takada Toshifumi, National Chung Cheng University, Taiwan
The Association Between Social Media Use and Students’ Learning Performance
Sylvia Veronica Siregar, Universitas Indonesia, Indonesia
Bayu Tenoyo, Universitas Bhayangkara Jakarta Raya, Indonesia
Thirty-First�Asian-Pacific�Conference�on�International�Accounting�Issues

17
Session 2(G): “Research Forum – Capital Market Issues” / Sofia
Moderator: Katarzyna Klimczak, SGH Warsaw School of Economics, Poland
The Association Between Earnings Attributes and the Cost of Equity Capital: Evidence
from Japan
Jinushi Junko, Hitotsubashi University, Japan
The Stock Price Relevance of Roe Decomposition Factors in Korea Stock Markets
Changrae Park, Gangneung-Wonju National University, Korea
A Study on Dynamic Capability for Globalization of Regional Industry
Takao Nomakuchi, Chuo University, Japan
� 6:00�p.m.�–�6:30�p.m.�Pre-Cocktail – Networking Reception / Foyer
� 6:30�p.m.�–�9:30�p.m.�Gala Dinner / Grand Ballroom
Hosts:
Marek Rocki, Rector, SGH Warsaw School of Economics, Poland
Piotr Wachowiak, Vice Rector, Research and Management, SGH Warsaw School of Economics, Poland
Michał�Kaczmarski,�Institute�of�Accounting,�SGH�Warsaw�School�of�Economics,�Poland
Presentation of Vernon Zimmerman Best Paper Awards
Presenters:
Susela Devi K. Suppiah, SUNWAY University, Malaysia

18
Tuesday, October 15
� 8:30�a.m.�-�3:30�p.m.�General Registration / Foyer
� 8:45�a.m.�–�10:15�a.m.�Concurrent Sessions
Session 3(A): “Corporate Social Responsibility Issues” / Rome
Moderator:�Marek�Gruszczyński,�SGH�Warsaw�School�of�Economics,�Poland
Prevention or Detection of Problems in Capital Groups. Discriminatory Analysis in the Extended Time
Horizon
Anna�Karmańska,�SGH�Warsaw�School�of�Economics,�Poland�
Magdalena Indyk, SGH Warsaw School of Economics, Poland
Does Qualitative Disclosure of Climate Change Influence Japanese Corporate Value?
Yuki Tanaka, Hosei University, Japan
Session 3(B): “Finance and Capital Market Issues” / Brussels
Moderator: Magdi El-Bannany, University of Sharjah, U.A.E.
Profitability and Organisational Structure of the World´S Biggest Stock Exchange Operators
Dorota�Wiśniewska,�SGH�Warsaw�School�of�Economics,�Poland�
Exploring Sustainability and Green Banking Disclosures: A Study of Indonesian Banking
Sector 2009 – 2017
Juniati Gunawan, Trisakti University-Jakarta, Indonesia
Umesh Sharma, Waikato University-New Zealand
Paulina Permatasari Suwandi, Parahyangan Catholic University-Bandung, Indonesia
Pension Funds and IPO Pricing. Evidence from a Quasi-Natural Experiment
L.K. Langer, University of California, Berkeley, U.S.A.
P.B. Langer, SGH Warsaw School of Economics, Poland
P. Roszkowska, Hult International Business School, U.S.A.
Thirty-First�Asian-Pacific�Conference�on�International�Accounting�Issues

19
Session 3(C): “Financial Accounting Issues” / Vienna
Moderator: Tatyana Ryabova, California State University, Fresno, U.S.A.
Do Business Groups Raise Post Merger Performance?
Kentaro Kaneko, University of Tokyo, Japan
Reiko Kashiwazaki, University of Tokyo, Japan
Fumiko Takeda, University of Tokyo, Japan
Seigniorage, Central Banks’ Financial Results and the Crisis
Zbigniew�Polański,�SGH�Warsaw�School�of�Economics,�Poland
Mikołaj�Szadkowski,�SGH�Warsaw�School�of�Economics,�Poland
Executive Compensation and Company Valuation
Andreas Schueler, Universitaet der Bundeswehr Muenchen, Germany
Session 3(D): “Auditing and Accounting Professional Issues” / Boardroom
Moderator:�Michał�Kaczmarski,�SGH�Warsaw�School�of�Economics,�Poland
Audit Service Market Across the Business Cycle
Jae Yeon Sim, Korea University, Korea
Sang Hyuk Lee, Korea University, Korea
Exploring the State-Accounting Profession Nexus: the Malaysian Experience
Susela Devi K. Suppiah, Sunway University, Malaysia
Salima Y. Paul, University of Plymouth, U.K.
Cybersecurity and AI – Implications for Internal Auditing
Toshifumi Takada, National Chung Cheng University, Taiwan
Masatoshi Sakaki, EY Shinnihon Audit Firm, Japan
Shiro Aoyagiceo, Global Security Expert Inc, Japan
Hiroshi Kawaguchi, Kawaguchi Sekkei Inc., Japan
20
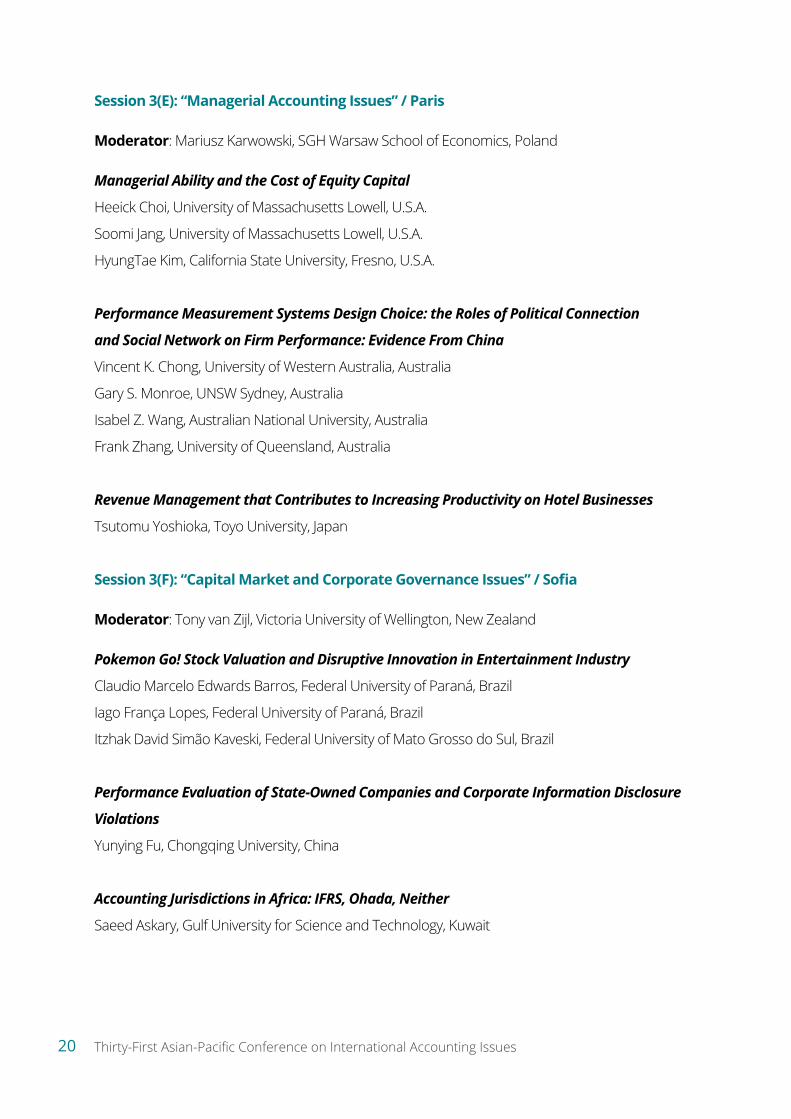
Session 3(E): “Managerial Accounting Issues” / Paris
Moderator: Mariusz Karwowski, SGH Warsaw School of Economics, Poland
Managerial Ability and the Cost of Equity Capital
Heeick Choi, University of Massachusetts Lowell, U.S.A.
Soomi Jang, University of Massachusetts Lowell, U.S.A.
HyungTae Kim, California State University, Fresno, U.S.A.
Performance Measurement Systems Design Choice: the Roles of Political Connection
and Social Network on Firm Performance: Evidence From China
Vincent K. Chong, University of Western Australia, Australia
Gary S. Monroe, UNSW Sydney, Australia
Isabel Z. Wang, Australian National University, Australia
Frank Zhang, University of Queensland, Australia
Revenue Management that Contributes to Increasing Productivity on Hotel Businesses
Tsutomu Yoshioka, Toyo University, Japan
Session 3(F): “Capital Market and Corporate Governance Issues” / Sofia
Moderator: Tony van Zijl, Victoria University of Wellington, New Zealand
Pokemon Go! Stock Valuation and Disruptive Innovation in Entertainment Industry
Claudio Marcelo Edwards Barros, Federal University of Paraná, Brazil
Iago França Lopes, Federal University of Paraná, Brazil
Itzhak David Simão Kaveski, Federal University of Mato Grosso do Sul, Brazil
Performance Evaluation of State-Owned Companies and Corporate Information Disclosure
Violations
Yunying Fu, Chongqing University, China
Accounting Jurisdictions in Africa: IFRS, Ohada, Neither
Saeed Askary, Gulf University for Science and Technology, Kuwait
Thirty-First�Asian-Pacific�Conference�on�International�Accounting�Issues

21
Session 3(G): “Research Forum – Financial Accounting Issues” / London
Moderator:�Marcin�Jamroży,�SGH�Warsaw�School�of�Economics,�Poland�
Information Transfer of Voluntary Disclosure Among Korean Chaebol Companies with Related Party
Transaction
Sungmin Jeon, Korea University, Korea
Is the Government Public Budget an Economic Entity? A View From Systems Perspective
Wojciech A. Nowak, University of Lodz, Poland
The Effect of Operational and Financial Information Disclosure on the Default Probability
and Average Lending Rate: Evidence from Chinese Peer-To-Peer Lending Market
Jiaqi Kuang, Xi’an Jiaotong-Liverpool University, China
David Xudong Ji, Xi’an Jiaotong-Liverpool University, China
Peng Cheng, Xi’an Jiaotong-Liverpool University, China
� 10:15�a.m.�–�10:30�a.m.�Coffee Break / Foyer
� 10:30�a.m.�–�12:00�p.m.�Concurrent Sessions
Session 4(A): “Corporate Governance and Capital Market Issues” / Rome
Moderator: Wojciech A. Nowak, University of Lodz, Poland
Intellectual Capital Efficiency and Firm Financial Performance: Evidence from South East Asian
Countries
Ainul Islam, Victoria University of Wellington, New Zealand
Arifatul�Husna�Mohd�Ariff,�Universiti�Utara�Malaysia,�Malaysia
Tony van Zijl, Victoria University of Wellington, New Zealand
Characteristics of Japanese Life Insurance Companies Disclosing Embedded Value
Makoto Tsukahara, Teikyo University, Japan
Kazuhiro Nishiyama, Teikyo University, Japan
Ryosuke Nakamura, University of Tsukuba, Japan
The Ethical Implications of Changes to the Dodd Frank ACT and Sarbanes Oxley ACT
Behnaz Z. Quigley, Marymount University, U.S.A.
22
Session 4(B): “Financial Accounting Issues” / Vienna
Moderator:�Małgorzata�Mierzejewska,�SGH�Warsaw�School�of�Economics,�Poland
The Use of XBRL (Extensible Business Reporting Language) for the Needs of Financial Reporting on
Capital Markets - Benefits, Costs, And Determinants of Application
Katarzyna Klimczak, SGH Warsaw School of Economics, Poland
The Impact of Business Model Innovation on Financial Statements – Selected Problems
Mariusz Karwowski, SGH Warsaw School of Economics, Poland
Aggregate Earnings Informativeness and Economic Shock: International Evidence
Makoto Nakano, Hitotsubashi University, Japan
Yuto Yoshinaga, Tohoku University, Japan
Session 4(C): “Financial and Corporate Social Responsibilities Issues” / Sofia
Moderator: Renata Pajewska, SGH Warsaw School of Economics, Poland
Narrative Risk Disclosures in Annual Reports: Proposal of Risk Map
Anna�Karmańska,�SGH�Warsaw�School�of�Economics,�Poland
Monika�Łada,�AGH�University�of�Science�and�Technology,�Poland
Do Financial Reporting Quality and Corporate Social Responsibility Associated with Investment
Efficiency? Evidence from Indonesia
Sylvia Veronic Siregar, Universitas Indonesia, Indonesia
Session 4(D): “Research Forum – International Financial Reporting Standards
and Auditing Issues” / Boardroom
Moderator: Katarzyna Kobiela-Pionnier, SGH Warsaw School of Economics, Poland
The Effect of Corporate Social Responsibility on the Organizational Commitment
of Employees Mediated by Intrinsic Motivation
Edicreia Andrade dos Santos, University of Mato Grosso do Sul, Brazil
Januário José Monteiro, University of Santa Catarina, Brazil
Rogério João Lunkes, University of Santa Catarina, Brazil
Claudio Marcelo Edwards Barros, Federal University of Paraná, Brazil
Thirty-First�Asian-Pacific�Conference�on�International�Accounting�Issues

23
The Impact of Asymmetric Cost Behavior on the Audit Report Lag
Jin Ho Kim, Sungkyunkwan University, Korea
Cybercurrency and Blockchain in the College Accounting Classroom
Ermira Mazziotta, Muhlenberg College, U.S.A.
Ellen Rackas, Muhlenberg College, U.S.A.
Session 4(E): “Research Forum – International Business Issues” / Paris
Moderator:�Rafał�Kasprzak,�SGH�Warsaw�School�of�Economics,�Poland�
Effect of Cultural and Historical Events on Innovation of Life Insurance Market
Adam�Śliwiński,�SGH�Warsaw�School�of�Economics,�Poland
Conformity Pressure and Compensation Contracts
Taichi Kimura, Keio University, Japan
Yutaro Murakami, Keio University, Japan
Risk Management Challenge in Multi-Stakeholder Decentralized Risk Environment.
FMD - A Pioneer European Private-Public Managed Big Data Project In Healthcare Sector
Michał�Kaczmarski,�SGH�Warsaw�School�of�Economics,�Poland
Poor Public Sector Accountability in Nigeria. The Imperative of Treasury Single Account (TSA)
Godwin Ndu Uchechuks, Federal College of Education Eha-Amufu.Enugu State, Nigeria
24
Session 4(F): “Research Forum – Financial Reporting Issues” / Brussels
Moderator:�Edyta�Łazarowicz,�SGH�Warsaw�School�of�Economics,�Poland
Book Tax Conformity, Earnings Management and Compensation Contacts
Yiu Wai Wong, Tohoku University, Japan
Performance of Public Sector and Government Financial Statements:
The Case of Indonesia
Endang Kiswara, Universitas Diponegoro, Indonesia
Dyah Turanggadewi Arya, Curtin University, Australia
The Effects of Voluntary Adoption System of IFRS and us Gaap: Evidence from Japanese Mnes
Hideaki Sakawa, Nagoya City University, Japan
Naoki Watanabel, Nagoya City University, Japan
Junjian Gu, University of Tsukuba, Japan
Session 4(G): “Research Forum – Corporate Goverance Issues” / London
Moderator:�Magdalena�Giedroyć,�SGH�Warsaw�School�of�Economics,�Poland�
Does Good Corporate Governance Increase Business Value? Evidence from an Emerging
Economy, India
Ahindra Chakrabarti, Great Lakes Institute of Management Gurgaon, India
The Influence of IFRS Adoption on Financial Reporting Quality: Empirical Evidence
from Banks in The UAE and Egypt
Magdi El-Bannany, University of Sharjah, U.A.E.
Governance Disclosures, Senior Management and their Influences on Tax Avoidance
Estralita Trisnawati, Tarumanagara University, Indonesia
Juniati Gunawan, Trisakti University, Indonesia

25
� 12:15�p.m.�–�1:45�p.m.�Luncheon / Foyer
Host:
Ryszard Bartkowiak, Dean, Collegium of Management and Finance, SGH Warsaw School of Economics,
Poland
� 1:45�p.m.�–�3:30�p.m.�Poster Session / London
Foreign Capital as a Determinant of the Non-Financial Reporting Development in Insurance
Companies in Vise Grad Group Countries
Marzanna Lament, Kazimierz Pulaski University of Technology and Humanities in Radom, Poland
Simplification in Financial Reporting and Reduction of Administrative Costs
Justyna Beata Zakrzewska, Kozminski University in Warsaw, Poland
�Joanna�Wielgórska-Leszczyńska,�SGH�Warsaw�School�of�Economics,�Poland
Off Balance Sheet Items in the Financial Statements of Entities Quoted on the Warsaw Stock
Exchange
Katarzyna Petelska, SGH Warsaw School of Economics, Poland
Permanent Establishment in Digital Business
Marcin�Jamroży,�SGH�Warsaw�School�of�Economics,�Poland
The Structure and Predictive Power of Components of Other Comprehensive Income in Polish
Companies Listed on Warsaw Stock Exchange
Katarzyna Bareja, SGH Warsaw School of Economics, Poland
Magdalena�Giedroyć,�SGH�Warsaw�School�of�Economics,�Poland
Małgorzata�Wrzosek,�SGH�Warsaw�School�of�Economics,�Poland
Cost Accounting in the Face of Social, Management and Civilization Challenges
Ewa Hellich, SGH Warsaw School of Economics, Poland
Małgorzata�Paszula,�SGH�Warsaw�School�of�Economics,�Poland
Interdisciplinary Economics. Relationship Between Economics and other Academic Disciplines
Renata Wojciechowska, SGH Warsaw School of Economics, Poland
Thirty-First�Asian-Pacific�Conference�on�International�Accounting�Issues
26
Management Control in Public Sector, Opportunities and Challenges
Anna�Kłopotek,�SGH�Warsaw�School�of�Economics,�Poland
The Internal Audit Towards Ethics Programs
Łukasz�Małecki-Tepicht,�SGH�Warsaw�School�of�Economics,�Poland
Successful Internationalisation of Polish Business Groups
Patryk Dziurski, SGH Warsaw School of Economics, Poland
Anna Krejner-Nowecka, SGH Warsaw School of Economics, Poland
Wioletta Mierzejewska, SGH Warsaw School of Economics, Poland
Advanced Analytics Model in Tax Fraud Detection
Małgorzata�Mierzejewska,�SGH�Warsaw�School�of�Economics,�Poland
The International Integrated Reporting Council – A New Emerging Epistemic Community
Katarzyna Kobiela-Pionnier, SGH Warsaw School of Economics, Poland
Implementation of IFRS 16 Leases at Kghm Polska Miedź S.A. Capital Group
Lidia�Kliszczak,�KGHM�Polska�Miedź�S.A,�Poland
Katarzyna�Kreczmańska-Gigol,�SGH�Warsaw�School�of�Economics,�Poland
Łukasz�Stelmach,�KGHM�Polska�Miedź�S.A,�Poland
Development Barriers of the Private Health Insurance in Poland
Renata�Pejewska-Kwaśny,�SGH�Warsaw�School�of�Economics,�Poland
The Role of Underwriting in Motor Insurance
Ilona Tomaszewska, SGH Warsaw School of Economics, Poland
The Value of Privacy Empirical Research, Using Polish Drivers as an Example
Adam�Śliwiński,�Łukasz�Kuryłowicz,�SGH�Warsaw�School�of�Economics,�Poland
� 3:30�p.m.�–�3:45�p.m. Coffee Break / Foyer
Thirty-First�Asian-Pacific�Conference�on�International�Accounting�Issues

27
� 3:45�p.m.�–�5:00�p.m.�Workshop – 2 / Amsterdam/Athens
Virtual Compliance Officer in Digital Economy
Workshop Leader:
Wojciech�Niezgodziński,�Senior�Manager,�Forensic�&�Integrity�Services,�EY�Poland
� 6:00�p.m.�–�9:15�p.m.�Workshop – 3
(evening event at Warsaw Stock Exchange combined with networking, drinks and canapes)
Cima Money Talks “New Technologies and the Future of Finance”
Workshop Leaders:
Jakub Bejnarowicz, Regional Director, Europe, CIMA
Peter Simons, Development and Innovation Specialist, CIMA
Wednesday, October 16
Optional tour arranged by Participants

28
Profiles
Justyna Adamczyk is a director of the Accounting and Auditing
Department in the Polish Ministry of Finance. She is responsible
for accounting and auditing legislation. She is a Chairman of Polish
Accounting Standards Committee and a member of Audit Oversight
Commission. She has been appointed by the Minister of Finance as a
plenipotentiary responsible for the establishment of the Polish Agency
for Audit Oversight. Before taking over as a director of the Accounting
and Auditing Department, Justyna Adamczyk was for 14 years the Chief
Accountant of the State Budget. She is a statutory auditor, author of the
publications and the lecturer in the area of accounting.
Ryszard Bartkowiak, Ph.D. is a professor in Economics at the SGH
Warsaw School of Economics, Dean of the Collegium of Management
and�Finance�(since�2012),�Vice-Director�of�the�Institute�of�Political�
Economy,�Law�and�Economic�Policy�(since�2014).�He�specializes�in,�and�
delivers lectures on, history of economic thought and contemporary
economics. He has published books on history of economics,
development economics and banking (bank deposit guarantee
schemes).
Jakub Bejnarowicz, Regional Director, Europe at CIMA and The
Association�of�International�Certified�Professional�Accountants.�He�is�
responsible for creating and executing CIMA’s development strategy
and�carrying�out�educational�activities�in�the�field�of�management�
accounting in the region. He supports recruitment and training strategies
of employers hiring management accounting professionals and puts
into�effect�plans�for�continuous�professional�development�of�CGMAs�
(Chartered�Global�Management�Accountants),�finance�professionals�and�
future business leaders. He advocates Global Management Accounting
Principles�(GMAP)�–�a�project�promoting�benefits�of�implementing�the�
GMAP principles by employers.

29
Professor Paul H. Dembinski, Dr. h.c. is a Faculty of Management
Economics and Social Sciences University of Fribourg (Switzerland).
Professor Paul H. Dembinski, economist and political scientist by training,
is a professor at the University of Fribourg where he holds the chair
for International Competition and Strategy; and also doctor honoris
causa of the SGH Warsaw School of Economics. He is also the initiator
and�Director�of�Foundation�of�the�Observatoire�de�la�Finance�(1996)�in�
Geneva. The mission of the Observatoire de la Finance is to promote
awareness�of�ethical�concerns�in�financial�activities�and�the�financial�
sector.�Since�its�foundation�in�2007,�he�co-chairs�the�Jury�of�“Ethics�&�Trust�in�Finance”�Global�award.
Professor�Dembinski�has�written�a�dozen�books�and�some�sixty�scientific�articles�in�the�field�of�
internationalisation�of�enterprises,�globalisation�of�enterprises,�competition,�ethics�and�finance.�His�most�
recent�books�are:�Finance:�Servant�or�Deceiver?�Financialisation�at�the�Crossroads,�2009;�(Finanse�po�
zawale,�Studio�EMKA,�2011),�Ethique�et�Responsabilité�en�Finance�2015�(Ethics�&�Responsibility�in�Finance,�
Routledge,�2017,�Etyka�I�odpowiedzialnosc�w�swiecie�finansow,�Studio�Emka,�2017).�His�working�languages�
are English, French, German, Polish and Spanish. He was educated in Poland, in Switzerland (Geneva and
Fribourg), in Cameroon and in the UK (St Antony’s College, Oxford).
Michael Favere-Marchesi, Ph.D., CPA (California). Dr. Michael Favere-
Marchesi is a professor of accounting and auditing in the Beedie School
of Business at Simon Fraser University in Vancouver, Canada. His teaching
interests are in Auditing and Forensic Accounting with Data Analytics. His
research interests include audit judgment and decision-making, audit
quality, fraud and international accounting. Dr. Favere-Marchesi has
published articles in Auditing, Accounting Horizons, Behavioral Research
in Accounting, and others. He is the current President of the Canadian
Academic Accounting Association, is a member of the University Senate
and serves on the Senate’s Committee on International Activities, as well as Beedie’s International Programs
Committee. Prior to joining the Beedie School of Business, Dr. Favere-Marchesi taught at the Monterey
Institute of International Studies in California, the National Institute of Development Administration (NIDA)
in Thailand, and the University of Southern California, and was a visiting professor at HEC (Paris), Mannheim
University, Bocconi University, and the Helsinki School of Economics.

30
Dr. Marek Dietl - President of the Management Board of the Warsaw
Stock Exchange. Marek Dietl holds a degree from the Warsaw School
of Economics and a PhD from the Institute of Economic Sciences,
Polish Academy of Sciences. During his PhD programme, he was a
fellow at the University of Glasgow. He is Assistant Professor at the
Warsaw�School�of�Economics�(SGH)�since�2012.�In�2012-2013,�he�
was a fellow at the University of Economics, Essex. He completed a
two-year�programme�in�finance:�EY�Executive�Studies�in�Finance.�In�
1999-2008,�Marek�Dietl�worked�with�the�international�consultancy�
Simon-Kucher�&�Partners,�where�he�was�promoted�from�Intern�to�Proxy�to�Leader�of�the�Warsaw�office.�
In�2008-2012,�he�was�with�Krajowy�Fundusz�Kapitałowy�S.A.,�initially�as�Investment�Manager�and�later�as�
Deputy Director for Investments. Marek Dietl has served on the Supervisory Boards, Audit Committees,
Investment�(Selection)�Committees�of�more�than�20�companies.�Marek�Dietl�has�served�as�an�advisor�
and�expert:�Advisor�to�the�President�of�Poland,�Advisor�to�the�President�of�the�Energy�Regulatory�Office,�
Mediator at the Court of Arbitration of the Polish Financial Supervision Authority, Member of the Board
of Economic Education at the National Bank of Poland, Expert of the Business Centre Club and Instytut
Sobieskiego. He has headed Financial Instrument Task Forces appointed by the Director of the National
Centre for Research and Development.
Peter Simons BBS, MBA, FCMA Development & Innovation Specialist,
CIMA.�Peter�Simons�is�a�CIMA�member�with�over�30�years�of�experience�
in�business�before�joining�CIMA�in�2006.�The�CIMA�qualification�enabled�
Peter to achieve career progression through roles in strategy, corporate
lending, credit management and marketing at Bank of Ireland. He was
the head of a division and on the bank’s senior management team in
London�when�he�left�in�2002�to�become�the�Managing�Director�of�a�UK�
subsidiary�of�IFG,�an�entrepreneurial�Irish�financial�services�group.�Peter�
is now the technical specialist in the applied research unit in CIMA’s
education department. He works with employers, consultants, software vendors and academics to explore
the�future�roles�of�organisations’�in-house�finance�professionals.�He�also�helps�to�develop�CIMA’s�expertise�
in performance management. Peter’s research contributes to the development of the CIMA syllabus. He
also writes articles and reports and works with colleagues across CIMA’s value chain to support members..
Thirty-First�Asian-Pacific�Conference�on�International�Accounting�Issues

31
Krzysztof Kozłowski, Ph.D. professor, Vice-Rector for Teaching and
Students’�Affairs�at�the�SGH�Warsaw�School�of�Economics.�Interested�in�
political and economic transformation and change in East and Central
Asia.�Conducted�field�research�on�color�revolutions�and�social�protests�
in Kyrgyzstan and Taiwan. Visiting professor in Korean, Italian and
Taiwanese Universities. Voted three times (by the students) the most
inspirational academic teacher at the SGH Warsaw School of Economics
(Undergraduate Studies).
Marek Rocki, Ph.D. a professor and a Rector of the SGH Warsaw
School�of�Economics�(since�2016).�Since�1981�a�faculty�member�at�
SGPiS/SGH:�1990-1996�Vice�Rector,�1996-1999�Dean�of�Graduate�
Programmes,�1999-2005�Rector,�2005-2011�Dean�of�the�Collegium�
of�Economic�Analyses.�2005-2006�Head�of�the�Civil�Service�Council,�
2003-2016�President�of�the�executive�board�of�the�Academic�Sports�
Association,�2008-2015�Head�of�the�Polish�Accreditation�Commission.�
Senator�of�the�Republic�of�Poland�since�2005.
Piotr Wachowiak, Ph.D. professor, Vice-Rector for Research
and Management at the Warsaw School of Economics, director of
the Institute of Management, secretary of the Organization and
Management Committee of the Polish Academy of Sciences. Chairman
of the Entrepreneurship Council at the President of the Republic
of Poland. Member of the CSR working group at the Ministry of
Investment�and�Development.�For�28�years�he�has�been�associated�
with business practice working in managerial positions in enterprises
and local government organizations. He specializes in human
resource management, negotiations, and corporate social responsibility. measurement of enterprises’
intellectual capital and knowledge management in enterprises. Author or co-author of many publications
on management. He participates in the development of expertise for enterprises and in training for
managerial�staff

32
Michał Kaczmarski, Ph.D., Institute of Accounting, the SGH Warsaw
School of Economics; General Manager at the Polish Medicines
Verification�Organization.�The�organization�is�part�of�the�network�of�thirty�
national�repositories�that�constitute�the�European�Medicines�Verification�
System�aimed�at�fighting�falsified�medicines�in�Europe.�He�is�specializing�
in the area of preventing money laundering and fraud and was practicing
as a consultant at Deloitte, EY and KPMG. He was also holding a position
of a Compliance Lead at one of the major pharmaceutical companies
with responsibility for Poland and Baltic countries. At the SGH Warsaw
School of Economics he conducts researches in the area of automation and machine learning aimed at
detection of fraud and misconduct.
Professor Hanna Godlewska-Majkowska, Ph.D. is a vice-rector
for cooperation with the environment at the SGH Warsaw School of
Economics.��From�graduation�till�2006,�she�worked�in�the�Department�
of�Economic�Geography.�In�the�years�2006-2016,�she�was�the�deputy�
director of the Institute of Enterprise, and earlier the deputy director of
the�Institute�of�National�Economy�Functioning.�In�the�years�2006-2016�
she took care of the Students’ Club of Entrepreneurship and Regional
Analysis.�Since�2014�she�has�been�the�head�of�the�Business�Environment�
Unit at the Institute of Enterprise at the Collegium of Business
Administration,�and�since�2016�she�has�held�the�position�of�full�professor�at�the�Institute�of�Enterprise.�
Beata Seta has graduated from Warsaw School of Economics. She is
currently ICA Global Operations Manager in Signify. Moreover previously
in Signify she was involved in newly set up of FSSC and outsourcing of
global�statutory�and�fiscal�processes.�She�is�a�senior�finance�professional�
with�19�years�of�experience.�During�her�career�she�was�mainly�
accountable�for�finance�and�accounting�transformation�in�international�
corporations. She possesses an excellent leadership skills and ability to
communicate and negotiate at all levels.
Thirty-First�Asian-Pacific�Conference�on�International�Accounting�Issues

33
Professor Anna Karmanska, Ph.D. is�conducting�their�scientific�and�
didactic work at the SGH Warsaw School of Economics. Karmanska is
currently serving as Director of the Institute of Accounting at SGH. In the
past,�she�was�vice�rector�for�didactics�and�students�affairs�at�her�home�
university. Thanks of her initiative SGH Ethics Club have been created.
In practice, she served as advisor to the Head of the Insurance
and Pension Funds Supervisory Body, as member of the Polish
Accounting Standards Committee, as independent member of the
Audit Commission to the Minister of Justice and as a Board Member of
European�Federation�of�Accountants.�Since�2006,�She�is�the�Chair�of�the�Ethics�Commission�to�the�Main�
Board�of�the�Accountants�Association�in�Poland�and�a�Vice�Chair�of�its�Scientific�Council.�Since�2018�is�
a chair of Polish Examination Board for candidates for statutory auditors, established by the Ministry of
Finance. He has the title of Honorable member of the Federation of Auditors, Accountants and Financial
Managers of Georgia and Ambassador of the Code of Professional Ethics in Accounting
Dr. Tom Wielicki is Professor Emeritus of Business Management at
the Craig School of Business, California State University, Fresno, former
Executive Director of the Digital Economy Center at CSUF, Chair of
Department of Information Systems and Decision Sciences, and the
President and owner of International Business Consultants. He is also
a Fulbright Scholar having served as a Senior Fulbright Scholar at the
Warsaw�School�of�Economics,�Poland�in�1999-2000�and�a�Coleman�
Fellow teaching and training project managers and entrepreneurs all
over the world. Dr. Wielicki was a Project Director of the Polish Business
Education Project funded by the US State Department with half a million dollars grant that contributed
to�development�of�the�first�private�school�of�business�in�Poland�-�WSB-NLU.�Dr.�Wielicki�has�40�years�of�
experience�in�research�and�consulting�projects�in�the�field�of�Project�Management,�SMEs�management,�
Management Information Systems, and Decision Support Systems. His research resulted in publishing
over�fifty�articles�in�professional�journals�and�proceedings�of�the�national�and�international�conferences.���
He has been invited as a visiting professor and expert in Project Management and Information Technology
to number of universities around the world including Heidelberg University, Germany, University of New
South Wales, Australia, Universidad de las Americas, Puebla, Mexico, Warsaw School of Economics - SGH,
Poland, and Tribhuvan University at Kathmandu, Nepal.

34
Mikołaj Pindelski, Ph.D. –�Department�of�Management�Theory�
Department, the SGH Warsaw School of Economics. Director of Post-
Graduate Studies on Sales Management.
Fellow of Ryukoku University Kyoto, Visiting scholar at Tel Aviv University
Recanati Business School, Bar Ilan University, Fordham University in New
York. Teaches Management, Responsible and Sustainable Management,
New Trends in Management, Sales Management, Innovations
Management e.g. at SGH Poland, IMT Ghaziabad India, EBS Estonia,
Vilnius University Lithuania, Toulouse Business School France, Tel Aviv
University Israel, Nottingham Trent University UK. Head of Steering Board PRME CEE Chapter under UN,
Head of Center for Responsible Management Research at SGH, President of Foundation of Responsible
Employers, cooperates with Ceeman IQA Accreditation Center. Author and co-author of Polish and
international publications.
Dr. Ali Peyvandi is Professor of Accountancy at California State
University, Fresno. His primary areas of expertise are International,
Financial, and Managerial Accounting. Dr. Peyvandi has published
research�papers�on�a�wide�range�of�topics�in�financial�reporting,�
corporation�finance�and�corporate�governance,�Managerial�Accounting,�
and�Global�Business�Education�issues.�For�over�30�years,�he�has�
conducted seminars and workshops for International Accounting,
and�computer�applications�for�managerial�and�financial�accounting.�In�
addition, he has consulted with Multinational Corporations, World Bank,
and governmental agency on Accounting and Management issues.
He is the endowed chair of Joy D. Covey professor of International Business, the chairman of the Asian-
Pacific�Conference�on�International�Accounting�Issues,�and�a�member�of�the�European�Accounting�
Association, the International Trade and Finance Association, and the American Accounting Association.
Thirty-First�Asian-Pacific�Conference�on�International�Accounting�Issues

35
Professor Jacek Prokop Ph.D. has been a faculty member at SGH
Warsaw�School�of�Economics�since�1984.�As�of�Sep.�1,�2016,�he�serves�
as the Vice Rector for International Relations, and is currently also the
head of the Department of Business Economics. He received his PhD
in Economics from Virginia Polytechnic Institute and State University
(Blacksburg,�Virginia,�USA)�in�1991,�and�he�completed�his�habilitation�
at�the�SGH�Warsaw�School�of�Economics�in�2002.�From�1991�until�
1998�he�was�a�tenure-track�Assistant�Professor�in�the�Department�of�
Management and Strategy at Kellogg Graduate School of Management,
Northwestern�University�(Evanston,�Illinois,�USA).�From�2000�until�2008,�he�was�a�Visiting�Professor�at�
Helsinki School of Economics and Business Administration in Finland. In addition to his academic work,
Professor�Prokop�has�also�been�involved�in�business�practice;�from�1995�until�1999�he�held�the�position�
of�Principal�Consultant�at�PricewaterhouseCoopers�in�Washington,�DC�(USA),�and�from�2004�until�2015�he�
served as an independent member of the Supervisory Board of Pekao Pioneer UPC S.A. in Warsaw.
Bodo Richardt has been European Association of Accountants and
Auditors�(EFAA)�President�from�2014�to�June�2019.�He�was�very�engaged�
in�EFAA�activity�over�all�the�World.�His�past�efforts�and�successes�as�
EFAA President are still currently of great importance for national
accountants and auditors’ organizations within the European Union and
Europe as a whole. He is a former member of the International Auditing
and Assurance Standards Board (IAASB), the Audit and Accounting
Committee of the Institute of Public Auditors in Germany (IDW), and the
Advisory Board of the Wirtschaftsprüferkammer (WPK) and has been the
Regional�President�of�WPK�in�Bavaria.�He�has�been�an�accountant�for�over�30�years�and�has�worked�in�a�
variety of professional practices from the Big 4 to SMPs in Germany, France and the United States.
Bodo�Richardt�has�unquestionable�knowledge�and�experience�in�the�field�of�global�accounting�policy�and�
the�functioning�of�international�institutions�important�for�finance,�accounting�and�-�more�broadly�-�the�
business world.

36
Agnieszka Stachniak is a deputy director of the Accounting and
Auditing Department in the Polish Ministry of Finance. She is responsible
for public sector accounting and for auditing legislation. She is involved
in international cooperation in accounting and auditing. She represents
Polish MoF at EU committees and working groups, such as Accounting
Regulatory Committee (ARC), Audit Regulatory Committee (AuRC), EPSAS
Working Group. She is a member of the International Public Sector
Accounting Standards Board (IPSASB) Consultative Advisory Group (CAG).
She is currently leading a project on public sector accounting in Poland.
Agnieszka Stachniak is a member of Polish Accounting Standards Committee. She is a statutory auditor.
She holds a M.A. degree in accounting from University of Lodz and she is a graduate from the National
School of Public Administration. She is currently a participant in the Ph.D. programme at Kozminski
University in Warsaw.
Wojciech Niezgodziński is a Senior Manager in EY Forensic and
Integrity Services in Warsaw with diverse experience in various national
and international projects, mainly related to fraud investigations and
compliance services. He is advising corporations and their outside
legal counsels on complex business matters that involve forensic
investigations, and economic damages arising from corruption,
misappropriation�of�assets�and�financial�reporting�irregularities.�
Wojciech is an author of many articles on business ethics, fraud and
compliance published in business magazines and EY blog. Wojciech
graduated from SGH Warsaw School of Economics where he obtained his Master’s in Finance and
Accounting�with�specializations�in�corporate�finance�and�international�markets.�Currently�at�his�Alma�Mater�
he is a visiting lecturer at postgraduate studies in forensics investigations and compliance management.
He�holds�the�titles�of�Certified�Fraud�Examiner�(CFE)�and�Certified�Internal�Auditor�(CIA).
Thirty-First�Asian-Pacific�Conference�on�International�Accounting�Issues

37
Edyta Szarska,�Controlling�Partner,�IBCS®�Certified�Trainer�and�
Certified�Consultant.�She�is�an�expert�in�the�field�of�finance�and�
controlling�with�10�years�of�professional�experience�in�controlling�
departments�and�over�12�years�of�consulting�and�trainings.�She�
managed many controlling projects as a consultant and trainer for
different�sectors�(i.e.�P&U,�pharmacy,�telecom,�chemical,�IT,�e-commerce,�
advisory BIG4). Her current focus is about the adoption of the SUCCESS
formula of IBCS® in CEE countries. She is a frequent speaker at Polish
and international conferences with the topic of IBCS®. By seminars
and�workshops�licenced�and�certified�by�IBCS®�Institute�she�helps�to�develop�IBCS®�competences�and�
advises to build IBCS® reporting concepts. Her vision: development of controlling awareness by practical
solutions for top managers, building the culture of quick and clear information for making business
decisions, getting by sharing and giving.
Grzegorz Nawrocki, Journalist,�current�affairs�programmes�host.�A�
graduate of Cambridge University, Preston (UCLAN) as well as American
Studies Center at Warsaw University. A British Chevening Scholar and a
scholar of Robert Schumann Institute in Budapest. Formerly a host of the
Polish Public Television political programmes. With intensive experience
with the BBC TV (e.g. HardTalk) as well as Danish media. An editor and
host of Oxford style debates realised with Oxbridge Society and Onet.
pl in Teatr Polski in Warsaw. Media skills coach. Specialising in political
interviews�and�current�affairs�analyses.�Member�of�the�Board�of�the�
„Polish�World�News”.�President�of�the�British�Alumni�Society�in�Poland

38
Przemysław Mencel -�Group�Chief�Financial�Officer�at�Etrose�Holding�
RAISEAD Group CIMA Fellow Member (FCMA), Association of International
Certified�Professional�Accountants�designation�(CGMA).
Financial executive with extensive international experience (EMEA
region), CIMA Fellow, CGMA, MBA at Georgia State University, expert in
the planning and implementation of long-term sustainable strategies,
who drives business decisions preserving value, protecting assets and
chasing�new�opportunities�with�the�ability�to�combine�financial�and�non-
financial�data�to�paint�a�complete�picture�of�the�business.�Standardized,�
benchmarked,�and�integrated�financial�processes�to�mitigate�risks,�control�costs,�and�ensure�compliance�
with corporate and governmental guidelines. Strong capital markets background and experience in debt and
equity raising, risk management, internal control, value chain, change management.
Mira Mech is a GBS Site Lead for AkzoNobel and a former head of
F&A�Operations�in�Accenture�[1000+].�Being�a�NewTech�enthusiast�
she established the culture of RPA and AI for Accenture Operations
that resulted in continuous supply of automation ideas. She cares not
only for delivering up to today’s expectations but for building the future
workforce of relevant and engaged specialists where nobody will have to
leave their hears at home when leaving for work. Privately, a mom of 4
years old twins and a traveller.

39
Conference Host, Patrons, Partners and Sponsors
SGH Warsaw School of Economics is the oldest university of economics in Poland. Its mission
has continuously been educating economists and business leaders serving the nation, country and
the�region.�SGH�is�famous�for�its�tradition,�flexible�adjustments�of�programmes�to�students’�needs,�
unquestionable education level, and successful alumni. SGH Warsaw School of Economics conducts
research�in�various�areas�of�economics,�finance,�management�and�business�administration�as�well�as�
in public policy and political science. SGH researchers are among experts of the European Commission
in�the�fields�of�research�&�innovation�as�well�as�social�policies.�They�advise�for�other�institutions�of�the�
European Union such as the European Court of Auditors.
SGH is ranked Poland’s top research university in economic sciences, with the grade of excellency
awarded by Ministry of Science and Higher Education.
See more: http://uczelnia.sgh.waw.pl/en
Conference Host

40
Ministry of Science and Higher Education�was�established�in�May�2006.�The�Ministry�deals�with�
issues connected with students, universities and scientists. It pursues a policy in the area of science
and higher education in Poland. Experts prepare strategic solutions, care for the implementation of
EU programmes and funds. The ministry supports the development of Polish universities, research
institutes�and�scientific�institutes�of�the�Polish�Academy�of�Sciences.�The�scientific�community�-�agencies�
such as the National Science Centre, the National Centre for Research and Development and Polish
National Agency for Academic Exchange - co-decide on the distribution of funds for science.
See more: https://www.gov.pl/web/science
The Ministry of Finance (MF)�is�a�governmental�administration�office�servicing�the�minister�
competent�for�the�state�budget,�public�finance�and�financial�institutions.�One�of�the�fundamental�tasks�
of the MF is preparation, execution and control over implementation of the state budget. Moreover, the
Ministry�deals�with�the�financing�system�for�local�governments,�the�budget�zone�and�state�security�and�
manages the public debt.
The MF is also responsible for implementation of state income and expenses, including income
from�taxes,�as�well�as�for�financial,�credit�and�payment�cooperation�with�foreign�countries�and�
implementation of provisions regarding customs. The MF executes tasks related to the operation of
financial�markets,�including�banks,�insurance�companies�and�investment�funds,�and�tasks�related�to�
trade in securities. Moreover, it initiates governmental policy with respect to the securities’ market.
The Ministry of Finance established the Accounting Standards Committee. The Committee cooperates
with the European Financial Reporting Advisory Group (EFRAG). Committee members participate in the
activities of EFRAG working groups. They give inputs to the standard-setting process and provide their
endorsement advice regarding issues relevant for Polish companies applying IFRS. By the Ministry of
Patronage
Honorary Patronage
Thirty-First�Asian-Pacific�Conference�on�International�Accounting�Issues

41
The Warsaw Stock Exchange Group (GPW Group) operates trading platforms for shares, Treasury and
corporate bonds, derivatives, electricity and gas, and provides indices and benchmarks including WIBOR
and�WIBID.�The�index�agent�FTSE�Russell�classifies�the�Polish�capital�market�as�a�Developed�Market�since�
2018.�The�markets�operated�by�the�GPW�Group�are�the�biggest�in�Central�and�Eastern�Europe.�
See more: http://www.gpw.pl
The Ministry Of Entrepreneurship and Technology was�established�in�2018.�Its�mission�is�to�
develop solutions which will improve the legal and institutional business environment. The Ministry
supports entrepreneurship and encourages employers to take responsible actions for employees.
The�Ministry�mission�is�also�to�increase�the�efficiency�of�Polish�business�through�innovations.
Finance is Examination Board for Candidates for Statutory Auditors (KE) appointed. The main task of the
EC is to conduct examinations for candidates for statutory auditors, including the diploma examination.
The Board ensures the quality of the statutory audits in Poland, controls the scope of knowledge
necessary to carry out the profession of statutory auditors and promotes the highest standards and
principles of vacation and professional ethics.
See more: https://www.gov.pl/web/finance
Honorary Patronage
Honorary Patronage
42
The National Bank of Poland (NBP) is the central bank of Poland based in Warsaw. The main aim of
NBP is to maintain a stable price level, while supporting the government’s economic policy unless it does
not limit the basic goal of NBP.
NBP�controls�the�issue�of�Poland’s�currency,�the�złoty�as�well�as�Poland’s�mediums�of�exchange.�NBP�
also organizes monetary settlements, operates foreign exchange reserves, conducts foreign exchange
operations,�conducts�banking�services�for�the�state�budget,�regulates�banks’�liquidity,�refinances�banks,�
shapes the conditions necessary for the development of the banking system, keeps monetary and
banking statistics. NBP is responsible for balance of payments and international investment position.
Honorary Patronage
National Chamber of Commerce is the largest independent business organization in Poland.
It�was�founded�in�1990.�It�represents�the�largest�number�of�entrepreneurs,�joining�nearly�160�business�
organizations. In terms of European integration Polish Chamber of Commerce actively cooperates with:
Eurochambres, the Association of European Chambers of Commerce in Brussels integrating European
economic government and lobbying in EU institutions for the interests of entrepreneurs; especially in
matters�created�legislation�that�may�affect�the�condition�of�companies.�Polish�Chamber�of�Commerce�
presents the voice of EU business in the form of opinions and positions the business environment at
the EU level to policies or draft legislation.
See more: https://kig.pl/o-kig/o-nas/
Honorary Patronage
43
The Supreme Audit Office (NIK) is the top independent state audit body whose mission is to
safeguard�public�spending.�For�over�100�years,�NIK�has�looked�into�the�way�the�Polish�state�operations�
and�how�it�spends�public�funds.�The�Supreme�Audit�Office�was�established�as�one�of�the�first�
institutions in the revived, independent Poland. After Poland accessed the European Union, NIK quickly
joined�works�to�develop�the�state�auditing�standards.�Those�efforts�were�recognised�soon.�In�2008,�NIK�
President was appointed Chair of the European Organisation of Supreme Audit Institutions (EUROSAI).
See more: https://www.nik.gov.pl/en/about-us
Thirty-First�Asian-Pacific�Conference�on�International�Accounting�Issues
Honorary Patronage
The Polish Economic Society (Polskie Towarzystwo Ekonomiczne, PTE) is an independent
national�association�of�economists.�It�was�established�in�1945�and�continues�the�tradition�of�the�
Warsaw Association of Economists and Statisticians and Economic Societies before World War II.
The Polish Economic Society is a member of the International Economic Association and maintains
broad international contacts. The Society’s principle aim is to contribute by its activities to the
development of economic thought and culture in Polish society. More about the activities of the
Polish Economic Society can be found here: http://www.pte.pl and its publishing activities:
http://www.ksiazkiekonomiczne.pl.
Detailed�information�on�PTE’s�activities�can�be�found�in�„Bulletin�of�PTE”�-�http://www.pte.pl/223_biuletyny_pte.html
Honorary Patronage

44
ACCA (the Association of Chartered Certified Accountants) is the global body for professional
accountants.�Founded�in�1904,�ACCA�has�consistently�held�unique�core�values:�opportunity,�diversity,�
innovation, integrity and accountability. ACCA believes that accountants bring value to economies in all
stages of development. The organization aims to develop capacity in the profession and encourages
the adoption of global standards. Its values are aligned to the needs of employers in all sectors and it
ensures�that,�through�qualifications,�ACCA�prepares�accountants�for�business.�It�seeks�to�open�up�the�
profession�to�people�of�all�backgrounds�and�removes�artificial�barriers,�innovates�qualifications�and�their�
delivery to meet the diverse needs of trainee professionals and their employers.
See more: https://www.accaglobal.com
Patrons, Partners and Sponsors
Partner
KGHM is among the top world’s largest producers of copper and silver with more than 55 years of
experience�in�mining,�smelting�and�refining.�Beyond�copper�and�silver,�KGHM�extracts�molybdenum,�
nickel, gold, palladium and platinum and produces rhenium. The company’s production assets and
projects are located on three continents.
KGHM’s�core�operations�are�situated�in�Poland.�The�most�significant�foreign�operation�-�Sierra�Gorda�
mine�-�is�situated��in�Chile.�KGHM�Group�employs�over�34�000�people.
See more: www.kghm.com
Gold Sponsor

45
Insurance Guarantee Fund is a key institution of the Polish insurance market protecting injured
parties�in�traffic�accidents�and�collisions�caused�by�uninsured�motor�vehicles’�owners,�protecting�
insured parties and entitled parties from insurance contracts, runs the largest and most modern
insurance�database�in�Poland,�develops�activities�aimed�at�fighting�insurance�crimes�as�well�as�manages�
the Touristic Guarantee Fund.
See more: http://www.ufg.pl
Silver Plus Sponsor
TUW Polski Zakład Ubezpieczeń Wzajemnych was established as PZU Group in response to the
growing interest in mutual insurance. Mutual insurance gives the opportunity of better risk management,
contracts cost optimization and reducing time of concluding insurance contracts for corporate clients,
local government units and hospitals.
Mutual Insurance Company is one of two allowed forms of insurance activity in Polish law along with a
joint-stock company. The Mutual insures its members on the basis of mutuality, and if the membership
depends on the conclusion of the insurance contract it allows the insured communities (Mutual
Cooperations�Membership)�to�be�established.�Members�of�TUW�are�also�its�„owners”.�The�guarantee�
of�financial�security�is�both�the�strong�capital�position�and�credibility�of�the�PZU�Group�as�well�as�the�full�
supervision of the KNF.
See more: https://www.tuwpzuw.pl
Silver Sponsor

46
The Chartered Institute of Management Accountants ® (CIMA), founded�in�1919,�is�the�world’s�
leading and largest professional body of management accountants, with members and students
operating in 177 countries, working at the heart of business. CIMA members and students work
in�industry,�commerce,�the�public�sector�and�not-for-profit�organisations.�CIMA�works�closely�with�
employers�and�sponsors�leading-edge�research,�constantly�updating�its�qualification,�professional�
experience requirements and continuing professional development to ensure it remains the employers’
choice�when�recruiting�financially-trained�business�leaders.�
See more: https://cimaglobal.com/poland
Silver Sponsor
Thirty-First�Asian-Pacific�Conference�on�International�Accounting�Issues
About EY’s Forensic & Integrity Services. Dealing with complex issues of fraud, regulatory
compliance�and�business�disputes�can�detract�from�efforts�to�succeed.�Better�management�of�fraud�
risk and compliance exposure is a critical business priority — no matter the size or industry sector. With
approximately�4,500�forensic�professionals�around�the�world,�EY�will�assemble�the�right�multidisciplinary�
and�culturally�aligned�team�to�work�with�you�and�your�legal�advisors.�EY�works�to�give�you�the�benefit�
of its broad sector experience, its deep subject-matter knowledge and the latest insights from its work
worldwide.
See more: https://www.ey.com
Silver Sponsor

47
The Accountants Association in Poland (AAP) is the biggest and the oldest Polish organization of
professionals�representing�accounting�and�finance.�It�comprises�of�26�Regional�Branches�and�the�Institute�
of�Professional�Certification�for�Accountants.�AAP�has�more�than�23�thousand�of�ordinary�members�
(individuals)�and�2,3�thousand�of�supporting�members�(firms).�Since�1989�it�has�been�a�member�of�the�
International�Federation�of�Accountants�(IFAC).�In�2007�AAP�adopted�the�Code�of�Professional�Ethics�in�
Accounting�that�has�over�25�thousand�of�signatories.�In�2009�AAP�introduced�four-tier�certification�of�the�
accounting profession and grants the professional titles in accounting.
See more: https://www.skwp.pl/en
Partner
PKN ORLEN is a leading-edge player on the fuels and energy markets, and the largest company in Central
and�Eastern�Europe,�listed�in�prestigious�global�rankings�such�as�Fortune�Global�500,�Platts�TOP250�and�
Thompson�Reuters�TOP100.�
The ORLEN Group operates on 6 home markets: in Poland, the Czech Republic, Germany, Lithuania,
Slovakia�and�Canada.�The�Group’s�offering�encompasses�over�50�top-quality�petrochemical�and�refining�
products,�which�are�sold�in�more�than�100�countries�across�6�continents.�PKN�ORLEN�is�also�a�major�
player on the Polish energy market and Poland’s largest industrial electricity producer, with a generation
capacity�of�1.9�GWe.�PKN�ORLEN�is�the�only�company�in�the�region�to�be�included�for�the�sixth�consecutive�
time in the list of The Most Ethical Companies by the US-based Ethisphere Institute.
See more: https://www.orlen.pl/en
Bronze Plus Sponsor

48
PIBR is a professional self-government organization associating all statutory auditors in Poland. Its mission
is�to�ensure�the�reliability�of�financial�information�and�the�security�of�business�transactions.�Members�of�
PIBR implement the mission by providing audit and consulting services in accordance with the highest
standards. The quality guarantee is the supervision over the exercise of the profession of statutory auditor,
exercised�by�the�local�government,�and�constant�improvement�of�professional�qualifications�by�PIBR�
members.
See more: https://www.pibr.org.pl/en
Bronze Sponsor
KPMG in�Poland�for�nearly�30�years�has�provided�professional�including�Audit,�Tax,�Advisory�services,�and�
D.Dobkowski�sp.k.,�a�Polish�limited�partnership,�a�law�firm�associated�with�KPMG�in�Poland�–�Legal�services.�
KPMG�employs�almost 2,000�people�in�Warsaw,�Kraków,�Poznań,�Wrocław,�Gdańsk,�Katowice�and�Łódź.
Yamaha is a representative of the Japanese manufacturer of motorcycles and scooters, ATVs and Side-
by-Side vehicles and Marine equipment in Poland. Its mission is to provide customers with Kando. This
term in Japanese means the feeling of excitement felt when encountering something of exceptional value,
quality�and�performance.�These�features�distinguish�Yamaha�products�and�provide�the�firm�with�
a leading position in the sale of new motorcycles among premium brands in Poland.
See more: http://www.yamaha-motor.pl
Bronze Sponsor
Sponsor

49
BDO is�one�of�the�leading�international�audit�and�advisory�companies,�present�in�Poland�since�1991.�Over�
the years its experts have been observing and taking an active part in the growth of the Polish capital market.
The organization gained the trust of the largest Polish and foreign companies, as well as mid-sized Polish
and�international�firms,�family�businesses,�listed�companies�and�financial�institutions.�BDO�successes�include�
Poland’s�first�privatizations.�The�firm�has�also�taken�part�in�the�introduction�to�public�trading�of�the�first�
companies�listed�on�the�Warsaw�Stock�Exchange.�It�prepared�Poland’s�first�issue�prospectus,�as�well�as�the�
first�prospectus�in�accordance�with�EU�standards.�BDO�eagerly�shares�its�knowledge�with�clients�through�
numerous training programs, and by organizing conferences and business events.
Sponsor
Sponsor
Deloitte provides�audit,�consulting,�financial�advisory,�risk�advisory,�tax�and�related�services�to�public�
and�private�clients�spanning�multiple�industries.�Deloitte�serves�four�out�of�five�Fortune�Global�500®�
companies�through�a�globally�connected�network�of�member�firms�in�more�than�150�countries�and�
territories bringing world-class capabilities, insights, and high-quality service to address clients’ most
complex business challenges.
Deloitte�in�Poland�is�one�of�the�leading�firms�providing�professional�advisory�services�in�six�main�areas�
audit,�tax�advisory,�consulting,�risk�management,�financial�and�legal�advisory.�Deloitte�Poland�employs�
more�than�2,500�dedicated�professionals�providing�a�wide�range�of�services.
See more: https://www2.deloitte.com/pl/en.html
Sponsor
Thirty-First�Asian-Pacific�Conference�on�International�Accounting�Issues

50
Rzeczpospolita is a nationwide daily economic and legal newspaper and the only conservative-liberal
newspaper�in�Poland.�The�paper’s�title�may�be�loosely�translated�as�„commonwealth”�or�„republic”,�
a�part�of�the�traditional�full�name�of�the�Polish�state�–�Rzeczpospolita�Polska.��Rzeczpospolita�is�read�by�
274,000�adult�Poles�on�a�daily�basis,�of�which�75%�have�higher�education.�More�than�three-quarters�of�
key corporate personnel choose Rzeczpospolita; the majority of readers are specialists and professionals,
CEOs,�high-level�state�officials,�managers,�as�well�as�technicians�and�specialised�administrative�staff.�
Over one half of Rzeczpospolita readers manage the work of others on an everyday basis.
Exclusive Media Patronage


52
TABLE OF CONTENTS
“BORROWER-LENDER CROSS-OWNERSHIP AND VOLUNTARY DISCLOSURE” Jimmy F. Downes, Tony Kang, Jing Wang and Liying Wang .............................................1
“OPTIONS TRADING AND VOLUNTARY CORPORATE DISCLOSURE” Yangyang Chen, Jeffrey Ng and Xin Yang ...........................................................................2
“ACCOUNTING FOR STOCK OPTIONS: HISTORICAL DEVELOPMENTS, CONTROVERSY AND PROGNOSIS”
Wei Chern Koh and Teck Min Choo .....................................................................................3
“THE IMPACT OF CLIENT SIZE, AUDIT FIRM SIZE FRAUD EXPERIENCE AND AUDIT EXPERIENCE ON AUDITOR’S PROFESSIONAL SKEPTICISM – THE CASE OF COLOMBIA”
Adelaida Correa, Mary Anali Vera-Colina and Medhat Endrawes .......................................4
“CORRUPTION AND AUDITOR CHOICE: A CROSS-COUNTRY INVESTIGATION” Rong-Ruey Duh, Chunlai Ye and Lin-Hui Yu ......................................................................5
“EXTERNAL AUDITORS’ RELIANCE ON MANAGEMENT’S EXPERTS: THE EFFECTS OF A PRE-ENGAGEMENT CONVERSATION AND PAST AUDITOR-CLIENT RELATIONSHIP”
Prerana Agrawal, Isabel Z. Wang and David Woodliff .......................................................6
“AN EMPIRICAL INVESTIGATION OF THE EFFECT OF POWERFUL CFOS ON DISCLOSURE QUALITY”
Lutfa Tilat Ferdous, Kamran Ahmed and Darren Henry ......................................................7
“WHY DOES LARGE PAY DISPARITY ADVERSELY AFFECT FIRM PERFORMANCE IN KOREA?”
Jeongtaek Kim .......................................................................................................................8
“CHARACTERISTICS OF HIGH-GROWTH FIRMS IN THAILAND” Kanitsorn Terdpaopong, Bernice Kotey and Nam Hoang ....................................................9
“STAKEHOLDER IMPORTANCE AND CORPORATE SOCIAL RESPONSIBILITY: EVIDENCE FROM A QUASI-NATURAL EXPERIMENT”
C.S. Agnes Cheng, Xiaohui Li, Zeyu Sun and Jing Xie .....................................................10
“DOES CSR REALLY ENHANCE SUSTAINABILITY? A PERSPECTIVE OF BUSINESS CYCLE”
Kwang Hwa Jeong and Sejoong Lee ...................................................................................11
“DEVELOPING A CORPORATE SUSTAINABILITY REPORTING FRAMEWORK IN AN EMERGING ECONOMY”
Bita Mashayekhi, Hossein Shaker Taheri and Mehdi Momeni Taheri ...............................12
“JOB HOPPING AND INNOVATION EFFICIENCY: EVIDENCE FROM CHINA” Yuan Yuan Hu, Jing Jia, Zhongtian Li and Baoshan Tao ...................................................13
“LIMITED AVAILABILITY IN CROWDFUNDING PROJECTS – GUARANTEE FOR PROFITABILITY?”
Alexander Fox and Jana Neuland ........................................................................................14
“CAN BOARD DIVERSITY HAVE AN EFFECT ON DECISION MAKING FOR INVESTMENT? – A PRELIMINARY ANALYSIS OF CORPORATE GOVERNANCE IN JAPAN”
Chieko Matsuda ...................................................................................................................15
“CORPORATE GOVERNANCE AND INVESTMENT DECISIONS: AN EXPERIMENTAL STUDY ON REAL INVESTORS”
ATM Tariquzzaman, Ian Eggleton and Tony van Zijl ........................................................16
“DOES CORPORATE GOVERNANCE DISCLOSURE PLAY THE ROLE OF INFORMATION FEEDBACK IN KOREA?”
Jin Yeung Hong, Sook Min Kim and Seung Weon Yoo .....................................................17
“DOES THE BOARD OF COMMISSIONER MONITOR BUSINESS STRATEGIES EFFECTIVELY?”
Dianwicaksih Arieftiara ......................................................................................................18
“IFRS ADOPTION AND EARNINGS QUALITY: EVIDENCE FROM A STAGED CONVERGENCE APPROACH”
D’yan Sukartha, Stuart Tooley and Peter Green .................................................................20
“INSTITUTIONAL THEORY PERSPECTIVE ON RECORDING AND MANAGING ASSET DATA IN THE PUBLIC HEALTH SECTOR”
Nirmala Nath, Yuan Yuan Hu and Shirley Chan ................................................................21
“ANALYSIS OF INSOLVENCY RISKS AND FINANCIAL PERFORMANCES OF BANKS IN THAILAND”
Metjiranont Theeraseth and Sodsongkrit Metcha ...............................................................22
“IS THERE EVIDENCE OF POST-EARNINGS ANNOUNCEMENT DRIFT IN LATIN AMERICA?”
Ervin Black, Gerlando Lima and Verônica Santana ...........................................................23
“DO INVESTORS EXPLOIT BANK EARNINGS MANAGEMENT INFORMATION TO EARN PROFITS IN STOCK MARKETS: A CASE OF ASIA PACIFIC?”
Nguyen N.T. Vo, Thai V.H. Nguyen and Duc T.H. Phan ...................................................24
“ACCOUNTABILITY AND AGGRESSIVE FINANCIAL REPORTING JUDGMENTS” Peipei Pan and Chris Patel ...................................................................................................25
“COMPREHENSIVE INCOME AND CREDIT RISK: EVIDENCE FROM JAPAN” Tomohiro Suzuki and Koreyoshi Seki ................................................................................26
“IFRS ADOPTION AND SEASONED EQUITY OFFERING UNDERPERFORMANCE” Solomon Opare, Muhammad Nurul Houqe and Tony van Zijl ...........................................27
“THE GROSS PROFITABILITY ANOMALY: RISK OR MISPRICING?” Sang Ho Lee and Yong Keun Yoo ......................................................................................28
“DETERMINANTS OF THE QUALITY OF FINANCIAL REPORTING AND PUBLIC SERVICE QUALITY: A STUDY IN THE CONTEXT OF THE APPLICATION OF ACCRUAL ACCOUNTING SYSTEMS AND PUBLIC SECTOR AUDIT IMPLEMENTATION IN INDONESIA”
Andi Chairil Furqan, Ratna Wardhani, Dwi Martani and Dyah Setyaningrum ..................29
“THE IMPACT OF FAIR DISCLOSURE REGULATION ON MANAGEMENT EARNINGS FORECASTS: EVIDENCE FROM JAPAN”
Yuki Horie ...........................................................................................................................30
“PRICING OF AUDIT SERVICES IN INDIA – A STUDY” Sanjib Kumar Basu ..............................................................................................................31
“THE REEXAMINATION OF AUDITOR SELECTION MODELS” Takashi Obinata and Takashi Taekura ................................................................................32
“AUDIT-SOFTWARE SKILLS READINESS – A DATA ANALYSIS TEACHING CASE” Fernando Parra and Hyung Tae Kim ...................................................................................33
“THE INFLUENCE OF THE SUCCESSION SOURCES OF SENIOR EXECUTIVES ON THE EARNINGS MANAGEMENT”
Hong Huang and Haiyu Liu ................................................................................................34
“INTEGRATED REPORTING AND EARNINGS QUALITY: THE MODERATING EFFECT OF AGENCY COST”
Victoria A. Obeng, Kamran Ahmed and Seema Miglani ....................................................35

“REMOVING THE CAMOUFLAGE: THE EFFECTS OF ANALYST GAAP EARNINGS FORECAST ON MANAGER’S CLASSIFICATION SHIFTING PRACTICE”
Tatyana Ryabova, Shu Lin and Harry Hui Xia ...................................................................36
“BUSINESS SCHOOLS’ ROLES IN DEVELOPING TRANSNATIONAL MANAGERS” Jia Wang and Ali Peyvandi .................................................................................................37
“INTERNATIONAL GRADUATE SCHOOL IN ACCOUNTANCY – EXPERIENCE AND DEVELOPMENT”
Yoko Suga and Toshifumi Takada ......................................................................................38
“THE ASSOCIATION BETWEEN SOCIAL MEDIA USE AND STUDENTS’ LEARNING PERFORMANCE”
Sylvia Veronica Siregar and Bayu Tenoyo .........................................................................39
“THE ASSOCIATION BETWEEN EARNINGS ATTRIBUTES AND THE COST OF EQUITY CAPITAL: EVIDENCE FROM JAPAN”
Junko Jinushi .......................................................................................................................40
“THE STOCK PRICE RELEVANCE OF ROE DECOMPOSITION FACTORS IN KOREA STOCK MARKETS”
Changrae Park .....................................................................................................................41
“A STUDY ON DYNAMIC CAPABILITY FOR GLOBALIZATION OF REGIONAL INDUSTRY”
Takao Nomakuchi ...............................................................................................................42
“PREVENTION OR DETECTION OF PROBLEMS IN CAPITAL GROUPS DISCRIMINATORY ANALYSIS IN THE EXTENDED TIME HORIZON”
Anna Karmańska and Magdalena Indyk .............................................................................43
“DOSE QUALITATIVE DISCLOSURE OF CLIMATE CHANGE INFLUENCE JAPANESE CORPORATE VALUE?”
Yuki Tanaka ........................................................................................................................44
“PROFITABILITY AND ORGANISATIONAL STRUCTURE OF THE WORLD´S BIGGEST STOCK EXCHANGE OPERATORS”
Dorota Wiśniewska .............................................................................................................45
“EXPLORING SUSTAINABILITY AND GREEN BANKING DISCLOSURES: A STUDY OF INDONESIAN BANKING SECTOR 2009 – 2017”
Juniati Gunawan, Umesh Sharma and Paulina Permatasari ................................................46
“PENSION FUNDS AND IPO PRICING. EVIDENCE FROM A QUASI-NATURAL EXPERIMENT”
L.K. Langer, P.B. Langer and P. Roszkowska ....................................................................47
“DO BUSINESS GROUPS RAISE POST MERGER PERFORMANCE?” Kentaro Kaneko, Reiko Kashiwazaki and Fumiko Takeda.................................................48
“SEIGNIORAGE, CENTRAL BANKS’ FINANCIAL RESULTS AND THE CRISIS” Zbigniew Polański and Mikołaj Szadkowski ......................................................................49
“EXECUTIVE COMPENSATION AND COMPANY VALUATION”
Andreas Schueler .................................................................................................................50 “AUDIT SERVICE MARKET ACROSS THE BUSINESS CYCLE”
Jae Yeon Sim and Sang Hyuk Lee ......................................................................................51 “EXPLORING THE STATE-ACCOUNTING PROFESSION NEXUS: THE MALAYSIAN EXPERIENCE”
Susela Devi K. Suppiah and Salima Y. Paul .......................................................................52 “CYBERSECURITY AND AI – IMPLICATIONS FOR INTERNAL AUDITING”
Toshifumi Takada, Masatoshi Sakaki, Shiro Aoyagiceo and Hiroshi Kawaguchi .............53
“MANAGERIAL ABILITY AND THE COST OF EQUITY CAPITAL” Heeick Choi, Soomi Jang and Hyung Tae Kim ..................................................................54
“PERFORMANCE MEASUREMENT SYSTEMS DESIGN CHOICE: THE ROLES OF POLITICAL CONNECTION AND SOCIAL NETWORK ON FIRM PERFORMANCE: EVIDENCE FROM CHINA”
Vincent K. Chong, Gary S. Monroe, Isabel Z. Wang and Frank Zhang .............................55
“REVENUE MANAGEMENT THAT CONTRIBUTES TO INCREASING PRODUCTIVITY ON HOTEL BUSINESSES”
Tsutomu Yoshioka ..............................................................................................................56 “POKEMON GO! STOCK VALUATION AND DISRUPTIVE INNOVATION IN ENTERTAINMENT INDUSTRY”
Claudio Marcelo Edwards Barros, Iago França Lopes and Itzhak David Simão Kaveski ..57
“PERFORMANCE EVALUATION OF STATE-OWNED COMPANIES AND CORPORATE INFORMATION DISCLOSURE VIOLATIONS”
Yunying Fu ..........................................................................................................................58 “ACCOUNTING JURISDICTIONS IN AFRICA: IFRS, OHADA, NEITHER”
Saeed Askary .......................................................................................................................59 “INFORMATION TRANSFER OF VOLUNTARY DISCLOSURE AMONG KOREAN CHAEBOL COMPANIES WITH RELATED PARTY TRANSACTION”
Sungmin Jeon ......................................................................................................................60
“IS THE GOVERNMENT PUBLIC BUDGET AN ECONOMIC ENTITY? A VIEW FROM SYSTEMS PERSPECTIVE”
Wojciech A. Nowak ............................................................................................................61
“THE EFFECT OF OPERATIONAL AND FINANCIAL INFORMATION DISCLOSURE ON THE DEFAULT PROBABILITY AND AVERAGE LENDING RATE: EVIDENCE FROM CHINESE PEER-TO-PEER LENDING MARKET”
Jiaqi Kuang, David Xudong Ji and Peng Cheng ..................................................................62 “INTELLECTUAL CAPITAL EFFICIENCY AND FIRM FINANCIAL PERFORMANCE: EVIDENCE FROM SOUTH EAST ASIAN COUNTRIES”
Ainul Islam, Mohd Ariff Arifatul Husna and Tony van Zijl ...............................................63 “CHARACTERISTICS OF JAPANESE LIFE INSURANCE COMPANIES DISCLOSING EMBEDDED VALUE”
Makoto Tsukahara, Kazuhiro Nishiyama and Ryosuke Nakamura ....................................64
“THE ETHICAL IMPLICATIONS OF CHANGES TO THE DODD FRANK ACT AND SARBANES OXLEY ACT”
Behnaz Z. Quigley ...............................................................................................................65
“THE USE OF XBRL (EXTENSIBLE BUSINESS REPORTING LANGUAGE) FOR THE NEEDS OF FINANCIAL REPORTING ON CAPITAL MARKETS - BENEFITS, COSTS, AND DETERMINANTS OF APPLICATION”
Katarzyna Klimczak ............................................................................................................66 “THE IMPACT OF BUSINESS MODEL INNOVATION ON FINANCIAL STATEMENTS – SELECTED PROBLEMS”
Mariusz Karwowski ............................................................................................................67 “AGGREGATE EARNINGS INFORMATIVENESS AND ECONOMIC SHOCK: INTERNATIONAL EVIDENCE”
Makoto Nakano and Yuto Yoshinaga .................................................................................68
“NARRATIVE RISK DISCLOSURES IN ANNUAL REPORTS: PROPOSAL OF RISK MAP”
Anna Karmańska and Monika Łada ....................................................................................69 “DO FINANCIAL REPORTING QUALITY AND CORPORATE SOCIAL RESPONSIBILITY ASSOCIATED WITH INVESTMENT EFFICIENCY? EVIDENCE FROM INDONESIA”
Sylvia Veronica Siregar .......................................................................................................70
“THE EFFECT OF CORPORATE SOCIAL RESPONSIBILITY ON THE ORGANIZATIONAL COMMITMENT OF EMPLOYEES MEDIATED BY INTRINSIC MOTIVATION”
Edicreia andrade dos santos, Januário José Monteiro, Rogério João Lunkes and Claudio Marcelo Edwards Barros .....................................................................................................71
“THE IMPACT OF ASYMMETRIC COST BEHAVIOR ON THE AUDIT REPORT LAG”
Jin Ho Kim ..........................................................................................................................72
“CYBERCURRENCY AND BLOCKCHAIN IN THE COLLEGE ACCOUNTING CLASSROOM”
Ermira Mazziotta and Ellen Rackas ....................................................................................73
“EFFECT OF CULTURAL AND HISTORICAL EVENTS ON INNOVATION OF LIFE INSURANCE MARKET – BRIEF DISCUSSION ON POLISH CASE”
Adam Sliwinski ...................................................................................................................74
“CONFORMITY PRESSURE AND COMPENSATION CONTRACTS” Taichi Kimura and Yutaro Murakami .................................................................................75
“RISK MANAGEMENT CHALLENGE IN MULTI-STAKEHOLDER DECENTRALIZED RISK ENVIRONMENT. FMD - A PIONEER EUROPEAN PRIVATE-PUBLIC MANAGED BIG DATA PROJECT IN HEALTHCARE SECTOR”
Michał Kaczmarski .............................................................................................................76
“POOR PUBLIC SECTOR ACCOUNTABILITY IN NIGERIA. THE IMPERATIVE OF TREASURY SINGLE ACCOUNT (TSA)”
Godwin Ndu Uchechukwu ..................................................................................................77
“BOOK TAX CONFORMITY, EARNINGS MANAGEMENT AND COMPENSATION CONTACTS”
Yiu Wai Wong .....................................................................................................................78
“PERFORMANCE OF PUBLIC SECTOR AND GOVERNMENT FINANCIAL STATEMENTS: THE CASE OF INDONESIA”
Endang Kiswara and Dyah Turanggadewi Arya .................................................................79
“THE EFFECTS OF VOLUNTARY ADOPTION SYSTEM OF IFRS AND US GAAP: EVIDENCE FROM JAPANESE MNES”
Hideaki Sakawa, Naoki Watanabel and Junjian Gu ............................................................80 “DOES GOOD CORPORATE GOVERNANCE INCREASE BUSINESS VALUE? EVIDENCE FROM AN EMERGING ECONOMY, INDIA”
Ahindra Chakrabarti ............................................................................................................81

“THE INFLUENCE OF IFRS ADOPTION ON FINANCIAL REPORTING QUALITY: EMPIRICAL EVIDENCE FROM BANKS IN THE UAE AND EGYPT”
Magdi El-Bannany ..............................................................................................................82 “GOVERNANCE DISCLOSURES, SENIOR MANAGEMENT AND THEIR INFLUENCES ON TAX AVOIDANCE”
Estralita Trisnawati and Juniati Gunawan ...........................................................................83
Page | 1
BORROWER-LENDER CROSS-OWNERSHIP AND VOLUNTARY DISCLOSURE
Jimmy F. Downes University of Nebraska-Lincoln
U.S.A. [email protected]
Tony Kang
University of Nebraska-Lincoln U.S.A.
Jing Wang University of Nebraska-Lincoln
U.S.A. [email protected]
Liying Wang
University of Nebraska-Lincoln U.S.A.
ABSTRACT This study examines the effect of borrower-lender cross-ownership on voluntary disclosure around the initiation of syndicated loans. We hypothesize those cross-owners, institutional shareholders who hold the equities of both the borrower and the lead lender, have an incentive to reduce information asymmetry between contracting parties by encouraging the borrower to disclose more and provide more accurate disclosures. Supporting this idea, our evidence shows that the pre-loan period management earnings guidance occurrence, frequency and accuracy are positively associated with cross-ownership and that these associations are more pronounced when the borrower has a weaker information environment (i.e., greater information asymmetry), is more financially constrained, and when the proprietary costs of disclosure are lower. These results highlight the important role of cross-owners in encouraging more transparent borrower disclosure in debt contracting.

Page | 2
OPTIONS TRADING AND VOLUNTARY CORPORATE DISCLOSURE
Yangyang Chen The Hong Kong Polytechnic University
Hong Kong [email protected]
Jeffrey Ng
The Hong Kong Polytechnic University Hong Kong
Xin Yang The Hong Kong Polytechnic University
Hong Kong [email protected]
ABSTRACT
Motivated by the close relation between stock options and the underlying stock and the informed trading taking place in the options market, we examine the effect of options trading on voluntary corporate disclosure. We find that options trading is negatively and significantly related to the likelihood and frequency of management earnings forecasts, suggesting that firms with an active options market make less voluntary disclosure. This finding suggests that information spillover from the options market to the stock market can increase stock price informativeness, in turn, reducing the need for firms to engage in voluntary disclosure to guide investor expectations. We further document that the negative relation between options trading and management forecasts is more pronounced for firms with a poorer information environment, a finding that highlights that information transfer from other markets, especially those with informed trading, is more important for more opaque firms. Consistent with information transfer reducing the need for voluntary disclosure, we also find that the negative relation is more pronounced for firms with stock market conditions that facilitate more price discovery. Lastly, we find that options trading reduces the specificity and informativeness of management forecasts. Our paper offers new insight into how cross-market information transfer can affect voluntary disclosure.

Page | 3
ACCOUNTING FOR STOCK OPTIONS: HISTORICAL DEVELOPMENTS, CONTROVERSY AND PROGNOSIS
Wei Chern Koh
Singapore University of Social Sciences Singapore
Teck Min Choo
Nanyang Technological University Singapore
ABSTRACT
The standard setting process surrounding the stock option accounting standard in the United States has a rich history since 1948 and is interesting due to the controversial nature of the standard. The process of arriving at this standard was very political in terms of lobbying activities. There were two major revisions to the stock-based compensation standard, in1993 and 2004. For the first interim or annual reporting period beginning after June 15, 2005 under SFAS 123R (revised in 2004) (currently, ASC 718), firms are to use fair value accounting (“FVA”) of the stock options in the income statement, i.e. expense the fair value of the stock options over the vesting period. Before the above, under SFAS 123 (issued in 1994), firms used intrinsic value accounting (“IVA”) in the income statement with concurrent disclosure of fair value in the notes. Intrinsic value is the difference between current stock price and exercise price. Hence, IVA permits zero expense if the exercise price is greater than current stock price. We summarise key arguments for and against stock option expensing and use academic research evidence and definitions from the Conceptual Framework to supplement these arguments. We attempt to provide a “one-stop” paper with detailed information about the stock option phenomenon, examining the political process behind standard setting and the controversies surrounding stock option expensing from the point of view of practice, research and technical definitions. For completeness, the paper also touches on the backdating scandal relating to stock options. The intention is to provide an article on the accounting of stock options expenses that can be used in classrooms for discussion purposes.

Page | 4
THE IMPACT OF CLIENT SIZE, AUDIT FIRM SIZE FRAUD EXPERIENCE AND AUDIT EXPERIENCE ON AUDITOR’S PROFESSIONAL SKEPTICISM – THE CASE
OF COLOMBIA
Adelaida Correa National University of Colombia
Colombia
Mary Analí Vera-Colina National University of Colombia
Colombia
Medhat Endrawes Macquarie University
Australia [email protected]
ABSTRACT
The current study examines the impact of fraud experience, years of experience, rank, audit firm size and client size on professional skepticism (PS) in multinational and national audit firms in Bogotá, Colombia. Public accounting professionals with experience in external audit and / or statutory audit in Bogotá, Colombia participated in the study. We find a significant main effect of audit firm size on PS and the impact of auditor rank and fraud experience was marginally significant only for small client. We did not find any significant impact of years of experience on PS. The evidence from this study is very relevant to the circumstances of South America economies, and to those of emerging countries overall. Keywords: PS, auditor, experience, Client size, Colombia

Page | 5
CORRUPTION AND AUDITOR CHOICE: A CROSS-COUNTRY INVESTIGATION
Rong-Ruey Duh* National Taiwan University
Taiwan [email protected]
Chunlai Ye
Texas A&M International University U.S.A.
Lin-Hui Yu National Taiwan University
Taiwan [email protected]
ABSTRACT
The purpose of this study is to examine whether the corruption level of a country is associated with the decision to choose Big 4 versus non-Big 4 auditors. In addition, we examine whether firms cross-listing in a country with a corruption level different from the home country are more likely to appoint Big 4 auditors. Based on a sample of 185,549 firm-year observations from 78 countries over 2003–2012, panel regression analysis is used to investigate the research questions. We find a negative association between corruption and the propensity to hire Big 4 auditors and that cross-listed firms are more likely to hire Big 4 auditors than their domestic counterparts. Interestingly, we find that when firms cross-list in less corrupt countries relative to their home countries, firms are more likely to hire Big 4 auditors. However, this tendency disappears when firms cross-list in more corrupt countries. Finally, we find that Big 4 auditors in corrupt countries are more likely to issue a qualified/adverse opinion or to disclaim an opinion. Keywords: Corruption; Auditor choice; Cross-list; Political economy Data Availability: Data used in this study are available from public sources identified in the study

Page | 6
EXTERNAL AUDITORS’ RELIANCE ON MANAGEMENT’S EXPERTS: THE EFFECTS OF A PRE-ENGAGEMENT CONVERSATION AND PAST AUDITOR-
CLIENT RELATIONSHIP
Prerana Agrawal The University of Western Australia
Australia [email protected]
Isabel Z. Wang
The Australian National University Australia
David Woodliff The University of Western Australia
Australia [email protected]
ABSTRACT
This study examines the impact of a pre-engagement conversation with a management’s expert on auditors’ reliance decisions within the context of collaborative and contentious auditor-client relationships. We conduct a 2 x 2 between-subjects experiment with 69 experienced auditors in Australia. Our results suggest that in the presence of inconsistent audit evidence, the presence of a pre-engagement conversation and the nature of auditor-client relationship do not influence auditors’ decisions. However, we do find the auditors’ decision to accommodate a client’s interests to be influenced by the nature of the auditor-client relationship and not by the presence of a pre-engagement conversation.
Page | 7
AN EMPIRICAL INVESTIGATION OF THE EFFECT OF POWERFUL CFOS ON DISCLOSURE QUALITY
Lutfa Tilat Ferdous La Trobe University
Australia
Kamran Ahmed La Trobe University
Australia
Darren Henry La Trobe University
Australia
ABSTRACT
We examine the relation between powerful CFO status and accounting disclosure quality, measured using financial statement disaggregation disclosure (FSDQ) and analyst forecast (AFDQ) indices. Empirically, we validate that CFO power, measured over a number of dimensions, predicts firms’ financial disclosure choices. The results are consistent after controlling for CEO Power and CFO compensation moderating elements. We also find that the relation is stronger for high sales growth firms and firms that have sound governance structures. Our results are robust to multiple information quality tests (including CFO background diversity, analyst forecast characteristics, bid ask spread, cost of debt, and market liquidity). Further, we address the potential endogeneity between CFO power and disclosure quality and identify supportive findings. The results highlight the importance of CFO power to the financial reporting process and decision-making. Keywords: CFO Power, Disclosure Quality, Financial Statement Disaggregation, Analyst Forecast Characteristics, CEO Power, Compensation, Monitoring Intensity
Page | 8
WHY DOES LARGE PAY DISPARITY ADVERSELY AFFECT FIRM PERFORMANCE IN KOREA?
Jeongtaek Kim
Korea University Korea
ABSTRACT
This study investigates the effect of large pay disparity between executive and employee on firm performance and explore the underlying cause of the result. In this study conducted for Korean publicly traded companies, I find that pay multiple is negatively associated with subsequent firm’s operating and stock return performance. In general, there have been a couple of main explanations on this result in prior literature. One is that large pay disparity harms employee morale and the other is that large pay disparity is a manifestation of management rent extraction. I first find that the relation between pay multiple and proxy for employee morale is statistically insignificant, suggesting that the first explanation is not supported empirically, at least in Korea. As an alternative explanation, I examine whether the adverse effect of large pay disparity is because it implies the prevalence of management rent extraction and find that the level of executive pay is negatively associated with subsequent firm performance. This result remains unchanged when replacing the level of executive pay with excess executive pay. Taken together, my findings imply that to address the adverse effect of large pay disparity in Korea, regulators and corporate sector should focus on mitigating the agency problem rather than simply decreasing the pay gap itself.
Page | 9
CHARACTERISTICS OF HIGH-GROWTH FIRMS IN THAILAND
Kanitsorn Terdpaopong Rangsit University
Thailand
Bernice Kotey University of New England
Australia [email protected]
Nam Hoang
University of New England Australia
ABSTRACT High-growth firms (HGFs) are seen as vital for economic growth. A small number of HGFs drives a disproportionately large amount of job creation, while the average firm has a limited impact on the economy. It is therefore essential for policy and theory to consider the barriers faced by firms achieving high growth and those with the potential to do so. Definition of HGFs is identified in this article and classifications of HGFs are introduced based on cumulative sale growth. This article used data of 753 Thai firms for a period of four years (2013 – 2016), 3,012 firm-year observations, to investigate the characteristics of each growth–firm classifications and to investigate factors that might potentially influence the firm’s profitability. The results suggest that Thai and Japanese major shareholders have negatively correlation to the profitability (ROA) when firms reached a high growth level while being small-sized provides a positive correlation to it. The results have implications for theory on high-growth firms and policies focused on them. Keywords: High-growth firms, HGFs, SMEs, profitability, correlated random effects, Thailand

Page | 10
STAKEHOLDER IMPORTANCE AND CORPORATE SOCIAL RESPONSIBILITY: EVIDENCE FROM A QUASI-NATURAL EXPERIMENT
C.S. Agnes Cheng
The Hong Kong Polytechnic University Hong Kong
Xiaohui Li
The Hong Kong Polytechnic University Hong Kong
Zeyu Sun
University of International Business and Economics China
Jing Xie
The Hong Kong Polytechnic University Hong Kong
ABSTRACT
We investigate whether stakeholder importance perceived by the board leads to better corporate social responsibility (CSR) performance and whether changes in CSR, due to exogenous shocks to stakeholder importance, affect firm value. Taking the adoption of state-level constituency statues as a quasi-natural experiment, we find that firms increase CSR after the adoption and the effect is stronger for firms with more severe conflict of interest between shareholders and stakeholders. We also find that increased CSR performance following constituency statues adoption leads to increases in firm performance and valuation, providing new evidence of a positive causal relation between CSR and firm performance and valuation. Overall, our paper suggests that the awareness of boards of the stakeholders’ interest is effective in governing firms to perform the proper type of CSR that satisfies both stakeholders and shareholders and reduce the conflict of interests between them. Keywords: Corporate Social Responsibility; Constituency Statutes; Shareholder-Stakeholder Conflict; Firm Valuation JEL Classification: M4, M14, G14, G38 Data Availability: Data used in this study are publicly available
Page | 11
DOES CSR REALLY ENHANCE SUSTAINABILITY? A PERSPECTIVE OF BUSINESS CYCLE
Kwang Hwa Jeong
Kangwon National University Korea
Sejoong Lee University of Seoul
Korea [email protected]
ABSTRACT
This paper investigates the effect of macroeconomic conditions on the relationship between CSR and firm value. Employing KEJI index as a proxy for a firm’s CSR activities, we find that a firm’s value with a high CSR score is underestimated under recession. The result implies that CSR may not represent corporate sustainability. We document that investors discount the value of CSR in the economic recession when sustainability becomes more important. By relating macroeconomic situation to the value of CSR, this study presents a new direction in the stream of CSR literature. Also, it represents that stable macroeconomic management is one of the important factors to fully enjoy the value of CSR.

Page | 12
DEVELOPING A CORPORATE SUSTAINABILITY REPORTING FRAMEWORK IN AN EMERGING ECONOMY
Bita Mashayekhi
University of Tehran Iran
Hossein Shaker Taheri
Islamic Azad University-Islamshahr Iran
Mehdi Momeni Taheri
Islamic Azad University-Islamshahr Iran
ABSTRACT
Today, the issue of corporate sustainability is noted both in academic literature and in the business environment, and there are many companies and organizations that want to make their operations sustainable and communicate different dimensions of sustainability in their business to stakeholders through sustainability reporting. This paper seeks to provide a framework for corporate sustainability reporting by reviewing existing literature on sustainability reporting, taking into account the expertise of domestic experts, to provide a roadmap for developing corporate sustainability reports in Iran. The statistical population of this study includes professionals and academics, including university teachers and post- graduate students in business majors. Our sample was determined via judgment sampling and data was obtained through 119 designed questionnaires. The results of this research is summarized in a Corporate Sustainability Reporting Framework for Iran, which is developed based on Seven research questions related to preparers of sustainability reports; determinants of sustainability reporting; the content of sustainability reports; corporate governance mechanisms necessary for sustainability reporting; challenges and risks with regard to sustainability reporting; benefits of sustainability reports; and assurance of sustainability reports. Keywords: Sustainability Reporting; Corporate Sustainability; Assurance JEL Classification: M40, M49
Page | 13
JOB HOPPING AND INNOVATION EFFICIENCY: EVIDENCE FROM CHINA
Yuan Yuan Hu Massey University
New Zealand [email protected]
Jing Jia
University of Tasmania Australia
Zhongtian Li Queensland University of Technology
Australia [email protected]
Baoshan Tao
Zhejiang Sci-Tech University China
ABSTRACT Knowledge transfer resulting from job hopping constitutes an important source of innovation. With a large amount of money being invested in R&D, there is a growing interest in understanding the efficiency of R&D activities. Using data envelopment analysis (DEA) technique to estimate R&D efficiency, we empirically investigate the impact of job hopping on R&D efficiency in China, where the term job mobility only exists about 20 years. Specifically, we build a job-hopping index based on the past job-hopping experiences of three important corporate governance bodies, namely top management team, board of directors and supervisory boards (we collectively referred the three bodies as MBS). The results show that the job-hopping index of MBS is associated with higher R&D efficiency, suggesting that past job-hopping activities of MBS have significant effects on firms’ innovation efficiency. Firms located in the province with high R&D intensity tend to have high R&D efficiency. Job hopping strengthened the relationship between R&D intensity and R&D efficiency.
Page | 14
LIMITED AVAILABILITY IN CROWDFUNDING PROJECTS – GUARANTEE FOR PROFITABILITY?
Alexander Fox
Ilmenau University of Technology Germany
Jana Neuland Ilmenau University of Technology
Germany [email protected]
ABSTRACT
The popularity of crowdfunding has risen immensely in the last decade. Crowdfunding has not only become an alternative and additional source for entrepreneurs looking for funding (Tomczak and Brem 2013; Moritz and Block 2014; Bouncken et al. 2015, Fox et al. 2015), it also gets high attention from research. While prior studies mainly concentrate on analysing the determinants of success of crowdfunding projects (Greenberg et al. 2013; Kunz et al. 2017) or use hypothetical research designs for analysing the profitability of crowdfunding (e.g. Harms 2007; Ordanini et al. 2011), our study is not limited to a hypothetical sample. We analyse the relationship between the use of limited availability in crowdfunding projects and the profitability of the included pledge levels. Our focus lies on the impact of limited availability in crowdfunding projects on profitability. Therefore, we analysed data from kickstarter.com, one of the world’s largest crowdfunding platforms. The database contains extracted information on all pledge levels of each project posted on the platform from its inception between 16th of May 2013 and 19th of May 2013. In the end, this study uses a dataset containing 494 projects and 4,224 pledge levels. Hence, our sample includes 32% of pledge levels with limited availability. Our results provide insights into the characteristics of crowdfunding projects that impact profitability. More specifically, we provide empirical evidence that the limited availability in the crowdfunding projects in terms of scarcity management is positive related to the profitability of the included pledge levels. We conclude that crowdfunding projects with limited availability on pledge levels are more profitable for donators/investors. Keywords: Crowdfunding, scarcity management, profitability, determinants
Page | 15
CAN BOARD DIVERSITY HAVE AN EFFECT ON DECISION MAKING FOR INVESTMENT? – A PRELIMINARY ANALYSIS OF CORPORATE
GOVERNANCE IN JAPAN
Chieko Matsuda Tokyo Metropolitan University
Japan [email protected]
ABSTRACT
This study analyzes corporate governance in Japan—particularly the relationship between management decision making on investments and the diversity of the management board, which has been increasingly important in recent years. The Japanese corporate governance code states that diversity in the management board in terms of gender and international representation is critical for healthy and effective management decision making. To comply with the code, many Japanese companies aim to hire female or foreign directors as independent directors. However, does diversity mean only gender and national origin? Is board diversity the only critical factor for effective decision making? Can such board diversity have a positive effect on decision making? This study investigates these questions and empirically reveals that female independent directors do not have any effect on decision making on investments that have a positive influence on corporate value, while national origin, variety of skills, and career history have some effect. Keywords: Corporate governance, board diversity, investment, management decision making, capital market

Page | 16
CORPORATE GOVERNANCE AND INVESTMENT DECISIONS: AN EXPERIMENTAL STUDY ON REAL INVESTORS
ATM Tariquzzaman*
Victoria University of Wellington New Zealand
Ian Eggleton Victoria University of Wellington
New Zealand
Tony van Zijl Victoria University of Wellington
New Zealand
ABSTRACT The main purpose of the study is to examine whether investors assign importance to corporate governance in making investment decisions. The study involves a 2x2x2 between-participant laboratory experiment on real investors in Bangladesh that examines the effects of corporate governance structure, financial condition and insider trading on individual investor decisions1. The findings of this study extend the literature on corporate board practices and investor perceptions by providing evidence from the emerging economy that strong corporate governance has a positive impact on investor decisions. The study also confirms the findings of prior literature that the financial condition of a company positively influences investor decisions. Hence, the results provide insights into the effects of strengthening corporate governance guidelines and of variation in financial condition on investor decisions. The study provides evidence that the common occurrence of illegal insider trading in the emerging market of Bangladesh does not appear to impact on investor decision making, unlike in developed countries. The results of this study also contribute to understanding of how the quality of corporate governance impacts decision making. It appears that governance directly impacts the perceived reliability of financial reports and trust in the board and management. The theoretical model and instrument developed for this study will be useful for further studies to explore the impact of other corporate governance factors on investor decisions. Furthermore, the theoretical model and instrument will also be useful for further studies in other countries, particularly where insider trading is regarded by investors as being a concern and to investigate the impact of other corporate governance factors on investors and financial analysts. Keywords: Corporate Governance, Board of Directors, Insider Trading, Financial Reports, Reliability, Trust and Investment Decisions

Page | 17
DOES CORPORATE GOVERNANCE DISCLOSURE PLAY THE ROLE OF INFORMATION FEEDBACK IN KOREA?
Jun Yeung Hong Korea University
Korea
Sook Min Kim Solbridge International School of Business
Korea
Seung Weon Yoo* Korea University
Korea [email protected]
ABSTRACT
According to OECD (2017), 37 countries have adopted to disclose corporate governance mechanism among 45 countries and either regulator or security and exchange commission should monitor whether companies follow the national code. Along with the trend toward emphasizing the importance of corporate governance, Korean government has adopted the voluntary disclosure system of corporate governance to all listed firms to enhance the transparency of corporate management and functions of monitoring since 2017. In such a context, we explore whether firms voluntarily disclose their corporate governance practices after stock price crash which is used as a proxy of decreasing firm value and reputation. Using 568 firm-year observations, we document that firms tend to deliver corporate governance information voluntarily after experiencing stock price crash. The result indicates two aspects. Information demand formed by stakeholders lead the possibility of corporate governance disclosure as well as the issuance of corporate governance disclosure offers firms have an opportunity to recover their credibility, reputation and firm value. Our result suggests that corporate governance report play an important role of information feedback of capital market. In addition to a function of information feedback, our result provides the evidence that firms going through negative event or scandal may use corporate governance disclosure as a tool of recovering firm value and reputation. We expect that our study contribute to expand understanding of corporate governance disclosure in Korea and other countries. Keywords: Voluntary Disclosure, Corporate Governance Disclosure, Stock Market Reaction, Stock Price Crash
Page | 18
DOES THE BOARD OF COMMISSIONER MONITOR BUSINESS STRATEGIES EFFECTIVELY?
Dianwicaksih Arieftiara
Universitas Pembangunan Nasional Veteran Jakarta Indonesia
ABSTRACT
In two-tier board system, Board Commissioner (BOC) is responsible to monitor manager’s activities. This study aims to investigate the role of Board Monitoring Effectiveness (BME) on manager’s decision regarding business strategy choices that fit with environmental uncertainty condition. Using a contingency fit approach analysis on listing companies on Indonesia’s Stock Exchange (IDX) from 2012 until 2015 and multinomial logistic regression method, this study finds that under highly uncertainty condition, BME has positive impact on the probability of manager to choosing prospector or defender than analyzer strategy. This result reveals that BME has positive effect on the contingent fit between business strategy and environmental uncertainty. This study is the first investigating the role of BME on contingent fit between business strategies and environmental uncertainty. Keywords: Board Monitoring Effectiveness; Business Strategy; Contingency Fit Analysis; Environmental Uncertainty
Page | 20
IFRS ADOPTION AND EARNINGS QUALITY: EVIDENCE FROM A STAGED CONVERGENCE APPROACH
D’yan Sukartha
Queensland University of Technology Australia
Stuart Tooley
Queensland University of Technology Australia
Peter Green
Queensland University of Technology Australia
ABSTRACT
This study examines the effect of mandatory IFRS adoption on the earnings quality of listed Indonesian reporting entities. Specifically, the study focuses on two country-specific macro settings in the form of (1) a two-stage convergence approach to IFRS adoption and (2) partially privatised, and minority interest listed, State-owned Enterprises (SOEs). Using data for 2001-2015 and applying multi-variate analysis for three measures of earnings quality (i.e. accrual quality, earnings persistence and predictability, and earnings smoothness), we find that listed SOEs accrual quality is significantly higher under IFRS than under pre-IFRS and the ‘staged’ approach to IFRS convergence has an effect on the rate of improvement in accruals quality. Investigating if Indonesia’s move to converge to IFRS had a stronger effect on listed SOEs compared to listed non-SOEs, we find that the accrual quality of listed SOEs is significantly higher than the impact of IFRS on the accrual quality of listed non-SOEs.
Page | 21
INSTITUTIONAL THEORY PERSPECTIVE ON RECORDING AND MANAGING ASSET DATA IN THE PUBLIC HEALTH SECTOR
Nirmala Nath Massey University
New Zealand [email protected]
Yuan Yuan Hu Massey University
New Zealand
Shirley Chan Auckland District Health Board
New Zealand
ABSTRACT Purpose The purpose of this study is to reveal the influences on asset data recording and data maintenance in New Zealand DHBs and provide insights into how and why these affect the progress of improvements. Design/methodology/approach Data was collected using an online survey questionnaire and publicly available archival documents and analysed using Saunders et al.’s (2016) and Miles and Huberman’s (1994) thematic approaches. New institutional sociology theory informs the research findings. Findings The factors that impede or progress asset data recording and maintenance in the New Zealand public health sector are segmented into five themes: information; system; process; organisation; and resource. These have eventuated in response to normative, coercive and mimetic pressures, and internal institutional dynamics. Interestingly, these isomorphic pressures were not fully diffused in the asset management systems; hence, the DHBs faced challenges in progressing with effective systems of asset data management capturing inconsistent data in multiple systems for the same assets. The internal organisational dynamics such as the DHB’s internal culture and practices impeded the progress. These comprised of management expectations, staff skills and training, management accountabilities, the procedures and systems in use by the DHBs and a lack of prescribed roles and responsibilities for the staff engaged in asset data management eroded staff and management accountability. Research limitations/implications The study focused on buildings and clinical equipment asset classes only; therefore, the outcomes may not be representative of all asset classes in the DHBs. Practical implications Senior management and policy makers need to focus on the internal dynamics of the DHBs in order to fully diffuse the external pressures for improvements in asset data management. Rules and adherence to professional standards and best practice alone do not lead to improvements, investment in staff and accountability does. Originality/value This study provides insights for asset data management in the New Zealand public sector health services that could motivate managers to improve the asset management capability among employees, and increase awareness of the importance of accurate to ensure effective decision making and planning. Keywords: Asset data; Data recording and maintenance; District Health Boards; Institutional theory; Health sector

Page | 22
ANALYSIS OF INSOLVENCY RISKS AND FINANCIAL PERFORMANCES OF BANKS IN THAILAND
Metjiranont Theeraseth
Ubon Ratchathani University Thailand
Sodsongkrit Metcha Ubon Ratchathani University
Thailand [email protected]
ABSTRACT
The aim of this study was to compare insolvency risks and financial performances of large commercial banks and state-owned enterprise banks in Thailand using data from 2014 to 2018. It was found that the commercial banks played a more important role in the banking sector based on their proportions of total banking institution assets from 2014 to 2018. It was also found that banks with higher results in financial performances and capacity did not always mean that they were more stable and less risky because by taking on more risks the commercial banks are also subject to higher insolvency risks than the state-owned enterprise banks. Keywords: Financial performance, Insolvency risk, Stability and security of commercial banks

Page | 23
IS THERE EVIDENCE OF POST-EARNINGS ANNOUNCEMENT DRIFT IN LATIN AMERICA?
Ervin Black
University of Oklahoma U.S.A.
Gerlando Lima
University of Illinois U.S.A.
Verônica Santana
University of Sao Paulo Brazil
ABSTRACT
This research investigates the Post-Earnings Announcement Drift (PEAD) anomaly in the context of Latin American stock markets. We evaluate cumulative abnormal returns around the annual report announcement dates of firms with good news (higher positive earnings surprises) and bad news (higher negative earnings surprises) from Argentina, Brazil, Colombia, Chile, Mexico and Peru from 1998 to 2017. Using both the market model and the constant mean model for estimating abnormal returns and calculating earnings surprises both using analysts’ estimates and comparable earnings we do not find evidences of the PEAD anomaly in the Latin American countries. We also evaluate each country separately as well as the pre and post IFRS adoption periods. These results contradict the PEAD anomaly literature, which is mainly based on US firms. To investigate whether the difference is due to Latin American firms’ inherent characteristics or due to differences in the institutional environment, we compare our results with a sample of matched firms traded in the New York Stock Exchange and find that both the full and matched NYSE sample present the traditional pattern of the PEAD anomaly. Comparing institutional variables within different countries we find differences in financial development as well as in culture, which leads us to consider that the absence of the anomaly in Latin American markets is mostly likely due to differences in the institutional environment. Keywords: Post-Earnings Announcement Drift; Latin America; Institutional environment; matched samples JEL Codes: G14; G15; M41
Page | 24
DO INVESTORS EXPLOIT BANK EARNINGS MANAGEMENT INFORMATION TO EARN PROFITS IN STOCK MARKETS: A CASE OF ASIA PACIFIC?
Nguyen N.T. Vo
Eastern International University Vietnam
Thai V.H. Nguyen
RMIT University Vietnam Vietnam
Duc T.H. Phan RMIT University
Australia
ABSTRACT The issue of asymmetric information remains the concern in investment decisions and has regained attention in relation to financial crisis. This study investigates whether investors exploit bank earnings management information to earn profits by trading on the basis of this informational advantage in stock markets. We argue that investors are divergent in capability to detect bank earnings management, which will be subsequently reflected in their trading positions. We answer the questions if bank accounting regulations, enforcement regimes, institutional quality and IFRS adoption play the roles in shaping investors’ behaviours in exploiting trading profits on the basis of detecting bank earnings management. Our research, on the sample of 198 banks across 13 Asia-Pacific countries in the period of 2002-2017, finds that there is a significant positive relationship between bank income-decreasing earnings management and bid-ask spreads. Our study also sheds light on the signalling effects of bank accounting regulations/ enforcement/ institutions/ IFRS adoption in guiding investors’ behaviours in response to bank earnings management.
Keywords: Bank earnings management, bank regulations, enforcement regimes, institutional quality, IFRS, bid-ask spread, Asia-Pacific countries
Page | 25
ACCOUNTABILITY AND AGGRESSIVE FINANCIAL REPORTING JUDGMENTS
Peipei Pan* Macquarie University
Australia [email protected]
Chris Patel
Macquarie University Australia
ABSTRACT We extend the literature on accountability by providing causal experimental evidence on whether perceived accountability influences Chinese accountants’ aggressive financial reporting judgments when formal accountability is imposed and when it is not imposed. We draw on the literature on Confucianism and interdependence to suggest that the Chinese cultural values of harmony within hierarchy and interdependence provide useful insights for understanding accountability. Our findings support the hypothesis that when formal accountability is imposed, accountants are not likely to make aggressive financial reporting judgments, irrespective of their scores on perceived accountability measures. Our findings further show that when formal accountability is not imposed, accountants who score lower on perceived accountability measures make more aggressive financial reporting judgments, compared to those who score higher on those measures. Our findings are relevant to enterprises in designing and developing culturally appropriate accountability mechanisms. Our findings also have implications for various standard setters, regulators and researchers. Keywords: Accountability, Aggressive reporting, China
Page | 26
COMPREHENSIVE INCOME AND CREDIT RISK: EVIDENCE FROM JAPAN
Tomohiro Suzuki Asia University
Japan
Koreyoshi Seki Asia University
Japan
ABSTRACT This study is an empirical analysis of how creditors react to other comprehensive income (OCI), which is characterized by fluctuations in net assets that are not released from risks and greater volatility than net income. The results suggest that the larger (smaller) the recorded amount of OCI, the lower (higher) the borrowing interest rate is. In addition, we observe that the higher the volatility of OCI, the higher the borrowing interest rate. In particular, because creditors are sensitive to the downside risks in firm performance, the interest rate increases if OCI is negative. Moreover, other securities are easier to sell and change into cash than other components of OCI, and cross-shareholdings in Japan tend to be eliminated in the long run. Therefore, this relationship between OCI and the borrowing interest rate is observed only for unrealized gains and losses on other securities.
Page | 27
IFRS ADOPTION AND SEASONED EQUITY OFFERING UNDERPERFORMANCE
Solomon Opare Victoria University of Wellington
New Zealand
Muhammad Nurul Houqe Massey University
New Zealand
Tony van Zijl Victoria University of Wellington
New Zealand
ABSTRACT This study uses a cross-country sample to examine the impact of adoption of IFRS on seasoned equity offering (SEO) underperformance. The empirical literature on SEOs has established that information uncertainties contribute to SEO underperformance. Given the growing number of countries that have adopted IFRS, it is therefore important to assess whether adoption of IFRS reduces the uncertainties surrounding SEOs and thus subsequent underperformance. The study employs a control sample of non-IFRS adoption countries and applies a difference-in- difference design to capture the incremental change between the treatment and control samples. We find that SEO underperformance decreases for IFRS adopters relative to non-IFRS adopters in the post-adoption period. We also find that SEO underperformance decreases for firms in countries that adopt IFRS and have stronger enforcement. These findings are statistically robust to the application of different measures of SEO underperformance but vary in economic terms. Overall, our study provides global evidence on SEOs and potentially incentivise standard setters to improve reporting standards and encourage policymakers to strengthen enforcement and information environment. Keywords: IFRS adoption; Seasoned equity offering; SEO underperformance; Enforcement
Page | 28
THE GROSS PROFITABILITY ANOMALY: RISK OR MISPRICING?
Sang Ho Lee Korea University
Korea [email protected]
Yong Keun Yoo* Korea University
Korea [email protected]
ABSTRACT
This study examines whether the gross profitability anomaly is a common risk premium or a market mispricing. Ever since Novy-Marx (2013) has claimed that gross profitability is a sound predictor of future return, recent studies incorporate profitability as a risk factor in asset pricing model. On the contrary, we find comprehensive evidence that gross profitability anomaly is a mispricing phenomenon. Investors underestimate the predictive and fundamental information within gross profitability ex-ante, resulting in drift patterns during the post-announcement period. Abnormal profits obtained by a zero-cost investment strategy are substantially concentrated in the future announcement period and persist over time regardless of the macroeconomic cycle. We find that even sophisticated investors, such as analysts, underestimate the predictive information in gross profits. Corporate information environment alleviates mispricing but does not fully eliminate the inefficiency. Results are robust after controlling for various firm risks and anomaly characteristics identified in prior studies except for corporate fundamentals. Overall, our findings are inconsistent with rational pricing explanations, suggesting that researchers and practitioners be aware of the possibility that gross profitability might not be an appropriate proxy for risk. Keywords: Gross profitability; Post-announcement drifts; Asset pricing; Market efficiency JEL Classification: G12, G14, M41
Page | 29
DETERMINANTS OF THE QUALITY OF FINANCIAL REPORTING AND PUBLIC SERVICE QUALITY: A STUDY IN THE CONTEXT OF THE APPLICATION OF
ACCRUAL ACCOUNTING SYSTEMS AND PUBLIC SECTOR AUDIT IMPLEMENTATION IN INDONESIA
Andi Chairil Furqan Universitas Indonesia
Indonesia
Ratna Wardhani Universitas Indonesia
Indonesia
Dwi Martani Universitas Indonesia
Indonesia
Dyah Setyaningrum Universitas Indonesia
Indonesia
ABSTRACT This study aims to analyze the effect of audit findings and follow-up of audit recommendations on the quality of financial reporting and the quality of public services in the context of the application of accrual accounting systems to local governments in Indonesia. Using data from 490 district/city governments in Indonesia, the results of the study indicate that generally the quality of financial reporting affects the quality of public services. Regarding the implementation of audits in the public sector, it was also found that audit findings have a negative impact on the quality of financial reporting and the quality of public services, while follow-up of audit recommendations play a positive role in improving the quality of financial reporting and the quality of public services. The implication of the results of this study is closely related to efforts to realize the ultimate goal of recent government reforms. To realize accountability, effectiveness and efficiency of the implementation of the tasks and functions of local governments, especially in terms of financial management and public services, depends on the effectiveness of the implementation of the accrual accounting system and the effectiveness of the implementation of external audits and internal supervision of the regional government, especially in order to reduce the number of audit findings and increase the number of conformity of follow-up of audit recommendations. Keywords: Quality of Public Services, Quality of Financial Reporting, Accrual Accounting System, Audit Findings, Follow-up of Audit Recommendations
Page | 30
THE IMPACT OF FAIR DISCLOSURE REGULATION ON MANAGEMENT EARNINGS FORECASTS: EVIDENCE FROM JAPAN
Yuki Horie
Hitotsubashi University Japan
ABSTRACT This study examines the impact of Fair Disclosure Regulation (FDR) on management earnings forecasts (MFs) in Japan. By conducting regression analysis, I analyze how the accuracy of MF is affected by the introduction of FDR. The results show that MF accuracy has improved post-FDR. Furthermore, I classify MFs into two groups: (1) good news MFs (when the latest MFs realize an upward revision of initial MFs), and (2) bad news MFs (when the latest MFs imply a downward revision of initial MFs), and analyzed the MF accuracy of each group. We find that bad news MF error increased post-FDR. The results suggest the following implications. First, managers have an incentive to control market expectations using MFs. Managers who can no longer revise MFs through analysts can avoid negative shocks in by purposefully disclosing bad news on MFs. Second, managers also have an incentive to publish accurate MFs to maintain their reputation because FDR increases the reliance of analysts and investors on disclosed information, and they discount managers who cannot provide accurate MFs. Third, in the presence of high information uncertainty, managers will be conservative in revealing information. These findings suggest that managers have actively controlled market expectations by using MFs after the introduction of the FDR. Keywords: Fair disclosure regulation, management forecasts, expectation management
Page | 31
PRICING OF AUDIT SERVICES IN INDIA – A STUDY
Sanjib Kumar Basu Kolkata of University of Calcutta
India [email protected]
ABSTRACT
This paper examined the clients’ and the auditors’ attributes as factors capable of determining external audit fees to be paid by the Indian companies. Specific characteristics that were studied to have significant influences on pricing of external audit services are size of the client, type of the company, profitability, leverage, level of corporate governance, size of the audit firm and internal audit. The study used primary data for the purpose of the analysis of the perceptions of the respondents and also used secondary data to validate the observations. The primary data was collected through structured questionnaire from the finance managers, accountants and the internal auditors of selected Indian companies who are directly associated with the audit services of the entities on behalf of the internal management. The data obtained and measured through Likert scale was analysed using descriptive statistics to depict pattern. Therefore, measure of central tendency, measure of dispersion and chi-square test was used to examine the responses over the factors influencing the price for the audit services. The findings from the study appear to be largely consistent with the previous studies as the size of the audit firm and leverage are found to be significant in the pricing of external audit fees across the companies. Surprisingly, the premium value for the Big 4 was not only high, but significantly consistent in most of the responses suggesting the near dominance of the audit market by these big accounting firms in India. No doubt, this trend has serious implications and the Indian small and medium sized firms to brace up and further improve on the provision of qualitative services to the client. Keywords: Audit Fees, Big 4, External Audit, Indian Auditing Environment and Perception

Page | 32
THE REEXAMINATION OF AUDITOR SELECTION MODELS
Takashi Obinata University of Tokyo
Japan
Takashi Yaekura Waseda University
Japan
ABSTRACT There are three objects of this study. First, this study identifies direct effects and total effects by structural equation model (hereafter SEM) and reveals causal chain. The reason for using SEM is that in a sole multiple regression model, causal chains cannot be identified, and if nested causal relationships are included between explanatory variables, the problem of endogeneity arises. Second, this study, by comparing national equality weighted analysis and sample size weighted analysis, demonstrates the fact that using only one method overlooks underlying facts. Third, on institutional factors as a measurement index that are found in the likes of La Porta et al. (1998, 2006), we examine whether there is a concept (latent variable) that supports its validity. We point out that there exists an inconsistency within the measure(s), construct(s), and the model. We show the limits of indices such as La Porta et al. (1998, 2006) and CIFAR (1995), and show that the results of research using them are not robust. Keywords: Big N audit, Auditor Selection, Structural Equation Model (SEM)

Page | 33
AUDIT-SOFTWARE SKILLS READINESS – A DATA ANALYSIS TEACHING CASE
Fernando Parra California State University, Fresno
U.S.A.
Hyung Tae Kim California State University, Fresno
U.S.A. Introduction As recommended by the American Accounting Association Pathways Commission (2012), accountancy curricula must identify and integrate emerging information technologies relevant to the profession. This teaching case responds to the prevailing need for audit readiness of businesses that operates in the digital era by challenging students to be prepared with the necessary audit and data analysis skills to be competitive in their profession. This case is particularly suited for Audit and Accounting Information Systems educators who are seeking to integrate experiential learning in their curricula. The case aims to demonstrate how to use digital sampling methods with CaseWare IDEA to achieve the following learning objectives:
● Conduct relevant tests for management’s assertions using data analysis software, including completeness, existence, valuation, verification, and cut-off tests.
● Understand management’s assertions and the types of audit evidence that support them. ● Interpret the nature and purpose of an auditor’s evaluation of internal controls.
Validation of Teaching Methodology This teaching case is implemented in four sections of upper-level accounting courses (Audit and AIS) at an AACSB-accredited institution in the United States. To assess the teaching effectiveness of this case, this study follows a longitudinal design with (pre and post) direct assessments. Indirect self-efficacy and user experience surveys are also conducted to provide more insight on the assignment. Student-level t-test of pre and post assessments means are conducted to evaluate its contribution. Our robustness test will include regression analysis after controlling the respondents’ individual characteristics (e.g., respondents’ GPA) to see how much each student’s software skill has improved after the implementation. Status of Case, Expected Results and Contribution This assignment has been created and piloted for one semester and is undergoing an evaluation of its teaching effectiveness with modified content based on student feedback. Data resources would be available to be used upon publication along with other teaching notes that facilitate lesson discussions, grading and software support. YouTube videos have also been created to allow students to learn the use of the software at their own pace; however, they are not anonymized at this time to be shared with the reviewers. Preliminary results demonstrate a significant development of student skills in the targeted learning objectives. Students have anecdotally expressed high enthusiasm at being properly skilled with the technology tools for their profession and applying their audit knowledge in this manner.
Page | 34
THE INFLUENCE OF THE SUCCESSION SOURCES OF SENIOR EXECUTIVES ON THE EARNINGS MANAGEMENT
Hong Huang
Shanghai Normal University China
Haiyu Liu
Shanghai Normal University China
ABSTRACT
The topic about executive turnover researches is a hot topic in the field of corporate governance, and it is also the focus of the judgment of the company's follow-up performance quality and performance by relevant interest groups. Based on accrued earnings and real earnings, this paper takes the data of a-share listed companies in Shanghai and Shenzhen from 2009 to 2017 as the sample, and conducts A multiple regression analysis of the "big bath" phenomenon between the succession executives and earnings management behaviors in China's state-owned enterprises and non-state-owned enterprises. That is to say, no matter in the enterprise with any property right nature, the external senior executives are strongly willing and able to reduce the company's surplus with internal and external resources in the succeeding year, but this phenomenon does not appear on the internal successors. In further consideration factors of whether the loss of the previous period, in the companies of different property rights, the loss factor of the previous period plays a different role in the relationship of succession executives and earnings management: loss of the previous period further increases the extent to reducing the surplus of external executives in state-owned enterprises while decreases the extent to reducing the surplus of external executives in non-state-owned enterprises, and loss of the previous period also contributes to internal succession executives in the non-state enterprises to rise the motivation of surplus. From the perspective of succession, this study explains the phenomenon that external executives have the motivation to whitewash the company's surplus, and that parachuting in senior executives plays a role in cleaning up the inflated surplus in the year of succession. Meanwhile, it is necessary to improve the corporate governance structure to prevent the "old trick" of managers' inflated surplus. Keywords: Accrued earnings management; Real earnings management; Source of executive succession; Nature of ownership; Loss
Page | 35
INTEGRATED REPORTING AND EARNINGS QUALITY: THE MODERATING EFFECT OF AGENCY COST
Victoria A. Obeng
La Trobe University Australia
Kamran Ahmed*
La Trobe University Australia
Seema Miglani La Trobe University
Australia
ABSTRACT Prior studies have suggested a link between disclosure mechanisms and accounting information quality and report a better information quality in the presence of higher transparency and clarity in disclosure mechanism. We contend that voluntary integrated reporting (IR) as a disclosure mechanism has an incremental positive effect on accounting information particularly the quality of reported earnings. Consistent with this argument, we find a positive relationship between IR practice and earnings quality. Furthermore, while voluntary adoption of IR is positively associated with earnings quality for firms with high agency cost, the moderating effect of firm level agency cost is insignificant on the relationship between voluntary IR practice and the level of integration. This suggests that managerial opportunism is not relevant in shaping the effectiveness of IR practice for quality disclosure when higher level of integration is achieved. Moreover, firm complexity does not affect the relationship between IR practice and earnings quality. Overall, our findings are consistent with the view that IR has an incremental positive effect on the quality of accounting information. Keywords: Integrated reporting, earnings quality, agency costs, firm complexity

Page | 36
REMOVING THE CAMOUFLAGE: THE EFFECTS OF ANALYST GAAP EARNINGS FORECAST ON MANAGER’S CLASSIFICATION SHIFTING PRACTICE
Tatyana Ryabova
California State University, Fresno U.S.A.
Shu Lin
California State University, Fresno U.S.A.
Harry Hui Xia
California State University, Fresno U.S.A.
ABSTRACT
Prior research on classification shifting finds that manager opportunistically shifts core operating expenses down the income statement into the non-recurring expenses to improve reported non-GAAP financial measures including core earnings, without changing the GAAP net income. By using a difference-in-differences test on the newly available analyst GAAP earnings forecast after the enactment of Sarbanes-Oxley Act (SOX), we find that the introduction of analyst GAAP forecast significantly attenuates the positive association between unexpected core earnings and non-GAAP exclusions at treatment firms while such association strengthening at control firms not covered by the GAAP forecast. Our results indicate that classification shifting, which generally results in a simultaneous inflate of core earnings and non-GAAP exclusions, has been effectively mitigated due to the transparency on forecasted non-GAAP exclusions brought by the growth of GAAP forecast offered by analyst. The finding of this study not only contributes to the existing literature by discovering a new mechanism to effectively constrain classification shifting after SOX but also supports the primary goal of standard setters and regulators to advocate more transparency and greater disaggregation of financial information. It also highlights the value of analyst as an effective information intermediary to the capital market and its participants. Keywords: Classification shifting, Analysts’ forecasts, GAAP forecasts, Non-GAAP earnings, Earnings management JEL Classification: G14, M41

Page | 37
BUSINESS SCHOOLS’ ROLES IN DEVELOPING TRANSNATIONAL MANAGERS
Jia Wang* California State University, Fresno
U.S.A. [email protected]
Ali Peyvandi
California State University, Fresno U.S.A.
ABSTRACT
Global companies across the nations are looking for students with diverse attitude, global mindset, and transnational experiences. In no academic discipline is diverse attitude, global education and global awareness more important than the field of business in the U.S. universities. In this environment, instructors cannot simply rely on the traditional teaching method of transmitting or passing knowledge to students. Students must actively construct knowledge in their own minds. That is, they discover and transform information, check new information against old, and revise rules when they are no longer apply. Instructors need to employ the constructivist teaching method to facilitate students’ learning and view students not as passive recipients of knowledge but active acquirers of knowledge. The AACSB, the premier accrediting body for business schools, has identified four "challenges" for business education: 1. Strong and growing economic forces; 2. Differences in organizational and cultural values; 3. Cultural diversity among employees and customers; and 4. Changing technology in products and processes. Further, the AACSB "Assurance of Learning Standards" stipulates that an undergraduate degree program (in business) include learning experiences in the "Dynamics of the global economy" and "Multicultural and diversity understanding"(AACSB International, 2018). Given the importance of developing students with diverse attitude for the global market, the purpose of the paper was to investigate business schools’ roles in developing transnational managers. The authors conducted a number of empirical studies in the past few years to explore the impacts of short study abroad programs on students’ global mindset, cultural attitudes, and diversity views. We also compared and contrasted students’ cultural diversity attitudes between those who took the regular course on campus and those who participated in the study abroad programs. Based on the results of these studies, the authors delineated the roles business schools can play in developing transnational managers. We made a number of suggestions for future researchers and discussed the limitations of the paper.

Page | 38
INTERNATIONAL GRADUATE SCHOOL IN ACCOUNTANCY – EXPERIENCE AND DEVELOPMENT
Yoko Suga
Tohoku University Japan
Toshifumi Takada National Chung Cheng University
Taiwan [email protected]
ABSTRACT
Objectives: 1. International Business Alliance 2. Asian and African countries need collaboration with Japan 3. Advancement of accounting research Conclusions: (1) Accounting research has changed in 1980s dramatically called ‘Accounting Revolution’. Empirical methodology of econometrics using statistics were introduced to accounting research. From 1980s till now, this has been a main stream of accounting research. On the other hand, one of the important roles of university professors in accountancy is to contribute to the practice. This mission has been forgotten since 1980s. The 1st objective of our paper is to change this condition. We started International Business Alliance Corporation; having seminars and events related to accounting, information technology and business communication. IBA’s activities have been supported by National Chung Cheng University and very successful. (2) IBA’s activities are now focusing on the exchange between Japan and Taiwan, Bangladesh, Vietnam. We will extend the programs to Asian and African countries. These are possible based on IGSAP’s international academic exchange. One of the authors visited over 30 countries and was responsible for having academic exchanges and MOUs of double degree programs. (3) Academic research in accounting is not limited to empirical study but can be developed to a type of engineering research. Engineering research means making something useful to society or practice. IBA is now engaged in making useful systems; SMEs accounting, business communication, cybersecurity, new business (food, culture, IOT, etc.).

Page | 39
THE ASSOCIATION BETWEEN SOCIAL MEDIA USE AND STUDENTS’ LEARNING PERFORMANCE
Sylvia Veronica Siregar Universitas Indonesia
Indonesia
Bayu Tenoyo Universitas Bhayangkara Jakarta Raya
Indonesia
ABSTRACT The purpose of this study is to examine the use of social media by undergraduate students in Indonesia and also the effect of those social media use on students' learning performance. We distributed questionnaires to undergraduate students in two universities (one public university and one private university). We find that the students are active in social media, even though most times they access social media is not related to learning. Our results also show that time spent on social media has negative significant effect on learning performance, which probably due to the fact that most students use social media for non-academic purposes. We also find that the time spent on social media has no significant effect on learning performance. However, we do find that the use of social media by teaching staff for learning purpose has positive and significant effect on learning performance. All these findings suggest that social media can only have significant effect if it already been incorporated in integrated way with course materials. In addition, we do not find significant effect of multitasking on learning performance and we also do not find any significant moderating role of major (business and economics vs engineering) and university (public vs private) on the association between time spent on social media and learning performance. Keywords: Learning performance, multitasking, social media
Page | 40
THE ASSOCIATION BETWEEN EARNINGS ATTRIBUTES AND THE COST OF EQUITY CAPITAL: EVIDENCE FROM JAPAN
Junko Jinushi
Hitotsubashi University Japan
ABSTRACT
Much research focuses on the association between earnings attributes and the cost of equity capital. However, only a few studies compare the extent of each earnings attributes’ influence on the cost of equity capital. Using Japanese companies that adopt Japanese GAAP as the sample, I compare the extent of each earnings attribute’s influence on the cost of equity capital and compare it with previous studies that use firms that apply U.S. GAAP or IFRS as their sample. Drawing on previous studies, accrual quality smoothness, persistence, and predictability are used as the proxies for earnings attributes. The results show the predictability proxy explains more of the variation in estimates of the cost of equity capital, followed by smoothness and accrual quality, which is inconsistent with previous studies. Furthermore, in additional analysis, the relationship between persistence and the cost of equity capital is examined more deeply, revealing the possibility that the relationship is U-shaped.
Page | 41
THE STOCK PRICE RELEVANCE OF ROE DECOMPOSITION FACTORS IN KOREA STOCK MARKETS
Changrae Park
Gangneung-Wonju National University Korea
ABSTRACT ROE is decomposed into the measure of product market strategies performance and financial market polices performance. According to the traditional decomposing approach, ROE is measured by ROA and equity multiplier. Moreover, ROA is decomposed into return on sales and assets turnover. Prior researches showed these traditionally decomposed factors had the stock price relevance. However, this traditional approach has some theoretical limitations in measuring the performances of market strategies and financial market policies. Therefore, the alternative approaches are on the rise. In the alternative method, ROE is decomposed as return on invested capital (ROIC) and financial leverage. The ROIC is further decomposed as return on net operating assets (RNOA) and return on non-operating investments (RNOI).
The purposes of this study were to investigate the effects of ROE decomposition factors decomposed by the traditional and alternative approach on the common stock price of the firms listed in Korea’s KOSPI and KOSDAQ markets. First, this study reviewed the effects of ROE and its decomposition factors decomposed by traditional and alternative approach on stock price for the all sample and each market. Second, this study analyzed whether or not the stock price effects of ROE and ROE factors were influenced by the RNOA level.
28,556 non-financial companies were sampled out from the Korean KOSPI stock market (11,370 firms) and KOSDAQ (17,186 firms) listed in between 2001 and 2018.
The results of this study were as follow. First, stock price showed a positive correlation with ROE, ROA, ROS, ROIC, RNOA, and negative correlation with EM and debt ratio. Second, ROE showed positive effects to the stock price for each market analysis. When analyzed for each market R2s increased compared to total sample analysis, but there was not different in R2 between markets. Third, ROA was positively related with stock price, and EM was negatively related. The stock price relevance of ROS was differ between markets. Fourth, ROIC and RNOA were positively related with stock price, but RNOI was insignificant in KOSPI. When RNOA decomposed further, the value relevance of further decomposed factors was different between markets. Fifth, when analyzed according to RNOA level, the value relevance of ROE and ROE factors decomposed by both approach showed different value relevance among RNOA levels and markets.
These results imply that, though ROE has value relevance, value relevance of ROE was different according to the market and operating performance(RNOA). The more theoretical but hard to calculate and unpopular ROE factors decomposed by alternative approach had not more value relevance than traditional decomposing approach. The ROE and ROE factors had more value relevance when analyzed the companies with similar characteristics such as market, and RNOA level.

Page | 42
A STUDY ON DYNAMIC CAPABILITY FOR GLOBALIZATION OF REGIONAL INDUSTRY
Takao Nomakuchi Chuo University
Japan
ABSTRACT The Japanese soy sauce industry is conducting global production at factories around the world. Its taste has been improved according to the food and cuisine of each country and region. They have changed strategies and organizations according to changes in the business environment such as maturity, shrinking and globalization of the market in Japan. As a result, Japanese soy sauce is consumed all over the world. The purpose of this research is to study the Japanese soy sauce industry as a business ecosystem and to consider its dynamic capability from the case of Japanese soy sauce manufacturer. Japan's soy sauce industry has been promoting horizontal division of labor as soon as it develops. Therefore, from the case analysis, we verify that Japanese soy sauce industry pursuing different taste of each region by horizontal division of labor is creating dynamic capability in globalization.

Page | 43
PREVENTION OR DETECTION OF PROBLEMS IN CAPITAL GROUPS DISCRIMINATORY ANALYSIS IN THE EXTENDED TIME HORIZON
Anna Karmańska
SGH Warsaw School of Economics Poland
Magdalena Indyk SGH Warsaw School of Economics
Poland [email protected]
ABSTRACT
The article presents an original empirical research on capital groups. The results of the research indicate a diagnostic usefulness of consolidated reporting as long as the analyst appropriately sets the perspective of interpretation of results in the extended time horizon. The aim of the research was to identify the predictions of difficulties/problems/crises in the functioning and maintaining the status quo of relationships within the group. With this in mind, a set of nine multidimensional discriminatory analysis models was used with financial categories applied at the consolidated level. It has been shown that it is justified in view of the concept of unity of group members, which is an underlying factor of the creation of consolidated reporting. The originality of the proposed research approach stems from: (1) analytical use of consolidated reporting, which is not often undertaken in the scientific research, (2) examination of the applicability of multi-dimensional discriminatory analysis models to capital groups, which, according to the authors' knowledge, have not yet been applied in relation to this kind of reporting and the use of which, they believe, are based on well-founded premises, (3) presentation of conclusions from the connection of the time -extended discriminatory analysis with the market and other financial parameters charactering the dominating entity (parent company) in the capital group, (4) confirmation of how the market arbitrarily, frequently in isolation from the reporting values, assesses the economic potential of business entities. The study shows that discriminatory models, despite a widespread assumption of their early warning function, proved to be detection rather than preventive models. As demonstrated by the analysis of the bankruptcy prediction in relation to the stock quotation graphs, the hazard information on threat is delayed. In addition, this article presents an analytical methodology, conducted in such a way that it can be treated as reasoning in a way ready for direct application in practice. The research used a method of literature studies and an induction method, creating generalisations based on experiments and empirical observations. Keywords: Capital groups, discriminatory analysis, consolidated financial statements, crisis, continuation of business
Page | 44
DOSE QUALITATIVE DISCLOSURE OF CLIMATE CHANGE INFLUENCE JAPANESE CORPORATE VALUE?
Yuki Tanaka
Hosei University Japan
ABSTRACT This study investigates the climate change-related textual information disclosed by Japanese companies on annual securities reports and examines the relationship between disclosure behavior and corporate value. Although the number of companies referring to climate change increased from fiscal year 2005 to 2017, most of those contents were less related to companies' business and about 40% of disclosing companies repeated the same disclosure as the previous year. As a result of investigating, the market value of companies referencing climate change was still statistically significantly larger than those of non-disclosing companies even if I controlled some independent variables. The market value of companies that disclosed information directly related to the business was also statistically significantly larger than the companies that disclosed information less related to their businesses.

Page | 45
PROFITABILITY AND ORGANISATIONAL STRUCTURE OF THE WORLD´S BIGGEST STOCK EXCHANGE OPERATORS
Dorota Wiśniewska
SGH Warsaw School of Economics Poland
ABSTRACT
The following article is the second in the series of articles concentrating on the topic of financial analysis of stock exchange operators. The article analyses the profitability and group structure of the biggest operators of stock exchanges in the world. Nowadays, financial markets play a very important role in the global economy. Whereas modern research has concentrated on analyzing the performance of the firms listed on equity exchanges, the topic of exchange operators and how they make profits has not yet been thoroughly studied. With this article, we want to make a small step in closing this gap in research. We analysed the sample of the ten biggest stock exchanges worldwide according to the market capitalisation of the market they are organizing. The financial information for each of them was collected, ratios calculated and analysed. The ratios have been divided into three groups: group profitability ratios, ratios of influence of separate entities from the group on its financial result and ratios of rights of minority shareholders. These groups allow for a multifaceted analysis of profitability and group structure of these organisations. Although many of the issues regarding profitability and group structure of the leading stock exchanges have been analysed in this article, further research is needed in this field. It might reveal further interesting facts about the organization of the stock exchange operators and the way in which they create profits. As the sample in the current research was only limited to 10 biggest entities, expansion of the studies to other smaller entities may should allow a comprehensive analysis and description of the whole market.

Page | 46
EXPLORING SUSTAINABILITY AND GREEN BANKING DISCLOSURES: A STUDY OF INDONESIAN BANKING SECTOR 2009 – 2017
Juniati Gunawan
Trisakti University-Jakarta Indonesia
Umesh Sharma
Waikato University New Zealand
Paulina Permatasari
Parahyangan Catholic University-Bandung Indonesia
ABSTRACT
This study examines the sustainability and green banking performance of Indonesian banking sectors from their disclosures in sustainability reports for a period of nine consecutive years. The findings elucidate that sustainability and green-banking disclosures are still dynamic year to year. The social information seems to be the most widely disclosed information, while environmental information is the least disclosed information. However, these findings may be different for the future since there are many sustainable or green banking regulations released. As in Indonesia, July 2017 has been an important milestone as there is sustainable finance regulation published under the Financial Service Authority. This study provides a comprehensive results of nine-year sustainability and green banking dislcosures before the regulations and also generates a newly modified green banking measurement. Keywords: Sustainability Report, Disclosure, Green Banking, Indonesia

Page | 47
PENSION FUNDS AND IPO PRICING. EVIDENCE FROM A QUASI-NATURAL EXPERIMENT
L.K. Langer
University of California, Berkeley U.S.A.
P.B. Langer
SGH Warsaw School of Economics Poland
P. Roszkowska*
Hult International Business School U.S.A.
ABSTRACT We exploit a natural experiment arising from the government-forced changes to the assets under management and investment policy of the Polish pension funds. We test whether new regulation leads to changes in the IPO pricing and subsequent stock’s performance. We report a material decrease in the IPO proceeds in the post-treatment period equal to over 100 million PLN. We find no empirical evidence that the treatment had a significant effect on the first-day IPO underpricing or on the long-term underperformance. We conclude that demand shock resulting from the pension fund reform effectively eliminates the so-called ‘pension premium’ of higher IPO valuations. Keywords: Event study, first day returns, government policy, IPO pricing, long-term underperformance, pension funds JEL codes: G11, G14

Page | 48
DO BUSINESS GROUPS RAISE POST MERGER PERFORMANCE?
Kentaro Kaneko University of Tokyo
Japan [email protected]
Reiko Kashiwazaki University of Tokyo
Japan [email protected]
Fumiko Takeda
University of Tokyo Japan
ABSTRACT This study examines whether merger performance is different between group companies and independent companies. Using data on mergers between Japanese listed companies for 1985–2014, we investigate the role of business groups on post-merger performance including company stock price, number of employees, and R&D. We find that the stock prices of acquirers react more negatively to announcements for within-group mergers than for mergers between independent firms. We also show that the acquirers of within-group mergers tend to increase number of employees and average annual salary but decrease R&D ratio after mergers. Such reduction of R&D ratio is not observed for acquirers of other types of mergers. In addition, the targets of within-group mergers tend to have higher leverage than other targets. Our results indicate that within-group mergers do not seem to aim at enhancing economic performance of acquirers but rather at rescuing troubled targets and are, thus, perceived unfavorably by market participants.
Page | 49
SEIGNIORAGE, CENTRAL BANKS’ FINANCIAL RESULTS AND THE CRISIS
Zbigniew Polański and Mikołaj Szadkowski SGH Warsaw School of Economics
Poland
ABSTRACT What has been the relationship between seigniorage and central banks’ financial results in recent years? Seigniorage is typically the key source of central bank profit which is largely transferred to the government; these payments show, however, considerable volatility, often creating political economy problems. In this paper we study the development of seigniorage of seven central banks in the context of their financial results and transfers made to the government during the period of 2003-18, with a special emphasis on the crisis period (2007-14). The institutions considered are the central banks of the euro area, Japan, Poland, Sweden, Switzerland, the United Kingdom and the United States. The novelty of the paper stems from the methodology applied to calculating seigniorage, which – contrary to other academic attempts at measuring it – is based on a direct analysis of central banks’ annual financial statements, i.e. their balance sheets and profit and loss accounts (income statements). We show that during the period studied seigniorage tended to diverge considerably with respect to central banks’ financial results and payments made to the government. Three more detailed questions guided our research. First, how to define and measure seigniorage? Second, what was the impact of the crisis on seigniorage as a source of central banks’ financial results and the following transfers to respective governments? Third, what has been the influence so far and what are the challenges of the currently discussed issues of exit policies and the normalization process? Concerning the first question we decided, contrary to many approaches, to adopt a cash-based definition of seigniorage which states that seigniorage is the income on central bank’s assets against its liabilities in the form of banknotes and coins (i.e. cash) in circulation net of expenses on their issue. Two variants of seigniorage calculation are used: in the first, seigniorage is linked to interest income on central bank assets, in the second – to total income on assets. Referring to the second question, our results show that for the period studied, seigniorage understood as above (both variants) typically amounted to less than 0.5 per cent of current GDP, i.e. in line with earlier estimates of seigniorage in a low inflation (and interest rate) environment. Moreover, throughout the crisis and the implementation of quantitative easing policies, central banks’ balance sheets expansion was usually accompanied by a considerable, but declining, as a ratio of their balance sheets, increase in cash issuance. As a result, there was no above-average increase in seigniorage (especially in the first variant of estimates). In the crisis period seigniorage was mainly affected by a change in the return on central banks’ assets. However, financial results of many central banks during (and after) the crisis increased considerably. Consequently, remittances to the state budget also increased, although they varied significantly due to different policies towards central bank profit distribution. Finally, as concerns the third question, we estimated that the Fed and the Eurosystem have been the most protected against recording negative interest income during the normalization process among the analyzed central banks conducting unconventional monetary policies.

Page | 50
EXECUTIVE COMPENSATION AND COMPANY VALUATION
Andreas Schueler University of the Federal Armed Forces Munich
Germany
ABSTRACT In the literature, the integration of the cash flow and risk effects of equity-based remuneration plans into company valuation is discussed only marginally compared to other aspects, such as the valuation of the respective instruments. This paper addresses the question of how these effects can be integrated into corporate valuation. We use the valuation of the firm before considering employee stock options (ESO) as a starting point. A by-product of this analysis are definitions of CAPM’s beta and cost of capital for a binomial distribution that are not adversely affected by a (first) circular reference. A gross or a net approach can be applied for valuing a company considering ESO. A (second) circular reference interferes with the net approach, but not with the gross approach. The resulting procedure is similar to the APV approach. Free cash flows to (old) owners and managers are valued separately. The cost of capital must be adjusted to the cash and risk impact of equity-based remuneration. The net approach suffers from a circular reference (mutual dependence) because the valuation results need to be known before the cost of capital can be derived. The gross approach increases the transparency of the valuation by dividing total company value up into the value of the shares of the existing shareholders and the value of the executive compensation through ESO. Making recourse to the treasury stock method, which is used to calculate diluted earnings per share, is not recommended here even though a corrected version of this method is used. Share-based plans with, e.g., performance-dependent payments and option-based plans usually lead to a risk transfer from (old) owners to managers, which needs to be considered in the beta values and the cost of capital. How the expected added value (NPV) is allocated, inter alia, depends on whether and the extent to which managers are required to make an up-front investment. The valuation framework developed in this paper can be applied to different types of equity- based compensation instruments. Additionally, it offers a starting point to integrate additional cash flow components into the valuation model and to extend it over a multi-period horizon.
Page | 51
AUDIT SERVICE MARKET ACROSS THE BUSINESS CYCLE
Jae Yeon Sim Korea University
Korea
Sang Hyuk Lee Korea University
Korea
ABSTRACT
This paper investigates the impacts of business cycle on audit service market. Also, in order to analyze whether audit hour, audit fee and audit quality varies across business cycle depending on auditor size, we perform analysis for Big4 auditors and non-Big4 auditors.
The analysis using the data of non-financial Korean firms between 2010 and 2018 shows that audit effort, audit fee and audit quality is lower during the recession periods compared to the boom periods. Also, Big4 auditors are impacted differently by fee pressure compared to non-Big4 auditors during the recession period. Big4 auditors seemed to maintain audit quality than non-Big4 auditors. It is expected that Big4 auditors do not reduce their audit efforts although there is fee pressure during the recession period compared to non-Big4 auditors.
This study has following contributions: First, although previous studies have focused on the extreme economic downturns such as “Great Recession”, this study analyzes whether audit service market varies across business cycles. Second, the empirical result of this study implies that auditors may consider macro-level factors when they make micro-level audit planning decisions. Lastly, this study presents an initial attempt to examine how audit service market varies across the business cycle using credit spread as proxy for the macroeconomic conditions.
Keywords: Business Cycle, Audit Service Market, Audit Fee, Audit Hour, Audit Quality, Credit Spread
Page | 52
EXPLORING THE STATE-ACCOUNTING PROFESSION NEXUS: THE MALAYSIAN EXPERIENCE
Susela Devi K. Suppiah*
Sunway University Malaysia
Salima Y. Paul University of Plymouth
U.K. [email protected]
ABSTRACT
In explicating the Malaysian accounting professionalization experience, the State-profession relations is explored using a “state-centric” approach. In contrast, prior studies have generally adopted a “profession-centric” approach. This paper contributes to the accounting professionalization literature three ways: Firstly, it provides insights into the manner as to how the Malaysian State managed the profession rather effectively, avoiding the pitfalls evident in the accounting professionalization experience of the other non-settler colonies (except Kenya). Secondly, it extends the professionalization literature in evidencing the impact of the source, timing and local social structures as well as the State ideology on the professionalization experience of a multi-ethnic society in the context of its socio-economic and political environment. Thirdly, it shows that, despite the internal tensions within the profession between the private-sector professional association, the Malaysian Association of Certified Public Accountants (MACPA), and the State-sponsored Malaysian Institute of Accountants, the State-Profession relationship is akin to that of father-son due to the State ideology and the Malay and Chinese belief-systems that have shaped the behaviour of the predominantly Malay State bureaucrats and the Chinese dominated accounting profession. The historical analysis shows an evolving mode of regulation, from associationism, to associative disorder, to corporatism during the four phases of distinct State stances towards economic development. This supports Cooper and Robson’s (2006) notion that different contexts are associated with different conceptions of what it means to be regulated, and evidences Puxty et al.’s (1987) notion that a professional body can operate in different modes at different times, depending upon the context. Keywords: Accounting professionalization, Malaysia, profession-state nexus
Page | 53
CYBERSECURITY AND AI – IMPLICATIONS FOR INTERNAL AUDITING
Toshifumi Takada National Chung Cheng University
Taiwan
Masatoshi Sakaki E.Y. Shinnihon Audit Firm
Japan
Shiro Aoyagiceo Global Security Expert Inc,
Japan
Hiroshi Kawaguchi Kawaguchi Sekkei Inc.
Japan
ABSTRACT Objectives There are 3 objectives of this paper. They are (1) To do a statistical test on the effects of Cybersecurity education (2) To make prototype AI programs for Cybersecurity (3) To consider implications to internal auditor Conclusion (1) Educational training courses using real incidents have effects on Cybersecurity. (2) AI programs may be used for Cybersecurity to detect attacking. (3) Incident occurs at information department. Internal audit department can do that role.
Page | 54
MANAGERIAL ABILITY AND THE COST OF EQUITY CAPITAL
Heeick Choi University of Massachusetts Lowell
U.S.A. [email protected]
Soomi Jang
University of Massachusetts Lowell U.S.A.
Hyung Tae Kim California State University, Fresno
U.S.A. [email protected]
ABSTRACT
This study examines whether more able managers or higher managerial ability affects the cost of equity capital. After controlling for standard risk factors and firm characteristics, we find strong evidence that higher managerial ability leads to a lower implied cost of equity. Our finding is unaffected by alternative measures of the cost of equity capital or managerial ability, suggesting that our argument is consistent with different proxies. Further, the role of managerial ability in reducing the cost of equity capital is more pronounced for firms with high information asymmetry among investors and with strong board monitoring. These findings suggest that more able managers diminish the cost of equity by enhancing the investment efficiency, improving the information environment, and lowering the business risk, and this role is more prominent for firms with more asymmetric information environments and firms with stronger corporate governance. Keywords: Managerial ability; Cost of equity capital; Information asymmetry; Corporate governance

Page | 55
PERFORMANCE MEASUREMENT SYSTEMS DESIGN CHOICE: THE ROLES OF POLITICAL CONNECTION AND SOCIAL NETWORK ON FIRM PERFORMANCE:
EVIDENCE FROM CHINA
Vincent K. Chong The University of Western Australia
Australia [email protected]
Gary S. Monroe UNSW Sydney
Australia [email protected]
Isabel Z. Wang
Australian National University Australia
Frank Zhang University of Queensland
Australia [email protected]
ABSTRACT
This study examines the effect of employees’ perceptions of political connection on performance measurement systems (PMS) design choice (i.e., the use of nonfinancial and financial performance measures for employees’ performance evaluation) and firm performance. Also, this study explores that the moderating effect of social networking, a factor which is very common and widely used by both domestic and foreign multinational firms operates in China; and its joint effect with political connection or PMS design choice on firm performance. We collected survey responses from a sample of 105 managers from manufacturing firms in China. Our results reveal that highly politically connected managers perceive that the use of nonfinancial performance measures as fair for their performance evaluation purpose, the use of nonfinancial and financial performance measures lead to improved firm performance. Our results further suggest that social networking interacts significantly with political connection, nonfinancial, and financial performance measures on firm performance. The theoretical and practical implications of our findings are discussed.
Page | 56
REVENUE MANAGEMENT THAT CONTRIBUTES TO INCREASING PRODUCTIVITY ON HOTEL BUSINESSES
Tsutomu Yoshioka
Toyo University Japan
ABSTRACT
Low labor productivity is regarded as a problem for service industry in Japan, especially in the lodging services. Moreover, the labor productivities of Japan are on the last position in the advanced (or developed) seven countries in OECD. And in Japan, labor productivity of lodging industry is quite low especially comparing to other industries. So, as a matter of course, it could be said that improvement of labor productivity of this industry is required urgently. Labor productivity is generally calculated with the formulas like [ Labor Productivity per person = Added Value / Number of Labors ] or [ Labor Productivity per Labor hour = Added Value / Labor Hours ]. And this “Added Value” is calculated with the formula likes [Labor Costs + Cost of rental + Net Financial cost + Operational profit after taxes + Taxes + Depreciation expense] (Bank of Japan) and [Revenue (Sales) – Pre-payment cost] (Japan Productivity Center). It can be said that Added Value is measured simply with the calculation of “Revenue - Pre-payment cost”. There is a limit to cost reduction. And reducing the number of labors and labor hours is likely to make service levels lower. So, how can hotels improve productivity? Revenue Management, a method to maximize revenue, is effective to increase revenue. An increase in revenue leads to an increase in Added Value. An increase in Added Value leads to an increase in Labor Productivity. In this paper, it is clarified that hotel companies can improve labor productivity by utilizing Revenue Management. This paper argued that the increase in revenue from Revenue Management contributes to the increase of Added Value and the improvement of productivity. This point is not the negative thinking of aiming for reduction but the focus of positive thinking of aiming to increase revenue. Keywords: Labor productivity, Added Value, Revenue increasing, Cost reduction, Hospitality management
Page | 57
POKEMON GO! STOCK VALUATION AND DISRUPTIVE INNOVATION IN ENTERTAINMENT INDUSTRY
Claudio Marcelo Edwards Barros
Federal University of Paraná Brazil
Iago França Lopes Federal University of Paraná
Brazil [email protected]
Itzhak David Simão Kaveski
Federal University of Mato Grosso do Sul Brazil
ABSTRACT
This research aims to analyze the impact of the announcement of the launch of the game Pokemon Go! on Nintendo's stocks. The study anchors itself on conceptual foundations of disruptive innovation and previous research that examined the stock market reaction to the announcement of innovations. This is an empirical research whose sample is made up of 4 Nintendo company assets traded in the United States, Germany, Switzerland and Japan, as well as the assets of companies comparable to Nintendo that made up the Detailed Stock Report available in the Refiniv® system (Thomson Reuters), at the time of the launch of the game. Through conducting a series of event studies, Nintendo's stocks traded in the United States, Germany, Switzerland and Japan presented abnormal returns after one day of the game's launch. These findings proved to be specific of Nintendo corporation's assets, with no similar reactions observed in peer valuation analysis. Based on five variables of cumulative abnormal returns (CARs) for all entertainment companies listed in Japan and controlled by factors such as profitability, debt, size and market value, it was found that on average the cumulative abnormal returns of Nintendo were significantly higher than the other companies in all 5 models tested. In response, we hope to broaden the discussions listed in this survey to recognize the launch of Pokemon Go! as an innovation with typical traits of Disruptive innovation, which were not ignored by capital market when the game was launched in July, 06th, 2016. Keywords: Pokemon Go! Disruptive Innovation; Capital Markets; Event Studies; Abnormal Returns
Page | 58
PERFORMANCE EVALUATION OF STATE-OWNED COMPANIES AND CORPORATE INFORMATION DISCLOSURE VIOLATIONS
Yunying Fu
Chongqing University China
ABSTRACT The special ownership structure of state-owned companies (SOC) in China is different from that in western countries. And the government-dominant economic system reform permeates many aspects of company decision-making. Therefore, study the motivation and results of tactical information disclosure of state-owned companies in China has its significance. In the background of the performance evaluation reform of Chinese companies, this paper examines the impact of the performance evaluation system reform on company information disclosure violations, which expands the research on the contractual motivation of company information disclosure from the perspective of executive compensation incentives of SOCs. In the context of the authorized operation management system reform of SOCs by SASAC (State-owned Assets Supervision and Administration Commission) and pushing through the EVA assessment, this paper examines the institutional reasons for the “cool response” of EVA assessment in some SOCs. We find that although EVA assessment strengthens the sensitivity of executive compensation to the performance of SOCs, it does not produce the expected incentive and restraint effect to alleviate the opportunistic behavior of SOC executives. After the implementation of EVA assessment, there are more business violations and information disclosure violations in SOCs. And this situation mainly occurs when executive compensation is lower than the industry annual average and the industry annual average within the same system. We believe that this is mainly because the administrative system characteristics of SOCs distort the incentive mechanism of compensation contracts, and some executives of SOCs induce opportunistic behavior because of insufficient incentives. After excluding the motivation of stock option, capital market financing, capital market shell preservation and the second kind of agency problem, the above conclusions are still valid. And also after excluding such factors as EVA assessment cycle, economic crisis, and administrative intervention of securities regulatory enforcement, the above conclusions are valid too. Reducing government intervention, policy burden on SOCs and the incentive distorting caused by administrative factors on top managers of SOCs may be the issues that must be solved in the reform of authorized management system of SOCs. Our study incorporates the interaction between government behavior and corporate governance into a unified framework, which provides policy references for the reform of authorized management system of SOCs and the management of executive compensation of SOCs, and also enriches empirical evidence for the influence of institutional factors on corporate governance in transition economy.
Page | 59
ACCOUNTING JURISDICTIONS IN AFRICA: IFRS, OHADA, NEITHER
Saeed Askary Gulf University for Sience and Technology
Kuwait [email protected]
ABSTRACT
The purpose of this study is to classify accounting jurisdictions all African countries by justifying through social, economic, political and environmental factors. Accounting jurisdictions in Africa categorized into three influential groups: IFRS adopted, OHADA and neither. The study collected qualitative and quantitative data from different and reliable sources and used cluster analysis. The result of the study shows that the most of the countries adopted IFRS are located in south-west, Christian as the main religion, speak mainly English language, colonized and got independence from UK, having the highest rate of literacy within other African countries. Most of the countries adopted OHADA are located in central-east, Islam is the main religion and French as the most spoken language They colonized by France and got their independency form France. Most of the countries neither adopted IFRS nor OHADA are located in north-east of Africa, Islam as the main religion, speak mainly Arabic language. Within the four factors affecting adopting IFRS, socio-cultural has the highest correlation and the economic factors has the lowest effects.
Page | 60
INFORMATION TRANSFER OF VOLUNTARY DISCLOSURE AMONG KOREAN CHAEBOL COMPANIES WITH RELATED PARTY TRANSACTION
Sungmin Jeon
Korea University Korea
ABSTRACT
This study examines whether disclosure has information transfer effect especially among companies in large business group in "Chaebol" in Korea. Particularly, when there are related parties transaction, I analyze how the information transfer of voluntary disclosure is manifested and affects the cost of equity of other firms in Chaebol. Dye and Hughes (2018) suggest that there is an information transfer effect of disclosure. Their results show that firms with cash flow correlations can share the effects of disclosure due to the information effect of disclosure. For example, if there is a positive correlation of cash flows between two companies and one company does not disclose, it will have a negative effect on the other company. If disclosed, the other company can enjoy the information effect of the disclosure. On the other hand, if the correlation of cash flow is negative, the firm value of the other company increases if one company does not disclose, and the other company is negatively affected when one company discloses. This study examines how the effects of disclosure suggested by Dye and Hughes (2018) affect the cost of equity of firms affiliated in large business groups, Chaebol with related party transactions. In particular, control owners can transfer wealth to other companies using related party transactions for their own profit. If the cash flow is transferred from one company to another, the disclosure will have the negative effect on other firms aligned with "Tunneling view". Based on these arguments, this paper analyzes whether voluntary disclosure frequency of counterparties in relation to related parties transaction affects the cost of equity. The results suggest that the cost of equity increased as the disclosure frequency of related parties increased. In other words, it can be interpreted that the information transfer has negative effect due to the transfer of wealth. Keywords:.Voluntary Disclosure, Information Transfer Effect, Cost of Equity, Chaebel, Relative Party Transaction
Page | 61
IS THE GOVERNMENT PUBLIC BUDGET AN ECONOMIC ENTITY? A VIEW FROM SYSTEMS PERSPECTIVE
Wojciech A. Nowak University of Lodz
Poland
ABSTRACT Governments gather and spend tremendous amounts of economic resources in the form money using the public budget as a tool. The financial effect of public budget execution is the deficit or surplus that in the long term influences on the public non-money resources and the taxes, and taxpayers wellbeing. But, the public budget deficit or surplus is not taken into account in the calculation of government net worth. It is not included in the government net worth account. This paper is devoted to the issue of the possibility of the application of generally recognized accrual accounting regulations to the public budget of government. These regulations have been driven by the accountability of economic entity and its general-purpose financial reporting. Both global and regional supranational regulations and national regulations refer to this kind of entities. However, these regulations don't encompass the public budgets of government. In the paper, the governments and their public budgets were subjected to the analysis from the perspective of complex adaptive system concept. As a result, it has been found that the public budget of government represent the financial aspect of government and through this it reveals the government as an economic entity, and this entity emulates. In the systems perspective, this means that both the governments and their public budgets belong to the class of economic entities being subset of complex adaptive systems set. Recognition as the economic entity, brings to mind the question about applying accrual accounting and reporting regulations, generally predicted for economic entities, to the public budget accounting and reporting. Conducted deliberations are pointing out to such a possibility both from the theoretical side, and from the practicality what was illustrated on the example of Poland. Within Polish public finance sector accounting regulations, the public budget deficit or surplus constitutes the separate position in the net assets of local government consolidated statement of financial position (balance sheet). In conclusion, it can be stated that from both theoretical and practical point of view it is possible to apply generally recognized accrual accounting regulations to the money/cash public budget of government. However, for having information on money current states, cash inflows and outflows have to be represented in real time. It means accrual basis should be supplemented by cash basis. Simultaneous applying these two accounting bases allows for recognizing budget as individual reporting entity which financial statement can be respectively combined or consolidated with other economic entities financial statements. Due to abstractness of budget, for practical reasons such kind of supplementation can be done by extracting some subset of analytical accounts from the set of the accrual accounts of economic entity servicing given budget. Or by operating by public budget servicing entity two separated sets of accounts, one for the public budget and the other for itself. Comparability and timeliness within public finance sector requires the central regulation for government public budget accounting and reporting. The presentation of public budget deficit or surplus as a separate position within the statement of accrual net worth seems to be of key importance for government financial accountability.
Page | 62
THE EFFECT OF OPERATIONAL AND FINANCIAL INFORMATION DISCLOSURE ON THE DEFAULT PROBABILITY AND AVERAGE LENDING RATE: EVIDENCE
FROM CHINESE PEER-TO-PEER LENDING MARKET
Jiaqi Kuang Xi’an Jiaotong-Liverpool University
China
David Xudong Ji Xi’an Jiaotong-Liverpool University
China [email protected]
Peng Cheng
Xi’an Jiaotong-Liverpool University China
ABSTRACT
The main purpose of this paper is to examine whether information disseminated by a third-party information intermediary (i.e., a rating agency) and operational and financial information voluntarily disclosed by peer-to-peer lending (P2P) platforms in China have an impact on the default probability and average lending rate of those platforms. Using the data that collected from September 2015 to December 2017, we find third-party provided information shows less impact on reducing default probability of platforms, while operational and financial information disclosed voluntarily by platforms has a significant impact on reducing default probability of platforms. Furthermore, both third-party provided information and platforms' voluntary disclosure of operational and financial information has a significant impact on reducing the average lending rate of platforms. Our results show that information disclosure is critical for improving the efficiency of peer-to-peer lending platforms in China. Keywords: Operational/Financial Information Disclosure, Voluntary Disclosure, Rating agency, Default, Peer-to-peer Lending Market

Page | 63
INTELLECTUAL CAPITAL EFFICIENCY AND FIRM FINANCIAL PERFORMANCE: EVIDENCE FROM SOUTH EAST ASIAN COUNTRIES
Ainul Islam
Victoria University of Wellington New Zealand
Mohd Ariff Arifatul Husna Universiti Utara Malaysia
Malaysia [email protected]
Tony van Zijl
Victoria University of Wellington New Zealand
ABSTRACT This study investigate the impact of Intellectual Capital (IC) on financial performance of listed firms in five South East Asian (SEA) countries: Indonesia, Malaysia, Philippines, Singapore, and Thailand. The study applies a modified version of the Value Added Intellectual Coefficient (VAIC) model proposed by Pulic (1998; 2000) to measure aggregate IC efficiency and its elements: human capital efficiency, structural capital efficiency and tangible capital efficiency. Financial performance is measured using return on equity and return on assets ratios. The results shows that aggregate IC and among the components of IC, human capital and tangible capital both have positive and significant impact on financial performance of listed firms in the five SEA countries. However, structural capital has a negative impact on financial performance of firms in all SEA countries other than Thailand, which contradicts the theoretical expectation. Keywords: Intellectual capital, financial performance JEL Classifications: L10, O34
Page | 64
CHARACTERISTICS OF JAPANESE LIFE INSURANCE COMPANIES DISCLOSING EMBEDDED VALUE
Makoto Tsukahara Teikyo University
Japan [email protected]
Kazuhiro Nishiyama
Teikyo University Japan
Ryosuke Nakamura University of Tsukuba
Japan [email protected]
ABSTRACT
In this paper, we analyze the disclosure of Embedded Value (EV) information by Japanese firms with life insurance operations to examine the characteristics that promote unregulated disclosure. As a result of the analysis, we found that companies with a larger solvency-margin ratio (disclosure is required by a statutory solvency standard in Japan) and smaller profits tend to disclose EV. Thus, based on the information required in statutory accounting, companies that perceive that their operating and financial positions are not properly valued voluntarily report EV. This suggests that companies try to eliminate information asymmetry through the disclosure. Furthermore, this result was observed in Japan, where several life insurance companies are structured as mutual companies. This suggests that life insurance companies disclose EV for stakeholders other than shareholders. Therefore, we found the role of EV is different from that described in previous research focusing on value relevance.
Page | 65
THE ETHICAL IMPLICATIONS OF CHANGES TO THE DODD FRANK ACT AND SARBANES OXLEY ACT
Behnaz Z. Quigley
Marymount University U.S.A.
ABSTRACT
The importance of ethical consideration in any organization should be clear to anyone wishing to live in a fair society. In this paper, I will look at the correlation between Ethics and the changes and implementation of the Dodd Frank Act and Sarbanes Oxley Act. In this endeavor it seems that discussion of what is Ethics must take place first. Michael Boylan (2009) in his book titled “Basic Ethics”, defines Ethics as a science. By “science” he means an activity which is studied rationally and systematically and its conclusions seek to be exact. Also ethics concerns “right” and “wrong”. In this case these terms refer to judgements that assign praise or blame. It is worth noting that these judgments are usually assigned to people or to actions according to some standard. However, what this standard is and how it is justified is a source of some controversy. The Dodd Frank Act was enacted to protect consumers and also safeguard the United States Financial industry. The United States Senate roll backed some regulations by loosening some regulations on some companies. More than 24 banks were relieved of the regulations. The bill that was passed gives relief to small regional banks that were struggling under the regulations. However, it also raises the amount to be considered too big to fail. Thousands of community banks and credit banks were relieved from the regulations. Initially banks that had more than 50 billion dollars were considered too big to fail. Now, under the new bill banks that have more than 250 billion dollars are considered too big to fail and can be relieved from stress tests. Senator Elizabeth Warren warned of creating another government bailout situation (Pymnts.com, 2018). When we look at the above scenario, does it account for being “right” or “wrong”? I could argue that it was right to relieve the small regional banks, community banks and credit unions. There could be many benefits that could accrue because of this. However, is it right also to exempt large banks from “too big to fail”? Exempting large financial institutions like American Express. According to Donna Borak (2017) of the Wall Street Journal, Banks such as Northern Trust Corporation and American Express Company will not have to comply with the Federal Reserve’s stress tests. These stress tests were created to ensure that banks could continue lending even in the midst of an economic crisis. Also banks are expected to file “annual wills” which show how banks would unwound without a tax bailout in case of a bankruptcy (Ryan Tracy & Donna Borak, 2016).
Page | 66
THE USE OF XBRL (EXTENSIBLE BUSINESS REPORTING LANGUAGE) FOR THE NEEDS OF FINANCIAL REPORTING ON CAPITAL MARKETS - BENEFITS, COSTS,
AND DETERMINANTS OF APPLICATION
Katarzyna Klimczak SGH Warsaw School of Economics
Poland [email protected]
ABSTRACT
XBRL is increasingly used in the world in a variety of reporting processes, including for tax, statistical, and banking reporting purposes, as well as under voluntary or mandatory reporting on capital markets. Recently the U.S. SEC accepted new assumptions regarding the use of XBRL on the U.S. capital market, which was the next step in long-standing activities to apply the XBRL standard in the United States. In turn, in the European Union, works on the implementation of measures involving an obligation for companies listed on European capital markets to prepare annual financial statements in XBRL electronic reporting format are nearing completion. This article discusses the benefits, costs, and determinants of the application of the XBRL for the purposes of financial reporting as they are seen by capital market supervisors and verified in empirical research.
Analyses conducted by capital market regulators as well as empirical scientific studies have indicated a number of benefits resulting from the application of the XBRL for reporting purposes. The use of the XBRL as a standard for the transmission of business data does, however, entail costs and may be associated with additional efforts for the participants of the information exchange. The scale of potential benefits as well as the costs and efforts related to the use of the XBRL may depend on many factors and conditions, which should be addressed by all participants of the capital market, European capital markets, in particular, in connection with the upcoming reporting obligation in XBRL in the European Union.
Page | 67
THE IMPACT OF BUSINESS MODEL INNOVATION ON FINANCIAL STATEMENTS – SELECTED PROBLEMS
Mariusz Karwowski
SGH Warsaw School of Economics Poland
ABSTRACT Business model innovation has emerged as one potential path to growth and value creation (Wirtz, Daiser, 2017; Sinfield, Calder, McConnell, Colson, 2012). CEO-level surveys also identify it as a key source of sustained value creation (Foss, Saebi, 2017). Schneider and Spieth (2013) believe there is need for a deeper and more reliable understanding of the impact of business model innovation on financial performance because, interestingly, little is known about this issue. The objective of this article is to examine the scope of disclosure in accounting policies in regard to selected issues which can contribute to explaining the direct or indirect impact of business model innovation on financial performance. The direct impact may be reflected through proper recognition of revenues in the statement of profit or loss and other comprehensive income (the income statement). The indirect impact may be seen in the recognition of internally generated intangibles (e.g., research and development) in financial statements. It was concluded that IFRS 15 forces companies pursuing business model innovation to match revenue more closely to the work performed to generate that revenue and to calculate the value transferred to the customer. According to IAS 38, on the other hand, the costs of building idea-based platforms that have enormous potential to create value in such companies are reported as expenses in initial years when they have little, if any, revenue. For this reason, non-financial information about these assets must be part of a company’s overall value creation story. In the field of accounting research, this article may be treated as an attempt to examine business model innovation from the perspective of the financial statements. Keywords: Business model; Business model innovation; Financial statements

Page | 68
AGGREGATE EARNINGS INFORMATIVENESS AND ECONOMIC SHOCK: INTERNATIONAL EVIDENCE
Makoto Nakano
Hitotsubashi University Japan
Yuto Yoshinaga Tohoku University
Japan [email protected]
ABSTRACT
Using international quarterly data during 1996 to 2018, we investigate whether financial statement analysis of firm profitability drivers applied at the aggregate level are relevant for forecasting GDP especially during periods of economic uncertainty. First, we confirm that aggregate-level profitability drivers are incrementally significant leading indicators of GDP growth worldwide, but the effects are trivial. Second, aggregate earnings information functions as a good leading indicator of future GDP growth only when facing economic shock. Third, the improvement effects during the global financial crisis are stronger in emerging countries. Overall, macro-level financial statement analysis is a useful tool for forecasting GDP growth during shock periods. Keywords: Aggregate earnings; macro-accounting; GDP forecast; DuPont analysis; economic shock JEL Classification: E01; M41 Data Availability: Data are available from public sources indicated in the text
Page | 69
NARRATIVE RISK DISCLOSURES IN ANNUAL REPORTS: PROPOSAL OF RISK MAP
Anna Karmańska
SGH Warsaw School of Economics Poland
Monika Łada AGH University of Science and Technology
Poland [email protected]
ABSTRACT
The aim of this article is to examine the transparency of the practice of risk disclosures within corporate financial reporting. The challenge has been taken as a result of the observation of the practice of these disclosures and their high diversity. Due to this diversity, the monitoring and evaluation of the risk areas and factors related to the company pursued by its stakeholders can be seriously impeded. In view of in-depth literature studies showing that the issue of reporting risk disclosures is not widely explored and there is an urgent need to introduce information solutions useful in different financial analyses. The authors present their own concept, which can be useful in transparent risk reporting. The article presents the results of an empirical study which shows different aspects of the current disclosure practice and provides a strong argument for presenting a concept that well-organizes this reporting area. The originality of this study results from the presentation of the results of an empirical study, whose objective is specific and never undertaken in the literature before and from a proposal of the design of an original Risk Map, as a disclosure disciplinary instrument in the area of risk in terms of ex-post as well as ex-ante. Keywords: Risk, disclosure, activity report, WIG30 companies, narrative reporting
Page | 70
DO FINANCIAL REPORTING QUALITY AND CORPORATE SOCIAL RESPONSIBILITY ASSOCIATED WITH INVESTMENT EFFICIENCY? EVIDENCE
FROM INDONESIA
Sylvia Veronica Siregar Universitas Indonesia
Indonesia
ABSTRACT This research aims to examine the association between the financial reporting quality and corporate social responsibility with investment efficiency. We also differentiate corporate social responsibility into strategic and non-strategic. The contribution of our study is examining the association of strategic and non-strategic CSR on investment efficiency, which not yet examined in extant studies. The samples of our study are listed firms in Indonesia stock exchange year 2012-2014. We conducted panel regression analysis for hypotheses testing. We measure financial reporting quality using aggregate measures based on three proxies of widely used measure of financial reporting quality. Corporate social responsibility is measured based on disclosure in annual reports as well as sustainability reports using GRI guidelines. As for investment efficiency we follow model used by Chen et al. (2011). Based on our results, we find evidence that financial reporting quality tends to have positive association with investment efficiency (particularly in over-investment and under-investment subsamples). Whereas, we find contrary evidence that corporate social responsibility tends to have negative association with investment efficiency. Keywords: Corporate social responsibility, financial reporting quality, investment efficiency, strategic CSR, non-strategic CSR

Page | 71
THE EFFECT OF CORPORATE SOCIAL RESPONSIBILITY ON THE ORGANIZATIONAL COMMITMENT OF EMPLOYEES MEDIATED BY INTRINSIC
MOTIVATION
Edicreia andrade dos santos University of Mato Grosso do Sul
Brazil [email protected]
Januário José Monteiro
University of Santa Catarina Brazil
Rogério João Lunkes University of Santa Catarina
Brazil [email protected]
Claudio Marcelo Edwards Barros
Federal University of Paraná Brazil
ABSTRACT One of the approaches in the literature for Corporate Social Responsibility (CSR) is to study its impact on employees by considering whether they are more attracted by responsible companies concerned with society. With this understanding, the aim of this study is to investigate the effects of CSR on the organizational commitment of employees mediated by intrinsic motivation. For this, we use a survey of 189 respondents. The research data is applied to the Structural Equation Modelling (SEM) technique using the Software Smart PLS. Notably, among the results obtained, there is a positive and significant relationship between the employees’ perceptions of CSR and organizational commitment; in addition, we confirm that intrinsic motivation mediates the CSR relationship in organizational commitment. We conclude that the CSR perceived by the employees allows their commitment and intrinsic motivation to improve. These arguments align with the current literature, which has studied the CSR from the point of view of the employees. Keywords: Corporate Social Responsibility (CSR); Intrinsic Motivation; Organizational Commitment

Page | 72
THE IMPACT OF ASYMMETRIC COST BEHAVIOR ON THE AUDIT REPORT LAG
Jin Ho Kim Sungkyunkwan University
Korea
ABSTRACT This study examines the impact of the cost stickiness on the audit report lag. I find that company’s asymmetric cost behavior, cost stickiness, is one of the important determinants of the audit report lag. The test results show that firm’s cost stickiness induced by empire building incentives is positively associated with the audit report lag. Interestingly, in the “future expectation” group, stickiness is also positively related with the audit report lag but not significant. It implicates that even if the firm has an inefficient cost behavior, auditors do not consider it as an audit risk compared to the suspected group of “empire building”.
Page | 73
CYBERCURRENCY AND BLOCKCHAIN IN THE COLLEGE ACCOUNTING CLASSROOM
Ermira Mazziotta
Muhlenberg College U.S.A.
Ellen Rackas
Muhlenberg College U.S.A.
ABSTRACT
Blockchain is effectively a type of a decentralized database known as a distributed ledger. Unlike traditional databases, blockchains have no sole administrators. As each transaction is recorded it is time-stamped in real time onto the “block”. Each block is linked to the previous block, and each user has a copy of that block in his or her own device. Blockchain, originally used for Bitcoin trading, is one of the most important and innovative technologies developed in the recent years (Jun Dai, Miklos A. Vasarhelyi 2017). This technology is considered to be as important as the internet and it could fundamentally change the nature of every business aspect by revolutionizing supply chains, payments and revenue streams through the way it documents and reconciles complex and disparate information from multiple sources. Blockchain has found applications in almost every industry and business aspect from auditing, financial services, supply chain and healthcare. This paper will investigate the current applications of blockchain, but the main focus of the paper is investigating what the academic community is doing and what needs to be done to prepare students for this revolutionary technology. This paper will also propose ways on how to introduce the blockchain technology into various accounting courses.

Page | 74
EFFECT OF CULTURAL AND HISTORICAL EVENTS ON INNOVATION OF LIFE INSURANCE MARKET – BRIEF DISCUSSION ON POLISH CASE
Adam Sliwinski
SGH Warsaw School of Economics Poland
ABSTRACT
The aim of the paper is an introduction of new research on innovation of life insurance market. The research question consider that the innovativeness of life insurance market in post-communist countries is significantly determined by cultural and historical development. The question would be answer based on Polish case. Polish life insurance market is the biggest among other countries in the region. According to the author, cultural and historical events in post-communist countries delayed and blocked innovativeness of the markets. The historical development of life insurance market in Poland is described in that context with stress on factors that are significant to answer the research question. The paper aims to present history of life insurance market in Poland. The development of life insurance market is described from the very beginning form of insurance to present times. Nowadays Polish life insurance market is one of the biggest among all markets in transition countries. The market went through a few milestones. From the very beginning when the insurance products were offered based on mutual idea through centrally planned economy up to developed free, commercial market with the presence of the biggest world’s players. The impact of the market on the economy of CEE region is also described. The basic data are presented and analyzed include the following: gross written premium, subscribed capital, FDI, number of insurance entities. The paper ends with the conclusions concern unique shape of life insurance market in Poland and historical events that influence the development of the market in terms of its innovativeness. Keywords: Insurance history, life insurance, market development JEL Classification: D02, G22
Page | 75
CONFORMITY PRESSURE AND COMPENSATION CONTRACTS
Taichi Kimura Keio University
Japan
Yutaro Murakami Keio University
Japan
ABSTRACT The conforming behaviors resulting from conformity pressure have been widely observed in economic and psychological experiments. This study focuses on examining how conformity pressure affects a manager’s incentive and the performance of compensation contracts. In particular, we identify the conditions under which the existence of conformity pressure can lead to a positive or negative outcome by developing a principal–agent model in which each worker feels psychological pressure when he compares his action with those of colleagues. The main findings of our study are as follows. When the sensitivity to the performance measure is similar between agents, conformity pressure never improves the performance of the contracts. On the contrary, when the productivity of effort is similar between agents, conformity pressure enhances the performance of the contracts. With respect to the comparison of the payment schemes, the existence of conformity pressure plays a more important role under the team payment scheme than under the individual payment scheme, especially when an agent’s productivity and performance measure sensitivity are inconsistent. Our findings have important implications for cultural controls. For firms that already engage in norm management, a rise in conformity pressure may positively affect the performance of compensation contracts. Keywords: Conformity Pressure; Compensation Contracts; Individual Payment Scheme; Team Payment Scheme JEL Classification: D86; D90; M41
Page | 76
RISK MANAGEMENT CHALLENGE IN MULTI-STAKEHOLDER DECENTRALIZED RISK ENVIRONMENT. FMD - A PIONEER EUROPEAN PRIVATE-PUBLIC
MANAGED BIG DATA PROJECT IN HEALTHCARE SECTOR
Michał Kaczmarski SGH Warsaw School of Economics
Poland
ABSTRACT Recently more and more public roles (tasks) are outsourced to private sector and only supervised by the imperium of governments. This approach seems to be particularly reasonable and cost effective in respect to complex challenges where many stakeholders need to be involved and, in practice, they only are capable to understand and develop a non-artificial operational risk mitigation framework that works. Medicines supply chain is one of the areas where the complexity is relatively high, hence the need for innovative approach towards regulatory risk management. Due to the fact that globalization and e-commerce have increased the complexity of the supply chain for medicines, there are numerous entry points for unethically and illegally produced medical products. The challenge of scale of the counterfeit medicines reaching out the patients and legal supply chain has been constantly alerted by World Health Organization (WHO). The scale of the problem varies from 1% in developed countries through 50% of medicines purchased over internet. Why counterfeit medicines are dangerous? Counterfeit medicines are potentially lethal because they frequently contain incorrect components and/or the wrong doses of active ingredients. Hence, European Parliament and the Council introduced the Directive 2011/62/EC that enforced agreed with the business stakeholders a pioneer European Medicines Verification System. The system went live on 9 February 2019. The System is a pioneer European private-public managed big data project in healthcare sector, introduced to prevent the entry into the legal supply chain of falsified medicinal products. The paper outlines the estimated costs and benefits of the European innovative undertaking and introduces the reader into the future potential of lessons learned deriving from newly introduced System.
Page | 77
POOR PUBLIC SECTOR ACCOUNTABILITY IN NIGERIA. THE IMPERATIVE OF TREASURY SINGLE ACCOUNT (TSA)
Godwin Ndu Uchechukwu
Federal College of Education Eha-Amufu Nigeria
ABSTRACT
Prior to the introduction of Treasury Single Account in Nigeria in the year 2012, Nigeria Public Sector lacked proper accounting system. Section 80 (1) of 1999 constitution of the Federal Republic of Nigeria (as amended) provides that “all revenues or other monies raised or received by the Federation shall be paid into and form one consolidated revenue fund of the Federation” However, successive government in Nigeria operated and managed public funds contrary to the provisions of this constitution. Right from independence, the challenges of public sector financial management have been quite enormous. The Nigeria Post-independence socio-political and economic experiences aptly provide more than sufficient materials to prove this fact as public accountability has been very weak since the first republic. Following these chequered records of poor fund management by the public sector in Nigeria, the government of Goodluck Jonathan in 2012 introduced the Treasury Single Account. This was designed to reform the public sector financial behaviours and enhance performance. Treasury Single Account (TSA) is a public accounting system whereby all government revenues are expected to be channeled to one account. This paper which is basically theoretical in nature adopted analytical and descriptive designs in examining the relevant issues in terms of its effectiveness in repositioning Nigerian Public Sector. The findings of the study show an improvement in the financial performance of the public sector by way of the revenue performance of the public sectors. The financial leakages to some extent have not been controlled since cases of unremitted cash balances with commercial banks and agencies still abound. The study among others recommended for a more proactive steps by the regulatory authorities in effecting a strict compliance by all concerned agencies and banks. A periodic appraisal of the concerned sectors was also recommended to control sharp practices by banks and MDAs. Keywords: Treasury Single Account (TSA), Public Sector, fund management, accountability and transparency
Page | 78
BOOK TAX CONFORMITY, EARNINGS MANAGEMENT AND COMPENSATION CONTACTS
Yiu Wai Wong
Tohoku University Japan
ABSTRACT
This paper has investigated how does a degree of book-tax conformity affect manager’s compensation contracts and earnings management activity. The arguments for and against on requiring book-tax conformity have been discussed in many countries for many years. Empirical studies about effects of book-tax conformity on usefulness of accounting earnings have been accumulated, but the literature on earnings management and book-tax conformity is still ambiguous. Also, there have been little studies which examine a relationship between the degree of book-tax conformity and manager’s compensation contracts. This study focuses on new aspects of book-tax conformity research, that is, compensation contracts. In this paper, I have found that bonus coefficient is decreasing in the in the degree of book-tax conformity. The main findings are as follows. Book-tax conformity prevents the manager from engaging earnings management and also some production activities. Further, expected utility of the principal decreases in the degree of book-tax conformity.
Page | 79
PERFORMANCE OF PUBLIC SECTOR AND GOVERNMENT FINANCIAL STATEMENTS: THE CASE OF INDONESIA
Endang Kiswara
Universitas Diponegoro Indonesia
Dyah Turanggadewi Arya Curtin University
Australia [email protected]
ABSTRACT
Financial statements reflect financial performance of public or private entities accordance to Financial Accounting Standards. In United States, accounting concept of public sector has shifted to the meaning of accountability. As a consequence, financial statements of public sector entities not just disclosing financial performance but include qualitative information consist of policies and strategies related to the responsibilities. Indonesian government as the highest public sector entity should demonstrate accountability of performance using financial reporting that integrated all aspects of public accountability, wider than just a Government Financial Statements. The Government Financial Statements of Indonesia which is object of this study consists of seven components: budget realization report, balance sheet, cash flow statement, operational report, report changes of accumulated budget surplus balances, changes in equity statement, and notes to financial statements. The government has main goal to serve community. Therefore, transparency and accountability are important components of performance report. This study uses criteria of public sector indicators published by the Canadian Public Sector Accounting Board (PSAB) in 2011 adaptive to the Indonesian rules and policies. Performance of public sector is represented by 5 main characteristics, consist of public accountability, various purposes of public interest, government structure, nature of resources and their interests, and volume of non-exchange transactions. Each of these features supported by 40 total indicators. The indicator used to measure suitability of government performance reports as public sector entities. The Government Financial Report and the Supreme Audit’s Executive Summary along 3 years: 2015, 2016, and 2011 were analyzed qualitative and comparatively to perspective data on Indonesia according to the World Bank and allocation of public funds from the United States government. Results of study indicate that the Government Financial Statements of Indonesia were not representing public sector performance reports and having weak compliance to the Financial Accounting Standards. Keywords: Government Financial Statements, public sector, indicator, performance

Page | 80
THE EFFECTS OF VOLUNTARY ADOPTION SYSTEM OF IFRS AND US GAAP: EVIDENCE FROM JAPANESE MNES
Hideaki Sakawa
Nagoya City University Japan
Naoki Watanabel Nagoya City University
Japan
Junjian Gu University of Tsukuba
Japan
ABSTRACT This paper investigates the relation between a degree of internationalization and voluntary adoption system of IFRS and US GAAP using of Japanese MNEs. We focus on co-existence of voluntary IFRS adoption and US GAAP in Japanese corporations post March 2010 when Voluntary IFRS adoption began. Our findings are summarized as following points. First, we find that both of IFRS and US GAAP adoptions are progressed in firms with higher degree of internationalization. Second, foreign shareholders are not positively moderated to the positive relation between IFRS adoption and internationalization, but positively moderated to the positive relation between internationalization and US GAAP. This suggests that Japanese MNEs care about North-American regional specific approach and foreign shareholders care more about stakeholders of North-American region. Keywords: IFRS; Internationalization; MNEs; US-GAAP; Stakeholder Theory

Page | 81
DOES GOOD CORPORATE GOVERNANCE INCREASE BUSINESS VALUE? EVIDENCE FROM AN EMERGING ECONOMY, INDIA
Ahindra Chakrabarti
Great Lakes Institute of Management Gurgaon India
ABSTRACT The present paper empirically examines whether good corporate governance practices leads to enhanced business value of companies. The study considers 81 non-financial Indian firms over a period from 2013-2014 to 2017-2018. Several corporate governance parameters like board size, board independence, board diligence, CEO duality, board diversity, number of board meeting held etc. are considered along with several institutional variables like DII share and FII share. The paper considers both accounting based as well as market based performance measures like, ROA, ROE, Economic Value Added (EVA) and Market Value Added (MVA). By running the appropriate panel data regression models, the study finds that, the impact of corporate governance variables on firm performance varies across performance measures. Independent boards and multiple directorships help in improving the firm performance. Financial leverage, FII share and Firm size also influence firm performance. However, not all the governance parameters influence the firm performance. , Results show that the multiple directorships held by board members helps them to gain varied experiences and thus they are able to share more expertise and wisdom in tackling the various business complexities of different firms. The Foreign Institutional Investors’ share and Promoter holding positively influence the economic value addition of the company. On the other hand, the companies having Group affiliation are likely to have a negative impact on their economic performance. In such cases, chances of diversion of funds among group companies may increase, or the poor performance of a group company may negatively affect the value of other profitable firms of the group.

Page | 82
THE INFLUENCE OF IFRS ADOPTION ON FINANCIAL REPORTING QUALITY: EMPIRICAL EVIDENCE FROM BANKS IN THE UAE AND EGYPT
Magdi El-Bannany
University of Sharjah U.A.E.
ABSTRACT
The purpose of this paper is to examine the determinants of financial reporting quality for banks in the UAE and Egypt over the period 2008 to 2017. Multiple regression analysis is used to test the relationship between financial reporting quality as a dependent variable and certain independent variables. The results indicate that global financial crisis, accounting conservatism for banks in the UAE and Egypt have significant impact on financial reporting quality but international financial reporting standards, market structure in terms of concentration, market structure in terms of efficiency, intellectual capital performance and bank size have not. These results might benefit the banking and accounting regulators to address the features affecting financial reporting quality. In addition, it provides valuable comparable information for stockholders and hence help them to take informative decisions. It is one of a few studies which addressing the influence of the nature of accounting standards on financial reporting quality in emerging economies through studying the effect of IFRS adopted by the UAE Banks and local accounting standards adopted by the Egyptian banks on financial reporting quality. In addition, the study, for the first time, is exploring whether intellectual capital performance maybe an underlying determinant of financial reporting quality. Keywords: Financial reporting quality, IFRS, global financial crisis, accounting conservatism, market structure, intellectual capital performance bank size, the UAE, Egypt
Page | 83
GOVERNANCE DISCLOSURES, SENIOR MANAGEMENT AND THEIR INFLUENCES ON TAX AVOIDANCE
Estralita Trisnawati
Tarumanagara University Indonesia
Juniati Gunawan
Trisakti University Indonesia
ABSTRACT
Purpose – This study aims to examine the influence of governance disclosures and senior management on tax avoidance in manufacturing industry companies listed on the Indonesia Stock Exchange (IDX). Design/methodology/approach – This study applies linear regression with WarpPLS 5.0, examining the secondary data of 120 manufacturing industry companies on the IDX during the period 2012-2017. Findings – The results show that: (1) governance disclosures have a significant influence on tax avoidance and (2) senior management has a significant influence on tax avoidance. Practical implications - This research provides input for the Government, especially the Directorate General of Taxation (DGT), to make regulations that are not subject to multi-interpretation that can be misused by taxpayers for tax avoidance. Tax avoidance causes losses to state revenues and regulations should create preventive policy standards to resolve long-term tax evasion actions. Originality/value – This study applies indicator used by the tax authorities in Indonesia, which is expected to help the tax authorities in digging the potential of the taxpayer so that the possibility of taxpayer who conduct tax avoidance or embezzlement of taxes can be detected. Not only Indonesia, but this study also provides insights to other countries, especially to developing countries who have relatively similar country characteristics to Indonesia. Keywords: Governance disclosure, senior management, tax avoidance
INDEX OF AUTHORS Agrawal, Prerana ........................................................................................................................6 Ahmed, Kamran .........................................................................................................................7 Ahmed, Kamran .......................................................................................................................35 Aoyagiceo, Shiro ......................................................................................................................53 Arieftiara, Dianwicaksih ..........................................................................................................18 Arifatul Husna, Mohd Ariff .....................................................................................................63 Arya, Dyah Turanggadewi .......................................................................................................79 Askary, Saeed ..........................................................................................................................59 Barros, Claudio Marcelo Edwards ...........................................................................................57 Barros, Claudio Marcelo Edwards ...........................................................................................71 Basu, Sanjib Kumar .................................................................................................................31 Black, Ervin .............................................................................................................................23 Chakrabarti, Ahindra ................................................................................................................81 Chan, Shirley............................................................................................................................21 Chen, Yangyang .........................................................................................................................2 Cheng, C.S. Agnes ...................................................................................................................10 Cheng, Peng .............................................................................................................................62 Choi, Heeick ............................................................................................................................54 Chong, Vincent K. ...................................................................................................................55 Choo, Teck Min .........................................................................................................................3 Correa, Adelaida ........................................................................................................................4 Dos Santos, Edicreia Andrade .................................................................................................71 Downes, Jimmy F. .....................................................................................................................1 Duh, Rong-Ruey ........................................................................................................................5 Eggleton, Ian ............................................................................................................................16 El-Bannany, Magdi ..................................................................................................................82 Endrawes, Medhat......................................................................................................................4 Ferdous, Lutfa Tilat ...................................................................................................................7 Fox, Alexander .........................................................................................................................14 Fu, Yunying .............................................................................................................................58 Furqan, Andi Chairil ................................................................................................................29 Gray, Sidney J. .........................................................................................................................19 Green, Peter ..............................................................................................................................20 Gu, Junjian ...............................................................................................................................80 Gunawan, Juniati ......................................................................................................................46 Gunawan, Juniati ......................................................................................................................83 Henry, Darren ............................................................................................................................7 Hoang, Nam ...............................................................................................................................9 Hong, Jin Yeung ......................................................................................................................17 Horie, Yuki ..............................................................................................................................30 Houqe, Muhammad Nurul .......................................................................................................27 Hu, Yuan Yuan ........................................................................................................................13 Hu, Yuan Yuan ........................................................................................................................21
Huang, Hong ............................................................................................................................34 Indyk, Magdalena ....................................................................................................................43 Islam, Ainul..............................................................................................................................63 Jang, Soomi ..............................................................................................................................54 Jeon, Sungmin ..........................................................................................................................60 Jeong, Kwang Hwa ..................................................................................................................11 Ji, David Xudong .....................................................................................................................62 Jia, Jing ....................................................................................................................................13 Jinushi, Junko ...........................................................................................................................40 K. Suppiah, Susela Devi ..........................................................................................................52 Kaczmarski, Michał .................................................................................................................76 Kaneko, Kentaro ......................................................................................................................48 Kang, Tony ................................................................................................................................1 Karmańska, Anna .....................................................................................................................43 Karmańska, Anna .....................................................................................................................69 Karwowski, Mariusz ................................................................................................................67 Kashiwazaki, Reiko .................................................................................................................48 Kaveski, Itzhak David Simão ..................................................................................................57 Kawaguchi, Hiroshi .................................................................................................................53 Kim, Hyung Tae.......................................................................................................................33 Kim, Hyung Tae.......................................................................................................................54 Kim, Jeongtaek ..........................................................................................................................8 Kim, Jin Ho ..............................................................................................................................72 Kim, Sook Min.........................................................................................................................17 Kimura, Taichi .........................................................................................................................75 Kiswara, Endang ......................................................................................................................79 Klimczak, Katarzyna ................................................................................................................66 Koh, Wei Chern .........................................................................................................................3 Kotey, Bernice ...........................................................................................................................9 Kuang, Jiaqi .............................................................................................................................62 Łada, Monika ...........................................................................................................................69 Langer, L.K. .............................................................................................................................47 Langer, P.B. .............................................................................................................................47 Lee, Sang Ho ............................................................................................................................28 Lee, Sang Hyuk ........................................................................................................................51 Lee, Sejoong ............................................................................................................................11 Li, Xiaohui ...............................................................................................................................10 Li, Zhongtian............................................................................................................................13 Lima, Gerlando ........................................................................................................................23 Lin, Shu ....................................................................................................................................36 Liu, Haiyu ................................................................................................................................34 Lopes, Iago França ...................................................................................................................57 Lunkes, Rogério João...............................................................................................................71 Martani, Dwi ............................................................................................................................29 Mashayekhi, Bita .....................................................................................................................12 Matsuda, Chieko ......................................................................................................................15
Mazziotta, Ermira ....................................................................................................................73 Metcha, Sodsongkrit ................................................................................................................22 Miglani, Seema ........................................................................................................................35 Monroe, Gary S. .......................................................................................................................55 Monteiro, Januário José ...........................................................................................................71 Murakami, Yutaro ....................................................................................................................75 Nagata, Kyoko .........................................................................................................................19 Nakamura, Miho ......................................................................................................................19 Nakamura, Ryosuke .................................................................................................................64 Nakano, Makoto .......................................................................................................................68 Nath, Nirmala ...........................................................................................................................21 Ndu Uchechukwu, Godwin ......................................................................................................77 Neuland, Jana ...........................................................................................................................14 Ng, Jeffrey..................................................................................................................................2 Nguyen, Thai V.H. ...................................................................................................................24 Nishiyama, Kazuhiro ...............................................................................................................64 Nomakuchi, Takao ...................................................................................................................42 Nowak, Wojciech A. ................................................................................................................61 Obeng, Victoria A. ...................................................................................................................35 Obinata, Takashi ......................................................................................................................32 Opare, Solomon .......................................................................................................................27 Ozu, Chikako ...........................................................................................................................19 Pan, Peipei................................................................................................................................25 Park, Changrae .........................................................................................................................41 Parra, Fernando ........................................................................................................................33 Patel, Chris ...............................................................................................................................25 Paul, Salima Y. ........................................................................................................................52 Permatasari, Paulina .................................................................................................................46 Peyvandi, Ali............................................................................................................................37 Phan, Duc T.H. .........................................................................................................................24 Polański, Zbigniew ..................................................................................................................49 Quigley, Behnaz Z. ..................................................................................................................65 Rackas, Ellen............................................................................................................................73 Roszkowska, P. ........................................................................................................................47 Ryabova, Tatyana ....................................................................................................................36 Sakaki, Masatoshi ....................................................................................................................53 Sakawa, Hideaki ......................................................................................................................80 Santana, Verônica ....................................................................................................................23 Schueler, Andreas ....................................................................................................................50 Seki, Koreyoshi ........................................................................................................................26 Setyaningrum, Dyah ................................................................................................................29 Sharma, Umesh ........................................................................................................................46 Sim, Jae Yeon ..........................................................................................................................51 Siregar, Sylvia Veronica ..........................................................................................................39 Siregar, Sylvia Veronica ..........................................................................................................70 Sliwinski, Adam .......................................................................................................................74
Suga, Yoko ...............................................................................................................................38 Sukartha, D’yan .......................................................................................................................20 Sun, Zeyu .................................................................................................................................10 Suzuki, Tomohiro ....................................................................................................................26 Szadkowski, Mikołaj................................................................................................................49 Taekura, Takashi ......................................................................................................................32 Taheri, Hossein Shaker ............................................................................................................12 Taheri, Mehdi Momeni ............................................................................................................12 Takada, Toshifumi ...................................................................................................................38 Takada, Toshifumi ...................................................................................................................53 Takeda, Fumiko .......................................................................................................................48 Tanaka, Yuki ............................................................................................................................44 Tao, Baoshan............................................................................................................................13 Tariquzzaman, ATM ................................................................................................................16 Tenoyo, Bayu ...........................................................................................................................39 Terdpaopong, Kanitsorn ............................................................................................................9 Theeraseth, Metjiranont ...........................................................................................................22 Tooley, Stuart ...........................................................................................................................20 Trisnawati, Estralita .................................................................................................................84 Tsukahara, Makoto ..................................................................................................................64 van Zijl, Tony...........................................................................................................................16 van Zijl, Tony...........................................................................................................................27 van Zijl, Tony...........................................................................................................................63 Vera-Colina, Mary Anali ...........................................................................................................4 Vo, Nguyen N.T. ......................................................................................................................24 Wang, Isabel Z. ..........................................................................................................................6 Wang, Isabel Z. ........................................................................................................................55 Wang, Jia..................................................................................................................................37 Wang, Jing .................................................................................................................................1 Wang, Liying .............................................................................................................................1 Wardhani, Ratna ......................................................................................................................29 Watanabel, Naoki .....................................................................................................................80 Wiśniewska, Dorota .................................................................................................................45 Wong, Yiu Wai ........................................................................................................................78 Woodliff, David .........................................................................................................................6 Xia, Harry Hui .........................................................................................................................36 Xie, Jing ...................................................................................................................................10 Yang, Xin ...................................................................................................................................2 Ye, Chunlai ................................................................................................................................5 Yoo, Seung Weon ....................................................................................................................17 Yoo, Yong Keun ......................................................................................................................28 Yoshinaga, Yuto ......................................................................................................................68 Yoshioka, Tsutomu ..................................................................................................................56 Yu, Lin-Hui ................................................................................................................................5 Zhang, Frank ............................................................................................................................55
1
JOB HOPPING AND INNOVATION EFFICIENCY: EVIDENCE FROM CHINA
Yuan Yuan Hu Massey University
New Zealand [email protected]
Jing Jia
University of Tasmania Australia
Zhongtian Li Queensland University of Technology
Australia [email protected]
Baoshan Tao
Zhejiang Sci-Tech University China
ABSTRACT Knowledge transfer resulting from job hopping constitutes an important source of innovation. With a large amount of money being invested in R&D, there is a growing interest in understanding the efficiency of R&D activities. Using data envelopment analysis (DEA) technique to estimate R&D efficiency, we empirically investigate the impact of job hopping on R&D efficiency in China, where the term job mobility only exists about 20 years. Specifically, we build a job-hopping index based on the past job-hopping experiences of three important corporate governance bodies, namely top management team, board of directors and supervisory boards (we collectively referred the three bodies as MBS). The results show that the job-hopping index of MBS is associated with higher R&D efficiency, suggesting that past job-hopping activities of MBS have significant effects on firms’ innovation efficiency. Firms located in the province with high R&D intensity tend to have high R&D efficiency. Job hopping strengthened the relationship between R&D intensity and R&D efficiency. Key words: Job hopping, Innovation, R&D efficiency, China, Corporate Governance
2
1. Introduction
Innovation is crucial to a firm’s growth, and knowledge transfer resulting from job hopping constitutes an important source of innovation and growth (Kaiser et al., 2015). With large amount of money being invested into R&D, there is a growing interest in understanding the efficiency of R&D activities. In this paper, we investigate the impact of firms’ job-hopping on R&D efficiency in China.
We select China as a natural setting for two reasons. First, innovation has been a focus in China as a driver of economic development. According to the recent Five-Year Plan suggested by the Chinese government, innovation is the key to future economic growth. Chinese Government invest a substantial amount of R&D grants to firms, with nearly a quarter of China’s total R&D spending ($207 billion) are from government grants ($46 billion) (Fang et al, 2018). Second, China exhibits low level of job mobility due to its employment reform in 1990s. In the mid-1990s, job changes were either prohibited or controlled by the Chinese Government (Song et al., 2017). Through university and local government, jobseekers were assigned to employment. Most people worked in state-owned enterprise (SOE) and enjoyed a lifetime of employment with no risk of being fired (known as “the iron rice bowl”) (Song, 2017). Job mobility was almost non-exist. Since the mid-1990, jobseekers can freely choose their employment and employer have had more flexibility in hiring and firing (Dong and Xu, 2009). In this sense, the term “job hopping” has only been existed in China for about 20 years (Felisher and Yang, 2006; Song, 2017). Consequently, due to the weak culture of job hopping, job turnover rate is quite low in China, with only 16% (Du et al., 2006). According to OECD (1997) and China Urban Household Survey, Chinese residents exhibit the longest tenure (19.9 years) and the lowest job mobility rate compared to the US, Japan, Germany and the UK. Therefore, the Chinese labour market is quite unique and differs from other countries’ labour market.
Job hopping of three important corporate governance bodies are examined in this paper, namely top management team, board of directors and supervisory boards. We refer those three bodies collectively as “MBS” (management, board of directors and supervisory boards). This study argues that the knowledge spillover resulting from the past job-hopping experience of MBS is closely related to firm’ innovation efficiency (Wu and Lee, 2007; Jaskyte, 2012; Damanpour and Schneider, 2006; Elenkov et al., 2005). Using all listed A-share companies in the Shenzhen Stock Exchange and Shanghai Stock Exchange over 20141 -2016, we empirically test whether MBS’s past job-hopping experience is a determinant of firms’ R&D efficiency.
To test the relationship. we build a job-hopping index based on the MBS’s past job-hopping experiences indicated in their resumes. Three aspects of the past job-hopping experience are considered: (1) firm-level mobility (MBS switch firms), (2) position-level mobility (MBS switch positions) and (3) function-level2 mobility (MBS switch functions). Based on the three aspects of MBS past job-hopping experience, a job-hopping index is constructed using the first factor of principle components analysis. This approach minimizes measurement errors and increase the power of regression analysis by avoiding multicollinearity from using the three proxies
1 We start from year 2014 due to data availability, firms start to disclose R&D efficiency related data from 2014. 2 In CSMAR database, it classifies function into nine categories, namely production, R&D, design, human resource, management, marketing, finance, accounting and law.
3
individually (Custodio et al., 2013). R&D efficiency is estimated using data envelopment analysis (DEA) technique based on the inputs and outputs of R&D activities.
Overall, we find that job hopping index is associated with higher R&D efficiency, showing that past job-hopping experience of MBS is a determinant of firms’ R&D efficiency. It also highlights the value of job hopping in China, a nation with low worker mobility rate. Further analysis reveals the importance of R&D intensity in enhancing R&D efficiency. We find that firms located in the province with high R&D intensity tend to have high R&D efficiency. Job hopping strengthened the relationship between R&D intensity and R&D efficiency. In addition, since high-tech industry is one of the most important knowledge-based industry, we further investigate whether firms that were certified as high and new technology have higher R&D efficiency. The results show that although high and new technology enterprises (HNTEs) spend more on R&D, their R&D efficiency are not significant higher compared to firms without a certification of high and new technology. This result may indicate that firms certified as HNTEs do not use R&D resources more efficiently than firms without certification. This result may provide practical implications to Chinese regulators.
This study contributes to the prior literature in several dimensions. First, we contribute to the previous literature on the measurement of innovation efficiency. Differs from previous studies, which often regard patents (for example number of patent applications or patent grants) as a measure of innovation efficiency (Goto and Suzuki, 1989; Kaiser et al., 2015; Custodio et al., 2017), we utilise data envelopment analysis (DEA) technique to estimate R&D efficiency. Due to a time lag between date of patent application and date of patent grants, it has been argued in the prior literature that granted patents and patent applications may not capture firms’ R&D efficiency accurately. In this study, we argue that DEA brings more accurate estimation of R&D efficiency as it considers the direct inputs and outputs of R&D. We select number of R&D employees and R&D expenditure are selected as inputs of firm innovation, and the amount of capitalised R&D expense is the output.
Second, this study advances our knowledge in relation to the linkage between MBS job mobility and R&D efficiency. Most of prior studies measure worker job mobility based on either a binary variable (mover vs stayer) or the number of movers/stayer (e.g. Ejsing et al., 2013; Kaiser et l., 2015; Gao et al., 2015). This study measures MBS job mobility based on a comprehensive job-hopping index, consisting of three components of the past job-hopping experience of MBS.
Third, our study complements previous findings that job hopping is an important determinant of firm innovation. Hoisl (2007) use questionnaire techniques find that inventor mobility enhances inventor productivity. Ejsing et al. (2013) show that hiring researcher from universities has a positive effect on firm patenting. Kaiser et al. (2015) find that the mobility of R&D workers could influence firms’ total patenting activity. This effect is strongest if workers join from patent-active firms.
The remainder of the paper is organized as follows: Section 2 provides the literature review on the role of managers and boards play in innovation efficiency and research question development. Section 3 describe the data, outlines the independent and dependent variables used in the analysis. The results are reported in Section 4 with additional analysis. Section 5 concludes.

4
2. Literature review and theoretical framework
2.1 The roles of top management team, board of directors and supervisory boards (MBS) play in innovation
Under the company law of People's Republic of China (PRC), Chinese listed firms are required to adopt a two-tier board structure, consisting of a board of directors and a supervisory board (Dahya et al., 2002). Both parties play important roles in effective monitoring of the company. The board of directors can be recognised as a decision-making unit, which exercise its power in various matters related to firm’s financial and economic arrangement, including determine financial budget, operation and investment plans. The supervisory board, on the other hand, is a monitoring device, with a main function of supervising senior managers and the board of directors. This corporate governance is markedly different from Anglo- American unitary board model (Dahya et al., 2002).
A number of studies highlight the significant roles that the board of directors play in enhancing innovation performance. The board can set the tone of innovative thinking and encourage innovation by creating a climate conducive to innovation (Daft, 1978). Both resource dependency theory and agency theory provide the framework of understanding board roles in facilitating and supporting firm innovation. According to resource dependency theory, boards can bring different needed resource, such as external relations and innovation expertise, to boost firm innovation performance (Pfeffer and Salancilk, 1978). The human capital (i.e. experience and expertise) and relational capital (networks) of the board of directors not only advice and counsel managers’ R&D decision making but also help managers identify future R&D opportunities, thus gives rise to high innovation performance and efficiency. Agency theory, on the other hand, highlights the monitoring role of the board in improving innovation. Board of directors bears the responsibilities of monitoring managers’ innovation activities and ensure firms generate new and innovative ideas and secure resources needed for the implementation of innovations (Wu and Lee, 2007; Jaskyte, 2012). Innovative activities demand a high level of specialized knowledge, expertise and market oversight of top management team and board of directors. Unlike other types of investment, the returns to innovation projects are relatively uncertain, thus, it is difficult to accurately assess the expected return of innovative projects. As a result, the board of directors are required to have exceptional skills and knowledge in advising and monitoring managers in terms of innovation and in increasing firms’ innovation performance. Consistent with this view, previous studies find that certain board features (including board tenure, outside directors) are associated with innovation performance (Coles et al., 2008; Jaskyte, 2012; Balsmeier et al., 2014).
The upper echelons theory suggests that organizational outcome is partially predicted by managerial characteristics of top management team (Hambrick and Mason, 1984). Top managers as organizational leaders may determine firms’ innovation culture, through positively influencing R&D workers’ motivation and job satisfaction, encouraging and rewarding innovation activities, eventually leading to high innovation performance (Damanpour and Schneider, 2006; Elenkov et al., 2005). In addition, top management team determines the level of attention (Bonner, 2002) and the degree of inputs devoted to individual innovation project (Song and Parry, 1996). They set overall strategic directions for innovation, select innovation project portfolio composition and

5
assign resources to innovation projects (Talke et al., 2010). Previous studies document that the composition of top management could directly affect innovation strategy and thus influences innovation outcomes (Hambrick and Mason, 1984, Bantel and Jackson, 1989; Damanpour and Schneider, 2008; Talke et al., 2010). Therefore, top management team is one of the important drivers of firms’ innovation performance (Cooper and Klenschmidt, 1995).
Since top management team and board of directors are closely related to firm innovation, in this study, we specifically investigate job hopping of MBS and R&D efficiency.
2.2 Job-hopping and innovation
Theoretically speaking, labour mobility generates extended networks which enhance knowledge flows between companies. Specifically, the knowledge-based view of innovation indicates that firms’ ability to produce innovation depends on how it recombines its initially separate knowledge and generates new knowledge through a learning process (Kogut and Zander, 1992). This process is contingent on both firms’ current (internal) knowledge and acquired (external) knowledge (Kogut and Zander, 1992). In this regard, knowledge transfer resulting from job hopping (external knowledge) constitutes an important source of innovation. Previous studies suggest that firms that exploit the knowledge and skills brought by the new employees are found to have an increased productivity, more types of new products and higher R&D outputs (Zhang et al., 2003; Balsvik, 2011; Ejsing et al., 2013; Kaiser et al., 2015). A portion of a firm’s knowledge is embodied in the workers, and the knowledge cannot retain within the firms if the employee leaves. Generally, employees are free to quit and take up a new job at will, and they can take some of their knowledge developed at the previous employer and apply it to the new company (Agarwal et al., 2004; Campbell et al., 2012). This acquired knowledge could help firms innovate by combining it with firms’ current knowledge.
Many scholars highlight the potential harm to firms whose employees leave to join or form rival firms (Campbell et al., 2012; Wezel et al., 2006). Such firms lose valuable human capital while their rivals gain valuable knowledge from job-hoppers. Therefore, worker mobility can be regarded as knowledge spillovers between firms (Dosi, 1988; Arrow, 1962; Song et al., 2003), leading to high innovation performance. R&D projects are knowledge-based investments, it demands talented personnel (Zingales, 2000). Knowledge spillovers due to job hopping can spur innovation by expropriating the experience and skills of newly recruited employees in developing innovative projects and fertilize different innovative ideas (Ganco et al., 2014). A number of studies indicate that worker mobility or labour turnover increases innovation performance (Saxenian, 1994; Almeida and Kogut, 1999; Fallick et al., 2006; Hoisl, 2006; Ejsing et al., 2013; Kaiser et al., 2015). For instance, Saxenian (1994) point out the importance of knowledge spillover due to job-hopping in regional innovation performance. She indicates that change of jobs leads to rapid knowledge dissemination and fertilization of ideas, which enhanced innovation in the Silicon Valley. Consistent with this view, Kaiser et al. (2015) find that workers join from patent-active firms increases firms’ number of patent applications, indicating that mobile workers affect firms’ patenting activities. Ejsing et al. (2013) find that new joiners contribute more than long-term employees to innovation activity, proxied by the number of patents. Similarly, Hoisl (2006) show that mobile inventors are more productive than non-movers, in terms of making patent applications.

6
Taken together, we argue that job-hopping provides a channel through which firms could acquire valuable knowledge and human capital from other firms, resulting in high R&D efficiency. Given the important role top management team and board of directors play in firm innovation, we propose that MBS with more job-hopping experience in the past is associated with higher R&D efficiency.
3. Method
3.1 Data
This study pools together data from two main sources - CSMAR and WIND database. Job hopping data was extracted from managers and directors’ resumes from CSMAR database. R&D efficiency data was obtained from both CSMAR and WIND database. Data related to firm characteristics and corporate governance were obtained from both CSMAR and WIND database. Our initial sample consisted of all listed A-share companies in the Shenzhen Stock Exchange and Shanghai Stock Exchange between 2014 3 and 2016. The sum of capitalization of the two exchanges was approximately RMB 20 trillion in 20144. We begin with listed firms that have available R&D efficiency data (i.e. R&D spending, the number of R&D employees and capitalised R&D). Due to R&D efficiency data availability, our sample period is from 2014-2016. We then exclude firm-years with missing variables, resulting in 3870 firm-year observations, of 2247 firms, from 2014-2016.
3.2 Variable definitions
Dependent variable - R&D efficiency
Differs from previous studies, which often regard patents (for example number of patent applications) as a measure of innovation efficiency (Goto and Suzuki, 1989; Kaiser et al., 2015; Custodio et al., 2017), we employ data envelopment analysis (DEA) to estimate R&D efficiency. DEA is a statistical procedure used to value the relative efficiency of firms (Demerjian et al., 2012), which has been applied into accounting research to measure firm efficiency (see Demerjian et al., 2012). Adopting DEA to estimate R&D efficiency brings more accurate estimation as it considers the direct inputs and outputs of R&D. To generate R&D efficiency using DEA, we use a number of R&D employees and R&D expenditure as inputs of firm innovation, as firms invest both money and labour into R&D activities (Griliches, 1980; Goto and Suzuki, 1989) A number of R&D employees and the amount of R&D expenditure represents the inputs. The amount of capitalised R&D investment expense is the output of firm innovation, which measures how much firms converted R&D expense into capital/assets.
Specifically, we solve the following optimization problem:
&
& &
3 We start from year 2014 due to data availability, firms start to disclose R&D efficiency related data from 2014. 4 China Securities Regulatory Commission: http://www.csrc.gov.cn.

7
Independent variable - Job-hopping index
This study investigates the past job-hopping experience of MBS. We code job hopping data based on the resumes of MBS obtained from CSMAR database. We identified three types of job-hopping, namely: firm-level mobility (MBS switch firms), position-level mobility (MBS switch positions) and function-level5 mobility (MBS switch functions). Accordingly, we create the following variables related to the past job-hopping experience of MBS: JHFIRM, the average number of firms that MBS previously worked. JHPOSI, the average number of positions that MBS previously worked, JHFUNC, the average number of functions that MBS previously worked.
We obtain JHI (job hopping index) by taking the first principal component6 of the three job-hopping variables: JHFIRM, JHPOSI and JHFUNC. Principal component analysis (PCA) effectively performs a singular value decomposition of the job-hopping variables. The single factor selected in this study is the factor with an eigenvalue greater than 1 (the factor with the highest eigenvalue). The main advantage of PCA is that we do not need to subjectively eliminate any variables or make subjective judgements in relation to the relative importance of the variables (Tetlock, 2007). A PCA-based index produces less measurement error than any individual variable or constructed indices (Larcker et al., 2007).
Controls
We control a number of firm characteristics that may affect firms’ R&D performance. Consistent with prior literature (Custodio et al., 2017; Girma et al., 2009), we control firm size, measured as the natural logarithm of total assets (lnTA). Capital intensity is proxied by the natural logarithm of the ratio of net PPE to the number of employees (CAPINTEN), leverage ratio (LEV: total liabilities deflated by total assets), market to book ratio (MTB), capital expenditure measured as capital expenditure deflated by total assets (CAPEXP). Firm age (AGE), ownership concentration (INDUSCON), number of industry and geographical segments (INSEG and GEOSEG), state-owned enterprise (SOE), government funding (GRANT) and political connection (POLI) (Wallsten, 2000; Hovey et al., 2003; Gorg and Strobl, 2007; Doh and Kim, 2014; Guan and Yam, 2015; Li et al., 2015).
4. Results
4.1 Descriptive statistics
Table 1 shows descriptive statistics of R&D efficiency generated using DEA, job-hopping variables and control variables used in our regression for all sample firms. Detailed variable definitions are presented in the appendix. The table shows that on average, our R&D efficiency has a figure of 0.10, with a minimum of 0 and a maximum of 1. In relation to past job-hopping
5 In CSMAR database, it classifies function into nine categories, namely production, R&D, design, human resource, management, marketing, finance, accounting and law. 6 Appendix 2 shows the correlation among JHFIRM, JFPOSI and JHFUNC, the results show that these variables are highly correlated with each other, indicating the appropriateness of using PCA.
8
experience (JHI), we find that on average, MBS have changed 1.37 firms, 2.12 positions and 1.90 functions before joining their current company.
4.2 Main results - MBS job-hopping and R&D efficiency
Our main hypothesis is firms that have MBS with high level of past job-hopping experience enhance their current firms’ R&D efficiency. We test this by estimating the following model in Table 2:
, , , ,
We run baseline OLS regressions with robust standard errors to account for issues of normality and heteroskedasticity. Table 2 represents the OLS regression results of the effect of the past job-hopping experience of MBS on firms R&D efficiency. The result shows a positive and significant association between JHI and RDefficiency, indicating that MBS’ past job-hopping experience significantly increase their firms’ innovation efficiency. In Column (1), we only include the JHI as the independent variable and control for year and industry fixed effects. the coefficient on JHI is 0.024 and is significant at the 1% level. In column (2), we add a set of control variables that could potentially affect firms’ innovation performance. The coefficient on the JHI is 0.036, and its significance still remains at 1% level.
4.3 Additional test
4.3.1 Instrumental approach
OLS technique is appropriate only if there are no potential endogeneity issues. First, intuitively, it is very unlikely that managers and directors’ mobility are driven by R&D efficiency. Therefore, reverse causality if not a problem in our study. Notwithstanding, endogeneity may be possible if there are unobservable underlying factors are correlated with both our independent and dependent variable. To address for this potential endogeneity, we first apply for an instrumental variable approach. We adopted the Lewbel 2SLS approach, which used internally generated instruments, to deal with omitted variable bias. The Lewbel 2SLS estimation techniques is efficient in dealing with endogeneity in the absence of instrumental variables (Emran and Shilpi, 2012; Mishra and Smyt, 2015; Churchill et al., 2017).
Table 3 display the results of using the Lewbel 2SLS estimation. We find that OLS and 2SLS results are consistent. The coefficient of JHI is 0.038 at a significance level of 5%, indicating that MBS’s past job-hopping experience significantly increase firms’ R&D efficiency. At the bottom of Table 3, we report results for three postestimation test7. The results show that the internally generated instruments satisfy the conditions of exogeneity and relevance, thus, our instruments are valid.
7 In addition, we did additional tests to test the validity of the internally generated instrument. Anderson LM test (under identification test) show that the model is identified, and Sargan statistic (over-identification test) is insignificant, indicating that the null hypothesis of the instrument is exogenous (unrelated with the error terms), can not be rejected. Therefore, these tests show that our internally generated instrument satisfy the conditions of exogeneity and relevance, thus, our Lewbel 2SLS results are valid.

9
4.3.2 Propensity score matching
To control for potential endogeneity raised by non-random selection concerns (Rosenbaum and Rubin, 1983), we rerun our test using a matched-sample design. We first estimate the propensity scores using a probit model in which the independent variables are the full set of firm characteristics as defined in column 2 of Table 2. The dependent variable is an indicator that takes the value of 1 for firms with a high JHI (firm’s JHI above the median of JHI of the full sample firms), and 0 otherwise. That is, we identify the median of JHI of the full sample, and further classify firms into two categories, high JHI firms (firms with JHI above the median) and low JHI firms (firms with JHI below the median). We then use the predicted score from the probit regression to match each firm-year observation with a high JHI to the firm-year observation with a low JHI.
Table 4 panel A results report the univariate comparisons of the firm characteristics between firms with high JHI and firms with low JHI. The univariate test shows that most of the difference is trivial, and are not significantly different, indicating that each pair of matched samples formed by PSM is virtually no different from each other, except for the job-hopping index.
Panel B of Table 4 reports the results of regression analysis using the matched sample, which show that JHI is significantly and positively related to R&D efficiency, which is consistent with our OLS and 2SLS result, indicating our results are robust
4.3.3 Additional analysis
Certification of High and New Technology Enterprise (HNTE)
As discussed in Section 1, Chinese government introduces multiple initiatives (fiscal incentives and financial policies) to encourage firm innovation (Ding & Li, 2015). Among governmental stimuli, certification of HNTE arguably is the most important one. For example, firms certified as HNTEs can use lower tax rate at 15%, rather than 25% (Ding & Li, 2015). Holders of HNTE certification are publicly disclosed on a website maintained by the Minister of Science8. Thus, merging list of certification holders manually collected from this website with other data, this study investigates differences between firms with certification and firms without. Results are presented in Column 1 and 2 in Table 5. Column 1shows: firms certified as HNTEs relate to more expenditures on R&D activities (β = 0.026, p < 0.01). This finding is largely expected, as certification of HNTE requires its holders to heavily invest on R&D activities9 (Fang, Lerner, Wu, & Zhang, 2018). Column 2 shows: whether firms are certified does not significantly relate to R&D efficiency. This study interprets it as that firms certified as HNTEs do not use R&D resources more efficiently than firms without certification. From view of practical implications, this finding may be disturbing. As discussed in Ding and Li (2015), firms with certification of HNTE enjoy different types of governmental subsidies. Thus, it is reasonable to demand: they use R&D resources (which include governmental subsidies) wisely and efficiently. Finding of this study suggests this is not the case.
8 See http://www.innocom.gov.cn/gxjsqyrdw/index.shtml, and the access date is 23 November 2018. 9 Who can receive certification of HNTE is determined by the Minister of Science. Requirements for HNTE certification holders can be found on http://www.innocom.gov.cn/, and access date is 22 November 2018.
10
R&D Intensity at Provincial Level
The Chinese National Bureau of Statistics discloses R&D intensity at provincial level10 in each year. This study argues that a province with greater R&D intensity tends to have socio-political environment that more supports R&D activities. Firms in socio-political environment that more supports innovation are expected to have higher innovation efficiency. Column 3 of Table 5 report our findings. The result shows that firms located in provinces with greater intensity significantly relate to higher efficiency (β = 0.007, p < 0.01).
In addition, we test whether socio-political environment of innovation could affect the relationship between job-hopping experience of executives, directors and supervisors and R&D efficiency. To test the relationship, we employ an interaction term of JHI and RD intensity (RDintensity*JHI). The results are shown in Column 4 of Table 5. We find that the interaction of JHI and RD intensity is positively and significantly related to R&D efficiency, showing that R&D intensity at provincial level strengthens relation between job-hopping experience of executives, directors and supervisors and R&D efficiency (β = 0.038, p < 0.05). From view of practical implications, this study suggests: R&D efficiency and effects of job-hopping on efficiency can be improved by improving the socio-political environment of innovation.
Lag analysis
We check for the issue of endogeneity by performing a lag analysis, regressing current year’s innovation efficiency on the previous years’ control variables (Hoitash et al., 2009). We find that lag analysis still show that job hopping is positively and significantly related to innovation efficiency (results shown in Table 6).
Alternative measure of R&D efficiency
Following previous studies (Hong et al., 2016), we use the number of patent applications in the current year as an alternative measure of innovation efficiency. The result presents in column 1 of Table 7. We find that job hopping is positively and significantly related to the number of patents applications in the current year, which indicates the robustness of our results.
In addition, we use a R&D efficiency ratio developed by Fang et al. (2018) and Hirshleifer et al. (2013) as an alternative measure of R&D efficiency, the ratio is computed using the formula below:
& , , / & , 0.8 ∗ & , 0.8 ∗ & ,
Where Patent i, t is firm i’s new applications filed in year t that were approved. R&Di,t-1, R&Di,t
and R&Di,t+1 are the R&D expenditures in millions of RMB during year t-1, t and t+1.
10 R&D intensity at provincial level is measured as R&D expenditure divided by GDP at provincial level. More information about this variable can be found on http://www.stats.gov.cn/tjsj/zxfb/201710/t20171009_1540386.html, and access date is 22 November 2018.
11
Column 2 of Table 7 reports the results using R&D efficiency ratio as an alternative proxy of R&D efficiency, we find our result remain constant, job-hopping index is associated with higher R&D efficiency ratio.
Other MBS characteristics.
Previous studies indicate that characteristics of MBS, such as experience and age, matters in spurring innovation (e.g. Custodio et al., 2017). In this study, we further control for a number of MBS characteristics, including tenure, gender, age and financial experience. Tenure represents the extent of company-specific skills or experience (Bilimoria and Piderit, 1994; Hogan and McPheters, 1980; Wulf and Singh, 2011). According to the expertise hypothesis, long-tenure indicates a high level of job-specific knowledge and experience, commitment, and competence about the firm and the firm’s business environment (Vafeas, 2003). Gender is the average percentage of female on MBS. Financial experience is the average percentage of MBS with financial experience. This study identifies MBS had financial experience if he/she currently or previously held any position related to finance, such as CFO, treasurer, and banker.
Table 8 present the results with additional control variables. We find that after controlling for additional MBS characteristics, our result remains quantitatively changed, job hopping index shows significant and positive relationship with R&D efficiency. In addition, MBS tenure is positively and significantly related to R&D efficiency, indicating that firm-specific human capital enhances firms R&D efficiency.
5. Conclusion
The influence of job hopping on R&D efficiency is relatively under-explored in accounting literature. In this paper, we shed new insights into the importance of job hopping in enhancing firms’ R&D efficiency. We find that a significant positive impact of past job hipping of top management team, board of directors and supervisory board on firms’ R&D efficiency.
Further analysis reveals the importance of R&D intensity in enhancing R&D efficiency. We find that firms located in the province with high R&D intensity tend to have high R&D efficiency. In addition, the results show that job hopping has a stronger positive relationship to R&D efficiency for firms located in the province with high R&D intensity. Contrary to our expectations, we find that although high and new technology enterprises (HNTEs) spend more on R&D, their R&D efficiency are not significant higher compared to firms without a certification of high and new technology. This result may indicate that firms certified as HNTEs do not use R&D resources more efficiently than firms without certification, which may provide some implications to Chinese regulators in enhancing R&D efficiency of HNTEs. Overall, our paper provides empirical evidence that past job hipping experience of top management team, board of directors and supervisory board is an important determinant of R&D efficiency.

12
References
Almeida, P., & Kogut, B. (1999). Localization of knowledge and the mobility of engineers in regional networks. Management science, 45(7), 905-917.
Arrow, K. J. (1962). The economic implications of learning by doing. The review of economic studies, 29(3), 155-173.
Balsmeier, B., Buchwald, A., & Stiebale, J. (2014). Outside directors on the board and innovative firm performance. Research Policy, 43(10), 1800-1815.
Balsvik, R. (2011). Is labor mobility a channel for spillovers from multinationals? Evidence from Norwegian manufacturing. The review of economics and statistics, 93(1), 285-297.
Bantel, K.A. and Jackson, S.E. (1989). Top management and innovations in banking—does the composition of the top team make a difference. Strategic Management Journal, 10, pp. 107-124
Bilimoria, D. and Piderit, S. K. (1994). Qualifications of corporate board committee members, Group and Organization Management, 19 (3), 334-362.
Bonner, J. (2002). Upper management control of new product development projects and project performance. Journal of Product Innovation Management, 19 (3), pp. 233-245
Campbell, B. A., Coff, R., & Kryscynski, D. (2012). Rethinking sustained competitive advantage from human capital. Academy of Management Review, 37(3), 376-395.
Churchill, S. A., Valenzuela, M. R. and Sablah, W. (2017). Ethnic diversity and firm performance: Evidence from China’s materials and industrial sectors. Empirical Economics, 53(4), 1711-1731
Cooper, R.G. and Kleinschmidt, E.J. (1995). Benchmarking for firm's critical success factors in new product development. Journal of Product Innovation Management, 12 (1995), pp. 374-391. Custódio, C., Ferreira, M. A. and Matos, P. (2017). Do general managerial skills spur innovation? Management Science.
Dahya, J., Karbhari, Y. and Xiao, J. Z. (2002). The supervisory board in Chinese listed companies: problems, causes, consequences and remedies. Asia Pacific business review, 9(2), 118-137.
Daft, R. L. (1978). A dual-core model of organizational innovation. Academy of management journal, 21(2), 193-210.
Damanpour, F., & Schneider, M. (2006). Phases of the adoption of innovation in organizations: effects of environment, organization and top managers 1. British journal of Management, 17(3), 215-236.
Demerjian, P., Lev, B., & McVay, S. (2012). Quantifying managerial ability: A new measure and validity tests. Management science, 58(7), 1229-1248.
Ding, X., & Li, J. (2015). Incentives for Innovation in China: Building an Innovative Economy. United States: Routledge.
13
Doh, S. & Kim, B. (2014). Government support for SME innovations in the regional industries: The case of government financial support program in South Korea. Research Policy, 43(9), 1557-1569.
Dong, X.Y., Xu, L.C. (2009). “Labor restructuring in China: Toward a functioning labor market”, in Journal of Comparative Economics, Vol. 37, No. 2, pp. 287–305.
Dosi, G. (1988). Sources, procedures, and microeconomic effects of innovation. Journal of economic literature, 1120-1171.
Du, y., Cai, F. and Wang, M. (2006), “Marketization and/or Informalization: New Trends of China’s Employment in Transition”, paper prepared for the WB Labor Markets Development Program.
Ejsing, A. K., Kaiser, U., Kongsted, H., & Laursen, K. (2013). The role of university scientist mobility for industrial innovation.
Elenkov, D. S., Judge, W., & Wright, P. (2005). Strategic leadership and executive innovation influence: an international multi-cluster comparative study. Strategic management journal, 26(7), 665-682.
Emran, M.S. and Shilpi, F. (2012) The extent of the market and stages of agricultural specialization. Can J Econ 45(3):1125–1153.
Fallick, B., Fleischman, C. A., & Rebitzer, J. B. (2006). Job-hopping in Silicon Valley: some evidence concerning the microfoundations of a high-technology cluster. The Review of Economics and Statistics, 88(3), 472-481.
Fang, L., Lerner, J., Wu, C., & Zhang, Q. (2018). Corruption, Government Subsidies, and Innovation: Evidence from China. NBER Working Paper Series. National Bureau of Economic Research. Cambridge, USA.
Fleisher, B. M., & Yang, D. T. (2006). Problems of China's rural labor markets and rural-urban migration. Chinese Economy, 39(3), 6-25.
Ganco, M., Ziedonis, R. H., & Agarwal, R. (2014). More stars stay, but the brightest ones still leave: Job hopping in the shadow of patent enforcement. Strategic Management Journal, 36(5), 659-685.
Guan, J., & Yam, R. C. (2015). Effects of government financial incentives on firms’ innovation performance in China: Evidences from Beijing in the 1990s. Research Policy, 44(1), 273-282.
Girma, S., Gong, Y., & Görg, H. (2009). What determines innovation activity in Chinese state-owned enterprises? The role of foreign direct investment. World Development, 37(4), 866-873.
Griliches, Z. (1980). R&D and the productivity slowdown. American Economic review, 343-348
Görg, H., & Strobl, E. (2007). The effect of R&D subsidies on private R&D. Economica, 74(294), 215-234.
Goto, A., & Suzuki, K. (1989). R & D capital, rate of return on R & D investment and spillover of R & D in Japanese manufacturing industries. The Review of Economics and Statistics, 555-564.
14
Hambrick, D.C. and Mason, P.A. (1984). Upper echelons—the organization as a reflection of its top managers. Academy of Management Review, 9 (2), pp. 193-206
Hirshleifer, D., Hsu, P.H. and Li, D.M. (2013), Innovative Efficiency and Stock Returns, Journal of Financial Economics 107, 632-654.
Hoisl, K. (2007). Tracing mobile inventors—the causality between inventor mobility and inventor productivity. In A Study of Inventors (pp. 65-119). Deutscher Universitätsverlag, Wiesbaden.
Hoitash, U., Hoitash, R., & Bedard, J. C. (2009). Corporate governance and internal control over financial reporting: A comparison of regulatory regimes. The Accounting Review, 84(3): 839–867.
Hogan, T. D., and McPheters, L. R. (1980). Executive compensation: performance versus personal characteristics, Southern Economic Journal, 46(4), 1060-1068.
Hong, J., Feng, B., Wu, Y., & Wang, L. (2016). Do government grants promote innovation efficiency in China's high-tech industries?. Technovation, 57, 4-13.
Hovey, M., Li, L., & Naughton, T. (2003). The relationship between valuation and ownership of listed firms in China. Corporate Governance: An International Review, 11(2), 112-122.
Jaskyte, K. (2012). Boards of directors and innovation in nonprofit organizations. Nonprofit Management and Leadership, 22(4), 439-459.
Kaiser, U., Kongsted, H. C., & Rønde, T. (2015). Does the mobility of R&D labor increase innovation?. Journal of Economic Behavior & Organization, 110, 91-105.
Kogut, B., & Zander, U. (1992). Knowledge of the firm, combinative capabilities, and the replication of technology. Organization science, 3(3), 383-397.
Larcker, D. F., Richardson, S. A., & Tuna, I. (2007). Corporate governance, accounting outcomes, and organizational performance. The accounting review, 82(4), 963-1008.
Lewbel, A. (2012). Using heteroscedasticity to identify and estimate mismeasured and endogenous regressor models. J Bus Econ Stat 30(1):67–80
Li, S., Song, X., & Wu, H. (2015). Political connection, ownership structure, and corporate philanthropy in China: A strategic-political perspective. Journal of Business Ethics, 129(2), 399-411.
Mishra, V., Smyth, R. (2015). Estimating returns to schooling in urban China using conventional and heteroskedasticity-based instruments. Econ Model , 47:166–173
Pfeffer, J., & Gerald, R. (81). Salancik. 1978. The external control of organizations: A resource dependence perspective.
Saxenian, A. (1994). Regional networks: industrial adaptation in Silicon Valley and route 128.
Song, Y. (2017). Six central features of the Chinese labour market: A literature survey. International Labour Review, 156(2), 213-242.
15
Song, X.M. and Parry, M.E. (1996). What separates Japanese new product winners from losers. Journal of Product Innovation Management, 13 (5), pp. 422-439 Talke, K., Salomo, S., & Rost, K. (2010). How top management team diversity affects innovativeness and performance via the strategic choice to focus on innovation fields. Research Policy, 39(7), 907-918.
Vafeas, N. (2003). Length of board tenure and outside director independence, Journal of Business Finance and Accounting, 30 (7/8), 1043-1064.
Wallsten, S. J. (2000). The effects of government-industry R&D programs on private R&D: the case of the Small Business Innovation Research program. The RAND Journal of Economics, 82-100.
Wezel, F. C., Cattani, G., & Pennings, J. M. (2006). Competitive implications of interfirm mobility. Organization Science, 17(6), 691-709.
Wu, H. L. and Lee, C. (2007). “The Effects of Board Competence on Operational Innovation: Tests of Universal, Contingency, and Configuration Models.” International Journal of Technology Management, 39(3/4), 330–343
Wulf, J. and Singh, H. (2011). How do acquirers retain successful target CEOs? The role of governance. Management Science, 57(12), 2101-2114.
Zhang, A., Zhang, Y., & Zhao, R. (2003). A study of the R&D efficiency and productivity of Chinese firms. Journal of Comparative Economics, 31(3), 444-464.
Zingales, L. (2000). In search of new foundations. The journal of Finance, 55(4), 1623-1653.
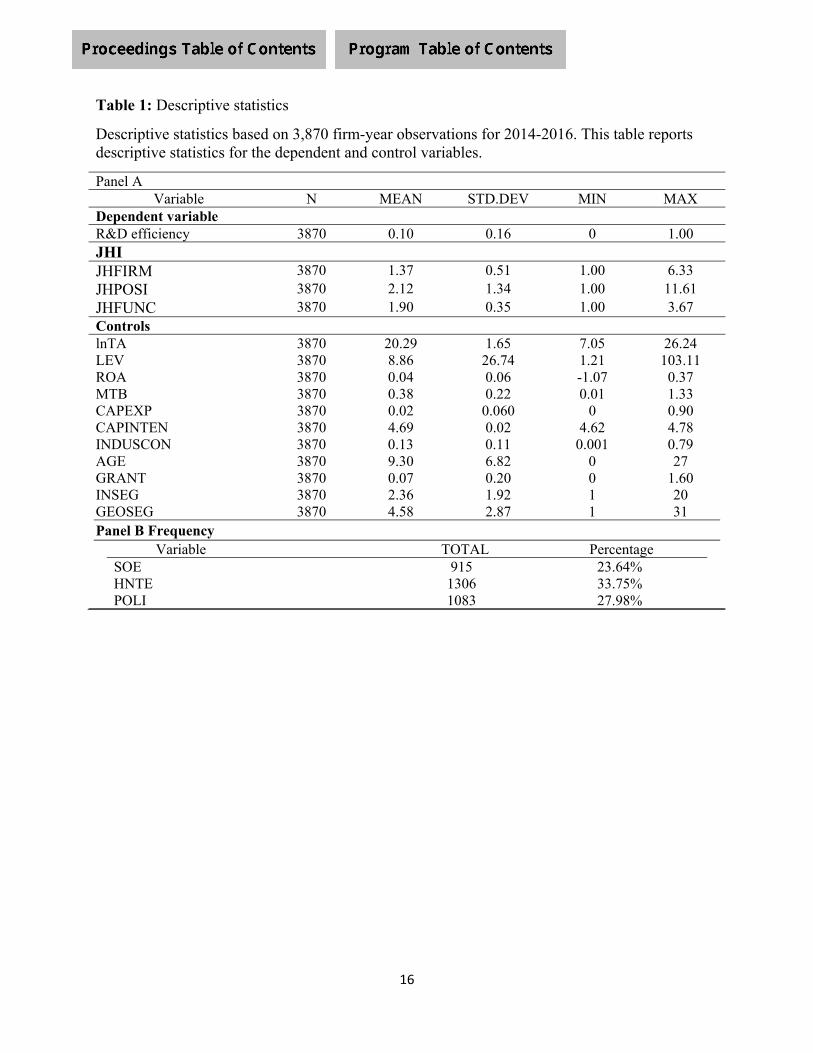
16
Table 1: Descriptive statistics
Descriptive statistics based on 3,870 firm-year observations for 2014-2016. This table reports descriptive statistics for the dependent and control variables.
Panel A Variable N MEAN STD.DEV MIN MAX
Dependent variable R&D efficiency 3870 0.10 0.16 0 1.00 JHI
JHFIRM 3870 1.37 0.51 1.00 6.33 JHPOSI 3870 2.12 1.34 1.00 11.61 JHFUNC 3870 1.90 0.35 1.00 3.67 Controls lnTA 3870 20.29 1.65 7.05 26.24 LEV 3870 8.86 26.74 1.21 103.11 ROA 3870 0.04 0.06 -1.07 0.37 MTB 3870 0.38 0.22 0.01 1.33 CAPEXP 3870 0.02 0.060 0 0.90 CAPINTEN 3870 4.69 0.02 4.62 4.78 INDUSCON 3870 0.13 0.11 0.001 0.79 AGE 3870 9.30 6.82 0 27 GRANT 3870 0.07 0.20 0 1.60 INSEG 3870 2.36 1.92 1 20 GEOSEG 3870 4.58 2.87 1 31 Panel B Frequency
Variable TOTAL Percentage SOE 915 23.64% HNTE 1306 33.75% POLI 1083 27.98%

17
Table 2.
Job-hopping index and R&D efficiency. This table reports the impact of job-hopping index (JHI) on R&D efficiency. All other variables are defined in the Appendix. The model is estimated using OLS regression with robust estimation to account for issues of normality and heteroskedasticity. t-statistics for each coefficient are in parentheses, where *, ** and *** indicate significance at the 0.10, 0.05 and 0.01 levels, respectively.
(1) (2) DV: R&D efficiency DV: R&D efficiency JHI 0.024
(3.75)*** 0.036
(3.76)*** lnTA
0.038 (7.36)***
LEV -0.091 (-6.16)***
ROA
0.065 (5.53)***
MTB 0.242 (4.83)***
CAPINTEN 0.168 (1.11)
INDUSCON -0.001 (-0.72)
CAPEXP 0.002 (1.45)
Age 0.001 (2.49)**
POLI
0.011 (0.69)
INSEG 0.001 (0.49) GEOSEG
0.003 (2.17)**
SOE
0.011 (1.02)
GRANT
0.005 (1.65)**
CONS 0.039 (3.95)***
-2.091 (-2.86)***
Year FE YES YES Industry FE YES YES Observations 3870 3870 Adjusted R2 0.01 0.10
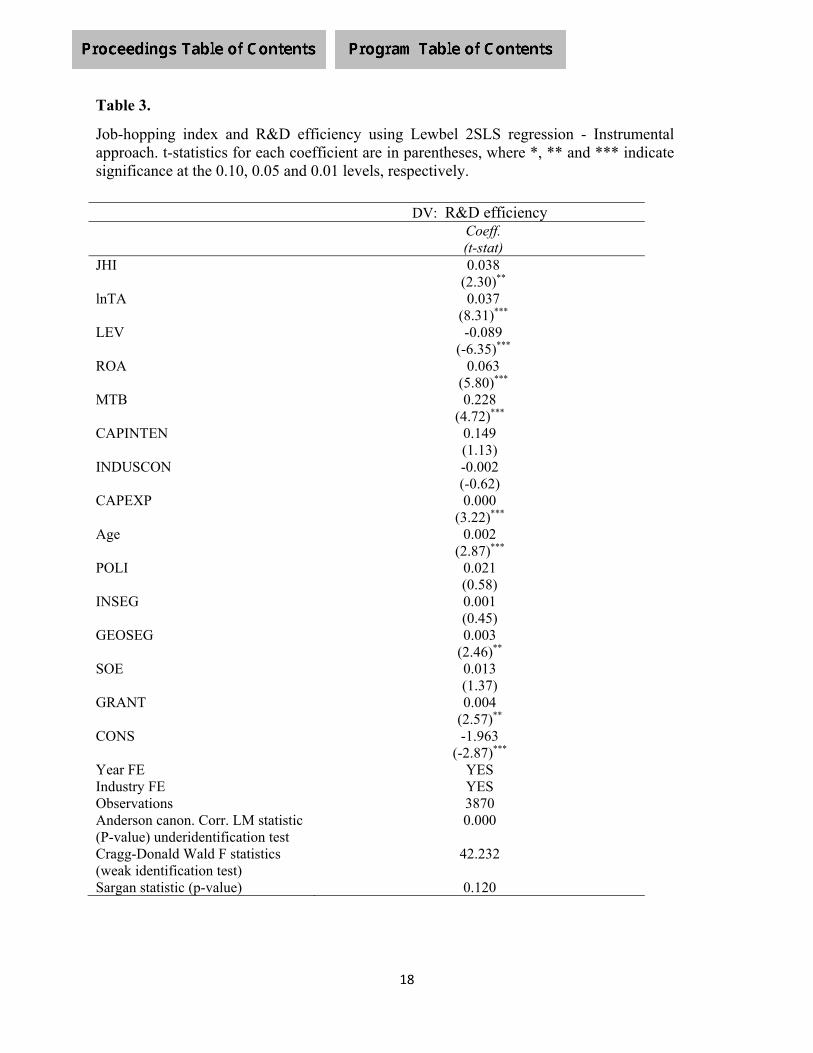
18
Table 3.
Job-hopping index and R&D efficiency using Lewbel 2SLS regression - Instrumental approach. t-statistics for each coefficient are in parentheses, where *, ** and *** indicate significance at the 0.10, 0.05 and 0.01 levels, respectively.
DV: R&D efficiency Coeff.
(t-stat) JHI 0.038
(2.30)** lnTA
0.037 (8.31)***
LEV -0.089 (-6.35)***
ROA
0.063 (5.80)***
MTB 0.228 (4.72)***
CAPINTEN 0.149 (1.13)
INDUSCON -0.002 (-0.62)
CAPEXP 0.000 (3.22)***
Age 0.002 (2.87)***
POLI
0.021 (0.58)
INSEG 0.001 (0.45) GEOSEG
0.003 (2.46)**
SOE
0.013 (1.37)
GRANT
0.004 (2.57)**
CONS -1.963 (-2.87)***
Year FE YES Industry FE YES Observations 3870 Anderson canon. Corr. LM statistic (P-value) underidentification test
0.000
Cragg-Donald Wald F statistics (weak identification test)
42.232
Sargan statistic (p-value) 0.120

19
Table 4. Propensity score matching – matched by job hopping dummy
Job-hopping index and R&D efficiency: propensity score matched sample. Panel A of this table shows the results of propensity-matched variables when dependent variable is R&D efficiency. Panel B presents the regression results of the impact of impact of job-hopping index (JHI) on R&D efficiency, using the matched samples. All variables are defined in the Appendix. All specifications control for year and industry fixed effects. Standard errors are corrected for clustering by firm.t-statistics for each coefficient are in parentheses, where *, ** and *** indicate significance at the 0.10, 0.05 and 0.01 levels, respectively.
Panel A: Propensity-matched variables Treated (firm’s JHI
is above the mean of JHI of the full
sample)
Controlled (firm’s JHI is below the mean of JHI
of the full sample)
t-stat P-value
lnTA 20.28 20.34 -0.95 0.343 LEV -0.64 -0.64 -0.19 0.847 ROA 0.04 0.04 0.65 0.517 MTB 0.35 0.34 1.10 0.271 CAPINTEN 4.70 4.70 0.25 0.803 INDUSCON 6.19 6.33 -0.51 0.612 CAPEXP 0.63 0.92 -0.70 0.484 Age 9.40 9.46 -0.25 0.801 POLI 0.04 0.04 -0.28 0.782 INSEG 2.37 2.46 -1.30 0.193 GEOSEG 4.65 4.58 0.59 0.553 SOE 0.20 0.20 0.24 0.813 GRANT 0.08 0.08 0.29 0.773 Panel B: PSM regression DV: RD efficiency JHI
0.054 (2.38)**
CONS
-2.378 (-2.82)***
Controls included YES Year FE YES Industry FE YES Observations 1913 Adjusted R2 0.06

20
Table 5. Certification of High and New Technology Enterprise (HNTE), R&D intensity and R&D efficiency. This table reports the impact of job hopping on R&D efficiency. All other variables are defined in the Appendix. The model is estimated using OLS regression with robust estimation to account for issues of normality and heteroskedasticity. t-statistics for each coefficient are in parentheses, where *, ** and *** indicate significance at the 0.10, 0.05 and 0.01 levels, respectively.
(1) (2) (3) (4) DV: R&D
expenditure DV: R&D efficiency
DV: R&D efficiency
DV: R&D efficiency
Coeff. (t-stat)
Coeff. (t-stat)
Coeff. (t-stat)
Coeff. (t-stat)
RDintensity
- - 0.007 (2.79)***
0.075 (2.54)**
RDintensity_ JHI
- - - 0.038 (2.03)**
HNTE
0.026 (2.82)***
0.001 (0.22)
- -
JHI -
- - 0.004 (0.02)
lnTA
0.018 (3.00)***
0.035 (8.44)***
0.035 (8.41)***
0.038 (8.57)***
LEV -0.103 (-5.55)***
-0.077 (-6.19)***
-0.076 (-6.10)***
-0.092 (-6.48)***
ROA
0.073 (4.83)***
0.061 (5.90)***
0.064 (6.13)***
0.064 (5.91)***
MTB 0.682 (10.59)***
0.217 (4.89)***
0.218 (4.92)***
0.249 (5.38)***
CAPINTEN 0.478 (2.41)**
0.094 (0.69)
0.101 (0.75)
0.128 (0.90)
INDUSCON -0.00 (-0.53)
-0.000 (-0.62)
-0.000 (-0.52)
-0.000 (-0.51)
CAPEXP 0.000 (2.29)**
0.000 (2.20)**
0.000 (4.13)***
0.000 (3.32)***
Age 0.004 (5.15)***
0.002 (2.16)***
0.002 (3.19)***
0.002 (2.88)***
POLI
-0.040 (-1.92)*
0.009 (0.61)
0.012 (0.08)
0.010 (0.65)
INSEG -0.015 0.001 0.001 0.001 (-6.00)*** (0.52) (0.37) (0.52) GEOSEG
-0.003 (-1.98)**
0.002 (2.15)**
0.002 (2.18)**
0.003 (2.27)**
SOE
-0.023 (-1.74)*
0.010 (1.12)
0.008 (0.88)
0.010 (1.10)
GRANT
0.004 (1.54)
0.004 (1.81)*
0.005 (2.81)***
0.005 (2.62)***
CONS -5.268 (-5.56)***
-1.565 (-2.27)**
-1.622 (-2.50)**
-1.866 (-2.22)**
Year FE YES YES YES YES Industry FE YES YES YES YES Observations 3870 3870 3870 3870 Adjusted R2 0.19 0.05 0.06 0.07
21
Table 6.
Job-hopping index and R&D efficiency. This table reports the impact of job-hopping index (JHI) on R&D efficiency using lagged control variables. All other variables are defined in the Appendix. The model is estimated using OLS regression with robust estimation to account for issues of normality and heteroskedasticity. t-statistics for each
coefficient are in parentheses, where *, ** and *** indicate significance at th
e 0.10, 0.05 and 0.01 levels, respectively.
(2)

22
Table 7.
Alternative measures of R&D efficiency. In column 1, we use the number of patents applications in the current year as an alternative measure of R&D efficiency. Column 2 shows the results of using an RD efficiency ratio developed by Famg et al. (2018) and Hirshleifer et al. (2013) as an alternative measure of R&D efficiency: & , , / & , 0.8 ∗ & , 0.8 ∗ & ,
DV: R&D efficiency JHI 0.021
(1.98)**
lnTAt-1
0.048 (5.21)***
LEV t-1
-0.109 (-4.16)***
ROA t-1
0.070 (3.76)***
MTB t-1
0.405 (5.17)***
CAPINTEN t-1
0.124 (0.54)
INDUSCON t-1
-0.085 (-1.95)*
CAPEXP t-1
0.001 (2.19)**
Age t-1
0.002 (1.25)
POLI t-1
0.010 (0.54)
INSEG t-1 -0.002 (-0.45) GEOSEG t-1
0.003 (1.27)
GRANT t-1
0.003 (1.73)*
CONS -2.357 (-2.18)**
Year FE YES Industry FE YES Observations 3862 Adjusted R2 0.09
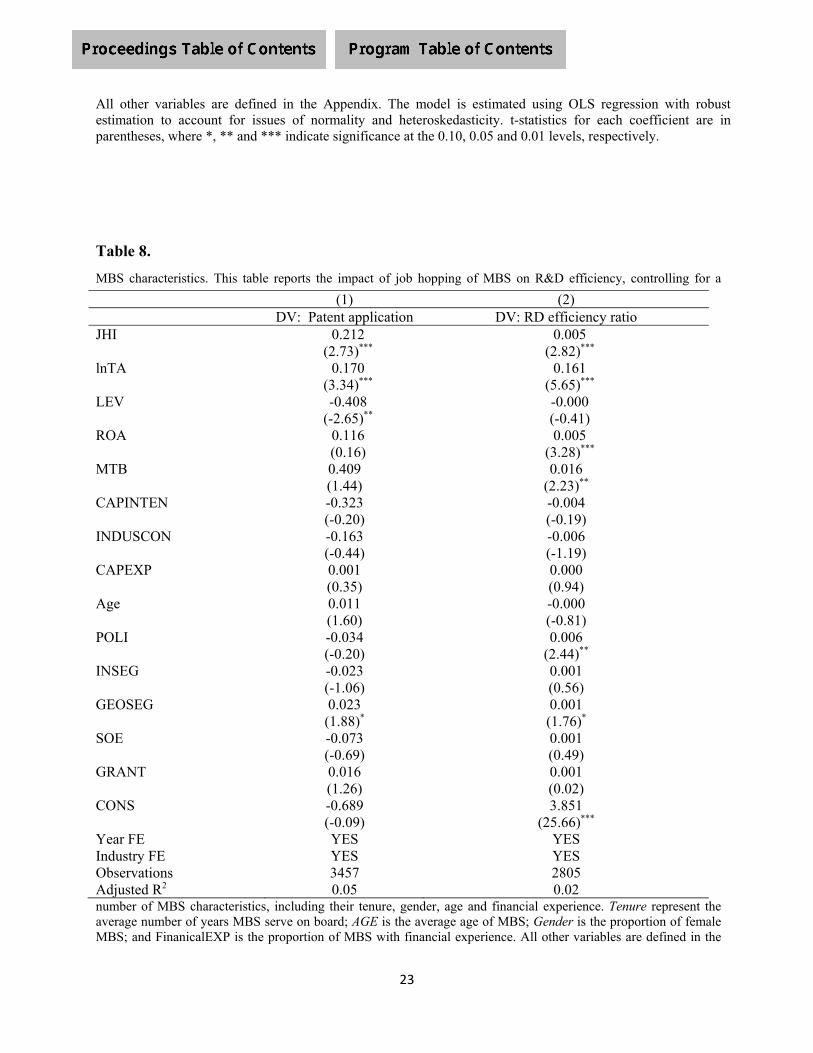
23
All other variables are defined in the Appendix. The model is estimated using OLS regression with robust estimation to account for issues of normality and heteroskedasticity. t-statistics for each coefficient are in parentheses, where *, ** and *** indicate significance at the 0.10, 0.05 and 0.01 levels, respectively.
Table 8.
MBS characteristics. This table reports the impact of job hopping of MBS on R&D efficiency, controlling for a
number of MBS characteristics, including their tenure, gender, age and financial experience. Tenure represent the average number of years MBS serve on board; AGE is the average age of MBS; Gender is the proportion of female MBS; and FinanicalEXP is the proportion of MBS with financial experience. All other variables are defined in the
(1) (2) DV: Patent application DV: RD efficiency ratio JHI 0.212
(2.73)*** 0.005
(2.82)*** lnTA
0.170 (3.34)***
0.161 (5.65)***
LEV -0.408 (-2.65)**
-0.000 (-0.41)
ROA
0.116 (0.16)
0.005 (3.28)***
MTB 0.409 (1.44)
0.016 (2.23)**
CAPINTEN -0.323 (-0.20)
-0.004 (-0.19)
INDUSCON -0.163 (-0.44)
-0.006 (-1.19)
CAPEXP 0.001 (0.35)
0.000 (0.94)
Age 0.011 (1.60)
-0.000 (-0.81)
POLI
-0.034 (-0.20)
0.006 (2.44)**
INSEG -0.023 0.001 (-1.06) (0.56) GEOSEG
0.023 (1.88)*
0.001 (1.76)*
SOE
-0.073 (-0.69)
0.001 (0.49)
GRANT
0.016 (1.26)
0.001 (0.02)
CONS -0.689 (-0.09)
3.851 (25.66)***
Year FE YES YES Industry FE YES YES Observations 3457 2805 Adjusted R2 0.05 0.02
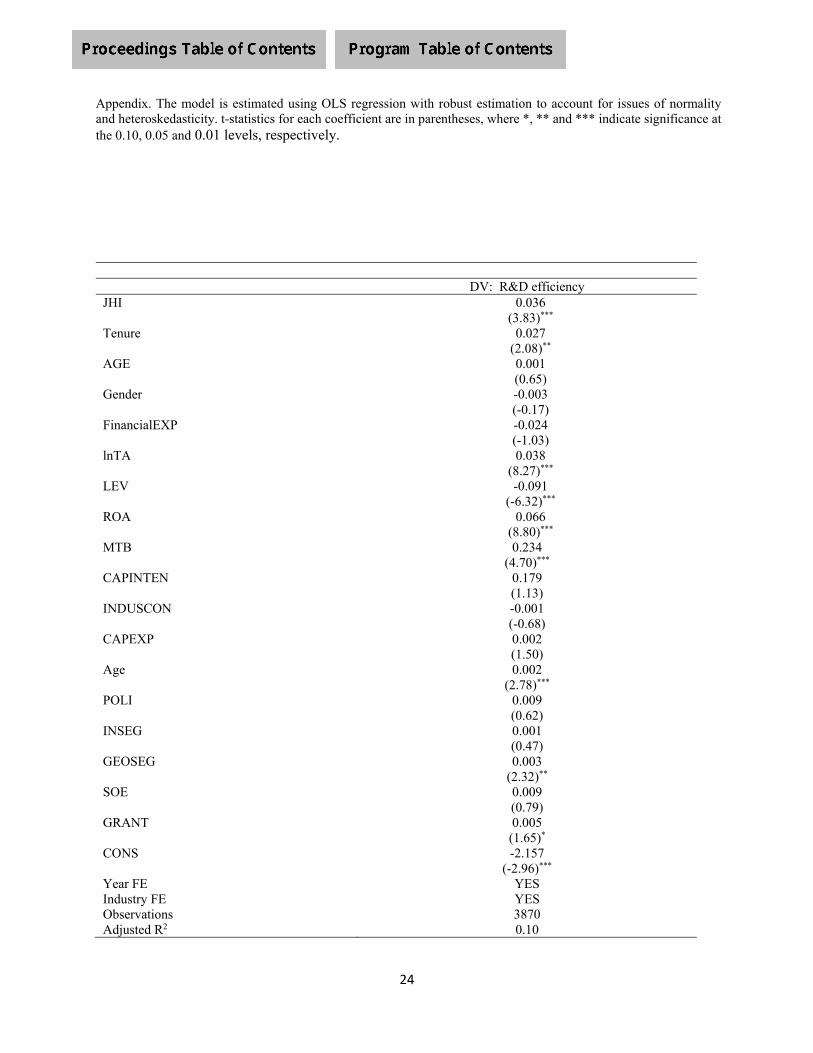
24
Appendix. The model is estimated using OLS regression with robust estimation to account for issues of normality and heteroskedasticity. t-statistics for each coefficient are in parentheses, where *, ** and *** indicate significance at the 0.10, 0.05 and 0.01 levels, respectively.
DV: R&D efficiency JHI 0.036
(3.83)*** Tenure
0.027 (2.08)**
AGE
0.001 (0.65)
Gender
-0.003 (-0.17)
FinancialEXP
-0.024 (-1.03)
lnTA
0.038 (8.27)***
LEV -0.091 (-6.32)***
ROA
0.066 (8.80)***
MTB 0.234 (4.70)***
CAPINTEN 0.179 (1.13)
INDUSCON -0.001 (-0.68)
CAPEXP 0.002 (1.50)
Age 0.002 (2.78)***
POLI
0.009 (0.62)
INSEG 0.001 (0.47) GEOSEG
0.003 (2.32)**
SOE
0.009 (0.79)
GRANT
0.005 (1.65)*
CONS -2.157 (-2.96)***
Year FE YES Industry FE YES Observations 3870 Adjusted R2 0.10
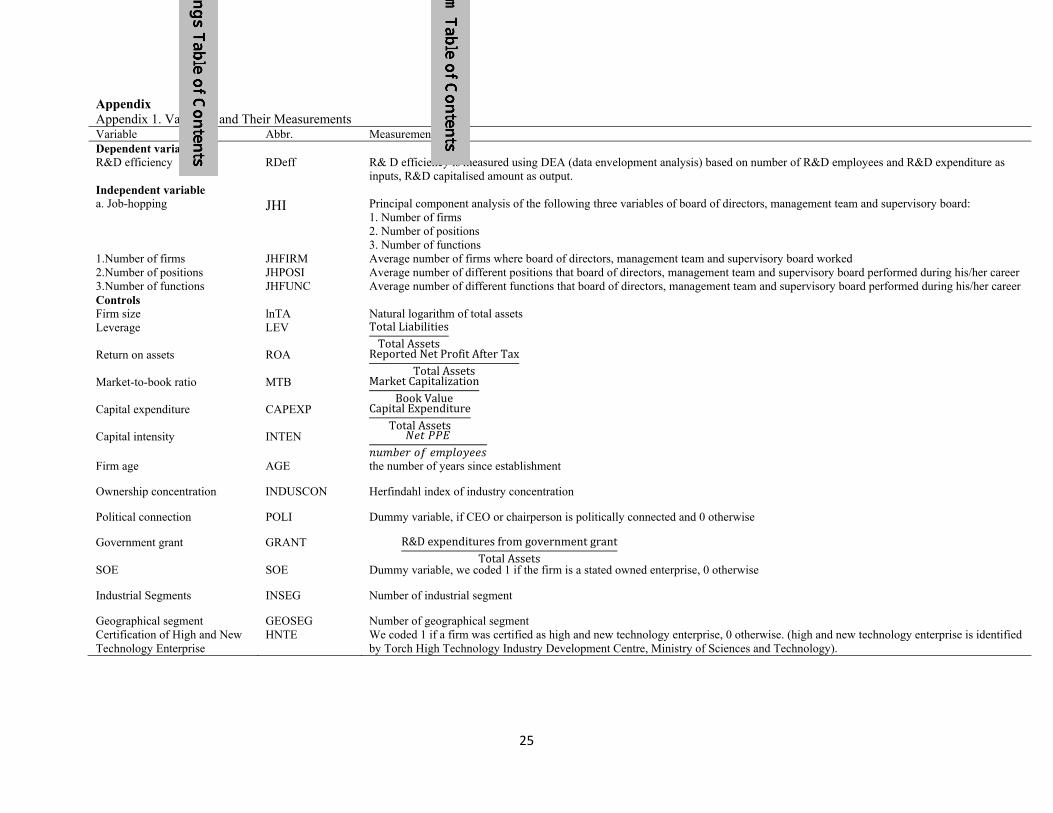
25
Appendix Appendix 1. Variables and Their Measurements Variable Abbr. Measurement Dependent variable R&D efficiency RDeff R& D efficiency is measured using DEA (data envelopment analysis) based on number of R&D employees and R&D expenditure as
inputs, R&D capitalised amount as output. Independent variable a. Job-hopping JHI Principal component analysis of the following three variables of board of directors, management team and supervisory board:
1. Number of firms 2. Number of positions
3. Number of functions 1.Number of firms JHFIRM Average number of firms where board of directors, management team and supervisory board worked 2.Number of positions JHPOSI Average number of different positions that board of directors, management team and supervisory board performed during his/her career 3.Number of functions JHFUNC Average number of different functions that board of directors, management team and supervisory board performed during his/her career Controls Firm size lnTA Natural logarithm of total assets Leverage LEV Total Liabilities
Total Assets
Return on assets ROA Reported Net Profit After TaxTotal Assets
Market-to-book ratio MTB Market CapitalizationBook Value
Capital expenditure CAPEXP Capital ExpenditureTotal Assets
Capital intensity INTEN
Firm age AGE the number of years since establishment
Ownership concentration INDUSCON Herfindahl index of industry concentration
Political connection POLI Dummy variable, if CEO or chairperson is politically connected and 0 otherwise
Government grant GRANT
R&D expenditures from government grantTotal Assets
SOE SOE Dummy variable, we coded 1 if the firm is a stated owned enterprise, 0 otherwise
Industrial Segments INSEG Number of industrial segment
Geographical segment GEOSEG Number of geographical segment Certification of High and New Technology Enterprise
HNTE
We coded 1 if a firm was certified as high and new technology enterprise, 0 otherwise. (high and new technology enterprise is identified by Torch High Technology Industry Development Centre, Ministry of Sciences and Technology).

26
Appendix 2. Correlation table
JHFIRM JHPOSI JHFUNC JHFIRM - JHPOSI 0.2370*** -
JHFUNC 0.1479*** 0.3326*** -
Appendix 3. Correlation table
Board JHI Supervisory JHI Management JHI Board JHI -
Supervisory JHI 0.4793*** - Management JHI 0.6302*** 0.5073*** -

1
DO BUSINESS GROUPS RAISE POST MERGER PERFORMANCE?
Kentaro Kaneko, Reiko Kashiwazaki, and Fumiko Takeda
Department of Technology Management for Innovation
University of Tokyo
7-3-1 Hongo, Bunkyo-ku, Tokyo 113-8656 Japan
Tel: +81-3-5841-1191
Email: [email protected] (Kaneko)
Email: [email protected] (Kashiwazaki)
Email: [email protected] (Takeda)
March 15, 2019
Abstract
This study examines whether merger performance is different between group companies
and independent companies. Using data on mergers between Japanese listed companies for
1985–2014, we investigate the role of business groups on post-merger performance
including company stock price, number of employees, and R&D. We find that the stock
prices of acquirers react more negatively to announcements for within-group mergers than
for mergers between independent firms. We also show that the acquirers of within-group
mergers tend to increase number of employees and average annual salary but decrease
R&D ratio after mergers. Such reduction of R&D ratio is not observed for acquirers of
other types of mergers. In addition, the targets of within-group mergers tend to have higher
leverage than other targets. Our results indicate that within-group mergers do not seem to
aim at enhancing economic performance of acquirers but rather at rescuing troubled targets
and are, thus, perceived unfavorably by market participants.
Corresponding author.

2
1.Introduction
One of the most notable characteristics of Japanese industrial structure is that many
Japanese companies belong to a business group (Flash, 2014; Hoshi and Kashyap, 2001;
Nakatani, 1983). Mitsubishi, Mitsui, Sumitomo, Fuyo, Sanwa, and Daiichi Kangyo are the
six largest business groups in Japan with a long history. Researchers state that these
business groups have secured stable business performance through risk-sharing within the
business group and enabled an employee-focused Japanese-style of management by
avoiding pressure from capital markets through cross-shareholding and financing affiliated
companies.
However, with the weakening of the main bank system after the collapse of the economic
bubble in the 1990s, structural reorganization and increased shareholder activism led to a
shift in corporate governance from stakeholder governance system to shareholder
governance. An increase in mergers and acquisitions (M&As) in the 2000s also accelerated
these structural changes. According to RECOFF, the number of M&As reached 3,850 in
2018, a historical high in post-war Japan.
While many studies have examined the economic effects of M&As, only a few have
focused on the role of group companies in M&As (Yeh and Hoshino, 2001; Inoue and
Kato, 2006; Mehrotra et al., 2009; Higgins, 2018). Further, no studies include an analysis
for the period after the mid-2000s when the governance structure was changed from
stakeholder governance to shareholder governance.
To fill this gap, we focus on mergers conducted between 1985 and 2014 among Japanese
listed companies and examine whether the impact of a merger on stock prices, number of
employees, and research and development (R&D) is different between group companies
and independent companies. While previous studies have classified group companies based
on their capital or financing structure, we use a different definition of group companies—
ones that are included in the presidents’ council or public relations committees of the six
largest business groups.
We show that the stock prices of acquirers react more negatively to announcements when
both acquirers and targets belong to the same business group than otherwise. To investigate
why markets undervalue within-group mergers, we examine whethernumber of employees,
average annual salary, and R&D ratio change after mergers. Our statistical analysis shows
that acquirers of within-group mergers tend to increase number of employees and average

3
annual salary but decrease R&D ratio after mergers. Such a reduction in R&D ratio is not
observed for acquirers of other types of mergers. We also show that the targets of within-
group mergers tend to have higher leverage than other targets. Our results indicate that
within-group mergers are not aimed at enhancing economic performance of acquirers but
rather rescuing troubled targets and are, thus, perceived unfavorably by market participants.
This paper is organized as follows. Section 2 describes background information. Section
3 provides literature review and develops hypotheses. Section 4 explains methodology and
data. Section 5 discusses the results. Section 6 provides concluding remarks.
2. Background
Large-scale M&As in Japan began with the merger between Yawata Iron and Fuji Steel
following the end of the 1970 Fairness Committee’s recommendation prohibiting mergers.
Although Japan witnessed few large-scale M&As between listed companies during the
1970s and the 1980s, a spate of M&As occurred against a backdrop of legal reforms
following the collapse of the bubble economy (Arikawa and Miyajima, 2007). The latter
half of the 1990s, in particular, saw the beginning of a full-scale M&A boom.
On the back of these M&As, legal and institutional frameworks were improved to
reduce excess capacity and enhance international competitiveness. For instance, in 1997,
the ban on the establishment of pure holding companies was lifted through an amendment
in the Antimonopoly Act, which led to an increase in the creation of holding companies
after 1999 with both the acquirers and targets being subsidiaries when carrying out mergers.
Another example is the permission for M&As using equity swaps and transfers through a
1999 revision to the Commercial Code, which enabled listed subsidiaries to be converted
into wholly-owned subsidiaries. Further, the 2003 amendment to the Law on Special
Measures for the Revitalization of Industrial Dynamism allowed cash-out and triangular
mergers, where acquirers provide shares of the parent companies to shareholders of the
targets. Further, the spread of consolidated accounting since 2000 made it possible to
conduct corporate decision-making advanced the reorganization of the business group.
Most Japanese companies belong to a business group or inter-company networks called
keiretsu that are peculiar to Japan. Keiretsu, or the post-war business group in Japan, are
classified as horizontal keiretsu and vertical keiretsu (Hoshi and Kashyap, 2001). While a
vertical keiretsu typically involves manufacturing companies, horizontal keiretsu includes a
group of large firms from diverse industries. The member companies of a horizontal
4
keiretsu are connected to one another by several networks, including a presidents’ council,
borrowings from keiretsu financial institutions, cross-shareholdings, inter-firm director
exchanges, transactions of intermediate products, and group-wide activities. The presidents’
council consists of key companies of the business group and meets every month to
socialize.
In this study, we focus on the six largest business groups of which three are pre-war
conglomerates, and the other three are financial keiretsu whose center is a city bank. The
pre-war Japanese conglomerates, zaibatsu, were dismantled during the U.S. occupation.
However, the affiliated companies of the three largest zaibatsu—Mitsui, Mitsubishi, and
Sumitomo—held unofficial meetings among their executive managers. The managers of
Sumitomo started to meet monthly at Hakusui-kai in April 1951, those of Mitsubishi at
“Mitsubishi Friday Club” in 1954, and those of Mitsui at Nimoku Kai in October 1961. In
the 1960s, major city banks from financial affiliations grew into business groups. The Fuyo
Group’s Fuyo-kai focusing on Fuji Bank was founded in January 1966. The Sanwa Group’s
Sansui-kai focusing on Sanwa bank was founded in February 1967. Daiichi Kangyo’s
Sankin-kai was established in January 1978.
According to Nakatani (1983), business groups aim to secure stable performance by
sharing risk between affiliated companies and to exempt management from the threats and
pressures of the capital market through cross-shareholding and close affiliate financing
relationships. In other words, business groups enable member companies to deviate from
profit maximization and achieve employee-oriented management.
However, after the economic bubble of the 1990s burst, the ties that once seemed
unbreakable appeared to loosen. First, through a reorganization of the banking industry, the
main banks of the six largest groups were consolidated into three megabanks, which
consisted of Mitsubishi UFJ Financial Group (FG), Mitsui Sumitomo FG, and Mizuho FG.
Tanaka (2013) investigated whether the reorganization of the banking industry affected the
other industries. Despite the emergence of megabanks, however, he concluded that the six
business groups were not likely to merge.
Second, the influence of group companies and main banks tended to decline over time.
According to Nomura Securities, the ratio of cross-shareholding among listed banks and
non-financial institutions (and insurance companies) declined from more than 30% (50%)
in FY 1990 to 9.5% (14.1%) in FY 2017. Instead, the ratio of outsiders, such as foreign
shareholders and individual shareholders increased over time.
5
Third, the 2014 stewardship code made the group-led rescue of distressed affiliated
companies, which once had been regarded as responsibility of main banks, more difficult
than before. For example, Mitsubishi UFJ Trust and Banking opposed the rescue plan of the
group company, Mitsubishi Motors, in 2016-17, by opposing the nominations of outside
directors from “specified related companies”—Mitsubishi Heavy and Mitsubishi Corp
(Tsutsumi et al., 2017).
Considering the transition of the corporate governance system in Japan, we examine
whether mergers between affiliated companies are different from mergers with other
companies. If yes, how?
3. Literature review and hypotheses development
According to studies, such as Nakatani (1983), companies belonging to business groups
tend to place emphasis on stable employment and business performance. Such companies
may neither rationalize their business lines nor reduce employment after mergers. The same
idea might work in mergers between affiliated companies, and there is the possibility that
the market may not receive such mergers favorably. Therefore, the stock price reaction to
within-group mergers is likely to be lower compared to other types of mergers.
Although many studies have examined the economic impact of M&As, only a few have
investigated the relationship between business groups and M&As. These studies include
Yeh and Hoshino (2001), Inoue and Kato (2006), Mehrotra et al. (2009), and Higgins
(2018). Yeh and Hoshino (2001) investigated the post-merger productivity and operating
performance of 86 mergers between 1970 and 1994, and found that keiretsu-independent
mergers outperform intra-keiretsu mergers.
Inoue and Kato (2006) examined the stock price responses to 165 M&As between group
companies for 1990–2002. They defined an within-group merger as: when the acquirer held
15% of the target’s stocks or when 15% of the target’s stocks were owned by the same
shareholder. They found no significant difference in stock price responses between within-
group M&As and other M&As.
Mehrotra et al. (2009) analyzed the relationship between domestic mergers and main
bank relationships based on 91 mergers between 1982 to 2003. They found a strong
involvement of the main bank in many mergers that were conducted by the shared main
bank. They also reported that domestic mergers tend to involve acquirers with strong
financial condition and targets with weak condition, indicating that the mergers were
6
conducted for rescuing weak targets. Overall, however, the merger announcements
generated positive stock price responses for both acquirers and targets, and the positive
responses were larger for targets than for acquirers.
More recently, Higgins (2018) focused on the period of banking crisis between 1990 and
2004 to examine how bank-firm ties influence the effect of M&As in Japan. He found that
acquirers with stronger bank ties experienced a larger loss of shareholder value via mergers
than acquirers with weaker bank ties. He argues that this gap is caused by the banks’
attempt to reduce their risk. As a result, the stock prices of banks reacted positively to their
borrowers’ mergers.
Among the studies discussed thus far, Inoue and Kato (2006) were unable to confirm
whether the presence or absence of a group relationship exerts a significant effect on the
stock price responses to M&A announcements. We argue that their insignificant results
could have been caused by their broad definition of business affiliation that relied solely on
share ownership. In fact, more than a half of their M&A transactions were classified as
within-group M&A. Both Mehrotra et al. (2009) and Higgins (2018) analyzed the effects of
loan relationships on M&As and reported a strong influence of the main banks on domestic
mergers. As the six business groups also have strong main banks, we follow the findings of
Mehrotra et al. (2009) and form the following hypothesis on the relationship between
business groups and market reactions to mergers.
H1: Stock price responses to merger announcements are more negative when both acquirers
and targets belong to the same business group than when both are independent companies.
When companies attempt to increase efficiency of business through mergers, they would
want to reduce the number of employees and wages after mergers. The following two
studies also show that M&As have a negative impact on the number of employees of
acquirers. First, Miyajima (2007) analyzed the effects of domestic mergers on full-time
employees using 114 domestic merger transactions between listed companies that agreed to
a merger between FY 1989 and 2002 and were in the first year of merger between FY 1990
and 2003. He found that the number of employees fell by approximately 3% after the
mergers between 1990 and 1998 and by around 10% between 1999 and 2003. He reported
that the number of employees fell by approximately 13% in an allied merger and by around
20% in a rescue merger.
7
Second, Taguchi et al. (2011) investigated the effects of M&As on employment
inJapanese companies. Using the business outlook survey results, their sample consisted of
3,697 M&As between FY 1995 and 2008. By estimating a labor demand, they have shown
that acquisitions had a dynamic positive effect on employment at the target company in the
manufacturing industry, while mergers had a dynamic negative effect on employment at the
acquiring company, mainly in non-manufacturing industry.
However, Nakatani (1983) pointed out that one of the aims of forming a business group
is to be able to carry out Japanese-style business. Japanese companies belonging to business
groups tend to emphasize stable employment and business performance. Such companies
would neither rationalize their business lines nor reduce employment after mergers.
Thus, we form the following hypothesis on mergers and number of employees.
H2: The number of employees tends to decrease more after mergers when acquirers and
targets do not belong to the same business group than when both are independent
companies.
Kubo and Saito (2007) examined the same 114 domestic merger transactions as
Miyajima (2007) had. They compared the changes in wages before and after domestic
mergers and found that wages increase after merger. They also show that wage increases
are higher in mergers between group companies than in mergers between non-group
companies. Following their results, we expect mergers between group companies to have a
larger increase in wages than other types of mergers.
H3: Annual salary tends to increase more after mergers when acquirers and targets belong
to the same business group than when both are independent companies.
Theoretically, whether M&As promote R&D is not clear. On the one hand, if M&As
lead to efficiency gains through rationalization, R&D activities are likely to be enhanced
after an M&A. On the other hand, if M&As reduce industrial competition, R&D activities
might decrease after an M&A. Previous empirical studies have provided mixed results. By
analyzing 191 acquisitions between 1970 and 1986, Hitt et al. (1991) have shown that
acquisitions have a negative effect on R&D expenditures because acquirers treat the M&A
as a substitute for in-house innovation.

8
On the contrary, based on M&As between companies of OECD member countries from
1990 to 1999, Bertrand and Zuniga (2006) reported that increase or decrease in R&D
investments after domestic M&A transactions varies across industries. To be more specific,
they demonstrated that R&D investment increases after domestic M&As involving low-
technology intensive industries, but decreases after domestic M&As involving medium-
technology intensive industries. Using the data of 31 M&As, Cassiman et al. (2005) also
reported that the impact of M&As on R&D depends on technological relatedness and
market-relatedness between acquirers and targets. They pointed out that R&D activities
increase after M&As between companies with ex-ante complementary technologies but
decrease after M&As between those with substitutable technologies.
In the Japanese context, each business group includes companies in different industries
(Hoshi and Kashyap, 2001; Flath, 2014). This means that acquirers and targets are less
likely to have a substitutable technological relationship and more likely to have a
complementary one. Thus, we formulate the following hypothesis on the relationship
between R&D and mergers.
H4: R&D ratios tend to increase more after mergers between domestic companies that
belong to the same business group than when both are independent companies.
4. Methodology and data
In this study, we focus on the six largest business groups of which three are pre-war
conglomerates, and the other three are financial keiretsu whose center is a city bank.
Following Flath (1990) and Tanaka (2013), we define group companies as those that are on
the presidents’ council and public relations committees of these six business groups. The
public relations committee is an organization that aims to enhance the group image by
contributing to the society.
We classify mergers between affiliated companies in the following ways.
[1] Intra: Mergers between companies belonging to the same business group.
[2] Inter: Mergers between companies belonging to different business groups.
[3] OtherA: Mergers conducted by a company belonging to the business group of an
independent company.
[4] OtherT: Mergers conducted by an independent company of a company belonging to the
business group.

9
[5] Non: Mergers between independent companies.
The company belonging to a business group means that the company is included in the
president’s council or public affairs committee of the six largest business groups. It is
important to note that the independent company here refers to companies that do not belong
to any of the six business groups but does not exclude the possibility of affiliation to a
business group outside of the six business groups. However, since the number of samples in
Inter and OtherT is small, these two categories are excluded from our main analysis. We
focus instead on Intra and its comparison with OtherA and Non.
To test H1, we first calculate the cumulative market-adjusted return (CMAR) for each
merger announcement. To guarantee robustness, we calculate CMAR for various windows
including CMAR (-1, 1), which denotes the CMAR between one day before the
announcement and one day after the announcement, and CMAR (-5, 5), which denotes the
CMAR between five days before the announcement and five days after the announcement.
We then estimate the CMAR for acquirers by using the following model:
𝐶𝑀𝐴𝑅 𝛼 𝛽 𝐼𝑛𝑡𝑟𝑎 𝛽 𝐼𝑛𝑡𝑒𝑟 𝛽 𝑂𝑡ℎ𝑒𝑟𝐴 𝛽 𝑂𝑡ℎ𝑒𝑟𝑇 𝛽 𝐴𝑠𝑠𝑒𝑡
𝛽 𝐶𝑎𝑠ℎ 𝛽 𝑀𝑎𝑟𝑘𝑒𝑡 ε. (1)
Among the independent variables, Intra, Inter, OtherA, and OtherT are dummy
variables, which take the value of 1 if the mergers are classified into these four categories,
and 0 for Non. Based on H1, we expect that Intra is negatively associated with CMAR.
Asset is the natural logarithm of total assets of acquirers. This variable is included to
control for the size effect. Cash is a dummy variable, which takes the value of 1 if acquirers
use cash for payment of the mergers, and 0 for other payment methods including stock
exchanges and stock transfers. Following previous studies, such as Alexandridis et al.
(2010), we expect positive coefficients for Cash. Market is a dummy variable, which takes
the value of 1 if the acquirers are listed on emerging stock exchanges mainly for start-ups,
and 0 if the acquirers are listed on established markets, such as the Tokyo Stock Exchange.
ε is a disturbance term. We also include year dummy variables to control for the year
effect.
To examine H2 to H4, we use the number of employees, average annual salary, and
R&D ratio (R&D expenditures divided by market capitalization) and calculate the change
in these variables between the year of the merger and the third year of the merger for Intra,
OtherA, and Non groups. Based on H2 to H4, we expect a greater increase in the number of
employees and average annual salary and a greater decrease in R&D ratio for Intra than

10
Non.
We collect merger transaction data with Thomson SDM Platinum. The daily stock price
data are retrieved from Toyo Keizai’s Kabuka CD-ROM. The number of employees, annual
salary, R&D expenditures, and market capitalization are obtained from Financial Data
Solutions. Asset data are retrieved from NEEDS FinancialQUEST.
Using Thomson SDM Platinum, we first search for merger announcements between
Japanese listed companies from 1985 to 2014, to obtain 505 merger announcements. After
eliminating 68 announcements that were withdrawn later, our final sample consists of 436
mergers. We then classify our samples into the following categories based on the keiretsu
relationships: 54 samples in Intra, 12 in Inter, 50 in OtherA, 9 in OtherT, and 311 in Non.
We confirm that the number of samples in Inter and OtherT is too small for a reliable
statistical analysis and, thus, focus our analysis on Intra and its comparison with OtherA
and Non.
Among the 436 mergers, only 30 (6.9%) samples are for the period between 1985 and
1998, while 406 (93.1%) are for 1999–2014. Hence, most of our sample mergers took place
after the institutional changes including legal changes related to M&As in Japan. Regarding
the mode of payment of mergers, only 39 (9.4%) samples are paid by cash, 352 (84.4%) by
stocks, and 26 (6.2%) by both. Further, only 46 (10.6%) samples have acquirers listed on
emerging stock exchanges, while 390 (89.4%) have acquirers listed on established markets,
such as the Tokyo Stock Exchange.
5. Results
Table I shows the CMAR around merger announcements for targets and acquirers. As
discussed in previous studies, such as Alexandridis et al. (2010), Andrade et al. (2001) and
Inoue and Kato (2006), for all the categories, CMAR is greater for targets than for
acquirers, perhaps because due to information asymmetry, acquirers tend to pay for
merging targets amounts larger than what is thought reasonable by market participants.
Comparing the CMAR among the three categories for both targets and acquirers, Intra has
the lowest CMAR for all windows except on the announcement day (0, 0). These results are
consistent with H1.
(Table I here)
Table II presents the regressions results based on equation (1) that estimates acquirers’
CMAR (-1, 1) and CMAR (-5, 5). The variance inflation factors are less than 10, indicating
11
that the models are exempt from multicollinearity. Both regression results produce
significantly negative coefficients for Intra at the 5% level. These results are consistent with
H1, which states that market reactions to merger announcements are weaker for mergers
between companies that belong to the same business group than otherwise.
(Table II here)
To test H2 to H4, Table III compares the number of employees, average annual salary,
and R&D expenditures divided by market capitalization between pre- and post-merger
periods. “vs Non” in the right column shows the difference with Non based on Welch’s t-
test (Welch 1937). We first note that for both pre- and post-merger periods, the number of
employees is the highest for Intra and lowest for Non, indicating a gap in firm size between
these categories. For all categories, the number of employees increases after mergers. The
rate of change is smaller for Intra than for OtherA and Non. Based on the Welch’s t-test,
the change of the number of employees is not significantly different between Intra/OtherA
and Non. These results are not consistent with H2.
(Table III here)
Likewise, average annual salary is the highest for Intra and lowest for Non in both the
pre- and post- merger periods, and for all categories, average annual salary increases after
mergers. The rate of change is larger for OtherA than for Intra and Non. Based on the
Welch’s t-test, the change of the number of employees is not significantly different between
Intra/OtherA and Non. These results are not consistent with H3.
Lastly, the R&D ratio is lesser for Non than for Intra and OtherA in both the pre- and
post-merger periods. However, the change in R&D ratio is different between Intra and the
other two categories. The R&D ratio decreases after mergers for Intra, but increases for
OtherA and Non. Based on Welch’s t-test, the rate of change is significantly larger for Intra
than for Non at the 10% level. These results are not consistent with H4.
So far, we find that acquirers of within-group mergers tend to increase the number of
employees and average annual salary but decrease R&D ratio after mergers. These results
indicate that within-group mergers are not aimed at profit maximization but at different
tasks. Several previous studies have stated that mergers between Japanese companies are
sometimes used to rescue troubled companies (Arikawa and Miyajima, 2007; Inoue and
Kato, 2006; Mehrotra et al., 2011). Mehrotra et al. (2011) reported that mergers between
firms having a common main bank tends to generate lower merger gains. To check this
possibility, we estimate the leverage of targets using the following equation.

12
𝐿𝑒𝑣𝑒𝑟𝑎𝑔𝑒 𝛼 𝛽 𝐼𝑛𝑡𝑟𝑎 𝛽 𝐼𝑛𝑡𝑒𝑟 𝛽 𝑂𝑡ℎ𝑒𝑟𝐴 𝛽 𝑂𝑡ℎ𝑒𝑟𝑇 ε (2)
The results are presented in Table IV. Model 1 includes the year dummies while Model 2
does not. For both models, the coefficients of Intra and Inter are significantly positive. This
means that mergers between companies that belong to same business groups tend to acquire
targets with higher leverage than in other types of mergers. In other words, mergers
between companies that belong to same business groups tend to aim at rescuing financially
distressed targets.
(Table IV here)
6. Concluding remarks
In this study, we focus on mergers among Japanese listed companies and examine
whether the impact of the merger on company stock price, number of employees, and R&D
is different between group companies and independent companies. While previous studies
have classified group companies based on their capital or financing structure, we use a
different definition of group companies—ones that are included in the presidents’ council
or public relations committees of the six largest business groups.
Based on the mergers between listed companies between 1985 and 2014, we show that
the stock prices of acquirers react more negatively to merger announcements between
companies that belong to the same business group than otherwise. To find out why markets
undervalue within-group mergers, we examine whether the number of employees, average
annual salary, and R&D ratio change after mergers. Our statistical analysis shows that
acquirers in the same business group tend to increase the number of employees and average
annual salary but decrease R&D ratio after mergers. Such reduction of R&D ratio is not
observed for acquirers that do not belong to the same business group. We also show that the
targets merged with acquirers of the same business group tend to have higher leverage than
other targets. Our results indicate that within-group mergers do not seem to be undertaken
to enhance economic performance but rather to rescue troubled targets and are, thus,
perceived unfavorably by market participants.
REFERENCE
[1] Alexandridis, G., Petmezas, D., & Travlos, N. G. (2010). Gains from Mergers and
Acquisitions Around the World: New Evidence. Financial Management, 39(4), 1671–
1695.
13
[2] Andrade, G., Mitchell, M., & Stafford, E. (2001). New Evidence and Perspective on
Mergers. Journal of Economics Perspectives, 15(2), 1–36.
[3] Arikawa, Y., & Miyajima, H. (2007). Understanding the M&A boom in Japan: What
drives Japanese M&A? RIETI Discussion Paper Series, 07-E-042.
[4] Bertrand, O., & Zuniga, P. (2006). R&D and M&A: Are cross-border M&A different?
An investigation on OECD countries. International Journal of Industrial Organization,
24, 401–423.
[5] Cassiman, B., Colombo, M., Garrone, P., & Veugelers, R. (2005). The impact of impact
of M&A on the R&D process: an empirical analysis of the role of technological and
market relatedness. Research Policy, 34(2), 195–220.
[6] Flath, D. (2014). The Japanese Economy (3rd ed.). Oxford University Press: UK.
[7] Flath, D. (1990). Shareholder Interlocks in the Keiretsu, Japan’s Financial Groups.
Working Paper Series, Columbia University.
[8] Higgins, H. N. (2018). Banks and Corporate Decisions: Evidence from Business
Groups. Financial Management, 47(3), 679–713.
[9] Hitt, M. A., Hoskisson, R. E., Ireland, R. D., & Harrison, J. S. (1991). Effects of
Acquisitions on R&D Inputs and Outputs. Academy of Management Journal, 34(3),
693–706.
[10] Hoshi, T., & Kashyap, A. K. (2001). Corporate Financing and Governance in Japan:
The Road to the Future. The MIT Press: USA.
[11] Inoue, K., & Kato, H., (2006). M&A to Kabuka (M&A and stock prices) Toyo Keizai
Shinposha: Japan (in Japanese).
[12] Kubo, K., & Saito, T. (2007). Gappei/Baishu to Jugyoin no Chingin (M&A and
Employees’ Wages). Nihon Roudou Kenkyu Zasshi, 560, 4–15 (in Japanese).
[13] Mehrotra, V., Schaik, D., Spronk, J., & Steenbeek, O. (2009). Creditor-Focused
Corporate Governance: Evidence from Mergers and Acquisition in Japan. Journal of
Finance and Quantitative Analysis, 46(4), 1051–1072.
[14] Miyajima, H. (2007). Nihon no M&A: Kigyo Touchi/Soshiki Kouritsu/Kigyo Kachi
heno impakuto (Japanese M&A: The Impact on Corporate Governance, Organizational
Efficiency, and Firm Value). Toyo Keizai Shinposha: Japan (in Japanese).
[15] Nakatani, I. (1983). Kigyo Shudan no Keizaiteki Imi to Ginko no Yakuwari (Economic
significance of business groups and the role of banks). Kin-yu Keizai (Journal of

14
Financial Economics), 202, 51–75 (in Japanese).
[16] Taguchi, H., Yanagawa, T., & Harita, M. M&A ni yoru Nihon Kigyo no Koyou heno
Eikyo (M&A effects on employment in Japanese enterprises). Financial Review, 107,
18–40 (in Japanese).
[17] Tanaka, A. (2013). Rokidai Kigyo Shudan no Mukinouka: Posuto Baburuki ni okeru
Kigyoukan Nettowahku no Ohganaizingu (The big six corporate complexes in the
twilight: early 2000s in Japan). Doshisha Shogaku (The Doshisha Business Review),
64(5), 330–351 (in Japanese).
[18] Tsutsumi, M., Tamaki, J., & Hayashi, E. (2017). Mitsubishi solidarity survived war but
succumbs to changing times: ‘Zaibatsu’ descendants grapple with pressures hitting
much of Japan Inc. Nikkei Asian Review December 24, 2017, Available at:
https://asia.nikkei.com/Business/Mitsubishi-solidarity-survived-war-but-succumbs-to-
changing-times.
[19] Welch, B. L. (1937). The significance of the difference between two means when the
population variance are unequal. Biometrika, 29, 350–361.
[20] Yeh, T., & Hoshino, Y. (2001). Productivity and operating performance of Japanese
merging firms: Keiretsu-related and independent mergers. Japan and the World
Economy, 14, 347–366.
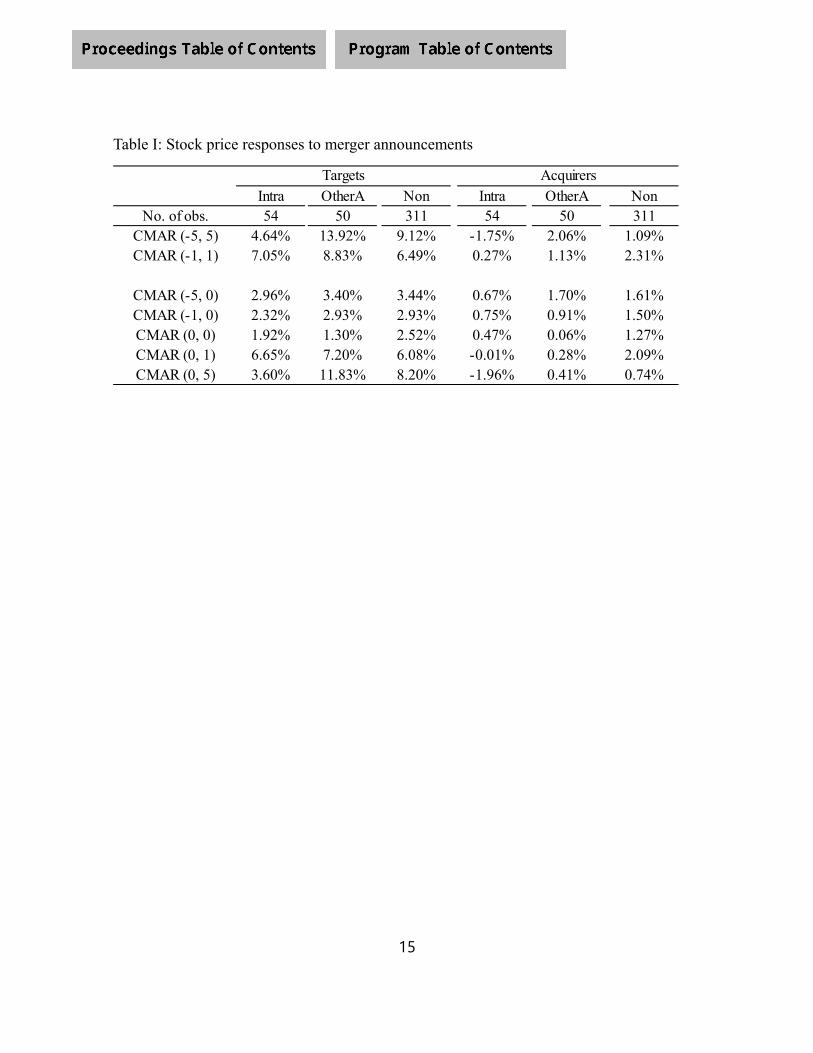
15
Table I: Stock price responses to merger announcements
Intra OtherA Non Intra OtherA NonNo. of obs. 54 50 311 54 50 311
CMAR (-5, 5) 4.64% 13.92% 9.12% -1.75% 2.06% 1.09%CMAR (-1, 1) 7.05% 8.83% 6.49% 0.27% 1.13% 2.31%
CMAR (-5, 0) 2.96% 3.40% 3.44% 0.67% 1.70% 1.61%CMAR (-1, 0) 2.32% 2.93% 2.93% 0.75% 0.91% 1.50%CMAR (0, 0) 1.92% 1.30% 2.52% 0.47% 0.06% 1.27%CMAR (0, 1) 6.65% 7.20% 6.08% -0.01% 0.28% 2.09%CMAR (0, 5) 3.60% 11.83% 8.20% -1.96% 0.41% 0.74%
Targets Acquirers
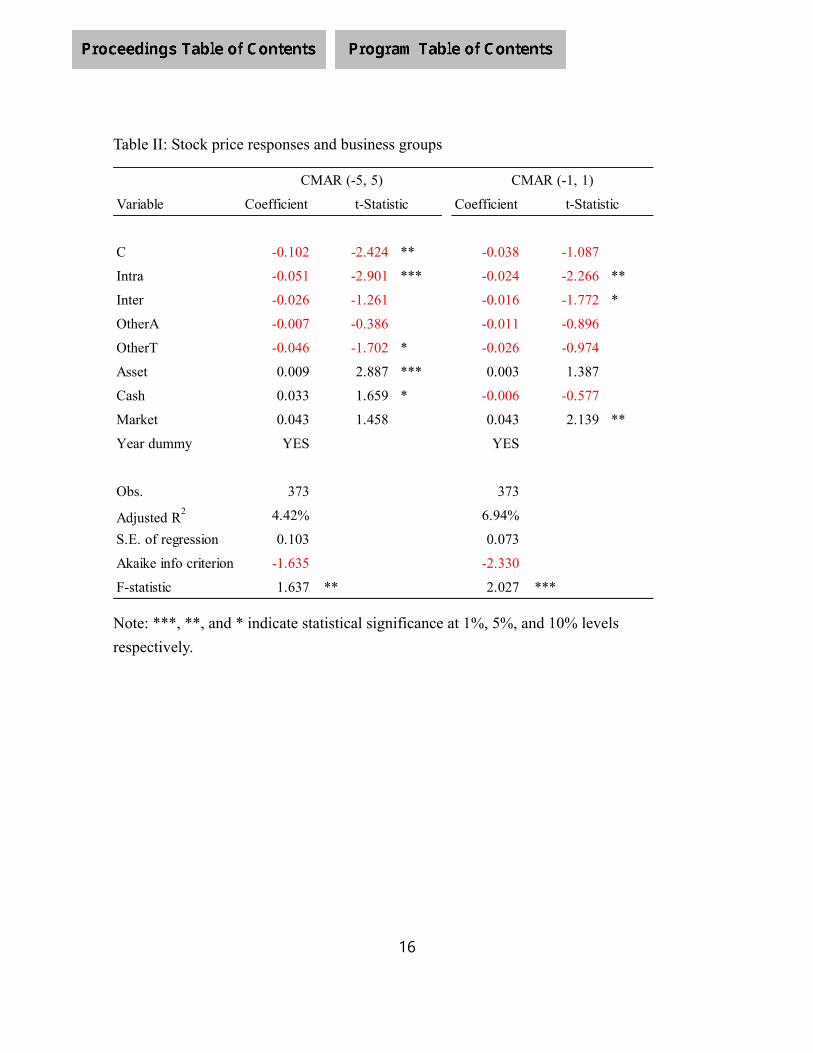
16
Table II: Stock price responses and business groups
Note: ***, **, and * indicate statistical significance at 1%, 5%, and 10% levels
respectively.
Variable Coefficient Coefficient
C -0.102 -2.424 ** -0.038 -1.087
Intra -0.051 -2.901 *** -0.024 -2.266 **
Inter -0.026 -1.261 -0.016 -1.772 *
OtherA -0.007 -0.386 -0.011 -0.896
OtherT -0.046 -1.702 * -0.026 -0.974
Asset 0.009 2.887 *** 0.003 1.387
Cash 0.033 1.659 * -0.006 -0.577
Market 0.043 1.458 0.043 2.139 **
Year dummy YES YES
Obs. 373 373
Adjusted R2 4.42% 6.94%
S.E. of regression 0.103 0.073
Akaike info criterion -1.635 -2.330
F-statistic 1.637 ** 2.027 ***
t-Statistic t-Statistic
CMAR (-1, 1)CMAR (-5, 5)
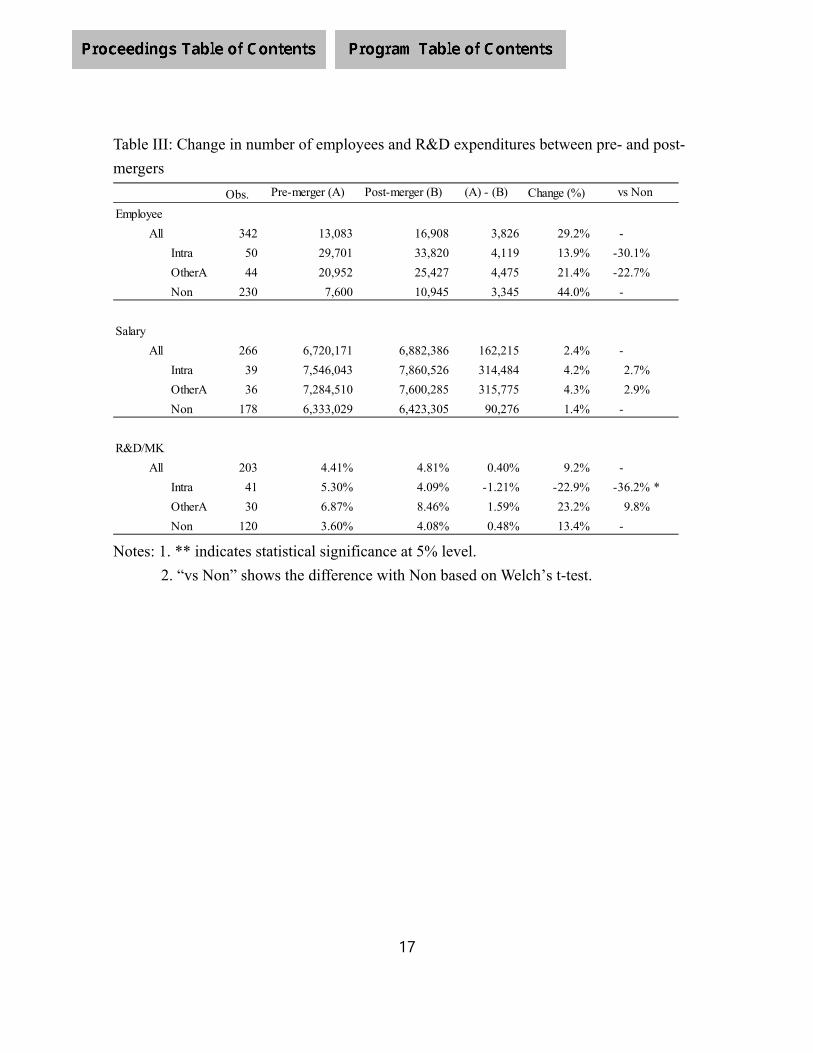
17
Table III: Change in number of employees and R&D expenditures between pre- and post-
mergers
Notes: 1. ** indicates statistical significance at 5% level.
2. “vs Non” shows the difference with Non based on Welch’s t-test.
Obs. Change (%)
Employee
All 342 13,083 16,908 3,826 29.2% -
Intra 50 29,701 33,820 4,119 13.9% -30.1%
OtherA 44 20,952 25,427 4,475 21.4% -22.7%
Non 230 7,600 10,945 3,345 44.0% -
Salary
All 266 6,720,171 6,882,386 162,215 2.4% -
Intra 39 7,546,043 7,860,526 314,484 4.2% 2.7%
OtherA 36 7,284,510 7,600,285 315,775 4.3% 2.9%
Non 178 6,333,029 6,423,305 90,276 1.4% -
R&D/MK
All 203 4.41% 4.81% 0.40% 9.2% -
Intra 41 5.30% 4.09% -1.21% -22.9% -36.2% *
OtherA 30 6.87% 8.46% 1.59% 23.2% 9.8%
Non 120 3.60% 4.08% 0.48% 13.4% -
Pre-merger (A) Post-merger (B) (A) - (B) vs Non
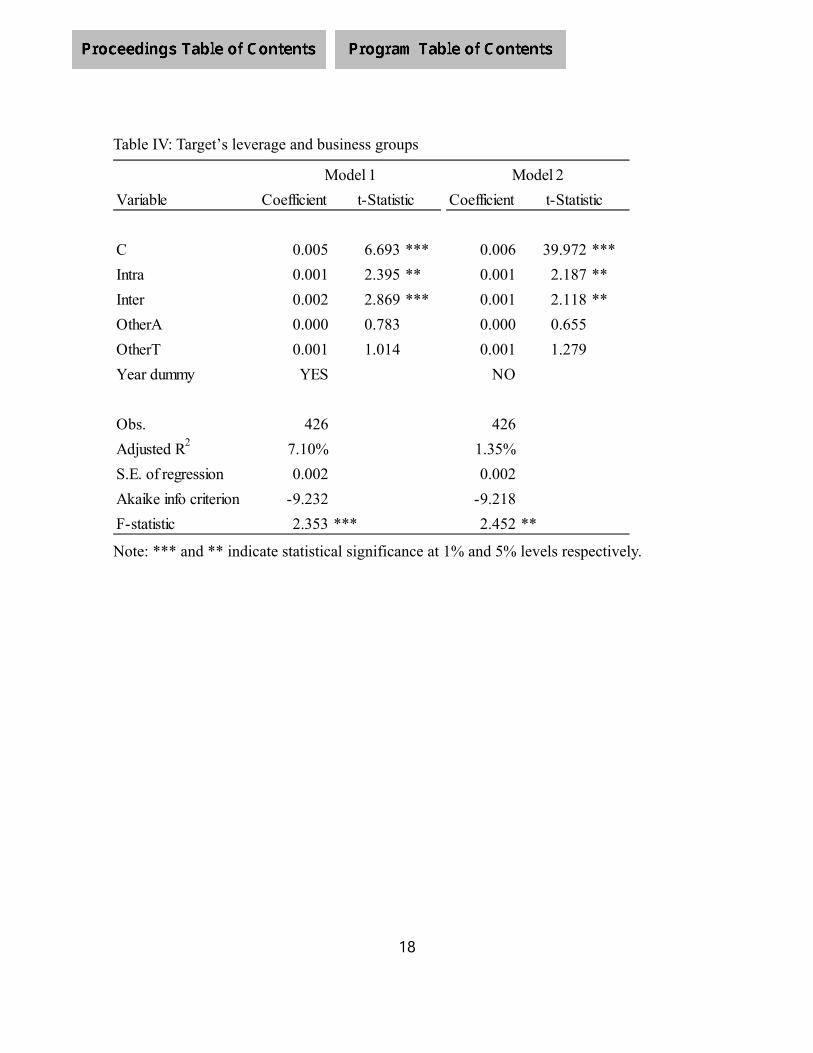
18
Table IV: Target’s leverage and business groups
Note: *** and ** indicate statistical significance at 1% and 5% levels respectively.
Variable Coefficient Coefficient
C 0.005 6.693 *** 0.006 39.972 ***
Intra 0.001 2.395 ** 0.001 2.187 **
Inter 0.002 2.869 *** 0.001 2.118 **
OtherA 0.000 0.783 0.000 0.655
OtherT 0.001 1.014 0.001 1.279
Year dummy YES NO
Obs. 426 426
Adjusted R2 7.10% 1.35%
S.E. of regression 0.002 0.002
Akaike info criterion -9.232 -9.218
F-statistic 2.353 *** 2.452 **
t-Statistict-Statistic
Model 1 Model 2
1
ANALYSIS OF INSOLVENCY RISKS AND FINANCIAL PERFORMANCES OF BANKS IN THAILAND
Metjiranont Theeraseth1 Sodsongkrit Metcha2
1Faculty of Management Science, Ubon Ratchathani University, Ubon Ratchathani, Thailand 2Faculty of Liberal Art, Ubon Ratchathani University, Ubon Ratchathani, Thailand
[email protected] and [email protected]
ABSTRACT
The aim of this study was to compare insolvency risks and financial performances of large commercial banks and state-owned enterprise banks in Thailand using data from 2014 to 2018. It was found that the commercial banks played a more important role in the banking sector based on their proportions of total banking institution assets from 2014 to 2018. It was also found that banks with higher results in financial performances and capacity did not always mean that they were more stable and less risky because by taking on more risks the commercial banks are also subject to higher insolvency risks than the state-owned enterprise banks.
Keywords: Financial performance, Insolvency risk, Stability and security of commercial banks
INTRODUCTION
In 2019, Thailand faced a number of challenges in safeguarding its financial system stability, as was the case with many countries around the world. Key risks stemmed from uncertainties surrounding monetary policy directions in major advanced economies, the impact from trade tensions between the US and China, as well as geopolitical risks. These headwinds contributed to volatility in global financial markets and international capital flows (Bank of Thailand, 2019).
The banking sector is one of the most important factors in the development of Thai’s economic system as it has large assets, a variety of assets and liabilities, and a significant impact on the country’s capital markets. It also plays an increasingly important role in the Thai industrialization process, and is a vital part of the national financial industry as banks are the major source of loans. As a result, the stability and security of commercial banks are critical. In addition, Thai’s financial institutions remain sensitive to mergers, restructures, and bankruptcies, and an analysis of financial performances and insolvency risks poses a challenge.
The aim of this study was to compare the financial performances and insolvency risks of large commercial banks and state-owned enterprise banks in Thailand for the period from 2014 to 2018. The paper employed a z-score approach and probabilities of book-value insolvency banks for assessment of Thai’s financial institutions. Furthermore, the rank of financial performances and risks were divided into two groups, large commercial banks and state-owned enterprise banks.
2
This paper presents a brief review of literature in section 2 and the study’s methodology to calculate bank risks and probability of insolvency in section 3. Data and selected results are discussed in section 4, and section 5 provides a conclusion.
LITERATURE REVIEW
There is many studies related to insolvency risks in the banking industry, with many focusing on ownership structure and others on bank regulations. Chun et al. (2010) analyzed the effects of ownership structure and risk-taking Korean and Japanese behavior during the relatively regulated period of the late 1990s and early 2000s. It was found that managerial ownership alone did not affect either the risk or profit levels of Korean banks. In contrast, an increase in managerial ownership added to the total risk of Japanese banks.
Cornett et al. examined the effects of government ownership and government involvement in countries’ banking systems on the performances of Asian banks from 1989 to 2004. This study’s examination of 16 Far East countries showed that state-owned banks exhibited more risk than private banks.
Haw et al. compared the impact of foreign and state ownership on banking risk by using a sample of listed commercial banks in East Asia and Western Europe. This research found evidence suggesting that banks with concentrated ownership exhibited higher risk, as measured by return volatility and insolvency risk. Lassoued et al. analyzed the impact of foreign and state ownership on banking risk in the Middle East and North Africa (MENA) region from 2006 to 2012, and results showed that state ownership encouraged banks to take more risks while foreign ownership reduced risk-taking.
The effects of state ownership and bank regulation have been examined in many economies in Asia, Europe, and MENA, and these examinations showed that state-owned banks exhibited more risk than private banks. Our study analyzed the overall financial performances and insolvency risks of two groups of Chinese banks, large commercial and joint-stock commercial banks.
METHODOLOGY
1.1 Measure of bank risk
The formula for risk measurement developed and used by Hannan and Hanweck (1988)1] was used to analyze the risks of commercial banks. The empirical form of their risk index (RI), which is labelled Z-score, is
(1)
where ROA = the return on assets,
1The measure also has been used by Laeven and Levine (2009), Jin, Kanagaretnam, Lobo, and Mathieu (2013), and Kanagaretnam, Lim, and Lobo (2014). Hannan and Hanweck originally developed their risk measure as probability of book-value insolvency.
( )
ROA CARscore
ROAZ
3
22(Z
1
s0)
)(
coreP BVE
CAR = the capital-assets ratio (equity/assets), σ(ROA) = the standard deviation of ROA.(Five years of dada for each bank)
The Z-score indicates that the number of standard deviations a bank’s return on assets has to drop below its expected value before equity is depleted and the bank becomes insolvent. Thus, a higher z-score indicates that the bank is more stable and less risky.
1.2 Probabilities of insolvency
Hannan and Hanweck (1988) also analysed the probabilities of book-value insolvency banks as follows:
(2)
Where P(BVE <0)=Probabilities of book-value insolvency.
EMPIRICAL FINDINGS AND RESULTS
Data were collected from annual reports of the five largest Thai commercial banks and the five largest Thai state-owned enterprise banks from 2014 to 2018. According to statistics of the financial Stability report 2018 from Bank of Thailand (BOT) [12], at the end of 2018 the assets held by the five largest commercial banks amounted to 53.49% of the total assets of Thai’s Financial Institutions, the five largest State-Owned Enterprise Banks held 21.43% of the total assets of the Thai’s financial institutions, and both groups held 74.93% of the total assets of Thai’s financial institutions.
The probability of insolvency is more important for large banks than small banks, because, even without adverse situations such as the Global Financial Crisis, large banks are already subject to more rigorous scrutiny by regulators, investors, and the general public. The total assets of Thai’s financial institutions can be seen in the table below
Table 1: Total Assets of Thai’s Financial Institutions (2014-2018)
Unit: Thai Billion Baht
Year/ Financial Institutions 2014 2015 2016 2017 2018 Growth Rate
Commercial Banks (Proportion of Financial Institutions)
16,746 (78.16)
17,315 (77.57)
17,722 (76.75)
18,774 (76.6)
18,950 (76.64)
13.16%
State-Owned Enterprise Banks (Proportion of Financial Institutions)
4,678 (21.84)
5,006 (22.43)
5,370 (23.25)
5,718 (23.35)
5,772 (23.36)
23.39%
Total 21,424 22,321 23,092 24,492 24,722
Source: Bank of Thailand 2018

4
The table reveals that the ratio of assets held by commercial banks to the total assets of all financial instructions in Thailand decreased from 78.16 % in 2014 to 76.64%, the lowest point, in 2018, while on the other hand, the ratio of assets held by state-owned enterprise banks to the total assets of all financial instructions in Thailand increased from 21.84% in 2014 to its highest point of 23.36% in 2018.
Table 2: Financial information: :( Averages from 2014 to 2018) 2018
Unit: Thai Million Baht
Bank Assets Proportion Equity Net Profit of Total Assets
Large Commercial Banks Bangkok Bank 2,946.606.40 11.92 375,775.40 34,133.40 Siam Commercial Bank 2,919,681.20 11.81 334,606.80 46,371.60 Krungthai Bank 2,777,517.80 11.23 274,785.80 30,476.60 Kasikornbank 2,768,730.40 11.20 317,905.60 39,719.60 Bank of Krungri Ayudhya 1,812,492.20 7.33 200,178.20 20,446.00 Total 13,225,028.00 53.49 1,503,251.80 171,147.20 Other Commercial Banks 5,725,573.00 23.16 615,567.20 36,097.80
State-Owned Enterprise Banks Government Savings Bank 2,507,864.40 10.14 175,034.00 27,151.00 Bank for Agriculture and Agricultural Co-operatives
1,527,639.60 6.18 175,034.00 9,772.40
Government Housing Bank 985,906.11 3.99 68,824.08 10,301.34 Export-Import Bank of Thailand 181,498.40 0.73 18,750.40 1,400.40 SMEs Development Bank of Thailand 97,600.00 0.39 6,248.00 784.20 Total 5,300,508.51 21.44 443,890.48 49,409.34
Total Assets of Thai’s Financial Institutions
24,722,256.55 100.00
Source: Annual reports of each bank and Bank of Thailand 2018
Table 2 shows the averages of financial information of the largest Thai commercial banks and Thai state-owned enterprise banks from 2014 to 2018, and that the commercial banks had the higher proportion of total assets (53.49), whereas the five state-owned enterprise banks’ proportion of total assets was 21.44. The large commercial banks and state-owned enterprise banks together held 74.93% of the total assets of all financial institutions. Table 2 also shows the equity and net profit of each bank calculated under the Z-score model.
The probability of book-value insolvency banks model are given in Table 3.

5
Table 3: Analysis of financial performances and risks
Bank E(ROA) CAP SROA Z-score P(BVE<0)
Large Commercial Banks Bangkok Bank 1.13 0.1275 0.10% 2.42 0.0856 Siam Commercial Bank 1.26 0.1446 0.28% 6.13 0.0133 Krungthai Bank 1.13 0.0989 0.16% 7.36 0.0092 Kasikorn bank 1.22 0.1148 0.30% 8.12 0.0191 Bank of Ayudhya 1.13 0.1104 0.03% 41.79 0.0003 State-Owned Enterprise BanksGovernment Savings Bank 1.08 0.0697 0.09% 12.95 0.0030 Bank for Agriculture and Agricultural Co-operatives
0.64 0.0791 0.09% 17.32 0.0017
Government Housing Bank 1.04 0.0698 0.06% 19.67 0.0014 Export-Import Bank of Thailand
1.50 0.2300 0.21% 13.22 0.0029
SMEs Development Bank of Thailand
0.42 0.0640 0.63% 12.87 0.0001
Analyses of the risk and the possibility of bankruptcy from table 3 shows that, except for the Bank of Ayudhya with a Z-score equal to 41.79 and P(BVE<0) of 0.0003%, all the large commercial banks had Z-scores lower than the state-owned enterprise banks. These results could be interpreted to suggest that the state-owned enterprise banks were stable as a result of being more risk-averse The possible reasons for the high Z-score of state-owned enterprise banks may come from the fact that they are state-owned and as such the Thai government can employ many means to support their balance sheets such as providing capital infusion to write off or restructure non-performing loans and non-performing assets.
It is possible to observe from the tables that the Z-scores correspond to probabilities of book-value insolvency. Moreover, only for Bank of Ayudhya with a Z-score equal to 41.79 and P(BVE<0) of 0.0003% had the higher Z-scores than all other large commercial banks and state-owned enterprise banks . One possible reason for the lower Z-scores of Bank of Ayudhya may have come from the fact that it has been integrated by MUFG Bank (JAPAN), which replaced GE Capital as its strategic shareholder and currently holding 76.88% interest in Bank of Ayudhya. The table also shows the averages returns on assets (ROA) of large commercial banks were higher than those of the state-owned enterprise banks, but the state-owned enterprise banks were more stable and more risk-averse A summary of the classification of banks based on their ranking of financial performances and risks is given in Table 4:
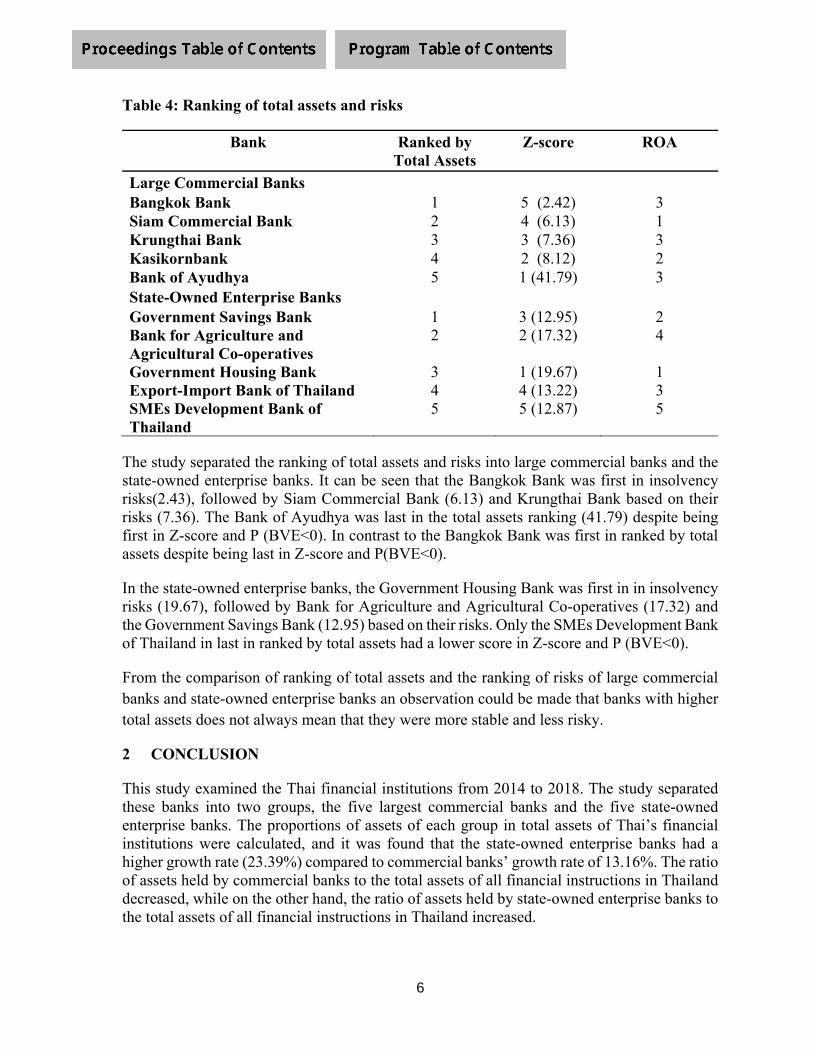
6
Table 4: Ranking of total assets and risks
Bank Ranked by Total Assets
Z-score ROA
Large Commercial Banks Bangkok Bank 1 5 (2.42) 3 Siam Commercial Bank 2 4 (6.13) 1 Krungthai Bank 3 3 (7.36) 3 Kasikornbank 4 2 (8.12) 2 Bank of Ayudhya 5 1 (41.79) 3 State-Owned Enterprise Banks Government Savings Bank 1 3 (12.95) 2 Bank for Agriculture and Agricultural Co-operatives
2 2 (17.32) 4
Government Housing Bank 3 1 (19.67) 1 Export-Import Bank of Thailand 4 4 (13.22) 3 SMEs Development Bank of Thailand
5 5 (12.87) 5
The study separated the ranking of total assets and risks into large commercial banks and the state-owned enterprise banks. It can be seen that the Bangkok Bank was first in insolvency risks(2.43), followed by Siam Commercial Bank (6.13) and Krungthai Bank based on their risks (7.36). The Bank of Ayudhya was last in the total assets ranking (41.79) despite being first in Z-score and P (BVE<0). In contrast to the Bangkok Bank was first in ranked by total assets despite being last in Z-score and P(BVE<0).
In the state-owned enterprise banks, the Government Housing Bank was first in in insolvency risks (19.67), followed by Bank for Agriculture and Agricultural Co-operatives (17.32) and the Government Savings Bank (12.95) based on their risks. Only the SMEs Development Bank of Thailand in last in ranked by total assets had a lower score in Z-score and P (BVE<0).
From the comparison of ranking of total assets and the ranking of risks of large commercial banks and state-owned enterprise banks an observation could be made that banks with higher total assets does not always mean that they were more stable and less risky.
2 CONCLUSION
This study examined the Thai financial institutions from 2014 to 2018. The study separated these banks into two groups, the five largest commercial banks and the five state-owned enterprise banks. The proportions of assets of each group in total assets of Thai’s financial institutions were calculated, and it was found that the state-owned enterprise banks had a higher growth rate (23.39%) compared to commercial banks’ growth rate of 13.16%. The ratio of assets held by commercial banks to the total assets of all financial instructions in Thailand decreased, while on the other hand, the ratio of assets held by state-owned enterprise banks to the total assets of all financial instructions in Thailand increased.
7
The study showed that the state-owned enterprise banks play a more important role in the banking sector because Thai government has a policy to inject money into the economy through state-owned enterprise banks Further, the application of a risk index (Z-score) to
measure the risks of state-owned enterprise banks and the possibility of bankruptcy found supporting evidence that state-owned enterprise banks were more stable and less risky than commercial banks. It was also found that banks with higher financial performances and capacity did not always mean that they were more stable and less risky because while averages of returns on assets of commercial banks may be greater than the state-owned enterprise banks, the commercial banks were also more risky.
6 ACKNOWLEDGMENT
This paper was supported by Faculty of management Science, Ubon Ratchathani University, which authors gratefully acknowledge.
7 REFERENCES
Bank of Thailand. 2018 Financial Stability Report. Retrieved May 6, 2019.
Tan,Y. 2016.The Impacts of Risk and Competition on Bank Profitability in China, Journal of International Financial Markets, Institutions and Money, vol.40, pp. 85-110.
Chan,S. E., M. Nagano and M. H. Lee. 2011.Ownership Structure and Risk-taking Behavior: Evidence from Bank in Korea and Japan, Asian Economic Journal, vol.25, No.2. Pp.151-175.
Cornett,M. M., L. Guo, S. Khaksari, and H. Tehranian. 2010.The Impact of State Ownership on Performance Differences in Privately-Owned Versus State-Owned Banks: An International Comparison”, Journal of financial Intermediation, vol.19, pp. 74-94.
Haw,I. M., S. S. M. Ho, B. Hu and D. Wu.2010. Concentrated Control, Institutions, and Banking Sector: an International Study, Journal of Bank and Finance, Vol.34,pp. 485–497.
Lassoued,N., H. Sassi and M. B. R. Attia. 2016.The impact of state and foreign ownership on banking risk: Evidence from the MENA countries, Research in International Business and Finance, vol.36. pp. 167-178.
Hannan,T. H. and A. Gearal.1988. Bank Insolvency Risk and Market for Large Certificates of Deposit, Journal of Money, Deposit and Banking, 1988, May, pp. 203-211, 1988.
Laeven,L. and R. Levine. 2009. Bank Governance, Regulation and Risk-Taking, Journal of Finance Economics, vol.2. pp. 259-275.
Jin,J. Y., K. Kanagaretnam, G. J. Lobo and R. Mathieu.2013. Impact of FDICIA Internal Controls on Bank Risk-Taking”, Journal of Banking and Finance, 2013, vol.37. pp. 614-624.

8
K. Kanagaretnam, C. Y. Lim, and G. J. Lobo. 2014. Influence of National Culture on Accounting Conservatism and Risk-Taking in the Banking Industry. Journal Accounting Review. vol.89, No.3. pp. 1115-1149.
Zhao,H. and S. Kang.2015. Banking Performance Evaluation in China Based on Non-Radial Super-Efficiency Data Envelopment Analysis, Procedia Economics and Finance, Prague, Czech Republic. Volume 23, 2015, pp. 197-202.
PROFITABILITY AND ORGANISATIONAL STRUCTURE OF THE WORLD´S BIGGEST STOCK EXCHANGE OPERATORS
Dorota Wiśniewska Warsaw School of Economics
Poland [email protected]
ABSTRACT
The following article is the second in the series of articles concentrating on the topic of financial analysis of stock exchange operators. The article analyses the profitability and group structure of the biggest operators of stock exchanges in the world. Nowadays, financial markets play a very important role in the global economy. Whereas modern research has concentrated on analyzing the performance of the firms listed on equity exchanges, the topic of exchange operators and how they make profits has not yet been thoroughly studied. With this article, we want to make a small step in closing this gap in research.
We analysed the sample of the ten biggest stock exchanges worldwide according to the market capitalisation of the market they are organizing. The financial information for each of them was collected, ratios calculated and analysed. The ratios have been divided into three groups: group profitability ratios, ratios of influence of separate entities from the group on its financial result and ratios of rights of minority shareholders. These groups allow for a multifaceted analysis of profitability and group structure of these organisations.
Although many of the issues regarding profitability and group structure of the leading stock exchanges have been analysed in this article, further research is needed in this field. It might reveal further interesting facts about the organization of the stock exchange operators and the way in which they create profits. As the sample in the current research was only limited to 10 biggest entities, expansion of the studies to other smaller entities may should allow a comprehensive analysis and description of the whole market.
1. INTRODUCTION
The following article is the second in the series of articles concentrating on the topic of financial analysis of stock exchange operators. The previous one, “The concept of ratio analysis of consolidated financial statements – in application to the stock exchange group” (Karmańska and Wiśniewska, 2018) has been presented on 30th Asian-Pacific Conference on International Accounting Issues in San Francisco in November 2018. It concerns the topic of ratio analysis of consolidated financial statements of one stock exchange operator. In the current article, we want to expand this analysis on multiple stock exchange operators from different countries, as a next step to a thorough analysis of the stock exchange industry all around the world. Financial markets play a very important role in the economy. Due to the fact that the markets are very closely connected with each other, financial crises, which take place regularly, have an impact on nearly all countries all around the world. Institutions that organize these markets play therefore a very important role in the stabilization of the global economy. Their main function is creation of the market where institutional and individual investors can buy and sell a variety of financial instruments with optimal liquidity. This enables the entities seeking funding to meet the investors on a single platform, thus decreasing the cost and time of individually looking for fundraisers. This main function of financial markets is provided by stock exchange operators and constitutes the basis of their operations. Moreover, institutions organizing the stock markets set up rules of trading on their market, as well as monitor compliance with them and enforce it if needed. Hence, the function of these financial institutions is twofold - on the one hand they offer the infrastructure needed for market participants to find a proper counterparty, and on the other hand supervise obeying the rules in force on the market. Stock exchanges have gone through huge organizational changes in the last two decades. In the past, trading on the market looked just as we know it from the movies – brokers working on the trading floor, running and screaming with the orders from their clients. With the rapid improvements in technology trade has become fully electronic with brokers (now called market specialists) performing all of the trades with use of a computer system. This has lead to increases in efficiency and decreases in costs. Together with growing globalization and deregulation in the financial sector, institutions which organize the stock markets have gradually changed their organizational structure. First, from mutual organizations, owned by and run for the benefits of its members (brokers in this case), they changed to for-profit companies in a process called demutualization. The first institution which went this measure was Stockholm Stock Exchange in 1993. Secondly, some of these for-profit organizations decided to list on the self-run market. The forerunner in this step was the Australian Stock Exchange which demutualized and went public at the same time in 1998 (Mendiola and O’Hara, 2003). Since that time more and more organizations have followed in their footsteps. In 2017 more than two thirds of the members of the World Federation of Exchanges, the biggest worldwide association of exchanges and clearing houses1, have been for-profit organizations (Slimane and Angulo, 2018). In the recent years another trend can be seen in this industry, namely increase of mergers and acquisitions (M&A). As many local players cannot compete with the growing competition from bigger rivals, they merge with operators from other markets, both in the same country, as well as internationally, forming big unified markets. Such mergers are however always subject to antitrust law enforced by many
1 See: https://www.world-exchanges.org/

international organizations like the European Commission in the EU, in addition to increased public scrutiny. This change from local mutual companies to international listed corporations show the increasing importance of such entities in the current economy. These are the entities which create the rules according to which the capital markets function. With increase in their size also the power they have over the markets increases. On the other hand, they act as regulators of these markets, supervising if the rules in force are obeyed by market participant. Being listed on the stock exchange, market operator becomes the market participant at the same time and has to obey the rules which they set up. This increases the possibility for fraudulent behavior and calls for proper supervision and understanding of these specific entities. However, this topic has not yet been thoroughly analyzed in international research and therefore we aim to fill this gap with our research.
2. LITERATURE REVIEW
Most of the research where the topic of the stock exchanges is present is the analysis of companies listed on a given stock exchange. Researchers use these companies’ samples as a good approximation of the market. However, the analysis of the other side, i.e. the operators of the market, is not so comprehensive. Moreover, due to the changes which the stock exchanges underwent in the last two decades, most of the research made before that time describes the reality which does not exist anymore and is therefore of little usage. The current research on the topic of stock exchanges concentrates on the following three core areas:
a) Demutualization of the stock exchanges, b) Mergers and acquisitions activity, c) Stock exchanges as self-regulatory organisations.
First of the currents is the process of demutualization itself. These works describe the change of the business model, explain the reasons driving to demutualization (Aggarwal and Dahiya, 2006), mostly illustrated by case studies of some leading exchange groups (Otchere and Abou-Zied, 2008). They analyze the financial performance of these entities before and after demutualization (Aggarwal and Steil, 2002) and initial public offering (Otchere, 2006, Mendiola and O’Hara, 2003) or compare it with those firms which were still in the form of mutual companies (Serifsoy, 2005). Other authors have analyzed the corporate governance restructuring of a stock exchange organisation following its conversion from a non-profit to a for-profit structure (Angulo and Slimane, 2018). The most recent works concentrate on the topic of M&A activity between the stock market operators. In order to be more competitive both small local exchange operators as well as large conglomerates merge with their competitors in order to increase their market. Researchers describe the drivers that lead to stock exchange integration (Dorodnykh, 2014). They also analyse the case studies of real mergers in the industry – both the successful and the not successful ones. Slimane concentrates on the merger between a number of European markets which lead to the creation of a single platform for Lisbon, Paris, Amsterdam and Brussels (Euronext) and checks if it affected the market risk (Slimane, 2012). Osaki describes the barriers which can hinder horizontal integration in this sector on the example of the merger of Tokyo and Osaka Stock Exchanges to form the Japan Exchange Group (Osaki, 2012). Mourselas and Comte analyze the reasons why the merger between London Stock Exchange and Deutsche Börse Group did not take place (Mourselas and Comte, 2017).

The next topic described by some of the researchers is the already-mentioned question of regulating the regulators. As the main source of income for stock exchanges are listing fees and commissions, it is true that the more transactions are being made on the market, the more income does the market operator earn. This can lead to the willingness of decreasing the listing requirements or increasing trading possibilities in order to increase stock market operators´ own income. This topic has already been recognised at the beginning of the demutualization period. Movsesyan describes in his work not only the process of demutualization itself but more importantly the impact it may have on the role of stock exchanges as self-regulatory organisations (SROs) (Movsesyan 2007). There have also been discussions made regarding the possible amendments to the law to adjust it to the new reality (Fleckner, 2006). Of interest was also the impact that changing ownership of and competition among stock exchanges will have on the corporate governance on the companies listed on them - the impact on listing, maintenance and disclosure requirements (Christiansen and Koldertsova, 2009). It was also checked that the strength of stock exchange monitoring is positively associated with firms performance (Hassan, 2017). It can be seen that none of these currents concentrate on the profitability of the stock exchange operators, how it is achieved and what impact on the profits has the structure of the corporate group of the market organizer. Therefore, this article aims to fill in this gap and hopefully start more discussions and research in this field.
3. DATA
This study is based on a sample of the ten biggest stock exchanges worldwide according to the capitalisation of the market they are organizing. The World Federation of Exchanges collects relevant information from the stock exchanges all around the world. As at 31.12.2018 there were 80 equity markets included in their statistics2. From this group companies which are private for-profit organisations were selected. Such restriction had to be met, as mutual companies are an outdated structure in the current markets and public companies usually do not publish their financial information which makes the analysis impossible. Following these criteria, markets with the biggest market capitalisation have been selected. Two Chinese stock exchanges had to be excluded from the sample, as they are owned by the government (Shanghai Stock Exchange which would have taken place 4 and Shenzen Stock Exchange on place 8). None of the companies had to be excluded from the first tenth because it was a mutual organisation. The following 10 markets have been selected for this study:
Table 1: Study sample No. Name Country
of registered office Equity market(s) operated
1 Intercontinentalexchange Group, Inc. (ICE)
USA NYSE (since 2013)3
2 NASDAQ, Inc. (NASDAQ) USA NASDAQ, NASDAQ Nordic (Copenhagen, Stockholm, Helsinki, Iceland, Tallinn, Riga, Vilnius, Armenia - all since 2008)
3 Japan Exchange Group, Inc. (JPX) Japan Tokyo, Osaka (since 2012)
2 See: focus.world-exchanges.org/issue/december-2018/market-statistics 3 Until 2012 part of NYSE Euronext
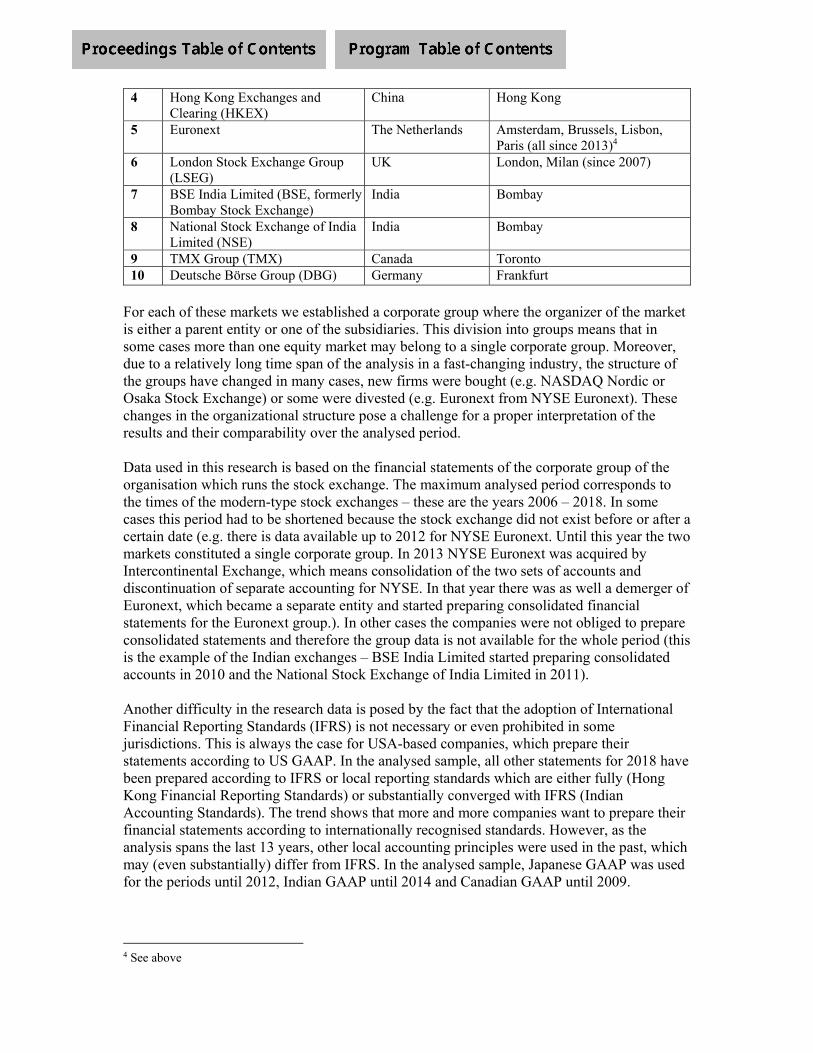
4 Hong Kong Exchanges and Clearing (HKEX)
China Hong Kong
5 Euronext The Netherlands Amsterdam, Brussels, Lisbon, Paris (all since 2013)4
6 London Stock Exchange Group (LSEG)
UK London, Milan (since 2007)
7 BSE India Limited (BSE, formerly Bombay Stock Exchange)
India Bombay
8 National Stock Exchange of India Limited (NSE)
India Bombay
9 TMX Group (TMX) Canada Toronto 10 Deutsche Börse Group (DBG) Germany Frankfurt
For each of these markets we established a corporate group where the organizer of the market is either a parent entity or one of the subsidiaries. This division into groups means that in some cases more than one equity market may belong to a single corporate group. Moreover, due to a relatively long time span of the analysis in a fast-changing industry, the structure of the groups have changed in many cases, new firms were bought (e.g. NASDAQ Nordic or Osaka Stock Exchange) or some were divested (e.g. Euronext from NYSE Euronext). These changes in the organizational structure pose a challenge for a proper interpretation of the results and their comparability over the analysed period. Data used in this research is based on the financial statements of the corporate group of the organisation which runs the stock exchange. The maximum analysed period corresponds to the times of the modern-type stock exchanges – these are the years 2006 – 2018. In some cases this period had to be shortened because the stock exchange did not exist before or after a certain date (e.g. there is data available up to 2012 for NYSE Euronext. Until this year the two markets constituted a single corporate group. In 2013 NYSE Euronext was acquired by Intercontinental Exchange, which means consolidation of the two sets of accounts and discontinuation of separate accounting for NYSE. In that year there was as well a demerger of Euronext, which became a separate entity and started preparing consolidated financial statements for the Euronext group.). In other cases the companies were not obliged to prepare consolidated statements and therefore the group data is not available for the whole period (this is the example of the Indian exchanges – BSE India Limited started preparing consolidated accounts in 2010 and the National Stock Exchange of India Limited in 2011). Another difficulty in the research data is posed by the fact that the adoption of International Financial Reporting Standards (IFRS) is not necessary or even prohibited in some jurisdictions. This is always the case for USA-based companies, which prepare their statements according to US GAAP. In the analysed sample, all other statements for 2018 have been prepared according to IFRS or local reporting standards which are either fully (Hong Kong Financial Reporting Standards) or substantially converged with IFRS (Indian Accounting Standards). The trend shows that more and more companies want to prepare their financial statements according to internationally recognised standards. However, as the analysis spans the last 13 years, other local accounting principles were used in the past, which may (even substantially) differ from IFRS. In the analysed sample, Japanese GAAP was used for the periods until 2012, Indian GAAP until 2014 and Canadian GAAP until 2009.
4 See above

Most of the analysed entities have a financial year ending 31.12. However, three of them (Japan Exchange Group, BSE India Limited and National Stock Exchange of India Limited5) have a shifted financial year ending 31.03. The financial results of these companies have been classified according to their financial year (FY), meaning that e.g. FY2018 ends on 31.03.2019. This causes some further problems to the analysis, as at the time of the writing of the article no data has been already published for the year ended 31.03.2019.
4. METHODOLOGY
As the first step to a comprehensive analysis of stock exchanges worldwide, in this article we have concentrated on the ratio analysis of consolidated financial statements of the ten leading exchange markets. This analysis is based on the model of financial ratios for consolidated financial statements created by Karmańska (Karmańska, 2006) and described in detail by Karmańska and Wiśniewska (Karmańska and Wiśniewska, 2018). This is a set of 38 ratios which describe different aspects of a corporate group. The uniqueness of this model is due to the fact that it concentrates on the analysis of the whole group of companies and not only the parent entity or one of the subsidiaries. This means that for the calculation of the ratios the consolidated numbers for the whole group are used and so the results must be analysed at the group level. The set can be divided into two parts. The first part consists of traditional ratios as known from other financial analysis models, like the ones describing profitability, payment capabilities, cash flows and indebtedness of the corporate group. However, the biggest value added of this model lies in two additional sets of ratios concentrating on the structure of the corporate group and the division of profits between the group and other owners. Such analysis cannot be performed for individual financial statements and therefore shows that usage of ratios created for individual statements for the analysis of corporate groups is not appropriate, as will omit analysing this important aspect of the group accounts. These two areas are the influence of separate entities on the group result and the rights of minority shareholders. In order to concentrate on the profitability of the groups of companies which run the stock exchanges, the following groups of ratios have been selected:
a) Set A: Group profitability ratios (3 selected ratios) b) Set B: Ratios of influence of separate entities from the group on its financial result (all
5 ratios) c) Set F: Ratios of rights of minority shareholders (all 3 ratios)
The data needed for the calculations of these ratios was collected manually by downloading consolidated financial statements and annual reports available mainly in the Investor Relation sections of the official group websites of the stock exchange operators. In some cases the financial statements were collected from official databases like the EDGAR database of the U.S. Securities and Exchange Commission. If available, also separate financial statements of the parent entity were collected. These statements were then analysed and the needed numbers included in the previously introduced model. As far as the data availability has allowed, all 11 ratios have been calculated for each of the corporate groups. These results and their analysis has been described below.
5 Also London Stock Exchange Group until 31.03.2014.
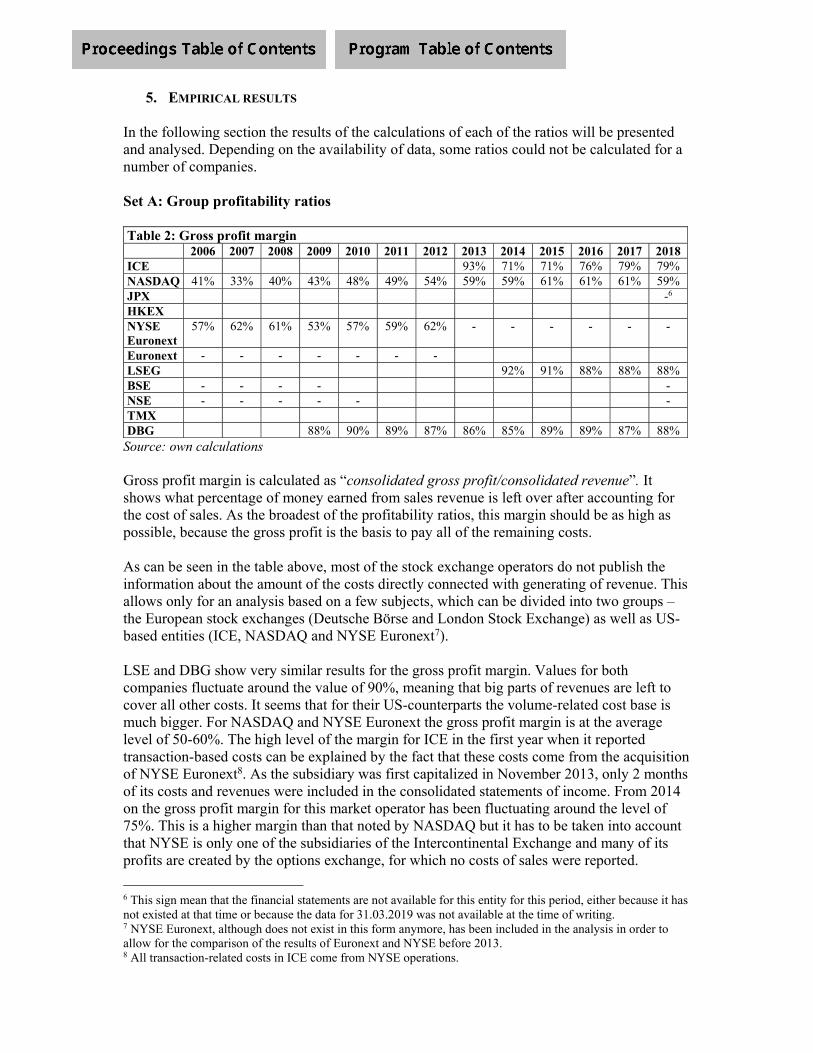
5. EMPIRICAL RESULTS
In the following section the results of the calculations of each of the ratios will be presented and analysed. Depending on the availability of data, some ratios could not be calculated for a number of companies. Set A: Group profitability ratios Table 2: Gross profit margin 2006 2007 2008 2009 2010 2011 2012 2013 2014 2015 2016 2017 2018ICE 93% 71% 71% 76% 79% 79% NASDAQ 41% 33% 40% 43% 48% 49% 54% 59% 59% 61% 61% 61% 59% JPX -6 HKEX NYSE Euronext
57% 62% 61% 53% 57% 59% 62% - - - - - -
Euronext - - - - - - - LSEG 92% 91% 88% 88% 88%BSE - - - - - NSE - - - - - - TMX DBG 88% 90% 89% 87% 86% 85% 89% 89% 87% 88%
Source: own calculations Gross profit margin is calculated as “consolidated gross profit/consolidated revenue”. It shows what percentage of money earned from sales revenue is left over after accounting for the cost of sales. As the broadest of the profitability ratios, this margin should be as high as possible, because the gross profit is the basis to pay all of the remaining costs. As can be seen in the table above, most of the stock exchange operators do not publish the information about the amount of the costs directly connected with generating of revenue. This allows only for an analysis based on a few subjects, which can be divided into two groups – the European stock exchanges (Deutsche Börse and London Stock Exchange) as well as US-based entities (ICE, NASDAQ and NYSE Euronext7). LSE and DBG show very similar results for the gross profit margin. Values for both companies fluctuate around the value of 90%, meaning that big parts of revenues are left to cover all other costs. It seems that for their US-counterparts the volume-related cost base is much bigger. For NASDAQ and NYSE Euronext the gross profit margin is at the average level of 50-60%. The high level of the margin for ICE in the first year when it reported transaction-based costs can be explained by the fact that these costs come from the acquisition of NYSE Euronext8. As the subsidiary was first capitalized in November 2013, only 2 months of its costs and revenues were included in the consolidated statements of income. From 2014 on the gross profit margin for this market operator has been fluctuating around the level of 75%. This is a higher margin than that noted by NASDAQ but it has to be taken into account that NYSE is only one of the subsidiaries of the Intercontinental Exchange and many of its profits are created by the options exchange, for which no costs of sales were reported.
6 This sign mean that the financial statements are not available for this entity for this period, either because it has not existed at that time or because the data for 31.03.2019 was not available at the time of writing. 7 NYSE Euronext, although does not exist in this form anymore, has been included in the analysis in order to allow for the comparison of the results of Euronext and NYSE before 2013. 8 All transaction-related costs in ICE come from NYSE operations.
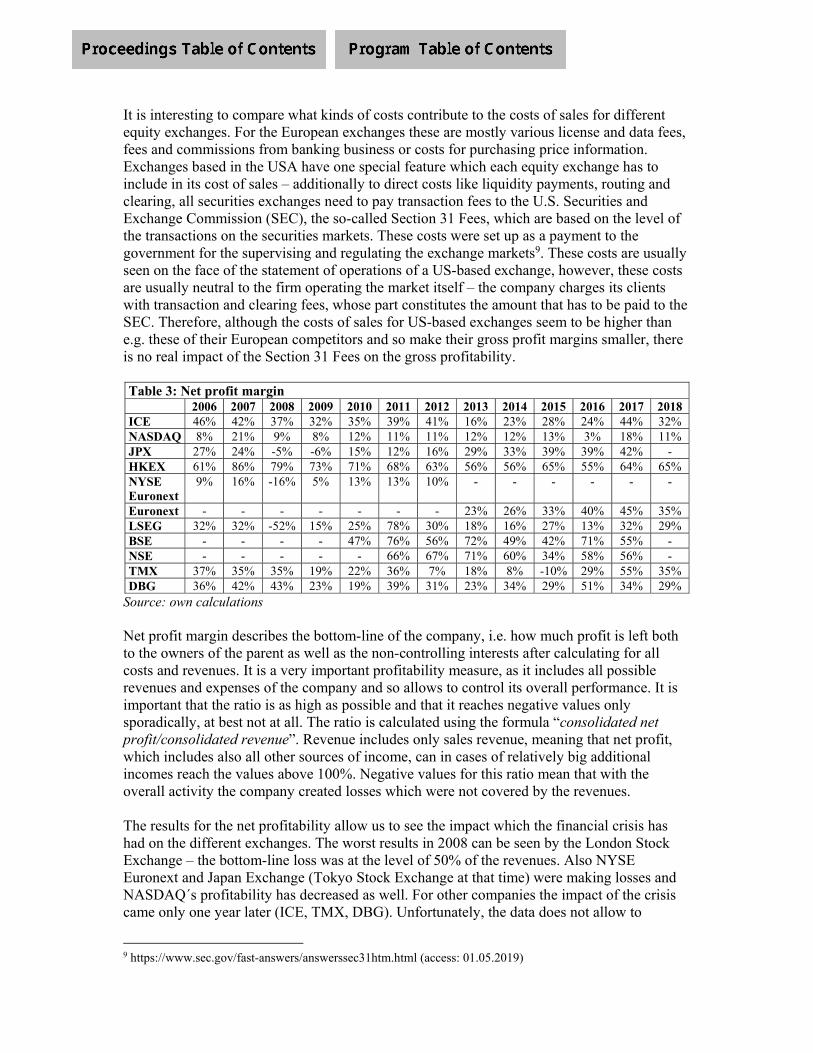
It is interesting to compare what kinds of costs contribute to the costs of sales for different equity exchanges. For the European exchanges these are mostly various license and data fees, fees and commissions from banking business or costs for purchasing price information. Exchanges based in the USA have one special feature which each equity exchange has to include in its cost of sales – additionally to direct costs like liquidity payments, routing and clearing, all securities exchanges need to pay transaction fees to the U.S. Securities and Exchange Commission (SEC), the so-called Section 31 Fees, which are based on the level of the transactions on the securities markets. These costs were set up as a payment to the government for the supervising and regulating the exchange markets9. These costs are usually seen on the face of the statement of operations of a US-based exchange, however, these costs are usually neutral to the firm operating the market itself – the company charges its clients with transaction and clearing fees, whose part constitutes the amount that has to be paid to the SEC. Therefore, although the costs of sales for US-based exchanges seem to be higher than e.g. these of their European competitors and so make their gross profit margins smaller, there is no real impact of the Section 31 Fees on the gross profitability. Table 3: Net profit margin 2006 2007 2008 2009 2010 2011 2012 2013 2014 2015 2016 2017 2018 ICE 46% 42% 37% 32% 35% 39% 41% 16% 23% 28% 24% 44% 32% NASDAQ 8% 21% 9% 8% 12% 11% 11% 12% 12% 13% 3% 18% 11%JPX 27% 24% -5% -6% 15% 12% 16% 29% 33% 39% 39% 42% - HKEX 61% 86% 79% 73% 71% 68% 63% 56% 56% 65% 55% 64% 65% NYSE Euronext
9% 16% -16% 5% 13% 13% 10% - - - - - -
Euronext - - - - - - - 23% 26% 33% 40% 45% 35% LSEG 32% 32% -52% 15% 25% 78% 30% 18% 16% 27% 13% 32% 29% BSE - - - - 47% 76% 56% 72% 49% 42% 71% 55% - NSE - - - - - 66% 67% 71% 60% 34% 58% 56% - TMX 37% 35% 35% 19% 22% 36% 7% 18% 8% -10% 29% 55% 35%DBG 36% 42% 43% 23% 19% 39% 31% 23% 34% 29% 51% 34% 29%
Source: own calculations Net profit margin describes the bottom-line of the company, i.e. how much profit is left both to the owners of the parent as well as the non-controlling interests after calculating for all costs and revenues. It is a very important profitability measure, as it includes all possible revenues and expenses of the company and so allows to control its overall performance. It is important that the ratio is as high as possible and that it reaches negative values only sporadically, at best not at all. The ratio is calculated using the formula “consolidated net profit/consolidated revenue”. Revenue includes only sales revenue, meaning that net profit, which includes also all other sources of income, can in cases of relatively big additional incomes reach the values above 100%. Negative values for this ratio mean that with the overall activity the company created losses which were not covered by the revenues. The results for the net profitability allow us to see the impact which the financial crisis has had on the different exchanges. The worst results in 2008 can be seen by the London Stock Exchange – the bottom-line loss was at the level of 50% of the revenues. Also NYSE Euronext and Japan Exchange (Tokyo Stock Exchange at that time) were making losses and NASDAQ´s profitability has decreased as well. For other companies the impact of the crisis came only one year later (ICE, TMX, DBG). Unfortunately, the data does not allow to
9 https://www.sec.gov/fast-answers/answerssec31htm.html (access: 01.05.2019)

compare the profitability of the Indian stock exchanges at that time, but it can be seen that the Chinese market has not been so dramatically impacted by the crisis – although after the peak in 2007 the profitability has been slightly decreasing, a typical trough is not seen there in the following years. After the crisis the exchange operators started increasing their profitability again with very high values reached in 2011. After that time the net profit margins for nearly all of the exchanges have been narrowing to the level of 30-40%. The net profitability for the stock exchange operators can be divided into three visible groups: high net profitability operators (HKEX, BSE and NSE) with average profitability at the level of 60-65%. Middle profitability exchange operators reach the level of net income in comparison with sales revenue of about 25-35% (DBG, Euronext, ICE, JPX and very volatile LSEG and TMX). The last stock exchange operator with a surprisingly low net profitability is NASDAQ10. It achieved the average net profit margin of only 11% with its maximum reaching 21% in 2007. The next part of our research will go into the direction of searching for reasons for such differences in profitability. Table 4: Return on equity 2006 2007 2008 2009 2010 2011 2012 2013 2014 2015 2016 2017 2018ICE 48% 19% 18% 15% 17% 20% 18% 2% 9% 9% 10% 18% 13% NASDAQ 10% 31% 8% 6% 9% 8% 7% 7% 8% 8% 2% 14% 9% JPX 22% 18% -3% -3% 8% 5% 7% 19% 17% 21% 20% 23% - HKEX 92% 279% 237% 142% 138% 125% 30% 29% 32% 36% 22% 25% 30%NYSE Euronext
14% 7% -10% 3% 9% 10% 6% - - - - - -
Euronext - - - - - - - 60% 53% 63% 56% 51% 38%LSEG 62% -32% -22% 10% 20% 24% 19% 13% 5% 14% 5% 19% 17%BSE - - - - - 9% 5% 6% 7% 6% 9% 9% - NSE - - - - - 23% 19% 21% 22% 10% 20% 25% - TMX 138% 114% 30% 16% 29% 25% 1% 4% 4% -2% 7% 13% 9% DBG 42% 62% 64% 21% 16% 41% 28% 19% 29% 23% 40% 22% 21%
Source: own calculations Return on equity (ROE) measures how much of net profit the company is able to generate with the use of equity belonging only to the shareholders of the parent. This shows the efficiency of the group in terms of profit making. It is calculated as follows: “net profit attributable to the owners of the parent/(shareholders´ equity – net profit attributable to the owners of the parent + gains on bargain purchase11”). Shareholders can use this ratio in order to see how efficiently their money is being used to create net profits for the group. During the evaluation of the return of equity for the analysed sample different management strategies for the appropriation of income and share issuance can be seen. First of all, a significant drop of ROE for some stock exchange operators can be seen during the years of the crisis in 2007-2009. A drop from sometimes really high levels can be seen for HKEX, TMX, LSEG and DBG. However, some stock exchanges reach comparable ROEs over the
10 NYSE Euronext is excluded from this analysis as the data available spans only the period of 2006 until 2012 and so may be in a major part biased by the financial crisis. 11 This element of the ratio creates a little bit of inconsistency. From the methodological point of view, gain on bargain purchase in this ratio is included in its full value, although it relates to the assets to which the right have both the parent entity and the non-controlling interest. In order for the ratio to be fully correct, an average level of financing of the group assets by the non-controlling interest should have been calculated and then multiplied by the gain on bargain purchase in order to eliminate the part created due to the participation of the non-controlling interest. However, as gains on bargain purchase exist very rarely, this aspect has been ignored.

analysed period – the return for BSE fluctuates about the level of 7%, for NASDAQ it is10%, JPX - 13% and NSE - 20%. Euronext reaches very high results for the whole period – for all of the years as separate corporate group, Euronext has reached the level of 53% on average. Due to the fact that less than a half of the yearly results are paid out in dividends, from year to year shareholder´s equity is increasing, what leads to a constant decrease in the ratio. Another stock exchange group which used to reach extremely high levels of return on equity was HKEX. Until 2011 their average ROE was on an astonishing level of 168%. In these years the management had a strategy of paying out most of the profits in the form of dividends to the shareholders. In 2011 the firm started issuing additional shares, which lead to increases in shareholder´s equity and therefore decrease in the ratio. Issuance of additional shares was also the reason for a dramatic decrease in the ratio for TMX from 114% in 2007 to 30% in 2008. Moreover, significant acquisitions can be seen in this analysis as well. The ROE of the Intercontinental Exchange decreased on average from 22% to 12% after the acquisition of NYSE Euronext in 2013. This can be seen as well in the case of TMX, which bought one on its subsidiaries in 2012 (average ROE of 25% before and 5% after the acquisition). Set B: Ratios of influence of separate entities from the group on its financial results Table 5: Impact of parent entity on profit or loss attributable to the group 2006 2007 2008 2009 2010 2011 2012 2013 2014 2015 2016 2017 2018ICE NASDAQ JPX -HKEX 71% 126% 114% 98% 95%NYSE Euronext
- - - - - -
Euronext - - - - - - - - 100% 100% 100% 100% 100%Euronext adjusted
- - - - - - - - 41% 7% -1% -5% -4%
LSEG 7% 87% -450% 77% 90% 31% 81% 34% 130% 16% 349% 7% 29%BSE - - - - - - 27% 55% 65% 94% 90% 79% - NSE - - - - - 79% 102% 106% 76% 69% 85% 79% - TMX DBG 92% 85% 94% 91% 66% 79% 94% 86% 56% 47% 43% 70% 65% Source: own calculations Impact of parent entity on profit or loss attributable to the group is the first from the set of three ratios created to analyse the impact of the structure of the group on its financial result. These ratios aim to discover what part of the consolidated profits are attributable to the activities of the parent company, which gains have the subsidiaries created and to what extent the associates and joint ventures have an impact on group profits. Such analysis helps to discover how the group is structured – if most of the profit-making activities lie with the parent company or are moved to other parts of the group. If the profits are concentrated only in one entity, fluctuations in its results will have a big impact on the group profitability as well. This ratio tries to evaluate the impact of the parent entity on the overall results of the group. It is calculated using the formula “net profit of the parent entity/(net profit attributable to the shareholders of the parent + impairment losses on goodwill from subsidiaries – gain on bargain purchase of subsidiaries)”. The denominator of the ratio tries to create the net profit of the corporate group in such a way which will eliminate those effects of consolidation which
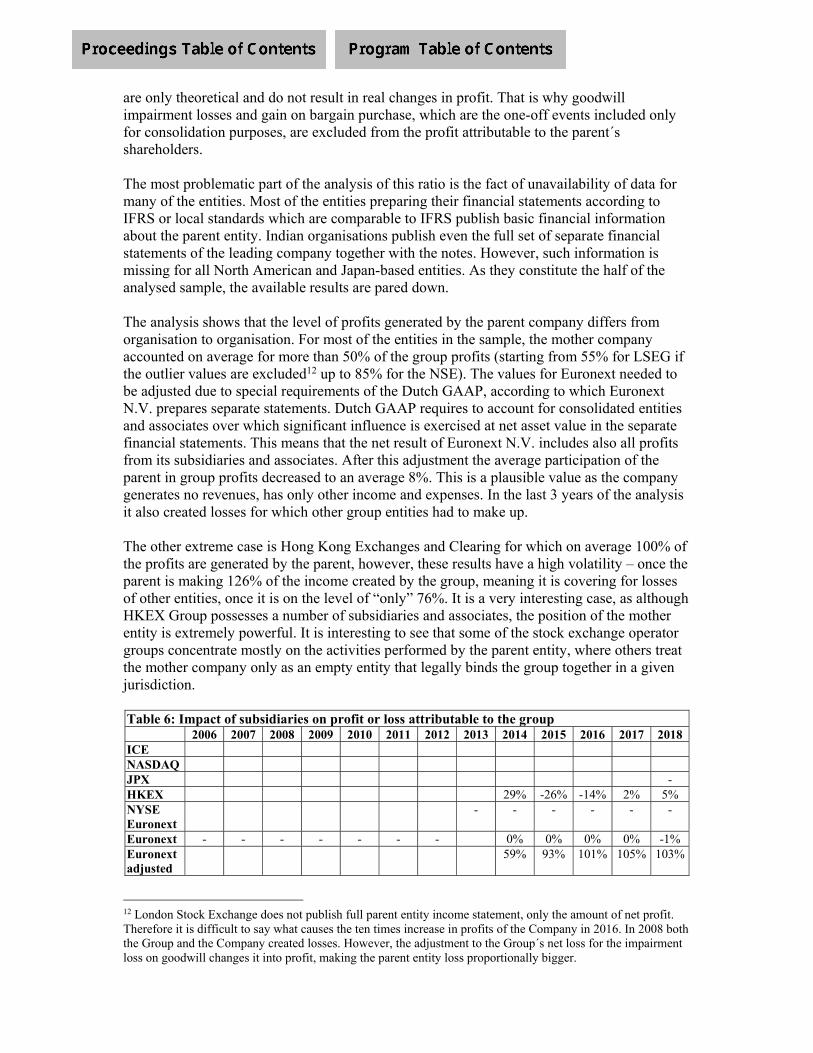
are only theoretical and do not result in real changes in profit. That is why goodwill impairment losses and gain on bargain purchase, which are the one-off events included only for consolidation purposes, are excluded from the profit attributable to the parent´s shareholders. The most problematic part of the analysis of this ratio is the fact of unavailability of data for many of the entities. Most of the entities preparing their financial statements according to IFRS or local standards which are comparable to IFRS publish basic financial information about the parent entity. Indian organisations publish even the full set of separate financial statements of the leading company together with the notes. However, such information is missing for all North American and Japan-based entities. As they constitute the half of the analysed sample, the available results are pared down. The analysis shows that the level of profits generated by the parent company differs from organisation to organisation. For most of the entities in the sample, the mother company accounted on average for more than 50% of the group profits (starting from 55% for LSEG if the outlier values are excluded12 up to 85% for the NSE). The values for Euronext needed to be adjusted due to special requirements of the Dutch GAAP, according to which Euronext N.V. prepares separate statements. Dutch GAAP requires to account for consolidated entities and associates over which significant influence is exercised at net asset value in the separate financial statements. This means that the net result of Euronext N.V. includes also all profits from its subsidiaries and associates. After this adjustment the average participation of the parent in group profits decreased to an average 8%. This is a plausible value as the company generates no revenues, has only other income and expenses. In the last 3 years of the analysis it also created losses for which other group entities had to make up. The other extreme case is Hong Kong Exchanges and Clearing for which on average 100% of the profits are generated by the parent, however, these results have a high volatility – once the parent is making 126% of the income created by the group, meaning it is covering for losses of other entities, once it is on the level of “only” 76%. It is a very interesting case, as although HKEX Group possesses a number of subsidiaries and associates, the position of the mother entity is extremely powerful. It is interesting to see that some of the stock exchange operator groups concentrate mostly on the activities performed by the parent entity, where others treat the mother company only as an empty entity that legally binds the group together in a given jurisdiction. Table 6: Impact of subsidiaries on profit or loss attributable to the group 2006 2007 2008 2009 2010 2011 2012 2013 2014 2015 2016 2017 2018 ICE NASDAQ JPX - HKEX 29% -26% -14% 2% 5% NYSE Euronext
- - - - - -
Euronext - - - - - - - 0% 0% 0% 0% -1% Euronext adjusted
59% 93% 101% 105% 103%
12 London Stock Exchange does not publish full parent entity income statement, only the amount of net profit. Therefore it is difficult to say what causes the ten times increase in profits of the Company in 2016. In 2008 both the Group and the Company created losses. However, the adjustment to the Group´s net loss for the impairment loss on goodwill changes it into profit, making the parent entity loss proportionally bigger.
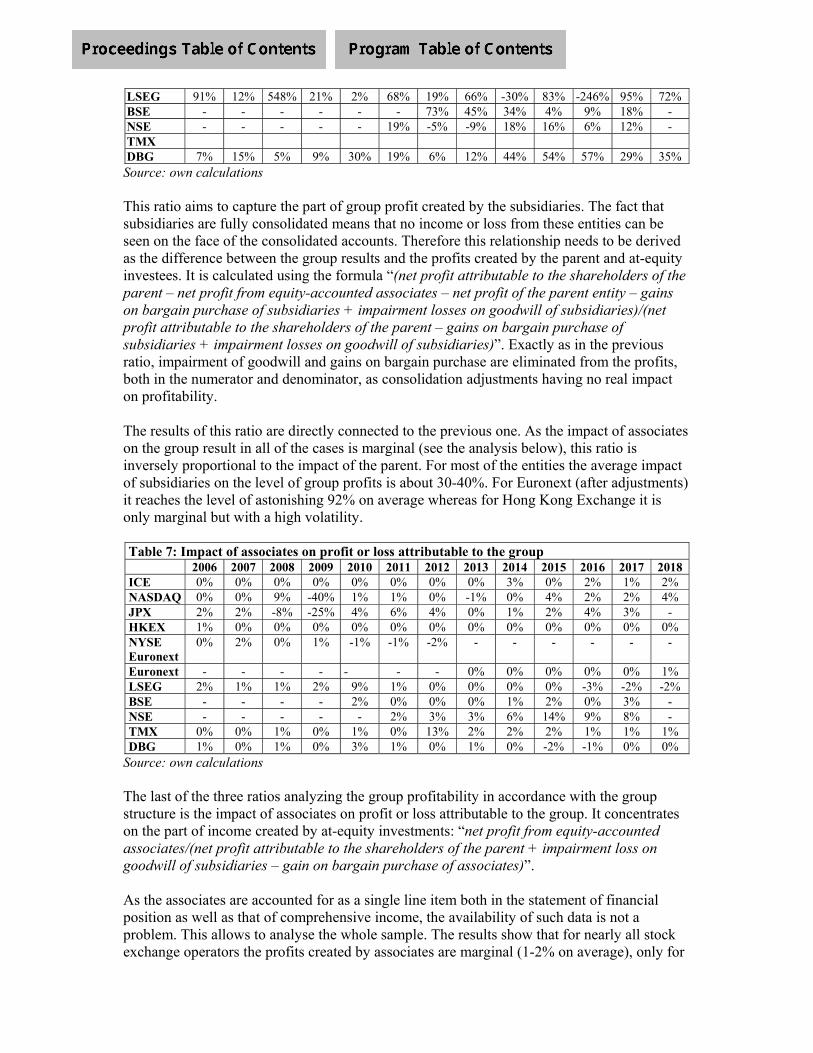
LSEG 91% 12% 548% 21% 2% 68% 19% 66% -30% 83% -246% 95% 72%BSE - - - - - - 73% 45% 34% 4% 9% 18% -NSE - - - - - 19% -5% -9% 18% 16% 6% 12% - TMX DBG 7% 15% 5% 9% 30% 19% 6% 12% 44% 54% 57% 29% 35%
Source: own calculations This ratio aims to capture the part of group profit created by the subsidiaries. The fact that subsidiaries are fully consolidated means that no income or loss from these entities can be seen on the face of the consolidated accounts. Therefore this relationship needs to be derived as the difference between the group results and the profits created by the parent and at-equity investees. It is calculated using the formula “(net profit attributable to the shareholders of the parent – net profit from equity-accounted associates – net profit of the parent entity – gains on bargain purchase of subsidiaries + impairment losses on goodwill of subsidiaries)/(net profit attributable to the shareholders of the parent – gains on bargain purchase of subsidiaries + impairment losses on goodwill of subsidiaries)”. Exactly as in the previous ratio, impairment of goodwill and gains on bargain purchase are eliminated from the profits, both in the numerator and denominator, as consolidation adjustments having no real impact on profitability. The results of this ratio are directly connected to the previous one. As the impact of associates on the group result in all of the cases is marginal (see the analysis below), this ratio is inversely proportional to the impact of the parent. For most of the entities the average impact of subsidiaries on the level of group profits is about 30-40%. For Euronext (after adjustments) it reaches the level of astonishing 92% on average whereas for Hong Kong Exchange it is only marginal but with a high volatility. Table 7: Impact of associates on profit or loss attributable to the group 2006 2007 2008 2009 2010 2011 2012 2013 2014 2015 2016 2017 2018ICE 0% 0% 0% 0% 0% 0% 0% 0% 3% 0% 2% 1% 2% NASDAQ 0% 0% 9% -40% 1% 1% 0% -1% 0% 4% 2% 2% 4% JPX 2% 2% -8% -25% 4% 6% 4% 0% 1% 2% 4% 3% - HKEX 1% 0% 0% 0% 0% 0% 0% 0% 0% 0% 0% 0% 0% NYSE Euronext
0% 2% 0% 1% -1% -1% -2% - - - - - -
Euronext - - - - - - - 0% 0% 0% 0% 0% 1% LSEG 2% 1% 1% 2% 9% 1% 0% 0% 0% 0% -3% -2% -2%BSE - - - - 2% 0% 0% 0% 1% 2% 0% 3% -NSE - - - - - 2% 3% 3% 6% 14% 9% 8% - TMX 0% 0% 1% 0% 1% 0% 13% 2% 2% 2% 1% 1% 1% DBG 1% 0% 1% 0% 3% 1% 0% 1% 0% -2% -1% 0% 0%
Source: own calculations The last of the three ratios analyzing the group profitability in accordance with the group structure is the impact of associates on profit or loss attributable to the group. It concentrates on the part of income created by at-equity investments: “net profit from equity-accounted associates/(net profit attributable to the shareholders of the parent + impairment loss on goodwill of subsidiaries – gain on bargain purchase of associates)”. As the associates are accounted for as a single line item both in the statement of financial position as well as that of comprehensive income, the availability of such data is not a problem. This allows to analyse the whole sample. The results show that for nearly all stock exchange operators the profits created by associates are marginal (1-2% on average), only for
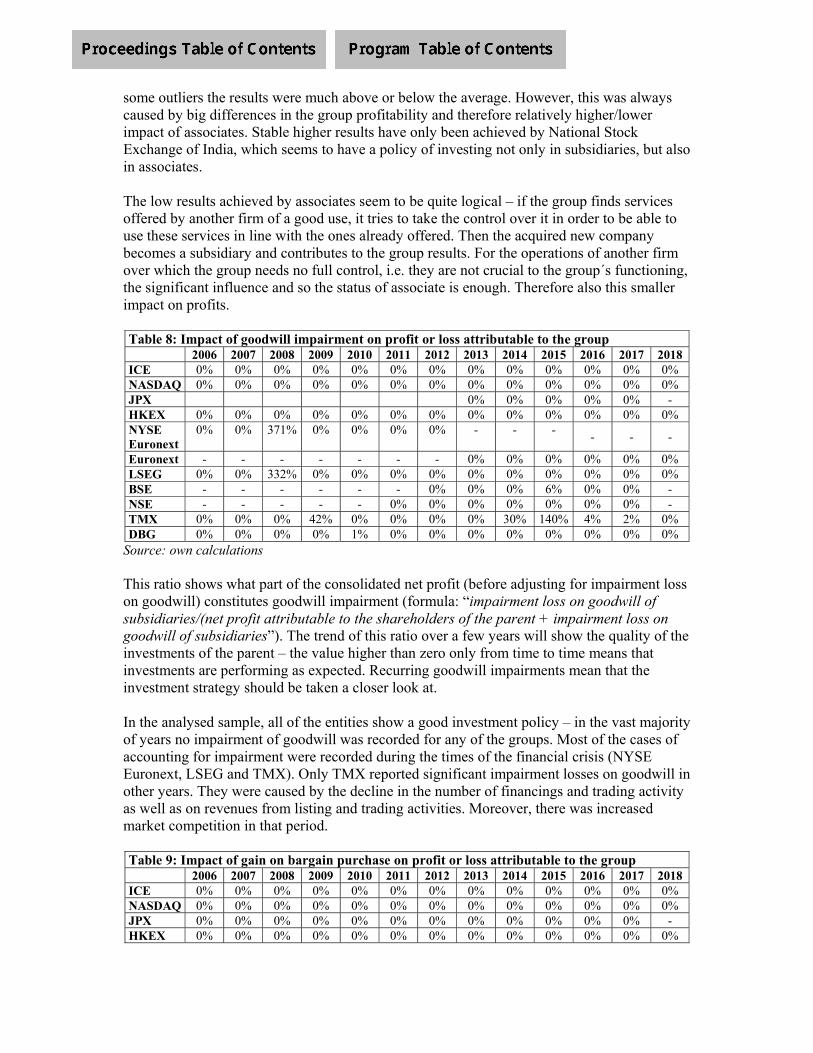
some outliers the results were much above or below the average. However, this was always caused by big differences in the group profitability and therefore relatively higher/lower impact of associates. Stable higher results have only been achieved by National Stock Exchange of India, which seems to have a policy of investing not only in subsidiaries, but also in associates. The low results achieved by associates seem to be quite logical – if the group finds services offered by another firm of a good use, it tries to take the control over it in order to be able to use these services in line with the ones already offered. Then the acquired new company becomes a subsidiary and contributes to the group results. For the operations of another firm over which the group needs no full control, i.e. they are not crucial to the group´s functioning, the significant influence and so the status of associate is enough. Therefore also this smaller impact on profits. Table 8: Impact of goodwill impairment on profit or loss attributable to the group 2006 2007 2008 2009 2010 2011 2012 2013 2014 2015 2016 2017 2018 ICE 0% 0% 0% 0% 0% 0% 0% 0% 0% 0% 0% 0% 0% NASDAQ 0% 0% 0% 0% 0% 0% 0% 0% 0% 0% 0% 0% 0% JPX 0% 0% 0% 0% 0% -HKEX 0% 0% 0% 0% 0% 0% 0% 0% 0% 0% 0% 0% 0% NYSE Euronext
0% 0% 371% 0% 0% 0% 0% - - - - - -
Euronext - - - - - - - 0% 0% 0% 0% 0% 0% LSEG 0% 0% 332% 0% 0% 0% 0% 0% 0% 0% 0% 0% 0% BSE - - - - - - 0% 0% 0% 6% 0% 0% - NSE - - - - - 0% 0% 0% 0% 0% 0% 0% - TMX 0% 0% 0% 42% 0% 0% 0% 0% 30% 140% 4% 2% 0% DBG 0% 0% 0% 0% 1% 0% 0% 0% 0% 0% 0% 0% 0%
Source: own calculations This ratio shows what part of the consolidated net profit (before adjusting for impairment loss on goodwill) constitutes goodwill impairment (formula: “impairment loss on goodwill of subsidiaries/(net profit attributable to the shareholders of the parent + impairment loss on goodwill of subsidiaries”). The trend of this ratio over a few years will show the quality of the investments of the parent – the value higher than zero only from time to time means that investments are performing as expected. Recurring goodwill impairments mean that the investment strategy should be taken a closer look at. In the analysed sample, all of the entities show a good investment policy – in the vast majority of years no impairment of goodwill was recorded for any of the groups. Most of the cases of accounting for impairment were recorded during the times of the financial crisis (NYSE Euronext, LSEG and TMX). Only TMX reported significant impairment losses on goodwill in other years. They were caused by the decline in the number of financings and trading activity as well as on revenues from listing and trading activities. Moreover, there was increased market competition in that period. Table 9: Impact of gain on bargain purchase on profit or loss attributable to the group 2006 2007 2008 2009 2010 2011 2012 2013 2014 2015 2016 2017 2018 ICE 0% 0% 0% 0% 0% 0% 0% 0% 0% 0% 0% 0% 0%NASDAQ 0% 0% 0% 0% 0% 0% 0% 0% 0% 0% 0% 0% 0% JPX 0% 0% 0% 0% 0% 0% 0% 0% 0% 0% 0% 0% - HKEX 0% 0% 0% 0% 0% 0% 0% 0% 0% 0% 0% 0% 0%
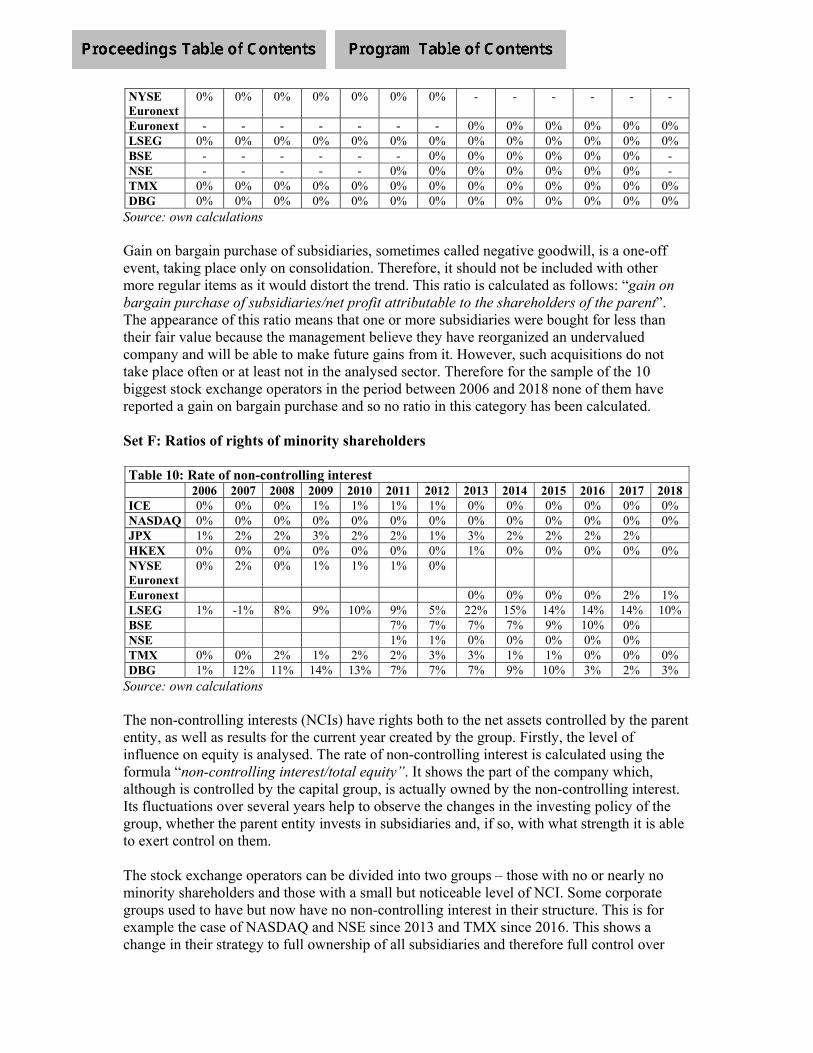
NYSE Euronext
0% 0% 0% 0% 0% 0% 0% - - - - - -
Euronext - - - - - - - 0% 0% 0% 0% 0% 0% LSEG 0% 0% 0% 0% 0% 0% 0% 0% 0% 0% 0% 0% 0%BSE - - - - - - 0% 0% 0% 0% 0% 0% - NSE - - - - - 0% 0% 0% 0% 0% 0% 0% - TMX 0% 0% 0% 0% 0% 0% 0% 0% 0% 0% 0% 0% 0% DBG 0% 0% 0% 0% 0% 0% 0% 0% 0% 0% 0% 0% 0%
Source: own calculations Gain on bargain purchase of subsidiaries, sometimes called negative goodwill, is a one-off event, taking place only on consolidation. Therefore, it should not be included with other more regular items as it would distort the trend. This ratio is calculated as follows: “gain on bargain purchase of subsidiaries/net profit attributable to the shareholders of the parent”. The appearance of this ratio means that one or more subsidiaries were bought for less than their fair value because the management believe they have reorganized an undervalued company and will be able to make future gains from it. However, such acquisitions do not take place often or at least not in the analysed sector. Therefore for the sample of the 10 biggest stock exchange operators in the period between 2006 and 2018 none of them have reported a gain on bargain purchase and so no ratio in this category has been calculated. Set F: Ratios of rights of minority shareholders Table 10: Rate of non-controlling interest 2006 2007 2008 2009 2010 2011 2012 2013 2014 2015 2016 2017 2018 ICE 0% 0% 0% 1% 1% 1% 1% 0% 0% 0% 0% 0% 0% NASDAQ 0% 0% 0% 0% 0% 0% 0% 0% 0% 0% 0% 0% 0% JPX 1% 2% 2% 3% 2% 2% 1% 3% 2% 2% 2% 2% HKEX 0% 0% 0% 0% 0% 0% 0% 1% 0% 0% 0% 0% 0%NYSE Euronext
0% 2% 0% 1% 1% 1% 0%
Euronext 0% 0% 0% 0% 2% 1%LSEG 1% -1% 8% 9% 10% 9% 5% 22% 15% 14% 14% 14% 10% BSE 7% 7% 7% 7% 9% 10% 0% NSE 1% 1% 0% 0% 0% 0% 0% TMX 0% 0% 2% 1% 2% 2% 3% 3% 1% 1% 0% 0% 0% DBG 1% 12% 11% 14% 13% 7% 7% 7% 9% 10% 3% 2% 3%
Source: own calculations The non-controlling interests (NCIs) have rights both to the net assets controlled by the parent entity, as well as results for the current year created by the group. Firstly, the level of influence on equity is analysed. The rate of non-controlling interest is calculated using the formula “non-controlling interest/total equity”. It shows the part of the company which, although is controlled by the capital group, is actually owned by the non-controlling interest. Its fluctuations over several years help to observe the changes in the investing policy of the group, whether the parent entity invests in subsidiaries and, if so, with what strength it is able to exert control on them. The stock exchange operators can be divided into two groups – those with no or nearly no minority shareholders and those with a small but noticeable level of NCI. Some corporate groups used to have but now have no non-controlling interest in their structure. This is for example the case of NASDAQ and NSE since 2013 and TMX since 2016. This shows a change in their strategy to full ownership of all subsidiaries and therefore full control over
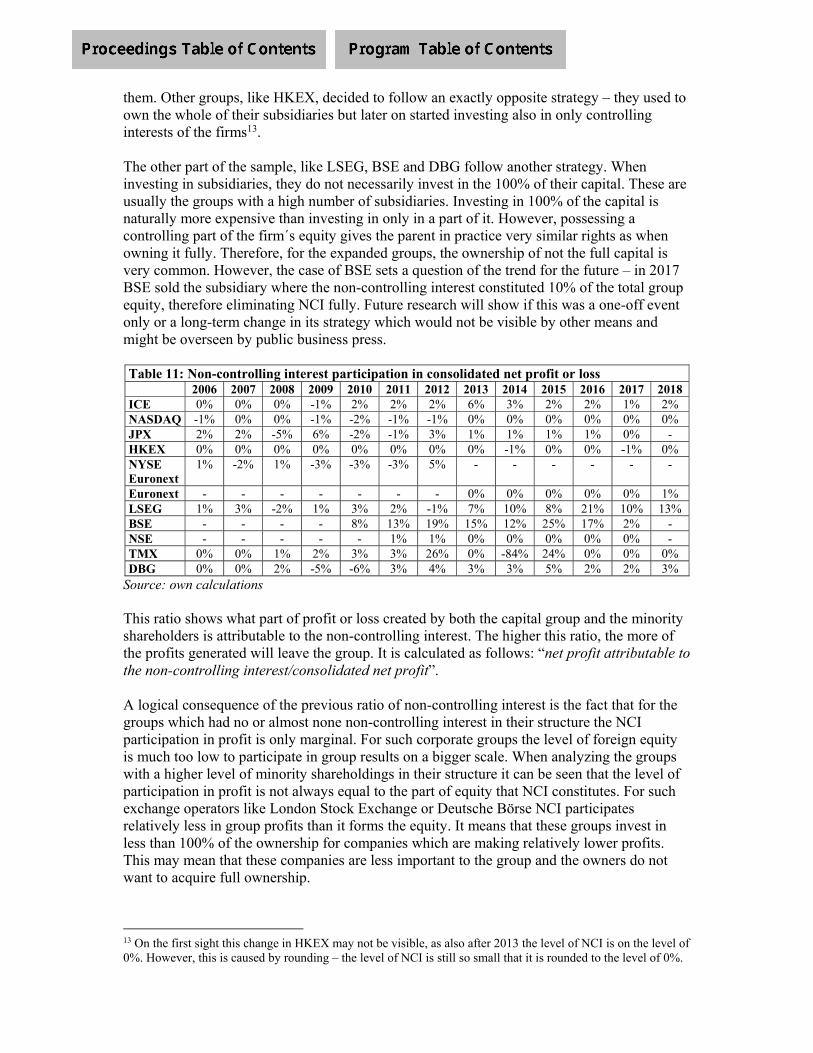
them. Other groups, like HKEX, decided to follow an exactly opposite strategy – they used to own the whole of their subsidiaries but later on started investing also in only controlling interests of the firms13. The other part of the sample, like LSEG, BSE and DBG follow another strategy. When investing in subsidiaries, they do not necessarily invest in the 100% of their capital. These are usually the groups with a high number of subsidiaries. Investing in 100% of the capital is naturally more expensive than investing in only in a part of it. However, possessing a controlling part of the firm´s equity gives the parent in practice very similar rights as when owning it fully. Therefore, for the expanded groups, the ownership of not the full capital is very common. However, the case of BSE sets a question of the trend for the future – in 2017 BSE sold the subsidiary where the non-controlling interest constituted 10% of the total group equity, therefore eliminating NCI fully. Future research will show if this was a one-off event only or a long-term change in its strategy which would not be visible by other means and might be overseen by public business press. Table 11: Non-controlling interest participation in consolidated net profit or loss 2006 2007 2008 2009 2010 2011 2012 2013 2014 2015 2016 2017 2018 ICE 0% 0% 0% -1% 2% 2% 2% 6% 3% 2% 2% 1% 2% NASDAQ -1% 0% 0% -1% -2% -1% -1% 0% 0% 0% 0% 0% 0% JPX 2% 2% -5% 6% -2% -1% 3% 1% 1% 1% 1% 0% - HKEX 0% 0% 0% 0% 0% 0% 0% 0% -1% 0% 0% -1% 0%NYSE Euronext
1% -2% 1% -3% -3% -3% 5% - - - - - -
Euronext - - - - - - - 0% 0% 0% 0% 0% 1%LSEG 1% 3% -2% 1% 3% 2% -1% 7% 10% 8% 21% 10% 13%BSE - - - - 8% 13% 19% 15% 12% 25% 17% 2% - NSE - - - - - 1% 1% 0% 0% 0% 0% 0% - TMX 0% 0% 1% 2% 3% 3% 26% 0% -84% 24% 0% 0% 0% DBG 0% 0% 2% -5% -6% 3% 4% 3% 3% 5% 2% 2% 3%
Source: own calculations This ratio shows what part of profit or loss created by both the capital group and the minority shareholders is attributable to the non-controlling interest. The higher this ratio, the more of the profits generated will leave the group. It is calculated as follows: “net profit attributable to the non-controlling interest/consolidated net profit”. A logical consequence of the previous ratio of non-controlling interest is the fact that for the groups which had no or almost none non-controlling interest in their structure the NCI participation in profit is only marginal. For such corporate groups the level of foreign equity is much too low to participate in group results on a bigger scale. When analyzing the groups with a higher level of minority shareholdings in their structure it can be seen that the level of participation in profit is not always equal to the part of equity that NCI constitutes. For such exchange operators like London Stock Exchange or Deutsche Börse NCI participates relatively less in group profits than it forms the equity. It means that these groups invest in less than 100% of the ownership for companies which are making relatively lower profits. This may mean that these companies are less important to the group and the owners do not want to acquire full ownership.
13 On the first sight this change in HKEX may not be visible, as also after 2013 the level of NCI is on the level of 0%. However, this is caused by rounding – the level of NCI is still so small that it is rounded to the level of 0%.
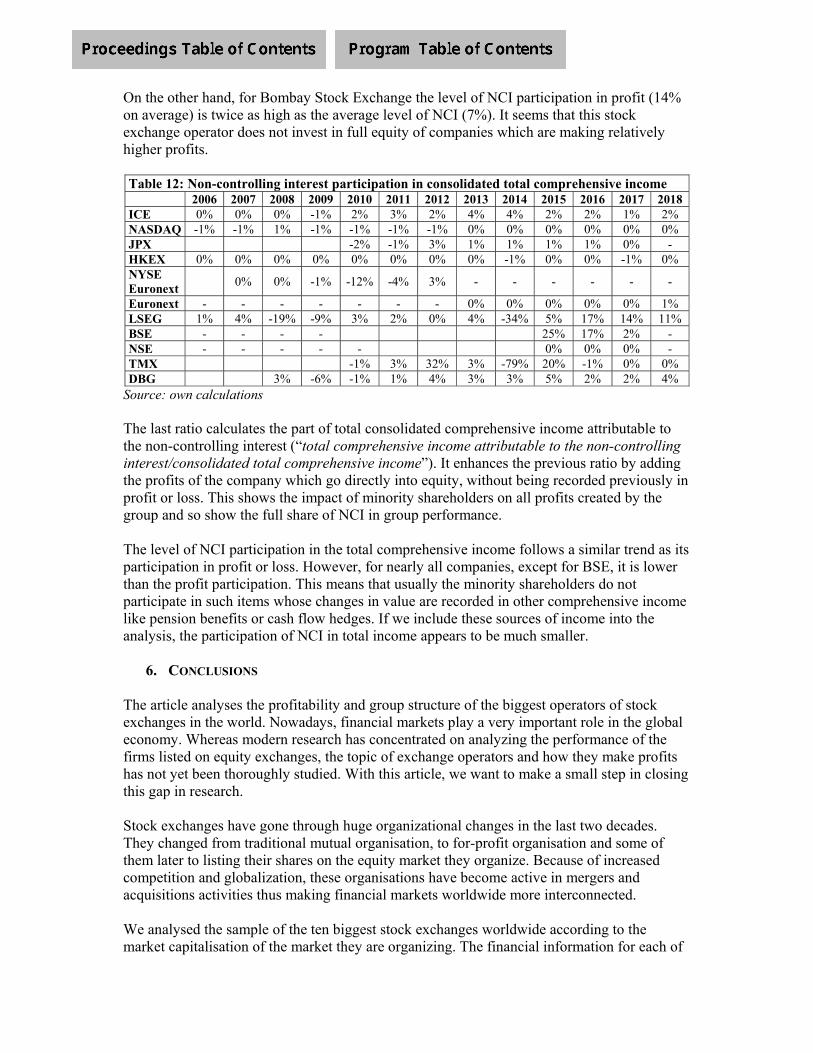
On the other hand, for Bombay Stock Exchange the level of NCI participation in profit (14% on average) is twice as high as the average level of NCI (7%). It seems that this stock exchange operator does not invest in full equity of companies which are making relatively higher profits. Table 12: Non-controlling interest participation in consolidated total comprehensive income 2006 2007 2008 2009 2010 2011 2012 2013 2014 2015 2016 2017 2018 ICE 0% 0% 0% -1% 2% 3% 2% 4% 4% 2% 2% 1% 2%NASDAQ -1% -1% 1% -1% -1% -1% -1% 0% 0% 0% 0% 0% 0% JPX -2% -1% 3% 1% 1% 1% 1% 0% - HKEX 0% 0% 0% 0% 0% 0% 0% 0% -1% 0% 0% -1% 0% NYSE Euronext
0% 0% -1% -12% -4% 3% - - - - - -
Euronext - - - - - - - 0% 0% 0% 0% 0% 1% LSEG 1% 4% -19% -9% 3% 2% 0% 4% -34% 5% 17% 14% 11% BSE - - - - 25% 17% 2% -NSE - - - - - 0% 0% 0% - TMX -1% 3% 32% 3% -79% 20% -1% 0% 0% DBG 3% -6% -1% 1% 4% 3% 3% 5% 2% 2% 4%
Source: own calculations The last ratio calculates the part of total consolidated comprehensive income attributable to the non-controlling interest (“total comprehensive income attributable to the non-controlling interest/consolidated total comprehensive income”). It enhances the previous ratio by adding the profits of the company which go directly into equity, without being recorded previously in profit or loss. This shows the impact of minority shareholders on all profits created by the group and so show the full share of NCI in group performance. The level of NCI participation in the total comprehensive income follows a similar trend as its participation in profit or loss. However, for nearly all companies, except for BSE, it is lower than the profit participation. This means that usually the minority shareholders do not participate in such items whose changes in value are recorded in other comprehensive income like pension benefits or cash flow hedges. If we include these sources of income into the analysis, the participation of NCI in total income appears to be much smaller.
6. CONCLUSIONS
The article analyses the profitability and group structure of the biggest operators of stock exchanges in the world. Nowadays, financial markets play a very important role in the global economy. Whereas modern research has concentrated on analyzing the performance of the firms listed on equity exchanges, the topic of exchange operators and how they make profits has not yet been thoroughly studied. With this article, we want to make a small step in closing this gap in research. Stock exchanges have gone through huge organizational changes in the last two decades. They changed from traditional mutual organisation, to for-profit organisation and some of them later to listing their shares on the equity market they organize. Because of increased competition and globalization, these organisations have become active in mergers and acquisitions activities thus making financial markets worldwide more interconnected. We analysed the sample of the ten biggest stock exchanges worldwide according to the market capitalisation of the market they are organizing. The financial information for each of
them was collected, ratios calculated and analysed. The ratios have been divided into three groups: group profitability ratios, ratios of influence of separate entities from the group on its financial result and ratios of rights of minority shareholders. These groups allow for a multifaceted analysis of profitability and group structure of these organisations. The analysis of the gross profit margin shows the division between the European and US-based entities. The European markets show a much higher margin than their American counterparts (90% versus 50-60%). This is connected with additional fees collected in the United States from the securities exchanges. This geographical division is not anymore detectable for the net profit margin. When all costs and profits are taken into account, the net profitability does not depend on the geographical location anymore. Hence, based on this ratio, the stock exchange operators can be divided into three groups: those with high net profitability of 60-65%, medium net income level at 25-35%, as well as surprisingly low profitability of NASDAQ (11%). The analysis of return on equity allows to see the relationship between the profitability of the stock exchange operator and the management´s decisions on how to use this profit. Some of the firms have a very high level of ROE, meaning they earn high profits but mostly pay out these profits to the shareholders in the form of dividends, therefore not increasing shareholder´s capital. Others use these profits to invest in subsidiaries. Sometimes these investment need an issuance of additional shares, which increases the equity significantly and so decreases the ROE, as it was the case for ICE after buying the NYSE Euronext in 2013. The ratios of impact of the parent entity, subsidiaries and associates are connected with one another. Most of the stock exchange groups earn the majority of their profits from the activities of the parent entity. Many of these groups have an expanded set of subsidiaries, but it is the mother company which operates the securities exchange and so makes the most profits. The most significant case of such structure has been found in the Hong Kong Exchanges and Clearing, where the HKEX is producing on average 100% of the group incomes. Other groups are most profitable due to the activities of their subsidiaries. As in the case for Euronext, the incomes earned from the parent are usually minimal, as this entity is used only as a bond for the whole group and produces no individual revenues. For all analysed corporate groups the associates have only a marginal impact on the profits, at the level of an average 1-2%. The ratio of impact of goodwill impairment on the group shows the investment strategy of the group. In the analysed sample, all of the entities show a good investment policy – in the vast majority of years no impairment of goodwill was recorded for any of the groups. Most of the cases of accounting for impairment were recorded during the times of the financial crisis. As no subsidiaries were bought at the price lower than the fair value of its assets less that of its liabilities, the ratio of impact of gain on bargain purchase on group profit could not be calculated. The last set of ratios has analysed the rights of minority shareholders in the group. The stock exchange operators can be divided into two groups – those with no or nearly no minority shareholders and those with a small but noticeable level of NCI. Some of them prefer to invest in the whole on nearly 100% of the stock capital of the subsidiary. Others, like LSEG, BSE and DBG follow another strategy. When investing in subsidiaries, they do not necessarily invest in the 100% of their capital. These are usually the groups with a high number of
subsidiaries for whom the purchase of the whole of the acquired capital may mean very high investments and so it is more important to retain control than full ownership. When analyzing the groups with a higher level of minority shareholdings in their structure it can be seen that the level of participation in profit is not always equal to the part of equity that NCI constitutes. For such exchange operators like London Stock Exchange or Deutsche Börse NCI participates relatively less in group profits than it forms the equity. It means that these groups invest in less than 100% of the ownership for companies which are making relatively lower profits. On the other hand, for Bombay Stock Exchange the level of NCI participation in profit (14% on average) is twice as high as the average level of NCI (7%). It seems that this stock exchange operator does not invest in full equity of companies which are making relatively higher profits. The level of NCI participation in the total comprehensive income follows a similar trend as its participation in profit or loss. Although many of the issues regarding profitability and group structure of the leading stock exchanges have been analysed in this article, further research is needed in this field. It might reveal further interesting facts about the organization of the stock exchange operators and the way in which they create profits. As the sample in the current research was only limited to 10 biggest entities, expansion of the studies to other smaller entities may should allow a comprehensive analysis and description of the whole market.

REFERENCE
[1] Angulo L.P., Slimane F.B. (2018), Board restructuring and successful demutualization: the stock exchanges, “Journal of Organizational Change Management”, VO. 31, No. 3.
[2] Aggarwal R., Dahiya S, (2006), Demutualisation and public offerings of financial exchanges, “Journal of Applied Corporate Finance”, Vol. 18, No. 3.
[3] Aggarwal R., Steil B. (2002), Demutualisation and corporate governance of stock exchanges, “Journal of Applied Corporate Finance” No. 15(1).
[4] Arlman P. (2003), All in the name of competition: European securities exchanges, “Journal of Financial Regulation and Compliance”, Vol. 11, No. 3.
[5] Christiansen H., Koldertsova A. (2009), The role of stock exchanges in corporate governance, “Financial Market Trends”, Vol. 1.
[6] Dorodnykh E. (2014), Determinants of stock exchange integration: evidence in worldwide perspective, “Journal of Economic Studies”, Vol. 41 Issue: 2.
[7] Fleckner A.M. (2006), Stock Exchanges at the Crossroads, “Fordham Law Review”, Vol. 74, Issue 5.
[8] Floreani J., Polato M. (2010), Consolidation and business strategies in the securities industry: how securities exchanges create value?, “Research in World Economy”, Vol. 1, No. 1.
[9] Hassan E.A. (2017), How would the stock exchange monitoring role affect the performance of U.S. firms: Evidence from cross-listed firms in the United States, “The Journal of Corporate Accounting & Finance”.
[10] Karmańska A. (2004), Uwarunkowania i specyfika analizy wskaźnikowej sprawozdań grupy kapitałowej (Conditions and character of ratio analysis of consolidated financial statements), [in:] P. Walentynowicz (ed.), B. Nogalski (ed.), Zarządzanie w grupach kapitałowych: aspekty organizacyjne, finansowe, właścicielskie i personalne (Corporate group management: organisational, financial, ownership and personal aspects), Wydawnictwo Wyższej Szkoły Administracji i Biznesu (Publishing House of the Higher School of Administration and Business), Gdynia.
[11] Karmańska A. (2006), Specyfika analizy wskaźnikowej skonsolidowanych sprawozdań finansowych (Character of ratio analysis of consolidated financial statements), “Problemy rachunkowości” (“Accounting Problems”), No. 1 (24).
[12] Karmańska A., Wiśniewska D. (2018), The concept of ration analysis of consolidated financial statements – in application to the stock exchange group, Working Paper presented on 30th Asian-Pacific Conference of International Accounting Issues, San Francisco, USA.
[13] Mendiola A.M., O’Hara M. (2003), Taking stock in stock markets: the changing governance of exchanges, Working Paper, Cornell University.
[14] Mourselas C, Comte J. (2017), Who killed the LSE-Deutsche Börse mega-merger?, “GlobalCapital” 20552165.
[15] Movsesyan, V. (2007), Demutualisation of, and Self-Regulation by, Stock Exchanges, SSRN Electronic Journal, 10.2139/ssrn.1882432.
[16] Osaki S. (2012), Two barriers hindering the integration of stock exchanges and the “Japan Exchange” initiative, NRI Papers, No. 177.
[17] Otchere I. (2006), Stock exchange self-listing and value effects, “Journal of Corporate Finance, No. 12.

[18] Otchere I., Abou-Zied K. (2008), Stock exchange demutualisation, self-listing and performance: The case of the Australian Stock Exchange), “Journal of Banking & Finance”, No. 32.
[19] Serifsoy B. (2005), Demutualisation, outsider ownership and stock exchange performance – empirical evidence, Working Paper Series: Finance and Accounting, No. 157, Johann Wolfgang Goether-Universität Frankfurt am Main, Fachbereich Wirtschaftswissenschaften, Frankfurt a. M.
[20] Slimane F.B., Angulo L.P. (2018), Strategic change and corporate governance: Evidence from the stock exchange industry, “Journal of Business Research”.

THE STOCK PRICE RELEVANCE OF ROE DECOMPOSITION FACTORS IN KOREA STOCK MARKETS
Changrae Park Department of Accounting,
Gangneung-Wonju National University, South Korea [email protected]@gwnu.ac.kr
ABSTRACT
ROE is decomposed into the measure of product market strategies performance and financial market polices performance. According to the traditional decomposing approach, ROE is measured by ROA and equity multiplier. Moreover, ROA is decomposed into return on sales and assets turnover. Prior researches showed these traditionally decomposed factors had the stock price relevance. However, this traditional approach has some theoretical limitations in measuring the performances of market strategies and financial market policies. Therefore, the alternative approaches are on the rise. In the alternative method, ROE is decomposed as return on invested capital (ROIC) and financial leverage. The ROIC is further decomposed as return on net operating assets (RNOA) and return on non-operating investments (RNOI).
The purposes of this study were to investigate the effects of ROE decomposition factors decomposed by the traditional and alternative approach on the common stock price of the firms listed in Korea’s KOSPI and KOSDAQ markets. First, this study reviewed the effects of ROE and its decomposition factors decomposed by traditional and alternative approach on stock price for the all sample and each market. Second, this study analyzed whether or not the stock price effects of ROE and ROE factors were influenced by the RNOA level.
28,556 non-financial companies were sampled out from the Korean KOSPI stock market (11,370 firms) and KOSDAQ (17,186 firms) listed in between 2001 and 2018.
The results of this study were as follow. First, stock price showed a positive correlation with ROE, ROA, ROS, ROIC, RNOA, and negative correlation with EM and debt ratio. Second, ROE showed positive effects to the stock price for each market analysis. When analyzed for each market R2s increased compared to total sample analysis, but there was not different in R2 between markets. Third, ROA was positively related with stock price, and EM was negatively related. The stock price relevance of ROS was differ between markets. Fourth, ROIC and RNOA were positively related with stock price, but RNOI was insignificant in KOSPI. When RNOA decomposed further, the value relevance of further decomposed factors was different between markets. Fifth, when analyzed according to RNOA level, the value relevance of ROE and ROE factors decomposed by both approach showed different value relevance among RNOA levels and markets.
These results imply that, though ROE has value relevance, value relevance of ROE was different according to the market and operating performance(RNOA). The more theoretical but hard to calculate and unpopular ROE factors decomposed by alternative approach had not more value relevance than traditional decomposing approach. The ROE and ROE factors had more value relevance when analyzed the companies with similar characteristics such as market, and RNOA level.

Ⅰ. Introduction
Usual ways of evaluating the performance of managers can be divided into two methods - qualitative methods and quantitative methods. In quantitative methods, the ratio analyses are dominant. Ratio analyses have been used to evaluate the past performances of the companies and recently ratios are used to forecast financial statements and the company valuation [10]. The performances of a manager relate with the financial market policies and product market strategies [13]. Manager should make decisions in such areas as operating management, investment management, financing strategies, dividend polices. So the ratio analyses focus on the evaluations of effectiveness of the firm’s policies about these areas.
Because ROE shows the efficiencies of funds invested by firm’s shareholders, it is regarded as the comprehensive indicator of a firm’s performance. ROE can be decomposed into return on assets (ROA) and a measure of financial leverage. The former is related with products market strategies and the latter is related with financial market strategies. Because of that, ROE and ROE decomposition factors are popularly used for the evaluation of manager’s performance.
However, this traditional approach has several limitations. There is a mismatch between the numerator and denominator in calculating decomposed factors. So alternative approaches were on the rise. According to new approach, ROE is decomposed into a return on invested capital (ROIC) and financial leverage effects. The return on invested capital is further decomposed into return on net operating assets (RNOA) and return on non-operating investments (RNOI), and financial leverage is further decomposed as spread (the difference between ROIC and effective interest rate) and financial leverage (debt ratio).
Though the alternative approach is more theoretical, traditional approach is more familiar and well known to the investor. In addition to that, the factors by alternative approach are more difficult to calculate and to understand. Because of these, it is needed to investigate whether the newly developed factors are more useful to investors. It can be done by comparing the stock price relevance of ROE factors decomposed between by traditional approach and by alternative approach. By comparing these two approaches, we can understand whether the more theoretical ratios are more useful in stock market.
The operating performance of company may positive influence on stock price. However, the effects of operating performance on stock price may not be same between the companies achieved enough operating performance and the others. The effects of ROE factors on stock price may be different according to the operating market performance.
There are three kinds of stock markets in Korea – KOSPI, KOSDA, and KONEX. Among them, KOSPI, which opened in 1956, is the most popular and in which major companies are listed. KOSDAQ opened in 1996 for the purpose of providing funds for startup companies as well as small and medium enterprises in such tech-savvy area as IT (information technology), BT (bio technology) and CT (culture technology). Because of that, the companied listed in KOSPI and KOSDAQ are different in their characteristics. So there may be different in value relevance of financial information including ROE factors. KONEX, which was open in 2013, is the latest and the most unpopular market in Korea. Because of this reasons, the stock price related researches in KOREA usually focus on the KOSPI and KOSDAQ markets.
The purposes of this study were to compare the effects of ROE factors which decomposed by traditional and alternative approach on the stock price of listed firms in Korea stock markets. First, this study reviews the effects of ROE factors which are decomposed by traditional and

alternative methods on the stock price of non-financial companies listed in Korea stock markets (KOSPI and KOSDAQ). Second, this study examines whether the effects of REO factors on price are different according to the RNOA level.
This research can contribute to understand whether the financial ratios which are more theoretical but difficult to calculate, are more useful than the ratios which are more familiar and easy to calculate in KOREA stock market. This research also is able to show whether the ROE decomposition factors by newly developed approach have more value relevance than traditional ROE decomposition factors. So the results of this research may give an understanding about the behavior of investors in Korea stock markets.
Ⅱ. Literature Review
2.1 ROE decomposing methods
2.1.1 Traditional approach
Traditionally, ROE is decomposed into its two drivers – return from operating activities and return from financial activities. This first level of decomposing ROE is to distinguish the profitability of these two activities. The second level of decomposing is to decompose return from operating activities into the sub-derivers. The return from operating activities can be further decomposed into profit margin and asset turnover, as follows;
ROE 𝑁𝑒𝑡 𝐼𝑛𝑐𝑜𝑚𝑒
𝐸𝑞𝑢𝑖𝑡𝑦𝑁𝑒𝑡 𝐼𝑛𝑐𝑜𝑚𝑒𝑇𝑜𝑡𝑎𝑙 𝐴𝑠𝑠𝑒𝑡𝑠
𝑇𝑜𝑡𝑎𝑙 𝐴𝑠𝑠𝑒𝑡𝑠
𝐸𝑞𝑢𝑖𝑡𝑦𝑅𝑂𝐴 𝐸𝑞𝑢𝑖𝑡𝑦 𝑀𝑢𝑙𝑡𝑖𝑝𝑙𝑖𝑒𝑟
𝑁𝑒𝑡 𝐼𝑛𝑐𝑜𝑚𝑒
𝑆𝑎𝑙𝑒𝑠𝑆𝑎𝑙𝑒𝑠
𝑇𝑜𝑡𝑎𝑙 𝐴𝑠𝑠𝑒𝑡𝑠𝑇𝑜𝑡𝑎𝑙 𝐴𝑠𝑠𝑒𝑡𝑠
𝐸𝑞𝑢𝑖𝑡𝑦
𝑁𝑒𝑡 𝐼𝑛𝑐𝑜𝑚𝑒
𝑆𝑎𝑙𝑒𝑠𝑆𝑎𝑙𝑒𝑠
𝑇𝑜𝑡𝑎𝑙 𝐴𝑠𝑠𝑒𝑡𝑠𝑇𝑜𝑡𝑎𝑙 𝐿𝑖𝑎𝑏𝑖𝑙𝑖𝑡𝑖𝑒𝑠 𝐸𝑞𝑢𝑖𝑡𝑦
𝐸𝑞𝑢𝑖𝑡𝑦
𝑅𝑂𝑆 𝐴𝑠𝑠𝑒𝑡𝑠 𝑇𝑢𝑟𝑛𝑜𝑣𝑒𝑟 1𝑇𝑜𝑡𝑎𝑙 𝐿𝑖𝑎𝑏𝑖𝑙𝑖𝑡𝑖𝑒𝑠
𝐸𝑞𝑢𝑖𝑡𝑦
In traditional approach, ROE can be decomposed into return on sales (ROS), asset turnover and leverage. The ROS indicates the profitability from sales activities and the asset turnover indicate the efficiencies of invested assets. Equity multiplier indicates the financial structures. Equity multiplier indicates not only the leverage effect of debt, but also the financial stability. Therefore, ROE can be decomposed into profitability, activity, and financial stability indicators. In this aspect, ROE is regarded as a comprehensive measure for the overall profitability.
2.2.3 Alternative approach
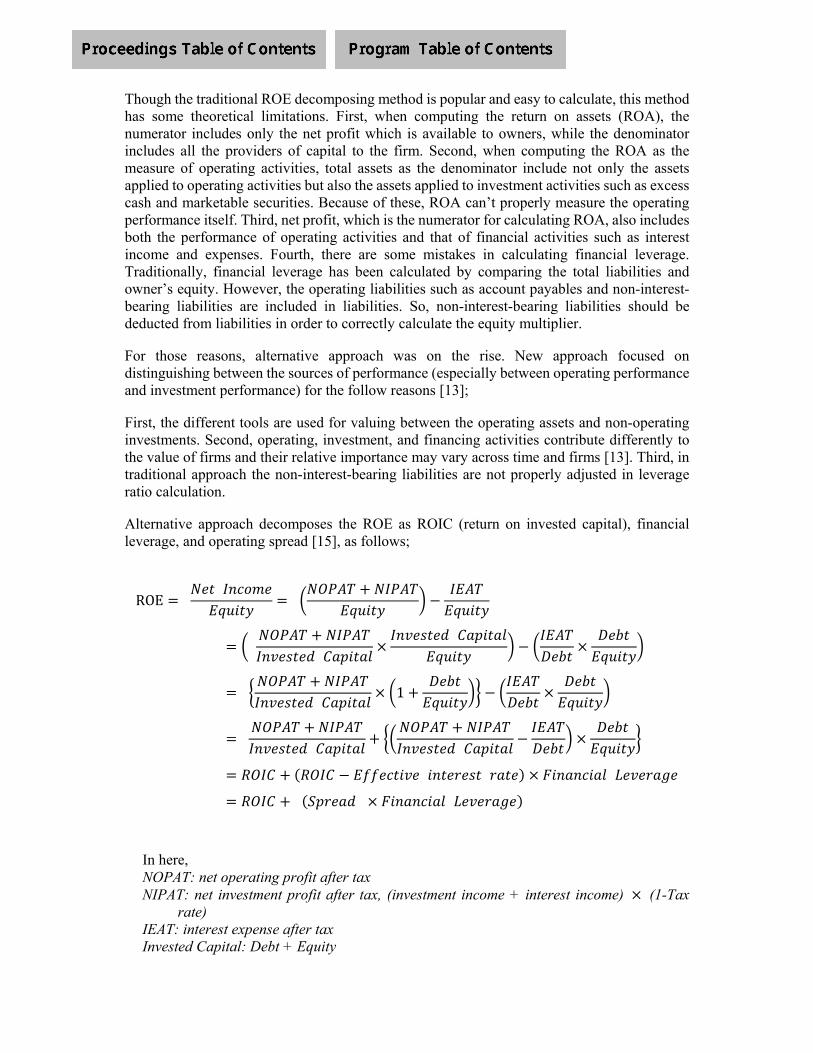
Though the traditional ROE decomposing method is popular and easy to calculate, this method has some theoretical limitations. First, when computing the return on assets (ROA), the numerator includes only the net profit which is available to owners, while the denominator includes all the providers of capital to the firm. Second, when computing the ROA as the measure of operating activities, total assets as the denominator include not only the assets applied to operating activities but also the assets applied to investment activities such as excess cash and marketable securities. Because of these, ROA can’t properly measure the operating performance itself. Third, net profit, which is the numerator for calculating ROA, also includes both the performance of operating activities and that of financial activities such as interest income and expenses. Fourth, there are some mistakes in calculating financial leverage. Traditionally, financial leverage has been calculated by comparing the total liabilities and owner’s equity. However, the operating liabilities such as account payables and non-interest-bearing liabilities are included in liabilities. So, non-interest-bearing liabilities should be deducted from liabilities in order to correctly calculate the equity multiplier.
For those reasons, alternative approach was on the rise. New approach focused on distinguishing between the sources of performance (especially between operating performance and investment performance) for the follow reasons [13];
First, the different tools are used for valuing between the operating assets and non-operating investments. Second, operating, investment, and financing activities contribute differently to the value of firms and their relative importance may vary across time and firms [13]. Third, in traditional approach the non-interest-bearing liabilities are not properly adjusted in leverage ratio calculation.
Alternative approach decomposes the ROE as ROIC (return on invested capital), financial leverage, and operating spread [15], as follows;
ROE 𝑁𝑒𝑡 𝐼𝑛𝑐𝑜𝑚𝑒
𝐸𝑞𝑢𝑖𝑡𝑦
𝑁𝑂𝑃𝐴𝑇 𝑁𝐼𝑃𝐴𝑇𝐸𝑞𝑢𝑖𝑡𝑦
𝐼𝐸𝐴𝑇𝐸𝑞𝑢𝑖𝑡𝑦
𝑁𝑂𝑃𝐴𝑇 𝑁𝐼𝑃𝐴𝑇𝐼𝑛𝑣𝑒𝑠𝑡𝑒𝑑 𝐶𝑎𝑝𝑖𝑡𝑎𝑙
𝐼𝑛𝑣𝑒𝑠𝑡𝑒𝑑 𝐶𝑎𝑝𝑖𝑡𝑎𝑙𝐸𝑞𝑢𝑖𝑡𝑦
𝐼𝐸𝐴𝑇𝐷𝑒𝑏𝑡
𝐷𝑒𝑏𝑡𝐸𝑞𝑢𝑖𝑡𝑦
𝑁𝑂𝑃𝐴𝑇 𝑁𝐼𝑃𝐴𝑇𝐼𝑛𝑣𝑒𝑠𝑡𝑒𝑑 𝐶𝑎𝑝𝑖𝑡𝑎𝑙
1𝐷𝑒𝑏𝑡
𝐸𝑞𝑢𝑖𝑡𝑦𝐼𝐸𝐴𝑇𝐷𝑒𝑏𝑡
𝐷𝑒𝑏𝑡𝐸𝑞𝑢𝑖𝑡𝑦
𝑁𝑂𝑃𝐴𝑇 𝑁𝐼𝑃𝐴𝑇𝐼𝑛𝑣𝑒𝑠𝑡𝑒𝑑 𝐶𝑎𝑝𝑖𝑡𝑎𝑙
𝑁𝑂𝑃𝐴𝑇 𝑁𝐼𝑃𝐴𝑇𝐼𝑛𝑣𝑒𝑠𝑡𝑒𝑑 𝐶𝑎𝑝𝑖𝑡𝑎𝑙
𝐼𝐸𝐴𝑇𝐷𝑒𝑏𝑡
𝐷𝑒𝑏𝑡𝐸𝑞𝑢𝑖𝑡𝑦
𝑅𝑂𝐼𝐶 𝑅𝑂𝐼𝐶 𝐸𝑓𝑓𝑒𝑐𝑡𝑖𝑣𝑒 𝑖𝑛𝑡𝑒𝑟𝑒𝑠𝑡 𝑟𝑎𝑡𝑒 𝐹𝑖𝑛𝑎𝑛𝑐𝑖𝑎𝑙 𝐿𝑒𝑣𝑒𝑟𝑎𝑔𝑒
𝑅𝑂𝐼𝐶 𝑆𝑝𝑟𝑒𝑎𝑑 𝐹𝑖𝑛𝑎𝑛𝑐𝑖𝑎𝑙 𝐿𝑒𝑣𝑒𝑟𝑎𝑔𝑒
In here, NOPAT: net operating profit after tax NIPAT: net investment profit after tax, (investment income + interest income) (1-Tax
rate) IEAT: interest expense after tax Invested Capital: Debt + Equity
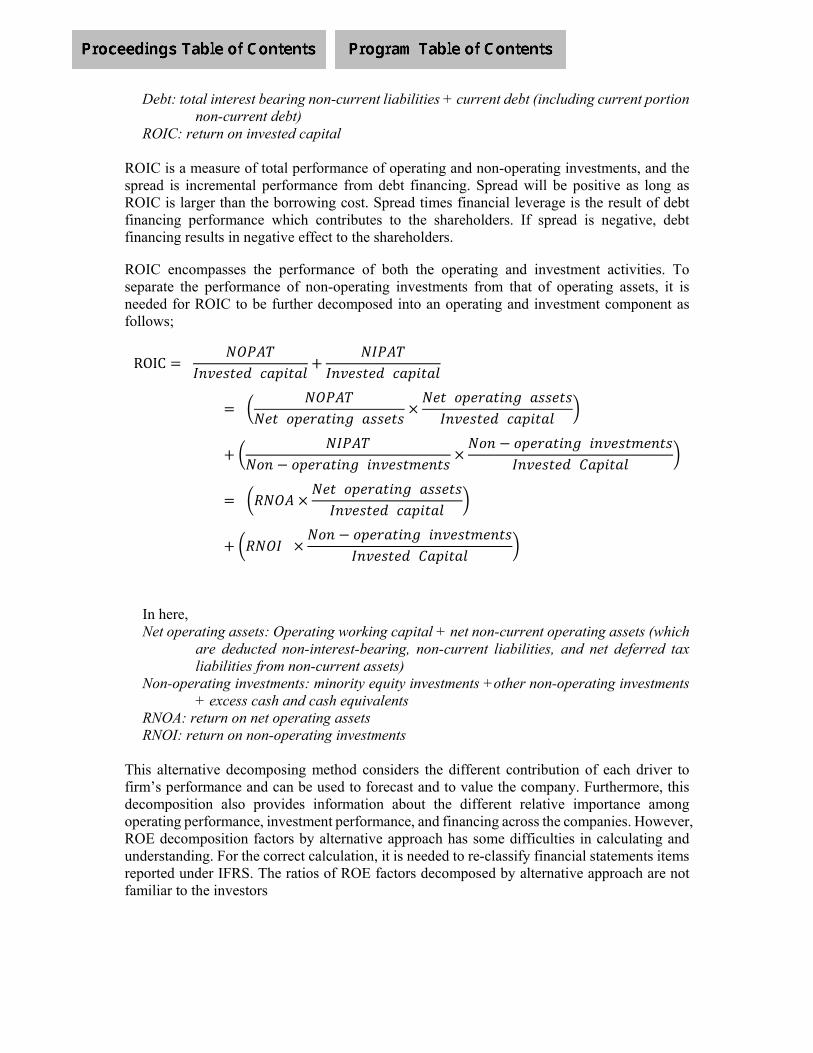
Debt: total interest bearing non-current liabilities + current debt (including current portion non-current debt)
ROIC: return on invested capital
ROIC is a measure of total performance of operating and non-operating investments, and the spread is incremental performance from debt financing. Spread will be positive as long as ROIC is larger than the borrowing cost. Spread times financial leverage is the result of debt financing performance which contributes to the shareholders. If spread is negative, debt financing results in negative effect to the shareholders.
ROIC encompasses the performance of both the operating and investment activities. To separate the performance of non-operating investments from that of operating assets, it is needed for ROIC to be further decomposed into an operating and investment component as follows;
ROIC 𝑁𝑂𝑃𝐴𝑇
𝐼𝑛𝑣𝑒𝑠𝑡𝑒𝑑 𝑐𝑎𝑝𝑖𝑡𝑎𝑙𝑁𝐼𝑃𝐴𝑇
𝐼𝑛𝑣𝑒𝑠𝑡𝑒𝑑 𝑐𝑎𝑝𝑖𝑡𝑎𝑙
𝑁𝑂𝑃𝐴𝑇
𝑁𝑒𝑡 𝑜𝑝𝑒𝑟𝑎𝑡𝑖𝑛𝑔 𝑎𝑠𝑠𝑒𝑡𝑠𝑁𝑒𝑡 𝑜𝑝𝑒𝑟𝑎𝑡𝑖𝑛𝑔 𝑎𝑠𝑠𝑒𝑡𝑠
𝐼𝑛𝑣𝑒𝑠𝑡𝑒𝑑 𝑐𝑎𝑝𝑖𝑡𝑎𝑙
𝑁𝐼𝑃𝐴𝑇𝑁𝑜𝑛 𝑜𝑝𝑒𝑟𝑎𝑡𝑖𝑛𝑔 𝑖𝑛𝑣𝑒𝑠𝑡𝑚𝑒𝑛𝑡𝑠
𝑁𝑜𝑛 𝑜𝑝𝑒𝑟𝑎𝑡𝑖𝑛𝑔 𝑖𝑛𝑣𝑒𝑠𝑡𝑚𝑒𝑛𝑡𝑠𝐼𝑛𝑣𝑒𝑠𝑡𝑒𝑑 𝐶𝑎𝑝𝑖𝑡𝑎𝑙
𝑅𝑁𝑂𝐴𝑁𝑒𝑡 𝑜𝑝𝑒𝑟𝑎𝑡𝑖𝑛𝑔 𝑎𝑠𝑠𝑒𝑡𝑠
𝐼𝑛𝑣𝑒𝑠𝑡𝑒𝑑 𝑐𝑎𝑝𝑖𝑡𝑎𝑙
𝑅𝑁𝑂𝐼 𝑁𝑜𝑛 𝑜𝑝𝑒𝑟𝑎𝑡𝑖𝑛𝑔 𝑖𝑛𝑣𝑒𝑠𝑡𝑚𝑒𝑛𝑡𝑠
𝐼𝑛𝑣𝑒𝑠𝑡𝑒𝑑 𝐶𝑎𝑝𝑖𝑡𝑎𝑙
In here, Net operating assets: Operating working capital + net non-current operating assets (which
are deducted non-interest-bearing, non-current liabilities, and net deferred tax liabilities from non-current assets)
Non-operating investments: minority equity investments +other non-operating investments + excess cash and cash equivalents
RNOA: return on net operating assets RNOI: return on non-operating investments
This alternative decomposing method considers the different contribution of each driver to firm’s performance and can be used to forecast and to value the company. Furthermore, this decomposition also provides information about the different relative importance among operating performance, investment performance, and financing across the companies. However, ROE decomposition factors by alternative approach has some difficulties in calculating and understanding. For the correct calculation, it is needed to re-classify financial statements items reported under IFRS. The ratios of ROE factors decomposed by alternative approach are not familiar to the investors

2.2 Researches about ROE and its decomposition factors
ROE and its decomposition factors are used for the performance evaluation, performance forecasting, and prediction of portfolio performance [11]. For the forecast of ROE, ROE behavior along the time was reviewed [13, 5]. The firm’s value relevance of ROE was examined after the IFRS adoption in Korea [2]. The relationship between the decomposed factors of ROE and the future profitability, and value relevance was also examined [9]. Heikal et al [6] reviewed whether the financial ratios including ROE had influence on the corporate growth in Indonesia Stock Exchange. Kijewska [7] reviewed the decomposition factors of ROE and identified which factors are determinants of ROE growth and decline in Poland. Kwon [8] examined that the reclassification of income statement items had predictive contents in forecasting ROE [8].
However, ROE is not panacea for the performance evaluation [3]. In the case of European bank, ROE may be lather an element of incentive in the relationship between banks and markets than performance measure [4].
There are some literatures about the ROE and its decomposition factors in academic and practical areas. And ROE has been used for the measure of manager’s performance. However, the researches about the effects of ROE decomposition factors on stock price are majorly based on the traditional decomposing method. The research about the ROE factors value relevance based on the alternative approach which is more theoretical and well measure of performance, is a few in KOREA.
Ⅲ. Methodology
3.1 Research model and analyses methods
The purposes of this research are to investigate the effect of ROE and ROE factors which are decomposed by traditional and alternative approach on the stock price. Newly developed ROE decomposed factors are more theoretical but more complex in calculation and unpopular to the investors. And traditional ROE decomposed factors are more convenient to use because of easy to calculate and popular to investors. So it is needed to compare the value relevance of ROE factors decomposed by traditional approach and by alternative approach. The results of this research shows whether or not the newly developed ROE decomposition factors by alternative approach have more value relevance than traditional ROE factors. So the results of this research may give an understanding about the behavior of investors in Korea stock markets.
ROE decomposition can be divided by multi levels according to the decomposing depth [15]. Level 1 is to decompose ROE into such factors as the performance of product market strategies and that of financial market policies. In the 1st level decomposition, traditional approach decomposes ROE as ROA and equity multiplier (EM) and alternative approach decomposed EOA as ROIC and leverage. In Level 2, both approaches further decompose the performance of product market strategies into profitability and the efficiencies of invested assets. So in the 2nd level decomposition, traditional approach decomposes ROE as return on sales (ROS), assets turnover (AT), and EM. And alternative approach decomposes ROE as return on net operating assets (RNOA), return on non-operating investments (RNOI), and leverage. RNOA can be further decomposed as return on net operating profit after tax (RNOPAT) and net operating

assets turnover (NOAT), and RNOI be decomposed as return on non-operating investments profit after tax (RNOIPAT) and non-operating investments turnover (NOIT).
To analyses the stock price relevance of ROE factors by each decomposition approach, this research uses the follow models;
[Model 1] The stock price relevance of ROE Pit = α0 + α1 ROEit + α2 Ln_Sizeit + α3 YearDummyit + α4 IndustryDummyit + εit
[Model 2] The stock price relevance of level 1 ROE decomposition factors A. Traditional approach
Pit = α0 + α1 ROAit + α2 EMit + α3 Ln_Sizeit + α4 YearDummyit + α5 IndustryDummyit + εit
B. Alternative approach
Pit = α0 + α1 ROICit + α2 Debt_ratioit + α3 Ln_Sizeit + α4 YearDummyit + α5 IndustryDummyit + εit
[Model 3] The stock price relevance of level 2 ROE decomposition factors A. Traditional approach
Pit = α0 + α1 ROSit + α2 ATit + α3EMit + α4 Ln_Sizeit + α5 YearDummyit + α6 IndustryDummyit + εit
B. Alternative approach
Ⅰ. Pit = α0 + α1 RNOAit + α2 RNOIit + α3 Debt_ratioit + α4 Ln_Sizeit + α5 YearDummyit + α6 IndustryDummyit + εit
Ⅱ. Pit = α0 + α1 RNOPATit + α2 NOATit + α3 RNOIPATit + α4 NOITit + α5 Debt_ratioit + α6 Ln_Sizeit + α7 YearDummyit + α8 IndustryDummyit + εit
In here Pit : Firm i’s per share price at the end of financial statements disclosure month divided by
par value ROEit : Firm i’s return on equity for period t ROAit : Firm i’s return on assets for period t EMit : Firm i’s equity multiplier(= total assets / equity at the end of fiscal year) for period t ROICit : Firm i’s return on invested capital for period t ROSit : Firm i’s return on sales(= net income / sales) for period t ATit : Firm i’s assets turnover(= sales / average total assets) for period t RNOAit : Firm i’s RNOA(return on net operating assets) for period t
RNOIit : Firm i’s RNOI (return on non-operating investments)for period t
RNOPATit : Firm i’s return on net operating profit after tax(= operating profit after tax / average net operating profit) for period t
NOATit : Firm i’s net operating assets turnover(= sales / average net operating assets) for period t
RNOIPATit : Firm i’s return on non-operating investments profit after tax(= investment profit / average non-operating assets) for period t
NOITit : Firm i’s non-operating investments turnover(= sales / average ono-operating

assets) for period t Debt_ratioit : Firm i’s Debt ratio for period t
Ln_Sizeit : Firm i’s ln(Total assets) for period t
YearDummyit : Year dummy for controlling year effect
IndustryDummyit : Industry dummy for controlling industry effect
Because the par value of listed company is not same, it was needed to control the difference of par value. In this research, common stock price was divided by par value for controlling the par value difference. In KOREA, almost all companies were disclosed financial statements at the 3rd month after the fiscal year end. So stock price is measured at the end of 3rd month after fiscal year end in order to use the stock price that fully reflects the year t’s financial statements. ROE factors were ratio variables which were calculated by using financial statements. So these variables may able to have extreme values (outliers). In order to the control the effect of outliers, all the variables are winsorized by 1%.
This study also examines the effects of ROE factors on the stock price by the RNOA level. The operating performance of company may positive influence on stock price. However, the relationship of operating performance and stock price may not be same between the companies achieved enough operating performance and the others. So the effects of ROE factors on stock price may be different according to the operating market performance.
And, the performances of operating assets and investment assets may influence deploying financed fund to each asset. If the companies have relatively higher RNOA than other companies, there may be differences in allocating the financed fund and financing activities. However, according to the former research in KOREA [12], managers want to balance performance between operating and investment. Managers may allocate the resources to the operating assets until the operating performance reaches to the proper level. For these reasons, available funds are allocated to the operating assets first, and the remaining are allocated to the investment assets to balance the performances between operating and investment. So the stock price effect of ROE factors may be different according to the RNOA level. To analyses the stock price relevance of ROE factors according to the operating performance, samples were grouped as 3 even deciles according to the RNOA for each year and market. For example, all the samples listed KOSPI of year 2001 were grouped as 3 even deciles according to the ascending order of RNOA. The regression results of upper models were compared among the RNOA deciles – lower, middle, and higher group of RNOA.
Stock price may be also influenced by firm size, industry effect, and economic situation of financial year. So the natural log of total assets (Ln_Size), industry (IndustryDummy), and year dummy (YearDummy) were included in the regression model as control variables.
3.2 Research Data
Samples were selected from the non-financial firms which were listed in KOSPI and KOSDAQ market between 2001 and 2018. Financial statements data for calculating ratios extracted from NEW KIS-VALUE Ⅲ database.
Total sample size was 28,556 firm-years of which KOSPI was 11,370 and KOSDAQ was 17,186. Sample size of 2001 was the smallest and those of 2018 were the largest. This was the results of new IPO companies.

[Table 1] The distribution of samples by year and Market
YEAR Frequencies
KOSPI KOSDAQ TOTAL 2001 526 652 1,178 2002 560 783 1,343 2003 591 823 1,414 2004 582 818 1,400 2005 597 867 1,464 2006 604 911 1,515 2007 623 974 1,597 2008 631 964 1,595 2009 636 962 1,598 2010 644 955 1,599 2011 665 959 1,624 2012 658 952 1,610 2013 653 968 1,621 2014 656 997 1,653 2015 673 1,058 1,731 2016 677 1,127 1,804 2017 688 1,184 1,872 2018 706 1,232 1,938 Total 11,370 17,186 28,556
Ⅳ. Results
4.1 The descriptive statistics of variables
The descriptive statistics of variables are presented in [Table 2]. For controlling the outlier, all the variables were winsorized by upper and lower 1%. The descriptive statistics of [table 2] are the results of the winsorized variables.
The mean of stock price was 15.93 times of one unit of par value (1 Korea won: ₩1), and the median was 6.17 times. This meant that the companies with relatively high stock prices existed. The average of ROE was -4% and median was 5%, which indicated that a firm’s average net profit was negative. However, median was 5% which was relatively higher than the average. This indicates that there were companies with relatively huge negative ROE. The minimum value of ROE was -573%. This means that the lowest performance companies had risk to become the status of impairment of capital.
The average and median of ROA were -1% and median 3% respective, and those of ROS were -8% and 3%. Those results showed that the performance of product market strategies was not so good, when the performance was measured by traditional approach. However, the average

and median of ROIC were 1% and 5%, and those of RNOA were 2% and 6%. The real performances of product market strategies measured by alternatives was higher than those measured by traditional approach. These results indirectly showed that the alternative approach was needed to measure the real performance of operating activities.
The mean of RNOI showed to be 6% which was higher than the RNOA (2%) and ROE (-4%). However, the median (3%) was lower than that of RNOA (6%) and ROE (5%), and the standard deviation of RNOI (48%) was higher than RNOA (36%). These results showed that the investment performances were more spread than operating performances among companies.
The mean of debt ratio was 110% and the median was 68%. This means that in general, a company’s debt was not much of a burden. However, the minimum value of the debt ratio was 1% and the maximum 4,610%. These imply that the amount of debt ratio varies enormously among companies.
[Table 2] Descriptive Statistics of Variables
Variables Mean Standard Deviation
Min Median Max
Par Price 15.93 48.00 0.01 6.17 1530.00ROE -0.04 0.39 -5.73 0.05 1.80ROA -0.01 0.17 -1.72 0.03 0.37ROS -0.08 0.69 -12.99 0.03 11.23AT 0.91 0.56 0.01 0.82 4.13EM 2.01 1.28 1.01 1.69 38.10
ROIC 0.01 0.20 -2.61 0.05 0.82RNOA 0.02 0.36 -4.71 0.06 4.39RNOI 0.06 0.48 -4.87 0.03 10.43
RNOPAT -0.04 0.44 -8.74 0.04 1.04RNOIPAT -0.02 0.25 -5.09 0.00 1.50
NOAT 1.75 1.62 -5.74 1.38 26.50NOIT 32.12 142.04 0.01 5.74 4,097.82
Debt Ratio 1.10 1.83 0.01 0.68 46.10Ln_Size 25.58 1.44 20.01 25.33 33.02

※ All the variables were winsorized by 1% both upper and lower Par Price : Per share price at the end of financial statements disclosure month divided by par value ROE : Return on equity (= net profit / average equity) ROA : Return on Assets ( = net profit / average total assets) ROS : Return on sales ( = net profit / sales) AT : Assets Turnover (= sales / average total assets) EM : Equity multiplier ( = total assets / equity) ROIC : Return on Invested Assets ( = net operating and investment profit after tax /Invested Assets) RNOA : Return on net operating assets (=net operating profit after tax / average net operating assets) RNOI : Return on non-operating investments (=net investment profit after tax / average non-operating
investment) RNOPAT : Return on Net Operating Profit after Tax(=net operating profit after tax /Sales) RNOIPAT : Return on Net Investment Profit after Tax(=net investment profit after tax /Sales) NOAT : Net Operating Assets Turnover ( = Sales / average net operating assets) NOIT : Non-Operating Investment Turnover( = Sales / average non-operating assets) Debt Ratio : Total debt divided by total capital Ln_Size : Ln(total assets)
4.2 The correlations among variables.
The correlation coefficients among variables are presented in [Table 3]. Pearson correlation coefficients are presented in the lower parts of diagonal, and Spearman rank correlation coefficients are presented in the upper part of diagonal.
All the Pearson correlation coefficients were statistically significant at 5% level except for the coefficient between PP and NOAT, and AT and Ln_size. And all the Spearman rank correlation coefficients were statistically significant at the 5% level without any exception. These results show that the relationship between variables were closed connected.
ROE, ROA, ROS, RNOA, and Size showed positive relationships with price. And EM, AT, and Debt ratio showed negative relationships with price. This means that the stock prices of the companies with higher operating performances were higher, and lower operating performances were related to lower stock prices. The debt ratio was related to low stock prices because more debt was regarded as more risk.
ROE, ROA, and RNOA showed positive relationship with size and negative relationship with debt ratio. In addition, ROE showed significantly positive relationship with RNOI. This shows that ROE was higher when the firm’s operating and investment return were higher and the size was larger, but the ROE was lower when the company’s debt ratio was higher. The increase of a company’s financial leverage did not affect the increase of ROE, but rather the decrease of it. This implies that debt financing might not be able to bring out the increase of ROE in Korea. On average manner, the spread might be negative in KOREA. The performance of non-operating investments (RNOI) showed negative relationship with debt ratio. The size showed positive relationships with the stock price, ROE, RNOA, and the debt ratio.

[Table 3] Correlations among Variables
Variables Par
Price ROE ROA ROS AT EM
ROIC
RNOA
RNOI
RNOPAT
RNOIPA
T
NOAT
NOIT
Debt Ratio
Ln Size
Par Price - 0.31 0.36 0.38 -0.05 -0.34 0.29 0.30 0.05 0.32 0.13 -0.02 -0.10 -0.34 0.24
ROE 0.10 - 0.97 0.87 0.37 -0.15 0.96 0.84 0.39 0.77 0.31 0.33 0.24 -0.19 0.20
ROA 0.12 0.90 - 0.92 0.32 -0.28 0.95 0.84 0.39 0.80 0.34 0.28 0.20 -0.32 0.18
ROS 0.06 0.62 0.71 - 0.08 -0.36 0.85 0.77 0.34 0.86 0.41 0.10 0.02 -0.40 0.21
AT -0.05 0.21 0.25 0.19 - 0.26 0.38 0.31 0.20 0.07 -0.11 0.80 0.68 0.24 0.02
EM -0.09 -0.23 -0.16 -0.06 0.12 - -0.13 -0.14 -0.05 -0.24 -0.22 0.23 0.29 0.96 0.14
ROIC 0.11 0.89 0.96 0.65 0.26 -0.01 - 0.87 0.41 0.80 0.33 0.33 0.26 -0.18 0.18
RNOA 0.09 0.55 0.60 0.46 0.17 -0.07 0.62 - 0.17 0.87 0.14 0.36 0.15 -0.18 0.21
RNOI 0.02 0.33 0.36 0.24 0.10 -0.03 0.37 0.11 - 0.15 0.75 0.08 0.35 -0.08 0.01
RNOPAT 0.06 0.58 0.67 0.83 0.19 -0.05 0.65 0.56 0.13 - 0.17 0.06 0.07 -0.28 0.20
RNOIPAT
0.04 0.40 0.48 0.67 0.10 -0.02 0.46 0.21 0.33 0.40 - -0.03 -0.15 -0.23 0.12
NOAT -0.00 0.13 0.15 0.12 0.63 0.14 0.16 0.29 0.02 0.13 0.05 - 0.29 0.22 0.14
NOIT -0.02 0.03 0.04 0.03 0.17 0.04 0.04 0.02 0.44 0.03 0.02 0.04 - 0.28 -0.09
Debt Ratio
-0.08 -0.41 -0.28 -0.14 0.07 0.76 -0.25 -0.17 -0.08 -0.15 -0.07 0.09 0.03 - 0.14
Ln_Size 0.20 0.24 0.26 0.21 -0.00 0.12 0.25 0.19 0.03 0.21 0.12 0.12 -0.06 0.05 -
※ All the variables were winsorized by 1% both upper and lower Cells are graded if significant level of correlation coefficient is less than 0.05 (α≤0.05) Pearson correlation coefficients are presented in the lower part of diagonal, and Spearman rank correlation coefficients are presented
in the upper part of diagonal
4.3 The effect of ROE and ROE factors on stock price
The results of regression analyses are presented in [Table 4]. Panel A showed regression results that price regressed on the ROE and ROE factors which were decomposed by traditional approach (Model 1, Model 2 A, and Model 3 A). And Panel B showed the regression results of ROIC and ROE factors which were decomposed by alternative approach (Model 2 B and Model 3 B). The significance of regression coefficient was tested by White heteroskedasticty constant t statistics.
The coefficients of ROE and Ln_Size were positive and statistically significant for the total sample and each stock market analysis. These mean that ROE as the comprehensive indicator of management performance affected the stock price positively, and larger companies normally had high stock prices. R2 was 10% for the total sample, and 14% in the KOSPI and KOSDAQ. This means that the value relevance of ROE was increase when analyzed within each market and that was not so much different between KOSPI and KOSDAQ.
When the stock price regressed on ROE factors decomposed into level 1 by traditional approach ([Model 2] A), ROA and EM were statistically significant for the total sample and each market analysis. The coefficients of ROA were positive and those of EM were negative. R2 was 11% in the total sample analysis, and 15% in the KOSPI and KOSDAQ. This also

means that the value relevance of ROE 1st level decomposed factors increase when analyzed within each market. However, the value relevance of ROE factors between KOSPI and KOSDAQ was not so much different and level 1 decomposition factors were not able to increase value relevance compared to ROE itself. And the effect of leverage on stock price was negative. It means that the debt financing is negative effect on value in KOREA.
The value relevance of level 2 decomposed factors which were decomposed by traditional approach ([Model 2] A) was a little different between markets. ROS which is further decomposed factor of ROA was positive coefficient in all the cases (total sample and each market analysis), but significant in total sample and KOSPI and insignificant in KOSDAQ. And AT was not significant in all the cases. EM as a leverage factor was negative and significant in all cases. R2 of total sample was 11%, and that of each market was 14%. Though R2 was increase when analyzed within each market compared to total sample analysis, further decomposition (from level 1 to level 2) was not able to increase value relevance of ROE factors.
In the case of traditional approach, ROE itself and leverage factor of ROE decomposition factor were significant value relevance in all the cases. And operating factors were significant only level 1 decomposition in all cases, but there were different between markets in level 2 decomposition. The value relevance was increase when analyzed within market, but the decomposition level was not to able to increase the value relevance and the value relevance of ROE factors between two market was almost similar.
ROIC and Debt_Ratio as 1st level decomposed factor by alternative approach ([Model 2] B) were significant in all the cases. The coefficient of ROIC was positive and that of Debt_Ratio was negative. This means that the operating performance has a positive effect on stock price and leverage has negative effect on stock price. R2 was 12% for the total sample, and 14% in the KOSPI and KOSDAQ. This means that the value relevance of ROE 1st level decomposed factors by alternative approach also increase when analyzed within each market. However, the value relevance of ROE factors decomposed into 1st level by alternative approach also was not so much different between KOSPI and KOSDAQ, and similar to traditional approach in each market. This result implied that the value relevance of ROE factors was not so much increase by decomposition approach and level.
When ROIC was further decomposed into RNOA (operating performance) and RNOI
(investment performance) by alternative approach ([Model 3] B-Ⅰ), RNOA and Debt_Ratio showed significant in all cases. The coefficients of RNOA were positive and those of Debt_Ratio were negative. However, the coefficient of RNOI was significant in total sample and KOSDAQ. Investment performance was not significantly effect on stock price in KOSI. These results show that though the operating performance effects positively on stock price in both market, the investment performance affect was not same between two markets. The KOSPI companies are relatively larger in size and longer in period than KOSDAQ market. So the investor may have more interest on the core activities (operating activities). R2 of total sample was 11%, and that of each market was 14%. As like traditional approach, R2 was increase compared to total sample analysis when analyzed within each market, and further decomposition (from level 1 to level 2) was not able to increase value relevance of ROE factors.
When RNOA and RNOI were further decomposed into profit (RNOPAT and RNOIPAT) and assets turnover (NOAT and NOIT) by alternative approach ([Model 3] B-Ⅱ), there were a little difference between markets. Net operating profit was significant in all samples and KOSPI, and insignificant in KOSDAQ. However, net operating assets turnover was significant only

KOSDAQ. Non-operating investments profit was insignificant in all cases and non-operating investments turnover was significant in all cases. But the coefficients of NOIT did not show the same sign. There were no increase in R2s of [Model 3] B-Ⅱ when compared to [Model 2] B, [Model 3] B-Ⅰ, and traditional approach. These results implied that alternative approach was not able to increase the value relevance of ROE factors rather than traditional approach and, as like upper analyses, the further decomposition also was not able to increase value relevance.
The value relevance analyses of ROE and ROE factors decomposed by traditional and alternative approach showed that, though ROE and ROE decomposition factors had value relevance, it was not increased by decomposition approach and level. These results may imply that investors prefer financial ratios which are simple in calculation and easy to interpret, to financial ratios which are more theoretical and accurate.
[Table 4] The effect of ROE and ROE factors on Stock Price by Market and Methods
A. Traditional Approach
Variables Total KOSPI KOSDAQ
ROE 6.40 9.31 5.32
ROA 19.12 48.11 13.31
ROS 1.11 3.90 0.62
AT 0.12 -1.22 0.59
EM -2.26 -2.70 -1.27 -1.76 -3.02 -3.74
Ln_Size 7.61 7.65 8.14 9.53 9.16 9.81 8.90 9.06 9.83
R2 0.10 0.11 0.11 0.14 0.15 0.14 0.14 0.15 0.14
B. Alternative Approach
Variables Total KOSPI KOSDAQ
ROIC 14.80 31.14 11.50
RNOA 5.77 4.74 6.70
RNOI 1.12 0.91 1.69
RNOPAT 1.84 9.96 1.34
RNOIPAT -0.00 13.65 -0.16
NOAT 0.05 0.24 -0.42
NOIT 0.00 -0.00 0.01
Debt Ratio -0.92 -1.13 -1.30 -0.61 -0.98 -0.89 -0.76 -0.87 -1.18
Ln_Size 7.54 7.82 8.00 9.26 9.79 9.60 8.77 9.01 9.63
R2 0.12 0.11 0.11 0.14 0.14 0.14 0.14 0.14 0.14
※ All the variables were winsorized by 1% both upper and lower The significant of regression coefficient was tested by White heteroskedasticty constant
t statistics Cells are graded if significant level of t-test is less than 0.05 (α≤0.05)

4.4 The effect of ROE and ROE factors decomposed by traditional approach on stock price according to the RNOA level
For the analyses of the effect of ROE and ROE factors on stock price according to the RNOA level, the samples were grouped into 3 even deciles according to the RNOA for each year in the market. For example, all of the samples of year 2001 in KOSPI were grouped into 3 even deciles according to the ascending order of RNOA. The stock price effects of ROE and ROE factors decomposed by traditional and alternative approach were analyzed for each group. In the analyses, size and industry were used as control variables. The significant of regression coefficients was tested by White heteroskedasticty constant t statistics.
The results of ROE and traditional approach are in [Table 5]. ROE was significant at all levels of RNOA and all markets except in KOSPI at middle level. However, R2s were different among RNOA level – lowest (9%) at middle level and highest (14%) at high level. When analyzed in each market, R2 increased compared to the total sample analysis except KOSPI at low RNOA. R2 between markets according to RNOA level also different. R2 was highest (22%) at high level of RNOA and lowest (7%) at low level in KOSPI, but highest (21%) at low level and lowest (16%) at high level in KOSDAQ.
In the analyses of ROE factors by level 1 decomposition, ROA was insignificant at low level of RNOA for all cases. The value relevance of ROA was significant when analyzed without considering RNOA level ([Table 4]), but the value relevance of ROA was different among RNOA level. ROE factors by level 2 decomposition, ROS was significant only at high level of RNOA for all cases, and insignificant at low level of RNOA. AT was insignificant at high level of RNOA. R2 between markets were also different at the same level of RNOA. R2s among RNOA level were different in the same market.
These results show that the value relevance of ROE and ROE factors decomposed by traditional approach was different among RNOA levels. As like upper analyses in section 4.3, R2s increased when analyzed for the companies listed in the same market, except KOSPI at low level of RNOA. R2s were similar between decomposition levels in the same market. However, R2s among total sample, KOSPI, and KOSDAQ differ from section 4.3 when considering RNOA.
[Table 5] The effect of ROE and ROE factors on Stock Price by RNOA Level
(Traditional Approach)
A. Low
Variables Total KOSPI KOSDAQ
ROE 0.79 1.19 0.94
ROA -1.38 -0.85 -0.87
ROS -0.37 0.01 -0.37
AT -2.42 -3.60 -1.09
EM -1.44 -1.31 -1.16 -1.06 -1.82 -1.71
Ln_Size 3.02 3.35 3.37 4.27 4.46 4.45 4.29 4.77 4.78
R2 0.12 0.12 0.12 0.07 0.08 0.08 0.21 0.21 0.21
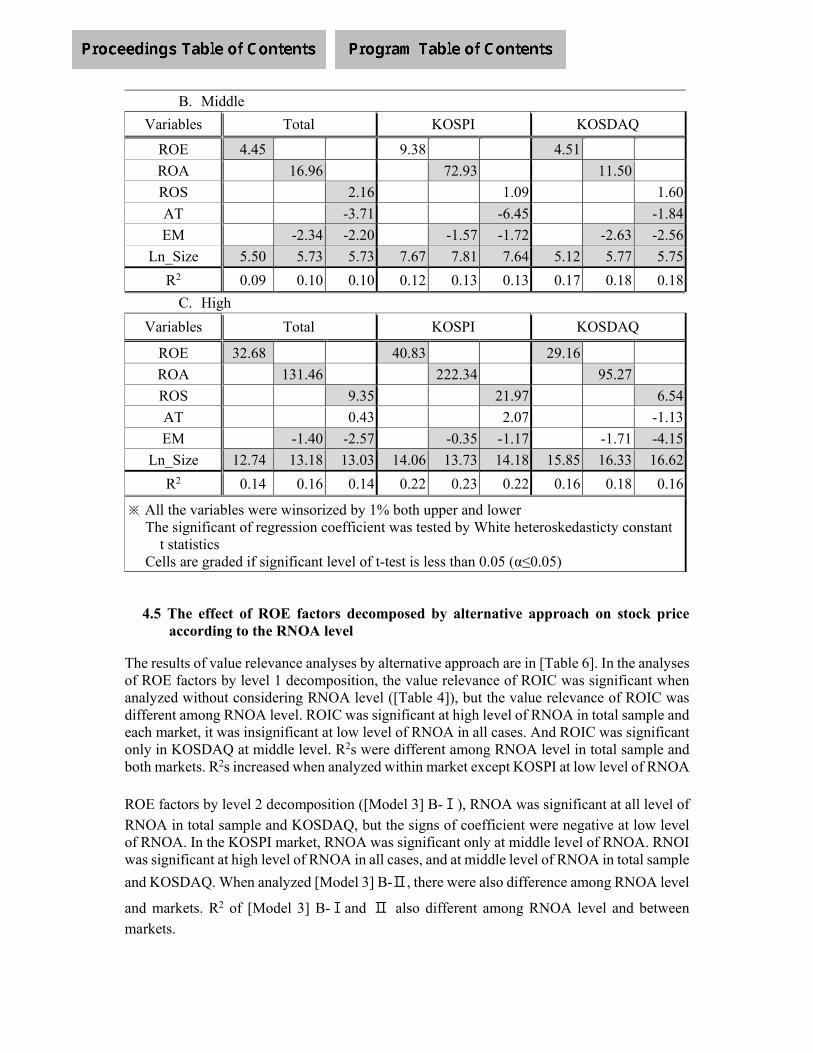
B. Middle
Variables Total KOSPI KOSDAQ
ROE 4.45 9.38 4.51
ROA 16.96 72.93 11.50
ROS 2.16 1.09 1.60
AT -3.71 -6.45 -1.84
EM -2.34 -2.20 -1.57 -1.72 -2.63 -2.56
Ln_Size 5.50 5.73 5.73 7.67 7.81 7.64 5.12 5.77 5.75
R2 0.09 0.10 0.10 0.12 0.13 0.13 0.17 0.18 0.18
C. High
Variables Total KOSPI KOSDAQ
ROE 32.68 40.83 29.16
ROA 131.46 222.34 95.27
ROS 9.35 21.97 6.54
AT 0.43 2.07 -1.13
EM -1.40 -2.57 -0.35 -1.17 -1.71 -4.15
Ln_Size 12.74 13.18 13.03 14.06 13.73 14.18 15.85 16.33 16.62
R2 0.14 0.16 0.14 0.22 0.23 0.22 0.16 0.18 0.16
※ All the variables were winsorized by 1% both upper and lower The significant of regression coefficient was tested by White heteroskedasticty constant
t statistics Cells are graded if significant level of t-test is less than 0.05 (α≤0.05)
4.5 The effect of ROE factors decomposed by alternative approach on stock price according to the RNOA level
The results of value relevance analyses by alternative approach are in [Table 6]. In the analyses of ROE factors by level 1 decomposition, the value relevance of ROIC was significant when analyzed without considering RNOA level ([Table 4]), but the value relevance of ROIC was different among RNOA level. ROIC was significant at high level of RNOA in total sample and each market, it was insignificant at low level of RNOA in all cases. And ROIC was significant only in KOSDAQ at middle level. R2s were different among RNOA level in total sample and both markets. R2s increased when analyzed within market except KOSPI at low level of RNOA
ROE factors by level 2 decomposition ([Model 3] B-Ⅰ), RNOA was significant at all level of RNOA in total sample and KOSDAQ, but the signs of coefficient were negative at low level of RNOA. In the KOSPI market, RNOA was significant only at middle level of RNOA. RNOI was significant at high level of RNOA in all cases, and at middle level of RNOA in total sample
and KOSDAQ. When analyzed [Model 3] B-Ⅱ, there were also difference among RNOA level
and markets. R2 of [Model 3] B-Ⅰand Ⅱ also different among RNOA level and between markets.

The analyses of ROE factors decomposed by alternative approach according to RNOA level showed that the value relevance of ROE factors were different among RNOA levels and between markets as like traditional approach.
[Table 6] The effect of ROE and ROE factors on Stock Price by RNOA Level
(Alternative Approach)
A. Low
Variables Total KOSPI KOSDAQ
ROIC -1.80 -1.66 -1.28
RNOA -4.33 -6.73 -2.30
RNOI 0.33 -0.21 0.74
RNOPAT -2.13 -1.61 -1.76
RNOIPAT 1.43 2.90 1.17
NOAT -0.47 -0.46 -0.46
NOIT -0.00 -0.00 -0.00
Debt Ratio -0.51 -0.57 -0.48 -0.54 -0.61 -0.49 -0.46 -0.47 -0.45
Ln_Size 3.26 3.44 3.38 4.41 4.57 4.44 4.66 4.79 4.81
R2 0.12 0.12 0.12 0.08 0.08 0.08 0.21 0.21 0.21
B. Middle
Variables Total KOSPI KOSDAQ
ROIC 8.67 13.02 10.95
RNOA 40.28 129.71 31.75
RNOI 1.21 0.49 1.96
RNOPAT 24.91 -0.95 37.61
RNOIPAT 7.27 8.99 7.15
NOAT -1.02 -1.43 -0.50
NOIT 0.00 0.00 0.00
Debt Ratio -1.88 -1.86 -1.65 -1.65 -1.65 -1.45 -1.91 -1.88 -1.69
Ln_Size 5.70 5.65 5.77 7.80 7.80 7.84 5.62 5.70 5.59
R2 0.10 0.10 0.10 0.12 0.13 0.12 0.18 0.18 0.19
C. High
Variables Total KOSPI KOSDAQ
ROIC 81.80 112.36 63.69
RNOA 7.09 1.35 55.87
RNOI 4.52 4.18 5.56
RNOPAT 14.78 5.63 15.93
RNOIPAT 6.65 42.86 0.71
NOAT -0.98 -0.51 -1.59
NOIT 0.01 -0.01 0.01
Debt Ratio -2.07 -2.26 -1.95 -1.23 -1.09 -0.89 -3.19 -4.59 -3.35
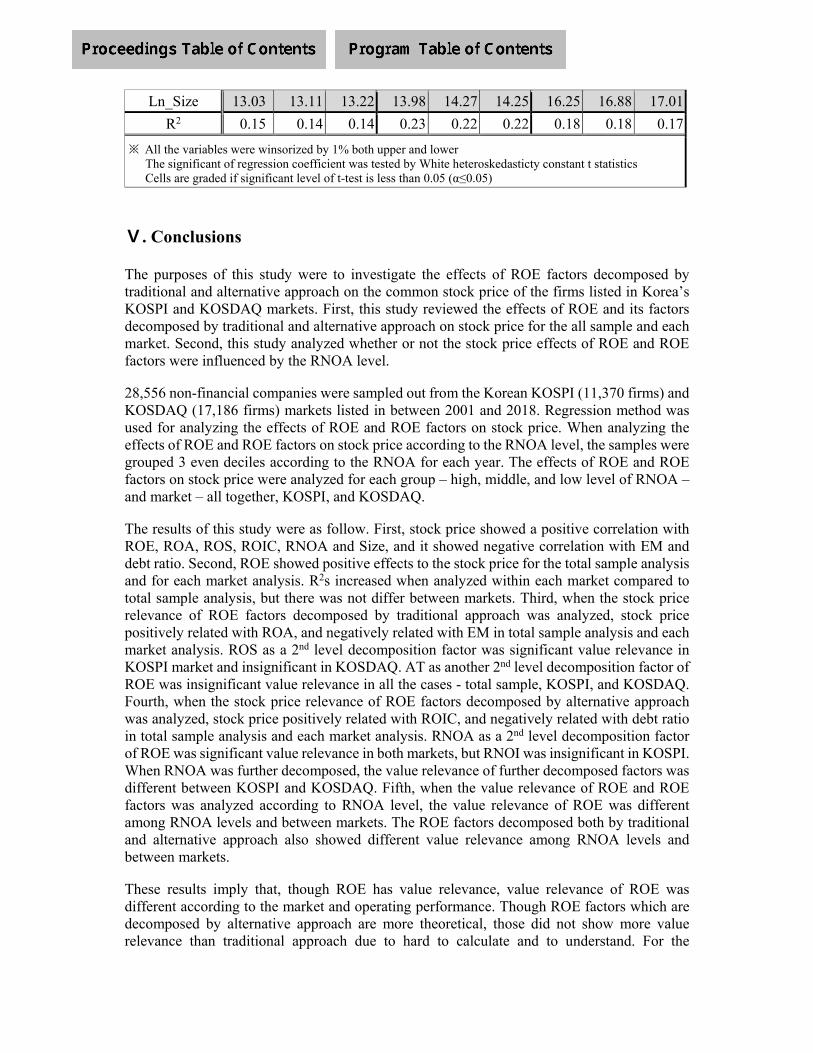
Ln_Size 13.03 13.11 13.22 13.98 14.27 14.25 16.25 16.88 17.01
R2 0.15 0.14 0.14 0.23 0.22 0.22 0.18 0.18 0.17
※ All the variables were winsorized by 1% both upper and lower The significant of regression coefficient was tested by White heteroskedasticty constant t statistics Cells are graded if significant level of t-test is less than 0.05 (α≤0.05)
Ⅴ. Conclusions
The purposes of this study were to investigate the effects of ROE factors decomposed by traditional and alternative approach on the common stock price of the firms listed in Korea’s KOSPI and KOSDAQ markets. First, this study reviewed the effects of ROE and its factors decomposed by traditional and alternative approach on stock price for the all sample and each market. Second, this study analyzed whether or not the stock price effects of ROE and ROE factors were influenced by the RNOA level.
28,556 non-financial companies were sampled out from the Korean KOSPI (11,370 firms) and KOSDAQ (17,186 firms) markets listed in between 2001 and 2018. Regression method was used for analyzing the effects of ROE and ROE factors on stock price. When analyzing the effects of ROE and ROE factors on stock price according to the RNOA level, the samples were grouped 3 even deciles according to the RNOA for each year. The effects of ROE and ROE factors on stock price were analyzed for each group – high, middle, and low level of RNOA – and market – all together, KOSPI, and KOSDAQ.
The results of this study were as follow. First, stock price showed a positive correlation with ROE, ROA, ROS, ROIC, RNOA and Size, and it showed negative correlation with EM and debt ratio. Second, ROE showed positive effects to the stock price for the total sample analysis and for each market analysis. R2s increased when analyzed within each market compared to total sample analysis, but there was not differ between markets. Third, when the stock price relevance of ROE factors decomposed by traditional approach was analyzed, stock price positively related with ROA, and negatively related with EM in total sample analysis and each market analysis. ROS as a 2nd level decomposition factor was significant value relevance in KOSPI market and insignificant in KOSDAQ. AT as another 2nd level decomposition factor of ROE was insignificant value relevance in all the cases - total sample, KOSPI, and KOSDAQ. Fourth, when the stock price relevance of ROE factors decomposed by alternative approach was analyzed, stock price positively related with ROIC, and negatively related with debt ratio in total sample analysis and each market analysis. RNOA as a 2nd level decomposition factor of ROE was significant value relevance in both markets, but RNOI was insignificant in KOSPI. When RNOA was further decomposed, the value relevance of further decomposed factors was different between KOSPI and KOSDAQ. Fifth, when the value relevance of ROE and ROE factors was analyzed according to RNOA level, the value relevance of ROE was different among RNOA levels and between markets. The ROE factors decomposed both by traditional and alternative approach also showed different value relevance among RNOA levels and between markets.
These results imply that, though ROE has value relevance, value relevance of ROE was different according to the market and operating performance. Though ROE factors which are decomposed by alternative approach are more theoretical, those did not show more value relevance than traditional approach due to hard to calculate and to understand. For the

acceptance of more theoretic financial information such as ROE factors decomposed by alternative approach, it may be needed to easy to calculate and to understand financial ratios.
The ROE and ROE factors had more value relevance when analyzed the companies with similar characteristics such as market, and RNOA level also effects on the value relevance of ROE factors. So, analysts need to consider the firm’s characteristics, and RNOA level when evaluate a firm’s value by ROE and ROE decomposing factors. Especially, when using RNOA and RNOI for stock price evaluation, it is needed for the analysts to consider the RNOA levels.
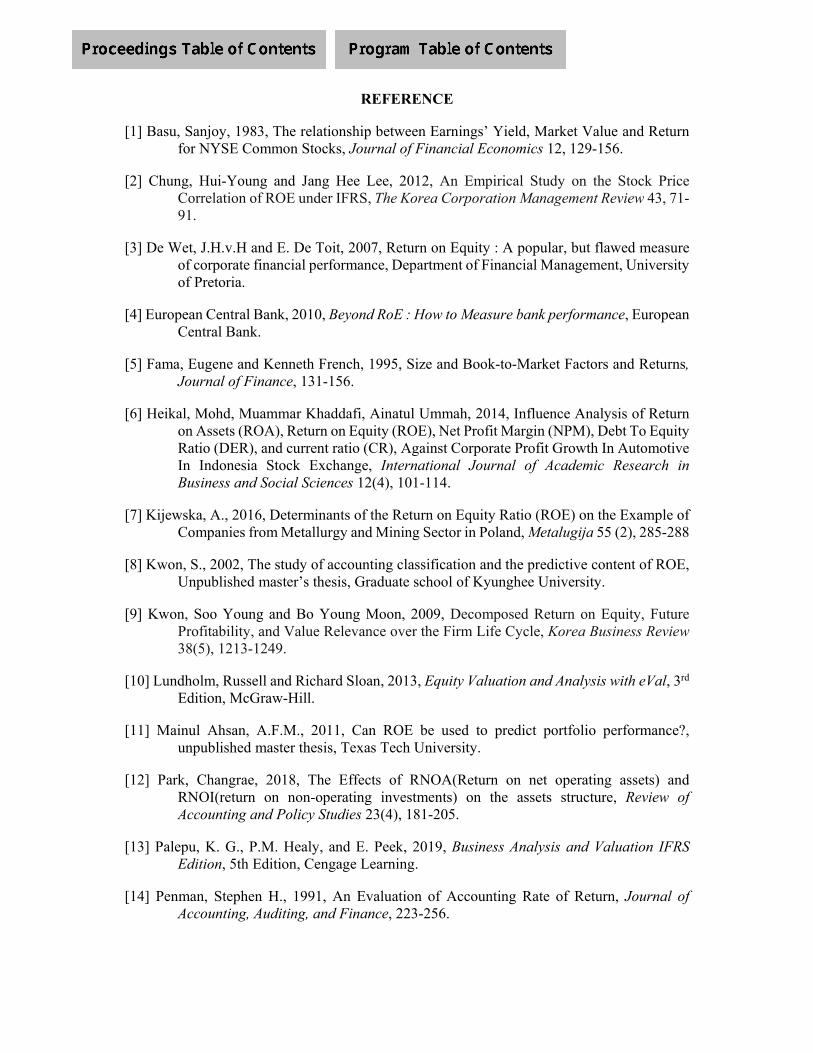
REFERENCE
[1] Basu, Sanjoy, 1983, The relationship between Earnings’ Yield, Market Value and Return for NYSE Common Stocks, Journal of Financial Economics 12, 129-156.
[2] Chung, Hui-Young and Jang Hee Lee, 2012, An Empirical Study on the Stock Price Correlation of ROE under IFRS, The Korea Corporation Management Review 43, 71-91.
[3] De Wet, J.H.v.H and E. De Toit, 2007, Return on Equity : A popular, but flawed measure of corporate financial performance, Department of Financial Management, University of Pretoria.
[4] European Central Bank, 2010, Beyond RoE : How to Measure bank performance, European Central Bank.
[5] Fama, Eugene and Kenneth French, 1995, Size and Book-to-Market Factors and Returns, Journal of Finance, 131-156.
[6] Heikal, Mohd, Muammar Khaddafi, Ainatul Ummah, 2014, Influence Analysis of Return on Assets (ROA), Return on Equity (ROE), Net Profit Margin (NPM), Debt To Equity Ratio (DER), and current ratio (CR), Against Corporate Profit Growth In Automotive In Indonesia Stock Exchange, International Journal of Academic Research in Business and Social Sciences 12(4), 101-114.
[7] Kijewska, A., 2016, Determinants of the Return on Equity Ratio (ROE) on the Example of Companies from Metallurgy and Mining Sector in Poland, Metalugija 55 (2), 285-288
[8] Kwon, S., 2002, The study of accounting classification and the predictive content of ROE, Unpublished master’s thesis, Graduate school of Kyunghee University.
[9] Kwon, Soo Young and Bo Young Moon, 2009, Decomposed Return on Equity, Future Profitability, and Value Relevance over the Firm Life Cycle, Korea Business Review 38(5), 1213-1249.
[10] Lundholm, Russell and Richard Sloan, 2013, Equity Valuation and Analysis with eVal, 3rd Edition, McGraw-Hill.
[11] Mainul Ahsan, A.F.M., 2011, Can ROE be used to predict portfolio performance?, unpublished master thesis, Texas Tech University.
[12] Park, Changrae, 2018, The Effects of RNOA(Return on net operating assets) and RNOI(return on non-operating investments) on the assets structure, Review of Accounting and Policy Studies 23(4), 181-205.
[13] Palepu, K. G., P.M. Healy, and E. Peek, 2019, Business Analysis and Valuation IFRS Edition, 5th Edition, Cengage Learning.
[14] Penman, Stephen H., 1991, An Evaluation of Accounting Rate of Return, Journal of Accounting, Auditing, and Finance, 223-256.

[15] Penman, Stephen H., 2010, Financial Statement Analysis and Security Valuation, 4th Edition, McGraw-Hill.
1
PRICING OF AUDIT SERVICES IN INDIA – A STUDY
Sanjib Kumar Basu Kolkata of University of Calcutta
India [email protected]
ABSTRACT
This paper examined the clients’ and the auditors’ attributes as factors capable of determining external audit fees to be paid by the Indian companies. Specific characteristics that were studied to have significant influences on pricing of external audit services are size of the client, type of the company, profitability, leverage, level of corporate governance, size of the audit firm and internal audit. The study used primary data for the purpose of the analysis of the perceptions of the respondents and also used secondary data to validate the observations. The primary data was collected through structured questionnaire from the finance managers, accountants and the internal auditors of selected Indian companies who are directly associated with the audit services of the entities on behalf of the internal management. The data obtained and measured through Likert scale was analysed using descriptive statistics to depict pattern. Therefore, measure of central tendency, measure of dispersion and chi-square test was used to examine the responses over the factors influencing the price for the audit services. The findings from the study appear to be largely consistent with the previous studies as the size of the audit firm and leverage are found to be significant in the pricing of external audit fees across the companies. Surprisingly, the premium value for the Big 4 was not only high, but significantly consistent in most of the responses suggesting the near dominance of the audit market by these big accounting firms in India. No doubt, this trend has serious implications and the Indian small and medium sized firms to brace up and further improve on the provision of qualitative services to the client. Keywords: Audit Fees, Big 4, External Audit, Indian Auditing Environment and Perception
2
PRICING OF AUDIT SERVICES IN INDIA- A STUDY
A: Introduction
Pricing for audit services, i.e., audit fees can be defined as the amount of fees charged by the
auditor for an audit process performed for the accounts of an enterprise (auditee). The
determination of the audit fees is based on the contract between the auditor and the auditee in
accordance with time spent on the audit process, the service required and the number of staff
needed for the audit process. In fact, audit fees are normally determined before starting the audit
process. There is a growing trend in recent years in accounting about discussing the issue of audit
fees, how do auditors determine the amount of fees to be charged from the auditee. This is an
important question that needs an answer. Prior research tried to examine whether fixing the audit
fees is affected by the audit firm’s attributes (like size, reputation, experience, degree of
competition, industry specialization) or by the client’s characteristics (auditee attributes like size,
complexity, risk, and profitability).
The cost of auditing is not sacrosanct across all industries and trades. They usually vary
immensely. A small business may not be able to offer the fees and charges that one of its more
established peers could demand. Auditing firms are aware of this and their charges vary widely.
Given the asymmetry of information between the company and its stakeholders, understanding the
way in which audit fees are determined enables us to infer how auditors, who are entities with
access to insider information, analyze the risk and complexity of auditee; these are the two key
factors influencing the pricing of services. In addition, the contracting entities themselves must
understand the factors affecting the fees that they pay so that they can adopt measures to reduce
these costs, which are often not negligible.
B: Rationale behind the Study
It may be found appropriate to identify the factors that affect the audit fees in Indian companies,
considering that no studies were found that address how audit expenses are determined in India.
Moreover, it is experienced through different studies that the significance of certain variables
changes according to each country's characteristics and period of analysis, recommending that
models be revised periodically. Therefore, it becomes essential to conduct specific research on
Indian companies.
An in-depth study of selected publicly traded companies in India was made to accomplish the
proposed goal. Data from 2009-10 to 2018-19 were used because this period witnessed a through

3
regulatory revision in the presentation and disclosure pattern of the accounting information in
India. Analysis of the expenses on auditing services as available in the annual reports for the years
of study was only made; that is, any spending on other works was ignored.
C: Statement of the Problem
The problem statement of the study is highlighted by providing answers to the following questions:
1. Does company related issues such as corporate size of the client; type of the company;
profitability; leverage; internal audit and level of corporate governance affect pricing of audit
services?
2. Does the size of audit firm and international linkage affect pricing of audit services?
D: Objectives of the Study:
As mentioned earlier, few studies were conducted in Asian countries in general and in India in
particular to identify the factors that may influence pricing of audit services. The current study
aims to identify the factors that may influence pricing of audit services charged by audit firms
against Indian companies. The study also aims to reveal whether pricing of audit services differ
according to the factors examined in the study.
E: The Indian Auditing Environment
It is important to highlight some issues related to Indian audit environment before undertaking this
study. It is important to note that the Bombay Stock Exchange (BSE) first ever stock exchange in
Asia (established in 1875) and the first in the country to be granted permanent recognition under
the Securities Contract Regulation Act, 1956. BSE Limited has had an interesting rise to
prominence over the past 144 years. BSE has facilitated the growth of the Indian corporate sector
by providing it with an efficient capital raising platform. (Yojana- July, 2012)
The Big 4, i.e., Ernst and Young (E&Y), Deloitte and Touche (D&T), KPMG and Price
Waterhouse Coopers (PWC) have a strong presence in India. Deloitte and Touche and KPMG
operate as a joint venture, whereas the other two operate as branches of international firms. “The
Big Four dominates the audit services industry in India. A total of 78.3% of the listed companies
in Bombay Stock Exchange (BSE) that published their annual reports in 2016 are audited by one
of the Big Four, and the others are audited by non-Big four. “Companies in India are required to
comply with Ind AS, i.e., Indian Accounting Standards converged with International Financial
Reporting Standards (IFRS), whereas accounting firms must comply with the Standards of
Auditing of India which are also converged with International Standards of Auditing. These
4
requirements apply to all companies, including financial intuitions”. The results of the study are
expected to increase the knowledge about how listed companies and audit firms in India reflect
pricing of audit services through their reporting practices.
F: Review of the Existing Literature
The most important factors affecting the pricing of audit services that may be highlighted in the
literature review include corporate size, audit firm size, corporate complexity, corporate
profitability, corporate risk, internal audit, price to book value ratio and size of the client.
It has been argued in the literature that increasing companies’ size resulted in increasing audit fees
(Simunic, 1980); risk (Stice, 1991); complexity (Hackenbrack and Knechel, 1997); and
profitability (Hay, et al., 2006).
Also, the same conclusion was reached in the literature review- that audit fees increase with audit
firm size (Francis, 1984; Palmrose, 1986); reputation (Craswell et al., 1995; Collinan, 1998;
Larcker and Richardson, 2004; Gonthier-Besacier and Schatt, 2007); and whether is one of the Big
Four (Palmrose, 1986; Francis and Simon 1987; Butterworth and Houghton, 1995).
Friis and Nielsen (2010) investigated the likelihood that applied IFRS standards may result in
increased Danish companies‟ cost of auditing. The study found that using IFRS standards does not
increased significantly audit fees. However, they found that combining IFRS with company size
and complexity, large and complex companies play a vital role in determining pricing of audit
services compared with less complex and small companies that also use IFRS. Ellis and Brooker
(2011) examined the determinants of audit fees in the community. The results revealed “that the
model is highly significant and explains the majority of the cross sectional variance in audit fees”.
Also, the study concluded “that the size and complexity variables explain the majority of variance
in fees”.
Hamid and Ali (2012) investigated the factors that may determine pricing of audit services in Iran.
The study concluded that “there was a significant relationship between auditing fees and its
predictors”. The study contributed some knowledge about understanding auditing fees.
Hallak and Silva (2012) examined the factors affecting auditing and consulting expenditures in
Brazilian public companies. The results concluded “that pricing of audit services are positively
related to company size, corporate performance quality, and the Big Four status of the auditor, but
had no significant relationship with corporate governance”.
5
Muni and Al-Hajeri (2013) conducted a study to examine the factors affecting the pricing of audit
services. The study shed light on the importance of the following factors in determining audit fees.
The study found that the following factors are significant in pricing audit services: the number of
transactions, the sum of accounts receivable and inventory, information technology, number of
subsidiaries, and regulations.
Monsuru (2014) investigated the factors affecting the pricing of audit services in the Nigerian
commercial banking sector industry. The findings of the study revealed that there is a positive
association of complexity, risk, but negative association between operating performance and
pricing of audit services.
Liu (2017) conducted a study about determinants of audit fees in China. The paper used the
regression model at individual auditor level and concluded that the variables of age, gender,
educational background, industry specialization, position and business, all have significant
correlation with the audit fees.
Sonu (2017) conducted a study about determinants of audit fees and financial crisis in Korea. The
study found that audit fees fall down dramatically during the financial crisis period. The study
suggests that auditors respond differently to small and risky firms into how auditors behave when
they are under pressure to reduce audit fees.
G: Research Methodology
The study is an explanatory attempt study to verify the hypotheses about the impact of independent
variables upon a dependent variable of pricing of audit services. Descriptive statistics and Chi
square test were used to test the hypothesis regarding the pricing of audit services on size of the
client, the type of the company, profitability of the client, leverage, internal audit, level of corporate
governance and the size of audit firm.
1. Sample Study Selection
Two sources were used to collect data (primary and secondary data sources).To achieve the
objectives of the current study and in light of the literature review and theoretical background, a
survey instrument (questionnaire) was used to solicit respondent’ opinions and attitudes towards
the factors affecting the pricing of audit services in selected Indian companies. Since the main
objective of the current study is to investigate perceptions on the factors affecting the pricing of
audit services, it would be difficult to conduct the research other than via a survey, as the data sources

6
are persons themselves, rather than any other source. So the survey strategy was chosen to conduct this
research.
2. Data Collection:
A questionnaire was developed and distributed to the sample study to collect data necessary to test
the hypothesis. Finance Managers, Accountants and Internal Auditors were covered in this study
who are directly associated with the auditing services from the client side. However, the opinions
of the external auditors were not considered and included for the purpose of this study.
3. Hypothesis Development
The current study investigates the distinguishing features in India where companies try to choose
the auditor with the lowest audit price. Therefore, the current study aims to test the relationship
between auditors and clients regarding pricing of audit services. These factors can be summarized
as follows:
I. Size of the client:
The relationship between company size and auditing fees are positive; that is, auditing and
consulting firms are charging large companies higher fees because the service is more complex
and demands more hours of work relative to services provided to small companies. The company
size is the key factor in explaining auditing service fees and it may be argued that it is natural
because reviewing the company will require additional effort from the auditing firm.
Client size was employed by many previous studies (Taylor and Baker, 1981; Francis, 1984; Firth,
1985; Barber, 1987; Chan , 1993; Anderson and Zeghal, 1994; Pong and Whittington, 1994;
Johnson, 1995; Gregory and Collier, 1996; Ho and Ng., 1996; Iyer and Iyer, 1996; Simon, 1996;
Waresul Karim and Moizer, 1996; Zhang and Myrteza, 1996; Firth, 1997; Lengendijk, 1997; Mike,
1997; Joshi and Al-Bastaki, 2000; Chung and Narasimhan, 2002; Simon and Taylor, 2002;
Ezzamel, 2002). Client size is considered an important factor in determining the audit fees, (Hay
et al., 2006).
Using client size was justified based on the basis that auditors spent more time on auditing
transactions of more complex businesses. Joshi (1999), Al-shammari, (2008) and Xu (2011)
provided exclusive evidence that the size of the client is the most important variable in pricing of
audit services. Based on the above discussions, the following hypothesis is developed:
H1: There is a positive relationship between corporate size and pricing of audit services.
II. Type of the Company
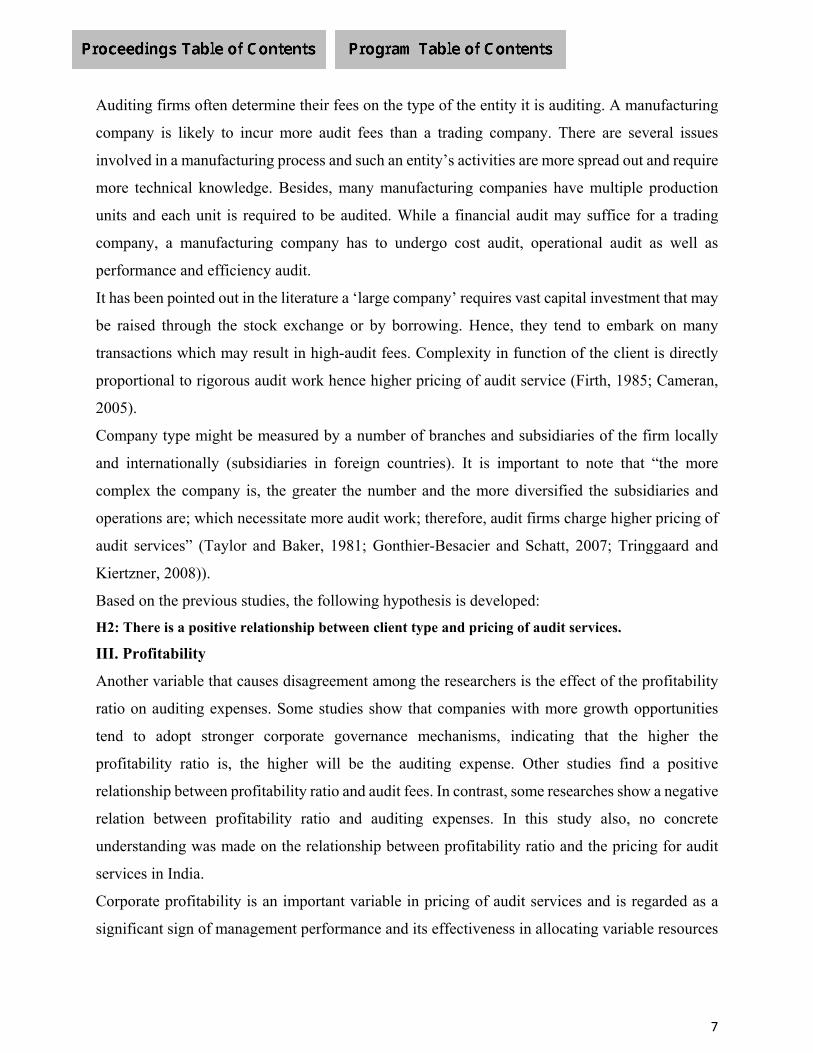
7
Auditing firms often determine their fees on the type of the entity it is auditing. A manufacturing
company is likely to incur more audit fees than a trading company. There are several issues
involved in a manufacturing process and such an entity’s activities are more spread out and require
more technical knowledge. Besides, many manufacturing companies have multiple production
units and each unit is required to be audited. While a financial audit may suffice for a trading
company, a manufacturing company has to undergo cost audit, operational audit as well as
performance and efficiency audit.
It has been pointed out in the literature a ‘large company’ requires vast capital investment that may
be raised through the stock exchange or by borrowing. Hence, they tend to embark on many
transactions which may result in high-audit fees. Complexity in function of the client is directly
proportional to rigorous audit work hence higher pricing of audit service (Firth, 1985; Cameran,
2005).
Company type might be measured by a number of branches and subsidiaries of the firm locally
and internationally (subsidiaries in foreign countries). It is important to note that “the more
complex the company is, the greater the number and the more diversified the subsidiaries and
operations are; which necessitate more audit work; therefore, audit firms charge higher pricing of
audit services” (Taylor and Baker, 1981; Gonthier-Besacier and Schatt, 2007; Tringgaard and
Kiertzner, 2008)).
Based on the previous studies, the following hypothesis is developed:
H2: There is a positive relationship between client type and pricing of audit services.
III. Profitability
Another variable that causes disagreement among the researchers is the effect of the profitability
ratio on auditing expenses. Some studies show that companies with more growth opportunities
tend to adopt stronger corporate governance mechanisms, indicating that the higher the
profitability ratio is, the higher will be the auditing expense. Other studies find a positive
relationship between profitability ratio and audit fees. In contrast, some researches show a negative
relation between profitability ratio and auditing expenses. In this study also, no concrete
understanding was made on the relationship between profitability ratio and the pricing for audit
services in India.
Corporate profitability is an important variable in pricing of audit services and is regarded as a
significant sign of management performance and its effectiveness in allocating variable resources

8
(Kikhia, 2015). Profitable firms are willing to pay more pricing of audit services to their external
auditors in view of the fact that higher profits may require accurate audit testing of the authority
for the identification of revenue and expenses that require more audit time (Joshi and Al-Bastaki,
2000). Most of studies in the literature indicate that the size of audit fees is significantly influenced
by profitability ratios (Sandra and Patrick, 1996). In the light of the above arguments, the following
hypothesis is developed:
H3: There is a positive relationship between profitability of the client and pricing of audit services.
IV. Leverage
Different studies show that the higher a company's probability of facing future financial difficulties
is, the more independent the auditor will be. Furthermore, it is reasonable to assume that the
auditing effort will be greater for companies with financial difficulties. Given that more highly
leveraged companies are more likely to have insolvency issues, the relationship between company
leverage and auditing fees are found positive; that is, auditing fees are higher for more highly
leveraged companies. Companies with higher business risks are associated with auditor
conservatism and that increased customer pressure improves auditing quality in this situation. It
may be argued that leverage is positively related to auditing fees because leveraged companies
require more careful monitoring to protect themselves from financial and market risks. Another
possible explanation is that more leveraged companies have a higher risk, which therefore causes
the audit fees to be greater.
“The degree of the risk, i.e., financial leverage of the client may be a considered when pricing of
audit services, as it could affect the auditor’s responsibility. Therefore, the more the risk involved,
the greater is the responsibility which deserve a higher fee to compensate the external auditor for
taking such risk” (Kikhia, 2015). Firth (1993) “discovered that higher level of client risk due to
high degree of financial leverage will increase the auditor’s effort which results in higher pricing
of audit services; therefore, the accounting firm will have to undertake detailed work to resolve or
moderate the risk”.
Based on the previous studies, the following hypothesis is developed:
H4: There is a positive relationship between the degree of leverage and pricing of audit services.
V. Internal Audit
A company which has a sound internal auditing department can incur less auditing costs. This is
because the department will have already done the basic work when the external auditor arrives.

9
The auditor will get all the papers necessary for the work. Many companies are adding more staff
to their internal audit team to keep audit costs low. In this study, however, no such relationship
could have been possible to be established.
The literature also found the variable “internal audit to be a significant determinate of audit fees”
(Chan, 1993; Ezzamel, 1996). In addition, it has been pointed that a week or absence of internal
audit system could be associated with either expensive audit fees or with efficient corporate
accounting practices and internal control systems that could result in less audit work and hence
lower fees. A week internal audit system might suggest that a company is facing accounting
problems that may require extra audit work and hence additional audit fees are payable (Naser and
Nuseibeh, 2007). Thus, the following hypothesis is developed:
H5: There is a positive relationship between internal audit and pricing of audit services.
VI. Level of Corporate Governance
Another driver of pricing for audit services is the level of corporate governance. External auditing
functions as a governance mechanism because it helps to solve agency problems, which sometimes
preclude the alignment of the interests of the shareholders and managers. External auditing serves
to mitigate agency problems because it contributes to increasing the credibility of financial
information through theoretically more accurate and independent analysis to better reflect the
operational and financial situation of the company in question. It is also argued that external
auditing will reduce agency costs if the market believes in the auditor's expertise and
independence. Companies with good governance practices are interested in offering more
transparency and disclosing more accurate information to investors and, therefore, hire higher
quality auditing services, thereby increasing their expenses.
Some researchers show that companies with strong auditing committees have lower auditing
expenses, whereas some other researchers find that companies with good governance tend to spend
more on auditing. As expected, there are discrepancies in the relationship between corporate
governance and auditing expenses because there is no consensus that the hiring of auditing services
leads to the loss of independence.
Level of corporate governance was found to be a significant determinant of audit fees (Francise,
1984; Francise and Stockes, 1986; Chan et al., 1993; Craswell, 1995; Che Ahmad and Houghton,
1996; Ezzamel, 1996). It was also found that there is a difference in audit work performed at high
level of corporate governance and low level of corporate governance (Chane, 1993). This may be

10
justified on the basis that audit firms tend to charge a premium for a low level of corporate
governance (Waresul Karim and Moizer, 1996). Consequently, it is assumed that companies with
high level of corporate governance would be expected to pay a lesser amount for the audit service
provided. In the light of the above discussion, the following hypothesis is developed:
H6: There is a positive relationship between the level of corporate governance and pricing of audit
services.
VII. Size of the Audit Firm
A recurring aspect in the literature reviewed is whether being one of the large audit firms increases
the fees charged for auditing services. Different studies propose three hypotheses on this matter:
(i) fees are proportionately higher because of the market monopoly (or oligopoly in this case) held
by the large firms; (ii) a premium is charged due to the higher quality of services provided
compared to competitors; and (iii) lower prices are charged because they reflect economies of
scale, which cannot be exploited by "small" firms. The studies conclude that being big firm has a
positive effect, demonstrating evidence for hypothesis (ii); that is, of a premium being charged for
the higher quality of services provided compared to competitors.
It is also emphasized in this study that large firms have more to lose in terms of reputation when
they make a mistake and, therefore, have an added incentive to do quality work. Other studies also
note the existence of the price premium charged by the main auditors and show that global auditors
charge higher fees.
It has been argued in the literature that there is a positive relationship between the size of the audit
firm and audit fees (Ibrahim, 2006).Companies audited by audit firms affiliated to big international
firms tend to publish high quality information. This is justified on the grounds that large
international audit firms have audit quality and protect credibility which might entails extra cost.
Audit firms with international affiliations are larger and supported by more technical experts than
small local firms and hence tend to supply better auditing quality and expect to incur more cost;
this in turn would be reflected in their charges to customers.
Waresul Karim and Moizer (1996) justified the existence of a positive relationship between the
size of the auditor and the size of the audit fees as the big audit firms have access to higher quality
staff, use advanced quality procedures, and so are more likely to detect errors and omissions. In
light of the above arguments, the following hypothesis is developed:
H7: There is a positive relationship between the size of auditing firms and auditor fees.
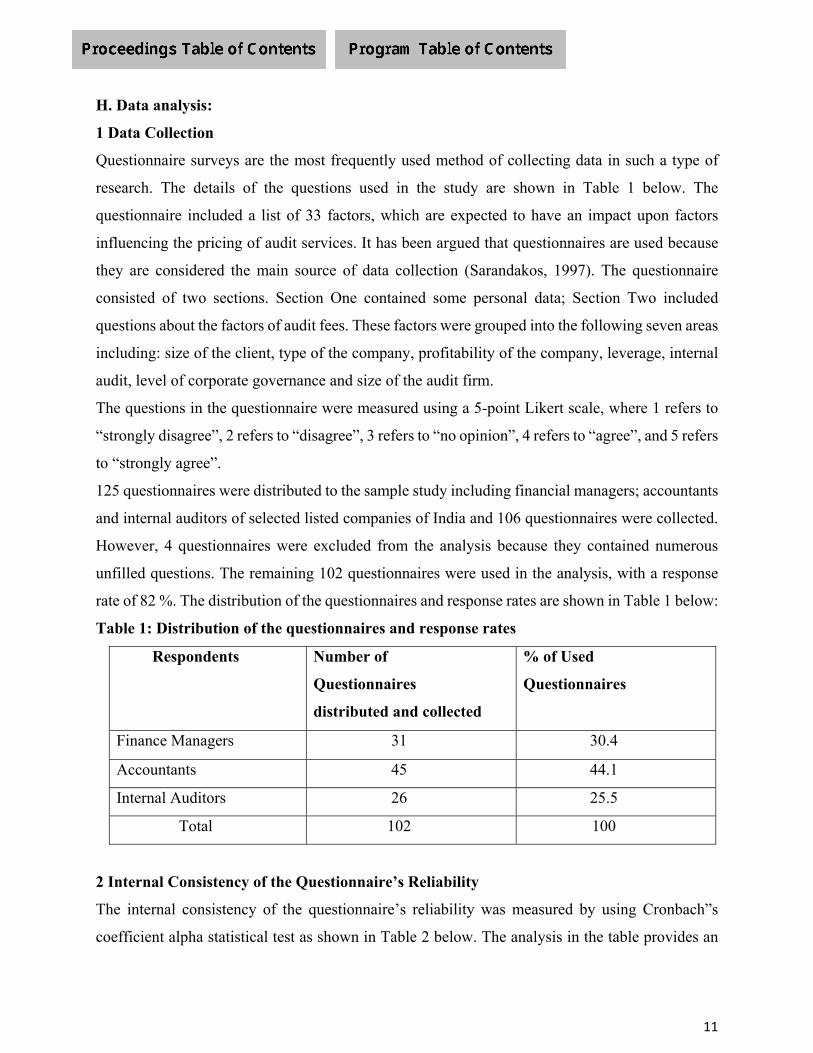
11
H. Data analysis:
1 Data Collection
Questionnaire surveys are the most frequently used method of collecting data in such a type of
research. The details of the questions used in the study are shown in Table 1 below. The
questionnaire included a list of 33 factors, which are expected to have an impact upon factors
influencing the pricing of audit services. It has been argued that questionnaires are used because
they are considered the main source of data collection (Sarandakos, 1997). The questionnaire
consisted of two sections. Section One contained some personal data; Section Two included
questions about the factors of audit fees. These factors were grouped into the following seven areas
including: size of the client, type of the company, profitability of the company, leverage, internal
audit, level of corporate governance and size of the audit firm.
The questions in the questionnaire were measured using a 5-point Likert scale, where 1 refers to
“strongly disagree”, 2 refers to “disagree”, 3 refers to “no opinion”, 4 refers to “agree”, and 5 refers
to “strongly agree”.
125 questionnaires were distributed to the sample study including financial managers; accountants
and internal auditors of selected listed companies of India and 106 questionnaires were collected.
However, 4 questionnaires were excluded from the analysis because they contained numerous
unfilled questions. The remaining 102 questionnaires were used in the analysis, with a response
rate of 82 %. The distribution of the questionnaires and response rates are shown in Table 1 below:
Table 1: Distribution of the questionnaires and response rates
Respondents Number of
Questionnaires
distributed and collected
% of Used
Questionnaires
Finance Managers 31 30.4
Accountants 45 44.1
Internal Auditors 26 25.5
Total 102 100
2 Internal Consistency of the Questionnaire’s Reliability
The internal consistency of the questionnaire’s reliability was measured by using Cronbach”s
coefficient alpha statistical test as shown in Table 2 below. The analysis in the table provides an

12
indication of the average correlation among all the items that made up the scale. The results
demonstrate that all indices obtained regarding the questions in the questionnaire were considered
to be high (above 0.70). A sample scale that shows an alpha value above 0.70 is considered as
reliable. Therefore, the indices for the questionnaire’s reliability are generally considered as
adequate for this study.
Table 2: Reliability Test
Questions Cronbach”s Alpha
Questions 1-6 0.812
Questions 7 -12 0.921
Questions 13-19 0.775
Question 20 -25 0.722
Questions 26 -33 0.883
Questions 34 -42 0.728
Questions 43 - 50 0.844
3. Chi-square analysis
Table 3 below shows that all values of Chi-square were significant for the seven groups of
questions (p<0.05). Therefore, it is possible to say that respondent’ answers were not equally
distributed among the different levels of agreement on the factors influencing pricing of audit
services in India in all groups. Based on the above results from Chi-square Test, all of the
hypotheses formulated earlier (H1 –H7) are accepted.
Table 3: Descriptive statistics and Chi-square results of the seven groups of questions (the
overall sample)
Groups of Q N Mini. Maxi.
Std.
Deviation
Chi-
Square Asymp Sig.
Group 1 (Q 1-6) 102 1.70 4.88 .52443 232.42 .000
Group 2 (Q 7-12) 102 2.00 4.67 .50112 153.77 .000
Group 3 (Q13-19) 102 1.40 4.29 .52541 343.10 .000
Group 4 (Q20-25) 102 1.82 4.32 .52587 140.40 .000
Group 5 (Q26-33) 102 1.35 4.47 .52068 251.40 .000
Group 6 (Q 34-42) 102 1.50 4.52 .53212 227.80 .000
Group 7 (Q 43-50) 102 1.80 4.83 .55430 129.50 .000
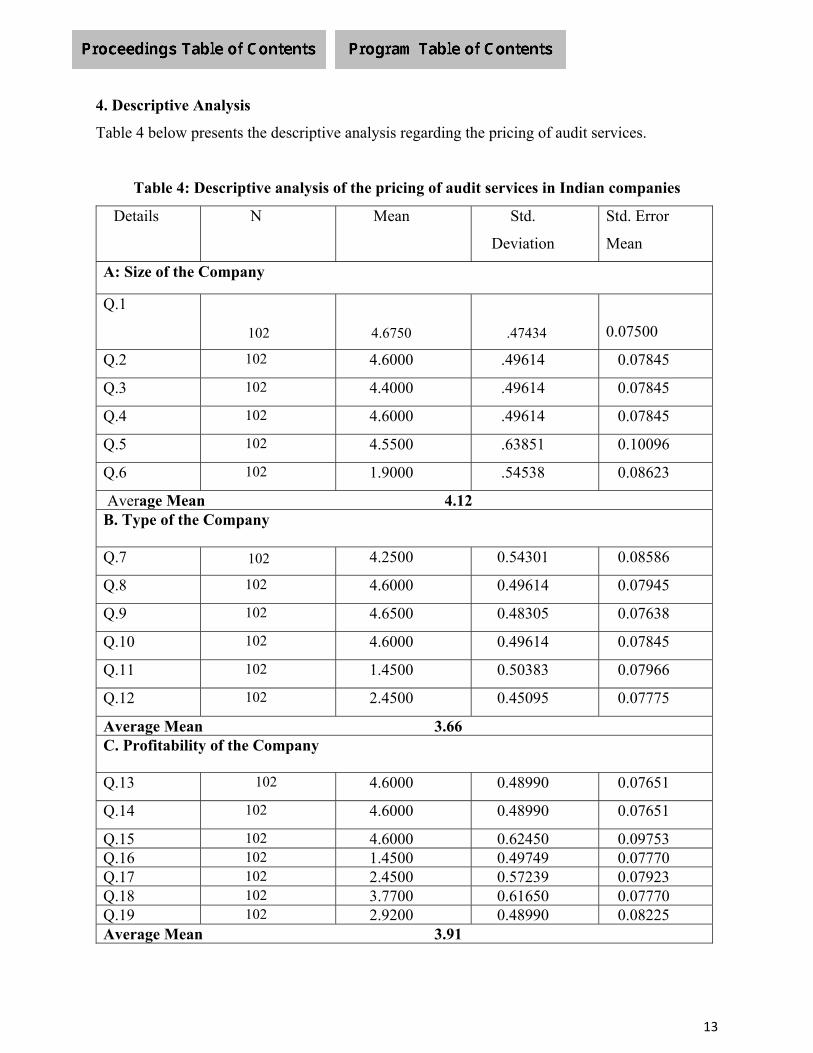
13
4. Descriptive Analysis
Table 4 below presents the descriptive analysis regarding the pricing of audit services.
Table 4: Descriptive analysis of the pricing of audit services in Indian companies
Details N Mean Std.
Deviation
Std. Error
Mean
A: Size of the Company
Q.1
102 4.6750 .47434
0.07500
Q.2 102 4.6000 .49614 0.07845
Q.3 102 4.4000 .49614 0.07845
Q.4 102 4.6000 .49614 0.07845
Q.5 102 4.5500 .63851 0.10096
Q.6 102 1.9000 .54538 0.08623
Average Mean 4.12 B. Type of the Company Q.7 102 4.2500 0.54301 0.08586
Q.8 102 4.6000 0.49614 0.07945
Q.9 102 4.6500 0.48305 0.07638
Q.10 102 4.6000 0.49614 0.07845
Q.11 102 1.4500 0.50383 0.07966
Q.12 102 2.4500 0.45095 0.07775
Average Mean 3.66 C. Profitability of the Company Q.13 102 4.6000 0.48990 0.07651
Q.14 102 4.6000 0.48990 0.07651
Q.15 102 4.6000 0.62450 0.09753Q.16 102 1.4500 0.49749 0.07770Q.17 102 2.4500 0.57239 0.07923Q.18 102 3.7700 0.61650 0.07770Q.19 102 2.9200 0.48990 0.08225Average Mean 3.91
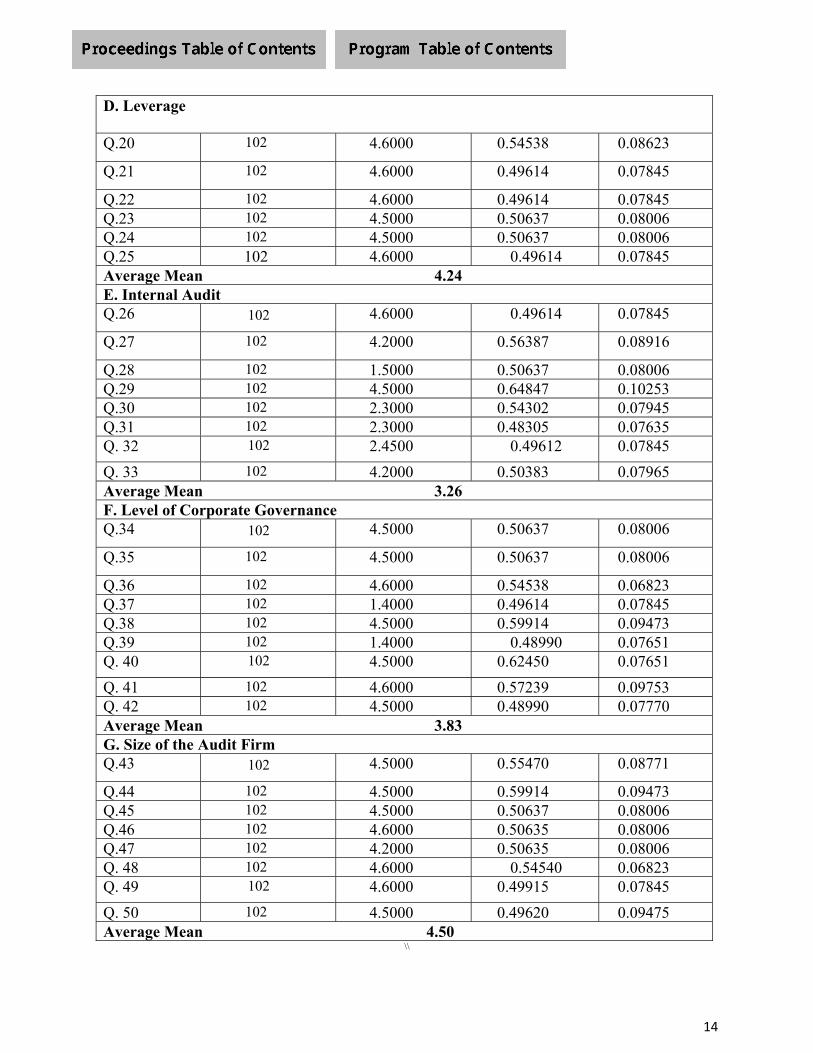
14
\\
D. Leverage Q.20 102 4.6000 0.54538 0.08623
Q.21 102 4.6000 0.49614 0.07845
Q.22 102 4.6000 0.49614 0.07845Q.23 102 4.5000 0.50637 0.08006Q.24 102 4.5000 0.50637 0.08006Q.25 102 4.6000 0.49614 0.07845Average Mean 4.24 E. Internal Audit Q.26 102 4.6000 0.49614 0.07845
Q.27 102 4.2000 0.56387 0.08916
Q.28 102 1.5000 0.50637 0.08006Q.29 102 4.5000 0.64847 0.10253Q.30 102 2.3000 0.54302 0.07945Q.31 102 2.3000 0.48305 0.07635Q. 32 102 2.4500 0.49612 0.07845
Q. 33 102 4.2000 0.50383 0.07965 Average Mean 3.26 F. Level of Corporate Governance Q.34 102 4.5000 0.50637 0.08006
Q.35 102 4.5000 0.50637 0.08006
Q.36 102 4.6000 0.54538 0.06823Q.37 102 1.4000 0.49614 0.07845Q.38 102 4.5000 0.59914 0.09473Q.39 102 1.4000 0.48990 0.07651Q. 40 102 4.5000 0.62450 0.07651
Q. 41 102 4.6000 0.57239 0.09753 Q. 42 102 4.5000 0.48990 0.07770Average Mean 3.83 G. Size of the Audit Firm Q.43 102 4.5000 0.55470 0.08771
Q.44 102 4.5000 0.59914 0.09473Q.45 102 4.5000 0.50637 0.08006Q.46 102 4.6000 0.50635 0.08006Q.47 102 4.2000 0.50635 0.08006Q. 48 102 4.6000 0.54540 0.06823Q. 49 102 4.6000 0.49915 0.07845
Q. 50 102 4.5000 0.49620 0.09475 Average Mean 4.50
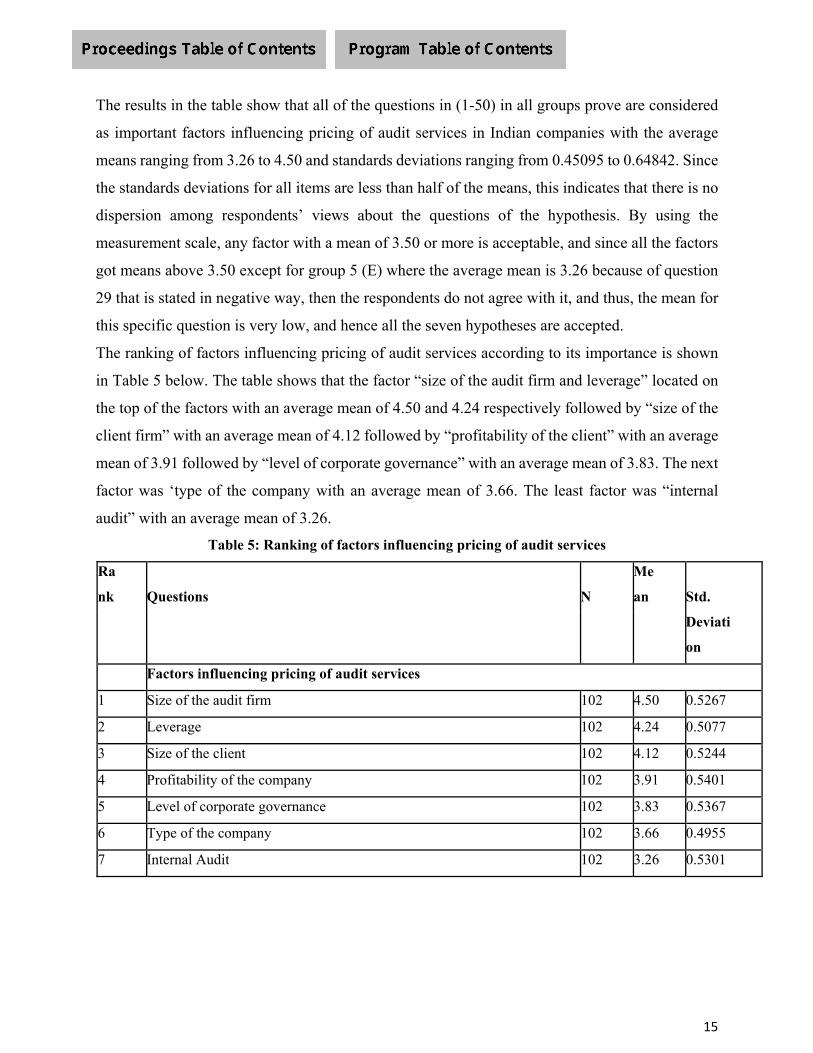
15
The results in the table show that all of the questions in (1-50) in all groups prove are considered
as important factors influencing pricing of audit services in Indian companies with the average
means ranging from 3.26 to 4.50 and standards deviations ranging from 0.45095 to 0.64842. Since
the standards deviations for all items are less than half of the means, this indicates that there is no
dispersion among respondents’ views about the questions of the hypothesis. By using the
measurement scale, any factor with a mean of 3.50 or more is acceptable, and since all the factors
got means above 3.50 except for group 5 (E) where the average mean is 3.26 because of question
29 that is stated in negative way, then the respondents do not agree with it, and thus, the mean for
this specific question is very low, and hence all the seven hypotheses are accepted.
The ranking of factors influencing pricing of audit services according to its importance is shown
in Table 5 below. The table shows that the factor “size of the audit firm and leverage” located on
the top of the factors with an average mean of 4.50 and 4.24 respectively followed by “size of the
client firm” with an average mean of 4.12 followed by “profitability of the client” with an average
mean of 3.91 followed by “level of corporate governance” with an average mean of 3.83. The next
factor was ‘type of the company with an average mean of 3.66. The least factor was “internal
audit” with an average mean of 3.26.
Table 5: Ranking of factors influencing pricing of audit services
Ra
nk Questions N
Me
an Std.
Deviati
on
Factors influencing pricing of audit services
1 Size of the audit firm 102 4.50 0.5267
2 Leverage 102 4.24 0.5077
3 Size of the client 102 4.12 0.5244
4 Profitability of the company 102 3.91 0.5401
5 Level of corporate governance 102 3.83 0.5367
6 Type of the company 102 3.66 0.4955
7 Internal Audit 102 3.26 0.5301
16
I. Conclusion
The studies on auditing fees were performed on the basis of perception of the respondents and it
is found that a large auditing firm will charge higher fees to deliver high-quality services in a
competitive market in which there is a demand for service differentiation. Thus, auditing fees can
be used to analyze auditing quality and whether there is a demand for differentiation in the auditing
market.
The current study aims to identify the determinants of pricing for audit services provided by
independent auditors in India. The results suggest that audit fees are positively related to size of
the audit firm, leverage and the size of the client. As previously mentioned, there is no consensus
on a "universal" model in the international literature. In general, the results shown here are more
or less consistent with those studies.
There is a strong positive relationship between company size and audit fees, and it is likely that
the larger the company is, the more complex the tasks involved and hence the cost of audit service.
There is a positive relationship between the quality of governance practices and audit fees. The
results suggest that companies with good governance practices spend more on auditing in the
pursuit of higher quality services, most likely because they want to provide information with
superior accuracy and reliability to their stakeholders. However, this finding does not prevent good
governance from reducing the risk perceived by the auditor and, consequently, the charged fees,
because the latter effect may occur simultaneously, although weaker than the former.
Moreover, there is no significant relationship between auditing expenses, internal audit and type
of the company. The results suggest that auditing firms consider size of the audit firm and level as
the most important factors to determine the fees of their services.
As suggestions for future studies, it would be interesting to conduct a similar analysis with data
collected after 2018 to assess audit fees over time. It is because of the fact that a number of reform
initiatives were undertaken post 2018 in the regulatory framework governing accounting and
auditing practices in India.
17
REFERENCES Antle, R., Gordon, E., Narayanamoorthy, G., & Zhou, L. (2006). The joint determination of audit fees, non-audit fees, and abnormal accruals. Review of Quantitative Finance and Accounting, 27 (3), 235-266. Anderson, T. and Zeghal, D., (1994), “The pricing of audit services: Further evidence from the Canadian market”, Accounting and Business Research, Vol. 24, Issue 95, pp. 195-207. Butterworth, S. and Houghton, K. A., (1995), “Auditor switching: The pricing of audit services”, Journal of Business Finance and Accounting, Vol. 22, Issue 3, pp. 323-344. Cameran, M., (2005), “Audit fees and the large auditor premium in the Italian market”, International Journal of Auditing, Vol. 9, Issue 2, pp. 129-146.
Chan, P; Ezzamel, M.; and Gwilliam, D., (1993), “Determinants of audit fees for quoted UK Companies”, Journal of Business Finance and Accounting, Vol. 20, Issue 6, pp. 765-786.
Che Ahmad, A. and Houghton, K. A., (1996), “Audit fee premiums to big eight firms: Evidence from the medium-size UK auditees”, Journal of International Accounting, Auditing and Taxation, Vol. 5, Issue 1, pp. 53-72.
Chung, S. and Narasimhan, R., (2002), “An international study of cross-sectional variations in audit fees”, International Journal of Auditing, Vol. 6, Issue 1, pp. 79-91.
Craswell, A. T.; Francis, J. R. and Taylor, S. L., (1995), “Auditor brand name reputations and industry specializations”, Journal of Accounting and Economics, Vol. 20, pp. 297-322.
Ezzamel, M.; Gwilliam, D. R. and Holland, K. M., (1996), “Some empirical evidence from publicly quoted UK companies on the relationship between the pricing of audit and non-audit services”, Accounting and Business Research, Vol. 27, No. 1, pp. 3-16.
Ezzamel, M.; Gwilliam, D. R. and Holland, K. M., (2002), “The relationship between categories of non-audit services and audit fees: Evidence from UK companies”, International Journal of Auditing, Vol. 6, No. 1, pp. 13-35.
Firth, M., (1985), “An analysis of audit fees and their determinants in New Zealand”, Auditing: A Journal of Practice and Theory, Vol. 4, Issue 2, pp. 23-37.
Firth M., (1997), “The provision of non-audit services and the pricing of audit fees”, Journal of Business Finance and Accounting, Vol. 24, Issue 3, pp. 511-525.
Francis, J. (1984). The effect of audit firm size on audit prices. Journal of Accounting and Economics, 6 (2), 133-151.
Friis, O. and Nielsen, M., (2010), “Audit fees and IFRS accounting: Is information costly? Discussion Papers on Business and Economics, No. 3, University of Southern Denmark.

18
Gregory, A. and Collier P., (1996), “Audit fees and auditor change: An investigation of the persistence of fee reduction by type of change”, Journal of Business Finance and Accounting, Vol. 23, No. 1, pp. 13-28. Hackenbrack, K.; and Knechel, R., (1997), “Resources allocation decisions in audit engagements”, Contemporary Accounting Research, Vol. 14, Issue 3, pp. 481-499.
Hallak, R. T. and Da Silva, A. L. C., (2012), “Determinants of audit and non-audit fee provided by Independent auditors in Brazil”,
Hamid K. and Ali Y. Q., (2012),”Effective factors on determination of audit fees in Iran”, Research Journal of Recent Sciences, Vol. 1, Issue 6, pp. 38-44.
Hassan M.; Hassan S.; Iqbal A. and Khan, M. F. A., (2014), “Impact of corporate governance on audit fee: Empirical evidence from Pakistan”, World Applied Science Journal, Vol. 30, No. 5, pp. 645-651.
Ho, S. W. and Ng P. H., (1996), “The determinants of audit fees in Hong Kong: An empirical study”, Asian Review of Accounting, Vol. 4, Issue 2, pp. 32-50.
Johnson, E. N.; Walker, K. B. and Westergaard, E., (1995), “Supplier concentration and pricing of audit services in New Zealand”, A Journal of Practice and Theory, Vol. 14, pp. 74-89. Joshi, P. L. and Al-Bastaki, H., (2000), “Determinants of audit fees: Evidence from the companies listed in Bahrain”, International Journal of Auditing, Vol. 4, Issue 2, pp. 129-138. Kikhia, H. Y. (2015), “Determinants of audit fees: Evidence from Jordan”, Accounting and Finance Research, Vol. 4, Issue 1, pp.42-53. Lengendijk, K., (1997), “The market for audit services in the Netherlands”, European Accounting Review, Vol. 6, Issue 2, pp.253-264. Liu S. (2017), “An empirical study: Auditors‟ characteristics and audit fee”, Open Journal of Accounting, 6, April 28, pp. 52-70. Mike, A.; Mike, S. and Muhammad, H., (1997), “The determinants of external audit costs in the New Zealand life insurance industry”, Journal of International Financial Management, Vol. 8, Issue 1, pp. 69-86. Muni, A. S. and Al-Hajeri F. K., (2013), “Determinants of audit fees in Bahrain: An empirical study”, Journal of Finance and Accountancy, Vol. 13, pp. 1-10. Palmrose, Z. (1986). Audit fees and auditor size: further evidence. Journal of Accounting Research, 24 (1), 97-110. Pong, C.M. & Whittington, G., (1994), “The determinants of audit fees: Some empirical models”, Journal of Business Finance and Accounting, Vol. 21, No. 8, pp. 1071-1095. Sandra, W. M. H. and Patrick, P. H., (1996), “The determinants of audit fees in Hong Kong: An empirical study”, Asian Review of Accounting, Vol. 4, Issue 2, pp. 32-50.
19
Sarantakos, S., 1997. Social Research. Macmillan Education Australia Pty Ltd: Melbourne. Simon, D.T.; Ramadan, R., and Duggar, A., (1996), “The market for audit services in India: An empirical examination”, International Journal of Accounting, Spring, pp. 27-35.
Simon, D.T.; Taylor, M. H., (2002), “A survey of audit pricing in Ireland”, International Journal of Auditing, Vol. 6, Issue 1, pp. 3-12.
Simunic D. A., (1980) “The pricing of audit services: Theory and evidence”, Journal of Accounting Research, Vol. 18, Issue 1, pp.161-190.
Sonu C. H. (2017), “Determinants of audit fees and financial crisis”, International Journal of Management and Applied Science, Vol. 3, Issue 1, pp. 95-97.
Taylor, M. E. and Baker, R. L., (1981), “An analysis of the external audit fee”, Accounting and Business Research, Vol. 12, pp. 55-60.
Thomas, R. (1996), Surveys. In: Greenfield, T. (ed.), Research Methods - Guidance for Postgraduates, Arnold, London, 115-124.
Tsui, J., Jaggi, B., & Gul, F. (2001). CEO domination, growth opportunities, and their impact on audit fees. Journal of Accounting Auditing and Finance, 16 (3), 183-203.
Tringaarrd, F. and Kiertzner, L., (2008), “Determinants of audit fees: Evidence from a small capital market with as joint audit requirement”, International Journal of Auditing, Vol. 12, No. 2, pp. 141-158.
Waresul Karim, A. K. M. and Moizer, P., (1996), “Determinants of audit fees in Bangladesh”, International Journal of Accounting, Vol. 31, No. 4, pp. 497-509.
Whisenant, S., Sankaraguruswamy, S., & Raghunandan, K. (2003). Evidence on the joint determination of audit and non-audit fees. Journal of Accounting Research, 41 (4), 721-744.
Xu, Y., (2011), “The determinants of audit fees: An empirical study of China’s listed companies”, The Journal of Lund University, the Department of Business Administration, Lund University.
Zhang, M. W. and Myrteza, S., (1996), “The determination of audit fees: Australian perspective”, Asian Review of Accounting, Vol. 4, Issue 1, pp. 81-96.
DOES GOOD CORPORATE GOVERNANCE INCREASE BUSINESS VALUE? EVIDENCE FROM AN EMERGING ECONOMY, INDIA
Ahindra Chakrabarti
Great Lakes Institute of Management Gurgaon India
ABSTRACT The present paper empirically examines whether good corporate governance practices leads to enhanced business value of companies. The study considers 81 non-financial Indian firms over a period from 2013-2014 to 2017-2018. Several corporate governance parameters like board size, board independence, board diligence, CEO duality, board diversity, number of board meeting held etc. are considered along with several institutional variables like DII share and FII share. The paper considers both accounting based as well as market based performance measures like, ROA, ROE, Economic Value Added (EVA) and Market Value Added (MVA). By running the appropriate panel data regression models, the study finds that, the impact of corporate governance variables on firm performance varies across performance measures. Independent boards and multiple directorships help in improving the firm performance. Financial leverage, FII share and Firm size also influence firm performance. However, not all the governance parameters influence the firm performance. , Results show that the multiple directorships held by board members helps them to gain varied experiences and thus they are able to share more expertise and wisdom in tackling the various business complexities of different firms. The Foreign Institutional Investors’ share and Promoter holding positively influence the economic value addition of the company. On the other hand, the companies having Group affiliation are likely to have a negative impact on their economic performance. In such cases, chances of diversion of funds among group companies may increase, or the poor performance of a group company may negatively affect the value of other profitable firms of the group.
1.Introduction
In modern society, the development of a country very much depends on its economic growth and prosperity. In turn, the economic growth rate of any country depends on the size of its capital market. Again, the capital market very much depends on the principles of accountability, fairness, transparency and responsibility of the business organizations. So, vital norms and regulations are required for controlling and overall supervision of the business houses to ensure their financial security. There should be some government laws or statutory bodies to oversee whether the corporate world are following such legal principles or not. It is in this context, that the term ‘Corporate Governance’ has emerged and also got entry into the vocabulary of both students and practitioners of business. To be more precise, it is due to the advent of Capital Markets and the subsequent dilution in the firms’ ownership, that the concept of corporate governance has come into existence and prominence. Thus, it may very well be understood that corporate governance plays a crucial role in shaping the structure and function of an organization and also in setting the vision of the firm.
John & Senbet (1998) proposed that “corporate governance deals with mechanisms by which stakeholders exercise control over corporate insiders and management such that their interests are protected”. Choi et al., (2010); Liu (2012) demonstrate that there have been always a better chance and tendency towards powerful market exposure for those companies which have followed good corporate governance mechanism. Thus, the credibility of a firm depends highly on this very entity of corporate governance as it contributes highly to the legitimacy of a firm and the trustworthiness of its financial reporting.
The financial crises and economic collapses around the world, since the past few decades, have led to an increased focus on the issue of corporate governance (Brown & Caylor, 2006). The beginning of the new millennium has witnessed a series of corporate fiascos like Xerox (2000), Enron (2001), Merrill Lynch (2002), WorldCom (2002), Lehman Brothers (2008), and Satyam Computers (2009). These black-listed companies and their malpractices have given a crucial signal to the corporates all over the world to think sincerely about the regime of corporate governance. Luo (2005a) and Epstein & Hanson (2006) echo the same and say that the cases such as Ahold, Parmalat and others have led to a renewed focus on corporate governance as a highly salient issue for international business. Thus, it has become evident that by setting a good governance policy – it will be possible to create shareholders’ value as well as avoid management level corruption. So, there has been some substantial effort in this direction, but still there has been no stop to the long procession of scams and scandals.
Several studies by Levine and Zervos (1998), Rajan and Zingales (1998), Demirgu¨c-Kunt and Maksimovic (1998) have shown that the economic growth of a country depends on the size of the country’s capital market. Thus, if corporate governance is weak then the capital market is thin which, in turn, leads to a slower economic growth rate. Therefore, strengthening the corporate governance system of a country is of utmost importance to achieve greater economic growth and prosperity. In this context, the present paper empirically examine whether good corporate governance actually help in creating and enhancing business value for companies. The findings will help understand the prominent governance parameters which are actually helpful in creating business value as well as the governance parameters which do not have any significant role in creating business values for Indian companies.
The remainder of the paper is designed as follows. Section two presents the review of relevant literature. Section three describes the objective of the study. Section four describes the data and methodology used in this study. Section five presents the major findings of the study and finally, section six concludes the study with necessary policy implications. 2. Review of Literatures
Board composition and Firm Performance Board composition has become a major focus area in most of the literature of corporate governance. Many countries including the US, UK, Australia, Canada along with other European and Asian countries, have adopted the unitary board model. Under this framework, the companies are flexible enough to choose the structure, membership and processes of their boards of directors. Keeping in pace with these wide variety and category of directors, in shaping the organizational structure and vision of the firm, it is important to determine the ideal nature and quality of the directors best suited for a proper boardroom composition. In this connection, Dalton et al., (1998) stressed the fact that the optimum boardroom composition is dependent on the strengths and weaknesses of both the executive and independent non-executive directors. Dalton et al., (1998) found that the optimum boardroom composition is highly dependent on the expertise of both the executives and non-executive independent directors.
Board Independence and Firm Performance
Many empirical studies examined the impact of independent non-executive directors on overall success of firms. Fama (1980) and Fama and Jensen (1983) argued that, outside directors are considered to be important monitors of management, who play important role in effective resolution of Agency problems between managers and shareholders. Independent non-executive directors hold a more neutral position in comparison to the executive directors, who by taking advantage of their position, often take decisions against the shareholders. They have further stated that outside independent directors may act as shareholders’ advocate to safe guard their interest. Baysinger and Butler (1985) and Schellenger et al., (1989) found evidences of positive relationship between firm performance and outside directors’ representation on the board. Byrd and Hickman (1992) echoed the same and argued that outside directors are more prone to effective monitoring and they objectively distinguish between good and bad decisions of the management and consequently, they potentially reduce the conflict between the shareholders and the management. Agrawal & Knoebar (1996); Elloumi and Gueyié (2001); and Daily et al., (2003) also argued in similar lines. However, Vance (1978) finds that corporate performance is more influenced by the technical expertise and managerial experiences of the executive directors rather than any other attributes of the board. Again, Klein (1998) and Bhagat & Black (2002) have not found any association between board independence and long term firm performance.
Women Directors and Firm Performance

Many empirical studies examined the linkage between firm performance and presence of women directors on boards. Dutta and Bose (2006) argued that the female members reflect a diversified attitude of the board. Supporting such views, Smith et al., (2006) cited three different reasons for evaluating the significance of women on a board. First, female board members generally have a better knowledge and understanding of a market in comparison to male directors. As such, this understanding influence the decision making process of the board in a positive manner. Second, female board members tend to project better images of a firm, in the perception of the community and thus enhance a firm’s performance. Third, when female board members are appointed, the male board members feel encouraged to have an in-depth understanding of the business environment. In addition, women directors can positively affect career development of junior female staff in a business. Due to all these reasons, a firm’s performance gets a positive boost, both directly and indirectly, with the presence of female members on a board. However, more recently Adams & Ferreira (2009), in a study of US firms, have found that on an average, gender diversity has a negative effect on firm performance. Therefore, mandating of gender quotas, for directors can reduce firm value for well governed firms. But, in spite of this, they have shown that women directors significantly impact board inputs and firm outcomes. They also find that, since gender diverse boards spend more effort in monitoring,
Board Size and Firm Performance
On the linkage between board size and firm performance, some scholars argue that larger boards provide better monitoring and effective decision making (Adams and Meheran, 2003; Anderson and Reeb, 2003; Coles et al., 2008; Klein, 1998; Pfeffer, 1972); while others argue that when board size increases, free riding takes place; and board’s efficiency is reduced (Jensen 1993; Lipton and Lorsch, 1992; Yermack, 1996). Eisenberg et al. (1998) and Yearmack (1996) observed positive linkage between smaller boards and higher firm value. In larger boards, problem of communication and cohesiveness may arise, resulting into conflicts creation (O’ Reilly et al., 1989). Despite the fact that board size is an important governance parameter, so far, there is no consensus about its linkage with firm performance; and there is no ideal board size recommended for companies.
CEO Duality and Firm Performance
Though, there have been many empirical studies related to firm structure, it is a fact that such studies have failed to provide an agreed view on any contribution and linkage between a board’s leadership structure and financial performance of a firm. Adding to the confusion, Berg & Smith (1978) find that there is no correlation between a firm’s structure and its financial performance. Even, Rechner and Dalton (1989); Daily and Dalton (1992, 1993) supported the fact that there is no notable effect of board leadership structure on a firm’s performance. Conversely, a study by Donaldson & Davis (1991) finds that joint structure (CEO duality) achieves higher return on equity compared to separate structure.
However, Fama and Jensen (1983), Jensen (1993) showed that duality tends to reduce a board’s supervisory power with regard to management related activities of a company, which in turn may result into an increase of agency cost. Similarly, Rechner & Dalton (1991) have observed
that separate leadership structure outperformed those with joint structure, with regard to firm’s financial performance. Chen, Lin & Yi (2008) documented that in the period between 1999 to 2003, many business houses have converted their existing model of duality to a non-duality structure. Furthermore, Heidrick and Struggles (2009) have shown that 84 per cent of firms in Europe, follow the separate structure of leadership for better performance of the firm. In recognition of the importance of separation of responsibility between a chairman and a CEO, these authors consider that in many businesses with a duality structure, there has been an abuse of power at the expense of the company and the shareholders. These rules have provided a recommendation that when there is a duality in a firm, the number of independent directors on a board should be a majority so as to provide and maintain balance.
Several studies have also examined the impact of number of board meetings held and the firm performance and the results are somewhat mixed (Gregory & Simmelkjaer, 2002; Moore, 2002; Rebeiz & Salameh 2006). In another context, several studies examined the linkage between promoters’ shareholding and firm performance and here too, overall, a mixed findings available (McConaughy et al., 1998; Mishra et al., 2001; Khatri et al., 2001; Kwak, 2003; Black et al., 2003). 3. Objective of the Study
The main objective of this study is to empirically examine whether good corporate governance variables leads to enhanced business value of companies. In other words, it tries to assess the implications of corporate governance practices and initiatives on business value generation through accounting and market related measures. The findings will help establish the governance- performance relationship in the context of a large emerging economy, India. 4. Data, Sample and Research Methodology
We have selected the companies which are part of the BSE 100 Index that are common for at least 3 years, out of the last 5 years (2014 to 2018). The sample has been further subjected to other screening criteria, that is, the elimination of Banking companies and Financial Institutions (FIs) as they follow a different accounting process. Thus, the final sample contains 81 companies listed in the National Stock Exchange of India Ltd. Over the 5 year period, counting to 405 firm year observations and the data represents panel data. For the corporate governance variables, we have procured the data from the Corporate Governance Reports contained in the Annual Reports of the sample companies. All financial and accounting variables are procured from ‘Prowess’ database maintained by the Centre for Monitoring Indian Economy. The Prowess database has formed the basis of several published empirical studies on the Indian corporate sector (e.g. Khanna & Palepu 2000; Sarkar & Sarkar [2000]; Bertrand, Mehta, & Mullainathan 2002).
The list of variables and their definition are summarized in the table 1:

Table 1: List of Variables and Definitions
Variable Name Definition
Maj_indep_board Majority Independent board. Dummy variable. Equals one if the percentage of independent director exceeds 50, 0 otherwise.
Brd_busyness Board Busyness. Dummy variable. Equals one if the board has at least one independent director with three or more directorships, 0 otherwise.
Brd_diligence Board diligence. Calculated as mean of percentage of board meetings attended by independent directors.
CEO_duality CEO duality. Dummy variable. Equals one if the CEO is also the chairman of the board, 0 otherwise.
DII_share
Domestic institutional investors' share. Percentage of equity owned by Indian banks and insurance companies, Indian financial institutions and Indian mutual funds.
FII_share Foreign institutional investors' share. Percentage of equity owned by institutional investors that are not domestic institutional investors.
Group Dummy variable. Equals one if the company is affiliated to a business group, 0 otherwise.
Brd_size Size of the board. Total number of directors on the board at the end of the financial year.
Per_brd_meeting
Percentage of board meetings attended by the board of directors. Calculated as average number of board meetings attended divided by maximum number of board meetings.
Avg_num_directorships
Average number of other directorships held by the board of directors. Equals to average number of other directorships held in other companies by all the directors who are on the board till the end of the financial year.
Promoter_shares Percentage of shares held by the promoters. Equals to the percentage of shares held by the promoters.
Auditor Dummy variable. Equals to one if auditor is among top four audit companies, 0 otherwise.
ROA Measurement of firms’ profitability. Calculated as net income divided by total assets multiplied by 100.
ROE Calculated as profit after tax divided by shareholder’s fund multiplied by 100
Leve Leverage. Degree of financial leverage derived as long term debt divided by total assets.
Performance Measurement Variables

Various financial measures, used in the study to measure firm performance, are grouped into two broad classes:
Accounting Based Measures Market Based Measures
Economic Value Added (EVA)
Return on Assets (ROA)
Return on Equity (ROE)
Market Value Added (MVA)
The list of Accounting Based Measures and their definition are described below:
ECONOMIC VALUE ADDED (EVA)
Stern Stewart & Co. has developed the concept of Economic Value Added (EVA) which is a particular method of calculating economic profit. EVA is defined as any profit earned over and above the cost of capital. It is a measure of economic profit, which is arrived at by considering the charge for the opportunity cost of all capital invested in the company.
The EVA is computed by using the following formula:
EVA = (NOPAT) t – WACC (CE) t
Where, (NOPAT) t denotes net operating profit after tax, WACC indicates weighted average cost of capital, and (CE) t stands for capital employed at the end of period t.
The computation of EVA involves calculation of three important things:
(a) Net Operating Profit before interest but after tax, (b) Weighted average cost of capital and (c) Amount of capital employed.
The computation of weighted average cost of capital (WACC) involves the calculation of cost of equity (Ke) and cost of debt (Kd). According to Stern Stewart’s recommendations, cost of equity (Ke) should be computed by using Capital Asset Pricing Model (CAPM).
According to the CAPM, the expected return on equity (Ke) is given by the following equation:
Ke = Rf + (Rm Rf)
Where, Ke represents cost of equity,
Rf stands for risk free rate of return and
Rm indicates the market return.
RISK FREE RATE: 10 year Treasury Gold Bond yield rates collected from the Treasury Division of the RBI are taken as the risk free rate.
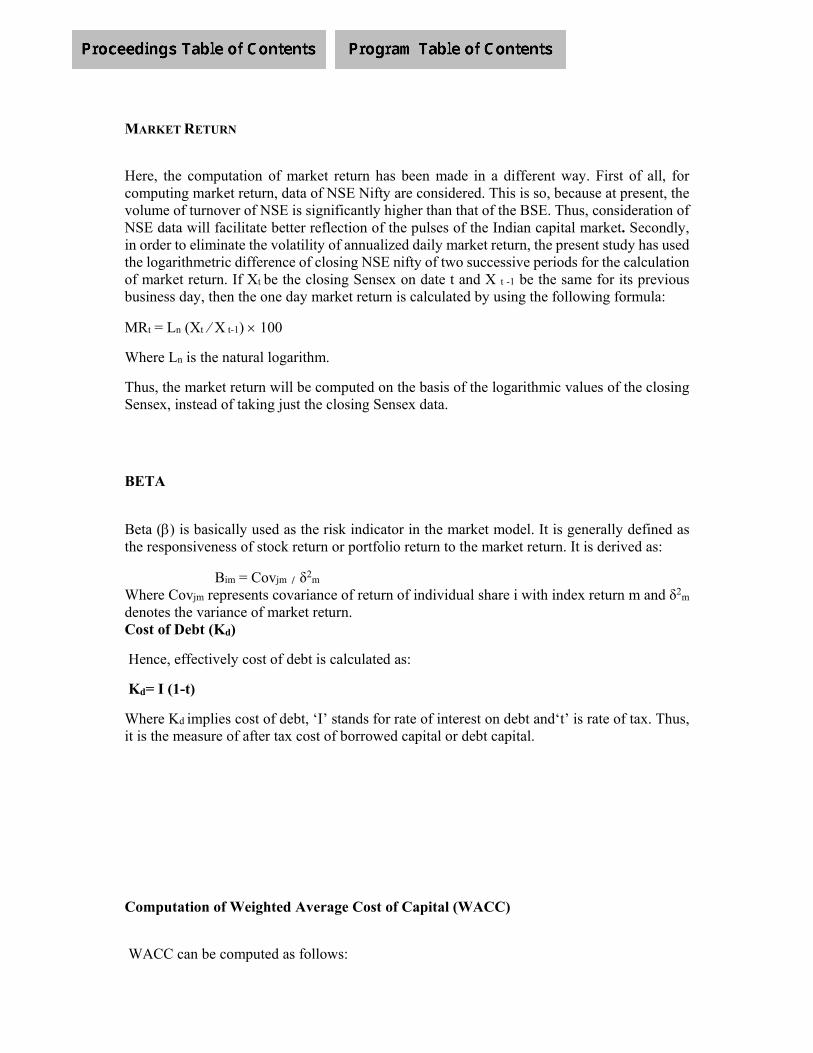
MARKET RETURN
Here, the computation of market return has been made in a different way. First of all, for computing market return, data of NSE Nifty are considered. This is so, because at present, the volume of turnover of NSE is significantly higher than that of the BSE. Thus, consideration of NSE data will facilitate better reflection of the pulses of the Indian capital market. Secondly, in order to eliminate the volatility of annualized daily market return, the present study has used the logarithmetric difference of closing NSE nifty of two successive periods for the calculation of market return. If Xt be the closing Sensex on date t and X t -1 be the same for its previous business day, then the one day market return is calculated by using the following formula:
MRt = Ln (Xt ∕ X t-1) 100
Where Ln is the natural logarithm.
Thus, the market return will be computed on the basis of the logarithmic values of the closing Sensex, instead of taking just the closing Sensex data.
BETA
Beta () is basically used as the risk indicator in the market model. It is generally defined as the responsiveness of stock return or portfolio return to the market return. It is derived as:
Βim = Covjm δ2m
Where Covjm represents covariance of return of individual share i with index return m and δ2m
denotes the variance of market return. Cost of Debt (Kd)
Hence, effectively cost of debt is calculated as:
Kd= I (1-t)
Where Kd implies cost of debt, ‘I’ stands for rate of interest on debt and‘t’ is rate of tax. Thus, it is the measure of after tax cost of borrowed capital or debt capital.
Computation of Weighted Average Cost of Capital (WACC)
WACC can be computed as follows:
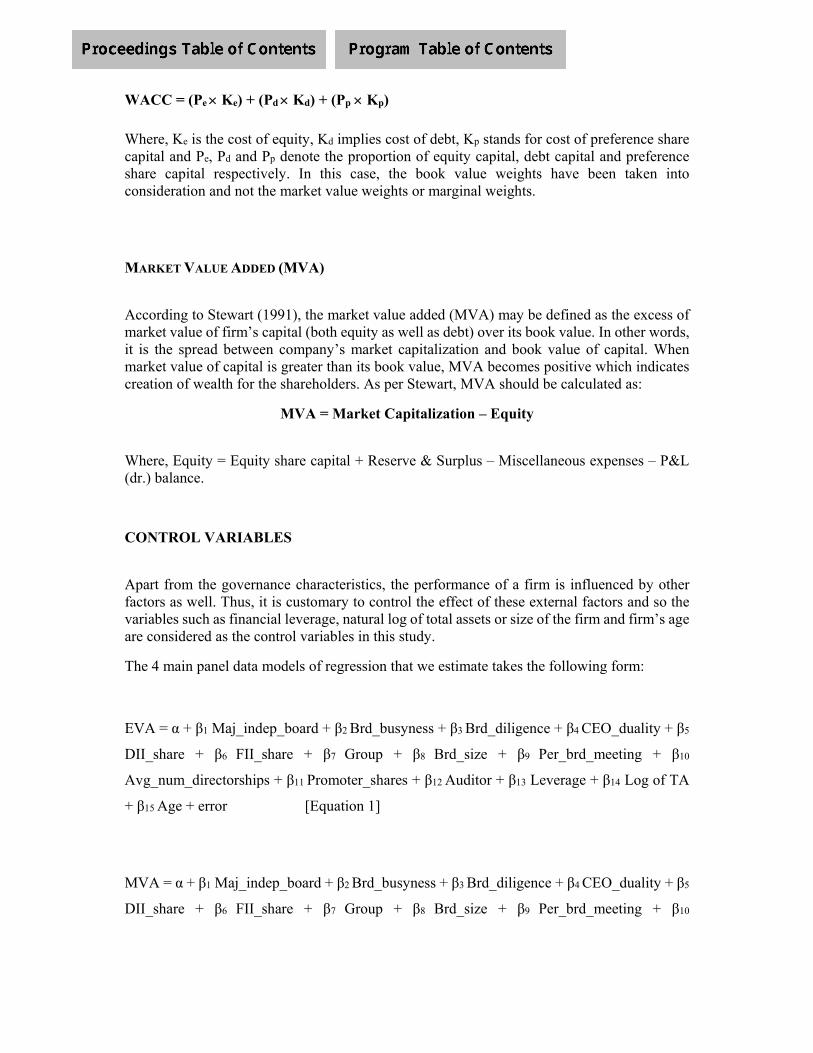
WACC = (Pe Ke) + (Pd Kd) + (Pp Kp)
Where, Ke is the cost of equity, Kd implies cost of debt, Kp stands for cost of preference share capital and Pe, Pd and Pp denote the proportion of equity capital, debt capital and preference share capital respectively. In this case, the book value weights have been taken into consideration and not the market value weights or marginal weights.
MARKET VALUE ADDED (MVA)
According to Stewart (1991), the market value added (MVA) may be defined as the excess of market value of firm’s capital (both equity as well as debt) over its book value. In other words, it is the spread between company’s market capitalization and book value of capital. When market value of capital is greater than its book value, MVA becomes positive which indicates creation of wealth for the shareholders. As per Stewart, MVA should be calculated as:
MVA = Market Capitalization – Equity
Where, Equity = Equity share capital + Reserve & Surplus – Miscellaneous expenses – P&L (dr.) balance.
CONTROL VARIABLES
Apart from the governance characteristics, the performance of a firm is influenced by other factors as well. Thus, it is customary to control the effect of these external factors and so the variables such as financial leverage, natural log of total assets or size of the firm and firm’s age are considered as the control variables in this study.
The 4 main panel data models of regression that we estimate takes the following form:
EVA = α + β1 Maj_indep_board + β2 Brd_busyness + β3 Brd_diligence + β4 CEO_duality + β5
DII_share + β6 FII_share + β7 Group + β8 Brd_size + β9 Per_brd_meeting + β10
Avg_num_directorships + β11 Promoter_shares + β12 Auditor + β13 Leverage + β14 Log of TA
+ β15 Age + error [Equation 1]
MVA = α + β1 Maj_indep_board + β2 Brd_busyness + β3 Brd_diligence + β4 CEO_duality + β5
DII_share + β6 FII_share + β7 Group + β8 Brd_size + β9 Per_brd_meeting + β10

Avg_num_directorships + β11 Promoter_shares + β12 Auditor + β13 Leverage + β14 Log of TA
+ β15 Age + error [Equation 2]
ROA = α + β1 Maj_indep_board + β2 Brd_busyness + β3 Brd_diligence + β4 CEO_duality + β5
DII_share + β6 FII_share + β7 Group + β8 Brd_size + β9 Per_brd_meeting + β10
Avg_num_directorships + β11 Promoter_shares + β12 Auditor + β13 Leverage + β14 Log of TA
+ β15 Age + error [Equation 3]
ROE = α + β1 Maj_indep_board + β2 Brd_busyness + β3 Brd_diligence + β4 CEO_duality + β5
DII_share + β6 FII_share + β7 Group + β8 Brd_size + β9 Per_brd_meeting + β10
Avg_num_directorships + β11 Promoter_shares + β12 Auditor + β13 Leverage + β14 Log of TA
+ β15 Age + error [Equation 4]
Where, α = the intercept
5. Analysis and Major Findings
For the purpose of the study, four different Regression Models have been applied by using four different Dependent Variables. The Dependent variables are Economic Value Added (EVA), Market Value Added (MVA), Return on Assets (ROA) and Return on Equity (ROE). EVA and MVA are said to be the modern tools to assess financial performance, whereas ROA and ROE are the traditional measures of financial performance.
Regression Model 4: EVA as the Dependent variable
In order to find out which regression model is appropriate, Hausman test is performed. As per the Hausman test, the hypotheses are:
Ho: Random effect model is appropriate.
Ha: Fixed effect model is appropriate.
The result of the Hausman test shows, that the null hypothesis cannot be rejected (Prob>chi2 = 0.2635) Thus, the Random Effect Model is appropriate. Hence, the regression results of the random effect model is presented below in Table 2.
TABLE 2: Random Effect Model Regression Results (EVA as dependent variable)

Variable Coefficient p-value
Constant 7. 218 0.360
Leverage -0. 615** 0.020
Log of TA -0.114** 0.016
Age 0.384 0.846
Maj_indep_board 417.7981 0.926
Brd_busyness -6579.428 0.612
Brd_diligence -212.1428 0.259
CEO_duality 681.7013 0.892
DII_share 875.6455 0.275
FII_share 1667.461*** 0.009
Group -28971.21** 0.018
Brd_size 114.3081 0.914
Per_brd_meeting 317.3866 0.244
Avg_num_directorships 2977.249* 0.101
Promoter_shares 888.2056** 0.043
Auditor -6488.369 0.509
Source: Authors’ own *, ** and *** denote statistical significance level of 10%, 5% and 1 % levels respectively. Number of obs = 405 Wald chi2 (15) = 37.84 Prob > chi2 = 0.0010 Table 2 reports the results of Random Effects Regression only. It reveals that amongst the control variables, the two variables, Leverage and Size of the firm are found to be statistically significant at 5% level. Here, the coefficient of Leverage and Size of the firm appears to be negative. This indicates that leverage and size of the firm are likely to have a negative impact on the EVA of the company. If the degree of leverage increases, financial risk is also likely to increase because of which the Weighted Average Cost of Capital (WACC) and the Cost of Capital Employed (CE) are also likely to go up, and may consequently reduce the EVA. Similarly, higher the size of the firm, higher will be the capital employed. Again, if capital employed is more, the cost on capital employed will also be higher and this may reduce the EVA.

Table 2 further reveals that amongst the corporate governance variables, the variable FII share is statistically significant at the 1% level, Group dummy and Promoter Shares are found to be statistically significant at the 5% level and Average number of directorships, held by all the directors in other companies, is found to be significant at the 10% level. Thus, the four statistically significant variables, namely FII share, Average number of directorships, Promoter shares appear to be positive while the coefficient of Group dummy appears to be negative. This indicates that FII share, Promoter shares and the average number of directorships held by the directors are likely to have a positive impact on the EVA of the sample firms. If Foreign Institutional Investors’ holding is more, it is likely to add more value to the companies and as such, it may be viewed by institutionalized investors as a sign of confidence, adding to the good prospects of the firm. Similarly, Promoter Shares is likely to have a positive impact on EVA. If the promoter share is higher, the involvement of the promoters in the proper functioning of the company is also more, which in turn may help in generating additional value for the company. It is also seen that the Average number of directorships, held by the directors, are likely to have a positive impact on the value addition of a firm. The greater number of directorships a director holds, is likely to bring more diverse knowledge and expertise in the board room and positively influence its decision making process. This may consequently help the company to generate more value.
On the other hand, the companies having Group affiliation are likely to have a negative impact on their economic performance. In such cases, chances of diversion of funds among group companies may increase, or the poor performance of a group company may negatively affect the value of other profitable firms of the group.
Other factors pertaining to corporate governance namely, proportion of independent directors on a board, board busyness, board diligence, DII share, size of a board, percentage of board meetings, audit quality are not found to have any statistically significant impact on the financial performance of the companies, measured in terms of EVA. Regression Model 4: MVA as the Dependent variable
The result of the Hausman test shows that the null hypothesis is accepted (Prob > chi2 = 0.9992). Thus, the Random Effect Model is appropriate. Hence, the regression results of the random effect model is presented below in Table 3.
TABLE 3: Random Effect Model Regression Results (MVA as dependent variable)
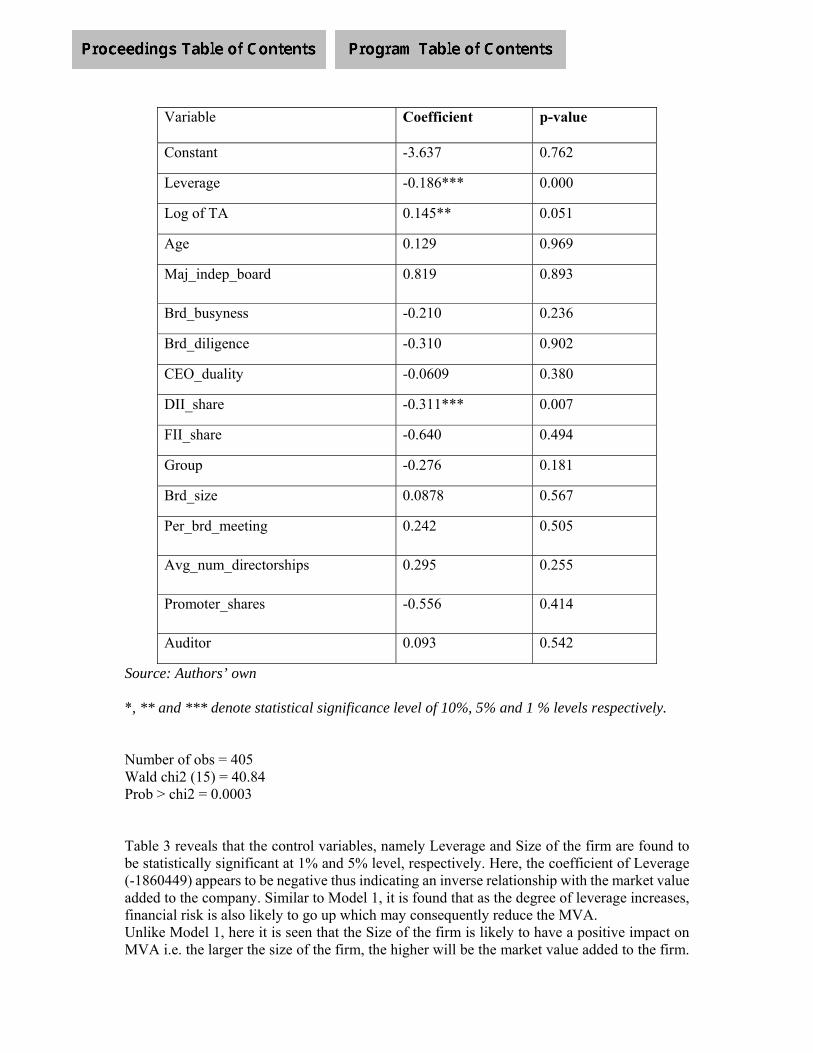
Source: Authors’ own *, ** and *** denote statistical significance level of 10%, 5% and 1 % levels respectively. Number of obs = 405 Wald chi2 (15) = 40.84 Prob > chi2 = 0.0003 Table 3 reveals that the control variables, namely Leverage and Size of the firm are found to be statistically significant at 1% and 5% level, respectively. Here, the coefficient of Leverage (-1860449) appears to be negative thus indicating an inverse relationship with the market value added to the company. Similar to Model 1, it is found that as the degree of leverage increases, financial risk is also likely to go up which may consequently reduce the MVA. Unlike Model 1, here it is seen that the Size of the firm is likely to have a positive impact on MVA i.e. the larger the size of the firm, the higher will be the market value added to the firm.
Variable Coefficient p-value
Constant -3.637 0.762
Leverage -0.186*** 0.000
Log of TA 0.145** 0.051
Age 0.129 0.969
Maj_indep_board 0.819 0.893
Brd_busyness -0.210 0.236
Brd_diligence -0.310 0.902
CEO_duality -0.0609 0.380
DII_share -0.311*** 0.007
FII_share -0.640 0.494
Group -0.276 0.181
Brd_size 0.0878 0.567
Per_brd_meeting 0.242 0.505
Avg_num_directorships 0.295 0.255
Promoter_shares -0.556 0.414
Auditor 0.093 0.542
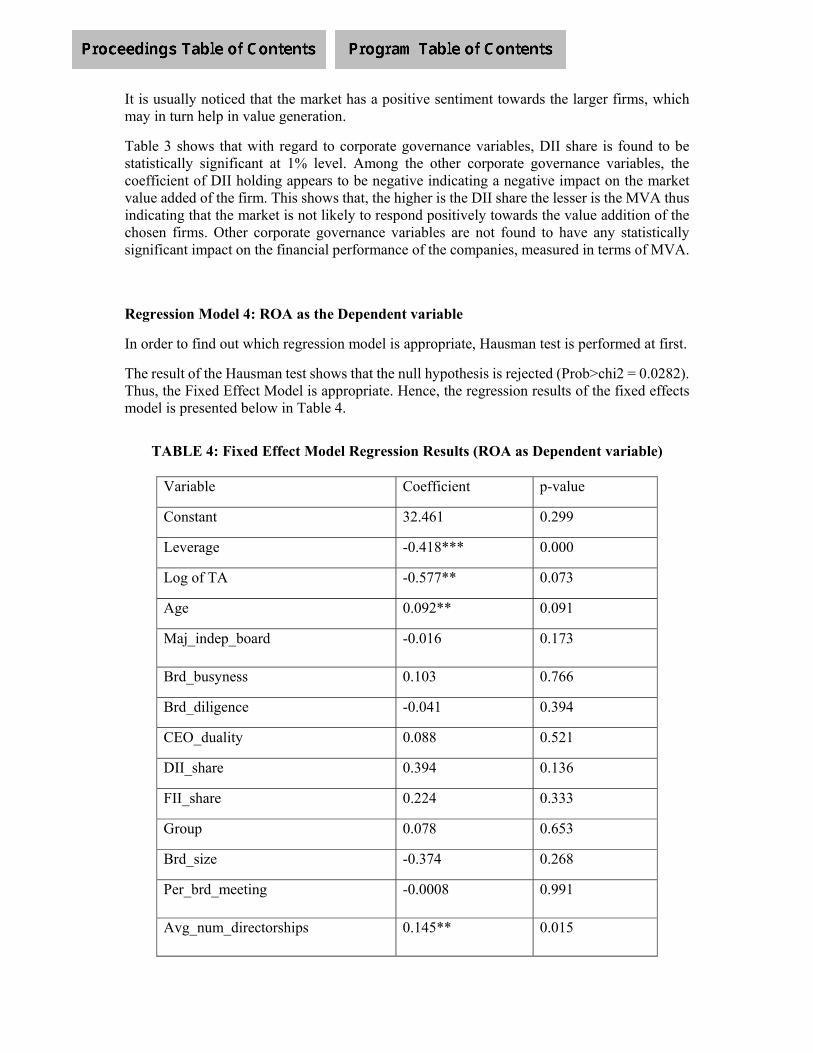
It is usually noticed that the market has a positive sentiment towards the larger firms, which may in turn help in value generation.
Table 3 shows that with regard to corporate governance variables, DII share is found to be statistically significant at 1% level. Among the other corporate governance variables, the coefficient of DII holding appears to be negative indicating a negative impact on the market value added of the firm. This shows that, the higher is the DII share the lesser is the MVA thus indicating that the market is not likely to respond positively towards the value addition of the chosen firms. Other corporate governance variables are not found to have any statistically significant impact on the financial performance of the companies, measured in terms of MVA.
Regression Model 4: ROA as the Dependent variable
In order to find out which regression model is appropriate, Hausman test is performed at first.
The result of the Hausman test shows that the null hypothesis is rejected (Prob>chi2 = 0.0282). Thus, the Fixed Effect Model is appropriate. Hence, the regression results of the fixed effects model is presented below in Table 4.
TABLE 4: Fixed Effect Model Regression Results (ROA as Dependent variable)
Variable Coefficient p-value
Constant 32.461 0.299
Leverage -0.418*** 0.000
Log of TA -0.577** 0.073
Age 0.092** 0.091
Maj_indep_board -0.016 0.173
Brd_busyness 0.103 0.766
Brd_diligence -0.041 0.394
CEO_duality 0.088 0.521
DII_share 0.394 0.136
FII_share 0.224 0.333
Group 0.078 0.653
Brd_size -0.374 0.268
Per_brd_meeting -0.0008 0.991
Avg_num_directorships 0.145** 0.015

Promoter_shares 0.202 0.344
Auditor -0.058 0.174
Source: Authors’ Own *, ** and *** denote statistical significance level of 10%, 5% and 1 % levels respectively. Number of obs = 405 F (14, 148) = 3.65 Prob > F = 0.0000
While estimating the regressions, we have taken into account both the fixed effects regression as well as the random effects regression. However, as per the Hausman test, we find that the fixed effects model is appropriate. Hence Table 4 reports the results of the fixed effects regressions only. Table 4 reveals that all the control variables, chosen for the study, are found to be statistically significant where the variable Leverage is found to be statistically significant at 1% level and size and age of the firm are found to be statistically significant at the 5% level. Here, the coefficient of Leverage and Size of the firm are found to be negative thus having an inverse relationship with the Return on Asset of the company. On the contrary, the coefficient of Age of the firm appears to have a positive impact on the Return on Assets of the firms. The older the firm, the longer is the establishment of a firm and they are likely to earn higher ROA. The well-established firms have a command over the market and this long establishment of these firms are likely to fetch more return on assets.
With regard to the corporate governance variables, the average number of directorships held by all the directors in other companies is found to be statistically significant at the 5% level, where the coefficient appears to have a positive impact on the ROA of the company. The multiple directorships held by a board member enable him to gain varied experiences and thus he is able to share more expertise and wisdom in tackling the various business complexities of different firms. Other factors pertaining to corporate governance are not found to have any statistically significant impact and thus they do not affect the financial performances of the companies, measured in terms of ROA. Regression Model 4: ROE as the Dependent variable
The result of the Hausman test shows that the null hypothesis is accepted (Prob>chi2 = 0.8351) . Thus, the Random Effect Model is appropriate and its results are shown in Table 5.
TABLE 5: Random Effect Model Regression Results, ROE as Dependent variable

Variable Coefficient p-value
Constant 7.288 0.168
Leverage -0.056* 0.001
Log of TA -0.045 0.154
Age 0.119 0.359
Maj_indep_board -0.070** 0.023
Brd_busyness -0.048 0.957
Brd_diligence -0.039 0.762
CEO_duality 0.047 0.167
DII_share -0.172 0.751
FII_share 0.355 0.409
Group 0.0112 0.882
Brd_size 0.064 0.372
Per_brd_meeting -0.158 0.401
Avg_num_directorships 0.022** 0.066
Promoter_shares 0.136 0.641
Auditor -0.056 0.387
Source: Authors’ Own *, ** and *** denote statistical significance level of 10%, 5% and 1 % levels respectively. Number of obs = 405 Wald chi2 (15) = 34.46 Prob > chi2 = 0.0029
From the Table 5, we have found that with regard to the control variables, Leverage is found to be significant at the 1% level. Here, the coefficient of Leverage appears to be negative, thus having an adverse effect on the Return on Equity of the firms. Thus, it may be said that the higher the Leverage, the lower is the ROE. Table 5 further reveals that from the variables pertaining to corporate governance, the Boards having a majority of independent directors is found to be statistically significant at 5% level. The coefficient of Majority Independent Board appears to be negative thus indicating a negative impact on the Return on Equity. Theoretically, it is argued that the return on equity is

more influenced by the expertise of the executive directors than the independent directors. This is due to the fact, that the executive directors are directly engaged in the day-to-day planning of the company and thus instil proper functioning of the company. Since the independent directors are not always aware of the full functioning of the company so they are unable to directly contribute to the return generation of the company, and more so because the larger boards may slow down decision making. The Average number of directorships held by the directors in other companies is found to be statistically significant at 10% level. The coefficient for Average number of directorship appears to be positive. This indicates that the firms, which appoint directors holding several number of directorships, are likely to generate more return on equity to the equity shareholders. But, the firms with majority independent boards are affected adversely with respect to their return on equity shareholders’ fund. Other factors, pertaining to corporate governance, are not found to have any statistically significant results and thus they do not affect the financial performances of the companies, measured in terms of ROE.
6. Conclusion
The present study attempts to analyse the impact of corporate governance in the determination of firm value. In this regard various corporate governance variables and control variables have been chosen. The financial measures used in the study to measure firm performance are Economic Value Added (EVA), Market Value Added (MVA), Return on Assets (ROA) and Return on Equity (ROE). After the statistical analysis it is found that Leverage is likely to have a negative impact on both the economic and market value added to the company as well as on the return on equity and assets. The size of the firm is also likely to show a negative impact on the EVA, ROA and ROE. Thus, it implies that if the capital employed is more, the cost on capital employed will also be higher and this may reduce the EVA, ROA and ROE. On the other hand, the age of the firm appears to have a positive impact on the ROA of the firms. This implies that the older the firm, the longer is the establishment of a firm and they are likely to earn higher ROA. Amongst the corporate governance variables, it is found that the average number of directorships held by all the directors are likely to have a positive impact on the EVA of the firm, as well as, on the return on assets and return on equity. Thus, it shows that the multiple directorships held by a board member helps him to gain varied experiences and thus he is able to share more expertise and wisdom in tackling the various business complexities of different firms. The Foreign Institutional Investors’ share and Promoter holding is likely to positively influence the economic value addition of the company. If Foreign Institutional Investors’ holding is more, it is likely to add more value to the companies and as such, it may be viewed by institutionalized investors as a sign of confidence, adding to the good prospects of the firm. Similarly, Promoter Shares is likely to have a positive impact on EVA. If the promoter share is higher, the involvement of the promoters in the proper functioning of the company is also more, which in turn may help in generating additional value for the company. On the other hand, the companies having Group affiliation are likely to have a negative impact on their economic performance. In such cases, chances of diversion of funds among group companies may increase, or the poor performance of a group company may negatively affect the value of other profitable firms of the group. Majority Independent Board appears to be negative thus indicating a negative impact on the Return on Equity. Theoretically, it is argued that the ROE is more influenced by the expertise of the executive directors than the independent directors. This is due to the fact, that the executive directors are directly engaged in the day-to-day

planning of the company and thus instil proper functioning of the company. These findings reveal the existence of correlation between the firm value and corporate governance characteristics of the firm.

REFERENCES:
Abidin, ZZ & Kamal, NM 2009, ‘Board Structure and Corporate Performance in Malaysia’,
International Journal of Economics and Finance, vol.1, no. 1, pp150-164.
Adams, Renee, and Daniel Ferreira. 2009. Women in the boardroom and their impact on
governance and performance. Journal of Financial Economics 94 (2): 291–309.
Agrawal, A. and Knoeber, C. (1996). “Firm performance and mechanisms to control agency
problems between managers and shareholders”, Journal of Financial and Quantitative
Analysis, 31(3), pp. 377-397.
Anderson, Ronald C. and David M. Reeb. 2003. “Founding Family Ownership and Firm
Performance.” Journal of Finance. 58:3, pp. 1301-1328.
Balasubramanian, N. (1997). Towards excellence in board performance. Management Review,
January–March, 67–84.
Baysinger, B. D., and Butler, H. H. (1985). “Corporate governance and the board of directors:
Performance effects of changes in board composition.” J. Law Econom., 1, 101–124.
Berg, S. and Smith, S. (1978) CEO and Board Chairman: A Quantitative Study of Dual vs
Unitary Board Leadership, Directors and Boards, Spring, 34–39.
Bhagat, S. and B. Black, (2002) “The Non-Correlation between Board Independence and Long-
Term Firm Performance,” Journal of Corporation Law 27, pp. 231–273.
Bhagat, S., B. Black and M. Blair, ‘‘Relational Investing and Firm Performance,’’ Journal of
Financial Research 27 (2004), pp. 1–30.
Black B. S., Tang H. and Kim W., (2003), Does corporate governance affect firm value?
Evidence form Korea. Working Paper No. 237, Stanford Law School.
Brown, L. and M. Caylor, ‘‘Corporate Governance and Firm Operating Performance,’’ Journal
of Accounting and Public Policy 25 (2006), pp. 409–434.

Byrd, J. J., and Hickman, K. A. (1992). “Do outside directors monitor managers?” J. Financ.
Econ., 32, 195–221.
Cadbury A. 2006. The rise of corporate governance. In The Accountable
Corporation, Volume 1. Corporate Governance, Epstein M, Hanson KO (eds) Praeger:
Westport, CT; 15–43.
Caramanolis-Cötelli, B., “External and Internal Corporate Control Mechanisms and the Role
of the Board of Directors: A Review of the Literature”, Working Paper. nr. 9606, Institute of
Banking and Financial Management, 1995.
Chang S.J., (2003). Ownership structure, expropriation and performance of group affiliated
companies in Korea. Academy of Management Journal, 46,2, 238-253.
Chang, E. C. and J. M. Pinegar. "Risk and Inflation." Journal of Financial and Quantitative
Analysis, 22, No. 1 (1987), 89-98.
Chen, C., W., Lin, J., B. and Yi, B. (2008), “CEO Duality and Firm Performance: An
Endogenous Issue”. Corporate Ownership and Control, 6(1), 58-65.
Chen, N., Roll, R. and S. Ross, 1986, "Economic Forces and the Stock Market," Journal of
Business 59, 383-403.
Choi, J.J., Sami, H. and Zhou, H. 2010. The impacts of state ownership on information
asymmetry: evidence from emerging market. China Journal of Accounting Research 3(1):
13-49.
Chung, K.H., (1989), “The Impact of the Demand Volatility and Leverages on the Systematic
Risk of Common Stocks,” Journal of Finance and Accounting 16(3), 343-360.
Coles, J., Daniel, N., Naveen, L., 2008. Boards: does one size fit all? Journal of Financial
Economics 87, 329–356.

Connelly, J. T., & Limpaphayom, P. (2004). Environmental reporting and firm performance:
evidence from Thailand. The Journal of Corporate Citizenship, 13, 137-149.
Dahya, J., Garcia, L. G., & Bommel, J. v. (2009). One man two hats: What's all the
commotion! The Financial Review, 44(2), 179-212.
Daily, C. M., and Dalton D. R. _1992_. “The relationship between governance structure and
corporate performance in entrepreneurial firms.” J. Business Venturing, 7, 375–386.
Daily, C. M., and Dalton, D. R. (1993). “Board of directors leadership and structure: Control
and performance implications.” Entrepreneurship Theory Pract., 17, 65–81.
Daily, C., Dalton, D., & Cannella, A. (2003). Corporate governance: Decades of dialogue and
data. Academy of Management Review, 28(3), 371-382.
Dalton, D., Daily, C., Ellstrand, A., and Johnson, J. _1998_. “Meta analytic reviews of board
composition, leadership structure, and financial performance.” Strategic Manage. J., 19, 260–
290.
Dalton, D., Daily, C., Johnson, J. and Ellstrand, A. (1999) Number of directors and financial
performance: A meta-analysis, Academy of Management Journal, 42, 674- 686.
Demirgüç-Kunt, A. & Maksimovic, V. (1998) Law, finance, and firm growth, Journal of
Finance, 53(6), pp. 2107–2137.
Demsetz, H. (1983). The structure of ownership and the theory of the firm. Journal of Law
and Economics, 26, 375-90.
Demsetz, H. and Lehn, K., 1985, ‘The structure of corporate ownership- causes and
consequences’, Journal of Political Economy, Vol. 93 (6), pp. 1155–77.
Derwent, R. A., and Jones, M. E. _1996_. The corporate governance handbook, Gee
Publishing, a Thomson Company, London.
Donaldson, L., and Davis, J. H. (1991). “Stewardship theory or agency theory: CEO
governance and shareholder returns.” Austr. J. Manage., 16, 49–64.
Dutta, P. and Bose, S. (2006), “Gender Diversity in the Boardroom and Financial
Performance of Commercial Banks: Evidence from Bangladesh”. The Cost and Management,
34(6), 70- 74.
Dwivedi, N., & Jain, A.K. (2005). Corporate governance and performance of Indian firms:
The effect of board size and ownership. Employee Responsibilities and Rights Journal, 17(3),
161-172.
Ehikioya, B. I. (2009). Corporate governance structure and firm performance in developing
economies: evidence from Nigeria. Corporate Governance, 9 (3), 231-243.
Eisenberg, T., Sundgren, S., & Wells, M. T. (1998). Larger board size and decreasing firm
value in small firms. Journal of Financial Economics, 48, 35–54.
Epstein MJ, Hanson KO. 2006 (eds.). The Accountable Corporation. Volume 1. Corporate
Governance. Praeger: Westport and London.
Faccio, M. and M. Lasfer, ‘‘Managerial Ownership, Board Structure and Firm Value: The UK
Evidence,’’ Working Paper (Vanderbilt University, 1999).
Fama, E. and M. Jensen, ‘‘Separation of Ownership and Control,’’ The Journal of Law and
Economics 26 (1983), pp. 301–325.
Fama, E., ‘‘Agency Problems and the Theory of the Firm,’’ Journal of Political Economy 88
(1980), pp. 288–307.
Fama, Eugene, and Michael Jensen, 1985, Organizational forms and investment decisions,
Journal of Financial Economics 14, 101-119.
Fathi Elloumi, Jean-Pierre Gueyié, (2001) "Financial distress and corporate governance: an
empirical analysis", Corporate Governance: The international journal of business in society,
Vol. 1 Iss: 1, pp.15 – 23.

Goilden, B. R., & Zajac, E. J. (2001). When will boards influence strategy? Inclination × Power
= Strategic change. Strategic Management Journal, 22, 1087–1117.
Goodstein, J., Guatam, K. and Boeker, W. (1994). “The effects of board size and diversity on
strategic change”, Strategic Management Journal,15(3), pp. 241-250.
Goswami, O. (2000). The Tide Rises, Gradually-Corporate Governance in India, Presented at
the Informal Workshop held on 3–4 April 2000 at OECD Headquarters, Paris on behalf of
Confederation of Indian Industry, New Delhi.
Gregory, H., and Simmelkjaer, R. T. _2002_. Comparative study of corporate governance
codes relevant to the European Union and its members states on behalf of the European
commission, Weil, Gotshal, & Manges, LLP, New York.
Harry Markowitz, (1991), Foundations of Portfolio Theory, Journal of Finance, 46, (2), 469-
77.
Heidrick & Struggles (2009), “Corporate Governance Report 2009 - Boards in turbulent
times”. Heidrick and Struggles International, Inc.
Hewa-Wellalage, N. and Locke, S. (2011), “Does CEO Duality is Really Matter? Evidence
from an Emerging Market”. Corporate Ownership and Control, 8(4), 112-122.
Hill, C. and S. Snell, ‘‘External Control, Corporate Strategy and Firm Performance in Research
Intensive Industries,’’ Strategic Management Journal 9 (1988), pp. 577–590.
Himmelberg, C. P., Hubbard, G. R., & Palia, D. (1999). Understanding the determinants of
managerial ownership and the link between ownership and performance. Journal of Financial
Economics, 20, 317–346.
James, Harvey, 1999, Owner as manager, extended horizons and the family firm,
International Journal of the Economics of Business 6, 41-56.
Jensen, M. C. (1993) The modern industrial revolution, exit, and the failure of internal
control systems, Journal of Finance, 48, 831-880.

Jensen, M. C., & Meckling, W. (1976). Theory of the firm: Managerial behaviour, agency
costs, and ownership structure. Journal of Financial Economics, 3, 305–360.
John, K. and Senbet, L.W. (1998). “Corporate governance and board effectiveness.”, Journal
of Banking and Finance, 22(4), pp. 371-403.
Johnson, S., P. Boone, A. Breach, and E. Friedman. 2000. ‘‘Corporate Governance in the Asian
Financial Crisis.’’ Journal of Financial Economics 58: 141–186.
Kang, D. (1998). The impact of ownership type on performance in public corporations: A
study of the US textile industry 1983-82. Harvard Business School Working Paper.
Khanna, T. & Palepu, K. (2000) “Emerging Market Business Groups, Foreign Intermediaries,
and Corporate Governance” Concentrated Corporate Ownership. University of Chicago
Press. pp. 265 – 294.
Khatri, N., Fern, C. T., & Budhwar, P. (2001). Explaining employee turnover in an Asian
context. Human Resource Management Journal, 11 (1), pp. 54-74.
Kiel, G., & Nicholson, G. (2003). Board composition and corporate performance: How the
Australian experience informs contrasting theories of corporate governance. Corporate
Governance: An International Review, 11(3), 189-205.
Klein, A., ‘‘Firm Performance and Board Committee Structure,’’ Journal of Law and
Economics 41 (1998), pp. 275–303.
Krugman, Paul. “The Myth of Asia’s Miracle”. Foreign Affairs 73, no. 6 (1994): 62–78.
Kwak, M., (2003). The advantages of family ownership. MIT Sloan Management Review,
12.
La Porta, R., Florencio, L. S., Shleifer, A., & Vishny, R. W. (1999). Corporate ownership
around the world. Journal of Finance, 54(2), 471–517.
Lauterbach, B & Vaninsky, A 1999, „Ownership structure and firm performance: Evidence
from Israel‟, Journal of Management and Governance, vol. 3, no. 2, pp. 189-201.
Leland, H. E. & Toft, K. B. (1996). Optimal capital structure, endogenous bankruptcy, and
term structure of credit spreads. Journal of Finance 51 (3), 987-1019.
Levine, R. & Zervos, S. (1998) Stock markets, banks, and economic growth, American
Economic Review, 88(3), pp. 537–558.
Lintner, J. (1965). The Valuation of Risk Assets and the Selection of Risky Investments in
Stock Portfolios and Capital Budgets. Review of Economics and Statistics, 73, 13-37.
Lipton, M. and Lorsch, J. W. (1992) A modest proposal for improved corporate governance,
Business Lawyer, 48, 59- 77.
Liu, C., Uchida, K., and Yang, Y. 2012. Corporate governance and Firm Value during the
global financial Crisis: Evidence from China. International Review of Financial Analysis
21:70-80.
Luo Y. 2005a. Corporate governance and accountability in multinational enterprises: concepts
and agenda. Journal of International Management 11: 1–18.
M. Bertrand, P. Mehta, and S. Mullainathan. 2002. “Ferreting out Tunneling: An Application
to Indian Business Groups,” Quarterly Journal of Economics 117, pp. 121–48.
M.E. Sharpe, Eastern European economics. (1962). Armonk, N.Y.
MacKinlay, A. C., 1987, "On Multivariate Tests of the CAPM," Journal of Financial
Economics 18, 341-372.
MacKinlay, A. Craig and Matthew P. Richardson, 1991, Using generalized method of
moments to test mean-variance efficiency, Journal of Finance 46, 511-527.

Mallik, A. K and Rakshit, D. (2005): “EVA Based Segmental Reporting: A Case Study”,
Research Bulletin, Vol. No- XXVI, Pp-12-27.
Markowitz, H. (1952) Portfolio Selection. Journal of Finance, 7, 77-91.
McConaughy D., M. Walker, G. Henderson & C. Mishra, (1998). Founding family controlled
firms: Efficiency and value. Review of Financial Economics 7,1, 1-19.
McConnell, J. and H. Servaes, ‘‘Additional Evidence on Equity Ownership and Corporate
Value,’’ Journal of Financial Economics 27 (1990), pp. 595–612.
Miller, M. (1991). Leverage, Journal of Finance, 46, p. 479-488.
Mishra C. & McConaughy, (1999). Founding family control and capital structure: The risk of
loss of control and the aversion of debt. Entrepreneurship Theory and Practice 23(4), 53-64.
Mishra C., Randoy T. & J. Jensen, (2001. The effect of founding family influence on firm
Value and corporate governance, Journal of International Financial Management and
Accounting, 12:3, 235-259.
Moore, M. T. (2002). “Corporate governance: An experienced model.” Director’s Monthly,
26 (3), 1–9.
Morck, R., A. Shleifer and R. Vishny, ‘‘Management Ownership and Market Valuation: An
Empirical Analysis,’’ Journal of Financial Economics 20 (1988), pp. 293–316.
Mueller, D.C. (2006) Corporate Governance and Economic Performance, International
Review of Applied Economics, Vol. 20, No. 5, 623–643, December 2006
O’Reilly, C., Caldwell, D., and Barnett, W. (1989). “Work group demography, social
integration, and turnover.” Adm. Sci. Q., 34, 21–37.
Pearce, J.A. and Zahra, S.A. (1992). “Board composition from strategic contingency
perspective”, Journal of Management Studies, 29(4), pp. 411-438
Peng M. Outside Directors and Firm Performance During Institutional Transitions. Strategic
Management Journal 2004; 25: 453-471.
Pfeffer, J. (1972). “Size and composition of corporate boards of directors.” Adm. Sci. Q., 17,
218–228.
Radelet, Steven and Jeffrey Sachs. “The East Asian Financial Crisis: Diagnosis, Remedies,
Prospects”. Research paper, Brookings Panel, Washington D.C., 26–27 March 1998.
Rajan, R. G. & Zingales, L. (1998) Financial dependence and growth, American Economic
Review, 88, pp. 559–586.
Ramaswamy, K., Li, M., & Veliyath, R. (2002). Variations in ownership behaviour and
propensity to diversify: A study of the Indian corporate context. Strategic Management
Journal, 23, 345–358.
Randoy, T., & Goel, S. (2000). Ownership structure, founding family leadership and
performance in Norwegian SMEs. Working paper, University of Minnesota-Duluth.
Rasiah, Rajah. “Assessing the Recovery Plans of Asian Economies Destabilized by Financial
Crisis”. Conference paper, Faculty of Economics and Business, UNIMAS, 1999.
Rebeiz, K. S. (2004). “Corporate governance accountability for multinational firms: Beyond
the call for regulatory reforms.” J. Int. Business Economy, 2(1), 175–181.
Rebeiz, K.S. & Salameh, Z. (2006) Relationship between Governance Structure and Financial
Performance in Construction, Journal of Management in Engineering, Vol. 22, No. 1, January
1, 2006.
Rechner, P. L., and Dalton, D. R. _1989_. “The impact of CEO as board chairperson on
corporate performance: Evidence vs. rhetoric.” Acad. Manage. Executive, 3, 141–143.

Rechner, P. L., and Dalton, D. R. _1991_. “CEO duality and organizational performance: A
longitudinal analysis.” Strategic Manage. J., 12_2_, 155–160.
Ross, S. A., ‘The Arbitrage Theory of Capital Asset Pricing’, Journal of Economic Theory,
Vol. 13, No. 3, 1976.
Sarkar J., & Sarkar S., (2000), Large shareholder activism in corporate governance in
developing countries: Evidence from India: International Review of Finance, 1:3 161-194.
Sarkar, J. and S. Sarkar. "Large Shareholder Activism in Corporate Governance in
Developing Countries: Evidence from India." International Review of Finance, 1 (2000),
161-194.
Sauer, A., and Murphy, A., (1992). An Empirical Comparison of Alternative Models of
Capital Asset Pricing in Germany. Journal of Banking and Finance, Vol. 16, pp. 183- 196.
Schellenger, M. H., Wood, D., and Tashakori, A. (1989). “Board of directors composition,
shareholder wealth, and dividend policy.” J. Management, 15, 457–467.
Sharpe, W.F. (1964). Capital Asset Prices: A Theory of Market Equilibrium under Conditions
of Risk. Journal of Finance, 19 (3), 425-42.
Sharpe, William F., 1991, “Capital Prices with and without Negative Holdings,” The Journal
of Finance, June 1991, pp. 489-509.
Shleifer, A. & Vishny, R. W. (1997) A survey of corporate governance, Journal of Finance,
52(2), pp. 737–783.
Singh, M. and W.N. Davidson III, (2003). Agency costs, ownership structure and corporate
governance mechanisms, Journal of Banking and Finance. 27: 793-816.

Slovin, M. B., & Sushka, M. E. (1993). Ownership concentration, corporate activity and firm
value: Evidence from the death of inside blockholders. Journal of Finance, XLVIII (4), 1293-
1321.
Smith, N., Smith, V., & Verner, M. (2006). Do women in top management affect firm
performance? A panel study of 2500 Danish firms. International Journal of Productivity and
Performance Management, 55(7), 569-593.
Stewart, G. B. (1991), The Quest for Value: A Guide for Senior Managers, First Ed., New
York: Harper Business.
Stulz, R. M. (1988). Managerial control of voting rights: Financing policies and the market
for corporate control, Journal of Financial Economics, 20, 25–54.
Thomsen, S., & Pedersen, T. (2000). Ownership structure and economic performance in the
largest European companies. Strategic Management Journal, 21, 689–705.
Umstead, David A. and Bergstrom, Gary L. , "Djmamic Estimation of Portfolio Betas,"
Journal of Financial and Quantitative Analysis , Vol. 14, No. 3 (September, 1979), 595-614.
Vafeas, N. (1999) Board Meeting Frequency and Firm Performance, Journal of Financial
Economics, 53, 113–142.
Vance, S. (1978). “Corporate governance: Assessing corporate performance by boardroom
attributes.” J. Business Res., 6, 203–220.
Van-Ees, H., & Postma, T. (2002). On the equilibrium relationship between board size and
corporate performance. Proceedings of the EURAM 2nd Annual Conference, Stockholm.
Vries de. (1993). The dynamics of family controlled firms: The good and bad news.
Organizational Dynamics, 59-71.
Ward, J. L. (1991). Creating effective boards for private enterprises, Jossey-Bass Publishers,
San Francisco.

Weiss, A. and G. Nikitin, ‘‘Foreign Portfolio Investment Improves Performance: evidence
from the Czech Republic,’’ Topics in Economic Analysis and Policy 4 (2004), pp. 1205– 1255.
Yermack, D. (1996) Higher Market Valuation for Firms with a Small Board of Directors,
Journal of Financial Economics, 40, 185–213.
Zingales, L. (1998). Corporate governance, in Peter Newman (ed.). The New Palgrave
Dictionary of Economics and the Law, London: Macmillan, 497-502.

CHARACTERISTICS OF HIGH-GROWTH FIRMS IN THAILAND
Kanitsorn Terdpaopong Rangsit University
Thailand
Bernice Kotey University of New England
Australia [email protected]
Nam Hoang
University of New England Australia
ABSTRACT High-growth firms (HGFs) are seen as vital for economic growth. A small number of HGFs drives a disproportionately large amount of job creation, while the average firm has a limited impact on the economy. It is therefore essential for policy and theory to consider the barriers faced by firms achieving high growth and those with the potential to do so. Definition of HGFs is identified in this article and classifications of HGFs are introduced based on cumulative sale growth. This article used data of 753 Thai firms for a period of four years (2013 – 2016), 3,012 firm-year observations, to investigate the characteristics of each growth–firm classifications and to investigate factors that might potentially influence the firm’s profitability. The results suggest that Thai and Japanese major shareholders have negatively correlation to the profitability (ROA) when firms reached a high growth level while being small-sized provides a positive correlation to it. The results have implications for theory on high-growth firms and policies focused on them. Keywords: High-growth firms, HGFs, SMEs, profitability, correlated random effects, Thailand

CHARACTERISTICS OF HIGH-GROWTH FIRMS IN THAILAND
INTRODUCTION
Firm growth is an extensive field in the business literature and has been widely studied since the Gibrat's seminal work in 1931 which has been eight decades ago (Gabriele & Giuseppe, 2013). The first phase of an interactional study using data from eight countries (Germany, Canada, Spain, France, Italy, the Netherlands, Sweden and Greece), under the direction of the OECD Small and Medium-Sized Enterprise Task Force (1998), concluded that high-growth small manufacturing firms' accounted for approximately 8% of all businesses but were responsible for more than 40% of new job creation by active firms during the period studied (Julien, 2000). It is commonly understood that a small number of high-growth firms (HGFs) drives a tremendously large amount of job creation in society, while the average firm has a limited impact on the economy. A few high-growth firms (HGFs) create more jobs than average firms (Birch and Medoff, 1994; Bru¨derl and Preisendo¨rfer, 2000; Davidsson and Henrekson, 2002; Delmar, Davidsson, & Gartner, 2003; Littunen and Tohmo; 2003; Halabisky, Dreessen, & Parsley, 2006; Acs et al., 2008; Acs and Mueller, 2008). Till the current date, an increasing number of researchers, policymakers focus on the small number of high-potential firms, high-growth firms that build a significant impact on the economy. European Commission also supports high-growth SMEs as a political objective in its Europe 2020 Strategy report (European Commission, 2010).
Past research has investigated factors of the success of the HGF (Julien, 2000), the dynamics of high-growth enterprises from a macro perspective (Per and Frederic, 1997), prediction the high-growth path using balance sheet ratios (Gabriele & Giuseppe, 2013), the link between total factor productivity growth and HGFs over a period of 10 years in the UK context (Du & Temouri, 2015), and the attempt to examine policy measures explicitly designed for high-growth entrepreneurial firms in 9 countries (Autio, Kronlund, & Kovalainen, 2007). The literature review for the critical markers of high growth firms which include training and experience in entrepreneurship and management; and strategies that emphasize innovation, marketing, and employee and organizational learning (Dwyer & Kotey, 2016) and so on. Most of these early studies implicitly assume that studying or investigating for in-depth understanding by researchers, by business entrepreneurs, by policymakers can lead to the promoting and increasing number of HGFs in the economy. Also, such would help to sustain the ongoing, healthy, and stainable economies at large. However, the literature so far does not adequately explore the link between HGFs and productivity or performance (Du & Temouri, 2015). HGFs regarding SMEs in Thailand is mutual to others. The business majority in the economy is on small and medium-sized enterprises. In Thailand, 99 % of business is classified as SMEs (3.004 million entities in 2016). How many percents of this classifies as HGF little is unknown. What we know were among 3.004 million entrepreneurs, 2.989 million was small entrepreneurs, or 99.19 % of the total country's entities, or 99.49 % of total SMEs, SMEs created million on jobs or about 78.48 % of total employment, or around 11,747,093 employees in 2016 (increased 9.26% from 2015) and contributed 42.2% of GDP in 2016. Only 33 % of total SMEs can access to finance from commercial banks (The Office of Small and Medium Enterprises Promotion (OSMEP), 2016). SMEs receive considerable attention from the Office of Small and Medium Enterprises Promotion, but little has mentioned about high-growth SMEs. No definition of a high-growth firm is defined from OSMEP, let alone research on such topic. OSMEP has divided SMEs’ status according to their business life cycle into four different groups; i) Start-up; ii) the Strong and
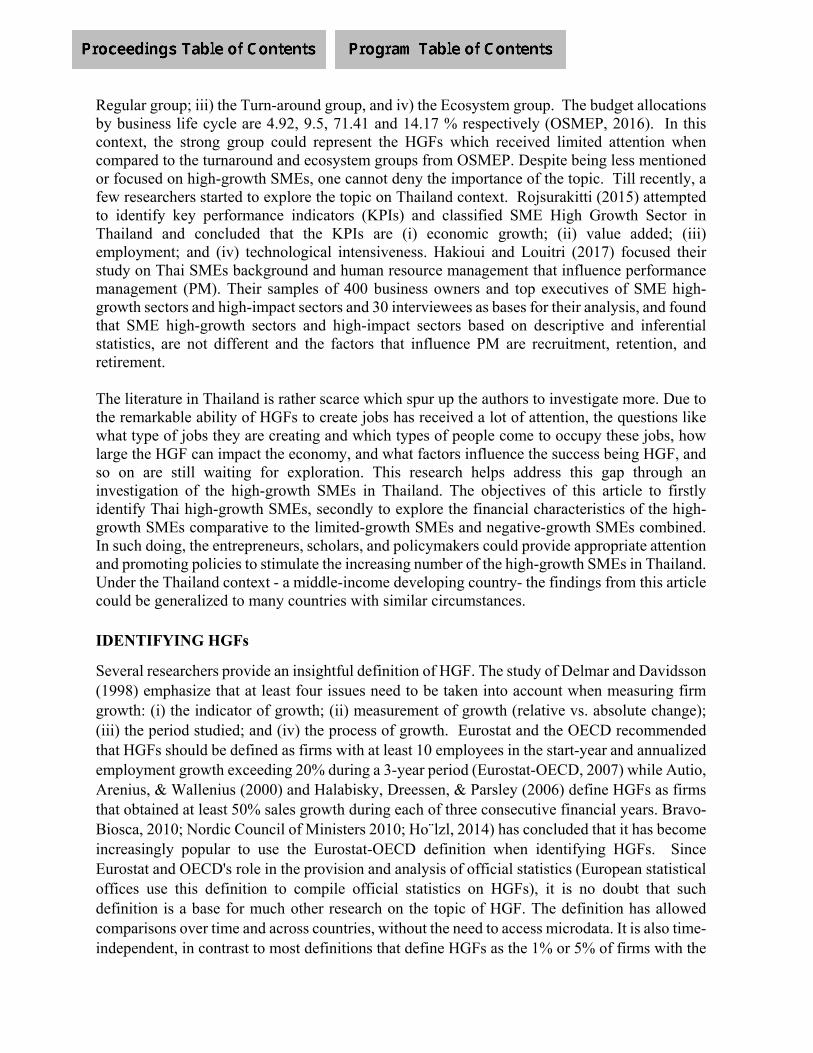
Regular group; iii) the Turn-around group, and iv) the Ecosystem group. The budget allocations by business life cycle are 4.92, 9.5, 71.41 and 14.17 % respectively (OSMEP, 2016). In this context, the strong group could represent the HGFs which received limited attention when compared to the turnaround and ecosystem groups from OSMEP. Despite being less mentioned or focused on high-growth SMEs, one cannot deny the importance of the topic. Till recently, a few researchers started to explore the topic on Thailand context. Rojsurakitti (2015) attempted to identify key performance indicators (KPIs) and classified SME High Growth Sector in Thailand and concluded that the KPIs are (i) economic growth; (ii) value added; (iii) employment; and (iv) technological intensiveness. Hakioui and Louitri (2017) focused their study on Thai SMEs background and human resource management that influence performance management (PM). Their samples of 400 business owners and top executives of SME high-growth sectors and high-impact sectors and 30 interviewees as bases for their analysis, and found that SME high-growth sectors and high-impact sectors based on descriptive and inferential statistics, are not different and the factors that influence PM are recruitment, retention, and retirement. The literature in Thailand is rather scarce which spur up the authors to investigate more. Due to the remarkable ability of HGFs to create jobs has received a lot of attention, the questions like what type of jobs they are creating and which types of people come to occupy these jobs, how large the HGF can impact the economy, and what factors influence the success being HGF, and so on are still waiting for exploration. This research helps address this gap through an investigation of the high-growth SMEs in Thailand. The objectives of this article to firstly identify Thai high-growth SMEs, secondly to explore the financial characteristics of the high-growth SMEs comparative to the limited-growth SMEs and negative-growth SMEs combined. In such doing, the entrepreneurs, scholars, and policymakers could provide appropriate attention and promoting policies to stimulate the increasing number of the high-growth SMEs in Thailand. Under the Thailand context - a middle-income developing country- the findings from this article could be generalized to many countries with similar circumstances. IDENTIFYING HGFs
Several researchers provide an insightful definition of HGF. The study of Delmar and Davidsson (1998) emphasize that at least four issues need to be taken into account when measuring firm growth: (i) the indicator of growth; (ii) measurement of growth (relative vs. absolute change); (iii) the period studied; and (iv) the process of growth. Eurostat and the OECD recommended that HGFs should be defined as firms with at least 10 employees in the start-year and annualized employment growth exceeding 20% during a 3-year period (Eurostat-OECD, 2007) while Autio, Arenius, & Wallenius (2000) and Halabisky, Dreessen, & Parsley (2006) define HGFs as firms that obtained at least 50% sales growth during each of three consecutive financial years. Bravo-Biosca, 2010; Nordic Council of Ministers 2010; Ho¨lzl, 2014) has concluded that it has become increasingly popular to use the Eurostat-OECD definition when identifying HGFs. Since Eurostat and OECD's role in the provision and analysis of official statistics (European statistical offices use this definition to compile official statistics on HGFs), it is no doubt that such definition is a base for much other research on the topic of HGF. The definition has allowed comparisons over time and across countries, without the need to access microdata. It is also time-independent, in contrast to most definitions that define HGFs as the 1% or 5% of firms with the
highest growth rates. However, Daunfeldt, Johansson, & Halvarsson (2015) argued that the Eurostat-OECD definition excludes a large number of firms and their job creation because it restricts attention to firms with at least ten (10) employees. Such controversial cover should all firms with high-growth rates be counted as HGFs, or only firms with substantial absolute changes (in terms of employment, sales, or productivity) raises a question relating to what kind of economic activity should be measured by any definition of HGFs and still leave many rooms for future research. The study by Daunfeldt, Elert, and Johansson (2016) using fractional logit regressions indicate that industries with high R&D intensity, ceteris paribus, can be expected to have a lower share of HGFs than can industries with lower R&D intensity. The findings cast doubt on the targeting R&D industries or subsidizing R&D to promote firm growth. They found that HGFs are overrepresented in knowledge-intensive service industries, i.e., service industries with a high share of human capital. The study by Lee (2014) studies on 4,858 UK SMEs to investigate the obstacles perceived by two sets of firms: (1) firms in periods of high growth and (2) potential high-growth firms, which are observationally similar but are not achieving high growth. The results suggest high growth firms perceive problems in six areas: recruitment, skill shortages, obtaining finance, cash flow, management skills and finding suitable premises. Coad, Daunfeldt, Ho¨lzly, Johanssonz and Nightingale (2014) suggested seven (7) facts about HGFs that (i) growth rates distributions are heavy-tailed; (ii) a small number of HGFs create a large share of new jobs; (iii) HGFs tend to be young but are not necessarily small; (iv) HGFs are not more common in high-tech industries; (v) high growth is not to be persistent over time; (vi) difficult to predict which firms are going to grow; (vii) the use of different growth indicators influences the results.
Defining HGFs using employment grow as a critical indicator may create somecontroversialforhigh‐techcompaniesorcompaniesthatlaborintensiveisnotafocusorcompanies that use an automaticmachine, roboticmachine. With the advancementoftechnologymakestechnologymoreaffordablefornewandyoungSMEs,thesecompanieswill be less likely to employ many employees, and such the increasing number ofemployeesislesslikelywiththeadvancingtechnologytheyacquire. However,theyareperhapsrapidlygrowingandcouldhavebeenincludedasHGFsifthenumberofemployeesisnotanissue.The study by Daunfeldt, Elert, & Johansson, (2013) concluded that the most commonly used indicators for the high-growth literature are sales and number of employees. The study by Almus (2002) and Daunfeldt, Elert, & Johansson, (2013) stated that the selection of HGFs using different growth measures is primarily driven by whether high growth is measured as absolute or relative growth. To correct for one-off expansions, and to reduce the issue of statistical measurement, growth rate employs in the study can be smoothing over the years. Most studies calculate growth rates over a time horizon of a few years. Three- or four-year periods are used in most previous HGF studies, although some studies have used shorter as well as more extended periods (Henrekson and Johansson, 2010).
Even though the definition of identification of HGF is crucial, there are other vital issues that researchers and policymakers should pay attention to. That is to discover factors that make them
grow distinguishably from average. The factors could come from internal or external. In other words, one should turn attention from ‘What', or ‘How much' to ‘How' – how the employment grow, how to sale grow, how to make it grows and so on – is it because of the business growing and required more staff, or because of the merger and acquisition of the two companies together (McKelvie and Wiklund, 2010). Spearot (2012) argued that this is not problematic since internal and external growth is guided or decided by decisions within firms. There is still a remaining controversy on HGFs that one needs to pay attention. It is no consensus on how HGFs should be defined. It could be problematic because methodological choices influence the policy implications that can be drawn from research on HGFs. Unfortunately, the theoretical literature in economics, management, and entrepreneurship does not yet provide much guidance on this critical question, with the results that open methodological questions lead to controversies (Coad, Daunfeldt, Ho¨lzly, Johanssonz, & Nightingale, 2014). In Thailand, there are criteria for considering identifying the classification of companies according to business competency by using the total income from the financial statements of the previous four years. The classification reported by the Office of Small and Medium Enterprises Promotion (OSLMEP) are Strong, Regular and Turnaround. The first classification is the ‘Strong' Group which total income in 3 years expanding over 20%. The second group is the ‘Regular’ which total income in 3 years expanding over 5% but not over 20%; ‘regular +’ where total income in 3 years expanding over 0-5%; and ‘regular –‘ where 0 to -5% is applied. The third group is the ‘Turnaround’ or ‘declining growth’ which ‘turnaround 1’ is defined to the companies with total income in 3 years decreasing over -5% but not over -20%, and ‘turnaround 2’ where the decreasing over -20%. In 2016, based on the data analysis of SMEs (223,615 SMEs submitted their financial statements consecutively over the past four years, only 199,127 companies are taken into account due to the completion of the data). According to the classification of entrepreneurs using the criteria of total income from the financial statement of the past four years, 89,881 SME entrepreneurs were classified to the Strong group or 45.14% of the total SMEs. The second was the Turnaround group with 71,170 entrepreneurs or 35.74%. The number of SMEs belonging to Regular totaled 38,076 entrepreneurs, or 19.12% (The Office of Small and Medium Enterprises Promotion (OSMEP), 2017). However, these percentages were determined based on the complete set of financial information of four consecutive years that SMEs supplied to the Commerce Department, Thailand. Identifying the high growth in this article From the literature, high growth firms have been defined differently. Some researchers defined them by employee growth, others by sales growth, and over different periods. Employee growth seems to receive favor among many researchers. However, in this study, we explored the best practice that fit our objectives and the context of Thailand where the number of employees is not widely available. In this article, firms therefore are classified into five performance groups based on their accumulative sales growth from 2013 – 2016 which all companies taken into the study must exist throughout 2013 – 2016. Each year, annual sales growth were determined, comparative between 2014 – 2013, 2015 – 2014, 2016 – 2015, and three annual sales growth were accumulative. The distinctions of those five groups are defined as follows.
(1) ‘NGF’ – Negative Growth Firm; if a firm has negative accumulative sales growth
(2) ‘LGF’ – Limited Growth Firm; if a firm has positive accumulative 0-20 % sales growth (3) ‘G+’ – Growth Plus One; if a firm has positive accumulative 20 - 30 % sales growth (4) ‘G++’ – Growth Plus Two; if a firm it has positive accumulative 30 - 50 % sales growth (5) ‘G+++’– Growth Plus Three; if a firm it has positive accumulative exceed 50 % sales
growth In this regards, our definition of high growth firms is stronger than what is identified by the Office of Small and Medium Enterprises Promotion, Thailand. The Strong group by OSMEP is equivalent to the G+ onwards.
DATA AND METHODOLOGY
Samples The samples selected to this study were chosen from the database of the Department of Business Development, the Ministry of Commerce, Thailand. Due to the focus of this study is to investigate the high growth firms; therefore the first criteria is the selection of sectors that have been the significant impact and drive the economy of the country. In this case, manufacturing, wholesale and retails, and services were selected into the study. Executive Summary on White Paper on Small and Medium Enterprises reported by OSMEP (2017) the GDP structure of the country in 2016, the service sector was the most important economic activity, followed by the manufacturing sector, and trading (wholesale and retails), accounting for 40.4%, 27.4% and 15.4% respectively. The GDP value in 2016 for small, medium and large were THB 4.27, 1.79 and 6.23 trillion (proportion 29.7: 12.5: 43.4%) with the GDP growth rate 5.1, 4.3 and 2.8 % respectively (Source: The Office of the National Economic and Social Development Board, compiled by The Office of Small and Medium Enterprises Promotion (OSMEP)). Furthermore, the location of the companies is the second criteria where main business clusters located in Bangkok, Pathumthani, Chachoengsao, Chonburi, Ayudhaya, and Rayong, were selected to the study. The third criteria is the size of the companies where asset volume over 50 million baht was selected as an indicator to draw the data. Only business types of a limited liability company and public company were chosen. Finally, 982 companies were drawn, and after checking the completeness of the data, only 795 companies have completed data and then chosen into the study. After outliers were detected and then dropped, the number of samples was reduced to 753 companies, 3,012 firm-year observations. Variables
As the objective of the article is to investigate the financial performance of each company classifications, numbers of variable are observed. On the financial aspects, the variables were carefully divided into three different aspects namely – liquidity (the ability of a company to meet its financial obligations as they come due); profitability (financial metrics to measure and evaluate the ability of a company to generate income (profit); and leverage (the level of debt incurred, or assesses the ability of a company to meet its financial obligations). All variables were described in Table 1 together with the information on mean, minimum (min), maximum (max) and standard deviation (SDV).

Table 1: Variable Selected for This Study
The companies' characteristics (ownership structure, size, sector, and age) and financial ratios are summarized in this table. Definitions of each variable are given. Mean (M), minimum (Min), maximum (Max) and standard deviation (SDV) are presented in columns below.
No. Variable Definitions M Min Max SDV
1 Status 1: NGF: Negative growth firms 2: LGF: Limited growth firms 3: G+: Growth Plus One 4: G++: Growth Plus Two 5: G+++ : Growth Plus Three
- - - -
2 Owner Ownership structures 1: Pure Thai corporation; 2: Joint venture (Thai + Foreign); and 3: Foreign corporation
1.81 1 3 .833
3 Size Business sizes based on their fixed assets; 1: Small; 2: Medium; and 3: Large
1.86 1 3 .836
4 Sector Business sectors: 1: Manufacturing, 2: Wholesales and Retails, 3: Services
1.42 1 3 .650
5 Age Business age 21.29 5 55 9.28
6 CA Current Assets Ratio (Current Assets / Current Liabilities)
.58 .0001 1.0 .25
7 CL Current Liability Ratio (Current Liability / Total Assets)
.40 .001 7.82 .35
8 DA Debt Asset Ratio (Total Debt / Total Assets) .56 .002 12.69 .52
9 DE Debt Equity Ratio (Total Debt / Total Equity) 1.80 -31.65 34.82 4.41
10 GPM Gross Profit Margin Ratio (Gross Profit Margin / Total Revenue)
.63 -20.93 34.82 2.14
11 OPM Operating Profit Margin Ratio (Operating Profit Margin / Total Revenue)
.03 -5.75 1.00 .27
12 NPM Net Profit Margin Ratio (Earnings after Interest and Tax Expenses / Total Revenue)
.02 -6.11 1.00 .27
13 ROA Return on Asset Ratio (Earnings after Interest and Taxes / Average Assets)
.05 -1.21 2.55 .13
14 ROE Return on Equity Ratio (Earnings after Interest and Taxes / Average Equity)
.10 -9.37 5.40 .43
Hypothesis setting
Moreno and Casillas (2007) using discriminant analysis to find out what characteristics enable them to distinguish between high-growth and non-high-growth firms. Their finding is that the HGFs are different from moderate-growth firms or declining firms because of their smaller size, their higher availability of idle resources, while firm age, however, does not seem to be a differentiating factor between the two types of firms. The study by Julien (2000) found that management that has high experience and communicative skills, both internally and externally,
can provide consistency through flexible planning and the sharing of a dynamic culture and to seek out new business opportunities which contributed to being HGFs. The ownership structure – joint venture – is one that suits this situation. Since management will need to integrate their knowledge from parent companies, this could be one of the factors that influence the success of HGFs. Navarro, Casillas, and Barringer (2012) also studied whether international geographic expansion and domestic geographic (size, age, and sector) influence the Spanish HGFs. Smallbone, Leig, and North (1995) studied characteristics and strategies of high growth SMEs and concluded that HGFs could be achieved by firms with a variety of size, sector and age characteristics; such firms are distinguished more by the strategies and actions of managers than by their profile characteristics. We further include measures of industry entry. Johansson (2005) and Brown, Haltiwanger, & Lane (2006) made an argument that industries with more turnover can be expected to be more conducive to high growth and hence have more HGFs.
In contrast, industries with a greater firm concentration can be argued to exhibit less high growth due to a smaller number of market opportunities (Chappell, Mwangi, & Walter, 1990; Geroski, 1995). We assume that the manufacturing industry has high turnover compared to other sectors on average. The joint venture companies would have less concentration compared to those pure Thai ownership companies. Those prior studies are complex and facilitate us to consider several factors that could potentially influence the Thai HGFs.
Hypothesis H1: Ownership structure of each growth firm classification is statistically different. Hypothesis H2: Size of each growth firm classification is statistically different. Hypothesis H3: Sector of each growth firm classification is statistically different. Hypothesis H4: Business age of each growth firm classification is statistically different.
The study’s objective is to investigate the financial performance of HGFs comparison to LGFs and NGFs. As HGFs are growing in their revenue each year, we assume that they might be able to access finance from financial institutions and expand their business activities to generate high income. The liquidity of those HGFs, is assumed to be more liquid than of those LGFs and NGFs and be able to meet their financial obligations better as they come due. Liquidity was one of the financial ratios studied by many research (Beaver, 1966; Ohlson, 1980; Zmijewski, 1984; Osteryoung, Constand, & Nast, 1992; Samad, & Hassan, 1999; Feng & Wang, 2000; Mertens et al., 2008; Lin, Liang, & Chen, 2011; Terdpaopong, & Mihret, 2011; Delen, Kuzey, & Uyar, 2013; Terdpaopong, & Hovey, 2013; Ahmad, 2016; Cultrera & Brédart, 2016; Demerjian & Owens, 2016; Lakshmi, Martin, & Venkatesan, 2016; Sharma, & Kaur, 2016; Nadya & Isrochmani, 2017; Shaonan & Yan, 2017, among many others). This proofs to be a powerful tool for measurement firms’ liquidity. In terms of HGFs, Daunfeldt, Elert, and Johansson (2016) studied whether HGFs are overrepresented in R&D-intensive or high-tech industries and whether HGFs are more prevalent in service industries with a high level of human capital. Liquidity was used as one of the criteria. Moreno & Casillas (2007) analyzed the main variables that allow one to distinguish between high-growth firms and non-high-growth firms and found that HGFs have lower solvency and immediate liquidity than non-high-growth firms. Thus, the first hypothesis is:
Hypothesis H5: Liquidity of each growth firm classification is statistically different.
HGFs tend to focus on expanding their businesses and need to maximize the utility of scarce resource without compromising the quality of their offerings. It is summarized that both access and effective management of finance is critical to HGFs (Dwyer & Kotey, 2016). Despite the fact the difficulty to access financing is the biggest obstacle for SMEs, HGFs are assumed to comfortably access to finance from financial institutions compared to average SMEs. However, in terms of assessing the ability to external finance, to some extent, HGFs should have received superior credits when compared to LGFs and NGFs. We hypothesized that HGFs would have gained access to finance better than those of LGFs and NGFs, and such would illustrate on their financial position that they have more leverage than LGFs and NGFs which may have to rely on their own capital. Debt to equity ratio and debt to asset ratio are the most popular leverage ratios used among many researchers (Beaver, 1966; Deakin, 1972; Ohlson, 1980; Samad & Hassan, 1999; Feng & Wang, 2000; Aivazian, Ge, & Qiu, 2005; Ahn, Denis, Denis, 2006; Yuan, 2006; Ding et al., 2008; Mertens et al., 2008; Faris, 2012; Delen, Kuzey, & Uyar, 2013; Terdpaopong, & Hovey, 2013; Jin, Yang, & Yin, 2015; Brîndescu-Olariu, 2016; Demerjian & Owens, 2016; Sharma & Kaur, 2016; Shaonan & Yan, 2017).
Hypothesis H6: Leverage of each growth firm classification is statistically different. Of course, being HGFs means that their profitability illustrated some growth for at least three consecutive years and such generally higher than those of LGFs and NGFs. Our assumption regarding profitability is that the HGFs can generate income from their activities and gain higher profits than other groups. Profitability ratios such as gross profit margin, operating profit (loss) ratio (EBIT to total revenue), or net profit (loss) ratio (EAITR to total revenue) have been used in many studies (Rai, Patnayakuni, & Patnayakuni, 1997; Samad, & Hassan, 1999; Ohlson, 1980; Feng, & Wang, 2000; Lin, Liang, & Chen, 2011; Kabajeh, Said, Dahmash, 2012; Delen, Kuzey, & Uyar, 2013; Monica, 2014; Ali, & Umer 2017; Rao, 2016; Karnawi, 2017; Shaonan, & Yan 2017) among many others. Daunfeldt, Elert, and Johansson (2016) used allSwedishlimitedliabilitycompaniesactiveatsomepointbetween1997and2008,yieldingatotalof164,808firmsand1,401,684firm‐yearobservations.Thedataincludeallvariablesintheannualreports,e.g.,profits,numberofemployees,salaries,fixedcosts,andliquidityandthefigurelikeR&DintensitytodistinguishHGF.Our second hypothesis on the profitability of these three groups is then written below. Hypothesis H7: Profitability of each growth firm classification is statistically different.
The profitability of each firm' growth status is expected to correlate to several factors. We examine which factors influence the growth of each firm classifications. In this study, we acknowledge correlated unobserved variables that potentially affect the changes in profitability. The unobserved variables could be distinguished broadly into two groups; internal factors and external factors. The unobserved internal factors, a number of employees, a number of skilled labors, business strategy, vision and mission, management skills, supporting facilities are among many others. The unobserved external factors such as the GDP of the country, the support from

the relevant authorities, taxation policy and other policies, trends of the customer are listed just a few. As one cannot avoid such unobserved factors, several factors are observed and take into the regression correlated random effect model. We assume that the size of a firm is an important determinant of financial performance (Beard & Dess, 1981; Chen, 1995; Mintzberg, 1997). We assume that if the size of the firm is big enough, it can access to broader business capital market, and access to investment opportunities that are normally not available to small enterprises. Therefore, the size of a firm could capture the potential administrative efficiency and other benefits that may highly related to profitability. The type of ownership is interesting. It can be assumed that foreign-owned firms have a higher probability of growth than domestics firms. Foreign-owned firms are usually establishing a business concept that has long been proven successful elsewhere, while domestic firms are often competing on their first market, and found to perform less profitable when compared to the foreign ones (Morris & Trotter, 1990). In this article, we focus on foreign ownership counterparts where 100% Thai ownership, Joint venture by which Japanese owners and other nationality owners are in our concern. We provide an assumption that having a joint venture with foreign partners would assist the companies in many aspects. First of all, a joint venture will open an opportunity for the company to have substantial capital funds injection from abroad. The company has a high potential to adopt overseas management practices from the foreign partners which yield them to gain higher income and profitability. The profitability of firms with overseas joint venture expects to be higher than companies with no joint venture. Another factor that this study observes is the business age. Age is a recurrent variable in most studies of growth (Davidsson & Delmar, 1997). Generally, younger firms are more prone to grow than older more established firms. Further, Kirchhoff and Phillips (1989) found that young firms that grow have twice the probability of survival to that of young non-growing firms. We assume that the longer the business establishes, the higher the profitability the company will gain. The rationale behind this is that the business that has been established for long will gather more experience in doing such business and gain more market share than the newly established business. Several financial ratios are also observed and put into the model to estimate the regression profitability model. Our primary assumption to form the next hypothesis is that different firm's growth status will be influenced by different factors depending on the firms' urgent need on such status. For example, the profitability of a negative growth firm would be highly influenced by their liquidity, their leverage which these would illustrate in the form of related financial ratios. Furthermore, the profitability of such a company would subject to its' size. The smaller firms would find difficulty in accessing or acquiring finance from financial institutes and prohibit them from growing and from running the business effectively. As such reasons provided, the seventh hypothesis is formed as follow. Hypothesis H8: Profitability of the different growth firm’s classifications is statistically correlated to ownership structure, size, age, and financial ratios
Data analysis
This study focuses on SMEs in Thailand. To be included in the study a firm had to be in existence in these four years - 2013, 2014, 2015, 2016, independently owned and in specified manufacturing sector or services. The data taken from the firms’ financial statements and related data from the Department of Business Development, Ministry of Commerce, Thailand. The
mature nature of firms in the study is emphasized by the fact that all were at least ten years old at the time of the data collection in 2018. The data employed in this study came from the financial records of the companies located in the business cluster zones of Thailand which are Bangkok, Pathumthani, Chachoengsao, Chonburi, Ayudthaya, and Rayong. The Kolmogorov-Smirnov test served as normality checks. Then One-Way ANOVA is used to differentiate distributions across different groups with the confidence levels were at = 90 %, 95 %, and 99 %. The ANOVA analysis allows us to compare the means of more independent groups in order to determine whether there is statistical evidence that associated population means are significantly different. A panel data analysis approach was adopted for the evaluation of the determinants of the companies’ profitability. A panel data is a longitudinal or cross-sectional data in which economic entities are observed across time. Our application in this study is based on a panel data model. The specifications on panel data make it possible to remedy the disadvantages arising from the use of aggregated data and possible to study and control the individual heterogeneity. Panel data also has the advantage of being able to solve the problem of multicollinearity. Our empirical study is to estimate the model by the static panel data method. The general form of a panel data model is:
Yit = iXit + ɛit
Where i = 1, ……N, t=1……….,T Where i corresponds to an individual, t corresponds to a time period, Yit is the dependent variables, Xit is the observed explanatory variables, the parameters i represent the individual effects which can be assumed to be fixed effects, or random effects and ɛit are the error terms that are assumed to satisfy the usual regression model conditions. For the robustness of results, our empirical model to investigate the determinants of the companies' profitability are divided into five different measures based on the classification of the company's growth status. Independent variables – performance, liquidity, and leverage – are taken into the model, with other firms' characteristics – size, age, ownership structure. A panel data can be analyzed in two ways either fixed or random effects. Fixed effect models investigate the association between the outcome, which is the profitability of the firms in this case, and the explanatory variables within an entity and assume that all other time-invariant variables across entities correlate with the explanatory variables with fixed correlation across firms (Ahiawodzi and Sackey, 2010). However, random effects consider time-invariant variables and explanatory variables are uncorrelated. The shortcoming of the fixed-effects models is that it could not measure the effects of time in-variant variables on the profitability, but we consider this assumption may be too strong in our study. We would relax the random effects assumption and assume the correlation pattern between unobserved time-invariant variables and the explanatory variables. This leads to correlated random effect models. In this article where both time-variant and time-invariant variables are taken into account, correlated random effects (CRE) for balanced panels is an appropriate approach. In order to accomplish the objectives to investigate which variables would correlate to the profitability of each firms' status, we take advantage of the correlated random effects (CRE)
framework (Chamberlain, 1982, 1984; Mundlak, 1978), which nests the fixed effects specification by assuming the correlation of the unobserved time-invariant variables and the means of explanatory variables. Wooldridge (2002) illustrates how the CRE approach applies to commonly used models, such as unobserved effects probit, Tobit, and count models. Papke and Wooldridge (2008) propose simple CRE methods when the response variable is in the form of a fraction or proportion. Specifically, the CRE model allows for heterogeneity in the returns to the treatment and decomposes the cross-sectional bias for each separately. We would be able to estimate the CRE model by GLS allowing for heterogeneity in the error terms. The CRE model will allow us to measure the impacts of those time-invariant variables on the profitability proxies while still keep the fixed-effects analysis on the time-variant explanatory variables. We apply this CRE regression model in which other unobserved variables are an acknowledged concern. In this paper, we take the CRE model to assess the profitability of companies in focus – NGF, LGF, G+, G++, G+++.
FINDINGS
Descriptive analysis
The number of samples taken to this study is 753 companies with 3,012 firm-year observations. Based on the definition of firm growth classification, five classifications are formed. Close to 50 percent of the samples are classified to negative growth firms (NGF), 22.18 percent to limited growth firms (LGF), 7.84, 7.57 and 12.88 percent to G+, G++, and G+++ respectively. Close to half (45.82 %) of the samples are Thai ownership companies, while 27.09 % and 27.09 % are Japanese and other ownership structures. We found that the ownership of the NGFs is more in Thai nationality, rather than Japanese or other. As regards size classes, 42.63 % of our samples are small enterprises, and the rest are 28.29 and 29.08 on medium and large companies. 66.67 % of the samples are in the manufacturing sector, while wholesales and retails is 24.44 % and service 8.9 %. Majority of the business age of the samples is ranged between 21 – 30 years – 41.43 % and 11 – 20 year – 34.93 %. We acknowledge that to some extent this result is a consequence of our growth firm definition as a definition based on growth rates would have favored smaller firms. To a very great extent, the over-representation of large high growth firms is simply a result of their growth. The descriptive statistics associated with firms’ characteristics in terms of ownership structures, size, business age and sector across the five growth firm classifications are reported in Tables 2 and 3, in conjunction with selective financial variables of this article.
Multicollinearity Test
Multicollinearity is a before testing the relationship between various indicators on panel data; it is necessary to verify that there is no problem of multicollinearity between the explanatory variables. Table xx presents the matrix of bilateral correlations between variables statistical problem often encountered in multiple linear regression. The highest correlation level (.726) is observed between ROE and DE variables. According to Kennedy (1985), a multicollinearity problem exists when the correlation coefficient between two variables is more than 0.8. In our application, all the correlation coefficients in our model are below 0.8, except the correlation

between OPM and NPM with .995 correlation and significant at .001. The OPM variable was dropped from our study when we analyze the regression analysis. Therefore, we can confirm the absence of bivariate multicollinearity.
Table 2: Firms’ characteristics
The table 2 provides a summary of the statistics of the 753 companies in the period 2013 – 2016. The table presents the firm's characteristics where ownership structures (Thai, Japanese and Other nationality major shareholders), size (small, medium, large), sector (manufacturing, wholesales & retails, service), and age ranges are presented. Five groups in concern – NGF, LGF, G+, G++, G+++ are classified and illustrate the characteristics in detail in the form of a number of the companies and percentage at the last column of the table.
Firm’s characteristics
Total
Percentage
NGF LGF G+ G++ G+++ Total
Owners Thai 345 50.13 40.72 32.20 35.09 52.58 45.82
Japan 204 26.27 29.34 22.03 31.58 26.80 27.09
Others 204 23.59 29.94 45.76 33.33 20.62 27.09
SIZE Small 321 43.43 46.71 35.59 38.60 39.18 42.63
Medium 213 26.54 25.15 38.98 29.82 32.99 28.29
Large 219 30.03 28.14 25.42 31.58 27.84 29.08
Sector Manufacturing 502 64.08 65.87 66.10 78.95 71.13 66.67
Wholesales and Retails 184 27.08 23.95 27.12 14.04 19.59 24.44
Services 67 8.85 10.18 6.78 7.02 9.28 8.90
(Year) 1-20 263 36.73 35.33 33.90 33.33 28.87 34.93
21-30 312 41.55 47.90 40.68 38.60 31.96 41.43
31-40 54 8.85 4.79 6.78 3.51 7.22 7.17
41-50 24 3.49 2.40 6.78 1.75 2.06 3.19
>50 2 0.54 - - - - 0.27
Total 753 100.00 100.00 100.00 100.00 100.00 100.00
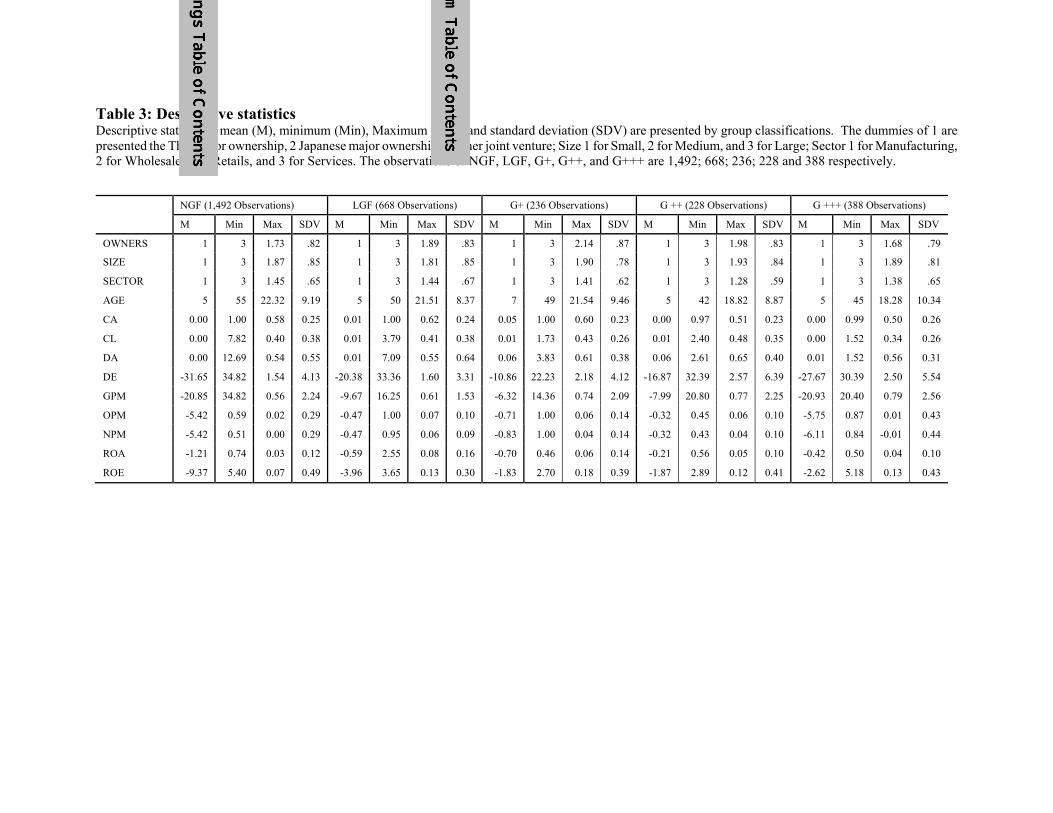
Table 3: Descriptive statistics Descriptive statistics – mean (M), minimum (Min), Maximum (Max) and standard deviation (SDV) are presented by group classifications. The dummies of 1 are presented the Thai major ownership, 2 Japanese major ownership, 3 Other joint venture; Size 1 for Small, 2 for Medium, and 3 for Large; Sector 1 for Manufacturing, 2 for Wholesales and Retails, and 3 for Services. The observations of NGF, LGF, G+, G++, and G+++ are 1,492; 668; 236; 228 and 388 respectively.
NGF (1,492 Observations) LGF (668 Observations) G+ (236 Observations) G ++ (228 Observations) G +++ (388 Observations)
M Min Max SDV M Min Max SDV M Min Max SDV M Min Max SDV M Min Max SDV
OWNERS 1 3 1.73 .82 1 3 1.89 .83 1 3 2.14 .87 1 3 1.98 .83 1 3 1.68 .79
SIZE 1 3 1.87 .85 1 3 1.81 .85 1 3 1.90 .78 1 3 1.93 .84 1 3 1.89 .81
SECTOR 1 3 1.45 .65 1 3 1.44 .67 1 3 1.41 .62 1 3 1.28 .59 1 3 1.38 .65
AGE 5 55 22.32 9.19 5 50 21.51 8.37 7 49 21.54 9.46 5 42 18.82 8.87 5 45 18.28 10.34
CA 0.00 1.00 0.58 0.25 0.01 1.00 0.62 0.24 0.05 1.00 0.60 0.23 0.00 0.97 0.51 0.23 0.00 0.99 0.50 0.26
CL 0.00 7.82 0.40 0.38 0.01 3.79 0.41 0.38 0.01 1.73 0.43 0.26 0.01 2.40 0.48 0.35 0.00 1.52 0.34 0.26
DA 0.00 12.69 0.54 0.55 0.01 7.09 0.55 0.64 0.06 3.83 0.61 0.38 0.06 2.61 0.65 0.40 0.01 1.52 0.56 0.31
DE -31.65 34.82 1.54 4.13 -20.38 33.36 1.60 3.31 -10.86 22.23 2.18 4.12 -16.87 32.39 2.57 6.39 -27.67 30.39 2.50 5.54
GPM -20.85 34.82 0.56 2.24 -9.67 16.25 0.61 1.53 -6.32 14.36 0.74 2.09 -7.99 20.80 0.77 2.25 -20.93 20.40 0.79 2.56
OPM -5.42 0.59 0.02 0.29 -0.47 1.00 0.07 0.10 -0.71 1.00 0.06 0.14 -0.32 0.45 0.06 0.10 -5.75 0.87 0.01 0.43
NPM -5.42 0.51 0.00 0.29 -0.47 0.95 0.06 0.09 -0.83 1.00 0.04 0.14 -0.32 0.43 0.04 0.10 -6.11 0.84 -0.01 0.44
ROA -1.21 0.74 0.03 0.12 -0.59 2.55 0.08 0.16 -0.70 0.46 0.06 0.14 -0.21 0.56 0.05 0.10 -0.42 0.50 0.04 0.10
ROE -9.37 5.40 0.07 0.49 -3.96 3.65 0.13 0.30 -1.83 2.70 0.18 0.39 -1.87 2.89 0.12 0.41 -2.62 5.18 0.13 0.43

Table 4: Correlations Matrix The correlations matrix of 13 variables is presented below. The high correlation where the coefficients exceed 0.8 is highlighted. The significance is placed below each coefficient and in the parenthesis form. The correlation coefficient (r) between the two variables is between +1 and –1. The number of observation is 3,012. To interpret its value, see which of the following values the correlation r is closest to:
‐ Exactly –1. A perfect downhill (negative) linear relationship ‐ 0.70. A strong downhill (negative) linear relationship ‐ –0.50. A moderate downhill (negative) relationship ‐ –0.30. A weak downhill (negative) linear relationship ‐ 0. No linear relationship
‐ +0.30. A weak uphill (positive) linear relationship ‐ +0.50. A moderate uphill (positive) relationship ‐ +0.70. A strong uphill (positive) linear relationship ‐ Exactly +1. A perfect uphill (positive) linear relationship
OWNER SIZE SECTOR AGE CA CL DA DE GPM OPM NPM ROA ROE OWNER 1
SIZE .129*** 1
SECTOR -.251*** -.122*** 1
AGE -.050** .228*** -.122** 1
CA .106*** -.428*** -.084*** -.014 1
CL -.027 -.095*** -.018 -.048** .084*** 1
DA -.077*** -.106*** .053** -.039** -.073*** .726*** 1 DA -.130*** -.014 .153*** -.087*** -.012 .090*** .102*** 1 GPM -.073*** -.013 .081*** -.038** -.008 .038** .034* .303** 1 OPM .030 .049** .035* .028 .062*** -.157*** -.185*** .025 .033* 1 NPM .036** .058*** .023 .031* .075*** -.150*** -.186*** .026 .024 .995*** 1 ROA .023 .042** .017 .006 .129*** -.222*** -.313*** -.040** -.005 .467** .455** 1 ROE .027 .008 .027 -.040** .035* .008 .002 -.207*** -.024 .120*** .110*** .278*** 1
***p<0.01;**p<0.05;*p<0.1
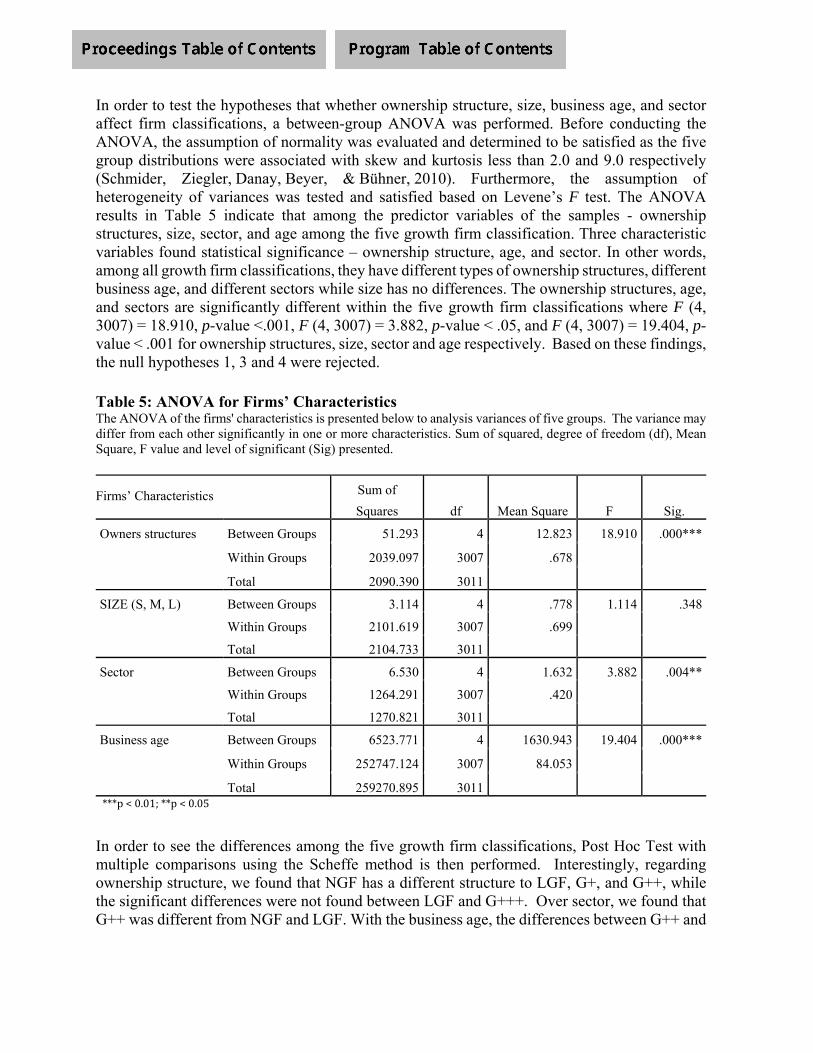
In order to test the hypotheses that whether ownership structure, size, business age, and sector affect firm classifications, a between-group ANOVA was performed. Before conducting the ANOVA, the assumption of normality was evaluated and determined to be satisfied as the five group distributions were associated with skew and kurtosis less than 2.0 and 9.0 respectively (Schmider, Ziegler, Danay, Beyer, & Bühner, 2010). Furthermore, the assumption of heterogeneity of variances was tested and satisfied based on Levene’s F test. The ANOVA results in Table 5 indicate that among the predictor variables of the samples - ownership structures, size, sector, and age among the five growth firm classification. Three characteristic variables found statistical significance – ownership structure, age, and sector. In other words, among all growth firm classifications, they have different types of ownership structures, different business age, and different sectors while size has no differences. The ownership structures, age, and sectors are significantly different within the five growth firm classifications where F (4, 3007) = 18.910, p-value <.001, F (4, 3007) = 3.882, p-value < .05, and F (4, 3007) = 19.404, p-value < .001 for ownership structures, size, sector and age respectively. Based on these findings, the null hypotheses 1, 3 and 4 were rejected. Table 5: ANOVA for Firms’ Characteristics The ANOVA of the firms' characteristics is presented below to analysis variances of five groups. The variance may differ from each other significantly in one or more characteristics. Sum of squared, degree of freedom (df), Mean Square, F value and level of significant (Sig) presented.
Firms’ Characteristics
Sum of
Squares df Mean Square F Sig.
Owners structures Between Groups 51.293 4 12.823 18.910 .000***
Within Groups 2039.097 3007 .678
Total 2090.390 3011
SIZE (S, M, L) Between Groups 3.114 4 .778 1.114 .348
Within Groups 2101.619 3007 .699
Total 2104.733 3011
Sector Between Groups 6.530 4 1.632 3.882 .004**
Within Groups 1264.291 3007 .420
Total 1270.821 3011
Business age Between Groups 6523.771 4 1630.943 19.404 .000***
Within Groups 252747.124 3007 84.053
Total 259270.895 3011 ***p<0.01;**p<0.05
In order to see the differences among the five growth firm classifications, Post Hoc Test with multiple comparisons using the Scheffe method is then performed. Interestingly, regarding ownership structure, we found that NGF has a different structure to LGF, G+, and G++, while the significant differences were not found between LGF and G+++. Over sector, we found that G++ was different from NGF and LGF. With the business age, the differences between G++ and

NGF, LGF and G+ were found which is similar to G+++ which found the be different from NGF, LGF, and G+.
The liquidity, leverage, and profitability of the firms are investigated through the ANOVA analysis, and if the significance of the variables is found, the Post Hoc Test is to perform. After the investigation of the firms' characteristics is observed, we later perform the assessment on liquidity ratios. From the Table xx, ANOVA analysis is employed to investigate the difference among the five growth firm classifications; we found that the liquidity, by which CA, CL, DA ratios are indicating, is statistically different (p-value < .05) among the groups. Post Hoc Test with multiple comparisons using the Scheffe method is then performed to explore the difference between the growth firm classifications. We reject the null hypothesis (H5) regarding the liquidity ratios. In other words, the results can be interpreted that these liquidity ratios are found to be different among all those growth firm classifications. Table 6: ANOVA for Liquidity Ratios The ANOVA of the firms’ liquidity ratios – Current Assets Ratio (CA), Current Liability Ratio (CL), and Debt to Asset Ratio (DA) are presented below to analysis variances of five groups. The variance may differ from each other significantly in one or more characteristics. Sum of squared, degree of freedom (df), Mean Square, F value and level of significant (Sig) presented.
***p<0.01;**p<0.05
The current asset ratio (CA) is the best ratio that indicates many areas of differences among the growth firm classifications. It is found that current asset of NGF is statistically different from LGF, G++, and G+++, while LGF is different from G++ and G+++. The G+ is also different from G++ and G+++. The current liability ratio (CL) is the second best to indicate the differences where G++ is found different from NGF; the G+++ was found to be different from any other groups. The debt to asset ratio (DA) is found the differences just between NGF and G++. Among the five growth firm classification, the G+++ and G++ were different from most of the other groups, especially when considering CA and CL ratios.
From the Table 7, ANOVA analysis is employed to investigate the difference among the five growth firm classifications; we found that the leverage, by which DE (debt-equity ratio) is a representative ratio, statistical different (p-value < .05) among the group. Post Hoc Test with multiple comparisons using the Scheffe method is then performed to explore the difference between the growth firm classifications. From this result, the null Hypotheses (H6) is rejected.
Sum of S
df Mean S
F Sig. CA Between Groups 4.438 4 1.109 18.897 .000***
Within Groups 176.529 3007 .059 Total 180.966 3011
CL Between Groups 2.978 4 .745 5.985 .000*** Within Groups 374.053 3007 .124 Total 377.031 3011
DA Between Groups 3.047 4 .762 2.776 .026** Within Groups 825.107 3007 .274 Total 828.155 3011
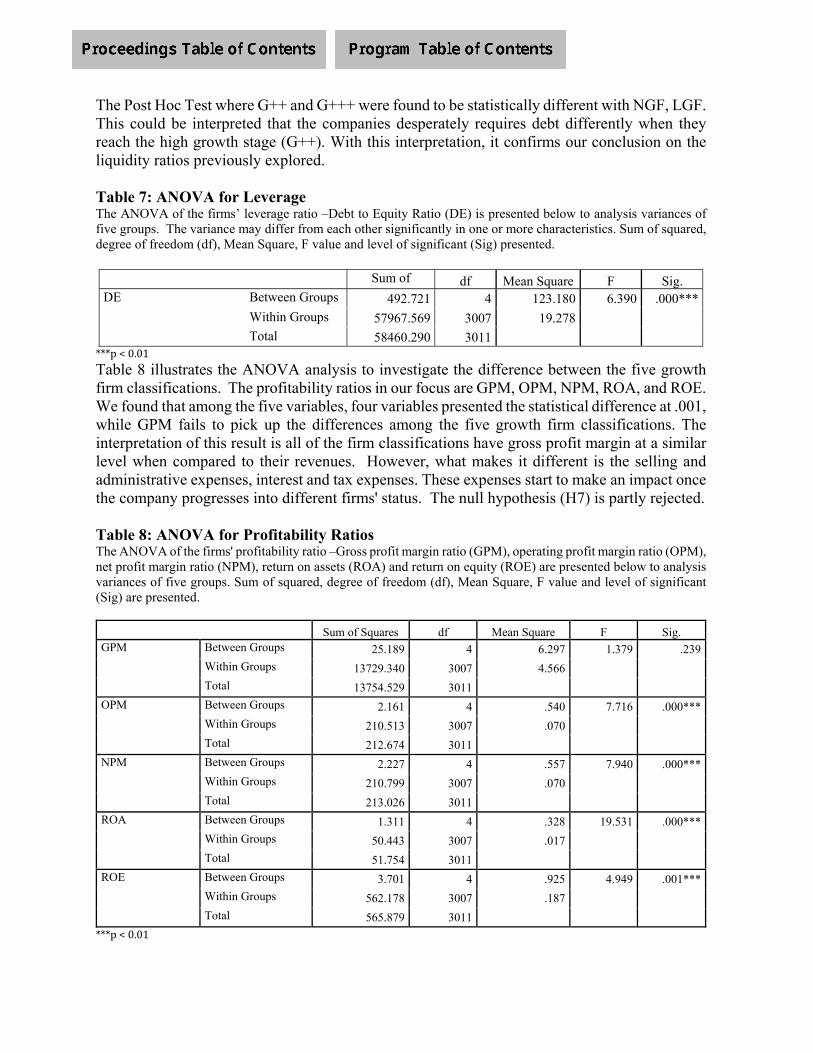
The Post Hoc Test where G++ and G+++ were found to be statistically different with NGF, LGF. This could be interpreted that the companies desperately requires debt differently when they reach the high growth stage (G++). With this interpretation, it confirms our conclusion on the liquidity ratios previously explored. Table 7: ANOVA for Leverage The ANOVA of the firms’ leverage ratio –Debt to Equity Ratio (DE) is presented below to analysis variances of five groups. The variance may differ from each other significantly in one or more characteristics. Sum of squared, degree of freedom (df), Mean Square, F value and level of significant (Sig) presented.
Sum of S
df Mean Square F Sig. DE Between Groups 492.721 4 123.180 6.390 .000***
Within Groups 57967.569 3007 19.278 Total 58460.290 3011
***p<0.01
Table 8 illustrates the ANOVA analysis to investigate the difference between the five growth firm classifications. The profitability ratios in our focus are GPM, OPM, NPM, ROA, and ROE. We found that among the five variables, four variables presented the statistical difference at .001, while GPM fails to pick up the differences among the five growth firm classifications. The interpretation of this result is all of the firm classifications have gross profit margin at a similar level when compared to their revenues. However, what makes it different is the selling and administrative expenses, interest and tax expenses. These expenses start to make an impact once the company progresses into different firms' status. The null hypothesis (H7) is partly rejected. Table 8: ANOVA for Profitability Ratios The ANOVA of the firms' profitability ratio –Gross profit margin ratio (GPM), operating profit margin ratio (OPM), net profit margin ratio (NPM), return on assets (ROA) and return on equity (ROE) are presented below to analysis variances of five groups. Sum of squared, degree of freedom (df), Mean Square, F value and level of significant (Sig) are presented.
Sum of Squares df Mean Square F Sig. GPM
Between Groups 25.189 4 6.297 1.379 .239
Within Groups 13729.340 3007 4.566
Total 13754.529 3011
OPM Between Groups 2.161 4 .540 7.716 .000***
Within Groups 210.513 3007 .070
Total 212.674 3011
NPM Between Groups 2.227 4 .557 7.940 .000***
Within Groups 210.799 3007 .070
Total 213.026 3011
ROA Between Groups 1.311 4 .328 19.531 .000***
Within Groups 50.443 3007 .017
Total 51.754 3011
ROE Between Groups 3.701 4 .925 4.949 .001***
Within Groups 562.178 3007 .187
Total 565.879 3011
***p<0.01

The Post Hoc Test is run to investigate the difference among the five growth firm classification regarding the OPM, NPM, ROA, and ROE. Regarding OPM and NPM, the NGF was found to be different from LGF, but not with G+, G++, and G+++. This means even the companies were classified to NGF, their performance (profitability) were similar to what G+, G++, and G+++ earned. Especially, when considering ROA (return on asset), it is found that the NGF was not statistically different from G+++. NGF has ROA different from another firm status, but such differences were not found between NGF and G+++.
Regression results
In order to test the hypothesis (H8) whether Profitability of the different growth firm’s classifications is statistically correlated to ownership structure, size, age, and financial ratios, correlated random effects regression analysis is employed. The regressions were run for each growth firm classification - NGF, LGF, G+, G++, and G+++. Four firm’s characteristics and four financial ratios were carefully hand-picked and entered to the model.
The results, regarding the influencing factors on return on assets (ROA), form our interesting conclusion. For the negative growth firm group (NGF), several variables were found to effect ROA statistically. The most influencing factor is the debt to asset ratio (DA) with the coefficient -0.099, at 1% significant level. DA ratio is negatively correlated to ROA. In other words, the larger the DA ratio, the low ROA. Current asset ratio (CA) and current liability (CL) are found to have positively correlated to ROA with the coefficient .087 and .086, at 1% significant level. We found that being Thai ownership companies are more promising than other nationality, while Japanese joint venture and other joint nationality joint venture did not illustrate any correlation to ROA of the negative growth firms (Thai, .025 coefficient, at 1% significant level). Being ‘small and medium-size’ is not beneficial to the negative growth companies (small firms with -.046 coefficient, medium with -.019 coefficient, at 1% significant level). Noted that all variables, but Japanese joint venture factor, are correlated to negative growth firms’ ROA.
For limited growth firms (LGF), CL ratio is the only variable that poses statistical significance to ROA (CL with coefficient -.326, at 1% significant level). The coefficient is presented the negative sign, meaning the reverse correlation to ROA of the LGF. The larger the CL ratio, the lower the ROA. While the companies that started to grow, debt becomes more critical and debt to asset ratio (DA) and current assets ratio (CA) are more significant and positive correlated to ROA of the growth firms (G+ and G++).
However, companies with high growth (G+++) is under several factors of pressure. To become a supper growth firm, interestingly being Thai or Japanese ownership does not positively correlate to ROA of such high growth firms. The study found that both Thai ownership and Japanese ownership have negatively correlated to ROA while being small, not medium or large, is positively correlated to ROA. Having high current asset and debt asset is positively correlated to ROA. This can be implied that the high growth firms are more desperate to increase liquidity (this is the same as the G++) and total liabilities are a primary source to have such liquidity. Age starts to become a positive factor to G+++ firms which mean older age is a good factor correlated to ROA even though with a small impact. This also reflects on NGF where age becomes negatively correlated to ROA. See Table 9.

Table 9: Correlated Random Effects Models for Return on Assets (ROA)
The table illustrates the variables that influence the changes in the ROA. Each of the dependents is divided into five different groups namely Negative Growth Firm (NGF), Limited Growth Firm (LGF), Growth Plus One (G+), Growth Plus Two (G++) and Growth Plus Three (G+++). Variables enter into the correlated random effects models are nationality (Thai, Japanese), Size (Small, Medium), Age, Current Asset Ratio (CA), Current Liability Ratio (CL), Debt to Asset Ratio (DA) and Debt to Equity Ratio (DE). The numbers of observations for each group are 1,492; 668; 236; 228 and 388, respectively. The number of each group are 373; 167; 59; 57 and 97.
***p<0.01;**p<0.05;*p<0.1
ROAVariable Coefficient z P>|z| Coefficient z P>|z| Coefficient z P>|z| Coefficient z P>|z| Coefficient z P>|z|
Thai | 0.025 2.55 0.006 *** 0.001 0.03 0.979 -0.062 -2.13 0.033 ** 0.039 1.67 0.095 * -0.042 -2.04 0.041 **
Japanese | 0.003 0.30 0.761 -0.016 -0.75 0.455 -0.040 -1.33 0.182 -0.016 -0.69 0.493 -0.057 -2.67 0.008 ***
Small | -0.046 -4.34 0.000 *** -0.030 -1.31 0.189 -0.011 -0.30 0.765 0.010 0.29 0.773 0.045 1.73 0.084 *
Medium | -0.019 -1.86 0.063 * -0.009 -0.40 0.693 -0.005 0.15 0.877 -0.016 -0.67 0.506 0.003 0.13 0.894Age | -0.001 -2.41 0.016 ** -0.001 -1.06 0.291 0.000 0.00 0.998 -0.002 -1.45 0.147 0.001 1.79 0.073 *
CA | 0.087 2.66 0.008 *** 0.128 1.42 0.156 0.043 0.51 0.611 0.212 2.72 0.006 ** 0.112 2.71 0.007 ***
CL | 0.086 5.52 0.000 *** -0.326 -3.13 0.002 *** 0.072 1.70 0.088 * -0.065 -0.89 0.374 -0.040 -0.80 0.425DA | -0.099 -9.77 0.000 *** 0.083 1.37 0.171 -0.241 -8.80 0.000 *** -0.180 -2.20 0.028 ** -0.112 -2.06 0.039 **
DE | 0.002 2.53 0.011 ** -0.002 -0.89 0.374 0.002 0.73 0.464 -0.001 -0.62 0.537 0.001 0.90 0.369_cons | 0.100 5.78 0.000 *** 0.084 2.18 0.029 ** 0.126 2.12 0.034 ** 0.135 3.23 0.001 *** 0.044 1.32 0.185
R-sq Overall 0.334 0.066 0.533 0.324 0.137Prob > chi2 0.000 0.001 0.000 0.000 0.000
G+++NGF LGF G+ G++

DISCUSSION AND CONCLUSION
Prior evidence is, however, based on studies that investigated a limited number of industries, excluded small firms, were based on highly aggregated data, and applied cutoff points. In this article, we examined the distribution of HGFs across industries, using a comprehensive, firm-level data set comprising limited liability firms in Thailand during the period 2013 - 2016. In contrast to previous studies, our analysis covered firms of all sizes and from all industries. We also used the model capable of using both time-variant and time-invariant as the dependent variable. In this paper we have analyzed 753 companies across three industry sectors in Thailand namely manufacturing, wholesales & retails, and services. We used data taken from 2013 – 2016 of the companies situated in the business clusters in Bangkok, Pathumthani, Chachoengsao, Chonburi, Ayudhaya, and Rayong. We have restricted in classification the samples to several firm's characteristics – by major shareholder nationality, size, sector, and age. In this article, we have distinguished firms into five classifications based on the level of its growth; NGF (negative growth firm), LGF (limited growth firm), G+ (growth plus one), G++ (Growth plus two and G+++ (Growth plus three). Our primary interest is to investigate firm’s characteristics that might potentially present the differences between groups such as factors of ownership structure (in hypothesis 1), size (hypothesis 2), sector (hypothesis 3) and business age (hypothesis 4). We also investigate the liquidity (hypothesis 5), leverage (hypothesis 6), profitability (hypothesis 7), and investigate factors that might influence firms’ performance in terms of ROA (hypothesis 8). The findings of this article bring us to reject null hypotheses 1, 3 and 4 which can be interpreted that different ownership structures, different sectors, and different ages presented in each growth group, while size does not matter between each group. We also reject the null hypotheses 5, 6 and 7 regarding the liquidity, leverage and profitability ratios. In other words, each group classification has different liquidity, leverage and profitability ratios. The regression models are developed from the testing of hypothesis 8. Five different models are drowned from this article to present the factors that might influence the return of assets (ROA) of each group.
ROA_NGF = 0.1 + .025Thai – 0.046 Small – 0.019 Medium – 0.001 Age + 0.087 CA + 0.086 CL – 0.099 DA + 0.002 DE
|Equation (1)
ROA_LGF = 0.087 – 0.326 CL |Equation (2) ROA_G+ = 0.126 – 0.062 Thai + 0.072 CL – 0.241 DA |Equation (3) ROA_G++ = 0.135 + 0.039 Thai +0.212 CA – 0.180 DA |Equation (4) ROA_G+++ = – 0.042 Thai – 0.057 Japanese + 0.045 Small + 0.001 Age + 0.112 CA –
0.112 DA |Equation (5)
These five models illustrate the variable that influences ROA for each growth group classification. We found that several variables correlate to ROA of NGF (Equation 1) while one variable (CL) influence the ROA of LGF, on three variables (Thai, CL, and DA) influence ROA of G+ and G++ respectively. DA ratio negatively affects the ROA of all group classification. From the result, being Thai and Japanese major shareholders can negatively influence ROA of G+++, and G+, while small firms have a positive correlation to ROA of G+++.

From recent studies have demonstrated that small fast-growing firms generate most job creation and economic growth. HGFs have therefore received an increasing attention from both policymakers and researchers. A common policy recommendation is that policymakers should target industrial policies towards potential fast-growing firms such as target to high-tech industries, i.e., industries with high R&D intensity. The strategy focusing on the fast-growing industries might be different and more focused in order to support them to be even more profitable in a longer period of time. The strategy focusing on the lower growth firms or negative growth firms may require more intensive, innovative, and technical support. The policymakers may need to assist these companies to evolve and stay competitive. The strategies for each group classification should be different depending on their requirement. Like most studies, this article faces some challenges. The first challenge is related to the methodology of defining HGFs, which we emphasized in this article. We are more or less ambiguous of HGFs definition and identification, as different research questions require different definitions of firm growth and thus different definitions of HGFs. Exploring the new and reasonable definition and identification is required from future research. A second major challenge is to understand whether or not the share of HGFs differ across sectors, age, and nationality. The previous study has remained a question that HGFs are not more common in high-tech industries – Why is that? As we have an assumption that joint venture companies would have less concentration compared to those pure or major Thai ownership companies, this may due to the knowledge spillover. However, this article cannot provide confirmation. Thirdly, we do not know much in detail about the internal features of HGFs. High-growth events are periods of intense change. They can incur due to having new opportunities in the market, due to promotion champagne, due to some sales strategies to boost sales volume in festival seasons, or many other reasons but also periods of stress, flux, and uncertainty. High growth seems not to be persistent over time. We have to admit that many important characteristics of HGFs remain unknown. Some may be superior to others. Fourth, would it be difficult empirically to predict which firms will grow, and which firms will not? These questions are awaiting future research. This article has some policy implications. The results suggest that being Thai and Japanese major shareholders has negative correlation to the ROA of high growth firms. Additionally we found that being small has positively influencing ROA of the companies (Equation 5), while this is also true as being medium-sized or large-sized influence the ROA of the negative growth firms (Equation 1). If small firms could survive and sustain in business in the long run, through their experience and other advantages of being small firms, the smaller size would influence the companies to have positive ROA. Policymakers should target to assist the firms with the desire and potential to grow. These findings have implications for future research in this area. In particular, case study based work on rapidly growing firms may yield more insights, and there seems relatively little evidence on the physical accommodation of high-growth firms. Further quantitative work using larger samples may also gain from considering which types of high-growth firms find different obstacles significant. For example, high-tech firms may face particular barriers which are different from others. Furthermore, other research along these lines should consider other definition of HGF and should use different measures of high growth.
REFERENCES
Acs, Z. J., & P. Mueller (2008), Employment effects of business dynamics: mice, gazelles and Elephants. Small Business Economics, 30, 85–100.
Ahiawodzi, A. K., & Sackey, F.G. (2010). Determinants of Credit Rationing to the Private Sector in Ghana. African Journal of Business and Management, 7(38), 3864–3874.
Ahmad, R. (2016). A Study of Relationship between Liquidity and Profitability of Standard Charter Bank Pakistan: Analysis of Financial Statement Approach. Global Journal of Management and Business Research, 16 (1), 76-82.
Ahn, S., Denis, D.J., & Denis, D.K. (2006). Leverage and investment in diversified firms. Journal of Financial Economics. 79(2), 317-337.
Aivazian, V.A., Ge, Y. & Qiu, J.P. (2005). The impact of leverage on firm investment: Canadian evidence. Journal of Corporate Finance, 11(1-2), 277-291.
Ali, R., & Umer, F. (2017). Determinants of Return on Equity: Evidence from the Cement Industry of Pakistan. KASBIT Business Journal. 10 (Special I), 106-119.
Almus, M. (2002). What characterizes a fast-growing firm? Applied Economics, 34, 1497–1508. Autio, E., Kronlund, M., & Kovalainen, A. (2007). High-Growth SME Support Initiatives in
Nine Countries: Analysis, Categorization, and Recommendations. Publications 1/2007 Industries Department. ISSN 1459-9376.
Autio, E., Arenius, P., & Wallenius, H. (2000). Economic impact of gazelle Firms in Finland. Working Papers Series. Helsinki University of Technology, Institute of Strategy and International Business, Helsinki.
Beaver, W. (1966). Financial ratios as predictors of failure. Empirical research in accounting: Selected studies. Journal of Accounting Research, 4, 71–111.
Beard, D. W., & Dess, G. C. (1981). Corporate −level strategy, business- level strategy and firm performance. Academic Management Journal, 24(4), 78-99.
Brown, C., Haltiwanger, J., & Lane, J. (2006). Economic Turbulence – Is a Volatile Economy Good for America? University of Chicago Press: Chicago.
Birch, D. L. (1979). The Job Generation Process. MIT Program on Neighborhood and Regional Change. Massachusetts Institute of Technology: Cambridge, MA.
Birch, D. L., & Medoff, J. (1994). Gazelles. In L.C. Solmon & A.R. Levenson, (Eds.), Labor Markets, Employment Policy and Job Creation (pp. 159-167). Boulder, CO and London: Westview Press.
Bravo-Biosca, A. (2010). Growth dynamics: exploring business growth and contraction in Europe and the US. Research Report. NESTA: London, UK.
Brîndescu-Olariu, D. (2016). Bankruptcy prediction based on the debt ratio. Theoretical and Applied Economics, 2(607), 145-156.
Bru¨derl, J., & P. Preisendo¨rfer. (2000). Fast-growing businesses: empirical evidence from a German study. International Journal of Sociology, 30(3), 45–70.
Chamberlain, G. (1982). Multivariate Regression Models for Panel Data. Journal of Econometrics, 18, 5–46.
Chamberlain, G. (1984). Panel Data. Handbook of Econometrics, 2, 1247–1318. Chappell, W. F., Mwangi, S.K., & Walter, J.M. (1990). A Poisson probability model of entry
and market structure with an application to U.S. industries during 1972–77. Southern Economic Journal, 56, 918–927.
Chen, Y.H. (1995). A New Matching Condition for Nonlinear Robust Control Design. ASME. J. Dyn. Sys., Meas., Control. 117(4):453-458. doi:10.1115/1.2801100.

Coad, A., Daunfeldt, S., Hölzl, W., Johansson, D., & Nightingale, P. (2014). High-growth firms: introduction to the special section. Industrial and Corporate Change, 23(1), 91–112. https://doi.org/10.1093/icc/dtt052
Cultrera, L., & Brédart, X. (2016). Bankruptcy prediction: the case of Belgian SMEs. Review of Accounting and Finance, 15(1), 101-119.
Daunfeldt, S., Elert, N., & Johansson, D. (2013). The economic contribution of high growth firms: do policy implications depend on the choice of growth indicator? Journal of Industry, Competition and Trade, 14(3), 337-365.
Daunfeldt, S., Johansson, D., & Halvarsson, D. (2015). Using the Eurostat-OECD definition of high-growth firms: a cautionary note. Journal of Entrepreneurship and Public Policy, 4(1), 50-56. https://doi.org/10.1108/JEPP-05-2013-0020
Daunfeldt, S., Elert, N., & Johansson, D. (2016). Are high-growth firms overrepresented in high-tech industries?, Industrial and Corporate Change, 25(1), 1–21, https://doi.org/10.1093/icc/dtv035
Davidsson, P., & Delmar, F. (1997). High-growth firms: characteristics, job contribution and method observations. In RENT XI Conference, 27 - 28 November 1997, Mannheim, Germany.
Davidsson, P. & Henrekson. M. (2002). Determinants of the prevalence of start-ups and high-growth firms. Small Business Economics, 19(2), 81–104.
Deakin, E. B. (1972). A Discriminant Analysis of Predictors of Business Failure. Journal of Accounting Research, 10(1), 167-179 doi: 10.2307/2490225
Delen, D., Kuzey, C., & Uyar, A. (2013). Measuring firm performance using financial ratios: A decision tree approach. Expert Systems with Applications, 40(10), 3970-3983.
Delmar, F., & Davidsson, P. (1998). A taxonomy of high-growth firms. in P. D. Reynolds and W. D. Bygrave (eds), Frontiers of Entrepreneurship Research. Babson College: Wellesley, MA, pp. 399–413.
Delmar, F., Davidsson, P., & Gartner, W.B. (2003). Arriving at the high-growth firm. Journal of Business Venturing, 18(2), 189–216.
Demerjian, P. R., & Owens, E. L. (2016). Measuring the probability of financial covenant violation in private debt contracts. Journal of Accounting and Economics, 61(2), 433-447.
Ding, Y., Brackenbury, W.J., Onganer, P.U., Montano, X., Porte, L.M., & Djamgoz, B.A. (2008). Epidermal growth factor upregulates motility of Mat-LyLu rat prostate cancer. Journal of cellular physiology, 215(1). 77-81.
Du, J., & Temouri, Y. (2015). High-growth firms and productivity: evidence from the United Kingdom. Small Business Economics, 44(1), 123. https://doi.org/10.1007/s11187-014-9584-2
Dwyer, B., & Kotey, B. (2016). Identifying high growth firms: Where are we? Journal of Management and Organization, 22(4), 457-475. doi:http://dx.doi.org/10.1017/jmo.2015.51
European Commission. (2010). Europe 2020: A Strategy for Smart, Sustainable and Inclusive Growth: Communication From the Commission. European Commission Publications Office: Brussels, Belgium.
Eurostat-OECD. (2007). Eurostat-OECD Manual on Business Demography Statistics. Office for Official Publications of the European Communities: Luxembourg.
Faris, N. A. (2012). Debt Ratio Analysis and Firm Investment: Evidence from Jordan. International Journal of Economics and Financial Issues, 2(1), 21-26.

Feng, C. M., & Wang, R. T. (2000). Performance evaluation for airlines including the consideration of financial ratios. Journal of Air Transport Management, 6(3), 133-142.
Gabriele, S., & Giuseppe, L. L. (2013). Identifying High Growth SMEs Through Balance Sheet Ratios. Available at SSRN: https://ssrn.com/abstract=2207550 or http://dx.doi.org/10.2139/ssrn.2207550
Geroski, P. A. (1995). What do we know about entry?, International Journal of Industrial Organization, 13, 421–440.
Hakioui, M. E., & Louitri, A. (2017). High-Growth SMEs: A Specific Research Object. International Journal of Service Science, Management, Engineering, and Technology (IJSSMET), 8(2), 1-11. doi:10.4018/IJSSMET.2017040101
Halabisky, D., Dreessen, E., & Parsley, C. (2006). Growth in firms in Canada, 1985-1999. Journal of Small Business and Entrepreneurship, 19(3), 255–268.
Henrekson, M., & Johansson, D. (2010). Gazelles as job creators: a survey and interpretation of the evidence. Small Business Economics, 35, 227–244.
Ho¨lzl, W. (2014). Persistence, survival and growth: a closer look at 20 years of fast-growing firms in Austria. Industrial and Corporate Change, 12(1). 110 A. Coad et al. Downloaded from https://academic.oup.com/icc/article-abstract/23/1/91/666544
Jin, Z., Yang, H., & Yin, G. (2015). Optimal debt ratio and dividend payment strategies with reinsurance. Insurance: Mathematics and Economics, 64, 351-363.
Johansson, D. (2005). The turnover of firms and industry growth. Small Business Economics, 24(5), 487–495.
Julien, P.A. (2000). HIGH GROWTH SMES: EXPLANATORY FACTORS. Investigaciones Europeas de Dirección y Economía de la Empresa, 6(2), 39-56.
Kabajeh, M., Said, M. A., & Dahmash, F.N., (2012). The Relationship between the ROA, ROE and ROI Ratios with Jordanian Insurance Public Companies Market Share Prices. International Journal of Humanities and Social Science, 2(11), 115-120.
Karnawi, K. (2017). Analysis of the effect of return on equity (ROE) and debt to equity ratio (Der) on stock price on cement industry listed in Indonesia stock exchange (idx) in the year of 2011-2015. Journal of business and management, 19(5), 66-76.
Kirchhoff, B., & Phillips, B. (1988). The Effect of Firm Formation and Growth on Job Creation in the United States. Journal of Business Venturing, 3, 261-272.
Lakshmi, T. M., Martin, A., & Venkatesan, V. P. (2016). A Genetic Bankrupt Ratio Analysis Tool Using a Genetic Algorithm to Identify Influencing Financial Ratios. IEEE Transactions on Evolutionary Computation, 20(1), 38-51.
Lee, N. (2014). What holds back high-growth firms? Evidence from UK SMEs. Small Business Economics, 43(1), 183-195. Retrieved from http://www.jstor.org/stable/43553740
Lin, F., Liang D., & Chen, E. (2011). Financial ratio selection for business crisis prediction. Expert Systems with Applications, 38(12), 15094-15102.
Littunen, H., & Tohmo, T. (2003). The high growth in new metal-based manufacturing and business service firms in Finland. Small Business Economics, 21(2), 187–200.
Mertens, A.C., Liu Q., Neglia J.P., Wasilewski, K., Leisenring, W., Armstrong, G.T., Robison, L.L., & Yasui, Y. (2008). Cause-specific late mortality among 5-year survivors of childhood cancer: The Childhood Cancer Survivor Study. Journal of the National Cancer Institute, 100 (19), 1368-1379. https://doi.org/10.1093/jnci/djn310
McKelvie, A., & Wiklund, J. (2010). Advancing firm growth research: a focus on growth mode instead of growth rate. Entrepreneurship Theory and Practice, 34(2), 261–288.

Mintzberg, H. (1997). The structuring organizations: A synthesis of the research. Faculty Management, 2, 38-57.
Monica, T. (2014). Profitability Analysis (A comparative study of SAIL & TATA Steel). Journal of Economics and Finance, 3(2), 19-22.
Moreno, A. M., & Casillas, J.C. (2007). High-growth SMEs versus non-high-growth SMEs: a discriminant analysis. Entrepreneurship & Regional Development, 19(1), 69-88. DOI: 10.1080/08985620601002162
Morris, M.H., & Trotter, J. D. (1990). Institutionalizing entrepreneurship in a large company: A case study at AT&T. Industrial Marketing Management, 19(2), 131-139. ISSN 0019-8501. https://doi.org/10.1016/0019-8501(90)90037-V.
Mundlak, Y. (1978). On the Pooling of Time Series and Cross Section Data. Econometrica, 46, 69–85.
Nadya, M., & Isrochmani, M. (2017). The effect of financial ratios on firm value in the food and beverage sector of the idx. Journal of Business and Management, 6(2), 214-226.
Navarro, J., Casillas, J., & Barringer, B. (2012). Forms of growth: How SMEs combine forms of growth to achieve high growth. Journal of Management & Organization, 18(1), 81-97. doi:10.1017/S1833367200001085
Nordic Council of Ministers. (2010). Nordic Entrepreneurship Monitor. Nordic Council of Ministers: Copenhagen, Denmark.
Office of Small and Medium Enterprises Promotion (OSMEP). (2016). Annual Report 2016. Retrieved from http://www.sme.go.th/th/download.php?modulekey=31
Office of Small and Medium Enterprises Promotion (OSMEP). (2017). Executive Summary White Paper on Small and Medium Enterprises 2017. Retrieved from file:///C:/Users/Windows/Downloads/3_Executive_summary__Eng_1.pdf
Ohlson, J. A. (1980). Financial ratios and the probabilistic prediction of bankruptcy. Journal of Accounting Research, 18 (1) 109-131.
Osteryoung, J., & Constand, R. L., & Nast, D. (1992). Financial ratios in large public and small private firms. Journal of Small Business Management, 30(3), 35.
Papke, L.E., & Wooldridge, J. M. (2008). Panel Data Methods for Fractional Response Variables with an Application to Test Pass Rates. Journal of Econometrics, 145, 121-133.
Per, D., & Frederic, D. (1997). High-growth firms: characteristics, job contribution and method observations. In RENT XI Conference, 27 - 28 November.
Rai, A., Patnayakuni R., & Patnayakuni, N. (1997). Technology investment and business performance. Communications of the ACM, 40(7), 89-97.
Rao, M. K. (2016). Spel Analysis of Financial Statement of Selected Public Sector Steel Manufacturing Companies-India. Indian Journal of Commerce and Management Studies, 7(3), 15-30.
Rojsurakitti, T. (2015). SMEs High Growth in Thailand. Archive Research Journal, 3(1), 209-217.
Samad, A., & Hassan, M. K. (1999). The performance of Malaysian Islamic bank during 1984-1997: An exploratory study. International Journal of Islamic Financial Services, 1(3), 1-14.
Schmider, E., Ziegler, M., Danay, E., Beyer, L., & Buehner, M. 2010). Is It Really Robust?. Methodology. European Journal of Research Methods for the Behavioral and Social Sciences, 6, 147-151. 10.1027/1614-2241/a000016.

Shaonan T., & Yan Y. (2017). Financial Ratios and Bankruptcy Predictions: An International Evidence. International Review of Economics and Finance, 51, 510–526.
Sharma, M. P. G., & Kaur, M. R. P. (2016). Working Capital Management and Its Impact on Profitability: A Case Study of Bharti Airtel Telecom Company. Imperial Journal of Interdisciplinary Research, 2(3), 265-271.
Smallbone, D., Leig, R., & North, D. (1995). The characteristics and strategies of high growth SMEs. International Journal of Entrepreneurial Behavior & Research, 1(3), 44-62. https://doi.org/10.1108/13552559510100657
Spearot, I. C. (2012). Firm heterogeneity, new investment and acquisitions. Journal of Industrial Economics, 60(1), 1–45.
Terdpaopong, K., & Hovey, M. (2013). Financial Uniqueness and Predictive Model for Financially Distressed, Listed Chinese SMEs. Journal of International Management Studies, 13(1), 21-36.
Terdpaopong, K., & Mihret, D. G. (2011). Modelling SME credit risk: Thai empirical evidence. Small Enterprise Research, 18(1), 63-79.
Wooldridge, J. M. (2002), Econometric Analysis of Cross Section and Panel Data. MIT Press: Cambridge, MA.
Yuan, Y. (2006). The state of competition of the Chinese banking industry. Journal of Asian Economics, 17, 519-534.
Zmijewski, M. E. (1984). Methodological Issues Related to the Estimation of Financial Distress Prediction Models. Journal of Accounting Research. 22, 59-82. doi: 10.2307/2490859
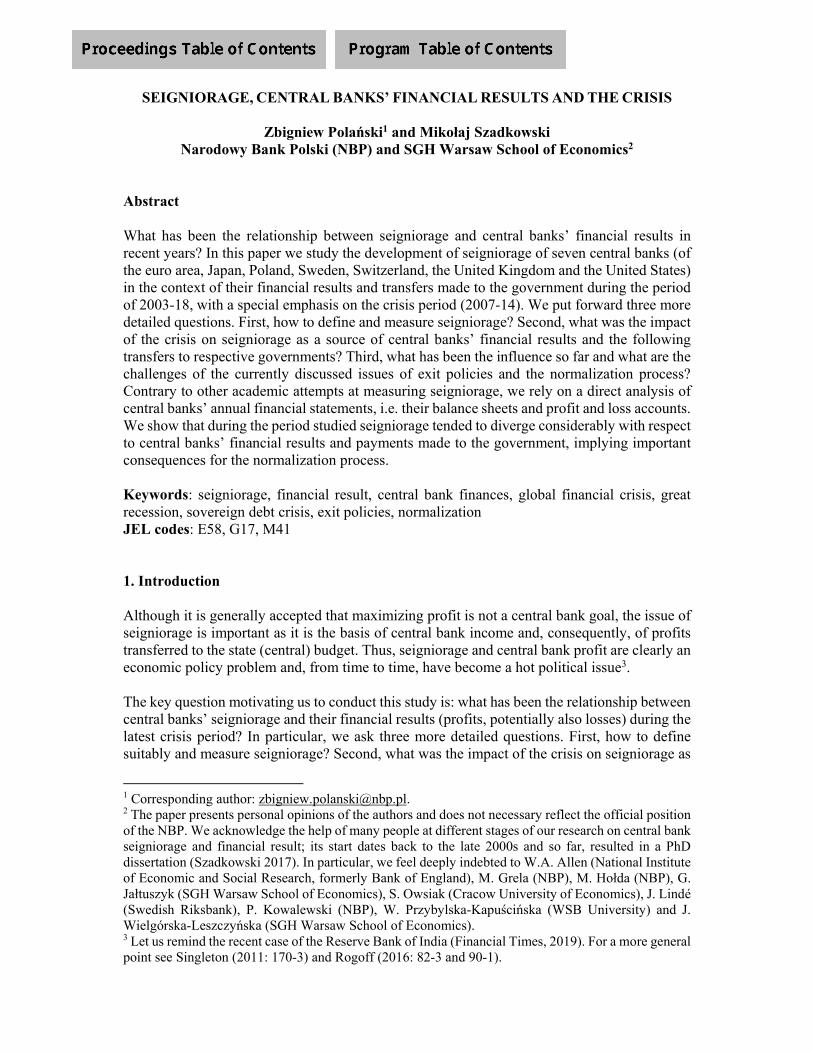
SEIGNIORAGE, CENTRAL BANKS’ FINANCIAL RESULTS AND THE CRISIS
Zbigniew Polański1 and Mikołaj Szadkowski Narodowy Bank Polski (NBP) and SGH Warsaw School of Economics2
Abstract What has been the relationship between seigniorage and central banks’ financial results in recent years? In this paper we study the development of seigniorage of seven central banks (of the euro area, Japan, Poland, Sweden, Switzerland, the United Kingdom and the United States) in the context of their financial results and transfers made to the government during the period of 2003-18, with a special emphasis on the crisis period (2007-14). We put forward three more detailed questions. First, how to define and measure seigniorage? Second, what was the impact of the crisis on seigniorage as a source of central banks’ financial results and the following transfers to respective governments? Third, what has been the influence so far and what are the challenges of the currently discussed issues of exit policies and the normalization process? Contrary to other academic attempts at measuring seigniorage, we rely on a direct analysis of central banks’ annual financial statements, i.e. their balance sheets and profit and loss accounts. We show that during the period studied seigniorage tended to diverge considerably with respect to central banks’ financial results and payments made to the government, implying important consequences for the normalization process. Keywords: seigniorage, financial result, central bank finances, global financial crisis, great recession, sovereign debt crisis, exit policies, normalization JEL codes: E58, G17, M41 1. Introduction Although it is generally accepted that maximizing profit is not a central bank goal, the issue of seigniorage is important as it is the basis of central bank income and, consequently, of profits transferred to the state (central) budget. Thus, seigniorage and central bank profit are clearly an economic policy problem and, from time to time, have become a hot political issue3. The key question motivating us to conduct this study is: what has been the relationship between central banks’ seigniorage and their financial results (profits, potentially also losses) during the latest crisis period? In particular, we ask three more detailed questions. First, how to define suitably and measure seigniorage? Second, what was the impact of the crisis on seigniorage as
1 Corresponding author: [email protected]. 2 The paper presents personal opinions of the authors and does not necessary reflect the official position of the NBP. We acknowledge the help of many people at different stages of our research on central bank seigniorage and financial result; its start dates back to the late 2000s and so far, resulted in a PhD dissertation (Szadkowski 2017). In particular, we feel deeply indebted to W.A. Allen (National Institute of Economic and Social Research, formerly Bank of England), M. Grela (NBP), M. Hołda (NBP), G. Jałtuszyk (SGH Warsaw School of Economics), S. Owsiak (Cracow University of Economics), J. Lindé (Swedish Riksbank), P. Kowalewski (NBP), W. Przybylska-Kapuścińska (WSB University) and J. Wielgórska-Leszczyńska (SGH Warsaw School of Economics). 3 Let us remind the recent case of the Reserve Bank of India (Financial Times, 2019). For a more general point see Singleton (2011: 170-3) and Rogoff (2016: 82-3 and 90-1).

2
a source of central banks’ financial results and the following transfers to respective governments (vis-à-vis the preceding period and the one following the crisis)? Third, what has been the impact so far and what are the challenges for the currently debated exit policies and the ongoing attempts at the normalization process? By the “crisis period” we mean the years 2007-14, however, we also study the preceding period and the post-crisis one. In the analysis, the years 2003-18 are divided in three sub-periods, albeit – as we shall see – many individual national peculiarities exist with respect to periodization. The three sub-periods are: (1) the years before the crisis (end of the “great moderation”), i.e. until 2006, (2) the crisis period (“global financial crisis”, “great recession” and the euro area “sovereign debt crisis”), i.e. the years 2007-14, and (3) the post-crisis period (attempts at “exit policies” and “normalization”), i.e. since 2015. We study the performance of seven central banks: five with a global reach (i.e. the US Federal Reserve System, the Eurosystem, the Bank of Japan, the Bank of England and the Swiss National Bank), and two institutions from smaller open economies (i.e. the Swedish Riksbank as a representative of a highly advanced country and the National Bank of Poland (NBP) as a representative of a highly successful converging economy). The novelty of the paper stems from the approach applied to calculating seigniorage, which – contrary to other academic attempts at measuring it – is based on a direct analysis of central banks’ annual financial statements, i.e. their balance sheets and profit and loss accounts (income statements). By means of two variants (options) of the adopted method of calculating seigniorage, we show that during the period studied it tended to diverge considerably with respect to central banks’ financial results and payments made to the government. According to the first variant, seigniorage continued to be the basis for both; this was, however, not entirely the case according to the second variant used. Our results show that in the period under consideration, seigniorage understood as above (both variants) typically amounted to less than 0.5 per cent of current GDP. Throughout the crisis and the implementation of quantitative easing policies, central banks’ balance sheets expansion was usually accompanied by a considerable, but declining, as a ratio of their balance sheets, increase in cash issuance. As a result, there was no above-average increase in seigniorage (especially in the first variant of estimates). However, financial results of many central banks during (and after) the crisis increased considerably. Consequently, remittances to the state budget also increased, although they varied significantly due to different policies towards central bank profit distribution. We estimate that the Fed and the Eurosystem have been the most protected against recording negative interest income during the normalization process among the analyzed central banks conducting unconventional monetary policies. The rest of the paper is organized as follows. The next two sections set the scene for our empirical research. Section 2 shortly discusses different notions of seigniorage and proposes the definition used in the remainder of the paper; the concept of seigniorage is also placed in a wider context of central bank financial result and finances. In Section 3 the sample of central banks to be studied is presented together with the time period to be covered with discussion concerning its sub-periods and individual countries’ idiosyncrasies; here we also operationalize the theoretical concept of seigniorage in line with our needs and possibilities (data access). Sections 4-6 present and discuss our empirical findings. Section 4 analyzes the impact of unconventional monetary policies on seigniorage and central banks’ financial results, while
3
Section 5 discusses the role of seigniorage in central banks’ financial results and transfers to governments during the crisis. Section 6 concentrates on the potential impact of exit policies and the normalization process on seigniorage and central banks’ financial results. Section 7 summarizes the findings and concludes. The main body of the paper is followed by four appendixes which provide evidence additional to the core narrative of the text. 2. Seigniorage, financial result and central bank finances There is no one generally accepted, universal definition of seigniorage. In fact, the history of money and the evolution of money-issuing mechanisms as well as banking, is also the history of its understanding. Thus, let us only shortly review here some exemplary concepts of seigniorage from fiat money issuance, leaving a larger survey for Appendix 1. The most comprehensive concept of seigniorage was proposed by M.J.M. Neumann (Neumann 1992; Neumann 1996). His definition of seigniorage includes all financial inflows resulting from the issuance of money (understood as an increase in monetary base) and the additional benefits associated with the net assets acquired against the money issued, e.g. interest income. The beneficiary of seigniorage is the entire state sector (both the government and the central bank). A. Drazen presented a similar comprehensive concept of seigniorage income (Drazen 1985). Under this approach income also relates to two sources: growth in the volume of the monetary base and the income from domestic and foreign net assets held by both the government and the central bank. However, in contrast to Neumann’s approach, only part of income is regarded as seigniorage, as an increase in net assets ensuring that they maintain their permanent share in national income is excluded from seigniorage. In turn, the concept of so-called “monetary seigniorage” refers only to the increase in the volume of the monetary base (Friedman 1971; Fischer 1982; Cukierman et al. 1990; Cukierman 1992: 47). On the other hand, the concept of seigniorage understood as an “inflation tax” perceives the benefits of the central bank (but also the government) in the loss of purchasing power of money (monetary base) (Keynes 1923: 42). The opportunity cost of holding money approach considers another perspective as it deals with the revenues (interest) obtained from assets acquired against money issue which simultaneously are potential costs borne by interest-free money-holders (Bailey 1956, Phelps 1973). The notions of so-called “fiscal seigniorage”, i.e. central bank’s financial result (Bofinger 2001: 371-2; Hochreiter and Rovelli 2002) or simply the payment made to the government by the central bank (Cukrowski 2003: 119; Wernik 2011: 49-50), deal with income on the central bank’s net assets. While the beneficiary of the first of these two concepts of seigniorage is initially the central bank, in the case of the second it is directly the government. Let us observe that most of these definitions abstract from the topic of costs (expenses) related to money production while they often define money as “monetary base (base-money)”, i.e. the sum of cash (currency) and commercial banks’ funds in their accounts with the central bank (the latter item in monetary theory is usually called “reserves”). From the macro viewpoint such an approach is to some extent understandable as under a fiat monetary system, the costs of money production can be considered meaningless from the national accounts perspective. On the other hand, from a practical point of view, commercial banks’ reserves can be easily turned
4
into cash. Furthermore, the assumed non-remuneration of commercial banks’ reserves in the central bank puts them on equal footing with cash, a non-interest-bearing financial asset. Until quite recently both cash and reserves were non-remunerated central bank liabilities. This has, however, changed with the introduction by some central banks of remuneration on required reserves in the 1980s and the remunerated standing deposit facility in the Eurosystem’s framework in 1999 (Bindseil 2004: 137). Subsequently, their generalized acceptance by many other central banks followed, together with the later practice – to be discussed in the next section, of penalizing by negative nominal interest rates commercial banks’ funds deposited with the central bank. Consequently, these reserves became virtually identical to deposits issued by commercial banks to non-bank customers, the difference being mainly in their risk profile (reserves in a central bank are as safe as cash). Nevertheless, from the point of view of seigniorage accounting the situation has changed considerably. In the case of positive interest rates on reserves, interest rate expenses by the central bank would have to be considered as an additional cost of money creation, while in the case of negative rates they are a source of central bank interest income, which is, however, difficult to consider as arising from money creation. Furthermore, if we were to acknowledge that commercial banks’ deposits with the central bank and the ones issued to their non-bank clients are almost identical in nature, this would lead to a logical conclusion that the last also generate seigniorage, since non-bank customers’ deposits are regarded as money (in the sense of monetary aggregates)4. Although the latter is obviously the case (as it is the entire banking system which ultimately generates modern money), we follow a conservative approach when it comes to seigniorage. Given the above arguments we are convinced that seigniorage creation should be tied to central bank monopoly on cash, i.e. the creation of the legal tender of the country (monetary area)5. Thus, we return to the original meaning of seigniorage as an income from the issuance of physical money (initially full-bodied coins, over time – paper currency). In other words, for us, as for all – to our knowledge – modern central banks6, the ultimate source of seigniorage is the issuance of cash, i.e. the legal tender of the jurisdictions in which central banks operate. Consequently, we adopt a cash-based definition of seigniorage. Since in this paper we relate seigniorage to financial results we cannot also abstract from the expenses incurred by central banks from cash issuance, particularly given that their reduction continues to be a major challenge for many monetary authorities7. Therefore, our cash-based definition of seigniorage can be written in the following way: 𝑆 𝐼𝐴 𝐸 (1)
4 Interestingly, the fact that modern seigniorage is created by both central banks and commercial banks is rarely recognized – exceptions are for example Baltensperger and Jordan (1997) and Arby (2006). 5 In addition, if we were to assume that commercial banks generate seigniorage gains, we would have to consider its allocation to banks’ net equity, payments to the shareholders of the banks (Arby 2006: 5-6) and at least part of the taxes paid by these institutions to the state as a transfer of seigniorage. This would create further problems in estimating the part of the tax flow resulting from “commercial banks’ seigniorage”. 6 See an overview of concepts of seigniorage as defined by central banks in Table 1A.2 (Appendix 1). 7 Especially with respect to the issuance of smaller denomination coins as their production costs are often above their face value. It is also worth noting that for commercial banks, the use of cash is a costly activity, and market forces in many cases result in their motivation for reducing its usage.

5
where: S – seigniorage, IA – income on assets against central bank liabilities in the form of banknotes and coins in circulation (cash), E – expenses of a central bank resulting from the issue of cash. In short, equation (1) means that seigniorage is simply net income from the issue of cash. More precisely, it is the income on central bank’s assets against its liabilities in the form of banknotes and coins in circulation (held by the public outside the central bank) less the expenses on their issuance. Obviously, equation (1) implies that seigniorage is driven by three factors: (1) the volume of cash issued, (2) the return on assets (interest and their valuation) related to cash, and (3) the expenses due to the production (including distribution and maintenance) of cash in circulation. What shapes, however, the central bank’s financial result? As mentioned above, seigniorage is understood in this essay as net income from the issue of cash. But, its issuance, albeit crucial, is just one function of a modern central bank, the other functions being to a larger or lesser extent related to currency creation8. These other functions of a central bank result in income and costs not considered in the concept of seigniorage. Thus, central bank’s financial result equation can be written as below: 𝐹𝑅 𝑆 𝑂𝐼 (2) where the new symbols are: FR – financial result, OI – other central bank net income. According to equation (2) central bank’s financial result is shaped by two factors: (1) seigniorage, and (2) remaining central bank income net of related costs. As hinted earlier the latter variable is due to the other roles performed by a central bank than cash issuance. It is therefore non-seigniorage central bank income reduced by costs unrelated to the cash-issue function9. To obtain a broader picture of the issues at stake it is worthwhile to put the above concepts of seigniorage and financial result in a larger framework of central bank finances. See Figure 1.
8 On the numerous functions performed by contemporary central banks see for example Bofinger (2001: 234-9) and Singleton (2011: 4-11). The first of these authors lists five functions, the second one – 10 (including the final one labeled “other functions”). In both cases the “bank of issue” function, i.e. the issuance of legal tender banknotes (and often coins), is mentioned as the first central bank role. See also the discussion on central banks’ functions in Goodhart (1988), Ugolini (2011, 2017) and Bindseil (2018). 9 Obviously, most of the activities of a fully-fledged modern central bank are usually more or less directly related to money issue or – more broadly – monetary policy conduct. On the other hand, however, as for example central banks functioning under currency board arrangements show, at least some of these functions might not be performed. Banking supervision, monetary and financial research or educational activities can also be (and often are) conducted by separate entities. A reverse situation may sometimes also occur; e.g. the ECB supervisory activities (conducted in the framework of the so-called first pillar of the banking union) are reimbursed by supervised banks (see ECB, 2019b: A18 and A55-A57).

6
In the context of central bank finances, i.e. the financial system of a central bank, shown in a simplified form in Figure 1, we can see the link between balance sheet’s assets and liabilities items, seigniorage and the profit and loss account – the central bank financial result. In particular, Figure 1 makes it clear that while seigniorage is normally of positive value (S > 0), as it relates to fiat money, i.e. currency with intrinsically very low value (low costs of issuance), this does not have to be the case for the financial result. The latter is frequently volatile and sometimes results in negative values (FR < 0)10. This is because the profit and loss account is additionally shaped by many other factors than seigniorage such as expenses due to non-issue functions of central banks, valuation changes of all assets and liabilities of a central bank, and provisions set aside. Thus, rarely, only by chance, seigniorage may equal financial result (S = FR).
Figure 1. Seigniorage, financial result and central bank finances
Source: own compilation. As in the case of other financial institutions, a central bank’s financial result consists mainly of income and expenses related to financial assets and liabilities. Thus, these are mainly interest and mark-to-market gains or losses: price and foreign exchange11 revaluation results. In addition, the content and structure of the central bank financial result depends on the adopted accounting principles, i.e. the rules and guidelines governing the recognition, presentation and valuation of different classes of assets and liabilities in the balance sheet. In other words, the central bank’s financial result depends ultimately on the bank’s functions and accepted accounting principles, in particular the adopted definition of income and expenses (for more see Appendix 2). 10 On such cases, typical in most Latin American countries in the years 1987-2005, see Stella and Lönnberg (2008: 12-5). As to the Czech Republic, ten years with central bank loss during the period of 1993-2007, see Cincibuch et al. (2008). According to Deutsche Bundesbank data, during the period of 1969-1979, the Bank faced two years with no profit and seven years with a loss (source: the Bundesbank website). 11 I.e. exchange rate movements; their impact depending on whether the central bank has a closed or an open foreign currency position. In the latter case the impact of exchange rate movements depends on their direction (appreciation or depreciation).
Assets Liabilities
Cash in circulation
Current accounts (reserves)
‐ deposits of commercial banks
Other deposits
Balance sheet
Central bank finances
Financial assets
‐ loans
‐ domestic securities
‐ FX reserves
Fixed assets
Net equity (own capital)
Other liabilities
‐ central bank debt issued
Monetary base
Base of seigniorage
Income on assets against base of seigniorage
Income on all assets
‐Expenses on all liabilities
Expenses on issue of cash
= Seigniorage
Profit and loss
account
Net interest income
Net result on financial
operations
Other income
Other expenses
= Financial result
Transfer to the government
7
What happens to the central bank’s financial result? After its calculation, as Figure 1 suggests, it is distributed to the central bank’s owners (nowadays mainly the government12) and/or allocated to its net equity. The main function of central bank’s net equity (own capital, net worth) is to absorb potential future losses. The size of net equity depends generally on two factors: (1) the accounting principles applied by the central bank, and (2) the principles of the distribution of its financial result, and the resulting payment ratio. The latter, i.e. the proportion of central bank profit transferred to the government, in practice is determined in different ways. These may be binding legal acts (statutes regulating the activities of central banks13), formal agreements between the central bank and the government or parliament14 as well as autonomous decisions of one or the other15. Summing up this part of our discussion, the volume of the central bank’s financial result shapes, through the payments ratio, the size of the money transfer to the finance ministry. Since typically seigniorage is the main source of the financial result, then in “normal times” its size is key in deciding on the latter transfer. Clearly, when the financial result is zero or negative, normally there is no such transfer. 3. The time frame, the central bank sample and some important technicalities Before we move to discuss our findings, in this section we must touch upon several diverging preliminary issues in order to present succinctly the empirical material. The time frame In this paper we discuss the evolution of central banks’ seigniorage, their financial results as well as payments made to the government before, after and during the “crisis”. By the latter we mean a sequence of crises that took place in the period of 2007-14. We analyze, however, the data for the entire period of 2003-18, which means that we also look at the time before the crises, the end of the so-called “great moderation” period, and the time after the crisis – i.e. the attempts at so-called “normalization” or “exit policies” (having in mind that this periodization is not completely applicable to all the cases analyzed below). As is well-known, in mid-2007 the first important turbulences in some financial markets appeared reaching global importance, forcing several major central banks to act (the US Fed, the Eurosystem and the Bank of England in particular). The sequence of crises basically concluded in 2014 together with the end of recession in the euro area a year earlier (see Figure
12 In the past, before nationalizations, in the case of stock corporations, they were usually paid out as dividends to the stockholders. 13 For example, according to the National Bank of Poland Act, 5 per cent of its profit has to be allocated to the reserve fund (until it reaches the maximum level equivalent to the amount of the statutory fund), and the rest must be transferred to the state budget (NBP 1997, Article 62). Therefore, in this case the payment ratio is 95 per cent. 14 For example, in the case of the Swiss National Bank the amount of the annual profit distribution to the Confederation and the cantons is laid down in an agreement between the Federal Department of Finance and the SNB (SNB 2019: 159). 15 For example, the central banks of Malta (and Hungary) where the boards decide the amount of profit which is distributed to the state budget.
8
3A.1 in Appendix 3)16 and the end of the most difficult period in the euro area’s sovereign debt crisis, as evidenced by the decline in the interest rate spreads in this monetary zone (see Figure 3A.2)17. Of course, this time periodization can be easily questioned on several grounds, for example by stressing that in Japan the crisis began much earlier (already in the 1990s), recession in the US only started in December 2007 (NBER 2010), the Lehman Brothers collapse, leading directly to the global great recession, took place in mid-September 2008, and the US recession already ended in June 2009 (NBER 2010). While all these facts are beyond any dispute, there is no doubt that for many central banks (clearly with the exception of the Bank of Japan) “the crisis” started in the summer of 2007. On the other hand, the first central bank to attempt to withdraw from crisis’ policies was the US Fed in the Fall of 2014 when it decided to end its third round of quantitative easing. However, in the early 2019 the US Fed (Fed 2019a) hinted at discontinuing the reduction of its balance sheet which ultimately happened in August (Fed 2019b), retreating therefore, at least temporarily, from “normalization” policies. This was also the case for the ECB, which decided to re-start one of its unconventional instruments in the second half of the year (ECB 2019a). Therefore, we cannot claim that exit policies and policy normalization have been widely followed by the institutions under discussion. The central bank sample For the time frame of 2003-18 we study the case of seven major central banks. Five of them are of crucial importance for the global financial system: the US Fed, the Eurosystem (ECB for short), the Bank of Japan (BoJ), the Bank of England (BoE), and the Swiss National Bank (SNB). The remaining two are the Swedish Riksbank and the National Bank of Poland (NBP). The general rationale for considering these latter institutions is that, similarly to the large five central banks, they do operate in the international arena, although most of their activity is clearly subject to what is known as a “small open economy situation”18. The two smaller central banks are quite distinct. The Riksbank, the oldest uninterruptedly operating monetary authority in the world, conducted unconventional monetary policies as Sweden was strongly affected by the first wave of the crisis (the great recession – see Figure 3A.1, Panel b), later followed by domestic problems (a housing bubble and a resulting policy reaction)19. From the perspective of our adopted definition of seigniorage (see previous section), the Riksbank is also interesting because of its policies to eliminate the usage of cash and advanced preparations to introduce the e-krona, a central bank digital currency (Riksbank 2017, 2018). Considering the NBP is worthwhile for different reasons. In fact, it is a counterpoint to the remaining six banks. This is because Poland was barely touched by the crisis; actually, it proved
16 For a more detailed analysis see CEPR (2017). 17 Although in 2014 two euro area countries still remained in recession (Cyprus, Finland); in 2015-16 Greece’s GDP declined again as well. 18 Let us recall that a small open economy is defined as an economy in which “domestic developments have little or no impact on other economies. Decisions about policy can (…) treat foreign interest rates, output levels, and inflation as exogenous because the domestic economy is small relative to the rest of the world” (Walsh 2003: 297). Switzerland is often considered as a small open economy, but because of its status as a global safe haven and the international role of the Swiss Franc we rather tend to think of the SNB as a very special case, in many aspects closer to the group of the remaining four large central banks than to the Riksbank or the NBP. 19 See more in Svensson (2014).
9
to be quite immune to the global and EU recessions (see Figure 3A.1). Before the crisis shock, the Polish banking sector enjoyed a permanent excess (surplus) liquidity situation (Polański 2017: 33), which proved to be very helpful. As a result, the NBP did not conduct unconventional policies. To its existing armory of instruments, it only added some repo and reverse repo operations (2008-10), FX swap operations (2009-10) and the repurchase of NBP bonds (2009) (NBP 2018: 37). Additionally, it extended one more line of domestic central bank credit (2010), reduced and increased again the reserve ratio, and conducted a few FX interventions (2010-3). In any case, it did not resort to unconventional policies either in the sense of quantitative easing (QE) type operations or very low (close to zero), or negative, nominal interest rates. Thus, Poland and its central bank are a quite different case from the remaining economic areas and their central banks. Among the considered central banks the NBP was not the only one that did not conduct QE programs. The other case was the SNB. But there is one important caveat here. The SNB did not introduce formal QE because it conducted extensive FX interventions which increased considerably the liquidity (reserves) of the Swiss banking sector having, thus, essentially achieving a similar effect as regular QE operations conducted by the other five central banks. The meaning of unconventional policies Before we move ahead we should also clarify what we mean by “unconventional” – or “nonstandard” – monetary policies. We tend to think of them as composed of two main types. First, the “QE-type” programs (operations), i.e. large-scale purchases of assets by monetary authorities conducted with the aim of increasing the size of reserves held by commercial banks on the liability side of the central bank20. Following Borio and Disyatat (2009) we will also use a wider term of “balance-sheet policies” as the increase of bank reserves – especially by the ECB – was achieved as well by other, largely similar, “unconventional” programs. Second, we consider as highly unconventional, the interest rate policies aiming at close to zero and negative nominal interest rates. Actually, we are convinced that ultimately the latter are more nonstandard or unconventional than the balance-sheet ones21. On both aspects of unconventional monetary policies conducted by the central banks studied see the next three figures (Figures 2-4). The three figures lead to several important observations. First, the balance sheet expansions of most of the central banks under study started well before the collapse of Lehman Brothers. This confirms that central banks were facing an unstable financial situation before the event – in the case of the Bank of England already during 2006. A different story is the case of Bank of Japan which started its first official QE program already in 2001, accompanied – since 1999 – by a zero-interest policy rate (Shirai 2017: 9-11). Second, in nominal terms the balance sheet of the Bank of England increased the most in the period analyzed (by more than 1200 per cent). In real terms, i.e. as a percentage of GDP, the picture is very different, however. The largest increase can be observed in the case of the SNB whose balance sheet size was equivalent to almost 120 per cent of Swiss GDP in 2018; paradoxically, as already mentioned, the Bank did not conduct a QE program – almost all the 20 See Lavoie and Fiebiger (2018: 140). These authors also discuss the economic and accounting impact of different incarnations of QE programs. 21 Large scale purchases of financial assets by central banks, leading to the expansion of their balance sheets were not rare in the past (see e.g. Ferguson et al., 2015), while zero or negative nominal rates were almost nonexistent (see Homer and Sylla 2005; Rogoff 2016: 128-32).
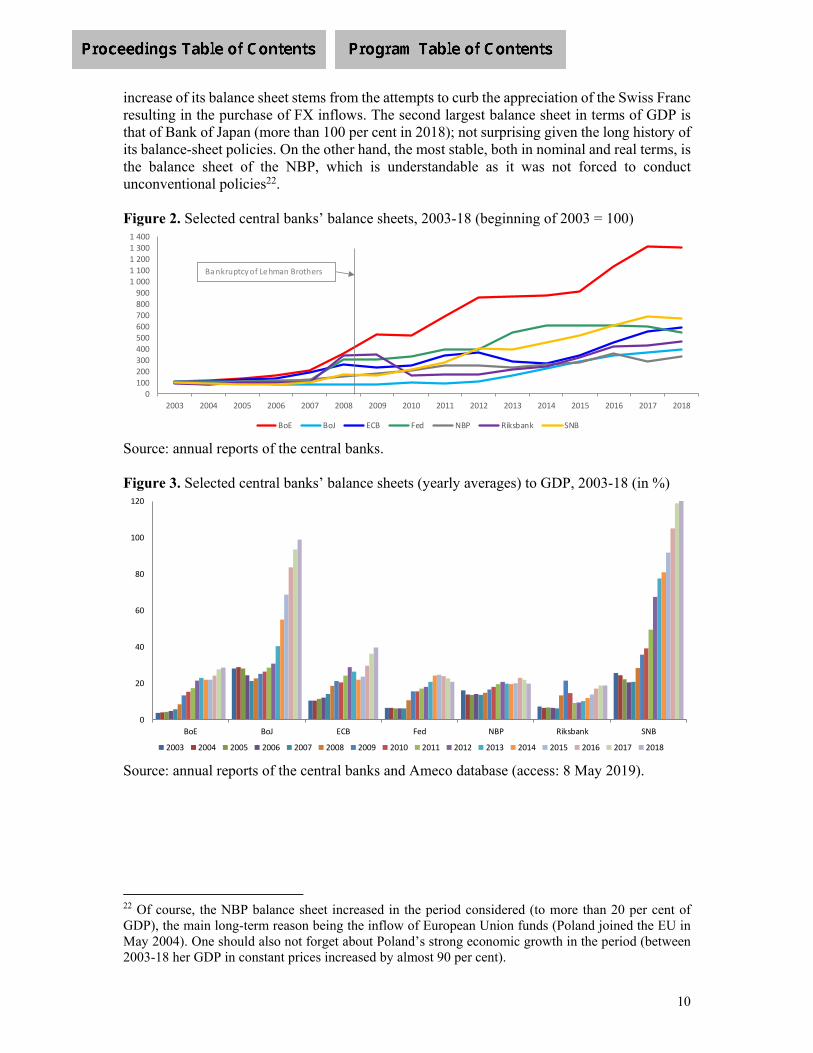
10
increase of its balance sheet stems from the attempts to curb the appreciation of the Swiss Franc resulting in the purchase of FX inflows. The second largest balance sheet in terms of GDP is that of Bank of Japan (more than 100 per cent in 2018); not surprising given the long history of its balance-sheet policies. On the other hand, the most stable, both in nominal and real terms, is the balance sheet of the NBP, which is understandable as it was not forced to conduct unconventional policies22. Figure 2. Selected central banks’ balance sheets, 2003-18 (beginning of 2003 = 100)
Source: annual reports of the central banks. Figure 3. Selected central banks’ balance sheets (yearly averages) to GDP, 2003-18 (in %)
Source: annual reports of the central banks and Ameco database (access: 8 May 2019).
22 Of course, the NBP balance sheet increased in the period considered (to more than 20 per cent of GDP), the main long-term reason being the inflow of European Union funds (Poland joined the EU in May 2004). One should also not forget about Poland’s strong economic growth in the period (between 2003-18 her GDP in constant prices increased by almost 90 per cent).
0
100
200
300
400
500
600
700
800
900
1 000
1 100
1 200
1 300
1 400
2003 2004 2005 2006 2007 2008 2009 2010 2011 2012 2013 2014 2015 2016 2017 2018
BoE BoJ ECB Fed NBP Riksbank SNB
Bankruptcyof Lehman Brothers
0
20
40
60
80
100
120
BoE BoJ ECB Fed NBP Riksbank SNB
2003 2004 2005 2006 2007 2008 2009 2010 2011 2012 2013 2014 2015 2016 2017 2018
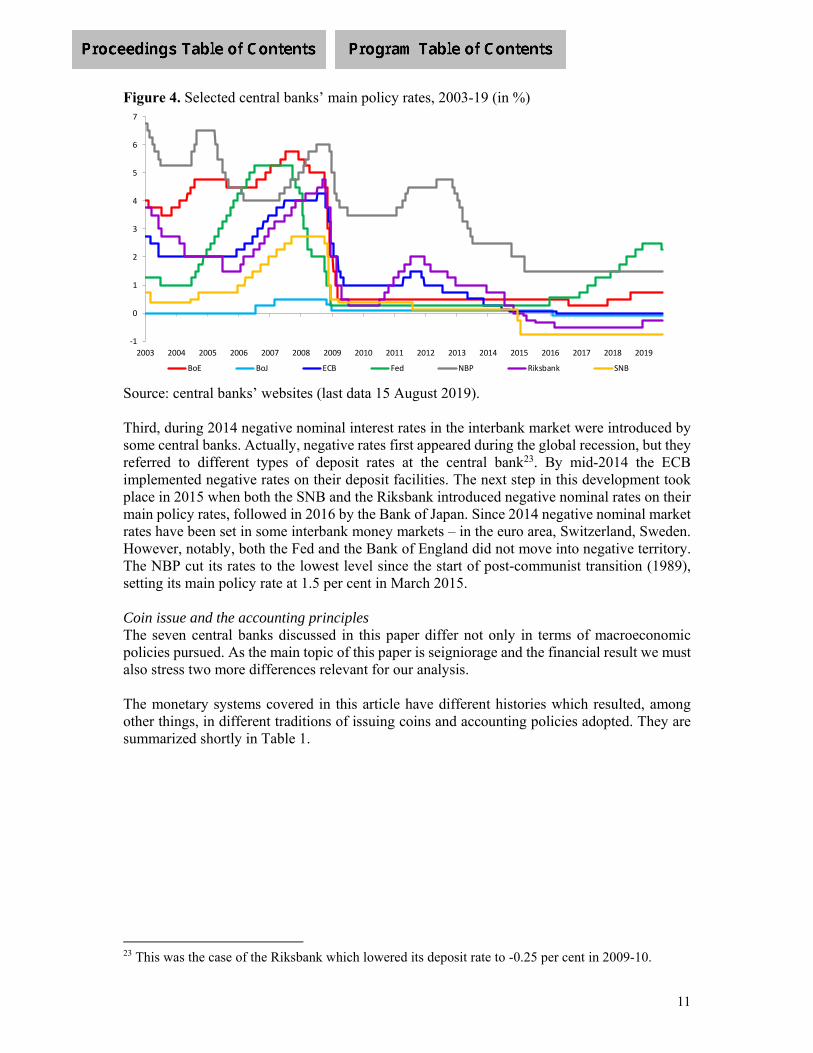
11
Figure 4. Selected central banks’ main policy rates, 2003-19 (in %)
Source: central banks’ websites (last data 15 August 2019). Third, during 2014 negative nominal interest rates in the interbank market were introduced by some central banks. Actually, negative rates first appeared during the global recession, but they referred to different types of deposit rates at the central bank23. By mid-2014 the ECB implemented negative rates on their deposit facilities. The next step in this development took place in 2015 when both the SNB and the Riksbank introduced negative nominal rates on their main policy rates, followed in 2016 by the Bank of Japan. Since 2014 negative nominal market rates have been set in some interbank money markets – in the euro area, Switzerland, Sweden. However, notably, both the Fed and the Bank of England did not move into negative territory. The NBP cut its rates to the lowest level since the start of post-communist transition (1989), setting its main policy rate at 1.5 per cent in March 2015. Coin issue and the accounting principles The seven central banks discussed in this paper differ not only in terms of macroeconomic policies pursued. As the main topic of this paper is seigniorage and the financial result we must also stress two more differences relevant for our analysis. The monetary systems covered in this article have different histories which resulted, among other things, in different traditions of issuing coins and accounting policies adopted. They are summarized shortly in Table 1.
23 This was the case of the Riksbank which lowered its deposit rate to -0.25 per cent in 2009-10.
‐1
0
1
2
3
4
5
6
7
2003 2004 2005 2006 2007 2008 2009 2010 2011 2012 2013 2014 2015 2016 2017 2018 2019
BoE BoJ ECB Fed NBP Riksbank SNB
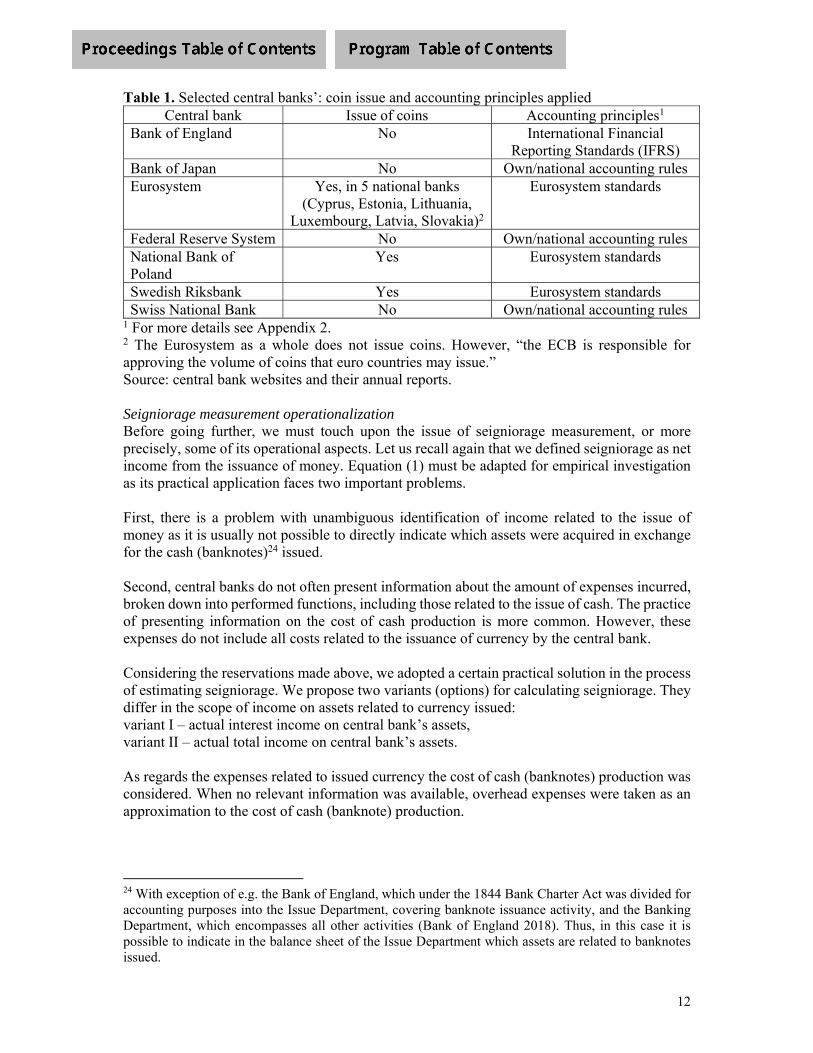
12
Table 1. Selected central banks’: coin issue and accounting principles applied Central bank Issue of coins Accounting principles1
Bank of England No International Financial Reporting Standards (IFRS)
Bank of Japan No Own/national accounting rules Eurosystem Yes, in 5 national banks
(Cyprus, Estonia, Lithuania, Luxembourg, Latvia, Slovakia)2
Eurosystem standards
Federal Reserve System No Own/national accounting rulesNational Bank of Poland
Yes Eurosystem standards
Swedish Riksbank Yes Eurosystem standardsSwiss National Bank No Own/national accounting rules
1 For more details see Appendix 2. 2 The Eurosystem as a whole does not issue coins. However, “the ECB is responsible for approving the volume of coins that euro countries may issue.” Source: central bank websites and their annual reports. Seigniorage measurement operationalization Before going further, we must touch upon the issue of seigniorage measurement, or more precisely, some of its operational aspects. Let us recall again that we defined seigniorage as net income from the issuance of money. Equation (1) must be adapted for empirical investigation as its practical application faces two important problems. First, there is a problem with unambiguous identification of income related to the issue of money as it is usually not possible to directly indicate which assets were acquired in exchange for the cash (banknotes)24 issued. Second, central banks do not often present information about the amount of expenses incurred, broken down into performed functions, including those related to the issue of cash. The practice of presenting information on the cost of cash production is more common. However, these expenses do not include all costs related to the issuance of currency by the central bank. Considering the reservations made above, we adopted a certain practical solution in the process of estimating seigniorage. We propose two variants (options) for calculating seigniorage. They differ in the scope of income on assets related to currency issued: variant I – actual interest income on central bank’s assets, variant II – actual total income on central bank’s assets. As regards the expenses related to issued currency the cost of cash (banknotes) production was considered. When no relevant information was available, overhead expenses were taken as an approximation to the cost of cash (banknote) production.
24 With exception of e.g. the Bank of England, which under the 1844 Bank Charter Act was divided for accounting purposes into the Issue Department, covering banknote issuance activity, and the Banking Department, which encompasses all other activities (Bank of England 2018). Thus, in this case it is possible to indicate in the balance sheet of the Issue Department which assets are related to banknotes issued.

13
The basis for the calculation was the volume of cash (banknotes) in circulation recorded in the central bank’s balance sheet. Estimates of revenues on assets were carried out in three stages. In the first one, income on all central bank assets was calculated according to the variants adopted (I – interest income; II – actual total income recorded in the profit and loss account). In the second stage, the share of liabilities due to cash (banknotes) in circulation in the balance sheet total was determined. In the third stage, the income from assets calculated in the first stage was multiplied by the share of liabilities from the issuance of currency in the balance sheet calculated in the second stage. The result, diminished by the expenses on cash (banknotes) production, is regarded as the estimate of seigniorage. The calculations were made for each central bank separately in each year covered by the analysis25. 4. The impact of unconventional monetary policies on seigniorage and central banks’ financial results Before the outburst of the global financial crisis the typical balance sheet of a central bank was mainly determined by the volume of cash (banknotes) issued. Central banks usually recorded positive financial results and they were mainly determined by seigniorage, i.e. the income on issued currency was one of the main factors influencing central banks’ profits (Szadkowski 2017). This changed as central banks turned to unconventional measures in their monetary policies. Although after 2007 enormous growth in the volume of central bank assets was observed, it seems that it only partly resulted from the issue of currency. As shown in Figure 5 liabilities due to cash in circulation in relation to the balance sheet total decreased for all observed central banks (except for the NBP). While before the crisis cash was one of the main positions in central bank balance sheets, during the crisis in all analyzed cases (except for the Bank of Japan) their share reached no more than 50% of the balance sheet total. This happened despite considerable growth of cash in circulation (with the exception of Sweden) in real terms – see Figure 626. Figure 5. Cash-to-balance sheet total ratio for selected central banks, 2003-18 (in %)
Source: annual reports of the central banks and Ameco database (access: 8 May 2019).
25 See also notes to Table 4A.1. 26 See also, in a more detailed and much wider perspective, Jobst and Stix (2017).
0
50
100
2003 2004 2005 2006 2007 2008 2009 2010 2011 2012 2013 2014 2015 2016 2017 2018
BoE BoJ ECB Fed NBP Riksbank SNB
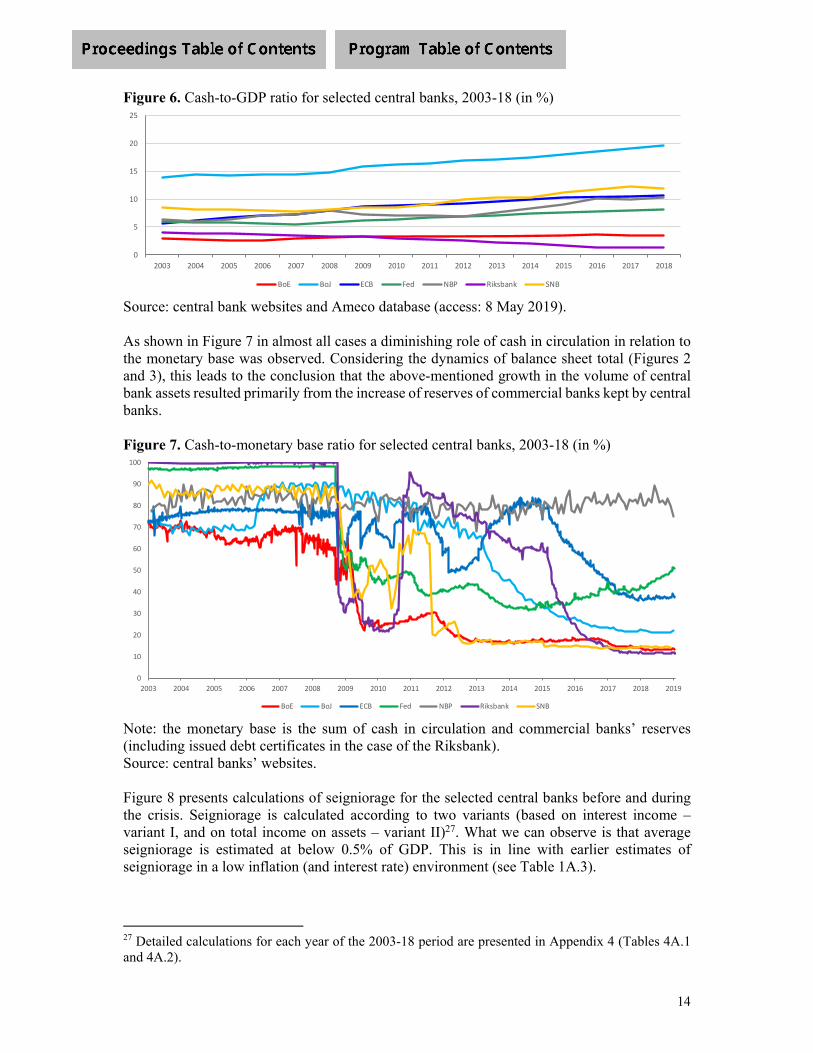
14
Figure 6. Cash-to-GDP ratio for selected central banks, 2003-18 (in %)
Source: central bank websites and Ameco database (access: 8 May 2019). As shown in Figure 7 in almost all cases a diminishing role of cash in circulation in relation to the monetary base was observed. Considering the dynamics of balance sheet total (Figures 2 and 3), this leads to the conclusion that the above-mentioned growth in the volume of central bank assets resulted primarily from the increase of reserves of commercial banks kept by central banks. Figure 7. Cash-to-monetary base ratio for selected central banks, 2003-18 (in %)
Note: the monetary base is the sum of cash in circulation and commercial banks’ reserves (including issued debt certificates in the case of the Riksbank). Source: central banks’ websites. Figure 8 presents calculations of seigniorage for the selected central banks before and during the crisis. Seigniorage is calculated according to two variants (based on interest income – variant I, and on total income on assets – variant II)27. What we can observe is that average seigniorage is estimated at below 0.5% of GDP. This is in line with earlier estimates of seigniorage in a low inflation (and interest rate) environment (see Table 1A.3).
27 Detailed calculations for each year of the 2003-18 period are presented in Appendix 4 (Tables 4A.1 and 4A.2).
0
5
10
15
20
25
2003 2004 2005 2006 2007 2008 2009 2010 2011 2012 2013 2014 2015 2016 2017 2018
BoE BoJ ECB Fed NBP Riksbank SNB
0
10
20
30
40
50
60
70
80
90
100
2003 2004 2005 2006 2007 2008 2009 2010 2011 2012 2013 2014 2015 2016 2017 2018 2019
BoE BoJ ECB Fed NBP Riksbank SNB
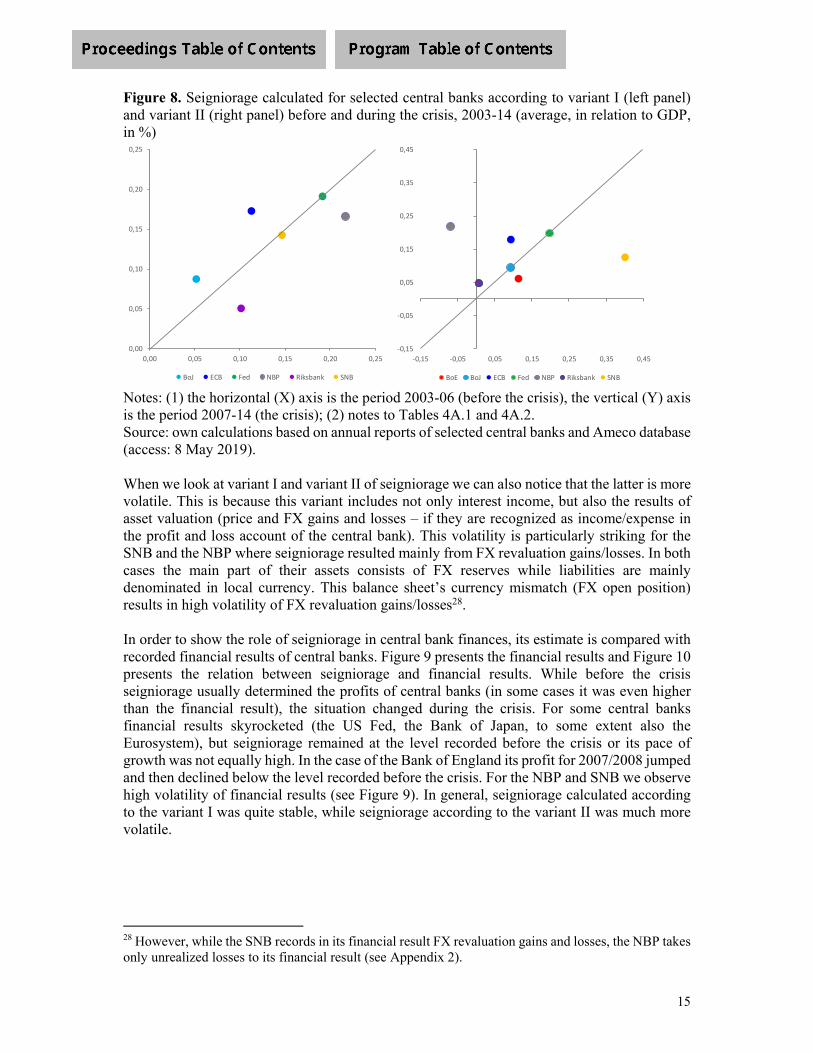
15
Figure 8. Seigniorage calculated for selected central banks according to variant I (left panel) and variant II (right panel) before and during the crisis, 2003-14 (average, in relation to GDP, in %)
Notes: (1) the horizontal (X) axis is the period 2003-06 (before the crisis), the vertical (Y) axis is the period 2007-14 (the crisis); (2) notes to Tables 4A.1 and 4A.2. Source: own calculations based on annual reports of selected central banks and Ameco database (access: 8 May 2019). When we look at variant I and variant II of seigniorage we can also notice that the latter is more volatile. This is because this variant includes not only interest income, but also the results of asset valuation (price and FX gains and losses – if they are recognized as income/expense in the profit and loss account of the central bank). This volatility is particularly striking for the SNB and the NBP where seigniorage resulted mainly from FX revaluation gains/losses. In both cases the main part of their assets consists of FX reserves while liabilities are mainly denominated in local currency. This balance sheet’s currency mismatch (FX open position) results in high volatility of FX revaluation gains/losses28. In order to show the role of seigniorage in central bank finances, its estimate is compared with recorded financial results of central banks. Figure 9 presents the financial results and Figure 10 presents the relation between seigniorage and financial results. While before the crisis seigniorage usually determined the profits of central banks (in some cases it was even higher than the financial result), the situation changed during the crisis. For some central banks financial results skyrocketed (the US Fed, the Bank of Japan, to some extent also the Eurosystem), but seigniorage remained at the level recorded before the crisis or its pace of growth was not equally high. In the case of the Bank of England its profit for 2007/2008 jumped and then declined below the level recorded before the crisis. For the NBP and SNB we observe high volatility of financial results (see Figure 9). In general, seigniorage calculated according to the variant I was quite stable, while seigniorage according to the variant II was much more volatile.
28 However, while the SNB records in its financial result FX revaluation gains and losses, the NBP takes only unrealized losses to its financial result (see Appendix 2).
0,00
0,05
0,10
0,15
0,20
0,25
0,00 0,05 0,10 0,15 0,20 0,25
BoJ ECB Fed NBP Riksbank SNB
‐0,15
‐0,05
0,05
0,15
0,25
0,35
0,45
‐0,15 ‐0,05 0,05 0,15 0,25 0,35 0,45
BoE BoJ ECB Fed NBP Riksbank SNB

16
Figure 9. Financial result before and during the crisis for selected central banks, 2003-14 (average, as % of GDP)
Notes: (1) the horizontal (X) axis is the period 2003-06 (before the crisis), the vertical (Y) axis is the period 2007-14 (the crisis); (2) note to Table 4A.3. Source: as in Figure 8. Figure 10. Seigniorage calculated according to variant I (left panel) and variant II (right panel) in relation to financial result before and during the crisis for selected central banks, 2003-14 (average, in %)
Notes: (1) as in Figures 8 and 9; (2) NBP’s financial result was zero for 2008, 2013-14 and 2018; therefore, calculated average does not include these years. Source: as in Figure 8.
0,0
0,5
1,0
1,5
2,0
‐0,5 0,0 0,5 1,0 1,5 2,0
BoE BoJ ECB Fed NBP Riksbank SNB
0,0
0,1
0,2
0,3
0,4
0,5
‐0,1 0,0 0,1 0,2 0,3 0,4 0,5
BoE BoJ ECB Fed NBP Riksbank
0
20
40
60
80
100
120
140
160
180
200
0 20 40 60 80 100 120 140 160 180 200
BoJ ECB Fed NBP Riksbank SNB
0
25
50
75
100
125
‐25 0 25 50 75 100 125
BoE BoJ ECB Fed NBP Riksbank SNB

17
5. The role of seigniorage in central banks’ financial results and transfers to the government The role of seigniorage in central banks’ financial results was partially analyzed in the previous section. Here we focus mainly on the role of calculated seigniorage and financial results in the transfers to the government. At the beginning we analyze average transfers to the government in the three subperiods: before the crisis (i.e. 2003-06), during the crisis (2007-14) and after the crisis (2015-18). Figure 11 presents average (for the subperiod) transfers to the government in relation to current GDP (for yearly data see Table 4A.3). As can be seen transfers made during and after the crisis are, with minor exceptions (notably the NBP and the SNB), higher than those made just before the crisis. It seems to confirm the previous observation that along with a higher balance sheet volume an increase in the financial result can be observed, i.e. in the basis for further remittances to the state budget. Figure 11. Transfers to the government of selected central banks (average, in % of current GDP)
Note: (1) the Bank of Japan did not publish its profit and loss account for 2003 in English; (2) in 2018, data for the Eurosystem do not include Banka Slovenije (central bank of Slovenia) since it has not yet published its Annual Report for 2018. Source: as in Figure 8. However, we must make two reservations. First, our conclusion does not fit the SNB case. Before the crisis the SNB transferred on average 1.6 per cent of GDP to the government while during and after the crisis the transfers stood at less than 0.3 per cent of GDP. The observed before the crisis high remittance resulted mainly from the one-off distribution made in 2005 (of almost 5 per cent of GDP) due to the proceeds from the sale of gold a year earlier. Second, with the above exception of the SNB’s one-off transfer, for most analyzed central banks the financial result is the main source and basis for the transfer to the government. Nevertheless, there is no single common algorithm for calculating the transfers, i.e. no single payment ratio
0,0
0,5
1,0
1,5
2,0BoE
BoJ
ECB
FedNBP
Riksbank
SNB
2003‐06 2007‐14 2015‐18
0,0
0,1
0,2
0,3
0,4
0,5BoE
BoJ
ECB
FedNBP
Riksbank
SNB
2003‐06 2007‐14 2015‐18

18
(see Section 2). While the Fed, the Bank of Japan and the NBP transfer almost all their profits to the state government, the Riksbank calculates the transfer amount as a part of average adjusted profit for the previous five years. The Bank of England transfers all the profit of the Issue Department (which is called seigniorage) and part of the profit of the Banking Department. However, in the case of the Banking Department there was also a one-off transfer similar to the SNB’s29. In turn, besides the mentioned one-off payment the SNB calculates the transfers to the Confederations and cantons based on periodic agreements. They stipulate the amount of transfers which does not always relate to the profit earned by the SNB in a given year. As regards the Eurosystem, the transfers to the government result from individual relations between national central banks and their governments (based on legal rules and/or bilateral agreements). After analyzing the amounts of financial result (in previous section) and transfers to the government, we can now look at the role of seigniorage and financial results in the transfers made to the governments. Figure 12 presents the value of seigniorage (according to the variants I and II) and the financial result in relation to the transfers to the government (assuming that the transfers are equal to 100 per cent). Figure 12. Seigniorage (variants SI and SII) and the financial result (FR) of selected central banks in relation to the transfers to the government (average, in %). Panel A: subperiod 2003-06
29 It concerned an additional dividend payment related to the gross surplus arising from the Special Liquidity Scheme which ended in 2012.
‐50
0
50
100
150
200
250
BoE BoJ ECB Fed NBP Riksbank SNB
SI SII FR
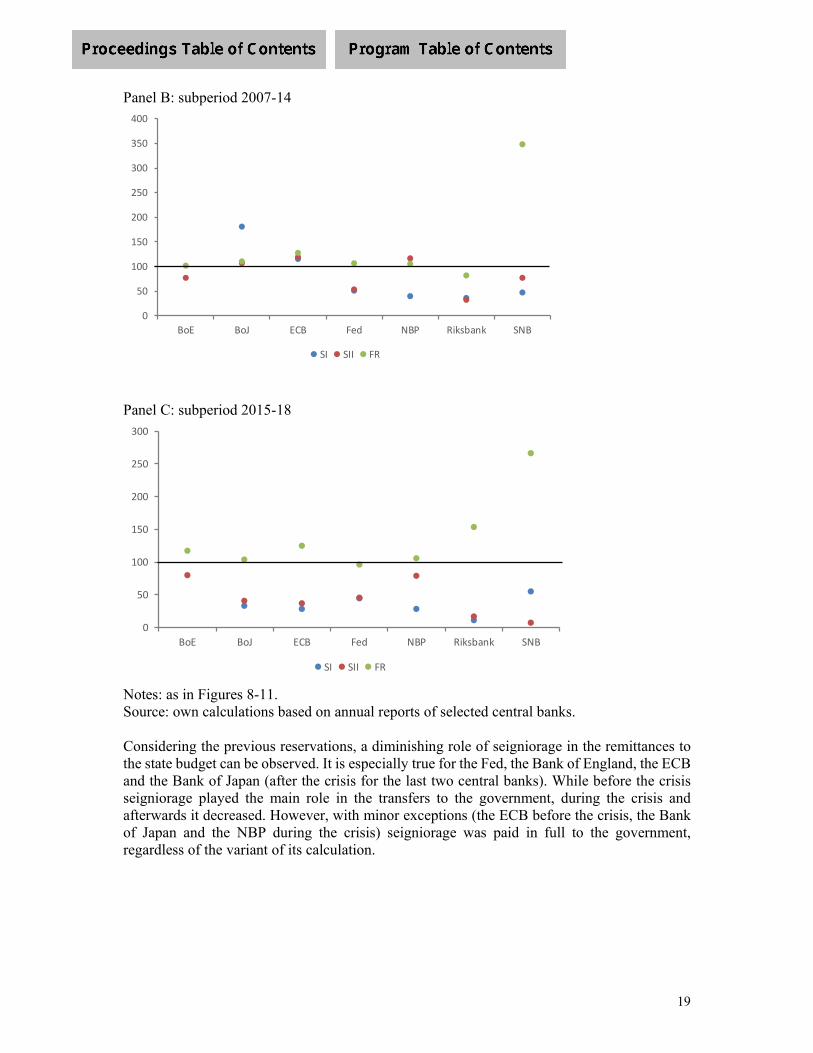
19
Panel B: subperiod 2007-14
Panel C: subperiod 2015-18
Notes: as in Figures 8-11. Source: own calculations based on annual reports of selected central banks. Considering the previous reservations, a diminishing role of seigniorage in the remittances to the state budget can be observed. It is especially true for the Fed, the Bank of England, the ECB and the Bank of Japan (after the crisis for the last two central banks). While before the crisis seigniorage played the main role in the transfers to the government, during the crisis and afterwards it decreased. However, with minor exceptions (the ECB before the crisis, the Bank of Japan and the NBP during the crisis) seigniorage was paid in full to the government, regardless of the variant of its calculation.
0
50
100
150
200
250
300
350
400
BoE BoJ ECB Fed NBP Riksbank SNB
SI SII FR
0
50
100
150
200
250
300
BoE BoJ ECB Fed NBP Riksbank SNB
SI SII FR
20
6. The impact of exit policies and normalization on seigniorage and central banks’ financial results Following the analysis of seigniorage before and during the crisis it is time to focus on its potential role after the crisis. However, it is necessary to change somehow the perspective of analysis and focus on the role of seigniorage in relation to future central banks’ financial results. It is proposed to concentrate on two factors which simultaneously influence the seigniorage and financial results of central banks. They are: interest rates and the volume of central bank balance sheets (and, thus, the volume of cash in circulation). As regards the interest rates it is supposed that after the financial crisis their gradual normalization will eventually take place. This means that the nominal interest rate level will return to positive values, i.e. above zero. This can already be seen in case of the Fed (see Figure 4). However, interest rates will probably not return to the levels recorded before the crisis (see e.g. Schnabl 2016), but they should reach such a level that enables central banks to conduct monetary policy with effective usage of conventional instruments (interest rate policy). For the analysis conducted in this paper it is important to conclude that interest rates will rise after the financial crisis. The second factor that has to be considered is the “normalization” of central bank balance sheet volume. It is often argued that together with the withdrawal of unconventional instruments central banks’ balance sheet totals will gradually return to their pre-crisis levels. However, a glimpse at the volume of central banks’ balance sheets since 2014 (see Figures 2 and 3) leads to the conclusion that they can remain at their current level even for a longer period. Although the Fed announced a program aiming at a decrease of its balance sheet (Fed 2017), the ECB started reducing the volume of purchased debt securities with the intention of halting the purchases with the end of 2018 (ECB 2018), and the SNB ceased to conduct FX interventions against Swiss franc appreciation (SNB 2015), so far, the results are rather moderate from the perspective of balance sheet volume30. Therefore, it is justified to assume that central banks’ balance sheet totals will remain at elevated levels for a longer period while banks start increasing their reference interest rates31. It will be interesting to see how such operations impact on the financial results of central banks and more precisely – their interest net income. We can look at the simplified structure of a stylized central bank’s balance sheet, a bank that conducted or still conducts unconventional operations in the form of purchasing debt securities (quantitative easing), e.g. the Bank of England, the Bank of Japan, the Fed, the ECB and the Riksbank. Such central banks hold bonds purchased under quantitative easing programs on the asset side (B). They were mainly purchased to bring market yields close to zero. They are fixed-income assets with long-term maturities and are remunerated at the yield prevailing at the purchase date (iB). This means that the average yield of purchased bonds is near zero. Central banks purchased those bonds with the intention to hold them until their maturity. The purchase price for the securities was mainly paid to the accounts of commercial banks kept within central banks on their liability side, i.e. reserves (R). Commercial banks’ reserves are short term 30 See our discussion on the discontinuation of the reduction of central banks’ balance sheets in Section 3. 31 At the end of July 2019, the Fed lowered the interest rate (Figure 4), which implies that the exit from low-interest rate policies does not have to be a linear one, however.
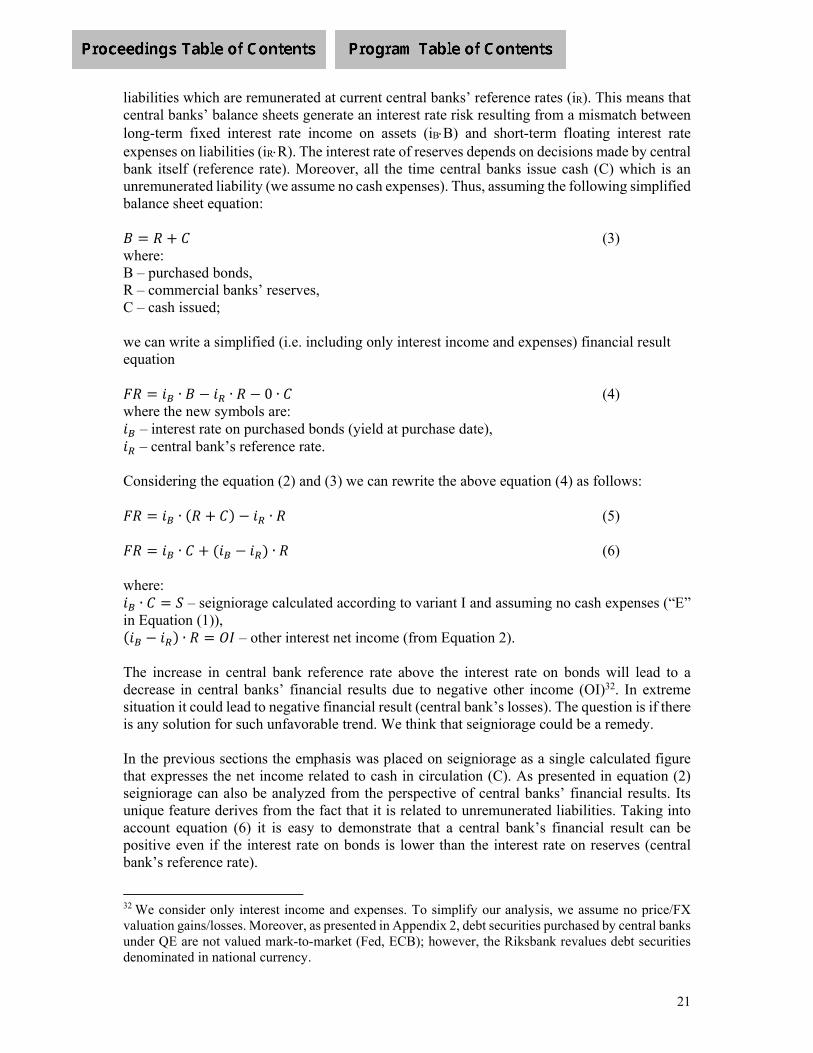
21
liabilities which are remunerated at current central banks’ reference rates (iR). This means that central banks’ balance sheets generate an interest rate risk resulting from a mismatch between long-term fixed interest rate income on assets (iBB) and short-term floating interest rate expenses on liabilities (iRR). The interest rate of reserves depends on decisions made by central bank itself (reference rate). Moreover, all the time central banks issue cash (C) which is an unremunerated liability (we assume no cash expenses). Thus, assuming the following simplified balance sheet equation: 𝐵 𝑅 𝐶 (3) where: B – purchased bonds, R – commercial banks’ reserves, C – cash issued; we can write a simplified (i.e. including only interest income and expenses) financial result equation 𝐹𝑅 𝑖 ∙ 𝐵 𝑖 ∙ 𝑅 0 ∙ 𝐶 (4) where the new symbols are: 𝑖 – interest rate on purchased bonds (yield at purchase date), 𝑖 – central bank’s reference rate. Considering the equation (2) and (3) we can rewrite the above equation (4) as follows: 𝐹𝑅 𝑖 ∙ 𝑅 𝐶 𝑖 ∙ 𝑅 (5) 𝐹𝑅 𝑖 ∙ 𝐶 𝑖 𝑖 ∙ 𝑅 (6) where: 𝑖 ∙ 𝐶 𝑆 – seigniorage calculated according to variant I and assuming no cash expenses (“E” in Equation (1)), 𝑖 𝑖 ∙ 𝑅 𝑂𝐼 – other interest net income (from Equation 2).
The increase in central bank reference rate above the interest rate on bonds will lead to a decrease in central banks’ financial results due to negative other income (OI)32. In extreme situation it could lead to negative financial result (central bank’s losses). The question is if there is any solution for such unfavorable trend. We think that seigniorage could be a remedy. In the previous sections the emphasis was placed on seigniorage as a single calculated figure that expresses the net income related to cash in circulation (C). As presented in equation (2) seigniorage can also be analyzed from the perspective of central banks’ financial results. Its unique feature derives from the fact that it is related to unremunerated liabilities. Taking into account equation (6) it is easy to demonstrate that a central bank’s financial result can be positive even if the interest rate on bonds is lower than the interest rate on reserves (central bank’s reference rate).
32 We consider only interest income and expenses. To simplify our analysis, we assume no price/FX valuation gains/losses. Moreover, as presented in Appendix 2, debt securities purchased by central banks under QE are not valued mark-to-market (Fed, ECB); however, the Riksbank revalues debt securities denominated in national currency.

22
𝐹𝑅 0 ↔ 𝑖 ∙ 𝐶 𝑖 𝑖 ∙ 𝑅 0 (7)
↔ (8)
With unremunerated liabilities in the form of cash issued, the central bank has more space to increase its reference interest rate above the interest rate on held bonds until it faces the danger of recording losses. The relation between interest rates depends on the relation of remunerated assets (bonds: B) to remunerated liabilities (reserves: B-C). According to Equation (8), the higher the share of cash in circulation in the balance sheet volume, the higher the central bank’s reference rates can be until the central bank records no profit (i.e. a break-even-point takes place). Figure 13 presents a situation where half of the balance sheet total consists of liabilities due to cash issued. An increase in central bank reference rate does not result in a negative financial result until certain threshold. This threshold depends on the relation between remunerated assets and liabilities. In this case the central bank can increase interest rates by 1 percentage point (from 1 per cent to 2 per cent) until it records negative net interest income (the potential to increase the central bank reference rate is shown by a horizontal green line with arrows)33. After the financial crisis seigniorage would be a kind of buffer that protects financial results of central banks from recording losses. Figure 13. Central bank break-even-point with cash issued (where cash issued = ½ balance sheet total)
Source: own calculations. Now when it is known how to interpret the break-even-point with seigniorage, the results calculated for selected central banks can be analyzed (see Figure 14). However, one reservation has to be made. It is not known what exactly the interest rate of central banks’ assets is. Central banks do not usually publish such information in their annual reports or annual accounts. Therefore, the results should be defined as the relation between the central bank’s reference rate and the interest rate on central bank’s assets, exceeding which results in negative net interest income.
33 We assume that at the beginning the interest on bonds is equal to the central bank’s reference rate.
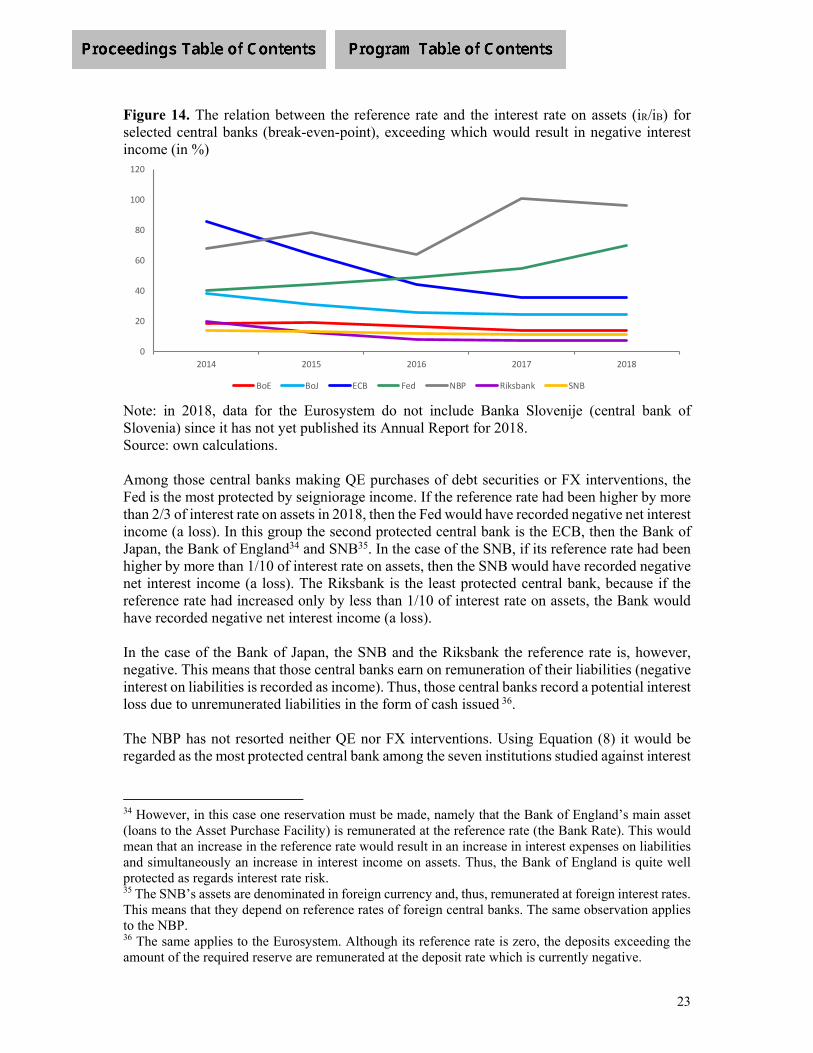
23
Figure 14. The relation between the reference rate and the interest rate on assets (iR/iB) for selected central banks (break-even-point), exceeding which would result in negative interest income (in %)
Note: in 2018, data for the Eurosystem do not include Banka Slovenije (central bank of Slovenia) since it has not yet published its Annual Report for 2018. Source: own calculations. Among those central banks making QE purchases of debt securities or FX interventions, the Fed is the most protected by seigniorage income. If the reference rate had been higher by more than 2/3 of interest rate on assets in 2018, then the Fed would have recorded negative net interest income (a loss). In this group the second protected central bank is the ECB, then the Bank of Japan, the Bank of England34 and SNB35. In the case of the SNB, if its reference rate had been higher by more than 1/10 of interest rate on assets, then the SNB would have recorded negative net interest income (a loss). The Riksbank is the least protected central bank, because if the reference rate had increased only by less than 1/10 of interest rate on assets, the Bank would have recorded negative net interest income (a loss). In the case of the Bank of Japan, the SNB and the Riksbank the reference rate is, however, negative. This means that those central banks earn on remuneration of their liabilities (negative interest on liabilities is recorded as income). Thus, those central banks record a potential interest loss due to unremunerated liabilities in the form of cash issued 36. The NBP has not resorted neither QE nor FX interventions. Using Equation (8) it would be regarded as the most protected central bank among the seven institutions studied against interest
34 However, in this case one reservation must be made, namely that the Bank of England’s main asset (loans to the Asset Purchase Facility) is remunerated at the reference rate (the Bank Rate). This would mean that an increase in the reference rate would result in an increase in interest expenses on liabilities and simultaneously an increase in interest income on assets. Thus, the Bank of England is quite well protected as regards interest rate risk. 35 The SNB’s assets are denominated in foreign currency and, thus, remunerated at foreign interest rates. This means that they depend on reference rates of foreign central banks. The same observation applies to the NBP. 36 The same applies to the Eurosystem. Although its reference rate is zero, the deposits exceeding the amount of the required reserve are remunerated at the deposit rate which is currently negative.
0
20
40
60
80
100
120
2014 2015 2016 2017 2018
BoE BoJ ECB Fed NBP Riksbank SNB
24
rate risk. It would not have recorded negative interest rate income until reference rate had been almost twice as high as the interest rate on its assets. 7. Summary of main findings and conclusions Following the adoption of the cash-based definition of seigniorage, the main findings of our research can be summarized as follows. First, both variants applied to the calculation of seigniorage have shown that during the period studied its evolution tended to diverge considerably for the sample of seven central banks with respect to their financial results and payments to the government. According to the first variant (based on interest income on central bank assets), seigniorage continued to be the basis for both of them; this was, however, not entirely the case according to the second variant (seigniorage based on total income on assets). Second, in the period studied seigniorage typically amounted to less than 0.5 per cent of GDP. This is in line with earlier estimates of seigniorage in a low inflation (and interest rate) environment. The impact of low interest rate policy on the size of seigniorage is particularly visible in the first variant of estimates: in the period 2007-14 these estimates were clearly lower in the cases studied, perhaps except for the SNB. Third, in the post-2007 period, the financial results of central banks – contrary to our estimates of seigniorage – tended to increase. This was because central banks’ balance sheet policies during the crisis period resulted mainly in increases of liabilities other than cash, i.e. commercial banks’ reserves. This phenomenon was particularly visible in the case of the US Fed and the Eurosystem. A much more pronounced process, based however on FX inflows, was noticeable in the case of the SNB. Fourth, similar developments to the financial results took place as concerns the transfers of profits to the state budgets. This is again particularly true of the US Fed and the Eurosystem, less so, however, in the case of the remaining five central banks due to different policies towards central bank profits distribution. Fifth, the NBP and the SNB are rather peculiar cases in the sample of central banks studied due to their substantial FX exposures resulting from large long open positions in their balance sheets. Consequently, in both these cases large volatility of seigniorage (variant II) and financial results took place. If seigniorage based on interest income on assets is considered alone, the developments in both central banks are in line with global ones. However, in the two institutions, seigniorage based on total income and the financial result proved to be very volatile during the analyzed period, often resulting in negative seigniorage, no profit and no payments to the state budget. In the case of the NBP such developments have been the price for Poland’s economic success which led to recurring appreciation pressures on the zloty, while in the case of the SNB they resulted from investors’ perception of Switzerland as a safe haven leading to Swiss franc appreciation. Sixth, generally speaking, the size of seigniorage during the crisis period (2007-14) was shaped by two main forces: (1) the decline in the return on assets (variant II seigniorage), which had a negative impact, and (2) the cash issued, which had a positive impact. The first of them was of major importance. This suggests that for the post-crisis period it can be presumed that the higher

25
the role of cash in a central bank’s balance sheet, the less negative impact of interest rate increases on financial result is likely to take place. Obviously, this seems to be the case of the US Fed in the 2015-18 period. Seventh, considering the role of cash in seigniorage creation, the Riksbank’s recent experience with a strong reduction of currency in circulation points to an essential problem – seigniorage may disappear as cash disappears. If this is to happen depends, however, on what the economic characteristics will be of the public digital currency which is to replace cash someday. In any case, this mere fact will call for a new definition of seigniorage.

26
REFERENCES (1) Arby M.F. (2006): Seigniorage Earnings of Commercial Banks and State Bank of Pakistan,
MPRA Paper, No. 4955, Munich. (2) Bailey J. (1956): The Welfare Cost of Inflationary Finance, The Journal of Political Economy,
Vol. 64, No. 2, April, pp. 93-110. (3) Baltensperger E., Jordan T.J. (1997): Seigniorage, Banking and the Optimal Quantity of
Money, Journal of Banking and Finance, Vol. 21, No. 6, June, pp. 781-96. (4) Bank of Canada (2013): Seigniorage, [https://www.bankofcanada.ca/wp-
content/uploads/2010/11/seigniorage.pdf, access: 14.03.2019]. (5) Bank of England (2018): Bank of England Annual Report and Accounts – 2018, Bank of
England, London, [https://www.bankofengland.co.uk/-/media/boe/files/annual-report/2018/boe-2018.pdf?la=en&hash=37A60AD4BB7912B2A7D065A828C8B 0E30B5 9C1B6].
(6) Bénassy-Quéré A., Cœuré B., Jacquet P., Pisani-Ferry J. (2010): Economic Policy. Theory and Practice, Oxford University Press, New York.
(7) Bindseil U. (2004): Monetary Policy Implementation: Theory, Past, Present, Oxford University Press, Oxford, New York.
(8) Bindseil U. (2018): Pre-1800 central bank operations and the origins of central banking, Mannheim University, 15 January (mimeo).
(9) Bofinger P. (2001): Monetary Policy. Goals, Institutions, Strategies, and Instruments, Oxford University Press, New York.
(10) Borio C., Disyatat P. (2009): Unconventional monetary policies: an appraisal, BIS Working Papers, Bank for International Settlements, No. 292.
(11) Burda M., Wyplosz C. (2009): Macroeconomics. A European Text, fifth edition, Oxford University Press, Oxford, New York.
(12) CEPR (2017): Euro Area Business Cycle Dating Committee: A Slow but Steady Euro Area Recovery, Centre for Economic Policy Research, 7 August, [https://cepr.org/sites/default/files/EABCDC-Findings-August-2017.pdf].
(13) Cincibuch M., Holub T., Hurník J. (2008): Central Bank Losses and Economic Convergence, Working Paper Series, No. 3, Czech National Bank, Prague, May, [http://www.cnb.cz/en/research/research_publications/cnb_wp/download/cnbwp_2008_03.pdf].
(14) Cukierman A., Edwards S., Tabellini G. (1990): Seigniorage and Political Stability, CEPR Discussion Papers, Centre for Economic Policy Research, No. 381, London.
(15) Cukierman A. (1992): Central Bank Strategy, Credibility, and Independence: Theory and Evidence, The MIT Press, Cambridge, Massachusetts, London, England.
(16) Cukrowski J. (2003): Renta emisyjna i gospodarka finansowa banku centralnego [Seigniorage and central bank finances], Wyższa Szkoła Finansów i Zarządzania w Białymstoku, Białystok.
(17) Deutsche Bundesbank (2019): Seigniorage, Glossary, Deutsche Bundesbank, [https://www.bundesbank.de/dynamic/action/en/homepage/glossary/729724/ glossary?firstLetter=S&contentId=654446#anchor-654446, access: 14.03.2019].
(18) Drazen A. (1985): A general measure of inflation tax revenue, Economic Letters, Elsevier, Vol. 17(4).
(19) ECB (2018): Monetary policy decisions, press release, European Central Bank, 14 June, [https://www.ecb.europa.eu/press/pr/date/2018/html/ecb.mp180614.en.html].
(20) ECB (2019a): Monetary policy decisions, press release, European Central Bank, 7 March [https://www.ecb.europa.eu/press/pr/date/2019/html/ecb.mp190307~7d8a9d2665.en.html].
(21) ECB (2019b): Annual Report 2018, European Central Bank, Frankfurt am Main, April. (22) ECB (2019c): What is seigniorage, European Central Bank,
[https://www.ecb.europa.eu/explainers/tell-me/html/seigniorage.en.html, access: 15.05.2019]. (23) Fed (2017): Federal Reserve issues FOMC statement, press release, Federal Reserve System,
September 20, [https://www.federalreserve.gov/newsevents/pressreleases/monetary20170920a.htm.]

27
(24) Fed (2019a): Minutes of the Federal Open Market Committee, Federal Reserve System, January 29-30, [https://www.federalreserve.gov/monetarypolicy/files/fomcminutes20190130.pdf].
(25) Fed (2019b): Minutes of the Federal Open Market Committee, Federal Reserve System, July 30-31, [https://www.federalreserve.gov/monetarypolicy/files/fomcminutes20190731.pdf].
(26) Ferguson N., Schaab A., Schularick M. (2015): Central Bank Balance Sheets: Expansion and Reduction since 1900, CESifo Working Papers, Center for Economic Studies & Ifo Institute, No. 5379, May.
(27) Financial Times (2019): RBI to pay bumper $3.9bn dividend to Indian government (by S. Mundy), 18 February.
(28) Fischer S. (1982): Seigniorage and the Case for a National Money, Journal of Political Economy, Vol. 90, No. 2, April, pp. 295-313.
(29) Friedman M. (1971): Government Revenue from Inflation, The Journal of Political Economy, University of Chicago Press, Vol. 79, No. 4.
(30) Goodhart C. (1988): The Evolution of Central Banks, The MIT Press, Cambridge, Massachusetts, London, England.
(31) Gros D. (1989): Seigniorage in the EC: The Implications of the EMS and Financial Market Integration, IMF Working Paper, WP/89/7, January 23.
(32) Hochreiter E., Rovelli R. (2002): The Generation and Distribution of Central Bank Seigniorage in the Czech Republic, Hungary and Poland, Banca Nazionale del Lavoro Quarterly Review, Banca Nazionale del Lavoro, December.
(33) Homer S., Sylla R.E. (2005): A History of Interest Rates, 4th edition, John Wiley & Sons Hoboken, New Jersey.
(34) Jobst C., Kernbauer H. (2016): The Quest for Stable Money. Central Banking in Austria, 1816-2016, Campus, Frankfurt am Main.
(35) Jobst C., H. Stix (2017): Doomed to disappear? The surprising return of cash across time and across countries, Centre for Economic Policy Research, Discussion Paper DP12327, London, September.
(36) Keynes J. M. (1923): A Tract on Monetary Reform, Macmillan and Co., Limited St. Martin's Street, London.
(37) Lavoie M., Fiebiger B. (2018): Unconventional monetary policies, with a focus on quantitative easing, European Journal of Economics and Economic Policies: Intervention, Vol. 15, No. 2, pp. 139-46.
(38) NBER (2010): September 20, 2010 announcement of June 2009 business cycle trough/end of last recession, National Bureau of Economic Research, [http://www.nber.org/cycles/sept2010.pdf].
(39) NBP (1997): The Act on Narodowy Bank Polski, Journal of Laws 2017, item 1337 with later amendments.
(40) NBP (2018): Annual Report 2017. Banking Sector Liquidity, Monetary Policy Instruments of Narodowy Bank Polski, Warsaw, [http://www.nbp.pl/en/publikacje/instruments/instruments2017.pdf].
(41) Neumann M.J.M. (1992): Seigniorage in the United States: How Much Does the U.S. Government Make from Money Production?, Federal Reserve Bank of St. Louis Review, Vol. 74, No. 2, March/April.
(42) Neumann M.J.M. (1996): A comparative study of seigniorage: Japan and Germany, BOJ Monetary and Economic Studies, Bank of Japan, Vo. 14, No. 1.
(43) Phelps E.S. (1973): Inflation in the Theory of Public Finance, The Swedish Journal of Economics, Vol. 75, No. 1.
(44) Polański Z. (2017): Stabilization Policies and Structural Developments: Poland and the Crises of 1929 and 2008, CASE Working Papers, No. 9 (133), Warsaw, [http://www.case-research.eu/index/?id=f30f224f1a61462305b7c1040e32676a].
(45) Riksbank (2017): The Riksbank’s e-krona project. Report 1, Sveriges Riksbank, Stockholm, September, [https://www.riksbank.se/globalassets/media/rapporter/e-krona/2017/rapport_ekrona_uppdaterad_170920_eng.pdf].
28
(46) Riksbank (2018): The Riksbank’s e-krona project. Report 2, Sveriges Riksbank, Stockholm, October, [https://www.riksbank.se/globalassets/media/rapporter/e-krona/2018/the-riksbanks-e-krona-project-report-2.pdf].
(47) Rogoff K. S. (2016): The Curse of Cash, Princeton University Press, Princeton and Oxford. (48) Sargent T.J., Velde F.R. (2003): The Big Problem of Small Change, Princeton University
Press, Princeton and Oxford. (49) Schnabl G. (2016): Central Banking and Crisis Management from the Perspective of Austrian
Business Cycle Theory, CESifo Working Paper, Center for Economic Studies & Ifo Institute, No. 6179.
(50) Shirai S. (2017): Mission Incomplete. Reflating Japan’s Economy, Asian Development Bank Institute, Tokyo.
(51) Singleton, J. (2011): Central Banking in the Twentieth Century, Cambridge University Press, Cambridge.
(52) SNB (2015): Swiss National Bank discontinues minimum exchange rate and lowers interest rate to -0,75%, press release, Swiss National Bank, 15 January.
(53) SNB (2019): Annual Report 2018, Swiss National Bank, Berne and Zurich, [https://www.snb.ch/en/iabout/pub/annrep/id/pub_annrep_2018].
(54) Stella P., Lönnberg A. (2008): Issues in Central Bank Finance and Independence, IMF Working Paper, International Monetary Fund, No. 37, [https://www.imf.org/external/pubs/ft/wp/2008/wp0837.pdf].
(55) Svensson L.E.O. (2014): Inflation Targeting and “Leaning against the Wind”, International Journal of Central Banking, Vol. 10, No. 2, June, pp. 103-114, [http://www.ijcb.org/journal/ijcb14q2a5.pdf].
(56) Szadkowski M. (2017): Koncepcja senioratu a gospodarka finansowa banku centralnego [The concept of seigniorage and central bank finances], unpublished PhD dissertation, SGH Warsaw School of Economics, Warsaw.
(57) Ugolini S. (2011): What do we really know about the long-term evolution of central banking? Evidence from the past, insights for the present, Working Paper, Norges Bank, [https://www.norges-bank.no/globalassets/upload/english/publications/working-papers/2011/wp_2011_15.pdf].
(58) Ugolini S. (2017): The Evolution of Central Banking: Theory and History, Palgrave Macmillan, London.
(59) Walsh C.E. (2003): Monetary Theory and Policy, The MIT Press, Cambridge, Massachusetts, London, England.
(60) Wernik A. (2011): Finanse publiczne. Cele, struktury, uwarunkowania [Public finance. Goals, structures, conditions], 2nd edition, Polskie Wydawnictwo Ekonomiczne, Warszawa.

29
Appendixes Appendix 1. Definitions and estimates of seigniorage Table 1A.1. A survey of selected definitions of seigniorage: economic literature
Author Definition Comment Bénassy-Quéré et al. (2010: 307)
Seigniorage – “income from money creation”; “is a tax levied on money holders”; can be measured as “the increase in base money (…) over a given period” or as “the opportunity cost of holding base money.”
Base-money-based definition.
Bofinger (2001: 369-72) Seigniorage – “the difference between the face value of the money issued by the State (Banknotes, coins, and central bank balances) and their relatively low production costs.” Monetary seigniorage – “assumption that any increase in the monetary base is identical to a revenue of the government”; “normally defined as a real magnitude.” Fiscal seigniorage – “provides a good description of the revenues that a government obtains from owing a central bank. It is almost identical with the central bank profit in those countries where outright open-market operations do not play a major role”; “normally defined as a real magnitude.”
Base-money-based definition.
Burda and Wyplosz (2009: 532)
Seigniorage – “exploitation by the government of the monopoly power of the central bank to create money as a means of raising real resources”
Base-money-based definition.
Cukierman (1992: 47) Seigniorage revenues – “the amount of real resources bought by the government by means of new base money injections.” Seigniorage – “measured in terms of the increase in base money as a percentage of total government revenues inclusive of the increase in base money.”
Base-money-based definition.
Goodhart (1988: 21) “Even when private note issues are not legal tender, the issuers obtain seigniorage, i.e. the margin between the rate of interest, generally zero (…) on the notes and the interest on the (default-free) assets held by the private note issuers against such note liabilities.”
Cash-based definition. May refer to private and public issuers.
Jobst and Kernbauer (2016: 77)
Seigniorage: - originally: “Profit resulting from the difference between the face value of coins and the lower cost of coin metal and production.” - today: “Profit accruing to the central bank because it does not pay interest on its banknote liabilities but receives interest on its assets.”
Cash-based definition.
Rogoff (2016: 81-2) Seigniorage – “the government’s total profit from printing money – including both the inflation tax and the monopoly rents accrued by accommodating greater real demand.” Monetary seigniorage – “extent the government is able to spend beyond its means each year by printing money and spending it.”
Cash-based definition.

30
Sargent and Velde (2013: 376) Seigniorage – “Fee charged on the coining of money to cover production costs and to provide revenue to the king. Also, profit earned by the monetary authority from the issue of currency.”
Cash-based definition.
Singleton (2011: 5) Seigniorage – income “generated when the central bank uses non-interest-bearing notes to purchase securities that do pay interest.”
Cash-based definition.
Source: own compilation based on publications mentioned in the first column (for more details see references). Table 1A.2. A survey of selected definitions of seigniorage: central banks
Central banks Definition CommentBank of Canada (2013) “Seigniorage is the revenue earned from the issue of money. (…) In Canada today, seigniorage
can be calculated as the difference between the interest the Bank of Canada earns on a portfolio of Government of Canada securities—in which it invests the total value of all bank notes in circulation—and the cost of issuing, distributing, and replacing those notes.”
Cash-based definition (only banknotes).
Deutsche Bundesbank (2019)
The term "seigniorage" originally referred to the profit the holder of minting rights ("seigneur") could generate from minting coins. (…) Despite changes in minting and minting rights, the term seigniorage is still in use today. However, its definition has become vaguer and broader in scope, sometimes being referred to as the profit generated by a central bank when it creates money and sometimes to the profit a central bank makes in general.
Relativity and subjectivity of definition stressed.
ECB (2019c) “The central bank earns interest on the money it lends, or receives a return on the assets it acquires – and this is called seigniorage income.”
Source: own compilation based on publications mentioned in the first column (for more details see references).

31
Table 1A.3. A survey of estimates of seigniorage Author Estimates Comment
Fischer (1982) Seigniorage in the range from 0.3 per cent of GNP (France 1973-78) to 6.2 percent of GNP (Argentina 1960-75).
Measured as the average of the change in high-powered money as a per cent of GNP.
Gross (1989) Seigniorage in the range from 2.42 per cent of GDP (Greece) to 0.33 per cent of GDP (United Kingdom).
Opportunity cost definition of seigniorage; estimates for 1987.
Rogoff (2016) Seigniorage in the range from -0.06 per cent of GDP (Sweden) to 1.37 per cent of GDP (Russia).
Monetary seigniorage approach; seigniorage revenue/GDP, 2006-15 average.
Singleton (2011: 171-2) “The central bank is the goose that lays the golden egg for the government. (…) The relatively autonomous free-range goose can bring in seigniorage revenue of up to 1 per cent of GDP. By imposing an inflation tax on citizens, the battery farm goose can bring in seigniorage worth between 5 and 10 per cent of GDP for an extended period. Finally, the force-fed goose can engineer an inflation tax that yields up to 25 per cent of GDP for the government until the inevitable collapse.”
No source of estimates provided.
Szadkowski (2017) Seigniorage ranged from 0.05 per cent of GDP to 0.26 per cent of GDP.
Averages for 45 central banks; 2003-12 period.
Source: own compilation based on publications mentioned in the first column (for more details see references).
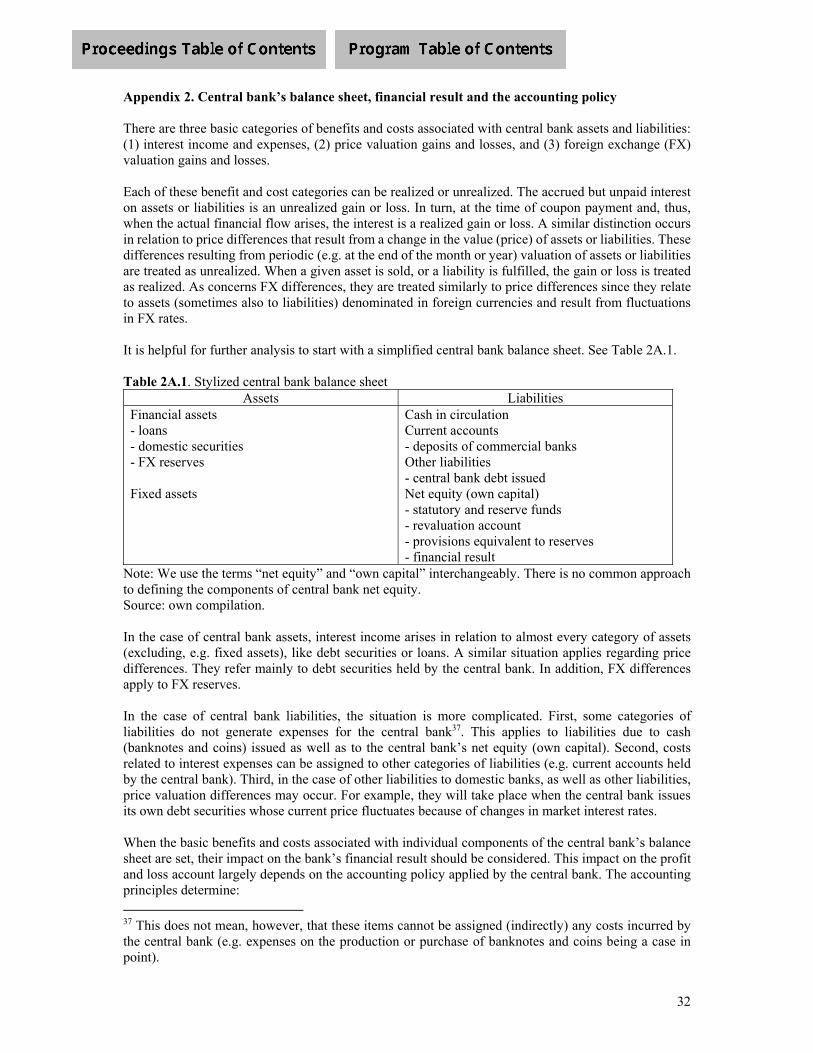
32
Appendix 2. Central bank’s balance sheet, financial result and the accounting policy There are three basic categories of benefits and costs associated with central bank assets and liabilities: (1) interest income and expenses, (2) price valuation gains and losses, and (3) foreign exchange (FX) valuation gains and losses. Each of these benefit and cost categories can be realized or unrealized. The accrued but unpaid interest on assets or liabilities is an unrealized gain or loss. In turn, at the time of coupon payment and, thus, when the actual financial flow arises, the interest is a realized gain or loss. A similar distinction occurs in relation to price differences that result from a change in the value (price) of assets or liabilities. These differences resulting from periodic (e.g. at the end of the month or year) valuation of assets or liabilities are treated as unrealized. When a given asset is sold, or a liability is fulfilled, the gain or loss is treated as realized. As concerns FX differences, they are treated similarly to price differences since they relate to assets (sometimes also to liabilities) denominated in foreign currencies and result from fluctuations in FX rates. It is helpful for further analysis to start with a simplified central bank balance sheet. See Table 2A.1. Table 2A.1. Stylized central bank balance sheet
Assets LiabilitiesFinancial assets - loans - domestic securities - FX reserves Fixed assets
Cash in circulation Current accounts - deposits of commercial banks Other liabilities - central bank debt issued Net equity (own capital) - statutory and reserve funds - revaluation account - provisions equivalent to reserves - financial result
Note: We use the terms “net equity” and “own capital” interchangeably. There is no common approach to defining the components of central bank net equity. Source: own compilation. In the case of central bank assets, interest income arises in relation to almost every category of assets (excluding, e.g. fixed assets), like debt securities or loans. A similar situation applies regarding price differences. They refer mainly to debt securities held by the central bank. In addition, FX differences apply to FX reserves. In the case of central bank liabilities, the situation is more complicated. First, some categories of liabilities do not generate expenses for the central bank37. This applies to liabilities due to cash (banknotes and coins) issued as well as to the central bank’s net equity (own capital). Second, costs related to interest expenses can be assigned to other categories of liabilities (e.g. current accounts held by the central bank). Third, in the case of other liabilities to domestic banks, as well as other liabilities, price valuation differences may occur. For example, they will take place when the central bank issues its own debt securities whose current price fluctuates because of changes in market interest rates. When the basic benefits and costs associated with individual components of the central bank’s balance sheet are set, their impact on the bank’s financial result should be considered. This impact on the profit and loss account largely depends on the accounting policy applied by the central bank. The accounting principles determine: 37 This does not mean, however, that these items cannot be assigned (indirectly) any costs incurred by the central bank (e.g. expenses on the production or purchase of banknotes and coins being a case in point).

33
- whether the given benefits or costs are identified by the bank, - whether the benefits or costs, which are identified by the bank, are included in its financial result,
and - how these benefits and costs are included in the financial result.
Regarding the first issue, it is worth bearing in mind that some central banks do not recognize, as part of their financial management, all sources of benefits and costs associated with assets and liabilities (for more details on the practice of the seven central banks discussed in the paper see Table 2A.2 at the end of the appendix). Most often this concerns price and FX differences, in the part regarding unrealized income and costs; such banks, therefore, do not recognize unrealized price and/or FX gains or losses. This means that they do not mark-to-market their assets and liabilities; instead, they use a historical cost approach as the main valuation policy. However, this means that only when the assets are sold, or the liabilities are settled, do the gains or losses relating to price or FX changes appear in their balance sheets38. The second issue concerns the recognition of certain income and expense items in the profit and loss account of the central bank. Some banks (see Table 2A.2) identify valuation gains and losses, but do not include them or include only partially in their financial result. This is because central banks often subordinate their financial management to the prudence principle. Unrealized gains (sometimes also unrealized losses) are not part of the bank’s financial result due to their risky nature. Instead, they are recorded directly in a “revaluation account” on the liabilities side of the balance sheet, forming part of the central bank’s net equity (see Table 2A.1). Thanks to this, they are not subject to further distribution and subsequent transfers to the government39. Another manifestation of the prudence principle in central banks’ accounting policies is the creation of provisions (called “provisions equivalent to reserves”). Such provisions are mainly used to cover the financial risks faced by central banks. Thus, central banks can withhold part of the income in one year in order to use it to cover losses materialized due to the financial risk in another year40. Finally, the third issue refers to the way income and expenses are calculated in the financial result of the central bank with respect to, inter alia, the recording date. It is possible to include income and expenses using the accrual principle, i.e. recognizing them in the accounting period in which they are earned or incurred. An alternative is the cash settlement method, i.e. recognizing income and expenses in the period in which they are received or paid. When discussing the way of recognizing income and expenses in the financial result, the method used to calculate them should also be considered. This applies, for example, to such matters as the method of calculating price and FX rate differences, or the method of calculating interest on income or expenses (straight-line vs internal rate of return41). Generally speaking, accounting policies currently used by central banks worldwide can be divided into three types: - International Financial Reporting Standards (IFRS), - Eurosystem’s accounting principles (rules), and - other accounting principles (own or national accounting).
38 As the difference between the sale price and historical cost which is taken to the profit and loss account. 39 Until they are realized when they are included in the profit and loss account. 40 The creation of provisions is taken to the financial result as an expense while their usage is recognized as income. 41 Straight-line means the calculation of income or expense at the rate proportional to the time allotted (pro rata temporis). The internal rate of return method means calculation of income or expense using the discount rate at which the accounting value of a financial asset or liability (e.g. debt security) is equal to the present value of future cash flows.

34
In principle, all accounting rules envisage that interest income or expenses on financial assets or liabilities are included in central banks’ profit and loss accounts on an accrual basis. As regards recording valuation results, however, there is no common approach: The Bank of England and the Swiss National Bank record unrealized gains and losses in their profit
and loss account42; The Eurosystem’s central banks, the National Bank of Poland and the Swedish Riksbank take only
unrealized losses at year-end to their profit and loss account with some exceptions43. According to the prudence principle unrealized gains are recorded in the revaluation account on the liabilities side of balance sheet (see Table 2.A.1) – thus central banks do not distribute unrealized gains to the government;
The Bank of Japan does not record unrealized gains and losses in the profit and loss account with the exception of price revaluation of foreign currency-denominated bonds and mutual funds instruments as well as FX revaluation of foreign currency-denominated assets and liabilities;
The Federal Reserve System does not record unrealized gains and losses in the profit and loss account apart from FX revaluation of foreign currency-denominated assets and liabilities.
Table 2A.2. compares the accounting principles applied by the studied central banks.
42 The Bank of England distinguishes also financial assets available for sale which are valued at current market price but gains and losses are recorded in the financial result when the financial asset is derecognized or impaired. 43 E.g. debt securities held for monetary policy purposes in the Eurosystem which are valued at amortized cost adjusted for impairment or debt securities issued by the NBP which are valued at nominal price (face value).
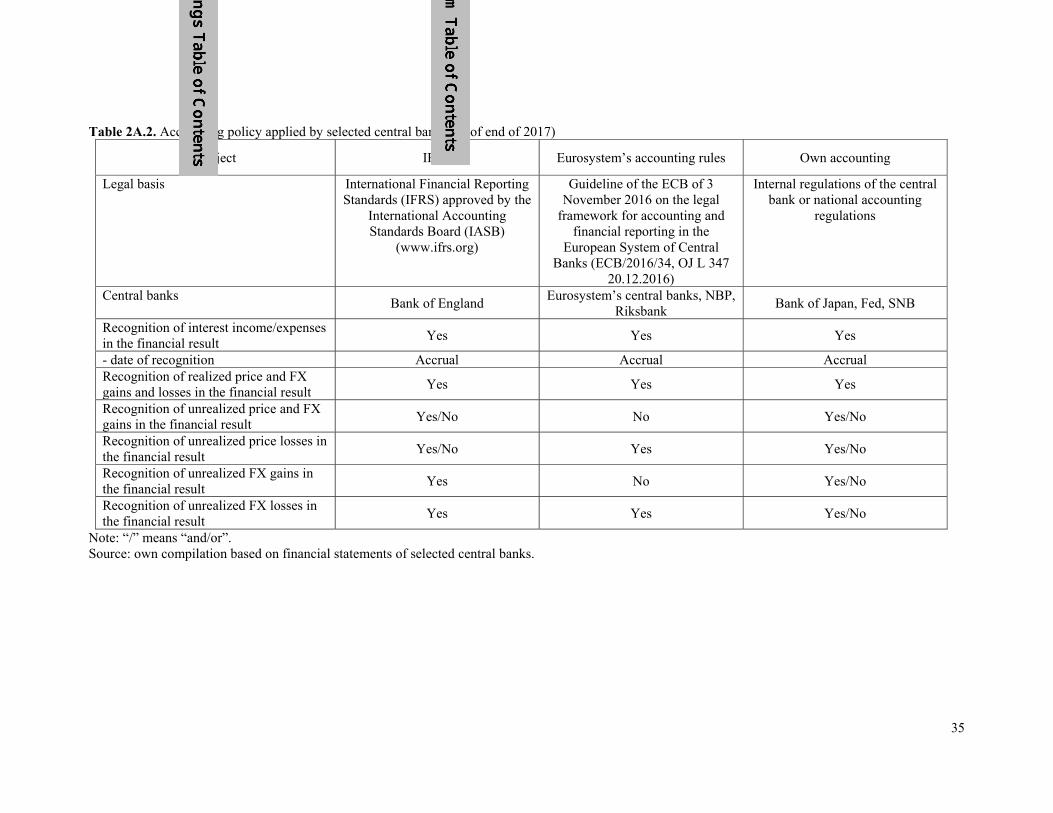
35
Table 2A.2. Accounting policy applied by selected central banks (as of end of 2017)
Subject IFRS Eurosystem’s accounting rules Own accounting
Legal basis International Financial Reporting Standards (IFRS) approved by the
International Accounting Standards Board (IASB)
(www.ifrs.org)
Guideline of the ECB of 3 November 2016 on the legal
framework for accounting and financial reporting in the
European System of Central Banks (ECB/2016/34, OJ L 347
20.12.2016)
Internal regulations of the central bank or national accounting
regulations
Central banks Bank of England
Eurosystem’s central banks, NBP, Riksbank
Bank of Japan, Fed, SNB
Recognition of interest income/expenses in the financial result
Yes Yes Yes
- date of recognition Accrual Accrual Accrual Recognition of realized price and FX gains and losses in the financial result
Yes Yes Yes
Recognition of unrealized price and FX gains in the financial result
Yes/No No Yes/No
Recognition of unrealized price losses in the financial result
Yes/No Yes Yes/No
Recognition of unrealized FX gains in the financial result
Yes No Yes/No
Recognition of unrealized FX losses in the financial result
Yes Yes Yes/No
Note: “/” means “and/or”. Source: own compilation based on financial statements of selected central banks.

36
Appendix 3. Additional figures and tables Figure 3A.1. GDP growth in seven monetary areas, 2003-18 Panel a. GDP growth (constant prices) in seven monetary areas, 2003-18 (2002 = 100)
Source: Ameco database (access: 8 May 2019). Panel b. GDP growth (constant prices) in 7 monetary areas, 2003-18 (year-on-year, in %)
Source: as above.
Figure 3A.2. Risk premium: euro area 2010-18 (spreads in p.p.)
Note: daily spreads between yields on 10-year Treasury bonds of a country and a similar German bond. Source: NBP calculations based on Reuters DataStream (last observation: 10 April 2019).
100
110
120
130
140
150
160
170
180
190
2003 2004 2005 2006 2007 2008 2009 2010 2011 2012 2013 2014 2015 2016 2017 2018
Euro area Japan Poland Sweden Switzerland United Kingdom USA
‐6
‐4
‐2
0
2
4
6
8
2003 2004 2005 2006 2007 2008 2009 2010 2011 2012 2013 2014 2015 2016 2017 2018
Euro area Japan Poland Sweden Switzerland United Kingdom USA

37
Appendix 4. Seigniorage calculation, financial result and remittance to state budgets of selected central banks Table 4A.1. Seigniorage calculations according to variant I in relation to current GDP in selected central banks, 2003-18 (in %)
Seigniorage SI
BoE BoJ ECB Fed NBP Riksbank SNB2003 ‐ ‐ 0.07 0.17 0.18 0.10 0.12
2004 ‐ 0.03 0.08 0.16 0.26 0.09 0.23
2005 ‐ 0.04 0.12 0.20 0.18 0.10 0.16
2006 ‐ 0.08 0.18 0.24 0.24 0.11 0.07
2007 ‐ 0.12 0.24 0.25 0.28 0.12 0.15
2008 ‐ 0.12 0.29 0.15 0.24 0.07 0.13
2009 ‐ 0.09 0.16 0.17 0.19 0.05 0.13
2010 ‐ 0.08 0.15 0.21 0.15 0.04 0.18
2011 ‐ 0.08 0.16 0.20 0.13 0.05 0.16
2012 ‐ 0.07 0.17 0.18 0.11 0.03 0.13
2013 ‐ 0.07 0.12 0.18 0.12 0.02 0.14
2014 ‐ 0.06 0.09 0.19 0.12 0.01 0.12
2015 ‐ 0.06 0.07 0.18 0.13 0.01 0.13
2016 ‐ 0.04 0.04 0.19 0.12 0.01 0.13
2017 ‐ 0.04 0.03 0.19 0.12 0.00 0.13
2018 ‐ 0.04 0.04 0.20 0.09 0.00 0.13 Notes: (1) for the Bank of England we calculated only variant II of seigniorage. As was mentioned the Bank of England prepares a separate balance sheet for the Issue Department and, consequently, a separate profit and loss statement. Since there is no possibility to separate interest income and other gains in the profit and loss account of the Issue Department, it was not possible to calculate variant I of seigniorage; (2) seigniorage for the Eurosystem is calculated for each national central bank separately and then summed up. Although the ECB publishes the Eurosystem’s balance sheet, it does not present Eurosystem’s aggregated profit and loss account. Moreover, the ECB is entitled to issue banknotes. Coins are issued by individual governments; however, some countries passed this right to national central banks (see Table 1). In such a case central banks present coins issued as other liabilities. For the Eurosystem as a whole we calculated seigniorage only in relation to banknotes issued; (3) in 2018, seigniorage for the Eurosystem does not include Banka Slovenije (central bank of Slovenia) since it has not yet published its Annual Report for 2018; (4) the Bank of Japan did not publish its profit and loss account for 2003 in English. Source: own calculations based on Annual Reports of selected central banks and Ameco database (access: 8 May 2019).

38
Table 4A.2. Seigniorage calculations according to variant II in relation to current GDP in selected central banks, 2003-18 (in %)
Seigniorage SII
BoE BoJ ECB Fed NBP Riksbank SNB 2003 0.10 ‐ ‐0.01 0.20 0.23 ‐0.17 0.29
2004 0.12 0.06 0.03 0.17 ‐0.66 ‐0.04 0.04
2005 0.12 0.08 0.16 0.18 0.06 0.08 0.91
2006 0.11 0.14 0.19 0.24 0.09 0.16 0.37
2007 0.15 0.11 0.21 0.26 ‐0.38 0.09 0.52
2008 0.14 0.09 0.29 0.15 0.24 0.10 ‐0.18
2009 0.03 0.07 0.19 0.16 0.72 0.08 0.32
2010 0.03 0.02 0.16 0.23 0.23 0.01 ‐0.70
2011 0.05 0.08 0.16 0.20 0.35 0.05 0.38
2012 0.03 0.14 0.19 0.22 0.31 0.03 0.13
2013 0.03 0.12 0.13 0.18 0.04 0.00 ‐0.18
2014 0.03 0.12 0.11 0.19 0.25 0.02 0.72
2015 0.02 0.05 0.09 0.18 0.38 0.01 ‐0.44
2016 0.02 0.05 0.06 0.19 0.33 0.02 0.37
2017 0.01 0.05 0.04 0.20 ‐0.16 0.00 0.78
2018 0.02 0.08 0.04 0.21 0.34 0.01 ‐0.25 Notes: as in table 4A.1 and: (1) Riksbank has been publishing its own seigniorage calculations in the Annual Reports since 2008. Although it is based on similar assumptions we made in this paper, unrealized losses on price and FX valuation are not treated as part of seigniorage. Therefore, we used our own calculations, (2) in case of the Bank of England the estimated seigniorage is equal to the financial result of the Issue Department. Source: as in Table 4A.1. Table 4A.3. Financial result in relation to current GDP in selected central banks, 2003-18 (in %)
Financial result
BoE BoJ ECB Fed NBP Riksbank SNB 2003 0.10 ‐ 0.04 0.20 0.50 ‐0.35 0.49
2004 0.13 0.08 0.02 0.18 0.47 ‐0.10 4.23
2005 0.13 0.11 0.13 0.18 0.12 0.11 2.36
2006 0.13 0.18 0.13 0.25 0.24 0.25 0.77
2007 0.16 0.13 0.15 0.27 ‐1.05 0.12 1.26
2008 0.20 0.08 0.19 0.26 0.00 0.33 ‐0.96
2009 0.05 0.07 0.24 0.36 0.30 0.43 1.17
2010 0.04 0.01 0.16 0.54 0.45 0.02 ‐3.54
2011 0.06 0.11 0.16 0.51 0.55 0.11 1.59
2012 0.04 0.17 0.26 0.56 0.34 0.05 0.38
2013 0.04 0.20 0.25 0.47 0.00 ‐0.05 ‐1.42
2014 0.04 0.26 0.20 0.58 0.00 0.08 5.90
2015 0.04 0.10 0.19 0.55 0.46 0.05 ‐3.55
2016 0.03 0.13 0.18 0.49 0.49 0.16 3.71
2017 0.02 0.16 0.20 0.41 ‐0.13 0.09 8.13
2018 0.03 0.20 0.24 0.31 0.00 0.07 ‐2.16
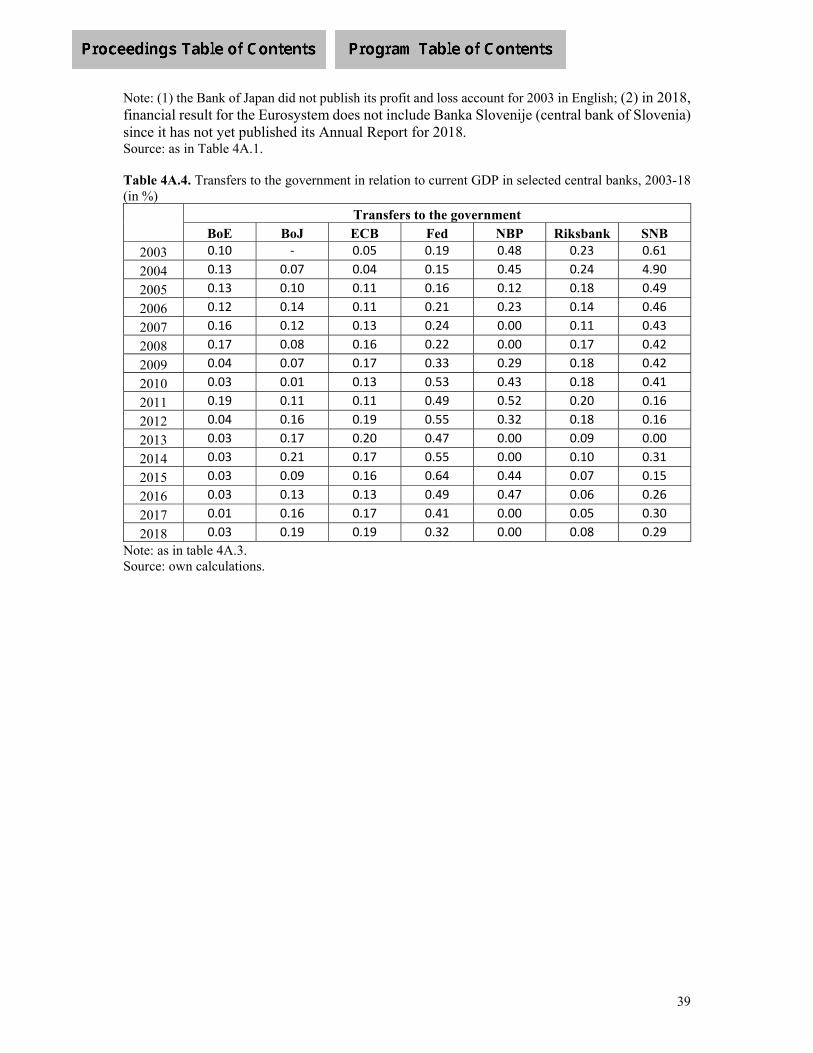
39
Note: (1) the Bank of Japan did not publish its profit and loss account for 2003 in English; (2) in 2018, financial result for the Eurosystem does not include Banka Slovenije (central bank of Slovenia) since it has not yet published its Annual Report for 2018. Source: as in Table 4A.1. Table 4A.4. Transfers to the government in relation to current GDP in selected central banks, 2003-18 (in %)
Transfers to the government
BoE BoJ ECB Fed NBP Riksbank SNB 2003 0.10 ‐ 0.05 0.19 0.48 0.23 0.61
2004 0.13 0.07 0.04 0.15 0.45 0.24 4.90
2005 0.13 0.10 0.11 0.16 0.12 0.18 0.49
2006 0.12 0.14 0.11 0.21 0.23 0.14 0.46
2007 0.16 0.12 0.13 0.24 0.00 0.11 0.43
2008 0.17 0.08 0.16 0.22 0.00 0.17 0.42
2009 0.04 0.07 0.17 0.33 0.29 0.18 0.42
2010 0.03 0.01 0.13 0.53 0.43 0.18 0.41
2011 0.19 0.11 0.11 0.49 0.52 0.20 0.16
2012 0.04 0.16 0.19 0.55 0.32 0.18 0.16
2013 0.03 0.17 0.20 0.47 0.00 0.09 0.00
2014 0.03 0.21 0.17 0.55 0.00 0.10 0.31
2015 0.03 0.09 0.16 0.64 0.44 0.07 0.15
2016 0.03 0.13 0.13 0.49 0.47 0.06 0.26
2017 0.01 0.16 0.17 0.41 0.00 0.05 0.30
2018 0.03 0.19 0.19 0.32 0.00 0.08 0.29 Note: as in table 4A.3. Source: own calculations.

1
CORPORATE GOVERNANCE AND INVESTMENT DECISIONS:
AN EXPERIMENTAL STUDY ON REAL INVESTORS
Dr. ATM Tariquzzaman*
Professor Ian Eggleton
Professor Tony van Zijl
School of Accounting and Commercial Law,
Victoria University of Wellington,
New Zealand.
*Corresponding author: [email protected]

2
Abstract
The main purpose of the study is to examine whether investors assign importance to corporate
governance in making investment decisions. The study involves a 2x2x2 between-participant
laboratory experiment on real investors in Bangladesh that examines the effects of corporate
governance structure, financial condition and insider trading on individual investor decisions1.
The findings of this study extend the literature on corporate board practices and investor
perceptions by providing evidence from the emerging economy that strong corporate
governance has a positive impact on investor decisions. The study also confirms the findings
of prior literature that the financial condition of a company positively influences investor
decisions. Hence, the results provide insights into the effects of strengthening corporate
governance guidelines and of variation in financial condition on investor decisions. The study
provides evidence that the common occurrence of illegal insider trading in the emerging market
of Bangladesh does not appear to impact on investor decision making, unlike in developed
countries.
The results of this study also contribute to understanding of how the quality of corporate
governance impacts decision making. It appears that governance directly impacts the perceived
reliability of financial reports and trust in the board and management.
The theoretical model and instrument developed for this study will be useful for further studies
to explore the impact of other corporate governance factors on investor decisions. Furthermore,
the theoretical model and instrument will also be useful for further studies in other countries,
particularly where insider trading is regarded by investors as being a concern and to investigate
the impact of other corporate governance factors on investors and financial analysts.
Keywords: Corporate Governance, Board of Directors, Insider Trading, Financial Reports,
Reliability, Trust and Investment Decisions.
Acknowledgment: ATM Tariquzzaman is grateful to Professors Ian Egletton, Jake Rose and
Tony van Zijl for their supervision of PhD thesis, from which this paper is drawn.
1 The study uses the terms corporate governance quality and board quality interchangeably.
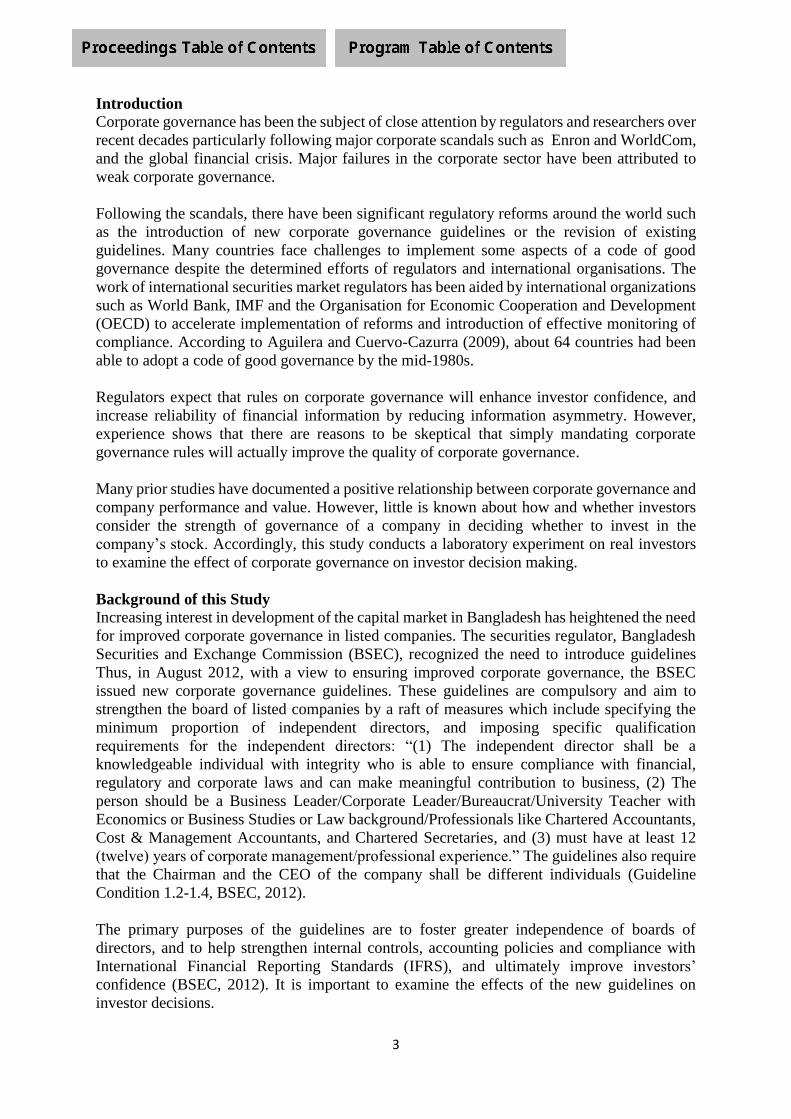
3
Introduction
Corporate governance has been the subject of close attention by regulators and researchers over
recent decades particularly following major corporate scandals such as Enron and WorldCom,
and the global financial crisis. Major failures in the corporate sector have been attributed to
weak corporate governance.
Following the scandals, there have been significant regulatory reforms around the world such
as the introduction of new corporate governance guidelines or the revision of existing
guidelines. Many countries face challenges to implement some aspects of a code of good
governance despite the determined efforts of regulators and international organisations. The
work of international securities market regulators has been aided by international organizations
such as World Bank, IMF and the Organisation for Economic Cooperation and Development
(OECD) to accelerate implementation of reforms and introduction of effective monitoring of
compliance. According to Aguilera and Cuervo-Cazurra (2009), about 64 countries had been
able to adopt a code of good governance by the mid-1980s.
Regulators expect that rules on corporate governance will enhance investor confidence, and
increase reliability of financial information by reducing information asymmetry. However,
experience shows that there are reasons to be skeptical that simply mandating corporate
governance rules will actually improve the quality of corporate governance.
Many prior studies have documented a positive relationship between corporate governance and
company performance and value. However, little is known about how and whether investors
consider the strength of governance of a company in deciding whether to invest in the
company’s stock. Accordingly, this study conducts a laboratory experiment on real investors
to examine the effect of corporate governance on investor decision making.
Background of this Study
Increasing interest in development of the capital market in Bangladesh has heightened the need
for improved corporate governance in listed companies. The securities regulator, Bangladesh
Securities and Exchange Commission (BSEC), recognized the need to introduce guidelines
Thus, in August 2012, with a view to ensuring improved corporate governance, the BSEC
issued new corporate governance guidelines. These guidelines are compulsory and aim to
strengthen the board of listed companies by a raft of measures which include specifying the
minimum proportion of independent directors, and imposing specific qualification
requirements for the independent directors: “(1) The independent director shall be a
knowledgeable individual with integrity who is able to ensure compliance with financial,
regulatory and corporate laws and can make meaningful contribution to business, (2) The
person should be a Business Leader/Corporate Leader/Bureaucrat/University Teacher with
Economics or Business Studies or Law background/Professionals like Chartered Accountants,
Cost & Management Accountants, and Chartered Secretaries, and (3) must have at least 12
(twelve) years of corporate management/professional experience.” The guidelines also require
that the Chairman and the CEO of the company shall be different individuals (Guideline
Condition 1.2-1.4, BSEC, 2012).
The primary purposes of the guidelines are to foster greater independence of boards of
directors, and to help strengthen internal controls, accounting policies and compliance with
International Financial Reporting Standards (IFRS), and ultimately improve investors’
confidence (BSEC, 2012). It is important to examine the effects of the new guidelines on
investor decisions.

4
Problem Statements, Objectives of this Study and Research Questions
Prior research indicates that individual investors take information on corporate governance into
account for investment judgments and decisions (Chang & Wei, 2011). One of the reasons for
considering information on corporate governance is that better financial performance has been
shown to be correlated with corporate governance (e.g., Gompers, Ishii, & Metrick, 2003 and
Cremers & Nair, 2005) and reduced information asymmetry (Kanagaretnam, Lobo, & Whalen,
2007). The board of directors is a vital part of the corporate governance structure of a
corporation (Fama & Jensen, 1983). Gillan (2006) reported that the board of directors is the
main source of implementing corporate governance. Similarly, Boone, Field, Karpoff, &
Raheja (2007) state that the board of directors, as appointed by shareholders, are responsible
for improving corporate governance in the company. Further, the board of directors acts as the
agent of shareholders and has fiduciary duties to capital providers such as the duty of care and
duty of loyalty. A board can imrove a firm’s reputation through improving corporate
governance (Berghe & Levrau, 2004).
Sharma (2006) reported that strong corporate governance in a company leads non-professional
and professional investors to perceive lower investment risk and thus be more willing to invest.
However, little is known about the interaction with financial condition and insider trading in
impacting investment decision making. Furthermore, little is also known how these three
factors impact on perceived reliability of financial reports and trust in board and management
and how these latter two factors in turn impact on decision making.
Investigation of the role of insider trading is particularly important for Bangladesh as there is
a widespread perception that insider trading is common and that it significantly weakens the
capital market (CPD, 2011). Insider trading is regarded as undermining and reducing investor
trust and confidence in the market because insider traders have informational advantage over
other investors and earn abnormal profits (Seyhun, 1986; Lakonishok & Lee, 2001 and
Piotroski & Roulstone, 2005). These finding suggest examining not only the direct impact of
insider trading but also the link between insider trading and reliability of financial information
when corporate governance is strong or weak.
Therefore, this study addresses the following questions:
1. In emerging markets does board quality impact on investors’ decisions?
2. Does board quality impact investors’ decisions when inside information is available?
3. Does board quality impact investors’ perceived reliability of financial reports?
4. Does board quality impact perceived reliability of financial reports when inside
information is available?
5. Does board quality impact investors’ decisions when financial condition is bad?
6. Does investors perceived reliability of financial reports impact investors’ decisions?
7. Does board quality impact investors’ trust in board and management?
8. Does availability of inside information impact investors’ trust in board and
management?
9. Does investors’ trust in board and management impact investors’ decisions?
10. Does perceived reliability of financial reports impact on trust in board and
management?

5
LITERATURE REVIEW
Overall Board Quality
Prior studies have highlighted that success of a company depends on the quality of the board
of directors since the board is the core element of the corporate governance structure and plays
the central role in monitoring and controlling management ( Fama & Jensen, 1983b; Baysinger
& Butler, 1985; Adjaoud, Zeghal, & Andaleeb, 2007; Adams, Hermalin, & Weisbach, 2008).
Scholars and many organisations have found relationship between board quality and financial
performance, and stock price (Van den Berghe & Levrau, 2004).
The OECD has offered definitions of board quality based on characteristics of the directors.
They have considered the presence of a majority of independent directors who have relevant
experience and qualifications, and separation of roles of the CEO and the chairman in a board
(Kiel & Nicholson, 2003) as the key components in determining board quality. The Cadbury
(1992) and Greenbury (1995) reports have also emphasized these factors in defining the quality
of the board of directors (ICAEW, 2016).
Holder-Webb and Sharma (2010) conducted an experiment on 62 bank managers in Singapore
to examine the cause and effect of the strength of corporate governance on lender decisions. In
their study, the strength of the board was characterised by the number of independent directors,
their knowledge of finance and accounting, relevant business qualifications and industry
experience. Based on these characteristics they developed two types of board: strong and weak.
The strong board had a majority of independent directors in the board (five independent
directors of a seven-member board) of which three independent directors had finance and
accounting knowledge, all independent directors had relevant business qualifications and two
independent directors had relevant industry experience. Their model reflected regulatory
reforms in Singapore and also discussions with bank managers. They only focused on the
independent directors, and their qualifications and experience.
Sharma (2006) investigated the association between the effectiveness of a board of directors
and non-professional investor judgment. The author performed an experiment on 82 MBA
students as a proxy for non-professional investors. They constructed two different hypothetical
board structures, namely strong and weak, operationalised by the number of non-executive
directors on the board and their experience, qualifications and share ownership in the company.
Apart from the ownership criterion their model was almost identical with that of Holder-Webb
and Sharma (2010). As with Holder-Webb and Sharma (2010), the study also excluded the
issue of duality of the CEO and the Chairman.
El-Sayed Ebaid (2013) conducted an experimental study to examine the association between
corporate governance mechanism and perceived earnings quality in Egypt. The study designed
two board structures: strong and weak. A strong board had these attributes: large board size,
majority of outside directors having financial literacy and regular board meeting held at least
four times per year. They did not consider the separation of the roles of the CEO and the
chairman or having experienced independent directors.
Prior studies have commonly emphasized diverse range of skills and relevant experience of
independent directors but not the issue of separation of the roles of the chairman and the CEO.
Considering the prior literature, this study operationalizes the quality of board as characterised
by independent directors with relevant business experience, qualifications, and separation of
CEO and chairman duties and responsibilities.

6
Impact of Independent Directors
Fama and Jensen (1983a) suggest that board effectiveness in monitoring and controlling
management activities depends on the level of independence of the board. Reflecting this view,
a good number of studies have investigated the impact of the proportion of independent
directors on the board.
Clarkson, Craswell, and Mackenzie (2008) investigated the association between board
independence and shareholder wealth of targeted Australian companies. They found that the
presence of an independent board in the target firm increased the initial bid premium by 21.1%,
on average. Their findings are consistent with the view of Fama and Jensen (1983a) that
independent directors act in the interests of shareholders and are concerned for their reputation
as professionals in decision control. The study estimated competence of the non-executive
directors by average tenure on the company board. In a similar study, Cotter, Shivdasani, and
Zenner (1997) investigated the role of independent directors of target companies during
takeovers. They examined 169 tender offers in the USA during 1989-1992 and found that when
a target board contains a majority of outside directors, the shareholders receive a return
approximately 20 percentage points higher than that of a similar firm without a majority of
outside directors of the board. This finding suggests that outside directors do a better job of
negotiating on behalf of shareholders than do insider directors. Together, these two studies
suggest that the board consisting of a majority of independent directors is an important factor
in increasing the return to investors. Their findings further imply that competence of
independent directors such as relevant knowledge and skills are critical to making a
constructive contribution to the business.
Byrd and Hickman (1992) studied 128 tender-offer bids made by 111 US companies during
the period 1980-1987 to investigate the link between the presence of independent directors
and company performance. Results suggest that investor confidence increases in a company
when they observe that independent directors play an important role in monitoring and
controlling the activities of management.
Barnhart and Rosenstein (1998) investigated the joint effects of ownership structure and board
composition on corporate performance of 321 S&P 500 companies in 1990. Using step wise
regression thus found that the joint effect of the proportion of independent directors and
managerial ownership on company performance (Tobin’s Q) was positive and significant.
Their results indicate that company performance is positively related to the independence of
the directors, which is consistent with the claims of Stulz (1988), and Morck, Shleifer, and
Vishny (1988).
Setia-Atmaja, Haman, and Tanewski (2011) examined the association between board
independence and earnings management. Using panel data over the period 2000-2004 of
Australian family owned (but listed) companies they showed that the boards with a majority of
independent directors had lower earnings management. The study further claimed that the
owners of a family owned company are less likely to entrench and expropriate the assets of the
company when the majority of the directors are independent. Their findings reinforce the
previous studies of Westphal (1998), Anderson and Reeb (2004) and Setia‐Atmaja, Tanewski,
and Skully (2009) that corporate governance by independent directors limits expropriation of
wealth of the company and thus protects the interests of investors (Fama & Jensen, 1983b).
However, not all studies support value arising from independence of directors. Bhagat & Black
(1999) argued that independent directors have an adverse effect on company performance
because sometimes they are ineffective. For example, General Motors, American Express,

7
IBM, Kodak, Chrysler, Sears, Westinghouse and Borden performed badly for years despite
having a majority of independent directors on their boards (Bhagat & Black, 1999). The authors
examined the relationship between the degree of board independence and company
performance by examining 928 large US public companies for the period 1985-1995. The
evidence indicated that having a board with a majority of independent directors did not enhance
company performance.
Dalton, Daily, Ellstrand, and Johnson (1998) conducted a meta-analysis of 54 empirical studies
of board composition and 31 empirical studies on board structure to examine the relationship
with firm performance. They did not find a positive relationship between board independence
and firm financial performance.
Impact of Experienced Independent Directors
Beasley (1996) investigated 150 US listed companies to examine the link between monitoring
skills of independent directors in preparing financial reports and company earnings quality.
Using logit regression analysis the author showed that independent directors who have relevant
knowledge to monitor the preparation of financial reports reduce the probability of financial
fraud.
Kang (2013) used independent director experience as a proxy for board quality to examine the
relation between board quality and firm value. The study analysed governance quality of S&P
1500 firms during 2000-2010 and reported that the presence of independent directors who have
relevant business experience of more than 5 years duration increases firm value (as measured
by Tobin’s Q). The findings of this study imply that the experience of an independent director
in a relevant business is a key determinant of board quality.
Diestre, Rajagopalan, & Dutta, (2014) examined the relationship between the influence of
outside directors with market-specific experience and the probability of a pharmaceutical
company making successful entry into a new market. Analysis of the board composition of 125
pharmaceutical companies for 2000-2006 in the US showed that the presence of outside
directors with relevant experience increased the probability of new-market entry by 60.2%.
Their results indicate that the presence of experienced independent directors in the relevant
business strengthens board quality and improves company performance. However, Klein
(1998) argued that insider directors can also contribute to improved company performance as
a result of their superior understanding of the business. These findings suggest that relevant
knowledge and experience are important driving factors in enhancing the value of a company.
The above discussion suggests that the mere symbolic presence of independent directors does
not necessarily contribute to improved company performance. The experience of an
independent director is an important characteristic of a board for improved company
performance. In contrast, independent directors with limited relevant knowledge may adversely
affect the monitoring of management activities. For example, JP Morgan incurred losses of
billions of dollars as none of its independent directors had banking and trading experience
(Cossin & Caballero, 2012). They did not realize the risks involved in credit swap trading due
to their lack of relevant knowledge and skills. Therefore, it is observed that results are mixed
on the simple association of the number of independent directors and company performance
(Leung, Richardson, & Jaggi, 2014). However, improved performance may result when the
independent directors are skilled and knowledgeable and can thus make a meaningful
contribution to performance of a company.
8
Impact of Duality of the Chairman/CEO
Splitting the functions and responsibilities of the chairman and the CEO has been a
controversial issue in corporate governance. When these two roles are held simultaneously by
one person this results in direction from a single leader (Boyd, 1995), but may result in conflicts
of interest (Fama & Jensen, 1983b; Rechner & Dalton, 1991). This concern stems from
separation of ownership and management and thus potential control conflicts between the roles
of the chairman (monitoring and control) and CEO (management) (Fama & Jensen, 1983b).
Duality of the chairman and CEO constrains board independence and obstructs the board in
executing its oversight and governance roles properly (Baliga, Moyer, & Rao, 1996). It gives
the CEO power to dominate the board and management, which may lead to serving self-interest
at the cost of investors. However, some argue that one person holding two positions results in
power accumulation that establishes a unity of command (Daily & Dalton, 1993).
Simpson and Gleason (1999) examined the impact of board structure and composition on the
probability of financial distress of 287 banking companies. They collected data on financial
distressed companies from SNL Quarterly Bank Digest and data on CEO duality from 1989
proxy statements.2 They showed that there was a higher probability of financial distress when
one person held both the position of Chairman and CEO. Their findings indicate that one person
holding the two positions has adverse effects on company performance, investor protection,
and confidence and trust in the board and management.
Krause and Semadeni (2014) provides further insight into the duality issue. They identified
three types of separation of the roles in USA board practices, that is, (1) apprentice separation,
(2) departure separation, and (3) demotion separation (Krause & Semadeni, 2014). They
analyzed 411 companies with separated boards to examine the link between company
performance and different types of separation of the roles of the Chairman and CEO. Using
multinomial logistic regression they found that demotion separation has a significantly stronger
effect on company future performance, stock return, and analyst ratings than an apprentice
separation or departure separation. Their findings indicate that demotion separation allows the
board to be more independent than for the other two types of separation of the CEO and the
chairman. The study sheds light on the importance of board independence and separation of
the roles for board effectiveness.
In contrast to the above studies, Boyd (1995) proposed that CEO duality has a positive impact
on return on investment (ROI). This suggests that the potential for conflict between the
Chairman and CEO may negatively affects the performance of the company when the roles are
held by two different individuals. However, the actions of regulators, recommendations of
international bodies and most studies suggest that true separation of roles can enhance company
performance and value.
Insider Trading
Investors make investment decisions based on information available in the market but
information is often used by insiders for their own benefits or passed on by insiders to select
external parties. The insiders or the select external parties can thus make abnormal returns
using the private information. Such trading (‘insider trading’) is illegal in most jurisdictions
and has drawn considerable attention from regulators.
2SNL Securities determines an indicator termed ‘SNL Safety Rating’ which is similar to the CAMELS rating
developed by federal regulators.

9
Evidence from the empirical literature suggests that leakage of information from a company
often occurs in the capital market. Christophe, Ferri, and Hsieh (2010) analysed short-selling
prior to the release of analyst downgrades in a sample of 670 downgraded NASDAQ stocks
between 2000 and 2001 to examine the impact of leakage of information on trading behaviour
in the market. They found abnormal changes both in buying and selling before analyst
recommendations. The changes in trading behaviour indicates leakage of information based on
which insiders trade in the market before analyst recommendations.
Karpoff and Lee (1991) investigated insider trading before announcements of primary offerings
of common stock, convertible debt, and straight debt.3 They analysed data on common stock,
straight debt, and convertible debt offerings of 83 firms, and 179 events of insider trading
collected from CRSP during the period from 1972 to 1982 to examine manager involvement
in trading before the issuance of new offering of securities. The study found that insiders sold
their common stocks at least several months prior to the announcement of the issue of new
common stocks and convertible debt. The findings indicate that insiders sell common stock
and convertible bonds before announcement of offerings to make abnormal returns. Abnormal
profit of insiders is in effect a transfer of wealth from outsider to insiders. Earning abnormal
profits from insider trading is an exploitation of the inside information recognised in agency
theory (Jensen & Meckling, 1979).
Dai, Fu, Kang, and Lee (2013) investigated how stronger corporate governance mechanisms
can limit the ability of insiders to make abnormal profits. They used a large sample of insider
trading transactions for companies listed on the NYSE, AMEX or NASDAQ during 1998 to
2011, and considered the following governance mechanisms: board independence,
compensation structure, and institutional ownership (with the data collected from the
RiskMetrics, S&P’s ExecComp, and Thomson Reuter institutional holdings databases) to
examine the effect of governance quality on insider profitability. Using OLS regression they
found that governance quality was inversely related to the profitability of insiders. Their results
suggest that higher quality governance can limit the potential for use of private information.
THEORETICAL FRAMEWORK AND DEVELOPMENT OF HYPOTHESES
The shareholders elect the board of directors who hire managers to run the day-to-day business
of a company. In a publicly held company, managers who operate the business are not
traditionally owners, although in some instances managers hold a small fraction of the
company’s stock. This gives rise to a number of questions as to how a board of directors and
managers act in the best interests of investors, how trustworthy and reliable they are, whether
financial statements reflect the true condition of the company, and whether the board and
management are fair in dealing with disclosure requirements to prevent insider trading. The
role of directors has been examined in a large body of literature from different theoretical
perspectives such as agency theory, signaling theory, and also other theoretical structures such
as stakeholder theory, stewardship theory, transaction cost theory, resource dependency theory,
political theory and efficient market theory (Borlea & Achim, 2013). However, this study is
mainly guided by : (1) agency theory, and (2) signaling theory to examine the influence of
corporate governance on investor judgment in making investment decisions. Agency theory
captures the role of the board of directors in monitoring management activities in the interests
of shareholders/owners, including potential investors. Investor decisions are examined through
the lens of signaling theory which explains how company signals on the quality of governance
can assist investors in making investment decisions.
3Insiders is defined in this case as officers, directors, and owners of more than 10% of the company.
10
Development of Hypothesis
Quality of the board and investment decisions
The study first examines the association between board quality and investor decisions. The role
of the board in controlling and monitoring management can be explained by agency theory –
the presence of information asymmetry and divergent interests. The shareholders as principal
appoint the board as an agent to perform tasks on their behalf. The purpose of appointing the
board is to protect the interests of the shareholders ( Jensen & Meckling, 1979; Porta, Lopez-
de-Silanes, Shleifer, & Vishny, 1998; Jensen, 2003). The board monitors the day to day
functions of management and exercises control over significant decisions to improve firm
performance and promote the interests of shareholders (Hillman & Dalziel, 2003). Through
proper monitoring and control of management the board can promote the likelihood of high
quality operating decisions and reduce the potential for manipulation of financial statements
(Beasley, 1996; Klein, 2002; Anderson & Reeb, 2004).
Many studies have linked board quality, as characterised by independent director experience
and true separation of roles of the CEO/chairman, with company performance and value.
Although some studies have found that board quality has no effect (Hermalin & Weisbach,
1991; Bhagat & Black, 1999), many studies have reported that board quality has either a
positive or negative effect on firm performance and value (Baysinger & Butler, 1985; Byrd &
Hickman, 1992; Cremers & Nair, 2005). Therefore, on balance, it is expected that a high quality
board will constrain managers from serving their own interests, and thus promote firm value.
Further, signaling theory suggest that a company with quality governance in place will signal
better performance (Chiang & Chia, 2005), in particular, high profitability and market value
(Bergh & Gibbons, 2011).
Hence the first hypothesis is:
H1: Investors will be more likely to invest in a company when board quality is strong, relative
to when board quality is weak.
Association between board quality, reliability (representational faithfulness) of financial
information and investment decisions
Maines and Wahlen (2006) view reliability as the degree to which a piece of accounting
information is: (1) an accounting construct that objectively represents the underlying economic
construct it purports to represent, and (2) a measurement that constructs without bias or error
using the measurement attribute it purports to use. Similarly, Frederickson, Hodge, and Pratt
(2006) described information as being reliable when it is verifiable, unbiased and measured
with certainty.
Previously, the Financial Accounting Standard Board (FASB) defined reliabity as (FASB,
1980):
“The quality of information that assures that information is reasonably free from error
and bias and faithfully represents what it purports to represent (p6)”
This definition was considered as a primary qualitative characteristics of financial information
which had three components: representational faithfulness, verifiability and neutrality. The
FASB and IASB observed user concerns over the concept of reliability including problems of
common understanding on verifiability or freedom from material error, neutrality and precision
(Downen, 2014). Whittington (2008) argued that reliability is better replaced by
representational faithfulness, which implies a greater concern for capturing economic
substance, and less with statistical accuracy. These different views were illustrative of the
debate surrounding the meaning of reliability that prompted both IASB and FASB to revisit
11
the concept of reliability in 2010 and shift from the term reliability to faithful representations
(FASB, 2010b; Erb & Pelger, 2015; IASB 2015).
Under the new framework, reliability is no longer considered as a primary quality. Faithful
representation has replaced reliability encompassing the main characteristics that the previous
framework included as aspects of reliability. These comprise completeness, neutrality and
freedom from error. It is observed in the new framework that standard setters have retained
some components of reliability. However, Erb and Pelger (2015) have argued that this
replacement has no material effect. Despite this disagreement, it is observed that ‘Faithful
Representation’ has been recognised as one of the primary characteristics of the conceptual
framework of financial reporting that plays a key role in making investment decisions. This
study used the term ‘reliability’ instead of the term ‘faithful representations’ in the
experimental instrument, as individual investor would have greater familiarity with the term
reliability.
Several studies have attempted to investigate the importance of reliability in making investment
decisions. Frederickson, Hodge, and Pratt (2006) examined how accounting choice of stock
option expense recognition influences investor assessment of the reliability of financial
statements and the impact on their investment decisions. Conducting a 2x2 between subjects
experiment on 1000 accounting and finance graduates from major US business schools, they
found that assessments of reliability under mandated recognition exceeded reliability
assessments under voluntary recognition. They viewed voluntary footnote disclosures as being
less reliable for users. Their results suggest that choice of a company’s accounting policy
effects the perceived reliability of financial reporting.
Elliott, Jackson, and Smith (2006) examined the impact of reliability of financial information
on decision making by non-professional investors. They conducted a 1x3 between subjects
experiment on 154 graduate business students from a large state university in the US to examine
how disclosures on estimates influence investor reliability perceptions and investment-related
judgment. They found a significantly positive relation between sensitivity disclosures on
estimates and investor perceptions of the reliability of the estimate. They also showed that the
process of accounting estimates and related disclosures influences investor assessment of the
reliability of financial statements and thus their investment decisions.
Similarly, Bagnoli and Watts (2005) demonstrated that management discretionary choice of
accounting policy provides a signal to the market about the reliability of the financial
statements and the future value of the company. Their findings imply that the board, which is
responsible for overseeing the process of preparing financial statements, is an important
element in signaling to investors the reliability of financial statements. In other words, the
quality of the board and of management serve as signals to investors in making investment
decisions. These views are consistent with the claim of Zhang and Wiersema (2009) that the
CEO signals the intrinsic quality of the company to potential investors through the quality of
financial reporting.
Hodge (2003) examined the effect of earnings quality on investor assessment of the reliability
of audited financial statements and thus their investment decisions. They surveyed 414
individual investors who were members of the National Association of Investors Corporation
(NAIC) in the USA. The study found that when earnings quality declines over time, investor
perceived reliability of audited financial statements decreases. Such investor perceptions are
probably a reflection of the quality of the board that oversees the preparation of financial

12
statements. Thus, it is expected that when board quality is strengthened, information quality
will improve; in turn, investors will be better placed to assess company prospects and thus
assess the value of the shares.
Investors are often faced with a high degree of uncertainty (Watts & Zimmerman, 1986) and
information risk (Easley & O'hara, 2004) in making investment decisions. When individuals
face uncertainty they give importance to the reliability of sources of information (Birnbaum &
Stegner, 1979). Earlier, in accounting and psychology studies, it has been demonstrated that
individuals give more importance to information from a reliable source (Hirst, Koonce, &
Simko, 1995). In other words, information is regarded as being reliability, it stems from
someone or something that is reliable. However, the reliability (or representational faithfulness)
of accounting information is undermined when management prepares financial statements that
primarily serve their own interest (Maines & Wahlen, 2006). The authors conclude that users
are senstive to the reliability of financial reports. These findings are significant to investors for
two reasons : (1) how the governance mechanism is structured in the entity to reduce conflicts
of interest, and (2) whether the board is capable of monitoring management to reduce the effect
of information asymmetry.
The board should provide effective monitoring of management in preparing financial reports
because the board has fiduciary duties and responsibility to oversee company activities,
including the preparation of financial statements. It follows from the above discussion that an
effective board can better ensure fair and transparent financial statements. A higher quality
board is more likely to reduce material errors and enhance the reliability of corporate financial
information. Therefore, it is expected that a quality board is better able to ensure preparation
of reliable financial reports, and investors will give more importance to financial reports
overseen by a strong board (the reliable source) to make investment decisions.
Considering the above discussion, we hypothesize as follows:
H2: The perceived reliability of reporting will be higher when board quality is srtong, relative
to when the board quality is weak.
H3: When perceived reliability of reporting increases, investors will be more likely to invest
in a company.
Effect of insider trading on investor decisions
Insider trading can be both legal and illegal. Insider trading is legal when company insiders:
officers, directors or employees—buy or sell stock in compliance with the relevant rules and
regulations (Beams, Brown, & Killough, 2003). Illegal insider trading, on the other hand, refers
to practices prohibited under securities laws where traders take advantage of private
information at the expense of others who do not have access to it. The theory behind the
prohibition of illegal insider trading is that it undermines investor confidence in the fairness
and transparency of financial markets. Illegal insider trading is considered to be fraudulent
because the insiders violate the trust or fiduciary duty that they owe to shareholders and the
public at large.
Empirical studies suggest that investors earn abnormal returns from trading based on private
information, and these trades influence price and volume significantly (Penman, 1982; Seyhun,
1986; Lakonishok & Lee, 2001). For example, Keown and Pinkerton (1981) showed that
investors in target firms earned abnormal return prior to the first public announcement of
planned mergers. They note that the price of a target firm stock gained on average about 40%
to 50% before the actual takeover announcement. This suggests that certain investors had
access to company inside information and used this information before the public
13
announcement to earn abnormal returns. Only a subset of investors receive the benefits of
illegal insider trading. On the contrary, if the information is publicly disclosed then it may be
expected that investors in general will incorporate that information in pricing the stock. Thus
current holders will likely benefit, but do so equally (Bhattacharya, Daouk, Jorgenson, & Kehr,
2000).
Giannetti and Simonov (2006) claim that investors who have relationships with company
insiders and thus have access to private information are more likely to invest in that company.
This finding implies that investors become more confident to invest as they are able to use
private information to earn a higher return at the expense of investors who have no inside
information. The strength of the governance structure of the company becomes immaterial to
investors who have access to private information. Giannetti and Simonov (2006) further state
that investors who do not have access to inside information are less likely to hold shares in a
weak governance company as they might suffer the advantages gained by inside traders.
It is recognized from prior literature that good governance can reduce the likelihood of insiders
exploiting private information. An experienced competent and independent board can be
effective in monitoring its own members and management to prevent insiders and their
associates from earning abnormal profits through illegal insider trading.
In accordance with the above discussion, we hypothesize that:
H4: Availability of insider information will increase the likelihood that investors invest in a
company, relative to when insider information is absent.
Impact of insider trading perception on reporting reliability
Strong corporate governance enhances the quality of financial information (Agrawal &
Chadha, 2005). Independent directors play a key role in this respect (Byrd & Hickman, 1992;
Brickley, Coles, & Jarrell, 1997). Agrawal and Chadha (2005) explained that independent
directors with financial expertise help to reduce the chance of restatement of financial
statements. This indicates that independent directors who have financial expertise are capable
of overseeing the reporting process, promoting integrity and preventing financial fraud, and
thus increase the reliability of reporting. Similarly, Beasley (1996) and Dechow, Sloan, and
Sweeney (1996) suggest that independent directors who have relevant knowledge and
experience are able to reduce financial fraud and earnings management, which has a positive
impact on the reliability of financial information.
There is also evidence that earnings management encourages insider trading (Sawicki &
Shrestha, 2008). For example, Baryeh, Yaari, and Dadalt (2012) reported that insiders purchase
shares prior to massage of the financial condition and performance of a company before a
seasoned equity offering by the company. These findings suggest an inverse association
between insider trading and the degree of reliability of the financial reports of a company. Thus
given the positive effect of increasing board quality on investor perceptions of the reliability
of financial reporting we hypothesize that:
H5: The favourable effects of increasing board quality on perceived reliability of financial
reporting will be diminished when insider information is available, relative to when insider
information is absent.
Association of trust in board, management and investment decisions
The basic concept of trust is discussed in the literature in the context of complexity, reliability,
flexibility, predictability, credibility, complacency, consistency, security, accuracy,
dependence, responsibility and uncertainty (Tweedale & Cutler, 2006). In an organization, trust

14
is defined as a psychological state of mind in terms of perceived risk that originates from the
uncertainty of an individual regarding another person’s motives, intentions and expectations
(Kramer & Cook, 2004). Mayer, Davis, and Schoorman (1995) define trust as:
“the willingness of a party to be vulnerable to the actions of another party based
on the expectation that the other will perform a particular action important to the
trustor, irrespective of the ability to monitor or control that other party” (p. 712).
Similarly, Robinson (1996) claims that trust is built when it is expected and believed that the
actions of another person will be beneficial, favorable and not harmful to the interests of others.
Kelly, Boardman, Goillau, and Jeannot (2003) define trust as the confidence placed in a person
or thing. They conducted a meta-analysis of prior literature on trust and identified some
essential elements in building trust such as, faithfulness, reliability, robustness, familiarity,
usefulness, self-confidence, reputation, and explication of intention. According to their view,
reliability of individuals builds trust in them. Similarly, Whittington (1999) states “Trust is
assumed to mean confidence in the truthfulness and reliability of another party” p.182.
Therefore, trust can be seen, based on favorable expectations regarding the intentions and
actions of other people, as an important element in determination of individual risk-taking
behavior.
In the context of agency theory, Lukas and Schöndube (2012) explain that the degree of trust
depends on previous decisions and actions of the principal and the agent. For example, in
relation to the payment of bonuses to employees, an employee (the agent) cannot perfectly
predict the bonus decisions of the employer (the principal). They can only believe in the
likelihood of receiving a bonus given the previous decisions on bonus payments. Molm,
Takahashi, and Peterson (2000) provide an explanation that trust is a nexus of feelings and
commitments with the other party. It comprises individual belief and expectations on how the
other party will behave. These explanations also imply that the level of trust is subject to
experience from dealing with the other party.
From the economics and social psychology points of view, Lewis and Weigert (1985) suggest
that competence and dutifulness of a person are key elements in building trust. Similarly,
Kramer and Cook (2004) claim that competencies of individuals are important components in
building trust in an organization since they can deal with complexity, resilience, optimism,
energy, and honesty. For the same reason, in a publicly held company, shareholders put their
trust in the board and management to run the business to deliver maximum returns on
investment. If shareholders have reasons to believe that the board and/or management engages
in illegal insider trading, shareholder trust in the board and management would be low.
Competence of board members and management (which can be represented by some important
factors such as integrity, knowledge and experience) is critical to develop investor trust in the
board and management. For example, several studies have documented that investor judgment
depends on trust (Harrison, Dibben, & Mason, 1997; Prowse, 1998a; Ryan & Buchholtz, 2001;
Elliott, Hodge, & Sedor, 2011). It may be assumed that when individuals in a position of trust
(i.e. board and management) appear to be lacking in competence, investors will lose trust in
the board and management and, possibly, in the marketplace.
Hence, we propose the following hypotheses:
H6a: Investors will have more trust in the board when board quality is strong, relative to
when board quality is weak.
H6b: Investors will have more trust in management when board quality is strong, relative to
when the board quality is weak.

15
H7a: When trust in a board increases, investors will be more likely to invest in a company.
H7b: When trust in management increases, investors will be more likely to invest in a
company.
Investor trust in a board and management in the presence of insider trading
Insider trading is illegal in stock markets because trading shares based on private information
is a breach of fiduciary duty, trust and confidence. It weakens market integrity and fair dealing,
destroys investor trust and confidence thereby disrupting growth of the market. Since dispersed
shareholders have limited control over company activities due to separation of control and
ownership (Berle & Means, 1968), regulators worldwide attempt to combat insider trading by
law.
Good corporate governance helps to ensure that management runs firms ethically and
competently in the interests of shareholders. Ethical behavior by management and their ability
to deliver on assurances are two important factors in building trust in them, especially in
business relations (Child & Rodrigues, 2004). This discussion suggests that if some investors
obtain access to non-public information the result will be low trust in management and the
board.
Hence, the following hypotheses are proposed:
H8: Investors trust in management will be lower when some investors have access to insider
information, relative to when insider information is absent.
H9: The favorable effects of increasing board quality on trust in management will be
diminished when insider information is available, relative to when insider information is
absent.
Financial condition and investor decisions
Financial reports are the formal records of the financial activities of a business and an overview
of the financial condition of the company. The Financial Accounting Standards Board (FASB,
2010b) has emphasized in the Statement of Financial Accounting Concepts No. 1, as amended,
that financial reporting assists investors in making investment decisions in the securities market
(paragraphs 34-36). Similarly, IASB, 2010 has emphasized in para OB2-OB11 of Chapter 1
that one of the objectives of preparing financial information is to make investment decisions.
Thus one of the purposes of providing financial statements is to provide investors with
information about the financial performance and financial position of a company. It is expected
that investors will understand, analyse and determine whether the financial condition of a
company is favourable or unfavourable and consider the company’s comments on future
prospects. Investors can form a view on the current and future value of the stock and hence
from comparison with current market price, make their investment decisions.
Prior studies show that the stock price of companies reflects their financial condition. For
example, Kross and Schroeder (1984) show that the stock price increases in response to the
announcement of higher earnings and decreases for lower earnings. Further, Al-Ajmi (2009)
claimed that investors consider corporate financial reports as the most important source of
information in making investment decisions. The key financial information of companies such
as earnings per share, earnings multiple, net asset value per share, dividends and other
performance characteristics are value relevant and are closely related to stock returns (Penman
& Sougiannis, 1998; Lawrence & Kercsmar, 1999). These findings indicate that investors give
weight to historical data in making investment decisions.
Considering the above discussion, this study expects that investors will be more likely to invest

16
in a company whose financial condition appears to be good as this will lead to the expectation
that the stock price will increase in the future. Conversely, investors will be less likely to invest
in a company whose financial condition is bad as they would expect that the price of the shares
of such companies will decrease.
Hence we hypothesize that:
H10: Investors are more likely to invest in a company when the company’s financial
condition is good than when it is bad.
Relation between perceived reliability and trust
The literature indicates that good corporate governance requires board members of a company
to be qualified, experienced, independent, reliable and trustworthy in directing and controlling
management. Therefore, it is important to examine if there is any effect of reliability of
financial statements on building trust. As discussed in the previous sections, reliability of
source does matter in building trust; that is, it indicates that reliability and trust are interlinked.
Considering the above views and the earlier discussion on trust one can infer that and reliability
of the financial reports might have effect on investor trust in the board and management.
Hence, this study proposes that:
H11: When perceived reliability of reporting increases (decreases) investor trust in the board
and management will also increase (decrease).
Theoretical Framework and Hypotheses
METHODOLOGY
Experimental Design
The research design is a controlled laboratory experiment. The experiment is based on a 2×2×2
between-participants fixed effects factorial design yielding eight experimental conditions. The
objective of the between-subjects experiment is to determine whether differences exist between
treatment conditions of the decision case designed for this study. The decision case involves a
hypothetical energy company named ABC Ltd. The company is listed with both the Dhaka
and Chittagong stock exchanges in Bangladesh. The shares of the company have been actively
traded on these stock exchanges since 2000. There are no large block-holders in the company

17
that dominate the ownership of the company. A reputable audit firm has been auditing financial
statements of the company for the past three years.
Three factors in the case are manipulated: (1) strong versus weak board; (2) good versus bad
financial condition; and (3) insider trading present versus absent. Each scenario is distinguished
by different combinations of board strength, financial condition and investor access to inside
information of the company. The background information on ABC Ltd. is identical in each
scenario, and the only differences between conditions are the manipulated independent
variables (Appendix A provides the instrument used in the study).
With respect to the ‘strong board’ the decision case states -“one independent director is a
university teacher in Accounting and another is a retired government officer. Both independent
directors meet the minimum experience requirements and are from the required professions,
and thus satisfy the new regulations. Moreover, they both have prior experience that is relevant
to ABC’s business”. On the other hand, in respect of the ‘weak board’ the case states: “one
independent director is a university teacher in Accounting and another is a retired government
officer. Both independent directors meet the minimum experience requirements and are from
the required professions, and thus satisfy the new regulations. However, neither independent
director has prior experience that is relevant to ABC’s business, and they are friends of
executive management”.
Regarding the financial condition of the company, the case highlights key performance
measures for three consecutive years such as, current ratio, quick ratio, debt to equity ratio,
gross margin ratio, net income ratio, return on equity ratio, earning per share and net tangible
assets per share. These key financial measures are important in making investment decisions
(Akhter & Ahmed, 2013) and it is mandatory to disclose them under Bangladesh securities
laws (BSEC, 2012). The company ‘in good financial condition’ has been improving its key
measures during 2010-2012 and these are above the industry averages in 2012, while ‘in the
bad financial condition’ the key financial measures have been declining for the three
consecutive years and these are below the industry averages in 2012.
With regards to ‘absence of insider trading’ in the company’s shares the case states - “your
cousin is an old friend of one of the members of the executive management team of ABC Ltd,
but he never receives any tips or inside information about ABC Ltd from management. Your
cousin has stated that he intends to purchase shares of ABC Ltd”. On the other hand, for the
‘presence of insider trading’ the case states -“your cousin is an old friend of one of the members
of the executive management team of ABC Ltd. Your cousin has informed you that he was
given inside information from his manager friend about a secret new joint venture with a
Japanese company, and the manager informed him that this venture is certain to increase ABC’s
share price in the near future. Your cousin has stated that he intends to purchase shares of ABC
Ltd”.
The experimental materials also include questions relating to participants’ demographics and
general information about the participants: age, gender, education, profession and trading
experience.
Participants
MBA students are usually considered good proxies for individual investors if the tasks are high
in integrative complexity. According to Elliott, Hodge, Kennedy, & Pronk (2007), it is
appropriate to conduct an experiment on MBA students since they collect and integrate

18
information similarly to non-professional investors. In addition, students have been found to
be suitable substitutes for relatively unsophisticated individual investors (Libby, Bloomfield,
& Nelson, 2002). However, students have not been found as good as individual investors in
terms of making investment decisions. Therefore, it is suggested that, subject to availability,
individual investors are the preferred participants on which to run an experimental study
(Elliott, Hodge, Kennedy, & Pronk, 2007).
Following the recommendation of Elliott, Hodge, Kennedy, & Pronk (2007), the participants
in this study were 307 individual investors who regularly trade on the Bangladesh stock
markets. It is expected that investors are likely to be more experienced in terms of making an
investment decision than MBA students. In addition, the majority of investors in Bangladesh
trade at the trading room of stockbrokers and merchant bankers by watching the display of
trading on a large monitor. Hence, a good number of investors were available to conduct the
experiment under controlled conditions in a limited number of locations. The individual
investors were selected from the clients of the top five stockbrokers of the Dhaka and
Chittagong Stock Exchanges and merchant bankers, in terms of annual trade volume. Prior to
the experiment, the Human Ethics Committee of Victoria University of Wellington approved
the instrument, on 21st November 2013, to run the experiment for the study.
Experimental Tasks
Participants were randomly assigned to one of the eight scenarios and given a questionnaire in
two separate envelopes. Envelope 1 included background information, the board structure of
ABC Ltd, financial information and participants’ access to insider information along with
relevant seven-point itemized interval questionnaires that capture the dependent variable.
Envelope 2 included attention check questions, additional seven-point itemized interval
questions relating to their responses given to the questionnaire in Envelope 1, and a
demographic questionnaire.
Based on the information provided about the company, participants were asked to indicate their
likelihood of choosing to invest in ABC shares on a seven-point itemized interval scale. The
lowest value of ‘1’ was accounted for as ‘not at all likely’ and the highest value of ‘7’ was for
‘very likely’. They were also asked to predict the change in share price of the company in the
next year by rating on a seven-point itemized interval scale anchored by significant decline ‘1’
and significant increase ‘7’. After making their judgment, participants completed five more
questions on a seven-point itemized interval scale concerning: reliability of financial
information, trust in the board of directors and management, director and management
involvement in insider trading, and the financial condition of the company. Participants read
the case and answered questions relating to their investment decisions, perception of reliability
of the financial statements of the company, trustworthiness of the board, perception of the
strength of the board and of management, financial condition, and insider trading.
Having completed the questionnaire provided in envelope 1, participants were asked to open
envelope 2 to answer attentions checks, debriefing and demographic questions. Finally, they
were asked to return the envelopes to a box placed in the back of the room.
Attention Checks
Attention checks were performed to determine whether the participants understood the case
materials and recognized their treatment conditions. If a participant receiving the strong board
scenario indicated that the board is weak, this made it clear that the participant did not attend
to the manipulation of the board strength. Similarly, if a participant received the good financial

19
condition scenario indicated that the company financial condition is bad, the participant is
considered as not having followed the manipulation of financial condition. Regarding the
insider trading treatment condition, if a participant receiving the scenario of presence of insider
trading indicated absence of insider trading this shows that the participant did not attend to the
manipulation of insider trading. Consistent with the prior study of Rose, Mazza, Norman, and
Rose (2013), the participants, who failed to answer the attention check questions correctly were
not included in the statistical tests of the hypotheses.
Debriefing Items and Demographic Questions
After completing the experiment, the participants were asked to respond to five general
questions on a seven-point itemized interval scale to understand: (1) the extent to which they
consider the strength of the board in investment decision making, (2) the extent to which they
consider the company’s financial condition in making investment decisions, (3) the extent to
which they believe that board members influence the future share price of a firm, (4) their
perception of the governance quality if friends and relatives of management are able to acquire
insider information, and (5) their perception of the impact of insider trading on the long term
value of the firm. Finally, the participants were asked to answer demographic questions such
as age, gender, education, occupation and number of years of experience in trading of shares.
RESULTS
A total of 320 individual investors were requested to participate in the study of which 307
individual investors agreed to participate. However, 15 participants did not complete the task
and 34 participants failed to answer the attention check questions correctly. These 49
participants who either did not complete or incorrectly answered the attention check questions
were excluded from the analyses. Therefore, the final sample comprised responses from 258
individual investors.
Table 1 & 2 show that the number of years of investment experience in the stock market has a
mean of 8.08 years with standard deviation 5.59 years and a range from 0.50 to 35 years. Panel
B shows that most of these participants are male (93.4%), seventy five percent of the
participants are from private business firms, and about 85% have university degrees.
[Insert Table 1 & 2]
To ensure that participants understood the manipulations they were presented in the
experiment, the study conducts attention checks after participants made the judgment on
investing in the company and indicated the degree of trust in the board and management and
reliability of the financial report. The participants were asked to answer four attention checks
questions relating to the three independent variables: (1) the board was weak or strong (2)
insider trading was absent or present, (3) the company financial condition was declining or
improving. Any participants who failed to recognize their treatment condition were considered
to have failed the attention check.
For example, if a participant received a scenario stating the board quality condition as “One
independent director is a university teacher in Accounting and another is a retired government
officer. Both independent directors meet the minimum experience requirements and are from
the required professions, and thus satisfy the new regulations. However, neither independent
director has prior experience that is relevant to ABC’s business, and they are friends of
executive management” and “The CEO and Chairman of the Board are different individuals,
but the CEO is not able to work independently since the Chairman dominates the CEO”, but
the participant specified that the scenario stated “One independent director is a university
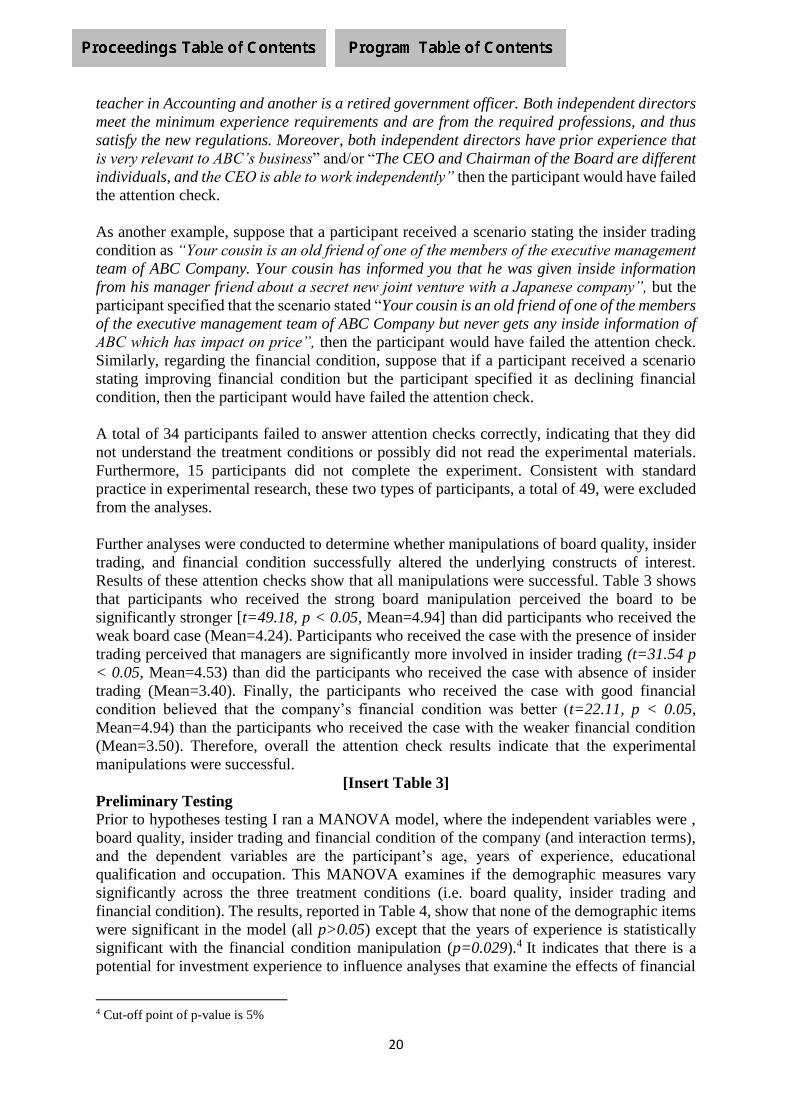
20
teacher in Accounting and another is a retired government officer. Both independent directors
meet the minimum experience requirements and are from the required professions, and thus
satisfy the new regulations. Moreover, both independent directors have prior experience that
is very relevant to ABC’s business” and/or “The CEO and Chairman of the Board are different
individuals, and the CEO is able to work independently” then the participant would have failed
the attention check.
As another example, suppose that a participant received a scenario stating the insider trading
condition as “Your cousin is an old friend of one of the members of the executive management
team of ABC Company. Your cousin has informed you that he was given inside information
from his manager friend about a secret new joint venture with a Japanese company”, but the
participant specified that the scenario stated “Your cousin is an old friend of one of the members
of the executive management team of ABC Company but never gets any inside information of
ABC which has impact on price”, then the participant would have failed the attention check.
Similarly, regarding the financial condition, suppose that if a participant received a scenario
stating improving financial condition but the participant specified it as declining financial
condition, then the participant would have failed the attention check.
A total of 34 participants failed to answer attention checks correctly, indicating that they did
not understand the treatment conditions or possibly did not read the experimental materials.
Furthermore, 15 participants did not complete the experiment. Consistent with standard
practice in experimental research, these two types of participants, a total of 49, were excluded
from the analyses.
Further analyses were conducted to determine whether manipulations of board quality, insider
trading, and financial condition successfully altered the underlying constructs of interest.
Results of these attention checks show that all manipulations were successful. Table 3 shows
that participants who received the strong board manipulation perceived the board to be
significantly stronger [t=49.18, p < 0.05, Mean=4.94] than did participants who received the
weak board case (Mean=4.24). Participants who received the case with the presence of insider
trading perceived that managers are significantly more involved in insider trading (t=31.54 p
< 0.05, Mean=4.53) than did the participants who received the case with absence of insider
trading (Mean=3.40). Finally, the participants who received the case with good financial
condition believed that the company’s financial condition was better (t=22.11, p < 0.05,
Mean=4.94) than the participants who received the case with the weaker financial condition
(Mean=3.50). Therefore, overall the attention check results indicate that the experimental
manipulations were successful.
[Insert Table 3]
Preliminary Testing
Prior to hypotheses testing I ran a MANOVA model, where the independent variables were ,
board quality, insider trading and financial condition of the company (and interaction terms),
and the dependent variables are the participant’s age, years of experience, educational
qualification and occupation. This MANOVA examines if the demographic measures vary
significantly across the three treatment conditions (i.e. board quality, insider trading and
financial condition). The results, reported in Table 4, show that none of the demographic items
were significant in the model (all p>0.05) except that the years of experience is statistically
significant with the financial condition manipulation (p=0.029).4 It indicates that there is a
potential for investment experience to influence analyses that examine the effects of financial
4 Cut-off point of p-value is 5%

21
condition on the dependent measures. Therefore, I retained this variable in the model used to
test the hypotheses in order to control for any influence of years of experience. I also run series
of ANCOVA model to examine whether any demographic variables could influence the
hypothesis tests where the dependent variable was the investment decision and independent
variables were board quality, insider trading and financial condition by including the
demographic characteristics as covariates. Years’ experience was only statistically significant
in the ANCOVA model with the investment decision as the dependent variable.
[Insert Table 4]
Hypotheses Testing
Hypotheses relating to the direct effects of board quality, insider trading and financial
condition on investment decisions (Hypotheses 1, 4 and 10)
I first ran an ANCOVA to test the three hypotheses which proposed direct effects of the three
independent variables of interest on investor decisions. Independent variables for these
hypotheses (H1, H4 & H10) are Board, Insider trading, and Financial condition respectively,
and the dependent variable is investor decisions. Results of a 2×2×2 (Board×Insider
trading×Financial condition) ANCOVA are presented in Table 5.1 and descriptive statistics are
presented in Table 5.2.5
The effect for strong board quality on investors decisions (Mean= 4.82) is higher than the
effect for weak board quality (Mean= 4.17). Hypothesis 1 (H1) predicts that investors will be
more likely to invest in a company when board quality is strong, relative to when board quality
is weak. The results indicate that board quality has a statistically significant effect on investor
decisions (F=8.707, p < 0.05). Thus, H1 is supported.
Hypothesis 4 (H4) posits that the presence of favorable insider information will increase the
likelihood that availability of insider information will increase the likelihood that investors
invest in a company, relative to when insider information is absent. However, insider trading
is not statistically significant (F=0.224, p= 0.636), and thus, H4 is not supported.
The effect of financial condition on investing is stronger when financial condition is good
(Mean= 5.13) than when financial condition is bad (Mean= 3.77). Hypothesis 10 (H10) predicts
that investors are more likely to invest in a company when the company’s financial condition
is good than when it is bad. Financial condition is statistically significant (F=42.57, p < 0.05).
Thus, H10 is supported.
[Insert Tables 5.1 & 5.2]
Hypotheses relating to the effect of board quality on perceived reliability of financial reports,
and joint effect of board quality and insider trading on reliability of financial reports.
(Hypotheses 2 and 5)
I use ANOVA to test the hypotheses regarding the direct impact of board quality on perceived
reliability of financial reports (H2), and the joint effect of board quality and insider trading on
the perceived reliability of financial reports (H5). The results are presented in Table 5.3.
The mean reliability when the board was strong was higher (4.57) than when the board was
weak (4.06) (see Table 5.4). Hypothesis 2 (H2) predicts that the perceived reliability of
reporting will be higher when board quality is strong, relative to when the board quality is
weak. ANOVA results show that board quality is statistically significant (F=6.511, p < 0.05),
which indicates that board quality affects investors’ perceived reliability of financial reports.
5 Cut-off point of p-value is 5%

22
Thus, hypothesis (H2) is supported.
Hypothesis 5 (H5) predicts that the favourable effects of increasing board quality on perceived
reliability of financial reporting will be diminished when insider information is available,
relative to when insider information is absent. The results show that the interaction effect of
board quality and insider trading on perceived reliability of financial information is not
significant (F=.232, p=0.631, which indicates that there is no interaction effect of board quality
(strong or weak) and insider trading (present or absent) on investors perceived reliability on
financial reports. Hence, hypothesis 5 (H5) is not supported.
[Insert Tables 5.3 & 5.4]
Hypothesis regarding the impact of perceived reliability of financial reports on investment
decisions (Hypothesis 3)
Hypothesis 3 (H3) predicts that when perceived reliability of reporting increases, investors will
be more likely to invest in a company. It is expected that a quality board is able to ensure
preparation of reliable financial reports, and investors will give more importance to financial
reports overseen by a strong board (the reliable source) in making investment decisions.
ANOVA results show that perceived reliability is statistically significant (F=113.04, p < 0.05)
(see Table 5.5). The results thus support hypothesis (H3) that when investors perceive that the
financial report is reliable, investors are more willing to make an investment in the company.
[Insert Table 5.5]
Hypotheses relating to the effect of the board quality on trust in board and management,
insider trading on investors trust in board’s management and interaction effect of board
quality and insider trading on investors trust in management (Hypotheses 6a, 6b and 8)
Table 5.8 shows that the mean value of trust in the board was 4.15 when the board was strong
and it was 3.59 when the board was weak. Similarly, Table 5.9 shows that the mean value of
trust in management was 4.51 when the board was strong and it was 3.96 when the board was
weak. Hypotheses 6a (H6a) and 6b (H6b) state that investors will have more trust in a
company’s board and management respectively when the board quality is strong, relative to
when the board quality is weak. It is posited that when individuals in a position of trust ( on the
board) appear to be lacking in quality, investors will lose trust in the board or management. I
performed separate ANOVAs and found that board quality has a statistically significant effect
on trust in board and management respectively [(F=8.358, p<0.05); (F=7.791, p<0.05)] ( see
Table 5.6 & 5.7). Therefore, hypotheses 6a and 6b are supported, which indicates that board
quality (strong or weak) affects investors’ trust both in the company’s board and in
management.
Insider trading does not have a statistically significant effect on investors’ trust in management
(F=2.50, p=0.115) (see Table 5.7). Thus, hypothesis 8 (H8), which proposes that “Investors
trust in management will be lower when some investors have access to insider information,
relative to when insider information is absent” is not supported.
Similarly, the interaction effect of board and insider trading (board * Insider trading) on trust
in management was not significant (F=0.221, p=0.639) (see Table- 5.7), which indicates that
there is no interaction effect of board quality (strong or weak) and insider trading (present or
absent) on investors’ trust in management.
[Insert Tables 5.6, 5.7, 5.8 & 5.9]

23
Hypotheses relating to the effect of investors’ trust in the board and management on
investment decisions (Hypotheses 7a and 7b)
Hypothesis 7a (H7a) predicts that when trust in a board increases, investors will be more likely
to invest in a company and, similarly, hypothesis 7b (H7b) predicts that when trust in the
management increases, investors will be more likely to invest in a company. I run two separate
ANOVAs, which show that both trust in the board and trust in management have statistically
significant effects on investment decisions [(F=80.47, p < 0.05); (F=79.29, p < 0.05)]
respectively (see Tables 5.10 & 5.11). Thus, these two hypotheses are supported.
[Insert Tables 5.10 & 5.11]
Hypothesis relating to the effect of perceived reliability of financial reports on investors’
trust (Hypotheses 11)
Hypothesis 11 (H11) proposes that when perceived reliability of the financial reporting of a
company increases (decreases) investor trust in the board and management will also increase
(decrease). Here, the dependent variable is investors’ trust that represents investors trust in both
board and management because trust builds through the overall governance structure i.e. board
and management (Barney & Hansen, 1994). Investor trust is measured from the responses
asking the participants (1) if they trust ABC Company’s board to protect the interest of
shareholders, and (2) if they trust the management of ABC Company to accurately represent
the financial position of the firm.
ANOVA results (Table 5.12) show that the perceived reliability of financial reports has a
statistically significant effect on trust (F=180.839, p < 0.05). This results support the
hypothesis that when investors perceived reliability of financial reports of the company
increases (decreases) their trust in the board and management increases (decreases).
[Insert Table 5.12]
Debriefing Analysis
There were five debriefing questions which were asked in order to get a better understanding
of the participants’ responses to the main questionnaire. Summary descriptive statistics are
presented in Table 6. The first debriefing item asked: “To what extent did you consider the
strength of the board when deciding whether or not to invest in ABC’s shares?” (on a 7-point
itemized interval scale anchored by ‘very little’ (1), ‘average’ (4) and ‘a great amount’ (7)).
The mean (standard deviation) value of the response is 4.16 (1.74) which indicates that on
average the investors give average value to the strength of the board in making investment
decisions.
The second question asked the participants to what extent they considered financial condition
in deciding to invest in ABC’s shares (‘1’ = very little, ‘4’ = a moderate amount, and ‘7’= a
great amount). The mean (standard deviation) is 4.66 (1.78) which indicates that the
participants moderately considered financial condition with the decision to invest in ABC’s
shares. This also implies that financial reports help investors make investment decisions.
The third item asked the participants the following: In general, to what extent do you believe
that board members influence the future share price of a firm? (‘1’ = very little, ‘4’ = a moderate
amount and ‘7’= a great amount). The mean (standard deviation) is 4.43 (1.80) which indicates
that participants believed that board members have moderate influence on the share price of a
firm.
The fourth debriefing questions was: In general, if friends and relatives of management are

24
able to acquire insider information, what does this indicate about governance quality? (‘1’ =
governance is poor, ‘4’ = governance is average, and ‘7’= governance is strong). The mean
(standard deviation) is 2.33 (1.73). The results suggest that the participants perceived
governance quality to be poor if friends and relatives of management are able to acquire inside
information.
The final item stated: In general, what effect does insider trading of a firm’s shares have on the
long-term value of the firm? (‘1’ = very negative effect and ‘7’= very positive effect). The
mean (standard deviation) is 2.58 (1.87) which indicates that participants perceive that insider
trading of a company’s shares has some negative effect on the long term value of the company.
Overall, the results of the debriefing questions indicate that participants perceive that the
theoretical constructs we manipulated have the capacity to influence the dependent constructs
of interest, which is consistent with the results of the hypothesis tests reported earlier.
However, in contrast to the results reported in the tests of the hypotheses on insider trading,
the debriefing result indicates that insider trading has some negative impact on the long term
value of the firm.
[Insert Table 6]
DISCUSSION
Prior literature suggests that board quality, as indicated by the relevant business experience of
the independent directors, has a positive relationship with firm value (Kang, 2013). Similarly,
true separation of the roles of the chairman and CEO can enhance company performance and
value (Simpson & Gleason, 1999). High board quality signals likelihood of better
performance and higher market value, thus helping investors to make decisions (Bergh &
Gibbons, 2011; Chiang & Chia, 2005). Consistent with these expectations, the results of the
study show that board quality has a significant positive impact on investor decisions (Sharma,
2006). The results are consistent with the argument that good quality corporate governance
can reduce conflict between the agent (management) and principal (investors) of a company,
prevent managers from misappropriation of assets and improve company performance (Fama
& Jensen, 1983b), and thus encourage investors to make investment in that company.
The results show that the impact of insider trading on investor decisions is not statistically
significant. This is contrary to the findings of Giannetti and Simonov (2006) that investors who
have relationships with company insiders and have access to private information are more
likely to invest in that company. The results are inconsistent with the findings of previous
studies which showed that investors earn abnormal profit using private information (Keown &
Pinkerton, 1981; Lakonishok & Lee, 2001; Penman, 1982; Seyhun, 1986). The results also
show that insider trading does not have a significant effect on investor trust in management and
in board. The results are surprising but there are a number of possible explanations. Investors
may simply pay no attention to inside information in a securities market such as exists in
Bangladesh because insider trading is perceived to be rife. They probably believe that their
success in investment is always tempered by the greater success of insiders and therefore
disclosure of a particular form/instance of inside information will not sway their judgment.
Furthermore, they may believe that other investors might have the same information and, in
any case, it may not be reliable. Another plausible explanation for this result is that contrarian
investors behave anomalously in a highly volatile market.6 They refuse to follow their own
information and make decisions irrationally. However, the results possibly indicate that further
6 Contrarian behaviour is significant when the market is highly volatile. Contrarian investors act against their
own private information (Azofra-Palenzuela, Fernández-Alonso, and Vallelado, 2006). The Bangladesh capital
market is identified as highly volatile (Chowdhury, Mollik, & Akhter, 2006).
25
investigation is required to examine investor reactions to insider trading in an emerging market.
The study also finds that the interaction effect of insider trading and board quality is not
significant to the perceived reliability of financial reports. This suggests that insider
information does not diminish the favorable effects of increasing board quality on perceived
reliability of financial reports. Similarly, the interaction effect of board quality and insider
trading on investor trust in management is not significant.
The results demonstrate that the financial condition of the company has a significant effect on
investor decisions. Investors appear to expect that the stock price will increase in the future if
the current financial condition is favorable. The results are consistent with the findings of prior
studies (Al-Ajmi, 2009; Lawrence & Kercsmar, 1999; Penman & Sougiannis, 1998). The result
supports the important objectives of FASB (2010a) and IASB (2010) which emphasised
reliable financial information to reflect the true financial condition of the company, thus
helping investors make decisions.
The board is responsible for providing effective monitoring of management in preparing
financial reports. A higher quality board can better ensure fair and transparent financial
statements by reducing material errors and enhancing the reliability of corporate financial
information, thus helping investors make sound investment decisions. Consistent with these
views, the results of this study show that board quality has a significant positive impact on the
perceived reliability of financial reports. The results show that perceived reliability of financial
reports is significant to investor decisions indicating that investors are more likely to invest in
a company when they perceive that the financial reports are reliable. These results are
consistent with the previous literature that good corporate governance signals the quality of
financial reporting, and reduces conflicts of interest and information asymmetry which assists
investors in making their investment favorable decisions (Hirst, Koonce, & Simko, 1995;
Hodge, 2003; Holder-Webb & Sharma, 2010; Maines & Wahlen, 2006; Zhang & Wiersema,
2009). The study further reveals that perceived reliability of financial reports has a significant
effect on investor trust in the board and management. Consistent with these results the study
finds that investor trust in the board and management has a significant effect on investor
decisions. The results further confirm the views of prior studies that trust influences investor
judgment in making investment decisions (Elliott, Hodge, & Sedor, 2011).
In future research, we analyse the mediating effects of trust and perceived reliability on the
relationships between board quality, financial condition and insider trading on investor
decision making. We also conduct SEM to analyze the full research model.
CONCLUSION
Prior literature on the relevance of corporate governance mechanisms shows that the strength
of corporate governance influences expected firm performance and thus the market value of a
company. This study contributes to understanding of the role of board of director quality by
examining (1) the effects of board quality at different levels of insider trading and financial
condition of the company The study confirms that board quality matters to investment
decisions. Within the context of the experiment, insider trading is not relevant to investment
decision making in the Bangladesh securities markets. As expected, financial condition does
influence investors’ decisions.
The research involved an experimental study of actual investors in an emerging economy to
examine the effects of governance quality on investor decisions, and to my knowledge, this is

26
the first such experimental study on the Bangladesh capital market. The findings of this study
should be useful to regulators in understanding the complexities of implementing corporate
governance guidelines.
The theoretical model and instrument will also be useful for further studies in other countries,
particularly where insider trading is regarded by investors as being a concern and to investigate
the impact of other corporate governance factors on investors and financial analysts. The
research results strongly suggest that future research on the effects of governance on investors
should include investor perceptions of financial statement reliability and investor trust in board
and management. Furthermore, the research has practical implications such as the potential for
good governance mechanisms to increase investors' trust in management and the board, which
are both critical to firms.
The study yields a number of opportunities for further research. In particular, the role of insider
trading deserves additional investigation. The finding that the level of insider trading did not
influence investors’ decisions to invest in a firm was contrary to expectations, and further
research focusing on insider trading may help to explain the result obtained. Of particular
interest is whether investors in markets where insider trading is not common or in highly
developed markets react differently to insider trading relative to investors in Bangladesh. An
additional issue concerns compliance with guidelines on corporate governance in terms of
compliance in substance and compliance in form only and how investors might use cues in the
investment environment to distinguish between these forms. For example, in respect of
separation of the chairman and CEO roles do investors also look for clues as to the actual
relationship between the individuals holding these positions to determine compliance in
substance or merely form.
This study is subject to a number of limitations. First, experimental studies have a common
limitation on generalizability. This study is focused on the emerging Bangladesh market where
insider trading is common. The results may not be applicable to other countries due to different
economic and regulatory environments, in particular the relative prevalence of insider trading.
Second, although actual investors completed the experimental task, the task was a hypothetical
case. Like all laboratory experiments, the task lacks some of the complexities of real-world
decisions such as the differences in investment decision making processes of individual
investors when investing their own or their client’s money (Guthrie, 2008). However, the
simplicity of the case materials and random assignment of treatments to participants ensures
high levels of internal validity, which is essential to studying the causal effects of governance
factors.
Finally, the study considers only two board attributes, the relevant experience of independent
directors and the separation of the roles of the chairman and CEO, to investigate the effects of
board quality. There are many other factors that influence board and governance quality, the
effects of which may differ from the effects of the two factors considered in this study.

27
Table 1: Investment experience in stock market
Statistics Years
Minimum 0.50
Maximum 35
Mean 8.08
Median 6
Standard deviation 5.59
Table 2: Profile of participants
Gender Number Percentage
Male 241 93.4%
Female 17 6.6%
Total 258 100%
Occupation
Private business 124 48.1%
Private servant7 70 27.1%
Other 64 24.8%
Total 258 100%
Education
Bachelor degree 95 36.8%
Master degree 124 48.1%
Other 39 15.1%
Total Number 258 100%
Table 3: Attention Checks
Attention
Checks
Scenarios Mean value Std. Dev. t-value p-value
Board Quality Strong 4.94 1.70 49.18 0.001
Weak 4.24 1.73
Insider trading Absent 3.40 1.90 31.54 0.001
Present 4.53 1.99
Financial
Condition
Good 4.94 1.52 22.11 0.001
Bad 3.50 1.51
Table 4: Tests of Between-Subjects Effects (MANOVA)
Source
Dependent
Variable
Type III
Sum of
Squares df
Mean
Square F Sig.
Corrected Model Age 2.670a 7 .381 .746 .633
Education 2.032b 7 .290 .361 .924
occupation 16.444c 7 2.349 1.076 .380
Nyears_experience 329.352d 7 47.050 1.527 .158
Intercept Age 1737.886 1 1737.886 3398.012 .000
Education 2986.949 1 2986.949 3711.194 .000
occupation 4443.864 1 4443.864 2034.759 .000
Nyears_experience 17016.874 1 17016.874 552.417 .000
Board Age .156 1 .156 .305 .582
7 Private servant refers to individual employed in a private business firm.

28
Education .650 1 .650 .807 .370
occupation .106 1 .106 .049 .825
Nyears_experience .026 1 .026 .001 .977
FinancialCondition Age .068 1 .068 .134 .715
Education .003 1 .003 .003 .954
occupation 1.124 1 1.124 .515 .474
Nyears_experience 147.699 1 147.699 4.795 .029
InsiderTarding Age .035 1 .035 .069 .793
Education .045 1 .045 .056 .814
occupation 2.248 1 2.248 1.029 .311
Nyears_experience 4.110 1 4.110 .133 .715
Board *
FinancialCondition
Age .503 1 .503 .983 .322
Education .426 1 .426 .530 .467
occupation 5.407 1 5.407 2.476 .117
Nyears_experience 81.643 1 81.643 2.650 .105
Board *
InsiderTarding
Age .677 1 .677 1.324 .251
Education .029 1 .029 .037 .849
occupation 6.590 1 6.590 3.018 .084
Nyears_experience 52.790 1 52.790 1.714 .192
FinancialCondition
* InsiderTarding
Age .121 1 .121 .237 .627
Education .729 1 .729 .905 .342
occupation .645 1 .645 .295 .587
Nyears_experience 13.514 1 13.514 .439 .508
Board *
FinancialCondition
* InsiderTarding
Age .888 1 .888 1.737 .189
Education .000 1 .000 .000 .983
occupation .049 1 .049 .022 .881
Nyears_experience 50.147 1 50.147 1.628 .203
Error Age 127.861 250 .511
Education 201.212 250 .805
occupation 545.994 250 2.184
Nyears_experience 7701.106 250 30.804
Total Age 1907.000 258
Education 3239.000 258
occupation 5075.000 258
Nyears_experience 24888.250 258
Corrected Total Age 130.531 257
Education 203.244 257
occupation 562.438 257
Nyears_experience 8030.458 257
a. R Squared = .020 (Adjusted R Squared = -.007)
b. R Squared = .010 (Adjusted R Squared = -.018)
c. R Squared = .029 (Adjusted R Squared = .002)
d. R Squared = .041 (Adjusted R Squared = .014)

29
Tables Related to Hypotheses Tests
Table 5.1: Tests of Between-Subjects Effects (ANCOVA) regarding hypotheses (H1, H4 & H10)
Dependent Variable: Investment decision
Source
Type III Sum
of Squares df Mean Square F Sig. Hypotheses
Corrected Model 158.248a 8 19.781 6.820 .000
Intercept 1350.000 1 1350.000 465.442 .000
Nyears_experience 9.705 1 9.705 3.346 .069
Board 25.254 1 25.254 8.707 .003 H1 Insider Trading .650 1 .650 .224 .636 H4 Fin Conditions 123.474 1 123.474 42.570 .001 H10 Board * Insider Trading .809 1 .809 .279 .598
Board * Fin Conditions 1.009 1 1.009 .348 .556
Insider Trading * Fin
Conditions .018 1 .018 .006 .937
Board * Insider Trading
* Fin Conditions 2.830 1 2.830 .976 .324
Error 722.217 249 2.900
Total 6132.000 258
Corrected Total 880.465 257
a. R Squared = .180 (Adjusted R Squared = .153)
Table 5.2: Descriptive analysis of hypotheses (H1, H4 & H10)
Dependent Variable: Investment decision
Independent
variables
Treatment
condition
Mean Standard
deviation
Number of
participants
Board quality Strong 4.82 1.71 137
Weak 4.17 1.95 121
Insider trading Absence 4.60 1.82 124
Presence 4.43 1.89 134
Financial
condition
Good 5.13 1.54 141
Bad 3.78 1.92 117

30
Table 5.3: Tests of Between-Subjects Effects (ANOVA) regarding hypotheses (H2 & H5)
Dependent Variable: Perceived reliability
Source
Type III Sum
of Squares df Mean Square F Sig. Hypotheses
Corrected Model 92.538a 7 13.220 5.327 .000
Intercept 4607.059 1 4607.059 1856.313 .000
Board 16.160 1 16.160 6.511 .011 H2
Insider Trading 1.532 1 1.532 .617 .433
Financial Condition 70.124 1 70.124 28.255 .000
Board * Insider Trading .575 1 .575 .232 .631 H5
Board * Financial
Condition 2.567 1 2.567 1.034 .310
Insider Trading *
Financial Condition .013 1 .013 .005 .943
Board * Insider Trading
* Financial Condition .789 1 .789 .318 .573
Error 620.458 250 2.482
Total 5549.000 258
Corrected Total 712.996 257
a. R Squared = .130 (Adjusted R Squared = .105)
Table 5.4: Descriptive analysis of hypothesis (H2)
Dependent variable: Perceived reliability
Independent
variables
Treatment
condition
Mean Standard
deviation
Number of
participants
Board quality Strong 4.57 1.57 137
Weak 4.06 1.73 121
Table 5.5: Tests of Between-Subjects Effects regarding hypothesis (H3)
Dependent Variable: Investment decision
Source
Type III Sum
of Squares df Mean Square F Sig. Hypothesis
Corrected Model 269.696a 1 269.696 113.042 .000
Intercept 113.323 1 113.323 47.499 .000
Perceived
Reliability 269.696 1 269.696 113.042 .000 H3
Error 610.769 256 2.386
Total 6132.000 258
Corrected Total 880.465 257
a. R Squared = .306 (Adjusted R Squared = .304)
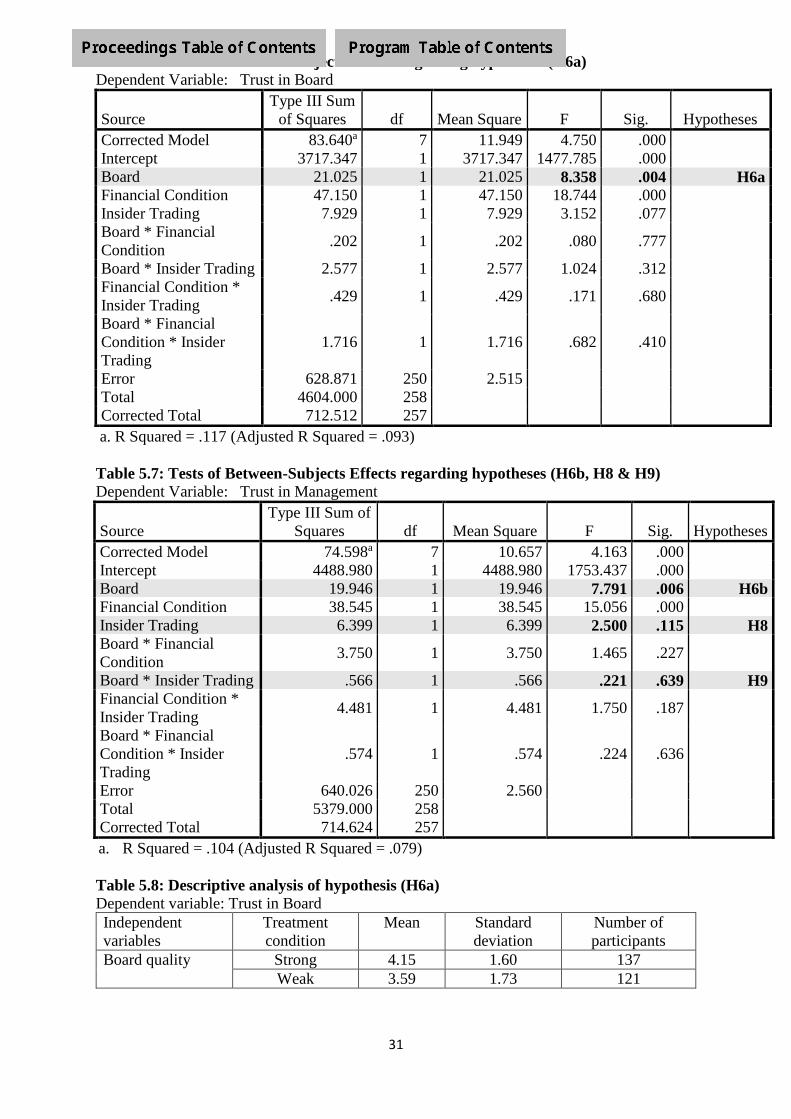
31
Table 5.7: Tests of Between-Subjects Effects regarding hypotheses (H6b, H8 & H9)
Dependent Variable: Trust in Management
Source
Type III Sum of
Squares df Mean Square F Sig. Hypotheses
Corrected Model 74.598a 7 10.657 4.163 .000
Intercept 4488.980 1 4488.980 1753.437 .000
Board 19.946 1 19.946 7.791 .006 H6b
Financial Condition 38.545 1 38.545 15.056 .000
Insider Trading 6.399 1 6.399 2.500 .115 H8
Board * Financial
Condition 3.750 1 3.750 1.465 .227
Board * Insider Trading .566 1 .566 .221 .639 H9
Financial Condition *
Insider Trading 4.481 1 4.481 1.750 .187
Board * Financial
Condition * Insider
Trading
.574 1 .574 .224 .636
Error 640.026 250 2.560
Total 5379.000 258
Corrected Total 714.624 257
a. R Squared = .104 (Adjusted R Squared = .079)
Table 5.8: Descriptive analysis of hypothesis (H6a)
Dependent variable: Trust in Board
Independent
variables
Treatment
condition
Mean Standard
deviation
Number of
participants
Board quality Strong 4.15 1.60 137
Weak 3.59 1.73 121
Table 5.6: Tests of Between-Subjects Effects regarding hypothesis (H6a)
Dependent Variable: Trust in Board
Source
Type III Sum
of Squares df Mean Square F Sig. Hypotheses
Corrected Model 83.640a 7 11.949 4.750 .000
Intercept 3717.347 1 3717.347 1477.785 .000
Board 21.025 1 21.025 8.358 .004 H6a
Financial Condition 47.150 1 47.150 18.744 .000
Insider Trading 7.929 1 7.929 3.152 .077
Board * Financial
Condition .202 1 .202 .080 .777
Board * Insider Trading 2.577 1 2.577 1.024 .312
Financial Condition *
Insider Trading .429 1 .429 .171 .680
Board * Financial
Condition * Insider
Trading
1.716 1 1.716 .682 .410
Error 628.871 250 2.515
Total 4604.000 258
Corrected Total 712.512 257
a. R Squared = .117 (Adjusted R Squared = .093)
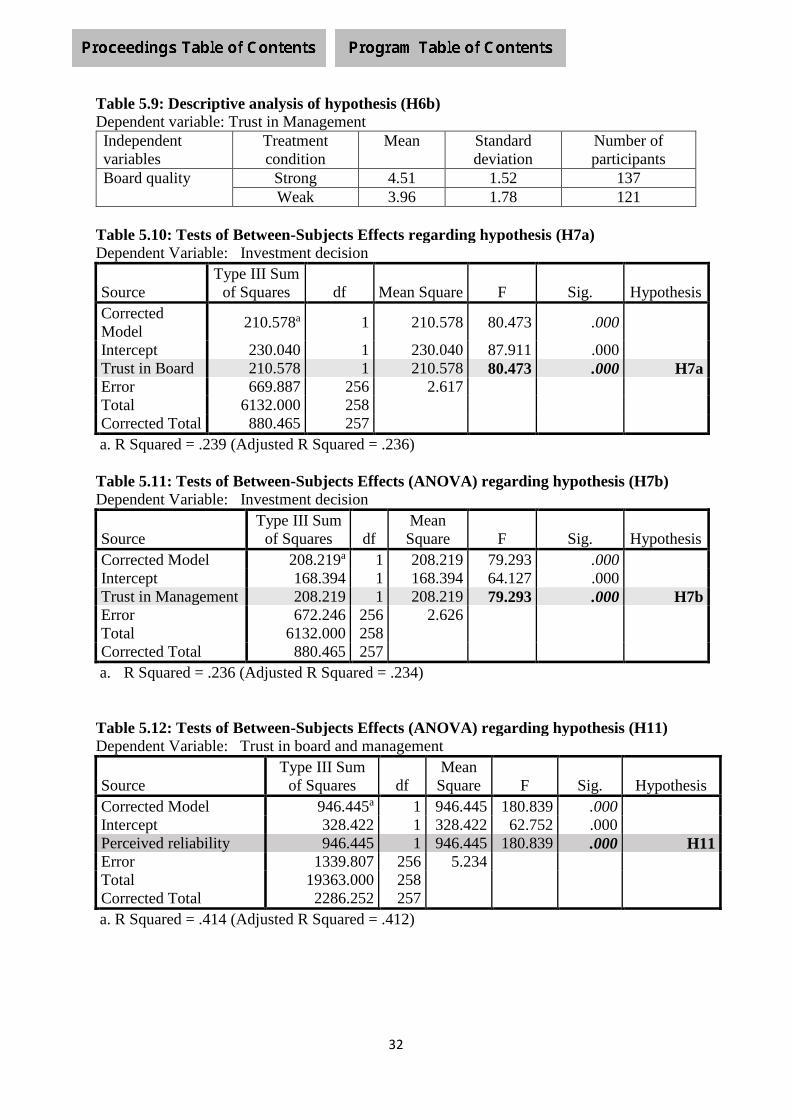
32
Table 5.9: Descriptive analysis of hypothesis (H6b)
Dependent variable: Trust in Management
Independent
variables
Treatment
condition
Mean Standard
deviation
Number of
participants
Board quality Strong 4.51 1.52 137
Weak 3.96 1.78 121
Table 5.10: Tests of Between-Subjects Effects regarding hypothesis (H7a) Dependent Variable: Investment decision
Source
Type III Sum
of Squares df Mean Square F Sig. Hypothesis
Corrected
Model 210.578a 1 210.578 80.473 .000
Intercept 230.040 1 230.040 87.911 .000
Trust in Board 210.578 1 210.578 80.473 .000 H7a
Error 669.887 256 2.617
Total 6132.000 258
Corrected Total 880.465 257
a. R Squared = .239 (Adjusted R Squared = .236)
Table 5.11: Tests of Between-Subjects Effects (ANOVA) regarding hypothesis (H7b) Dependent Variable: Investment decision
Source
Type III Sum
of Squares df
Mean
Square F Sig. Hypothesis
Corrected Model 208.219a 1 208.219 79.293 .000
Intercept 168.394 1 168.394 64.127 .000
Trust in Management 208.219 1 208.219 79.293 .000 H7b
Error 672.246 256 2.626
Total 6132.000 258
Corrected Total 880.465 257
a. R Squared = .236 (Adjusted R Squared = .234)
Table 5.12: Tests of Between-Subjects Effects (ANOVA) regarding hypothesis (H11) Dependent Variable: Trust in board and management
Source
Type III Sum
of Squares df
Mean
Square F Sig. Hypothesis
Corrected Model 946.445a 1 946.445 180.839 .000
Intercept 328.422 1 328.422 62.752 .000
Perceived reliability 946.445 1 946.445 180.839 .000 H11
Error 1339.807 256 5.234
Total 19363.000 258
Corrected Total 2286.252 257
a. R Squared = .414 (Adjusted R Squared = .412)

33
Table 6: Descriptive analyses of Responses to the Debriefing Questions
Mean
Std.
Deviation
1. To what extent did you consider the strength of the board when
deciding whether or not to invest in ABC’s shares? (‘1’= very
little, 4= average, 7= a great amount).
4.16 1.74
2. To what extent did you consider the company’s financial
condition when deciding whether or not to invest in ABC’s
shares? (‘1’= very little, 4= a moderate amount, 7= a great
amount).
4.66 1.78
3. In general, to what extent do you believe that board members
influence the future share price of a firm? (‘1’= very little, 4=a
moderate amount, 7= a great amount).
4.43 1.80
4. In general, if friends and relatives of management are able to
acquire insider information, what does this indicate about
governance quality? (‘1’= governance is poor, 4= governance is
average, 7= governance is very strong).
2.33 1.73
5. In general, what effect does insider trading of a firm’s shares
have on the long-term value of the firm? (‘1’= very negative
effect, 4= no effect, 7= very positive effect).
2.58 1.87
34
REFERENCES
Adams, R. B., Hermalin, B. E., & Weisbach, M. S. (2010). The Role of Boards of Directors
in Corporate Governance: A Conceptual Framework and Survey. Journal of
Economic Literature, 48(1), 58-107.
Adjaoud, F., Zeghal, D., & Andaleeb, S. (2007). The effect of board's quality on
performance: A study of Canadian firms. Corporate Governance: An International
Review, 15(4), 623-635.
Agrawal, A., & Chadha, S. (2005). Corporate governance and accounting scandals. The
Journal of Law & Economics, 48(2), 371-406.
Aguilera, R. V., & Cazurra, A. C. (2009). Codes of good governance. Corporate
Governance: An International Review, 17(3), 376-387.
Akhter, R., & Ahmed, S. (2013). Behavioral Aspects of Individual Investors for Investment
in Bangladesh Stock Market. International Journal of Ethics in Social Sciences, 1(1),
57-70.
Al-Ajmi, J. (2009). Investors' use of corporate reports in Bahrain. Managerial Auditing
journal, 24(3), 266-289.
Anderson , R. C., & Reeb, D. M. (2004). Board composition: Balancing family influence in
S&P 500 firms. Administrative Science Quarterly, 49(2), 209-237.
Azofra-Palenzuela, V., Fernández-Alonso, B., & Vallelado, T. (2006). An Experimental
Study of Herding and Contrarian Behavior among Financial Investors. Available at
https://papers.ssrn.com/sol3/papers.cfm?abstract_id=932928
Bagnoli, M., & Watts, S. G. (2005). Conservative accounting choices. Management Science,
51(5), 786-801.
Baliga, B. R., Moyer, R. C., & Rao, R. S. (1996). CEO duality and firm performance: what's
the fuss? Strategic Management Journal, 17(1), 41-53.
Barnhart, S. W., & Rosenstein, S. (1998). Board composition, managerial ownership, and
firm performance: An empirical analysis. The Financial Review, 33(4), 1-16.
Baysinger, B. D., & Butler, H. N. (1985). Corporate governance and the board of directors:
Performance effects of changes in board composition. Journal of Law, Economics, &
Organization, 1(1), 101-124.
Beams, J. D., Brown, R. M., & Killough, L. N. (2003). An experiment testing the
determinants of non-compliance with insider trading laws. Journal of Business and
Ethics, 45(4), 309-323.
Beasley, M. S. (1996). An empirical analysis of the relation between the board of director
composition and financial statement fraud. The Accounting Review, 71(4), 443-465.
Bergh, D. D., & Gibbons, P. (2011). The stock market reaction to the hiring of management
consultants: A signalling theory approach. Journal of Management Studies, 48(3),
544-567.
Berghe, L. V., & Levrau, A. (2004). Evaluating Boards of Directors: What constitues a good
corporate board? Corporate Governance: An International Review , 12 (4), 461-478.
Berle, A., & Means, G. (1968). The modern corporation and private property, 1932.
McMillan, New York, NY.
Bhagat, S., & Black, B. (1999). The uncertain relationship between board composition and
firm performance. The Business Lawyer, 54(3), 921-963.
Bhattacharya, U., Daouk, H., Jorgenson, B., & Kehr, C.-H. (2000). When an event is not an
event: the curious case of an emerging market. Journal of Financial Economics,
55(1), 69-101.
Birnbaum, M. H., & Stegner, S. E. (1979). Source credibility in social judgment: Bias,
expertise, and the judge's point of view. Journal of Personality and Social

35
Psychology, 37(1): 48.
Boone, A. L., Field, L. C., Karpoff, J. M., & Raheja, C. G. (2007). The determinants of
corporate board size and composition: An emipirical analysis. Journal of Financial
Economics , 66-101.
Borlea, S. N. P., & Achim, M.-V. P. (2013). Theories of Corporate Governance. Studia
Universitatis "Vasile Goldis" Arad. Seria stiinte economice., 23(1), 117-128.
Boyd, B. K. (1995). CEO duality and firm performance: A contingency model. Strategic
Management Journal, 16(4), 301-312.
Brickley, J. A., Coles, J. L., & Jarrell, G. (1997). Leadership structure: Separating the CEO
and chairman of the board. Journal of corporate Finance, 3(3), 189-220.
BSEC. (2012). Securities Rules. Retrieved July 10, 2013, from Bangladesh Securities and
Exchange Commission. http://www.secbd.org/.
Byrd, J. W., & Hickman, K. A. (1992). Do outside directors monitor managers?: Evidence
from tender offer bids. Journal of Financial Economics, 32(2), 195-221.
Chang, R. D., & Wei, J. T. (2011). Effects of governance on investment decision and
perceptions of reporting credibility: Investment experience of Taiwanese individual
investors. Asia Pacific Journal of Management , 28(1), 139-155.
Chiang, H.-t., & Chia, F. (2005). An empirical study of corporate governance and corporate
performance. Journal of American Academy of Business, 6(1), 95-101.
Child, J., & Rodrigues, S. B. (2004). Repairing the breach of trust in corporate governance.
Corporate Governance: An International Review, 12(2), 143-152.
Chowdhury, S., Mollik, A. T., & Akhter, M. S. (2006). Does predicted macroeconomic
Volatility influence stock market volatility? Evidence from the Bangladesh capital
market (Doctoral dissertation, University of South Australia).
Christophe, S. E., Ferri, M. G., & Hsieh, J. (2010). Informed trading before analyst
downgrades: Evidence from short sellers. Journal of Financial Economics, 95(1), 85-
106.
Clarkson, P. M., Craswell, A., & Mackenzie, P. (2008). The effect of board independence on
target shareholder wealth. Australian Accounting Review, 18(2), 135-148.
Cossin, D., & Caballero, J. (2012). A practical perspective:The four pillers of of board
effectiveness. Retrieved from https://www.imd.org/globalassets/board-
center/docs/imd-the-four-pillars-of-board-effectiveness-1.pdf
Cotter, J. F., Shivdasani, A., & Zenner, M. (1997). Do independent directors enhance target
shareholder wealth during tender offers? Journal of Financial Economics, 43(2).
CPD. (2011). WEF's Global Competitiveness Report 2011-12 and Bangladesh
Business Environment Study 2011. Dhaka: Centre for Policy Dialogue.
Cremers, K., & Nair, V. B. (2005). Governance mechanisms and equity prices. The Journal
of Finance, 60(6), 2859-2894.
Dai, L., Fu, R., Kang, J. K., & Lee, I. (2013). Internal corporate governance and insider
trading. Work. Pap., Erasmus Univ. http://papers.ssrn.com/sol3/papers.cfm
Daily, C. M., & Dalton, D. R. (1993). Board of directors leadership and structure: Control
and performance implications. Entrepreneurship Theory and Practice, 17 (3), 65-82.
Dalton, D. R., Daily, C. M., Ellstrand, A. E., & Johnson, J. L. (1998). Meta-analytic reviews
of board composition, leadership structure, and financial performance. Strategic
management journal, 19(3), 269-290.
Dechow, P. M., Sloan, R. G., & Sweeney, A. P. (1996). Causes and consequences of earnings
manipulation: An analysis of firms subject to enforcement actions by the SEC.
Contemporary Accounting Research, 13(1), 1-36.
Diestre, L., Rajagopalan, N., & Dutta, S. (2014). Constraints in acquiring and utilizing
directors' experience: An empirical study of new‐market entry in the pharmaceutical
https://www.imd.org/globalassets/board-center/docs/imd-the-four-pillars-of-board-effectiveness-1.pdf
36
industry. Strategic Management Journal, 36(3), 339-359
Downen, T. (2014). Defining and Measuring Financial Reporting Precision. Journal of
Theoretical Accounting Research, 9(2), 21-57.
Easley, D., & O'hara, M. (2004). Information and the cost of capital. The Journal of Finance,
59(4), 1553-1583.
El-Sayed Ebaid, I. (2013). Corporate governance and investors' perceptions of earnings
quality: Egyptian perspective. Corporate Governance: The International Journal of
Business in Society, 13(3), 261-273.
Elliott, W. B., Hodge, F. D., Kennedy, J. J., & Pronk, M. (2007). Are MBA students a good
proxy for nonprofessional investors? The Accounting Review, 82(1), 139-168.
Elliott, W. B., Jackson, K. E., & Smith, S. D. (2006). Estimate-Related Disclosures and
Investors’ Reliability Judgments. Retrieved from
https://www.researchgate.net/profile/WBrookeElliott/publication/267218205_Estimat
eRelated_Disclosures_and_Investors'_Reliability_Judgments/links/547f79260cf2ccc7
f8b921f4.pdf
Erb, C., & Pelger, C. (2015). “Twisting words”? A study of the construction and
reconstruction of reliability in financial reporting standard-setting. Accounting,
Organizations and Society, 40, 13-40.
Fama, E. F., & Jensen, M. C. (1983a). Agency problems and residual claims. Journal of Law
and Economics, 26(2), 327-349.
Fama, E. F., & Jensen, M. C. (1983b). Separation of ownership and control. Journal of Law
and economics, 26(2), 301-325.
FASB. (1980). Statement of financial accounting concepts No. 2: qualitative characteristics
of accounting information. Stamfort, CT: Financial Accounting Standards Board.
Retrieved from http://www.fasb.org/cs
FASB. (2010a). Conceptual Framework for Financial Reporting. Statement of Financial
Accounting Concepts No. 8. Financial Accounting Standards Board. Retrieved from
http://www.fasb.org/cs
FASB. (2010b). Conceptual Framework for Financial Reporting. Chapter 3,“Qualitative
Characteristics of Useful Financial Information.” Statement of Financial Accounting
Concepts No. 8. Financial Accounting Standards Board. Retrieved from
http://www.fasb.org/cs
Frederickson, J. R., Hodge, F. D., & Pratt, J. H. (2006). The evolution of stock option
accounting: Disclosure, voluntary recognition, mandated recognition, and
management disavowals. The Accounting Review, 81(5), 1073-1093.
Giannetti, M., & Simonov, A. (2006). Which investors fear expropriation? Evidence from
investors' portfolio choices. The Journal of Finance, 61(3), 1507-1547.
Gillan, S. L. (2006). Recent Developments in Corporate Governance:An Overview. Journal
of Corporate Finance , 12(3), 381-402.
Gompers, P. A., Ishii, J. L., & Metrick, A. (2003). Corporate governance and equity prices.
The Quarterly Journal of Economics, 118(1), 107-156.
Guthrie, C. (2008). The Effects of Reputation Threat and Whistle-Blowing Report Source on
Chief Audit Executives' Investigation Decisions (Doctoral dissertation).
Harrison, R. T., Dibben, M. R., & Mason, C. M. (1997). The role of trust in the informal
investor's investment decision: An exploratory analysis. Entrepreneurship Theory and
Practice, 21, 63-82.
Hillman, A. J., & Dalziel, T. (2003). Boards of directors and firm performance: Integrating
agency and resource dependence perspectives. Academy of ManagementReview,28(3).
Hirst, D. E., Koonce, L., & Simko, P. J. (1995). Investor reactions to financial analysts'
research reports. Journal of Accounting Research, 33(2), 335-351.
37
Hodge, F. D. (2003). Investors' perceptions of earnings quality, auditor independence, and the
usefulness of audited financial information. Accounting Horizons, 17, 37-48.
Holder-Webb, L., & Sharma, D. S. (2010). The effect of governance on credit decisions and
perceptions of reporting reliability. Behavioral Research in Accounting, 22(1), 1-20.
IASB. (2010). Conceptual Framework for Financial Reporting. International Accounting
Standard Board. Retrieved from http://www.ifrs.org/News/Press Releases/
Documents/Conceptual FW2010vb.pdf
IASB. (2015). Conceptual Framework for Financial Reporting. International Accounting
Standard Board. Retrieved from http://www.ifrs.org/Current-Projects/IASB-
Projects/Conceptual-Framework/Documents/May%202015/Basis-to-
ED_CF_MAY%202015.pdf
ICAEW. (2016). Evolution of the UK Corporate Governance Code: Retrieved from
http://www.icaew.com/en/library/subject-gateways/corporate-governance/codes-and-
reports/uk-corporate-governance-code/history
Jensen, M. C. (1993). The modern industrial revolution, exit, and the failure of internal
control systems. The Journal of Finance, 48(3), 831-880.
Jensen, M. C. (2003). A theory of the firm: governance, residual claims, and organizational
forms. Harvard University Press.
Jensen, M. C., & Meckling, W. H. (1979). Theory of the firm: Managerial behavior, agency
costs, and ownership structure. In Economics and social institutions (pp. 163-231)
Springer Netherlands.
Kanagaretnam, K., Lobo, G. J., & Whalen, D. J. (2007). Does good corporate governance
reduce information asymmetry around quarterly earnings announcements? Journal of
Accounting and Public Policy, 26(4), 497-522.
Kang, S. (2013). Experienced Independent Directors. Available at SSRN 2240650. Available
at https://papers.ssrn.com/sol3/papers.cfm?abstract_id=2240650
Karpoff, J. M., & Lee, D. (1991). Insider trading before new issue announcements. Financial
Management, 20(1), 18-26.
Kelly, C., Boardman, M., Goillau, P., & Jeannot, E. (2003). Guidelines for trust in future
ATM systems: A literature review. Retrieved from
https://www.eurocontrol.int/sites/default/files/content/ documents/nm/
safety/guidelines-for-trust-in-future-atm-systems-a-literature-review.pdf
Keown, A. J., & Pinkerton, J. M. (1981). Merger announcements and insider trading activity:
An empirical investigation. The Journal of Finance, 36(4), 855-869.
Kiel, G. C., & Nicholson, G. J. (2003). Board composition and corporate performance: how
the Australian experience informs contrasting theories of corporate governance.
Corporate Governance: An International Review, 11(3), 189-205.
Klein, A. (1998). Firm Performance and Board Committee Structure. The Journal of Law and
Economics, 41(1), 275-304.
Klein, A. (2002). Audit committee, board of director characteristics, and earnings
management. Journal of Accounting and Economics, 33(3), 375-400.
Kramer, R. M., & Cook, K. S. (2004). Trust and distrust in organizations. Dilemmas and
Approaches. New York: Russell Sage Foundation, 7.
Krause, R., & Semadeni, M. (2014). Last dance or second chance? Firm performance, CEO
career horizon, and the separation of board leadership roles. Strategic Management
Journal, 35(6), 808-825.
Kross, W., & Schroeder, D. A. (1984). An empirical investigation of the effect of quarterly
earnings announcement timing on stock returns. Journal of Accounting Research,
22(1), 153-176.
Lakonishok, J., & Lee, I. (2001). Are insider trades informative? Review of Financial Studies,
38
14(1), 79-11.
Lawrence, R., & Kercsmar, J. (1999). Accounting information utilization and judgment
quality in a stock investment task. American Business Review, 17(1), 7.
Leung, S., Richardson, G., & Jaggi, B. (2014). Corporate board and board committee
independence, firm performance, and family ownership concentration: An analysis
based on Hong Kong firms. Journal of Contemporary Accounting & Economics,
10(1), 16-31.
Lewis, J. D., & Weigert, A. (1985). Trust as a social reality. Social forces, 63(4): 967-985.
Li, J., & Ang, J. S. (2000). Quantity versus quality of directors’ time: The effectiveness of
directors and number of outside directorships. Managerial Finance, 26(10), 1-21.
Libby, R., Bloomfield, R., & Nelson, M. W. (2002). Experimental research in financial
accounting. Accounting, Organizations and Society, 27(8), 775-810.
Lukas, C., & Schöndube, J. R. (2012). Trust and adaptive learning in implicit contracts.
Review of Managerial Science, 6(1), 1-32.
Maines, L. A., & Wahlen, J. M. (2006). The nature of accounting information reliability:
Inferences from archival and experimental research. Accounting Horizons, 20(4), 399-
425.
Molm, L. D., Takahashi, N., & Peterson, G. (2000). Risk and trust in social exchange: An
experimental test of a classical proposition. American Journal of Sociology, 105(5),
1396-1427.
Morck, R., Shleifer, A., & Vishny, R. W. (1988). Management ownership and market
valuation: An empirical analysis. Journal of Financial Economics, 20, 293-315.
Penman, S. H. (1982). Insider trading and the dissemination of firms' forecast information.
Journal of Business, 55(40), 479-503.
Penman, S. H., & Sougiannis, T. (1998). A comparison of dividend, cash flow, and earnings
approaches to equity valuation. Contemporary Accounting Research, 15(3), 343-383.
Piotroski, J. D., & Roulstone, D. T. (2005). Do insider trades reflect bothcontrarian beliefs
and superior knowledge about future cash realizations? Journal of Accounting and
Finance, 39 (1), 55-81.
Porta, R. L., Lopez-de-Silanes, F., Shleifer, A., & Vishny, R. W. (1998). Law and finance.
Journal of political economy, 106(6), 1113-1155.
Prowse, S. (1998a). Angel investors and the market for angel investments. Journal of
Banking & Finance, 22(6), 785-792.
Rechner, P. L., & Dalton, D. R. (1991). CEO duality and organizational performance: A
longitudinal analysis. Strategic Management Journal, 12(2), 155-160.
Robinson, S. L. (1996). Trust and breach of the psychological contract. Administrative
Science Quarterly, (41(4), 574-599.
Ryan, L. V., & Buchholtz, A. K. (2001). Trust, risk, and shareholder decision making: An
investor perspective on corporate governance. Business Ethics Quarterly, 11(01), 177-
193.
Setia-Atmaja, L., Haman, J., & Tanewski, G. (2011). The role of board independence in
mitigating agency problem II in Australian family firms. The British Accounting
Review, 43(3), 230-246.
Setia‐Atmaja, L., Tanewski, G. A., & Skully, M. (2009). The role of dividends, debt and
board structure in the governance of family controlled firms. Journal of Business
Finance & Accounting, 36(7‐8), 863-898.
Seyhun, H. N. (1986). Insiders' profits, costs of trading, and market efficiency. Journal of
Financial Economics, 16(2), 189-212.
Sharma, D. S. (2006). Effects of professional and non-professional investors’ perceptions of
board effectiveness on their judgments: An experimental study. Journal of Accounting

39
and Public Policy, 25(1), 91-115.
Simpson, W. G., & Gleason, A. E. (1999). Board structure, ownership, and financial distress
in banking firms. International Review of Economics & Finance, 8(3), 281-292.
Stulz, R. (1988). Managerial control of voting rights: Financing policies and the market for
corporate control. Journal of Financial Economics, 20: 25-54.
Van den Berghe, L. A., & Levrau, A. (2004). Evaluating boards of directors: what constitutes
a good corporate board? Corporate Governance: An International Review, 12(4), 461-
478.
Watts, R. Zimmerman (1986). Positive accounting theory. Edgewood Cliff, NJ.
Westphal, J. D. (1998). Board games: How CEOs adapt to increases in structural board
independence from management. Administrative Science Quarterly, 43(3), 511-537.
Whittington, G. (1999). Trust in financial reporting. Pacific Accounting Review, 11(1/2): 181-
188.
Whittington, G. (2008). Fair value and the IASB/FASB conceptual framework project: an
alternative view. Abacus, 44(2), 139-168.
Zhang, Y., & Wiersema, M. F. (2009). Stock market reaction to CEO certification: The
signaling role of CEO background. Strategic Management Journal, 30(7), 693-710.

40
Appendix A: Instrument
Investor Decisions
INSTRUCTIONS FOR COMPLETING QUESTIONNAIRE
Thank you for participating in this study. You do not need to provide your name or reveal your
identity in this study. Your participation, information and opinions will remain anonymous; and
will be kept strictly confidential and reported only in aggregated/non-attributable form. Your
information will be used only for this research. After completing the task you should put your
envelopes back in the study material pack and deposit in the box placed in the back of the room.
Return of the questionnaire is deemed to be consent to your participation in this study.
The first envelope contains the following information about a company called ABC.
- Background information
- Regulatory requirements of board structure
- Information about the board structure of the company
- Financial highlights for the years 2010, 2011 & 2012
You will be asked to evaluate the company as a potential investment opportunity. The second
envelope contains demographic questions and additional questions about ABC Company.
Please open Envelope No. 1 to begin the questionnaire
Background information
The Bangladesh SEC issued new corporate governance guidelines in August 2012 that became
effective in December 2012. The guidelines were intended to improve governance quality by
creating new requirements related to board size, the number of independent directors, directors’
educational qualifications, directors’ professional experience, and the duality of the CEO and
the board chairman. The compulsory requirements for board structures of listed companies in
Bangladesh are described in Table 1.
Table 1
Board Structure Component Requirements
Board size The number of board members shall not be less
than 5 (five) nor more than 20 (twenty).
Total number of independent
directors’
At least 1/5th of the total number of directors must
be independent.
Qualification of independent
directors’
The independent directors shall be elected from the
following professional categories:
1. Business Leader
2. Corporate Leader
3. Bureaucrat
4. University Teacher with Economics or
Business Studies or Law background
5. Chartered Accountants
6. Cost & Management Accountants
7. Chartered Secretaries
Experience All independent directors must have at least 12 years
of professional experience.
Duality The Chairman of the Board and the Chief
Executive Officer shall be different individuals.
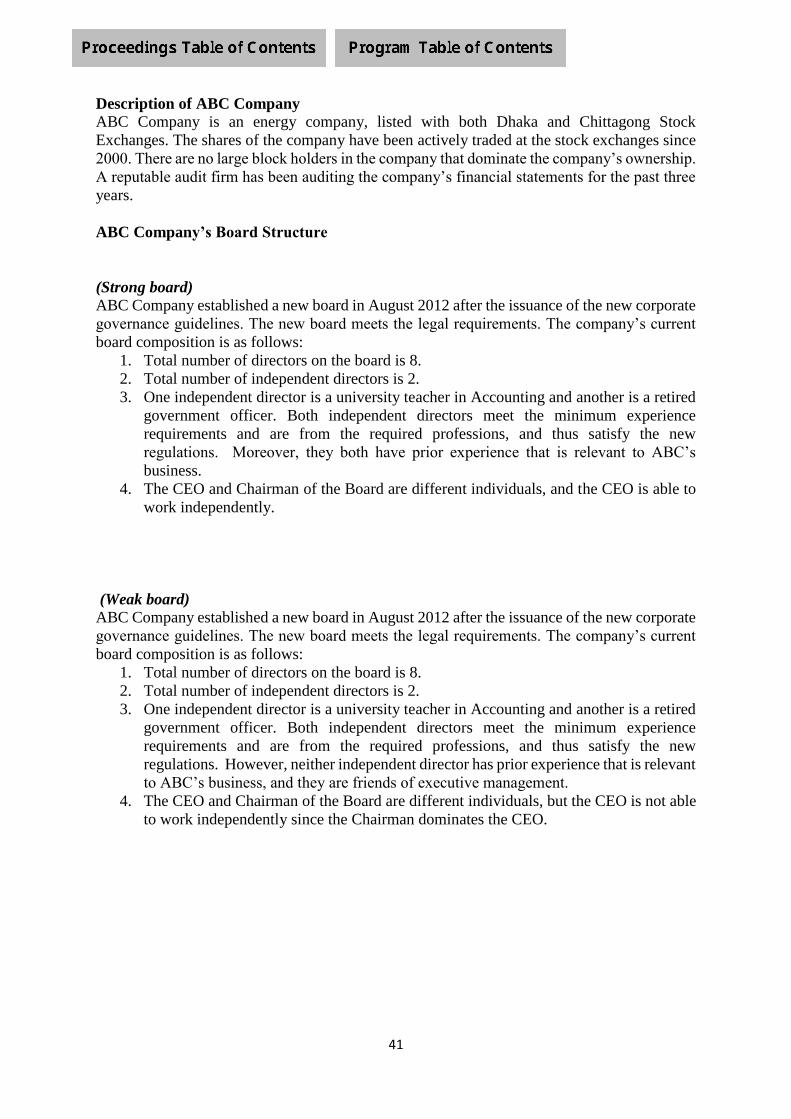
41
Description of ABC Company
ABC Company is an energy company, listed with both Dhaka and Chittagong Stock
Exchanges. The shares of the company have been actively traded at the stock exchanges since
2000. There are no large block holders in the company that dominate the company’s ownership.
A reputable audit firm has been auditing the company’s financial statements for the past three
years.
ABC Company’s Board Structure
(Strong board)
ABC Company established a new board in August 2012 after the issuance of the new corporate
governance guidelines. The new board meets the legal requirements. The company’s current
board composition is as follows:
1. Total number of directors on the board is 8.
2. Total number of independent directors is 2.
3. One independent director is a university teacher in Accounting and another is a retired
government officer. Both independent directors meet the minimum experience
requirements and are from the required professions, and thus satisfy the new
regulations. Moreover, they both have prior experience that is relevant to ABC’s
business.
4. The CEO and Chairman of the Board are different individuals, and the CEO is able to
work independently.
(Weak board)
ABC Company established a new board in August 2012 after the issuance of the new corporate
governance guidelines. The new board meets the legal requirements. The company’s current
board composition is as follows:
1. Total number of directors on the board is 8.
2. Total number of independent directors is 2.
3. One independent director is a university teacher in Accounting and another is a retired
government officer. Both independent directors meet the minimum experience
requirements and are from the required professions, and thus satisfy the new
regulations. However, neither independent director has prior experience that is relevant
to ABC’s business, and they are friends of executive management.
4. The CEO and Chairman of the Board are different individuals, but the CEO is not able
to work independently since the Chairman dominates the CEO.
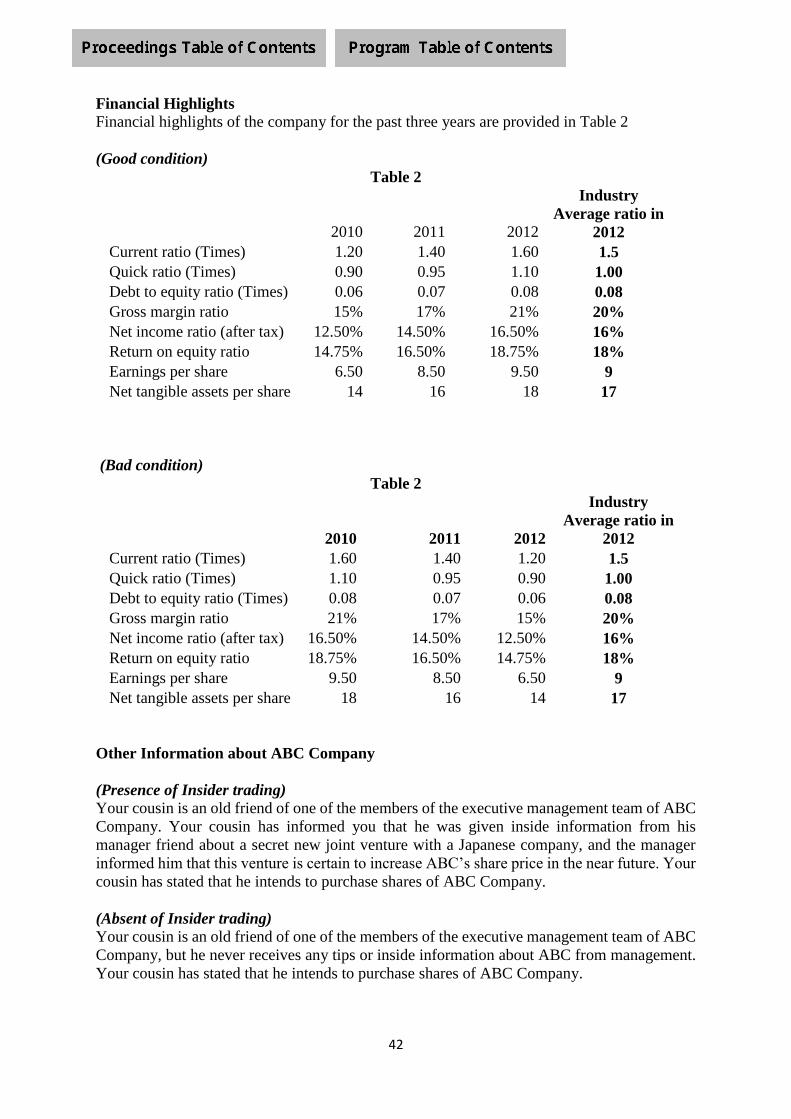
42
Financial Highlights
Financial highlights of the company for the past three years are provided in Table 2
(Good condition)
Table 2
2010 2011 2012
Industry
Average ratio in
2012
Current ratio (Times) 1.20 1.40 1.60 1.5
Quick ratio (Times) 0.90 0.95 1.10 1.00
Debt to equity ratio (Times) 0.06 0.07 0.08 0.08
Gross margin ratio 15% 17% 21% 20%
Net income ratio (after tax) 12.50% 14.50% 16.50% 16%
Return on equity ratio 14.75% 16.50% 18.75% 18%
Earnings per share 6.50 8.50 9.50 9
Net tangible assets per share 14 16 18 17
(Bad condition)
Table 2
2010 2011 2012
Industry
Average ratio in
2012
Current ratio (Times) 1.60 1.40 1.20 1.5
Quick ratio (Times) 1.10 0.95 0.90 1.00
Debt to equity ratio (Times) 0.08 0.07 0.06 0.08
Gross margin ratio 21% 17% 15% 20%
Net income ratio (after tax) 16.50% 14.50% 12.50% 16%
Return on equity ratio 18.75% 16.50% 14.75% 18%
Earnings per share 9.50 8.50 6.50 9
Net tangible assets per share 18 16 14 17
Other Information about ABC Company
(Presence of Insider trading)
Your cousin is an old friend of one of the members of the executive management team of ABC
Company. Your cousin has informed you that he was given inside information from his
manager friend about a secret new joint venture with a Japanese company, and the manager
informed him that this venture is certain to increase ABC’s share price in the near future. Your
cousin has stated that he intends to purchase shares of ABC Company.
(Absent of Insider trading)
Your cousin is an old friend of one of the members of the executive management team of ABC
Company, but he never receives any tips or inside information about ABC from management.
Your cousin has stated that he intends to purchase shares of ABC Company.

43
Questions
Base only upon the case materials you have read, please answer the following questions:
1. What is the likelihood that you would choose to invest in ABC Company? (Please
circle one)
1----------------2----------------3----------------4----------------5----------------6----------------7
Not at all likely Moderately likely Very likely
2. What do you believe will happen to ABC Company’s stock price over the next
year?
1---------------2----------------3----------------4----------------5----------------6---------------
--7
Significant decline No change
Significant increase
3. Do you believe that the financial information of ABC Company is reliable?
(Please circle one)
1----------------2----------------3----------------4----------------5----------------6--------------
--7
Not reliable at all Moderately reliable Very
reliable
4. Do you trust ABC Company’s directors to protect the interest of shareholders? (Please circle one)
1----------------2----------------3----------------4----------------5----------------6--------------
--7
No trust Moderate trust Complete trust
5. What is your perception of the quality of ABC Company’s board of directors? (Please circle one)
1----------------2----------------3----------------4----------------5----------------6--------------
--7
Very low quality Average quality Very high
quality
6. Do you trust the management of ABC Company to accurately represent the
financial position of the firm? (Please circle one)
1----------------2----------------3----------------4----------------5----------------6--------------
--7
No trust Moderate trust Complete
trust
7. Do you believe that the directors of ABC Company are involved in insider
trading?
1----------------2----------------3----------------4----------------5----------------6--------------
--7
Definitely no Possibly Definitely
yes
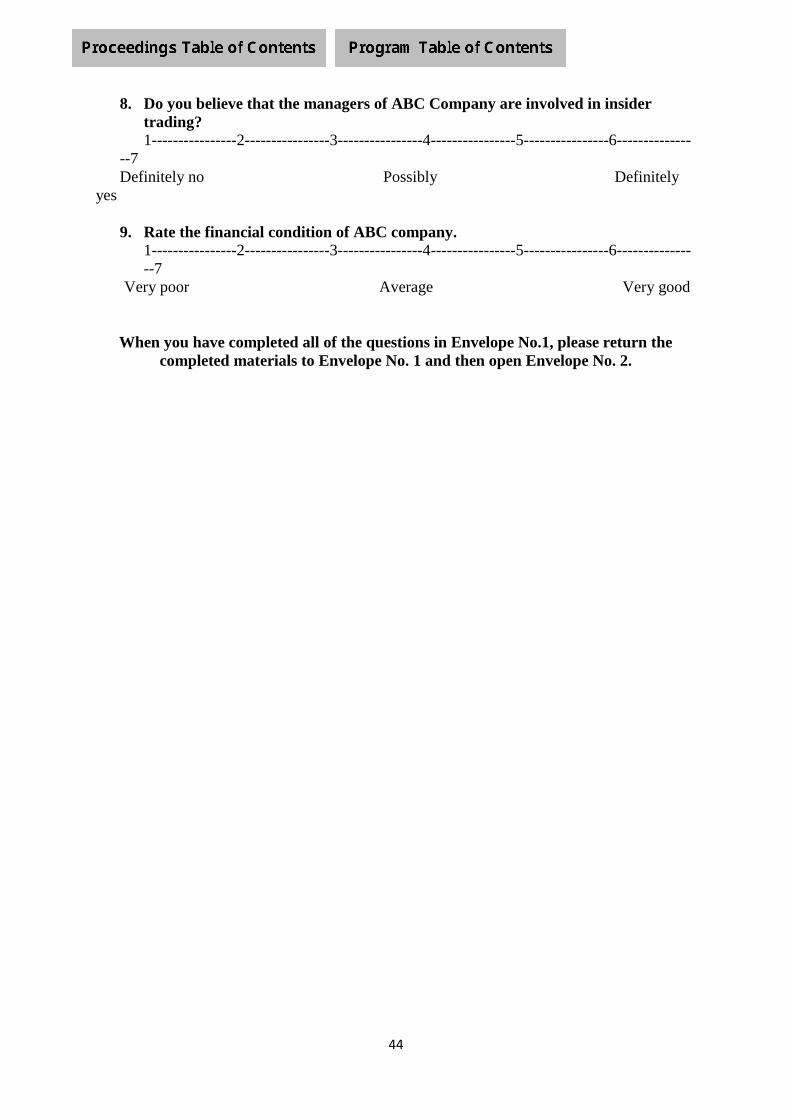
44
8. Do you believe that the managers of ABC Company are involved in insider
trading?
1----------------2----------------3----------------4----------------5----------------6--------------
--7
Definitely no Possibly Definitely
yes
9. Rate the financial condition of ABC company.
1----------------2----------------3----------------4----------------5----------------6--------------
--7
Very poor Average Very good
When you have completed all of the questions in Envelope No.1, please return the
completed materials to Envelope No. 1 and then open Envelope No. 2.

45
Questions (related to ABC Ltd)
Please answer all questions.
1. Which of the following statements about your cousin were included in the case
materials (check one box to indicate your response)
Your cousin is an old friend of one of the members of the executive management
team of ABC Company. Your cousin has informed you that he was given inside
information from his manager friend about a secret new joint venture with a
Japanese company, and the manager informed him that is venture is certain to
increase ABC’s share price in the near future. Your cousin has stated that he
intends to purchase shares of ABC Company.
Your cousin is an old friend of one of the members of the executive management
team of ABC Company but never gets any inside information of ABC which
has impact on price. Your cousin has stated that he intends to purchase shares
of ABC Company.
2. What was the trend in ABC Company’s financial condition over the last three
years (Please tick the appropriate box)
Declining Improving
3. Which of the following statements about the independent directors were
included in the case material (check one box to indicate your response)
One independent director is a university teacher in Accounting and another is a
retired government officer. Both independent directors meet the minimum
experience requirements and are from the required professions, and thus satisfy
the new regulations. However, neither independent director has prior experience
that is relevant to ABC’s business, and they are friends of executive
management.
One independent director is a university teacher in Accounting and another is a
retired government officer. Both independent directors meet the minimum
experience requirements and are from the required professions, and thus satisfy
the new regulations. Moreover, both independent directors have prior
experience that is very relevant to ABC’s business.
4. Which of the following statements about the CEO were included in the case
material (check one box to indicate your response)
The CEO and Chairman of the Board are different individuals, but the CEO is
not able to work independently since the Chairman dominates the CEO.
The CEO and Chairman of the Board are different individuals, and the CEO is
able to work independently.

46
5. To what extent did you consider the strength of the board when deciding
whether or not to invest in ABC’s shares? (Please circle one)
1----------------2----------------3----------------4----------------5----------------6--------------
--7
Very little Average A
great amount
6. To what extent did you consider the company’s financial condition when
deciding whether or not to invest in ABC’s shares? (Please circle one in each item)
1----------------2----------------3----------------4----------------5----------------6--------------
--7
Very little A moderate amount A great
amount
7. In general, to what extent do you believe that board members influence the future
share price of a firm? (Please circle one in each item)
1----------------2----------------3----------------4----------------5----------------6--------------
--7
Very little A moderate amount A great
amount
8. In general, if friends and relatives of management are able to acquire insider
information, what does this indicate about governance quality? (Please circle one
in each item)
1----------------2----------------3----------------4----------------5----------------6--------------
--7
Governance is very poor Governance is average Governance is very
strong
9. In general, what effect does insider trading of a firm’s shares have on the long-
term value of the firm? (Please circle one in each item)
1----------------2----------------3----------------4----------------5----------------6--------------
--7
Very negative effect No effect
Very positive effect

47
Demographic Information
Please answer all questions by ticking the appropriate boxes:
1. Your age (in years) 2. Gender
Under 20 Female
20-35 Male
36-50
51-65
Over 65
3. Your highest education 4. Your occupation
SSC Student
HSC Retired public servant
Bachelor Degree Retired private servant
Masters degree Private servant
PhD Private business
Professional Degree Academician
Diploma Physician (Doctor)
Others (specify)
5. Number of years of experience in trading of shares (please write the number of years
in the box)
Thank you for your participation. Please return the completed materials to
Envelope No. 2 and then put both envelopes in the study material pack and then
deposit in the box.
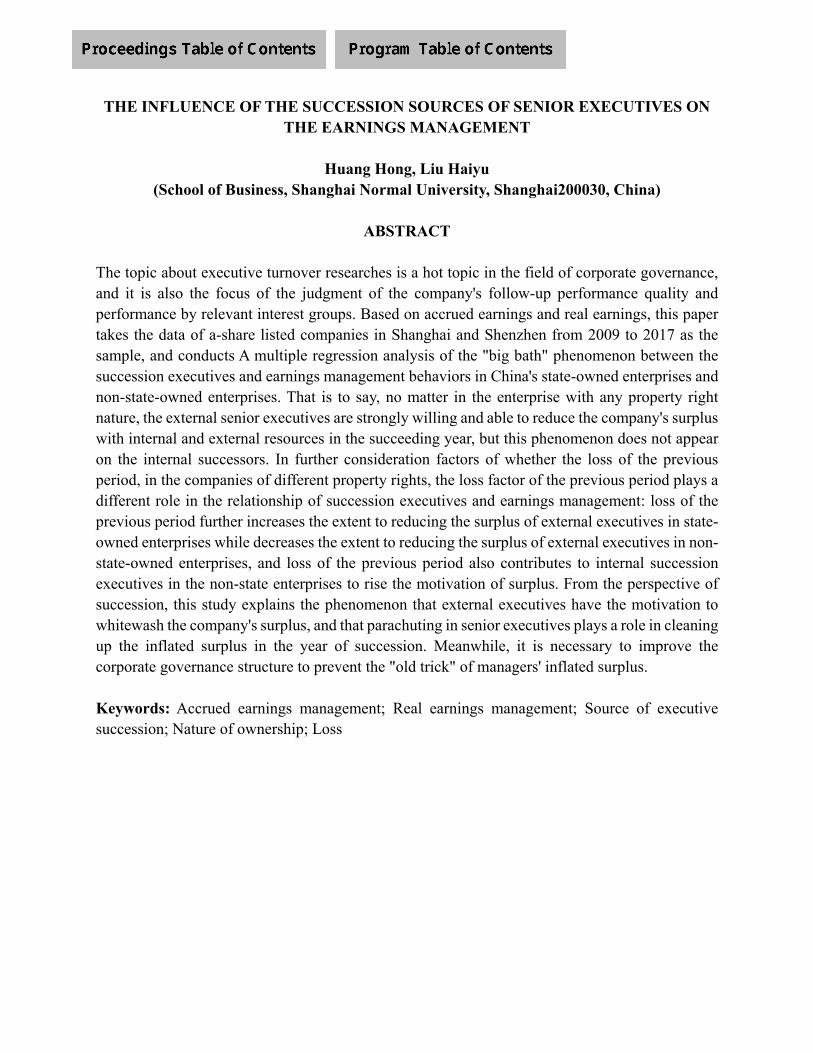
THE INFLUENCE OF THE SUCCESSION SOURCES OF SENIOR EXECUTIVES ON THE EARNINGS MANAGEMENT
Huang Hong, Liu Haiyu
(School of Business, Shanghai Normal University, Shanghai200030, China)
ABSTRACT
The topic about executive turnover researches is a hot topic in the field of corporate governance, and it is also the focus of the judgment of the company's follow-up performance quality and performance by relevant interest groups. Based on accrued earnings and real earnings, this paper takes the data of a-share listed companies in Shanghai and Shenzhen from 2009 to 2017 as the sample, and conducts A multiple regression analysis of the "big bath" phenomenon between the succession executives and earnings management behaviors in China's state-owned enterprises and non-state-owned enterprises. That is to say, no matter in the enterprise with any property right nature, the external senior executives are strongly willing and able to reduce the company's surplus with internal and external resources in the succeeding year, but this phenomenon does not appear on the internal successors. In further consideration factors of whether the loss of the previous period, in the companies of different property rights, the loss factor of the previous period plays a different role in the relationship of succession executives and earnings management: loss of the previous period further increases the extent to reducing the surplus of external executives in state-owned enterprises while decreases the extent to reducing the surplus of external executives in non-state-owned enterprises, and loss of the previous period also contributes to internal succession executives in the non-state enterprises to rise the motivation of surplus. From the perspective of succession, this study explains the phenomenon that external executives have the motivation to whitewash the company's surplus, and that parachuting in senior executives plays a role in cleaning up the inflated surplus in the year of succession. Meanwhile, it is necessary to improve the corporate governance structure to prevent the "old trick" of managers' inflated surplus. Keywords: Accrued earnings management; Real earnings management; Source of executive succession; Nature of ownership; Loss
I. INTRODUCTION The topic about researchers on top management turnover is a hot topic in the field of corporate
governance. To a large extent, this issue reflects the level of corporate governance, and at the same time, it has become the focus of related interest groups' judgment on the quality and performance of the company's subsequent performance. Foreign scholars' studies on earnings management and top management turnover believe that in order to maintain personal reputation or personal interests, external executives often manipulate profits through earnings management, thus increasing the book surplus. After the change of senior executives, the new senior executives will often take advantage of the "period of ambiguity between success and failure", firstly turn the profit down through negative earnings management to put the responsibility on the predecessor, and carry out "surplus reserve" for the following year [1] [2].Therefore, it can be seen that the dismission and succession of senior executives do affect the earnings management behavior of the company.
Many foreign scholars have confirmed that changes of senior executives are one of the reasons for the change in the direction and degree of earnings management of the company. For example, De Angelo (1986) found that for a company with poor performance, the new CEO would write off a huge amount of assets to increase the possibility of future surplus [3]. Murphy and Zimmerman (1993) also confirmed the existence of such behavior in new executives [4]. Godfreyet al. (2003)found that senior executives in Australian companies also had the behaviors of “cleaning profits” in that year [5]. Geiger and North (2006) took changes of CFO as the research objects, and found that there were significant differences in earnings management between these two kinds of companies by comparing the earnings management degree of companies with external CFO appointment and those without CFO changes [6]. Pourciau (1993) further found that new executives in the office will use accrued items and assets amortization to reduce the book surplus and put the blame of poor performance on former executives. But in his second year in office, the new executives would upward adjust profit by formal means, which showed the company's shareholders and the board of directors that their business could be better than the previous executives [7].
This phenomenon that the changes of senior management lead to earnings management also exists in China. Hongjun Zhu (2002) found that the new executives did not significantly improve the performance of listed companies in a short period of time, but increased the degree of earnings management of companies [8]. Xingwen Zhu (2010) found that in the year when the senior executives were replaced, the company had a serious act of adjusting and reducing the book surplus, but state-owned controlling shareholders could play a certain role in inhibiting such earnings management[9]. Yongjian Linet al. (2013)also found that new executives cleaned the surplus in the year when they took office, and they would further increase profits in the first and second full year after they took office[10]. From the perspective of financial restatement, Luguang Qi and Chuanmo Han (2017) found that the new senior executives would reduce profits by restating the financial statements of the previous year [11].
The above studies have confirmed that senior executives of Chinese enterprises also make great efforts to reduce profits in the year when they take office, but many literatures fail to distinguish the sources of senior executives' succession. Then Xingqiang Du and Zejiang Zhou

(2010) distinguished the sources of succession and found that with other factors that may affect the earnings management controlled, external executives relatively had more negative earnings management, that is to say, executives hired from outside are more motivated to reduce the company's current surplus level than those promoted from inside, indicating that the "big shower" phenomenon not only exists, but also changes to some extent depending on the source of new executives [12].
However, the above researches are mainly based on accrual earnings management. Earnings management can be divided into accrued earnings management and real earnings management according to whether it will ultimately affect the cash flow of enterprises. Qihui Gong (2015) argued that there was substitution effect between these two methods when enterprises conducted earnings management, namely when choosing one major method of earnings management, the use of other methods of earnings management will be relatively reduced. And in China after policy terms which ruled that assets’ impairment provision can be reversed were cancelled, accrued items adjustment space is becoming narrow, coupled with the continuous strengthening of the external supervision, as a result of which, the risk of accrual earnings management increases accordingly. Therefore, the probability and amount of a company with positive earnings management motivation to increase profits through accrual items are significantly reduced, while the behavior of increasing profits through disposal of long-term assets is significantly increased [13]. Cohen and Zarowin (2008) also found that after the enactment of the SOX law, the management began to change the implementation mode of earnings management, and more often chose to achieve the purpose of adjusting the current account surplus through the actual activities of the company [14]. Gunny (2010) also believed that the manipulation of real business activities was hidden in daily production, sales and other activities, with high concealment, low risk, relatively low litigation risk and regulated cost [15]. Qizhou Shi and Libo Fan (2017) believed that, in terms of the way of earnings management, executives mainly adjusted the company's earnings upward through real activities, so as to improve the level of their in-service consumption. In addition, although the internal control has a certain inhibitory effect on the upward accrual earnings manipulation, this inhibitory effect is even weaker when it comes to the real earnings management behavior [16]. From the above studies, it is more likely for the management to adjust profits through the implementation of real earnings management according to the risk-return view. Therefore, it is not enough to study the earnings management behavior of senior executives merely by studying the accrued earnings management level.
On the other side, many scholars have found that avoiding losses or turning losses into profits in listed companies is one of the important motives for earnings management. The survey conducted by Graham (2005) showed that the company would adjust its book surplus to avoid losses, achieve profit targets or avoid performance decline [17]. Due to the special institutional background in China's capital market, listed companies in China are more strongly motivated to avoid loss to protect their brands. Jianqiao Lu found that deficit companies often adopted earnings adjustment behavior of profit reduction in the first loss year, and there were a large number of earnings management behaviors of upward adjustment of profit in the year before the first loss and the year of turnaround [18]. Yihong Jiang and Likun Wang (2005) also found that companies in lost

would have " a big shower" in the first loss year, while there were a large number of extraordinary profit and loss in the year of profit recovery [19]. Tao Wei et al. (2007)also found that those kinds of companies would use extraordinary profit and loss to conduct earnings management [20]. Similarly, Xin Zhang (2008) also found that listed companies would increase or decrease profits in the fourth quarter based on different purposes [21]. Luyu Shi (2016) also supported this conclusion [22]. This shows that whether a listed company is in the state of loss will also affect the earnings management choice of senior executives. However, few previous literatures on top management turnover and earnings management have taken the loss factor into consideration.
Through the above literature review, it can be seen that the "big bath" behavior has been confirmed both at home and abroad. Nevertheless, there are few literatures that include real earnings management into the analysis while differentiating the sources of succession. At the same time, there are few literatures combining the company's earnings before the appointment of senior executives with the earnings management behavior after the appointment of senior executives. Therefore, in this paper, based on the background of senior executives leaving a-share listed companies, combining with accrued earnings management and real earnings management, new senior executives are divided into internal promotion and external employment according to different sources to testify whether there is different earning management in those two kinds of executives; On the other hand, it will combine the earnings management behavior with the company's profit or loss situation before they take office to examine and analyze whether this phenomenon is different in the loss-making and profit-making companies. In considering the nature of state-owned enterprises and non-state-owned enterprises in property rights, there are large difference between executives appointed mechanism and so on, so this article will study the two kinds of different study respectively. Those are to supplement and improve the research field of corporate earnings management, and enrich the corporate governance theory by analyzing the earnings management behaviors of new executives from different sources.
II. THEORETICAL BACKGROUND AND HYPOTHESIS FORMULATION Agent theory is an indispensable and important part of modern enterprise theory. It emphasizes
the inconsistency of interests between principals and agents and the existence of information asymmetry, and the first major problem arising from this principal-agent relationship is that executives take opportunistic actions to increase their own interests. Such problems have become more acute during the transition, because shareholders hope that the change of senior executives can improve the company's earnings, but they are only willing to pay a lower price; New executives want "a new broom sweeps clean" to deliver better performance than their predecessors, but shareholders do not trust them enough. At the same time, they should consider our own development in the later stage more comprehensively, and not "run out of ideas" because of the excessive performance in the early stage. Therefore, the contradiction between shareholders and management in the agency relationship escalates, and the change of executives may further lead to the opportunistic behavior of executives: earnings management; At the same time, shareholders and the board of directors will not expect too much from the performance of the new senior executives in that year due to their short tenure. In addition, the year of change belongs to the
"period of ambiguity of merit and loss", so it is impossible to accurately attribute the company performance of that year to the former or new executives. Consequently, if new executives adopt downward earnings management behavior, they can not only "bathe" their profits, squeeze out the surplus of that year, and attribute the company's poor performance to the outgoing executives, but also " travel light ". At the same time, the reduction of the current year's profits can also reduce the starting point of performance, making it easier for the new executive to prove that he is "stronger" than the previous executive. At this time, implementing downward earnings management can kill two birds with one stone. To sum up, no matter whether the new senior executives are promoted internally or hired externally, from the perspective of earnings, it is profitable to conduct profit reduction and purge in the first year.
For external successors, scholars generally believe that external employment of a company is usually due to the poor business performance of the company and the urgent need for competent managers to "turn the world around" [23], so external successors are burdened with strong expectations from shareholders and the board of directors. Such a company is likely to have a greater degree of upward earnings moisture, so external successors will have a very strong incentive to implement a lot of negative earnings management, such as increasing discretionary expenses in the first year of office. The reason for this is firstly that the new executive can blame the previous executive for the poor performance in the first year of taking office. Secondly, it can not only squeeze out the surplus of the current year, but also store up the surplus and energy for the later period. Because the accrued items of earnings management are in narrow space and real earnings management are in more concealment, so the external successor will lower down profits through the accrued items and the real business activities. At the same time implementation of real earnings management is achievable for external successors, because they tend to have more resources and social relations, which are considered one of the most important social mechanism in Chinese [24] [25], also are considered the lifeblood of a business in China [26]. Therefore, external senior executives are more capable of implementing real earnings management and more confident of making large profits for the company in the following years.
But for internal succession executives, firstly, there is a relatively low degree of information asymmetry between new successors and shareholders or the board of directors, and the internal succession is generally based on the conventional selection system, the company is relatively stable, at this time inside successor who significantly lowered profits will appear obviously; Secondly, even if the internal senior executives clean the company's earnings in that year, it is difficult for them to get rid of the relationship with the earnings management behavior of their predecessors or even they may be the participants of the previous earnings management. Therefore, it is difficult for the internal senior executives to achieve the purpose of "light loading" mentioned above by reducing the profits downward. Thirdly, internal executives may be promoted and recommended by former executives, so they may reduce downward earnings management behavior due to "QingMian". To sum up, the author proposes the following hypotheses:
H1:In the year of the senior executive's appointment, external successors will take both
accrual and real activity earnings management to reduce profits and make room for profits.

But there is no obvious accrual and real earnings management motivation for internal executives. Academics have shown that companies in loss tend to have more earnings management
practices designed to boost profits or "take a big bath". In loss-making listed companies, the original earnings management situation is relatively complex, which will definitely affect the earnings management behavior of new executives. Considering the special provisions of China's capital market, if a company has two consecutive years of losses, it will be specially treated. So if listed companies are in a lost in the previous period, this turnaround motivation is more stronger. Due to internal promotion executives are pre-executives’ assistants and participants in the decision-making, so after taking office, the decision taken is more of the continuation of the original decision. As a result, the internal successors of the loss-making companies will not reduce the profits in the first year, but will continue to increase the profits to achieve the company's goal of turning around the losses. For new executives who are from outside employment, On the one hand, they have relatively little interest or personal relationship with the company's management; on the other hand, the external employment of the company itself is more due to the internal crisis of the company. So in the listed company of losses in the previous period, external employment executives will not be limited to the company the original decision to manage profits in order to realize the turnaround, on contrary, they were also more likely to reduce profits for next year's "roll over" to prepare. Considering the difference in the nature of property rights of Chinese enterprises, the goals and responsibilities of executives in state-owned and non-state-owned enterprises are different. Therefore, we expect that this difference will also be reflected in the relationship between the company's early losses and the earnings management behaviors of executives. Based on this, the author proposes the following hypothesis:
H2: The loss in previous period will play a moderating role between the source of executive succession and earnings management, the external successor will still reduce the surplus, while the internal successor with the turnaround motive will try to increase the surplus to avoid being replaced by ST; And the performance of this kind of adjustment effect will be different in the company of different property right nature.
III. Empirical Research
Research samples and Data This paper takes a-share companies in Shanghai and Shenzhen from 2009 to 2017 as the initial
research sample. The data are mainly from CSMAR and REEST. At the same time, the initial samples were screened according to the following principles :(1) the cross-listed companies are excluded, leaving only the listed companies that only issued a-shares;(2) delete listed companies in the financial industry. The reason is that the accounting standards and asset-liability ratio that the financial industry abided by are quite different from other industries. (3) remove all ST, *ST and listed companies; (4) delete the samples with serious missing financial data.
According to the above screening criteria, a total of 10638 samples are obtained from 2009 to 2017. The number of samples with executive turnover was 3 096, among which 2 058 were observed for internal succession and 1 038 were observed for external succession. In addition, 474
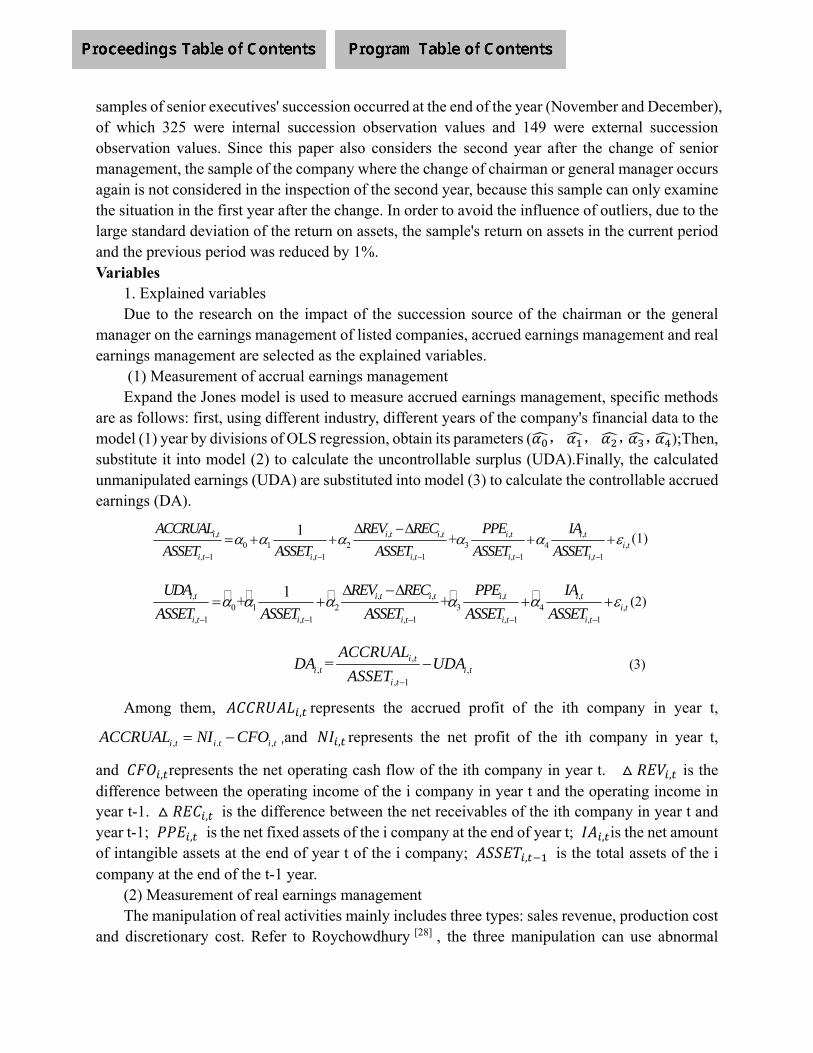
samples of senior executives' succession occurred at the end of the year (November and December), of which 325 were internal succession observation values and 149 were external succession observation values. Since this paper also considers the second year after the change of senior management, the sample of the company where the change of chairman or general manager occurs again is not considered in the inspection of the second year, because this sample can only examine the situation in the first year after the change. In order to avoid the influence of outliers, due to the large standard deviation of the return on assets, the sample's return on assets in the current period and the previous period was reduced by 1%. Variables
1. Explained variables Due to the research on the impact of the succession source of the chairman or the general
manager on the earnings management of listed companies, accrued earnings management and real earnings management are selected as the explained variables.
(1) Measurement of accrual earnings management Expand the Jones model is used to measure accrued earnings management, specific methods
are as follows: first, using different industry, different years of the company's financial data to the model (1) year by divisions of OLS regression, obtain its parameters ( , , , , );Then, substitute it into model (2) to calculate the uncontrollable surplus (UDA).Finally, the calculated unmanipulated earnings (UDA) are substituted into model (3) to calculate the controllable accrued earnings (DA).
, , , , ,0 1 2 3 4 ,
, 1 , 1 , 1 , 1 , 1
1+i t i t i t i t i t
i ti t i t i t i t i t
ACCRUAL REV REC PPE IA
ASSET ASSET ASSET ASSET ASSET
(1)
, , , , ,0 1 2 3 4 ,
, 1 , 1 , 1 , 1 , 1
1+ +i t i t i t i t i t
i ti t i t i t i t i t
UDA REV REC PPE IA
ASSET ASSET ASSET ASSET ASSET
(2)
,, ,
, 1
= i ti t i t
i t
ACCRUALDA UDA
ASSET
(3)
Among them, , represents the accrued profit of the ith company in year t,
, . ,i t i t i tACCRUAL NI CFO ,and , represents the net profit of the ith company in year t,
and , represents the net operating cash flow of the ith company in year t. , is the difference between the operating income of the i company in year t and the operating income in year t-1. , is the difference between the net receivables of the ith company in year t and year t-1; , is the net fixed assets of the i company at the end of year t; , is the net amount of intangible assets at the end of year t of the i company; , is the total assets of the i company at the end of the t-1 year.
(2) Measurement of real earnings management The manipulation of real activities mainly includes three types: sales revenue, production cost
and discretionary cost. Refer to Roychowdhury [28] , the three manipulation can use abnormal

operating cash flow (ACFO), abnormal production cost (APRO), maneuverability, abnormal discretionary expenditure (AEXP) to measure, the specific calculation method is as follows: first, through the following three models (model (4), (5), (6)) divisions by year OLS regression to get operating cash flow, the production cost and the normal of discretionary expenditure; The outliers for these three items (ACFO, APRO and AEXP) are then obtained by subtracting the normal values obtained by regression from the actual values of operating cash flow, production costs and discretionary expenses. Finally, real earnings management level (RM) was calculated according to model (7).
, , ,0 1 2 3 ,
, 1 , 1 , 1 , 1
1i t i t i ti t
i t i t i t i t
CFO SALES SALES
ASSET ASSET ASSET ASSET
(4)
, , , , 10 1 2 3 4 ,
, 1 , 1 , 1 , 1 , 1
1i t i t i t i ti t
i t i t i t i t i t
PRO SALES SALES SALES
ASSET ASSET ASSET ASSET ASSET
(5)
, , 10 1 2 ,
, 1 , 1 , 1
1i t i ti t
i t i t i t
EXP SALES
ASSET ASSET ASSET
(6)
Finally, three outliers (ACFO, APRO, and AEXP) are obtained by subtracting their estimates from the actual occurring values of each of the net cash flows from operating activities ( , ), product costs ( , ), and discretionary expenses ( , ).Using the method of Cohen and Zarowin (2010) for reference, a comprehensive index is adopted to measure the real earnings management [14].
, , , ,i t i t i t i tRM APRO ACFO AEXP (7)
2. Explanatory variables As for the senior executives referred to in the change of senior management, this paper chooses
the chairman of the board or the general manager. If only the chairman of a company has changed, then the chairman is taken as the research object; If only the general manager changes, the general manager will be the research object; If there is both chairman change and general manager change, non-acting executives are selected as the research object; if all non-acting executives are selected, the chairman is selected as the research object. If there are more than one change of chairman (general manager) in the same year, the last change shall be taken.
As for the source of senior executives' succession, we learn from the practice of Xingqiang Du and Zejiang Zhou. In addition, the classification of the nature of equity is based on the classification of the nature of equity in the CSMAR database. There are four categories of the nature of equity in the database: state-owned enterprises, private enterprises, foreign capital and others. This paper classifies the first category as state-owned enterprises and the last three as non-state-owned enterprises.
3. Controlled variables Since we study the impact of different sources of executive succession on earnings
management, we need to control other factors that may affect earnings management. So this
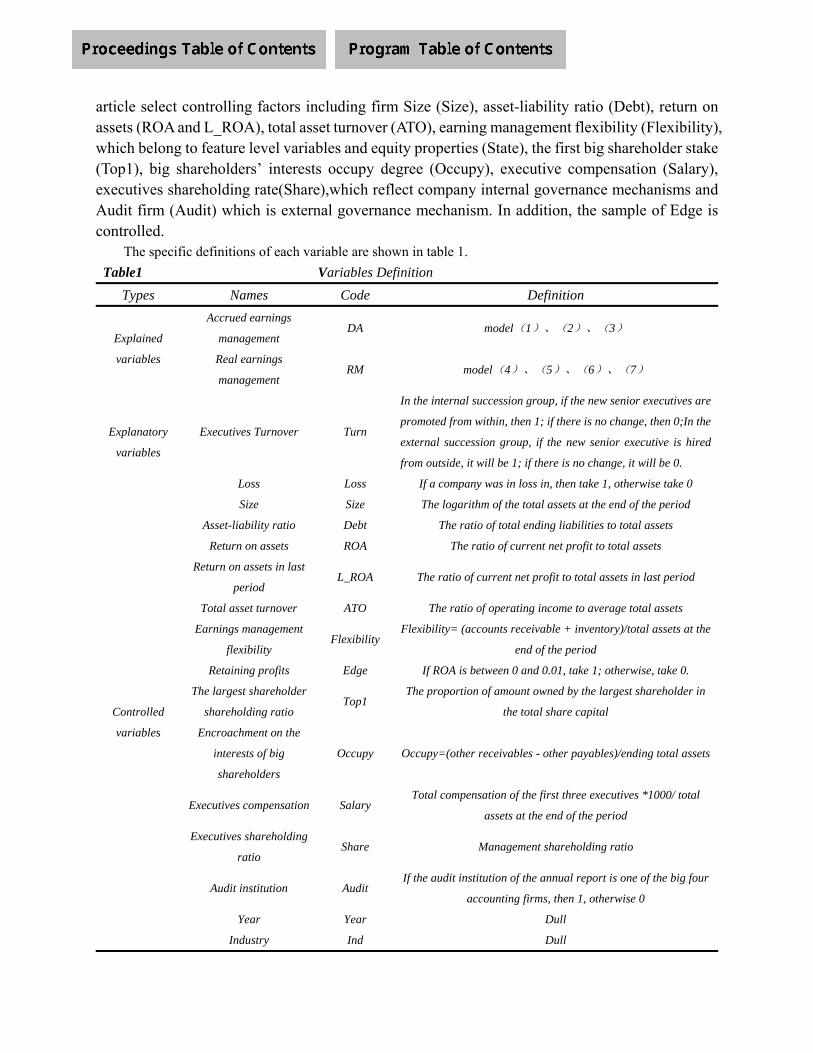
article select controlling factors including firm Size (Size), asset-liability ratio (Debt), return on assets (ROA and L_ROA), total asset turnover (ATO), earning management flexibility (Flexibility), which belong to feature level variables and equity properties (State), the first big shareholder stake (Top1), big shareholders’ interests occupy degree (Occupy), executive compensation (Salary), executives shareholding rate(Share),which reflect company internal governance mechanisms and Audit firm (Audit) which is external governance mechanism. In addition, the sample of Edge is controlled.
The specific definitions of each variable are shown in table 1.
Table1 Variables Definition
Types Names Code Definition
Explained
variables
Accrued earnings
management DA model(1)、(2)、(3)
Real earnings
management RM model(4)、(5)、(6)、(7)
Explanatory
variables
Executives Turnover Turn
In the internal succession group, if the new senior executives are
promoted from within, then 1; if there is no change, then 0;In the
external succession group, if the new senior executive is hired
from outside, it will be 1; if there is no change, it will be 0.
Loss Loss If a company was in loss in, then take 1, otherwise take 0
Controlled
variables
Size Size The logarithm of the total assets at the end of the period
Asset-liability ratio Debt The ratio of total ending liabilities to total assets
Return on assets ROA The ratio of current net profit to total assets
Return on assets in last
period L_ROA The ratio of current net profit to total assets in last period
Total asset turnover ATO The ratio of operating income to average total assets
Earnings management
flexibility Flexibility
Flexibility= (accounts receivable + inventory)/total assets at the
end of the period
Retaining profits Edge If ROA is between 0 and 0.01, take 1; otherwise, take 0.
The largest shareholder
shareholding ratio Top1
The proportion of amount owned by the largest shareholder in
the total share capital
Encroachment on the
interests of big
shareholders
Occupy Occupy=(other receivables - other payables)/ending total assets
Executives compensation Salary Total compensation of the first three executives *1000/ total
assets at the end of the period
Executives shareholding
ratio Share Management shareholding ratio
Audit institution Audit If the audit institution of the annual report is one of the big four
accounting firms, then 1, otherwise 0
Year Year Dull
Industry Ind Dull
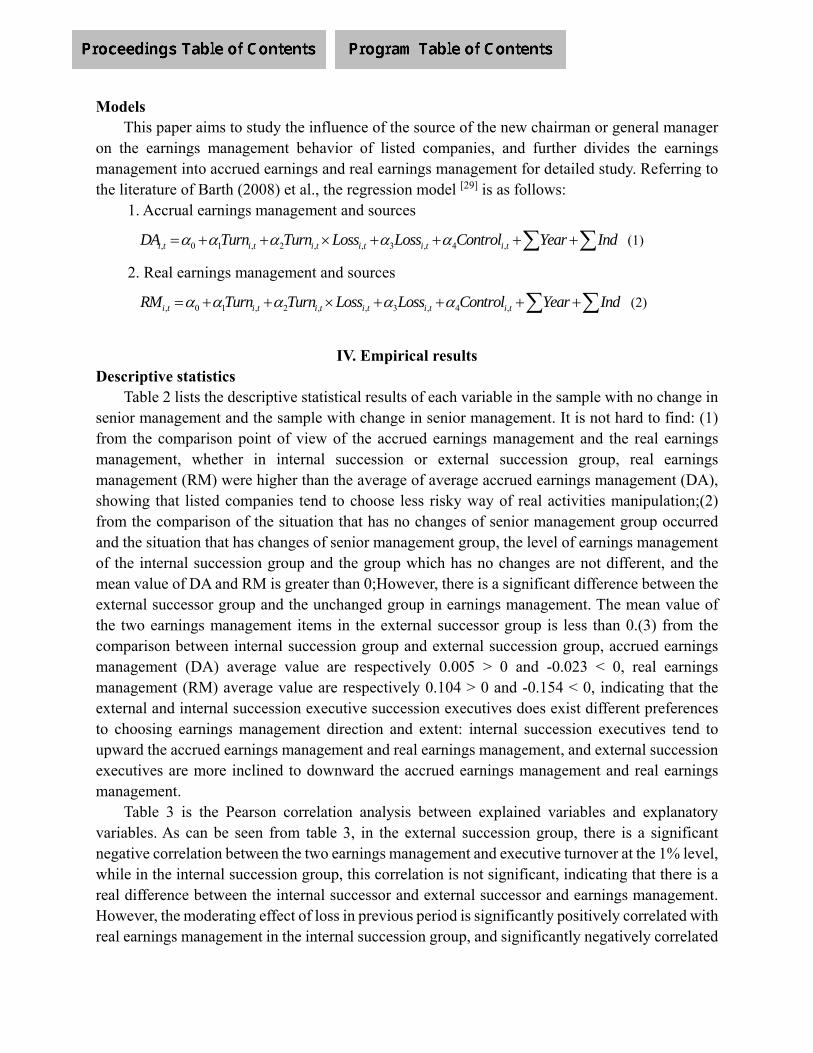
Models This paper aims to study the influence of the source of the new chairman or general manager
on the earnings management behavior of listed companies, and further divides the earnings management into accrued earnings and real earnings management for detailed study. Referring to the literature of Barth (2008) et al., the regression model [29] is as follows: 1. Accrual earnings management and sources
, 0 1 , 2 , , 3 , 4 ,i t i t i t i t i t i tDA Turn Turn Loss Loss Control Year Ind (1)
2. Real earnings management and sources
, 0 1 , 2 , , 3 , 4 ,i t i t i t i t i t i tRM Turn Turn Loss Loss Control Year Ind (2)
IV. Empirical results Descriptive statistics
Table 2 lists the descriptive statistical results of each variable in the sample with no change in senior management and the sample with change in senior management. It is not hard to find: (1) from the comparison point of view of the accrued earnings management and the real earnings management, whether in internal succession or external succession group, real earnings management (RM) were higher than the average of average accrued earnings management (DA), showing that listed companies tend to choose less risky way of real activities manipulation;(2) from the comparison of the situation that has no changes of senior management group occurred and the situation that has changes of senior management group, the level of earnings management of the internal succession group and the group which has no changes are not different, and the mean value of DA and RM is greater than 0;However, there is a significant difference between the external successor group and the unchanged group in earnings management. The mean value of the two earnings management items in the external successor group is less than 0.(3) from the comparison between internal succession group and external succession group, accrued earnings management (DA) average value are respectively 0.005 > 0 and -0.023 < 0, real earnings management (RM) average value are respectively 0.104 > 0 and -0.154 < 0, indicating that the external and internal succession executive succession executives does exist different preferences to choosing earnings management direction and extent: internal succession executives tend to upward the accrued earnings management and real earnings management, and external succession executives are more inclined to downward the accrued earnings management and real earnings management.
Table 3 is the Pearson correlation analysis between explained variables and explanatory variables. As can be seen from table 3, in the external succession group, there is a significant negative correlation between the two earnings management and executive turnover at the 1% level, while in the internal succession group, this correlation is not significant, indicating that there is a real difference between the internal successor and external successor and earnings management. However, the moderating effect of loss in previous period is significantly positively correlated with real earnings management in the internal succession group, and significantly negatively correlated

with accruals and real earnings management in the external succession group, indicating that the loss would change the correlation between new executives and earnings management. In addition, Pearson's correlation test of all variables is also carried out in this paper, and the results show that all correlation coefficients do not exceed 0.500, indicating that no serious collinlinearity problem would occur during regression. Due to the limitation of length and relative importance, all results are not listed in this paper.

Table2 Descriptive statistics of variables for grouped samples
Sample with no turnover Sample with no turnover
Sample with internal succssor Sample with external succssor
varia
bles
Numb
ers Mean
Standard
Deviation
Minimu
m
Maximu
m
Numbe
rs Mean
Standard
Deviation
Minimu
m
Maxim
um
Numbe
rs Mean
Standard
Deviation
Minimu
m
Maxim
um
DA 7 542 0.008 0.190 -2.330 9.249 1 733 0.005 0.211 -2.470 3.526 889 -0.023 0.237 -2.870 1.704
RM 7 542 0.065 0.484 -19.722 6.161 1 733 0.104 1.650 -42.322 36.578 889 -0.154 2.972 -65.566 28.758
Loss 7 542 0.092 0.289 0.000 1.000 1 733 0.130 0.336 0.000 1.000 889 0.159 0.366 0.000 1.000
Size 7 542 13.061 1.332 8.547 18.826 1 733 13.130 1.363 8.431 18.891 889 12.967 1.336 9.492 18.757
Debt 7 542 0.515 0.292 0.017 13.397 1 733 0.537 0.300 0.016 8.612 889 0.549 0.627 0.007 13.711
ROA 7 542 6.002 6.253 -15.032 38.842 1 733 4.953 6.547 -15.032 38.842 889 5.149 7.579 -15.032 38.842
L_RO
A 7 542 6.091 6.525 -15.703 41.694 1 733 5.124 6.962 -15.703 41.694 889 4.367 7.613 -15.703 41.694
ATO 7 542 0.703 0.589 0.002 9.310 1 733 0.725 0.695 0.001 11.274 889 0.707 0.704 0.003 10.586
Flexib
ility 7 542 0.280 0.181 0.000 0.934 1 733 0.280 0.187 0.001 0.936 889 0.260 0.184 0.004 0.929
Edge 7 542 0.075 0.263 0.000 1.000 1 733 0.111 0.315 0.000 1.000 889 0.130 0.337 0.000 1.000
Top1 7 542 34.072 14.766 3.622 89.986 1 733 35.498 15.298 3.390 83.735 889 35.414 15.645 5.144 85.232
Occup
y 7 542 -0.028 0.083 -2.723 0.527 1 733 -0.037 0.126 -3.918 0.281 889 -0.034 0.084 -1.069 0.266
Salary 7 542 0.562 0.870 0.000 20.637 1 733 0.547 1.004 0.000 30.609 889 0.570 0.850 0.001 14.191
Share 7 542 3.062 9.452 0.000 78.381 1 733 2.047 7.587 0.000 67.781 889 1.404 6.495 0.000 74.041
Audit 7 542 0.070 0.255 0.000 1.000 1 733 0.069 0.254 0.000 1.000 889 0.052 0.222 0.000 1.000
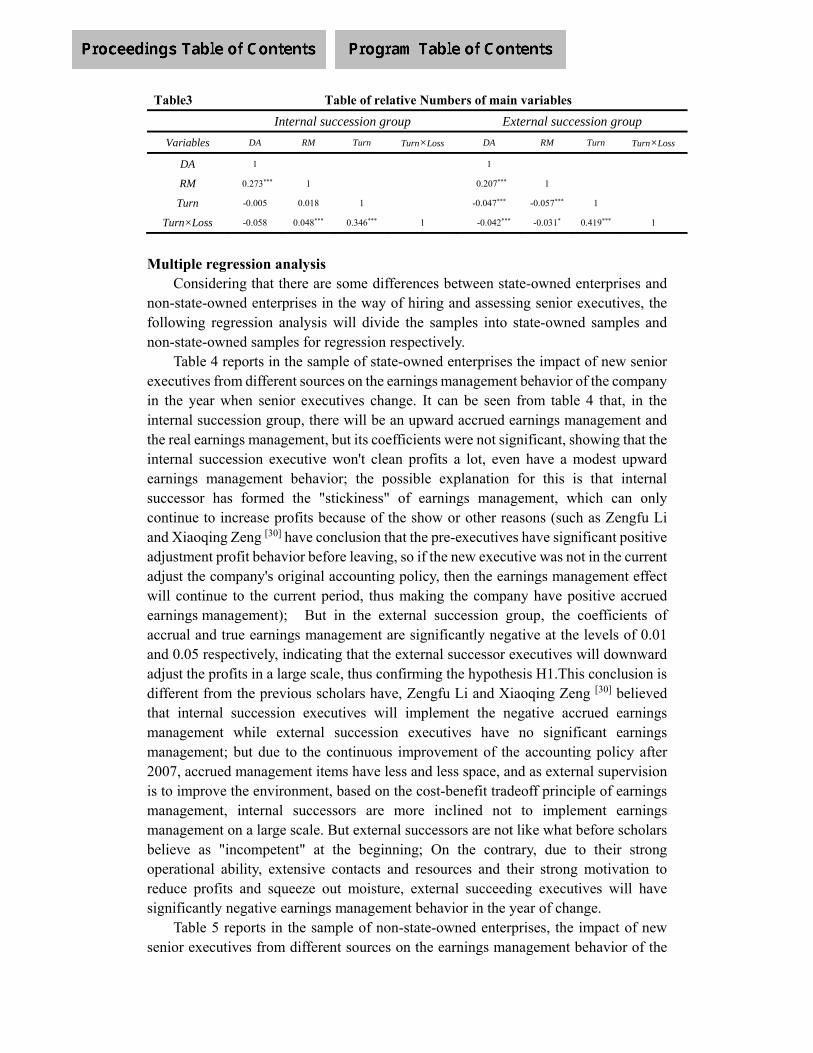
Table3 Table of relative Numbers of main variables
Internal succession group External succession group
Variables DA RM Turn Turn×Loss DA RM Turn Turn×Loss
DA 1 1
RM 0.273*** 1 0.207*** 1
Turn -0.005 0.018 1 -0.047*** -0.057*** 1
Turn×Loss -0.058 0.048*** 0.346*** 1 -0.042*** -0.031* 0.419*** 1
Multiple regression analysis Considering that there are some differences between state-owned enterprises and
non-state-owned enterprises in the way of hiring and assessing senior executives, the following regression analysis will divide the samples into state-owned samples and non-state-owned samples for regression respectively.
Table 4 reports in the sample of state-owned enterprises the impact of new senior executives from different sources on the earnings management behavior of the company in the year when senior executives change. It can be seen from table 4 that, in the internal succession group, there will be an upward accrued earnings management and the real earnings management, but its coefficients were not significant, showing that the internal succession executive won't clean profits a lot, even have a modest upward earnings management behavior; the possible explanation for this is that internal successor has formed the "stickiness" of earnings management, which can only continue to increase profits because of the show or other reasons (such as Zengfu Li and Xiaoqing Zeng [30] have conclusion that the pre-executives have significant positive adjustment profit behavior before leaving, so if the new executive was not in the current adjust the company's original accounting policy, then the earnings management effect will continue to the current period, thus making the company have positive accrued earnings management); But in the external succession group, the coefficients of accrual and true earnings management are significantly negative at the levels of 0.01 and 0.05 respectively, indicating that the external successor executives will downward adjust the profits in a large scale, thus confirming the hypothesis H1.This conclusion is different from the previous scholars have, Zengfu Li and Xiaoqing Zeng [30] believed that internal succession executives will implement the negative accrued earnings management while external succession executives have no significant earnings management; but due to the continuous improvement of the accounting policy after 2007, accrued management items have less and less space, and as external supervision is to improve the environment, based on the cost-benefit tradeoff principle of earnings management, internal successors are more inclined not to implement earnings management on a large scale. But external successors are not like what before scholars believe as "incompetent" at the beginning; On the contrary, due to their strong operational ability, extensive contacts and resources and their strong motivation to reduce profits and squeeze out moisture, external succeeding executives will have significantly negative earnings management behavior in the year of change.
Table 5 reports in the sample of non-state-owned enterprises, the impact of new senior executives from different sources on the earnings management behavior of the

company. As can be seen from table 5, in the sample of non-state-owned enterprises, the newly hired executives also have a very significant negative profit reduction in their first year on the job. The conclusion is similar to the sample of state-owned enterprises, assuming that H1 still holds. This shows that new external executives, both in state-owned and non-state-owned companies, have a very strong incentive to reduce their profits in the year they take office so as to squeeze out the original surplus and make room for the next year's profits. For internal promotion executives, state-owned enterprises and non-state-owned enterprises showed a certain difference: the executives in the state-owned enterprises weakly increase surplus, while others in non-state-owned enterprises cut surplus. The reason for this difference may be that the survival and development of state-owned enterprises are more responsible for social responsibility and concerns, so they are more likely to need to ensure the stability of the company.
In addition, Let’s look at the coefficients of interaction of turnover with the losses of the previous period (Turn x Loss). In table 4, the coefficient is significantly negative in the RM model of external succession group, that is to say, if the state-owned listed companies is in a loss in the last period, new external executives will still greatly clean surplus. In table 5, the coefficient is significantly positive in the RM model of internal succession group while is no longer significant in the RM model of external succession group, that means, if the non-state-owned listed companies is in a loss in the last period, in order to avoid being specially treated, internal promotion executives will handle upward adjustment of profits, at the same time, the situation of external executives squeezing the surplus ceased to exist. These results have verified the hypothesis H2, loss of the previous period can play a regulatory role in relationship between new executives and earnings management. And at the same time this regulatory effect perform differently in enterprises of different property nature: loss of the last period increases the strength of external executives blowing surplus in the state-owned enterprises while weakening the strength of external executives blowing surplus in the non-state enterprises, but also leads to more higher level of internal promotion executives to raise its current surplus in the non-state enterprises. That is to say, the external executives in the state-owned enterprises with losses in the previous period will still vigorously suppress the surplus, while the external executives in the non-state-owned enterprises with losses in the previous period will reduce the pressure on the surplus, and at the same time, the internal promotion of executives will also increase profits to prevent being ST. The possible explanations for these differences between state-owned enterprises and non-state-owned enterprises are as follows: First, Foreign executives of state-owned enterprises are relatively more capable and have more social resources and political capital, so they are more confident to turn the situation around immediately in the next year and win instead of losing; Second, the state-owned enterprises have special property right nature, the management of state-owned enterprises are only representative of enterprise property rights, and in addition to performance to some social responsibility, so their sensitivity to profit and loss is not so strong, non-state enterprise compared with non-state enterprises of the new executive more cannot afford because in the office when the company was ST processing of shareholders and board level pressure and consequences.

Table4 Sources of executive succession and earnings management in SOE samples
Internal succession group External succession group
Variables DA RM DA RM
Turn 0.005(1.255) 0.001(0.065) -0.014***(-2.605) -0.069**(-2.529)
Turn×Loss -0.006(-0.518) -0.023(-0.674) 0.004(0.297) -0.281***(-4.177)
Loss 0.003(0.368) 0.029(1.397) -0.008(-1.149) -0.022(-0.609)
Size 0.061***(12.301) -0.081***(-5.488) 0.056***(10.194) -0.166***(-6.155)
Debt -0.095***(-6.542) -0.057(-1.328) -0.093***(-5.554) -0.121(-1.455)
ROA 0.005***(10.720) -0.026***(-19.051) 0.005***(10.240) -0.029***(-12.248)
L_ROA 0.001***(2.693) 0.007***(5.977) 0.000(0.057) 0.007***(3.168)
ATO -0.036***(-5.402) -0.154***(-7.794) -0.053***(-7.477) -0.287***(-8.100)
Flexibility 0.127***(5.341) 0.490***(6.928) 0.179***(7.141) 1.212***(9.773)
Edge -0.022***(-2.939) -0.155***(-7.020) -0.019**(-2.440) -0.158***(-4.022)
Top1 -0.010(-1.598) 0.020(1.053) -0.011(-1.607) -0.006(-0.163)
Occupy 0.096***(2.847) 0.228**(2.261) 0.060(1.567) 0.063(0.333)
Salary -0.098***(-13.905) 0.249***(7.191) -0.101***(-12.523) 0.001(0.020)
Share -0.004***(-2.668) -0.004(-0.897) -0.002(-1.364) 0.000(0.050)
Audit -0.007(-0.459) -0.013(-0.276) -0.009(-0.529) -0.051(-0.618)
Ind Controlled Controlled Controlled Controlled
Year Controlled Controlled Controlled Controlled
N 4554 4554 4137 4137
ADJ_R2 0.194 0.162 0.173 0.130
F Vaule 41.06 33.13 31.89 22.83
Note: the values in parentheses are t statistics.***, ** and * mean significant at 1%, 5% and 10% levels
respectively (double-tailed test)
Table4 Sources of executive succession and earnings management in NON-SOE samples
Internal succession group External succession group
Variables DA RM DA RM
Turn -0.002(-0.226) -0.024(-0.505) -0.035**(-2.388) -0.477***(-5.323)
Turn×Loss 0.006(0.219) 0.294**(2.323) -0.038(-1.156) 0.148(0.745)
Loss 0.019(1.190) 0.057(0.725) 0.016(0.948) 0.199**(1.975)
Size 0.030***(3.595) 0.026(0.636) 0.009(0.964) -0.258***(-4.657)
Debt -0.021(-1.152) 0.069(0.768) -0.114***(-7.626) 0.011(0.121)
ROA 0.016*** (19.758) -0.020***(-5.036) 0.015***(18.736) -0.055***(-11.028)
L_ROA -0.002*** (-2.955) 0.007** (2.025) -0.002*** (-2.692) 0.023*** (4.716)
ATO -0.055*** (-3.969) -0.420*** (-6.177) -0.057*** (-3.422) -0.465*** (-4.580)
Flexibility 0.103**(2.529) 0.625*** (3.130) 0.089**(2.077) 1.055*** (4.047)
Edge 0.083*** (5.040) -0.145*(-1.803) 0.096*** (5.558) -0.429*** (-4.076)
Top1 -0.000(-0.773) -0.004(-1.588) -0.001(-1.269) -0.005(-1.279)
Occupy 0.437*** (7.892) -0.078(-0.286) 0.298*** (4.988) -0.067(-0.185)
Salary -0.098*** (-13.905) 0.249*** (7.191) -0.101*** (-12.523) 0.001(0.020)
Share -0.002*** (-3.655) -0.010*** (-2.896) -0.001(-1.210) 0.003(0.689)
Audit -0.054(-1.519) -0.689*** (-3.945) -0.057(-1.524) -0.703*** (-3.087)
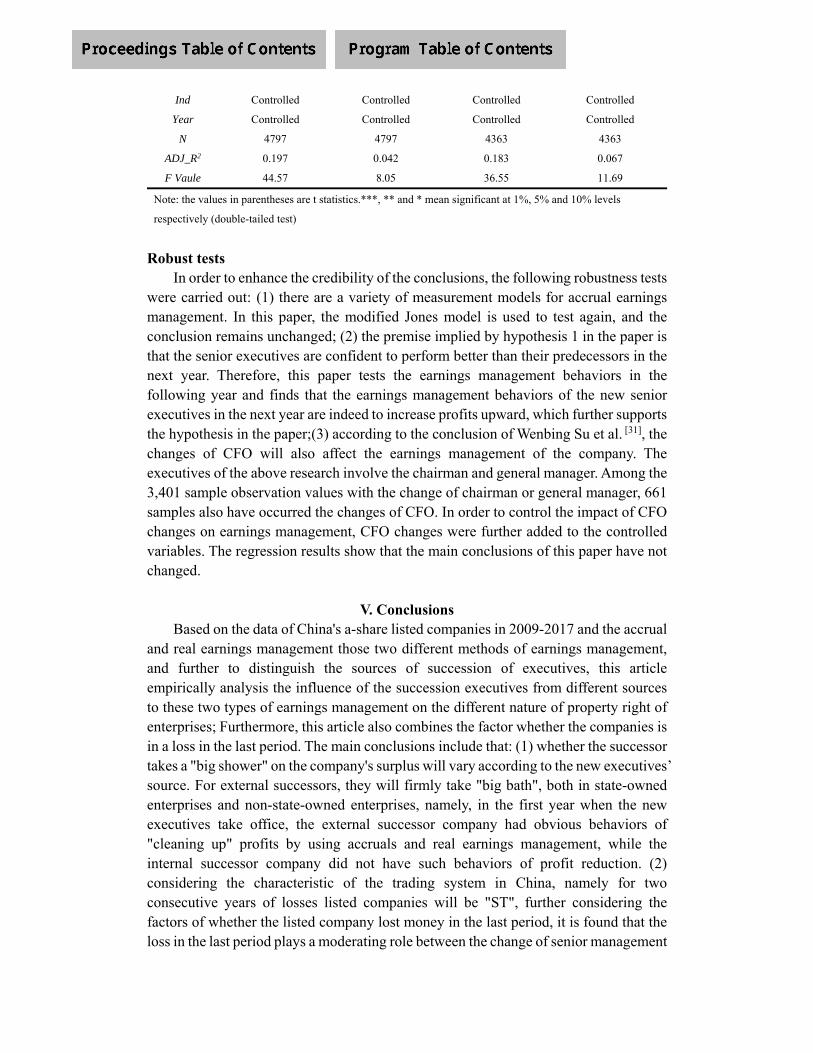
Ind Controlled Controlled Controlled Controlled
Year Controlled Controlled Controlled Controlled
N 4797 4797 4363 4363
ADJ_R2 0.197 0.042 0.183 0.067
F Vaule 44.57 8.05 36.55 11.69
Note: the values in parentheses are t statistics.***, ** and * mean significant at 1%, 5% and 10% levels
respectively (double-tailed test)
Robust tests In order to enhance the credibility of the conclusions, the following robustness tests
were carried out: (1) there are a variety of measurement models for accrual earnings management. In this paper, the modified Jones model is used to test again, and the conclusion remains unchanged; (2) the premise implied by hypothesis 1 in the paper is that the senior executives are confident to perform better than their predecessors in the next year. Therefore, this paper tests the earnings management behaviors in the following year and finds that the earnings management behaviors of the new senior executives in the next year are indeed to increase profits upward, which further supports the hypothesis in the paper;(3) according to the conclusion of Wenbing Su et al. [31], the changes of CFO will also affect the earnings management of the company. The executives of the above research involve the chairman and general manager. Among the 3,401 sample observation values with the change of chairman or general manager, 661 samples also have occurred the changes of CFO. In order to control the impact of CFO changes on earnings management, CFO changes were further added to the controlled variables. The regression results show that the main conclusions of this paper have not changed.
V. Conclusions Based on the data of China's a-share listed companies in 2009-2017 and the accrual
and real earnings management those two different methods of earnings management, and further to distinguish the sources of succession of executives, this article empirically analysis the influence of the succession executives from different sources to these two types of earnings management on the different nature of property right of enterprises; Furthermore, this article also combines the factor whether the companies is in a loss in the last period. The main conclusions include that: (1) whether the successor takes a "big shower" on the company's surplus will vary according to the new executives’ source. For external successors, they will firmly take "big bath", both in state-owned enterprises and non-state-owned enterprises, namely, in the first year when the new executives take office, the external successor company had obvious behaviors of "cleaning up" profits by using accruals and real earnings management, while the internal successor company did not have such behaviors of profit reduction. (2) considering the characteristic of the trading system in China, namely for two consecutive years of losses listed companies will be "ST", further considering the factors of whether the listed company lost money in the last period, it is found that the loss in the last period plays a moderating role between the change of senior management
and earnings management: first, in state-owned enterprises, the loss of the previous period is to promote external successor to scale down current profits, not affected by the interference of the trading system; However, in the non-state-owned enterprises, the previous period loss inhibited the external successor to suppress the surplus phenomenon, and caused the internal successor to have the rising surplus behavior.
In addition, in line with the phenomenon that senior executives are motivated to adjust the surplus upward before leaving office, the senior executives who are parachuted in are more willing and able to use external resources to clean up the company's surplus, squeeze out surplus water, and store up surplus for the next year. This paper provides empirical evidence for the understanding of the behaviors of the succeeding senior executives, indicating that there are indeed new external senior executives in China who will conduct opportunistic earnings management after taking office, and whether the company is in loss in the previous period will further affect the choice of the new senior executives for earnings management. And with the continuous improvement of China's institutional environment, using real activities to adjust the book surplus has become another more hidden choice for executives to carry out earnings management.
The above studies have enriched the literature on corporate top management turnover and earnings management, which has certain enlightenment effect on explaining the earnings management behavior of new senior executives, and provides reference for improving the design of senior management supervision system and incentive system of China's listed companies.
REFERENCES [1] Dechow PM, Sloan RG. Detecting Earnings Management[J]. The Accounting Review, 1995, (70):93-225. [2] Reitenga AL, Tearney MG. Mandatory CEO Retirements, Discretionary Accruals, and Corporate Governance Mechanisms[J]. Journal of Accounting, Auditing and Finance, 2003, (18):255-280. [3] De Angelo, LE. Accounting Numbers as Market Valuation Substitutes: A Study of Management Buyouts of Public Stockholders. The Accounting Review, 1986, (7): 400-420. [4] Murphy KJ, Zimmerman JL. Financial Performance Surrounding CEO Turnover, Journal of Accounting and Economics, 1993, (1): 273-316 [5] Godfrey J, Mather P, Ramsay A. Earnings and impression management in financial reports: the case of CEO changes [J].Abacus, 2003, 39 (1) :95-123. [6] Geiger MA, North DS. Does Hiring a New CFO Change Things? An Investigation of Changes in Discretionary Accruals[J]. Accounting Review, 2006, 81(4):781-809. [7] Pourciau S. Earning Management and Non-routine Executive Changes[J]. Journal of Accounting and Economics,1993,(16):317-336. [8] Hongjun Zhu. Big shareholders’ changes and senior management’s change: the role of business performance [J]. Accounting Research, 2002(9):31-40. [9] Xingwen Zhu, Yigang Liao, Shengwen Xie. Senior management turnover, equity characteristics and earnings management - empirical evidence from Chinese listed companies[J]. Nankai Management Review, 2010, 13(2):23-29. [10] Yongjian Lin, Zhiqiang Wang, Maoliang Li. Top management turnover and earnings management: an empirical study based on accrual control and real activity control[J]. Nankai Management Review, 2013, 16(1):4-14. [11] Luguang Qi, Chuanmo Han. Executive turnover and financial restatement: from the perspective of management defense[J]. Journal of Central University of Finance & Economics, 2017(3):121-129. [12] Xinqiang Du, Zejiang Zhou. Executive turnover, sources of succession and earnings management[J]. Modern Economic Science, 2010, 32(1):23-33. [13] Qihui Gong, Liansheng Wu, Yaping Wang. Partial substitution between two types of earnings management[J]. Economic Research Journal, 2015(6):175-188. [14] Cohen DA, Zarowin P. Accrual-based and Real Earnings Management Activities around Seasoned Equity Offerings. Journal of Accounting and Economics,2010,50 (1): 2-19. [15] Gunny KA. The Relation between Earnings Management Using Real Activities Manipulation and Future Performance: Evidence from Meeting Earnings Benchmarks. Contemporary Accounting Research, 2010, 27(3): 851-888. [16] Qizhou Shi, Libo Fan. Internal control, earnings management and managers' on-the-job consumption[J]. Research on Financial and Economic Issues, 2017(7):90-96. [17] Graham JR,Harvey CR,Rajgopal S. The Economic Implications of Corporate Financial Reporting[J]. Journal of Accounting and Economics,2005,40(1):3-73. [18] Jianqiao Lu. Empirical study on earnings management of Chinese listed companies in deficit[J]. Accounting Research,1999(1):25-35.

[19] Yihong Jiang, Likun Wang. Why extraordinary profit and loss often occured - evidence from the annual reports of loss-making listed companies[J]. Securities Market Herald,2005(6):913. [20] Tao Wei, Zhengfei Lu, Hongwei Shan. Research on motivation, means and function of earnings management by extraordinary profit and loss [J]. Management World,2007(1):113-121. [21] Xi Zhang. Empirical study on earnings management of loss-making listed companies in China in the fourth quarter[J]. Accounting Research, 2008(4):25-33. [22] Luyu Shi. A study on the earnings management of China's loss-making listed companies in the fourth quarter[J]. Research on Financial and Economic Issues, 2016(2):89-91. [23] Datta DK, Rajagopalan N. Industry Structure and CEO Characteristics:An Empirical Study of Succession Events[J]. Strategic Management Journal, 1998, (19):833-852. [24] Xin KK, Pearce JL. Guanxi: Connections as Substitutes for Formal Institutional Support[J]. The Academy of Management Journal, 1996, 39(6):1641-1658. [25] Peng MW, Luo Y. Managerial Ties and Firm Performance in a Transition Economy: The Nature of a Micro-Macro Link[J]. The Academy of Management Journal, 2000, 43(3):486-501. [26] Hwang K. Face and Favor: The Chinese Power Game[J]. American Journal of Sociology, 1987, 92(4):944-974. [27] Mingxia Wu, Yongzhen Xie. Study on the relationship between early performance of state-owned enterprises and abnormal CEO changes under various situational factors[J]. Journal of Guizhou College of Finance and Economics, 2018, 194(3):68-75. [28] Roychowdhury S.Earnings Management Through Real Activities Manipulation[J].Journal of Accounting and Economics,2006, 42(2):335-370. [29] Barth ME, Landsman WR, Lang MH. International Accounting Standards and Accounting Quality[J]. Journal of Accounting Research, 2008, 46(3):467-498. [30] Zengfu Li, Xiaoaqing Zeng. Top management turnover, succession and earnings manipulation - based on accrual project manipulation and real activity manipulation [J]. Economic Science, 2014, 36(3):97-113. [31] Wenbing Su, Jianjun Su, Hui Yang. CFO change and earnings management -- empirical evidence from Shanghai a-share companies [J]. Research on Economics and Management, 2010(2):93-101.
REVENUE MANAGEMENT THAT CONTRIBUTES TO INCREASING PRODUCTIVITY
ON HOTEL BUSINESSES
Tsutomu YOSHIOKA
Ph.D., Associate Professor,
Faculty of International Tourism Management, Toyo University, Japan
Abstract
Low labor productivity is regarded as a problem for service industry in Japan, especially in the lodging
services. Moreover, the labor productivities of Japan are on the last position in the advanced (or
developed) seven countries in OECD. And in Japan, labor productivity of lodging industry is quite
low especially comparing to other industries. So, as a matter of course, it could be said that
improvement of labor productivity of this industry is required urgently.
Labor productivity is generally calculated with the formulas like [ Labor Productivity per person =
Added Value / Number of Labors ] or [ Labor Productivity per Labor hour = Added Value / Labor
Hours ]. And this “Added Value” is calculated with the formula likes [Labor Costs + Cost of rental +
Net Financial cost + Operational profit after taxes + Taxes + Depreciation expense] (Bank of Japan)
and [Revenue (Sales) – Pre-payment cost] (Japan Productivity Center). It can be said that Added Value
is measured simply with the calculation of “Revenue - Pre-payment cost”.
There is a limit to cost reduction. And reducing the number of labors and labor hours is likely to make
service levels lower. So, how can hotels improve productivity? Revenue Management, a method to
maximize revenue, is effective to increase revenue. An increase in revenue leads to an increase in
Added Value. An increase in Added Value leads to an increase in Labor Productivity.
In this paper, it is clarified that hotel companies can improve labor productivity by utilizing Revenue
Management. This paper argued that the increase in revenue from Revenue Management contributes
to the increase of Added Value and the improvement of productivity. This point is not the negative
thinking of aiming for reduction but the focus of positive thinking of aiming to increase revenue.
Keywords
Labor productivity, Added Value, Revenue increasing, Cost reduction, Hospitality management

1. Introduction
Low labor productivity is regarded as a problem for service industry in Japan, especially in the lodging
services. Table-1 shows the Labor Productivities of 36 countries in OECD.
Table-1: Labor Productivity of 36 countries in OECD
Labor Productivity per person Labor Productivity per labor hour
Rank Country (US$) Country (US$) 1 Ireland 164,795 Ireland 97.5
2 Luxembourg 143,770 Luxembourg 94.7
3 United States 127,075 Norway 82.3
4 Norway 122,902 Belgium 73.5
5 Switzerland 118,155 Denmark 72.2
: : : : :
20 : : Japan 47.5
21 Japan 84,027 : :
Average 95,464 53.5
Source: by Author using Japan Productivity Center (2018)
Moreover, the productivities of Japan are on the last position in the advanced (or developed) seven
countries in OECD. Table-2 shows this fact.
Table-2: Labor Productivity of 7 advanced (or developed) countries in OECD
Labor Productivity per person Labor Productivity per labor hour
Rank Country (US$) Country (US$) 1 United States 127,075 United States 72.02 France 106,998 Germany 69.83 Italy 104,179 France 67.84 Germany 100,940 Italy 55.55 Canada 93,093 Canada 53.76 United Kingdom 89,674 United Kingdom 53.57 Japan 84,027 Japan 47.5
Source: by Author using Japan Productivity Center (2018)

And in Japan, labor productivity of lodging industry is quite low especially comparing to other
industries. Figure-1 shows this problem.
Figure-1: Labor Productivity by industries in Japan
Source: by Author using Policy Research Institute, Ministry of Finance, Japan (2015)
So, as a matter of course, it could be said that improvement of labor productivity of this industry is
required urgently.
2. Literatures Review
2.1. Productivity
Stewart and Johns (1996) says “Productivity may broadly be defined as the ratio of output to input”.
And productivity is generally calculated with the formulas below1.
1 In the following, the terms “numerator” and “denominator” are used, which mean the numerator and denominator in these formulas.

Labor Productivity per person =Added Value
Number of Labors
or
Labor Productivity per Labor hour =Added Value
Labor Hours
By these formulas, it could be said that the “Added Value” is the key factor of productivity. This
“Added Value” is well considered on Mizuno (2019) and Kajiura (2016) like Figure-2:
Figure-2: Structure of Added Value
Kinds of Added Value
Added Value
Ministry of Finance
Cost of Human Resources
Cost of rental for movable properties and real estates
Interest expense
Net operational profit (operational profit - interest expense)
Taxes
Bank of Japan
Labor Costs
Cost of rental
Net Financial cost
Operational profit after taxes
Taxes Depreciation expense
Japan Productivity Center
Net Sales – { (Material cost + Cost of sales goods and services + Depreciation expense) + Opening stocks – Closing stocks + (or - ) adjustments }
Source: Mizuno (2019) and Kajiura (2016) (modified by author)
According to Mizuno (2019) and Kajiura (2016), it is clear that Added Value contains some values
added by companies. And also, it can be said that Added Value is measured simply with the calculation
of “Revenue - Pre-payment cost”.
In Japan, there are so many considerations, not only by academic researches but also by government.
As a matter of fact, Japan Government established “SPRING: Service PRoductivity & INnovation
for Growth” (The abbreviated Japanese name is “The Council of Productivity on Service Industry”)
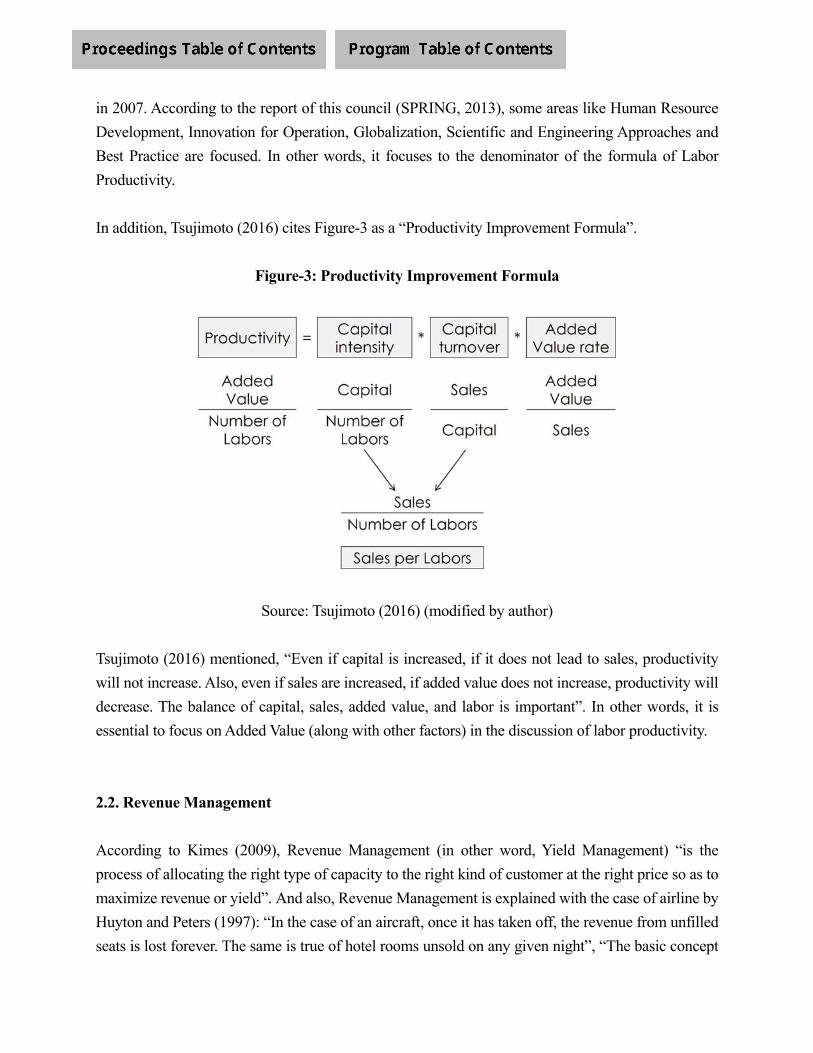
in 2007. According to the report of this council (SPRING, 2013), some areas like Human Resource
Development, Innovation for Operation, Globalization, Scientific and Engineering Approaches and
Best Practice are focused. In other words, it focuses to the denominator of the formula of Labor
Productivity.
In addition, Tsujimoto (2016) cites Figure-3 as a “Productivity Improvement Formula”.
Figure-3: Productivity Improvement Formula
Source: Tsujimoto (2016) (modified by author)
Tsujimoto (2016) mentioned, “Even if capital is increased, if it does not lead to sales, productivity
will not increase. Also, even if sales are increased, if added value does not increase, productivity will
decrease. The balance of capital, sales, added value, and labor is important”. In other words, it is
essential to focus on Added Value (along with other factors) in the discussion of labor productivity.
2.2. Revenue Management
According to Kimes (2009), Revenue Management (in other word, Yield Management) “is the
process of allocating the right type of capacity to the right kind of customer at the right price so as to
maximize revenue or yield”. And also, Revenue Management is explained with the case of airline by
Huyton and Peters (1997): “In the case of an aircraft, once it has taken off, the revenue from unfilled
seats is lost forever. The same is true of hotel rooms unsold on any given night”, “The basic concept

is that during periods of high demand for hotel rooms the prices are set at the highest rate so as to
maximize revenue. At times of lower demand, the rates are set so as to encourage occupancy”.
So, it can be said that Revenue Management is the method for service industries with limited capacity
to maximize revenue (Aoki, 2006).
3. Research Designs
This research is a kind of qualitative and theoretical research. The author has conducted some
interviews for collecting data. But these data are quite a little because there is only a few hotel
company which cooperated to this research. Moreover, the author could not collect statistical data
related to this research in the same reasons above.
So, in this research, simple simulations are conducted referring previous researches, instead of statistic
data analysis.
4. Discussions
4.1. Limitation of cost reduction
There is a limit to cost reduction. This is a well-known fact. However, in this regard, according to the
aforementioned formula for calculating Added Value, it can be understood that this is not an effective
means.
For example, in the hotel industry, labor costs account for a large percentage of the total cost as well
as other industries or more. However, reducing labor costs has no impact on Added Value. As Figure-
2 shows, with the addition method of the Bank of Japan and the Ministry of Finance, even if labor
costs are reduced, it will increase operating income or net income. In addition, under the Japan
Productivity Center’s deduction method, only pre-payment costs are deducted, and labor costs are
irrelevant. In other words, labor cost reduction has no impact on Added Value.
Expenses that affect Added Value are primarily pre-payment costs. In other words, pre-payment costs
are the Added Value created by other companies. In order to reduce this, it is necessary to negotiate
or make the purchase price cheaper. That is, this method is not easy. From these two discussions, it

can be understood that focusing on cost reduction is not meaningless, but has limitations.
4.2. Limitation of denominators reduction: Labors and Labor Hours
In the aforementioned formula for calculating Labor Productivity, there is a limit to the reduction of
the denominator, that is, the reduction of the number of labors and labor hours. Only this method is
attracting particular attention in Japan recently. As mentioned above, various methods are being
considered in the government, think tanks and companies in Japan. However, reducing the number of
labors and labor hours is likely to make service levels lower.
A luxury hotel in Osaka, Japan will be the sample of this, where the author stayed. In 2013, despite
the fact that “Fresh Orange Juice” was described in the menu book, this hotel provided FROZEN
Orange Juice. In addition, food ingredients different from the contents of the menu book were used.
The author stayed at this hotel the day after the incident was reported by this hotel own. The author
had stayed at this hotel several time, but he took down his luggage from a taxi by himself for the first
time. There was no bell staff in front of doors. At the time of check-in procedure, he was asked if he
needed guidance to his room. So he answered that he needed it and he was asked to wait for a while.
After all, he was kept waiting in the lobby sofa for about 15 minutes. The day after the incident was
reported, the staff was responding. So there was no bell staff around the front desk, lobby and door.
It can be said that the service level declines as the number of labors decreases. It is clear that there is
a limit to reducing the number of labors and labor hours.
4.3. Increasing numerator; Sales or Revenue
The previous discussions have shown that there is a limit to reducing costs as well as reducing the
number of labors and labor hours. In the above formula for calculating Added Value, the addition
method of the Ministry of Finance and the Bank of Japan consists of the addition of costs and profit.
On the other hand, the deduction method of the Japan Productivity Center consists of the revenue
(sales) and the subtraction of the pre-payment cost. A factor not considered in the previous discussions
is “revenue (sales)”.
Revenue (sales) is generally calculated by [unit price * quantity]. According to this formula, revenue
can be increased by increasing unit price, quantity or both. However, although this formula is simple,
it is not easy to increase both the unit price and the quantity. So how can revenue be increased to
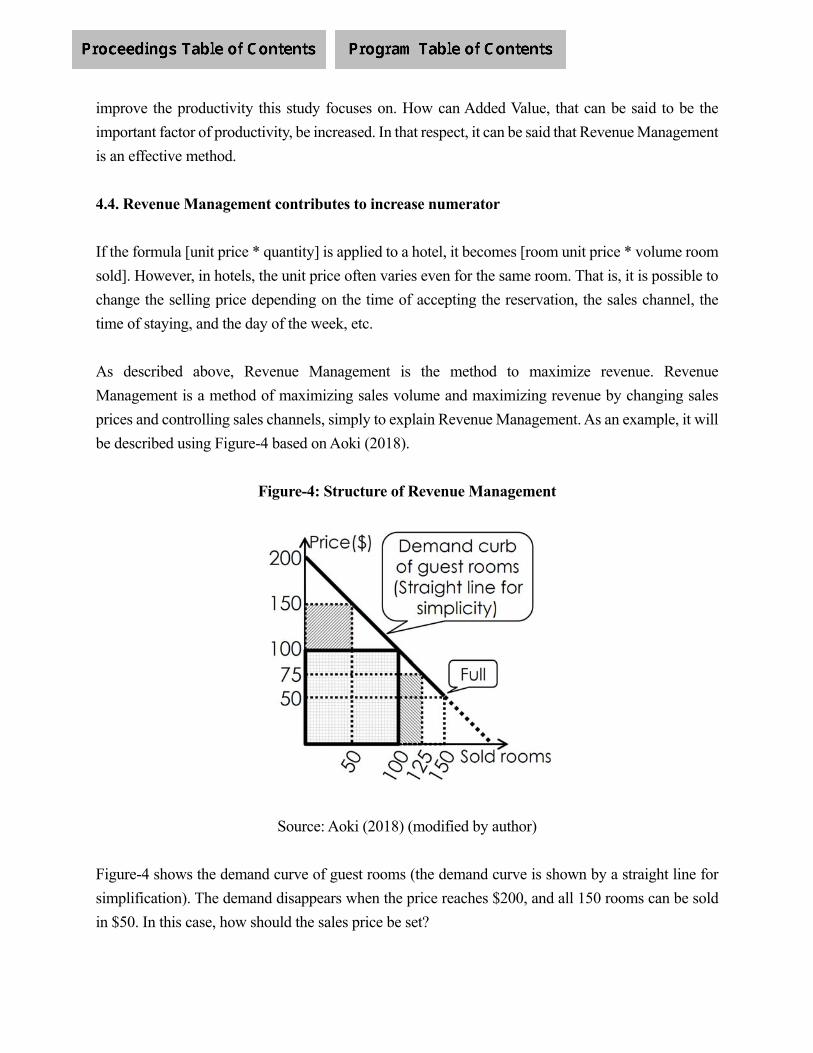
improve the productivity this study focuses on. How can Added Value, that can be said to be the
important factor of productivity, be increased. In that respect, it can be said that Revenue Management
is an effective method.
4.4. Revenue Management contributes to increase numerator
If the formula [unit price * quantity] is applied to a hotel, it becomes [room unit price * volume room
sold]. However, in hotels, the unit price often varies even for the same room. That is, it is possible to
change the selling price depending on the time of accepting the reservation, the sales channel, the
time of staying, and the day of the week, etc.
As described above, Revenue Management is the method to maximize revenue. Revenue
Management is a method of maximizing sales volume and maximizing revenue by changing sales
prices and controlling sales channels, simply to explain Revenue Management. As an example, it will
be described using Figure-4 based on Aoki (2018).
Figure-4: Structure of Revenue Management
Source: Aoki (2018) (modified by author)
Figure-4 shows the demand curve of guest rooms (the demand curve is shown by a straight line for
simplification). The demand disappears when the price reaches $200, and all 150 rooms can be sold
in $50. In this case, how should the sales price be set?
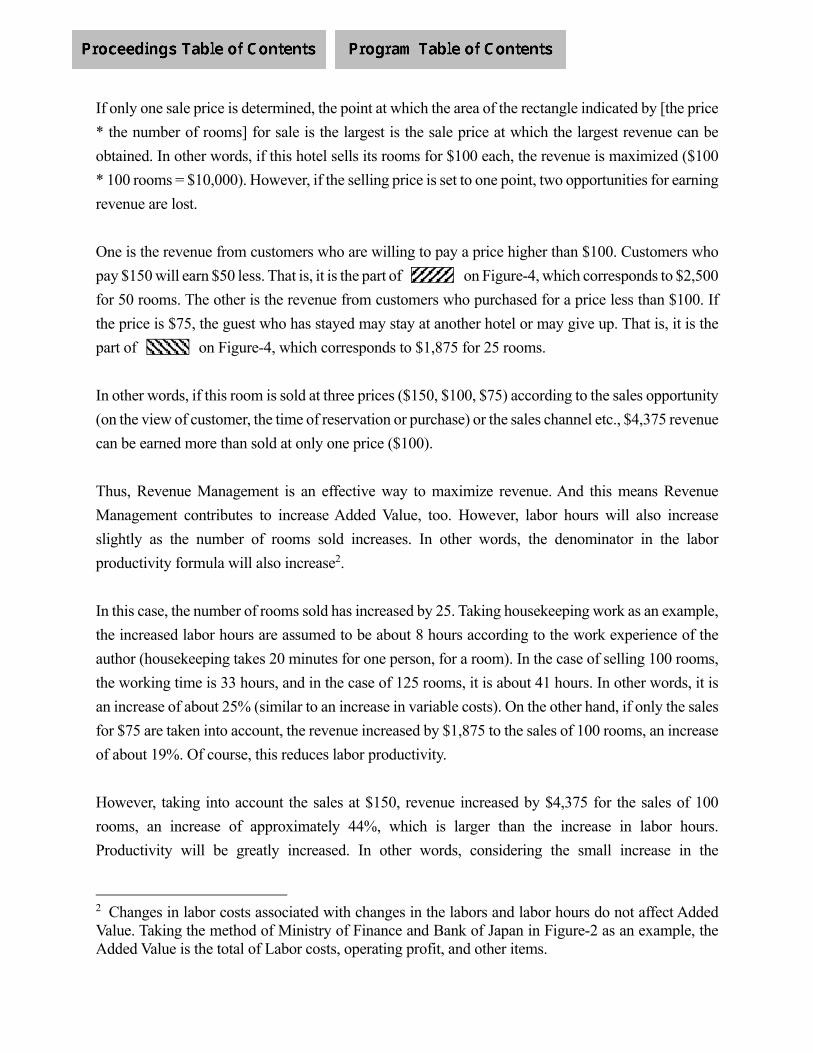
If only one sale price is determined, the point at which the area of the rectangle indicated by [the price
* the number of rooms] for sale is the largest is the sale price at which the largest revenue can be
obtained. In other words, if this hotel sells its rooms for $100 each, the revenue is maximized ($100
* 100 rooms = $10,000). However, if the selling price is set to one point, two opportunities for earning
revenue are lost.
One is the revenue from customers who are willing to pay a price higher than $100. Customers who
pay $150 will earn $50 less. That is, it is the part of on Figure-4, which corresponds to $2,500
for 50 rooms. The other is the revenue from customers who purchased for a price less than $100. If
the price is $75, the guest who has stayed may stay at another hotel or may give up. That is, it is the
part of on Figure-4, which corresponds to $1,875 for 25 rooms.
In other words, if this room is sold at three prices ($150, $100, $75) according to the sales opportunity
(on the view of customer, the time of reservation or purchase) or the sales channel etc., $4,375 revenue
can be earned more than sold at only one price ($100).
Thus, Revenue Management is an effective way to maximize revenue. And this means Revenue
Management contributes to increase Added Value, too. However, labor hours will also increase
slightly as the number of rooms sold increases. In other words, the denominator in the labor
productivity formula will also increase2.
In this case, the number of rooms sold has increased by 25. Taking housekeeping work as an example,
the increased labor hours are assumed to be about 8 hours according to the work experience of the
author (housekeeping takes 20 minutes for one person, for a room). In the case of selling 100 rooms,
the working time is 33 hours, and in the case of 125 rooms, it is about 41 hours. In other words, it is
an increase of about 25% (similar to an increase in variable costs). On the other hand, if only the sales
for $75 are taken into account, the revenue increased by $1,875 to the sales of 100 rooms, an increase
of about 19%. Of course, this reduces labor productivity.
However, taking into account the sales at $150, revenue increased by $4,375 for the sales of 100
rooms, an increase of approximately 44%, which is larger than the increase in labor hours.
Productivity will be greatly increased. In other words, considering the small increase in the
2 Changes in labor costs associated with changes in the labors and labor hours do not affect Added Value. Taking the method of Ministry of Finance and Bank of Japan in Figure-2 as an example, the Added Value is the total of Labor costs, operating profit, and other items.

denominator, it can be said that the increase in revenue from Revenue Management has certainly
contributed to the improvement of labor productivity in the hotel industry.
5. Contributes and Limitations on this study
The contribution of this study is to clarify the relation between the already well-known discussions of
labor productivity and the theory of Revenue Management. Recently, productivity is discussed not
only in the manufacturing industry but also in the service industry including the hotel industry. As for
Revenue Management, in addition to Kimes (2009), Huyton and Peters (1997), Aoki (2006; 2019)
mentioned above, there are many previous studies3. Moreover, it is the method already utilized in
hotel companies. However, at least the author cannot find previous researches that link productivity
discussions and Revenue Management theory.
By utilizing Revenue Management, hotels can increase not only labor productivity, but also profit and
some indicators of business analysis like ROA; Return on Assets, ROE; Return on Equity and others.
Yes. It’s true. But, in this paper, the author tries to focus on labor productivity increasing, especially
the hotel industry in Japan.
On the other hand, the author recognizes that this study has limitations. In this paper, studies such as
statistical analysis and case studies are lacking. This is due to the fact that the author cannot collect
data on labor productivity in particular. The author asked some companies in Japan to provide data,
but he has not been able to collect these data so far. In the future, the author would like to continue
asking companies etc. so that he can collect data on productivity that is necessary to advance this
research. Then it would be possible to set up research designs and carry out analytical research.
6. Results and Conclusions
In this paper, it is clarified that hotel companies can improve labor productivity by utilizing Revenue
Management. The low labor productivity of the hotel industry in Japan is focused as a problem. Also,
in Japan, some discussions of productivity of service industry have focused on reducing costs, the
number of labors and labor hours. However, this paper argued that the increase in revenue from the
method of Revenue Management contributes to the increase of Added Value and the improvement of
3 E.g. Cross (1997), Talluri and van Ryzin (2004), Huefner (2015) etc.
labor productivity. This point is not the negative thinking of aiming for reduction, but the focus of
positive thinking of aiming to increase revenue.
The author hopes that the labor productivity improvement of the hotel industry in Japan will be
realized, and in connection with it, the labors of this industry will be able to enjoy high salaries and
enjoy working in this industry. Low salaries of hotel industry in Japan are another problem, but
strongly relates to this research about productivity.
REFERENCES
[1] Aoki, A., (2006), “Revenue Management on Service industry with limited capacity”
(Japanese), Business Review of Senshu University, No.83, Senshu Daigaku Keiei Gakkai.
[2] Aoki, A., (2019), “What is Revenue Management - Sell at different rates for different customer
groups”, The Nikkei (Morning newspaper), 2nd/April/2018.
[3] Cross, R, (1997), Revenue Management: Hard-Core Tactics for Market Domination,
Broadway.
[4] Huefner, R.J., (2015), Revenue Management: A Path to Increased Profits (2nd ed.), Business
Expert Pr.
[5] Huyton, J.R. and Peters, S.D., (1997), “Application of Yield Management to the Hotel
Industry”, Yeoman, I. and Ingold, A. (ed), Yield Management: Strategies for Service Industries,
London: Cassel.
[6] Japan Productivity Center, (2018), International Comparison of Labor Productivity 2018
(Japanese), https://www.jpc-net.jp/intl_comparison/intl_comparison_2018.pdf (access;
15/May/2019).
[7] Kajiura, A., (2016), “Productivity components and the reality of Added Value Distribution”,
Productivity improvement theory and practice (Japanese), Chuo Keizai-sha.
[8] Kimes, S.E., (2009), “Hotel Revenue Management in an Economic Downturn: Results of an
International Study”, Cornell Hospitality Report, Vol.9, No.12, Cornell University School of
Hotel Administration.
[9] Mizuno, I, (2019), “Basic philosophy and purpose of new added value analysis”, The Center of
Productivity Comprehensive Research (ed.), Added value concept today for high added value
management (Japanese), Japan Productivity Center.
[10] Policy Research Institute, Ministry of Finance, Japan, (2015), Monthly Report of Financial
Statistics (773) (Japanese).
[11] SPRING. 2013. Toward New Development of Service Innovation Initiatives - Proposal book.

[12] Stewart, S.; Johns, N., (1996), ‘Total quality: an approach to managing productivity in the hotel
industry’, Johns, N. (ed.), Productivity Management in Hospitality and Tourism, Cassell.
[13] Talluri, K.T.; van Ryzin, G.J., (2004), The Theory and Practice of Revenue Management
(International Series in Operations Research & Management Science), Springer.
[14] Tsujimoto, K., (2016), ‘Productivity and Management’, Kajiura, A. (ed), Productivity
improvement theory and practice (Japanese), Chuo Keizai-sha.
1
COMPREHENSIVE INCOME AND CREDIT RISK:
EVIDENCE FROM JAPAN
Tomohiro Suzuki1
Koreyoshi Seki2
1 Department of Business Administration, Asia University, Japan
2 Department of Business Administration, Asia University, Japan
ABSTRACT
This study is an empirical analysis of how creditors react to other
comprehensive income (OCI), which is characterized by fluctuations in
net assets that are not released from risks and greater volatility than net
income. The results suggest that the larger (smaller) the recorded amount
of OCI, the lower (higher) the borrowing interest rate is. In addition, we
observe that the higher the volatility of OCI, the higher the borrowing
interest rate. In particular, because creditors are sensitive to the downside
risks in firm performance, the interest rate increases if OCI is negative.
Moreover, other securities are easier to sell and change into cash than other
components of OCI, and cross-shareholdings in Japan tend to be
eliminated in the long run. Therefore, this relationship between OCI and
the borrowing interest rate is observed only for unrealized gains and losses
on other securities.
1. INTRODUCTION
The purpose of this study is to examine the impact of changes in other comprehensive income
(OCI) and its volatility on credit risk. OCI includes changes in net assets that are not released
from risk. Furthermore, in previous research, comprehensive income has been reported as
having greater volatility than net income (e.g., Hodder et al. 2006; Khan and Bradbury 2016).
Do these futures of OCI provide useful information to investors?
There have been two major views on this point. One is that the accounting adjustments included
in OCI cause performance indicator incremental volatility to net income, which is considered
noise rather than useful information for investors (e.g., Dhaliwal et al. 1999). The other view
2
supports the information usefulness of OCI. Namely, the incremental volatility of OCI reflects
potential corporate risk and investors will make investment decisions that take that into account
(Hodder et al. 2006; Khan and Bradbury 2016).
In previous research, the information usefulness of OCI for investors has been empirically
vilified through the relationship of OCI and stock price (return) from the perspective of equity
investors. There is evidence that there is a significant relationship between OCI and stock price
(return) (e.g., Biddle and Choi 2006; Lee and Park 2013). However, some studies have reported
that OCI has no incremental value relevance to net income (e.g., Chambers et al. 2007;
Landsman et al. 2011; Veltri and Ferraro 2017). Therefore, consistent evidence has not been
observed1.
As mentioned, although there are many previous studies that examine the usefulness of OCI
from the perspective of equity investors, the empirical support in this stream of research has
not explored how creditors view OCI. As creditors and equity investors have an asymmetric
return structure on their investments, different responses are expected to the risks reflected in
corporate performance (Merton 1974). Therefore, it is worthwhile to examine investor response
to OCI and to clarify the usefulness of OCI information to investors. For the above reasons, we
examine how creditors reflect changes in OCI and the magnitude of its volatility in terms of
interest rates.
2. PRIOR RESEARCH AND HYPOTHESIS DEVELOPMENT
OCI includes changes in net assets that are not released from risk. How do creditors view OCI
based on such characteristics? For example, Li (2010) reports that about 90% of the financial
covenant clauses in the United States reflect OCI. In other words, as OCI is not yet released
from risks, it suggests that creditors are reflecting OCI in their credit risk assessment of the
company. This could be due to the fact that realized valuation gains or losses could be the
resources for principal repayment, as the valuation difference in available-for-sale securities
and currency translation adjustments will be realized. In particular, Japanese companies are in
the process of eliminating cross-shareholdings in the long run and it is possible that other
securities will be eliminated in the future.
From the above, the following hypothesis is set.
1 In this study, only prior research dealing with OCI alone is described, however, there is other prior
research dealing with OCI and stock prices, mainly the components of OCI (valuation profits and losses
and foreign currency exchange translation adjustments, fixed assets, etc.) and stock returns.

3
H1. The larger (smaller) the amount of OCI recorded, the more the creditor decreases
(increases) the interest rate.
Another feature of OCI according to previous research is that comprehensive income is
reported to have greater volatility than net income (e.g., Hodder et al. 2006; Khan and Bradbury
2016). In particular, as the volatility of comprehensive income increases, equity investors over
estimate corporate risk (Hodder et al. 2006). Such comprehensive income and the volatility of
unrealized gains and losses included in it are reported to be positively related to the volatility
of stock returns and corporate risk perceived by investors measured with stock β (Maines and
Mcdaniel 2000; Bloomfield et al. 2006; Hodder et al. 2006)2.
The above-mentioned prior research examines the relationship between OCI volatility and
corporate risk from the perspective of equity investors, but the issue here is the differences
between equity investors and creditors in dealing with corporate risk. The theoretical literature
shows that information on firm fundamentals influences creditors and equity investors
differently (Bao et al. 2018). In other words, while creditors are sensitive to the downside risk
of increasing the possibility of bankruptcy with respect to increased performance volatility
caused by OCI, this is not the case for increased profits. However, from the equity investor's
point of view, the increase in volatility as risk also leads to an increase in expected returns.
Therefore, the increase in firm performance volatility caused by OCI, while being neutral to
equity investors, may be seen as an increase in credit risk to creditors. Consistent with this view,
Bao et al. (2018) document that there is a negative relationship between the volatility of OCI
and the corporate risk that creditors consider, reflected in interest rates and the credit rate, and
the possibility of bankruptcy.
From the above, the following hypothesis is set.
H2: The greater the volatility of OCI, the more the creditor increases the interest rate.
3. RESEARCH DESIGN
3.1 Model
We use the following regression model following Bao et al. (2018).
2 However, the studies by Maines and Mcdaniel (2000) and Bloomfield et al.(2006) are experimental using
non-professional investors as samples; thus, sophisticated investors may show different responses, so any
interpretation needs careful attention.

4
Cost of Debti,t=α0+α1Comprehensive Incomei,t+α2Sizei,t+α3PBRi,t+α4Levi,t
+α5EBITDAi,t+α6PPEi,t+α7OCF_Voli,t+α8Zscorei,t+α9Currenti,t
+α10RFSPi,t+Firms+ε (1)
Cost of Debti,t∈{IRSi,t, IRLi,t, IRWAi,t}
Comprehensive Incomei,t∈{OCIi,t, OCI_Voli,t}
The dependent variable is Cost of Debti,t. Three variables, the average interest rate of short-
term borrowings (IRS), the average interest rate of long-term borrowings (IRL), and the
weighted average interest rate of year-end borrowings (IRWA), are substituted for Cost of
Debti,t. The variable of interest is Comprehensive Income,t, which is substituted with other
comprehensive income (OCI) and the standard deviation of OCI over the past five years.
According to the hypotheses, the coefficients of these variables are expected to be positive.
As control variables, firm size (Size), financial leverage (Lev), growth potential (PBR),
profitability (EBITDA), tangible fixed assets (PPE), business risk (OCI_Vol), bankruptcy
possibility (Zscore), and financial solvency (Current) are incorporated into the model.
In addition, to control macroeconomic factors and firm fixed effects, the difference between
the 10-year government bond yield and 2-year government bond yield (RFSP) and firm dummy
are incorporated into the model. In calculating t-values, the standard error is corrected in the
firm-year cluster. Details of each variable are shown in Table 1.
Table 1 Variables Definition
variables definition
IRSi,t the average interest rate of short-term borrowings
IRLi,t the average interest rate of long-term borrowings
IRWAi,t the weighted average interest rate of year-end borrowings
OCIi,t other comprehensive income÷Total assets in year t
OCI_Voli,t the standard deviation of OCI over the past five years
Sizei,t the naural log of total assets at the end of the term t
PBRi,t market value in year t÷ owned capital in year t
Levi,t Interest-bearing debt in year t÷Total assets in year t
EBITDAi,t (Operating profit in year t+depreciation in year t)÷Total
assets in year t
PPEi,t Tangible fixed assets in year t÷Total assets in year t
OCF_Voli,t Standard deviation of operating cash flow for the past five years
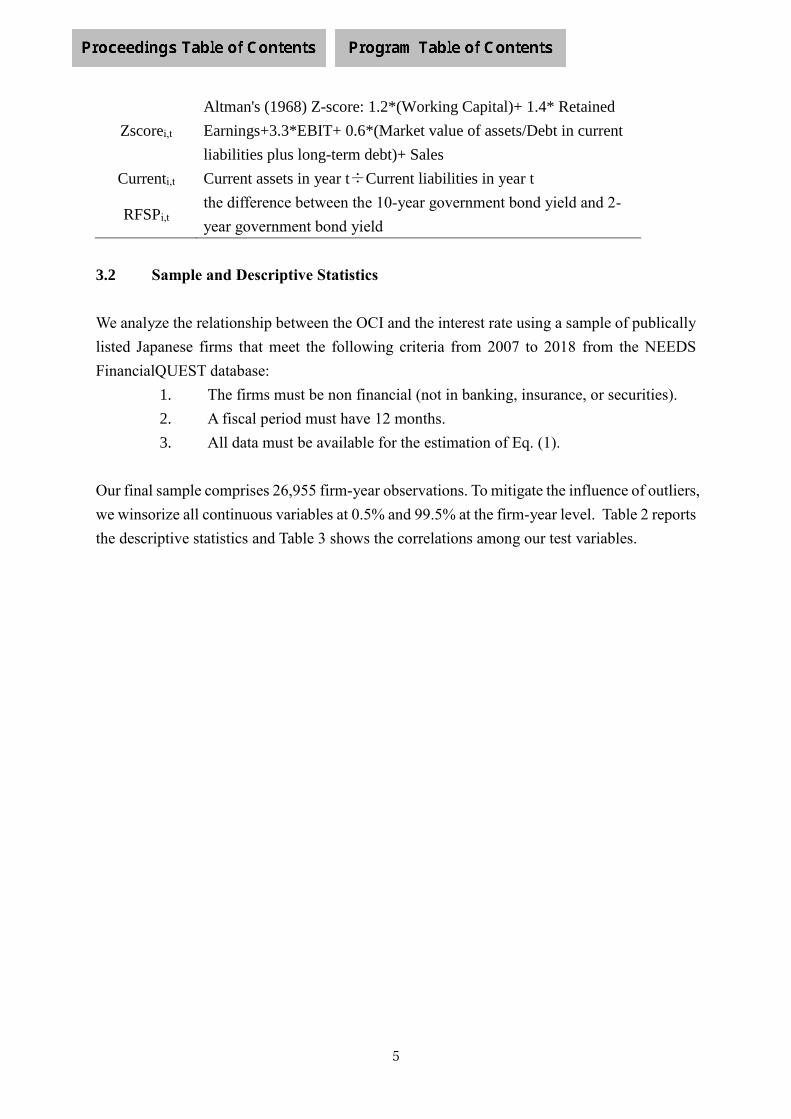
5
Zscorei,t
Altman's (1968) Z-score: 1.2*(Working Capital)+ 1.4* Retained
Earnings+3.3*EBIT+ 0.6*(Market value of assets/Debt in current
liabilities plus long-term debt)+ Sales
Currenti,t Current assets in year t÷Current liabilities in year t
RFSPi,t the difference between the 10-year government bond yield and 2-
year government bond yield
3.2 Sample and Descriptive Statistics
We analyze the relationship between the OCI and the interest rate using a sample of publically
listed Japanese firms that meet the following criteria from 2007 to 2018 from the NEEDS
FinancialQUEST database:
1. The firms must be non financial (not in banking, insurance, or securities).
2. A fiscal period must have 12 months.
3. All data must be available for the estimation of Eq. (1).
Our final sample comprises 26,955 firm-year observations. To mitigate the influence of outliers,
we winsorize all continuous variables at 0.5% and 99.5% at the firm-year level. Table 2 reports
the descriptive statistics and Table 3 shows the correlations among our test variables.
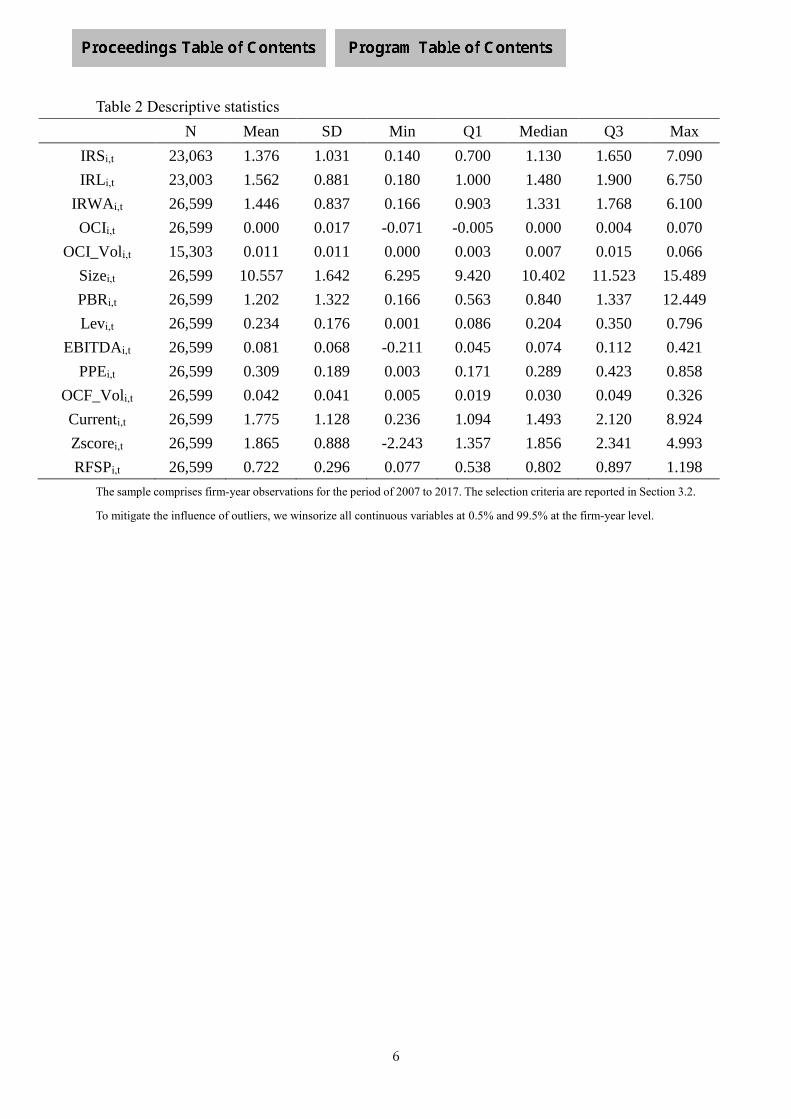
6
Table 2 Descriptive statistics
N Mean SD Min Q1 Median Q3 Max
IRSi,t 23,063 1.376 1.031 0.140 0.700 1.130 1.650 7.090
IRLi,t 23,003 1.562 0.881 0.180 1.000 1.480 1.900 6.750
IRWAi,t 26,599 1.446 0.837 0.166 0.903 1.331 1.768 6.100
OCIi,t 26,599 0.000 0.017 -0.071 -0.005 0.000 0.004 0.070
OCI_Voli,t 15,303 0.011 0.011 0.000 0.003 0.007 0.015 0.066
Sizei,t 26,599 10.557 1.642 6.295 9.420 10.402 11.523 15.489
PBRi,t 26,599 1.202 1.322 0.166 0.563 0.840 1.337 12.449
Levi,t 26,599 0.234 0.176 0.001 0.086 0.204 0.350 0.796
EBITDAi,t 26,599 0.081 0.068 -0.211 0.045 0.074 0.112 0.421
PPEi,t 26,599 0.309 0.189 0.003 0.171 0.289 0.423 0.858
OCF_Voli,t 26,599 0.042 0.041 0.005 0.019 0.030 0.049 0.326
Currenti,t 26,599 1.775 1.128 0.236 1.094 1.493 2.120 8.924
Zscorei,t 26,599 1.865 0.888 -2.243 1.357 1.856 2.341 4.993
RFSPi,t 26,599 0.722 0.296 0.077 0.538 0.802 0.897 1.198
The sample comprises firm-year observations for the period of 2007 to 2017. The selection criteria are reported in Section 3.2.
To mitigate the influence of outliers, we winsorize all continuous variables at 0.5% and 99.5% at the firm-year level.
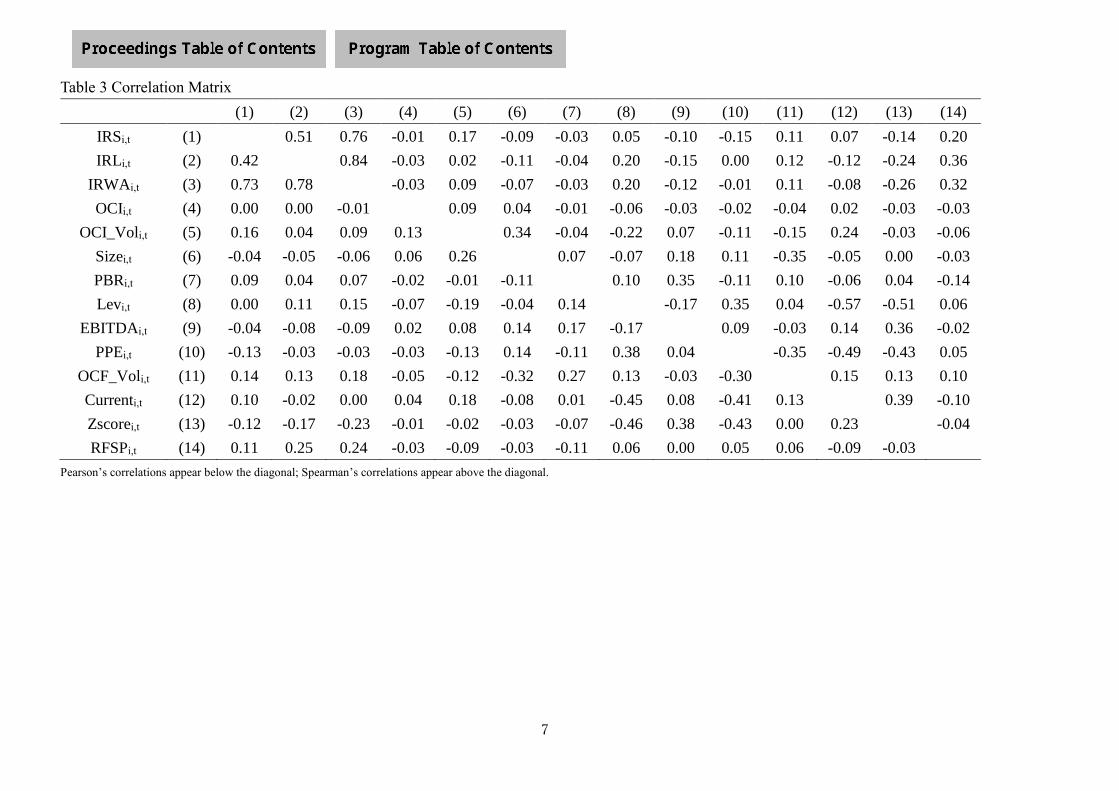
7
Table 3 Correlation Matrix
(1) (2) (3) (4) (5) (6) (7) (8) (9) (10) (11) (12) (13) (14)
IRSi,t (1) 0.51 0.76 -0.01 0.17 -0.09 -0.03 0.05 -0.10 -0.15 0.11 0.07 -0.14 0.20
IRLi,t (2) 0.42 0.84 -0.03 0.02 -0.11 -0.04 0.20 -0.15 0.00 0.12 -0.12 -0.24 0.36
IRWAi,t (3) 0.73 0.78 -0.03 0.09 -0.07 -0.03 0.20 -0.12 -0.01 0.11 -0.08 -0.26 0.32
OCIi,t (4) 0.00 0.00 -0.01 0.09 0.04 -0.01 -0.06 -0.03 -0.02 -0.04 0.02 -0.03 -0.03
OCI_Voli,t (5) 0.16 0.04 0.09 0.13 0.34 -0.04 -0.22 0.07 -0.11 -0.15 0.24 -0.03 -0.06
Sizei,t (6) -0.04 -0.05 -0.06 0.06 0.26 0.07 -0.07 0.18 0.11 -0.35 -0.05 0.00 -0.03
PBRi,t (7) 0.09 0.04 0.07 -0.02 -0.01 -0.11 0.10 0.35 -0.11 0.10 -0.06 0.04 -0.14
Levi,t (8) 0.00 0.11 0.15 -0.07 -0.19 -0.04 0.14 -0.17 0.35 0.04 -0.57 -0.51 0.06
EBITDAi,t (9) -0.04 -0.08 -0.09 0.02 0.08 0.14 0.17 -0.17 0.09 -0.03 0.14 0.36 -0.02
PPEi,t (10) -0.13 -0.03 -0.03 -0.03 -0.13 0.14 -0.11 0.38 0.04 -0.35 -0.49 -0.43 0.05
OCF_Voli,t (11) 0.14 0.13 0.18 -0.05 -0.12 -0.32 0.27 0.13 -0.03 -0.30 0.15 0.13 0.10
Currenti,t (12) 0.10 -0.02 0.00 0.04 0.18 -0.08 0.01 -0.45 0.08 -0.41 0.13 0.39 -0.10
Zscorei,t (13) -0.12 -0.17 -0.23 -0.01 -0.02 -0.03 -0.07 -0.46 0.38 -0.43 0.00 0.23 -0.04
RFSPi,t (14) 0.11 0.25 0.24 -0.03 -0.09 -0.03 -0.11 0.06 0.00 0.05 0.06 -0.09 -0.03
Pearson’s correlations appear below the diagonal; Spearman’s correlations appear above the diagonal.

8
4. RESULTS
Table 4 shows the results of our empirical findings of the relationship between changes in OCI and
the interest rate. In Eq. (1) where the dependent variable is the average interest rate of short-term
borrowings (IRSi,t) or the average interest rate of long-term borrowings (IRLi,t), the coefficient on
OCI is negative and statistically significant at the 10% level. In addition, where the weighted
average interest rate of year-end borrowings (IRWAi,t) is substituted, the coefficient on OCI is
negative and statistically significant at the 5% level.
These results suggest that although the increase in OCI is an increase in net assets that are not free
from risk, creditors consider this increase as reducing corporate risk and thereby reduce their
borrowing interest rate.
Table 5 shows the results of the empirical findings of the relationship between the OCI volatility
and the interest rate. In Eq. (1) where the dependent variable is the average interest rate of short-
term borrowings (IRSi,t), the coefficient on OCI_Vol is positive and statistically significant at the
10% level. In addition, where the weighted average interest rate of year-end borrowings (IRWAi,t)
is substituted, the coefficient on OCI is positive and statistically significant at the 1% level.
Generally, these results indicate that the higher the OCI volatility, the higher the interest rate on
borrowings because creditors are valuing firm risk as high.
5. ADDITIONAL ANALYSIS
5.1 Regression analysis by positive and negative OCI
As creditors are expected to be more sensitive to downside risks, it is possible that creditor response
differs depending on whether the change in OCI is positive or negative. Therefore, we test for each
positive and negative change in OCI.
Table 6 shows the results of the empirical findings of the regression for each positive and negative
OCI change. The coefficient of OCI is negative and significant at the 5% level when OCI is
negative and the dependent variable is IRL. When OCI is positive, the coefficients of OCI for all
the dependent variables are not statistically significant. This suggests that the creditor is increasing
the interest rate on long-term borrowings to hedge the downside risk that OCI becomes negative.
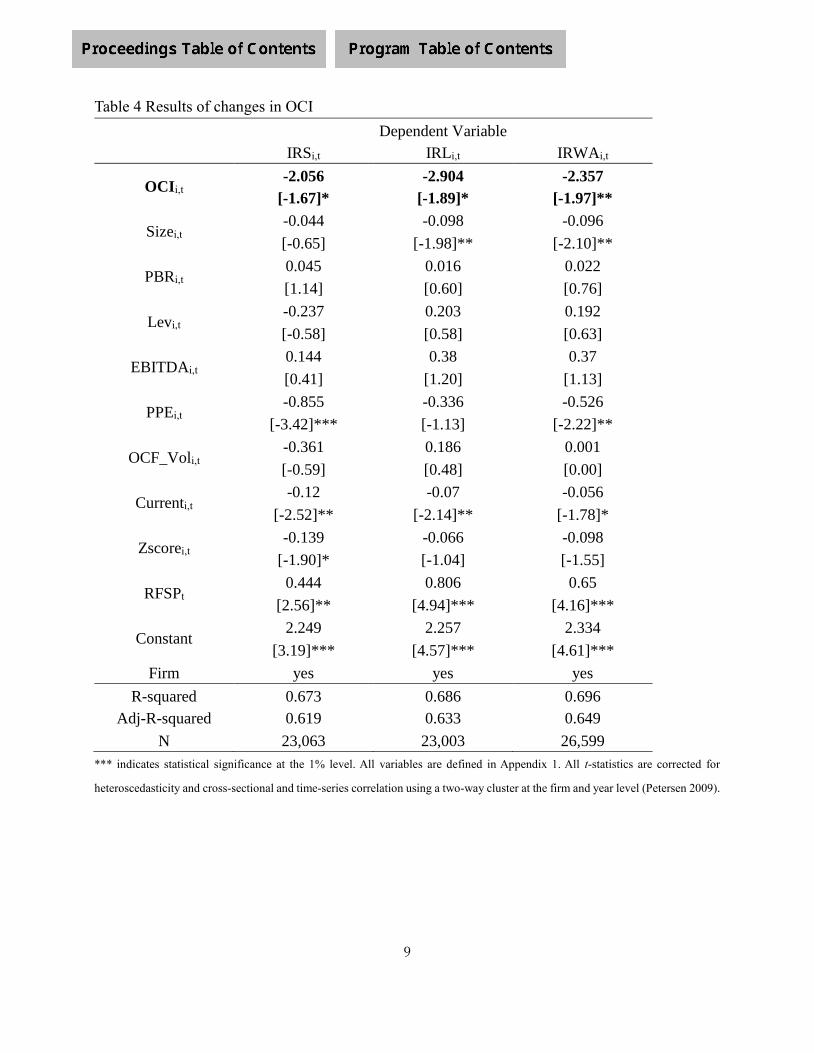
9
Table 4 Results of changes in OCI
Dependent Variable
IRSi,t IRLi,t IRWAi,t
OCIi,t -2.056 -2.904 -2.357
[-1.67]* [-1.89]* [-1.97]**
Sizei,t -0.044 -0.098 -0.096
[-0.65] [-1.98]** [-2.10]**
PBRi,t 0.045 0.016 0.022
[1.14] [0.60] [0.76]
Levi,t -0.237 0.203 0.192
[-0.58] [0.58] [0.63]
EBITDAi,t 0.144 0.38 0.37
[0.41] [1.20] [1.13]
PPEi,t -0.855 -0.336 -0.526
[-3.42]*** [-1.13] [-2.22]**
OCF_Voli,t -0.361 0.186 0.001
[-0.59] [0.48] [0.00]
Currenti,t -0.12 -0.07 -0.056
[-2.52]** [-2.14]** [-1.78]*
Zscorei,t -0.139 -0.066 -0.098
[-1.90]* [-1.04] [-1.55]
RFSPt 0.444 0.806 0.65
[2.56]** [4.94]*** [4.16]***
Constant 2.249 2.257 2.334
[3.19]*** [4.57]*** [4.61]***
Firm yes yes yes
R-squared 0.673 0.686 0.696
Adj-R-squared 0.619 0.633 0.649
N 23,063 23,003 26,599
*** indicates statistical significance at the 1% level. All variables are defined in Appendix 1. All t-statistics are corrected for
heteroscedasticity and cross-sectional and time-series correlation using a two-way cluster at the firm and year level (Petersen 2009).

10
Table 5 Results of volatility in OCI
Dependent Variable
IRSi,t IRLi,t IRWAi,t
OCI_Voli,t 3.002 1.606 2.382
[1.66]* [1.25] [2.64]***
Sizei,t -0.172 -0.179 -0.135
[-2.20]** [-3.23]*** [-2.17]**
PBRi,t -0.008 -0.003 -0.004
[-0.64] [-0.40] [-0.60]
Levi,t 0.385 0.554 0.386
[1.46] [4.70]*** [3.85]***
EBITDAi,t 0.006 0.367 0.132
[0.02] [1.33] [0.61]
PPEi,t -0.653 0.088 -0.178
[-1.48] [0.58] [-1.09]
OCF_Voli,t -0.056 0.706 0.595
[-0.13] [1.63] [1.75]*
Currenti,t -0.001 0.006 0.013
[-0.06] [0.35] [0.73]
Zscorei,t -0.137 -0.084 -0.095
[-2.57]** [-3.05]*** [-2.10]**
RFSPt 0.356 0.607 0.542
[12.34]*** [14.60]*** [22.54]***
Constant 3.16 2.756 2.405
[3.52]*** [4.25]*** [3.57]***
Firm yes yes yes
R-squared 0.784 0.788 0.809
Adj-R-squared 0.727 0.733 0.763
N 13,100 13,263 15,303
*** indicates statistical significance at the 1% level. All variables are defined in Appendix 1. All t-statistics are corrected for
heteroscedasticity and cross-sectional and time-series correlation using a two-way cluster at the firm and year level (Petersen 2009).
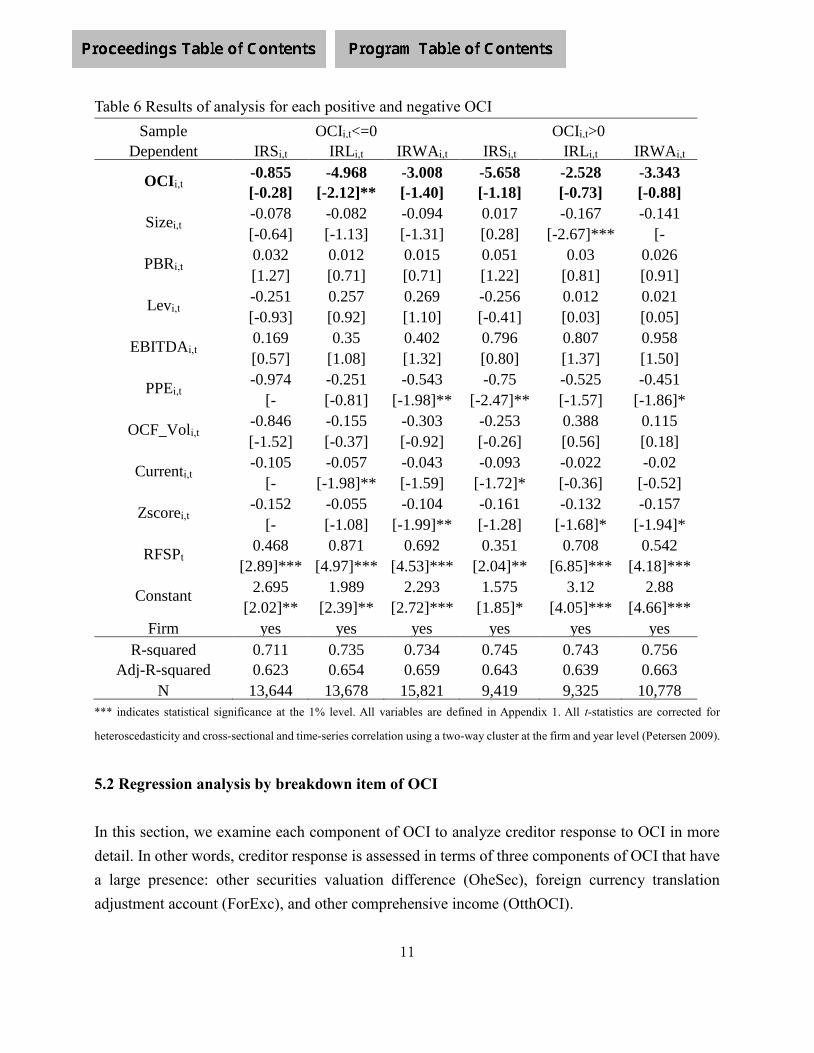
11
Table 6 Results of analysis for each positive and negative OCI
Sample OCIi,t<=0 OCIi,t>0
Dependent
Variable
IRSi,t IRLi,t IRWAi,t IRSi,t IRLi,t IRWAi,t
OCIi,t -0.855 -4.968 -3.008 -5.658 -2.528 -3.343
[-0.28] [-2.12]** [-1.40] [-1.18] [-0.73] [-0.88]
Sizei,t -0.078 -0.082 -0.094 0.017 -0.167 -0.141
[-0.64] [-1.13] [-1.31] [0.28] [-2.67]*** [-
3.03]*** PBRi,t 0.032 0.012 0.015 0.051 0.03 0.026
[1.27] [0.71] [0.71] [1.22] [0.81] [0.91]
Levi,t -0.251 0.257 0.269 -0.256 0.012 0.021
[-0.93] [0.92] [1.10] [-0.41] [0.03] [0.05]
EBITDAi,t 0.169 0.35 0.402 0.796 0.807 0.958
[0.57] [1.08] [1.32] [0.80] [1.37] [1.50]
PPEi,t -0.974 -0.251 -0.543 -0.75 -0.525 -0.451
[-
3.43]***
[-0.81] [-1.98]** [-2.47]** [-1.57] [-1.86]*
OCF_Voli,t -0.846 -0.155 -0.303 -0.253 0.388 0.115
[-1.52] [-0.37] [-0.92] [-0.26] [0.56] [0.18]
Currenti,t -0.105 -0.057 -0.043 -0.093 -0.022 -0.02
[-
3.27]***
[-1.98]** [-1.59] [-1.72]* [-0.36] [-0.52]
Zscorei,t -0.152 -0.055 -0.104 -0.161 -0.132 -0.157
[-
2.74]***
[-1.08] [-1.99]** [-1.28] [-1.68]* [-1.94]*
RFSPt 0.468 0.871 0.692 0.351 0.708 0.542
[2.89]*** [4.97]*** [4.53]*** [2.04]** [6.85]*** [4.18]***
Constant 2.695 1.989 2.293 1.575 3.12 2.88
[2.02]** [2.39]** [2.72]*** [1.85]* [4.05]*** [4.66]***
Firm yes yes yes yes yes yes
R-squared 0.711 0.735 0.734 0.745 0.743 0.756
Adj-R-squared 0.623 0.654 0.659 0.643 0.639 0.663
N 13,644 13,678 15,821 9,419 9,325 10,778
*** indicates statistical significance at the 1% level. All variables are defined in Appendix 1. All t-statistics are corrected for
heteroscedasticity and cross-sectional and time-series correlation using a two-way cluster at the firm and year level (Petersen 2009).
5.2 Regression analysis by breakdown item of OCI
In this section, we examine each component of OCI to analyze creditor response to OCI in more
detail. In other words, creditor response is assessed in terms of three components of OCI that have
a large presence: other securities valuation difference (OheSec), foreign currency translation
adjustment account (ForExc), and other comprehensive income (OtthOCI).
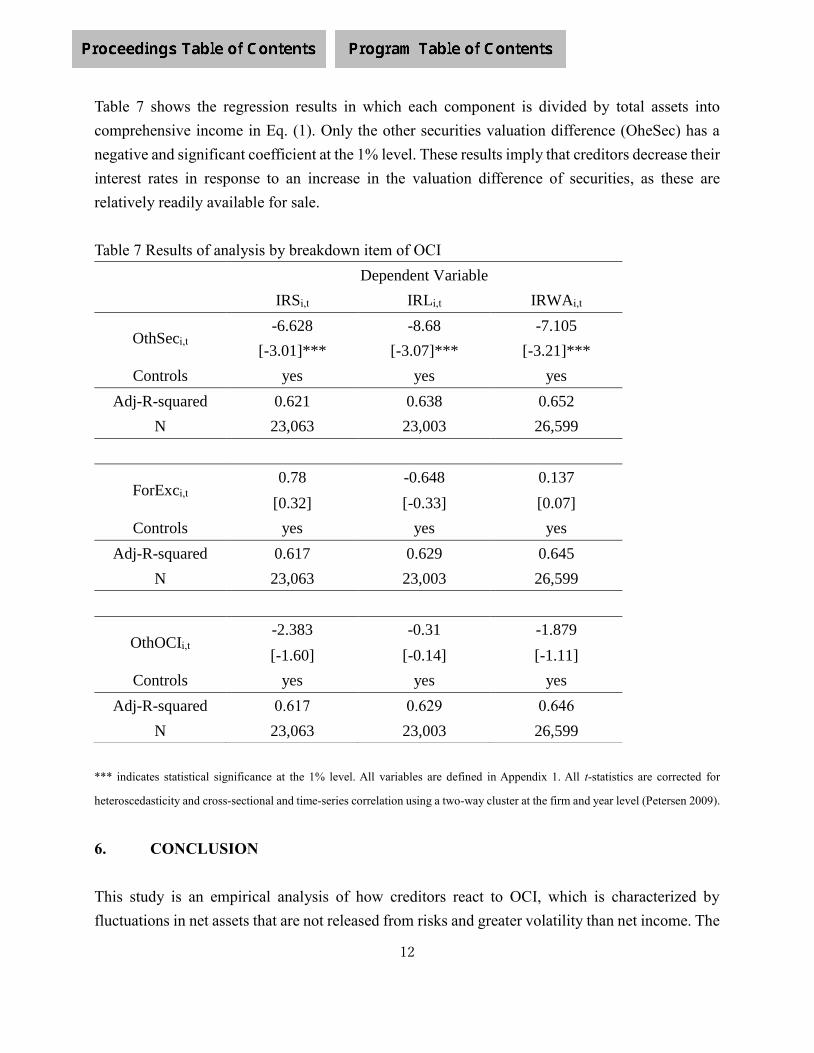
12
Table 7 shows the regression results in which each component is divided by total assets into
comprehensive income in Eq. (1). Only the other securities valuation difference (OheSec) has a
negative and significant coefficient at the 1% level. These results imply that creditors decrease their
interest rates in response to an increase in the valuation difference of securities, as these are
relatively readily available for sale.
Table 7 Results of analysis by breakdown item of OCI
*** indicates statistical significance at the 1% level. All variables are defined in Appendix 1. All t-statistics are corrected for
heteroscedasticity and cross-sectional and time-series correlation using a two-way cluster at the firm and year level (Petersen 2009).
6. CONCLUSION
This study is an empirical analysis of how creditors react to OCI, which is characterized by
fluctuations in net assets that are not released from risks and greater volatility than net income. The
Dependent Variable
IRSi,t IRLi,t IRWAi,t
OthSeci,t -6.628 -8.68 -7.105
[-3.01]*** [-3.07]*** [-3.21]***
Controls yes yes yes
Adj-R-squared 0.621 0.638 0.652
N 23,063 23,003 26,599
ForExci,t 0.78 -0.648 0.137
[0.32] [-0.33] [0.07]
Controls yes yes yes
Adj-R-squared 0.617 0.629 0.645
N 23,063 23,003 26,599
OthOCIi,t -2.383 -0.31 -1.879
[-1.60] [-0.14] [-1.11]
Controls yes yes yes
Adj-R-squared 0.617 0.629 0.646
N 23,063 23,003 26,599
13
results suggest that the larger (smaller) the recorded amount of OCI, the lower (higher) the interest
rate on borrowing. In addition, we observe that the higher the volatility of OCI, the higher the
interest rate on borrowing. In particular, because creditors are sensitive to downside risks in firm
performance, the interest rate increases when OCI is negative. However, other securities are easier
to sell and change into cash than other components of OCI and cross-shareholdings in Japan tend
to be eliminated in the long run. Therefore, the above-mentioned relationship between OCI and
interest rates on borrowing is observed only for unrealized gains and losses on other securities.

14
REFERENCE
[1] Bao, M. X., M. T. Billett, D. B. Smith, and E. Unlu. 2018. Does Incremental Other
Comprehensive Income (OCI) Volatility Affect the Cost of Debt, Capital Structure
and Credit Ratings? SSRN: 1–16.
[2] Biddle, G. C., and J.-H. Choi. 2006. Is Comprehensive Income Useful? Journal of
Contemporary Accounting & Economics 2 (1): 1–32.
[3] Bloomfield, R. J., M. W. Nelson, and S. D. Smith. 2006. Feedback loops, fair
value accounting and correlated investments. Review of Accounting Studies 11 (2–
3): 377–416.
[4] Chambers, D., T. J. Linsmeier, C. Shakespeare, and T. Sougiannis. 2007. An
evaluation of SFAS No. 130 comprehensive income disclosures. Review of
Accounting Studies 12 (4): 557–593.
[5] Dhaliwal, D., K. R. Subramanyam, and R. Trezevant. 1999. Is comprehensive
income superior to net income as a measure of firm performance? Journal of
Accounting and Economics 26 (1–3): 43–67.
[6] Hodder, L. D., P. E. Hopkins, and J. M. Wahlen. 2006. Risk‐Relevance of Fair‐
Value Income Measures for Commercial Banks. The Accounting Review 81 (2):
337–375.
[7] Khan, S., and M. E. Bradbury. 2016. The volatility of comprehensive income and
its association with market risk. Accounting and Finance 56 (3): 727–748.
[8] Landsman, W. R., B. L. Miller, K. Peasnell, and S. Yeh. 2011. Do investors
understand really dirty surplus? Accounting Review 86 (1): 237–258.
[9] Lee, C., and M. S. Park. 2013. Subjectivity in fair-value estimates, audit quality,
and informativeness of other comprehensive income. Advances in Accounting.
[10] Li, N. 2010. Negotiated Measurement Rules in Debt Contracts. Journal of
Accounting Research 48 (5): 1103–1144.
[11] Petersen, M. A. 2009. Estimating standard errors in finance panel data sets:
Comparing approaches. Review of financial studies, 22(1): 435-480.
[12] Maines, L. A., and L. S. Mcdaniel. 2000. Effects of Comprehensive-
Nonprofessional Judgments: Characteristics on Investors ’ The Role of Financial-
Statement Presentation Format. The Accounting Review 75 (2): 179–207.
[13] Merton, R. C. (1974). On the pricing of corporate debt: The risk structure of
interest rates. The Journal of finance, 29(2), 449-470. [14] Veltri, S., and O. Ferraro. 2017. Does other comprehensive income matter in

15
credit-oriented systems? Analyzing the Italian context. Journal of International
Accounting, Auditing and Taxation: 0–1.
1
Developing a Corporate Sustainability Reporting Framework in
an Emerging Economy
2; Mehdi Momeni Taheri2Hossein Shaker Taheri; 1Bita Mashayekhi
1- University of Tehran, Faculty of Management,
2- Islamic Azad University- Islamshahr, Faculty of Management and Accounting
Abstract
Today, the issue of corporate sustainability is noted both in academic literature and in the business environment, and there are many companies and organizations that want to make their operations sustainable and communicate different dimensions of sustainability in their business to stakeholders through sustainability reporting. This paper seeks to provide a framework for corporate sustainability reporting by reviewing existing literature on sustainability reporting, taking into account the expertise of domestic experts, to provide a roadmap for developing corporate sustainability reports in Iran. The statistical population of this study includes professionals and academics, including university teachers and post- graduate students in business majors. Our sample was determined via judgment sampling and data was obtained through 119 designed questionnaires. The results of this research is summarized in a Corporate Sustainability Reporting Framework for Iran, which is developed based on Seven research questions related to preparers of sustainability reports; determinants of sustainability reporting; the content of sustainability reports; corporate governance mechanisms necessary for sustainability reporting; challenges and risks with regard to sustainability reporting; benefits of sustainability reports; and assurance of sustainability reports.
Key words: Sustainability Reporting; Corporate Sustainability; Assurance.
JEL Classification: M40, M49.
1 Corresponding Author, Department of Accounting, Email address: [email protected], Tehran, Iran
2
Introduction
According to Dyllick and Hockerts (2002) corporate sustainability as meeting the desires of direct and indirect stakeholders of the company without compromising on the capability to meet the future stakeholders’ needs. Also from Rezaee point of view (2016), corporate sustainability is a process of focusing on company achievements in all five dimensions of sustainable performance (economic, social, managerial, ethical, and environmental). Today, corporate sustainability has been considered both in academic literature and in the business environment.
As per Rezaei (2016), a number of sustainability theories have been developed in examining the role of corporations in society and their interactions with their stakeholders, including agency, stakeholder, signaling, institutional, legitimacy, and stewardship theories. According to him, stakeholders consisting of shareholders, creditors, suppliers, customers, employees, government, society and the environment. The aforementioned theories try to explain the integration among several dimensions of sustainability performance, interactions between them, the possible pressures and constraints imposed by them on the key business objective of creating value for its shareholder (Rezaei, 2016). For instance, sustainability reporting based on stakeholder and legitimacy theories address a process for protecting the interests of all stakeholders, focusing on achieving long-term financial and non-financial performance for all owners.
Despite the growing trend of presenting sustainability reports by companies and emerging policy makers in this area in many countries, Iran has so far paid less than this, and academic research and systematic reviews of sustainability reporting have not yet been completed. Therefore, important issues in Iranian business environment such as the factors affecting the preparation of sustainability report, its content, the governance mechanisms, related challenges, and its assurance remain neglected.
Thus this paper seeks to find out essential and challenging regarding sustainability reporting via reviewing the literature and taking into account experts' opinions, and to proposes a conceptual framework for corporate sustainability reporting in Iran.
In the following, the structure of the paper includes an overview of the literature, research questions, research method, research findings, and conclusions.
Literature Review
Hahn and Kühnen (2013) reviewed the factors affecting sustainability reporting by reviewing 178 research papers from 1999 to 2011. They divided the determinants of corporate sustainability reporting into internal and external factors. Internal factors include size, financial performance, financial leverage, social and environmental performance, and ownership structure; and external factors are corporate visibility, sector affiliation, country-of-origin, and legal requirements.
According to Hahn and Kühnen (2013), just company size consistently has a positive effect on sustainability reporting as an internal determinant as well as corporate visibility and stakeholder pressure as external ones.
McNally, et al. (2017) investigate the challenges regarding generating integrated reports. Through detailed interviews with those who prepare integrated reports, they find out integrated reporting challenges as follows: (1) a ‘push-down’ approach for preparing integrated reports; (2) managerial
3
and strategic attitudes; (3) doubts about the relevancy of integrated reports; (4) uncertainty about what should be reported; (5) striking an equilibrium between qualitative and quantitative disclosures; (6) the difficulty of identifying material information for reporting; (7) challenges regarding practical data and system; and (8) and impression management.
Some research has also looked at the factors that trigger demand for sustainability assurance services. According to prior research, larger registered firms in the stock exchange markets have been more in demand for sustainability reporting assurance services (KPMG, 2013, 2011; Sierra et al., 2013; Siemnett et al., 2009; Zorio et al., 2013; Cho et al., 2014) show that US large firms, companies that disclose more information in sustainability reports, and those companies which operate in industries that are sensitive to environmental issues as well as financial industry, are more likely to employ sustainability reporting assurance services.
In Iran, some research has been conducted on corporate sustainability. Fakhari et al. (2017) develop a model for ranking Iranian listed companies in terms of environmental, social, and governance reporting (ESG) via Analytical Hierarchy Process (AHP). Their results show that social, environmental, and governance dimensions are in the order of priority. Masoumi et al. (2018) examined the variables that affect the sustainability reporting. The results indicate company size, liquidity, institutional shareholders, and CEO duality have a significant effect on the level of corporate sustainability reporting.
Mahdavi et al. (2015) examine the relationship between firm size, industry type, and profitability with disclosing environmental and social accounting information. Their findings suggest that there is a meaningful positive relationship between size and level of disclosure of environmental and social information, but there is no significant relationship between the level of disclosure of environmental and social information with profitability. In fact, Iranian companies are not interested in this kind of reporting, so there is a real need for much improvement in the disclosure regarding corporate governance, social, and environmental information as the main dimensions of sustainability.
According to Iranian position with regard to sustainability and CSR reporting, developing a conceptual framework for sustainability reporting for Iranian listed firms is a must, and this study tries to do this.
Research Questions
Considering the literature in sustainability reporting area and taking into account the special conditions of Iran, the following questions on the subject of developing of a sustainability reporting framework in Iran are designed.
1. Who should prepare sustainability reports? 2. What are the drivers and factors affecting sustainability reporting and the reason for
sustainability reporting in non-compulsory conditions in Iran? 3. Which information should be disclosed in a sustainability report? 4. Which corporate governance mechanisms encourage the sustainability reporting? 5. What are the challenges and risks surrounding the sustainability reporting? 6. How can companies maximize the benefits of sustainability reporting? 7. Should sustainability reports be audited?

4
Research Method
This study, in respect to its goals, is a kind of descriptive research on the one hand, and on the other is exploratory one. This study employs the survey method which is very common method in research. Our survey is performed cross-sectional, in which, data is collected just once during a period of time (several days, weeks, or months); and a questionnaire is used to collect the data. In order to design the questionnaire, firstly we review the literature on sustainability reporting. Then, we gather the experts’ opinions via a focus group consisting people who involve sustainability activities as well as sustainability reporting. In the next step and based on previous data we developed our questionnaire and tried to cover our research questions through the questionnaire in 72 categories, which are shown in appendix (1). Respondents were offered a choice of five pre-coded responses by using five-point Likert Scale, which is used to allow the individual to express how much they agree or disagree with a particular statement.
Afterward we have to test the validity and reliability of the questionnaire. For this purpose, we sent it to 18 experts in the field of sustainability and 10 comments were received from them. After submitting corrective suggestions, the final questionnaire was ready to distribute. Cronbach’s alpha coefficient is used for reliability measurements. Considering that the Cronbach's alpha coefficient is 88%, the designed questionnaire has an acceptable reliability.
The questionnaires were distributed electronically to 250 academic and professionals involved in sustainability activities, research, and reporting; and a total of 119 respondents completed the survey – a 47.6% response rate.
Research Findings
Statistical analysis of collected data from the questionnaires is presented in two sections: descriptive statistics and inferential statistics. Of the 119 respondents, 85 are male and 34 are female; and 26 percent have PhD. Also, 71 respondents are professionals and others are university faculty members. The average age of the respondents is 32.5 years and their average working experience is 15 years.
The results of the analysis of the responses provided to the items related to the first research question are described in Figure (1).
Figure (1) Research Question 1- Who should prepare sustainability reports?
Item Mean Std. Deviation Std. Error T-Statistic df Significance of Two Sequences
Mean Difference
Lower Confidence
Interval
Upper Confidence
Interval 1 3.13 1.193 0.109 1.230 118 0.221 0.134 -0.08 0.35 2 3.50 1.134 0.104 4.769 118 0.000 0.496 0.29 0.70 3 3.25 1.223 0.112 2.249 118 0.026 0.252 0.03 0.47 4 4.33 0.855 0.078 16.944 118 0.000 1.328 1.17 1.48
The average score of the responses provided to item#1 does not have a significant difference with 3. As a result, respondents do not agree or oppose the preparation of sustainability reports by the

5
financial accounting department. On the other hand, the average scores of the responses provided for items #2 and #3 has a significant difference with 3, which indicates that respondents agree with the preparation of sustainability reports by the management accounting department or another independent reporting department. Of course, it should be noted that the average score for the item #2 (management accounting department) is 3.5 and the average score for the item #3 (integrated reporting department) is 3.25. However, based on the results of the test for comparing the means of a community, in Figure (2), this mean difference is not statistically significant.
Figure (2)
Variable T-Statistic df Significance of Two Sequences
Mean Difference
Lower Confidence Interval
Upper Confidence Interval
Score Difference 1.561 118 0.121 0.244 -0.065 0.553
The results of the analysis of the responses provided to the items related to the first research question are described in Figure (3).
Figure (3) Research Question 2-What are the drivers and factors affecting sustainability reporting and the reason for
sustainability reporting in non-compulsory conditions in Iran?
Item Mean Std. Deviation Std. Error T-Statistic df Significance of Two Sequences
Mean Difference
Lower Confidence
Interval
Upper Confidence
Interval 5 4.25 0.704 0.065 19.409 118 0.000 1.252 1.12 1.38 6 3.76 0.851 0.078 9.805 118 0.000 0.765 0.61 0.92 7 3.91 1/000 0.092 9.901 118 0.000 0.908 0.73 1.09 8 3.88 0.865 0.079 11.124 118 0.000 0.0.882 0.73 1.04 9 3.95 0.832 0.076 12.449 118 0.000 0.950 0.80 1.10
10 3.55 0.954 0.087 6.243 118 0.000 0.546 0.37 0.72 11 3.60 0.986 0.090 6.603 118 0.000 0.597 0.42 0.78 12 3.72 0.911 0.083 8.657 118 0.000 0.723 0.56 0.89 13 3.55 0.810 0.074 7.471 118 0.000 0.555 0.41 0.70 14 3.27 0.936 0.086 3.134 118 0.002 0.269 0.10 0.44 15 4.11 0.900 0.083 13.445 118 0.000 1.109 0.95 1.27 16 3.84 0.792 0.073 11.578 118 0.000 0.840 0.70 0.98 17 3.92 0.962 0.088 10.389 118 0.000 0.916 0.74 1.09
The average of the responses provided to items #5 to #17 has a significant difference with 3, therefore, from the respondents' point of view, the factors mentioned in these items are effective on sustainability reporting and are considered as sustainability reporting determinants. Since the effects of large companies and companies operating in environmentally sensitive industries are being monitored by the various groups of the public communities and the media, and consequently the society is more sensitive to the activities of these companies, the mentioned items have obtained more scores in our questionnaire. A similar argument can be made for the high score for the registered companies in the stock exchange. Also, the fact that the company name is identical to its brand name has the lower the score because in Iranian business environment, companies’ brands and reputation are probably not considered by the society similar to developed countries.
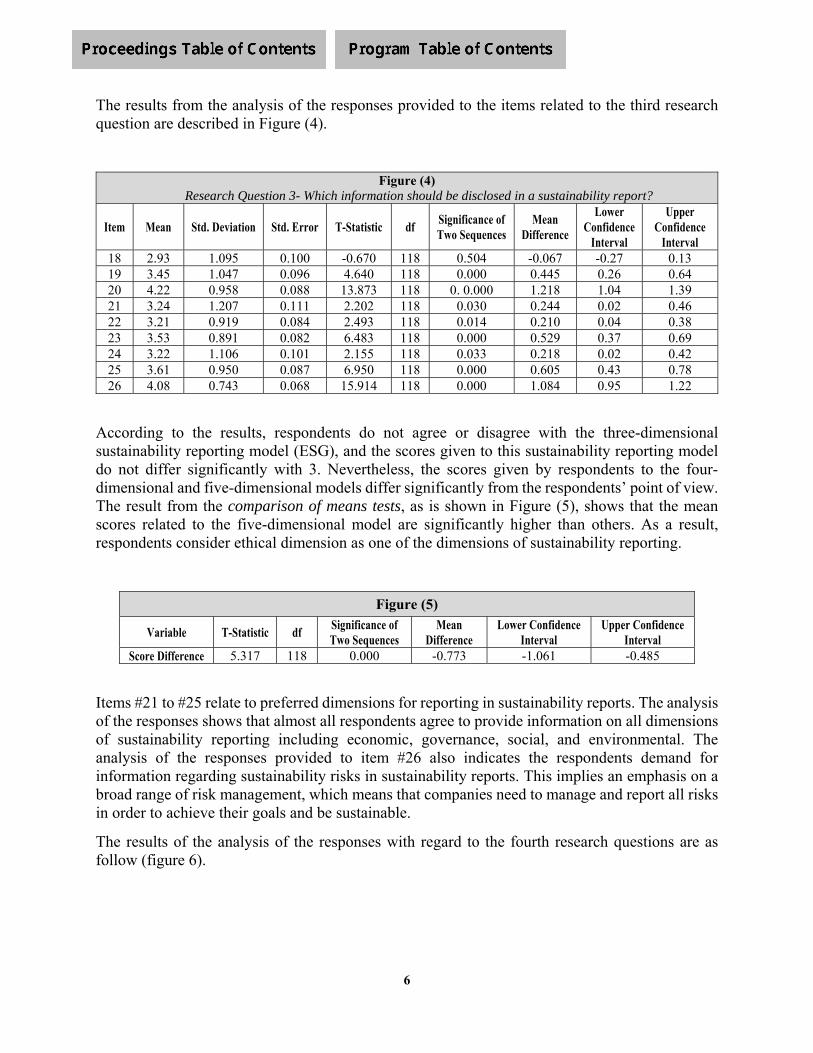
6
The results from the analysis of the responses provided to the items related to the third research question are described in Figure (4).
Figure (4) Research Question 3- Which information should be disclosed in a sustainability report?
Item Mean Std. Deviation Std. Error T-Statistic df Significance of Two Sequences
Mean Difference
Lower Confidence
Interval
Upper Confidence
Interval 18 2.93 1.095 0.100 -0.670 118 0.504 -0.067 -0.27 0.13 19 3.45 1.047 0.096 4.640 118 0.000 0.445 0.26 0.64 20 4.22 0.958 0.088 13.873 118 0. 0.000 1.218 1.04 1.39 21 3.24 1.207 0.111 2.202 118 0.030 0.244 0.02 0.46 22 3.21 0.919 0.084 2.493 118 0.014 0.210 0.04 0.38 23 3.53 0.891 0.082 6.483 118 0.000 0.529 0.37 0.69 24 3.22 1.106 0.101 2.155 118 0.033 0.218 0.02 0.42 25 3.61 0.950 0.087 6.950 118 0.000 0.605 0.43 0.78 26 4.08 0.743 0.068 15.914 118 0.000 1.084 0.95 1.22
According to the results, respondents do not agree or disagree with the three-dimensional sustainability reporting model (ESG), and the scores given to this sustainability reporting model do not differ significantly with 3. Nevertheless, the scores given by respondents to the four-dimensional and five-dimensional models differ significantly from the respondents’ point of view. The result from the comparison of means tests, as is shown in Figure (5), shows that the mean scores related to the five-dimensional model are significantly higher than others. As a result, respondents consider ethical dimension as one of the dimensions of sustainability reporting.
Figure (5)
Variable T-Statistic df Significance of Two Sequences
Mean Difference
Lower Confidence Interval
Upper Confidence Interval
Score Difference 5.317 118 0.000 -0.773 -1.061 -0.485
Items #21 to #25 relate to preferred dimensions for reporting in sustainability reports. The analysis of the responses shows that almost all respondents agree to provide information on all dimensions of sustainability reporting including economic, governance, social, and environmental. The analysis of the responses provided to item #26 also indicates the respondents demand for information regarding sustainability risks in sustainability reports. This implies an emphasis on a broad range of risk management, which means that companies need to manage and report all risks in order to achieve their goals and be sustainable.
The results of the analysis of the responses with regard to the fourth research questions are as follow (figure 6).
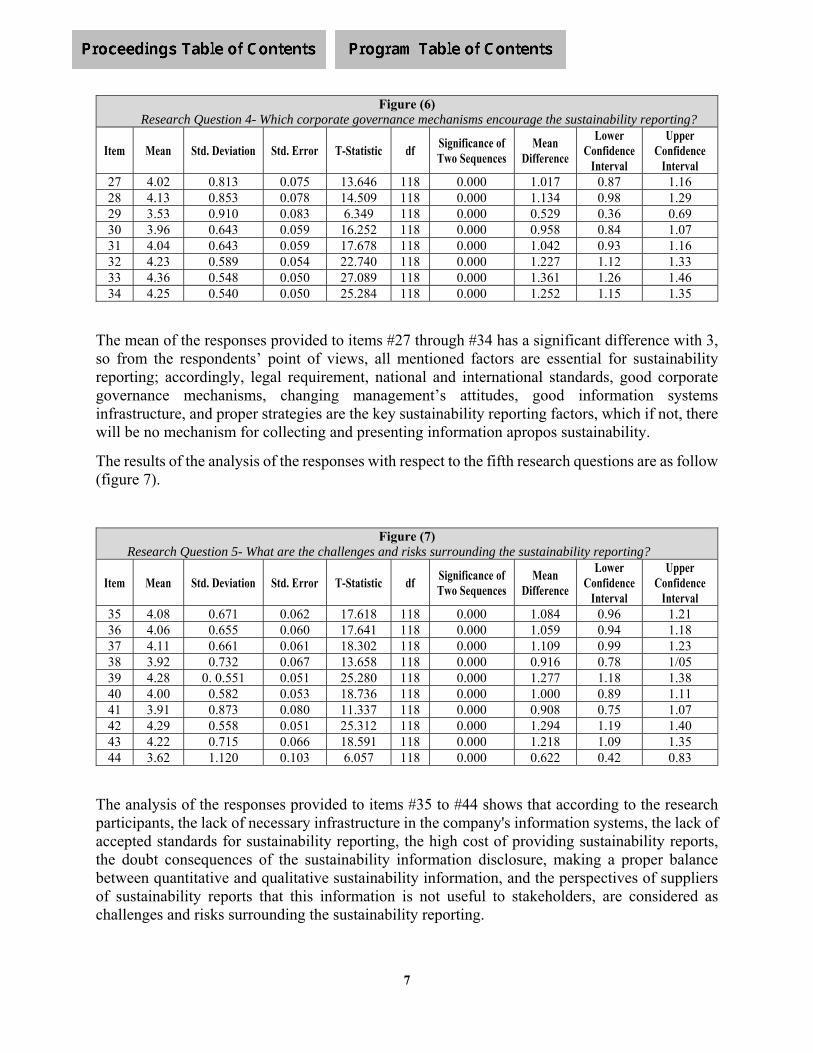
7
Figure (6) Research Question 4- Which corporate governance mechanisms encourage the sustainability reporting?
Item Mean Std. Deviation Std. Error T-Statistic df Significance of Two Sequences
Mean Difference
Lower Confidence
Interval
Upper Confidence
Interval 27 4.02 0.813 0.075 13.646 118 0.000 1.017 0.87 1.16 28 4.13 0.853 0.078 14.509 118 0.000 1.134 0.98 1.29 29 3.53 0.910 0.083 6.349 118 0.000 0.529 0.36 0.69 30 3.96 0.643 0.059 16.252 118 0.000 0.958 0.84 1.07 31 4.04 0.643 0.059 17.678 118 0.000 1.042 0.93 1.16 32 4.23 0.589 0.054 22.740 118 0.000 1.227 1.12 1.33 33 4.36 0.548 0.050 27.089 118 0.000 1.361 1.26 1.46 34 4.25 0.540 0.050 25.284 118 0.000 1.252 1.15 1.35
The mean of the responses provided to items #27 through #34 has a significant difference with 3, so from the respondents’ point of views, all mentioned factors are essential for sustainability reporting; accordingly, legal requirement, national and international standards, good corporate governance mechanisms, changing management’s attitudes, good information systems infrastructure, and proper strategies are the key sustainability reporting factors, which if not, there will be no mechanism for collecting and presenting information apropos sustainability.
The results of the analysis of the responses with respect to the fifth research questions are as follow (figure 7).
Figure (7) Research Question 5- What are the challenges and risks surrounding the sustainability reporting?
Item Mean Std. Deviation Std. Error T-Statistic df Significance of Two Sequences
Mean Difference
Lower Confidence
Interval
Upper Confidence
Interval 35 4.08 0.671 0.062 17.618 118 0.000 1.084 0.96 1.21 36 4.06 0.655 0.060 17.641 118 0.000 1.059 0.94 1.18 37 4.11 0.661 0.061 18.302 118 0.000 1.109 0.99 1.23 38 3.92 0.732 0.067 13.658 118 0.000 0.916 0.78 1/05 39 4.28 0. 0.551 0.051 25.280 118 0.000 1.277 1.18 1.38 40 4.00 0.582 0.053 18.736 118 0.000 1.000 0.89 1.11 41 3.91 0.873 0.080 11.337 118 0.000 0.908 0.75 1.07 42 4.29 0.558 0.051 25.312 118 0.000 1.294 1.19 1.40 43 4.22 0.715 0.066 18.591 118 0.000 1.218 1.09 1.35 44 3.62 1.120 0.103 6.057 118 0.000 0.622 0.42 0.83
The analysis of the responses provided to items #35 to #44 shows that according to the research participants, the lack of necessary infrastructure in the company's information systems, the lack of accepted standards for sustainability reporting, the high cost of providing sustainability reports, the doubt consequences of the sustainability information disclosure, making a proper balance between quantitative and qualitative sustainability information, and the perspectives of suppliers of sustainability reports that this information is not useful to stakeholders, are considered as challenges and risks surrounding the sustainability reporting.
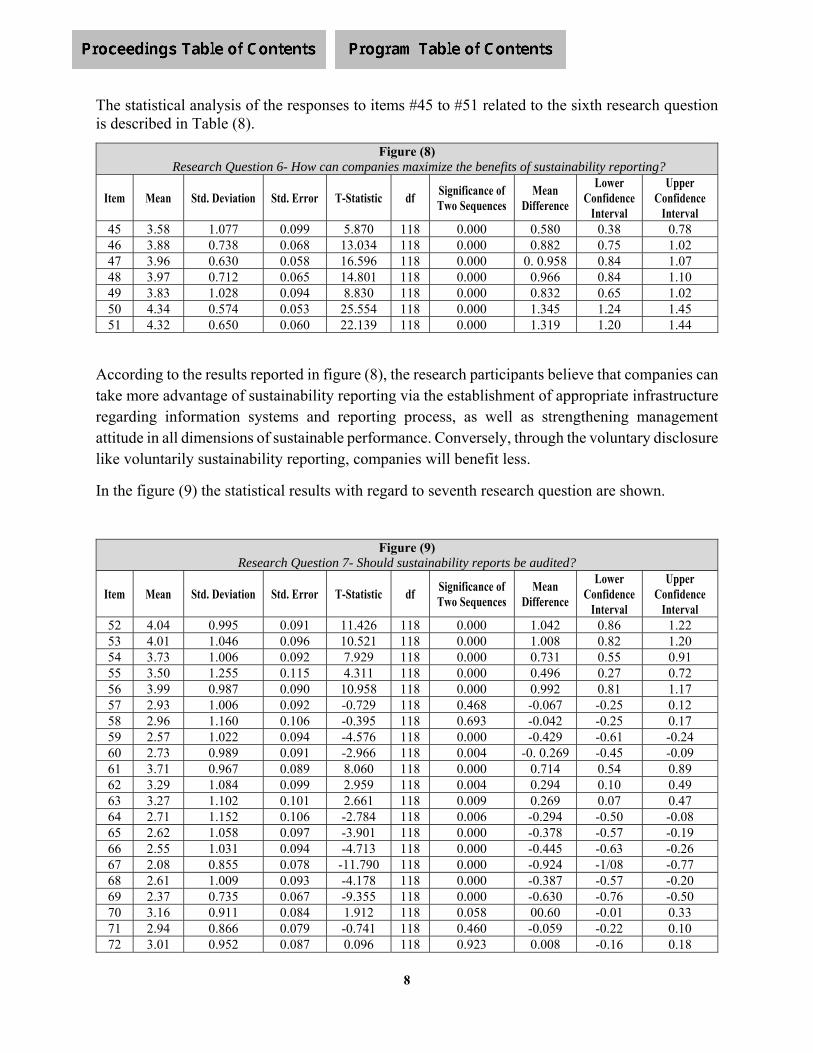
8
The statistical analysis of the responses to items #45 to #51 related to the sixth research question is described in Table (8).
Figure (8) Research Question 6- How can companies maximize the benefits of sustainability reporting?
Item Mean Std. Deviation Std. Error T-Statistic df Significance of Two Sequences
Mean Difference
Lower Confidence
Interval
Upper Confidence
Interval 45 3.58 1.077 0.099 5.870 118 0.000 0.580 0.38 0.78 46 3.88 0.738 0.068 13.034 118 0.000 0.882 0.75 1.02 47 3.96 0.630 0.058 16.596 118 0.000 0. 0.958 0.84 1.07 48 3.97 0.712 0.065 14.801 118 0.000 0.966 0.84 1.10 49 3.83 1.028 0.094 8.830 118 0.000 0.832 0.65 1.02 50 4.34 0.574 0.053 25.554 118 0.000 1.345 1.24 1.45 51 4.32 0.650 0.060 22.139 118 0.000 1.319 1.20 1.44
According to the results reported in figure (8), the research participants believe that companies can take more advantage of sustainability reporting via the establishment of appropriate infrastructure regarding information systems and reporting process, as well as strengthening management attitude in all dimensions of sustainable performance. Conversely, through the voluntary disclosure like voluntarily sustainability reporting, companies will benefit less.
In the figure (9) the statistical results with regard to seventh research question are shown.
Figure (9) Research Question 7- Should sustainability reports be audited?
Item Mean Std. Deviation Std. Error T-Statistic df Significance of Two Sequences
Mean Difference
Lower Confidence
Interval
Upper Confidence
Interval 52 4.04 0.995 0.091 11.426 118 0.000 1.042 0.86 1.22 53 4.01 1.046 0.096 10.521 118 0.000 1.008 0.82 1.20 54 3.73 1.006 0.092 7.929 118 0.000 0.731 0.55 0.91 55 3.50 1.255 0.115 4.311 118 0.000 0.496 0.27 0.72 56 3.99 0.987 0.090 10.958 118 0.000 0.992 0.81 1.17 57 2.93 1.006 0.092 -0.729 118 0.468 -0.067 -0.25 0.12 58 2.96 1.160 0.106 -0.395 118 0.693 -0.042 -0.25 0.17 59 2.57 1.022 0.094 -4.576 118 0.000 -0.429 -0.61 -0.24 60 2.73 0.989 0.091 -2.966 118 0.004 -0. 0.269 -0.45 -0.09 61 3.71 0.967 0.089 8.060 118 0.000 0.714 0.54 0.89 62 3.29 1.084 0.099 2.959 118 0.004 0.294 0.10 0.49 63 3.27 1.102 0.101 2.661 118 0.009 0.269 0.07 0.47 64 2.71 1.152 0.106 -2.784 118 0.006 -0.294 -0.50 -0.08 65 2.62 1.058 0.097 -3.901 118 0.000 -0.378 -0.57 -0.19 66 2.55 1.031 0.094 -4.713 118 0.000 -0.445 -0.63 -0.26 67 2.08 0.855 0.078 -11.790 118 0.000 -0.924 -1/08 -0.77 68 2.61 1.009 0.093 -4.178 118 0.000 -0.387 -0.57 -0.20 69 2.37 0.735 0.067 -9.355 118 0.000 -0.630 -0.76 -0.50 70 3.16 0.911 0.084 1.912 118 0.058 00.60 -0.01 0.33 71 2.94 0.866 0.079 -0.741 118 0.460 -0.059 -0.22 0.10 72 3.01 0.952 0.087 0.096 118 0.923 0.008 -0.16 0.18
9
In items #52 to #55, the attitude of research participants about auditing the sustainability reports is similar to financial statement auditing and they justify the need for auditing sustainability reports as they do for financial statements audit. Also, according to them, increasing credibility of sustainability reports is a good reason for auditing these kind of reports.
As per figure (9), participants in this study comment about the reasons and determinants of demand for auditing the sustainability reports via responding to items #57 to #61 are. Accordingly, they disagree with the pressures of media and public thoughts, as well as considering the stakeholder rights as determinants of demanding for auditing sustainability reports. Instead, increasing the value of the firm due to the audit of sustainability reports is the only effective factor on auditing sustainability reports in their opinion.
In our questionnaire, items #62 to #69 address the challenges of sustainability reporting audit. In conformity with figure (9), the respondents believe that due to the lack of local/national standards for sustainability reporting, independent audit of sustainability reports is not possible and this would be a challenge or obstacle for this kind of reporting. On the other hand, respondents oppose the fact that factors include high auditing costs; incapability of the existing supporting systems and processes; lack of mandatory and regulatory requirements; risk of issuing qualified or even adverse audit opinion; lack of accepted and integrated reporting standards; and the existence of alternative procedures are significant obstacles for independent auditing of sustainability reports.
We ask the research participants to determine the alternatives to independent auditing of sustainability reports using items #70 to #72. As it is already-mentioned, respondents do not consider the existence of alternative procedures as an obstacle to independent auditing sustainability reports. Consequently, so from the point of view of the respondents are indifferent to alternative procedures independent auditing of sustainability reports like internal audit, self-assurance, or communication with stakeholders for taking their views about companies’ sustainable performance.
Discussion and Conclusion
In this paper, in view of its objective of providing a corporate sustainability reporting framework in Iran, seven research questions are developed based on the literature, and via a survey and in the form of a questionnaire, the opinions and attitudes of the relevant experts are obtained. In light of the responses provided by the experts, a conceptual framework for sustainability reporting in Iran is developed as follows in Figure (10):
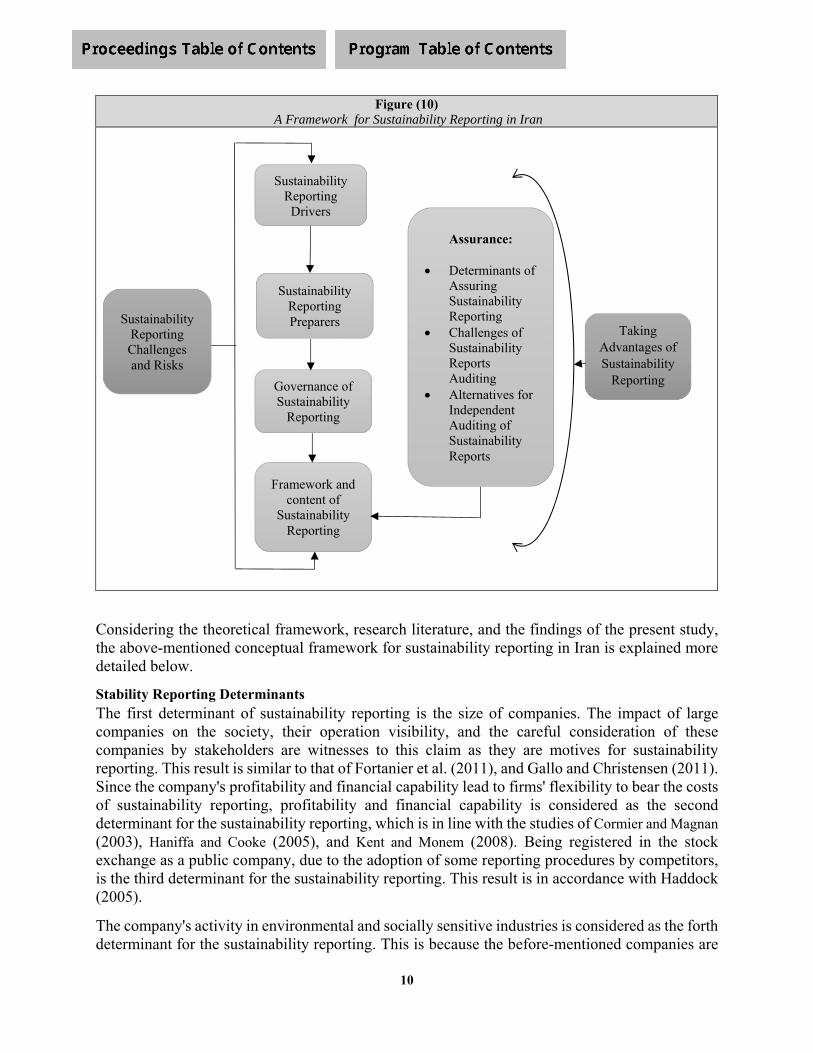
10
Figure (10) A Framework for Sustainability Reporting in Iran
Considering the theoretical framework, research literature, and the findings of the present study, the above-mentioned conceptual framework for sustainability reporting in Iran is explained more detailed below.
Stability Reporting Determinants The first determinant of sustainability reporting is the size of companies. The impact of large companies on the society, their operation visibility, and the careful consideration of these companies by stakeholders are witnesses to this claim as they are motives for sustainability reporting. This result is similar to that of Fortanier et al. (2011), and Gallo and Christensen (2011). Since the company's profitability and financial capability lead to firms' flexibility to bear the costs of sustainability reporting, profitability and financial capability is considered as the second determinant for the sustainability reporting, which is in line with the studies of Cormier and Magnan (2003), Haniffa and Cooke (2005), and Kent and Monem (2008). Being registered in the stock exchange as a public company, due to the adoption of some reporting procedures by competitors, is the third determinant for the sustainability reporting. This result is in accordance with Haddock (2005).
The company's activity in environmental and socially sensitive industries is considered as the forth determinant for the sustainability reporting. This is because the before-mentioned companies are
Sustainability Reporting Challenges and Risks
Sustainability Reporting Drivers
Taking Advantages of Sustainability
Reporting
Sustainability Reporting Preparers
Governance of Sustainability
Reporting
Framework and content of
Sustainability Reporting
Assurance:
Determinants of Assuring Sustainability Reporting
Challenges of Sustainability Reports Auditing
Alternatives for Independent Auditing of Sustainability Reports
11
under a significant pressure from their stakeholders. Parsa and Kouhy (2008) and Sotorrío and Sánchez (2010) mention the same result. Also, our findings show the culture and social norms as well as regulatory structure of the company's business location are also mentioned as the Fifth and sixth determinants for the sustainability reporting, which are in line with the findings of Sotorrío and Sánchez (2010) and Golob and Bartlett (2007).
Due to identified determinants for sustainability reporting in Iranian context, the Iranian supervisory and regulatory bodies should provide the necessary background for the reporting sustainability information by companies, and at the same time establish some requirements and regulation or even laws for those companies which are more capable for sustainability activities and reporting.
Preparers of Sustainability Reports There are different departments in companies that can be considered responsible for preparing sustainability reports. Nevertheless, according to our findings, management accounting department or another reporting department- except for financial accounting - is responsible for sustainability reporting. It should be noted that the ultimate responsibility of sustainability reports is with the board of directors. Certainly, companies and professional institutions should provide the necessary background like required training for those personnel who prepare of sustainability reports.
Governance of Sustainability Reporting According to our results, sustainability reports should be considered in the context of some governance mechanisms such as legal requirements, national and international standards, management attitude, appropriate information system infrastructure, and the existence of sustainable performance strategies, as well as application of corporate governance principles. In this regard, it is necessary to formulate and approve appropriate legal requirements to facilitate sustainability reporting. Correspondingly, companies should plan for improving their own information systems in order to support the various dimensions of sustainable performance.
Sustainability Reports Content As per our survey results, although research participants agreed with both five-dimensional and four-dimensional sustainability reporting model, they significantly tended to have the five-dimensional model in comparison to the four-dimensional model. Therefore, it seems sustainability reports in the Iranian setting should include economic, strategic, social, ethical, and environmental information. This preferred five-dimensional model is similar to the model presented by Rezaei (2016).
External assurance of Sustainability Reports Regarding the external assurance of sustainability reports, issues including incentives/ determinants, challenges, and alternative approaches need to be considered. In conformity with our study, improving the credibility of sustainability reports and increasing firm value are drivers for auditing sustainability reports. The lack of accepted national or international standards for preparing sustainability reports together with the lack of certified sustainability report auditors are considered as the main challenges for sustainability reports auditing. In this respect, professional associations and standardizing bodies should develop guidelines and standards for sustainability reporting auditing. They also should train the concepts of sustainability to the auditors, as well as familiarize them with the application of those guidelines and standards.
12
On the subject of alternative approaches to independent auditing of sustainability reports, the participants do not consider any alternatives. This finding is Contradictory to Adamsand Evans (2004), Park and Brorson (2005), and Sawani et al. (2010), who identify some alternative procedures like internal audit, self-assurance through some certifications such as ISO, and communication with stakeholders for taking their views about companies’ sustainable performance. Immature internal auditing profession in Iran, as well as ineffective communication between companies’ management and its stakeholders in Iran are among the factors that have led respondents to oppose independent sustainability reporting alternatives (Mashayekhi and Jalali, 2018).
Challenges and Risks of Sustainability Reporting The sustainability reporting is a challenging and risky process. According to participants’ perspective in this study, the challenges and risks on the subject of sustainability reporting include (1) the lack of required information systems infrastructure, (2) the lack of accepted standards for sustainability reporting, (3) the high cost of sustainability reporting, (Solomon and Lewis, L. 2002) (4) the doubt about consequences of the sustainability information disclosure, (5) the difficulty of making a proper balance between quantitative and qualitative sustainability information, (6) the perspectives of suppliers of sustainability reports that this information is not useful to stakeholders, (7) the viewpoint of some managers regarding the priority and importance of providing financial information in comparison with sustainability information, (8) lack of communication and coordination between different contributing teams in sustainability reporting, (9) lack of active engagement with stakeholders, and (10) the fact that top management requires providing sustainability reports (management push-down approach, McNally, et al. 2017). These finding are somehow similar to McNally, et al. (2017), who show about challenges of integrated reporting.
Taking Advantages of Sustainability Reporting In accordance with the results of this survey, companies can take more advantages of sustainability reporting in some ways, including (1) disclosing more voluntary sustainability information; (2) utilizing accepted international standards of sustainability reporting; (3) best practice benchmarking sustainability reports; (4) stakeholder engagement in sustainability reporting process; (5) independent auditing of sustainability reports; (6) establishing appropriate infrastructure for information systems and reporting process; and (7) strengthening management attitudes in all aspects of sustainable performance. However, some aforenoted items are more effective whereas some are less.
To put the main point in nutshell, the conceptual framework presented in this research can provide a guideline for regulators and standard setters for legislating and policy making regarding sustainability reporting. Furthermore, companies can use this framework to design and shape extract their corporate sustainability reports appropriately in a way which is suitable for Iranian context.
What’s more, researchers may apply our proposed conceptual framework for conducting future research in the sustainability reporting areas. Nonetheless, it should be noted that due to our research methodology, including the use of a judgmental sample to increase the validity of the results, the generalizability limitations of the results should be considered.
13
References Adams, C.A. and Evans, R. (2004), “Accountability, completeness, credibility and the audit expectations gap”, The Journal of Corporate Citizenship, Vol. 14 No. 1, pp. 97-115.
Cho, C. H., Laine, M., Roberts, R. W. & Rodrigue, M. (2015). Organized hypocrisy, organizational façades, and sustainability reporting. Accounting, Organizations and Society, 40 (0), 78-94.
Cormier, D., Magnan, M., (2003). Environmental reporting management: a continental European perspective. Journal of Accounting and Public Policy 22, 43-62.
Danaeifard Hassan, Alvani Mehdi. (2016). Qualitative research method in management. Tehran: Saffar publications (in Persian).
Dyllick, T., Hockerts, K., 2002. Beyond the business case for corporate sustainability. Business Strategy and The Environment 11, 130-141.
Fakhari H, Malekian E, Jafaei Rahni M. (2018). Explaining and Ranking of the Components and Indicators of Environmental, Social and Corporate Governance Reporting by Analytic Hierarchy Process in the Companies Listed in Stock Exchange. Iranian Journal of value and behavioral accounting. 2 (4) :153-187. (in Persian)
Fortanier, F., Kolk, A., Pinkse, J., (2011). Harmonization in CSR reporting: MNEs and global CSR standards. Management International Review 51, 665-696.
Gallo, P.J., Jones Christensen, L., (2011). Firm size matters: an empirical investigation of organizational size and ownership on sustainability-related behaviors. Business & Society 50, 315-349.
Golob, U., Bartlett, J.L., (2007). Communicating about corporate social responsibility: a comparative study of CSR reporting in Australia and Slovenia. Public Relations Review 33, 1-9.
Hahn, R., & Kühnen, M. (2013). Determinants of sustainability reporting: a review of results, trends, theory, and opportunities in an expanding field of research. Journal of cleaner production, 59, 5-21.
Haniffa, R., Cooke, T.E., (2005). The impact of culture and governance on corporate social reporting. Journal of Accounting and Public Policy 24, 391-430.
Haddock, J., (2005). Consumer influence on internet-based corporate communication of environmental activities: the UK food sector. British Food Journal 107 (10): 792-805.
Kent, P., Monem, R., (2008). What drives TBL reporting: good governance or threat to legitimacy? Australian Accounting Review 18, 297-309.
KPMG (2011), “KPMG international survey of corporate responsibility reporting”, available at: www.kpmg.com/PT/pt/IssuesAndInsights/Documents/corporate-responsibility2011.pdf (accessed 29September 2014).
14
KPMG (2013), “The KPMG survey of corporate responsibility reporting”, available at: www.kpmg.com/Global/en/IssuesAndInsights/ArticlesPublications/corporate-responsibility/Documents/corporate-responsibility-reporting-survey-2013-exec-summary.pdf (accessed 1 October 2014).
Mahdavi, G. H., Abbas Ali Daryaei, A. A., Alikhani, R., and Maranjory, M. (2015). The Relation of Firm Size, Industry Type and Profitability to Social and Environmental Information Disclosure. Journal of Empirical Research in Accounting. 4 (3): 87-103. doi: 10.22051/jera.2015.1994 (in Persian)
Mashayekhi, B. and Jalali, F. (2018). A Qualitative Study on the Vicious Cycle of Internal Audit Function in Iran. AFAANZ (Accounting and Finance Association of Australia and New Zealand) Conference, Auckland.
Masoumi, S. R., Salehnejad, S. H., Zabihi Zarin Kalayee, A. (2018). Identifying the variables affecting the sustainability reporting of listed companies in Tehran Stock Exchange. Journal of Audit Science. 18 (70): 195-22 (in Persian)
McNally, M. A., Cerbone, D., & Maroun, W. (2017). Exploring the challenges of preparing an integrated report. Meditari Accountancy Research, 25(4), 481-504.
Park, J. and Brorson, T. (2005), Experiences of and views on third party assurance of corporate environmental and sustainability reports, Journal of Cleaner Production, Vol. 13 No. 10, pp. 1095-1106.
Parsa, S., Kouhy, R., (2008). Social reporting by companies listed on the alternative investment market. Journal of Business Ethics 79, 345-360.
Rezaee, Z. (2016). Business sustainability research: A theoretical and integrated perspective. Journal of Accounting Literature, 36, 48-64.
Sawani, Y., Zain, M.M. and Darus, F. (2010), “Preliminary insights on sustainability reporting and assurance practices in Malaysia”, Social Responsibility Journal, Vol. 6 No. 4, pp. 627-645.
Sierra, L., Zorio, A. and Garcia-Benau, M.A. (2013), “Sustainable development and assurance of corporate social responsibility reports published by Ibex-35 companies”, Corporate Social Responsibility and Environmental Management, Vol. 20 No. 6, pp. 359-370.
Simnett, R., Vanstraelen, A., & Chua, W. F. (2009). Assurance on general purpose non-financial reports: an international comparison. The Accounting Review, 84(3), 937–967.
Solomon, A. & Lewis, L. 2002. Incentives and disincentives for corporate environmental disclosure. Business Strategy and the Environment, 11 (3), 154-169.
Sotorrío, L.L., Sánchez, J.L.F., 2010. Corporate social reporting for different audiences: the case of multinational corporations in Spain. Corporate Social Responsibility and Environmental Management 17, 272-283.
Zorio, A., Garcia-Benau, M.A. and Sierra, L. (2013), “Sustainable development and the quality of assurance reports: empirical evidence”, Business Strategy and the Environment, Vol. 22 No. 7, pp. 484-500.

15
Appendix (1)
Research Questions Research Question 1: Who should prepare sustainability reports? 1 Sustainability reports should be prepared by the financial accounting department. 2 Sustainability reports should be provided by the management accounting department.
3 Sustainability reports should be provided by an independent department (e.g. the integrated reporting department, if any).
4 The board of directors is responsible for producing sustainability reports as well as financial statements.
Research Question 2: What are the drivers and factors affecting sustainability reporting and the reason for sustainability reporting in non-compulsory conditions in Iran?
5 Size, visibility, and the pressures and demands of their stakeholders to thoroughly examine those companies are drivers of sustainability reporting.
6 Profitability, capability and flexibility of companies regarding sustainability reporting costs are the drivers of sustainability reporting.
7 The legitimization of company activities for creditors and shareholders is a determinant for sustainability reporting.
8 Reducing the information asymmetry between the company and its investors as well as signaling to the market are the drivers of sustainability reporting.
9 Registering companies in the stock exchanges (due to the adoption of some reporting procedures by competitors, and therefore, competitive pressure with regard to reporting) is a determinant for sustainability reporting.
0 The decentralization of the company's ownership structure is a determinant for sustainability reporting due to the lack of major shareholders who already have access to relevant information and the need to reduce information asymmetries.
11 Ownership of the foreign investors in the company is a determinant for sustainability reporting due to the difficulties in accessing information through alternative sources of information.
12 The attention of the media to the company's activities is a determinant for sustainability reporting.
13 The position of the company in the supply chain is a factor in driving sustainability reporting due to the difference in the relationship between the companies in the supply chain with the final consumers.
14 Uniformity of the company name and its brands is a driver for sustainability reporting because of its impact on the company's visibility.
15 The company's activity in environmental and social sensitive industries and their stakeholder pressures is driving sustainability reporting.
16 The culture, social norms, and the local regulatory structure are determining the sustainability reporting.
17 The positive effects of sustainability reporting on the value of the company are determinants of sustainability reporting.
Question 3: Which information should be disclosed in a sustainability report?18 Sustainability reports should include three dimensions: environmental, social, and governance (ESG).
19 Sustainability reports should include four dimensions: economic, governance, social, and environmental.
20 Sustainability reports should include five dimensions: economic, governance, social, ethical, and environmental.
21 Sustainability reports should prioritize financial and economic performance data.
22 In Sustainability reports, the priority should be given to the presentation of corporate governance information.

16
23 In sustainability reports, the priority should be given to communicating social performance information (the quality of the implementation of the company's social responsibilities and goals in practice and aligning them with the goals of society).
24 In sustainability reports, the priority must be given to the presentation of ethical performance (the existence of a corporate culture based on integrity and competency).
25 In sustainability reports the priority must be given to the environmental performance data. 26 Sustainability reports should include the risks associated with sustainability performance. Question 4: Which corporate governance mechanisms encourage the sustainability reporting? 27 It is difficult to prepare sustainability reports without legal requirements. 28 The existence of a legal requirement will increase sustainability reporting and improve its quality. 29 Sustainability reporting using international norms and standards is appropriate for Iranian companies. 30 It is difficult to prepare sustainability reports without any local standards. 31 Sustainability reporting requires the proper implementation of corporate governance principles.
32 Sustainability reporting requires managers to change their attitudes toward reporting and sustainability management.
33 Sustainability reporting is difficult without proper information systems infrastructure. 34 Sustainability reporting requires proper strategies for sustainability in companies. Question 5: What are the challenges and risks surrounding the sustainability reporting?
35 The fact that top management requires sustainability reporting, is one of the challenges regarding this kind of reporting.
36 Regarding the view of some managers about the priority and importance of providing financial information in comparison with preparing sustainability information and undervaluing the sustainability reporting, is one of the sustainability reporting challenges.
37 The lack of communication and coordination between the various participants in sustainability reporting process is one of the sustainability reporting challenges.
38 Not believing in usefulness of the sustainability reports for stakeholders, is one of the sustainability reporting challenges.
39 The lack of integrated and consensual standards for sustainability reporting is one of the sustainability reporting challenges.
40 The lack of active engagement with stakeholders to better understand their expectations and information they need is one of the challenges of sustainability reporting.
41 Balancing the provision of quantitative and qualitative information in sustainability reports is one of the challenges of sustainability reporting.
42 The lack of required information systems infrastructure is one of the challenges of sustainability reporting.
43 The cost of providing sustainability reports, especially for small companies, is one of the challenges of sustainability reporting.
44 Consequences of disclosing sustainability information are other challenges of sustainability reporting. Question 6: How can companies maximize the benefits of sustainability reporting? 45 Companies can benefit more from sustainability reporting when they report on a voluntary basis.
46 Companies can benefit more from sustainability reporting when they report based on well-known international standards.
47 Companies can benefit more from sustainability reporting when they benchmark the well-known similar companies.
48 Companies can benefit more from sustainability reporting when stakeholders participate in the process of preparing sustainability reports and their needs and expectation is considered.
49 Companies can benefit more from sustainability reporting when sustainability reports are audited.
50 Companies can benefit more from sustainability reporting when information systems and reporting processes are built on an appropriate infrastructure

17
51 Companies can benefit more from sustainability reporting by strengthening management attitudes in all aspects of sustainable performance.
Question 7: Should sustainability reports be audited? 52 Sustainability reports should be subject to independent auditing like corporate financial statements.
53 Due to agency problem between companies’ owners and manages as well as information asymmetry within them, sustainability reports should be independently audited like financial information.
54 Because the audited/ assured information is more reliable in making decisions, sustainability reports should be independently audited.
55 Due to the possibility of litigation against companies for the misleading content of sustainability reports and the need to consider insurance coverage for that, sustainability reports should be subject to independent audits.
56 Due to the increased credibility of audited/ assured sustainability reports, sustainability reports should be independent audits.
57 The sustainability reports of big companies should be audited/ assured, whereas this is not necessary for small companies.
58 The sustainability reports of the companies among sensitive industries to sustainability issues should be audited/ assured, whereas others should not.
59 The sustainability reports of the companies under media and public pressure should be audited/ assured, whereas others should not.
60 The sustainability reports of the companies in the countries concerned about the rights of stakeholders should be audited/ assured, whereas others should not.
61 Because the audited/ assured sustainability reports contribute to the companies’ value, sustainability reports should be independently audited.
62 Due to the lack of local/national standards for sustainability reporting, independent audit of sustainability reports is not possible.
63 Due to the lack of certified auditors in the field of sustainability reports auditing, independent audit of sustainability reports is not possible.
64 Due to high costs for auditing of sustainability reports, independent audit of sustainability reports is not wise.
65 Since the existing systems and processes are incapable of supporting the audit of sustainability reports, there is no need for independent auditing of sustainability reports.
66 Due to the lack of mandatory rules and regulations, there is no need for independent auditing of sustainability reports.
67 Due to the risk of issuing qualified or even adverse opinion on sustainability reports, there is no need for independent auditing of sustainability reports.
68 Due to the lack of consensus auditing standards for sustainability reports, there is no need for independent auditing of sustainability reports.
69 Due to alternative procedures, there is no need for independent auditing of sustainability reports.
70 The internal audit engagement in sustainability reporting audit is considered as one of the alternatives to the independent audit of sustainability reports.
71 Verification through certification such as ISO 26000, is one of the alternatives to the independent audit of sustainability reports.
72 Communication with stakeholders and taking their views and opinions about companies’ sustainable performance is one of the alternatives to the independent audit of sustainability reports.

1
IFRS ADOPTION AND SEASONED EQUITY OFFERING UNDERPERFORMANCE
Abstract
This study uses a cross-country sample to examine the impact of adoption of IFRS on seasoned
equity offering (SEO) underperformance. The empirical literature on SEOs has established that
information uncertainties contribute to SEO underperformance. Given the growing number of
countries that have adopted IFRS, it is therefore important to assess whether adoption of IFRS
reduces the uncertainties surrounding SEOs and thus subsequent underperformance. The study
employs a control sample of non-IFRS adoption countries and applies a difference-in-
difference design to capture the incremental change between the treatment and control samples.
We find that SEO underperformance decreases for IFRS adopters relative to non-IFRS adopters
in the post-adoption period. We also find that SEO underperformance decreases for firms in
countries that adopt IFRS and have stronger enforcement. These findings are statistically robust
to the application of different measures of SEO underperformance but vary in economic terms.
Overall, our study provides global evidence on SEOs and potentially incentivise standard
setters to improve reporting standards and encourage policymakers to strengthen enforcement
and information environment.
Keywords: IFRS adoption; Seasoned equity offering; SEO underperformance; Enforcement
crystalcui
Typewritten Text
Solomon Opare and Tony van Zijl School of Accounting and Commercial Law, Victoria University of Wellington, New Zealand Muhammad Nurul Houqe School of Accountancy, Massey University, New Zealand
crystalcui
Typewritten Text
crystalcui
Typewritten Text

2
1. Introduction
This study examines the impact of adoption of International Financial Reporting Standards
(IFRS) on seasoned equity offering (SEO) underperformance. IFRS has gained global
acceptance since adoption by European countries and other countries in 2005. Proponents of
IFRS argue that it leads to increased disclosure and better enable investors to compare financial
information to enhance efficient resource allocation (Barth et al., 2012; Hong et al., 2014).
Improved information is likely to reduce the information asymmetry between firms and
investors and thus have a critical impact on pricing SEOs. Therefore, SEOs provide a watershed
corporate event to examine the impact of IFRS adoption.
SEO firms might intuitively be expected to experience better stock price performance
compared to their past performance and to their peers. However, contrary to this expectation,
the empirical literature shows that SEO firms actually experience significantly negative
abnormal returns after the offering. For example, Loughran and Ritter (1995) find that issuing
firms experienced an 8% lower stock return than non-issuing firms with the same market
capitalisation. Loughran and Ritter (1997) find that the low stock returns after an SEO
particularly follow high returns prior to the offering. The dip in performance following a peak
performance of SEO firms is popularly referred to in the literature as post-SEO
underperformance.
Our main motivation for studying SEOs is that, although the offerings are subject to regulatory
demands and scrutiny, offer audited financial information, and are followed by analysts, there
is substantial pressure on managers to influence prices upwards as the SEO approaches. This
is because the issue price reflects the share price of the firm at the date of the offer. It is also
striking that SEO firms record underperformance given that prices are already observable.
Despite the extensive disclosure demands on corporate events such as SEOs, information
asymmetry appears to have been the major factor underpinning the anomalies surrounding this
event. The information gap causes uncertainties prior to this corporate event.
Consistent with the information asymmetry explanation, it is expected that SEO
underperformance increases with increasing information asymmetry and decreases with
improved disclosure in the prospectus and financial reports. This is because, if investors are
unaware of the true value of the firm prior to an SEO, they are likely to subsequently discount
the price of the firm when they become more informed on their investment. On the other hand,
if management provides adequate information that reflects the prospects of the firm, investors
3
can accurately price their investment in an SEO firm. This is likely to reduce the level of
underperformance after an SEO issue.
Compared to local standards, IFRS is expected to bridge the information gap faced by investors
in an SEO transaction and subsequently reduce the level of underperformance. This is based
on the following reasons. First, firms are more inclined to communicate with both foreign and
domestic financial information users due to firms’ increased participation in foreign markets.
IFRS as a common international accounting standard will enable firms to provide more
standardised financial information and compete for the attention of investors and reduce the
cost associated with information processing.
Second, most domestic standards have discretion on the informativeness of disclosures.
However, IFRS offers more information disclosure requirements. For example, Ashbaugh
(2001) documents the additional disclosure requirement by IFRS compared to local GAAPs
and in fact, finds that firms significantly increase their information flow prior to an SEO issue.
The increased disclosure facilitates raising equity capital by firms and enables investors to
better value a firm.
Third, IFRS offers more stringent accounting measurements. Ding et al. (2007) found that
IFRS reduces the amount of reporting discretion relative to local GAAPs. Ashbaugh and Pincus
(2001) found that the variation among local GAAPs across jurisdictions exacerbates analysts
forecast errors of non-US firms and that analysts forecast accuracy improves after firms apply
international accounting standards. The stringent accounting measurement has the potential to
reduce opportunistic behaviour of management prior to SEO issues, improve financial
reporting quality and reduce the level of underperformance.
In jurisdictions where IFRS is adopted, it is often difficult to distinguish the impact of
accounting standards changes from other regulatory changes and institutional factors such as
the strength of law enforcement and investor protection. For example, both the EU Market
Abuse Directive (Directive 2003/6/EC) in 2003 and the Transparency Directive (Directive
2004/109/EC) in 2004 had similar objectives to the adoption of IFRS (Christensen et al., 2013).
Countries such as Germany and Spain made concurrent policy changes to accommodate the
adoption of IFRS which led to decreased earnings management and increased liquidity but
Ernstberger et al. (2012) argue that it is difficult to trace these outcomes to any specific change
made to the reporting environment. We thus empirically test whether adoption of IFRS has any
4
significant impact on SEO underperformance and examine whether the results differ with the
institutional setting of countries.
Our study is based on a sample of 29,534 SEOs from 42 IFRS adoption countries and 9 non-
IFRS adoption countries for the period 1992 to 2017. We investigate the effect of adoption of
IFRS on SEO underperformance for pre- and post-adoption periods and between adopters and
non-adopters using a difference-in-difference design. The difference-in-difference approach
compares the change in SEO underperformance for IFRS adopters for pre-adoption and post-
adoption periods relative to a corresponding change in SEO underperformance for non-IFRS
adopters. This research design controls for concurrent confounding issues and better identifies
the causal effect of adoption of IFRS and SEO underperformance.
Our analyses show that IFRS adoption leads to a reduction in SEO underperformance and the
decrease persist for firms that apply IFRS and are domiciled in strong enforcement environment
relative to weak enforcement countries. The decrease in SEO underperformance is both
statistically and economically significant ranging from 10% to 44%. The results are robust
statistically to the application of different measures of underperformance but vary in economic
terms. The results for firm-level variables to control for variation in firm-specific
characteristics are largely consistent with the literature.
This study makes contributions in several dimensions. First, we investigate a capital market
effect of adoption of IFRS on SEO underperformance, which has not been previously
examined. SEO underperformance is detrimental to investors and imposes significant losses on
investors’ value, thus by examining SEO underperformance we contribute to research on the
adoption of accounting standards on equity markets. Second, we employ a cross-country
sample in our study. Prior research on SEOs has predominantly been on the US market and
only a few other developed markets. Given the marked global increase in SEOs in recent years,
investors cross investing in various equity markets, and the global acceptance of IFRS as a
single set of accounting standards for financial reporting, focusing on specific countries offer
limited insights into SEOs around the world.
The use of cross-country sample is important in the context of our study for the following
reasons. First, globalisation and capital market integration, particularly across Europe, and the
adoption of common internationally accepted accounting standards facilitate cross-border
investment. The existence of common financial information across different capital markets
made possible, in part, by adoption of IFRS enables investors and firms to participate in equity

5
issuance around the world. Second, cross-country study is of interest considering the
heterogeneity in capital markets across countries.
The rest of this paper is structured as follows. Section 2 reviews the research evidence and set
up the hypotheses. Section 3 describes our methodology. Section 4 provides details on our
sample. In Section 5, we discuss our empirical results and we present additional analyses in
Section 6. Section 7 concludes the study.
2. Research evidence and hypotheses
SEOs are important corporate events where firms raise funds in the capital market by issuing
additional shares. In SEOs, managers have real incentives to inflate earnings. This is because
higher earnings are likely to produce higher share prices (Bar-Gill and Bebchuk, 2002). The
higher share prices lead to an increase in funds raised because the offer price of SEOs depends
on the share price of the firm at the date of the offering (Rangan, 1998; Teoh et al., 1998;
Cohen and Zarowin, 2010; Kothari et al., 2016). Also, higher stock price performance enables
firms to obtain more favourable terms in an SEO transaction (Kothari et al., 2016) and increases
the compensation package of management where managers performance is assessed on market-
based measure.
The unique features of SEOs have attracted considerable research on the underlying economics.
Loughran and Ritter (1997), Shivakumar (2000), and Kothari et al. (2016) provide evidence
which shows that SEOs are typified by stock price underperformance after the issue. The
evidence shows that the operating performance and stock returns of issuing firms peak at the
time of the issue and decline after the issue. Rangan (1998), Teoh et al. (1998), and Shivakumar
(2000) attribute the observed underperformance to inflated earnings although SEOs are subject
to intense scrutiny from regulators, authors, and financial analysts.
Rangan (1998) and Teoh et al. (1998) argue that managers opportunistically inflate earnings
prior to SEOs to take advantage of investors’ naivety in extrapolating pre-issue earnings
growth. After the issue, investors discount the value of the firm due to the observed dip in
earnings growth. Shivakumar (2000) refutes the opportunism assumption by Rangan (1998)
and Teoh et al. (1998) and draws on rational expectations to explain SEO underperformance.
Shivakumar (2000) argues that the underperformance occurs due to investors’ discounting of
stock prices after an SEO because investors assume that all firms inflate their earnings prior to
an SEO. If firms cannot credibly communicate the absence of inflated earnings, they anticipate
investors’ stock price discounting and overstate their earnings.
6
Another explanation for the SEO underperformance is provided by Hertzel and Li (2010) and
Khan et al. (2012). The authors attribute the underperformance to the existence of information
asymmetry between managers and investors. The authors explain that managers use market
timing to issue SEOs because they possess private information on firms’ stock mispricing and
overvaluation. However, investors are not able to discern the mispricing before the issue but
react to recent trends in the performance of firms. Subsequently, investors correct their
valuation when they become aware of the overvaluation where firms are not able to sustain the
pre-issue performance.
Based on the above documented evidence we investigate whether adoption of IFRS has an
impact on SEO underperformance. Hong et al. (2014), ICAEW (2014), and De George et al.
(2016) suggest that high-quality financial reporting standards and increased disclosure reduce
information asymmetry and uncertainties surrounding equity issues. Ahmed et al. (2013) in a
meta-analysis study found that, in general, IFRS offers a positive impact on financial
information. Several studies including Jones and Finley (2011), Brochet et al. (2013) and
Jayaraman and Verdi (2014) find that compared to local GAAP, IFRS as a single set of
accounting standards generally enhance the comparability of financial information of firms
within and across countries.
Kim and Li (2011) find that IFRS adoption reduces information barriers for firms because
investors use the financial information of peer firms to assess the value of a given firm.
Ashbaugh (2001) and Ashbaugh and Pincus (2001) reveal that reporting under IFRS provides
the mechanism for more standardised financial information on earnings and equity which
reduces the information processing cost by investors. The existence of comparable and
standardised financial information across firms would enable investors to be more informed
about the underlying value of an issuing firm prior to an SEO. This is likely to reduce investor
naivety in extrapolating pre-issue performance if management succeeds in manipulating the
value of the firm.
Ashbaugh (2001) also documents specific additional financial information or disclosure
requirements that international accounting standards offer over local accounting standards in
most jurisdictions adopting IFRS. The additional disclosure such as statement of cash flows,
effect of changes in accounting estimates, events occurring after reporting date and related
party transactions are expected to improve the information environment and reduce
idiosyncratic risk of management expropriation steaming from opacity in financial reports prior
7
to adoption of IFRS. For example, the availability of statement of cash flow helps investors
and analysts to compare cash flow with earnings to identify the proportion of accruals which
has been proven to be the main mechanism that firms use to manage earnings and disguise the
underlying value of firms. Ding et al. (2007) find that the economic consequence of the absence
of the additional disclosure from adoption of IFRS is associated with higher earnings
management.
To avoid adverse selection, management is thus expected to signal to investors about the
presence or absence of private benefit that insiders seek to exploit. Reporting under IFRS is
one of the important channels to signal the absence of private information. Adoption of IFRS
increases disclosure and comparability which in turn improves transparency (Horton et al.,
2013) and reduces SEO underperformance. In fact, evidence shows that there is higher
disclosure prior to equity offerings as a strategy by firms to pre-empt investors’ search of
information in relation to equity issues (Ashbough, 2001). Ashbaugh and Pincus (2001) and
Byard et al. (2011) find that adoption of IFRS reduces analysts’ forecast error and forecast
dispersion, which in turn increase firms’ information environment. Furthermore, DeFond et al.
(2014) find that through increased transparency, adoption of IFRS has reduced managers ability
to withhold information from users. It is expected that IFRS adoption would improve
information flow and reduce SEO underperformance.
Given the evidence documented on the existence of underperformance post SEO as a result of
information asymmetry between outside investors and management, we expect that the
increase in disclosure, transparency, comparability, and improved information environment
from adoption of IFRS will decrease the level of information asymmetry and reduce SEO
underperformance. We thus hypothesise that:
H1: Adoption of IFRS reduces SEO underperformance.
Countries’ institutional environment is a significant factor when explaining the effects of
adoption of IFRS. The impact of IFRS adoption may be hindered by differences across
countries in respect of institutional settings (Brown et al., 2014). Earlier studies from La Porta
et al. (1997, 1998) suggest the importance of enforcement in an institutional environment and
Leuz (2010) notes that the adoption of financial reporting standards should be done in
conjunction with other institutional changes because both standards and the institutional
environment have an impact on the quality of financial reporting. A number of researchers in
accounting examine the effect of the differences in the level of enforcement on financial

8
reporting (Bhattacharya et al., 2003; Burgstahler et al., 2006; Daske et al., 2008). The evidence
from these studies suggests that financial reporting will be of high quality if there is strong
enforcement in place.
Bhattacharya et al. (2003) and Bushman et al. (2004) find that countries with strong investor
protection exhibit greater transparency. Daske et al. (2008) and Houqe et al. (2014) examine
the effect of mandatory IFRS adoption and investor protection on earnings quality. The authors
find that IFRS adoption has a positive economic impact in countries with strong investor
protection. This indicates that financial reporting is significantly impacted by the institutional
setting of a country.
Djankov et al. (2008) find higher legal protection of investors against managers’ expropriation
in more developed and open markets. La Porta et al. (1997, 1998) show that investor protection
is based on the legal origin of a firm and that countries with strong investor protection have a
large and open capital market, particularly common law countries. The strength of investor
protection is a reflection of the level of enforcement in a country. Larger and open markets are
mostly more efficient which indicates an increasing flow of financial information and
disclosure for investment decisions. These are characteristics of strong enforcement regimes;
weaker enforcement regimes are likely to be associated with corporate insiders acting on
material private information to the detriment of outside investors.
When investors are better informed on the value of a firm they may not be drawn into
overpricing of SEOs. Lang et al. (2006) find that despite the application of one set of financial
reporting standards across Europe, lack of financial statement comparability continued, and
earnings management was common among the firms in their sample. This suggests that IFRS
may be of higher quality than local GAAP, but lack of implementation and enforcement may
lead to a lower positive effect on the capital market (Ahmed et al., 2013). In response to this,
the EU in 2004 passed a directive mandating management of firms to establish committees that
would ensure enforcement and compliance of IFRS. The directive was widely accepted by
many countries and led to an increase in capital market benefits. However, where there are
concurrent changes in the level of enforcement it is difficult to identify the impact of adoption
of IFRS. This is because the effect of adoption of IFRS then becomes a function of the quality
of IFRS relative to local GAAP, and the level of enforcement of that country.
In a strong enforcement environment, financial information would not be of high quality if
financial standards are not of high quality. In a weak enforcement environment, accounting
9
standards are not effective, thus there is likely to be less impact from adoption of high-quality
accounting standards.
A country which adopts IFRS but has a strong enforcement environment is likely to experience
a significant impact from adoption of IFRS. Also, stronger enforcement institutions may
present fewer opportunities for managerial discretion which is likely to offset the positive
impact of adoption of IFRS. Consequently, we hypothesise that:
H2: Adoption of IFRS reinforces the effect of a strong enforcement environment in
reducing SEO underperformance.
3. Test methodology
We first examine the relationship between adoption of IFRS and SEO underperformance using
a difference-in-difference approach with a benchmark sample of non-IFRS adoption countries.
The benchmark sample of non-IFRS adoption countries controls for changes in the economic
environment and contemporaneous effects that are unrelated to the introduction of IFRS. The
difference-in-difference approach controls for unobservable differences between treatment and
control firms and account for observable changes in the treatment sample Daske et al. (2008).
A benchmark of voluntary adoption is not suitable because mandatory IFRS adoption is
unlikely to be substantially different from voluntary adoption, subject to similar economic and
regulatory environments, and a non-random sample, hence potential for self-selection bias.
We test Hypothesis 1 using the following regression model.
𝑆𝐸𝑂𝑈𝑃 = 𝛽0 + 𝛽1𝑇𝑖𝑚𝑒 + 𝛽2𝑀𝑎𝑛𝑑𝑎𝑡𝑜𝑟𝑦 + 𝛽3𝑇𝑖𝑚𝑒 ∗ 𝑀𝑎𝑛𝑑𝑎𝑡𝑜𝑟𝑦 + ∑𝛽𝑖𝐶𝑜𝑛𝑡𝑟𝑜𝑙𝑠𝑖 + 𝜀 (1)
where SEOUP stands for SEO underperformance. The variable Time is a dummy variable that
equals one for observations after mandatory adoption and reflects the change in
underperformance for the benchmark group. The variable Mandatory is a dummy variable and
takes the value of one for a firm in a given country that applied IFRS when compliance became
mandatory and is zero otherwise. This captures the difference between the benchmark and
treatment groups in the pre-period. Our main variable of interest, Time*Mandatory, is an
interaction of the variables Time and Mandatory and takes the value of one for mandatory
adopters in the post-adoption period. This is expected to capture any change in SEO
underperformance for IFRS adopters relative to non-IFRS adopters following IFRS adoption.
The variable Controlsi, denotes our set of control variables that have an impact on SEO
underperformance and the various fixed effects (industry fixed effects, country fixed effects,
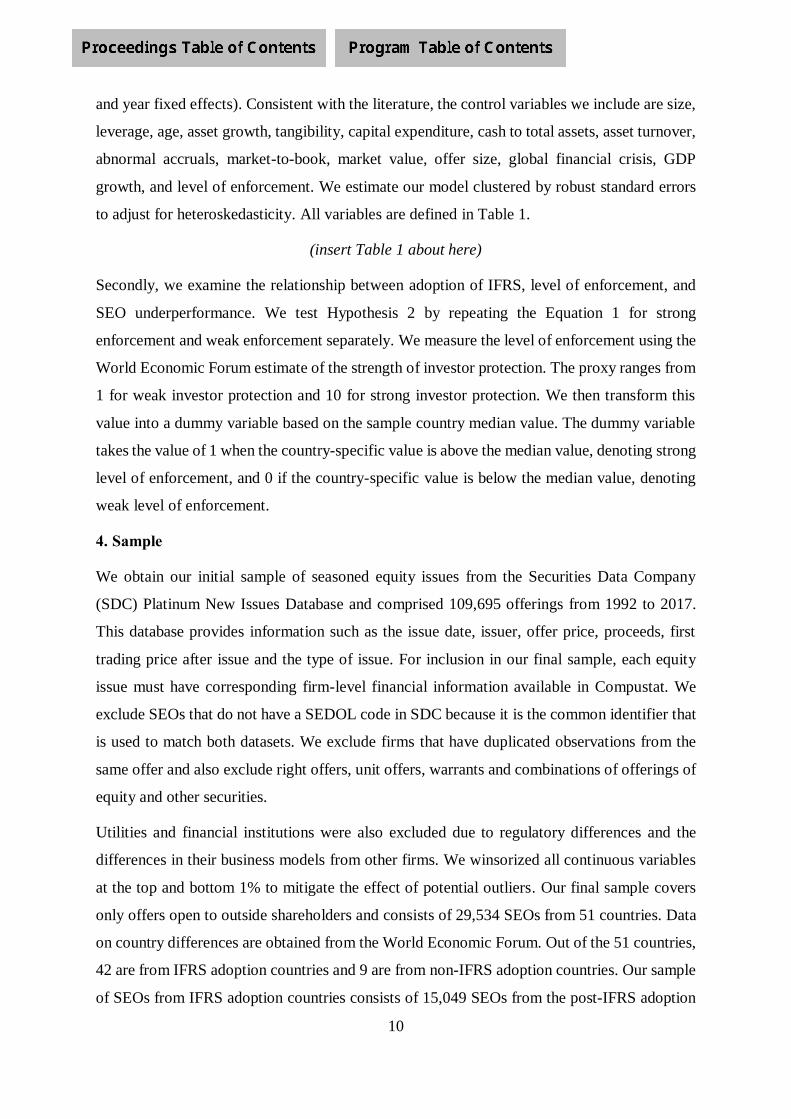
10
and year fixed effects). Consistent with the literature, the control variables we include are size,
leverage, age, asset growth, tangibility, capital expenditure, cash to total assets, asset turnover,
abnormal accruals, market-to-book, market value, offer size, global financial crisis, GDP
growth, and level of enforcement. We estimate our model clustered by robust standard errors
to adjust for heteroskedasticity. All variables are defined in Table 1.
(insert Table 1 about here)
Secondly, we examine the relationship between adoption of IFRS, level of enforcement, and
SEO underperformance. We test Hypothesis 2 by repeating the Equation 1 for strong
enforcement and weak enforcement separately. We measure the level of enforcement using the
World Economic Forum estimate of the strength of investor protection. The proxy ranges from
1 for weak investor protection and 10 for strong investor protection. We then transform this
value into a dummy variable based on the sample country median value. The dummy variable
takes the value of 1 when the country-specific value is above the median value, denoting strong
level of enforcement, and 0 if the country-specific value is below the median value, denoting
weak level of enforcement.
4. Sample
We obtain our initial sample of seasoned equity issues from the Securities Data Company
(SDC) Platinum New Issues Database and comprised 109,695 offerings from 1992 to 2017.
This database provides information such as the issue date, issuer, offer price, proceeds, first
trading price after issue and the type of issue. For inclusion in our final sample, each equity
issue must have corresponding firm-level financial information available in Compustat. We
exclude SEOs that do not have a SEDOL code in SDC because it is the common identifier that
is used to match both datasets. We exclude firms that have duplicated observations from the
same offer and also exclude right offers, unit offers, warrants and combinations of offerings of
equity and other securities.
Utilities and financial institutions were also excluded due to regulatory differences and the
differences in their business models from other firms. We winsorized all continuous variables
at the top and bottom 1% to mitigate the effect of potential outliers. Our final sample covers
only offers open to outside shareholders and consists of 29,534 SEOs from 51 countries. Data
on country differences are obtained from the World Economic Forum. Out of the 51 countries,
42 are from IFRS adoption countries and 9 are from non-IFRS adoption countries. Our sample
of SEOs from IFRS adoption countries consists of 15,049 SEOs from the post-IFRS adoption
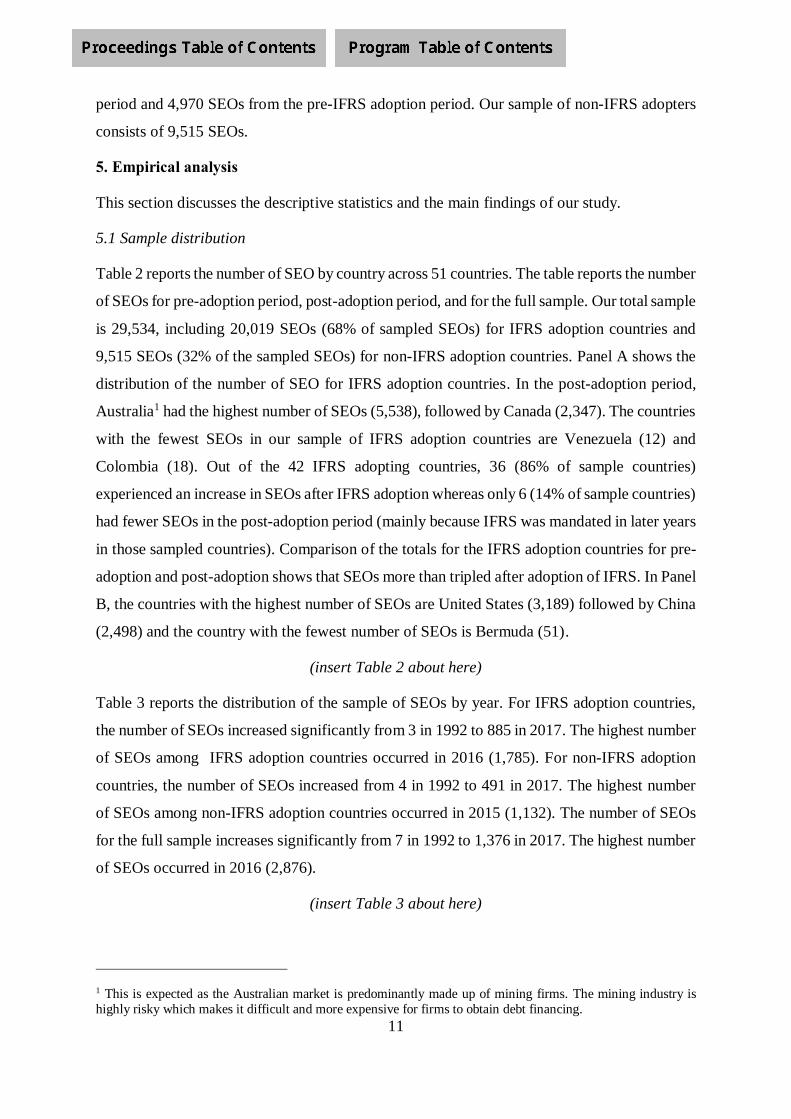
11
period and 4,970 SEOs from the pre-IFRS adoption period. Our sample of non-IFRS adopters
consists of 9,515 SEOs.
5. Empirical analysis
This section discusses the descriptive statistics and the main findings of our study.
5.1 Sample distribution
Table 2 reports the number of SEO by country across 51 countries. The table reports the number
of SEOs for pre-adoption period, post-adoption period, and for the full sample. Our total sample
is 29,534, including 20,019 SEOs (68% of sampled SEOs) for IFRS adoption countries and
9,515 SEOs (32% of the sampled SEOs) for non-IFRS adoption countries. Panel A shows the
distribution of the number of SEO for IFRS adoption countries. In the post-adoption period,
Australia1 had the highest number of SEOs (5,538), followed by Canada (2,347). The countries
with the fewest SEOs in our sample of IFRS adoption countries are Venezuela (12) and
Colombia (18). Out of the 42 IFRS adopting countries, 36 (86% of sample countries)
experienced an increase in SEOs after IFRS adoption whereas only 6 (14% of sample countries)
had fewer SEOs in the post-adoption period (mainly because IFRS was mandated in later years
in those sampled countries). Comparison of the totals for the IFRS adoption countries for pre-
adoption and post-adoption shows that SEOs more than tripled after adoption of IFRS. In Panel
B, the countries with the highest number of SEOs are United States (3,189) followed by China
(2,498) and the country with the fewest number of SEOs is Bermuda (51).
(insert Table 2 about here)
Table 3 reports the distribution of the sample of SEOs by year. For IFRS adoption countries,
the number of SEOs increased significantly from 3 in 1992 to 885 in 2017. The highest number
of SEOs among IFRS adoption countries occurred in 2016 (1,785). For non-IFRS adoption
countries, the number of SEOs increased from 4 in 1992 to 491 in 2017. The highest number
of SEOs among non-IFRS adoption countries occurred in 2015 (1,132). The number of SEOs
for the full sample increases significantly from 7 in 1992 to 1,376 in 2017. The highest number
of SEOs occurred in 2016 (2,876).
(insert Table 3 about here)
1 This is expected as the Australian market is predominantly made up of mining firms. The mining industry is
highly risky which makes it difficult and more expensive for firms to obtain debt financing.
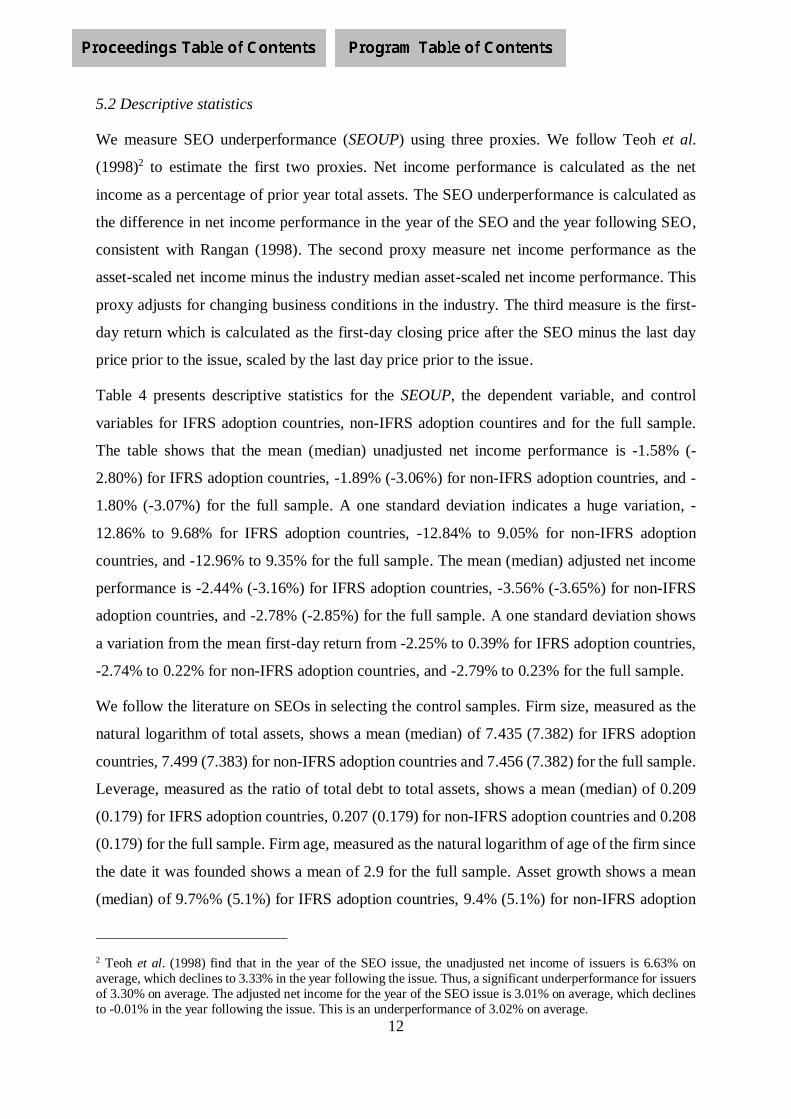
12
5.2 Descriptive statistics
We measure SEO underperformance (SEOUP) using three proxies. We follow Teoh et al.
(1998)2 to estimate the first two proxies. Net income performance is calculated as the net
income as a percentage of prior year total assets. The SEO underperformance is calculated as
the difference in net income performance in the year of the SEO and the year following SEO,
consistent with Rangan (1998). The second proxy measure net income performance as the
asset-scaled net income minus the industry median asset-scaled net income performance. This
proxy adjusts for changing business conditions in the industry. The third measure is the first-
day return which is calculated as the first-day closing price after the SEO minus the last day
price prior to the issue, scaled by the last day price prior to the issue.
Table 4 presents descriptive statistics for the SEOUP, the dependent variable, and control
variables for IFRS adoption countries, non-IFRS adoption countires and for the full sample.
The table shows that the mean (median) unadjusted net income performance is -1.58% (-
2.80%) for IFRS adoption countries, -1.89% (-3.06%) for non-IFRS adoption countries, and -
1.80% (-3.07%) for the full sample. A one standard deviation indicates a huge variation, -
12.86% to 9.68% for IFRS adoption countries, -12.84% to 9.05% for non-IFRS adoption
countries, and -12.96% to 9.35% for the full sample. The mean (median) adjusted net income
performance is -2.44% (-3.16%) for IFRS adoption countries, -3.56% (-3.65%) for non-IFRS
adoption countries, and -2.78% (-2.85%) for the full sample. A one standard deviation shows
a variation from the mean first-day return from -2.25% to 0.39% for IFRS adoption countries,
-2.74% to 0.22% for non-IFRS adoption countries, and -2.79% to 0.23% for the full sample.
We follow the literature on SEOs in selecting the control samples. Firm size, measured as the
natural logarithm of total assets, shows a mean (median) of 7.435 (7.382) for IFRS adoption
countries, 7.499 (7.383) for non-IFRS adoption countries and 7.456 (7.382) for the full sample.
Leverage, measured as the ratio of total debt to total assets, shows a mean (median) of 0.209
(0.179) for IFRS adoption countries, 0.207 (0.179) for non-IFRS adoption countries and 0.208
(0.179) for the full sample. Firm age, measured as the natural logarithm of age of the firm since
the date it was founded shows a mean of 2.9 for the full sample. Asset growth shows a mean
(median) of 9.7%% (5.1%) for IFRS adoption countries, 9.4% (5.1%) for non-IFRS adoption
2 Teoh et al. (1998) find that in the year of the SEO issue, the unadjusted net income of issuers is 6.63% on
average, which declines to 3.33% in the year following the issue. Thus, a significant underperformance for issuers
of 3.30% on average. The adjusted net income for the year of the SEO issue is 3.01% on average, which declines
to -0.01% in the year following the issue. This is an underperformance of 3.02% on average.

13
countries, and 9.6% (5.1%) for the full sample. Tangibility, measured as the ratio of gross PPE
to total assets, shows that gross PPE forms about 52.3% of total assets for the full sample. Asset
turnover is estimated as sales divided by total assets of the firm and this shows very high mean
values of 83.8% for our full sample. Cash balance, measured as cash and short-term investment
scaled by total assets, shows a mean (median) value of 13.2% (9%) for the full sample. The
descriptive statistics also show that about 5% of SEOs for our full sample occurred during the
global financial crisis period.
GDP growth, as a country-level variable, shows a mean (median) percentage growth of 2.6%
(2.6%) for IFRS adoption countries, 4.2% (3.3%) for non-IFRS adoption countries, and 3.1%
(2.6%) for the full sample. The mean (median) score for the level of enforcement is 7.7 (8.0)
for IFRS adoption countries, 6.6 (7.0) for non-IFRS adoption countries, and 7.4 (8.0) for the
full sample.
(insert Table 4 about here)
Table 5 reports the Pearson correlation matrix among the variables for our full sample of 29,534
SEOs. The table shows a range of 0.001 to 0.849. This indicates a low level of correlation
among our test variables. The results show that the correlation between SEO underperformance
and IFRS is significant at 0.05 or better. We find IFRS adoption is significantly correlated with
all the variables except abnormal accruals. The unadjusted net income is significantly
correlated with all the variables except first-day return, age, tangibility, GDP growth, and level
of enforcement. The adjusted net income is significantly correlated with all the variables except
first-day return, offer size, and level of enforcement. First-day return is significantly correlated
with just about half of the variables.
(insert Table 5 about here)
5.3 Main Results
The results of our test of Hypothesis 1 (mandatory adoption of IFRS reduces SEO
underperformance) are reported in Table 6. The table reports the coefficients and p-values from
the regression models for Models 1-3 based on the difference-in-difference design. Model 1 is
estimated using the unadjusted net income, Model 2 uses the industry adjusted net income, and
Model 3 reports on the first-day return. All three models use non-IFRS adoption countries as
the benchmark sample. The intercept represents the change in the pre-period for non-IFRS

14
adoption countries. Our results show that the coefficient on Time*Mandatory for Model 1 is
positive and significant (p < 0.05). This indicates a decrease in SEO underperformance after
adoption of IFRS. The decrease in underperformance is economically significant at 21% on
average.3 In Model 2, the coefficient on Time*Mandatory is positive and significant (p < 0.01),
indicating a decrease in underperformance. The decrease in underperformance is economically
significant at 44% on average.4 Model 3 also shows a significant positive coefficient on
Time*Mandatory (p < 0.01) and is economically significant at 8% on average.5
The results for the control variables are largely consistent with prior studies on SEOs. Our
results indicate that SEO underperformance is significantly lower for larger firms, firms with
higher assets growth, higher capital expenditure, higher assets turnover, higher market-to-book
ratio, higher market value, bigger offer size, and firms from strong enforcement countries. On
the other hand, the results show that SEO underperformance increases for older firms, firms
with higher tangibility, higher cash balances, higher abnormal accruals, and during the global
financial crisis period. The control variables age, cash balances, asset turnover, market value,
offer size, and level of enforcement are consistent across Models 1-3.
(insert Table 6 about here)
We report our results for Hypothesis 2 in Tables 7 and 8 by applying Equation 1 and reporting
results separately for strong enforcement and weak enforcement. Hypothesis 2 discusses how
adoption of IFRS reinforces the effect of the level of enforcement in reducing SEO
underperformance. Table 7 examines the impact of adoption of IFRS on SEO
underperformance for strong enforcement countries. Model 1 shows a positive and significant
coefficient on Time*Mandatory (p < 0.05) which indicates a decrease in underperformance.
All the variables under Model 1 are significant except offer size. The coefficient on
Time*Mandatory is positive and highly significant (p < 0.01) and the coefficient in Model 3 is
marginally significant.
(insert Table 7 about here)
3 21% = 0.6/-2.804, where 0.6 is the coefficient of Time*Mandatory in Model 1 of Table 6 and -2.804 is the
median value of unadjusted net income for IFRS adoption countries in Table 4.
4 44% = 1.4/-3.159, where 1.4 is the coefficient of Time*Mandatory in Model 2 of Table 6 and -3.159 is the
median value of adjusted net income for IFRS adoption countries in Table 4.
5 11% = 0.151/-1.791, where 0.151 is the coefficient of Time*Mandatory in Model 3 of Table 6 and -1.791 is the
median value of the first-day return for IFRS adoption countries in Table 4.

15
Table 8 examines the impact of adoption of IFRS on SEO underperformance for low
enforcement countries. The coefficients on Time*Mandatory for Models 1-3 are not significant.
(insert Table 8 about here)
Analysis of the difference in coefficients for Time*Mandatory in Model 1 for strong
enforcement and weak enforcement is positive and significant (mean = 0.006, p < 0.01). This
indicates that adoption of IFRS is associated with a decrease in underperformance for firms in
countries with strong enforcement and this decrease in underperformance is economically
significant at 21% on average.6 In Model 2 of Table 7 and 8, the difference in the coefficient
on Time*Mandatory is positive and significant (mean = 0.006, p < 0.01) which suggests that
adoption of IFRS is associated with a decrease in underperformance for firms in strong
enforcement countries. The decrease is economically significant at 19% on average.7 In Model
3 of Table 7 and 8, the difference in the coefficient on Time*Mandatory is more positive and
significant (mean = 0.179, p < 0.01) which suggests that adoption of IFRS is associated with a
decrease in underperformance for firms in strong enforcement countries. The decrease is
economically significant at 10% on average.8
6. Additional analyses
We repeat our analysis in Table 6 using alternative research design and measures of SEO
underperformance. First, we use a propensity score match (PSM) of firms in IFRS adoption
countries matched with firms in non-IFRS adoption countries. In this PSM approach, we match
the treatment firms (firms in IFRS adoption countries) with the control firms (firms in non-
IFRS adoption countries) on firm size, performance, and leverage. We require both treatment
and control firms to be in the same industry and year. We use matching with replacement to
reduce the differences that may exist between the matched sample and the treatment sample
after the matching. The second approach measures the asset-scaled performance of the
treatment sample (firms in IFRS adoption countries) minus the asset-scaled performance of
matched sample (firms in non-IFRS adoption countries). We matched the samples across firm
6 21% = 0.6/-2.804, where 0.6 (0.7-0.1 = 0.6) is the difference in coefficients in Model 1 for Time*Mandatory in
Tables 7 and 8 and -2.804 is the median value of unadjusted net income for IFRS adoption countries in Table 4.
7 19% = 0.6/-3.159, where 0.6 (1.5-0.9 = 0.6) is the difference in coefficients in Model 2 for Time*Mandatory in
Tables 7 and 8 and -3.159 is the median value of adjusted net income for IFRS adoption countries in Table 4.
8 10% = 0.179/-1.791, where 0.179 (0.102+0.077 = 0.179) is the difference in coefficients in Model 3 for
Time*Mandatory in Tables 7 and 8 and -1.791 is the median value of the first-day return for IFRS adoption
countries in Table 4.
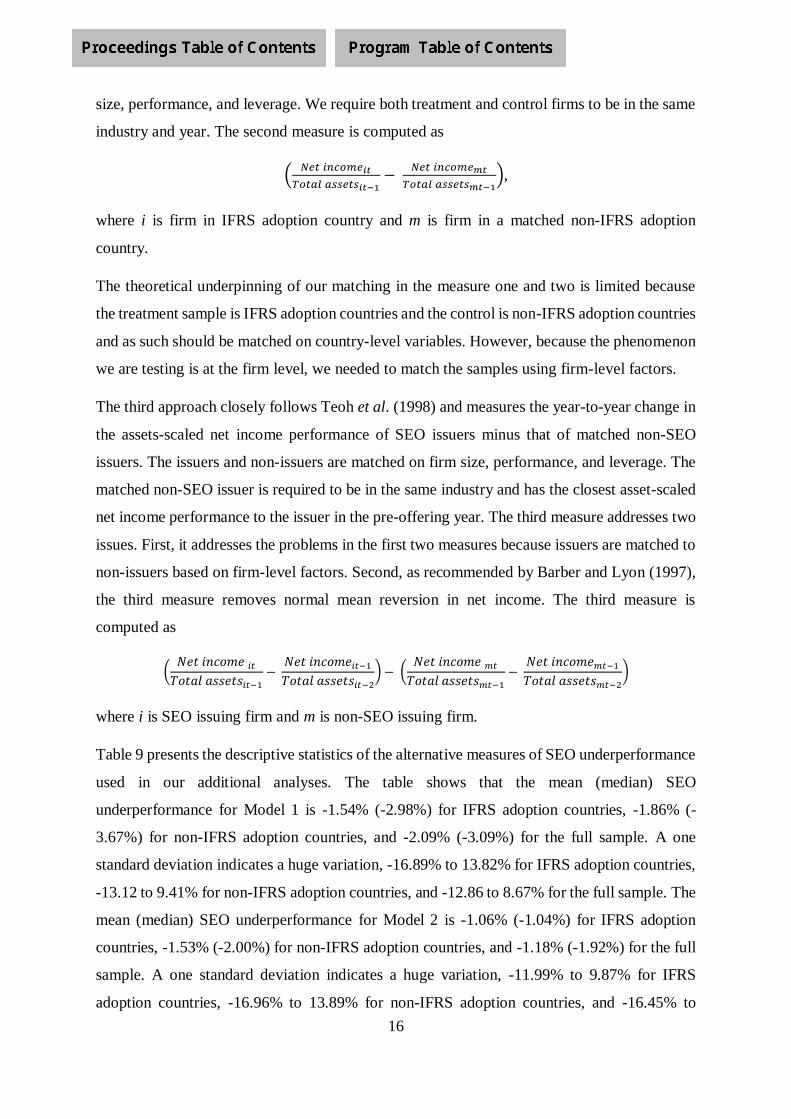
16
size, performance, and leverage. We require both treatment and control firms to be in the same
industry and year. The second measure is computed as
(𝑁𝑒𝑡 𝑖𝑛𝑐𝑜𝑚𝑒𝑖𝑡
𝑇𝑜𝑡𝑎𝑙 𝑎𝑠𝑠𝑒𝑡𝑠𝑖𝑡−1−
𝑁𝑒𝑡 𝑖𝑛𝑐𝑜𝑚𝑒𝑚𝑡
𝑇𝑜𝑡𝑎𝑙 𝑎𝑠𝑠𝑒𝑡𝑠𝑚𝑡−1),
where i is firm in IFRS adoption country and m is firm in a matched non-IFRS adoption
country.
The theoretical underpinning of our matching in the measure one and two is limited because
the treatment sample is IFRS adoption countries and the control is non-IFRS adoption countries
and as such should be matched on country-level variables. However, because the phenomenon
we are testing is at the firm level, we needed to match the samples using firm-level factors.
The third approach closely follows Teoh et al. (1998) and measures the year-to-year change in
the assets-scaled net income performance of SEO issuers minus that of matched non-SEO
issuers. The issuers and non-issuers are matched on firm size, performance, and leverage. The
matched non-SEO issuer is required to be in the same industry and has the closest asset-scaled
net income performance to the issuer in the pre-offering year. The third measure addresses two
issues. First, it addresses the problems in the first two measures because issuers are matched to
non-issuers based on firm-level factors. Second, as recommended by Barber and Lyon (1997),
the third measure removes normal mean reversion in net income. The third measure is
computed as
(𝑁𝑒𝑡 𝑖𝑛𝑐𝑜𝑚𝑒 𝑖𝑡
𝑇𝑜𝑡𝑎𝑙 𝑎𝑠𝑠𝑒𝑡𝑠𝑖𝑡−1
− 𝑁𝑒𝑡 𝑖𝑛𝑐𝑜𝑚𝑒𝑖𝑡−1
𝑇𝑜𝑡𝑎𝑙 𝑎𝑠𝑠𝑒𝑡𝑠𝑖𝑡−2
) − (𝑁𝑒𝑡 𝑖𝑛𝑐𝑜𝑚𝑒 𝑚𝑡
𝑇𝑜𝑡𝑎𝑙 𝑎𝑠𝑠𝑒𝑡𝑠𝑚𝑡−1
− 𝑁𝑒𝑡 𝑖𝑛𝑐𝑜𝑚𝑒𝑚𝑡−1
𝑇𝑜𝑡𝑎𝑙 𝑎𝑠𝑠𝑒𝑡𝑠𝑚𝑡−2
)
where i is SEO issuing firm and m is non-SEO issuing firm.
Table 9 presents the descriptive statistics of the alternative measures of SEO underperformance
used in our additional analyses. The table shows that the mean (median) SEO
underperformance for Model 1 is -1.54% (-2.98%) for IFRS adoption countries, -1.86% (-
3.67%) for non-IFRS adoption countries, and -2.09% (-3.09%) for the full sample. A one
standard deviation indicates a huge variation, -16.89% to 13.82% for IFRS adoption countries,
-13.12 to 9.41% for non-IFRS adoption countries, and -12.86 to 8.67% for the full sample. The
mean (median) SEO underperformance for Model 2 is -1.06% (-1.04%) for IFRS adoption
countries, -1.53% (-2.00%) for non-IFRS adoption countries, and -1.18% (-1.92%) for the full
sample. A one standard deviation indicates a huge variation, -11.99% to 9.87% for IFRS
adoption countries, -16.96% to 13.89% for non-IFRS adoption countries, and -16.45% to
17
14.09% for the full sample. For Model 3, the mean (median) is -0.28% (-0.26%) for SEO
issuers, -0.22% (-0.22%) for non-SEO issuers, and -0.24% (-0.25%) for the full sample. A one
standard deviation indicates a huge variation of -15.64% to 15.08% for SEO issuers, -15.47%
to 15.04% for non-SEO issuers, and -15.50% to 15.03% for the full sample.
(insert Table 9 about here)
Table 10 reports on the alternative measures of SEO underperformance. The table reports the
coefficients and p-values from the regression models for Models 1-3. Model 1 is estimated
using a PSM sample of firms in IFRS adoption countries and a matched sample of firms in
non-IFRS adoption countries. Model 2 is also estimated using a PSM of a sample of firms in
IFRS adoption countries (treatment) and a matched sample of firms in non-IFRS adoption
countries but calculates the difference in the asset scaled net-income performance of the
treatment and the matched sample. Model 3 measures the difference in the year-to-year change
in asset-scaled net income performance of SEO issuers and non-SEO issuers. The results show
that the coefficient on Time*Mandatory of Model 1 is positive and significant (p < 0.01). This
indicates a decrease in SEO underperformance after adoption of IFRS. The decrease in
underperformance is economically significant at 10% on average.9 The coefficient on
Time*Mandatory in Model 2 and Issuer*Mandatory in Model 3 are not significant.
(insert Table 10 about here)
7. Conclusion
We use a difference-in-difference design and employ non-IFRS adoption countries as our
benchmark sample to explore whether (i) adoption of IFRS has an impact on SEO
underperformance (ii) adoption of IFRS reinforces the level of enforcement to impact a change
in SEO underperformance.
We show that adoption of IFRS leads to a statistically and economically significant reduction
in SEO underperformance. The improvements in information quality, transparency, and
additional disclosure requirements from adoption of IFRS reduce information asymmetry
among participants in SEO transactions. We find evidence that SEO underperformance reduces
for firms, following adoption of IFRS and the effect persists in countries with strong
enforcement than in weak enforcement countries. We also find evidence that the reduction of
9 10% = 0.3/-2.983, where 0.3 is the coefficient of Time*Mandatory in Model 1 of Table 10 and -2.983 is the
median value of Model 1 for IFRS adoption countries in Table 9.
18
SEO underperformance from adoption of IFRS ranges from 10% to 44%. We also find that the
choice of modelling and measure of SEO underperformance impact on the level of
underperformance economically, but robust statistically.
Our study contributes to the literature examining the economic importance of adoption of IFRS
on the capital market particularly during SEO transactions which, thus far, has been
predominantly on the US market with few studies on the UK, France and Canada. Considering
the level of globalisation, the internationalisation of firms, participation of investors in equity
issues across multiple countries, and the global acceptance of IFRS, research on single
countries provides limited evidence on the dynamics of SEO transaction. We thus use a cross-
country setting which offers a large sample to test the impact of adoption of IFRS on reducing
SEO underperformance.
Our study has potential implications. We confirm that firms can use accounting choices to
signal ‘good behaviour’ in the capital market and that enables investors to distinguish between
good and bad firms. Even though IFRS offers alternatives, we suggest that prior to SEO issues
firms should report accounting policies and choices that reflect quality financial information,
and this has the potential to reduce the level of SEO underperformance. We also suggest that
standard setters should continue to improve the disclosure requirements, especially accounting
policies that have alternatives and likely to be exploited by managers to mislead investors prior
to an SEO issue. The tightening of disclosure requirements would lead to richer financial
information for the capital market. Also, since IFRS and quality of enforcement are reinforcing
factors in reducing underperformance we recommend that regulators should continue to focus
on achieving regulatory improvements.

19
References
Ahmed, A. S., Neel, M., & Wang, D. (2013). Does mandatory adoption of IFRS improve
accounting quality? Preliminary evidence. Contemporary Accounting Research, 30(4),
1344-1372.
Ahmed, K., Chalmers, K., & Khlif, H. (2013). A meta-analysis of IFRS adoption effects.
International Journal of Accounting, 48(2), 173-217.
Ashbaugh, H. (2001). Non-US firms' accounting standard choices. Journal of Accounting and
Public Policy, 20(2), 129-153.
Ashbaugh, H., & Pincus, M. (2001). Domestic accounting standards, international accounting
standards, and the predictability of earnings. Journal of Accounting Research, 39(3),
417-434.
Barber, B. M., & Lyon, J. D. (1997). Detecting long-run abnormal stock returns: The empirical
power and specification of test statistics. Journal of Financial Economics, 43(3), 341-
372.
Bar-Gill, O., & Bebchuk, L. (2002). Misreporting corporate performance. Harvard Law and
Economics, Available at SSRN: http://dx.doi.org/10.2139/ssrn.354141.
Barth, M. E., Landsman, W. R., Lang, M., & Williams, C. (2012). Are IFRS-based and US
GAAP-based accounting amounts comparable? Journal of Accounting and Economics,
54(1), 68-93.
Bhattacharya, U., Daouk, H., & Welker, M. (2003). The world price of earnings opacity.
Accounting Review, 78(3), 641-678.
Brochet, F., Jagolinzer, A. D., & Riedi, E. J. (2013). Mandatory IFRS adoption and financial
statement comparability. Contemporary Accounting Research, 30(4), 1373-1400.
Brown, P., Preiato, J., & Tarca, A. (2014). Measuring country differences in enforcement of
accounting standards: An audit and enforcement proxy. Journal of Business Finance &
Accounting, 41(1-2), 1-52.
Burgstahler, D. C., Hail, L., & Leuz, C. (2006). The importance of reporting incentives:
Earnings management in European private and public firms. Accounting Review, 81(5),
983-1016.
Bushman, R. M., Piotroski, J. D., & Smith, A. J. (2004). What determines corporate
transparency? Journal of Accounting Research, 42(2), 207-252.
Byard, D., Li, Y., & Yu, Y. (2011). The effect of mandatory IFRS adoption on financial
analysts’ information environment. Journal of Accounting Research, 49(1), 69-96.
Christensen, H. B., Hail, L., & Leuz, C. (2013). Mandatory IFRS reporting and changes in
enforcement. Journal of Accounting and Economics, 56(2-3), 147-177.
Cohen, D. A., & Zarowin, P. (2010). Accrual-based and real earnings management activities
around seasoned equity offerings. Journal of Accounting and Economics, 50(1), 2-19.
Daske, H., Hail, L., Leuz, C., & Verdi, R. (2008). Mandatory IFRS reporting around the world:
early evidence on the economic consequences. Journal of Accounting Research, 46(5),
1085-1142.
DeFond, M. L., Hung, M., Li, S., & Li, Y. (2014). Does mandatory IFRS adoption affect crash
risk?. The Accounting Review, 90(1), 265-299.
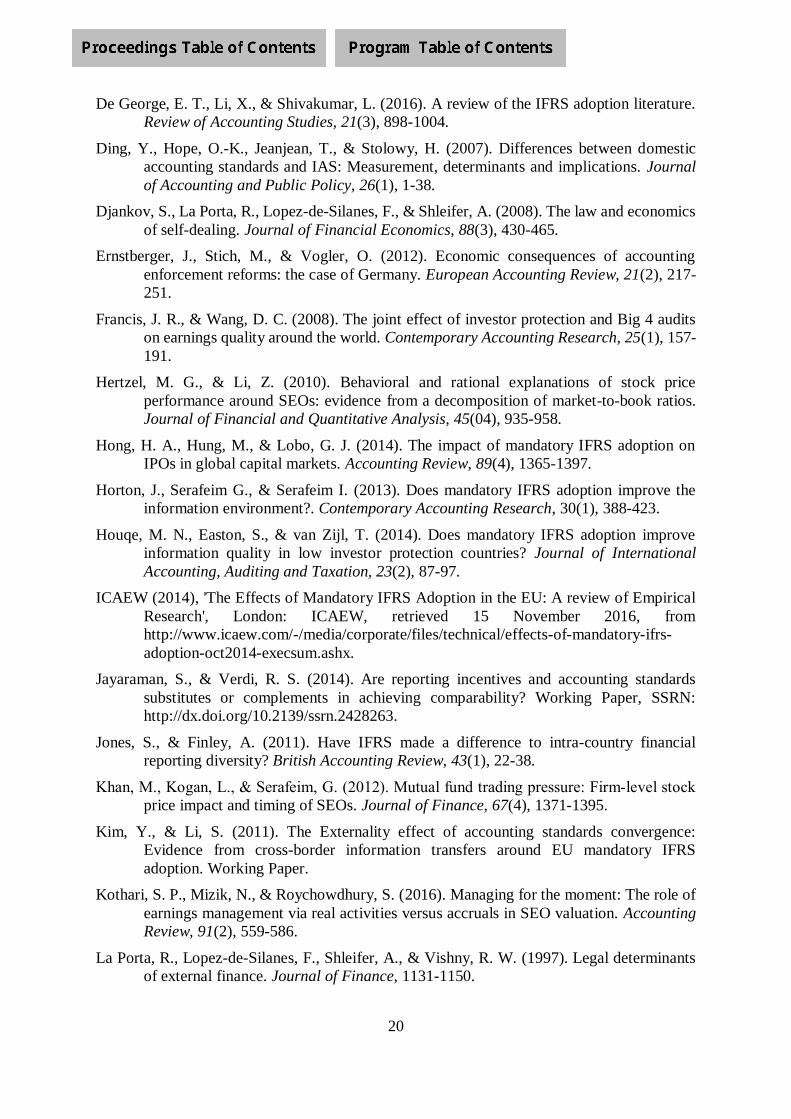
20
De George, E. T., Li, X., & Shivakumar, L. (2016). A review of the IFRS adoption literature.
Review of Accounting Studies, 21(3), 898-1004.
Ding, Y., Hope, O.-K., Jeanjean, T., & Stolowy, H. (2007). Differences between domestic
accounting standards and IAS: Measurement, determinants and implications. Journal
of Accounting and Public Policy, 26(1), 1-38.
Djankov, S., La Porta, R., Lopez-de-Silanes, F., & Shleifer, A. (2008). The law and economics
of self-dealing. Journal of Financial Economics, 88(3), 430-465.
Ernstberger, J., Stich, M., & Vogler, O. (2012). Economic consequences of accounting
enforcement reforms: the case of Germany. European Accounting Review, 21(2), 217-
251.
Francis, J. R., & Wang, D. C. (2008). The joint effect of investor protection and Big 4 audits
on earnings quality around the world. Contemporary Accounting Research, 25(1), 157-
191.
Hertzel, M. G., & Li, Z. (2010). Behavioral and rational explanations of stock price
performance around SEOs: evidence from a decomposition of market-to-book ratios.
Journal of Financial and Quantitative Analysis, 45(04), 935-958.
Hong, H. A., Hung, M., & Lobo, G. J. (2014). The impact of mandatory IFRS adoption on
IPOs in global capital markets. Accounting Review, 89(4), 1365-1397.
Horton, J., Serafeim G., & Serafeim I. (2013). Does mandatory IFRS adoption improve the
information environment?. Contemporary Accounting Research, 30(1), 388-423.
Houqe, M. N., Easton, S., & van Zijl, T. (2014). Does mandatory IFRS adoption improve
information quality in low investor protection countries? Journal of International
Accounting, Auditing and Taxation, 23(2), 87-97.
ICAEW (2014), 'The Effects of Mandatory IFRS Adoption in the EU: A review of Empirical
Research', London: ICAEW, retrieved 15 November 2016, from
http://www.icaew.com/-/media/corporate/files/technical/effects-of-mandatory-ifrs-
adoption-oct2014-execsum.ashx.
Jayaraman, S., & Verdi, R. S. (2014). Are reporting incentives and accounting standards
substitutes or complements in achieving comparability? Working Paper, SSRN:
http://dx.doi.org/10.2139/ssrn.2428263.
Jones, S., & Finley, A. (2011). Have IFRS made a difference to intra-country financial
reporting diversity? British Accounting Review, 43(1), 22-38.
Khan, M., Kogan, L., & Serafeim, G. (2012). Mutual fund trading pressure: Firm‐level stock
price impact and timing of SEOs. Journal of Finance, 67(4), 1371-1395.
Kim, Y., & Li, S. (2011). The Externality effect of accounting standards convergence:
Evidence from cross-border information transfers around EU mandatory IFRS
adoption. Working Paper.
Kothari, S. P., Mizik, N., & Roychowdhury, S. (2016). Managing for the moment: The role of
earnings management via real activities versus accruals in SEO valuation. Accounting
Review, 91(2), 559-586.
La Porta, R., Lopez-de-Silanes, F., Shleifer, A., & Vishny, R. W. (1997). Legal determinants
of external finance. Journal of Finance, 1131-1150.

21
La Porta, R., Lopez-de-Silanes, F., Shleifer, A., & Vishny, R. W. (1998). Law and finance.
Journal of Political Economy, 106(6), 1113-1155.
Lang, M., Smith Raedy, J., & Wilson, W. (2006). Earnings management and cross listing: Are
reconciled earnings comparable to US earnings? Journal of Accounting and Economics,
42(1-2), 255-283.
Leuz, C. (2010). Different approaches to corporate reporting regulation: How jurisdictions
differ and why. Accounting and Business Research, 40(3), 229-256.
Loughran, T., & Ritter, J. R. (1995). The new issues puzzle. Journal of Finance, 50(1), 23-51.
Loughran, T., & Ritter, J. R. (1997). The operating performance of firms conducting seasoned
equity offerings. Journal of Finance, 52(5), 1823-1850.
Rangan, S. (1998). Earnings management and the performance of seasoned equity offerings.
Journal of Financial Economics, 50(1), 101-122.
Shivakumar, L. (2000). Do firms mislead investors by overstating earnings before seasoned
equity offerings? Journal of Accounting and Economics, 29(3), 339-371.
Singleton-Green, B. (2015). The effects of mandatory IFRS adoption in the EU: A review of
empirical research. Available at SSRN: https://ssrn.com/abstract=2515391.
Teoh, S. H., Welch, I., & Wong, T. J. (1998). Earnings management and the underperformance
of seasoned equity offerings. Journal of Financial Economics, 50(1), 63-99.

22
Table 1: Variable definitions
Variable Description
Dependent variables
Unadjusted net income performance
The difference between the asset-scaled net income on the year of SEO and the year following an SEO (Teo et al., 1998).
Adjusted net income
performance
Asset scales net income minus the industry median asset-scaled net income (Teo et al.,
1998).
First-day return First day closing price after an SEO minus the last day price prior to an SEO, scaled by
the last day price prior to the SEO.
PSM of IFRS and non-
IFRS adoption countries
PSM of firms in IFRS adoption countries matched based on size, leverage, performance,
industry, and year to firms in non-IFRS adoption countries.
PSM of the difference in
IFRS and non-IFRS
adoption countries
The asset-scaled-net income performance of firms in IFRS adoption countries minus the
asset-scaled performance of matched sample of firms in non-IFRS adoption countries. The
PSM is applied by matching on size, leverage, performance, industry, and year.
Year-to-year change in
net income performance
Year-to-year change in asset-scaled net income performance of an SEO issuer minus the
that of a matched non-SEO issuer. Issuers and non-issuers are matched based on size,
leverage, performance, industry, and year.
Test variables Post Dummy is 1 if an SEO occurs in the post-adoption period.
Man Dummy is 1 if an SEO is in an IFRS adoption country.
Firm-level control variables
Size Natural logarithm of total assets for a firm.
Leverage The ratio of total debt to total assets.
Age Natural logarithm of firm age from the date it was founded.
Asset growth Growth rate of assets.
Tangibility The ratio of gross property, plant, and equipment and total assets.
Capital expenditure The ratio of capital expenditure to total assets.
Cash to total assets Cash and short-term investment divided by total assets.
Asset turnover The ratio of sales to total assets.
Abnormal accruals Total accruals minus predicted accruals based on Francis and Wang (2008).
Market-to-book Total assets minus equity plus common shares outstanding multiplied by price, divided
by total assets.
Market value Natural logarithm of market value of a firm.
Offer size Offered shares divided by total shares outstanding prior to the offer.
Country-level control variables
GDP (%) GDP growth, defined as GDP for the year minus GDP for previous year, scale by previous year's GDP.
Level of enforcement The strength of investor protection based on estimates of the World Economic Forum in
a range from 1 for weak and 10 for strong governance. Other variables Global financial crisis Dummy is 1 if an SEO occurs in the global financial crisis year, 2008.
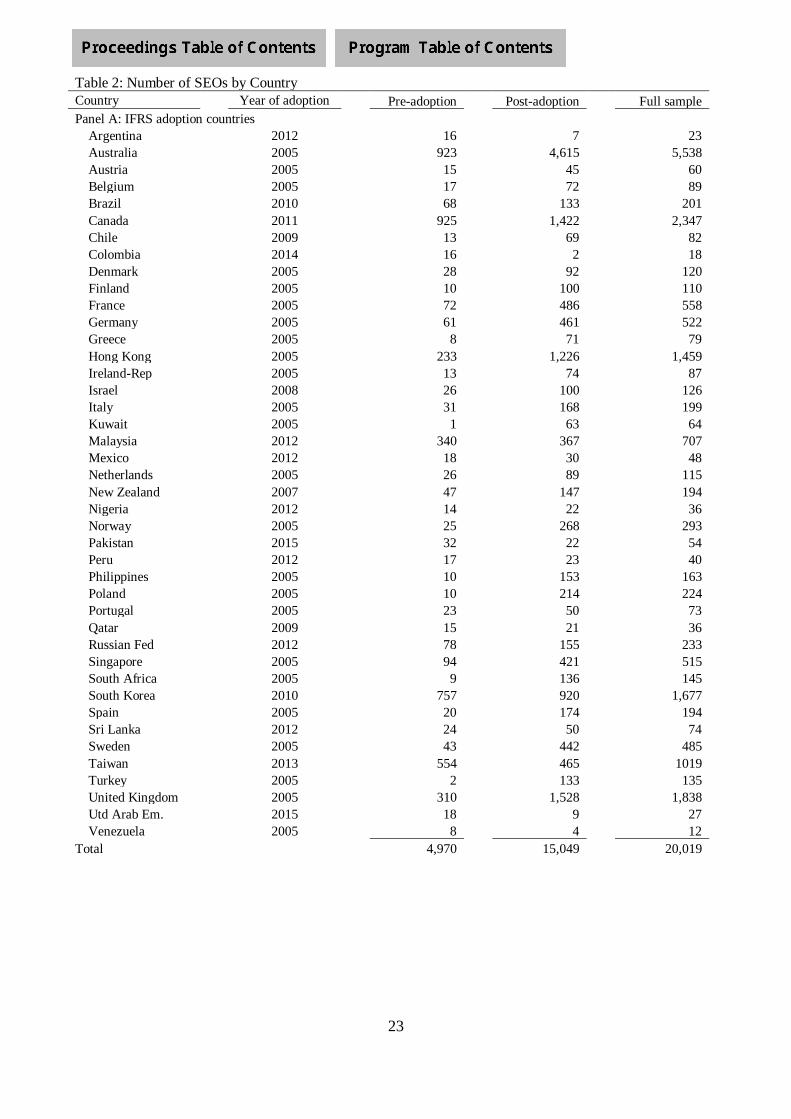
23
Table 2: Number of SEOs by Country
Country Year of adoption Pre-adoption Post-adoption Full sample
Panel A: IFRS adoption countries Argentina 2012 16 7 23
Australia 2005 923 4,615 5,538
Austria 2005 15 45 60
Belgium 2005 17 72 89
Brazil 2010 68 133 201
Canada 2011 925 1,422 2,347
Chile 2009 13 69 82
Colombia 2014 16 2 18
Denmark 2005 28 92 120
Finland 2005 10 100 110
France 2005 72 486 558
Germany 2005 61 461 522
Greece 2005 8 71 79
Hong Kong 2005 233 1,226 1,459
Ireland-Rep 2005 13 74 87
Israel 2008 26 100 126
Italy 2005 31 168 199
Kuwait 2005 1 63 64
Malaysia 2012 340 367 707
Mexico 2012 18 30 48
Netherlands 2005 26 89 115
New Zealand 2007 47 147 194
Nigeria 2012 14 22 36
Norway 2005 25 268 293
Pakistan 2015 32 22 54
Peru 2012 17 23 40
Philippines 2005 10 153 163
Poland 2005 10 214 224
Portugal 2005 23 50 73
Qatar 2009 15 21 36
Russian Fed 2012 78 155 233
Singapore 2005 94 421 515
South Africa 2005 9 136 145
South Korea 2010 757 920 1,677
Spain 2005 20 174 194
Sri Lanka 2012 24 50 74
Sweden 2005 43 442 485
Taiwan 2013 554 465 1019
Turkey 2005 2 133 135
United Kingdom 2005 310 1,528 1,838
Utd Arab Em. 2015 18 9 27
Venezuela 2005 8 4 12
Total 4,970 15,049 20,019

24
Table 2 continued
Country Pre-adoption Post-adoption Full sample
Panel B: Non-IFRS adoption countries Bermuda 8 43 51
China 20 2,478 2,498
Egypt 3 130 133
India 23 1,235 1,258
Indonesia 34 204 238
Japan 535 1,217 1,752
Switzerland 17 136 153
Thailand 32 211 243
United States 615 2,574 3,189
Total 1,287 8,228 9,515
Notes: This table presents the sample distribution of the number of SEOs by country. The table reports the distribution for
pre-IFRS adoption period, post-IFRS adoption period, and for the full sample. Panel A shows the distribution of the number
of SEOs for IFRS adoption countries and Panel B shows the number of SEOs for non-IFRS adoption countries. We determine
the IFRS adoption countries and the year of adoption as the date IFRS reporting became mandatory by relying on information
published on Deloitte’s IAS Plus website (www.iasplus.com), IFRS website (www.ifrs.org), and the websites of the various
stock exchanges. Our sample consists of 29,534 SEOs across 51 countries over the period 1992 to 2017.

25
Table 3: Number of SEOs by Year
Year IFRS adoption Non-IFRS adoption Full sample
1992 3 4 7
1993 7 4 11
1994 23 7 30
1995 27 28 55
1996 59 55 114
1997 84 69 153
1998 104 66 170
1999 181 95 276
2000 254 120 374
2001 276 107 383
2002 421 161 582
2003 528 217 745
2004 597 354 951
2005 623 338 961
2006 769 351 1,120
2007 1,116 364 1,480
2008 1,064 334 1,398
2009 1,589 620 2,209
2010 1,657 704 2,361
2011 1,583 583 2,166
2012 1,469 603 2,072
2013 1,615 789 2,404
2014 1,580 828 2,408
2015 1,720 1,132 2,852
2016 1,785 1,091 2,876
2017 885 491 1,376
Total 20,019 9,515 29,534
Notes: This table reports the distribution of the number of SEOs by year. The table reports distribution for IFRS adoption
countries, non-IFRS adoption countries, and for the full sample. Our sample consists of 29,534 SEOs across 51 countries over the period 1992 to 2017.

26
Table 4: Descriptive statistics
Mean Median Stan. dev. Mean Median Stan. dev. Mean Median Stan. dev.
Variables N IFRS adoption Non-IFRS adoption Full sample
Net income to total assets (%) 29,534 -1.584 -2.804 11.261 -1.894 -3.060 10.948 -1.804 -3.067 11.158
Adj. NI to total assets (%) 29,534 -2.439 -3.159 14.906 -3.557 -3.653 15.400 -2.777 -2.852 11.155
First-day return 21,737 -1.103 -1.791 1.497 -1.260 -1.852 1.480 -1.283 -1.599 1.508
Size 29,534 7.435 7.382 3.218 7.499 7.383 3.117 7.456 7.382 3.185
Leverage 29,534 0.209 0.179 0.182 0.207 0.179 0.180 0.208 0.179 0.181
Age 29,534 2.943 2.908 0.393 2.932 2.908 0.393 2.939 2.908 0.393
Asset growth 29,534 0.097 0.051 0.222 0.094 0.051 0.219 0.096 0.051 0.221
Tangibility 29,534 0.522 0.479 0.352 0.524 0.479 0.350 0.523 0.479 0.351
Capital expenditure 29,534 3.933 3.957 3.444 4.007 3.957 3.343 3.957 3.957 3.411
Cash to total assets 29,534 0.133 0.090 0.128 0.132 0.090 0.126 0.132 0.090 0.128
Asset turnover 29,534 0.838 0.752 0.582 0.837 0.755 0.574 0.838 0.752 0.580
Abnormal accruals 29,534 0.002 0.002 0.120 0.001 0.002 0.116 0.002 0.002 0.118
Market-to-book 29,534 5.313 5.203 2.457 5.429 5.203 2.467 5.351 5.203 2.461
Market value 29,534 4.092 4.004 2.051 5.509 5.707 1.968 4.564 4.433 2.131
Offer size 29,534 0.277 0.199 0.670 0.212 0.199 0.603 0.255 0.199 0.649
Global financial crisis 29,534 0.053 0.000 0.224 0.035 0.000 0.184 0.047 0.000 0.212
GDP (%) 29,534 2.559 2.570 2.471 4.180 3.345 3.384 3.081 2.609 2.899
Level of enforcement 29,534 7.744 8.000 1.167 6.583 7.000 2.459 7.357 8.000 1.795
Notes: This table reports the descriptive statistics for IFRS adoption countries, non-IFRS adoption countries, and for the full sample. All variables are described in Table 1.

27
Notes: This table reports the Pearson correlation matrix for all the variables. The total sample size is 29,534. * indicates significance
at 0.05 or better. All variables are defined in Table 1.
Table 5: Pearson correlation matrix
Variables (1) (2) (3) (4) (5) (6) (7) (8) (9)
1 IFRS 2 Unadj. net income 0.022* 3 Adj. net income 0.017* 0.609* 4 First-day return 0.010* 0.004 0.004 5 Size 0.019* 0.328* 0.160* 0.017* 6 Leverage -0.031* -0.112* -0.113* 0.010 0.220* 7 Age -0.104* -0.001 -0.036* -0.015* 0.289* 0.070* 8 Asset growth 0.013* 0.252* 0.164* 0.008 0.029* -0.025* -0.130* 9 Tangibility -0.040* -0.003 -0.051* 0.005 0.187* 0.251* 0.218* -0.168*
10 Capital expenditure 0.021* 0.303* 0.137* 0.014* 0.849* 0.213* 0.226* 0.073* 0.277*
11 Cash to total assets 0.047* -0.047* 0.013* -0.016* -0.172* -0.388* -0.149* 0.112* -0.321*
12 Asset turnover 0.038* 0.298* 0.105* -0.006 0.156* 0.001 0.058* -0.057* -0.026*
13 Abnormal accruals -0.001 -0.308* -0.203* -0.010 0.063* -0.032* -0.015* 0.236* -0.065*
14 Market-to-book 0.045* 0.330* -0.220* 0.004 -0.148* 0.531* 0.049* -0.059* 0.049*
15 Market value 0.248* 0.028* 0.012* 0.108* 0.044* 0.006 0.021* 0.002 0.022*
16 Offer size 0.056* 0.023* 0.010 -0.078* -0.043* -0.008 -0.043* -0.019* -0.021*
17 Global financial crisis -0.022* -0.013* -0.011* 0.001 -0.002 0.017* 0.012* -0.012* 0.003
18 GDP (%) 0.587* 0.001 0.060* 0.041* -0.020* -0.006 -0.041* -0.003 -0.008
19 Level of enforcement 0.190* 0.011 0.009 0.063* -0.053* -0.001 0.007 0.013* -0.001
Variables (10) (11) (12) (13) (14) (15) (16) (17) (18)
11 Cash to total assets -0.166* 12 Asset turnover 0.113* -0.055* 13 Abnormal accruals 0.055* -0.032* 0.027* 14 Market-to-book -0.089* -0.170* 0.128* -0.122* 15 Market value 0.034* -0.017* 0.022* 0.005 0.066* 16 Offer size -0.048* 0.012* 0.092* 0.009 0.020* 0.065* 17 Global financial crisis 0.013* -0.007 0.031* -0.017* 0.002 -0.033* -0.008 18 GDP (%) -0.016* 0.002 -0.007 -0.008 0.025* 0.309* -0.092* -0.036* 19 Level of enforcement -0.037* -0.005 0.011 -0.002 0.010 -0.237* -0.047* 0.011 -0.251*
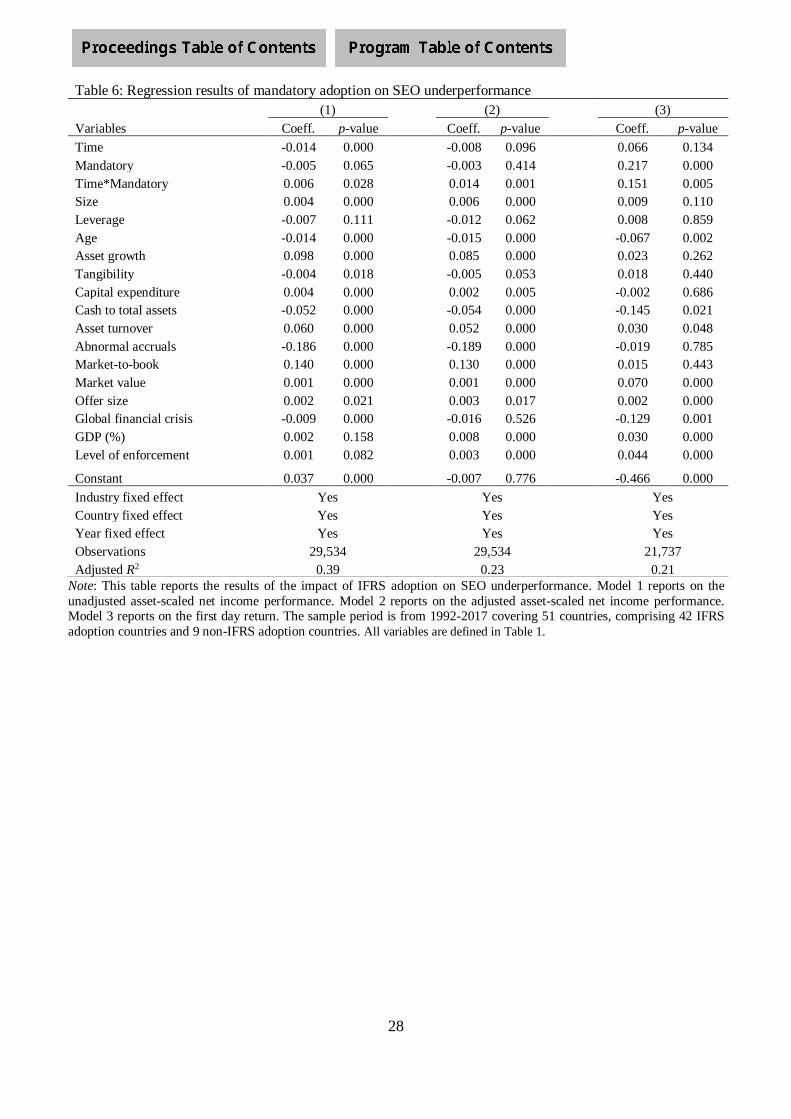
28
Note: This table reports the results of the impact of IFRS adoption on SEO underperformance. Model 1 reports on the
unadjusted asset-scaled net income performance. Model 2 reports on the adjusted asset-scaled net income performance. Model 3 reports on the first day return. The sample period is from 1992-2017 covering 51 countries, comprising 42 IFRS
adoption countries and 9 non-IFRS adoption countries. All variables are defined in Table 1.
Table 6: Regression results of mandatory adoption on SEO underperformance
(1) (2) (3)
Variables Coeff. p-value Coeff. p-value Coeff. p-value
Time -0.014 0.000 -0.008 0.096 0.066 0.134
Mandatory -0.005 0.065 -0.003 0.414 0.217 0.000
Time*Mandatory 0.006 0.028 0.014 0.001 0.151 0.005
Size 0.004 0.000 0.006 0.000 0.009 0.110
Leverage -0.007 0.111 -0.012 0.062 0.008 0.859
Age -0.014 0.000 -0.015 0.000 -0.067 0.002
Asset growth 0.098 0.000 0.085 0.000 0.023 0.262
Tangibility -0.004 0.018 -0.005 0.053 0.018 0.440
Capital expenditure 0.004 0.000 0.002 0.005 -0.002 0.686
Cash to total assets -0.052 0.000 -0.054 0.000 -0.145 0.021
Asset turnover 0.060 0.000 0.052 0.000 0.030 0.048
Abnormal accruals -0.186 0.000 -0.189 0.000 -0.019 0.785
Market-to-book 0.140 0.000 0.130 0.000 0.015 0.443
Market value 0.001 0.000 0.001 0.000 0.070 0.000
Offer size 0.002 0.021 0.003 0.017 0.002 0.000
Global financial crisis -0.009 0.000 -0.016 0.526 -0.129 0.001
GDP (%) 0.002 0.158 0.008 0.000 0.030 0.000
Level of enforcement 0.001 0.082 0.003 0.000 0.044 0.000
Constant 0.037 0.000 -0.007 0.776 -0.466 0.000
Industry fixed effect Yes Yes Yes
Country fixed effect Yes Yes Yes
Year fixed effect Yes Yes Yes
Observations 29,534 29,534 21,737
Adjusted R2 0.39 0.23 0.21

29
Table 7: Regression results of mandatory adoption on SEO underperformance for strong enforcement
(1) (2) (3)
Variables Coeff. p-value Coeff. p-value Coeff. p-value
Time -0.011 0.000 0.011 0.044 0.072 0.128
Mandatory -0.007 0.018 -0.003 0.471 0.096 0.127
Time*Mandatory 0.007 0.038 0.015 0.001 0.102 0.082
Size 0.002 0.000 0.006 0.000 0.008 0.267
Leverage -0.056 0.000 -0.005 0.491 0.040 0.524
Age -0.021 0.000 -0.014 0.000 -0.083 0.001
Asset growth 0.023 0.000 0.091 0.000 0.028 0.275
Tangibility -0.009 0.000 -0.004 0.199 0.039 0.150
Capital expenditure 0.006 0.000 0.002 0.017 -0.003 0.671
Cash to total assets -0.045 0.000 -0.065 0.000 -0.149 0.049
Asset turnover 0.052 0.000 0.055 0.000 -0.021 0.255
Abnormal accruals -0.216 0.000 -0.192 0.000 -0.003 0.890
Market-to-book 0.053 0.000 0.139 0.000 0.008 0.761
Market value 0.001 0.000 0.001 0.227 0.080 0.000
Offer size 0.001 0.448 0.005 0.001 0.003 0.000
Global financial crisis -0.012 0.000 -0.011 0.752 -0.149 0.002
GDP (%) 0.004 0.011 0.004 0.000 0.033 0.000
Level of enforcement 0.003 0.001 0.009 0.000 0.009 0.136
Constant 0.069 0.000 -0.071 0.049 -0.643 0.000
Industry fixed effect Yes Yes Yes
Country fixed effect Yes Yes Yes
Year fixed effect Yes Yes Yes
Observations 22,535 22,535 17,077
Adjusted R2 0.37 0.23 0.18
Note: This table reports the results of the impact of IFRS adoption on SEO underperformance for strong enforcement
countries. Model 1 reports on the unadjusted asset-scaled net income performance. Model 2 reports on the adjusted asset-
scaled net income performance. Model 3 reports on the first day return. The sample period is from 1992-2017 covering 51
countries, comprising 42 IFRS adoption countries and 9 non-IFRS adoption countries. There are 25 strong enforcement
countries. All variables are defined in Table 1.
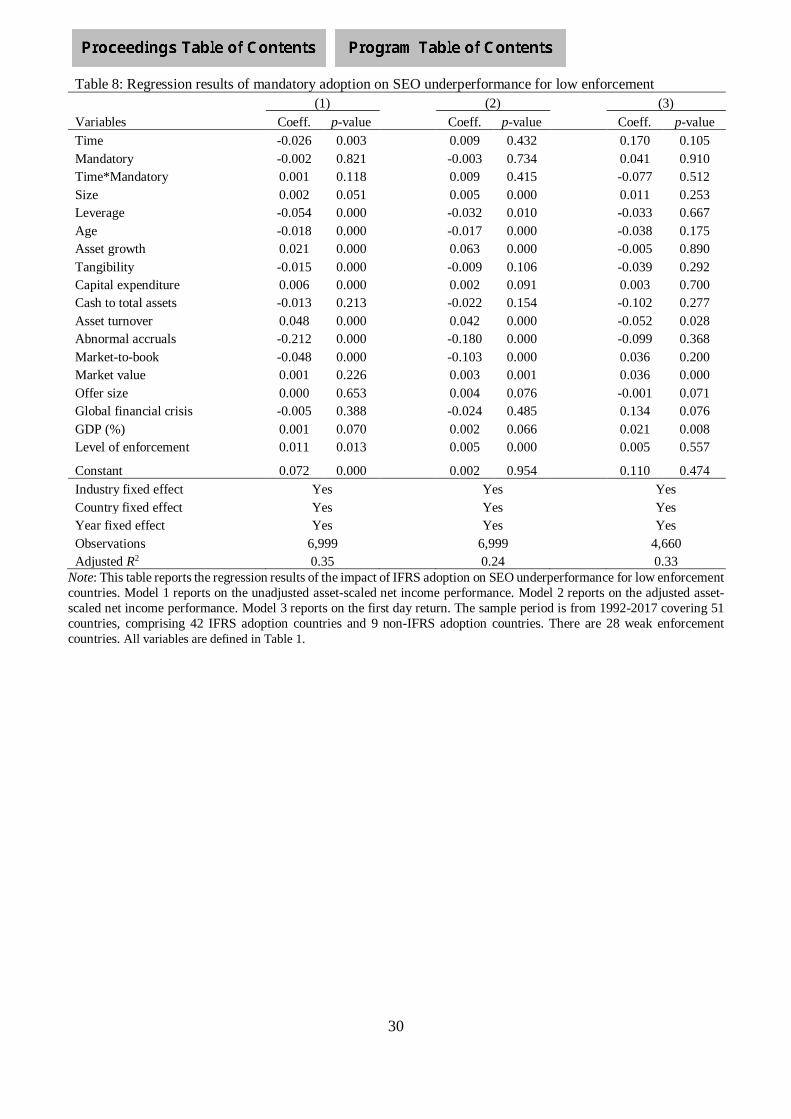
30
Table 8: Regression results of mandatory adoption on SEO underperformance for low enforcement
(1) (2) (3)
Variables Coeff. p-value Coeff. p-value Coeff. p-value
Time -0.026 0.003 0.009 0.432 0.170 0.105
Mandatory -0.002 0.821 -0.003 0.734 0.041 0.910
Time*Mandatory 0.001 0.118 0.009 0.415 -0.077 0.512
Size 0.002 0.051 0.005 0.000 0.011 0.253
Leverage -0.054 0.000 -0.032 0.010 -0.033 0.667
Age -0.018 0.000 -0.017 0.000 -0.038 0.175
Asset growth 0.021 0.000 0.063 0.000 -0.005 0.890
Tangibility -0.015 0.000 -0.009 0.106 -0.039 0.292
Capital expenditure 0.006 0.000 0.002 0.091 0.003 0.700
Cash to total assets -0.013 0.213 -0.022 0.154 -0.102 0.277
Asset turnover 0.048 0.000 0.042 0.000 -0.052 0.028
Abnormal accruals -0.212 0.000 -0.180 0.000 -0.099 0.368
Market-to-book -0.048 0.000 -0.103 0.000 0.036 0.200
Market value 0.001 0.226 0.003 0.001 0.036 0.000
Offer size 0.000 0.653 0.004 0.076 -0.001 0.071
Global financial crisis -0.005 0.388 -0.024 0.485 0.134 0.076
GDP (%) 0.001 0.070 0.002 0.066 0.021 0.008
Level of enforcement 0.011 0.013 0.005 0.000 0.005 0.557
Constant 0.072 0.000 0.002 0.954 0.110 0.474
Industry fixed effect Yes Yes Yes
Country fixed effect Yes Yes Yes
Year fixed effect Yes Yes Yes
Observations 6,999 6,999 4,660
Adjusted R2 0.35 0.24 0.33
Note: This table reports the regression results of the impact of IFRS adoption on SEO underperformance for low enforcement
countries. Model 1 reports on the unadjusted asset-scaled net income performance. Model 2 reports on the adjusted asset-
scaled net income performance. Model 3 reports on the first day return. The sample period is from 1992-2017 covering 51
countries, comprising 42 IFRS adoption countries and 9 non-IFRS adoption countries. There are 28 weak enforcement
countries. All variables are defined in Table 1.

31
Table 9: Descriptive statistics of alternative measures of SEO underperformance
N Mean Median Stan. dev.
Model 1 IFRS adoption 9,515 -1.535% -2.983% 15.351%
Non-IFRS adoption 9,515 -1.855% -3.665% 11.260%
Full sample 19,030 -2.092% -3.087% 10.763%
Model 2
IFRS adoption 9,406 -1.059% -1.040% 10.927%
Non-IFRS adoption 9,406 -1.533% -1.995% 15.423%
Full sample 18,812 -1.179% -1.916% 15.268%
Model 3 SEO issuers 29,330 -0.283% -0.260% 15.361%
Non-SEO issuers 29,330 -0.217% -0.224% 15.253%
Full sample 58,660 -0.235% -0.245% 15.263%
Note: This table reports the descriptive statistics for alternative measures of SEO underperformance. Model 1 measures the
PSM of IFRS adoption countries and the matched non-IFRS adoption countries. Model 2 uses a PSM to match IFRS adoption
countries to non-IFRS adoption countries and measures the difference between the asset-scaled net income performance of
firms in IFRS adoption and firms in non-IFRS adoption countries. Model 3 matches SEO issuers to non-SEO issuers to
determine the year-to-year change in asset scaled net income performance of issuers and the asset-scaled net income
performance of non-SEO issuers. All variables are defined in Table 1.

32
Table 10: Results of PSM of IFRS adoption and non-IFRS adoption countries and issuers and non-issuers
(1) (2) (3)
Variables Coeff p-value Coeff p-value Coeff p-value
Time -0.009 0.001 0.006 0.202 Mandatory -0.002 0.051 0.004 0.489 0.004 0.063
Time*Mandatory 0.003 0.009 -0.006 0.273 Issuer -0.007 0.008
Issuer*Mandatory 0.003 0.347
Size 0.005 0.000 0.003 0.000 0.004 0.000
Leverage -0.005 0.321 -0.020 0.009 0.003 0.670
Age -0.015 0.000 -0.010 0.000 -0.009 0.000
Asset growth 0.097 0.000 0.037 0.000 0.092 0.000
Tangibility -0.002 0.352 0.000 0.918 -0.002 0.403
Capital expenditure 0.003 0.000 0.001 0.329 0.004 0.000
Cash to total assets -0.062 0.000 -0.044 0.000 -0.044 0.000
Asset turnover 0.061 0.000 0.021 0.000 0.059 0.000
Abnormal accruals -0.317 0.000 -0.126 0.000 -0.295 0.000
Market-to-book 0.140 0.000 0.039 0.000 0.143 0.000
Market value 0.001 0.000 0.000 0.776 0.002 0.000
Offer size 0.003 0.000 0.002 0.890 0.003 0.037
Global financial crisis -0.010 0.000 -0.004 0.315 -0.013 0.001
GDP (%) 0.001 0.490 0.000 0.798 0.001 0.327
Level of enforcement 0.001 0.009 0.001 0.561 0.001 0.467
Constant 0.068 0.000 0.012 0.481 -0.005 0.719
Industry fixed effect Yes Yes Yes
Country fixed effect Yes Yes Yes
Year fixed effect Yes Yes Yes
Observations 9,444 9,444 29,460
Adjusted R2 0.40 0.13 0.20
Note: This table reports the regression results of the impact of IFRS adoption on SEO underperformance using PSM of IFRS adoption countries and non-IFRS adoption countries and for SEO issuing firms and non-SEO issuing firms. Model 1 reports
the PSM of IFRS adoption countries and non-IFRS adoption countries. Model 2 reports the PSM of the difference in the
asset-scaled net income performance for firms in IFRS adoption countries and the asset-scaled net income performance of
matched firms in non-IFRS adoption countries. Model 3 reports on the PSM of the difference in asset-scaled net income
performance of issuers and their matched asset-scaled net income performance of non-issuers. All variables are defined in
Table 1.
CYBERCURRENCY AND BLOCKCHAIN IN THE COLLEGE ACCOUNTING CLASSROOM
Ermira Mazziotta
Muhlenberg College U.S.A.
Ellen Rackas
Muhlenberg College U.S.A.
ABSTRACT
Blockchain is effectively a type of a decentralized database known as a distributed ledger. Unlike traditional databases, blockchains have no sole administrators. As each transaction is recorded it is time-stamped in real time onto the “block”. Each block is linked to the previous block, and each user has a copy of that block in his or her own device. Blockchain, originally used for Bitcoin trading, is one of the most important and innovative technologies developed in the recent years (Jun Dai, Miklos A. Vasarhelyi 2017). This technology is considered to be as important as the internet and it could fundamentally change the nature of every business aspect by revolutionizing supply chains, payments and revenue streams through the way it documents and reconciles complex and disparate information from multiple sources. Blockchain has found applications in almost every industry and business aspect from auditing, financial services, supply chain and healthcare. This paper will investigate the current applications of blockchain, but the main focus of the paper is investigating what the academic community is doing and what needs to be done to prepare students for this revolutionary technology. This paper will also propose ways on how to introduce the blockchain technology into various accounting courses.

CYBERCURRENCY AND BLOCKCHAIN IN THE COLLEGE ACCOUNTING CLASSROOM
What is Blockchain? Blockchains are tamper evident and tamper resistant digital ledgers implemented in a distributed fashion and usually without a central authority (i.e., a bank, company or government). At their most basic level, they enable a community of users to record transactions in a shared ledger within that same community, such that under normal operation of the blockchain network no transaction can be changed once published. This technology became widely known in 2009 with the launch of the Bitcoin network, the first of many modern cryptocurrencies. In Bitcoin, and similar systems, the transfer of digital information that represents electronic cash takes place in a distributed system. Bitcoin users can digitally sign and transfer their rights to that information to another user and the Bitcoin blockchain records this transfer publicly, allowing all participants of the network to independently verify the validity of the transactions. The main characteristics of blockchain are: (1) decentralization, (2) strong authentication, and (3) tamper-resistance. The operation and management of the Bitcoin system are designed to be decentralized. This means that all nodes in the system have access to the entire list of transactions. Such access allows nodes to both verify and publish new transaction records onto blocks, which are then periodically added to the end of the main blockchain with a time stamp (Nakamoto 2008). Blockchain technology was introduced and initiated by mysterious group or person named only by the alias Satoshi Nakamoto (2008). He used a chain of blocks to create a decentralized, publicly available, and cryptographically secure digital currency system. Blockchain Applications This section will cover blockchain applications in professions other than accounting, which will be covered in the next section. Because of the positive characteristics of blockchain technology, it is no surprise that it has found widespread application across profit, nonprofit and governmental agencies. Here are some of the applications of blockchain technology: Governments There has been much discussion and speculation of foreign and domestic governments and individuals tampering with votes. In the context of voting, individual citizens’ details could be stored in blockchains to guarantee that voting is executed lawfully and foreign government influence could be mitigated since the potential for vote tampering would be marginal. A malicious party cannot cast a vote on behalf of another individual because each individual has a unique private key that only he/she can access. For governments, the potential for blockchain adoption is equally compelling, with a variety of use cases that could aid and protect democratic principles. Land titles in developing countries have long been an issue for citizens; a large number of registries were lost due to lack of ownership proof. In Honduras, blockchains are being used to guarantee that land rights are digitized, ensuring consecutive governments cannot strip land owners of what is rightfully theirs by successive dictatorships (Lemieux, 2016), (Hughes.et al. 2019).
Supply Chain Management Supply chain management is a $16 trillion sector with large overhead in terms of costs, error handling, fraud, and administration (Boucher, 2017). Blockchain is ripe to disrupt this sector, especially when synthesized with an IoT strategy. The promise of a blockchain/IoT approach is that many of the issues associated with supply chain handling can be eliminated or drastically enhanced, thus reducing overhead significantly. This works by ensuring each party with a private key writes a confirmation to the blockchain that they have received a product. This secure chain of custody allows for high confidence verification of where and how a product was handled, and allows each member of the supply chain to identify and inspect where any mishandling might have occurred (Hughes.et al. 2019). The granularity and information that IoT and blockchain promise has given rise to companies such as Provenance, Smartlog, and Everledger, which offer transparency services and tracking provenance of everyday goods (Montecchi, Plangger, & Etter, 2019). While this may seem overzealous, provenance can be crucial to certain industries that rely on evidencing the source of goods, and to consumers who want to ensure companies align with their personal values. An example of this would be diamond supply, for which the provenance of stones is integral to the underlying value of the stones (Iansiti & Lakhani, 2017; Tapscott & Tapscott, 2016). Ordinary consumer goods such as clothing, meats, wine, seafood, and postal services are also affected by documentation issues; while proving the authenticity of goods is one aspect of their appeal, many companies are finding that blockchain gives them a competitive advantage with consumers who are increasingly concerned with the origin of goods sourced from around the world (Armstrong, 2016). Finally, blockchains can protect consumers from deceptive counterfeit fraud. By registering the initial purchase onto a blockchain, the authenticity of the product can be permanently stored and the ownership of the certificate can be passed along in a transaction that can be managed through smart contracts. By connecting the physical product with the blockchain via the use of an IoT device such as a sensor, the connection between the product and its authentication certificate is locked (Hughes.et al. 2019). Entrepreneurship Exploitation of the technology is evident in a number of business communities, including startups and intrapreneurs, whereby the disruptive potential of blockchains is driving innovation within business modeling and value propositions (Magretta, 2002;Nowin'ski & Kozma, 2017). As a development platform, the blockchain provides a bedrock for new sets of software applications that are decentralized and cryptographically secure. As open source software, most blockchains are open to development from everyone, which will encourage incremental innovation and further improve the robustness of the blockchain ecosystem. The removal of third- party intermediaries combined with convergent solutions such as IoT and AI is driving competition, driving down costs, and lowering barriers to entry (Hughes.et al. 2019). Digital Rights Management The music industry has a long history of unfair practices and nefarious contract agreements that have always favored the labels (Gopal, Sanders, Bhattacharjee, Agrawal, & Wagner, 2004). Musical blockchains are disrupting this power by giving back the control, ownership, and distribution rights to the artists themselves (Dickson, 2016; Lyubareva, Benghozi, & Fidele, 2014). Since the digital revolution of the 1990s, consumers have also been able to reproduce and download albums and songs without moderation on a peer-to-peer basis, highlighting the issues

and flaws in current IP, copyright, and licensing laws. This has given rise to a remix culture (Lessig, 2010), meaning modern technology and infrastructure have allowed consumers to copy, edit, and redistribute original digital content without any meaningful repercussion or with little regard to legal and moral considerations (Kietzmann & Angell, 2014). On a musical blockchain, the balance of power would be given back to the artist; hash representations of their music could be written into a block with a unique ID and metadata including ownership and licensing rights. This means that the content could not be misattributed easily unless the artist allowed it. Payments could be made using a digital currency and the artists could control the way that they distribute or sell music. Different rates could be given for different population segments (e.g., students and the elderly would receive huge discounts; Dickson, 2016; Tapscott & Tapscott, 2016, Hughes.et al. 2019. Healthcare The current healthcare system has many flaws and one of the most important being patient data security. In the recent years many hospitals have experienced data breach and in many cases they are kept “hostage” for ransom money. Although blockchain will not entirely eliminate the problem of data breach it will increase the efficiency of data. Blockchains have the potential to revolutionize the way health data is stored, handled, and efficiently exchanged between healthcare entities while maintaining these entities’ incentives. For example, after a patient receives a lab result, the data instead of being stored centrally on the lab’s servers can be stored encrypted on the blockchain network. The data itself can be tagged with the creator of the data (i.e., the lab) so any parties who access data in the future can see who generated it. This allows for the preservation of commercial incentives for the lab as they will still be able to bill insurance companies and receive funding based on their work. However, the control of the data is now given to the patient, who can actively decide to share it with a new family doctor or send it to a university for research purposes. This reduces concerns surrounding lost or corrupt data, slow exchange of data, and unknown reselling of data. Many blockchain-based healthcare startups like Doc.ai and Encrypgen have already developed decentralized health data solutions (Hughes.et al. 2019). Financial Services The very creation of blockchain stemmed from cryptocurrency, bitcoin. It was the need to trade bitcoin that led to the creation of blockchain. The traditional role of financial institutions such as banks is undermined by blockchain because one of the characteristics of blockchain is “decentralized”. A third party is not needed for the completion of the transactions. Although there has been some hickups Blockchain has turned out to be extremely effective in maintaining a secure ledger of bitcoin transactions. Since the protocol and code was and currently is open‐source software it has benefited from the efforts of many interested coders who wanted Bitcoin and Blockchain to work. The success of Blockchain has financial services firms moving quickly to utilize the benefits of Blockchain and similar systems within their firms. The financial services firms see this as appropriating Blockchain technology within their own settlement transactions. These could include items such as remittance settlements and mortgage settlements.

How Blockchain and Cyber Currency Can Be Utilized in the Accounting Profession Blockchain is essentially an accountancy based technology. It acts as a type of ledger, storing and recording transactional data for assets, liabilities, income and expenses. Blockchain can also provide methods for reconciling data and recording cash flows. Since blockchain provides transparency in record keeping, it allows accountants to streamline their processes as record authenticity is not disputable. Blockchain can all but eliminate errors and fraud associated with traditional accounting practices (Arnold, 2018). Should accountants worry about losing their jobs? The easy answer is no. Anytime technology leaps forward there is concern over job loss. In this case, accountants can avoid the more tedious, repetitive tasks and focus more on information interpretation and categorization plus implementing and maintaining the blockchain (Martin, 2018). Should bookkeepers worry then? Probably not. Blockchain is a bookkeepers dream. With this new technology efficiency will be improved, records will be permanent and transparent – the ultimate bookkeeping job. Bookkeepers or “blockchainkeepers” will still need to oversee accounts payable, contracts, invoice preparation and accounts receivable. Most available research on blockchain technology agrees the major benefits to the accounting profession are: 1. DLT itself. Distributed Ledger Technology allows for all users of accounting information to access in real time. Since there is no transfer of data ease of use and transparency will dramatically improve efficiency (Martin, 2018). 2. Smart contracts. Smart contracts are blocks of code that automate accounting processes. With certain transactions automated, data error will be reduced (Martin, 2018). 3. Easier reconciliations. In the same way that smart contracts can be used to automate components of data entry, reconciliations can also be built into smart contracts (Martin, 2018). 4. Reduction of costs. With improved efficiency, and less data error, cost savings should be realized relatively quickly once learning curves are overcome (Martin, 2018). 5. Reduction of fraud. In order to modify data, all copies of the data would have to be modified simultaneously which is almost impossible. It is important to note that not all fraud can be eliminated – fraudulent data entered into the DLT is still fraudulent (Martin, 2018). 6. Improved regulatory compliance. DLT can ease the burden of some agencies in overseeing financial compliance – it may even become mandatory in some sectors in the near future (CPAJ Staff, 2019). 7. Reduced audit time – smart contracts can also be utilized by auditors to automate certain audit functions – reducing the number of records to be reviewed by the auditors –saving both time and money (CPAJ Staff, 2019).

8. New opportunities – new assurance and verification services could be provided by accountants related to DLT as well as acting as independent administrators of DLT and blockchain (CPAJ Staff, 2019). The Possible Downsides to the Profession While it is clear that the positive impact to the profession is extensive there are some other factors to consider. These negatives can be divided into technology factors and nontechnology factors. As with any new technology there will be costs associated with training, development and compatibility. Current accounting software is not blockchain compatible but several accounting firms and software developers are currently working to change that. In addition, in order for blockchain’s benefits to be fully realized, companies will need to embrace cloud based software solutions – a departure from traditional server based software. Accounting firms and companies that are slow to embrace blockchain may be at risk for long term viability. As the demand for DLT increases, outdated software and technology will be become obsolete (CPAJ Staff, 2019). Crypto currency provides other opportunities and challenges within the profession. Although, it is named “currency” crypto currency is actual treated as property. This requires the crypto currency to be recorded at its fair value when exchanged for goods and services. Opportunities exist to assist clients with such valuation services for recording the acquisition and disposal of the crypto currency. There will be a delay in fully realizing the potential of accounting and crypto currency until blockchain technology is more widely utilized. It is also important to note that in the United States the FASB has not yet issued any pronouncements in the area of cryptocurrency but it is currently in development. This also creates an opportunity for accountants who are willing to educate themselves on this cutting edge technology. The auditing profession will be profoundly impacted by the existence of cyber currency on a client’s books. New audit procedures will need to be developed to test valuation and ownership. This is also an area where regulatory bodies have yet to issue guidance. How to incorporate Blockchain Technology in the Classroom It is imperative for higher education to prepare students for the “real world.” Both blockchain and cybercurrency could easily be introduced in a variety of undergraduate and graduate courses, including but not limited to accounting information systems, taxation, auditing, financial accounting and managerial accounting. When introducing double entry accounting in financial accounting, using blockchain as an example of preventing double spending would be appropriate. Auditing courses and accounting information courses are especially tailored for blockchain assignments. Auditing courses could explore the audit trail inherently provided by blockchain technology through research papers and projects. Accounting information systems coursework could easily incorporate understanding an organization’s information system with blockchain technology. Taxation courses could explore the impact of cybercurrency transactions on capital gains and losses and valuation as well as the effect blockchain could have on transfer pricing. (Ng, 2019)
In order to incorporate these concepts in the accounting curriculum, it is essential to provide adequate training to faculty beyond just awareness. Even providing course release or stipends for training could be incentive enough for accounting faculty to change course content. The AICPA offers an online certificate program “Blockchain and Beyond” to provide information on the underlying concepts of cryptocurrency and blockchain, the risks and challenges of implementing blockchain and how to incorporate blockchain into digital ledgers. The Big 4 accounting firms also have made available online resources. (Ng, 2019) While our focus is solidly in accounting courses, blockchain education is expanding in many higher education institutions across many different disciplines. Both Portland State University and the University of Oregon have launched blockchain programs (Diehl, 2019). “The University of Oregon is one of 18 colleges around the globe to benefit from a $50 million grant program for blockchain research launched by Ripple, a fintech company focused on making cross-border payments more efficient” (Diehl, 2019). Some universities are adding bootcamps, student clubs and acting as blockchain incubators (Kursh, 2016) “Simon Fraser University in British Columbia, for example, has even gone so far as to start accepting Bitcoins as payment in its bookstores and even installed BTM’s (Bitcoin Teller Machines) around campus to provide students with a literal hands-on cryptocurrency-learning environment (Kursh, 2016). In addition, as new blockchain curricula emerges, keeping up with industry will be a challenge. Partnering with local technology companies will be even more essential (Diehl, 2019). While some entrepreneurs are barreling ahead, higher education will be more cautious. This technology is still in its infant stages but is definitely here to stay. Sample Assignments Sample Assignment 1 Federal Taxation Research Project In 2018, Credit Karma Tax reported that fewer than 100 of 250,000 individual tax returns filed for 2017 reported cybercurrency capital gains or losses (Cheng, 2018). According to the same article Credit Karma Tax also reported that over 1 million US households own cryptocurrency (Cheng, 2018). There is a large disconnect between these two figures. Choose one of the following topics for a 3 – 4-page paper: Knowing that, can you calculate the potential magnitude of the potential tax exposure. What methodology could you incorporate to do the calculation? What issues are raised with the calculation? How can practitioners educate their clients in the reporting of cybercurrency gains and losses? What kind of obstacles would a practitioner face? Why might clients be reluctant? Planning for these capital gains is part of the discussion. How can blockchain be utilized to ease the tracking of cybercurrency transactions? What kind of valuation issues might a taxpayer face in calculating capital gains and losses on crypto currencies?

Sample Assignment 2: (can be adapted for Federal Taxation or Financial Accounting or Cost Accounting courses) What is Money? Choose one of the following: Assign the Podcast “NPR Planet Money” about the Yapese stone money called Rai stones or Island Money by Michael F. Bryan. Discuss how cybercurrency and Rai stones are similar and how they are different. What makes currency valuable? Cybercurrency and casino chips – discuss how they are similar and how are they different Foreign currency and cybercurrency – discuss how they are similar and how are they different Sample Assignment 3: Accounting Information Systems Project: Select an accounting process that a typical organization employs (accounts payable, accounts receivable, sales cycle, etc.) Prepare a flowchart of the current process and then update it with how blockchain technology could be incorporated into the process. This assignment should focus on understanding of the controls around the process and how blockchain reduces the risk. Sample Assignment 4: Auditing Paper: Auditing the Blockchain Consider the implications of blockchain technology and the audit risks associated with it. How does a CPA audit the controls around blockchain? How would the use of blockchain impact the Audit Risk (AR) and the Risk of Material Misstatements (RMM). Conclusion Blockchain technology is here to stay. We, the academic community need to find ways to incorporate the technology into our classrooms in theory and practice.

REFERENCE Bibliography [1] Arnold, A. (2018, August 28). Blockchain is not a threat to accounting, its an opportunity.
Retrieved from Forbes.com: https://www.forbes.com/sites/andrewarnold/2018/08/28/blockchain-is-not-a-threat-to-accounting-its-an-opportunity/#1c46d4db68d0
[2] Cheng, E. (2018, February 21). CNBC.com, p. 5. [3] CPAJ Staff. (2019). Auditing Implications of Blockchain and Cybersecurity. The CPA
Journal, February. [4] Diehl, C. (2019, February). The Startup Community. Oregon Business Magazine, pp. 40-41. [5] Kursh, S. A. (2016). Adding FinTech and Blockchain to Your Curriculum. Business
Education Innovation Journal, 6-12. [6] Martin, R. (2018, November 29). blockchainaccountingapplications. Retrieved from
www.igniteoutsourcing.com: www.igniteoutsourcing.com/blockchain/blockchain-accounting-applications/
[7] Ng, C. (2019). CPA, CGMA, DBA. Pennsylvania CPA Journal, 14-15. [8] White, Gareth R.T. Strategic Change. Sep2017, Vol. 26 Issue 5, p439-451. 13p. 8 Charts.
DOI: 10.1002/jsc.2144 [9] Adams, Richard; Parry, Glenn; Godsiff, Phil; Ward, Peter. Strategic Change. Sep2017, Vol.
26 Issue 5, p417-422. 6p. DOI: 10.1002/jsc.2141. [10] Nakamoto,S., “Bitcoin: A Peer-to-Peer Electronic Cash System,” 2008.
https://bitcoin.org/bitcoin.pdf [11] Merrett, Rebecca. CIO (13284045). 12/10/2015, p2-2. 1p [12] Hughes, Park, Kietzman, Archer-Brown Business Horizons 2019 62, 273 - 281

THE EFFECT OF CORPORATE SOCIAL RESPONSIBILITY ON THE ORGANIZATIONAL COMMITMENT OF EMPLOYEES MEDIATED BY
INTRINSIC MOTIVATION
Edicreia andrade dos santos Professor of Accounting at Federal University of Mato Grosso do Sul
School of Accounting University of Mato Grosso do Sul
[email protected] Brazil
Januário José Monteiro
Doctor Student at Federal University of Santa Catarina School of Accounting
University of Santa Catarina [email protected]
Brazil
Rogério João Lunkes Professor of Accounting at Federal University of Santa Catarina
School of Accounting University of Santa Catarina [email protected]
Brazil
Claudio Marcelo Edwards Barros Professor of Accounting at Federal University of Paraná
School of Accounting Federal University of Paraná
[email protected] Brazil.
ABSTRACT
One of the approaches in the literature for Corporate Social Responsibility (CSR) is to study its impact on employees by considering whether they are more attracted by responsible companies concerned with society. With this understanding, the aim of this study is to investigate the effects of CSR on the organizational commitment of employees mediated by intrinsic motivation. For this, we use a survey of 189 respondents. The research data is applied to the Structural Equation Modelling (SEM) technique using the Software Smart PLS. Notably, among the results obtained, there is a positive and significant relationship between the employees’ perceptions of CSR and organizational commitment; in addition, we confirm that intrinsic motivation mediates the CSR relationship in organizational commitment. We conclude that the CSR perceived by the employees allows their commitment and intrinsic motivation to improve. These arguments align with the current literature, which has studied the CSR from the point of view of the employees. Keywords: Corporate Social Responsibility (CSR); Intrinsic Motivation; Organizational Commitment.

1 Introduction The literature on corporate social responsibility (CSR) has been extensively researched (Ali, Rehman, Ali, Yousef and Zia, 2010). In general, the CSR is approached from two perspectives; first perspective is considered the organization's response to the environment, dealing with social issues beyond the legal, technical and economic requirements (Mcguire, 1963; Davis, 1973), and the second focuses on the impact of CSR on the behaviour of employees (Peterson, 2004; Brammer, Millington and Rayton, 2007; Rupp, Ganapathi, Aguilera, Williams and Türker, 2009a; Liu Quan, Xu and Forrest, 2019). Previous research, such as Türker (2009a), adopted the theory of social identity to explain that the extent to which the organization adopts a CSR culture allows the individuals to identify with its values.
This identification allows them to feel motivated (Skudiene and Auruskeviviene, 2010), more satisfied with work (Riordan; Gatewood and Bill 1997; Youn, Lee and Lee, 2019), more committed to the organization (Brammer; Millington and Rayton, 2007; Türker; 2009a; Young, Lee and Lee 2010), and have a higher performance level (Herremans, Akathaporn and Mclnnes, 1993). This paper adopts the second approach to observe the impact of CSR on organizational commitment, following the flow of research by Peterson (2004); Brammer, Millington and Rayton (2007); Ali et al., (2010); Zheng (2010) and Azim (2016). Moreover, this study advances the literature by using intrinsic motivation as a mediating variable, in addition to the analysis, based on the suggestions of (Aguilera, Rupp, Williams and Ganapathi, 2007), who affirm that the individual achieves intrinsic motivation when the organization in which he works is socially responsible.
Studies, such as the research done by Hayati and Canigo (2012), associate intrinsic motivation and organizational commitment; the results show a positive and significant relationship between them. Gheitani, Sevyedamiri, and Foroundi, (2018) have already observed a partially positive relationship between intrinsic motivation and organizational commitment. Another branch of the research is related CSR to intrinsic motivation, as is the case with Meillyt and Ruzevicius (2008), who found that the CSR increases employee motivation by creating a healthier working environment.
It is observed that previous research separately addressed the elements that are intended to be analysed in this paper. Therefore, this study relates the three elements in a single research setting, filling the gap highlighted by Hur, Moon and Ko (2016), who affirm that future research should replicate and enlarge the analysis scope of the relationship between CSR and variables, such as organizational commitment, intrinsic motivation, creativity, and others. The authors further emphasize that studies addressing CSR need to be developed in other economic contexts to confirm the validity and external results. Moreover, Skudiene and Auruskeviviene (2010) consider that more studies should examine the relationship between CSR and motivation, as previous studies were less detailed because they considered motivation with a less comprehensive approach; consequently, it is unclear what type of motivation is most salient when the organization adopts the practices of CSR.
Based on the statements above, this study has the following research question: What are the effects of Corporative Social Responsible (CSR) on the organizational commitment of employees mediated by intrinsic motivation? In this sense, the study aims to investigate the effects of Corporative Social Responsible (CSR) on the organizational commitment of employees mediated by intrinsic motivation.
This research is justified as contributing to the literature because CSR is a promising area of significance for researchers (Ali et al., 2010). In addition, this work is indicated as a contribution to the literature because CSR can be a competitive tool for organizations (Azim, 2016), and socially responsible organizations tend to increase the motivation levels of their employees (Aguilera et al., 2007) and, consequently, their commitment (Youn, Lee and Lee, 2019). Thus, this paper generates practices for contributing to the literature, thus observing the impact that managers have on the behaviour of the employees by searching for greater satisfaction, commitment, and performance. In terms of social contributions, this research helps to understand CSR, allowing companies to improve their commitment to society, in general, and to the welfare of employees, in particular, as well as to enhance the quality of products or services (Ali et al., 2010). 2 Theoretical Basis And Development Of Hypotheses 2.1 Corporate Social Responsibility (CSR) The initial concepts of CSR were presented by Beyer (1972) and Drucker (1974), who suggested that organizations needed to implement socially beneficial actions in society. Although several studies have focused on CSR, Lantos (2001), Eweje and Bentley (2006) and Skudiene and Auruskeviviene (2010) state that its definition remains relatively vague and inconclusive. Authors such as McGuire (1963) and Davis (1973) point out that CSR is the response of organizations to issues beyond the legal, technical and economic requirements and, therefore, is broad and should be integrated into the strategic planning of the organization. On the other hand, the literature focuses on the impact of CSR on employees and considers that they are more attracted by responsible companies that are concerned with society (Peterson, 2004; Brammer et al., 2005; Rupp et al., 2006). Kitzmueller and Shimshack (2012) define CSR as the commitment of organizations to ethics, as well as to sustainable and economic development, without the purpose of both their interests and that of the stakeholders conflicting. Liu et al. (2019) have added that CSR means the company needs to see beyond the economic benefits by being aware of the social needs within the organizational environment without being exempt from the environmental aspects and stakeholders. Recently, surveys linked to CSR have focused on employees as one of the key elements that incorporate stakeholders (Liu et al., 2019), noting that CSR attracts potentially motivated employees and, consequently, improves the commitment of others (Turban and Greening, 1997; Albinger, Oise and Freeman, 2000; Greening Turban, 2000; Peterson, 2004). Türker (2009a) affirms that when an organization's social responsibility increases, the identity of the employees is closer to that of the organization, which concerns the relationship between CSR and organizational commitment.

The focus of the research in line with CSR extends from the perspective of customers to employees (Bhattacharya, Sen and Kroschun, 2008; Song et al., 2015; Liu et al., 2019). For these reasons, research such as that of Bohdanowicz, Zientara, and Novotna (2011) investigated the impact of CSR from the point of view of the employees and found that companies with a higher CSR are more attractive to employees. Thus, they concluded that many companies have promoted a culture of CSR to attract quality employees.
2.2 Organizational Commitment Organizational commitment is defined by Cook and Wall (1980) as the employee's effective relationship with the employer organization; when their values and objectives are observed, feelings of satisfaction and well-being are generated at work. As Buchanan (1974) stated, organizational commitment is tested by three dimensions: (i) the identification, considered as the internalisation of the objectives and values of the organization; (ii) the involvement, which is related to the satisfaction of the individual at work and identification with the activities of the job; and (iii) the loyalty, regarded as the affection towards the organization (Cook and Wall, 1980). In summary, the literature on organizational commitment is presented under two perspectives; on the one hand, the literature focuses on the employee’s attachment to the organization, and on the other hand, the literature focuses on the employee’s intention to continue employment and identify with the organization (Kim et al., 2012). It is observed that the dimensions of commitment are somehow linked to individuals; thus, the actions that affect the attitudes, perceptions, and behaviour of these individuals in the organization need more attention. For this reason, Riordan et al. (1997) discussed the relationship between CSR and variables related to the intended behaviour of employees in the organization, among which the organizational commitment is included. Thus, some studies related the CSR to several variables of a psychological nature, as is the case with organizational commitment (Brammer et al., 2007; Ali et al., 2010; Aguinis and Glavas, 2012; Azim, 2016; Kim, Song and Lee, 2016; Youn, Lee and Lee, 2019). Brammer et al. (2007) observed that CSR significantly increases the organizational commitment. Ali et al., (2010) investigated the influence of CSR on organizational impairment and organizational performance and showed a significantly positive relationship between them. Aguinis and Glavas (2012) have found that companies which have CSR practices exhibit greater employee engagement, a better relationship between work colleagues and higher organizational commitment. The results of the research by Kim, Song and Lee (2016) suggest that the employee’s perception about how the organization gives value to their contributions and value their welfare in the workplace affects organizational commitment. Azim (2016) investigated the relationship between CSR and organizational commitment, the engagement at work, the engagement in the organization and the organizational citizenship behaviour. These findings evidenced a positive relationship between CSR and organization commitment, engagement at work, engagement in the organization and organizational citizenship behaviour. Youn, Lee and Lee (2019) investigated the relationship between CSR and organizational commitment, as mediated by job satisfaction. The results showed that the employees’ perception of the organization's involvement in CSR projects influenced the
employees’ commitment to the organization. Based on these findings, we propose the following hypothesis:
H1: There is a positive relationship between corporate social responsibility (CSR) and the organizational commitment of employees. 2.3 Intrinsic Motivation Latham and Pinder (2005) define motivation as being a set of forces arising from the individual that determine the shape, direction, and intensity of the employees’ work. According to Skudiene and Auruskeviviene (2010), this definition is comprehensive and encompasses both intrinsic motivations related to the internal aspects of the individual, and extrinsic, referring to the external aspects. Intrinsic motivation is related to the perceived pleasure of an individual performing a certain activity without obtaining any reward (White, 1959; Hunt, 1996). It is usually approached from two perspectives. The first perspective highlights that, on the one hand, the motivation of the individual is not influenced by his effort because from the moment a certain activity is predetermined, it is rewarding to him (Daci and Ryan, 2000). This reward occurs from the point of view of the individual because they feel motivated to verify what is important in their work and to obtain control of the necessary resources; further, the individual has the freedom to suggest and develop abilities and opportunities for growth (Armstrong, 2006). The second perspective highlights that the motivation of the individual can be strengthened by satisfying their social needs (Daci and Ryan, 2000). Amabile (1993) affirm that intrinsic motivators can arise from the feelings of individuals in the course of their functions, which are often encouraged by their own work. Daci and Ryan (2002) emphasize that basic psychological needs, such as autonomy, competence, and relationship, when satisfied, allow the individual to achieve intrinsic motivation. Then, when the employee is intrinsically motivated, they develop the activities not for the extrinsic rewards but because they feel like they are a part of the organization, as they trust and identify with its purposes (Skudiene and Auruskeviviene, 2010). Previous studies related intrinsic motivation and organizational commitment and observed that the more responsible an organization is in society, the more motivated the employees become, which reflects on their commitment to the organization (Aguilera et al., 2007; Meillyt and Ruzevicius, 2008; Skudiene and Auruskeviviene, 2010; Hayati and Canigo, 2012; Hur, Moon and Ko, 2016). Aguilera et al., (2007) argue that employees increase their intrinsic motivation when they perceive that the organization promotes a CSR culture, causing socially responsible companies to seek the collective good. This result was confirmed by Meillyt and Ruzevicius (2008), who concluded that organizations which have CSR practices increase employee motivation by creating a healthier environment at work. In addition, Skudiene and Auruskeviviene (2010) concluded that CSR is positively correlated with intrinsic motivation.
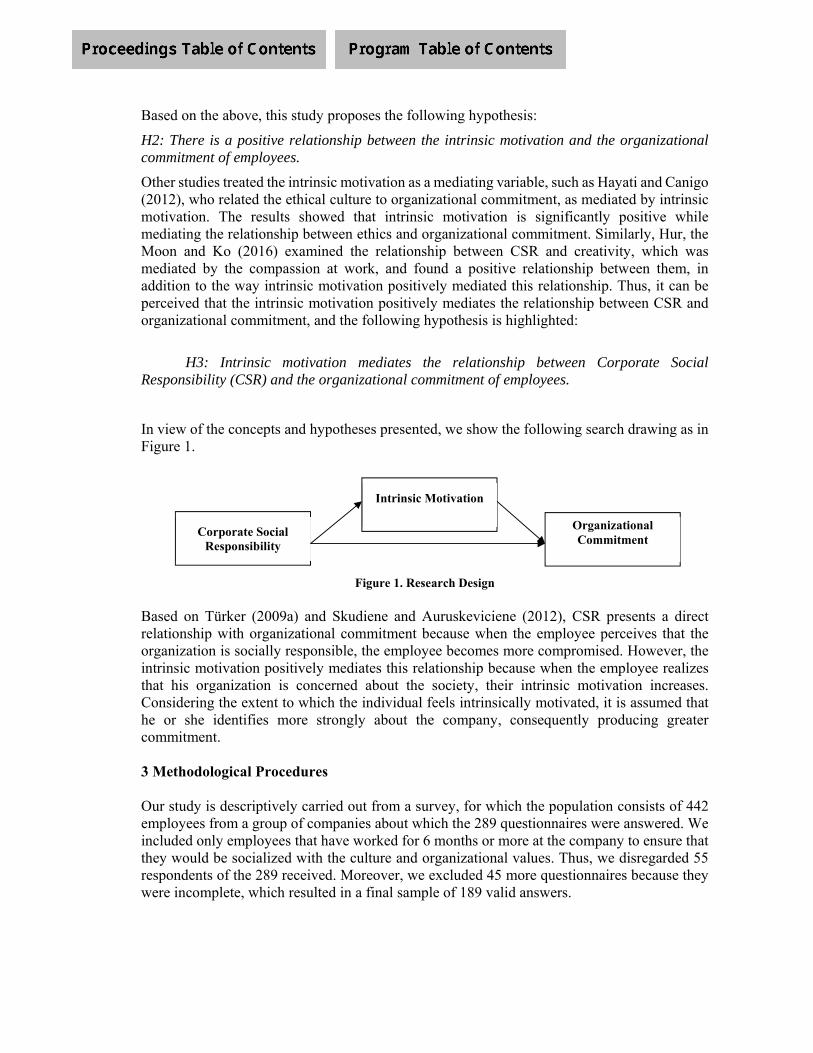
Based on the above, this study proposes the following hypothesis:
H2: There is a positive relationship between the intrinsic motivation and the organizational commitment of employees.
Other studies treated the intrinsic motivation as a mediating variable, such as Hayati and Canigo (2012), who related the ethical culture to organizational commitment, as mediated by intrinsic motivation. The results showed that intrinsic motivation is significantly positive while mediating the relationship between ethics and organizational commitment. Similarly, Hur, the Moon and Ko (2016) examined the relationship between CSR and creativity, which was mediated by the compassion at work, and found a positive relationship between them, in addition to the way intrinsic motivation positively mediated this relationship. Thus, it can be perceived that the intrinsic motivation positively mediates the relationship between CSR and organizational commitment, and the following hypothesis is highlighted:
H3: Intrinsic motivation mediates the relationship between Corporate Social Responsibility (CSR) and the organizational commitment of employees.
In view of the concepts and hypotheses presented, we show the following search drawing as in Figure 1.
Figure 1. Research Design Based on Türker (2009a) and Skudiene and Auruskeviciene (2012), CSR presents a direct relationship with organizational commitment because when the employee perceives that the organization is socially responsible, the employee becomes more compromised. However, the intrinsic motivation positively mediates this relationship because when the employee realizes that his organization is concerned about the society, their intrinsic motivation increases. Considering the extent to which the individual feels intrinsically motivated, it is assumed that he or she identifies more strongly about the company, consequently producing greater commitment.
3 Methodological Procedures Our study is descriptively carried out from a survey, for which the population consists of 442 employees from a group of companies about which the 289 questionnaires were answered. We included only employees that have worked for 6 months or more at the company to ensure that they would be socialized with the culture and organizational values. Thus, we disregarded 55 respondents of the 289 received. Moreover, we excluded 45 more questionnaires because they were incomplete, which resulted in a final sample of 189 valid answers.
Corporate Social Responsibility
Intrinsic Motivation
Organizational Commitment

Our research instrument was applied prudentially to the employees by one of the authors of this work in the period of January 7-15, 2019. The survey consisted of three constructs with 21 questions and was measured on a 5-point Likert scale.
Table 1. Construct of the Research and Variables.
Construct Variables Questions References
Corporate Social Responsibility - CSR
CSR for social and non-social Stakeholders
4 Türker (2009b).
CSR for employees 5 CSR for costumers 3
Intrinsic Motivation - IM Intrinsic Motivation 3 Skudiene and Auruskeviciene (2012).
Organizational Commitment-OC
Organizational Commitment 6 Allen and Meyer (1990).
For the data analysis, we adopted the technique of Structural Equation Modelling estimated from partial least squares (partial least squares – PLS). The PLS allowed the testing of a set of variables, with the purpose of investigating the level of explanation of the predictive variables for the dependent variables (multiple regression aspects) and determining the most important predictor variable (factorial analysis) (Klem, 2006). In addition, to examine the effects of mediation, we used a step-by-step analysis of the pathways, as recommended by Baron and Kenny (1986). 4 Analysis and Discussion of Results 4.1 Respondent Profile We present, in Table 2, the demographic data of the respondents in our research.
Table 2. Respondent Data
Gender N (%) Age N (%)
Female 96 50.80 From 18 to 21 years 40 21.40 Male 93 49.20 From 22 to 30 years 80 42.80
Over 30 years 69 35.80 Total 189 100 Total 189 100 Experience N (%) Schooling N (%)Above 6 months to 3 years 73 38.80 Incomplete Elementary School 5 2.70 Over 3 years to 7 years 67 35.60 Elementary School 31 16.50 Over 7 years 49 25.60 High-School degree 130 69.10
Bachelor’s degree 23 11.70 Total 189 100 Total 189 100
According to Table 2, we observed that the female and male genders are homogeneous in the sample (96 women and 93 men). Most respondents are between 18 to 30 years old and have completed high school. Only 11.7% of the collaborators have achieved a bachelor’s degree. The companies of the respondents included 14 stores (5 supermarkets, 3 fuel stations, 2 department stores, 1 gas distributor, 1 accounting office, 1 importer and 1 bakery and confectionery) with family management located in 2 cities in the south of Brazil. This group of
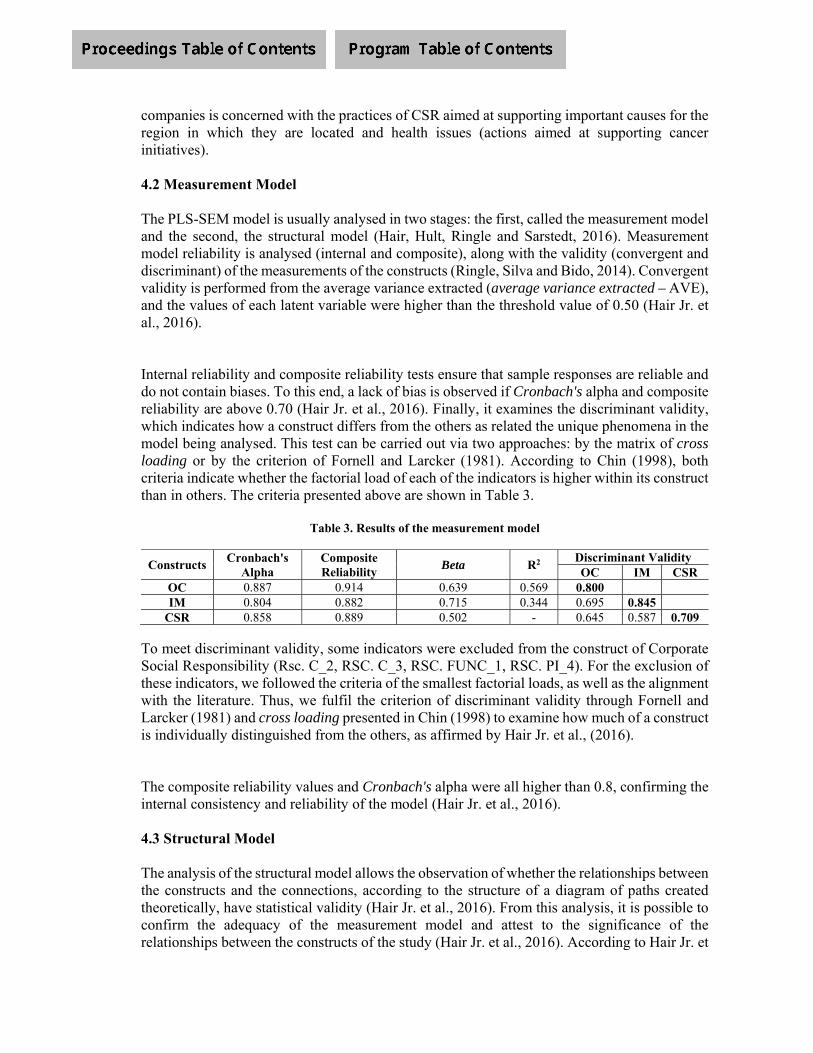
companies is concerned with the practices of CSR aimed at supporting important causes for the region in which they are located and health issues (actions aimed at supporting cancer initiatives). 4.2 Measurement Model The PLS-SEM model is usually analysed in two stages: the first, called the measurement model and the second, the structural model (Hair, Hult, Ringle and Sarstedt, 2016). Measurement model reliability is analysed (internal and composite), along with the validity (convergent and discriminant) of the measurements of the constructs (Ringle, Silva and Bido, 2014). Convergent validity is performed from the average variance extracted (average variance extracted – AVE), and the values of each latent variable were higher than the threshold value of 0.50 (Hair Jr. et al., 2016). Internal reliability and composite reliability tests ensure that sample responses are reliable and do not contain biases. To this end, a lack of bias is observed if Cronbach's alpha and composite reliability are above 0.70 (Hair Jr. et al., 2016). Finally, it examines the discriminant validity, which indicates how a construct differs from the others as related the unique phenomena in the model being analysed. This test can be carried out via two approaches: by the matrix of cross loading or by the criterion of Fornell and Larcker (1981). According to Chin (1998), both criteria indicate whether the factorial load of each of the indicators is higher within its construct than in others. The criteria presented above are shown in Table 3.
Table 3. Results of the measurement model
Constructs Cronbach's
Alpha Composite Reliability
Beta R2 Discriminant Validity OC IM CSR
OC 0.887 0.914 0.639 0.569 0.800
IM 0.804 0.882 0.715 0.344 0.695 0.845CSR 0.858 0.889 0.502 - 0.645 0.587 0.709
To meet discriminant validity, some indicators were excluded from the construct of Corporate Social Responsibility (Rsc. C_2, RSC. C_3, RSC. FUNC_1, RSC. PI_4). For the exclusion of these indicators, we followed the criteria of the smallest factorial loads, as well as the alignment with the literature. Thus, we fulfil the criterion of discriminant validity through Fornell and Larcker (1981) and cross loading presented in Chin (1998) to examine how much of a construct is individually distinguished from the others, as affirmed by Hair Jr. et al., (2016). The composite reliability values and Cronbach's alpha were all higher than 0.8, confirming the internal consistency and reliability of the model (Hair Jr. et al., 2016).
4.3 Structural Model The analysis of the structural model allows the observation of whether the relationships between the constructs and the connections, according to the structure of a diagram of paths created theoretically, have statistical validity (Hair Jr. et al., 2016). From this analysis, it is possible to confirm the adequacy of the measurement model and attest to the significance of the relationships between the constructs of the study (Hair Jr. et al., 2016). According to Hair Jr. et

al. (2016), to evaluate the validity of the structural model, the following criteria are analysed: (i) the size and significance of the path coefficients, (ii) coefficients of determination of Pearson (R ²), (iii) effect sizes (F ²) and (iv) the relevance predictive (Q ²). Items i and ii are obtained through the technique of bootstrapping, and items iii and iv are on the blindfolding platform. For the execution of the technique of bootstrapping, used to assess the level of significance between the relationships of the constructs, the parameters of 5,000 subsamples were used with 5,000 interactions (Hair Jr. et al., 2016). Thus, the values obtained for the relationship between the constructs are presented in Table 4, and the values obtained for R2 and Q2 and F2 are presented in a note.
Table 4. Effects between constructs
Paths β. P-Value Hypotheses RSC-> CO 0.362 0.000 *** H1 MI-> CO 0.482 0.000 *** H1 RSC-> MI-> CO 0.136 0.000 *** H3
Note 1: CSR: Corporate Social Responsibility; IM: Intrinsic Motivation; OC: Organizational Commitment. Note 2: N = 189. Note 3: p < 0.001. R2 = Organizational Commitment (0.569); Intrinsic Motivation (0.344). Q2 = Organizational Commitment (0.335); Intrinsic Motivation (0.205). F2= Organizational Commitment (0.354); Intrinsic Motivation (0.200). For the analysis of determination coefficients of Pearson (R ²), it is determined that an R ² of 2% can be classified as a small effect, R ² of 13% as a medium effect and R² of 26% as a large effect. From the results obtained, we verified for organizational commitment (56%) and intrinsic motivation (34%), which reveal that more than 50% is explained through the proposed model by the constructs used. The F² value is a measure that evaluates whether there is a substantial impact on the dependent construct when an independent construct is omitted from the model. Considering the values for f ² suggested by Hair Jr. et al., (2016), small (0.02), medium (0.15) and large (0.35) effects, it is perceived that with the omission of the independent construct (CSR), there would be an impact on organizational commitment. The criterion of Q² provides evidence for how much the model approaches the expected outcome. According to Hair Jr. et al., (2016), the values must be greater than zero. According to the values of the constructs for this criterion, conformity in the adjusted model is inferred. The hypotheses of the research are confirmed, as seen from the results presented in Table 4. The first hypothesis (H1) attempted to test whether there is a positive relationship between CSR and organizational commitment, which was statistically confirmed (β = 0.362, p < 0.01). These findings confirm the study of Azim (2016) because he found the same result.
The second hypothesis sought to verify whether there is a positive relationship between intrinsic motivation and the organizational commitment of the employees, which was confirmed as positive and statistically significant (β = 0.482, p < 0.01). These results indicate that when employees have their psychological needs satisfied, such as motivation, their commitment to the organization is greater. In the third and last hypothesis, our interest was to understand whether intrinsic motivation mediates the relationship between CSR and the organizational commitment of employees. To test this mediation, the precepts of Baron and Kenny were followed (1986). Mediation is used to test hypotheses concerning the procedures that explain the occurrence of certain effects or the conditions that act as facilitators or inhibitors of such effects. Therefore, it was confirmed that the intrinsic motivation mediates the relationship CSR-> CO. We consider that the employees achieve their motivation from internal and external elements. It is observed that CSR functions as the extrinsic element that increases their motivation, which influences their commitment to the organization. These findings corroborate Hayati and Canigo (2012) and Hur, Lua and Ko (2016), as it is found that that motivation can be considered to be a mediating variable both under the scope of CSR and organizational commitment.
4.4 Discussion of results This research sought to examine whether the relationship between CSR and organizational commitment is mediated by intrinsic motivation. The results reveal that a CSR perceived by the employees has a direct relationship with their commitment to the organization. These findings are affirmed by Azim (2016) because he observed a positive relationship between CSR and organizational commitment. It is inferred from this that employees know when an organization is committed to ethics and sustainable development, and they observe its responsibility for society (Kitzmueller and Shimshack, 2012). This benefits employees, customers and other stakeholders and, therefore, positively influences the organizational commitment. Because CSR transcended legal requirements and integrates into the strategic planning of organizations, it is indispensable to disseminate this concept in the organizational environment, given that it can better the organization's performance via the employees’ commitment. Kim, Song, and Lee (2016) affirm that, when the employee realizes that the organization values his or her contributions and welfare in the workplace, commitment increases. This result highlights the impact of CSR as perceived by employees in our research because, as found by Peterson (2004), Brammer et al., (2005) and Rupp et al., (2006), the level of the employee’s motivation increases, and the probability of the organization attracting motivated employees is greater. We perceived that the level of employee motivation arises alone, without considering CSR as a predictor, and influences organizational commitment. These arguments are sustained by Latham and Pinder (2005) because they consider that employees can feel motivated through intrinsic regulations. The range of intrinsic motivation often presupposes the satisfaction of the needs of the individual as autonomous, competent and interaction-based (Daci and Ryan, 2000).

These needs can be achieved through the opportunities granted by the organization and the freedom given to employees to suggest improvements that are often linked to the planning of the daily operations of the company, with CSR practices being among them. Armstrong (2006) presents evidence regarding the control of resources. The freedom of action and the opportunity for growth are elements that allow the achievement of intrinsic motivation. The more motivated the employee is, the greater the benefit he will provide to the organization, including commitment, creativity, satisfaction and better performance. CSR is an important antecedent of motivation that produces a positive effect on organizational commitment, as noted in the confirmation of H3. It is inferred that when the organization shows concern for the environment to which it is inserted, it arouses interest from motivation and identifies employees with the organization. Therefore, these actions reflect on increased motivation and commitment. These findings reflect the arguments of (Turban and Greening, 1997; Albinger and Freeman, 2000; Greening and Turban, 2000; Peterson, 2004). These findings also show that when the organization is socially responsible, its employee turnover cycle tends to be greater: on one hand, the interest to remain in the organization is justified because employees identify with the objectives of the organization; on the other hand, the results show that the organization considers the employees to be a part of it. These observations are congruent with Meillyt and Ruzevicius (2008), which point out that the exercise of CSR practices enables a healthy work environment and causes employees to have greater identification with the organization, motivation, and willingness to remain in employment. Generally, the results of our research showed that the employee-perceived organizational CSR allows employee commitment to improve. These arguments align the current of the literature that has studied the CSR from an employee's point of view. It was also found that the motivation achieved by the employees leads to a greater commitment to the organization. These results align with the propositions of Daci and Ryan (2000) to realise that motivation is achieved through the satisfaction of the psychological needs linked to the autonomy, competence, and need for a relationship or interaction.
5 Conclusions The study aimed to investigate the effects of CSR on the organizational commitment of employees as mediated by intrinsic motivation. The final sample was 189 employees from a group of companies that control 14 stores. Through the data collected the first time, the sample profile was analysed; the second time, the hypotheses of the research were tested considering the variables analysed (CSR, intrinsic motivation and organizational commitment). In the results, we confirmed that CSR is positively related to the organizational commitment (H1); that intrinsic motivation exerts positive influence, which is significant to the organizational commitment (H2); and that intrinsic motivation mediates the relationship between CSR and organizational commitment in H3. In summary, we concluded that the sense of social responsibility of the organization increases the commitment of its employees when

they achieve intrinsic motivation. External variables acting on the individual may influence the achievement of motivation, and the consequences of the CSR functions, as one of these elements and if well adopted by the organization, allow employees to achieve satisfaction of their basic psychological needs. This study generates important implications that are theoretical and practical. Theoretically, the study contributes to the literature about the proposed theme by verifying that social, environmental and economic issues generate benefits for organizations, specifically for achieving organizational objectives through increased employee commitment. We found that the employees ' perceptions of CSR are trusted and, for this reason, contribute to the research stream that investigates the CSR of organizations from the perspective of the employees (Peterson, 2004; Brammer, Millington and Rayton, 2007; Rupp, Ganapathi, Aguilera, Williams and Türker, 2009; Liu, Quan, Xu and Forrest, 2019). Our results allow the advance of the propositions of some studies (Brammer et al., 2007; Ali et al., 2010, and Azim 2016) because, apart from observing that the CSR influences the organizational commitment, it was also found that the intrinsic motivation mediates this relationship. In this way, it is confirmed that psychological variables can help in predicting the effects of CSR on behaviouristic and attitudinal variables of employees. Regarding practical implications, our results suggest that companies should adopt ethical practices that aim not only at achieving the primary goals (profit) but also others that can leverage the organization's performance. We suggest that companies pay more attention to the psychological variable that can affect the employee's performance. One of these variables is the intrinsic motivation, which is important for psychological well-being. Our samples were composed of the individuals of a unique company, which is the reason why we consider it as a limitation of the study. Another limitation is the method used, as this research is characterized as transversal and, although the relationships were tested based on the literature, the results lack a cautious interpretation. We suggest that future researchers investigate the model proposed in this study with a longitudinal method, with which it is possible to follow the ways in which the employees react when the organization is socially responsible, how commitments are affected by this perception and the level of motivation achieved. In addition, we suggest that future research adopts other psychological variables, such as empowerment, to realise what effect it produces on the behaviour of its employees. Future research could also try to explain the causal effect between the variables investigated here.
REFERENCES
Aguilera, R. V., Rupp, D. E., Williams, C. A., and Ganapathi, J. (2007). Putting the S back in corporate social responsibility: A Multilevel theory of social change in organizations. Academy of Management Review, 32(3), 836-863.

Albinger, H. S., and Freeman, S. J. (2000). Corporate social performance and attractiveness as an employer to different job seeking populations. Journal of Business Ethics, 28(3), 243-253.
Ali, I., Rehman, K. U., Ali, S. I., Yousaf, J., and Zia, M. (2010). Corporate Social responsibility influences, employee commitment, and organizational performance. African Journal of Business Management, 4(13), 2796-2801.
Amabile, T. M. (1993). Motivational Synergy: Toward new conceptualizations of intrinsic and extrinsic motivation in the workplace. Human Resource Management Review, 3(3), 185-201.
Armstrong, M. (2006). Strategic Human Resource Management-A Guide to Action 3rd Ed.
Baron, R. M., and Kenny, D. A. (1986). The Moderator-Mediator variable distinction in social psychological research: Conceptual, strategic, and statistical considerations. Journal of Personality and Social Psychology, 51 (6), 1173-1182.
Bervian, P. A., Deer, A. L., and Silva, R. D. (2002). Scientific Methodology. São Paulo: Belongs Hall, 482-493.
Bhattacharya, C. B., Sen, S., and Korschun, D. (2008). Using Corporate social responsibility to win the war for talent. MIT Sloan Management Review, 49 (2).
BohdanowiczP. Zientara, P., and Novotna, E. (2011). International hotel chains and environmental protection: An analysis of Hilton's We care! Programme. Journal of Sustainable Tourism, 19(7), 797-816.
Brammer, S., Millington, A., and Rayton, B. (2007). The Contribution of corporate social responsibility to organizational commitment. The International Journal of Human Resource Management, 18(10), 1701-1719.
Chin, W. W. (1998). The Partial least squares approach for structural equation modeling. In Marcoulides, G. A. (Ed.). Modern Methods for Business Research (pp. 295-336). New Jersey: Lawrence Erlbaum Associates.
Dawkins, J., and Lewis, S. (2003). CSR in Stakeholder Expectations: And their implication for company strategy. Journal of Business Ethics, 44(2-3), 185-193.
Deci, E. L., and Ryan, R. M. (2002). Overview of self-determination theory: An organismic dialectical perspective. Handbook of self-Determination Research, 3-33.
Eweje, G., and Bentley, T. (2006). CSR and staff retention in New Zealand companies: A Literature Review. (Department of Management and International Business Research Working Paper Series). Auckland, NZ: Massey University. Department of Management and International Business.
Gheitani, A., Imani, S., Seyyedamiri, N., and Foroudi, the, P. (2018). Mediating effect of intrinsic motivation on the relationship between Islamic work ethic, job satisfaction, and organizational commitment in banking sector. International Journal of Islamic and Middle Eastern Finance and Management, 12 (1), 76-95.
Greening, D. W., and Turban, D. B. (2000). Corporate social performance as a competitive advantage in attracting a quality workforce. Business and Society, 39(3), 254-280.
Hayati, K., and Caniago, Kansas, I. (2012). Islamic work ethic: The role of intrinsic motivation, job satisfaction, organizational commitment and job performance. Procedia-Social and Behavioral Sciences, 65, 1102-1106.
Herremans, I. M., Akathaporn, P., and McInnes, M. (1993). An Investigation of corporate social responsibility reputation and economic performance. Accounting Organizations and Society, 18(7-8), 587-604.
Hunt, L. C. (1970). The Effect of self-selection, interest, and motivation upon independent, instructional, and Frustational Levels. The Reading Teacher, 24(2), 146-158.
Hur, W. M., Moon, T. W., and Ko, S. H. (2016). How employees ' perceptions of CSR increase employee creativity: Mediating Mechanisms of compassion at work and intrinsic motivation. Journal of Business Ethics116.
Kitzmueller, the, M., and Shimshack, the, J. (2012). Economic Perspectives on corporate social responsibility. Journal of Economic Literature, 50(1), 51-84.
Lantos, G. P. (2001). The boundaries of strategic corporate social responsibility. Journal of Consumer Marketing, 18(7), 595-632.
Latham, G. P., and Pinder, C. C. (2005). Work Motivation Theory and research at the dawn of the twenty-first century. Annu. Rev. Psychol., 56, 485-516.
Liu, Y., Quan, B. T., Xu, Q., and Forrest, J. Y. L. (2019). Corporate Social Responsibility and decision analysis in a supply chain through government subsidy. Journal of Cleaner Production, 208, 436-447.
Martins, G. D. A., and Theophilo, C. R. (2007). Pole Technical-research strategies. Scientific research Methodology for applied Social Sciences. São Paulo: Atlas, 53-82.
McGuire, J. W. (1963). Business and Society. McGraw Hill.
Peterson, D. K. (2004). The relationship between perceptions of corporate citizenship and organizational commitment. Business and Society, 43(3), 296-319.
ProdaNov, C. C., and Freitas, E. C. (2013). Scientific Work Methodology: Methods and Techniques of Research and Academic Work2nd Edition. Publisher Feevale.
Rupp, D. E., Ganapathi, J., Aguilera, R. V., and Williams, C. A. (2006). Employee reactions to corporate social responsibility: AN Organizational justice framework. Journal of Organizational Behavior: The International Journal of Industrial, Occupational and Organizational Psychology and Behavior, 27(4), 537-543.
Ryan, R. M., and Deci, E. L. (2000). Self-Determination theory and the facilitation of intrinsic motivation, social development, and well-being. American Psychologist, 55(1), 68.
Skudiene, V., and Auruskeviciene, V. (2012). The Contribution of corporate social responsibility to internal employee motivation. Baltic Journal Of Management, 7(1), 49-67.
Song, H. J., Lee, H. M., Lee, C. K., and Song, S. J. (2015). The role of CSR and responsible gambling in casino employees ' organizational commitment, job satisfaction, and customer orientation. Asia Pacific Journal Of Tourism Research, 20(4), 455-471.
Tahleel Azim, M. (2016). Corporate Social Responsibility and employee behaviour: The mediator role of organizational commitment. Brazilian Journal of Business Management, 18(60).

Turban, D. B., and Greening, D. W. (1997). Corporate Social performance and organizational attractiveness to prospective employees. Academy of Management Journal, 40(3), 658-672.
Türker, D. (2009a). Measuring Corporate Social Responsibility: A Scale Development study. Journal of Business Ethics, 85(4), 411-427.
Türker, D. (2009b). How Corporate Social responsibility influences organizational commitment. Journal of Business Ethics, 89(2), 189.
White, R. W. (1959). Motivation Reconsidered THe concept of competence. Psychological Review, 66(5), 297.
Youn, H., Lee, K., and Lee, S. (2018). Effects of corporate social responsibility on employees in the casino industry. Tourism Management, 68, 328-335.
Zaman, H. M. F., In, Z., Ahmed, M., Raja, Y. M., and Marri, M. Y. K. (2013). The mediating role of intrinsic motivation between Islamic work ethics and employee job satisfaction. Journal of Business Studies Quarterly, 5(1), 93-102.

A STUDY ON DYNAMIC CAPABILITY FOR GLOBALIZATION OF REGIONAL INDUSTRY
Takao Nomakuchi Chuo University
Japan
ABSTRACT The Japanese soy sauce industry is conducting global production at factories around the world. Its taste has been improved according to the food and cuisine of each country and region. They have changed strategies and organizations according to changes in the business environment such as maturity, shrinking and globalization of the market in Japan. As a result, Japanese soy sauce is consumed all over the world. The purpose of this research is to study the Japanese soy sauce industry as a business ecosystem and to consider its dynamic capability from the case of Japanese soy sauce manufacturer. Japan's soy sauce industry has been promoting horizontal division of labor as soon as it develops. Therefore, from the case analysis, we verify that Japanese soy sauce industry pursuing different taste of each region by horizontal division of labor is creating dynamic capability in globalization.

I. INTRODUCTION
This paper provides a productive discussion of the relationship between dynamic capabilities and technology management. The Japanese soy sauce industry is conducting global production at factories around the world. Its taste has been improved according to the food and cuisine of each country and region. They have changed strategies and organizations according to changes in the business environment such as maturity, shrinking and globalization of the market in Japan. As a result, Japanese soy sauce is consumed all over the world. The purpose of this research is to study the Japanese soy sauce industry as a business ecosystem and to consider its dynamic capability from the case of Japanese soy sauce manufacturer. Japan's soy sauce industry has been promoting horizontal division of labor as soon as it develops. Therefore, from the case analysis, we verify that Japanese soy sauce industry pursuing different taste of each region by horizontal division of labor is creating dynamic capability in globalization. Iansiti and Levien(2004)[1]decided that Keystone would create value by creating open innovation on the business ecosystem by creating the health of the business ecosystem. And Keyston's code of conduct is called Keystone Strategy. Therefore, we clarify from the case that a representative Soy souece company in Japan is using Keystone Strategy. And in this paper we consider that such a business ecosystem is creating dynamic capabilities of the Japanese sauce industry in the globalization era.
Kikkoman is the keystone of the Japanese soy sauce industry and creates industry soundness and is creating a business ecosystem. Considering that Kikkoman's dense soy sauce serves as a platform to create a diversified soy sauce maker worldwide so that manufacturers can produce soy sauces of various flavors suitable for each region of each country from case studies. And this paper explains that such business ecosystem is creating dynamic capability of Japanese sauce industry in globalization era
II. PREVIOUS RESERCH
A. Keystone Strategy
Iansiti and Levien(2004)[1]decided that Keystone would create value by creating open innovation on the business ecosystem by creating the health of the business ecosystem. And Keyston's code of conduct is called Keystone Strategy.
According to Iansiti and Levien (2004) [1], there is no innovation that can be realized independently in recent years. And it is inevitable to create innovation by combining resources that will be a source of competitive advantage through symbiotic relationships with external companies. And in such a chaotic business environment where diverse industries are fused together, and various companies repeatedly collaborate and compete, the business infrastructure system based on the relationship that coexists with each other as a Business Ecosystem. Iansiti and Levien (2004) [1] mention that Keystone would create value by creating Open Innovation on the Business Ecosystem by creating the health of the Business Ecosystem. And Keyston's code of conduct is called Keystone Strategy.
According to Paine (1966) [2], there is a small number of only one species that is essential to the stability of biological communities in some cases. Sea otters, Wolves, Starfish are found to be
Keystone species. Keystone is an architectural term, an important stone that supports a building at the top of the arch. The arch collapses when you remove it. Even in the ecosystem, it was named because it is a species that greatly affects the balance of ecosystems when removed. Recognizing which species are important Keystone species in the ecosystem is very important for managing ecosystems. In the Yellowstone National Park, the wolves were extinct, so the elk increased. As the elk increased, the vegetation inside the park was disturbed and the health of the ecosystem was lost. In other words, biodiversity such as butterflies and insects were lost. So, when the wolf was reintroduced into the park, the wolf prey on the elk. By reducing Elk, the health of the ecosystem in the park has recovered, poplar forest grew, Beaver 's River Bank appeared, and the diversity of insects such as butterflies resurrected. The wolf proved to play an important role in the nature and ecosystem of Yellowstone National Park. The health of the ecosystem is biodiversity. When this is applied to business, the health of the Business Ecosystem is the diversity of niche venture. And the existence of diverse niche venture is considered to be the source of Open Innovation.
Iansiti and Levien (2004) [1] classifies participants in Business Ecosystem into the following four types.
The Keystone
Keystone can increase ecosystem productivity by simplifying the complex task of connecting network participants to one another or by making the creation of new products by third parties more efficient. They can enhance ecosystem robustness by consistently incorporating technological innovations and by providing a reliable point of reference that helps participants respond to new and uncertain conditions. And they can encourage ecosystem niche creation by offering innovative technologies to a variety of third-party organizations.
The Physical Dominator
The physical dominator aims to integrate vertically or horizontally to own and manage a large proportion of a network directly. Once the dominator becomes solely responsible for most of the value creation and capture, there is little opportunity for a meaningful ecosystem to emerge. Physical dominators, the ultimate aggressors, eventually control much of an ecosystem.
The Value Dominator
The value dominator has little direct control over its ecosystem, occupying in some cases just a single hub. It creates little, if any, value for the ecosystem; a value dominator extracts as much as it can. By sucking from the network most of the value created by other members, it leaves too little to sustain the ecosystem, which ultimately collapses and brings the value dominator down with it.
A Niche Player
In Business Ecosystems, most firms follow niche strategies. A niche player aims to develop specialized capabilities that differentiate it from other companies in the network. By leveraging complementary resources from other niche players or from an ecosystem keystone, the niche player can focus all its energies on enhancing its narrow domain of expertise. When they are allowed to thrive, niche players represent the bulk of the ecosystem and are responsible for most of the value creation and innovation.

B. Business Ecosystem and Dyamic Capability
According to Teecs(2011) [3], As new bases of competitive advantage have gained in significance, old ways of looking at competition have been supplanted. Porter’s Five Forces framework (Porter, 1980) [4], which applied the structure-performance paradigm of industrial organization economics to strategy, focused on evaluating suppliers, customers, and the threat of new entrants and/or substitute products. This framework is not without insight, but it’s not up to the task of revealing the dominant logic of value capture in most new industries, as well as many of the old. Hence, firms need to take a more comprehensive view of the environment in which they must compete. Such a view needs to include not only buyers and suppliers but the local market for skilled workers (since they are not entirely mobile internationally), universities (for access to both highly educated talent and faculty research), financial institutions (especially venture capital), the legal system (especially intellectual property law and employment law), and the domestic political situation. Figure 1 displays these factors and their interaction.
Figure 1 Dynamic Capability’s factors and interaction
Quoted from Teece (2011)
In order to embrace these new elements of competition, the Dynamic Capabilities Framework has emerged. It offers a comprehensive, multidisciplinary approach to managerial decision-making. No other framework offers, or purports to offer, a comprehensive and multidisciplinary, research-based perspective on key strategic challenges. The Dynamic Capabilities Framework helps identify the factors likely to impact enterprise performance. It is gradually developing into a (interdisciplinary) theory of the modern corporation.
According to Iansiti & Levien (2004) [5] , Many industries today behave like a massively interconnected network of organizations, technologies, consumers and products. The impact of this trend is important. In networked industrial environments like the computer industry, the performance of any organization is driven in large part by the characteristics and structure of the network, which influence the combined behavior of its many partners, competitors and customers. The operational dynamics of network industries have significant implications for practitioners, from operating managers to technology architects, and from policy makers to entrepreneurs. And this
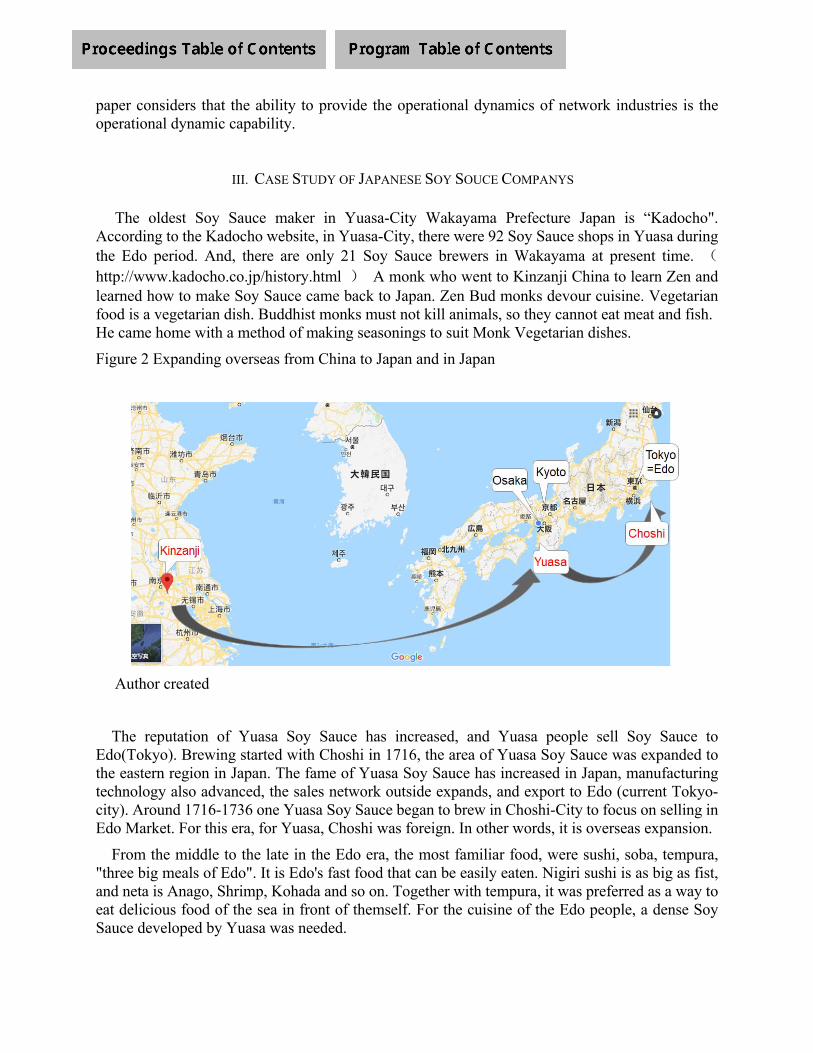
paper considers that the ability to provide the operational dynamics of network industries is the operational dynamic capability.
III. CASE STUDY OF JAPANESE SOY SOUCE COMPANYS
The oldest Soy Sauce maker in Yuasa-City Wakayama Prefecture Japan is “Kadocho". According to the Kadocho website, in Yuasa-City, there were 92 Soy Sauce shops in Yuasa during the Edo period. And, there are only 21 Soy Sauce brewers in Wakayama at present time. (http://www.kadocho.co.jp/history.html ) A monk who went to Kinzanji China to learn Zen and learned how to make Soy Sauce came back to Japan. Zen Bud monks devour cuisine. Vegetarian food is a vegetarian dish. Buddhist monks must not kill animals, so they cannot eat meat and fish. He came home with a method of making seasonings to suit Monk Vegetarian dishes.
Figure 2 Expanding overseas from China to Japan and in Japan
Author created
The reputation of Yuasa Soy Sauce has increased, and Yuasa people sell Soy Sauce to Edo(Tokyo). Brewing started with Choshi in 1716, the area of Yuasa Soy Sauce was expanded to the eastern region in Japan. The fame of Yuasa Soy Sauce has increased in Japan, manufacturing technology also advanced, the sales network outside expands, and export to Edo (current Tokyo-city). Around 1716-1736 one Yuasa Soy Sauce began to brew in Choshi-City to focus on selling in Edo Market. For this era, for Yuasa, Choshi was foreign. In other words, it is overseas expansion.
From the middle to the late in the Edo era, the most familiar food, were sushi, soba, tempura, "three big meals of Edo". It is Edo's fast food that can be easily eaten. Nigiri sushi is as big as fist, and neta is Anago, Shrimp, Kohada and so on. Together with tempura, it was preferred as a way to eat delicious food of the sea in front of themself. For the cuisine of the Edo people, a dense Soy Sauce developed by Yuasa was needed.

The city of Noda is ideally situated close to soybean-growing regions as well as the Edo River, which provided a convenient transportation route to and from Edo (present-day Tokyo). Noda has been well-known for its Soy Sauce production since the Edo period (1603–1867).
Figure 2 Movement from Choshi to Noda for market access
Author created
The city of Noda-City is ideally situated close to soybean-growing regions as well as the Edo River, which provided a convenient transportation route to and from Edo (present-day Tokyo).
Noda has been well-known for its Soy Sauce production since the Edo period (1603–1867). In December 1917, eight family run companies with capital of ¥7 million merged to form Noda Soy Source Company, the predecessor of Kikkoman Corporation. (According to Kikkoman Annual Report 2018 [6])
The Soy Sauce of Kikkoman is made all over the world as Figure 3 below.
Figure 3 Kikkoman's overseas factory
Quoted from Kikkoman Annual Report 2018 [6]

The following Figure 4 shows the various colors of typical Japanese Soy Sauce in Japan.
Figure 4 Variation of Japanese Soy Sauce Colors
Quoted from Fukudome & Utsunomiya(2015) [7]
For example, Light Soy Sauce does not erase the color of the Kyoto Monks Vegetarian dish, do not hide its taste. The most famous production area of light Soy sauce is Tatsuno-City. Originally, Tatsuno was making alcohol. By abandoning sake and specializing in light mouth Soy Sauce, They developed proprietary technology that can deal with light taste such as Kyoto's refined cuisine as light-colored Soy Sauce that is not colored in other areas, not producing in other areas, coloring dishes. Soy sauce of Tatsuno also crossed the sea from Yuasa.
Figure5 Crossed the sea from Yuasa to Tatsuno.
Author created
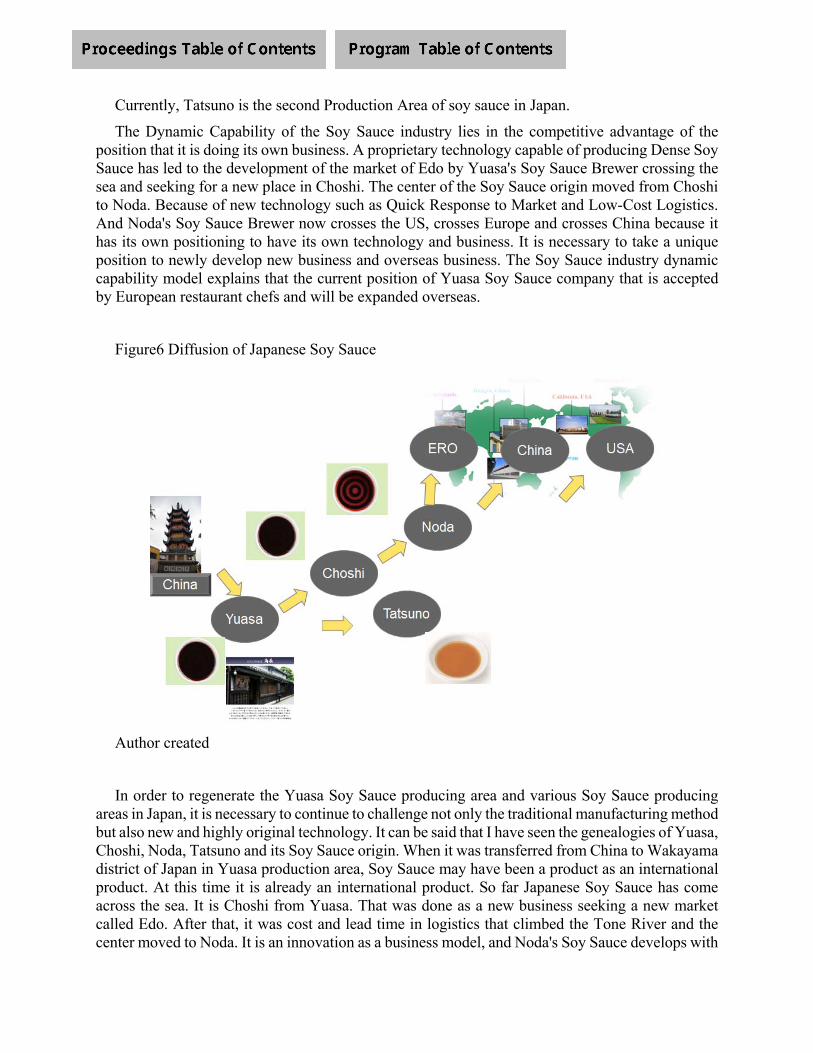
Currently, Tatsuno is the second Production Area of soy sauce in Japan.
The Dynamic Capability of the Soy Sauce industry lies in the competitive advantage of the position that it is doing its own business. A proprietary technology capable of producing Dense Soy Sauce has led to the development of the market of Edo by Yuasa's Soy Sauce Brewer crossing the sea and seeking for a new place in Choshi. The center of the Soy Sauce origin moved from Choshi to Noda. Because of new technology such as Quick Response to Market and Low-Cost Logistics. And Noda's Soy Sauce Brewer now crosses the US, crosses Europe and crosses China because it has its own positioning to have its own technology and business. It is necessary to take a unique position to newly develop new business and overseas business. The Soy Sauce industry dynamic capability model explains that the current position of Yuasa Soy Sauce company that is accepted by European restaurant chefs and will be expanded overseas.
Figure6 Diffusion of Japanese Soy Sauce
Author created
In order to regenerate the Yuasa Soy Sauce producing area and various Soy Sauce producing areas in Japan, it is necessary to continue to challenge not only the traditional manufacturing method but also new and highly original technology. It can be said that I have seen the genealogies of Yuasa, Choshi, Noda, Tatsuno and its Soy Sauce origin. When it was transferred from China to Wakayama district of Japan in Yuasa production area, Soy Sauce may have been a product as an international product. At this time it is already an international product. So far Japanese Soy Sauce has come across the sea. It is Choshi from Yuasa. That was done as a new business seeking a new market called Edo. After that, it was cost and lead time in logistics that climbed the Tone River and the center moved to Noda. It is an innovation as a business model, and Noda's Soy Sauce develops with
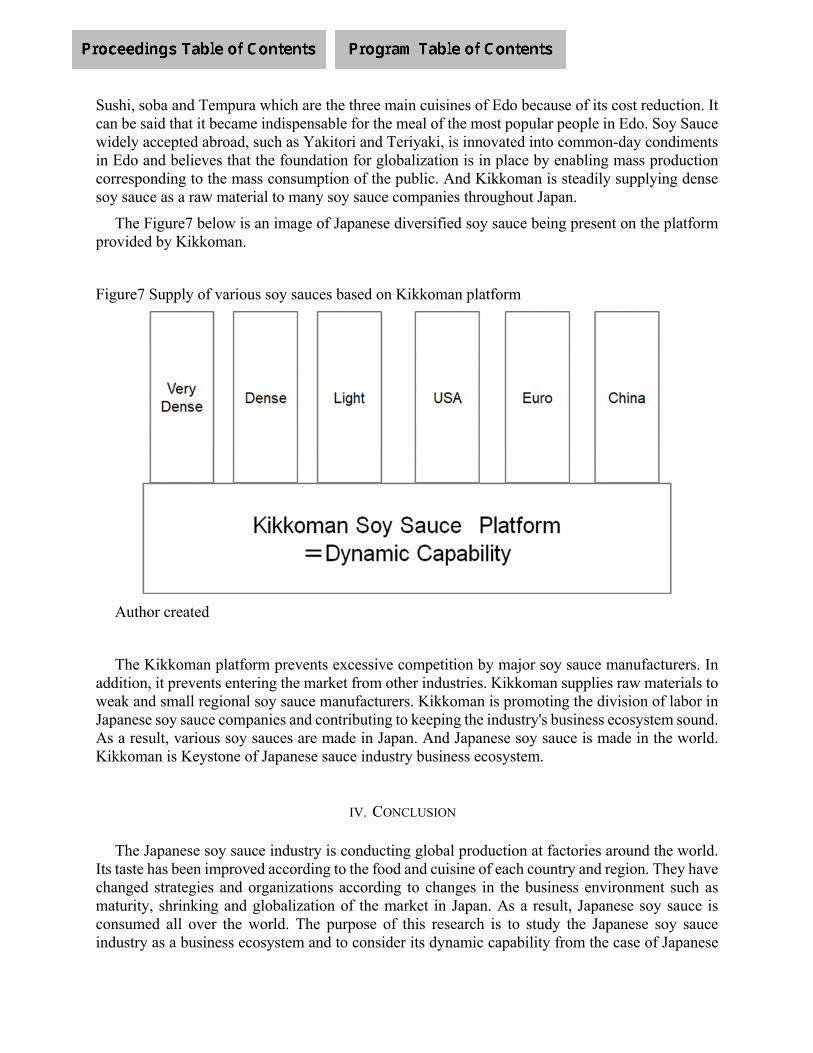
Sushi, soba and Tempura which are the three main cuisines of Edo because of its cost reduction. It can be said that it became indispensable for the meal of the most popular people in Edo. Soy Sauce widely accepted abroad, such as Yakitori and Teriyaki, is innovated into common-day condiments in Edo and believes that the foundation for globalization is in place by enabling mass production corresponding to the mass consumption of the public. And Kikkoman is steadily supplying dense soy sauce as a raw material to many soy sauce companies throughout Japan.
The Figure7 below is an image of Japanese diversified soy sauce being present on the platform provided by Kikkoman.
Figure7 Supply of various soy sauces based on Kikkoman platform
Author created
The Kikkoman platform prevents excessive competition by major soy sauce manufacturers. In addition, it prevents entering the market from other industries. Kikkoman supplies raw materials to weak and small regional soy sauce manufacturers. Kikkoman is promoting the division of labor in Japanese soy sauce companies and contributing to keeping the industry's business ecosystem sound. As a result, various soy sauces are made in Japan. And Japanese soy sauce is made in the world. Kikkoman is Keystone of Japanese sauce industry business ecosystem.
IV. CONCLUSION
The Japanese soy sauce industry is conducting global production at factories around the world. Its taste has been improved according to the food and cuisine of each country and region. They have changed strategies and organizations according to changes in the business environment such as maturity, shrinking and globalization of the market in Japan. As a result, Japanese soy sauce is consumed all over the world. The purpose of this research is to study the Japanese soy sauce industry as a business ecosystem and to consider its dynamic capability from the case of Japanese
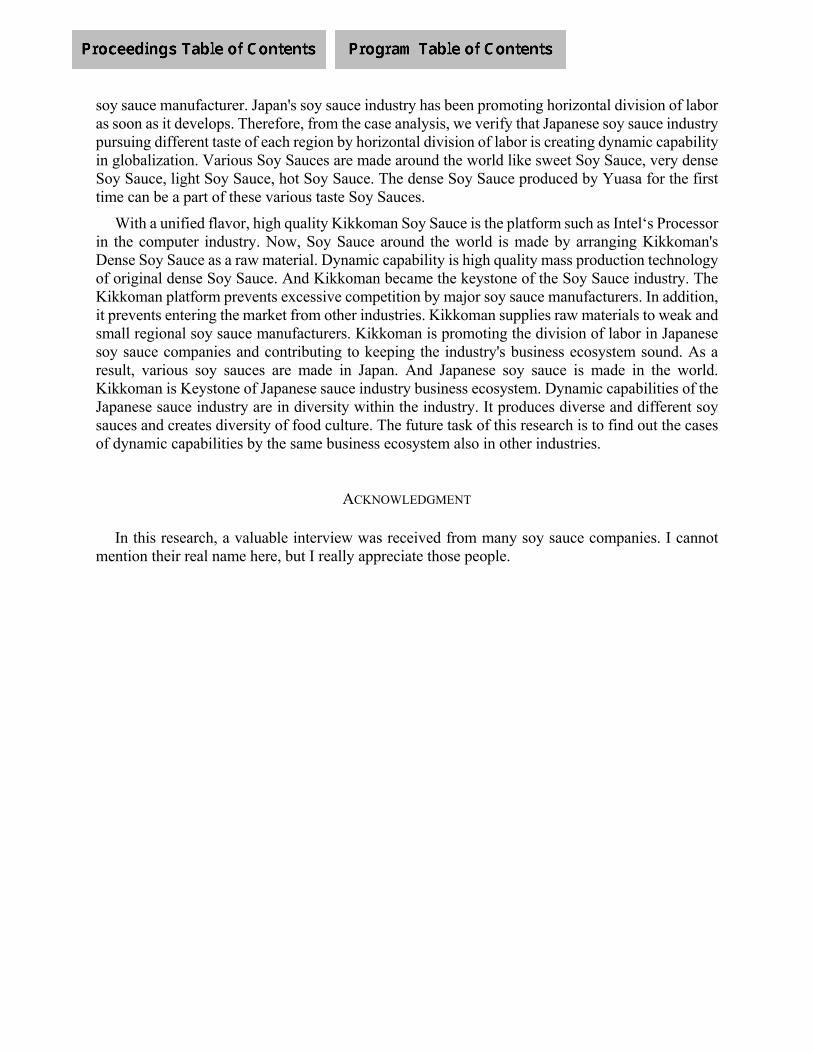
soy sauce manufacturer. Japan's soy sauce industry has been promoting horizontal division of labor as soon as it develops. Therefore, from the case analysis, we verify that Japanese soy sauce industry pursuing different taste of each region by horizontal division of labor is creating dynamic capability in globalization. Various Soy Sauces are made around the world like sweet Soy Sauce, very dense Soy Sauce, light Soy Sauce, hot Soy Sauce. The dense Soy Sauce produced by Yuasa for the first time can be a part of these various taste Soy Sauces.
With a unified flavor, high quality Kikkoman Soy Sauce is the platform such as Intel‘s Processor in the computer industry. Now, Soy Sauce around the world is made by arranging Kikkoman's Dense Soy Sauce as a raw material. Dynamic capability is high quality mass production technology of original dense Soy Sauce. And Kikkoman became the keystone of the Soy Sauce industry. The Kikkoman platform prevents excessive competition by major soy sauce manufacturers. In addition, it prevents entering the market from other industries. Kikkoman supplies raw materials to weak and small regional soy sauce manufacturers. Kikkoman is promoting the division of labor in Japanese soy sauce companies and contributing to keeping the industry's business ecosystem sound. As a result, various soy sauces are made in Japan. And Japanese soy sauce is made in the world. Kikkoman is Keystone of Japanese sauce industry business ecosystem. Dynamic capabilities of the Japanese sauce industry are in diversity within the industry. It produces diverse and different soy sauces and creates diversity of food culture. The future task of this research is to find out the cases of dynamic capabilities by the same business ecosystem also in other industries.
ACKNOWLEDGMENT
In this research, a valuable interview was received from many soy sauce companies. I cannot mention their real name here, but I really appreciate those people.

REFERENCES
[1] Iansiti, M. and Levien, R.(2004)Strategy as Ecology, Harvard Business Review March, Vol.82, No.3, pp.68-78.
[2] Paine, R.T. (1966) Food web complexity and species diversity, Amer. Naturalist Vol.100, pp.65-75.
[3] Teece, David, J.(2011) Dynamic capabilities: A guide for managers, IVEY BUSINESS JURNAL, March / April 2011, https://iveybusinessjournal.com/publication/dynamic-capabilities-a-guide-for-managers/(accessed 2018-01-21)
[4] Porter, M. E. (1980). Competitive Strategy: Techniques for Analyzing Industries and Competitors. New York:Free Press.
[5] Iansiti, M. and Levien, R.(2004)Keystones and Dominators: Framing Operating and Technology Strategy in a Business Ecosystem, Harverd Business School Working Paper, pp3-61.
[6] Kikkoman(2018) Annual Report 2018, http://www.kikkoman.com/en/finance/library/annual/index.htmlG. (accessed 2018-01-21)
[7] Fukudome, Nami, ami Utsunomiya, Yuka (2015) Soy sauce and regional cuisine Regional characteristics of soy sauce seen from local cuisine, FOOD CULTURE No.26, pp.8-25.
CHARACTERISTICS OF JAPANESE LIFE INSURANCE COMPANIES
DISCLOSING EMBEDDED VALUE
TSUKAHARA, Makoto(Teikyo University)i
NISHIYAMA Kazuhiro(Teikyo University)ii
NAKAMURA Ryosuke(University of Tsukuba)iii
[Abstract]iv
In this paper, we analyze the disclosure of Embedded Value (EV) information by Japanese
firms with life insurance operations to examine the characteristics that promote unregulated
disclosure. As a result of the analysis, we found that companies with a larger solvency-margin
ratio (disclosure is required by a statutory solvency standard in Japan) and smaller profits tend
to disclose EV. Thus, based on the information required in statutory accounting, companies
that perceive that their operating and financial positions are not properly valued voluntarily
report EV. This suggests that companies try to eliminate information asymmetry through the
disclosure. Furthermore, this result was observed in Japan, where several life insurance
companies are structured as mutual companies. This suggests that life insurance companies
disclose EV for stakeholders other than shareholders. Therefore, we found the role of EV is
different from that described in previous research focusing on value relevance.
i Teikyo University; [email protected]; Japan. ii Teikyo University; [email protected]; Japan. iii University of Tsukuba, [email protected], Japan iv We would like to thank Editage (www.editage.jp) for English language editing.
1. Introduction
Embedded Value (EV) refers to unregulated disclosure to report an estimate of the present
value of future net cash flows from an in-force life insurance covered business. Disclosing EV
allows for the quantification of the value of an in-force covered business. EV is a forward-
looking measure that captures the expected net value of the underlying contracts signed by the
insurer, and is a component of equity, with profits calculated as the change in equity between
two consecutive periods (Serafeim, 2011).
Prior studies have mainly discussed the role of the information in the stock market (Horton,
2007; Almezweq and Liu, 2013; Tudini et al., 2011; Gerstner et al., 2015). These studies
consider the relevance of EV from an international perspective, and describe how EV
disclosure reduces information asymmetry between investors (especially shareholders) and
management. However, in insurance settings, the possibility exists that some incentives for EV
disclosure have more to do with policyholders than with investors. In Japan, studies have
described a number of life insurers that disclose EV, including some non-listed and mutual
companies (Nakamura and Nishiyama, 2014). For this reason, we focus on Japanese life
insurers in this paper. In other words, it is often assumed life insurance companies aim to inform
shareholders when they disclose EV; however, some Japanese mutual companies do not have
any shareholders. Why, then, would they disclose EV? Focusing on life insurance companies
in Japan may help shed light on other incentives for disclosing EV.
First, we discuss the definitions and roles of EV disclosure. Second, we investigate how
companies are disclosing EV in Japan. Next, we refer to prefaces, and through multivariate
analysis, determine the features of life insurers disclosing EV. We set the hypothesis that the
incentive for EV disclosure does not arise from shareholders but from other stakeholders, such
as policyholders. In other words, company managers who believe that GAAP valuations are
not appropriate will voluntarily disclose EV. At the end of this paper, we discuss the
probabilities of EV disclosure without stakeholders.
2. Embedded value
2.1 EV
EV generally has several components, such as the present value of future shareholders’ cash
flows from the in-force covered business (PVIF) plus required capital, less the cost of holding
the capital, plus free surplus allocated to the business. EV disclosure recognizes the value of
new business and any unexpected change in the in-force covered business in the year it occurs.
As such, EV is considered a leading indicator of future changes in accounting earnings (El-
Gazzar et al., 2015). Both components, PVIF and required capital, are measured on an
economic value (market price) basis. EV is said to be based on the corporate valuation method
developed during the M&A of a life insurance company (Serafeim, 2011).
The concept of Appraisal Value (AV), based on discounted cash flow, approximates the

shareholder value of EV. However, since AV will also include revenue from contracts expected
to be acquired in the future, it is difficult for it to be the optimal corporate value indicator. In
that respect, EV is a more objective evaluation index because it limits the measurement target
to the in-force covered business.
Furthermore, in the calculation of the value of the in-force covered business, sensitivities have
been published on how changes in preconditions affect the EV. In addition to this, a statement
by a third-party organization (actuary firm) is attached to the EV disclosure, and the
assumptions, calculation method, and results are verified (Ishizaka, 2009). Thus, a certain
degree of credibility and objectivity is attached to EV.
2.2 Types of EV
EV is classified into three types: Traditional (TEV), European (EEV), and Market Consistent
(MCEV),1 depending on the method of measurement. TEV was developed in the 1990s by the
CFO Forum, a group of Chief Financial Officers (CFOs) from major European life insurance
companies. However, in TEV valuation there were disagreements about how to estimate the
value of the in-force covered business, leading to concerns about comparability in the
beginning (CFO Forum, 2016b). In response to this disagreement, in May of 2004, the CFO
Forum defined the EEV principle for the purpose of standardization (CFO Forum, 2016a). The
EEV principle was standardized by establishing uniform provisions for calculating the values
of in-force covered businesses that had variations. However, this modification did not
completely allay concerns about unification in the methods of calculation. For example, it has
been pointed out that some discretion is permitted in the decision about the discount rate used
to evaluate the value of an in-force covered business (CFO Forum, 2016b).
Under these circumstances, the CFO Forum developed MCEV in June of 2008, in response to
criticism of the EEV principle. Unlike EEV, MCEV uses risk-free rates for future return and
discount rates to calculate the value of an in-force covered business. At first, the idea was to
require all members of the CFO Forum to disclose MCEV (CFO Forum, 2009). However, even
now, disclosure is not required, perhaps because the 2008 Lehman Brothers-triggered financial
crisis caused the future profits of new contracts to be negative or precipitated large fluctuations
in MCEV for some companies. After the crisis, in April 2011, the CFO Forum withdrew its
idea, and thereafter, the use of MCEV has been limited to publication as one of the EVs.Today,
companies have some discretion about the EV content of disclosures, as long as they show the
calculation methods, assumptions, and sensitivities for both EEV and MCEV. (CFO Forum,
2016a; CFO Forum, 2016b).
2.3 Limitation of GAAP disclosure
1 Copyright© Stitching CFO Forum Foundation 2008.
In the life insurance industry, there are two main viewpoints on statutory accounting GAAP
limitations that stem mainly from peculiarities in business models and practices. The first
viewpoint is as follows. There is typically a peak of cumulative cash outflow up to the point of
sale and even beyond if initial commissions, policy record-keeping, and administration costs
exceed initial premiums. This is followed by a steady level of cash inflows (premiums less
ongoing expenses) that grow with reinvestment, and, finally, by a large cash outflow at
termination. The primary returns of life insurers are often recognized later in long-term
contracts. On the other hand, the costs are concentrated when the contract is acquired. Initial
costs are incurred to acquire a new contract, which puts pressure on performance. The
investment is realized as profit in a later stage of the contract, but then matching of income and
expenses cannot be fulfilled. Therefore, statutory accounting is said to be unsuitable for
evaluating the performance of life insurance companies (Sumitomo Mitsui Aioi Life Insurance,
2017).
The second viewpoint is related to limits in the evaluation of some insurance liabilities
recorded at the time of contract acquisition. The “reserve,” which is estimated and recorded
as a liability in preparation for future insurance payments, is often calculated based on
assumptions at the time of the contract. However, then, it may not be possible to make
changes in response to the latest economic developments and the continuity rate. Therefore,
accounting information may not provide a sufficient basis for the determination of corporate
value during an M&A (Hoshino, 2018).
To address these statutory accounting limitations, EV disclosures in the life insurance
industry are beginning to consider future cash flow generated from the in-force covered
business, with the idea that this approach to EV disclosure is more relevant and credible than
statutory accounting (IFRS4, BC140). However, concerns about comparability remain, as
mentioned above (IFRS 4, BC141).
2.4 EV disclosure in Japan
This section shows the results of a survey about EV disclosure in Japan. By the end of
July, 2018, we surveyed 41 companies belonging to The Life Insurance Association of Japan
(including those companies that were consolidated in the past). Most of these companies
disclose EVs in their published annual reports and press releases. Based on the survey
findings, we investigated EV disclosures in annual reports from the fiscal year ending in
March of 2009 to the fiscal year ending in March of 2018. If EV was disclosed, we
documented what kind of EV was disclosed. The sample based on the above criteria was 400
companies per year.
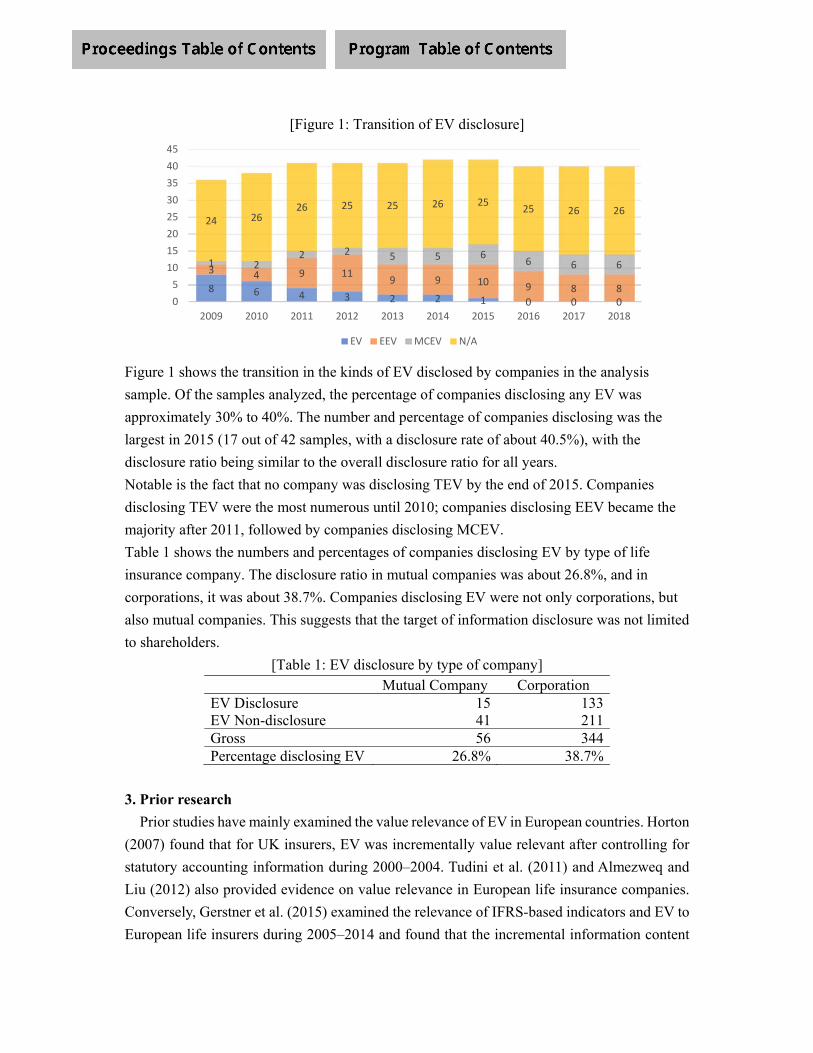
[Figure 1: Transition of EV disclosure]
Figure 1 shows the transition in the kinds of EV disclosed by companies in the analysis
sample. Of the samples analyzed, the percentage of companies disclosing any EV was
approximately 30% to 40%. The number and percentage of companies disclosing was the
largest in 2015 (17 out of 42 samples, with a disclosure rate of about 40.5%), with the
disclosure ratio being similar to the overall disclosure ratio for all years.
Notable is the fact that no company was disclosing TEV by the end of 2015. Companies
disclosing TEV were the most numerous until 2010; companies disclosing EEV became the
majority after 2011, followed by companies disclosing MCEV.
Table 1 shows the numbers and percentages of companies disclosing EV by type of life
insurance company. The disclosure ratio in mutual companies was about 26.8%, and in
corporations, it was about 38.7%. Companies disclosing EV were not only corporations, but
also mutual companies. This suggests that the target of information disclosure was not limited
to shareholders.
[Table 1: EV disclosure by type of company] Mutual Company Corporation EV Disclosure 15 133 EV Non-disclosure 41 211 Gross 56 344 Percentage disclosing EV 26.8% 38.7%
3. Prior research
Prior studies have mainly examined the value relevance of EV in European countries. Horton
(2007) found that for UK insurers, EV was incrementally value relevant after controlling for
statutory accounting information during 2000–2004. Tudini et al. (2011) and Almezweq and
Liu (2012) also provided evidence on value relevance in European life insurance companies.
Conversely, Gerstner et al. (2015) examined the relevance of IFRS-based indicators and EV to
European life insurers during 2005–2014 and found that the incremental information content
8 6 4 3 2 2 1 0 0 0
3 4 9 119 9 10 9 8 8
1 22 2 5 5 6
6 6 6
24 2626 25 25 26 25
25 26 26
0
5
10
15
20
25
30
35
40
45
2009 2010 2011 2012 2013 2014 2015 2016 2017 2018
EV EEV MCEV N/A
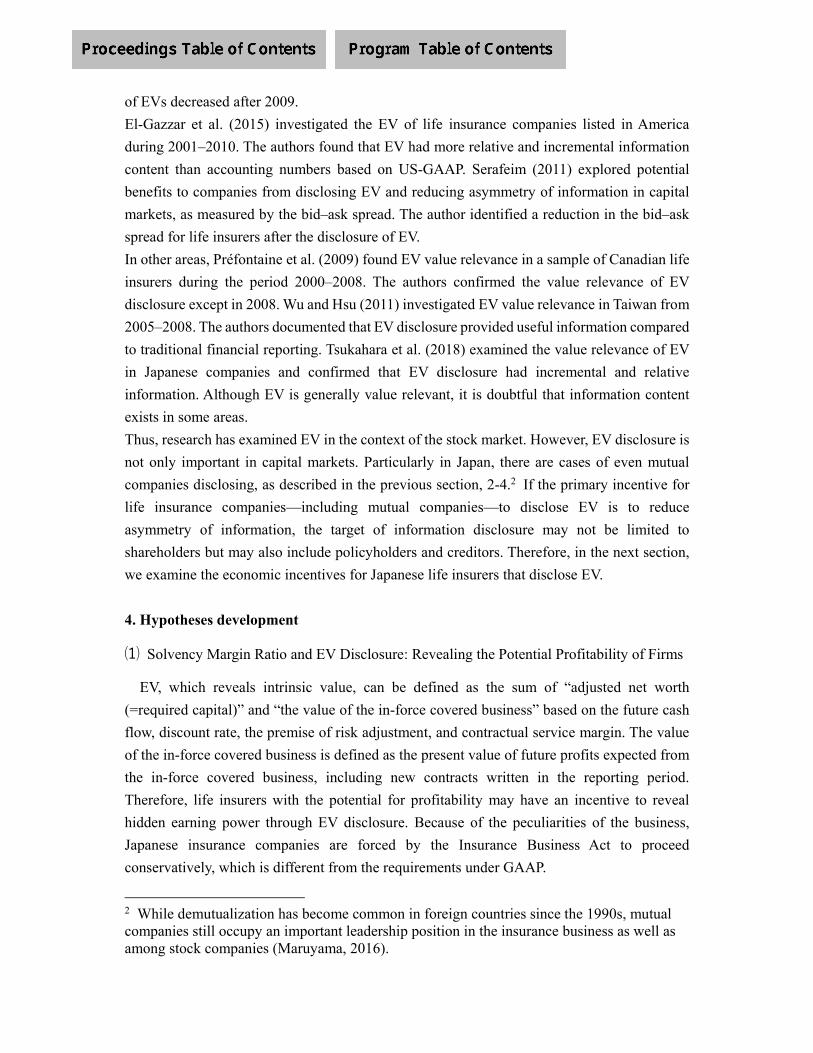
of EVs decreased after 2009.
El-Gazzar et al. (2015) investigated the EV of life insurance companies listed in America
during 2001–2010. The authors found that EV had more relative and incremental information
content than accounting numbers based on US-GAAP. Serafeim (2011) explored potential
benefits to companies from disclosing EV and reducing asymmetry of information in capital
markets, as measured by the bid–ask spread. The author identified a reduction in the bid–ask
spread for life insurers after the disclosure of EV.
In other areas, Préfontaine et al. (2009) found EV value relevance in a sample of Canadian life
insurers during the period 2000–2008. The authors confirmed the value relevance of EV
disclosure except in 2008. Wu and Hsu (2011) investigated EV value relevance in Taiwan from
2005–2008. The authors documented that EV disclosure provided useful information compared
to traditional financial reporting. Tsukahara et al. (2018) examined the value relevance of EV
in Japanese companies and confirmed that EV disclosure had incremental and relative
information. Although EV is generally value relevant, it is doubtful that information content
exists in some areas.
Thus, research has examined EV in the context of the stock market. However, EV disclosure is
not only important in capital markets. Particularly in Japan, there are cases of even mutual
companies disclosing, as described in the previous section, 2-4.2 If the primary incentive for
life insurance companies—including mutual companies—to disclose EV is to reduce
asymmetry of information, the target of information disclosure may not be limited to
shareholders but may also include policyholders and creditors. Therefore, in the next section,
we examine the economic incentives for Japanese life insurers that disclose EV.
4. Hypotheses development
⑴ Solvency Margin Ratio and EV Disclosure: Revealing the Potential Profitability of Firms
EV, which reveals intrinsic value, can be defined as the sum of “adjusted net worth
(=required capital)” and “the value of the in-force covered business” based on the future cash
flow, discount rate, the premise of risk adjustment, and contractual service margin. The value
of the in-force covered business is defined as the present value of future profits expected from
the in-force covered business, including new contracts written in the reporting period.
Therefore, life insurers with the potential for profitability may have an incentive to reveal
hidden earning power through EV disclosure. Because of the peculiarities of the business,
Japanese insurance companies are forced by the Insurance Business Act to proceed
conservatively, which is different from the requirements under GAAP.
2 While demutualization has become common in foreign countries since the 1990s, mutual companies still occupy an important leadership position in the insurance business as well as among stock companies (Maruyama, 2016).

According to Usui (2012), highly-capitalized liabilities such as policy reserves and reserves for
outstanding claims, policyholder dividends, and price fluctuations accounted for 85.5% of total
debt in the 2006 industry average. Additionally, securities held by non-financial companies as
appropriate policy reserves accounted for 73.7% of total assets. EV is constructed such that it
cannot be explained through statutory accounting. Thus, differences between the results of
statutory accounting and the actual performance of life insurers may create an incentive for
companies to disclose EV. A profound difference lies in the treatment of the highly capitalized
reserves included in the liability. Therefore, insurance companies announce adjusted net assets,
which refer to highly capitalized liability plus net assets as the solvency margin ratio—an
indicator of financial soundness.3
The solvency margin ratio is an index that reveals the payment capacity for risk beyond forecast.
It consists of the "total amount of solvency margin" that is provided, which is calculated by
adding a highly capital reserve, and so on. Specifically, it is calculated as follows.
solvency margin ratiototal amount of solvency margin
total amount of risks 12
【Table 2: Components of total amount of solvency margin】
ASSETS General allowance for doubtful accounts
LIABILITIES Excess of premium reserve
Contingency reserve
Price fluctuation reserve
Catastrophe loss reserve
Subordinated debt, etc.
NET ASSETS Shareholders' equity
OFF-BALANCE IT
EMS
Unrealized gains (losses) on land
Unrealized gains (losses) on available-
for-sale securities and deferred gains
(losses) on
hedge transactions (before tax effect
deductions)
Total amount of unrecognized actuarial
3 The solvency margin ratio was introduced in the revised Insurance Business Act in 1995 and was required to be disclosed by life insurance companies in 1997. The laws and regulations concerning calculation were revised at the end of 2011 to make risk measurement more rigorous.

difference and unrecognized prior service
costs
(before tax effect deductions)
A high solvency margin ratio means that the liquidity of the company is high. However, the
liability is transferred to revenue if no payment events occur beyond the forecast. Taking this
into consideration, a company with a high solvency margin ratio may potentially be profitable.
Based on this ratio, the regulatory agency in Japan uses 200% as a criterion for early corrective
action. However, when the business of Daiwa Life failed in 2008, the solvency margin ratio
was as high as 555%. This case raised doubts about the credibility of the ratio itself.
The Financial Service Agency of Japan treats the solvency margin based on economic value as
equivalent to Europe's Solvency II from a long-term perspective (Financial Services Agency,
2007). On the other hand, EV has a property in common with the total solvency margin, in that
they are both components of ‘adjusted net worth’. As described earlier, by incorporating the
value of the in-force covered business, the EV may have a greater power to predict potential
profitability than the solvency margin ratio. Therefore, companies with high potential
profitability have a high solvency margin ratio and may have an incentive to disclose EV as an
additional signal of high potential profitability and strong financial health.
Hypothesis 1: Life insurance companies with higher solvency margin ratios disclose EV.
(2) Financial indicators and EV disclosure: Underestimation of profitability and liquidity
In statutory accounting, there is a temporal difference between the signing of new contracts
and accounting revenue recognition, and the cancellation takes a very long time. Therefore, EV
is used as a reference that recognizes future profit from winning new contracts.4 In other words,
companies that have lower reported earnings may continue to permanently disclose EV to
signal potential profitability and thus, enhance the fairness of evaluations.
Hypothesis 2-1: Life insurance companies with smaller accounting earnings disclose EV.
Furthermore, we consider the possibility that EV is a supplement to general liquidity indicators.
One of the administrative supervisory indicators for determining the financial health of life
insurance companies is "adjusted net assets." The index equals assets that include the
4 Jacob et al. (2017) maintained that development of the EV measure was driven largely by concerns within the international life insurance industry about the mismatch between accounting results and economic performance because of delayed recognition of revenues and expenses and the mismatch between the valuation bases for assets (fair values) and liabilities (estimated future benefits). Transactions that affect the long-term value of a life insurer are recognized immediately in EV but may be deferred under accounting conventions.

unrealized gains on securities and real estate minus liabilities. It is considered a substantial
equity capital after evaluating the market value (Japanese Insurance Business Act, par.132;
Taiyo Life Insurance, 20185).
“Adjusted net assets” is an indicator of payment capacity with the assumption of immediate
liquidation. However, it does not reflect information on future earnings equivalent to the “value
of the in-force covered business” disclosed in the EV. Therefore, life insurance companies
whose liquidity indicators are worse when based solely on adjusted net assets may have a
stronger incentive to disclose EV; else, they face the possibility of inappropriate evaluations
from stakeholders.
Hypothesis 2-2: Life insurance companies with lower adjusted net assets disclose EV.
5. Sample selection and research design
5.1 Sample selection
The samples used in the analysis were as follows: (1) firms listed in the “Nikkei Value Search”
provided by Nikkei Inc.(2) firms belonging to the sample period (2009–2018) that could be
acquired through the database,6 (3) firms classified as "life insurance" in the industry minor
classification, (4) firms with financial and non-financial data required for verification, (5) firms
that were part of this group after 2011, when the calculation standard for the solvency margin
ratio was changed. In addition, non-financial data required for verification were manually
collected from the “Annual Report”7 published by the insurance company. According to El-
Gazzar et al. (2015), US companies (except those listed in the US with a cross-listing) do not
disclose EV. Therefore, they were excluded from the sample.
5.2 Research design
In this paper, we performed multiple regression analysis with the EV disclosure dummy as
the dependent variable and the elements set in the hypothesis as the explanatory variables.
𝑃𝑟𝑜𝑏 𝐷𝑖𝑠𝑐𝐷 , 1 𝛼 𝛽 𝑆𝑜𝑙𝑣𝑒𝑛𝑐𝑦 , 𝛽 𝑅𝑂𝐴 , 𝛽 𝐸𝑞𝑢𝑖𝑡𝑦 , 𝛽 𝐿𝑛𝐴𝑠𝑠𝑒𝑡 ,
𝛽 𝑀𝑎𝑟𝑘𝑒𝑡 , Σ𝑌𝑒𝑎𝑟 𝜖 ,
We analyzed panel data and did not distinguish between the first, second, and subsequent years
5 https://www.taiyo-seimei.co.jp/company/ir/total_equity.html 6 The sample period is from 2009, as the target of the Nikkei Value Search is for the latest nine periods. 7 An Annual Report is a disclosure document mandated by the Insurance Business Act. EV is defined as information voluntarily disclosed in this document.

of disclosure. In other words, we assumed that firm managers believe that information is not
sufficiently provided by the compulsory disclosure of EV in the expectation of continuous
disclosure effects.
Based on Hypothesis 1, companies with a higher solvency margin ratio (𝑆𝑜𝑙𝑣𝑒𝑛𝑐𝑦 , ) tend to
disclose EV, so 𝛽 is expected to be positive. Additionally, based on hypothesis 2, companies
are more likely to disclose EV, since the index based on accounting information is worse. That
is, lower the profitability (𝑅𝑂𝐴 , ) and lower the equity ratio (𝐸𝑞𝑢𝑖𝑡𝑦 , ), the more companies
disclose EV. Thus, 𝛽 and 𝛽 are expected to be negative.
In addition, 𝐿𝑛𝐴𝑠𝑠𝑒𝑡 , and 𝑀𝑎𝑟𝑘𝑒𝑡 , are set to control firm size and listing status
(including the status of the parent company). Based on the agency cost hypothesis (Ng and
Koh, 1994), large companies depend heavily on external capital. Such companies may seek to
reduce the agency costs associated with scaling by actively disclosing information.
Additionally, based on the political cost hypothesis (Inchausti, 1997), the larger the firm is,
the greater the political cost; it is expected that information disclosure will reduce this cost.
Therefore, it is expected that coefficient 𝛽 for firm size (𝐿𝑛𝐴𝑠𝑠𝑒𝑡 , ) will be positive.
EV is an indicator of corporate value in the stock market. Therefore, managers of listed life
insurance companies have an incentive to disclose EV to represent an appropriate valuation of
the company.
As in Section 3, when a parent company discloses EV, other companies in the group will also
disclose the same type of EV. Therefore, 𝑀𝑎𝑟𝑘𝑒𝑡 , 1 is also applied to subsidiaries of
listed companies. Finally, an annual dummy is added to control the annual effect. The
definitions of variables are summarized in Table 3.
Table 3: Variable definition Variable Definition
𝐷𝑖𝑠𝑐𝐷 , 1 A dummy variable that is 1 if firm i disclosed the EV at the end of term t and 0 otherwise.
Dependent variable
𝑆𝑜𝑙𝑣𝑒𝑛𝑐𝑦 , Firm i's solvency margin ratio at the end of the year t.
Hypothesis 1
𝑅𝑂𝐴 , Firm i's net income at the end of the year t divided by total assets at the end of the year t-1.
Hypothesis 2-1
𝐸𝑞𝑢𝑖𝑡𝑦 , Firm i's adjusted net worth (required capital) at end of year t divided by total assets at end of year t.
Hypothesis 2-2
𝐿𝑛𝐴𝑠𝑠𝑒𝑡 , Natural logarithm of the firm i's total assets at the end of year t.
Control variable
Market , A dummy variable that is 1 if firm i is listed on a Japanese stock market at the end of year t or is a subsidiary of a listed insurance company and 0 otherwise.
Control variable
𝑌𝑒𝑎𝑟 Year dummy. Control variable
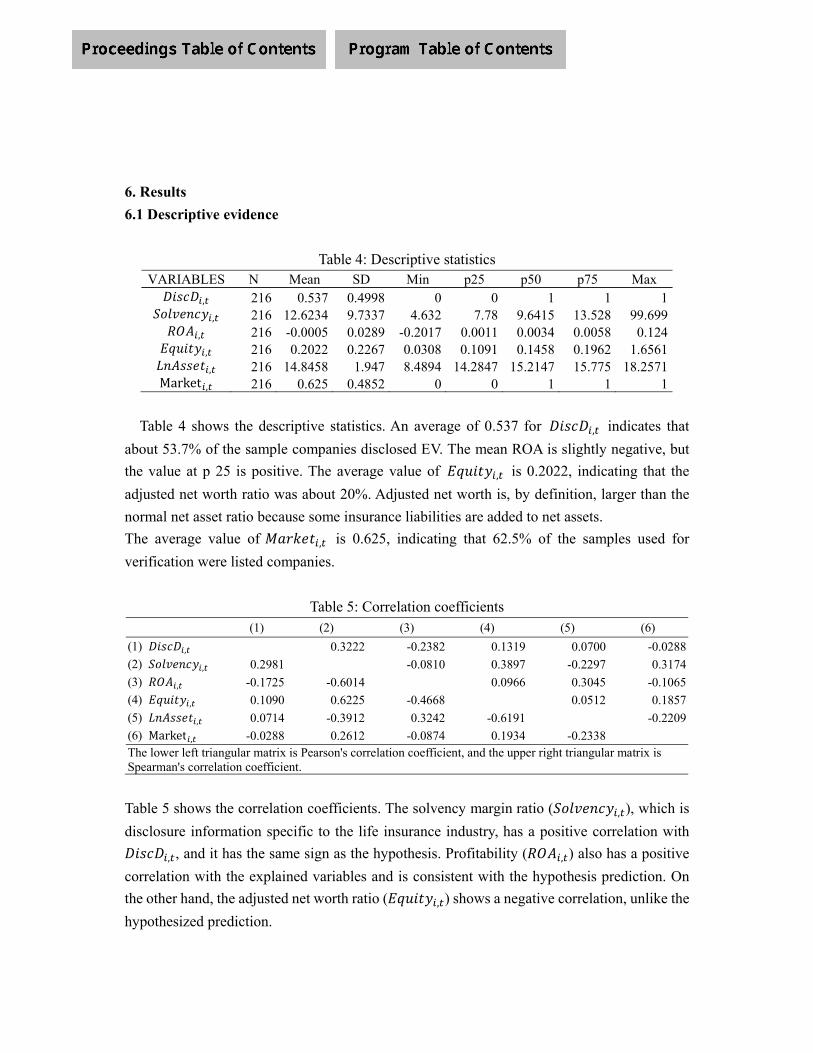
6. Results
6.1 Descriptive evidence
Table 4: Descriptive statistics VARIABLES N Mean SD Min p25 p50 p75 Max
𝐷𝑖𝑠𝑐𝐷 , 216 0.537 0.4998 0 0 1 1 1𝑆𝑜𝑙𝑣𝑒𝑛𝑐𝑦 , 216 12.6234 9.7337 4.632 7.78 9.6415 13.528 99.699
𝑅𝑂𝐴 , 216 -0.0005 0.0289 -0.2017 0.0011 0.0034 0.0058 0.124𝐸𝑞𝑢𝑖𝑡𝑦 , 216 0.2022 0.2267 0.0308 0.1091 0.1458 0.1962 1.6561
𝐿𝑛𝐴𝑠𝑠𝑒𝑡 , 216 14.8458 1.947 8.4894 14.2847 15.2147 15.775 18.2571Market , 216 0.625 0.4852 0 0 1 1 1
Table 4 shows the descriptive statistics. An average of 0.537 for 𝐷𝑖𝑠𝑐𝐷 , indicates that
about 53.7% of the sample companies disclosed EV. The mean ROA is slightly negative, but
the value at p 25 is positive. The average value of 𝐸𝑞𝑢𝑖𝑡𝑦 , is 0.2022, indicating that the
adjusted net worth ratio was about 20%. Adjusted net worth is, by definition, larger than the
normal net asset ratio because some insurance liabilities are added to net assets.
The average value of 𝑀𝑎𝑟𝑘𝑒𝑡 , is 0.625, indicating that 62.5% of the samples used for
verification were listed companies.
Table 5: Correlation coefficients (1) (2) (3) (4) (5) (6)
(1) 𝐷𝑖𝑠𝑐𝐷 , 0.3222 -0.2382 0.1319 0.0700 -0.0288
(2) 𝑆𝑜𝑙𝑣𝑒𝑛𝑐𝑦 , 0.2981 -0.0810 0.3897 -0.2297 0.3174
(3) 𝑅𝑂𝐴 , -0.1725 -0.6014 0.0966 0.3045 -0.1065
(4) 𝐸𝑞𝑢𝑖𝑡𝑦 , 0.1090 0.6225 -0.4668 0.0512 0.1857
(5) 𝐿𝑛𝐴𝑠𝑠𝑒𝑡 , 0.0714 -0.3912 0.3242 -0.6191 -0.2209
(6) Market , -0.0288 0.2612 -0.0874 0.1934 -0.2338 The lower left triangular matrix is Pearson's correlation coefficient, and the upper right triangular matrix is Spearman's correlation coefficient.
Table 5 shows the correlation coefficients. The solvency margin ratio (𝑆𝑜𝑙𝑣𝑒𝑛𝑐𝑦 , ), which is
disclosure information specific to the life insurance industry, has a positive correlation with
𝐷𝑖𝑠𝑐𝐷 , , and it has the same sign as the hypothesis. Profitability (𝑅𝑂𝐴 , ) also has a positive
correlation with the explained variables and is consistent with the hypothesis prediction. On
the other hand, the adjusted net worth ratio (𝐸𝑞𝑢𝑖𝑡𝑦 , ) shows a negative correlation, unlike the
hypothesized prediction.
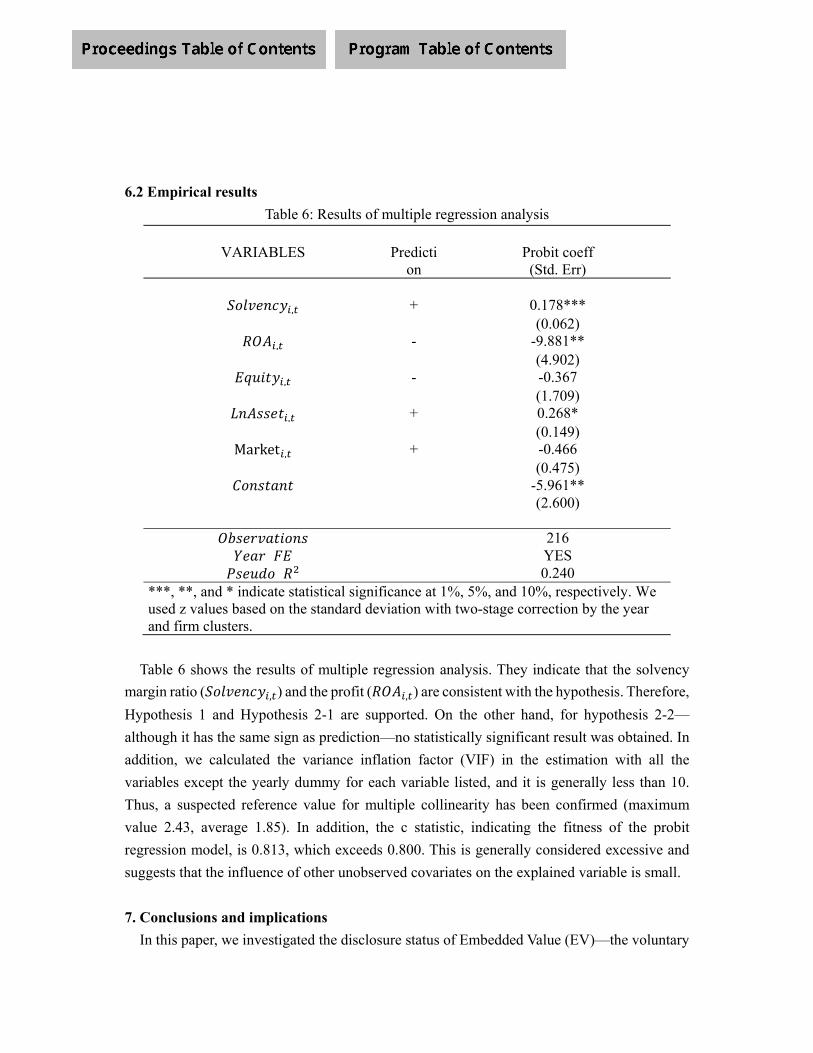
6.2 Empirical results
Table 6: Results of multiple regression analysis
VARIABLES Prediction
Probit coeff (Std. Err)
𝑆𝑜𝑙𝑣𝑒𝑛𝑐𝑦 , + 0.178***
(0.062) 𝑅𝑂𝐴 , - -9.881**
(4.902) 𝐸𝑞𝑢𝑖𝑡𝑦 , - -0.367
(1.709) 𝐿𝑛𝐴𝑠𝑠𝑒𝑡 , + 0.268*
(0.149) Market , + -0.466
(0.475) 𝐶𝑜𝑛𝑠𝑡𝑎𝑛𝑡 -5.961**
(2.600)
𝑂𝑏𝑠𝑒𝑟𝑣𝑎𝑡𝑖𝑜𝑛𝑠 216 𝑌𝑒𝑎𝑟 𝐹𝐸 YES
𝑃𝑠𝑒𝑢𝑑𝑜 𝑅 0.240 ***, **, and * indicate statistical significance at 1%, 5%, and 10%, respectively. We used z values based on the standard deviation with two-stage correction by the year and firm clusters.
Table 6 shows the results of multiple regression analysis. They indicate that the solvency
margin ratio (𝑆𝑜𝑙𝑣𝑒𝑛𝑐𝑦 , ) and the profit (𝑅𝑂𝐴 , ) are consistent with the hypothesis. Therefore,
Hypothesis 1 and Hypothesis 2-1 are supported. On the other hand, for hypothesis 2-2—
although it has the same sign as prediction—no statistically significant result was obtained. In
addition, we calculated the variance inflation factor (VIF) in the estimation with all the
variables except the yearly dummy for each variable listed, and it is generally less than 10.
Thus, a suspected reference value for multiple collinearity has been confirmed (maximum
value 2.43, average 1.85). In addition, the c statistic, indicating the fitness of the probit
regression model, is 0.813, which exceeds 0.800. This is generally considered excessive and
suggests that the influence of other unobserved covariates on the explained variable is small.
7. Conclusions and implications
In this paper, we investigated the disclosure status of Embedded Value (EV)—the voluntary

disclosure information of life insurance companies—and analyzed the characteristics of
companies disclosing EV in Japan. We observed that companies with larger solvency-margin
ratios and smaller profits tended to disclose EV. These results suggest that companies
perceiving or predicting undervaluation (because of the nature of information required for
institutional accounting or because the information provided will not adequately convey
performance) disclose information in an attempt to mitigate asymmetry of information.
The validity of the above hypothesis was demonstrated for Japan, where multiple life insurance
companies operate as mutual companies. Thus, it appears that managers of life insurance
companies believe that this information is useful for stakeholders other than shareholders. It is
clear that the role of EV in our study is different from that in previous research focusing on the
value relationship. However, the content of the EV information—that is, whether the future
profit that is estimated by this indicator is actually generated at a later date—has yet to be
examined. Considering this, the economic role of EV should be further examined.

References
Almezweq, M. and G. Liu(2012), “The Value Relevance of Voluntary European Embedded
Value Disclosures: Evidence from UK Life Insurance Companies,” International
Journal of Accounting and Finance 3, pp. 343-366.
CFO Forum (2004), “European Embedded Value Principles.”
CFO Forum (2016a), “Market Consistent Embedded Value Principles.”
CFO Forum (2016b), “Market Consistent Embedded Value Basis for Conclusions.”
El-Gazzar, S., R. Jacob, and S. McGregor(2015), “The Relative and Incremental Valuation
Effects of Embedded Value Disclosure by Life Insurers: Evidence from Cross-Listed
Firms in the U.S.,” Accounting Horizons 29, pp. 327-339.
Financial Services Agency(2007), “Solvency Margin Hiritsu no Sansyutsu Kijun ni Tsuite
(in Japanese)”.
Gerstner, T., D. Lohmaier, and A. Richter(2015) , “Value Relevance of Life Insurers’
Embedded Value Disclosure and Implications for IFRS Phase II,” Working Paper.
Horton, J.(2007) “The Value Relevance of Realistic Reporting: Evidence from UK Life
Insurers,” Accounting and Business 37, pp. 175-197.
Hoshino, T. (2018) “Will IFRS 17 replace EV?” Milliman White Paper.
Inchausti, B. (1997), “The Influence of Company Characteristics and Accounting Regulation
on Information Disclosed by Spanish Firms,” European Accounting Review 6, pp. 45-68.
Ishizaka, M (2009), “Survey of Embedded Value Disclosure (in Japanese),” Seimei-Hoken
Ronshu 166, pp. 77-98.
Jacob. R, S. El-Gazzar, and S. McGregor(2017), “Evolution of Financial Reporting of Life
Insurers: The Predominance of Unregulated Embedded Value Disclosure,” Journal of
Financial Regulation and Compliance 25, pp. 56-72.
Maruyama, R.(2016), “Seiho Sougo Kaisya no Gyomu Takakuka to Kabusiki Kaisyaka (in
Japanese),” Shoken Keizai Kenkyu 95, pp. 89-108.
Nakamura. R, and K. Nishiyama(2014) , “A Study on Embedded Value Disclosure in
Japanese Life Insurance Companies (in Japanese),” Journal of the Faculty of Political
Science and Economics (Tokai University) 46, pp. 95-112.
Ng, E., and H. Koh (1994), “An Agency Theory and Probit Analytic Approach to Corporate
Non-mandatory Disclosure Compliance,” Asia-Pacific Journal of Accounting 1, pp. 29-
44.
Préfontaine, J., J. Desrochers, and L. Godbout(2009) , “The Informational Content of
Voluntary Embedded Value (EV) Financial Disclosures by Canadian Life Insurance
Companies,” International Business and Economics Research Journal 8, pp. 1-14.
Serafeim, G. ( 2011 ) , “Consequences and Institutional Determinants of Unregulated
Corporate Financial Statements: Evidence from Embedded Value Reporting,” Journal of
Accounting Research 49, pp. 529-571.
Sumitomo Mitsui Aioi Life Insurance (2017) Annual Report.
Tsukahara, M., R. Nakamura, and K. Nishiyama (2018), “Value Relevance of Embedded Value
Disclosure: Evidence from Japan (in Japanese),” Kaikei 194(5), pp. 75-89.
Tudini, E., G. Forte, and J. Mattei(2011) , “The Value Relevance of Embedded Value
Disclosures: Evidence from European Life Insurance Companies,” Working Paper.
Usui, A. (2012), Financial Services and Accounting, Chuokeizai-Sha, Inc. (In Japanese).
Wu, R. C-F. and A. W-H. Hsu(2011), “Value Relevance of Embedded Value and IFRS 4
Insurance Contracts,” The Geneva Papers 36, pp. 283-303.
POKEMON GO!: STOCK VALUATION AND DISRUPTIVE INNOVATION IN ENTERTAINMENT INDUSTRY
Claudio Marcelo Edwards Barros Professor of Accountancy at Federal University of Paraná
School of Accounting Federal University of Paraná
[email protected] Brazil.
Iago França Lopes
Doctor Student at Federal University of Paraná School of Accounting
Federal University of Paraná [email protected]
Brazil.
Itzhak David Simão Kaveski Professor of Accountancy at Federal University of Mato Grosso do Sul
School of Accounting Federal University of Mato Grosso do Sul
[email protected] Brazil
ABSTRACT
This research aims to analyze the impact of the announcement of the launch of the game Pokemon Go! on Nintendo's stocks. The study anchors itself on conceptual foundations of disruptive innovation and previous research that examined the stock market reaction to the announcement of innovations. This is an empirical research whose sample is made up of 4 Nintendo company assets traded in the United States, Germany, Switzerland and Japan, as well as the assets of companies comparable to Nintendo that made up the Detailed Stock Report available in the Refiniv® system (Thomson Reuters), at the time of the launch of the game. Through conducting a series of event studies, Nintendo's stocks traded in the United States, Germany, Switzerland and Japan presented abnormal returns after one day of the game's launch. These findings proved to be specific of Nintendo corporation's assets, with no similar reactions observed in peer valuation analysis. Based on five variables of cumulative abnormal returns (CARs) for all entertainment companies listed in Japan and controlled by factors such as profitability, debt, size and market value, it was found that on average the cumulative abnormal returns of Nintendo were significantly higher than the other companies in all 5 models tested. In response, we hope to broaden the discussions listed in this survey to recognize the launch of Pokemon Go! as an innovation with typical traits of Disruptive innovation, which were not ignored by capital market when the game was launched in July 06th, 2016. Keywords: Pokemon Go! Disruptive Innovation; Capital Markets; Event Studies; Abnormal Returns.

1 Introduction Financial researchers have devoted high attention to event studies, which consist of assessing through hypotheses, theoretical and conceptual frameworks, the impact of a determining event on the stock price volatility of a company or asset portfolios. Grar (1997, p. 462) defines an event as "the information that is made public in the market and is liable to affect the value of one or more firms at the same time. The event can be general or specific, periodic or occasional, exogenous or decided by the management of the company ". In this sense, the launch of Pokemon Go! by the company Nintendo represents an important event for entertainment corporations present in Japan and in the World. The Pokémon Go! is an augmented reality mobile game, developed by Niantic and Nintendo companies for iOS and Android platforms, based on the franchise of a cartoon world-wide known as Pokémon (Dorward, et al, 2017). On April 11th, 2019, the official website of The Pokémon Company, confirmed that Pokémon Go! has been downloaded more than 1 billion times worldwide in iOS and Android. Assuming that this 1 billion downloads were made by unique individuals, this means that 14% of the world population downloaded Pokémon Go! on their mobile devices. The launch of the game was representative for the stock market, as the company's stock had grown 9.3% at the launch of the application, which occurred on July 6th, 2016. Until July 11th, the company had grown 24.54% on the Tokyo Stock Exchange after the market closed (Lasalle, 2016). The results of this market valuation have been recorded by scholars into two perspectives. The first is that the game has as a reference a disruptive innovation through augmented reality (Carli, Gastal, & Gomes, 2016). Christensen, Raynor and McDonald (2015) define disruptive innovation as a process in which companies challenge established firms by providing products or services that meet the needs of some segment of society. The second perspective that may be aroused the interest of market is the use of georeferencing and mobility attributes in an instantaneous way in the game (Carli, Gastal, & Gomes, 2016). In essence, geo-referencing is an attribute of the area of cartography that has gained space in the field of entertainment through electronic games. Cascón-Katchadourian, Ruiz-Rodríguez and Alberich-Pascual (2017, p. 204) infers that "their recent popularization is linked to the appearance and massive use over the last decade of websites, situation and what surrounds them ". The Pokemon Go! receives this popularity due to the use of georeferencing technology. The game, "as it allows us to accurately reconstruct the geographical situation of plans on a large scale and without projections" (Cascón-Katchadourian, Ruiz-Rodríguez and Alberich-Pascual, 2017, p. 204). The announcements of new products represents a focus of study for the marketing field combined to corporate finance and statistical methods. Several studies have this approach and recognize the performance of stock market from the launch of a new product.

Examples of such investigations are the researches of Eddy and Saunders (1980), Chaney, Devinney and Winer (1991) and Koku, Jagpal and Viswanath (1997), among others. Dalattre (2007) emphasizes that event studies contribute to the identification of value creation or destruction. Market events are key points for checking stock valuation. On the other hand, this methodology confirms the strategic actions that the company adopted in certain periods. In the case of the related research, development and innovation the application of this methodology becomes relevant as it integrates areas of knowledge and contributes to the improvement of the technique and understanding of the informational content potentially produced from product launches. For the field of finance and accounting, a good deal of research is to understand the effects of launching a new product versus the behavior of the stock market shows up as an opportunity under the lens of Efficient Market Hypotheses (EMH, 1970, 1991) in its semi strong form. Thus, it is possible to provide information regarding the normal or abnormal returns that the product launch may cause. A specific gain for accounting and finance is to provide empirical elements for the users of financial information regarding the behavior of the company's equity phenomena. Thus, this research aims to discuss the stock market reaction to the launch of Pokemon Go !. This event presents itself a component in the capital market and may be relevant and shocking on decisions of economic agents (Batista, Maia & Romero, 2018). The challenges for launching an innovation focus on verifying the market acceptability of such a product or service. In this way, this research contributes to the verification of market absorption and acceptability on the launch of Pokemon Go !, contributes to understand how the market reacts and evaluates in financial terms the advertising of the information, which will make it possible to affirm the levels of operation of the same under the aegis of the HME. The construction of the research involves the application of several event studies that consider the examination of the abnormal returns of Nintendo and the companies that integrated the entertainment industry in Japan at the time of the launch of game Pokemon Go !. The data analysis were conducted into two stages. In the first, the abnormal returns were determined. Nintendo's stocks traded in the United States, Germany, Switzerland and Japan presented abnormal returns ranging from 4.61% (Japan) to 6.25% (United States) one day after and 17.91% (Japan) to 32.48% (Swiss) after three days the product was launched. These results prove to be peculiar of Nintendo company's assets, because no similar returns on Nintendo's peer reviews were o observed. The results of this stage were consistent even after the use of resilient estimators to the presence of outliers to determine the abnormal returns. In the second stage the analysis were conducted by cross section regressions. Based on five variants of cumulative abnormal returns (CARs) for all companies in the entertainment industry in Japan and controlled by factors such as profitability, debt, size and market value, it was found that on average the cumulative abnormal returns of Nintendo were significantly higher than the other companies in the industry in all 5 models tested. The results allows us to decide on research hypotheses in
order to broaden the discussions concerning game launch and the reactions of the stock market. Markets are considered to be instantaneously backed up by their disclosure information, reacting in a semi strong form. Thus, this paper contributes to discussions related to the efficiency of markets in a context of disruptive innovation through augmented reality and the use of georeferencing and mobile devices. In addition to combining marketing and finance, this paper fits into an emerging field, which is termed by Dalattre (2007) of financial marketing. Finally, the study contributes to examine the relationship between shareholder and consumer behavior and the role of the brand (Dalatte, 2007), considering the launch of an innovation with traits of disruptive one. 2 Empirical and Theoretical Framework 2.1 Disruptive Innovation Disruptive Innovation has received extensive research attention since the 1990s by Clayton Christensen, however, its definition is not clear. The initial efforts of Christensen (1997) took as reference the conceptual structures of disruptive technologies. Nowadays, the same concept has been expanded to products and business models. Thus, this conceptual structure is used to explain a plurality of innovations, which has being developed in the markets. Markides (2006) points out that such an attitude of scholars is a mistake, since the various types of innovations have as a characteristic influence and conduct the market differently and yet the competitive effects of this innovation produce different effects in economic terms, financial and social aspects of the market. These phenomena deserve different lenses regarding their treatment and observation. According to Christensen, Raynor and McDonald (2015, p.4) "Disruption describes a process whereby a smaller company with fewer resources is able to successfully challenge established incumbent businesses". In addition, Christensen and Raynor (2003: 69) make this point forcefully by arguing that "... disruption is a process and not an event ... it might take decades for the forces to work their way through an industry but [they] are always at work. "The empirical literature classifies Disruptive Innovation under two differente positions. The first considers the innovations of business models. The second is in the context of product innovations, ie the launch of a new product to the world (Christensen, 1997). The innovations of business models "invade an existing market by emphasizing different product or service attributes to those emphasized by the traditional business models of the established competitors" (Markides, 2006, p.20). Disruptive innovations from the constitution of a new product are included in terms providing of a new product to the world (Markides, 2006).
These different types of innovation contribute to the creation of different markets, which represents to the field of innovation elements based on marketing and organizational challenges with significant consequences for the administration of business. At this specific point, it is worth emphasizing that decomposing disruptive innovation in terms of effects on markets presents as an issue, which is able to give relevant contributions to the market itself and to users of the innovation results (Markides, 2006). Disruptive Innovation induces a certain discomfort in the market, since they present themselves as competitive advantages against the mighty corporations of the same industry. Thus, the insertion of a new product in the market at a cheaper price and even at a zero cost as is the case of the game Pokemon Go!, it will lead competitors to reshape their business forms, causing some discomfort in industry (Cândido, 2011; Markides, 2006). In addition, Markides (2006, p.22) argues that disruptive innovations "are disruptive to consumers because they introduce products and value propositions that disturb prevailing consumer habits and behaviors in a major way". A peculiar fact in terms of behavior and participation in the composition of Nintendo's assets occurred on July 31th, 2016. According to data obtained through Bloomberg® terminals , on that date, weeks after the launch of the game Pokemon Go !, the fund named ARK Investing in Disruptive Innovation becomes part of Nintendo's investor group. To ARK "disruptive innovation as the introduction of a technologically enabled product or service that should transform economic activity by creating simplicity and accessibility while driving down costs" (ARK Invest, 2019, p.1). In addition, the company believes that, "innovation typically needs time and maturity before gaining mass market adoption. Through an open research process that cuts across sectors, industries, and markets, ARK seeks to identify innovation platforms characterized by: (i) Dramatic cost declines; (ii) Strong price elasticity of demand; and (iii) Convergence which spawns further innovation "(ARK Invest, 2019, p.1). In this sense, it can be assumed that the entrance of a fund with these characteristics into equity composition of Nintendo was not a coincidence, but a decision weighted according to the impact that the game generated worldwide. In this context that is involved in the disruptive innovation process in organizations is inviting and provocative. Researchers and theorists have devoted attention to recognize the values of empirical tests involving the effects of Disruptive innovation. Thus, "as an ever-growing community of researchers and practitioners continues to build on disruption theory and integrate it with other perspectives, we will begin to better understand what helps firms innovate successfully" (Christensen, Raynor and McDonald, 2015, p.11). Encouraged by this optimism of Christensen, Raynor and McDonald (2015) observe the Pokemon Go! as an innovation Disruptive represents a breakthrough in terms of cooperation with the emerging field of research, which integrates marketing and finance. 2.2 Hypothesis Development Efficient Markets Hypothesis in its semi strong form, evidenced by a large number of empirical studies, current prices reflect all publicly available information of corporations,

such as financial statements, other periodical and non-periodical publications, as well as disclosures potentially relevant to investors' decisions. Since the information is public, no investor will achieve extraordinary returns because prices are quickly adjusted to new information disclosed. Another point to be highlighted in terms of market behavior in the semi strong form are expectations of future results. Under these conditions, the investor accesses publicly available information and positions itself from a behavior in which it is expected future gains. This fact reveals a possible learning process by investors (Sawyer and Gygax, 2001, Fama, 1991). The announcement of the development of Pokémon Go! by Nintendo occurred on September 10th, 2015, with its launch scheduled for 2016. Given the importance of the already consolidated Pokémon franchise with several products on the market, it was to be expected an increase in company stock after its launch. In the first two days of the game's launch in the United States, Australia and New Zealand, Nintendo shares rose more than 25% with gains of market value of $ 7.5 billion. The entry of ARK Investing in Disruptive Innovation, which seeks to "capture longterm outperformance and capital appreciation created by disruptive innovation" (ARK Invest, 2019, p.1), also represents a positioning of an investor seeking future gains from development of the disruptive innovation provoked by the game. "The fund aims to identify large-scale investment opportunities in the public markets resulting from technologically enabled innovation centered around DNA sequencing, robotics, artificial intelligence, energy storage, and blockchain technology" (ARK Invest, 2019, p.1). Nevertheless, after a release by Nintendo on July 22, 2016, the Japanese company's stock plunged almost 18%, a drop of approximately $ 6.4 billion in market value. This drop occurred because the application was developed and distributed by Niantic, Inc, where franchise ownership rights belong to the Pokémon Company, to which it receives a licensing fee, as well as compensation for collaboration in application development and operations. In addition, Nintendo owns only 32% of the voting shares of Pokémon Company, accounted for using the equity method. Therefore, revenue reflected in the game profits for Nintendo, will be limited to the results counted by the company Pokémon Company. Since new information released by organizations can influence behavior of actions, researchers have sought to analyze how advertising and launching new products can affect abnormal returns of corporations. Hu et al., (2013) investigated the effects of the launch of new products on price stocks of US companies from 1997 to 2007. The authors noted that companies that launched new products had significant abnormal returns over a period of three days (-1, 0 and 1), where its highest value occurred on the day of the new product launch. On average, the advertisers had a significant gain of 0,408% on the day before the launch, 0,925% on the launch date and 0,537% on the day after launch. The results support Efficient Market Hypothesis in its semi strong form as information about the launch of the new products had already been released by the organizations, so the positive and significant changes in

stock prices one day before launch, at launch and one day after the launch corroborates the EMH. Mann and Babbar (2017) analyzed the impact of new product announcements on the stock value of Indian companies listed in the BSE 500 stock in the period 2003 to 2012. The findings demonstrated that companies that made the announcement of new products achieved significant positive abnormal returns compared to other organizations. In addition, it also corroborates the Semi strong Efficient Market Hypothesis, since positive returns occurred at the day of the announcement of the new products. Qin, Hung, Jang, and Lehto (2017) researched whether the introduction of mobile applications affects the value of the shares of hotel and airline companies. The results indicated that, on average, hotel and airline companies that introduced mobile applications had a 1,32% gain on abnormal returns on the day of the event. In addition, the launch event was the only day with significant abnormal returns and the highest gain among the 11 days during the event window (5 days before and 5 days later). The authors conclude that there is no leakage of information before the event and no reaction of stock market delays, which contributes to Semi strong Efficient Market Hypothesis. Based on the arguments presented and the results of the mentioned researches, two hypotheses of research were formulated: H1: The launch of the game Pokemon Go! led to informational content causing abnormal positive returns on the Nintendo company's stock; H2: The cumulative abnormal returns after the announcement of Pokemon Go! were more pronounced on Nintendo stocks compared to the companies that integrate the entertainment industry in Japan. 3 Data, Sample and Methods This section aims to describe the methodological approach used to investigate the stock market reaction to the launch of the Pokémon Go!. The main focus is to demonstrate to the reader steps related to the construction of the database and the methodological choices made. With these priorities, it is sought to make possible the reliability of the study. 3.1 Event Study and Event Window Elton, Gruber, Brown and Goetzmann (2004) define Event Study as an econometric tool aimed at debugging the impact of internal or external announcements on companies' stock valuation. Similar to the empirical studies that examined the impact of changes or
announcements related to corporate innovation, this research followed the similar stages on database construction and application of similar methods to the investigations developed by (i) Hu, Jiang and Lee (2013) that investigated effects on the stock price of new product advertisers; (ii) Mann and Babbar (2017) that evaluated the impact of announcement of new products on the value of stocks of Indian companies listed in the BSE 500 stock at the industry and firm level; and (iii) Quin et al (2017) who verified whether the introduction of mobile applications affects the valuation of hotel and airline industry. The event to be investigated in this research is the launch of the game called Pokémon Go! by Nintendo and Niantic with applications in mobile devices (cell phones and tablets). More specifically, the date that will be used as the starting point for conducting this study will be the world announcement day on July 6th, 2016. For purposes of applying the Event Studies, that date is called "zero date". It is understood that the interpretation of informational content of certain ads depends on the possible impact to be examined at a viable intervals of time. For this reason, the quotations for the assets selected in this study occurred on a daily basis in the form of stock price quotations, which will serve as basis for the determination of observed, expected and abnormal returns. According to Benninga (2008), it is recommended that the closing price adjusted for splits and inplits and the payment of dividends are used to determine observed stock returns. It is argued that a subjective component for conducting one or more event studies is the definition of the Event Window (Mackinlay, 1997). Several researchers use between 3, 5 and 10 days around "zero date" considering event windows with 7, 11, 21 days, respectively. In this study the Event Window adopted was 5 previous days (06/28, 06/29, 06/30, 07/01 and 07/05) and 5 days later (07/07, 07/08, 07/11 , 07/12) to the "zero date". 3.2 Securities Selected and Data collection Considering what is the proposed in this research, the selection of assets to be analyzed went through three stages. Initially, through the Bloomberg® terminal, there were verified Nintendo's stocks in United States, Germany, Switzerland and Japan. In view of the fact that this study seeks to examine the effect of launching the game Pokémon Go!, it would be inconsistent to ignore the possibility of observing effects in other companies considered Nintendo's peers. A possible reaction that translated into informational content of the stocks at Nintendo could be repeated throughout the entertainment segment, which would extenuate the hypothesis that Nintendo's specific reaction due to the launch of the game. In this sense, the second stage of asset selection was to consult the Detailed Stock Report for the year 2016 provided by the Thomson Reuters® terminal (current Refinivit®) and also the Peer Review analysis to identify the comparable assets and include them in the analysis considering same event window. The inclusion of peer-group analysis to comprehensively examine an effect is a research planning decision that is recurrent and can be observed in studies such as developed by Romano and Almeida (2015) and Barros, Lopes and Almeida (2019). Chart 1 identifies all selected assets.

Chart 1 – Securities selected for analysis
Companies (Short name)
Description of main activities
Nintendo Engaged in the development, manufacture and sale of entertainment products in home entertainment field. The Company's main products include game machines such as portable and console game machines and software. Headquarter: Japan.
Bandai
Engaged in entertainment business. The Company operates in three business segments: toys, network Entertainment and facilities. Headquarter: Japan.
Koei
KOEI LTD.: engaged in game software business. The Company has six business segments: Software games, Online Mobile segment, Media Rights segment, Slot Pinball (SP), Amusement Facility Operation segment and others segment involved in real estate. Headquarter: Japan.
Sanrio
Sanrio: engages in the planning and sales of social communication gift products, theme park business and others. Headquater: Japan.
Tomy
TOMY LTD.: engaged in the design, development, manufacture and sale of toys, as well as the provision of toy development technology and sheared services. Headquarter: Japan.
Happinet
Happinet Corp.: operates through four business segments. toys, video and music, video game and amusement. Headquarter: Japan.
Fujishoji
Fujishoji LTD.: involved in the development, manufacture and sale of pachinko machines. Headquarter: Japan.
FuRyu
FURYU CORPORATION is a company principally engaged in the entertainment related business. Headquarter: Japan.
Nuts Inc
Nuts Inc., formerly Commonwealth Entertainment & Co. is a Japan-based company primarily engaged in the amusement business. Headquarter: Japan.
People
People.cn CO., LTD is a China-based company, principally engaged in the operation of Internet information business. Headquarter: China.
Kotobukiya
Kotobukiya Ltd. is a company mainly engaged in design, development, production and sale of hobby goods, such as polyvinyl chloride(PVC)f Figure, plastic model, collectibles and other related goods. Headquarter: Japan.
Source: Refinitv®
And lastly, in addition to collecting daily quotes from peer companies, it was decided to examine the valuation performance of the entire entertainment industry considering companies that were listed on the Japanese stock exchange at the time of Pokemon Go ! launch which also includes Nintendo itself. The purpose of this third stage was to verify the significance of the valuation of the company's shares through 5 combinations of cross section regressions, further detailed. 3.3 Estimation Window
Estimation window is a time series used to measure the daily valuation of stocks surveyed and it is constructed during the time interval preceding the Event Window. According to Benninga (2008), it is recommended to build Estimation Windows with at least one year of trading, that is, 252 days. For the development of the present study, the estimation window goes from March 31th, 2015 to June 27th, 2015. The author further argues that Windows of Estimation can never overlap or intersect the Event Window under penalty of invalidity the result of the calculations of expected and abnormal returns.

According to the purposes of this study, the Estimation Window was constructed by determining daily returns on a continuous form (natural logarithm) for the selected assets (Ri) and the market portfolios (Nasdaq, Dax, Swiss and Nikkei indexes) used (Rm), as shown next:
Ri = Ln(Pt/Pt-1) (1) Rm = Ln(Ct/Ct-1) (2)
On what: Pt is the stock price on day t; Pt-1 is the price of the stock on the previous day, ie, t-1; Ct is the quotation of the Market Portfolio on day t; Ct-1 is the quotation of the Market Portfolio on the previous day, ie, t-1; The terms Ln represent the natural logarithm of the returns Ri and Rm, which serve as the data source for estimating the parameters required to calculate expected and abnormal daily returns. To estimate these returns, two techniques were used. The first one was the traditional Ordinary Least Squares (OLS) method in a form of a simple linear regression, commonly called Market Model, according to equation (3):
Ri = αi+ βiRm +εi (3) The parameters α and β are estimated from the OLS application. The parameter β is the slope of the linear model (equation 3) obtained by the ratio between the covariance of the observed returns of the stock and the market and the variance of the market returns. The parameter α is the intercept, calculated by the average difference between the dependent variable (Ri) and the independent variable (Rm) of equation 3. The expected daily returns are the returns that would be generated by the individual asset under analysis based on α and β , according to equation (4):
E(Ri│Rm) = αi + βiRm (4) The abnormal daily returns (ARi) are calculated by the difference between the observed daily returns for the asset under analysis (Ri) and the expected daily returns [E (Ri│Rm)] for it. Thus, abnormal returns can be identified by one of the equations shown as follows:
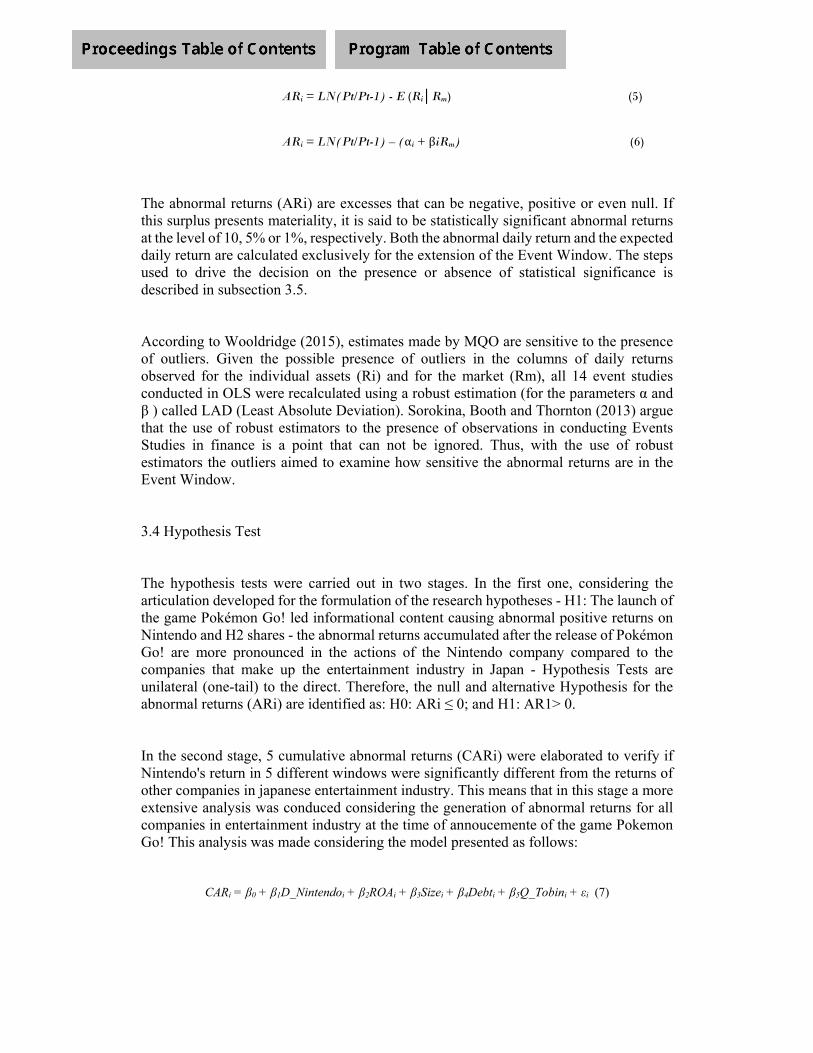
ARi = LN(Pt/Pt-1) - E (Ri│Rm) (5) ARi = LN(Pt/Pt-1) – (αi + βiRm) (6) The abnormal returns (ARi) are excesses that can be negative, positive or even null. If this surplus presents materiality, it is said to be statistically significant abnormal returns at the level of 10, 5% or 1%, respectively. Both the abnormal daily return and the expected daily return are calculated exclusively for the extension of the Event Window. The steps used to drive the decision on the presence or absence of statistical significance is described in subsection 3.5.
According to Wooldridge (2015), estimates made by MQO are sensitive to the presence of outliers. Given the possible presence of outliers in the columns of daily returns observed for the individual assets (Ri) and for the market (Rm), all 14 event studies conducted in OLS were recalculated using a robust estimation (for the parameters α and β ) called LAD (Least Absolute Deviation). Sorokina, Booth and Thornton (2013) argue that the use of robust estimators to the presence of observations in conducting Events Studies in finance is a point that can not be ignored. Thus, with the use of robust estimators the outliers aimed to examine how sensitive the abnormal returns are in the Event Window. 3.4 Hypothesis Test
The hypothesis tests were carried out in two stages. In the first one, considering the articulation developed for the formulation of the research hypotheses - H1: The launch of the game Pokémon Go! led informational content causing abnormal positive returns on Nintendo and H2 shares - the abnormal returns accumulated after the release of Pokémon Go! are more pronounced in the actions of the Nintendo company compared to the companies that make up the entertainment industry in Japan - Hypothesis Tests are unilateral (one-tail) to the direct. Therefore, the null and alternative Hypothesis for the abnormal returns (ARi) are identified as: H0: ARi ≤ 0; and H1: AR1> 0. In the second stage, 5 cumulative abnormal returns (CARi) were elaborated to verify if Nintendo's return in 5 different windows were significantly different from the returns of other companies in japanese entertainment industry. This means that in this stage a more extensive analysis was conduced considering the generation of abnormal returns for all companies in entertainment industry at the time of annoucemente of the game Pokemon Go! This analysis was made considering the model presented as follows:
CARi = β0 + β1D_Nintendoi + β2ROAi + β3Sizei + β4Debti + β5Q_Tobini + εi (7)
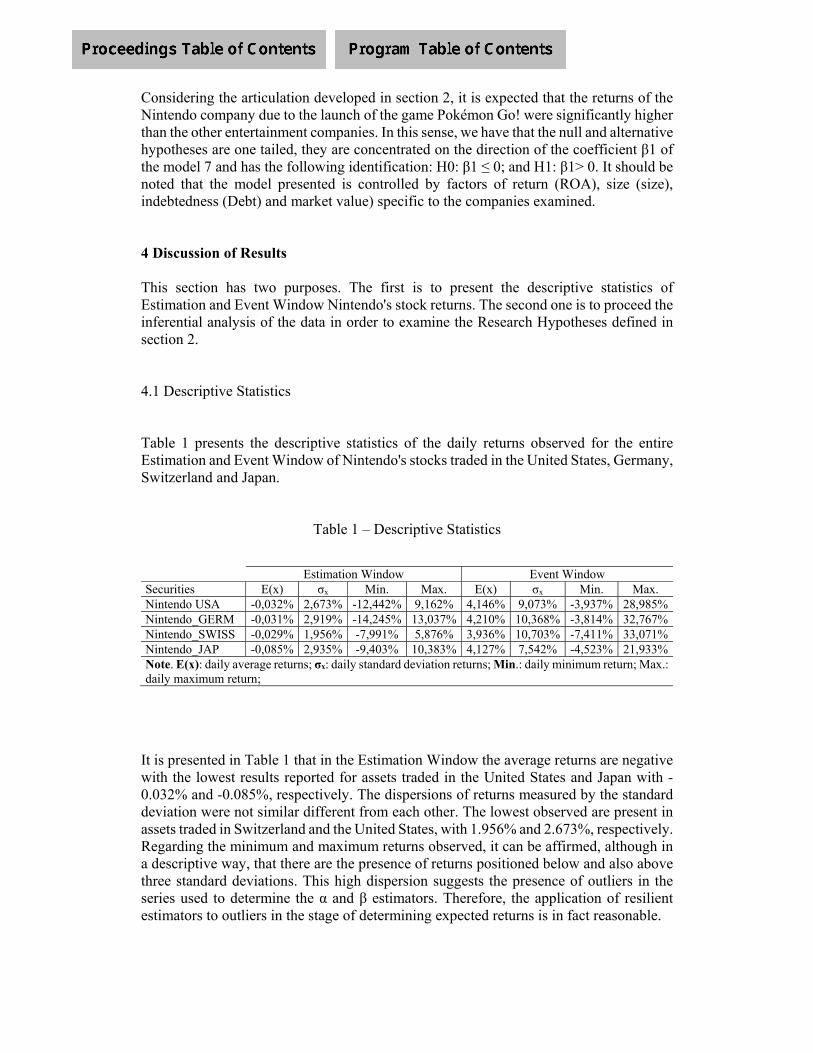
Considering the articulation developed in section 2, it is expected that the returns of the Nintendo company due to the launch of the game Pokémon Go! were significantly higher than the other entertainment companies. In this sense, we have that the null and alternative hypotheses are one tailed, they are concentrated on the direction of the coefficient β1 of the model 7 and has the following identification: H0: β1 ≤ 0; and H1: β1> 0. It should be noted that the model presented is controlled by factors of return (ROA), size (size), indebtedness (Debt) and market value) specific to the companies examined.
4 Discussion of Results
This section has two purposes. The first is to present the descriptive statistics of Estimation and Event Window Nintendo's stock returns. The second one is to proceed the inferential analysis of the data in order to examine the Research Hypotheses defined in section 2. 4.1 Descriptive Statistics
Table 1 presents the descriptive statistics of the daily returns observed for the entire Estimation and Event Window of Nintendo's stocks traded in the United States, Germany, Switzerland and Japan.
Table 1 – Descriptive Statistics
Estimation Window Event Window Securities E(x) σx Min. Max. E(x) σx Min. Max. Nintendo USA -0,032% 2,673% -12,442% 9,162% 4,146% 9,073% -3,937% 28,985%Nintendo_GERM -0,031% 2,919% -14,245% 13,037% 4,210% 10,368% -3,814% 32,767%Nintendo_SWISS -0,029% 1,956% -7,991% 5,876% 3,936% 10,703% -7,411% 33,071%Nintendo_JAP -0,085% 2,935% -9,403% 10,383% 4,127% 7,542% -4,523% 21,933%Note. E(x): daily average returns; σx: daily standard deviation returns; Min.: daily minimum return; Max.: daily maximum return;
It is presented in Table 1 that in the Estimation Window the average returns are negative with the lowest results reported for assets traded in the United States and Japan with -0.032% and -0.085%, respectively. The dispersions of returns measured by the standard deviation were not similar different from each other. The lowest observed are present in assets traded in Switzerland and the United States, with 1.956% and 2.673%, respectively. Regarding the minimum and maximum returns observed, it can be affirmed, although in a descriptive way, that there are the presence of returns positioned below and also above three standard deviations. This high dispersion suggests the presence of outliers in the series used to determine the α and β estimators. Therefore, the application of resilient estimators to outliers in the stage of determining expected returns is in fact reasonable.

Regarding the average daily returns in the Events Window, Table 1 shows a high disparity (if compared with the Estimation Window), but a certain homogeneity among them. Although in a descriptive way, it is observed that the maximum returns observed are dramatically higher than those seen in the Estimation Window. On the other hand, the minimum returns can be considered trivial. This suggests a significant increase in returns on dates that are around the day of the Pokemon Go! by the Nintendo Corporation.
4.2 Inferencial Statistics
Table 2 shows the abnormal returns (ARi) determined for Nintendo's stocks and selected companies (peers) according to Detailed Stock Report.

Table 2 – Ordinary Least Squares (OLS) Abnormal Returns (ARi) calculated for Event Window for 5 days prior to and 5 days after the global announcement of the Pokémon Go!
Companies 5 days before
4 days before
3 days before
2 days before
1 day before
Event Day
1 day after
2 days after
3 days after
4 days after
5 days after
Standard Error
Nintendo (USA) 0.32% 2.46% -0.89% -0.51% -0.94% 0.22% 6.25%*** 8.59%*** 28.57%*** -0.75% -3.72% 2.51%Nintendo (GERM) -2.21% 1.93% -1.03% -0.21% -2.47% 2.68% 5.56%** 11.68%*** 31.22%*** -2.69% -4.75% 2.70% Nintendo (SWISS) -1.37% -0.85% -0.33% -0.50% 3.74% 0.28% 0.06% 12.01%*** 32.48%*** 0.86% -7.44%** 2.70% Nintendo (JAPAN) -0.13% 2.47% 0.88% -0.18% -1.39% 1.33% 4.61%** 10.09%*** 17.91%*** 9.36%*** -5.80%** 2.20% Bandai 1.48% 1.62% 0.16% 1.77% 0.42% 0.08% -1.29% 1.41% 0.94% -3.44%** -0.65% 1.64% Koei -2.09% 1.71% 2.57% -0.43% -0.69% -0.54% 0.21% 0.39% 3.37% -1.04% 0.40% 1.89% Sanrio -1.49% 2.31% 0.08% -0.26% -0.61% -2.03% 1.37% -0.38% 1.22% 0.74% 0.68% 1.78%Tomy 0.81% 4.21% -1.06% 0.93% 5.21%*** 1.07% -3.99% 0.68% 2.97% -2.06% 0.44% 2.16% Happinet 1.68% -1.71% -1.64% -0.08% -0.18% -0.38% 2.29% -2.29% -1.09% 6.32%*** -2.21% 1.51%Fujishoji 0.42% 0.02% 1.10% -0.31% -1.03% 0.10% -0.02% 1.57% -2.07** 0.13% -0.50% 0.93% FuRyu -0.93% 3.18% 0.14% 2.37% 0.85% -2.09% -0.84% 0.56% -0.67% -0.10% 1.09% 2.74% Nuts Inc 0.40% -0.67% 1.10% -0.58% -1.14% 0.71% 0.19% 2.00% -3.38% -0.74% -0.95% 4.85% People 1.90% 0.94% -1.32% 3.07% -2.20% 1.40% 0.76% -3.32% -1.59% -3.17% -0.74% 2.80% Kotobukiya -0.78% 5.52%** 0.46% 2.52% -3.01% 3.49% -2.15% -1.49% -3.67% -6.31%*** -0.80% 2.54%Note. Authors. The Event Window comprises 5 days before the Event Day (July 06th 2016), including days 01th, 05th, 06th, 07th and 08th July and 5 days after which days are 12th, 13th, 14th, 15th and 19th July. For Nintendo USA, Nintendo GERMANY, Nintendo SWISS, the market portfolios used to determine daily market returns were NASDAQ, DAX and SWISS MARKET indexes, respectively. Abnormal returns (ARi) were calculated with OLS regressions for each event study conducted. ***, ** and * represent the significance of abnormal returns (ARi) at the 1%, 5% and 10% level, with critical values (one tail) of 2.33, 1.64 and 1.28, respectively. Standard Error: determined for the estimation window for each computed regression. For example, it can be noted that the Abnormal Return of Nintendo’s stock (JAPAN) in 07/08/201 (column 3 days after) was 17.91%. The t-test calculated for this abnormal return is 8.14 (0.1791 / 0.0220), which p-value related is less than 1%. The regressions for the Estimation Window were computed with HAC (Heterokesdasticity and Autocorrelated Consistent) for assets in which the assumptions of homoscedasticity and (or) autocorrelation were not observed: Nintendo (GERMANY), Sanrio, Happinet and Nuts Inc. All series of daily returns of stocks and market portfolios were tested for the presence of unit root. Null hypothesis of presence of root unit (ADF test) was rejected for the 14 assets.
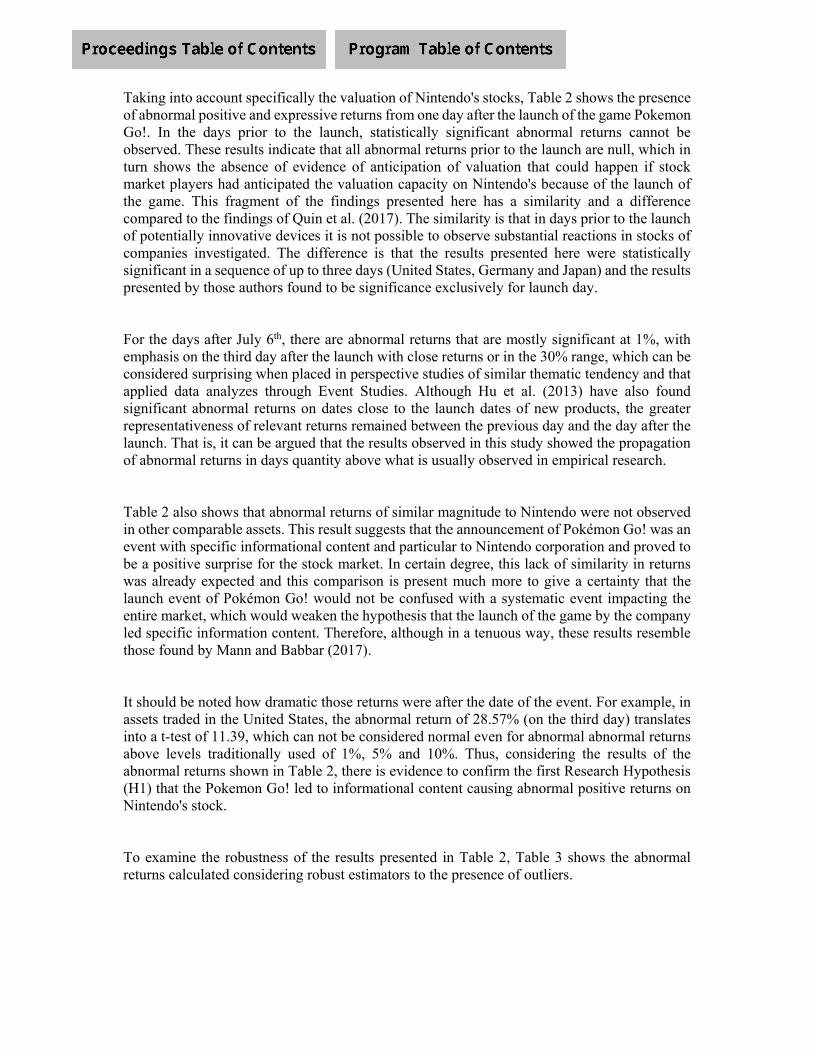
Taking into account specifically the valuation of Nintendo's stocks, Table 2 shows the presence of abnormal positive and expressive returns from one day after the launch of the game Pokemon Go!. In the days prior to the launch, statistically significant abnormal returns cannot be observed. These results indicate that all abnormal returns prior to the launch are null, which in turn shows the absence of evidence of anticipation of valuation that could happen if stock market players had anticipated the valuation capacity on Nintendo's because of the launch of the game. This fragment of the findings presented here has a similarity and a difference compared to the findings of Quin et al. (2017). The similarity is that in days prior to the launch of potentially innovative devices it is not possible to observe substantial reactions in stocks of companies investigated. The difference is that the results presented here were statistically significant in a sequence of up to three days (United States, Germany and Japan) and the results presented by those authors found to be significance exclusively for launch day. For the days after July 6th, there are abnormal returns that are mostly significant at 1%, with emphasis on the third day after the launch with close returns or in the 30% range, which can be considered surprising when placed in perspective studies of similar thematic tendency and that applied data analyzes through Event Studies. Although Hu et al. (2013) have also found significant abnormal returns on dates close to the launch dates of new products, the greater representativeness of relevant returns remained between the previous day and the day after the launch. That is, it can be argued that the results observed in this study showed the propagation of abnormal returns in days quantity above what is usually observed in empirical research. Table 2 also shows that abnormal returns of similar magnitude to Nintendo were not observed in other comparable assets. This result suggests that the announcement of Pokémon Go! was an event with specific informational content and particular to Nintendo corporation and proved to be a positive surprise for the stock market. In certain degree, this lack of similarity in returns was already expected and this comparison is present much more to give a certainty that the launch event of Pokémon Go! would not be confused with a systematic event impacting the entire market, which would weaken the hypothesis that the launch of the game by the company led specific information content. Therefore, although in a tenuous way, these results resemble those found by Mann and Babbar (2017). It should be noted how dramatic those returns were after the date of the event. For example, in assets traded in the United States, the abnormal return of 28.57% (on the third day) translates into a t-test of 11.39, which can not be considered normal even for abnormal abnormal returns above levels traditionally used of 1%, 5% and 10%. Thus, considering the results of the abnormal returns shown in Table 2, there is evidence to confirm the first Research Hypothesis (H1) that the Pokemon Go! led to informational content causing abnormal positive returns on Nintendo's stock. To examine the robustness of the results presented in Table 2, Table 3 shows the abnormal returns calculated considering robust estimators to the presence of outliers.

Table 3 – Least Absolute Deviation (LAD) Abnormal Returns (ARi) calculated for Event Window for 5 days prior to and 5 days after the global announcement of the Pokémon Go!
Days Nintendo (USA) Nintendo (GERMANY) Nintendo (SWISS) Nintendo (JAPAN)
5 days before 0,32% -1,99% -1,50% -0,10% 4 days before 2,48% 2,25% -0,98% 2,55% 3 days before -0,84% -0,24% -0,47% 0,91% 2 days before -0,41% -0,28% -0,64% -0,14% 1 day before -0,78% -0,31% 3,59% -1,35%
Event Day 0,29% 1,94% 0,13% 1,32% 1 day after 6,36%*** 4,14% -0,08% 4,63%** 2 days after 8,62%*** 10,75%*** 11,87%*** 10,08%*** 3 days after 28,66%*** 31,54%*** 32,34%*** 18,03%*** 4 days after -0,66% -2,00% 0,72% 9,46%*** 5 days after -3,57% -3,63% -7,59%** -5,74%**
Note. Authors. ***, ** and * represent the significance of abnormal returns (ARi) at the 1%, 5% and 10% level, with critical values (one tail) of 2.33, 1.64 and 1.28, respectively.
It can be seen in Table 3 that even after estimation of α and β parameters taking into consideration robust estimators to the presence of extraordinary daily returns, the levels of significance for the abnormal returns of the Nintendo company remained similar to those obtained by estimations in ordinary least squares . In this sense, the results contained in Table 3 corroborate the idea of generating significant and positive abnormal returns one day after the world launch of the game Pokemon Go! and thus confirming surprising and unexpected reaction of the stock market. It should be noted that since the results of the abnormal returns of companies comparable to Nintendo were not expressively different from those observed in Table 2, it was decided not to report them.
Table 2 has already demonstrated the presence of abnormal positive returns that differ from Nintendo's assets relative to their peers. However, in order to expand this examination to the entire entertainment industry in Japan where it is a representative part of the Nintendo company's peers and competitors, it was decided to examine whether the company's returns are significantly different from those of entire entertainment industry. The companies considered here were those that had shares listed in Japan during the announcement period of Pokemon Go! game and had daily price quotations of their shares that allowed the construction of events studies for each of them. This analysis was carried out through of 5 linear regression variants cross sections in which it was verified, through a dummy variable, if the cumulative abnormal returns (CARi) of the Nintendo company for 5 specific intervals are statistically different. These results are presented in Table 4. For the purposes of hypothesis testing and considering the model shown below, it is expected, controlled by factors of profitability, debt, size and market value, to verify whether the cumulative abnormal returns (CARi) of Nintendo are significant.
Table 4 – Cross Section Analyses considering all companies of entertainment industry and Nintendo Peers.
CARi = β0 + β1D_Nintendoi + β2ROAi + β3Sizei + β4Levi + β5Tobini + εi
CAR (0, 1) CAR (0, 2) CAR (0, 3) CAR (0, 4) CAR (0, 5) Constant -0.12681 -0.09826 -0.09844 -0.03743 -0.02533
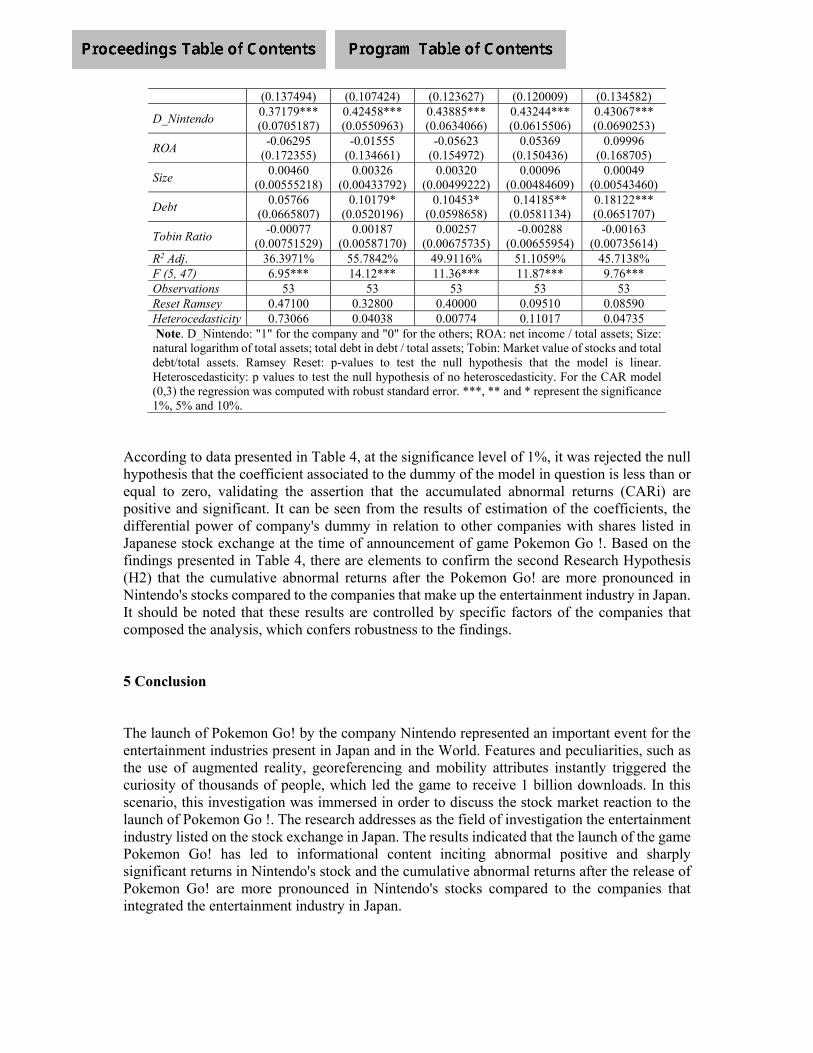
(0.137494) (0.107424) (0.123627) (0.120009) (0.134582)
D_Nintendo 0.37179*** (0.0705187)
0.42458*** (0.0550963)
0.43885*** (0.0634066)
0.43244*** (0.0615506)
0.43067*** (0.0690253)
ROA -0.06295
(0.172355) -0.01555
(0.134661) -0.05623
(0.154972) 0.05369
(0.150436) 0.09996
(0.168705)
Size 0.00460
(0.00555218) 0.00326
(0.00433792) 0.00320
(0.00499222) 0.00096
(0.00484609) 0.00049
(0.00543460)
Debt 0.05766
(0.0665807) 0.10179*
(0.0520196) 0.10453*
(0.0598658) 0.14185**
(0.0581134) 0.18122*** (0.0651707)
Tobin Ratio -0.00077
(0.00751529) 0.00187
(0.00587170)0.00257
(0.00675735)-0.00288
(0.00655954) -0.00163
(0.00735614)R2 Adj. 36.3971% 55.7842% 49.9116% 51.1059% 45.7138% F (5, 47) 6.95*** 14.12*** 11.36*** 11.87*** 9.76*** Observations 53 53 53 53 53 Reset Ramsey 0.47100 0.32800 0.40000 0.09510 0.08590 Heterocedasticity 0.73066 0.04038 0.00774 0.11017 0.04735 Note. D_Nintendo: "1" for the company and "0" for the others; ROA: net income / total assets; Size: natural logarithm of total assets; total debt in debt / total assets; Tobin: Market value of stocks and total debt/total assets. Ramsey Reset: p-values to test the null hypothesis that the model is linear. Heteroscedasticity: p values to test the null hypothesis of no heteroscedasticity. For the CAR model (0,3) the regression was computed with robust standard error. ***, ** and * represent the significance 1%, 5% and 10%.
According to data presented in Table 4, at the significance level of 1%, it was rejected the null hypothesis that the coefficient associated to the dummy of the model in question is less than or equal to zero, validating the assertion that the accumulated abnormal returns (CARi) are positive and significant. It can be seen from the results of estimation of the coefficients, the differential power of company's dummy in relation to other companies with shares listed in Japanese stock exchange at the time of announcement of game Pokemon Go !. Based on the findings presented in Table 4, there are elements to confirm the second Research Hypothesis (H2) that the cumulative abnormal returns after the Pokemon Go! are more pronounced in Nintendo's stocks compared to the companies that make up the entertainment industry in Japan. It should be noted that these results are controlled by specific factors of the companies that composed the analysis, which confers robustness to the findings. 5 Conclusion
The launch of Pokemon Go! by the company Nintendo represented an important event for the entertainment industries present in Japan and in the World. Features and peculiarities, such as the use of augmented reality, georeferencing and mobility attributes instantly triggered the curiosity of thousands of people, which led the game to receive 1 billion downloads. In this scenario, this investigation was immersed in order to discuss the stock market reaction to the launch of Pokemon Go !. The research addresses as the field of investigation the entertainment industry listed on the stock exchange in Japan. The results indicated that the launch of the game Pokemon Go! has led to informational content inciting abnormal positive and sharply significant returns in Nintendo's stock and the cumulative abnormal returns after the release of Pokemon Go! are more pronounced in Nintendo's stocks compared to the companies that integrated the entertainment industry in Japan.
This research provides support for three streams of research present in the contemporary literature. First, the findings are consistent with the efficient market hypothesis in its semi strong form, since Nintendo's stocks were adjusted based on the information disclosed by the company. The market did not anticipate itself in relation to the announcement of the game, a fact that evidences that it did not know of such an event in advance or remained calm as a speculation, in order to observe how it would be the reaction of the effective target public of the game. Thus, it is noted that the market absorbed the information that had been disclosed by the company regarding the availability of the game. In this situation, the market reacted by propagating abnormal returns up to three days after the game's launch for all Nintendo assets studied. It is emphasized that this valuation on stocks was not identified in other comparable assets, a fact that receives HME support in its semi strong configuration. Furthermore, The behavior observed here related to the abnormal returns may also reflect a learning process on the part of the investors (Sawyer and Gygax, 2001), that is, these investors or interested in Disruptive innovation already have expertise regarding the behavior of the market in what concerns the launch of games. This fact may also be included in the results discussed so far.
Second, the launch of the Pokemon Go! represents an innovation with typical traits of disruptive change to the technology market as it is characterized as a large-scale augmented reality experience. The launch of the game was probably the first time the augmented reality experience has been tested on a planetary scale and the strength of the abnormal returns specific to Nintendo's stocks indicates that this experience did not go unharmed to capital markets. The company made use of this technological attribute to offer the market an experience, which it had not yet experienced. The use of the artifacts present in the characteristics of the Disruptive innovation revived a media belonging to The Pokémon Company, which has been present in the world since the 1990s. The launching of the game is aligned to what is proposed by Christensen (1997), as presents the ability to create different markets from the use of augmented reality, georeferencing and mobility attributes in an instant. Another attribute perceived in the market that matches to the practice of Disruptive innovation by The Pokémon Company is that it provides the use of smarthphone with a different attribute, the integration of reality with fiction, through the game. As a consequence, it is perceived that Nintendo seeks to differentiate itself from other companies also by creating elements of competitive advantage. For competitors, a timely scenario is illustrated, given that they can benefit from the use of Disruptive innovation to modify products and services, given the shocking market receptivity.
Finally, the third stream of contribution of this research hinges on the emergence of the line of research called financial marketing (Dalattre, 2007) recognizing the effects of launching a game that uses augmented reality through Disruptive Innovation. Thus, integrating the elements of marketing and finance is also a way to demonstrate to internal and external users the creation of value from the perspective of the user of the game.
The construction of an investigation is a work developed by researchers, which is not free of limitations. In this sense, the methodological approach used to explore the research objectives are not the only ones and other methodological choices can be made to understand the signage that the game's launch had on the business world.

It is also necessary to seek answers to the behavior of the entertainment industries in the world, since the launch of the game was worldwide, we can broaden the discussions listed in this survey to recognize the launch of Pokemon Go! as a representative case of disruptive innovation.
REFERENCE
ARK Invest. (2019). Invest in the Future, Today. Recovered in 09 may, 2019, of https://ark-invest.com/disruptive-innovation-ark.
Barros, C. M. E., Lopes, I. F., & de Almeida, L. B. (2019). Efeito contágio da operação carne
fraca sobre o valor das ações dos principais players do mercado de proteínas do Brasil e do México. Enfoque, 38(1), 105-122.
Batista, A. R. D. A., Maia, U., & Romero, A. (2018). Stock market under the 2016 Brazilian
presidential impeachment: a test in the semi-strong form of the efficient market hypothesis. Revista Contabilidade & Finanças, 29(78), 405-417.
Benninga, S. (2008). Financial modeling. Massachusetts: MIT Press Books, 2008. Cândido, A. C. (2011). Inovação Disruptiva: Reflexões sobre as suas características e
implicações no mercado. Tese de Doutorado, Universidade Nova de Lisboa, Monte de Caparica, Portugal.
Carli, I. C. D. S., Gastal, S., & Gomes, M. N. (2016). Pokémon Go, Realidade Aumentada e
Georeferenciamento: A gamificação nas suas possibilidades para o Turismo. Revista Hospitalidade, 13(Número Especial), 01-17.
Cascón-Katchadourian, J., Ruiz Rodríguez, A. Á., & Alberich i Pascual, J. (2017). Uses and
applications of feoreferencing and geolocation in old cartographic and photographic document management. El profesional de la información, 27(1), 1699-2407.
Chaney, P. K., Devinney, T. M., & Winer, R. S. (1991). The impact of new product
introductions on the market value of firms. Journal of Business, 64(4), 573-610. Christensen, C. M., Raynor, M. E., & McDonald, R. (2015). What is disruptive
innovation. Harvard Business Review, 93(12), 44-53. Christensen, C., 1997. The Innovator’s Dilemma. Harvard Business School Press, Cambridge,
MA Dalattre, E (2007). Event study methodology in marketing. Recherche et Applications en
Marketing, 22(2), 57-75. Dorward, L.J., Mittermeier, J.C., Sandbrook, C., & Spooner, F. (2017). Pokémon Go: Benefits,
costs, and lessons for the conservation movement. Conservation Letters, 10(1), 160-165. Eddy, A. R., and Saunders, G. B. (1980). New product announcements and stock
prices. Decision sciences, 11(1), 90-97. Elton, E. J. and Gruber, M. J. (1995). Modern portfolio theory and investment analysis. New
York: John Whiley & Sons Inc. Elton, E., Gruber, M., & Brown, S. (2012). Moderna teoria de carteiras e análise de
investimentos. São Paulo: Elsevier.
Fama, E. F. (1970). Efficient capital markets: a review of theory and empirical work. The
Journal of Finance, 25(2), 383-417. Fama, E. F. (1991). Efficient capital markets: II. The Journal of Finance , 46(5), 1575-1617. Grar A. (1997), Étude d’événement, Encyclopédie des marchés financiers, Ed. Y. Simon, Paris,
Economica, 462-484. Hu, C., Jiang, W., & Lee, C. F. (2013). Managerial flexibility and the wealth effect of new
product introductions. Review of Quantitative Finance and Accounting, 41(2), 273-294. Johnston, M. A. (2007). A review of the application of event studies in marketing. Academy of
Marketing Science Review, 2007(4), 1-33. Koku, P. S., Jagpal, H. S., & Viswanath, P. V. (1997). The effect of new product announcements
and preannouncements on stock price. Journal of Market-Focused Management, 2(2), 183-199.
Lasalle, L. (2016). Pokémon GO fait bondir Nintendo en bourse. Recovered in 20 April. 2019,
of https://branchez-vous.com/2016/07/11/pokemon-go-fait-bondir-nintendo-en-bourse/. MacKinlay, A. C. (1997). Event studies in economics and finance. Journal of economic
literature, 35(1), 13-39. Mann, B. J. S., & Babbar, S. (2017). New product announcements effect on stock prices in
India. Journal of Asia Business Studies, 11(4), 368-386. Markides, C. (2006). Disruptive innovation: In need of better theory. Journal of product
innovation management, 23(1), 19-25. Ojah, K. and L. Monplaisir. (2003). Investors Valuation of Global Product Design and
Development. Journal of International Business Studies 34(5), 457-472. Qin, M., Tang, C. H. H., Jang, S. S., & Lehto, X. (2017). Mobile app introduction and
shareholder returns. Journal of Hospitality and Tourism Management, 31(1), 173-180. Romano, P. R., & de Souza, V. (2015). Analysis of Effects in Capital Markets Resulting from
Mergers: The BRF Case Journal od Contemporary Administration, 19(5), 606-625. Sawyer, K. R., & Gygax, A. (2001). How Eventful are Event Studies? SSRN. Sorokina, N., Booth, D. E., & Thornton Jr, J. H. (2013). Robust Methods in Event Studies:
Empirical Evidence and Theoretical Implications. Journal of Data Science, 11(2013), 575-606.
Sprague, K. (2015). Innovative Announcement Effects in the Pharmaceutical Industry via Stock
Market Volatility. Thesis. University of Colorado Boulder, Colorado, USA.

Wooldridge, J. M. (2015). Introductory econometrics: A modern approach. Toronto: Nelson Education.
LIMITED AVAILABILITY IN CROWDFUNDING PROJECTS – GUARANTEE FOR PROFITABILITY?
Authors:
Alexander Fox
Ilmenau University of Technology Germany
Jana Neuland Ilmenau University of Technology
Germany [email protected]
ABSTRACT The popularity of crowdfunding has risen immensely in the last decade. Crowdfunding has not only become an alternative and additional source for entrepreneurs looking for funding (Tomczak and Brem 2013; Moritz and Block 2014; Bouncken et al. 2015, Fox et al. 2015), it also gets high attention from research. While prior studies mainly concentrate on analysing the determinants of success of crowdfunding projects (Greenberg et al. 2013; Kunz et al. 2017) or use hypothetical research designs for analysing the profitability of crowdfunding (e.g. Harms 2007; Ordanini et al. 2011), our study is not limited to a hypothetical sample. We analyse the relationship between the use of limited availability in crowdfunding projects and the profita-bility of the included pledge levels. Our focus lies on the impact of limited availability in crowdfunding projects on profitability. Therefore, we analysed data from kickstarter.com, one of the world’s largest crowdfunding platforms. The database contains extracted information on all pledge levels of each project posted on the platform from its inception between 16th of May 2013 and 19th of May 2013. In the end, this study uses a dataset containing 494 projects and 4,224 pledge levels. Hence, our sample includes 32% of pledge levels with limited availability. Our results provide insights into the characteristics of crowdfunding projects that impact prof-itability. More specifically, we provide empirical evidence that the limited availability in the crowdfunding projects in terms of scarcity management is positive related to the profitability of the included pledge levels. We conclude that crowdfunding projects with limited availability on pledge levels are more profitable for donators/investors. Key words: crowdfunding, scarcity management, profitability, determinants
1 INTRODUCTION
The popularity of crowdfunding has risen immensely in the last decade. Crowdfunding has become an alternative and additional source for entrepreneurs looking for funding (Tomczak and Brem 2013; Moritz and Block 2014; Bouncken et al. 2015, Fox et al. 2015). This form of financing was initially used as a financing alternative for mostly innovative companies in their foundation or early stage phase, but also for charitable projects crowdfunding is an in-teresting alternative (Moritz and Block 2014). Crowdfunding is generally used to generate funds for a project through a large number of people, typically with the help of the Internet (Lehner 2013). The often cited Belleflame et al. 2014 define crowdfunding as „… an open call, mostly through the Internet, for the provision of financial resources either in the form of donation or in exchange for the future product or some form of reward to support initiatives for specific purposes”. Specifying this definition, crowdfunding is a process in which individuals, as well as organizations, initiate commercial or non-commercial projects in a public announcement to ask for financing commitments, esti-mate market demand, and build customer relationships. Participants in the crowdfunding campaign can subscribe to monetary or non-monetary funds, the amount of which they are free to choose, on an online or offline platform over a specified period of time. The promised funds will be made available to the project if the pre-specified conditions are met. A material or even only an intangible compensation for the funding agencies can, but does not have to be provided (Kuppuswamy and Bayus 2013; Cordova et al. 2015; Müllerleile and Joenssen 2015). In the current literature, it is already suggested that there is an impact of social and intrinsic determinants on success of crowdfunding projects (Ordanini et al. 2011; van Wingerden and Ryan 2011; Belleflame et al. 2014; Allison et al. 2015; Trost et al. 2017). In contrast to previ-ous studies, which mainly concentrate on analysing the determinants on financial success based on monetary returns to investors, we analyse the determinants on financial success based on non-monetary returns to investors (e.g. gifts, product prototypes) with data from kickstarter.com, one of the world’s largest reward-based crowdfunding platforms. In reward-based crowdfunding projects backers receive tangible and intangible returns for their finan-cial contribution (Kuppuswamy and Bayus 2013; Frydrych et al. 2014; Müllerleile and Joenssen 2015). Moreover, it can be observed, that there are some crowdfunding projects on kickstarter.com with limited availabilities in their pledge levels. Pledge levels are the reward tiers, which are offered to the backers of a campaign. This topic is interesting because young innovative en-trepreneurs usually have problems in raising money sufficiently; while on the side limitations on investors actually contradict this original intention to generate sufficient financial re-sources. Some authors found a relation between intended limited availability of crowdfunding compensations and scarcity management (Joenssen and Müllerleile 2016; Cunha et al. 2014). Therefore, we investigate the relation of such limitations in crowdfunding projects and the profitability of pledges. Our research especially addresses technological projects on kick-starter.com using automatically and hand collected data. In the second section of this paper, we give a literature review and develop our hypothesis. The sample selection as well as the development of the empirical model are discussed in section three. The results of the empiri-cal analysis are presented in section four, while our main results show a positive and signifi-cant relation between the limited availability in the crowdfunding projects and the profitabil-ity of the included pledge levels. Finally, the paper ends with a conclusion in section five.
2 LITERATURE REVIEW AND HYPOTHESIS DEVELOPMENT
Crowdfunding practices and mechanisms are widely discussed in literature. Prior research has already investigated the motivation of project initiators to use crowdfunding as a platform for raising capital. Belleflamme et al. 2014 identified essential motives of crowdfunding, like the public attention and the obtaining feedback on products. Another study of Gerber (2011) shows that the main motivation to raise capital on the platform results from the intention to replicate successful experiences of others by obtaining full control over the project. In addi-tion, Belleflamme et. al. 2014 identified the preselling process as an important factor because crowdfunding gives entrepreneurs the chance to price discrimination. Moreover, existing research has identified that project characteristics (e.g. category, goal, du-ration) are related to its success. Greenberg et al. 2013, for instance, defined determinants to predict the funding success of projects. Cordova et al. 2015 indicated size, duration as well as the projects contribution frequency as main determinants of crowdfunding success. Hereby, the results from Mollick 2014 as well as from Kuppuswamy and Bayus 2013 were confirmed. Kunz et al. 2017 also analysed several determinants of crowdfunding success. They docu-mented, to name just a few results, a relation between success and the length of a campaign as well as the number of updates and the number of images in crowdfunding projects. Focussing on motives of investors’ decision to support crowdfunding projects, there are sev-eral studies in Behavioral Finance research, which deal with herd behaviour (Zhang/Liu 2012; Agrawal et al. 2015; Stadler et al. 2015), home bias (Brem and Wassong 2014; Lin and Viswanathan 2015) or the feeling of solidarity (Ordanini et al. 2011; Berglin and Strandberg 2013; Van Wingerden and Ryan 2011). Although the factors of motivation are explored, little is known about the determinants of the crowdfunding projects profitability with focus on reward-based projects. In this context, Brem and Wassong (2014) show in their explorative study using fictitious examples of crowdfunding projects that profitability is the main motivation of investors ahead of the de-livery of the product itself, the support aspect and the sense of belonging to a project. For that, they interviewed 221 students. However, it has to be critically mentioned that this study is only based on a hypothetical situation and as a result emotional aspects may play a lesser role than in reality (Trost et al. 2017). The study of Ordanini et al. 2011 concentrated on an interview of seven crowdfunding platform founders. The focus of the survey lies on identify-ing possible investors’ motivations. The authors also assumed that profitability is an im-portant investors’ incentive. It has to be noted critically that the founders opinions are highly subjective and speculative, therefore results of the study should be scrutinised. Harms 2007 concluded that the investors’ decision to invest depends on a possible economic value of the project as well as on the presence of a possible tangible innovative output of the project. However, his study is also only based on results of an online survey with hypothetical charac-ter. Even though previous studies partially used hypothetical projects in empirical analysis or were based on students work, the relationship between profitability and the investors’ deci-sion process really seems to be an important determinant. In contrast to early research, Trost et al. 2017 started to analyse real projects from kickstarter.com (with focus on technological projects) and the impact of the profitability of crowdfunding projects to investors’ decisions. Their study indicates that profitability is an essential element of an investors’ bundle of moti-vation. Concentrating on reward-based projects, former research has already mentioned that project
initiators use limited availabilities of returns as an incentive for investors in their projects. It is possible to distinguish between natural limitations (e.g. meeting with project initiators) and artificially created limitations (Joenssen and Müllerleile 2016). Artificially created limitations are usually special discounts on a limited number of products, like reward limits or early-bird rewards (Stegmaier 2015; Joenssen and Müllerleile 2016; Shi 2018). In addition, it is also possible that limited availabilities are temporal. The goal is to convince potential investors to invest in a project more easily by pretending a finite commodity (Shi 2018). Commodity theory analyses such psychological effects of scarcity (Brock 1968). The main idea of this theory concentrates on the underlying assumption, that goods or services appear more attractive to customers, if these are combined with a limited availability (Verhallen 1982; Verhallen and Robben 1994; Cialdini 2009). As a reason for that it is stated that con-sumers associate limited availability with uniqueness, high quality or a particular attractive offer, whereby people want to express a certain status or their superiority, regardless of whether that is true or not (Lynn 1992; Snyder and Fromkin 1980; Verhallen and Robben 1994; Inman et al. 1997; Barone and Roy 2010). Joenssen and Müllerleile (2016) argue that crowdfunding projects provide transparent infor-mation to potential investors by pointing out special facts about the project (e.g. offered and requested donations, prices of limited available products and services). As a result, they argue that it is questionable whether scarcity can usefully be utilized in crowdfunding projects as potential investors can refrain from investing in sold-out early-bird rewards because the un-limited pledge levels are no longer as attractive as the limited ones. In their study, they show a negative relation of limited availability and financial success of crowdfunding projects (Joenssen and Müllerleile 2016). We argue that the profitability of a crowdfunding project for the investors depends on the availability of investments because limited orders simulate backers a higher profitability. As a result, the hypothesis is formulated as follows: H1: There is a positive relation between the limited availability and the profitability of the pledge level for the investors.
3 SAMPLE SELECTION AND RESEARCH DESIGN
To construct the sample we collected data from one of the world’s largest crowdfunding plat-forms kickstarter.com. We concentrate on reward-based-projects with the broad category technology, continuing the research from Trost et al. 2017. A special characteristic of kick-starter.com is the “all-or-nothing-approach” of fundraising on the online platform, meaning that a project can only be successful, if it is fully founded. Nevertheless, it is also possible that funded projects can exceed their original funding goal. At the starting point, the database consists of 596 projects. We extracted information on all pledge levels of each project posted on the platform from its inception between 16th of May 2013 and 19th of May 2013. In first step, we collected data automatically from kickstarter.com, considering for each cam-paign its title, description, url and webshop. In according to this we also took into account the minimum amount of each pledge level and number of backers. Subsequently, we calculated the expected profitability in consideration of using the minimum amount of pledge level and a manually collected and quantified comparison price. In next step, we evaluated each pledge
level; a predefined category list following Trost et al. 2017 and identified intangible and tan-gible products as well as services and other returns backers may get for their donation respec-tively their investment. Another important subdivision of projects was to categorize the pur-poses of reward-based projects into preselling and crowd sponsoring. For allocating the pro-jects to these two types, it was necessary to get an overall impression about the estimated re-turns of a project. Projects without any identifiable return were deleted from database. There-fore, in the end this study uses a dataset containing 494 projects with 4,224 pledge levels. The hypothesis of this study predicts that limited availability in crowdfunding projects has a relation to profitability. To investigate the relation between scarcity management and profita-bility, we estimate a generalised regression model by testing the significance and influence of limited availability with an OLS regression. To test H1, we propose the following model:
,
, , _ , ,
, , , , Suppressing subscriptions, we measure the variables at pledge level (i) for each project (j). The dependent variable is the variable as explained above. The profitability of a pledge level is measured in two ways. Our first proxy concentrates on the backers’ point of view and is calculated as the quotient of the suggested comparison price of return and the of-fering price a backer has to invest (expected profitability). On the other side, we focus on the backers behavior and the profitability of a pledge level after the investment. This view can also be interesting to find out which choice backers prefer and if they consider profitability in their investment decision (demanded profitability). Therefore, we also use the expected prof-itability multiplied with number of backers as an additional proxy for profitability. For testing the relation between profitability and scarcity management (H1), we use a binary variable ( and suggest a positive coefficient . The variable of interest than takes the value “one” if the pledge level can be considered as limited availability and “zero” if not. To control the differences in profitability determinants we include the following variables. First we include the amount of the funding goal as an independent variable ( and as a representative for the necessary target attainment that is needed to reach a successful funding. We observe that the higher the funding goal is, the higher is the expected profitability of a single pledge level. Concerning the underlying assumption that the funding goal can be un-derstood as signal for quality of the project, a proper signaling can decrease unsureness and increase reliability on markets without perfect information (Koch et al. 2015). In this context, Frydrych et al. 2014 consider that a lower funding targets signal legitimacy by setting mod-est. Moreover it can be suggested that the higher the funding goal is, the probability to com-plete the project successfully is lower (Mollick 2014; Leboey and Schwienbacher 2015; Ah-lers et al. 2015). Next, following Zvilichovsky et al. 2013, we include the number of backers ( _ as independent variable. In general, it can be suggested that the number of backers has a social influence on project success (Brem and Wassong 2014). Therefore, you may consider the goal-gradient-hypothesis (Hull 1932; Kivetz et al. 2006; Kuppuswamy and Bayus 2015) when backers get the feeling of being a part of the project and expect a good deal (Ordanini et
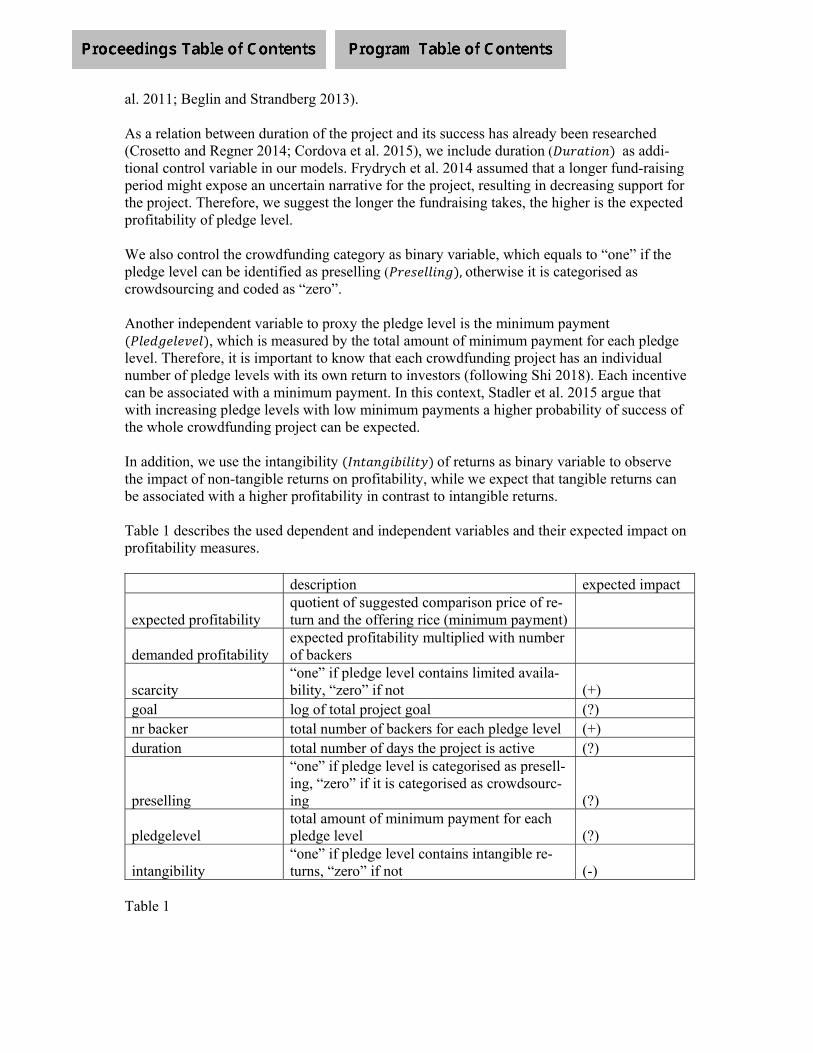
al. 2011; Beglin and Strandberg 2013). As a relation between duration of the project and its success has already been researched (Crosetto and Regner 2014; Cordova et al. 2015), we include duration ( as addi-tional control variable in our models. Frydrych et al. 2014 assumed that a longer fund-raising period might expose an uncertain narrative for the project, resulting in decreasing support for the project. Therefore, we suggest the longer the fundraising takes, the higher is the expected profitability of pledge level. We also control the crowdfunding category as binary variable, which equals to “one” if the pledge level can be identified as preselling ( ,otherwise it is categorised as crowdsourcing and coded as “zero”. Another independent variable to proxy the pledge level is the minimum payment
, which is measured by the total amount of minimum payment for each pledge level. Therefore, it is important to know that each crowdfunding project has an individual number of pledge levels with its own return to investors (following Shi 2018). Each incentive can be associated with a minimum payment. In this context, Stadler et al. 2015 argue that with increasing pledge levels with low minimum payments a higher probability of success of the whole crowdfunding project can be expected. In addition, we use the intangibility of returns as binary variable to observe the impact of non-tangible returns on profitability, while we expect that tangible returns can be associated with a higher profitability in contrast to intangible returns. Table 1 describes the used dependent and independent variables and their expected impact on profitability measures. description expected impact
expected profitability quotient of suggested comparison price of re-turn and the offering rice (minimum payment)
demanded profitability expected profitability multiplied with number of backers
scarcity “one” if pledge level contains limited availa-bility, “zero” if not (+)
goal log of total project goal (?) nr backer total number of backers for each pledge level (+) duration total number of days the project is active (?)
preselling
“one” if pledge level is categorised as presell-ing, “zero” if it is categorised as crowdsourc-ing (?)
pledgelevel total amount of minimum payment for each pledge level (?)
intangibility “one” if pledge level contains intangible re-turns, “zero” if not (-)
Table 1
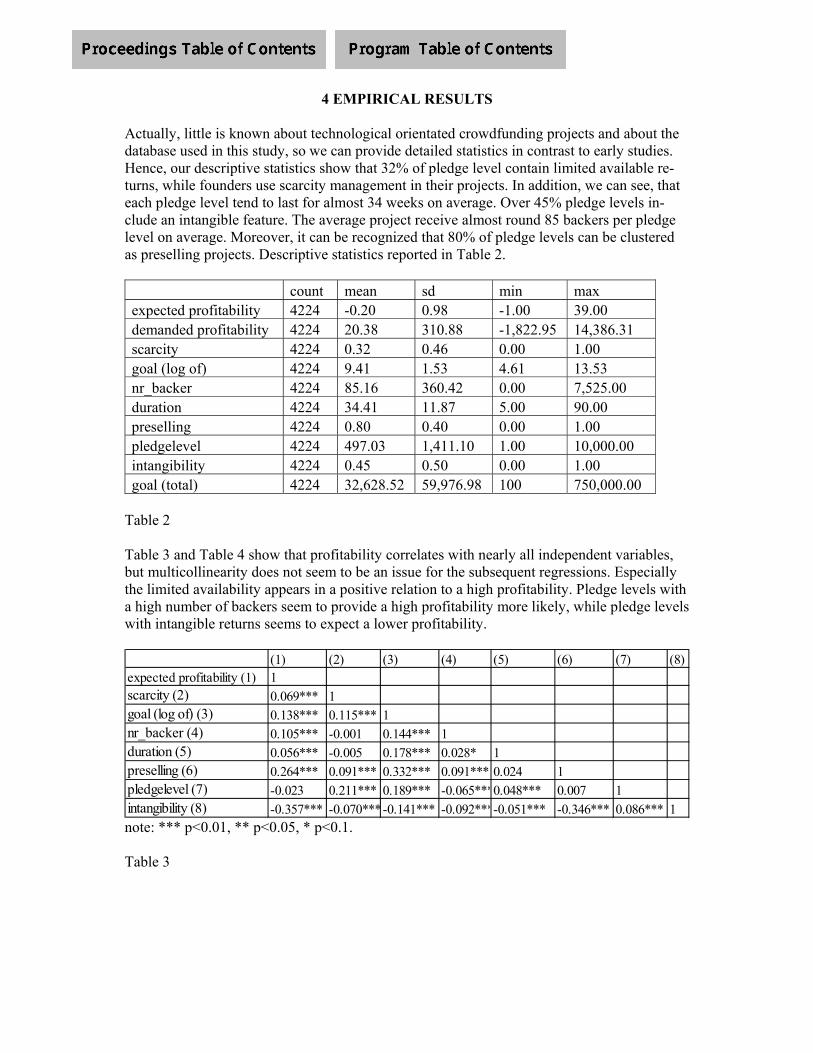
4 EMPIRICAL RESULTS Actually, little is known about technological orientated crowdfunding projects and about the database used in this study, so we can provide detailed statistics in contrast to early studies. Hence, our descriptive statistics show that 32% of pledge level contain limited available re-turns, while founders use scarcity management in their projects. In addition, we can see, that each pledge level tend to last for almost 34 weeks on average. Over 45% pledge levels in-clude an intangible feature. The average project receive almost round 85 backers per pledge level on average. Moreover, it can be recognized that 80% of pledge levels can be clustered as preselling projects. Descriptive statistics reported in Table 2. count mean sd min max expected profitability 4224 -0.20 0.98 -1.00 39.00 demanded profitability 4224 20.38 310.88 -1,822.95 14,386.31 scarcity 4224 0.32 0.46 0.00 1.00 goal (log of) 4224 9.41 1.53 4.61 13.53 nr_backer 4224 85.16 360.42 0.00 7,525.00 duration 4224 34.41 11.87 5.00 90.00 preselling 4224 0.80 0.40 0.00 1.00 pledgelevel 4224 497.03 1,411.10 1.00 10,000.00 intangibility 4224 0.45 0.50 0.00 1.00 goal (total) 4224 32,628.52 59,976.98 100 750,000.00
Table 2 Table 3 and Table 4 show that profitability correlates with nearly all independent variables, but multicollinearity does not seem to be an issue for the subsequent regressions. Especially the limited availability appears in a positive relation to a high profitability. Pledge levels with a high number of backers seem to provide a high profitability more likely, while pledge levels with intangible returns seems to expect a lower profitability.
note: *** p<0.01, ** p<0.05, * p<0.1.
Table 3
(1) (2) (3) (4) (5) (6) (7) (8)expected profitability (1) 1scarcity (2) 0.069*** 1goal (log of) (3) 0.138*** 0.115*** 1nr_backer (4) 0.105*** -0.001 0.144*** 1duration (5) 0.056*** -0.005 0.178*** 0.028* 1preselling (6) 0.264*** 0.091*** 0.332*** 0.091*** 0.024 1pledgelevel (7) -0.023 0.211*** 0.189*** -0.065***0.048*** 0.007 1intangibility (8) -0.357*** -0.070***-0.141*** -0.092***-0.051*** -0.346*** 0.086*** 1

note: *** p<0.01, ** p<0.05, * p<0.1.
Table 4
In addition, it seems to be clear that the number of backers is high when the goal is high. The low correlation among the predicted variables used in the model indicates no reason to sus-pect multicollinearity. We also examined multicollinearity using variance inflation factors (VIF). For all variables the VIF (not reported) are below two. In the regression models heter-oscedasticity is present. Therefore we use robust standard error subsequently. Overall, it seems there are no serious concerns about violated assumptions of an OLS regression. We investigated H1by using an OLS-regression. The results are presented in Table 5.
expected profitabil-ity
demanded profitabil-ity
scarcity 0.034*** 0.029*** (0.002) (0.004) goal (log of) 0.033*** -0.034* (0.003) (0.058)nr_backer 0.059*** 0.530*** (0.000) (0.004)duration 0.030*** 0.008 (0.005) (0.295)preselling 0.143*** -0.014 (0.000) (0.343) pledgelevel -0.011 0.022* (0.344) (0.086) intangibility -0.293*** -0.057*** (0.000) (0.000)r2 0.158 0.283N 4224 4224
note: *** p<0.01, ** p<0.05, * p<0.1.
Table 5
(1) (2) (3) (4) (5) (6) (7) (8)demanded profitability (1) 1scarcity (2) 0.032** 1goal (log of) (3) 0.055*** 0.115*** 1nr_backer (4) 0.527*** -0.001 0.144*** 1duration (5) 0.022 -0.005 0.178*** 0.028* 1preselling (6) 0.046*** 0.091*** 0.332*** 0.091*** 0.024 1pledgelevel (7) -0.017 0.211*** 0.189*** -0.065***0.048*** 0.007 1intangibility (8) -0.096*** 0.070*** -0.141*** -0.093***-0.051*** -0.346*** 0.086*** 1

The regression results show a positive significant relation between scarcity management, es-pecially limited availabilities in pledge levels, and profitability as expected with H1 before. Potential reasons may be found in theoretical assumptions of Cialdini 2009 with respect to studies from Verhallen and Robben 1994 or suggestions from Barone and Roy 2010. For the expected profitability model 16% of the variance and for the demanded profitability model 28% of the variance of the respective profitability proxy can be explained. Our results show that there is no clear evidence for a relation between profitability and the to-tal goal of a project as well as the amount of minimum payment on pledge level. Therefor we found evidence for a strong negative relationship between intangibility of pledge levels and the profitability. The number of backers is affected positively by profitability. Interestingly, the results show a very clear relation with a high coefficient of 53% between the demanded profitability and the number of backers. Therefore, a higher demand by the backers for more profitable pledges can indeed be shown, so they request more profitable pledges. This was made clear by the just mentioned fact. Results are robust across alternative models using different profitability measures and differ-ent control variables (not reported). We also used the number of limited available possibilities for backers as an alternative variable for scarcity and obtained the same results as above. For future research, it could be interesting to analyse the real motivations of backers using limited available products or services. As in most cases this is only possible by using interviews, our actual study cannot provide evidence about more detailed interests of backers. However, the coefficients for the control variables are mainly in line with previous research and our expec-tations.
5 CONCLUSIONS
In the current literature it is already explored that there is an impact of social and intrinsic de-terminants on the success of crowdfunding projects (Ordanini et al. 2011; van Wingerden and Ryan 2011; Belleflame et al. 2014; Allison et al. 2015; Trost et al. 2017). Thereby the focus mainly lies on analysing the determinants of financial success for investors. Only some stud-ies investigate determinants of the profitability of crowdfunding projects (e.g. Harms 2007; Ordanini et al. 2011). These studies are mainly characterised by hypothetical research sam-ples. In addition, despite the extensive research on crowdfunding, little is known about the relation between limited availability in crowdfunding projects and the profitability of the in-cluded pledge levels. In this context, the theoretical framework of commodity theory may help to analyse psycho-logical effects of scarcity (Brock 1968) on crowdfunding projects. Following earlier research we follow the approach that goods or services appear more attractive to customers, if they are combined with a limited availability (see Verhallen 1982; Verhallen and Robben 1994; Cialdini 2009). Thus, uniqueness, quality and prestige are interesting incentives to investors and possible determinants for using scarcity management in crowdfunding projects for the in-itiators. Taking all together, there is a positive relation between limited availability in crowd-funding projects and the profitability of the included pledge levels indeed. In contrast to earlier studies, we are not limited to a hypothetical sample, plus we do not only use small samples. Our empirical research focuses on reward-based projects with the cate-gory technology, continuing the research from Trost et al. 2017. We analysed data from kick-

starter.com, one of the world’s largest crowdfunding platforms. The database contains ex-tracted information on all pledge levels of each project posted on the platform from its incep-tion between 16th of May 2013 and 19th of May 2013. In the end, this study uses a dataset containing 494 projects and 4,224 pledge levels. Hence, our sample includes 32% of pledge levels with limited availability. The results of this study provide insights into the characteristics of crowdfunding projects that impact profitability. More specifically, we provide empirical evidence that the limited availability in crowdfunding projects in terms of scarcity management is positive related to the profitability of the included pledge levels. As a result, we conclude that crowdfunding projects that include limited availability on pledge levels are more profitable for donators/in-vestors. Future research may analyse if these projects are also more likely to succeed their funding goal.
REFERENCES
Agrawal, A./Catalini, C./Goldfarb, A. (2013), Some Simple Economics of Crowdfunding, NBER Working Paper No. 19133. Ahlers, G. K., Cumming, D., Günther, C., & Schweizer, D. (2015), Signaling in equity crowdfunding, Entrepreneurship theory and practice, 39 (4), 955–980. Allison, T./Davis, B./Short, J./Webb, J. (2015), Crowdfunding in a prosocial microlending environment: examining the role of intrinsic versus extrinsic cues, Entrepreneurship, the-ory and practice, 39, 53–73. Barone, M. J/Roy, T. (2010), Does Exclusivity Always Pay Off? Exclusive Price Promo-tions and Consumer Response, in: Journal of Marketing, 2/2010, 74, 121–132. Belleflamme, P./Lambert, T./Schwienbacher, A. (2014), Crowdfunding: tapping the right crowd, Journal of Business Venturing, 29, 585–609. Berglin, H./Strandberg, C. (2013), Leveraging customers as investors: the driving forces behind crowdfunding, Uppsala University. Bouncken, R. B./Komorek, M./Kraus, S. (2015), Crowdfunding: The Current State Of Re-search, International Business & Economics Research Journal, 14, 407–416. Brem, A./Wassong, N. (2014), Wer investiert warum? Eine Analyse von Investmententscheidungen bei Crowdfunding-Projekten, Zeitschrift für KMU und Entrepreneurship, 62, 31–55. Brock, T.C. (1968), Implications of commodity theory for value change, in: Greenwald, A.G./ Brock, T. C. / Ostrom, T. M. (Hrsg.), Psychological foundations of attitudes, New York, 243–275. Cialdini, Robert B. (2009): Influence: science and practice, 5. Auflage, Boston u.a.

Cordova, A./ Dolci, J./Gianfrate, G. (2015): The determinants of crowdfunding success: evidence from technology projects, in: Procedia-Social and Behavioral Sciences 181, 115-124.
Crosetto, P., & Regner, T. (2014), Crowdfunding: Determinants of success and funding dynamics (No. 2014-035), Jena Economic Research Papers. Cumming, D. J./ Leboeuf, G./ Schwienbacher, A. (2015). Crowdfunding models: Keep‐it‐all vs. all‐or‐nothing. Financial Management. Cunha, M. P. E., Rego, A., Oliveira, P., Rosado, P., & Habib, N. (2014): Product innova-tion inresource-poor environments: Three research streams. Journal of Product Innovation Management, 31, 202–210. Fox, A./Müllerleile, T./Joenssen, D. (2015), Zur Eignung von Mezzanine-Kapital für Crowdfunding in Deutschland, Corporate Finance, 6, 1–9. Fromkin, H.L. (1970), Effects of Experimentally Aroused Feelings of Undistinctiveness upon Valuation of Scarce and Novel Experiences, in: Journal of personality and social psychology, 3/1970; 16, 521–529. Frydrych, D./Bock, A./Kinder, T./Koeck, B. (2014), Exploring entrepreneurial legitimacy in reward-based crowdfunding, Venture Capital, 16, 247–269. Gerber, E./Hui, J. (2013), Crowdfunding: Motivations and Deterrents for Participation (Article No. 34), ACM Transactions on Computer-Human Interaction, 20, 1–32. Greenberg, M. D./ Parbo, B./ Hariharan, K./ Gerber E. (2013), Crowdfunding Support Tools: Predicting Success & Failure, CHI 13 Extended Abstracts on Human Factors in Computing Systems, 1815 – 1820.
Hornuf, L./Schwienbacher, A. (2018), Market mechanisms and funding dynamics in eq-uity crowdfunding, in: Journal of Corporate Finance, 50, 556–574 Howe, J. (2006), The rise of crowdsourcing, Wired magazine, 14.6.2006. Harms, Michel. (2007): What drives motivation to participate financially in a crowdfund-ing community?. Available at SSRN 2269242. Hull, C.. 1932. The Goal-Gradient Hypothesis and Maze Learning. Psychological Review 39, 25–43. Inman, J.J./Peter, A.C./Raghubir, P. (1997), Framing the Deal: The Role of Restrictions in Accentuating Deal Value, in: Journal of Consumer Research, 1/1997, 24, 68-79. Joenssen, D.W./Müllerleile, T. (2016), Limitless crowdfunding?: the effect of scarcity management, in: Brüntje, D./Gajda, O. (Hrsg.), Crowdfunding in Europe : State of the Art in theory and practice, Cham u.a., 193–199

Kickstarter.com (2018), Statistiken, in: https://www.kickstarter.com/help/stats?ref=global-footer, last download on 23rd of August 2018. Kivetz, R./ Urminsky,O./ Zheng, Y. (2006), The Goal-Gradient Hypothesis Resurrected: Purchase Acceleration, Illusionary Goal Progress, and Customer Retention. Journal of Marketing Research 43, 39–58.
Kunz, M. M./Bretschneider, U./Erler, M./ Leimeister, J.M. (2017), An empirical investiga-tion of signaling in reward-based crowdfunding, in: Electronic Commerce Research, 3/2017, 17. , 425–461. Kuppuswamy, Venkat, and Barry L. Bayus (2013): Crowdfunding Creative Ideas: the Dy-namics of Projects Backers in Kickstarter: SSRN Working Paper. Lin, M./Viswanathan, S. (2015), Home Bias in Online Investments: An Empirical Study of an Online Crowdfunding Market, Management Science, 62, 1393–1414. Lehner, O. (2013), Crowdfunding social ventures: a model and research agenda, Venture Capital, 15, 289–311. Lin, M./Viswanathan, S. (2015), Home Bias in Online Investments: An Empirical Study of an Online Crowdfunding Market, Management Science, 62,1393–1414. Lynn, M. (1992), Scarcity’s Enhancement of Desirability: The Role of Naive Economic Theories, in: Basic and Applied Social Psychology, 1/1992, 13, 67–78. Lynn, M./Bogert, P. (1996). The effect of Scarcity on Anticipated Price Appreciation, in: Journal of Applied Social Psychology, 22/1996, 26, 1978–1984. Meschkowski, A./Wilhelmi, F. (2013), Investorenschutz im Crowdinvesting, Betriebs-Berater, 68, 1411–1418. Mollick, E. (2014), The dynamics of crowdfunding: An exploratory study, Journal of Business Venturing, 29, 1–16. Moritz, A./Block, J. (2014), Crowdfunding und Crowdinvesting: State of the Art der wirtschaftswissenschaftlichen Literatur, Zeitschrift für KMU und Entrepreneurship, 62, 57–89. Müllerleile, T./Joenssen, D. (2015), Key Success-Determinants of Crowdfunded Projects: An Exploratory Analysis, in: Lausen, B./Krolak-Schwerdt, S./Böhmer, M. (Hrsg.), Data Science, Learning by Latent Structures, and Knowledge Discovery. Studies in Classifica-tion, Data Analysis and Knowledge Organization, Berlin/Wiesbaden, 271–281. Ordanini, A./Miceli, L./Pizzetti, M./Parasuraman, A. (2011), Crowdfunding: transforming customers into investors through innovative service platforms, Journal of Service Manage-ment, 22, 443–470.

Schwienbacher, A./Larralde, B. (2012), Crowdfunding of small Entrepreneurial Ventures, in: Cumming, D. (Hrsg.), The Oxford Handbook of Entrepreneurial Finance, Oxford, S. 369–391. Shi, S. W. (2018), Crowdfunding: Designing an effective reward structure, in: Interna-tional Journal of Market Research, 3/2018, 60, 288-303. Snyder, C.R./Fromkin, H.L. (1980), Uniqueness: The Human Pursuit of Difference, New York/London Stadler, M./Thies, F./Wessel, M./Benlian, A. (2015), Erfolg von Crowdfunding-Kampagnen frühzeitig erkennen: Erfolgsprädiktoren auf Kickstarter und Indiegogo, in: Thomas. O./Teuteberg, F. (Hrsg.): Proceedings der 12. Internationalen Tagung Wirtschaftsinformatik (WI 2015), Osnabrück, 1237–1251. Stegmaier, J. (2015), A crowdfunder's strategy guide : build a better business by building community, Oakland Tomczak, A./Brem, A. (2013), A conceptualized investment model of crowdfunding, Ven-ture Capital, 15, 335–359. Trost, Ralf / Fox, Alexander / Heim, Sebastian (2017): Geldwerte Gegenleistungen im reward-based Crowdfunding - suchen die Geldgeber doch Rendite?, in: Betriebswirtschaftliche Forschung und Praxis (BFuP), 2/2017, 69, 131–155. van Wingerden R./Ryan J. (2011), Fighting for funds: An exploratory study into the field of crowdfunding, Lund University School of Economics and Management. Verhallen, T.M.M. (1982), Scarcity and Consumer Choice Behavior, in: Journal of Eco-nomic Psychology, 4/1982, 2, 299-322. Verhallen, T.M.M./Robben, H.S.J. (1994), Scarcity and preference: An experiment on un-availability and product evaluation, in: Journal of Economic Psychology, 2/1994, 15, 315–331 Zhang, J./ Liu. P. (2012), Rational Herding in Microloan Markets, Management Science, 58, 892 – 912. Zvilichovsky, D./ Inbar, Y./ Barzilay, O. (2015), Playing both sides of the market: Success and reciprocity on crowdfunding platforms.

“RISK MANAGEMENT CHALLENGE IN MULTI-STAKEHOLDER DECENTRALIZED
RISK ENVIRONMENT. FMD - A PIONEER EUROPEAN PRIVATE-PUBLIC
MANAGED BIG DATA PROJECT IN HEALTHCARE SECTOR”
Author:
Michał Kaczmarski, Assistant Professor, Warsaw School of Economics, Collegium of
Management and Finance, Institute of Accounting;
General Manager of the Polish Medicines Verification Organization (PLMVO,
KOWAL)
Foreword
Recently more and more public roles (tasks) are outsourced to private sector and only
supervised by the imperium of governments. This approach seems to be particularly
reasonable and cost effective in respect to complex challenges where many stakeholders need
to be involved and in practice, they only are capable to understand and develop a non-
artificial operational framework that works. Medicines supply is one of the areas where the
complexity of supply chain is relatively high. The below chart presents the multi-stakeholder
and multinational character of it:
Source: (IGO. 2017)(IGO. 2017)(IGO. 2017)(IGO. 2017)(IGO. 2017)(IGO. 2017) WHO Global Surveillance and Monitoring System for
substandard and falsified medical products1
Undisturbed and secure medicines supply chain is particularly important for patients and
efficacy of therapies, often lifesaving ones and reimbursed by national authorities. Both
objectives, i.e. undisturbed supply chain and medicines safety are vital for sustainability of
healthcare system in countries and across the world.
1 World Health Organization, "WHO Global Surveillance and Monitoring System for substandard and falsified medical products,", Geneva
2018

Unfortunately, due to the fact that globalization and e-commerce have increased the
complexity of the supply chain for medicines, there are numerous entry points for unethically
and illegally produced medical products.2 The challenge of scale of the counterfeit medicines
reaching out the patients and legal supply chain has been constantly alerted by World Health
Organization (WHO). According to European Alliance for Access to Safe Medicines3 quoting
WHO:
- 50% of medicines purchased over the internet from sites that conceal their physical address
are counterfeit
- 10% of medicines sold in developing countries are fakes
- 1% of medicines sold in developed markets, such as the European Union, are counterfeit4
Such a scale of the problem could not be tolerated for too long, hence the risk had to be
mitigated and effective countermeasures taken.
Counterfeit medicines
A medicine is considered counterfeit when it is deliberately and fraudulently mislabelled
with respect to its identity, history and/or source. This means that the box, tablet pack, patient
information leaflet or any other packaging, labelling and documentation associated with it
may display the wrong name or product information, be printed in the wrong language or be
missing security stickers or holograms.5
When we speak about counterfeit medicines, we refer to the three areas that had been defined
by the World Health Assembly that governs World Health Organization. The counterfeit
medicines are:
- Substandard medical products: also called “out of specification”, these are
authorized medical products that fail to meet either their quality standards or their
specifications, or both;
- Unregistered/unlicensed medical products: medical products that have not
undergone evaluation and/or approval by the national or regional regulatory authority
for the market in which they are marketed/distributed or used, subject to permitted
conditions under national or regional regulation and legislation, finally
- Falsified medical products: medical products that deliberately/fraudulently
misrepresent their identity, composition or source.6
All of the above three categories will be further jointly referred to as counterfeit medicines.
Profit and risk of counterfeit medicines equation
Counterfeit medicines prevail due to high margin that the fraudsters may achieve from
medicines falsification and relatively low penalties for participation in the criminal conduct.
2 Geneva: World Health Organization; 2017 (WHO/EMP/RHT/SAV/2017.01). Licence: CC BY-NC-SA3.0 IGO, "WHO Global Surveillance
and Monitoring System for substandard and falsified medical products: executive summary," (2017). 3 https://eaasm.eu/home,en 4 European Alliance for Access to Safe Medicines, "The Counterfeiting Superhighway," (2008). 5 Medicines, "The Counterfeiting Superhighway." 6 Geneva: World Health Organization; Licence: CC BY-NC-SA 3.0 IGO, "A study on the public health and socioeconomic impact of
substandard and falsified medical products," (2017).

The problem has also been lacking a systematic measure to verify diligence of legitimate
market supply players and to prove that the act of counterfeiting had been committed
knowingly.
European Commission already in its 2008 report on impact assessment of counterfeit
medicines claimed that the scale of the problem has been increasing over the recent years and
annual cost impact on businesses and society resulting from counterfeit medicinal products in
the legal supply chain had been estimated direct and indirect costs at the level of
approximately 950 million EUR within EU only. By a direct cost we look at the costs falling
on the health sector in terms of prevention, diagnosis and treatment of disease that due to
counterfeit products are not delivering assumed outcome, whereas Indirect costs typically
measure the lost productivity potential of patients who are too ill to work or who die
prematurely.7 The above-mentioned figure is further increasing and will continue to increase
if no effective countermeasures are implemented. The estimation does not mention the loss of
pharmaceutical businesses that intellectual property is damaged. Those losses bring further
impact into the equation.
According to the International Institute of Research Against Counterfeit Medicines (RACM)
for 1000 USD invested, the trafficking of counterfeit currency or of heroin would bring a
return of 20,000 USD, of counterfeit cigarettes 43,000 USD, and counterfeit medicines,
between 200,000 and 450,000 USD.8
Source: http://www.iracm.com/en/thematic-observatory/organized-crime/
Moreover, according to the World Health Organization:
- 50% of medicines purchased over the internet from sites that conceal their physical
address are counterfeit;
- 10% of medicines sold in developing countries are fakes too, and
- 1% of medicines sold in developed markets, such as the European Union, are
counterfeit as well.
7 European Commission, "Impact Assessment Accompanying the document Commision Delegated Regulation (EU) 2016/161supplementing
Directive 2001/83/EC of the European Parliament and of the Council by
laying down detailed rules for the safety features appearing on the packaging of
medicinal products for human use," (2015 2015), SWD(2015) 189 final. 8 http://www.iracm.com/en/thematic-observatory/organized-crime/ [accessed: 15 May 2019, 22:50]
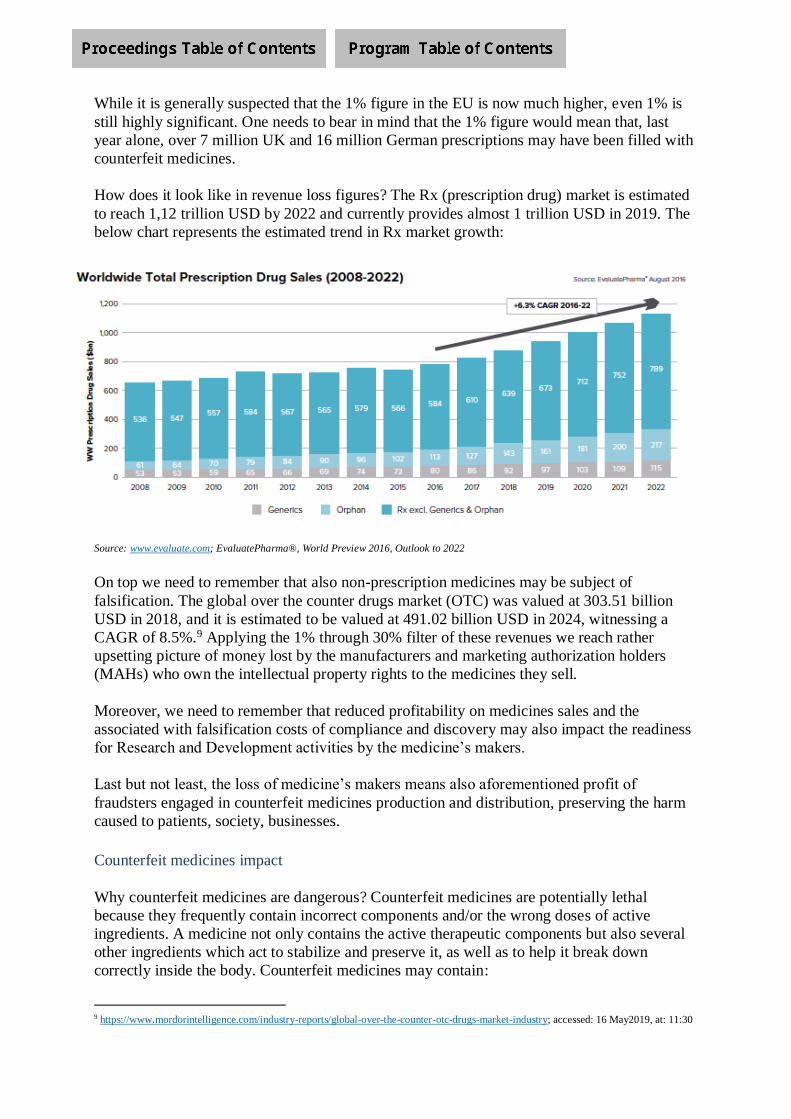
While it is generally suspected that the 1% figure in the EU is now much higher, even 1% is
still highly significant. One needs to bear in mind that the 1% figure would mean that, last
year alone, over 7 million UK and 16 million German prescriptions may have been filled with
counterfeit medicines.
How does it look like in revenue loss figures? The Rx (prescription drug) market is estimated
to reach 1,12 trillion USD by 2022 and currently provides almost 1 trillion USD in 2019. The
below chart represents the estimated trend in Rx market growth:
Source: www.evaluate.com; EvaluatePharma®, World Preview 2016, Outlook to 2022
On top we need to remember that also non-prescription medicines may be subject of
falsification. The global over the counter drugs market (OTC) was valued at 303.51 billion
USD in 2018, and it is estimated to be valued at 491.02 billion USD in 2024, witnessing a
CAGR of 8.5%.9 Applying the 1% through 30% filter of these revenues we reach rather
upsetting picture of money lost by the manufacturers and marketing authorization holders
(MAHs) who own the intellectual property rights to the medicines they sell.
Moreover, we need to remember that reduced profitability on medicines sales and the
associated with falsification costs of compliance and discovery may also impact the readiness
for Research and Development activities by the medicine’s makers.
Last but not least, the loss of medicine’s makers means also aforementioned profit of
fraudsters engaged in counterfeit medicines production and distribution, preserving the harm
caused to patients, society, businesses.
Counterfeit medicines impact
Why counterfeit medicines are dangerous? Counterfeit medicines are potentially lethal
because they frequently contain incorrect components and/or the wrong doses of active
ingredients. A medicine not only contains the active therapeutic components but also several
other ingredients which act to stabilize and preserve it, as well as to help it break down
correctly inside the body. Counterfeit medicines may contain:
9 https://www.mordorintelligence.com/industry-reports/global-over-the-counter-otc-drugs-market-industry; accessed: 16 May2019, at: 11:30

- an incorrect amount of active ingredient (too little can be as dangerous as too much)
- a wrong active ingredient
- no active ingredient at all
- toxic and/or other non-medical components (e.g.: road paint, floor wax, shoe polish,
talcum powder, chalk)
- the correct ingredients, but fake packaging and documentation10.
If there is anything suspicious about a medicine or if it is different from the original product
in terms of presentation (color, taste, crumbliness, shape, size, stamped logos etc.) or
packaging (language, medicine names, indicated dose strength, printing etc.) then it may be a
counterfeit product.11
There are two types of medicines particularly prone to falsification. First group are the high
value products, the second the products consumed in high volumes. Both are attractive to
counterfeiting perpetrators. It is believed that in developed markets, such us the EU market
the so called “lifestyle medicines”, such as erectile dysfunction products or weight
management are the ones most falsified. These medicines people may buy online because
they do not wish to discuss the problem with a doctor, or in fact anybody else. However, the
recent researches and findings from EU customs undercover operations prove that lifesaving
prescription medicines are also subject to counterfeiting. The problem is even more visible in
less developed markets, where e.g. malaria vaccines are falsified and administered to humans,
which often has lethal consequences. It is known fact that e.g. only in China up to 300
thousand people were dying per annum due to falsified medicines12. This is far less than total
number of terrorism casualties for the last 40 years.13
Risk and counterfeit risk mitigation measures across EU
The overall situation of counterfeit medicines had been monitored for many years by many
governments including the European Union (EU) and European Economic Area (EEA)
member states.
The abovementioned monitoring proved that border controls only, considering 10 billion
packs of on prescription medicines (Rx) entering EU customer market per annum and the fact
that to large extent these Rx products are manufactured outside the EU and EEA area and that
they have to be imported from out of the EU and EEA before released to the target market
circulation, are not enough. The results of the border control law enforcement activities
provided however a good indication into the scale of the problem. Counterfeit medicines
seized at the EU's outer border tripled between 2006 and 2009, reaching approximately 7.5
million items. Over 30 million counterfeit medicines have been seized by customs at EU
borders over the years 2010-201914.
According to Europol the scale of the problem increases, mostly due to high profitability of
the criminal procedure and low number of prosecutions and proceeds of crime seizing. It is
impossible to stop billions of packs at border controls. Hence the EU governments decided to
do more. In particular that falsified medicinal products can enter the legitimate supply chain
at various stages of it. This means that before introducing serialization and anti-tampering
devices to medicinal products the discovery of falsification had been extremely hard. Prior to
10 Medicines, "The Counterfeiting Superhighway." 11 Medicines, "The Counterfeiting Superhighway." 12 Medicines, "The Counterfeiting Superhighway." 13 https://ourworldindata.org/terrorism; accessed 17 May 2019 at 19:40 14 Commission, "COM Impact Assessment 2015."

serialization the packs had not been individually tracked and verified, hence the discovery of
counterfeit product had become extremely hard.
The below chart presents established by the European Commission touch points of entering
counterfeit medicines into legitimate supply chain circulation. Once introduced the layering
phase had been initiated and the tracking of fakes almost impossible, except instances of
accidental discovery or pure luck of law enforcement agencies.
Source: Impact Assessment Accompanying the document Commission Delegated Regulation (EU) 2016/161supplementing Directive
2001/83/EC of the European Parliament and of the Council by laying down detailed rules for the safety features appearing on the packaging of medicinal products for human use, Brussels, 2015
The missing obligatory technology solutions protecting medicinal products against
falsification led to an increased and intolerable presence of falsified medicines in the
European Union (EU) and European Economic Area (EEA). To fight this problem, European
Parliament and the Council introduced the Directive 2011/62/EC that enforced agreed with
the business stakeholders two obligatory safety features: (i) a unique identifier (a number or
sequence, unique to an individual medicine pack, contained in a carrier/barcode), and (ii) an
anti-tampering device (i.e. reliable indicator whether the pack had been tampered before
delivery to the patient or not).
The Directive also put the European Commission under the obligation to set out: (i) the
technical details of the unique identifier; (ii) which actor in the supply chain will verify the
safety features; and (iii) who will establish and manage the repositories system storing the
unique identifiers.15
The year 2015 brought further development, i.e. the introduction into a legal circulation of the
Commission Delegated Regulation (UE) 2016/161 that introduced a European Medicines
Verification System (further System) that went live on 9 February 2019.
The System is a pioneer European private-public managed big data project in healthcare
sector, introduced to prevent the entry into the legal supply chain of falsified medicinal
products by requiring the placing of safety features consisting of a unique identifier and an
anti-tampering device on the packaging of certain medicinal products for human use for the
purposes of allowing their identification and authentication.16
The aforementioned regulations derived from the concept of regulatory risk management
frameworks, recently heavily promoted by the United Nations as an effective measure to
mitigate serious risks with national and global impact. As risk management is perceived a
15 Commission, "COM Impact Assessment 2015." 16 European Commission, "Commission Delegated Regulation (UE) 2016/161," Official Journal of the European Union (L 32/1) (2015).
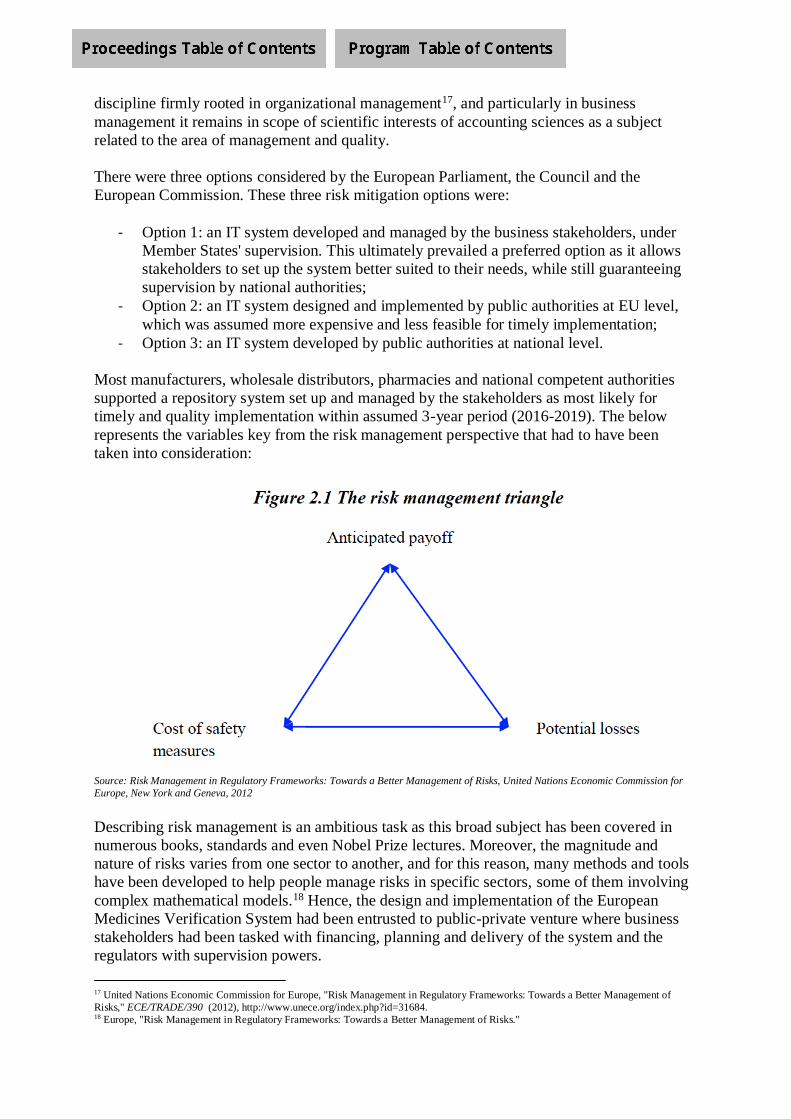
discipline firmly rooted in organizational management17, and particularly in business
management it remains in scope of scientific interests of accounting sciences as a subject
related to the area of management and quality.
There were three options considered by the European Parliament, the Council and the
European Commission. These three risk mitigation options were:
- Option 1: an IT system developed and managed by the business stakeholders, under
Member States' supervision. This ultimately prevailed a preferred option as it allows
stakeholders to set up the system better suited to their needs, while still guaranteeing
supervision by national authorities;
- Option 2: an IT system designed and implemented by public authorities at EU level,
which was assumed more expensive and less feasible for timely implementation;
- Option 3: an IT system developed by public authorities at national level.
Most manufacturers, wholesale distributors, pharmacies and national competent authorities
supported a repository system set up and managed by the stakeholders as most likely for
timely and quality implementation within assumed 3-year period (2016-2019). The below
represents the variables key from the risk management perspective that had to have been
taken into consideration:
Source: Risk Management in Regulatory Frameworks: Towards a Better Management of Risks, United Nations Economic Commission for
Europe, New York and Geneva, 2012
Describing risk management is an ambitious task as this broad subject has been covered in
numerous books, standards and even Nobel Prize lectures. Moreover, the magnitude and
nature of risks varies from one sector to another, and for this reason, many methods and tools
have been developed to help people manage risks in specific sectors, some of them involving
complex mathematical models.18 Hence, the design and implementation of the European
Medicines Verification System had been entrusted to public-private venture where business
stakeholders had been tasked with financing, planning and delivery of the system and the
regulators with supervision powers.
17 United Nations Economic Commission for Europe, "Risk Management in Regulatory Frameworks: Towards a Better Management of
Risks," ECE/TRADE/390 (2012), http://www.unece.org/index.php?id=31684. 18 Europe, "Risk Management in Regulatory Frameworks: Towards a Better Management of Risks."

In this paper I am focusing only on the patient safety and intellectual property losses aspect of
the medicine’s safety. The below WHO drawing explains the payoff aspect of the counterfeit
medicines fight associated with the potential and actual losses and impact of the fakes on
economy, society and healthcare system:
Source: A study on the public health and socioeconomic impact of substandard and falsified medical products, World Health Organization, Geneva 2017
Potential losses for patients and economy
As stated earlier, the impact of the counterfeit medicines is overwhelming. On one hand we
have the estimated cost of 950 million EUR across UE associated to health and
socioeconomic impact.
Moreover, provided that EvaluatePharma Outlook19 indicates almost 1 trillion USD sales of
prescription drugs (Rx) worldwide in 2019 and assuming that Europe represents 20% of the
figure, the intellectual property theft aspect of the counterfeit drug may be valued at 2 billion
USD of annual losses by manufacturers and marketing authorization holders (MAHs). If we
also consider that Rx drugs supplied to EU patients is assumed at the volume of 10 - 14
billion packs per annum20 and take only 1 % of the figure, we speak about 100 to 140 million
fake packs across Europe.
Anticipated payoff
The anticipated payoff on the other hand – if the EU market only is considered – is the saving
of the patient lives and the 950 million EUR in socioeconomic savings, as well as 2 billion is
revenue due to reduced volume of fake Rx products on the market.
Moreover, the replacement of different national product coding systems with a harmonized
EU system is assumed to bring additional surplus savings to be as high as 1 billion EUR per
year21.
19 EvaluatePharma®, "World Preview 2016, Outlook to 2022," (2016), www.evaluate.com. 20 https://www.medicinesforeurope.com/news/new-safeguards-for-patient-safety-as-falsified-medicines-directive-comes-into-force/; accessed
17 May 2019 at 12:30 21 Commission, "COM Impact Assessment 2015."

Additionally, it is considered that FMD may bring significant reduction of costs, human
resources and time needed to handle recalls and returns procedures for medicinal products.
The number of recalls has more than doubled over the years 2010 - 2015. On average about
200.000 units are affected per medicine recall. Each product recall is estimated to cost 2
million EUR across the supply chain.
Altogether, we talk about at least 4 billion EUR od savings and payoff altogether.
Estimated cost of safety measures
The cost of serialization effort had also been considered. However, this aspect of the project
has been decentralized and we have to split the cost into System user groups, i.e. amongst the
business stakeholders. The System outline had been presented below:
Source: https://emvo-medicines.eu/mission/emvs/
According to the Commission Delegated Regulation (EU) 2016/161 there are two major users
of the System. The first group are the Marketing Authorization Holders (MAH), i.e. the
owners of the IP right to their products. They have to cover the cost of:
- packaging including 2D Data Matrix information of the medicinal product and the
anti-tampering device on each single pack of the medicinal product;
- development and maintenance of the repositories system22 described by Chapter VII
of the Commission Delegated Regulation (UE) 2016/161 (the Regulation). The
obligation derives from article 31 of the Regulation.
22 Art. 32 of the Commission Delegated Regulation (UE) 2016/161 states:
“The repositories system shall be composed of the following electronic repositories:
(a) a central information and data router (‘hub’); (b) repositories which serve the territory of one Member State (‘national repositories’) or
the territory of multiple Member States (‘supranational repositories’). Those repositories shall be connected to the hub”

It had been estimated that the costs to upgrade the packaging line for applying the unique
identifier can reach 0,033 EUR per pack of medicines. Total annual costs for originators
(manufacturers of branded products) range from 20 million to 110 million EUR. Total costs
for generics companies range from 30 million to 210 million EUR. However, these costs will
be partly offset by savings stemming from the harmonization of national coding systems and
the reduced costs of handling recalls and returns.
Concerning the database costs where the medicines pack information is stored, the costs had
been estimated to reach 205 million EUR/year for the manufacturers, corresponding to 0,022
EUR per pack of medicine.23 The latter is also covered by the MAHs.
The second group are the wholesalers and pharmacies, both at hospitals and community
pharmacies.
As regards the verification of the unique identifier, the total costs of risk-based verification by
wholesale distributors had been estimated at the level of about 33 million EUR per year for
the sector.
A pharmacy/retailer or general practitioner will incur annualized costs of 530 EUR, and a
hospital pharmacy up to € 750, to modify software, buy scanners and verify authenticity.
Altogether, the costs per annum were assumed not to exceed about 400 million EUR for
manufacturers/MAHs and 90 million EUR for wholesalers and pharmacies. The latter
assuming 150 000 users of the system amongst wholesalers and pharmacies24 participating at
average cost of 600 EUR x 150 000 = 90 million EUR.
Altogether the financial commitment is not to exceed 500 million EUR with aforementioned
at least 4 billion EUR payoff, i.e. the eightfold difference and 3,5 billion EUR surplus.
Moreover, it is assumed that with time the costs of operation of the system shall decrease and
create additional savings, such us e.g. better stock management, more reliable medical
procedures settlement based on more precise medicine consumption data, better and cheaper
monitoring of reimbursement costs and enhanced efficacy of pharmacovigilance or
pharmacoepidemiology procedures. All of the latter are still difficult to estimate at the early
project phase; however, they all had been foreseen by the Regulation25.
Conclusions going forward
It is assumed to review the effects of implementation of the aforementioned risk mitigation
system that effectively went life on 9 February 2019. The review is therefore assumed in
2024, by the time the actual cost and benefits of the project may be well measured by the
scientific community and if the project proves its concept it needs to be considered as the
future of the private-public regulatory risk mitigation enterprises.
Currently the author is collecting data on the project performance and is busy with designing
a survey amongst stakeholders of the project in order to learn more about the perceived
benefits of the European Medicines Verification System in its still early phase and to learn
23 Commission, "COM Impact Assessment 2015." 24 https://www.lekis.cz/wp-content/uploads/2019/02/EMVS-Stabilisation-Period-v1.0.pdf; accessed 17 May 2019 at 18:00 25 See article 39 of the Commission Delegated Regulation (UE) 2016/161

about any potential project risks materialized and mitigated across this pioneer EU initiative,
the first in the history of European Union and still unique across the world.
Finally, if the proof of concept gets proved the whole EU project and its lessons learned may
be extremely beneficial to the US market before 202326 when similar project is expected to go
live pursuant to introduction there of the Drug Supply Chain Security Act.
26 https://www.ey.com/Publication/vwLUAssets/ey-pharmaceutical-serialization-compliance-and-beyond/$File/ey-pharmaceutical-
serialization-compliance-and-beyond.pdf; accessed 17 May 2019 at 19:00

REFERENCES
1) European Alliance for Access to Safe Medicines, The Counterfeiting Superhighway, Surrey, UK 2008 2) European Commission, Commission Delegated Regulation (UE) 2016/161, Official Journal of the
European Union, ref.: (L 32/1), 2015 3) European Commission, Impact Assessment Accompanying the Document Commision Delegated
Regulation (UE) 2016/161 supplementing Directive 2001/83/EC of the European Parliament and of the Council by laying down detailed rules for the safety features ppearing on the packaging of medicinal products for human use, 2015, SWD(2015) 189 final
4) EvaluatePharma, World Preview 2016, Outlook to 2022, 2016, www.evaluate.com 5) United Nations Economic Commission for Europe, Risk Management in Regulatory Frameworks:
Towards a Better Management of Risks, ECE/TRADE/390, New York and Geneva, 2012 6) World Health Organization, A Study on the Public Health and Socioeconomic Impact of Substandard
and Falsified Medical Products, Geneva 2017 7) World Health Organization, Global Surveillance and Monitoring System for Substandard and Falsified
Medical Products: Executive Summary, Geneva 2017 8) World Health Organization, Global Surveillance and Monitoring System for Substandard and Falsified
Medical Products (full text, English version), Geneva 2017
1
NARRATIVE RISK DISCLOSURES IN ANNUAL REPORTS: PROPOSAL OF RISK MAP
Anna Karmańska
SGH Warsaw School of Economics Poland
Monika Łada AGH University of Science and Technology
Poland [email protected]
ABSTRACT
The aim of this article is to examine the transparency of the practice of risk disclosures within corporate financial reporting. The challenge has been taken as a result of the observation of the practice of these disclosures and their high diversity. Due to this diversity, the monitoring and evaluation of the risk areas and factors related to the company pursued by its stakeholders can be seriously impeded. In view of in-depth literature studies showing that the issue of reporting risk disclosures is not widely explored and there is an urgent need to introduce information solutions useful in different financial analyses. The authors present their own concept, which can be useful in transparent risk reporting. The article presents the results of an empirical study which shows different aspects of the current disclosure practice and provides a strong argument for presenting a concept that well-organizes this reporting area. The originality of this study results from the presentation of the results of an empirical study, whose objective is specific and never undertaken in the literature before and from a proposal of the design of an original Risk Map, as a disclosure disciplinary instrument in the area of risk in terms of ex-post as well as ex-ante. Keywords: Risk, disclosure, activity report, WIG30 companies, narrative reporting

2
1. Introduction 1.1. Risk management as a driver of the growth in demand for information in the risk areas
and factors
The reasons for the increase in the requirements from business companies in the field of risk disclosure can be seen in the development of the science of risk management. What also contributed to it, was a strong and increasingly evident pressure exerted in recent decades on companies by financial markets, financial regulators, politicians and other interest groups. The risk management process and its measurement are an internal issue of the company and should not be identified with the risk reporting process. The former serves a specific prevention, limiting the possibility of appearance of risk effects. The latter, on the other hand, entails a policy of disclosing to external stakeholders the information on the kinds of risk, as a matter of fact, on the risk management effects related to the company. However, both processes are closely interrelated. Risk management is linked to internal risk measurement, using instruments to compensate for potential risk effects and the implementation of the internal control system to ensure the implementation of the company risk management policy. To make a clear distinction, risk reporting (primarily through the annual report) is a mechanism that merely casts light on the company's risk management policies and practices and assists external stakeholders in recognising all aspects affecting the valuation of the financial condition of the company.
1.2. Conditions for risk disclosure in financial reporting. Origins and arguments
The current practice of reporting risk areas and factors has its history. Its origins can be related to the beginning of the process of standardizing corporate governance. The first clear signal about the need to improve financial reporting, taking into account this idea, was expressed in the UK in Cadbury Report in 1992 [13]. However, the need to broaden the range of information reported by companies, including the scope of risk, resulted only from the Turnbull Report published in 1999. [52]. Other reports related to the creation of corporate governance principles were made between 1992 and 1999 in the UK. These were: in 1995, the Greenbury report and in 1998 - the Hampel report. However, none of them so clearly focused on the risk, as the Turnbull report. The arguments in favour of the need for risk disclosure – particularly in publications from 1998 and 1997, were due to the conviction that risk disclosure would primarily serve [58]:
facilitating supranational, supra-industrial comparisons of risk characteristics and values of its different measures, as well as
enriching investors knowledge and enabling them to make decisions with greater awareness of the nature and scale of the risks connected with the activities of different corporations (companies).
In 1997, a document appeared entirely dedicated to risk. The Institute of Chartered Accountants in England and Wales (ICAEW) prepared a draft risk report - the Financial Reporting of Risk, Proposals for a Statement of Business Risk [52]. How important this document was and at the same time how pioneering, is evidenced by its further versions in 2002, 2004 and 2011[27]. A certain role was played by the OECD'S principles of corporate governance (of 1999 [52]), which included a requirement for risk management and information on its scale and the adoption in 2002 by the Congress of the United States, the Sarbanes – Oxley Act – 2002, which – by

3
improving the quality and reliability of financial reporting and exacerbating transparency requirements for players in the financial markets – was to restore, after the financial scandals of Enron and WorldCom, the investor confidence in the financial markets, the boards of companies listed in the Stock Exchange, audit agencies and financial advisors. Arguments for widening risk disclosure can also be found in the following reasoning [52]: a company raising capital seeks to obtain it at the lowest price. One of the main factors shaping the cost of capital is the risk connected with the company and its future cash flows. If the information on risk is insufficient to adequately assess it, the capital provider usually requests a special premium to cover the effects of additional risk. Therefore, increasing the scope of information of risk may be accompanied by a reduction in the cost of capital. Better risk information should lead to a more efficient allocation of capital in the market. In addition, the extension of risk information can contribute to the establishment of a more effective risk management system by the company. It is very likely that a company which introduces a stricter approach to risk reporting should also improve its risk management procedures. Broader risk reporting can bring a number of other benefits. All investors have the right to receive the same information about the company in which they invest capital. However, in practice, access to certain information (not resulting from reporting) may be limited. Therefore, risk reporting can provide fairer access to information. Risk reporting also gives an opportunity to assess how the entity managers fulfil the tasks assigned to them and how the scope of protection of investors' interests increases. The above findings indicate that the observed trends aimed at the reduction in asymmetry of information between economic operators and the environment affect the widening of the scope of compulsory and non-compulsory disclosures in the annual reports. Risk reporting is a dimension of disclosures that primarily takes a form of descriptive narrative of areas and sources of economic risk, of how the entity responds to identified threats, as well as the potential impact of the risk factors on the situation of the entity and the perception of its activities by the environment.
1.3.Narrative disclosures and diversity of topics related to them The scientific research of narrative disclosures in relation to risk areas and factors is scientifically interesting. It is caused not only by uncertainty and risk, which as a research subject poses a major challenge. What is also important here, as observed by Charlotte Linde [40], is the role of narration in expressing and transmitting the socially useful knowledge, as a special kind of hidden knowledge. As "(...)narration is a bridge between silence and openness, enabling the demonstration and cognition of tacit knowledge of society(...). " Another issue is that narrative disclosures may be optional or obligatory. It is not meaningless for their scope, quality and other attributes, which is noted by Richard Slack and Philip Shrives [54], stressing the difficulties related to the narration, which also poses research challenges. In these studies, a different issue, but only seemingly distant from the reporting narration, may be leadership in the company and the ability to use different narrative patterns in different circumstances. And this aspect of the reporting narrative is shown by Stephen Denning [14]. This is just a small sample of the diversity of issues that can be seen in the research on narrative disclosures in the area of risk. However, it is not disputed that, owing to the intensity of the changes in the reporting of economic entities, the research related to risk

4
and its reporting narrative are interesting and, at the same time, useful: scientifically and practically.
1.4.The background of narrative disclosures in Poland and in the EU In countries such as Poland, with a less reinforced market economy system and shorter capital market traditions, the main source of pressure on extending the scope of risk reporting comes from foreign organisations and institutions (e.g. International Accounting Standards). Poland, as a member of the European Union, is subject to the regulation of EU.
Historically, in Poland, prior to the date of International Accounting Standards (i.e. before 1 January 2005), on the statutory list, i.e. obligatory notes supplementing financial statements and on the list of issues determining the content of the report, which was called the management report (the latter 1990s), there was no clear indication of the need for risk reporting [23]. And even though the disclosure requirements have grown considerably, there have been no changes in this issue [24]. In general, during the period 1995-2001, the disclosure could be grouped in six blocks, which included information related to the scope and valuation of balance sheet items, result cash flows, information on managing authorities, information relevant to the comparability of reports, concerning the capital group, information going beyond the statutory minimum and relevant to the financial analysis. It was only in 2001 that the announcement of changes in the nature of disclosures could be noticed. It appeared in the obligation of the inclusion of the information in the disclosure of the information concerning mergers and, lastly, identifying the uncertainty of continuation of the business. The then balance sheet law stated that the latter information should contain “in the case of uncertainty as to the possibility of continuation of the activity, a description of those uncertainties and a statement that such uncertainty exists and an indication the financial statement contains the related corrections; the information should also include a description of the action taken or planned by the entity to eliminate uncertainty [25].” Radical changes in the disclosure of financial reporting began at the moment of the accession of Poland to the European Union (1 May 2004), which made it compulsory to apply EU directives and then international accounting standards. Today we are faced with the flood of information of a non-financial character, and narrative related to the condition and potential of the company. Every country of the European Union is in a similar situation. A major change in accounting risk reporting in Poland came with the introduction in 2014 of Directive No 95 of the European Parliament and the Council amending substantially the principles and scope of disclosure of non-financial information. This directive1 – after the transposition into the accounting Act (2016) of its assumptions, including in particular account for the risk characterisation obligation, broadened the annual reporting obligations to many economic entities in 2017. It was crucial for the content of the so-called issuer's activity report of issuer listed on the stock exchange. This report should include the information specified in the accounting rules and, importantly, the descriptions of the relevant risk factors and threats, defining the extent to which the issuer is exposed to it 2.
1Directive 2014/95/EU of the European Parliament and of the Council of 22 October 2014 amending Directive 2013/34/EU as regards the disclosure of non‐financial and diversity‐related information by certain large entities and groups, Official Journal of the European Union, L 330/1. 2 Art. 91, Regulation of the Minister of Finance of 19 February 2009 on the current and periodic information conveyed by issuers of securities and conditions of recognition as equivalent information required by the law of

5
Although this change was serious and spread to all the countries of the European Union, it was not a complete novelty in Poland. The risk disclosure practices in the annual reports had already been observed earlier. They primarily resulted from the application of International Accounting Standards and other information requirements concerning first of all the listed companies [52]3. In Poland, before the introduction of amendments to the Directive of 2014, the problem of the disclosure of risk areas and factors in financial reporting was practically not widely undertaken. A pioneer publication in this regard was the book (the effect of several years of scientific research) scientifically edited by A. Karmańska, entitled Risk in Accounting [52] of 2008 and publication of D. Dobija entitled Standardization of Financial Reporting, Valuation and Risk Measurement Dilemmas [15]. Meanwhile, in Europe, the research in this area was carried out on a wider scale, on many substantive fronts, but nevertheless definitely with less intensively than, for example, studies relating to the fair value. At this point, to expose research aspects, it is worth mentioning that in the UK (2010) [59] the problem of quality of risk disclosure was undertaken. The study focused primarily on transparency. It confirmed a general tendency to transparent presentations of information about the risk, but it also identified creative reporting in this area. However, the research indicated the overall usability of narrative reporting not only for corporate managers, but also for investors, suppliers, employees, state and other stakeholder groups. In addition, it pointed to limitations of this reporting. In the same year (2010), also in the UK [50] the research examined on a sample of over one million cases, who used the narrative information contained in the online annual reports and what is (on average) the use of different types of narrative information. This research found out that the most frequent users of the online annual report were, as appropriate, private individuals, people registered by Internet service providers, employees and professional investors/creditors. The results also suggest that people with more experience and knowledge in the preparation and use of financial statements, such as professional investors, creditors and accounting firms, use the annual reports mainly to acquire detailed financial accounting data. However, the ease of online access to annual reports is a good channel for distributing company information among employees and a broader group of other stakeholders.
In Italy (2012) [26], the evolution of voluntary disclosures in the direction of compulsory disclosures was undertaken. An empirical research concluded that, after introducing some new compulsory disclosures, managers are generally discreet, unlikely to disclose widely, do not change their disclosure policy without revealing significant information to external users. Before and after the introduction of the new regulations, the behaviour of the managers
a non‐member State (Consolidated text: OJ 2014. Item. 133). This regulation was repealed in April 2018 and replaced by the regulation of the Minister of Finance of 29 March 2018 on the current and periodic information conveyed by issuers of securities and the conditions for recognition of equivalent to the information required by the law of a non‐member state (Journal of Laws 2018, Item 757). The obligation to present in the activity report of the issuer the information required by the Accounting Act was maintained in paragraph 70, which is analogical to the earlier. 3In conclusion, it can be said that the requirements for risk communication are becoming increasingly important, and the way in which these requirements are implemented depends on the management of the entity. Because it is the management that decides on the quality of the information disclosed (the clarity of the wording used as well as its reliability depend on the individual itself). In the light of IFRS, managements may decide whether to disclose risk data in the context of the notes or in a separate element (part of) the report.

6
appeared to be in line with their own interests in order to protect themselves against litigation and competitive costs, as well as against possible decline in the value of the company. Summa summarum, this research makes it possible to note that the boards do not change their "reporting attitude" as a result of the emergence of new regulations on disclosure. On this background, it would be interesting to investigate what would, if anything, make managers change the external information policy? In 2012, in the UK [21], they began to investigate the factors that determine the narrative risk information in periodic reports of non-financial corporations. An empirical analysis indicated that large companies reveal more and more information about risk. It was also noted that there was a significant link between the kind of activity and the level of disclosure of the narrative risk in the periodic reports, but in turn the statistical analysis showed negligible impact on the level of risk disclosures of other business specific characteristics (such as liquidity, leverage, profitability) and corporate governance mechanisms for narrative risk disclosure. It turned out that the size of the company and the type of industry in which it operates affect the disclosure of narrative risk. In 2014 (in Italy) [42], a research was conducted on the usability of risk disclosure in the banking sector. It was said that in banks, the disclosure of information is quite similar, and banks tend to provide a lot of information in supplementary notes to financial statements. It was considered that the research could be of great importance for reporters, for those responsible for setting up international and national accounting standards, the Basel Committee of Banking Supervision and national supervisory authorities.
In 2015, in Finland [44] the research focused on the impact of the boards on the quality of disclosure of narrative information. The research explained the supervisory function of the management board in relation to lower layers of corporate managers. It was found out that the financial incentives of board members actually affected the dynamics of their work and also translated into narrative disclosures of the company. Besides Europe, research was conducted from different perspectives. For example, in 2011, in Australia [55], when examining different keywords (e.g. dividends), the relationship between the narrative disclosure and company performance was confirmed and a model was proposed which, based on narrative allows for the distinguishing of good and poor companies. The quality of this model, although not without reservation, was set at a level of 86% of the validity of the assessment. In Egypt in 2012 [34], a research conducted was analogous to that of 2010 made in the UK and focused on the stakeholders of online financial reports. The findings on the Egyptian grounds are similar to those of the British practice. Also, in Australia, 2016 [28] they examined the "quality" of narrative information on risk management, assessing both what is disclosed and how it is done. The research refers to 2010 and 2012. It indicates that many companies claim that since there is no obligation to report risk areas and factors, they will not do so even facultatively. It was assumed that such (empirically confirmed) reasoning provides an argument for the need to introduce compulsory regulations in this regard at the international level. In 2019, in Nigeria and South Africa [4], the research focused on a relationship between culture, corporate governance and risk reporting practices. The results indicate that two factors, namely
7
ownership and profitability, are essential for the practice of disclosure of corporate risk information. It was assumed that the understanding of the factors relevant to risk disclosure could help regulators and standard-setting entities to promote the improvement and dissemination of such disclosures.
1.5. The aim and questions of the new empirical study
The above observations made the author continue the study of accounting risk, begun by A. Karmańska in 2008 [52]. The fact of a major change in the balance sheet law, which was presented above, was a direct driver which could significantly change the practice of perception of risk in economic activity and, consequently, in accounting. With this assumption in mind and observing the intensified narrative reporting in various forms [31, 32], the authors conducted an empirical research in 2018 to diagnose whether significant substantive changes in the balance sheet law of 2017 translated in Poland into a substantial change in the practice of presenting disclosures of risk area and factors. The observations made are described in the text [33] entitled "Disclosure of risk areas and factors in the activity reports of listed companies - observations of changes in legal regulations" (admitted for printing). The results of the research indicate a selective increase in the scope of disclosures of risk areas and factors and a clear intensification of the risk rhetoric. In this regard, they make everyone realise the multifaceted and complicated issues related to the narrative risk disclosure and the specific impact of changes in accounting legislation on the above-mentioned disclosures in the practice of stock market companies. The manual review and analyses of the documents of the companies surveyed allowed the authors to conclude that although the requirements for risk communication have increased, the way these requirements are implemented is quite diverse in many aspects, also qualitative (transparency, clarity and explicit formulation and its reliability). In view of the statements made, the purpose of the research presented in this article was also to diagnose, this time, the scope and method of disclosures of risk areas and factors in the reports of the largest companies (WIG30), listed on the Warsaw Stock Exchange. This diagnosis is intended to help authors in: (1) answering the question of whether it is possible to compare the narrative disclosure of risks both in terms of time and – for example industry, and (2) giving rise to working out a proposal of guidelines for narrative disclosures in this regard. And literary studies made on the occasion of this research are aimed at presenting the reasons behind the development of the theory of narrative disclosures (in this particular case, risk areas and factors). As reported above, risk reporting has been the subject of research for years, but there are still research gaps and there is no overall risk disclosure theory. However, the existing research proposals have a lot to say about the reporting practice in this area and the findings of the scientists involved in the problem provoke a new scientific curiosity: has this practice changed over years, if so, why? What are these changes and what is the actual usability of such disclosures? The adopted objective and scope of the research was translated into the layout of this article. The next chapter will introduce a theoretical framework of research into narrative risk areas and factors. The third chapter will be intended to approximate the test method used. The fourth chapter will discuss the results of the empirical texts of the section of the annual reports on narrative risk disclosure. The general conditions for annual reporting of listed companies in Poland will be outlined. There will a discussion of the place and structure of risk presentation

8
in the reports, the labels used to identify the risk areas and factors, and the description of risk factors. The next chapter will present a proposal for a standard for the structure of disclosures of risk area disclosures and factors for non-financial corporations. The article ends with the conclusions set out in part six. 2. Risk disclosures in annual reports – theoretical framework The research on accounting risk has been conducted for years [6, 9, 22, 52] and in very different contexts. The analysis of disclosures is therefore merely a part of a wide range of research to create information on risks and its use by organisations for internal and external purposes. The complexity of risk is illustrated in Figure 1, which shows a map of the most frequently recurring keywords from 230 of the most relevant articles on risk, published in scientific accounting journals found in the Science Direct database. The analysed studies come from the period 1979-2018 and concern both the disclosure of risk information and its preparation as well as the use for management purposes. On the basis of the keywords (repeated minimum 3 times), a map of the links has been developed and five main thematic clusters have been identified. Figure 1 Map of thematic clusters in risk studies on accounting
Source: authors’ own material The empirical research presented in the article is a part of a central cluster of analyses related to corporate disclosures in the form of risk reporting in response to legal regulations and aimed at reducing the asymmetry of information between economic entities and the environment. The issue of risk reporting was also described in the publications by means of keywords included in other clusters: risk management, risk disclosure and voluntary disclosure. A clear increase in the interest in risk disclosure is a part of the broader trend of changes in the reporting of economic entities in response to the reasons behind recent crises and financial scandals [8]. One of these changes [3] is a greater orientation of accounting information on the future. The

9
widening scope of information on the subject of risk [36] in parallel with other quantitative and qualitative disclosures will allow the external recipients to visualize the potential of growth of enterprises and judge on their reputation. The existing risk reporting studies focus on formal information disclosed by companies in different forms. The research of disclosures in annual reports [2, 3, 41] was relatively common and, in recent years, particularly in their narrative parts [2]. An important criterion for differentiating the disclosures used by authors [19, 30] was the distinction between compulsory and non-compulsory disclosure. Statutory disclosures include risk information prepared in response to external regulations, for instance introducing new reporting requirements. Interestingly, the studies conducted so far provide diverging views on the dependencies of these two essential types of disclosures. Some studies [11] showed their substitutability, i.e. increasing the scope of formal requirements affected the reduction in voluntary disclosures. Other studies [19] demonstrated their complementarity. Increasing an external pressure on the preparation of risk information introduced in the form of regulation contributed to the extension of the scope and improvement in the quality of voluntary disclosures. At the same time [33], it was found out that the introduction of risk disclosure obligation had a greater impact on the change in the scope of information contained in the reports of entities which had previously had a very low level of disclosures than those which had already provided a wide range of voluntary disclosures.
A normative belief in the need to increase the scope of risk disclosure is connected with the aim of reducing the asymmetry between entities and external stakeholders [1]. Empirical studies verifying such a positive expected effect were carried out both from the perspective of information providers and recipients. From the perspective of the disclosing entity [30], the potential costs and benefits of the adjustment to the stakeholders’ information expectations were indicated. From the perspective of the recipients [47, 56] the usability of the information was assessed, i.e. its impact on stakeholder decisions. The researchers ' attention has so far focused primarily on stock market investors [56, 57] and connecting the risk information with the market valuation of the entity. It was noted that a much greater impact on investor decisions is made by a disclosure of unexpected risk factor [37] or a disclosure by an entity which is not well-known [47]. In analysing the themes and the way of risk reporting, a similar diversity of business intentions [1] was seen as in other areas of disclosures. In this context , [45] the real and symbolic character of disclosures is distinguished . The former, as intended by the disclosing party aims to reduce the asymmetry of information and to provide external stakeholders with useful information about the prospects of the activity of the entity. Such a conduct [46] can improve the credibility of the entity in the perception of the environment and translate into long-term economic benefits, but also exposes to adverse operations of investors or competition. Symbolic disclosures are characterized by a much greater complexity of reasons. This group includes disclosures [38] which aim only at the apparent (minimum) fulfilment of the environmental requirements, e.g. regulatory requirements. The way of conducting disclosures [37], e.g. their generalisations or incomprehensibility, makes this information useless for the public. Another noted aim of symbolic disclosures is [17] to create a curtain (façade) that covers or deter attention from information that could potentially adversely affect the reception by the environment. The manipulation of risk information may also be aimed at obtaining positive
10
reception and obtaining more support from the environment. In general, the information procedures used in this regard take similar forms as other manipulations included in the phenomenon of impression management [12, 45]. The contents of real and symbolic disclosures are closely related and difficult to distinguish, and their intensity may vary depending on the external pressure on their disclosure. In the context of the substantive scope of disclosure of risk, it is interesting to note [51] that the information provided is intended to inform recipients that there is no risk, and not about risk. Therefore, an important element of disclosures is information on internal risk management systems in enterprises. It is confirmed by an empirical study [16, 41] demonstrating that the disclosure includes both information on the areas and sources of risk and the ways in which they are mitigated. The connection of both dimensions makes it possible to prove to external stakeholders that the risk factors are properly identified, analysed and measures are taken to mitigate their possible adverse effects. The applied risk disclosure logic [43] presents a way to safeguard its growth potential. Some authors [3] claim, however, that the disclosure should also include information on how the entity dealt with the actual risk in the past. The scope of disclosures outlined above requires not only quantification of risk, but also a narrative description of risk factors, potential impacts, organisational solutions and risk management methods used as well as specific negative effects of certain risk factors. Empirical research [41, 49] confirms that risk disclosure in annual reports is quantitative and qualitative with a dominant narrative form. The analysis of annual reports showed [2] that information on risk factors and risk management is disclosed in various sections of the report. Some quantitative information is contained in the financial statements. A high volatility of data values [35] over time and the value of selected financial indicators can signal an increasing risk of liquidity loss, debt increase or instability in the area of sales. The level of risk is also disclosed in the form of direct measurement effects [29]. Most often, however, the risk factors and areas and the mitigating actions are presented in the form of narration, and researchers [3, 41] notice their generalisations and low consistency signalling the information gap.
In previous years, the attention of researchers was attracted by the reasons behind the diversity of scope and the way of conducting disclosures. The main factors that were identified as significant in most studies included the size of the entity [18, 41, 46]. Given the limitations and expected benefits, larger entities tend to provide an environment with a greater scope and higher quality information on risk than smaller ones. Among other characteristics of the risk disclosure differentiators, researchers identified for instance various characteristics of corporate governance [2, 18, 48, 49], overall risk of activity of the entity [18, 57], profitability [46] or the structure of owners [49]. The list of these factors characterising the entity is not complete and the significance of not all the factors is confirmed in all studies. The scope of the risk disclosure also affects factors from the entity environment. One of such important factors differentiating the scope and manner of risk disclosure is the sector in which the entity operates [7]. This is due to a number of potential economic factors (e.g. sector-specific risks) and social (e.g. specific traditions and practices accepted in the sector). A clear specificity of risk disclosure is recorded in the financial sector [20], mainly involving banks and insurers. Given the specific risks of the sector and the greater degree of formalisation of the operation of such entities, in empirical research, authors often decide to a

11
prori whether the analysed sample is to be taken from this sector [5] or not [41, 53]. [20] It was noted that in the previous years following the financial crisis, the disclosure of the risks of financial sector entities was of great interest to accounting researchers. In the recent period, however, more and more attention was paid to the disclosure of non-financial sector entities [3]. Another observed factor differentiating the scope of disclosures is the country in which the entities operate [19]. A greater range of disclosures was observed [46, 57] in companies operating on international markets in comparison with those of a national scope. As regards reporting on individual national markets [19], it was observed that a clear differentiation of disclosures is not only related to formal risk reporting requirements but also to the traditions and culture of the country concerned. In European countries and Australia [20], a greater tendency towards flexibility of requirements and the domination of voluntary disclosures is found. In the United States [20], due to the formalisation of requirements, the study of compulsory disclosures was more interesting. In Poland, as an economy with not well-established market traditions, there should be a greater tendency to disclose in response to formalised requirements and institutional pressures than in achieving tangible benefits as a result of voluntary risk disclosure. However, there is no representative empirical research [33] to indicate this specificity. From the perspective of the research objective, the results of existing studies on the introduction of risk reporting obligations, standardisation of disclosures and the impact of such initiatives on the quality of accounting information are of particular importance. The first fundamental issue discussed is the legitimacy of the reporting obligation. The previously discussed empirical findings [11] indicated that the obligation to disclose risk does not always improve the quality of information and may contribute to a greater range of symbolic disclosures. On the other hand, the lack of reporting obligations on risk issues may deprive investors and other stakeholders of the relevant information. Such divergent results make authors [20] recommend a mandatory but flexible approach to risk disclosure that is to follow the "apply or justify" principle. This solution was also adopted by EU standards and national regulations in Poland. Given a short period of time which has elapsed since the introduction of Directive 95 of the European Parliament and of the Council and its transposition into national solutions in 2014, there is still little research showing its impact on the area of risks. The first results of empirical analyses carried out in member states after the introduction of the new regulations are fragmentary. There was an attempt to establish risk disclosure models in periodic reports on a sample of public Portuguese companies [53]. The authors carried out a manual analysis of the content of the periodic reports of 35 Portuguese non-financial companies, taking into account the value of capitalisation. The objective of this analysis was to create indices of corporate risk disclosure that were used to observe of the "tone" of disclosure. The results of these studies indicated [53] that the corporate risk disclosure policy was not influenced by the quality of the statutory auditor. The empirical study conducted in Poland [33] confirmed a selectively positive impact of the statutory risk disclosure on the scope and quality of reporting. As a result of the implementation of the European directive in the form of new reporting requirements in the Accounting Act, the annual reports of WIG30 companies were generally completed with a separate section

12
containing narrative risk disclosure. Like in other countries, also in Poland, new regulations affected the scope of reporting by improving the quality of "stragglers’" reports and the emergence of new risk categories in the reports related to non-financial aspects of activities such as reputational risks. At the same time [33], it was noticed that the average scale of the change in reporting risk areas and factors had not undergone radical changes. The majority of companies applied a follow-up policy presenting in a similar way an equivalent view of the issue of risk of the entity's activities. A considerable variation in the way in which individual companies are disclosed and the dispersion of this type of information across the various parts of annual reports makes it difficult to connect the elements described with the potential for the growth in value. It also caused a low comparability of the level of risk and the dynamics of its changes between various entities. Another equally debated issue as the obligation to disclose risks is the standardisation of their disclosures in annual reports. The list of postulates as to the substantive content and the layout of risk disclosures is very long and diverse. It includes [20, 46] for instance historical information on risk factors (e.g. past or current risk realisations) but also forecasts of their future emergence. It relates to numerical data reflecting the level and dynamics of risk but also narrative descriptions of the risk mitigation mechanisms used in the entity and the correctness and effectiveness of their functioning. For example, in relation to a better connection of risk information with financial data [51] , the following solutions were suggested: detailed reporting of results in a way that allows users to determine accounting volumes
individually and to perform different types of risk analysis, conducting and disclosing the results of reverse tests indicating changes in historical
estimates and their impact on financial projections, aggregation and presentation of risk disclosures in a well-structured form, e.g. tabular, supplementing the description of the models used to determine them, the principles of the
use of models and the sensitivity analysis. At the same time, the literature [3] stresses that the sources of risk, their relevance and the potential impacts and responses are largely entity specific. The individual selection of the scope of disclosure therefore [20] may provide a better opportunity to take account of the specificities of the entity in risk reports. In addition, the quality of voluntarily selected information can testify to management's attention paid to the protection of the growth potential in the future as well as to good reputation. Other defects in standardisation also include [39] a tendency to increase the symbolic scope of disclosure required by the standard of the position without a thorough analysis of the legitimacy of the identified risk factors and to the disadvantage of the scope to voluntary disclosures aimed at reducing the asymmetry of information. The main argument in favour of making efforts to standardise risk disclosure is to ensure the comparability of the reports [10] – the characteristics indicated in the International Accounting Standards Board (IASB) conceptual framework as one of the four basic measures of accounting information quality (relevance, reliability, understandability and comparability). Empirical research also confirms a positive impact of standardisation on the scope of disclosures. Quantitative studies conducted in Finland following the release of the risk disclosure standard in 2006 [46] confirmed that it contributed to the improvement of the quality of the reported information in a number of dimensions. There was an increase in the range of quantitative and qualitative narrative disclosures. This impact was durable, and the improved quality was
13
sustained in the following years after the introduction of the standard. However, a similar effect did not occur in the dimension of numerical disclosures, the scope of which was not affected by radical change. In addition, the studies in question [46] identified other characteristics of the entities affecting the scope of risk disclosure, such as the size of the entity, its profitability and the foreign listing status. 3. Research method The empirical studies presented below are qualitative cross-sectional studies and their task is to compare risk disclosures in a selected test sample. Following a number of previous studies, a research method was content analysis. Analysing the texts, an open coding was used to identify the most important differences in the selected disclosure dimensions in the analysed material. In order to establish a substantive scope of disclosures, a closed coding method, based on a predetermined list of risk areas and factors, was also applied. Moreover, an automated text analysis was used, such as searching for specific words, creating a risk-related word tree, and analysing the similarity of texts by words. The research used a range of risk disclosure measures constructed in the number of occurrences of specific words. It also assessed the quality of the disclosures, determining their density and substantive scope. The empirical material gathered for the research included the activity reports for 2017 of the largest companies listed on the Warsaw Stock Exchange indexed at WIG30. The material was obtained from the companies ' websites in the sections of investor relations. The analysis period was related to the introduction of a statutory risk disclosure obligation in 2016 in the activity report. A total of 30 reports were collected. Most of them were made in Polish, only two were prepared in English (Play, Kenel). Reports in the PDF format were subjected to quantitative and qualitative analyses using the quality testing software. For this purpose, the manual and automatic text analysis options accessible in the software were used. When analysing the collected research material, the focus was on disclosures of risk factors and areas. However, the analysis of this area was carried out in connection with descriptions of how companies react to identified risk factors and system solutions that enable the identification, analysis and mitigation of business risks. The perceived dispersion of risk information throughout the annual reports, including in the new sections on non-financial information, resulted in a substantial part of the research being covered by sections of the corporate activity report dedicated to disclosure risk factors. In the first phase of the research, the texts of the activity reports of all WIG30 companies were analysed in terms of location, scope and means of risk disclosure. The company reports were grouped according to the similarity of the words used in the risk descriptions. Based on appropriately selected disclosure measures, quantitative ranges of narrative risk disclosures were compared and the methods of quantification and visualisation of risk were applied. In the second stage, the object of research was exclusively the texts from the section of the reports dedicated to risk disclosure. This section of the research uses the open and closed coding of open and closed texts describing risk factors and areas. On this basis, the structure of disclosures and the categories (labels) used to describe specific risk factors were identified. The

14
structure of the disclosures of companies operating in the financial sector (banking insurance) and in other areas of economic activity (non-financial) was compared. The third phase of the research applied a normative approach. Based on the results of the literature and empirical research, a risk map proposal was developed. It was created within a very popular concept of risk matrix. The proposed solution is related to the structure of the disclosures of risk area and factors used to encode the empirical material in the second stage. In this indirect way, it was proved that the risk disclosure system adopted in the map is adjusted to the activities of entities from a very broad spectrum of non-financial sectors. 4. Risk reporting in Poland - empirical results 4.1. Narrative, quantitative and graphic risk disclosures in annual reports The analysis of the collected empirical material of WIG30 companies shows that risk information is scattered across various parts of annual reports. They were placed for example in the sections on financial statements, the CEO’s lists, the auditors' reports. However, according to the current regulations, all the audited entities (in both non-financial sector [NF] and financial [F], see table 1) made risk disclosures in their activity reports. A separate section on risk and risk management was included in all reports of 2017. In addition, some companies cited risk issues in other chapters of the report, on the occasion of the presentation of non-financial information "Risk Management" [NF: 12], "Chapter Non-financial report"[NF: 6], financial forecasts "Financial Risk Management"[NF: 17] or refer to risk descriptions in financial statements "Financial Risks"[NF: 23]. The names of the sections of the risk reports are described in two main ways. The first indicates a disclosure of risk factors e.g.: "Risk"[NF: 23],"Risk Report"[F:1],"Risk in the business..."[NF: 16],"Risk Factors"[NF: 15,27],"Key Risk Factors"[NF: 20]. In titles, risks are also combined with hazards: "Description of relevant risk factors and threats" [NF: 2], "Relevant Risk and Hazard Factors" [NF: 5,26, F:21], "Risks and hazards" [ NF: 6.9], "Determinants risk and hazard factors" [NF: 12, uncertainty "Risk and uncertainties" [NF: 13] and development opportunities: "Risks and opportunities" [NF: 22], "Risks and threats and development prospects"[NF: 10,"Strategy for action, development prospects and risk and threat factors"[NF: 17]. The second way of creating titles suggests information on risk mitigation, in a short form entitled "Risk Management... " [NF: 3, 4, 7, 8, 14, 24, 30, F:18,19, 25,28] or more sophisticated as "Basic principles and risk management structure" [F:29]. An interesting rhetoric procedure is the determination by one of the banks of the section on risk management, which suggests the main purpose of the treatment, i.e. "Bank and customer security" [F:11]. Irrespective of the chapter title, most reports in the section descriptions contain information on risk factors and risk management. The way in which both aspects are combined varies. Most commonly, companies (totally 23) first describe the risk management system and then characterise the risk factors indicating possible ways of its mitigation. The descriptions of the risk management system vary from the very short (1-2 paragraphs) of the characteristics of the risk management system [NF: 2, 4, 13, 12, 22, 27, F:1,21], to more extensive texts [NF: 3, 7, 8, 14, 16, 30, F : 11, 18, 19, 25, 28, 29] containing, in addition to the main elements of the system, a detailed discussion e.g. authorities responsible for risk management, determination of the level of risk allowed (risk appetite), risk assessment methods, risk documentation, risk management principles in key areas. One of the banks [F:18] also devoted a separate section to the description of the changes in the risk management system in a given year.

15
In the discussed chapters, risk factors are presented in a differentiated range and form. Some companies do so in a synthetic way by linking to the diagrams [NF: 7] or tables [NF: 3, 8, 13, 14, 16, 24, 30] the risk factor with a response method. The others explain the undertaken actions in a more descriptive way by characterising a group of risk factors first and then the way of safeguarding against them. Some entities (6) apply the second approach to presenting risk, i.e. limiting to descriptions of specific risk areas and factors [NF: 9] and detailed ways of its mitigation [NF: 5, 6, 10, 23, 26]. The third observed system of connection between risk factors and risk management [NF: 15] is to describe in the first place all risk factors and then the specific ways in which they are handled. It is worth mentioning that some companies except [NF: 8,10] or instead of [NF: 17] risk factors describe the so-called development factors. The way they are formulated suggests that they are factors that determine the entity's future financial situation and development opportunities. They correspond to the factors described by other entities as risks. However, the rhetoric of the description can prove that they can also be seen positively as an opportunity to improve the situation [NF: 17]. Some companies formulate them as risk factors for the future [1 NF: 17] or for a specified period i.e. next year [NF: 8, 10, 17]. The latter are also referred to as "development prospects" [NF: 17]. The results of grouping the texts of the risk activity reports sections on the basis of similarity of words (Figure 1) suggest a similar description in the three primary main groups and the remaining aggregate group of “diverged” cases. The three main clusters concentrate the majority of companies in a similar way describing risk issues. In the first main cluster, the similarity is demonstrated by the financial sector entities in the first instance [F:19, 11, 18, 1, 29, 25]. All these companies in a similarly detailed manner described the issues of risk. This differs essentially from the other two entities in the financial sector [F:21,28], whose descriptions were very vague. Figure 1 presents, among the "diverged" descriptions, those prepared in English [NF: 13,27] and three companies engaged in trading activities [NF: 6, 9, 15]. The similarity of risk descriptions by the sector in which the entity operates is also suggested by a sequence of connected texts in three main groups. In pairs, the descriptions are combined of energy companies [NF: 7,22], IT companies [NF: 2, 4] and telecommunications operators [NF: 5.20]. The way in which these entities are linked at a higher level of grouping shows that the sector is not the only factor causing a similar presentation of risks. The resulting system does not accurately reflect the variability in the structure of the risk activity report section. A significant majority of risk disclosures in activity reports are narration. They are presented in the form of texts built in paragraphs and shorter sections of the texts included in the tables or diagrams. The tables describe not only these risk factors, but also other elements: risk area definitions, objectives and risk mitigation tools. The tables also summarize the figures illustrating the problem presented. The intensity of such a risk disclosure method is particularly evident in companies in the financial sector [F:1,18, 11, 19, 25, 28, 29], although this is not the rule [cf. F:1]. In addition, the numerical information of banks and insurers is presented in the graphs: linear, bar and pie. In other non-financial sectors, figures are given in a single and incidental way [e.g. NF: 14, 17, 20, 24, 26, 27] and are not presented in the form of charts or tabular comparisons.
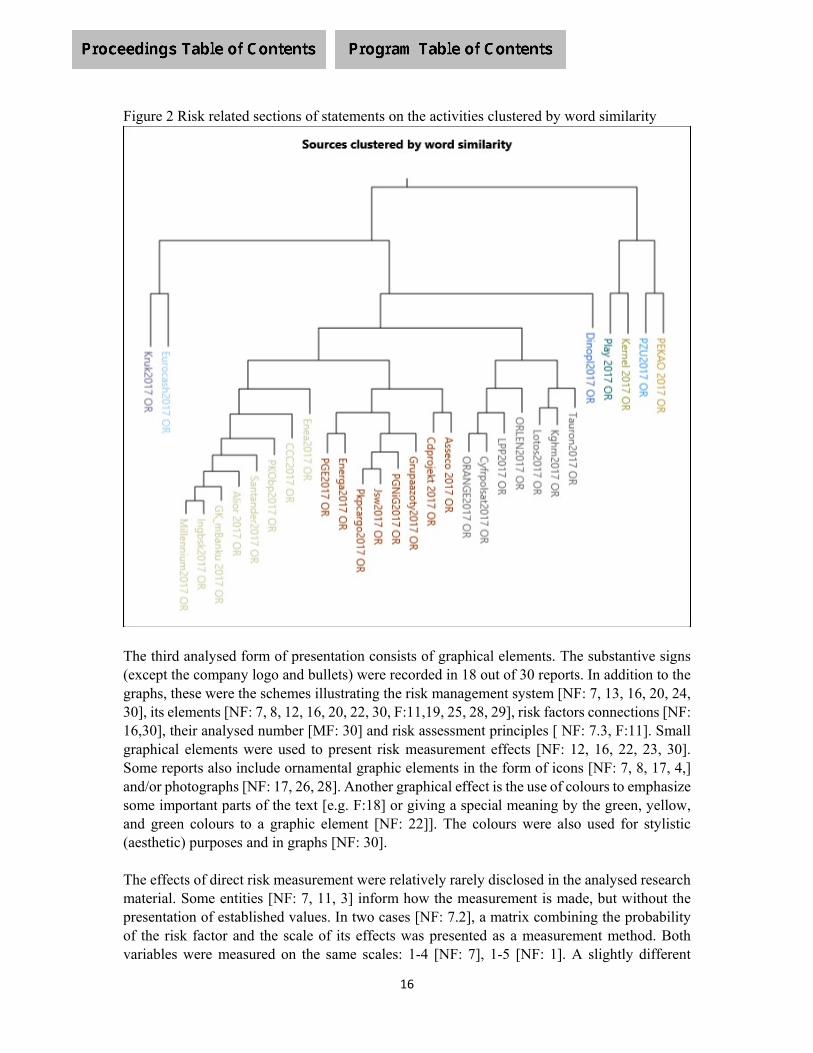
16
Figure 2 Risk related sections of statements on the activities clustered by word similarity
The third analysed form of presentation consists of graphical elements. The substantive signs (except the company logo and bullets) were recorded in 18 out of 30 reports. In addition to the graphs, these were the schemes illustrating the risk management system [NF: 7, 13, 16, 20, 24, 30], its elements [NF: 7, 8, 12, 16, 20, 22, 30, F:11,19, 25, 28, 29], risk factors connections [NF: 16,30], their analysed number [MF: 30] and risk assessment principles [ NF: 7.3, F:11]. Small graphical elements were used to present risk measurement effects [NF: 12, 16, 22, 23, 30]. Some reports also include ornamental graphic elements in the form of icons [NF: 7, 8, 17, 4,] and/or photographs [NF: 17, 26, 28]. Another graphical effect is the use of colours to emphasize some important parts of the text [e.g. F:18] or giving a special meaning by the green, yellow, and green colours to a graphic element [NF: 22]]. The colours were also used for stylistic (aesthetic) purposes and in graphs [NF: 30]. The effects of direct risk measurement were relatively rarely disclosed in the analysed research material. Some entities [NF: 7, 11, 3] inform how the measurement is made, but without the presentation of established values. In two cases [NF: 7.2], a matrix combining the probability of the risk factor and the scale of its effects was presented as a measurement method. Both variables were measured on the same scales: 1-4 [NF: 7], 1-5 [NF: 1]. A slightly different
17
measurement method was applied by the bank [F:11] using a similar matrix to divide the risk factors into relevant and irrelevant. The frequency of risk factors (scale 1-3) and potential loss, expressed as a percentage of own funds (scale 1-4), were assumed as variables in the matrix. Other units [F:28] indicated that the measurement is carried out by a specialised unit, but they do not indicate how. Measures quantifying the described risk factors were presented by only four companies. They all applied a very close approach but using different variables. 30 in the description of the risk factors indicated only the trend of changes measured on the 3-stage scale (decline, no change, growth). One non-financial company [NF; 12] applied two variables quantifying not only the change in relation to the previous year (decline, no change, growth) but determining the significance of the risk factor on the 1-3 scale (low, medium, high). An analogous way of quantification of risk factors was used by another non-financial company [NF: 16], specifying the level of risk (low, medium and large) and indicating the prospect (trend) of the risk (decline, stable, growth). Besides, some risk factors in the company's activity report were attributed to non-financial aspects: labour, anti-corruption, respect for human rights, social and the natural environment issues. Three variables quantifying risk were used by another non-financial company [NF: 23]. The risk measures in the company's report included alongside the level of relevance of risk (low, medium, large) and the change in the level of risk in relation to the previous year (decline, growth, no change) and also the likelihood of risk materialisation identified as low, medium or high. In all cases, the variables were presented graphically. The significance of the risk and the probability were marked with dots (1 to 3) or colour (red, yellow, green), and the change with arrows (down, horizontal or upward). 4.2. Quantitative scope and density of narrative risk disclosures in statements on the activities The descriptions contained in the risk activity report sections have a very diverse range (Table 1). This is evidenced by the quantitative disclosure measures such as the number of pages devoted to the risk description and the number of words in the section. The shortest description contained 392 words presented on two pages of the report [NF: 9]. Much longer descriptions were presented by mobile telephone operators [NF: 2.27] and financial sector companies. The differentiated quantitative range of the pages and words stems from the differentiated density of the text in the reports. In the analysed sample, it ranged from 196 tom751 words per page. These values should be treated as estimates in view of the use of graphical forms and the numerical summaries. The density of disclosures is described by a measure showing the percentage of pages of the activity report intended for risk descriptions. It was formed within the limits of 1.51%-20.25% of the content of the whole report. Again, the smallest risk disclosure density was recorded by a company in the food industry. The largest percentage of the risk disclosure in the report was allocated by one of the banks [F:25]. The results of the quantitative analysis of the extremes indicate a similar quantitative range of disclosures and the density of disclosures. In this regard, there is also a noticeable difference between financial sector companies and other entities. The average density of risk disclosures is almost doubled among banks and insurers. The intensity of risk rhetoric was measured using the number of occurrences of the risk-related words (risk *) in the descriptions. In the analysed sections, this word was used from 4 times
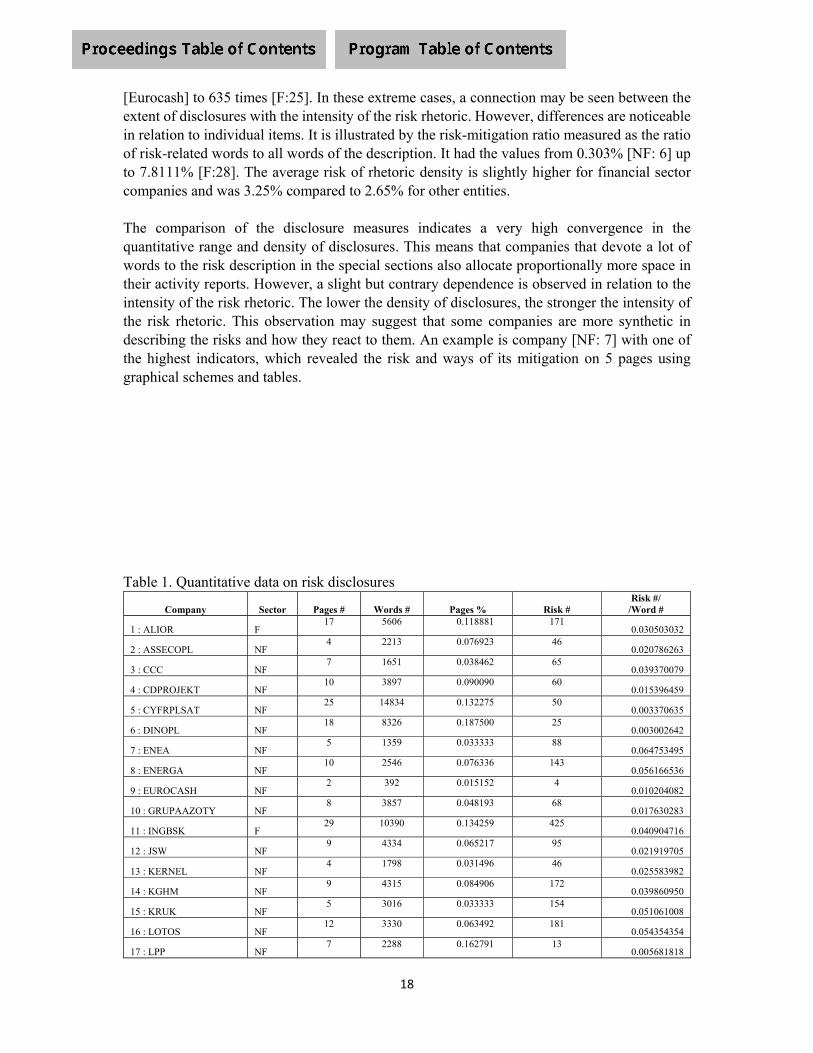
18
[Eurocash] to 635 times [F:25]. In these extreme cases, a connection may be seen between the extent of disclosures with the intensity of the risk rhetoric. However, differences are noticeable in relation to individual items. It is illustrated by the risk-mitigation ratio measured as the ratio of risk-related words to all words of the description. It had the values from 0.303% [NF: 6] up to 7.8111% [F:28]. The average risk of rhetoric density is slightly higher for financial sector companies and was 3.25% compared to 2.65% for other entities. The comparison of the disclosure measures indicates a very high convergence in the quantitative range and density of disclosures. This means that companies that devote a lot of words to the risk description in the special sections also allocate proportionally more space in their activity reports. However, a slight but contrary dependence is observed in relation to the intensity of the risk rhetoric. The lower the density of disclosures, the stronger the intensity of the risk rhetoric. This observation may suggest that some companies are more synthetic in describing the risks and how they react to them. An example is company [NF: 7] with one of the highest indicators, which revealed the risk and ways of its mitigation on 5 pages using graphical schemes and tables. Table 1. Quantitative data on risk disclosures
Company Sector Pages # Words # Pages % Risk # Risk #/
/Word #
1 : ALIOR F 17 5606 0.118881 171
0.030503032
2 : ASSECOPL NF 4 2213 0.076923 46
0.020786263
3 : CCC NF 7 1651 0.038462 65
0.039370079
4 : CDPROJEKT NF 10 3897 0.090090 60
0.015396459
5 : CYFRPLSAT NF 25 14834 0.132275 50
0.003370635
6 : DINOPL NF 18 8326 0.187500 25
0.003002642
7 : ENEA NF 5 1359 0.033333 88
0.064753495
8 : ENERGA NF 10 2546 0.076336 143
0.056166536
9 : EUROCASH NF 2 392 0.015152 4
0.010204082
10 : GRUPAAZOTY NF 8 3857 0.048193 68
0.017630283
11 : INGBSK F 29 10390 0.134259 425
0.040904716
12 : JSW NF 9 4334 0.065217 95
0.021919705
13 : KERNEL NF 4 1798 0.031496 46
0.025583982
14 : KGHM NF 9 4315 0.084906 172
0.039860950
15 : KRUK NF 5 3016 0.033333 154
0.051061008
16 : LOTOS NF 12 3330 0.063492 181
0.054354354
17 : LPP NF 7 2288 0.162791 13
0.005681818

19
18 : MBANK F 23 9824 0.160839 336
0.034201954
19 : MILLENNIUM F 14 6365 0.177215 180
0.028279654
20 : ORANGEPL NF 9 4725 0.085714 54
0.011428571
21 : PEKAO F 5 1887 0.043478 69
0.036565978
22 : PGE NF 6 2033 0.042553 68
0.033448106
23 : PGNiG NF 6 3995 0.044118 65
0.016270338
24 : PKNORLEN NF 8 2541 0.068966 65
0.025580480
25 : PKOBP F 32 12645 0.202532 635
0.050217477
26 : PKPCARGO NF 10 5907 0.047170 68
0.011511766
27 : PLAY NF 27 20287 0.183673 105
0.005175728
28 : PZU F 14 5761 0.122807 450
0.078111439
29 : SANPL F 12 6057 0.083916 234
0.038632987
30 : TAURONPE NF 12 4991 0.062500 252
0.050490884
4.3. Narrative disclosures of risk factors A tree analysis showed that the range of words combined in the analysed texts with risk was very wide and diverse. It indicates a very large variation, both adjective defining the area or type of a risk factor, and the use of more elaborate phrases describing the risk. There was a very large variation in the level at which a given risk factor was established, from a very general (e.g. macro-economic risk) to a very detailed (e.g. the risk of theft committed by customers). The risk factors in dedicated sections were described in three essential layouts. The first simplest was to draw up a list of risks and a more or less elaborate description of its characteristics [e.g. NF: 2, 4, 15, F:1, 21]. The second method of presenting the risk consisted in grouping the risk factors and their descriptions into areas with a similar specificity [e.g. NF: 3, 7, 12, 30]. Sometimes the grouping was a multi-step in character [e.g. NF: 24,13, F:25]. The last way to describe risk factors is to group them according to the selected operation segments of the entity [NF: 23]. Due to the specificity, noticed again, of the way in which the financial sector entities disclose risks, the detailed results of the narrative analysis of risk disclosure will be discussed separately for the two groups of entities – the financial and non-financial sector. The disclosure of risk factors and areas by financial sector companies, i.e. banks and insurers was more coherent than other entities. It was not only affected by the use of quantitative data, but also more uniform labels identifying the types of risk factors. And most entities defined the meaning of individual labels. The analysis of the substantive significance conferred to these labels meant that they are relatively uniformly applied by all in the analysed cases. Labels assigned to risk factors served as aggregated categories described in the text and illustrated with numerical measures. Such a procedure contributed to a greater comparability of disclosures. All financial sector entities reported market risks, also divided into interest rate risk and currency risk. It was equally common to disclose credit risk, operational risk and regulatory risks, as identified by some entities, as a risk of non-compliance. All reports except the insurer’s

20
[F:28] contained a description of the liquidity risk. Some banks [F:1,11, 18,25] next to the operational risk pointed to a business risk. The same entities also reported on the model risks related to possible erroneous decisions taken on the basis of internal valuation models. Selectively, banks separately listed capital risk. The reputation risk was indicated least often and only banks [F:1,18, 25,14]. The insurer [F:28] identified an actuarial risk, which refers to the bank model risk. The indication of the risk factor did not automatically describe the risk. In some banks [F:1], only the selected risk items were described, and others were only named. In other cases [F:11], the list of risk factors was more detailed and grouped in the aforementioned layout. A significantly greater variation in the presentation of risk factors was observed in the case of companies in non-financial sectors. Some entities describing the risk factors used more general and universal categories. The factors were described with external and internal breakdown [NF: 9,17]. This universal and transparent distribution of factors, however, in other reports was combined with successive collective categories such as the risk of strategy implementation [31 NF] or technology, value chain and market [NF: 14]. A similar breakdown, although with different labels was adopted by another company [NF: 26], identifying three groups of factors: “risks related to the economic and market environment”, 'risks in the business pursuit" and "financial risks". Another approach used was to identify risk areas and then to include specific factors in them. Some entities defined these areas in connection with the level of strategic and operational management. However, this consistent breakdown was never performed independently but was supplemented by other risk dimensions: financial and market [NF: 7] legal-regulatory and financial [NF: 8], financial and reputation and compliance [NF: 16]. A similar presentation of risk factors was applied by Orange, disclosing apart from the "risk affecting operating activity..." also: 'legal and fiscal risks', 'competitive risks' and 'risk factors related to the overall economic situation and the state of financial markets'. Another non-financial entity [NF: 24] defined, somewhat differently but in the same substantive layout, the risk areas by dividing them into: strategic, design and process/operational. It was observed that the operating risk label did not always indicate the level of management or the prospects of impact of risk factors but was applied [e.g. NF: 20, 15, 22] also in relation to the isolated operating activity or was identified with a part of internal risk. For example, a non-financial company [NF: 22] describing risk factors for the next year - alongside with the operating risk defined as risk "related to the implementation of the current economic processes"- it distinguished the market and product, property, regulatory and financial risks. On the other hand, strategic risk factors with a long-term impact on the situation of the entity are listed separately. Similarly applied labels of operating risk were shown in the Kruk report, where the "risk of failure to pursue strategic objectives" and "operating risk related to the group activities" are only two positions in the longer list of risk factors. In addition, the company described separately the risk factors related to transactions with associated entities. Many entities combined factors in groups in an arbitrary manner, mainly in conjunction with the placement of the risk factor and its type. With regard to a broad environment, [NF: 5, 6, 12, 24, 5] companies identified separately or jointly macro-economic factors of socio-economic risk and those related to the market situation. The groups of risk factors related to the legal and

21
regulatory environment were often shown as a separate item [NF: 5, 6, 12, 24, 23, 27]. Some companies described separately the risks at sector level [NF: 6, 13, 20], others combined them with a description of the risk of activity [NF: 5]. At the level of the entity the risk of activity of the entity [NF: 5, 6, 12], operating risk [NF: 20,23] and business risk [NF: 27], financial risk [NF: 5, 12, 20, 23], risk associated with structure [NF: 27], risk of non-compliance [NF: 23] and environmental risk [NF: 12]. The most unusual grouping of risk factors was used by a non-financial company [NF: 30], distinguishing the following areas: "Finance and credit", "Trade", " Employees and organisational culture", "Customers and contractors", "Risk compliance", "Technology and infrastructure." Other companies focused on a descriptive explanation of the list of individual risk sources [NF: 2, 4, 10, 5]. In this group of reports, the risk factors disclosed were related to the socio-economic and legal environment, the sector/sectors in which the entity operates, its relations with specificity of stakeholder groups, the specificities of the internal business and key resources. The reports identify the currency risk as well as other factors related to the financial entity, i.e. credit risk, liquidity risk. Technology companies [NF: 2, 4] paid particular attention to the consequence of rapid technological development as a source of danger for the competitive position and operational activity of the entity. There was also a possibility of illegal activities to be undertaken against the company or to tarnish its good image. The risk of inadequate compliance with legal regulations was also recognised on the part of the entity. The above-mentioned risk factors were also included in the reports of companies that opted for grouping factors into areas of risks. In examining the substantive descriptions of various factors, two main points were highlighted. The terms (labels) describing the risks are applied in a discretionary manner. The same risk name in each entity may mean another group or risk factor. Secondly, the labels of areas, types and risk factors are constructed, often simultaneously or interchangeably, in conjunction with the definition of risk sources, risks, consequences and impacts over time. The above reasons affect the lack of comparability of risk factor disclosures in companies outside the financial sector. Therefore, in order to analyse the substantive scope of the disclosures made in the activity reports, it was decided to assign factors to several arbitrarily selected groups: market and political risks: national, macroeconomic and global, linked to internal policy
volatility, macroeconomic parameters and competition in areas of this activity, legal risks related to the variability of the law, the way is enforced and used, force majeure, risk related to the action of the forces of nature, technical risks related to failures resulting from the reliability of technical equipment,
procedural and organisational solutions and information systems (more broadly IT risks), technological risks related to the implementation of new/innovative technologies and/or to
technologies already used, economic and financial risks arising from the nature of the activity and the way in which it
is financed, ecological risk, concerning the possibility of negative natural phenomena caused by the
activity of the entity, personnel risks, their turnover and competences, disputes and other problems, risks connected with contractors, both suppliers and customers, clients ethical risks, in the sense of theft, frauds and other crimes and acts of non-compliance
with ethical principles in business,

22
risks related to the potential deterioration of the market entity's image. The results of the manual coding show that all entities in the non-financial sectors included in the description the risk factors classified as market risk. When describing them, they pointed to possible changes: market prices, interest rates, exchange rates, economic prosperity, competition, etc. A wide range of risk factors resulted from different kinds of economic and financial determinants of the entities' activities. In this respect, despite a considerable variability in the formulation of risks, entities generally pointed to the possibility of inadequate adaptation of their activities to changes in the environment and the deterioration of the financial situation of the entity or its competitive position. In most, but not in all, reports, legal risks were identified as significant. The range of factors of this type was very broad: from possible violations of law by the company, to the lack of clarity in the interpretation of legal regulations, to the legal issues of conclusion and terms of contracts in different legal areas. This frequently identified risk area is reflected mainly in three types of descriptions: on possible disruption of deliveries as a result of the activities of suppliers and intermediaries, on possible breaking up trade relations with partners and on potential dependence on buyers and suppliers. The technical risk is another risk factors group included in the description. In addition to the risk of failure of machinery and equipment, the company also perceived the risk of errors in the application of models, procedures, information systems and other internal organisational arrangements. All the risk groups described were identified in most analysed cases. It can therefore be defined as common, characteristic of almost every economic activity. A much greater selectivity of disclosures was identified in relation to the remaining groups. Only some entities presented the staff risk, writing about difficulties in acquiring and retaining workers, occupational safety issues and the development of qualifications, and possible individual and collective conflicts. A similar number of instances in the reports was noted with regard to ecological and ethical risks. The ecological risks were mainly disclosed by entities in the raw material sectors as well as mobile operators. In ethical matters, the possibility of acting to the detriment of the entity has been reported. The media social perception risk was described in relation to selected stakeholders and their potential responses. Fewer entities revealed the possibility of negative impact of the so-called "force majeure" and technological risks. 5. Risk Map – The proposal of the guidelines As demonstrated in point 2 of this text, empirical research confirms that the standardisation of disclosures, although not deprived of defects, is certainly a tool to introduce order, which allows for speaking of comparability, even if it were not be ensured in a perfect way. The authors’ own empirical research on the disclosure of information in risk areas and factors indicates the need to organise the way in which this issue is presented if the risk information is actually intended to create a context for assessing achievements and potential of the entity presented in the detailed categories of the financial statements. A variety of approaches, both in terms of scope and structure and even the form of risk disclosure, is a major impediment to financial analyses and various comparisons over time and between industries (not to mention financial and non-financial sectors). However, it is not possible to excessively stiffen the presentation of risk information by standardising the scope and form of the presentation of disclosures. Such an action may bring an undesirable effect, in

23
the form of limiting companies to the specification of only those risk areas and factors that the standardisation would propose. In view of the dynamic changes in the environment of companies and in their organisation itself, it cannot be ruled out that the standard would become quickly outdated, triggering new own costs and perhaps even greater "confusion" in disclosures than presented by the study conducted by us. For this reason, one should be cautious when making proposals on how to deal with the comparability of risk areas and factors in time and economic space.
What would be valuable to the analysts of the company is some kind of synthetic description or graphic presentation of what happened and what did not and what can happen and how the effects of risk have been handled and how it is to be done in the future. Such information can say much about the knowledge of the determinants of the company possessed by the board managing it, the professionalism in assessing risks and opportunities and skills, in general, of operating and managing the company in the conditions of risk and uncertainty. Summa summarum: such a synthesis would in fact characterise the quality of management. In view of the statement that the issue of risk disclosures is more urgent in the non-financial sector, where the creativity of the providers of this information is much higher than in the financial sector, the following is a proposal risk maps as a model approach to the issue of risk disclosures. Creating the Risk Map presented below, we took into account the observations resulting from our research, which shows that the technical form of presentation is very important for the perception (understanding) of risk disclosure. A very elaborate narrative can make the image of risk areas and factors obscure; and too poor comments can give rise to unsatisfaction and suspicion of incomplete communication of issues related to risk generating activities. Our search aimed to develop a concept that would on the one hand synthesize a variety of disclosures and, on the other be explicit and communicative. The literature research on risk management shows that the so-called risk matrix is becoming more and more popular [29]. A more frequent use of transparent presentation techniques can be observed, even in the case of a fairly complex message. Such techniques appeal to the imagination and do not require very elaborate comments. Silvia Jordan, Hermann Mitterhofer and Lene Jørgensen claiming that the matrix is a carrier of semantic connotation and various analogies, even though they do not contain elaborate comments, they become "understandable" and very precise, and processes or potentially incomprehensible phenomena become simple, conceivable, verifiable and, therefore, ' manageable '. These matrices – used in relation to risk – can easily capture a growing or expended range of risk areas or factors. And while some researchers question their informative value (due to the ease of falsifying the risk image), this form is gaining significance, as evidenced by its promotion by various major standardisation and governmental institutions [29]. Bearing in mind the recommendations of Jordan, Mitterhofer and Jørgensen [29], who made their observations by analysing multiple risk matrices, in the Risk Map proposed by us, we referred to this form. The Risk Map is a proposal for a graphical synthesis/summary of the risk disclosures related to the operation of the company where the risk disclosure would be presented in accordance with the current regulations, but according to their own presentation concepts, as is the case now.

24
The authors believe that the proposal for the Risk Map can become a disciplinary tool for the accuracy of disclosures of risk areas and factors in these identified fields. In this way, it can promote transparency of disclosures and, at the initial stage of its application, can also be treated as a tool for educating people reporting disclosure in this area. It can also facilitate communication within the team preparing such a disclosure. The Risk Map should be presented for the purpose of reproduction of the findings made by means of professional identification and analysis of both opportunities and risks of the company, which is conducted for reporting purposes for the balance sheet year. This map, as well as the financial statements accompanying the risk disclosure, should ensure comparability of the year-to-year disclosures and should represent prognostic value important for the stakeholders of financial statements (including disclosures discussed here). Please, be aware that the Risk Map can be regarded as a business card for management skills in the risk area and factors related to the company. For this reason, the "settlement power" of the Map is an important attribute of it. The conceptual assumptions of the Risk Map are as follows:
1. The following holistic reasoning underlies the risk map construction: companies and institutions operate under conditions of risk and uncertainty, to
varying degrees regarding them, management of the entity makes all the decisions under risk, i.e. manages under
risk whose consequences may be negative or positive, each implementation of risk carries an expected value, which, in the longer or shorter
horizon, directly or indirectly, in economic activity translates to the financial performance of the entity; the realisation of the risk related to the economic activity has, ultimately, a financial dimension,
for this reason, potential and at the same time the negative effects of risk should be preventively reduced by means of instruments/tools/solutions that allow either to compensate for the negative effects of the risk, or to reduce their size (finally, in financial terms); in this respect, it is important to talk about managing potential consequences (effects) of risk rather than risk management.
2. This approach allows for the analysis of risks related to economic activity on two levels: - areas of risk factors related to the company (different characteristics and classifications are possible) and - management of potential consequences (effects) of risk (there are possible presentations of different instruments, whose use is accompanied by the hope of reducing potential negative consequences of risk).
3. It is assumed that the risks disclosed in the financial statements have a nature of the so-called "specific" risks (non-systematic), which means that risk factors are conditioned by the microeconomic causes that lie within the unit and in its immediate vicinity, i.e. the In the industry or in the sector and can be to a certain extent controlled by the entity.
4. Besides, it is considered that the report will disclose the risks most relevant to the activities of the entity, i.e. the ones that can make the company's operating conditions in the future more difficult or even generally altered.
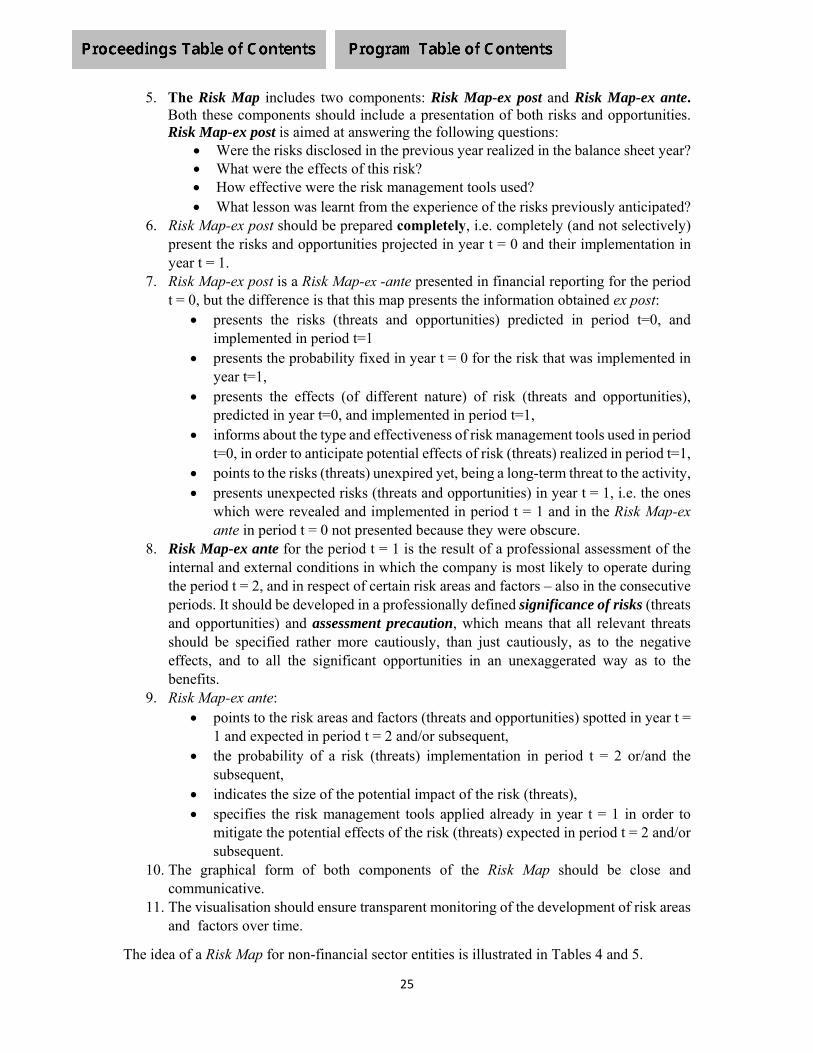
25
5. The Risk Map includes two components: Risk Map-ex post and Risk Map-ex ante. Both these components should include a presentation of both risks and opportunities. Risk Map-ex post is aimed at answering the following questions:
Were the risks disclosed in the previous year realized in the balance sheet year? What were the effects of this risk? How effective were the risk management tools used? What lesson was learnt from the experience of the risks previously anticipated?
6. Risk Map-ex post should be prepared completely, i.e. completely (and not selectively) present the risks and opportunities projected in year t = 0 and their implementation in year t = 1.
7. Risk Map-ex post is a Risk Map-ex -ante presented in financial reporting for the period t = 0, but the difference is that this map presents the information obtained ex post:
presents the risks (threats and opportunities) predicted in period t=0, and implemented in period t=1
presents the probability fixed in year t = 0 for the risk that was implemented in year t=1,
presents the effects (of different nature) of risk (threats and opportunities), predicted in year t=0, and implemented in period t=1,
informs about the type and effectiveness of risk management tools used in period t=0, in order to anticipate potential effects of risk (threats) realized in period t=1,
points to the risks (threats) unexpired yet, being a long-term threat to the activity, presents unexpected risks (threats and opportunities) in year t = 1, i.e. the ones
which were revealed and implemented in period t = 1 and in the Risk Map-ex ante in period t = 0 not presented because they were obscure.
8. Risk Map-ex ante for the period t = 1 is the result of a professional assessment of the internal and external conditions in which the company is most likely to operate during the period t = 2, and in respect of certain risk areas and factors – also in the consecutive periods. It should be developed in a professionally defined significance of risks (threats and opportunities) and assessment precaution, which means that all relevant threats should be specified rather more cautiously, than just cautiously, as to the negative effects, and to all the significant opportunities in an unexaggerated way as to the benefits.
9. Risk Map-ex ante: points to the risk areas and factors (threats and opportunities) spotted in year t =
1 and expected in period t = 2 and/or subsequent, the probability of a risk (threats) implementation in period t = 2 or/and the
subsequent, indicates the size of the potential impact of the risk (threats), specifies the risk management tools applied already in year t = 1 in order to
mitigate the potential effects of the risk (threats) expected in period t = 2 and/or subsequent.
10. The graphical form of both components of the Risk Map should be close and communicative.
11. The visualisation should ensure transparent monitoring of the development of risk areas and factors over time.
The idea of a Risk Map for non-financial sector entities is illustrated in Tables 4 and 5.
26
6. Conclusions The author's intention was to propose a solution that could improve the current practice of presenting disclosures about risk areas and factors. Such a need has been identified by the authors in a deep and labour-intensive qualitative analysis of these disclosures presented for 2017, i.e. the first year when in the European Union, new substantially extended mandatory requirements came into effect in relation to the information (also with regard to risks) to be provided by most economic entities, including all listed companies. In their previous research [33] , they found significant changes in the practice of disclosures due to the introduction of the new obligation, but also noted that the presentation of these disclosures does not provide comparability over time and, moreover, is not transparent due to the diversity of terminology used and solutions to the description of risk areas and factors4. The research presented in this text reinforced a conviction of a large reporting clutter in the area of risk and the need for rapid implementation of solutions that are very important from the perspective of transparent information to the stakeholder on the threats and opportunities related to the company important for them. Moreover, the literature research assured the authors that the problem of analysis of the policy, scope, form, principles and purpose of disclosures in the area of risk is not widely explored, and the need to organise comparability issues appears urgent. This encouraged the authors initiate the discussion on their own proposal, which is referred to as the Risk Map. The Risk Map was proposed for non-financial entities, as the largest diversity in the way of disclosures was found here. The financial sector (banking entities and insurance companies), in a sense, retained a similar disclosure standard, although it can easily be noted that the disclosure generally dealt with issues relating strictly to operational activity. However, nothing prevents such a Risk Map from being constructed analogously for those entities. Another intention of the authors is to address this concept to practitioners for assessment, i.e. people involved in the preparation of documents in which risk disclosure is presented. Such a survey will verify the concept presented here in practice and connect it with the author's intention to create a complete conceptual framework for disclosures in the area of risk.
4Directive 2014/95/EU of the European Parliament and of the Council of 22 October 2014 amending Directive 2013/34/EU as regards the disclosure of non-financial and diversity-related information by certain large undertakings and groups, Official Journal of the European Union, L 330/1.

27
Table 2. The concept of Risk Map – ex ante
RISK MAP– EX ANTE at the reporting date for the period t=1
Part A – Visualization of the intensity of future threats and opportunities seen at the end t=1
Threats Opportunities
Probab
ility
Very high
(Above 80%)
WP(09)-111
WP(01)-122
Very high
(above 80%)
Probab
ility
High
(60-80%)
WP(11)-231
WP(05)-112
High
(60-80%)
Medium
(40-60%)
Medium
(40-60%)
Low
(20-40%)
WP(06)-231
WP(02)-212
Low
(20-40%)
Very low
(up to 20%)
WP(10)-242
WP(03)-111
Very low
(up to 20%)
X Very small
Small Medium Large Very large
Very large
Large Medium Small Very small X
Threats Opportunities
EFFECTS OF IMPLEMENTATION

28
Part B – Legend of the threat attribute codes seen at the end t=1
Risk areas Risk code applied on the Risk Map*
Risk factor source node (WZ)
Risk effect nodes
(WS)
Risk time horizon nodes
(WC)
WZ(1) WZ(2) WS(1) WS(2) WS(3) WS(4) WC(1) WC(2) WP(01) political and market risks: national, macro‐economic and global,
related to the variability of internal policies, macroeconomic parameters (such as: interest rates, exchange rates) in countries where the company carries out its economic activities and competitors in the areas of their activity
WP(01)-122 x x x
WP(02) legal risks related to the variability of law and the way it is enforced WP(02)-212 x x x WP(03) risk of force majeure related to the operation of forces of nature,
terrorist attacks, pandemics, hostilities, disasters or other extraordinary events
WP(03)-111 x x x
WP(04) economic risk resulting from the nature of the pursued business and the adopted way in which it is financed
WP(04)
WP(05) technical risks related to failures resulting from the unreliability of technical equipment, organisational solutions and information systems (broader: IT risks)
WP(05)-112 x x x
WP(06) technological risks related to the implementation of new technologies and/or to the technologies already used
WP(06)-231 x x x
WP(07) ecological risks concerning the possibility of negative natural phenomena caused by the activities of the entity
WP(07)
WP(08) personnel risk concerning employees, their turnover and competences, disputes and other problems
WP(08)
WP(09) risks related to contractors, both suppliers and customers, clients WP(09)-111 x x x WP(10) ethical risks in the sense of theft, frauds and other crimes and
manifestation of non‐compliance with ethical principles in business activities (in business, finance and accounting)
WP(10)-242 x x x
WP(11) media risks related to the potential deterioration of the entity’smarket image
WP(11)-231 x x x
WP(12) risk in another area WP(12)

29
Risk factor source nodes WZ(1) – risks stemming essentially from the factors surrounding the company WZ(2) – risks stemming essentially from intra‐corporate factors WZ(3) – no possibility of reliable determination of risk factor source Risk effect nodes WS(1) – risks with potential consequences for operating activities WS(2) – risks with potential consequences for investment activities, i.e. connected with resources held but not used in operating activities WS(3) – risks with potential consequences in the financial activities, i.e. related to the strategy used for financing economic activities as a whole WS(4) – risks whose description does not allow for an explicit classification of their consequences or potential consequences have an overall scope as regards the activities
of the company Time horizon risk nodes WC(1) – risks seen in the strategic horizon WC(2) – risks seen in the operational or tactical horizon
*example of threat coding; the coding of opportunities may refer to an analogous or different specification of potential opportunity areas and occur in similar or other nodes of factors of potential benefits resulting from of opportunities
Part C — Description of risk, scale of potential effects and risk management instruments applied in year t = 1
The characterization of each risk (threat) should be made here, but in particular the one shown in the Risk Map-ex ante in the area of high threat and higher probability.
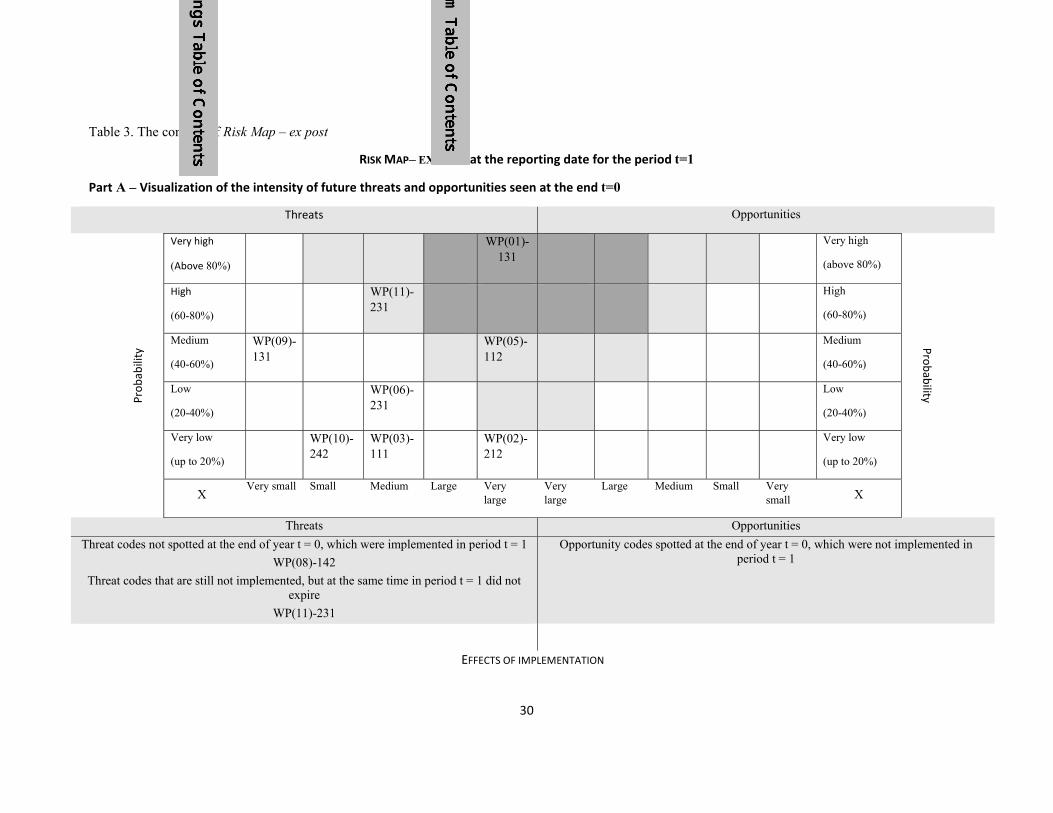
30
Table 3. The concept of Risk Map – ex post
RISK MAP– EX POST at the reporting date for the period t=1
Part A – Visualization of the intensity of future threats and opportunities seen at the end t=0
Threats Opportunities
Probab
ility
Very high
(Above 80%)
WP(01)-131
Very high
(above 80%)
Probab
ility
High
(60-80%)
WP(11)-231
High
(60-80%)
Medium
(40-60%)
WP(09)-131
WP(05)-112
Medium
(40-60%)
Low
(20-40%)
WP(06)-231
Low
(20-40%)
Very low
(up to 20%)
WP(10)-242
WP(03)-111
WP(02)-212
Very low
(up to 20%)
X Very small Small Medium Large Very
large Very large
Large Medium Small Very small X
Threats Opportunities
Threat codes not spotted at the end of year t = 0, which were implemented in period t = 1
WP(08)-142
Opportunity codes spotted at the end of year t = 0, which were not implemented in period t = 1
Threat codes that are still not implemented, but at the same time in period t = 1 did not expire
WP(11)-231
EFFECTS OF IMPLEMENTATION

31
Part B – Legend of the threat attribute codes seen at the end t=0
Risk areas Risk code
applied in the Risk Map *
Risk factor source node (WZ)
Risk effect nodes
(WS)
Risk time horizon nodes
(WC)
WZ(1) WZ(2) WS(1) WS(2) WS(3) WS(4) WC(1) WC(2) WP(01) political and market risks: national, macro‐economic and global,
related to the variability of internal policies, macroeconomic parameters (such as: interest rates, exchange rates) in countries where the company carries out its economic activities and competitors in the areas of their activity
WP(01)-131 x x x
WP(02) legal risks related to the variability of law and the way it is enforced WP(02)-212 x x x WP(03) risk of force majeure related to the operation of forces of nature,
terrorist attacks, pandemics, hostilities, disasters or other extraordinary events
WP(03)-111 x x x
WP(04) economic risk resulting from the nature of the pursued business and the adopted way in which it is financed
WP(04)
WP(05) technical risks related to failures resulting from the failure of technical equipment, organizational solutions and information systems (broader: IT risks)
WP(05)-112 x x x
WP(06) technological risks related to the implementation of new technologies and/or to the technologies already used
WP(06)-231 x x x
WP(07) ecological risks concerning the possibility of negative natural
phenomena caused by the activities of the entity WP(07)
WP(08) personnel risk concerning employees, their turnover and competences, disputes and other problems
WP(08)-142 x x x
WP(09) risks related to contractors, both suppliers and customers, clients WP(09)-131 x x x WP(10) ethical risks in the sense of theft, frauds and other crimes and
manifestation of non‐compliance with ethical principles in business activities (in business, finance and accounting)
WP(10)-242 x x x
WP(11) media risks related to the potential deterioration of the entity’smarket image
WP(11)-231 x x x
WP(12) risk in another area WP(12)

32
Risk factor source nodes WZ(1) – risks stemming essentially from the factors surrounding the company WZ(2) – risks stemming essentially from intra‐corporate factors WZ(3) – no possibility of reliable determination of risk factors source Risk effect nodes WS(1) – risks with potential consequences for operating activities WS(2) – risks with potential consequences for investment activities, i.e. connected with resources held but not used in operating activities WS(3) – risks with potential consequences in the financial activities, i.e. related to the strategy used for financing economic activities as a whole WS(4) – risks whose description does not allow for an explicit classification of their consequences or potential consequences have an overall scope as regards the activities
of the company Risk time horizon nodes WC(1) – risks seen in the strategic horizon WC(2) – risks seen in the operational or tactical horizon
*example of threat coding; the coding of opportunities may refer to an analogous or different specification of potential opportunity areas and occur in similar
or other nodes of factors of potential benefits resulting from of opportunities
Part C — Description of risk, scale of potential effects and risk management instruments applied in year t = 0
The characterization of each risk should be given here, which: was placed on the Risk Map-ex ante for year t=0, however, from a retrospective perspective, with a description stating of whether or not the effects of a
given risk occurred in year t = 1, what their scale was, how effective the previously applied risk management instruments proved to be, was not placed on the Risk Map-ex ante for year t = 0, as significant, and which for some reasons, however, occurred and caused negative consequences. The description should also specify the risks indicated in t = 0 and in t = 1 did not expire yet.

33
REFERENCES [1.] Abdelrehim, N., P. Linsley, and S. Verma, Understanding risk disclosures as a
function of social organisation: A neo-Durkheimian institutional theory-based study of Burmah Oil Company 1971–1976. The British Accounting Review, 2017. 49(1): pp. 103-116.
[2.] Abraham, S. and P. Cox, Analysing the determinants of narrative risk information in UK FTSE 100 annual reports. The British Accounting Review, 2007. 39(3): pp. 227-248.
[3.] Abraham, S. and P.J. Shrives, Improving the relevance of risk factor disclosure in corporate annual reports. The British Accounting Review, 2014. 46(1): pp. 91-107.
[4.] Agyei-Mensah, B.K. and S. Buertey, Do culture and governance structure influence extent of corporate risk disclosure? International Journal of Managerial Finance, 2019. 0(0): p. null.
[5.] Barakat, A. and K. Hussainey, Bank governance, regulation, supervision, and risk reporting: Evidence from operational risk disclosures in European banks. International Review of Financial Analysis, 2013. 30: pp. 254-273.
[6.] Beaver, W., P. Kettler, and M. Scholes, The association between market determined and accounting determined risk measures. The Accounting Review, 1970. 45(4): pp. 654-682.
[7.] Beretta, S. and S. Bozzolan, A framework for the analysis of firm risk communication. The International Journal of Accounting, 2004. 39(3): pp. 265-288.
[8.] Bhimani, A., The role of a crisis in reshaping the role of accounting. Journal of Accounting and Public Policy, 2008. 27(6): pp. 444-454.
[9.] Blocher, E., R.P. Moffie, and R.W. Zmud, Report format and task complexity: Interaction in risk judgments. Accounting, Organizations and Society, 1986. 11(6): pp. 457-470.
[10.] Botosan, C.A., Discussion of a framework for the analysis of firm risk communication. The International Journal of Accounting, 2004. 39(3): pp. 289-295.
[11.] Butler, M., A. Kraft, and I.S. Weiss, The effect of reporting frequency on the timeliness of earnings: The cases of voluntary and mandatory interim reports. Journal of Accounting and Economics, 2007. 43(2): pp. 181-217.
[12.] C. Edgar, V., M. Beck, and N.M. Brennan, Impression management in annual report narratives: the case of the UK private finance initiative. Accounting, Auditing & Accountability Journal, 2018. 31(6): pp. 1566-1592.
[13.] Cadbury, A., The financial aspects of corporate governance (Cadbury Report). London, UK: The Committee on the Financial Aspect of Corporate Governance (The Cadbury Committee) and Gee and Co, Ltd, 1992.
[14.] Denning, S., Effective storytelling: strategic business narrative techniques. Strategy & Leadership, 2006. 34(1): pp. 42-48.
[15.] Dobija, D., Dylematy standaryzacji sprawozdawczości finansowej, wyceny i pomiaru ryzyka. Zeszyty Teoretyczne Rachunkowości, 2010. 57(113): pp. 5-14.
[16.] Dobler, M., Incentives for risk reporting — A discretionary disclosure and cheap talk approach. The International Journal of Accounting, 2008. 43(2): pp. 184-206.
[17.] Elsbach, K.D. and R.I. Sutton, Acquiring organizational legitimacy through illegitimate actions: A marriage of institutional and impression management theories. Academy of management Journal, 1992. 35(4): pp. 699-738.
[18.] Elshandidy, T., I. Fraser, and K. Hussainey, Aggregated, voluntary, and mandatory risk disclosure incentives: Evidence from UK FTSE all-share companies. International Review of Financial Analysis, 2013. 30: pp. 320-333.

34
[19.] Elshandidy, T., I. Fraser, and K. Hussainey, What drives mandatory and voluntary risk reporting variations across Germany, UK and US? The British Accounting Review, 2015. 47(4): pp. 376-394.
[20.] Elshandidy, T., P.J. Shrives, M. Bamber, and S. Abraham, Risk reporting: A review of the literature and implications for future research. Journal of Accounting Literature, 2018. 40: pp. 54-82.
[21.] Elzahar, H. and K. Hussainey, Determinants of narrative risk disclosures in UK interim reports. The Journal of Risk Finance, 2012. 13(2): pp. 133-147.
[22.] Eskew, R.K., The forecasting ability of accounting risk measures: some additional evidence. Accounting Review, 1979: pp. 107-118.
[23.] Gmytrasiewicz, M., A. Karmańska, and I. Olchowicz, Rachunkowość finansowa. 1996, Warsaw: Difin.
[24.] Gmytrasiewicz, M., A. Karmańska, and I. Olchowicz, Rachunkowość finansowa. 2000, Warsaw: Difin.
[25.] Gmytrasiewicz, M. and A. Karmańska, Rachunkowość finansowa. 2002, Warsaw: Difin.
[26.] Greco, G., The management's reaction to new mandatory risk disclosure: A longitudinal study on Italian listed companies. Corporate Communications: An International Journal, 2012. 17(2): pp. 113-137.
[27.] ICAEW, No surprises: The case for better risk reporting. 2002, The Institute of Chartered Accountants of England & Wales, London.
[28.] Jia, J., L. Munro, and S. Buckby, A finer-grained approach to assessing the “quality”(“quantity” and “richness”) of risk management disclosures. Managerial Auditing Journal, 2016. 31(8/9): pp. 770-803.
[29.] Jordan, S., H. Mitterhofer, and L. Jørgensen, The interdiscursive appeal of risk matrices: Collective symbols, flexibility normalism and the interplay of ‘risk’ and ‘uncertainty’. Accounting, Organizations and Society, 2018. 67: pp. 34-55.
[30.] Kang, H. and S.J. Gray, Country-specific risks and geographic disclosure aggregation: Voluntary disclosure behaviour by British multinationals. The British Accounting Review, 2019.
[31.] Karmańska, A., The imperative of sustainable growth and reporting integration. Three eras in the corporate reporting development. Copernican Journal of Finance & Accounting, 2014. 3(1): pp. 73-82.
[32.] Karmańska, A., The imperative of sustainable growth and reporting integration. The fourth era in the corporate reporting development. Copernican Journal of Finance & Accounting, 2014. 3(2): pp. 49-66.
[33.] Karmańska, A. and M. Łada, Ujawnianie obszarów i czynników ryzyka w sprawozdaniach z działalności spółek giełdowych - obserwacje wobec zmian regulacji prawnych. Zeszyty Teoretyczne Rachunkowości, 2019. (being printed).
[34.] Khalil, A. and M. Maghraby, The determinants of internet risk disclosure: empirical study of Egyptian listed companies. Managerial Auditing Journal, 2017. 32(8): pp. 746-767.
[35.] Khan, S. and M.E. Bradbury, Volatility and risk relevance of comprehensive income. Journal of Contemporary Accounting & Economics, 2014. 10(1): pp. 76-85.
[36.] Knechel, W.R., The business risk audit: Origins, obstacles and opportunities. Accounting, Organizations and Society, 2007. 32(4): pp. 383-408.
[37.] Kravet, T. and V. Muslu, Textual risk disclosures and investors’ risk perceptions. Review of Accounting Studies, 2013. 18(4): pp. 1088-1122.

35
[38.] Leung, S., L. Parker, and J. Courtis, Impression management through minimal narrative disclosure in annual reports. The British Accounting Review, 2015. 47(3): pp. 275-289.
[39.] Li, H., W.G. No, and T. Wang, SEC's cybersecurity disclosure guidance and disclosed cybersecurity risk factors. International Journal of Accounting Information Systems, 2018. 30: pp. 40-55.
[40.] Linde, C., Narrative and social tacit knowledge. Journal of knowledge management, 2001. 5(2): pp. 160-171.
[41.] Linsley, P.M. and P.J. Shrives, Risk reporting: A study of risk disclosures in the annual reports of UK companies. The British Accounting Review, 2006. 38(4): pp. 387-404.
[42.] Maffei, M., M. Aria, C. Fiondella, R. Spanò, and C. Zagaria, (Un) useful risk disclosure: explanations from the Italian banks. Managerial Auditing Journal, 2014. 29(7): pp. 621-648.
[43.] Malafronte, I., C. Porzio, and M.G. Starita, The nature and determinants of disclosure practices in the insurance industry: Evidence from European insurers. International Review of Financial Analysis, 2016. 45: pp. 367-382.
[44.] Martikainen, M., J. Kinnunen, A. Miihkinen, and P. Troberg, Board’s financial incentives, competence, and firm risk disclosure: Evidence from Finnish index listed companies. Journal of Applied Accounting Research, 2015. 16(3): pp. 333-358.
[45.] Merkl-Davies, D.M. and N.M. Brennan, Discretionary disclosure strategies in corporate narratives: incremental information or impression management? 2007.
[46.] Miihkinen, A., What Drives Quality of Firm Risk Disclosure?: The Impact of a National Disclosure Standard and Reporting Incentives under IFRS. The International Journal of Accounting, 2012. 47(4): pp. 437-468.
[47.] Miihkinen, A., The usefulness of firm risk disclosures under different firm riskiness, investor-interest, and market conditions: New evidence from Finland. Advances in Accounting, 2013. 29(2): pp. 312-331.
[48.] Moumen, N., H. Ben Othman, and K. Hussainey, Board structure and the informativeness of risk disclosure: Evidence from MENA emerging markets. Advances in Accounting, 2016. 35: pp. 82-97.
[49.] Ntim, C.G., S. Lindop, and D.A. Thomas, Corporate governance and risk reporting in South Africa: A study of corporate risk disclosures in the pre- and post-2007/2008 global financial crisis periods. International Review of Financial Analysis, 2013. 30: pp. 363-383.
[50.] Rowbottom, N. and A. Lymer, Exploring the use and users of narrative reporting in the online annual report. Journal of Applied Accounting Research, 2010. 11(2): pp. 90-108.
[51.] Ryan, S.G., Risk reporting quality: implications of academic research for financial reporting policy. Accounting and Business Research, 2012. 42(3): pp. 295-324.
[52.] Ryzyko w rachunkowości, ed. A. Karmańska. 2008, Warszawa: Difin. [53.] Serrasqueiro, R.M. and T.S. Mineiro, Corporate risk reporting: Analysis of risk
disclosures in the interim reports of public Portuguese non-financial companies. Contaduría y administración, 2018. 63(3): p. 8.
[54.] Slack, R. and P. Shrives, Voluntary disclosure narratives: more research or time to reflect? Journal of Applied Accounting Research, 2010. 11(2): pp. 84-89.
[55.] Smith, M., Y. Dong, and Y. Ren, The predictive ability of corporate narrative disclosures: Australian evidence. Asian Review of Accounting, 2011. 19(2): pp. 157-170.

36
[56.] Solomon, J.F., A. Solomon, S.D. Norton, and N.L. Joseph, A CONCEPTUAL FRAMEWORK FOR CORPORATE RISK DISCLOSURE EMERGING FROM THE AGENDA FOR CORPORATE GOVERNANCE REFORM. The British Accounting Review, 2000. 32(4): pp. 447-478.
[57.] Tan, Y., C.C. Zeng, and T. Elshandidy, Risk disclosures, international orientation, and share price informativeness: Evidence from China. Journal of International Accounting, Auditing and Taxation, 2017. 29: pp. 81-102.
[58.] Woods, M., K. Dowd, and C.G. Humphrey, Credibility at risk? The accounting profession, risk reporting and the rise of VaR. CRIS Discussion Paper Series, 2004: pp. 2004-3.
[59.] Yeoh, P., Narrative reporting: the UK experience. International Journal of Law and Management, 2010. 52(3): pp. 211-231.

1
PREVENTION OR DETECTION OF PROBLEMS IN CAPITAL GROUPS. DISCRIMINATORY ANALYSIS IN THE EXTENDED TIME HORIZON
Anna Karmańska
Warsaw School of Economics Poland
Magdalena Indyk Warsaw School of Economics
Poland [email protected]
ABSTRACT
The article presents an original empirical research on capital groups. The results of the research indicate a diagnostic usefulness of consolidated reporting as long as the analyst appropriately sets the perspective of interpretation of results in the extended time horizon. The aim of the research was to identify the predictions of difficulties/problems/crises in the functioning and maintaining the status quo of relationships within the group. With this in mind, a set of nine multidimensional discriminatory analysis models was used with financial categories applied at the consolidated level. It has been shown that it is justified in view of the concept of unity of group members, which is an underlying factor of the creation of consolidated reporting. The originality of the proposed research approach stems from: (1) analytical use of consolidated reporting, which is not often undertaken in the scientific research, (2) examination of the applicability of multi-dimensional discriminatory analysis models to capital groups, which, according to the authors' knowledge, have not yet been applied in relation to this kind of reporting and the use of which, they believe, are based on well-founded premises, (3) presentation of conclusions from the connection of the time -extended discriminatory analysis with the market and other financial parameters charactering the dominating entity (parent company) in the capital group, (4) confirmation of how the market arbitrarily, frequently in isolation from the reporting values, assesses the economic potential of business entities. The study shows that discriminatory models, despite a widespread assumption of their early warning function, proved to be detection rather than preventive models. As demonstrated by the analysis of the bankruptcy prediction in relation to the stock quotation graphs, the hazard information on threat is delayed. In addition, this article presents an analytical methodology, conducted in such a way that it can be treated as reasoning in a way ready for direct application in practice. The research used a method of literature studies and an induction method, creating generalisations based on experiments and empirical observations. Keywords: capital groups, discriminatory analysis, consolidated financial statements, crisis, continuation of business
2
1. Introduction
In general, scientific curiosity is an underlying factor of the analysis of the title problem: Can a discriminatory analysis, which is generally dedicated to a single economic entity, be applied to capital groups? And if so, does it actually allow for the diagnosis of the origin of potential problems which are relevant to the further operation of the group of entities in the existing relationship between them?
The problem was also undertaken due to the observation that the issue of identifying threat to the functioning of the capital group based on consolidated financial statements is not scientifically explored. Unlike the analysis of individual entities, their financial conditions, the risk of loss e.g. of solvency, problems resulting from excessive indebtedness or other serious risks related to the continuation of activities; in these analytical areas much more research and approaches can be found, while analogous issues with regard to capital groups are discussed far less frequently.
It is also important to note here that these publications, which deal with the problem of unit financial reporting, clearly show that "anticipation of bankruptcy is one of the main uses of accounting information" [Bodle, et al. 2016]. It is difficult to find studies that would be pursued in a similar spirit but based on consolidated reporting. It may induce to a reflection on why it happens.
It seems that the reluctance to examine the issue of discriminatory analysis using consolidated reporting may be due to the fact that the models of this analysis were developed to deal with individual economic entities. Meanwhile, the specificity of such a multi-entity organism as a capital group makes the financial information presented in the form of consolidated financial reporting characterize the accomplishments and potential of the group of entities, and a single entity. A lower interest in these issues may also be caused by the fact that a capital group is not a legal entity in the same sense as a single company or institution. A capital group cannot therefore go bankrupt.
However, the premises underlying the formation of the capital groups and the joint reporting of the accomplishments of many entities forming such a group clearly indicate the need to observe the condition of the group, irrespective of the observation of the condition of a selected entity from the group. The omnipresent globalisation, multi-market operation, strategies to optimise different burdens (costs, taxes) are conducive to the emergence of multi-entity, often international, structures which connect with each other in terms of capital (ownership), in order to eventually achieve a greater profit. In addition, the capital connections in the group of entities create long-term financial ties. They are important for planning (both strategic and operational) within single entities. The economic policy of the parent company – through the capital ties – translates into these plans very seriously. The impact is not only in the area of operational policy but also in the financing and management strategies in different areas of risk.
The monitoring of the health of the group and its ability to continue in the subjective composition, in which it currently operates is, according to the authors, an important issue. The findings indicating potential risks can be early warning signals at least for three stakeholder groups: a parent entity that can take action to restructure the composition of the group, entities in a dependent group and entities interested in contracts with this group entities.
2. Research hypothesis of the concept of the group entities unity
The authors assume that, although a capital group is not a stand-alone entity in the context of economic law, the consolidated financial statements drawn up in accordance with the concept of uniformity of these entities allow, for analytical purposes, for the treatment of the group as if it were a single, economically self-reliant entity.
The arguments in favour of such a presumption lie both in the conditions of the establishment of capital groups and in the very procedure of creation of consolidated financial statements.
A capital group – vividly speaking – creates a family of entities in which, although each individual is a distinct economic being, through the capital bonds is in the relationships important for the

3
functioning of the entire capital group. This means that the worse results of one group entity are reflected in the financial effects of the capital group as a whole. In turn, good results – positively shape the financial image of the whole group. As a capital group may include entities which are financially better or worse, it must be assumed that such an “abstract economic entity” as a capital group, represents a total averaged picture of the accomplishments of all the entities in that group.
The capital links between the members of the group may exist for a number of reasons, which are usually justified by the strategy of the action of each of these entities, and, to the greatest extent, the strategy of economic activity and the business model of the parent company in the group. There may be important premises connected with the optimisation of the logistics of supply chain by the parent entity (then, it establishes capital bonds with entities that are present in the process of providing certain customer values). There may also be indications of a purely investment character which result from the desire to achieve economic benefits through capital engagement in entities in other industries or sectors than the parent company [Wiankowski, et al., 1999b].
The main source of knowledge about a capital group is its consolidated financial statement. It is drawn up by a parent company using the unit reports of its subsidiaries at all levels. It creates one financial report, which is presented as if the group constituted one economic entity. This means that all operations that have occurred between members of the group, i.e. are intra-group in character, during the preparation of the consolidated report must be excluded. The parent company draws up the financial statements of the group comprising its data and its subsidiaries at all levels, irrespective of their seat. The data are arranged as if the group constituted a single entity, the report also includes the data of the other subordinated entities. Such reports present (alongside the unit financial reporting of entities in the group) a special and large load of knowledge on the interaction effects of many independent entities and therefore their analysis should be in-depth and attentive.
There are certain items in the consolidated financial reporting specific for this kind of reporting only. When analysing consolidated reports, one should understand them well, which in consequence translates into a way of describing the conclusions of the analysis of these reports. It is not possible to evaluate the results by accepting uncritically the model of certain standards and norms identical to those used in the analysis of the financial statements of a single economic entity. Although the analytical methodology may be analogous in both cases, generalisations or conclusions in the second of them must be more prudent, drawn up at the background of the achievements of the parent company and treated (in many areas) more as a medium state, resultants of extreme situations, which become more likely with an increased complexity of the capital group (both in terms of the number of enterprises, the strength of capital ties and the diversity of industries, geographical areas and market segments in which they pursue their economic activity).
“The unity of many legally independent economic organisations" in consolidated reporting also provides the basis for a capital group to be treated as one usually large economic entity with a frequently complex internal organisational structure. This sort of thinking is justified by the possibility of using analytical tools normally used for the analysis of independent entities (individual) and allows for the formulation of a HYPOTHESIS [H]: the multidimensional discriminatory analysis applied to a capital group may provide early warning signals against the problems that may occur in this group in the relatively near future.
In order to verify the above assumption (hypothesis), we empirically test a multidimensional discriminatory analysis, which is considered to be the most synthetic tool for diagnosing the ability of the entity to continue its economic activity in the current ownership and organisational structure of many entities.
The empirical study, which primarily serves it, is also aimed at verifying that the findings of long-term discriminatory analyses go hand-in-hand with the market behaviour towards entities of the group particularly threatened with problems of business continuity. Ultimately, the authors' intention is also to create a fuller analytical algorithm dedicated to capital groups, and possibly to be used not only by investors but also by credit institutions and even external auditors. This text presents an initial stage of the research work.

4
3. Research thesis on the reasons behind the creation of capital groups and factors threatening the continuity of economic activities
Facing a competitive market, companies and institutions are looking for the solutions that will be
able to significantly optimise their operating costs, affect preventively economic and financial risks, develop in a sustainable manner and, as a result, achieve a financial advantage for its owners, which is well and synthetically, reflected by an increase in the market value of the company. They can do so by developing their own economic potential (the so-called internal expansion) or using the potential existing outside their organisational structures (the so-called external expansion) [Wojtyniuk, Draczyński, 1999].
The way to implement this is to create or integrate into the economic multi-entity groups of enterprises, referred to with the term "capital group." In economic terms, a capital group is a team of legally independent economic entities, created for the achievement of common economic objectives and pursuing these objectives, based on the capital links uniting these entities [Nogalski, Ronkowski, 2004, p. 11]. According to the balance sheet law, on the other hand, a capital group is described by the relationships related to on one hand 'control' and, on the other, 'dependence' between the entities operating in the form of capital companies (limited liability companies and joint stock companies) [Directive, 2013]. As previously presented, the group of companies is legally autonomous but heavily dependent in a strategic and management sense. This dependence stems from the right to the influence in the group of the parent company (i.e. exercising control over the so-called dependent entities in the group) on the operational and financial policies of the subsidiaries. In practice, this means that the majority of entities in the group (subsidiaries) remain under a major strategic influence of the policy of the parent company. Their own operational and financial policies can therefore only be pursued to the extent allowed by the policy of the parent company.
In this situation, the parent company’s monitoring of what is happening in the group is essential from the perspective of its strategic objectives. This monitoring is not facilitated by the fact that capital groups often have very complex ownership structures. Thus, an analytical approach seems to be valuable as it can provide early warning signals about problems that threaten to maintain the current subjective structure of the group. In turn, it is important, from the perspective of the subsidiary and its economic policy, to have a good understanding of the premises underlying the establishment of the parent company's capital links with a number of entities (capital group), which are different in the scope of operation, the scale of the operational activity and the geographic location. The awareness of these premises allows for the better development its own economic policy (in the margin of discretion given by the parent). The motives for creating capital groups can be formulated, presented and classified in varying detail [Śliwa, 2011, pp. 24-25; Stecki, 1995, pp. 64-65]. It seems that these three groups give them a full coverage [Wiankowski, et al., 1999a, p.19]:
1. the elimination of internal weaknesses (negative phenomena) in existing activities, such as: inefficient management structures, high fixed costs, significant indebtedness, capital shortages, low competitiveness, turnover decline,
2. overcoming external threats from the socio-economic environment, e.g. the emergence of new competitors, changing customer preferences, loss of some foreign markets, adverse political changes,
3. achievement of specific development objectives through the implementation of projects using own strengths and opportunities resulting from environmental conditions, e.g. diversification of activities, increased competitiveness, control of new markets or increased capital.
The activities, successes or failures of one group entity, in relation to equity and operational relationships in the group, are not indifferent to the actions, successes and failures of other entities in the group. A change in the situation in one unit in a group can affect the entire group. In view of this, an individualised assessment of the performance of each entity in the group may be insufficient, from the point of view of the dominating entity in the capital group as well as each subsidiary separately. The above thought is well supported by a Polish proverb: "Who keeps company with wolves will learn to howl." This means that the entity operating in the capital group of entities with poor financial condition

5
can also become weaker. Therefore, the recognition of the weakness of the group's condition as a whole appears to be relevant for each entity in the group.
The most painful consequence of the problems in the business activity and various crisis situations in this activity may be the bankruptcy of the company. A bankruptcy of a company or a financial institution is usually not a sudden event but a result of a systematic deterioration in the financial situation of the organization. Greiner, in his life cycle model of the organization, indicates that the development of the organization occurs through different stages of growth (evolution) and through crises emerging as their consequence. These, in turn, lead to a change (revolution) and bring the organization to the next stage of development [Trompenaars F., Coebergh P.H., 2015, pp. 301-303], if the organization can manage risks which do not omit even the best-performing and market-adapted organisations [Wieczerzyńska, 2009, p. 9]. At this synthetic background, we formulate a thesis that the assessment of the financial position of a company and a capital group as a whole requires the consideration of both financial and non-financial premises in an appropriately extended time horizon.
Only when the situation is monitored in the longer term, the economic difficulties may be disclosed rapidly or more slowly and with a smaller or greater force, which may result in crises which will involve not only individual entities in the group, but the whole group and many other entities in its environment. For the survival of the economic organization, the perception of the symptoms of crises and their different phases is a key issue. Different actions and decisions should be taken when it is about a [Cabała, 2008, p. 61]: (1) potential crisis, i.e. when there are no clear signals, but there are some symptoms suggesting a possibility of problems in the functioning of the company (e.g. a difficult financial situation of the main supplier resulting in a temporary shortage of raw materials in the warehouses); (2) hidden crisis, when the situation can be clearly classified as a crisis situation (e.g. bankruptcy of the main supplier); (3) burning crisis, when the organisation feels the effects of problems that have occurred. Although such crises do not imply an immediate bankruptcy, they should be analysed and assessed as to whether they are: manageable or unmanageable. In each of these situations, there will probably be different management decisions, but in order to take them, you need to be aware of a crisis situation or a situation forecasting it.
The literature indicates many possible causes of crisis: from external (macroeconomic) to internal (such as poor management or product problems). In view of the sources from which the premises discussed in the literature result and making a specific hierarchy of the causes of difficult situations in economic activities, the issue of the corporate mission should be prioritised. It disciplines strategic planning, allocating resources in the most efficient way possible [cf. Griffin, 2013, p. 5]1. It is also confirmed by Schalast, Merter [2010, p. 14], pointing out that the difficulties (crisis) in the company begin problems resulting from accidental strategy or the lack of strategy.2
Next, the mission should underlie two pillars of the company's activities: (1) building the brand of organization and (2) adherence to ethical values. The lack of mission, irregularities in the construction of the brand or ethical values and the lack of consistence in following the assigned mission give rise to the disclosure of the premises identified in the literature as the internal causes of the crisis . The review of the factors determining the bankruptcy of companies [Antonowicz, 2015, pp. 104-111] indicates that it is possible to divide internal premises (factors) into two main groups of: (1) poor management due to errors and ignorance of the management board of the organization in the sphere of management, finance and marketing3 as well as (2) the lack of ethical values reflected in accounting manipulations,
1 An interesting completion is an article written Bartkowiak [2011, pp. 11-13], who analysed the determinants of the success of business strategies. Three synthetic groups were identified for the purpose of the study: (1) profit – shareholder satisfaction; (2) security – ensuring financial stabilisation; (3) growth – increase in market share, development of the company's potential. Of these three overarching objectives, he proved that the companies that chose growth as the most important goal achieve success more often. 2 It has its real consequences because the company begins to achieve less income and less profit than the one that could be realised with a better allocation of resources. In addition, this is usually accompanied by an increase in debt and as a result a strategy crisis shifts to a result crisis. If the financial situation of the company deteriorates and it is not able to settle its payment obligations, the result crisis changes into a liquidity crisis [cf. Kleinrok, 2013, pp. 360-361]. 3 In particular, it is about the factors like inefficient management of working capital, problems with retention of liquidity, too high indebtedness, lack of diversification of products or roles of employees in the organisation, lack

6
in a deliberate action to the detriment of the company, as well as in an excessive rush to success, i.e. on the scale of activities not adapted to the capacities and resources of the organisation4. The role of the management board of an organisation is therefore to identify potential internal threats, to confront them with the adopted mission and to take further decisions in this regard before the threat is transformed into an unmanageable crisis.
In a group of external factors, i.e. independent of the organisation, which can contribute to the deterioration of the financial situation, Wieczerzyńska, [2009, p.33] points to macroeconomic factors such as (1) business cycle in the country; (2) fiscal, monetary and exchange rate policies of the authorities and the central bank; (3) inflation; (4) the level of income of population and the consumption model. Other authors also point to the importance of such factors as: legal regulations, taxation, intensification of competition or the ageing of the sector, technological changes [Antonowicz, 2015, pp. 104-111]. Similarly, also in this case, the role of the management board is to identify external signals and to quickly and appropriately react to them. It is very important to be flexible with regard to external factors, which sometimes require changes in the adopted mission.5
In addition, it should be mentioned that there are situations that are independent of organisations, which immediately influence the fate of the company, e.g. random situations (disasters, fires) or activities within a capital group, which 6is determined by the parent company (e.g. the case of Bassor Mastercook).7 Although external factors can have a significant impact on the functioning of the organisation, as the Euler Hermes figures show, even in a good situation, the company has a liquidity problem and nearly to 1/3 of the value of the liabilities are settled after the payment date [Kowalczyk, 2011, pp. 66-67].
Speaking of serious difficulties (crisis) in the company, it is worth distinguishing the causes of the occurrence from its symptoms, although this border in practice is not explicit. The crisis is triggered by certain causes – i.e. the internal and external factors that constitute the source and basis of the crisis situation in the organisation; while the symptoms of the crisis are already events and processes that result from the occurrence of the aforementioned factors [Wieczerzyńska, 2009, p. 49]. And Kopczyński [2016, p. 89-93] distinguishes the following symptoms: (1) financial – high indebtedness, in particular increasing short-term liabilities, liquidity problems, major operational losses; (2) operational - loss of key personnel, market/consignee or key supplier, lack of results of the adopted strategy, with better results of competitors, decline in confidence in management and multiplication of conflict situations (3) other – unusual turnover of staff (especially of higher tiers), decline in the discipline among workers resulting in a large number of errors and failure to meet their responsibilities,
of competent management, personal conflicts, lack of financial control (ineffective budgeting and controlling process). 4 In the context of ethical values, Rybak [2008, pp. 149-151] also refers to "directed" bankruptcies that took place only in order to avoid repayment of liabilities incurred. He refers to the low morale of these representatives of Polish business, whose aim is to quickly enrich, who pass the risk on to others, and in the case of defeat quickly start again without being held responsible for the previous liabilities. 5A good example is the history of Kodak and Fujifilm. In the face of a technological change: from analogue to digital, Kodak did not take advantage of its chance and did not enter the newly emerging sector in time, even though it developed its technology already in the 1970s! Meanwhile, Fujifilm's management board identified the moment of technological change and was not afraid to take difficult decisions that meant the limitation of investment in analogue technology and concentrating on digital technology. In addition, the company looked for other possible sources of income to compensate for those declining ones from the photography [Dziurski, 2016, pp. 61-71]. 6 Solbus may be an example, the company collapsed because the prototype of the bus burned down during the test drive (the installation proved defective), and it resulted in an avalanche of consequences: the Ministry of Infrastructure suspended the authorisation of the vehicle for traffic, the lease company withdrew from cooperation, a liquidity problem emerged. http://bydgoszcz.wyborcza.pl/bydgoszcz/1,35590,8133412,Solbus_upadl_po_pozarze_prototypu.html?disableRedirects=true (13.05.2019) 7Fagor Mastercook S.A. was part of a Spanish capital group headed by Fagor Electrodomésticos. The Spanish company informed in 2013 that it had not found funding and declared bankruptcy; this decision made other companies in the group follow, including the Polish company. https://gazetawroclawska.pl/hiszpanski-fagor-oglosil-bankructwo-co-sie-stanie-z-wroclawskimi-fabrykami/ar/1041723 (13.05.2019)
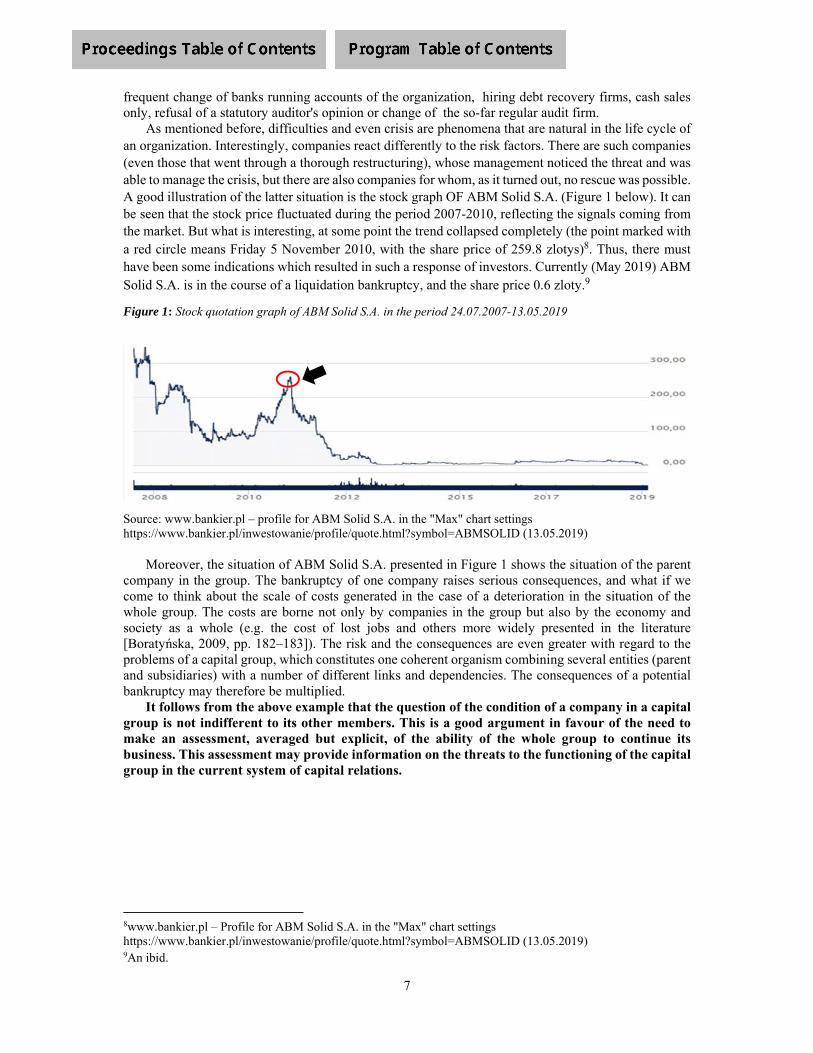
7
frequent change of banks running accounts of the organization, hiring debt recovery firms, cash sales only, refusal of a statutory auditor's opinion or change of the so-far regular audit firm.
As mentioned before, difficulties and even crisis are phenomena that are natural in the life cycle of an organization. Interestingly, companies react differently to the risk factors. There are such companies (even those that went through a thorough restructuring), whose management noticed the threat and was able to manage the crisis, but there are also companies for whom, as it turned out, no rescue was possible. A good illustration of the latter situation is the stock graph OF ABM Solid S.A. (Figure 1 below). It can be seen that the stock price fluctuated during the period 2007-2010, reflecting the signals coming from the market. But what is interesting, at some point the trend collapsed completely (the point marked with a red circle means Friday 5 November 2010, with the share price of 259.8 zlotys)8. Thus, there must have been some indications which resulted in such a response of investors. Currently (May 2019) ABM Solid S.A. is in the course of a liquidation bankruptcy, and the share price 0.6 zloty.9
Figure 1: Stock quotation graph of ABM Solid S.A. in the period 24.07.2007-13.05.2019
Source: www.bankier.pl – profile for ABM Solid S.A. in the "Max" chart settings https://www.bankier.pl/inwestowanie/profile/quote.html?symbol=ABMSOLID (13.05.2019)
Moreover, the situation of ABM Solid S.A. presented in Figure 1 shows the situation of the parent
company in the group. The bankruptcy of one company raises serious consequences, and what if we come to think about the scale of costs generated in the case of a deterioration in the situation of the whole group. The costs are borne not only by companies in the group but also by the economy and society as a whole (e.g. the cost of lost jobs and others more widely presented in the literature [Boratyńska, 2009, pp. 182–183]). The risk and the consequences are even greater with regard to the problems of a capital group, which constitutes one coherent organism combining several entities (parent and subsidiaries) with a number of different links and dependencies. The consequences of a potential bankruptcy may therefore be multiplied.
It follows from the above example that the question of the condition of a company in a capital group is not indifferent to its other members. This is a good argument in favour of the need to make an assessment, averaged but explicit, of the ability of the whole group to continue its business. This assessment may provide information on the threats to the functioning of the capital group in the current system of capital relations.
8www.bankier.pl – Profile for ABM Solid S.A. in the "Max" chart settings https://www.bankier.pl/inwestowanie/profile/quote.html?symbol=ABMSOLID (13.05.2019) 9An ibid.
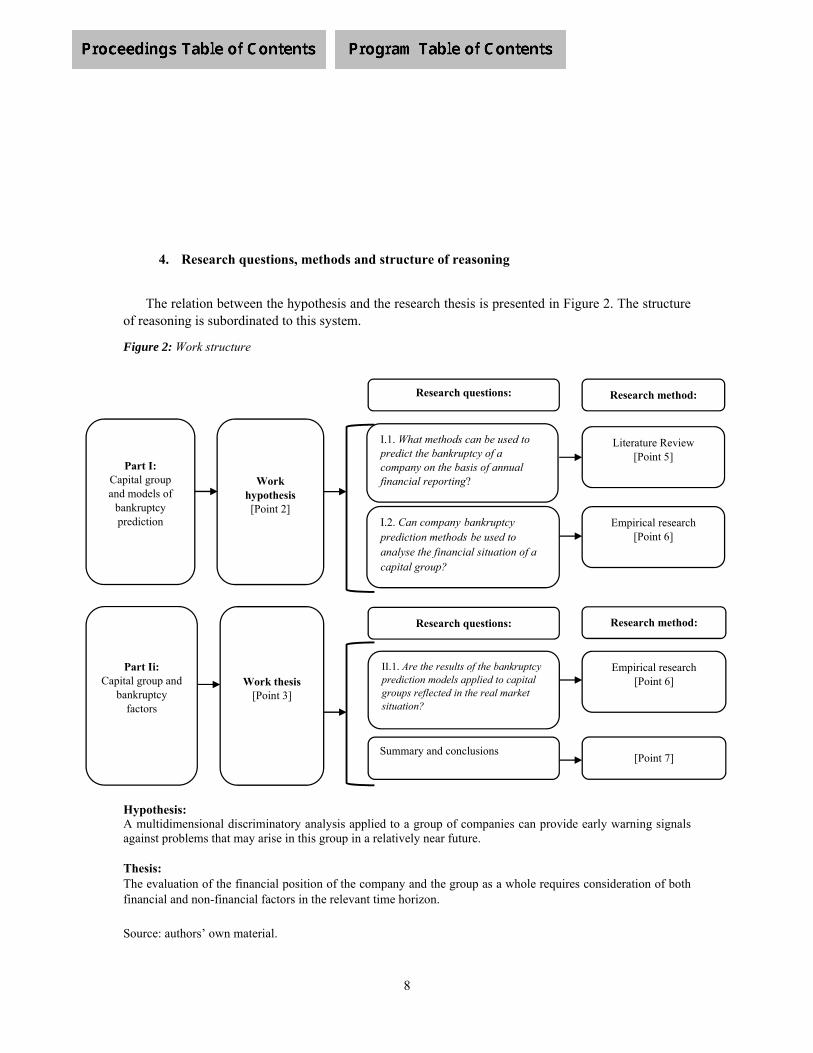
8
4. Research questions, methods and structure of reasoning
The relation between the hypothesis and the research thesis is presented in Figure 2. The structure of reasoning is subordinated to this system.
Figure 2: Work structure
Hypothesis: A multidimensional discriminatory analysis applied to a group of companies can provide early warning signals against problems that may arise in this group in a relatively near future. Thesis: The evaluation of the financial position of the company and the group as a whole requires consideration of both financial and non-financial factors in the relevant time horizon.
Source: authors’ own material.
Part I: Capital group and models of
bankruptcy prediction
Work hypothesis [Point 2]
I.1. What methods can be used to predict the bankruptcy of a company on the basis of annual financial reporting?
Research questions: Research method:
Literature Review [Point 5]
I.2. Can company bankruptcy prediction methods be used to analyse the financial situation of a capital group?
Empirical research [Point 6]
Part Ii: Capital group and
bankruptcy factors
Work thesis [Point 3]
Research questions: Research method:
Empirical research [Point 6]
Summary and conclusions
II.1. Are the results of the bankruptcy prediction models applied to capital groups reflected in the real market situation?
[Point 7]
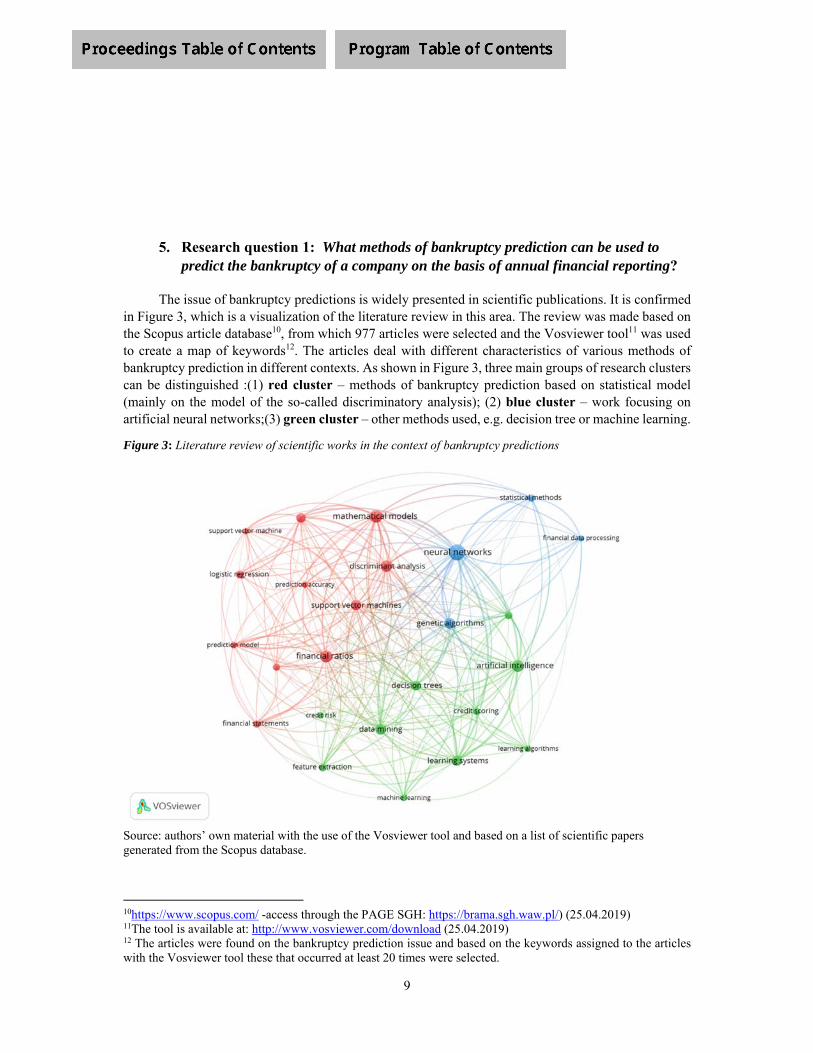
9
5. Research question 1: What methods of bankruptcy prediction can be used to
predict the bankruptcy of a company on the basis of annual financial reporting?
The issue of bankruptcy predictions is widely presented in scientific publications. It is confirmed in Figure 3, which is a visualization of the literature review in this area. The review was made based on the Scopus article database10, from which 977 articles were selected and the Vosviewer tool11 was used to create a map of keywords12. The articles deal with different characteristics of various methods of bankruptcy prediction in different contexts. As shown in Figure 3, three main groups of research clusters can be distinguished :(1) red cluster – methods of bankruptcy prediction based on statistical model (mainly on the model of the so-called discriminatory analysis); (2) blue cluster – work focusing on artificial neural networks;(3) green cluster – other methods used, e.g. decision tree or machine learning.
Figure 3: Literature review of scientific works in the context of bankruptcy predictions
Source: authors’ own material with the use of the Vosviewer tool and based on a list of scientific papers generated from the Scopus database.
10https://www.scopus.com/ -access through the PAGE SGH: https://brama.sgh.waw.pl/) (25.04.2019) 11The tool is available at: http://www.vosviewer.com/download (25.04.2019) 12 The articles were found on the bankruptcy prediction issue and based on the keywords assigned to the articles with the Vosviewer tool these that occurred at least 20 times were selected.

10
Table 1 shows the results of authors’ own review of the most important methods of bankruptcy prediction, with their advantages and disadvantages discussed in the literature. Taking into account the applicability of the above models to the source material, i.e. in this research to the financial statements of capital groups and the assessments related to their predictive potential, it was decided to use multidimensional models of discriminatory analysis in the study presented here.
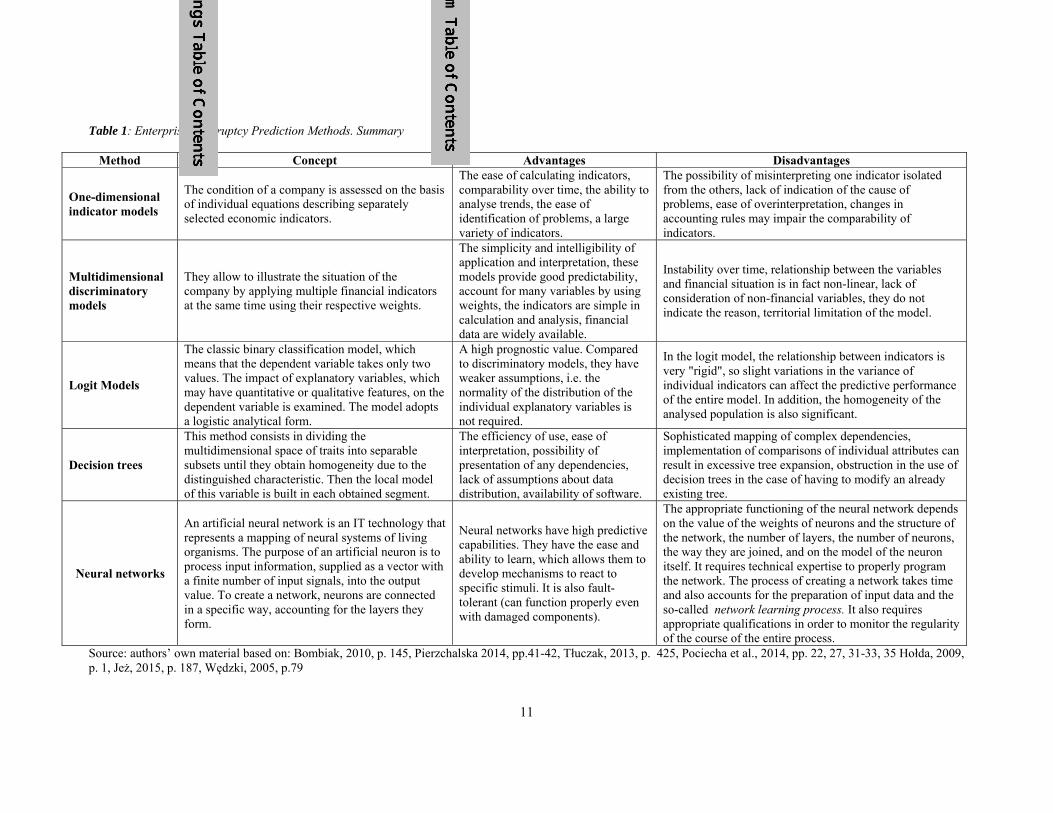
11
Table 1: Enterprise Bankruptcy Prediction Methods. Summary
Method Concept Advantages Disadvantages
One-dimensional indicator models
The condition of a company is assessed on the basis of individual equations describing separately selected economic indicators.
The ease of calculating indicators, comparability over time, the ability to analyse trends, the ease of identification of problems, a large variety of indicators.
The possibility of misinterpreting one indicator isolated from the others, lack of indication of the cause of problems, ease of overinterpretation, changes in accounting rules may impair the comparability of indicators.
Multidimensional discriminatory models
They allow to illustrate the situation of the company by applying multiple financial indicators at the same time using their respective weights.
The simplicity and intelligibility of application and interpretation, these models provide good predictability, account for many variables by using weights, the indicators are simple in calculation and analysis, financial data are widely available.
Instability over time, relationship between the variables and financial situation is in fact non-linear, lack of consideration of non-financial variables, they do not indicate the reason, territorial limitation of the model.
Logit Models
The classic binary classification model, which means that the dependent variable takes only two values. The impact of explanatory variables, which may have quantitative or qualitative features, on the dependent variable is examined. The model adopts a logistic analytical form.
A high prognostic value. Compared to discriminatory models, they have weaker assumptions, i.e. the normality of the distribution of the individual explanatory variables is not required.
In the logit model, the relationship between indicators is very "rigid", so slight variations in the variance of individual indicators can affect the predictive performance of the entire model. In addition, the homogeneity of the analysed population is also significant.
Decision trees
This method consists in dividing the multidimensional space of traits into separable subsets until they obtain homogeneity due to the distinguished characteristic. Then the local model of this variable is built in each obtained segment.
The efficiency of use, ease of interpretation, possibility of presentation of any dependencies, lack of assumptions about data distribution, availability of software.
Sophisticated mapping of complex dependencies, implementation of comparisons of individual attributes can result in excessive tree expansion, obstruction in the use of decision trees in the case of having to modify an already existing tree.
Neural networks
An artificial neural network is an IT technology that represents a mapping of neural systems of living organisms. The purpose of an artificial neuron is to process input information, supplied as a vector with a finite number of input signals, into the output value. To create a network, neurons are connected in a specific way, accounting for the layers they form.
Neural networks have high predictive capabilities. They have the ease and ability to learn, which allows them to develop mechanisms to react to specific stimuli. It is also fault-tolerant (can function properly even with damaged components).
The appropriate functioning of the neural network depends on the value of the weights of neurons and the structure of the network, the number of layers, the number of neurons, the way they are joined, and on the model of the neuron itself. It requires technical expertise to properly program the network. The process of creating a network takes time and also accounts for the preparation of input data and the so-called network learning process. It also requires appropriate qualifications in order to monitor the regularity of the course of the entire process.
Source: authors’ own material based on: Bombiak, 2010, p. 145, Pierzchalska 2014, pp.41-42, Tłuczak, 2013, p. 425, Pociecha et al., 2014, pp. 22, 27, 31-33, 35 Hołda, 2009, p. 1, Jeż, 2015, p. 187, Wędzki, 2005, p.79

12
Discriminatory analysis models form a combination of different financial indicators which, used together, illustrate the financial situation of a company. Appropriate weights are allocated to each indicator showing the degree of significance of the indicator. The result of the discriminatory analysis model is the calculation of one parameter (the so-called Z-score), the size of which allows for the determination of the financial situation of the company (at the assumed ranges of values which this parameter can achieve). As reported by Aczel [2000, p. 883], the general form of a discriminatory function is:
Z= b0 + b1X1 + b2X2 + ... + bkXk , (1)
where: Z – dependent variable (explained), b0 – constant parameter, bi – for i = 1, 2, ..., k, coefficients of discriminatory function – variable weights, Xi – for i = 1, 2, ..., k, independent variables (explanatory) – financial indicators.
The precursor among the authors of discriminatory analysis models was undoubtedly Edward I. Altman, professor of finance at the Stern School of Business, New York University, who in 1968 developed the so-called Altman model or Z-score model. Many alternative models to the Altman model also appeared in scientific publications. However, as this research work concerns Polish companies and capital groups, let us look at the models of discriminatory analysis that have been applied to Polish companies. To this end, we used the selection of models proposed by Wojnar [2014, pp. 221-225].
Table 2: Overview of discriminatory analysis models for Polish companies
No. Model author Model Variables and limit values
1. M. Pogodzińska i S. Sojak
Z = 0,644741X1 + 0.912304 X2
X1 – (current assets – stocks)/short-term liabilities, X2 – gross result/sales revenue. Z > 0 – good condition Z < 0 – bankruptcy threat -0.454 < Z < 0.090 – intermediate sphere
2. D. Hadasik
Z = 2.3626 + 0.3654 X1 – 0.7655 X2 – 2.4043 X3 + 1.5908 X4 + 0.0023 X5 – 0.0128 X6
X1 – current assets/current liabilities, X2 – (current assets – stocks)/current liabilities, X3 – total liabilities/total assets, X4 – (current assets – short-term liabilities)/total liabilities, X5 – receivables/revenues from sales, X6 – inventories/revenues from sales. Z > 0 – good condition Z < 0 – bankruptcy threat
3. E. Mączyńska13
Z = -1.498 + 9.498 X1 + 3.566 X2 + 2.903 X3 + 0.452 X4
X1 – operational result / value of assets, X2 – equity value / value of assets, X3 – net financial result + depreciation /total liabilities, X4 – current assets / short-term liabilities Z > 2 – very good condition 1 <= Z <= 2 – good condition 0 < Z < 1 – poor condition Z <= 0 – bankruptcy threat
4. D. Wierzba Z = 3.26 X1
X1 – (profit from operating activities – depreciation)/total assets, X2 – (profit from operating activities – depreciation)/sale of products,
13 The article written by Wojnar [2014, pp. 221-225] used the form of the function Z = 1.5 x1 + 0.08 x2 + 10 x3 + 5 x4 + 0.3 x5 + 0.1 x6. It is one of the seven models proposed by Prof. Mączyńska. For the purpose of empirical research, a model version was chosen which, according to Prof. Mączyńska studies, was characterized by the greatest effectiveness.
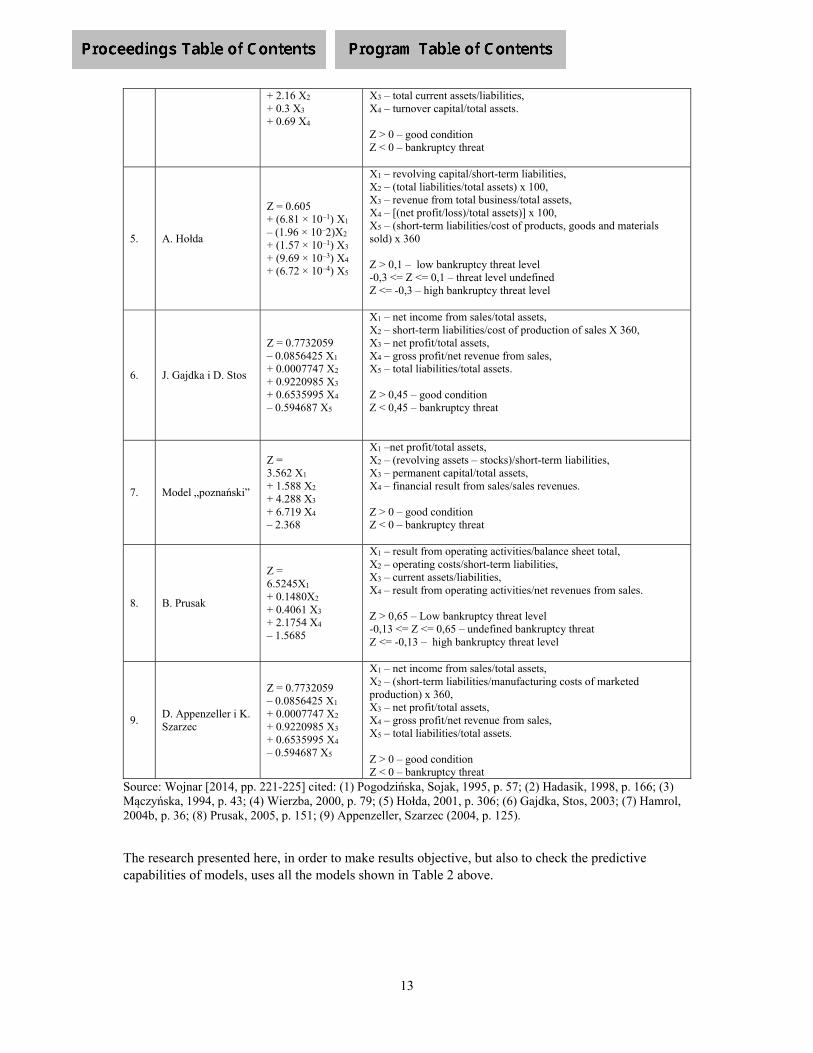
13
+ 2.16 X2 + 0.3 X3 + 0.69 X4
X3 – total current assets/liabilities, X4 – turnover capital/total assets. Z > 0 – good condition Z < 0 – bankruptcy threat
5. A. Hołda
Z = 0.605 + (6.81 × 10–1) X1 – (1.96 × 10–2)X2 + (1.57 × 10–1) X3 + (9.69 × 10–3) X4 + (6.72 × 10–4) X5
X1 – revolving capital/short-term liabilities, X2 – (total liabilities/total assets) x 100, X3 – revenue from total business/total assets, X4 – [(net profit/loss)/total assets)] x 100, X5 – (short-term liabilities/cost of products, goods and materials sold) x 360 Z > 0,1 – low bankruptcy threat level -0,3 <= Z <= 0,1 – threat level undefined Z <= -0,3 – high bankruptcy threat level
6. J. Gajdka i D. Stos
Z = 0.7732059 ‒ 0.0856425 X1 + 0.0007747 X2 + 0.9220985 X3 + 0.6535995 X4 ‒ 0.594687 X5
X1 – net income from sales/total assets, X2 – short-term liabilities/cost of production of sales X 360, X3 – net profit/total assets, X4 – gross profit/net revenue from sales, X5 – total liabilities/total assets. Z > 0,45 – good condition Z < 0,45 – bankruptcy threat
7. Model „poznański”
Z = 3.562 X1 + 1.588 X2 + 4.288 X3 + 6.719 X4 ‒ 2.368
X1 –net profit/total assets, X2 – (revolving assets – stocks)/short-term liabilities, X3 – permanent capital/total assets, X4 – financial result from sales/sales revenues. Z > 0 – good condition Z < 0 – bankruptcy threat
8. B. Prusak
Z = 6.5245X1 + 0.1480X2 + 0.4061 X3 + 2.1754 X4 – 1.5685
X1 – result from operating activities/balance sheet total, X2 – operating costs/short-term liabilities, X3 – current assets/liabilities, X4 – result from operating activities/net revenues from sales. Z > 0,65 – Low bankruptcy threat level -0,13 <= Z <= 0,65 – undefined bankruptcy threat Z <= -0,13 – high bankruptcy threat level
9. D. Appenzeller i K. Szarzec
Z = 0.7732059 ‒ 0.0856425 X1
+ 0.0007747 X2 + 0.9220985 X3 + 0.6535995 X4 ‒ 0.594687 X5
X1 – net income from sales/total assets, X2 – (short-term liabilities/manufacturing costs of marketed production) x 360, X3 – net profit/total assets, X4 – gross profit/net revenue from sales, X5 – total liabilities/total assets. Z > 0 – good condition Z < 0 – bankruptcy threat
Source: Wojnar [2014, pp. 221-225] cited: (1) Pogodzińska, Sojak, 1995, p. 57; (2) Hadasik, 1998, p. 166; (3) Mączyńska, 1994, p. 43; (4) Wierzba, 2000, p. 79; (5) Hołda, 2001, p. 306; (6) Gajdka, Stos, 2003; (7) Hamrol, 2004b, p. 36; (8) Prusak, 2005, p. 151; (9) Appenzeller, Szarzec (2004, p. 125).
The research presented here, in order to make results objective, but also to check the predictive capabilities of models, uses all the models shown in Table 2 above.
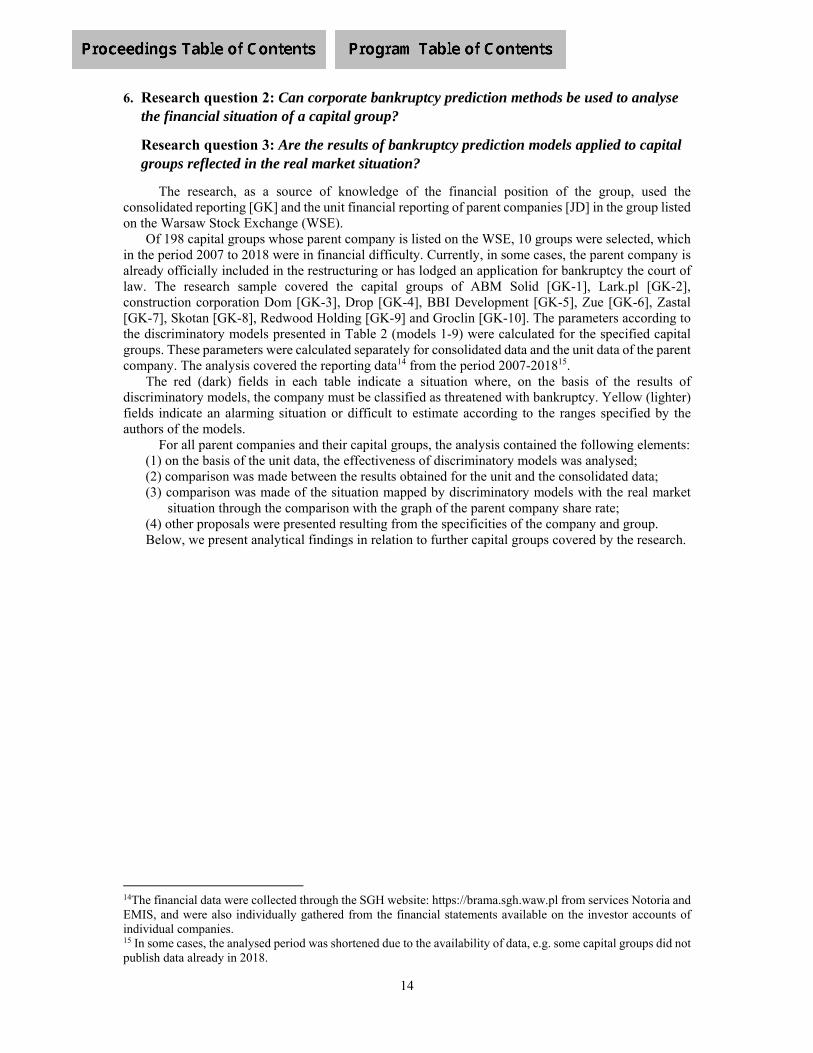
14
6. Research question 2: Can corporate bankruptcy prediction methods be used to analyse the financial situation of a capital group?
Research question 3: Are the results of bankruptcy prediction models applied to capital groups reflected in the real market situation?
The research, as a source of knowledge of the financial position of the group, used the consolidated reporting [GK] and the unit financial reporting of parent companies [JD] in the group listed on the Warsaw Stock Exchange (WSE).
Of 198 capital groups whose parent company is listed on the WSE, 10 groups were selected, which in the period 2007 to 2018 were in financial difficulty. Currently, in some cases, the parent company is already officially included in the restructuring or has lodged an application for bankruptcy the court of law. The research sample covered the capital groups of ABM Solid [GK-1], Lark.pl [GK-2], construction corporation Dom [GK-3], Drop [GK-4], BBI Development [GK-5], Zue [GK-6], Zastal [GK-7], Skotan [GK-8], Redwood Holding [GK-9] and Groclin [GK-10]. The parameters according to the discriminatory models presented in Table 2 (models 1-9) were calculated for the specified capital groups. These parameters were calculated separately for consolidated data and the unit data of the parent company. The analysis covered the reporting data14 from the period 2007-201815.
The red (dark) fields in each table indicate a situation where, on the basis of the results of discriminatory models, the company must be classified as threatened with bankruptcy. Yellow (lighter) fields indicate an alarming situation or difficult to estimate according to the ranges specified by the authors of the models.
For all parent companies and their capital groups, the analysis contained the following elements: (1) on the basis of the unit data, the effectiveness of discriminatory models was analysed; (2) comparison was made between the results obtained for the unit and the consolidated data; (3) comparison was made of the situation mapped by discriminatory models with the real market
situation through the comparison with the graph of the parent company share rate; (4) other proposals were presented resulting from the specificities of the company and group. Below, we present analytical findings in relation to further capital groups covered by the research.
14The financial data were collected through the SGH website: https://brama.sgh.waw.pl from services Notoria and EMIS, and were also individually gathered from the financial statements available on the investor accounts of individual companies. 15 In some cases, the analysed period was shortened due to the availability of data, e.g. some capital groups did not publish data already in 2018.
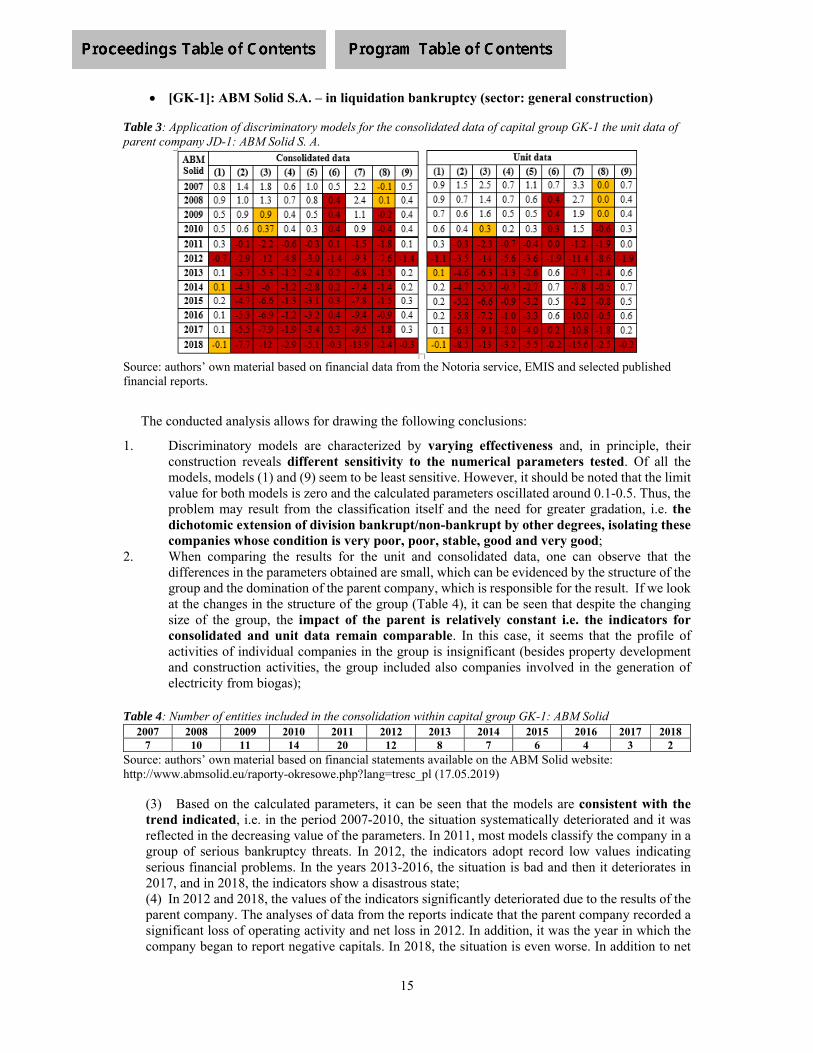
15
[GK-1]: ABM Solid S.A. – in liquidation bankruptcy (sector: general construction) Table 3: Application of discriminatory models for the consolidated data of capital group GK-1 the unit data of parent company JD-1: ABM Solid S. A.
Source: authors’ own material based on financial data from the Notoria service, EMIS and selected published financial reports.
The conducted analysis allows for drawing the following conclusions:
1. Discriminatory models are characterized by varying effectiveness and, in principle, their construction reveals different sensitivity to the numerical parameters tested. Of all the models, models (1) and (9) seem to be least sensitive. However, it should be noted that the limit value for both models is zero and the calculated parameters oscillated around 0.1-0.5. Thus, the problem may result from the classification itself and the need for greater gradation, i.e. the dichotomic extension of division bankrupt/non-bankrupt by other degrees, isolating these companies whose condition is very poor, poor, stable, good and very good;
2. When comparing the results for the unit and consolidated data, one can observe that the differences in the parameters obtained are small, which can be evidenced by the structure of the group and the domination of the parent company, which is responsible for the result. If we look at the changes in the structure of the group (Table 4), it can be seen that despite the changing size of the group, the impact of the parent is relatively constant i.e. the indicators for consolidated and unit data remain comparable. In this case, it seems that the profile of activities of individual companies in the group is insignificant (besides property development and construction activities, the group included also companies involved in the generation of electricity from biogas);
Table 4: Number of entities included in the consolidation within capital group GK-1: ABM Solid
2007 2008 2009 2010 2011 2012 2013 2014 2015 2016 2017 2018 7 10 11 14 20 12 8 7 6 4 3 2
Source: authors’ own material based on financial statements available on the ABM Solid website: http://www.abmsolid.eu/raporty-okresowe.php?lang=tresc_pl (17.05.2019)
(3) Based on the calculated parameters, it can be seen that the models are consistent with the trend indicated, i.e. in the period 2007-2010, the situation systematically deteriorated and it was reflected in the decreasing value of the parameters. In 2011, most models classify the company in a group of serious bankruptcy threats. In 2012, the indicators adopt record low values indicating serious financial problems. In the years 2013-2016, the situation is bad and then it deteriorates in 2017, and in 2018, the indicators show a disastrous state; (4) In 2012 and 2018, the values of the indicators significantly deteriorated due to the results of the parent company. The analyses of data from the reports indicate that the parent company recorded a significant loss of operating activity and net loss in 2012. In addition, it was the year in which the company began to report negative capitals. In 2018, the situation is even worse. In addition to net

16
losses and negative capital, there is a clear reduction in the company assets and activity. This shows that discriminatory models are a helpful tool to signal a threat, but do not in themselves provide information on the reasons for this condition; (5) We also note that the models signaled the risk of bankruptcy for the 2011 data. However, when we look at the consolidated cash flow for the period of 2007-2010 (Table 5), we can see that some consequences could have been predicted earlier. In 2007, 2008 and 2010 the capital group recorded significant negative flows from operating activities. In addition, the group pursued a consistent investment strategy, which was reflected in the negative investment flows (mainly in the category of Acquisition of intangible assets and tangible fixed assets) and in the structure of the group (as shown in Table 4, in 2007, 7 entities were included in the consolidation and in 2011 already 20 entities). Positive financial flows resulted from the financing of investments from the issuance of shares (2007) and the bank credit leverage16. It can therefore be noted that discriminatory models show a state of bankruptcy threat, which stems from the previously adopted financial and investment decisions. However, the question arises as to which extent these models actually warn against bankruptcy, and to which extent they only inform about it (or a very serious threat). If most models indicate serious problems only for the data for 2011, then the next question arises whether or not we have at this moment a ship that is sinking and whether from the point of view of the board and stakeholders there is a real way out of this situation (or it may be too late). It may appear that the period of 2007-2010 was the time for decision-making and the further stage was a consequence of the undertaken action without a possibility of maneuvering.
Table 5: Cash flows in capital group GK-1: ABM Solid
Flows 2007 2008 2009 2010 2011 2012 2013 2014 2015 2016 2017 2018 operating -13 633 -14 475 17 118 -16 100 -7 761 10 105 -1 358 3 430 2 010 -1 885 -7 894 -1 741
investment -30 574 -3 317 -3 081 -12 229 -1 252 8 640 9 965 963 3 481 832 6 846 849 financial 52 983 25 012 -26 355 51 525 -6 672 -16 669 -10 341 -2 396 -6 405 -1 969 -8 636 -670
Source: authors’ own material on the basis of financial data from the Notoria service, EMIS and selected published financial statements.
(6) In reference to point (5), it is worth noting that three models (3, 6 and 8) have indicated the threat status before. The analysis of the structure of these models indicate that their strength lies in the selection of indicators (i.e. at least half of the explanatory variables are mixed indices – combining the balance sheet categories with the items of the profit and loss account). If we look at the weights allocated to them, it seems that eventually mixed variables have a greater impact on the final result obtained from the model. (7) It is also worth comparing the results of discriminatory models with the market response to the emerging signals. For this purpose, we will use the stock graph for the parent company of ABM Solid S.A. listed on the Warsaw Stock Exchange. The letters marked in Figure 4 indicate subsequently the moment of publication of the report: A – for the 1st half 2010, B – for 2010, C – for 2011. Let us remember that discriminatory models assessed the company as a potential bankrupt on the basis of data for 2011, which were published at the beginning of 2012 (point C). But since November 2010 (point D), a clear downward trend is conspicuous, which, measured from point D to C, lasts about 16 months. Applying discriminatory models in point C (21 March 2012), we in fact confirm that the situation of the company as very bad, as evidenced by the filing of an application for bankruptcy three months later (28 June 2012). The conclusion that results from this is that in order for discriminatory models to function as a warning, they should be used at regular intervals (e.g. quarterly) in order to be able to properly monitor the financial position of the company and sufficiently early react to emerging crisis moments. Monitoring based on annual data may result in delayed response. In addition, the models should first signal the deterioration zones as in model (3) and (8) -yellow fields.
16 On the basis of the consolidated cash-flow statement, the income from loans amounted to PLN 12 million in 2007, PLN 61 million in 2008, PLN 36 in 2009 and 101 million zlotys in 2010 (source: consolidated financial statements available on the websiteABM Solid: http://www.abmsolid.eu/raporty-okresowe.php?lang=tresc_pl (17.05.2019)).

17
Model (8) has indicated a worsening of the situation on the basis of data for 2007 (published in 2008). Using this model and assuming that the situation broke out in November 2010, we have time margin of about 2.5 years to take appropriate action.
Figure 4: Stock quotation graph of JD-1: ABM Solid S.A. in the period: 01 January 2010 – 26 May 2012
Source: https://www.bankier.pl/inwestowanie/profile/quote.html?symbol=ABMSOLID (18.05.2019)
[GK-2]: Building corporation Dom S.A. – Application for bankruptcy filed in 2018
(sector: building materials) Table 6: Application of discriminatory models for the consolidated data of capital group GK- 2 and unit data of parent company JD-2: KB Dom S.A.
Source: authors’ own material on the basis of financial data from the Notoria service, EMIS and selected
published financial statements.
The conducted analysis allows for drawing the following conclusions: 1. Models showed different effectiveness, although most of them signaled a wrong situation for
the 2009 data. Model (2) and model (5) showed the least sensitivity to financial data. What is more, model (5) showed, compared to other models, abnormally high values for the unit data. It turned out that this disorder was due to the abnormal performance of the parent company, which in the years 2011-2017 achieved a very low income at a level of several hundred thousand. With a low cost of sold products and on the balance sheet side – assets estimated at over PLN 100 million and short-term liabilities valued at over PLN 15 million, the calculated parameters were distorted. Moreover, when we look at 2011 and the data of the parent company, it appears that the models report disastrously low values. Likewise, if the unit revenues for 2011 amounted to 89 thousand zlotys and the loss on net sales to - 6 million zlotys, the indicator based on the relationship result of sales/revenues from sales will be significantly distorted. Similarly, in 2013, the sales revenue amounted to 741 thousand zlotys and exceptionally this year there was not a loss but a gross profit of 1.3 million and net profit of 2.1 million. This means that the gross profit/revenue indicators will be distorted. And in 2017, the parent company suffered a
A B CD
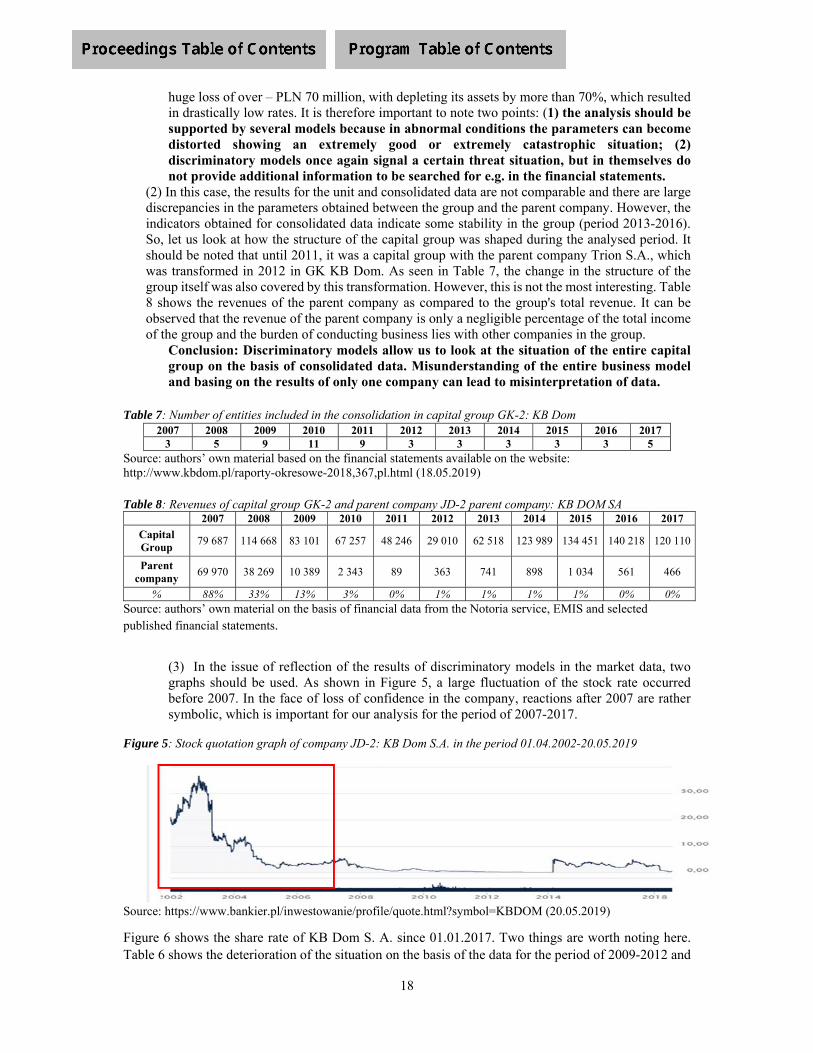
18
huge loss of over – PLN 70 million, with depleting its assets by more than 70%, which resulted in drastically low rates. It is therefore important to note two points: (1) the analysis should be supported by several models because in abnormal conditions the parameters can become distorted showing an extremely good or extremely catastrophic situation; (2) discriminatory models once again signal a certain threat situation, but in themselves do not provide additional information to be searched for e.g. in the financial statements.
(2) In this case, the results for the unit and consolidated data are not comparable and there are large discrepancies in the parameters obtained between the group and the parent company. However, the indicators obtained for consolidated data indicate some stability in the group (period 2013-2016). So, let us look at how the structure of the capital group was shaped during the analysed period. It should be noted that until 2011, it was a capital group with the parent company Trion S.A., which was transformed in 2012 in GK KB Dom. As seen in Table 7, the change in the structure of the group itself was also covered by this transformation. However, this is not the most interesting. Table 8 shows the revenues of the parent company as compared to the group's total revenue. It can be observed that the revenue of the parent company is only a negligible percentage of the total income of the group and the burden of conducting business lies with other companies in the group.
Conclusion: Discriminatory models allow us to look at the situation of the entire capital group on the basis of consolidated data. Misunderstanding of the entire business model and basing on the results of only one company can lead to misinterpretation of data.
Table 7: Number of entities included in the consolidation in capital group GK-2: KB Dom 2007 2008 2009 2010 2011 2012 2013 2014 2015 2016 2017
3 5 9 11 9 3 3 3 3 3 5 Source: authors’ own material based on the financial statements available on the website: http://www.kbdom.pl/raporty-okresowe-2018,367,pl.html (18.05.2019) Table 8: Revenues of capital group GK-2 and parent company JD-2 parent company: KB DOM SA
2007 2008 2009 2010 2011 2012 2013 2014 2015 2016 2017
Capital Group
79 687 114 668 83 101 67 257 48 246 29 010 62 518 123 989 134 451 140 218 120 110
Parent company
69 970 38 269 10 389 2 343 89 363 741 898 1 034 561 466
% 88% 33% 13% 3% 0% 1% 1% 1% 1% 0% 0% Source: authors’ own material on the basis of financial data from the Notoria service, EMIS and selected published financial statements.
(3) In the issue of reflection of the results of discriminatory models in the market data, two graphs should be used. As shown in Figure 5, a large fluctuation of the stock rate occurred before 2007. In the face of loss of confidence in the company, reactions after 2007 are rather symbolic, which is important for our analysis for the period of 2007-2017.
Figure 5: Stock quotation graph of company JD-2: KB Dom S.A. in the period 01.04.2002-20.05.2019
Source: https://www.bankier.pl/inwestowanie/profile/quote.html?symbol=KBDOM (20.05.2019)
Figure 6 shows the share rate of KB Dom S. A. since 01.01.2017. Two things are worth noting here. Table 6 shows the deterioration of the situation on the basis of the data for the period of 2009-2012 and
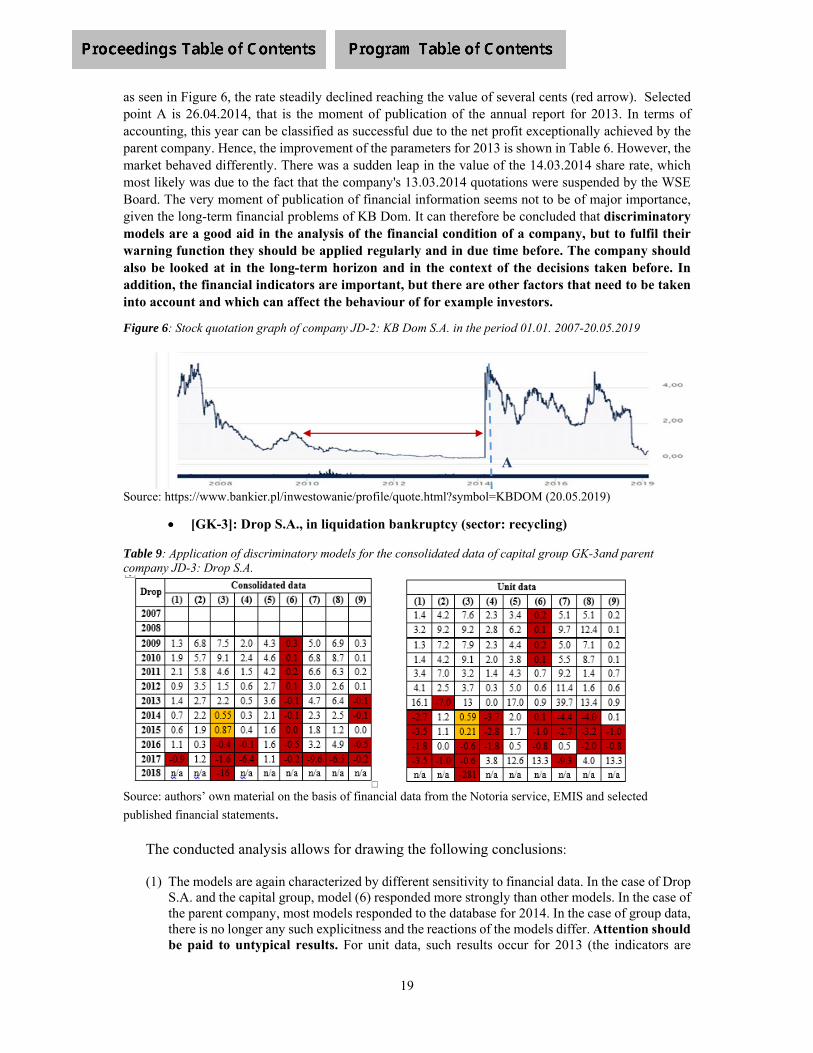
19
as seen in Figure 6, the rate steadily declined reaching the value of several cents (red arrow). Selected point A is 26.04.2014, that is the moment of publication of the annual report for 2013. In terms of accounting, this year can be classified as successful due to the net profit exceptionally achieved by the parent company. Hence, the improvement of the parameters for 2013 is shown in Table 6. However, the market behaved differently. There was a sudden leap in the value of the 14.03.2014 share rate, which most likely was due to the fact that the company's 13.03.2014 quotations were suspended by the WSE Board. The very moment of publication of financial information seems not to be of major importance, given the long-term financial problems of KB Dom. It can therefore be concluded that discriminatory models are a good aid in the analysis of the financial condition of a company, but to fulfil their warning function they should be applied regularly and in due time before. The company should also be looked at in the long-term horizon and in the context of the decisions taken before. In addition, the financial indicators are important, but there are other factors that need to be taken into account and which can affect the behaviour of for example investors.
Figure 6: Stock quotation graph of company JD-2: KB Dom S.A. in the period 01.01. 2007-20.05.2019
Source: https://www.bankier.pl/inwestowanie/profile/quote.html?symbol=KBDOM (20.05.2019)
[GK-3]: Drop S.A., in liquidation bankruptcy (sector: recycling) Table 9: Application of discriminatory models for the consolidated data of capital group GK-3and parent company JD-3: Drop S.A.
Source: authors’ own material on the basis of financial data from the Notoria service, EMIS and selected
published financial statements.
The conducted analysis allows for drawing the following conclusions: (1) The models are again characterized by different sensitivity to financial data. In the case of Drop
S.A. and the capital group, model (6) responded more strongly than other models. In the case of the parent company, most models responded to the database for 2014. In the case of group data, there is no longer any such explicitness and the reactions of the models differ. Attention should be paid to untypical results. For unit data, such results occur for 2013 (the indicators are
A
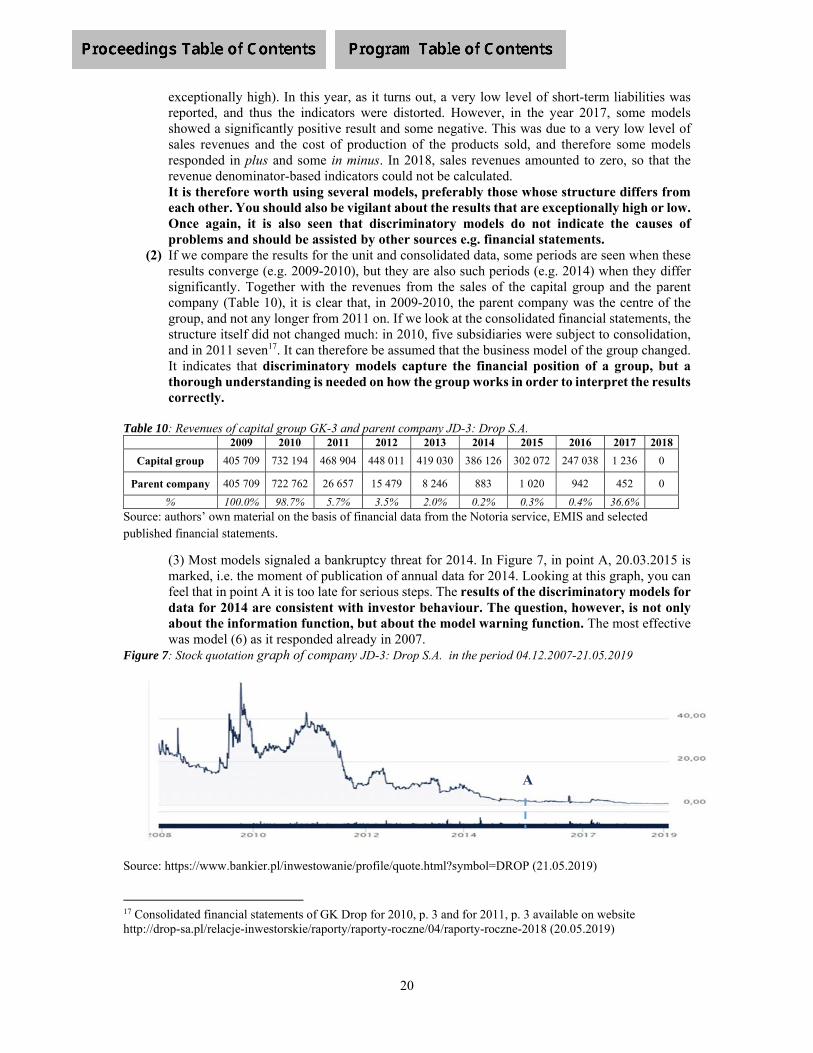
20
exceptionally high). In this year, as it turns out, a very low level of short-term liabilities was reported, and thus the indicators were distorted. However, in the year 2017, some models showed a significantly positive result and some negative. This was due to a very low level of sales revenues and the cost of production of the products sold, and therefore some models responded in plus and some in minus. In 2018, sales revenues amounted to zero, so that the revenue denominator-based indicators could not be calculated. It is therefore worth using several models, preferably those whose structure differs from each other. You should also be vigilant about the results that are exceptionally high or low. Once again, it is also seen that discriminatory models do not indicate the causes of problems and should be assisted by other sources e.g. financial statements.
(2) If we compare the results for the unit and consolidated data, some periods are seen when these results converge (e.g. 2009-2010), but they are also such periods (e.g. 2014) when they differ significantly. Together with the revenues from the sales of the capital group and the parent company (Table 10), it is clear that, in 2009-2010, the parent company was the centre of the group, and not any longer from 2011 on. If we look at the consolidated financial statements, the structure itself did not changed much: in 2010, five subsidiaries were subject to consolidation, and in 2011 seven17. It can therefore be assumed that the business model of the group changed. It indicates that discriminatory models capture the financial position of a group, but a thorough understanding is needed on how the group works in order to interpret the results correctly.
Table 10: Revenues of capital group GK-3 and parent company JD-3: Drop S.A. 2009 2010 2011 2012 2013 2014 2015 2016 2017 2018
Capital group 405 709 732 194 468 904 448 011 419 030 386 126 302 072 247 038 1 236 0
Parent company 405 709 722 762 26 657 15 479 8 246 883 1 020 942 452 0
% 100.0% 98.7% 5.7% 3.5% 2.0% 0.2% 0.3% 0.4% 36.6% Source: authors’ own material on the basis of financial data from the Notoria service, EMIS and selected published financial statements.
(3) Most models signaled a bankruptcy threat for 2014. In Figure 7, in point A, 20.03.2015 is marked, i.e. the moment of publication of annual data for 2014. Looking at this graph, you can feel that in point A it is too late for serious steps. The results of the discriminatory models for data for 2014 are consistent with investor behaviour. The question, however, is not only about the information function, but about the model warning function. The most effective was model (6) as it responded already in 2007.
Figure 7: Stock quotation graph of company JD-3: Drop S.A. in the period 04.12.2007-21.05.2019
Source: https://www.bankier.pl/inwestowanie/profile/quote.html?symbol=DROP (21.05.2019)
17 Consolidated financial statements of GK Drop for 2010, p. 3 and for 2011, p. 3 available on website http://drop-sa.pl/relacje-inwestorskie/raporty/raporty-roczne/04/raporty-roczne-2018 (20.05.2019)
A

21
[GK-4]: Redwood Holding S.A. – in restructuring (sector: mechanical equipment) Table 11: Application of discriminatory models for the consolidated data of capital group GK-4 and parent company JD-4: Redwood Holding S.A.
Source: authors’ own material on the basis of financial data from the Notoria service, EMIS and selected published financial statements.
The conducted analysis allows for drawing the following conclusions:
(1) The analysed models are of varying effectiveness. In this case, model (8) responded most, while model (9) did not react almost at all. Again, the question arises as to whether the classification bankrupt/non-bankrupt is sufficient and whether it is necessary to broaden/create a threat zone occurring earlier. Another recurrent phenomenon is excessively high indicators compared to other models. It is worth noting the unit data for 2007, and in particular the data for 2013. A high level of revolving assets and low level of short-term liabilities occurred in 2007. And in 2013, enormous values due to the fact that some models use the cost of manufacturing of the sold production as a denominator in one variable of the model. Since this cost was minimal in 2013, the relation was reversed, and the value of the indicator was multiplied. It is worth using several models at the same time, then compare the results. It can be noted that most models classified the company and the group as being particularly threatened on the basis of data for 2015.
(2) The results obtained for the group and for the parent company converge till 2011, while after 2012, they begin to show increasing differences. When we look at Table 12 and the generated sales revenues, we may note that since 2012 the parent company has lost in this respect in favour of other entities in the group. This shows how important it is to understand the entire business model of the capital group.
Table 12: Revenues of capital group GK-4 and parent company JD-4: Redwood Holding SA. 2007 2008 2009 2010 2011 2012 2013 2014 2015 2016 2017
Capital group 97 450 94 369 103 887 120 877 149 796 121 570 119 434 94 800 79 456 25 010 6 993
Parent company 97 450 84 768 78 321 79 351 98 564 27 658 8 852 7 955 6 856 4 043 2 718
% 100.0% 89.8% 75.4% 65.6% 65.8% 22.8% 7.4% 8.4% 8.6% 16.2% 38.9%
Source: authors’ own material on the basis of financial data from the Notoria service, EMIS and selected published financial statements.

22
(3) Most models responded strongly to the figures for 2015. They were published on 21.03.2016 (point A in Figure 8). Looking at the graph, it is possible to feel that discriminatory models, despite their assumptions, are detection rather than preventive models. In principle, only model (8) indicated a potential problem in almost the whole considered period. If we look additionally at the consolidated cash flow up to 2016, we see a consistent investment policy and looking for the sources of its financing, which at this stage was related to a certain risk.
Figure 8: Stock quotation graph of company JD-4: Redwood Holding S.A. in the period 04.11.2007-21.05.2019
Source: https://www.bankier.pl/inwestowanie/profile/quote.html?symbol=REDWOOD (21.05.2019)
Table 13: Cash flows in capital group Redwood Holding S.A. Flows 2007 2008 2009 2010 2011 2012 2013 2014 2015 2016
operating 4 104 -12 428 11 063 16 404 -2 288 -4 688 15 830 5 726 2 237 1 613
investment -1 326 -7 341 -3 208 -11 283 -10 872 -6 257 -6 721 144 4 827 1 982
financial 9 301 11 428 -8 248 -6 939 13 741 10 369 -11 102 -7 103 -6 157 -3 804
Source: authors’ own material on the basis of financial data from the Notoria service, EMIS and selected published financial statements.
[GK-5]: ZUE S.A. – (sector: construction and telecommunication installations)
Table 14: Application of discriminatory models for the consolidated data of capital group GK-5 and parent company JD-5: ZUE S.A.
Source: authors’ own material on the basis of financial data from the Notoria service, EMIS and selected published financial statements.
A
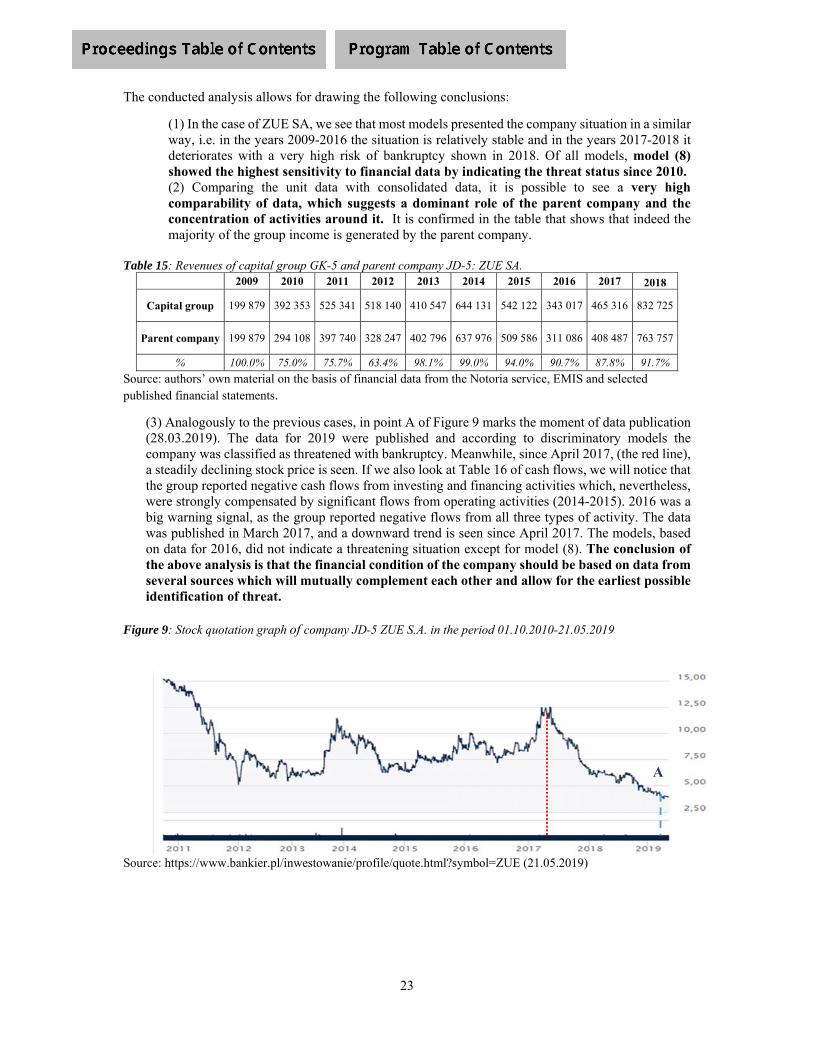
23
The conducted analysis allows for drawing the following conclusions:
(1) In the case of ZUE SA, we see that most models presented the company situation in a similar way, i.e. in the years 2009-2016 the situation is relatively stable and in the years 2017-2018 it deteriorates with a very high risk of bankruptcy shown in 2018. Of all models, model (8) showed the highest sensitivity to financial data by indicating the threat status since 2010. (2) Comparing the unit data with consolidated data, it is possible to see a very high comparability of data, which suggests a dominant role of the parent company and the concentration of activities around it. It is confirmed in the table that shows that indeed the majority of the group income is generated by the parent company.
Table 15: Revenues of capital group GK-5 and parent company JD-5: ZUE SA. 2009 2010 2011 2012 2013 2014 2015 2016 2017 2018
Capital group 199 879 392 353 525 341 518 140 410 547 644 131 542 122 343 017 465 316 832 725
Parent company 199 879 294 108 397 740 328 247 402 796 637 976 509 586 311 086 408 487 763 757
% 100.0% 75.0% 75.7% 63.4% 98.1% 99.0% 94.0% 90.7% 87.8% 91.7%
Source: authors’ own material on the basis of financial data from the Notoria service, EMIS and selected published financial statements.
(3) Analogously to the previous cases, in point A of Figure 9 marks the moment of data publication (28.03.2019). The data for 2019 were published and according to discriminatory models the company was classified as threatened with bankruptcy. Meanwhile, since April 2017, (the red line), a steadily declining stock price is seen. If we also look at Table 16 of cash flows, we will notice that the group reported negative cash flows from investing and financing activities which, nevertheless, were strongly compensated by significant flows from operating activities (2014-2015). 2016 was a big warning signal, as the group reported negative flows from all three types of activity. The data was published in March 2017, and a downward trend is seen since April 2017. The models, based on data for 2016, did not indicate a threatening situation except for model (8). The conclusion of the above analysis is that the financial condition of the company should be based on data from several sources which will mutually complement each other and allow for the earliest possible identification of threat.
Figure 9: Stock quotation graph of company JD-5 ZUE S.A. in the period 01.10.2010-21.05.2019
Source: https://www.bankier.pl/inwestowanie/profile/quote.html?symbol=ZUE (21.05.2019)
A

24
Table 16: Cash flow in capital group GK-5: ZUE Flows 2009 2010 2011 2012 2013 2014 2015 2016 2017 2018
operating 17 582 -42 072 21 866 12 828 9 707 68 600 111 812 -38 014 18 863 -22 180
investment -111 479 13 232 -7 852 2 816 -6 696 -3 710 -6 371 -63 227 -17 467 34 717
financial 72 804 60 357 -19 296 5 712 -23 054 -43 210 -4 184 -9 065 3 591 1 848 Source: authors’ own material on the basis of financial data from the Notoria service, EMIS and selected published financial statements.
[GK-6]: BBI Development (sector: real property sales) Table 17: Application of discriminatory models for the consolidated data of capital group GK-6 and parent company JD-6: BBI Development S.A.
Source: authors’ own material on the basis of financial data from the Notoria service, EMIS and selected published financial statements.
The conducted analysis allows for drawing the following conclusions: 1. Looking at the unit data, five models showed similar effectiveness, one did not react at all and
for three it was not possible to count the indicators. The fields "n/a" resulted from the fact that the cost of the sold products was not reported separately, but together with other costs (therefore, the indicators that had this cost in the denominator could not be counted). In addition, sales revenue was zero in 2007. During the 2008-2015 period, there were very large anomalies in the parameter values which resulted from low sales revenues and a very high net loss from sales. Since sales revenues are used in many denominator indicators and were much lower in relation to the costs incurred, the parameters obtainedd in the models were multiplied. In the years 2014-2015, a reverse situation is seen, when the parameters assumed a high positive value, which in turn was due to a much higher profit from operating activities from the sales. In 2014, the company also began to present separately the cost of sold products, which influenced the value of calculated parameters. It can therefore be concluded that the completeness of the data is very important in the models of discriminatory analysis and that the untypical presentation of data may distort the value of the parameters obtained and adversely affect the comparability of data.
2. There is a very large discrepancy between the unit and consolidated data. Based on previous analyses, it can be assumed that the business model is not focused around the parent company. In the case of BBI Development, the parent company is engaged in holding activities, while most subsidiaries are companies engaged in the construction business or property management. Looking at Table 18, one can see a disproportion between the revenue generated by the group and the revenue of the parent entity.
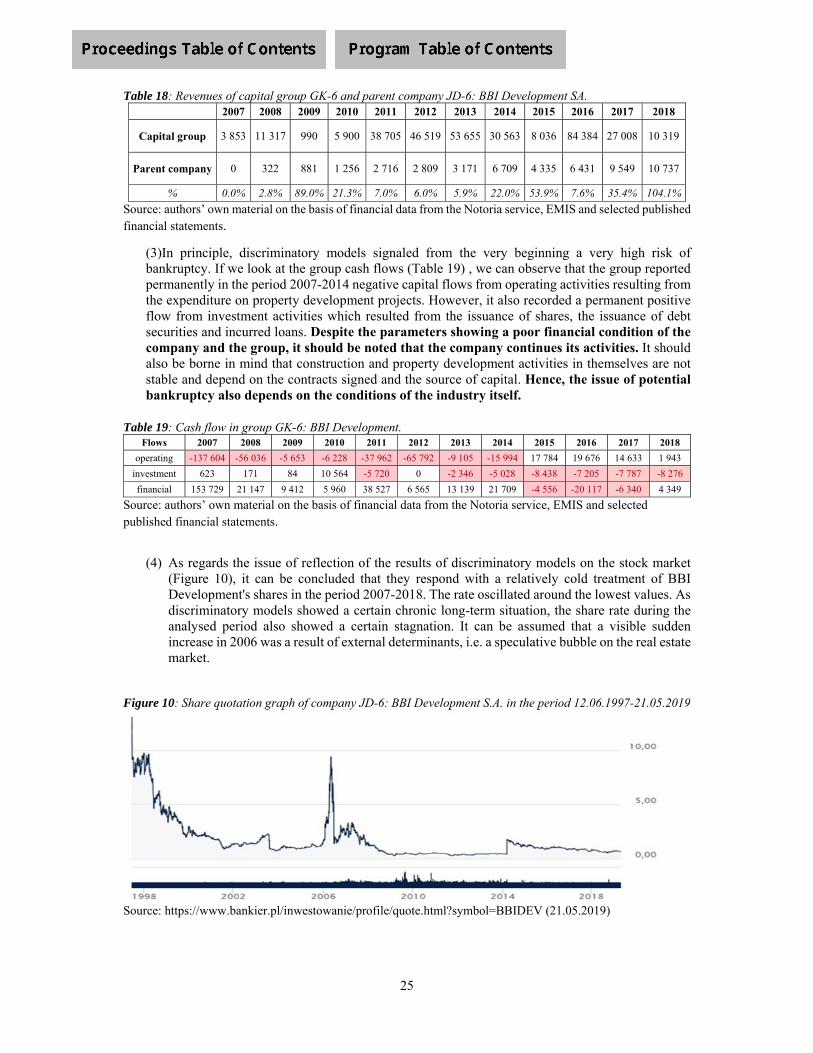
25
Table 18: Revenues of capital group GK-6 and parent company JD-6: BBI Development SA. 2007 2008 2009 2010 2011 2012 2013 2014 2015 2016 2017 2018
Capital group 3 853 11 317 990 5 900 38 705 46 519 53 655 30 563 8 036 84 384 27 008 10 319
Parent company 0 322 881 1 256 2 716 2 809 3 171 6 709 4 335 6 431 9 549 10 737
% 0.0% 2.8% 89.0% 21.3% 7.0% 6.0% 5.9% 22.0% 53.9% 7.6% 35.4% 104.1%
Source: authors’ own material on the basis of financial data from the Notoria service, EMIS and selected published financial statements.
(3)In principle, discriminatory models signaled from the very beginning a very high risk of bankruptcy. If we look at the group cash flows (Table 19) , we can observe that the group reported permanently in the period 2007-2014 negative capital flows from operating activities resulting from the expenditure on property development projects. However, it also recorded a permanent positive flow from investment activities which resulted from the issuance of shares, the issuance of debt securities and incurred loans. Despite the parameters showing a poor financial condition of the company and the group, it should be noted that the company continues its activities. It should also be borne in mind that construction and property development activities in themselves are not stable and depend on the contracts signed and the source of capital. Hence, the issue of potential bankruptcy also depends on the conditions of the industry itself.
Table 19: Cash flow in group GK-6: BBI Development.
Flows 2007 2008 2009 2010 2011 2012 2013 2014 2015 2016 2017 2018
operating -137 604 -56 036 -5 653 -6 228 -37 962 -65 792 -9 105 -15 994 17 784 19 676 14 633 1 943
investment 623 171 84 10 564 -5 720 0 -2 346 -5 028 -8 438 -7 205 -7 787 -8 276
financial 153 729 21 147 9 412 5 960 38 527 6 565 13 139 21 709 -4 556 -20 117 -6 340 4 349
Source: authors’ own material on the basis of financial data from the Notoria service, EMIS and selected published financial statements.
(4) As regards the issue of reflection of the results of discriminatory models on the stock market
(Figure 10), it can be concluded that they respond with a relatively cold treatment of BBI Development's shares in the period 2007-2018. The rate oscillated around the lowest values. As discriminatory models showed a certain chronic long-term situation, the share rate during the analysed period also showed a certain stagnation. It can be assumed that a visible sudden increase in 2006 was a result of external determinants, i.e. a speculative bubble on the real estate market.
Figure 10: Share quotation graph of company JD-6: BBI Development S.A. in the period 12.06.1997-21.05.2019
Source: https://www.bankier.pl/inwestowanie/profile/quote.html?symbol=BBIDEV (21.05.2019)
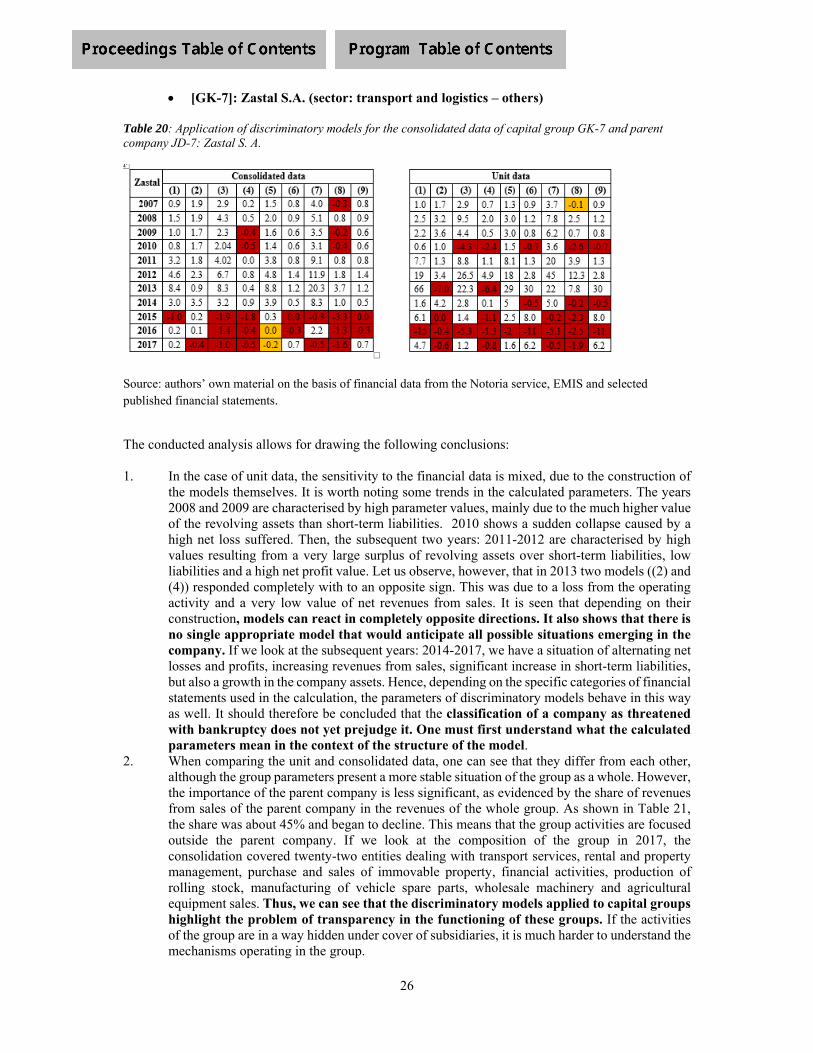
26
[GK-7]: Zastal S.A. (sector: transport and logistics – others) Table 20: Application of discriminatory models for the consolidated data of capital group GK-7 and parent company JD-7: Zastal S. A.
Source: authors’ own material on the basis of financial data from the Notoria service, EMIS and selected published financial statements.
The conducted analysis allows for drawing the following conclusions: 1. In the case of unit data, the sensitivity to the financial data is mixed, due to the construction of
the models themselves. It is worth noting some trends in the calculated parameters. The years 2008 and 2009 are characterised by high parameter values, mainly due to the much higher value of the revolving assets than short-term liabilities. 2010 shows a sudden collapse caused by a high net loss suffered. Then, the subsequent two years: 2011-2012 are characterised by high values resulting from a very large surplus of revolving assets over short-term liabilities, low liabilities and a high net profit value. Let us observe, however, that in 2013 two models ((2) and (4)) responded completely with to an opposite sign. This was due to a loss from the operating activity and a very low value of net revenues from sales. It is seen that depending on their construction, models can react in completely opposite directions. It also shows that there is no single appropriate model that would anticipate all possible situations emerging in the company. If we look at the subsequent years: 2014-2017, we have a situation of alternating net losses and profits, increasing revenues from sales, significant increase in short-term liabilities, but also a growth in the company assets. Hence, depending on the specific categories of financial statements used in the calculation, the parameters of discriminatory models behave in this way as well. It should therefore be concluded that the classification of a company as threatened with bankruptcy does not yet prejudge it. One must first understand what the calculated parameters mean in the context of the structure of the model.
2. When comparing the unit and consolidated data, one can see that they differ from each other, although the group parameters present a more stable situation of the group as a whole. However, the importance of the parent company is less significant, as evidenced by the share of revenues from sales of the parent company in the revenues of the whole group. As shown in Table 21, the share was about 45% and began to decline. This means that the group activities are focused outside the parent company. If we look at the composition of the group in 2017, the consolidation covered twenty-two entities dealing with transport services, rental and property management, purchase and sales of immovable property, financial activities, production of rolling stock, manufacturing of vehicle spare parts, wholesale machinery and agricultural equipment sales. Thus, we can see that the discriminatory models applied to capital groups highlight the problem of transparency in the functioning of these groups. If the activities of the group are in a way hidden under cover of subsidiaries, it is much harder to understand the mechanisms operating in the group.

27
Table 21: Revenues of capital group GK-7 and parent company JD-7: Zastal SA.
2007 2008 2009 2010 2011 2012 2013 2014 2015 2016 2017
Capital group 20 527 21 490 17 842 18 965 18 243 24 371 21 652 26 441 35 341 51 217 58 159
Parent company 9 282 10 496 8 448 8 267 8 013 9 935 318 3 020 7 305 7 039 9 970
% 45.2% 48.8% 47.3% 43.6% 43.9% 40.8% 1.5% 11.4% 20.7% 13.7% 17.1%
Source: authors’ own material on the basis of financial data from the Notoria service, EMIS and selected published financial statements.
(3) Discriminatory models show a mixed situation of the parent company. This instability is also reflected in Figure 11, which shows the stock price fluctuations of Zastal S.A. If we look at the period 2015-2019, these fluctuations are really minimal and present rather a certain stagnation among investors. However, interestingly, the figures for 2011 and 2012 present a very good situation of the company. Point A shows the moment of publication of the data for 2011 (30.04.2012) and point B for 2012 (01.05.2013). However, when analysing these two moments, we do not see a direct response of investors to these (as it could seem) good financial data. This means that investors also take into account other financial or non-financial factors that determine their investment preferences.
Figure 11: Stock quotation graph of company JD-7: Zastal S.A. in the period 27.08.2007-21.05.2019
Source: https://www.bankier.pl/inwestowanie/profile/quote.html?symbol=ZASTAL (21.05.2019)
[GK-8]: Inter Groclin Auto S.A. (sector: car parts) Table 22: Application of discriminatory models for consolidated data of capital group GK-8 and parent company JD-8: Inter Groclin Auto S. A
Source: authors’ own material on the basis of financial data from the Notoria service, EMIS and selected published financial statements.
A B
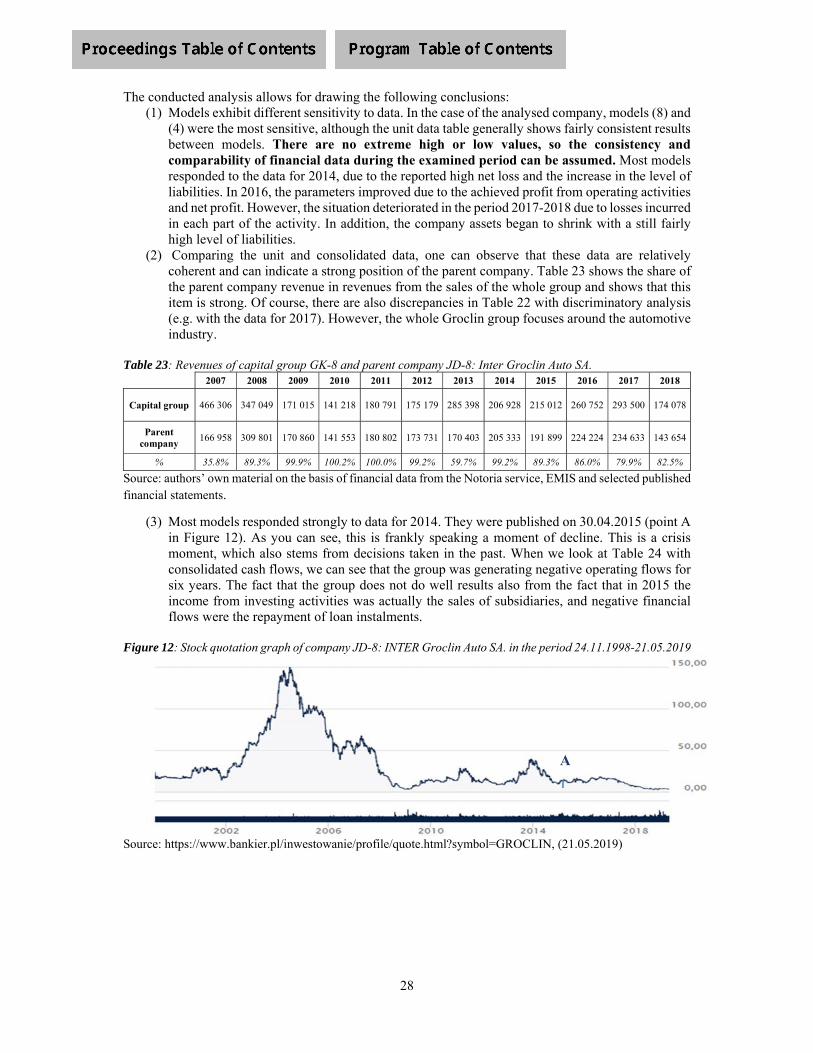
28
The conducted analysis allows for drawing the following conclusions: (1) Models exhibit different sensitivity to data. In the case of the analysed company, models (8) and
(4) were the most sensitive, although the unit data table generally shows fairly consistent results between models. There are no extreme high or low values, so the consistency and comparability of financial data during the examined period can be assumed. Most models responded to the data for 2014, due to the reported high net loss and the increase in the level of liabilities. In 2016, the parameters improved due to the achieved profit from operating activities and net profit. However, the situation deteriorated in the period 2017-2018 due to losses incurred in each part of the activity. In addition, the company assets began to shrink with a still fairly high level of liabilities.
(2) Comparing the unit and consolidated data, one can observe that these data are relatively coherent and can indicate a strong position of the parent company. Table 23 shows the share of the parent company revenue in revenues from the sales of the whole group and shows that this item is strong. Of course, there are also discrepancies in Table 22 with discriminatory analysis (e.g. with the data for 2017). However, the whole Groclin group focuses around the automotive industry.
Table 23: Revenues of capital group GK-8 and parent company JD-8: Inter Groclin Auto SA. 2007 2008 2009 2010 2011 2012 2013 2014 2015 2016 2017 2018
Capital group 466 306 347 049 171 015 141 218 180 791 175 179 285 398 206 928 215 012 260 752 293 500 174 078
Parent company
166 958 309 801 170 860 141 553 180 802 173 731 170 403 205 333 191 899 224 224 234 633 143 654
% 35.8% 89.3% 99.9% 100.2% 100.0% 99.2% 59.7% 99.2% 89.3% 86.0% 79.9% 82.5%
Source: authors’ own material on the basis of financial data from the Notoria service, EMIS and selected published financial statements.
(3) Most models responded strongly to data for 2014. They were published on 30.04.2015 (point A in Figure 12). As you can see, this is frankly speaking a moment of decline. This is a crisis moment, which also stems from decisions taken in the past. When we look at Table 24 with consolidated cash flows, we can see that the group was generating negative operating flows for six years. The fact that the group does not do well results also from the fact that in 2015 the income from investing activities was actually the sales of subsidiaries, and negative financial flows were the repayment of loan instalments.
Figure 12: Stock quotation graph of company JD-8: INTER Groclin Auto SA. in the period 24.11.1998-21.05.2019
Source: https://www.bankier.pl/inwestowanie/profile/quote.html?symbol=GROCLIN, (21.05.2019)
A

29
Table 24: Cash flows in capital group GK-8: Inter Groclin Auto Flows 2007 2008 2009 2010 2011 2012 2013 2014 2015 2016 2017 2018
operating -51 941 16 784 15 614 -3 758 -17 148 -3 658 -22 314 -2 315 -17 495 4 233 9 492 5 931
investment 5 824 17 378 19 928 9 601 12 902 -14 543 1 963 -10 534 103 461 -22 342 -15 829 41 473
financial 33 405 -34 982 -33 862 -10 105 -1 348 18 120 27 660 8 302 -54 370 10 687 -4 013 -57 307
Source: authors’ own material on the basis of financial data from the Notoria service, EMIS and selected published financial statements.
[GK-9]: Skotan S.A. (sector: fuels and gas – others)
Table 25: Application of discriminatory models for the consolidated data of capital group GK-9 and parent company JD-9: Skotan S. A.
Source: authors’ own material on the basis of financial data from the Notoria service, EMIS and selected published financial statements.
The conducted analysis allows for drawing the following conclusions: 1. Models, due to their construction, similarly react to numerical values. In the case of Skotan SA,
attention should be paid to two issues. Firstly, to the extremely low/high values of the calculated parameters that resulted from a very unstable activity of the company. It was characterized for example by very low sales revenues, zero cost of sold products or significant net losses. Secondly, the zero cost of the products sold hampered the calculation of many parameters – hence " n/a". Moreover, during the whole period considered, the company suffered a loss already at the level of net sales.
2. Comparing the unit and consolidated data, you will notice that the tables practically overlap, especially for the 2011 data. If we look at the share of the parent company revenue in the revenues from the sales of the group, we can see that since 2013 it has been only the revenue of the parent. Two subsidiaries were involved in the production of the petroleum refining product. It is interesting from the point of view of transparency of the group, especially if (as in 2008) the share of the parent company amounted to only 4.6%.
Table 26: Revenue capital group GK-9 and parent company JD-9: Skotan SA. 2007 2008 2009 2010 2011 2012 2013 2014 2015 2016 2017 2018 Capital group
407 336 467 560 1 508 1 015 0 0 1 727 628 636 1 289 3 187 3 499
Parent company
104 682 21 584 135 14 0 0 1 728 628 636 1 289 3 187 3 499
% 25,7% 4,6% 9,0% 1,4% 100,1% 100,0% 100,0% 100,0% 100,0% 100,0%
Source: authors’ own material on the basis of financial data from the Notoria service, EMIS and selected published
financial statements.
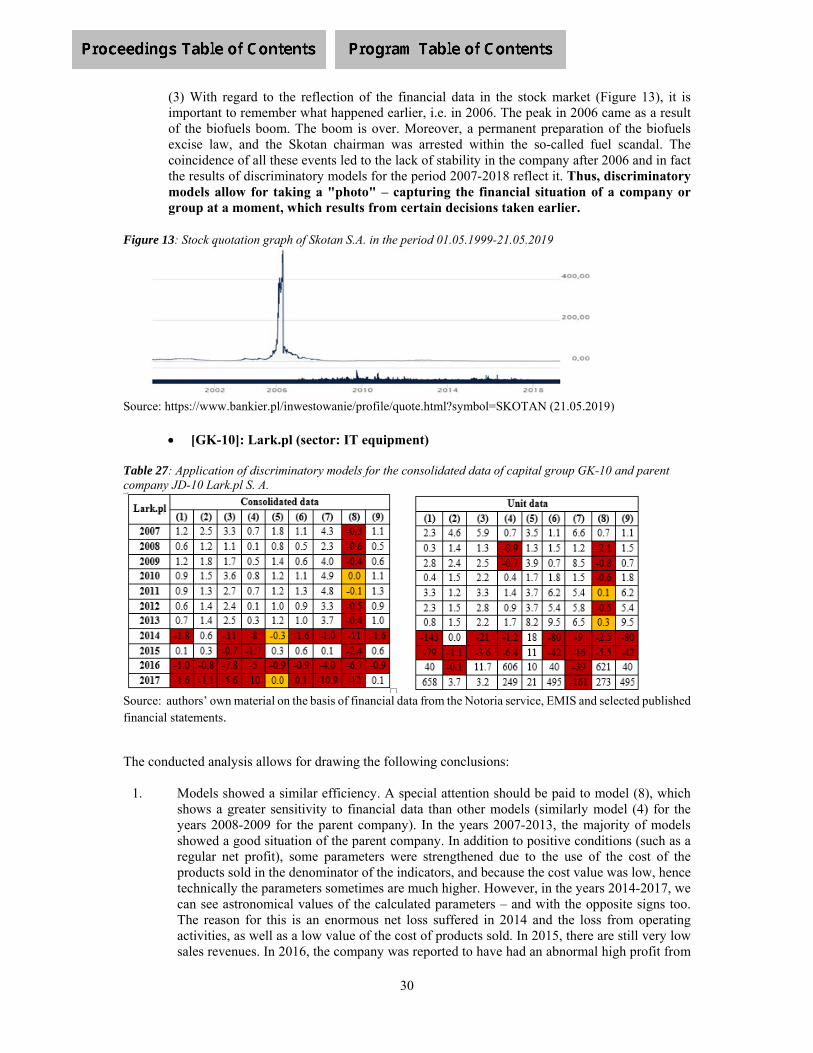
30
(3) With regard to the reflection of the financial data in the stock market (Figure 13), it is important to remember what happened earlier, i.e. in 2006. The peak in 2006 came as a result of the biofuels boom. The boom is over. Moreover, a permanent preparation of the biofuels excise law, and the Skotan chairman was arrested within the so-called fuel scandal. The coincidence of all these events led to the lack of stability in the company after 2006 and in fact the results of discriminatory models for the period 2007-2018 reflect it. Thus, discriminatory models allow for taking a "photo" – capturing the financial situation of a company or group at a moment, which results from certain decisions taken earlier.
Figure 13: Stock quotation graph of Skotan S.A. in the period 01.05.1999-21.05.2019
Source: https://www.bankier.pl/inwestowanie/profile/quote.html?symbol=SKOTAN (21.05.2019)
[GK-10]: Lark.pl (sector: IT equipment)
Table 27: Application of discriminatory models for the consolidated data of capital group GK-10 and parent company JD-10 Lark.pl S. A.
Source: authors’ own material on the basis of financial data from the Notoria service, EMIS and selected published financial statements.
The conducted analysis allows for drawing the following conclusions:
1. Models showed a similar efficiency. A special attention should be paid to model (8), which shows a greater sensitivity to financial data than other models (similarly model (4) for the years 2008-2009 for the parent company). In the years 2007-2013, the majority of models showed a good situation of the parent company. In addition to positive conditions (such as a regular net profit), some parameters were strengthened due to the use of the cost of the products sold in the denominator of the indicators, and because the cost value was low, hence technically the parameters sometimes are much higher. However, in the years 2014-2017, we can see astronomical values of the calculated parameters – and with the opposite signs too. The reason for this is an enormous net loss suffered in 2014 and the loss from operating activities, as well as a low value of the cost of products sold. In 2015, there are still very low sales revenues. In 2016, the company was reported to have had an abnormal high profit from
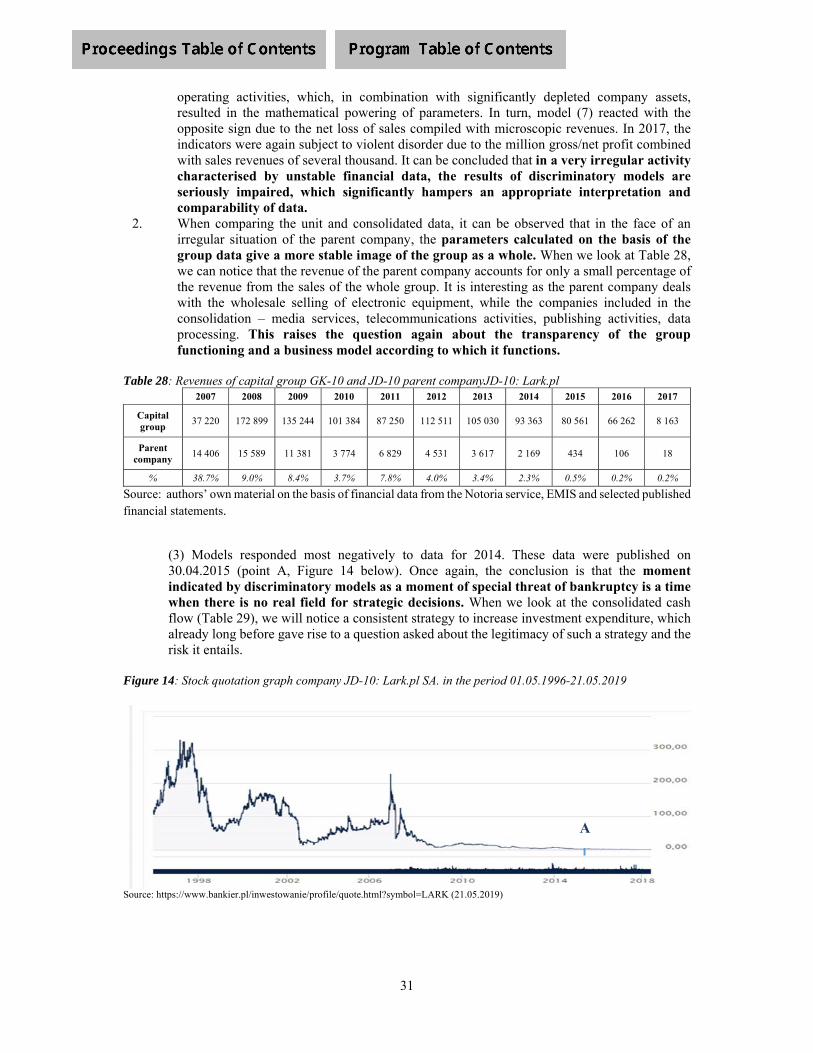
31
operating activities, which, in combination with significantly depleted company assets, resulted in the mathematical powering of parameters. In turn, model (7) reacted with the opposite sign due to the net loss of sales compiled with microscopic revenues. In 2017, the indicators were again subject to violent disorder due to the million gross/net profit combined with sales revenues of several thousand. It can be concluded that in a very irregular activity characterised by unstable financial data, the results of discriminatory models are seriously impaired, which significantly hampers an appropriate interpretation and comparability of data.
2. When comparing the unit and consolidated data, it can be observed that in the face of an irregular situation of the parent company, the parameters calculated on the basis of the group data give a more stable image of the group as a whole. When we look at Table 28, we can notice that the revenue of the parent company accounts for only a small percentage of the revenue from the sales of the whole group. It is interesting as the parent company deals with the wholesale selling of electronic equipment, while the companies included in the consolidation – media services, telecommunications activities, publishing activities, data processing. This raises the question again about the transparency of the group functioning and a business model according to which it functions.
Table 28: Revenues of capital group GK-10 and JD-10 parent companyJD-10: Lark.pl
2007 2008 2009 2010 2011 2012 2013 2014 2015 2016 2017
Capital group
37 220 172 899 135 244 101 384 87 250 112 511 105 030 93 363 80 561 66 262 8 163
Parent company
14 406 15 589 11 381 3 774 6 829 4 531 3 617 2 169 434 106 18
% 38.7% 9.0% 8.4% 3.7% 7.8% 4.0% 3.4% 2.3% 0.5% 0.2% 0.2%
Source: authors’ own material on the basis of financial data from the Notoria service, EMIS and selected published financial statements.
(3) Models responded most negatively to data for 2014. These data were published on 30.04.2015 (point A, Figure 14 below). Once again, the conclusion is that the moment indicated by discriminatory models as a moment of special threat of bankruptcy is a time when there is no real field for strategic decisions. When we look at the consolidated cash flow (Table 29), we will notice a consistent strategy to increase investment expenditure, which already long before gave rise to a question asked about the legitimacy of such a strategy and the risk it entails.
Figure 14: Stock quotation graph company JD-10: Lark.pl SA. in the period 01.05.1996-21.05.2019
Source: https://www.bankier.pl/inwestowanie/profile/quote.html?symbol=LARK (21.05.2019)
A

32
Table 29: Cash flow in capital group GK-10: Lark.pl
Flows 2007 2008 2009 2010 2011 2012 2013 2014 2015 2016 2017
operating -663 3 024 2 692 18 571 20 351 12 271 23 265 19 280 -806 -183 -775
investment -75 919 -30 139 -7 782 -15 294 -20 533 -39 708 -14 165 -6 705 -10 689 -799 23 209
financial 81 237 21 962 3 732 -5 885 3 106 23 803 -8 657 -13 574 9 980 431 -19 542
Source: authors’ own material on the basis of financial data from the Notoria service, EMIS and selected published financial statements.
7. Summary and conclusions
The conclusions to be drawn from the research refer to: A) discriminatory models themselves,
B) the use of these models for the purpose of capital groups, C) the use of models in the context of other possible reasons behind bankruptcy. In a synthetic form, the findings are as follows:
A. The use of discriminatory models as a method of bankruptcy prediction (1) The discriminatory models used in this work are characterised by varying degrees of
effectiveness, i.e. sensitivity to changes in financial data. This is mainly due to the construction of the model based on the selection of different indicators and categories of financial statements. The model that showed the greatest sensitivity to the variability of the financial data was model (8), i.e. the model of Błażej Prusak.
(2) Most models classify companies only in two categories – threatened by bankruptcy and not threatened by bankruptcy. As our study shows, such a breakdown may be ineffective if the models are also used as early warning systems. At the time of a high risk of bankruptcy, there is usually no longer many possibilities of maneuvering. Hence, there is a need for greater gradation as to the classification of the financial situation of companies.
(3) Discriminatory models signal problems but do not reveal their source. Therefore, there is a need to reach additional sources, e.g. financial statements, to determine the appropriate premises.
(4) The study shows that the greater the stability of the financial data, the greater the comparability of the parameters obtained. Abnormal fluctuations for example in sales revenues or the level of liabilities cause disturbances, and the calculated results present, depending on the model, extremely positive or negative values. Then it hampers the proper comparability of data and their analysis and interpretation. This may also indicate the instability of the analysed company itself.
(5) There is no single, perfect model able to anticipate all possible situations and always react properly. Therefore, it is best to use several models, preferably those whose constructions differ from each other. One should also be vigilant about the results that are excessively low or high. The basis is the understanding of which indicators the model consist.
(6) Discriminatory models allow for taking a "photo" – capturing the financial situation of a company or group at the time, resulting from certain decisions taken before.
(7) Discriminatory models show the state of bankruptcy threat, which is due to the financial and investment decisions that have been taken. However, the question arises as to how much these models actually warn against bankruptcy and how much they only inform about it.
B. Application of discriminatory models to capital groups
(1) Discriminatory models are a useful tool for assessing the financial situation of a capital group, as they allow you to look at a group as one entity. It appears that relying on the results of only one company (e.g. only the parent company) can lead to the misinterpretation of data.
(2) It is worth remembering that the greater the influence of the parent company on the level of financial activity generated, the closer the parameters calculated for consolidated data to those calculated for the parent company, which is quite obvious. Hence, when applying discriminatory models to capital groups, the results obtained should be combined with those for the parent company to determine its impact on the whole group.

33
(3) In order to interpret the calculated parameters for a group well, it is necessary to understand the model of business operation, i.e. subsidiaries comprising it and the subject of their activities. As the analysis shows, in some cases, there are concerns about their transparency, when revenue streams are in a way "under cover" of subsidiaries.
(4) Parameters calculated on the basis of group data give a more stable image of the group as a whole.
C. Application of discriminatory models in the context of other possible premises of bankruptcy
(1) As the research shows, the classification of an entity as threatened with bankruptcy does not imply an immediate collapse. Despite the parameters of poor financial condition, the company and the group can continue their business but it depends, among other factors, on the capital flow for this activity.
(2) Discriminatory models, despite the widespread assumption of an early warning function, proved to be detection models rather than preventive. As indicated by the bankruptcy prediction analysis of the stock quotations graphs, the hazard information on the threat is delayed, i.e. it appears at a time when the ship is already sinking. It means that investors also take into account other financial or non-financial factors that determine their investment preferences.
(3) The issue of a potential bankruptcy also depends on the determinants of the industry itself. (4) The company's financial health analysis should be based on data from several sources, which
will complement each other and allow for the earliest possible identification of threat. Discriminatory models operate on the principle of "litmus paper", but there are sources that can provide certain signals earlier, for example cash flow analysis.
(5) In order for discriminatory models to perform their warning function, they should be used at regular intervals (e.g. quarterly) in order to properly monitor the financial situation of the company and react in due time to emerging crisis moments. The extension of the classification of the bankrupt/non-bankrupt with additional warning zones could be helpful. (6) The company should be also viewed in a long-term horizon and in the context of the decisions made before, the consequences of which are being implemented now. (7) As the analysis shows, the deterioration of the financial situation of a company may also result from other factors such as the sudden collapse of a speculative bubble, legislative changes or personal issues. As it turned out, the publication of financial data was also not an impulse for example to buy shares.
The authors hope that the study and its findings objectivising the use of models of discriminatory analyses, in particular in application to capital groups, in the context of long-term analysis and analysis of the market determinants will be used to broaden the knowledge of the functioning of capital groups and their parent companies and to create new useful analytical approaches. The research and conclusions can be considered cognitively essential. Special research is rather seldom devoted to the analytical use of consolidated financial reporting.
REFERENCES
[1] Abraham Y., Sardais C., 2008, Will we learn from the bankruptcy of Barings Bank?, l’Ecole de Paris du management, report from Seminar Business Life, https://www.ecole.org/fr/844/VA040708-ENG.pdf (25.04.2019)
[2] Aczel D.A., 2000, Statystyka w zarządzaniu, PWN Warsaw [3] Appenzeller, D., Szarzec, K., 2004, Prognozowanie zagrożenia upadłością polskich spółek publicznych,
Rynek Terminowy, 1, 120‒128. [4] Bartkowiak P., 2011, Uwarunkowania prowadzenia strategii przedsiębiorstw in: E. Urbanowska-Sojkin
(ed.), Wybory strategiczne w przedsiębiorstwach – uwarunkowania, Zeszyty naukowe Uniwersytetu Ekonomicznego w Poznaniu, no. 169, Wydawnictwo Uniwersytetu Ekonomicznego w Poznaniu, Poznań
[5] Bodle K. A., Cybinski P.J., Monem R., Effect of IFRS adoption on financial reporting quality: Evidence from bankruptcy prediction, Accounting Research Journal, Vol. 29 Issue: 3, 2016, pp.292-312, https://doi.org/10.1108/ARJ-03-2014-0029;
[6] Bombiak E., 2010, Modele dyskryminacyjne jako metoda oceny sytuacji finansowej przedsiębiorstwa,
34
Zeszyty Naukowe Akademii Podlaskiej w Siedlcach, Seria: Administracja i Zarządzanie, no. 86. [7] Boratyńska K., 2009, Koszty bankructwa przedsiębiorstwa na świecie i w Polsce – przegląd
dotychczasowych badań, Zeszyty Naukowe SGGW - Ekonomika i Organizacja Gospodarki Żywnościowej, no. 178, Warsaw, pp.175-186
[8] Cabała P., 2008, Systemy wczesnego ostrzegania w przedsiębiorstwie, Wydawnictwo Uniwersytetu Ekonomicznego w Krakowie, Kraków za Krystek U., 1987, Unternehmungskriesen. Beschreibung, Vermeidung und Bewältigung uberlebenskritischer Prozesse in Unternehmungen, Gabler, Wiesbaden
[9] Directive 2013/34/EU of the European Parliament and of the Council of 26 June 2013 on the annual financial statements, consolidated financial statements and related reports of certain types of undertakings, amending Directive 2006/43/EC of the European Parliament and of the Council and repealing Council Directives 78/660/EEC and 83/349/EEC. Official Journal of the European Union L 182/1.
[10] Dziurski P., 2016, Branża fotografii analogowej – jak zwyciężyć i jak przegrać w konfrontacji z przełomową innowacją in: P. Dziurski, M. Romanowska (ed.), Anatomia kryzysu w przedsiębiorstwie, Oficyna Wydawnicza Szkoły Głównej Handlowej w Warszawie, Warsaw
[11] Fusaro P., Miller R. 2002, What went wrong at Enron: everyone’s guide to the largest bankruptcy in US history, John Wiley and Sons, Hoboken, N.J.
[12] Gajdka, J., Stos, D., 2003, Ocena kondycji finansowej polskich spółek publicznych w okresie 1998–2001. W: D. Zarzecki (ed.). Zarządzanie finansami: mierzenie wyników i wycena przedsiębiorstwa. T. 1. Szczecin: Uniwersytet Szczeciński. ISBN 83-89142-11-2
[13] Griffin R.W., 2013, Management: Principles and Practices, South-Western, Cengage Learning Publishing, Australia, Brazil, Japan, Korea, Mexico, Singapore, Spain, United Kingdom, United States
[14] Hadasik, D.,1998, Upadłość przedsiębiorstw w Polsce i metody jej prognozowania. Zeszyty Naukowe, Series 2: Prace Habilitacyjne, no. 158. Poznań: Wydawnictwo Akademii Ekonomicznej.
[15] Hamrol, M., Czajka, B., Piechocki, M., 2004b, Upadłość przedsiębiorstwa – model analizy dyskryminacyjnej.
[16] Hagdtrom R.G., 2007, Na sposób Warrena Buffeta, Seria: Klasyka biznesu na podstawie edycji MT Biznes 2007
[17] Hołda, A., 2001, Prognozowanie jednostki w warunkach gospodarki polskiej z wykorzystaniem funkcji dyskryminacyjnej, Rachunkowość, 5, 306‒310.
[18] Hołda, A. 2009, Wykorzystanie drzew decyzyjnych w prognozowaniu upadłości przedsiębiorstw branży budowlanej, Zeszyty Naukowe Uniwersytetu Ekonomicznego w Krakowie, no. 796
[19] Jeż. R, 2015, Sztuczne sieci neuronowe i ich zastosowanie w modelowaniu zjawisk gospodarczych, Zeszyty Naukowe Uniwersytetu Ekonomicznego w Katowicach, no. 217
[20] Kapferer J.N., 2014, The new strategic brand management: advanced insights and strategic thinking, Kogan Page, London, Philadelphia
[21] Kleinrok M., 2013, Specyfika przejęć przedsiębiorstw zagrożonych bankructwem, in: A. Adamska, E.Mączyńska (ed.), Upadłości, bankructwa i naprawa przedsiębiorstw. Wybrane zagadnienia. Oficyna Wydawnicza Szkoły Głównej Handlowej w Warszawie, Warsaw, pp. 357-371
[22] Kopczyński P., 2016, Prognozowanie upadłości spółek giełdowych, Akademia Zarządzania i Finansów, Wydawnictwo Uniwersytetu Łódzkiego, Łódź
[23] Kowalczyk K., 2011, Jak zachować płynność i zaufanie, Agro Trendy, sierpień-wrzesień 2012, pp.66-67 [24] Mączyńska, E., 1994, Ocena kondycji przedsiębiorstwa (uproszczone metody). Życie Gospodarcze, 38, 44. [25] Nogalski B., Ronkowski R., Podstawy funkcjonowania polskich grup kapitałowych oraz ich formy
organizacyjne i sposoby zarządzania, [in:] Nogalski B., Walentynowicz P., Zarządzanie w grupach kapitałowych. Aspekty organizacyjne, finansowe, właścicielskie i personalne, Wydawnictwo Wyższej Szkoły Administracji i Biznesu im. Eugeniusza Kwiatkowskiego w Gdyni, Gdynia 2004.
[26] Pierzchalska W.B., 2014, Analiza finansowa oraz modele przewidywania upadłości jako narzędzie oceny kondycji finansowej przedsiębiorstwa, Finanse i Prawo Finansowe 1/1,34-45, Muzeum Historii Polski
[27] Pociecha J. et al., 2014, Statystyczne metody prognozowania bankructwa w zmieniającej się koniunkturze gospodarczej, Uniwersytet Ekonomiczny w Krakowie, Kraków
[28] Pogodzińska, M., Sojak, S., 1995, Wykorzystanie analizy dyskryminacyjnej w przewidywaniu bankructwa przedsiębiorstw. Acta Universitatis Nicolai Copernici: Ekonomia, 25(299), 53‒61.
[29] Prusak, B., 2005, Nowoczesne metody prognozowania zagrożenia finansowego przedsiębiorstw, Warsaw: Difin. ISBN 83-7251-524-7
[30] Przegląd Organizacji, 6, 35–39 [31] Rybak M., 2008, Etyka biznesu a upadłość przedsiębiorstw w Polsce in: E. Mączyńska (ed.) Bankructwa
przedsiębiorstw. Wybrane aspekty instytucjonalne, Oficyna Wydawnicza Szkoły Głównej Handlowej w Warszawie, Warsaw, pp. 149-151
[32] Schalast Ch., Merter S.,2010, Der Unternehmersverkauf aus der Insolvenz – Chancen und Risiken, Frankfurt School Verlag, Franfurt

35
[33] Stecki L., Holding, Toruń 1995, pp. 64-65. [34] Śliwa J., Zarządzanie finansami w grupach kapitałowych, Wydawnictwo Naukowe Wydziału Zarządzania
Uniwersytetu Warszawskiego, Warsaw 2011, pp. 24-25; [35] Tłuczak A., 2013, Zastosowanie dyskryminacyjnych modeli przewidywania bankructwa do oceny ryzyka
upadłości przedsiębiorstw, Zeszyty Naukowe Wyższej Szkoły Bankowej we Wrocławiu, no. 2(34)/2013 [36] Trompenaars F., Coebergh P.H., 2015, 100+ Management Models. How to understand and apply the
world’s most powerful business tools, McGraw-Hill Education Publishing, New York, Chicago, San Francisco, Athens, London, Madrid, Mexico City, Milan, New Delhi, Singapore, Sydney, Toronto
[37] Wędzki D., 2005, Wielowymiarowa analiza bankructwa na przykładzie budownictwa, Badania operacyjne i decyzje, no. 2
[38] Wiankowski S., Bogusławski Z., Borzęcki J., Karmańska A., Zarządzanie grupą kapitałową. Analiza i projektowanie rozwiązań organizacyjnych, Orgmasz, 1999a, p.19.
[39] Wiankowski S., Bogusławski Z., Borzęcki J., Karmańska A., Zarządzanie grupą kapitałową, Instytut Organizacji i Zarządzania w Przemyśle ORGMASZ, Warsaw, 1999b.
[40] Wieczerzyńska B. 2009, Kryzys w przedsiębiorstwie, CeDeWu.pl Wydawnictwa Fachowe, Warsaw [41] Wierzba, D., 2000, Wczesne wykrywanie przedsiębiorstw zagrożonych upadłością na podstawie analizy
wskaźników finansowych – teoria i badania empiryczne. Zeszyty Naukowe Wyższej Szkoły Ekonomiczno- Informatycznej w Warszawie, 9, 79‒105.
[42] Wojnar J., 2014, Ocena skuteczności modeli analizy dyskryminacyjnej do prognozowania zagrożenia finansowego spółek giełdowych, Zeszyty Naukowe Małopolskiej Wyższej Szkoły Ekonomicznej w Tarnowie, vol. 24, no. 1, Tarnów
[43] Wojtunik M., Draczyński B., Zarządzanie holdingiem i grupą kapitałową, ODDK, Gdańsk 1997, p. 30.
1
EFFECT OF CULTURAL AND HISTORICAL EVENTS ON INNOVATION OF LIFE INSURANCE MARKET – BRIEF DISCUSSION ON POLISH CASE
Adam Sliwinski
Warsaw School of Economics Poland
ABSTRACT
The aim of the paper is an introduction of new research on innovation of life insurance market. The research question consider that the innovativeness of life insurance market in post-communist countries is significantly determined by cultural and historical development. The question would be answer based on Polish case. Polish life insurance market is the biggest among other countries in the region. According to the author, cultural and historical events in post-communist countries delayed and blocked innovativeness of the markets. The historical development of life insurance market in Poland is described in that context with stress on factors that are significant to answer the research question. The paper aims to present history of life insurance market in Poland. The development of life insurance market is described from the very beginning form of insurance to present times. Nowadays Polish life insurance market is one of the biggest among all markets in transition countries. The market went through a few milestones. From the very beginning when the insurance products were offered based on mutual idea through centrally planned economy up to developed free, commercial market with the presence of the biggest world’s players. The impact of the market on the economy of CEE region is also described. The basic data are presented and analyzed include the following: gross written premium, subscribed capital, FDI, number of insurance entities. The paper ends with the conclusions concern unique shape of life insurance market in Poland and historical events that influence the development of the market in terms of its innovativeness. Keywords: Insurance history, life insurance, market development JEL Classification: D02, G22
2
Introduction
Life insurance (assurance) is an financial tool known form ancient times. Development of life
insurance is strictly connected with progress of actuarial sciences. It is science cannot remain
stationary. It is changing all the time throughout the historical events and market
transformations. Although the science fundaments of life insurance are stable the tool and the
market have changed a lot from it is first forms. The paper aims to present history of life
insurance market in Poland. The Polis case is very evident how the life insurance market
changes based on historical events. The development of life insurance market in Poland is
described from the very beginning form of insurance to present times. Nowadays Polish life
insurance market is one of the biggest among all markets in transition countries. The market
went through a few milestones. From the very beginning when the insurance products were
offered based on mutual idea through centrally planned economy up to developed free,
commercial market with the presence of the biggest world’s players. The impact of the market
on the economy of CEE region is also described. The basic data are presented and analyzed
include the following: gross written premium, claims ratio, profitability ratios and some
macroeconomics indicators like penetration and density of life insurance. Macroeconomics
indicators are presented in comparison to main EU markets ratios. The paper ends with the
conclusions concern further development of life insurance market in Poland.
The development of Polish life insurance sector
By some researchers Polish life insurance market is still regarded as an emerging
market. According to author the transition period ended at the turn between 2005 and 2006
when the gross written premium from life insurance accounted for more than 50% in total
market premium. According to some literature review and the experts’ opinions author assume
that after that pint in time the market should be treated as developed. However when we
compare it to mature western European markets, for example the British, we can assume that
the Polish market still should be regarded as rather small. The number of life insurance
companies active on Polish market at the end of 2018 is equal 26 (including two in the form of
mutual societies). There are also 8 branches of life. However, during the thirty years of its
transformation from centrally planned economy to free market the Polish insurance market
experienced three huge events, which undoubtedly had a significant impact on its shape and
performance.

3
First event was connected to implementation of a new insurance law in July 1990. The
main idea of which was to allow private and foreign investors to invest in the Polish insurance
market. Since 1990 they have been able to open insurances companies. At that time the market
was dominated by two main State-owned insurance companies (PZU and Warta).
Nevertheless, July 1990 was the starting point in the creation of a new, free Polish insurance
market. From that point in time new market emerged. Communism time was not so conductive
for individual life policies. Such a policies were treated as a products for wealthy individuals.
That was not in line with the main idea of polish government according to which the
government should look after working class people by delivering theoretically equal services.
We cannot state that during communism time the life insurance market was not present in
Poland. During that time group policies emerged. However it is quite difficult to analyze the
period owe to the fact that there is lack of separate life insurance statistics. I will come back
to that period later on in the text.
The second huge event was European integration in May 2004, which ultimately opened
up the market. At present, according to the three main pillars of integration included in the
Treaty of Rome, European companies are able to open branches or subsidiaries in Poland
without permission or a license from the Insurance Supervision Committee. The influence of
EU integration is clearly visible in terms of foreign investments (look figure 2). The foreign
investment after 2004 speed down rapidly. Since there is no need for separate license there is
no need for creating a separate entity.
The third event has taken place in 2016 when the new Solvency II regime has been
introduced. Solvency II impose a number of new activities which changed the behavior of
insurers. In author opinion Solvency II regime influence especially investment linked products
within life insurance branch.
The fact that the Polish market is still one of the biggest among the other post-
communist countries is also good justification for studying the market and its history. On the
other hand, during the transition period the Polish insurance market underwent significant
changes, particularly to ownership structure. For example, domestic capital accounted for 75%
in total subscribed capital in 1991. During the period of 15 years of transition (to 2005) the
share of domestic capital decreased to only 22,82%. The decrease in the level of domestic
capital has been gradual. However, we can assume that the change is significant. The growth
is very remarkable especially when considering changes in the life insurance sector, where the
number of companies increased almost eight and half times in the period of 15 years of
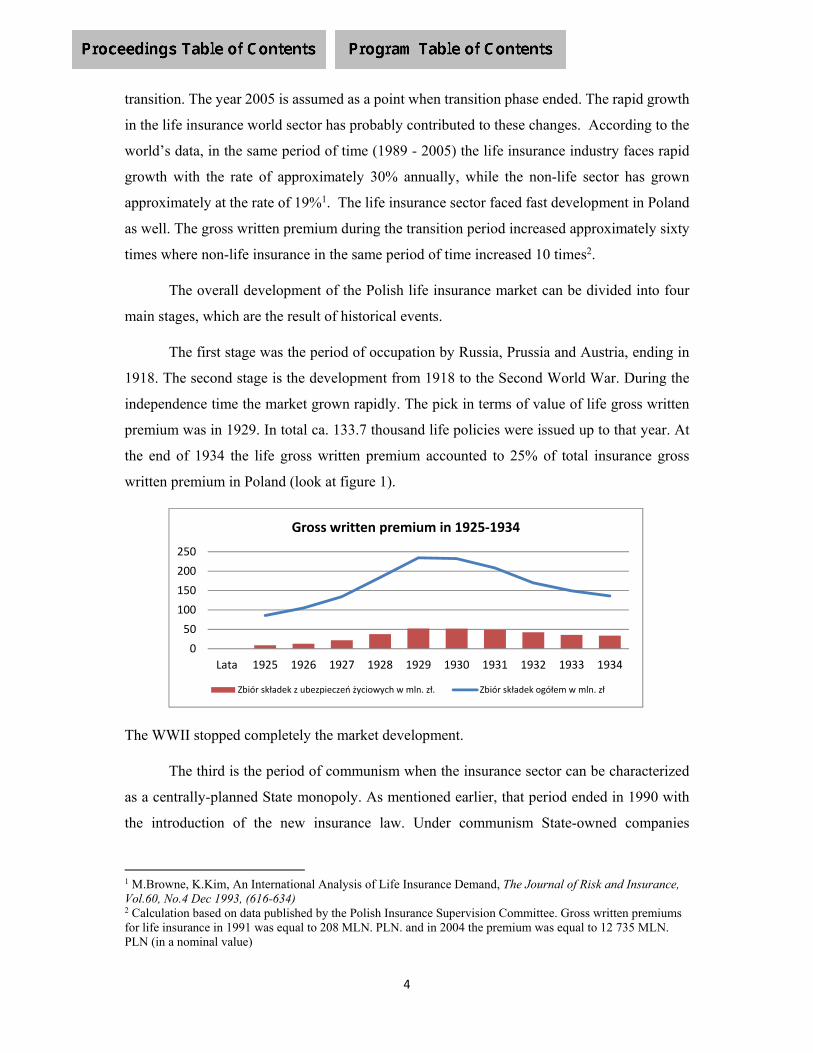
4
transition. The year 2005 is assumed as a point when transition phase ended. The rapid growth
in the life insurance world sector has probably contributed to these changes. According to the
world’s data, in the same period of time (1989 - 2005) the life insurance industry faces rapid
growth with the rate of approximately 30% annually, while the non-life sector has grown
approximately at the rate of 19%1. The life insurance sector faced fast development in Poland
as well. The gross written premium during the transition period increased approximately sixty
times where non-life insurance in the same period of time increased 10 times2.
The overall development of the Polish life insurance market can be divided into four
main stages, which are the result of historical events.
The first stage was the period of occupation by Russia, Prussia and Austria, ending in
1918. The second stage is the development from 1918 to the Second World War. During the
independence time the market grown rapidly. The pick in terms of value of life gross written
premium was in 1929. In total ca. 133.7 thousand life policies were issued up to that year. At
the end of 1934 the life gross written premium accounted to 25% of total insurance gross
written premium in Poland (look at figure 1).
The WWII stopped completely the market development.
The third is the period of communism when the insurance sector can be characterized
as a centrally-planned State monopoly. As mentioned earlier, that period ended in 1990 with
the introduction of the new insurance law. Under communism State-owned companies
1 M.Browne, K.Kim, An International Analysis of Life Insurance Demand, The Journal of Risk and Insurance, Vol.60, No.4 Dec 1993, (616-634) 2 Calculation based on data published by the Polish Insurance Supervision Committee. Gross written premiums for life insurance in 1991 was equal to 208 MLN. PLN. and in 2004 the premium was equal to 12 735 MLN. PLN (in a nominal value)
0
50
100
150
200
250
Lata 1925 1926 1927 1928 1929 1930 1931 1932 1933 1934
Gross written premium in 1925‐1934
Zbiór składek z ubezpieczeń życiowych w mln. zł. Zbiór składek ogółem w mln. zł
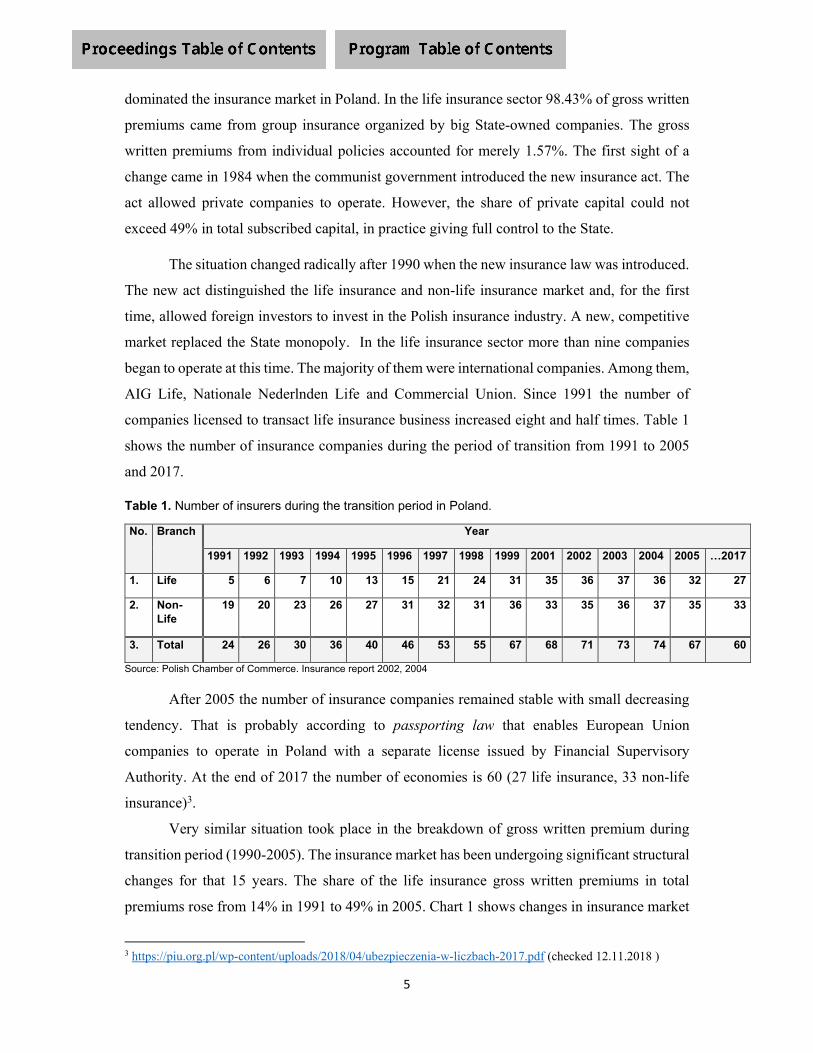
5
dominated the insurance market in Poland. In the life insurance sector 98.43% of gross written
premiums came from group insurance organized by big State-owned companies. The gross
written premiums from individual policies accounted for merely 1.57%. The first sight of a
change came in 1984 when the communist government introduced the new insurance act. The
act allowed private companies to operate. However, the share of private capital could not
exceed 49% in total subscribed capital, in practice giving full control to the State.
The situation changed radically after 1990 when the new insurance law was introduced.
The new act distinguished the life insurance and non-life insurance market and, for the first
time, allowed foreign investors to invest in the Polish insurance industry. A new, competitive
market replaced the State monopoly. In the life insurance sector more than nine companies
began to operate at this time. The majority of them were international companies. Among them,
AIG Life, Nationale Nederlnden Life and Commercial Union. Since 1991 the number of
companies licensed to transact life insurance business increased eight and half times. Table 1
shows the number of insurance companies during the period of transition from 1991 to 2005
and 2017.
Table 1. Number of insurers during the transition period in Poland.
No. Branch Year
1991 1992 1993 1994 1995 1996 1997 1998 1999 2001 2002 2003 2004 2005 …2017
1. Life 5 6 7 10 13 15 21 24 31 35 36 37 36 32 27
2. Non-Life
19 20 23 26 27 31 32 31 36 33 35 36 37 35 33
3. Total 24 26 30 36 40 46 53 55 67 68 71 73 74 67 60
Source: Polish Chamber of Commerce. Insurance report 2002, 2004
After 2005 the number of insurance companies remained stable with small decreasing
tendency. That is probably according to passporting law that enables European Union
companies to operate in Poland with a separate license issued by Financial Supervisory
Authority. At the end of 2017 the number of economies is 60 (27 life insurance, 33 non-life
insurance)3.
Very similar situation took place in the breakdown of gross written premium during
transition period (1990-2005). The insurance market has been undergoing significant structural
changes for that 15 years. The share of the life insurance gross written premiums in total
premiums rose from 14% in 1991 to 49% in 2005. Chart 1 shows changes in insurance market
3 https://piu.org.pl/wp-content/uploads/2018/04/ubezpieczenia-w-liczbach-2017.pdf (checked 12.11.2018 )
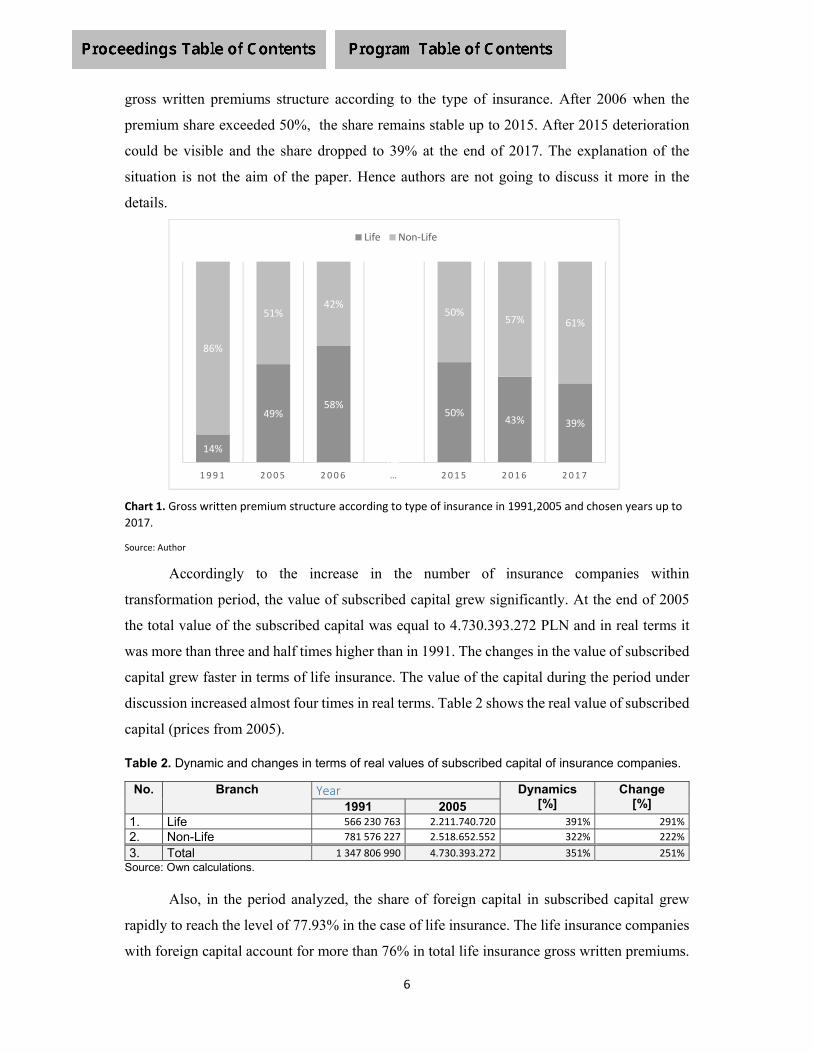
6
gross written premiums structure according to the type of insurance. After 2006 when the
premium share exceeded 50%, the share remains stable up to 2015. After 2015 deterioration
could be visible and the share dropped to 39% at the end of 2017. The explanation of the
situation is not the aim of the paper. Hence authors are not going to discuss it more in the
details.
Chart 1. Gross written premium structure according to type of insurance in 1991,2005 and chosen years up to
2017.
Source: Author
Accordingly to the increase in the number of insurance companies within
transformation period, the value of subscribed capital grew significantly. At the end of 2005
the total value of the subscribed capital was equal to 4.730.393.272 PLN and in real terms it
was more than three and half times higher than in 1991. The changes in the value of subscribed
capital grew faster in terms of life insurance. The value of the capital during the period under
discussion increased almost four times in real terms. Table 2 shows the real value of subscribed
capital (prices from 2005).
Table 2. Dynamic and changes in terms of real values of subscribed capital of insurance companies.
No. Branch Year Dynamics [%]
Change[%] 1991 2005
1. Life 566 230 763 2.211.740.720 391% 291%
2. Non-Life 781 576 227 2.518.652.552 322% 222%
3. Total 1 347 806 990 4.730.393.272 351% 251%
Source: Own calculations.
Also, in the period analyzed, the share of foreign capital in subscribed capital grew
rapidly to reach the level of 77.93% in the case of life insurance. The life insurance companies
with foreign capital account for more than 76% in total life insurance gross written premiums.
14%
49%58%
0%
50%43% 39%
86%
51%42%
0%
50%57% 61%
1991 2005 2006 … 2015 2016 2017
Life Non‐Life
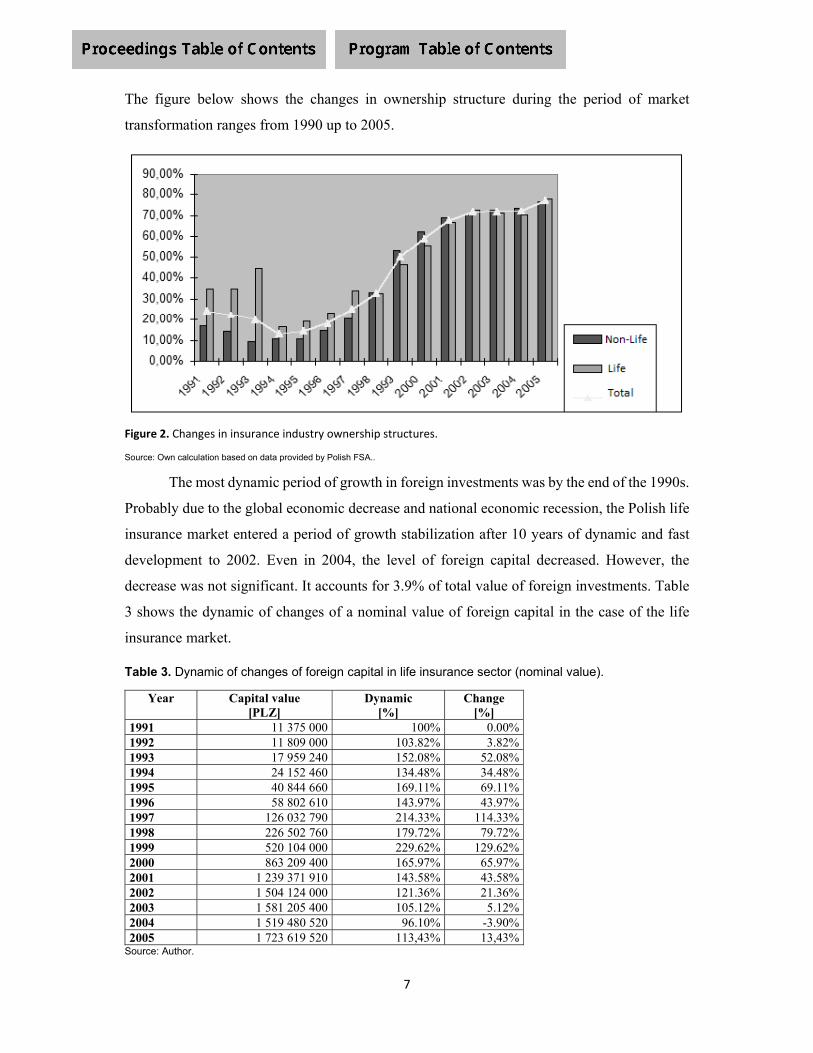
7
The figure below shows the changes in ownership structure during the period of market
transformation ranges from 1990 up to 2005.
Figure 2. Changes in insurance industry ownership structures.
Source: Own calculation based on data provided by Polish FSA..
The most dynamic period of growth in foreign investments was by the end of the 1990s.
Probably due to the global economic decrease and national economic recession, the Polish life
insurance market entered a period of growth stabilization after 10 years of dynamic and fast
development to 2002. Even in 2004, the level of foreign capital decreased. However, the
decrease was not significant. It accounts for 3.9% of total value of foreign investments. Table
3 shows the dynamic of changes of a nominal value of foreign capital in the case of the life
insurance market.
Table 3. Dynamic of changes of foreign capital in life insurance sector (nominal value).
Year Capital value [PLZ]
Dynamic [%]
Change [%]
1991 11 375 000 100% 0.00%1992 11 809 000 103.82% 3.82%1993 17 959 240 152.08% 52.08%1994 24 152 460 134.48% 34.48%1995 40 844 660 169.11% 69.11%1996 58 802 610 143.97% 43.97%1997 126 032 790 214.33% 114.33%1998 226 502 760 179.72% 79.72%1999 520 104 000 229.62% 129.62%2000 863 209 400 165.97% 65.97%2001 1 239 371 910 143.58% 43.58%2002 1 504 124 000 121.36% 21.36%2003 1 581 205 400 105.12% 5.12%2004 1 519 480 520 96.10% -3.90%2005 1 723 619 520 113,43% 13,43%
Source: Author.
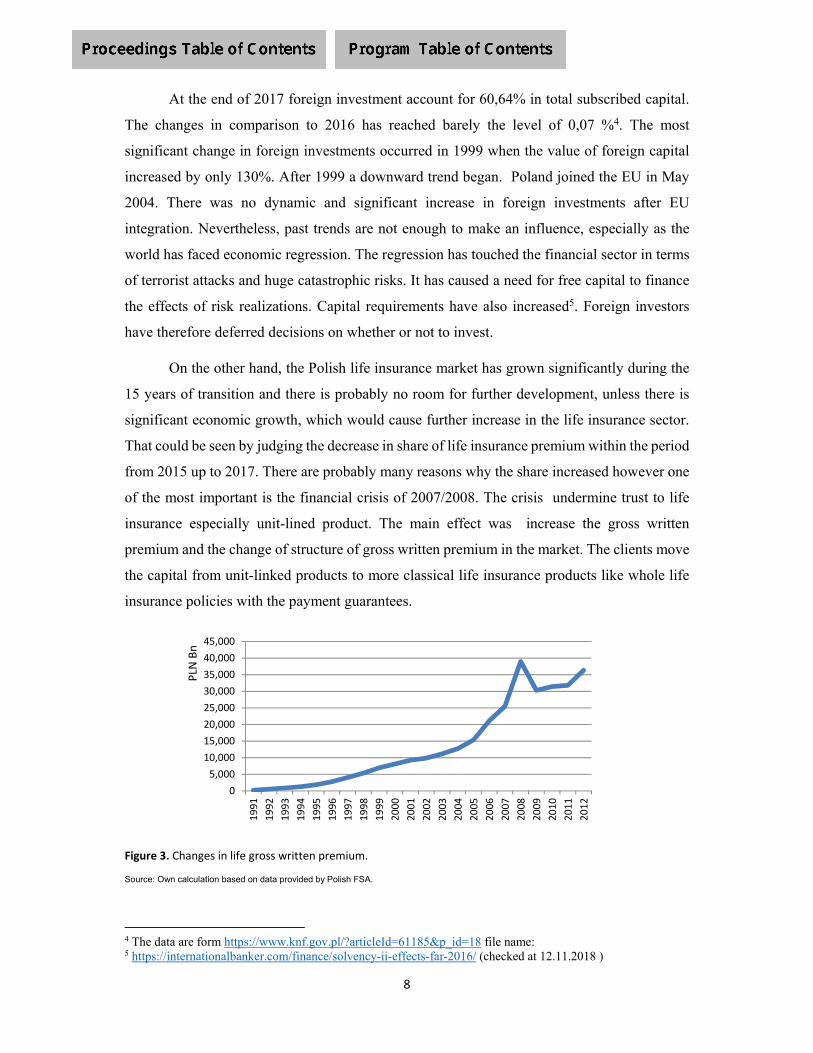
8
At the end of 2017 foreign investment account for 60,64% in total subscribed capital.
The changes in comparison to 2016 has reached barely the level of 0,07 %4. The most
significant change in foreign investments occurred in 1999 when the value of foreign capital
increased by only 130%. After 1999 a downward trend began. Poland joined the EU in May
2004. There was no dynamic and significant increase in foreign investments after EU
integration. Nevertheless, past trends are not enough to make an influence, especially as the
world has faced economic regression. The regression has touched the financial sector in terms
of terrorist attacks and huge catastrophic risks. It has caused a need for free capital to finance
the effects of risk realizations. Capital requirements have also increased5. Foreign investors
have therefore deferred decisions on whether or not to invest.
On the other hand, the Polish life insurance market has grown significantly during the
15 years of transition and there is probably no room for further development, unless there is
significant economic growth, which would cause further increase in the life insurance sector.
That could be seen by judging the decrease in share of life insurance premium within the period
from 2015 up to 2017. There are probably many reasons why the share increased however one
of the most important is the financial crisis of 2007/2008. The crisis undermine trust to life
insurance especially unit-lined product. The main effect was increase the gross written
premium and the change of structure of gross written premium in the market. The clients move
the capital from unit-linked products to more classical life insurance products like whole life
insurance policies with the payment guarantees.
Figure 3. Changes in life gross written premium.
Source: Own calculation based on data provided by Polish FSA.
4 The data are form https://www.knf.gov.pl/?articleId=61185&p_id=18 file name: 5 https://internationalbanker.com/finance/solvency-ii-effects-far-2016/ (checked at 12.11.2018 )
0
5,000
10,000
15,000
20,000
25,000
30,000
35,000
40,000
45,000
1991
1992
1993
1994
1995
1996
1997
1998
1999
2000
2001
2002
2003
2004
2005
2006
2007
2008
2009
2010
2011
2012
PLN
Bn

9
As it is shone on figure 3 the premium dropped rapidly after 2008 owe to the financial
crisis. After that the premium has started to recover however the structure of the market
changed. The share of unit-linked insurance rapidly got down in favor of the whole life
insurance (look figure 4).
Figure 4. Changes in life gross written premium.
Source: Own calculation based on data provided by Polish FSA.
Conclusions
The history of Polish life insurance is very interesting and worth to study. The market
undergone a huge transformation from the state monopoly where merely was no market to one
of the biggest among Central and Easter European markets with the presents of the biggest
world’s players. Life insurance market history in Poland is also connected to the development
of actuarial science and insurance education. In that filed the contribution of Warsaw School
of Economics is invaluable. Warsaw School of Economics is one of the first university where
the subject of insurance end actuarial science has been promoted. The first insurance faculty
was created in 1915. The faculty was created by notable insurance individuals from business
and academic sectors. Historical and cultural events through times influence the shape of polish
life insurance market which is now quite unique amongst the other CEE markets. The
uniqueness applies to market structure, products offered and level of FDI and the role of the
market in creation of economic growth.
0.0
20.0
40.0
60.0
80.0
100.0
120.0
2005 2006 2007 2008 2009 2010
Reasekuracja czynna
Grupa V. Ub. wypadkowe
Grupa IV. Ub. rentowe
Grupa III. UFK
Grupa II. Ub. posagowe
Grupa I. Ub. na życie

10
REFERENCE
Browne M., Kim K., An International Analysis of Life Insurance Demand, The Journal of Risk
and Insurance, Vol.60, No.4 Dec 1993, (616-634)
Dyrekcja Ubezpieczeń, 1853, Zbiór urządzeń i wiadomości tyczących się zabezpieczeń na życie
(A collection of devices, and the message property security life), 1853, Drukarnia
Stanisława Strąbskiego, Warszawa.
Śliwiński A., Ryzyko ubezpieczeniowe. Taryfy – budowa i optymalizacja (Insurance Risk,
Premium – construction and optimization), Poltext, Warszawa 2002
Śliwiński A., Michalski T., Rószkiewicz M., Demand for Life Insurance – An Empirical
Analysis in the Case of Poland, ,,The Geneva Papers on Risk and Insurance – Issues
and Practice” 2013, Vol. 38 (1), s. 62–87.
Śliwiński A., Michalski T., Karmańska A., Innovations in Risk Management as Exemplified by
the Polish Insurance Market, ,,Journal of Reviews on Global Economics” 2013, No. 2,
s. 407–415
Śliwiński A., Karmańska A., Michalski T., Insurance Innovation Assessment Model – Process
Based Approach (Part I), ToKnowPress, Bangkok 2015 (ISBN 978-961-6914-13-0)
Śliwiński A., Karmańska A., Michalski T., An Insurer’s Innovation Appraisal Model –
Processes Approach (Part II), ToKnowPress, Bangkok 2016 (ISBN 978-961-6914-16-
01)
Śliwiński A, Karmańska A., Michalski A., Insurance Innovation Assessment Model: Reference
Object Application Techniques (Part III), Management Challenges in a Network
Economy: Proceedings of the Make Learn and TIIM International Conference 2017
(ISSN 2232-3309), s. 659–664
Śliwiński A., Karmańska A., Michalski T., European Insurance Markets in Face of Financial
Crisis: Application of Learning Curve Concept as a Tool of Insurance Products
Innovation – Discussion, ,,Journal of Reviews on Global Economics” 2017, Vol. 2
(ISSN 1929-7092), s. 404–419; DOI:10.6000/1929-7092.2017.06.42 (data
dostępu:28.03.2019)

1
CORRUPTION AND AUDITOR CHOICE: A CROSS-COUNTRY INVESTIGATION
Rong-Ruey Duh (Corresponding author) National Taiwan University
Taiwan [email protected]
Chunlai Ye
Texas A&M International University U.S.A.
Lin-Hui Yu National Taiwan University
Taiwan [email protected]
ABSTRACT
The purpose of this study is to examine whether the corruption level of a country is associated with the decision to choose Big 4 versus non-Big 4 auditors. In addition, we examine whether firms cross-listing in a country with a corruption level different from the home country are more likely to appoint Big 4 auditors. Based on a sample of 185,549 firm-year observations from 78 countries over 2003–2012, panel regression analysis is used to investigate the research questions. We find a negative association between corruption and the propensity to hire Big 4 auditors and that cross-listed firms are more likely to hire Big 4 auditors than their domestic counterparts. Interestingly, we find that when firms cross-list in less corrupt countries relative to their home countries, firms are more likely to hire Big 4 auditors. However, this tendency disappears when firms cross-list in more corrupt countries. Finally, we find that Big 4 auditors in corrupt countries are more likely to issue a qualified/adverse opinion or to disclaim an opinion.
Keywords: Corruption; Auditor choice; Cross-list; Political economy Data Availability: Data used in this study are available from public sources identified in the
study.
2
1. Introduction
Transparency International defines corruption as the abuse of entrusted power in bureaucratic
and political institutions for private gain, and indicates that bribery and secret dealings are
common practices in countries with high levels of corruption.1 Corruption has negative effects on
the capital market, as high-level government officials can distort and manipulate policies to
maximize their personal benefit, leading to misallocation of financial resources. Corruption
continues to hurt societies around the world (Rose-Ackerman, 1997, 2011) and its cost to
societies is huge.2 Because of its huge impact, prior research examines how public sector
corruption affects firm behavior and capital markets.3 For example, Asiedu and Freeman (2009)
find that the corruption level in a country is negatively associated with firm-level investment
growth in so-called Transition countries. Di Guardo et al. (2016) find that the corruption level in
a host country affects the ownership strategy in cross-border mergers and acquisition. Blau
(2017) finds that corruption has a negative impact on the liquidity of American depositary
receipts (ADR) in stock markets.4 Motivated by these studies suggesting that corruption can
affect firm behavior, we examine the role that corruption plays in firms’ decisions to choose Big
4 versus non-Big 4 auditors. This research question is important because while corruption is
characterized by opaqueness and presents serious threats to corporate internal controls and
1 Transparency International (TI) is a non-governmental organization dedicated to fighting corruption. Each year, Transparency International publishes a corruption index based on surveys of business people and country analysts. For more details about the definition of corruption, please visit http://www.transparency.org/files/content/tool/2008_CPI_FAQs_EN.pdf 2 Kaufmann (2005) estimates the costs of global corruption to be one trillion dollars. Based on this estimate, Hameed et al. (2014) estimate the costs to be 1.16 trillion dollars in 2012 and indicate that the 105 economies in their study contribute 44% of global corruption, while these countries account for only 22% of global GDP. 3 Public sectors, which include bureaucratic and political institutions, are controlled by the State, whereas private sectors are run by private individuals or groups. 4 Sequeira and Djankov (2014) use bribe payments to port officials as proxies for corruption and find that firms respond to different types of corruption by utilizing different levels of public services at two ports in Southern Africa.
3
shareholders’ wealth, auditing is designed to operate in opposition to it and to promote
transparency and good governance. 5
Prior literature documents that firms’ auditor choices are associated with country-level
characteristics such as investor protection (Choi and Wong, 2007) and a secretive national
culture (Hope et al., 2008). While Choi and Wong (2007) examine firms in 38 countries from
1993 to 1998 and document that the governance role of Big 4 auditors substitutes for investor
protection mechanisms in countries with a poor legal environment, the evidence seems to be
confined to the Big 4 auditors’ governance role and the results are based on a sample that is
dated. While Hope et al. (2008) document a negative association between a secretive culture
(that is, a cultural attribute) and the choice of a Big 4 audit firm, whether the corruption level of
bureaucratic institutions (that is, a government attribute) also plays a role in the decision to
choose a Big 4 auditor remains an unanswered question.6
The role of Big 4 auditors is important in corrupt countries as people expect that auditors
serve as corporate police officers in deterring corporate fraud. However, prior research may not
fully support people’s perception. Uecker, Brief, and Kinney (1981) conduct an experiment and
find that aggressive external auditors may not deter corporate fraud, arguably because Uecker et
al. (1981) do not consider the corruption levels of bureaucratic institutions. In fact, the likelihood
of committing corporate fraud and audit quality are both related to the corruption level of a
5 The Foreign Corrupt Practices Act (FCPA) passed by the U.S. Congress in 1977 makes it unlawful to bribe foreign officials and requires an internal control system sufficient to maintain accurate books and records. Maher (1981) examines the impact of the FCPA and finds that firms did not increase their levels of internal control in response, but rather expended more resources on “proving” compliance with the legislation. Lyon and Maher (2005) find that auditors perceive bribe-paying firms to have higher risk and thus charge such firms higher audit fees. 6 Houqe et al. (2012) examine how government quality affects the decision to hire external auditors using an integrated score of government quality per Kaufmann, Kraay, & Mastruzzi (2007). However, they focus more on the interaction effect between IFRS adoption and government quality. We note that in their robustness tests, Houqe et al. (2012) replace their government quality proxy with the corruption index from Transparency International but include fewer control variables and do not address endogeneity concerns. They also do not discuss cross-listing firms and do not examine whether Big 4 auditors are more or less likely to issue unfavorable opinions.

4
country. Klitgaard (1988) points out that governments in more corrupt countries have more
discretion in interpreting laws. Thus, managers are more likely to commit fraud and, through
bribes and secret dealings, expect not to get penalized. Consistent with this view, Healy and
Serafeim (2016) find that a firm’s self-reported anticorruption effort is positively related to the
hiring of Big 4 auditors and home country corruption enforcement. However, their focus is on
the determinants and consequences of corporate self-reported anticorruption effort, but not the
association between country-level corruption and a firm’s choice of Big 4 auditors. Further, their
sample is confined to the year of 2007 and to 480 firms from 31 countries with certain
attributes.7 Thus, to gain a more complete understanding about how a firm’s choice of a Big 4
auditor is associated with the corruption level of the country in which the firm operates requires a
more direct examination with more countries and longer periods as the sample.
We choose our sample covering 78 countries over 2003–2012 and use the annually-
updated corruption data provided by Transparency International. The choice of this research
design is advantageous for the following reasons. First, the substantial variation in corruption
levels in our sample enables us to examine whether the quality of government affects managers’
perception of auditors as deterrents of corporate fraud. Second, the literature on investor
protection has not been substantially updated since La Porta et al. finished the investor protection
index in 1998. However, the effect of corruption is not static, as political systems change over
time (Pagano and Volpin, 2005). Sandholtz and Gray (2003) document that greater degrees of
international integration can lower a country’s corruption level. Changing political environments
warrant analyses using a more recent sample and a frequently updated index to capture the
7 Their initial sample comes from Transparency International’s 500 leading firms selected from Forbes’ March 2007 Global 2000 that represent largest listed companies (250), companies from high-risk sectors (107), and companies from the top 25 global exporting countries (143).
5
temporal differences in country-level attributes. Third, cross-listing in other countries has
become more popular in the past decades. In our sample, only 3.40% of total assets are owned by
cross-listing firms in 2003 and that this percentage keeps increasing. In 2012, the last year of our
sample, 5.51% of total assets are owned by cross-listed firms. While recent decades have
witnessed increasing globalization, as seen in increasing international investments for which
audited financial information is crucial (Gunn and Michas, 2018), our understanding of the effect
of corruption on auditor choice in an international setting is limited. Overall, our research design
allows us to estimate the effect of corruption on auditor choice with greater precision in the
current, ever-changing business environment.
We first examine the association between the corruption level in a country and the
likelihood of a company’s hiring a Big 4 auditor, and document that corruption is negatively
associated with the propensity to appoint a Big 4 auditor. We also find that Big 4 auditors still
serve a strong governance role in corrupt countries, as firms are more likely to receive qualified/
adverse opinions and Big 4 auditors are more likely to disclaim opinions. Next, we focus on the
cross-listing firms, a group which represents firms having a greater incentive to signal that their
financial statements are of higher quality relative to those of their domestic counterparts, and
examine whether the absolute and relative levels of corruption have a differential impact on the
propensity to hire Big 4 auditors. Empirical findings reveal that cross-listed firms are more likely
to hire Big 4 auditors than are their domestic counterparts and that when firms cross-list in
countries with a lower level of corruption than their home countries, the propensity to hire Big 4
auditors is higher. However, we fail to document such a tendency when firms cross-list in more
corrupt countries. These findings support the argument that Big 4 auditors are perceived to serve
a strong governance role in financial reporting even in a country where corruption is pervasive
6
and suggest that firms whose home countries have high levels of corruption signal to the market
that they are conforming to the norms of the less corrupt countries in which they cross-list by
appointing a Big 4 auditor.
We further investigate whether the negative association between corruption and the
propensity to hire Big 4 auditors may be attributable to the reluctance of Big 4 auditors to
establish a presence in more corrupt countries, resulting in firms’ having fewer choices among
Big 4 auditors. While this alternative explanation is also driven by corruption, it challenges our
argument that the demand for Big 4 auditors is lower in more corrupt countries because the Big 4
represent a strong governance role. To explore this competing explanation, we exclude from our
sample the countries with fewer than four Big 4 auditors, i.e., countries in which the supply is
more limited. Our results remain unchanged, precluding the limited-supply interpretation.
Finally, we examine whether our results are driven by omitted variables and suffer from
endogeneity concerns. We find a group of control firms using propensity score and firm size
matching and find that our conclusions remain the same. Further, to be consistent with and
expand prior literature, we add a vector of country-level variables to our model, decreasing our
sample coverage from 78 countries in the main results to 34 countries in the sensitivity tests.8
While this approach substantially reduces the sample size and the generalizability of our results,
our inferences remain similar. Our results are also robust to additional sample restrictions.
In the next section, we review the literature and discuss the research question. Section 3
presents the regression models and the definitions of test and control variables. Section 4
8 These variables include the percentage of politically-connected firms (Guedhami et al., 2014), the strength of investor protection measures of common laws, disclosure and anti-director rights, and a public enforcement index (Francis and Wang, 2008; Choi and Wong, 2007; La Porta et al., 1997, 1998, 2006), literacy (Lamoreaux et al., 2015), secretive culture (Hope et al., 2008), disclosure level (Hope et al., 2008), and the extent of ownership concentration (La Porta et al., 1998).
7
explains the sample selection procedures and presents descriptive statistics and empirical results.
Section 5 discusses additional analyses. Section 6 presents the sensitivity tests. Section 7
provides concluding remarks.
2. Literature review and research question
In this paper, we take the position that country level corruption is positively associated with
corporate corruption. As bribery and secret dealings are common practices in corrupt countries,
managers are more likely to bribe government officials in operations. Because such practices are
illegal in most countries, managers may need to disguise bribe payments (Healy and Serafeim,
2016). The opaque and secretive nature of bribe payments increases corporate corruption and
poses a threat to internal controls. Thus, accounting records are likely to be of lower quality and
information asymmetries between managers and shareholders are higher in a more corrupt
country. 9
As the financial statements are more likely to be of lower quality in more corrupt
countries, investors may require a higher return on capital to compensate for the risks, leading to
a steep discount of equity and debt. Jensen and Meckling (1976) suggest that credible financial
statements reduce agency costs between managers and shareholders and thus improve investor
confidence in firms’ reporting quality. Prior literature documents that Big 4 auditors provide
higher quality audit services in the U.S. and other countries because of reputation and legal
concerns (Choi and Wong, 2007; Gul et al., 2003, 2013; Francis et al., 1999; Teoh and Wong,
1993); therefore, firms are incentivized to hire Big 4 auditors to reduce agency problems.
9 Even if managers’ acts of bribery ostensibly stem from the interest of shareholders (e.g., bribes to obtain government contracts), they can still hurt shareholders. First, the effort to keep the bribe payments secret consumes firms’ resources (Rose-Ackerman, 2004). Second, shareholders cannot verify whether the total amount actually flows to the “target” officials. Third, the firm’s reputation is damaged when such behavior is uncovered.
8
Furthermore, choosing a Big 4 auditor may serve a signaling role in more corrupt countries. That
is, firms with high reporting quality may hire a Big 4 auditor to provide investors with
information about their reporting quality (Spence, 1973). In addition, firms with bad reporting
quality may find hiring a Big 4 auditor costly, as they bear the cost of falsehoods. Thus, the
benefit of signaling through appointing a Big 4 auditor is potentially higher in countries that are
more corrupt because investors are less protected by their judicial systems and the need to
distinguish between good and bad firms is stronger. Taken together, the demand for Big 4
auditors is expected to be stronger in countries that are more corrupt because of higher agency
costs and signaling needs.
On the other hand, the demand for good audit quality may be lower in more corrupt
countries because managers or boards of directors in such countries may tend to avoid more
independent auditors who are likely to detect internal control weaknesses (Zhang et al., 2007;
Krishnan, 2005) and issue an unfavorable audit opinion (Lennox, 2000; DeFond et al., 1999). In
addition, managers are less likely to follow (or being forced to follow) prescribed accounting
rules and are more likely to engage in earnings management when the enforcement mechanism is
weak (Hope, 2003; Leuz et al., 2003). Companies in corrupt countries may have lower reporting
quality and higher information uncertainty and thus not welcome high quality audits. In other
words, hiring a high quality auditor may make managers’ bribe payments more difficult and
costly. While such deterrence can also occur in countries that are less corrupt, in general, high
quality auditors will be less welcome in more corrupt countries because, compared to countries
with lower levels of corruption, social norms in countries with more corruption may be such that
bribery is perceived as less serious and is discouraged to a lesser extent (Fisman and Miguel,
2007; Sunder, 2005; Sandholtz and Gray, 2003). In places where such lenient views toward

9
corruption are widely held, a mechanism that operates in opposition to it will tend to be avoided,
and to the extent that Big 4 auditors serve a strong governance role in financial reporting, the
propensity to hire Big 4 auditors will be lower in countries where corruption is more prevalent.
Overall, firms in countries with more corruption may be more likely to appoint a Big 4
auditor (because of a stronger need for higher audit quality) or less likely to do so (because of
less demand for higher audit quality). Thus, whether the corruption level is positively or
negatively associated with the choice of Big 4 auditors is an empirical question.
3. Research design
To examine the possible association between corruption and Big 4/non-Big 4 auditor choice, we
estimate the following logistic regression model:
BIG4ijt = α0 + β1CORRUPTIONjt + α1CROSS_LISTijt + α2logASSETijt + α3AR_INVijt
+ α4PPEijt + α5LEVERAGEijt + α6LOSSijt + α7TOBINQijt + α8ISSUEijt
+ α9GLOBAL_EXPERTqjt + α10IFRSjt + α11MANDATORY_ROTATIONjt
+ α12logGDPjt + α13GDP_GROWTHjt + α14MARKET_CAPjt
+ α15OPENNESSjt + α16FDIjt + INDUSTRY + YEAR + εijt (1)
The dependent variable BIG4ijt, is an indicator variable equal to 1 if firm i hires a Big 4 auditor in
year t and zero otherwise. The test variable, CORRUPTIONjt, measures the degree of corruption
at the country level. We separately obtain the corruption index from Transparency International
and from the World Bank; both organizations annually rate countries by level of public sector
corruption.10 We multiply the raw corruption index by –1 so that a higher value indicates a higher
level of corruption and use percentile rank for subsequent analyses to facilitate comparison
10 Please visit http://www.transparency.org/ for more details on the corruption data.
10
between results using the two indices. In the end, both metrics of CORRUPTIONjt have a value
from 0 to 0.99. To examine the association between corruption and Big 4/non-Big 4 auditor
choice, the test variable is CORRUPTION (β1): A positive (negative) coefficient indicates that
firms in more corrupt countries are more (less) likely to hire Big 4 auditors.
Following prior research ((Duh et al., 2018; Hope et al., 2008; Francis et al., 1999;
DeFond, 1992; Francis and Wilson, 1988), we include a vector of control variables capturing
firm-, industry-, and country-level characteristics. We include the following firm-level
characteristics: CROSS_LISTijt is an indicator variable that equals 1 if firm i is also listed on a
stock exchange outside its home country, j; logASSETijt is the natural logarithm of total assets;
AR_INVijt is the sum of accounts receivable and inventory scaled by total assets; PPEijt is net
property, plant, and equipment scaled by total assets; LEVERAGEijt is total debt scaled by total
assets; LOSSijt is an indicator variable that equals 1 if firm i’s net income in year t is less than 0
and zero otherwise; TOBINQijt is the sum of total liabilities and the market value of equity scaled
by total assets; and ISSUEijt is an indicator variable that equals 1 if the firm issued either equity
or debt (by an amount greater than or equal to 10% of the previous year’s common capital or
long-term debt) in the three years prior to year t, and zero otherwise. GLOBAL_EXPERTqjt is an
industry-level indicator variable that equals one if a single audit firm audits over 30% of the total
worldwide assets in industry q in year t.11
We also include the following country-level characteristics: IFRSjt is an indicator variable
that equals 1 if country j follows International Financial Reporting Standards (IFRS) in year t,
and zero otherwise; MANDATORY_ROTATIONjt is an indicator variable that equals 1 if there is
mandatory audit firm rotation for country j in year t; logGDPjt is the natural logarithm of the
11 We choose 30% as the threshold to be consistent with Reichelt and Wang (2010).
11
gross domestic product of country j in year t; GDP_GROWTHjt is the growth in GDP of country
j from year t–1 to year t; MARKET_CAPjt is total market capitalization scaled by GDP for
country j in year t; OPENNESSjt is the value of imports plus exports for country j in year t scaled
by GDP in year t; and FDIjt is the amount of foreign direct investment in country j in year t as a
percentage of GDP in year t. We expect that larger firms and cross-listing firms are more likely
to hire a Big 4 auditor, as these firms may have more agency conflict and be under greater
scrutiny by the capital markets. Given the complexity of our international setting and mixed prior
empirical evidence, we do not have a priori predictions for other control variables.
Finally, we include industry and year fixed effects to control for systematic variation
across industries and time and we cluster standard errors at the industry-country level.12 We also
conduct variance inflation factor (VIF) tests for all the regressions to make sure that
multicollinearity is not a concern in the estimation of our models. All continuous variables are
winsorized at the 1% and 99 % levels to mitigate the effect of outliers.
4. Sample selection, descriptive statistics, and empirical results
4.1 Sample selection and descriptive statistics
We obtain financial statement information from COMPUSTAT Global Vantage and corruption
data from Transparency International and the World Bank. Table I summarizes the sample
selection process. We first delete firms from Japan, South Korea, India, and Pakistan because of
potential miscoding of the auditor identification variable in Global Vantage (Francis and Wang,
2008). We also delete firms from Bermuda and the Cayman Islands because these countries
represent tax havens and firms typically choose to incorporate in these countries merely for tax
12 The results are robust to clustering standard errors at the firm level.

12
reasons. Next, we identify the available firm-year observations having positive total assets during
the sample period, 2003-2012. We delete firms from countries with fewer than 100 firm-year
observations (Francis et al., 2013) and firms without market value or the data necessary to
calculate country-level and firm-level control variables. Finally, we exclude firms falling in the
financial (SIC6000-6999) and regulated (SIC 4400-5000) industries. These procedures result in a
final sample of 185,549 firm-year observations for examining whether firms in countries with
higher levels of corruption are more likely to hire Big 4 auditors.
Table II presents country distribution data and corruption levels using two alternative
indices. The U.S. has 42,367 firm-year observations, making it the country with the largest
representation in our sample. With respect to corruption, Venezuela (Denmark) is the country
with the highest (lowest) level of corruption according to both indices.
Table III presents the descriptive statistics for the variables used in Equation (1) from 78
countries during the 2003-2012 period. We find that 51.4% of firms in our sample appoint Big 4
auditors. The distributions of CORRUPTION in the two different indices are similar.
Table IV presents correlations between the variables used in this study. We find that most
correlations among the explanatory variables are less than 0.30, suggesting that multicollinearity
may not be a concern in the estimation of our models.
[Insert TABLE I here]
[Insert TABLE II here]
[Insert TABLE III here]
[Insert TABLE IV here]
13
4.2. Empirical results
4.2.1 The association between corruption and Big 4/non-Big 4 auditor choice
Table V presents results for analyses examining the relationship between corruption and the Big
4/non-Big 4 auditor choice. Column (1), Table V shows the results when CORRUPTION is
based on the corruption index from Transparency International. We find that the coefficient of
interest (CORRUPTION) is significantly negative (–4.359, p-value < 0.0001), indicating that a
firm’s propensity to appoint a Big 4 auditor is lower in countries with more corruption than in
countries with less corruption.
To ensure that our results are not sensitive to which corruption index is used, we repeat
the analyses using an alternative measure of corruption. Column (2) presents the results when
CORRUPTION is based on the World Bank corruption index. We again find the coefficient on
CORRUPTION to be negative and significant (–4.226, p-value <0.0001). We also conduct
multicollinearity diagnostic tests and find that the VIF is below 10 for all the variables,
suggesting that multicollinearity is not a concern in the estimation of our models.
[Insert TABLE V here]
5. Additional analyses
5.1 Exploring the association between corruption and Big 4/non-Big 4 auditor choice among
cross-listing firms
In this section, we focus on the cross-listing firms to examine whether the absolute and relative
levels of corruption have differential impacts on the choice of a Big 4 or a non-Big 4 auditor.
Focusing on cross-listing firms allows us to differentiate firms having more versus less incentive
to demand higher audit quality and to explore whether the negative association between
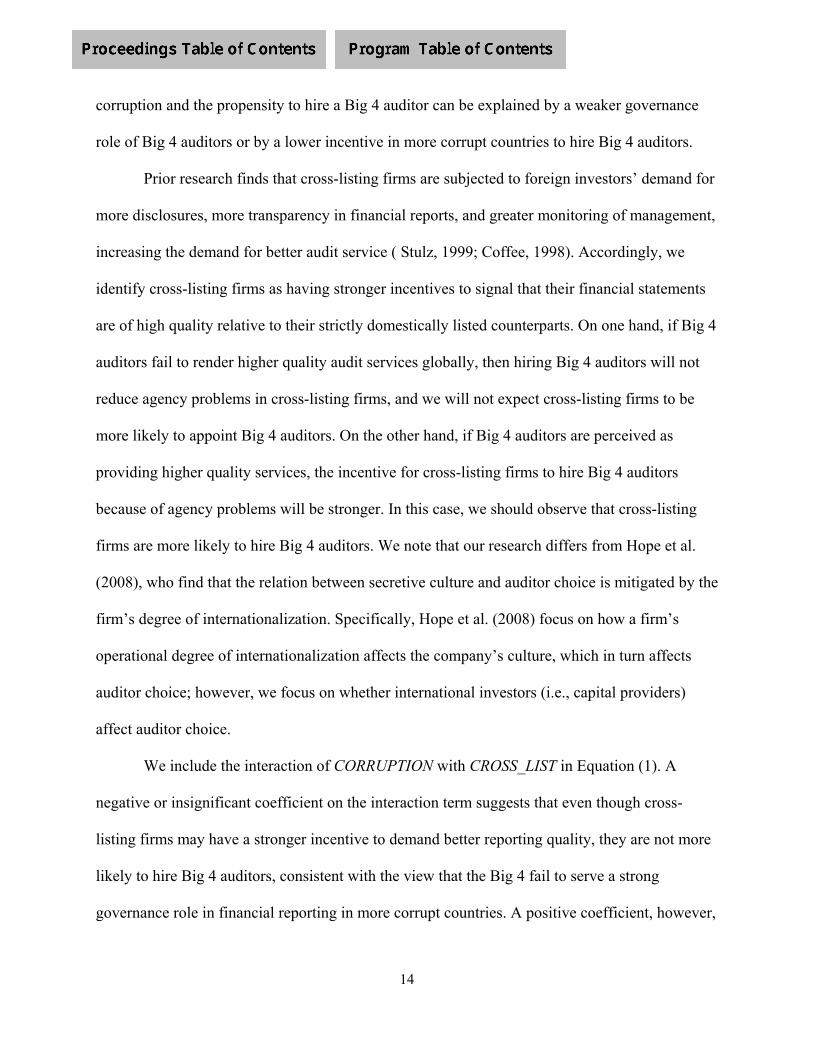
14
corruption and the propensity to hire a Big 4 auditor can be explained by a weaker governance
role of Big 4 auditors or by a lower incentive in more corrupt countries to hire Big 4 auditors.
Prior research finds that cross-listing firms are subjected to foreign investors’ demand for
more disclosures, more transparency in financial reports, and greater monitoring of management,
increasing the demand for better audit service ( Stulz, 1999; Coffee, 1998). Accordingly, we
identify cross-listing firms as having stronger incentives to signal that their financial statements
are of high quality relative to their strictly domestically listed counterparts. On one hand, if Big 4
auditors fail to render higher quality audit services globally, then hiring Big 4 auditors will not
reduce agency problems in cross-listing firms, and we will not expect cross-listing firms to be
more likely to appoint Big 4 auditors. On the other hand, if Big 4 auditors are perceived as
providing higher quality services, the incentive for cross-listing firms to hire Big 4 auditors
because of agency problems will be stronger. In this case, we should observe that cross-listing
firms are more likely to hire Big 4 auditors. We note that our research differs from Hope et al.
(2008), who find that the relation between secretive culture and auditor choice is mitigated by the
firm’s degree of internationalization. Specifically, Hope et al. (2008) focus on how a firm’s
operational degree of internationalization affects the company’s culture, which in turn affects
auditor choice; however, we focus on whether international investors (i.e., capital providers)
affect auditor choice.
We include the interaction of CORRUPTION with CROSS_LIST in Equation (1). A
negative or insignificant coefficient on the interaction term suggests that even though cross-
listing firms may have a stronger incentive to demand better reporting quality, they are not more
likely to hire Big 4 auditors, consistent with the view that the Big 4 fail to serve a strong
governance role in financial reporting in more corrupt countries. A positive coefficient, however,
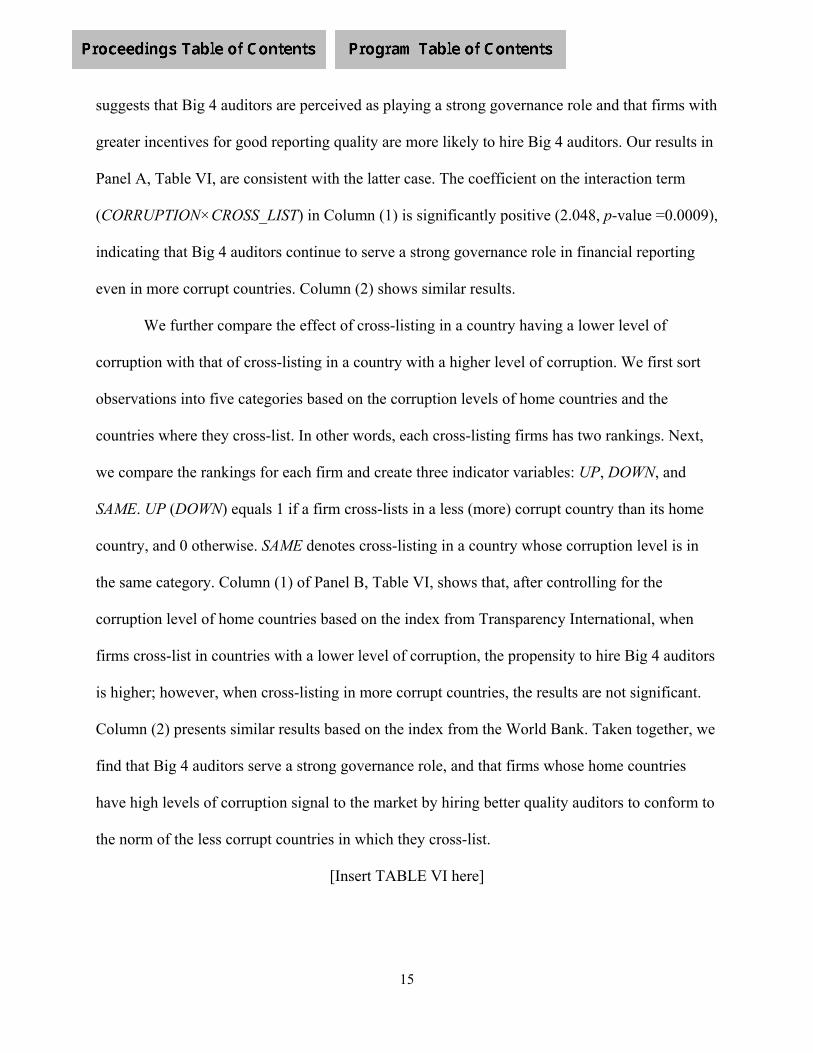
15
suggests that Big 4 auditors are perceived as playing a strong governance role and that firms with
greater incentives for good reporting quality are more likely to hire Big 4 auditors. Our results in
Panel A, Table VI, are consistent with the latter case. The coefficient on the interaction term
(CORRUPTION×CROSS_LIST) in Column (1) is significantly positive (2.048, p-value =0.0009),
indicating that Big 4 auditors continue to serve a strong governance role in financial reporting
even in more corrupt countries. Column (2) shows similar results.
We further compare the effect of cross-listing in a country having a lower level of
corruption with that of cross-listing in a country with a higher level of corruption. We first sort
observations into five categories based on the corruption levels of home countries and the
countries where they cross-list. In other words, each cross-listing firms has two rankings. Next,
we compare the rankings for each firm and create three indicator variables: UP, DOWN, and
SAME. UP (DOWN) equals 1 if a firm cross-lists in a less (more) corrupt country than its home
country, and 0 otherwise. SAME denotes cross-listing in a country whose corruption level is in
the same category. Column (1) of Panel B, Table VI, shows that, after controlling for the
corruption level of home countries based on the index from Transparency International, when
firms cross-list in countries with a lower level of corruption, the propensity to hire Big 4 auditors
is higher; however, when cross-listing in more corrupt countries, the results are not significant.
Column (2) presents similar results based on the index from the World Bank. Taken together, we
find that Big 4 auditors serve a strong governance role, and that firms whose home countries
have high levels of corruption signal to the market by hiring better quality auditors to conform to
the norm of the less corrupt countries in which they cross-list.
[Insert TABLE VI here]

16
5.2 The association among corruption, Big 4 auditors, and audit opinions.
In this section, we examine whether the negative association between the likelihood of
appointing Big 4 auditors and corruption is attributed to the superior quality of Big 4 auditors. In
the hypothesis development section, we predict that, as Big 4 auditors serve a strong governance
role in corrupt countries, managers and boards of directors in such countries tend to avoid Big 4
auditors, who are likely to issue unfavorable opinions. However, prior studies show that audit
quality is associated with the litigation risk that auditors face (Boone et al., 2011), raising the
question as to whether the superior audit quality of Big 4 auditors still exists in corrupt countries,
where the litigation risks are likely to be lower. To address this concern, we examine the
following logistic regression model:
OPINIONijt = α0 + β1CORRUPTIONjt + β2BIG4ijt +β3CORRUPTIONjt ×BIG4ijt
+ α3logASSETijt + α5LEVERAGEijt + α6LOSSijt + α7TOBINQijt + α10IFRSjt
+ α11MANDATORY_ROTATIONjt + α12logGDPjt + α13GDP_GROWTHjt
+ α14MARKET_CAPjt + α15OPENNESSjt + α16FDIjt + INDUSTRY + YEAR + εijt
(2)
The dependent variable OPINIONijt, is an indicator variable equal to 1 if firm i receives a
qualified/adverse opinion or firm i’s auditor disclaims an opinion in year t, and zero otherwise.
The test variable is CORRUPTION×BIG4; a positive (negative) coefficient indicates that Big 4
auditors are more (less) likely to issue a qualified/adverse opinion and to disclaim an opinion in
corrupt countries.
Table VII presents the regression results from estimating Equation (2). We find that the
coefficient of interest, CORRUPTION×BIG4, loads negatively for both corruption indices. This
finding is also consistent with our assumption that Big 4 auditors still serve a strong governance

17
role in corrupt countries. This finding also provides additional support for our argument that
firms are more likely to receive unfavorable audit opinions from Big 4 auditors, which in turn
affects firms’ decision to choose between Big 4 and non-Big 4 auditors.
[Insert TABLE VII here]
6. Sensitivity tests
In this section, we report the results of a number of sensitivity analyses. While we document the
effect of corruption on Big 4/non-Big4 auditor choice and identify the most direct factors that
link corruption with these two dependent variables, there may be omitted-variable bias and
endogeneity concerns. To investigate the potential confounding effects, we re-assess our main
findings by performing propensity-score matching and firm-size matching to identify a group of
firms having similar propensity to appoint Big 4 auditors and a group of firms having similar
size. Next, we consider a vector of investor protection environment proxies—political,
economic, legal, and cultural factors—as documented in prior literature to examine whether
corruption has incremental explanatory power in firms’ auditor choice. Finally, we examine
whether our results hold under alternative sample restrictions.
6.1 Propensity score matching and firm size matching
To find a group of control firms, we first perform propensity-score matching by estimating the
propensity for firms to hire Big 4 auditors using the firm-level determinants included in Equation
(1). Next, we divide the full sample into three sub-samples based on the Transparency
International corruption level and select the highest corruption sub-sample (n = 62,006) and the

18
lowest corruption sub-sample (n = 60,167).13 We then match the observations in the two
subsamples based on the estimated propensity scores, within common support and without
replacement, using a caliper distance of 0.03 so that the two groups have similar propensities to
hire Big 4 auditors. After the matching process, we obtain 94,122 country-firm-year observations
(a 77% match) and then re-estimate the auditor choice model (Equation (1)). We continue to find
the experimental variable, CORRUPTION, to be significantly negative (p-value < 0.0001),
regardless of the metric used for measuring CORRUPTION (see Table VIII, Panel A, Columns
(1) and (3)).
We further test whether our results are sensitive to an alternative matching sample and
match firms hiring Big 4 auditors with those not hiring Big 4 auditors based on size and
logASSET (Lawrence et al., 2011), resulting in 86,246 observations (a 71% match). The results
are reported in Columns (2) and (4) and are similar to those based on propensity score matching.
[Insert TABLE VIII here]
6.2 Examining the potential effect of a limited supply of Big 4 auditors
Next, we examine whether the negative association between corruption and the propensity to hire
Big 4 auditors is due to limited choices of Big 4 auditors in more corrupt countries rather than to
lower demand for Big 4 auditors. Specifically, if Big 4 auditors are less willing to invest in more
corrupt countries and establish a presence there, firms in more corrupt countries face a very
limited supply of Big 4 auditors, leading to a negative association between corruption and the
propensity to choose a Big 4 auditor. While this possibility is also driven by corruption, this
13 Using the World Bank metric, the resulting size of the highest- and lowest-corruption sub-samples is 62,236 and 68,083, respectively. Ideally, the three sub-samples are of equal size; but since there are observations with the same corruption score, the sample sizes of the three groups are not exactly equal.
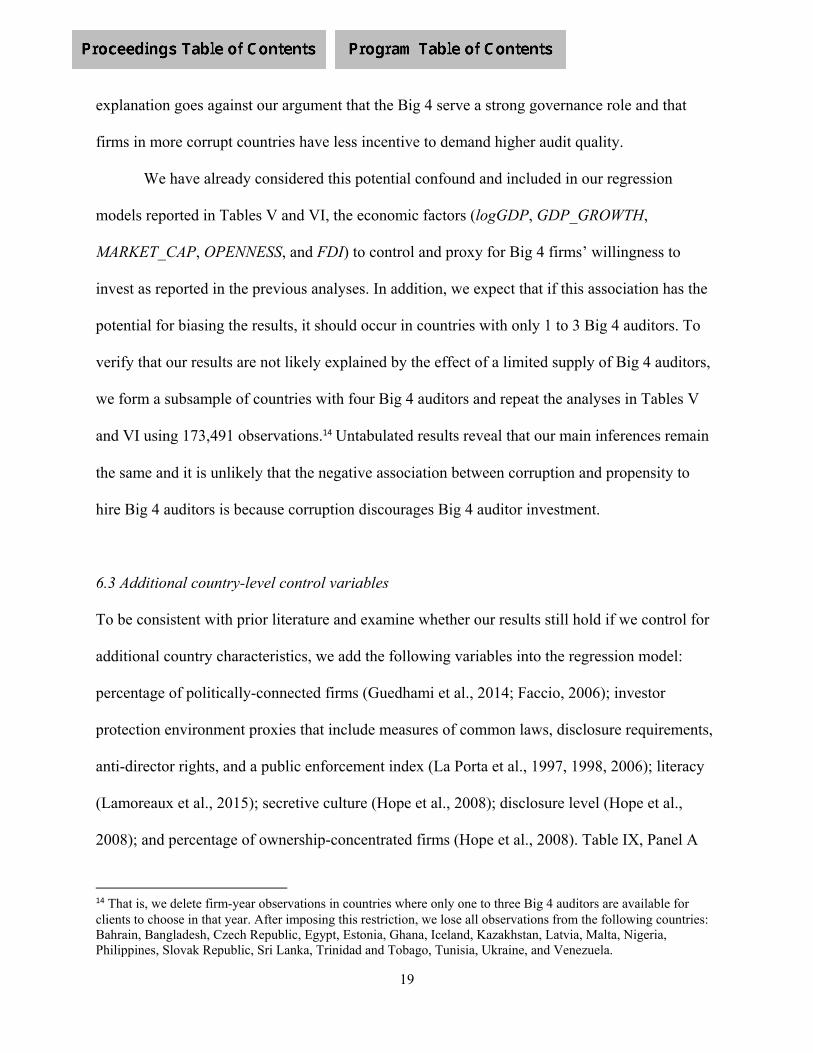
19
explanation goes against our argument that the Big 4 serve a strong governance role and that
firms in more corrupt countries have less incentive to demand higher audit quality.
We have already considered this potential confound and included in our regression
models reported in Tables V and VI, the economic factors (logGDP, GDP_GROWTH,
MARKET_CAP, OPENNESS, and FDI) to control and proxy for Big 4 firms’ willingness to
invest as reported in the previous analyses. In addition, we expect that if this association has the
potential for biasing the results, it should occur in countries with only 1 to 3 Big 4 auditors. To
verify that our results are not likely explained by the effect of a limited supply of Big 4 auditors,
we form a subsample of countries with four Big 4 auditors and repeat the analyses in Tables V
and VI using 173,491 observations.14 Untabulated results reveal that our main inferences remain
the same and it is unlikely that the negative association between corruption and propensity to
hire Big 4 auditors is because corruption discourages Big 4 auditor investment.
6.3 Additional country-level control variables
To be consistent with prior literature and examine whether our results still hold if we control for
additional country characteristics, we add the following variables into the regression model:
percentage of politically-connected firms (Guedhami et al., 2014; Faccio, 2006); investor
protection environment proxies that include measures of common laws, disclosure requirements,
anti-director rights, and a public enforcement index (La Porta et al., 1997, 1998, 2006); literacy
(Lamoreaux et al., 2015); secretive culture (Hope et al., 2008); disclosure level (Hope et al.,
2008); and percentage of ownership-concentrated firms (Hope et al., 2008). Table IX, Panel A
14 That is, we delete firm-year observations in countries where only one to three Big 4 auditors are available for clients to choose in that year. After imposing this restriction, we lose all observations from the following countries: Bahrain, Bangladesh, Czech Republic, Egypt, Estonia, Ghana, Iceland, Kazakhstan, Latvia, Malta, Nigeria, Philippines, Slovak Republic, Sri Lanka, Trinidad and Tobago, Tunisia, Ukraine, and Venezuela.
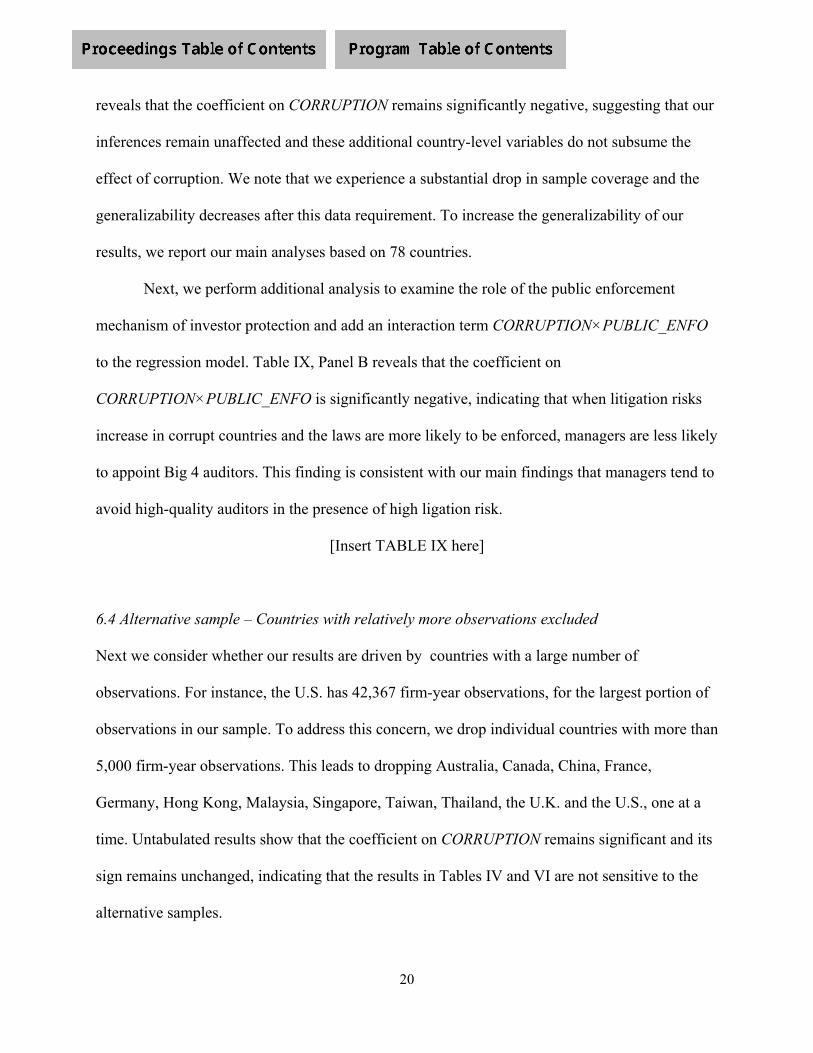
20
reveals that the coefficient on CORRUPTION remains significantly negative, suggesting that our
inferences remain unaffected and these additional country-level variables do not subsume the
effect of corruption. We note that we experience a substantial drop in sample coverage and the
generalizability decreases after this data requirement. To increase the generalizability of our
results, we report our main analyses based on 78 countries.
Next, we perform additional analysis to examine the role of the public enforcement
mechanism of investor protection and add an interaction term CORRUPTION×PUBLIC_ENFO
to the regression model. Table IX, Panel B reveals that the coefficient on
CORRUPTION×PUBLIC_ENFO is significantly negative, indicating that when litigation risks
increase in corrupt countries and the laws are more likely to be enforced, managers are less likely
to appoint Big 4 auditors. This finding is consistent with our main findings that managers tend to
avoid high-quality auditors in the presence of high ligation risk.
[Insert TABLE IX here]
6.4 Alternative sample – Countries with relatively more observations excluded
Next we consider whether our results are driven by countries with a large number of
observations. For instance, the U.S. has 42,367 firm-year observations, for the largest portion of
observations in our sample. To address this concern, we drop individual countries with more than
5,000 firm-year observations. This leads to dropping Australia, Canada, China, France,
Germany, Hong Kong, Malaysia, Singapore, Taiwan, Thailand, the U.K. and the U.S., one at a
time. Untabulated results show that the coefficient on CORRUPTION remains significant and its
sign remains unchanged, indicating that the results in Tables IV and VI are not sensitive to the
alternative samples.
21
6.5 Alternative sample – Observations after 2005 excluded
Francis et al. (2013) point out potential coding problems in the Global Vantage datasets starting
from 2005. Accordingly, we delete observations that fall after 2005 and repeat the analyses.15
Untabulated results reveal that the coefficients of interest are significant with the same signs,
indicating that our main inferences are unaffected by this additional restriction.
7. Conclusion
This paper examines the association between the political environment, as manifested in the
corruption level of a country, and firms’ auditor hiring decisions. This topic is important to
capital market participants around the world but challenging because to examine firms’ decision
to hire Big 4 auditors, we need to consider (1) whether the Big 4 auditors represent a strong
governance role around the world, (2) whether the incentives to hire a Big 4 auditor to reduce
information asymmetry and signal superior financial reporting quality change according to the
corruption level, and (3) whether corruption affects the supply of Big 4 auditor services.
We provide evidence for the association between corruption and auditor choice using a
sample with cross-country variation in the level of public sector corruption and take the above
confounding issues into consideration. We find that firms in countries with higher levels of
corruption are less likely to hire Big 4 auditors. In addition, we find that cross-listed firms in
countries with more corruption are more likely to hire a Big 4 auditor than their domestically
listed counterparts. Specifically, when firms cross-list in countries with a lower level of
15 Francis et al. (2013) point out that Global Vantage may have data errors, as the Big 4 market share declines substantially from 2004 to 2005. We believe that Global Vantage has rectified the historical data in our data set and find that the average Big 4 market share in 2004 and 2005 are similar in our sample. Nevertheless, we perform additional analysis to ensure the robustness of our results.
22
corruption than their home countries, the propensity to hire Big 4 auditors is higher. However,
this tendency disappears when firms cross-list in more-corrupt countries. We also find that Big 4
auditors in corrupt countries are more likely to issue a qualified/adverse opinion and to disclaim
an opinion. These findings are consistent with the views that Big 4 auditors are perceived as
playing a strong governance role in financial reporting even in countries where corruption is
relatively prevalent and that firms in countries with higher levels of corruption may have less
incentive to demand higher audit quality. Our analysis also precludes the alternative explanation
that corruption discourages Big 4 auditor investments and thus reduces the likelihood of firms’
appointing Big 4 auditors.
Overall, we provide evidence that the corruption level of a country, an important aspect
of the political environment, plays a role in firms’ decision to choose between Big 4 versus non-
Big 4 auditors. Our study complements the prior auditor choice literature, which focuses mostly
on signal countries such as the US, by expanding the scope to 78 countries. In addition, we
enhance the understanding of how the absolute and relative performance of the political
environment affects cross-listing firms’ choice of auditors. Future studies may usefully
investigate other aspects of the political economy to assess the generalizability of our findings.

23
References
Asiedu, E. and Freeman, J. (2009), “The effect of corruption on investment growth: Evidence from firms in Latin America, sub-Saharan Africa, and transition countries”, Review of Development Economics, Vol. 13 No. 2, pp. 200–214.
Blau, B.M. (2017), “Social trust and the liquidity of cross-listed securities”, Journal of Business Research, Vol. 78, pp. 155–171.
Boone, J.P., Khurana, I.K. and Raman, K.K. (2011), “Litigation Risk and Abnormal Accruals”, Auditing: A Journal of Practice and Theory, Vol. 30 No. 2, pp. 231–256.
Center for International Financial Analysis & Research (CIFAR). (1995), International Accounting and Auditng Trends, CIFAR, Princeton, NJ.
Choi, J.-H. and Wong, T.J. (2007), “Auditors’ governance functions and legal environments: An international investigation”, Contemporary Accounting Research, Vol. 24 No. 1, pp. 13–46.
Coffee, J. (1998), “Future as history: The prospects for global convergence in corporate governance and its implications”, Northwestern University Law Review, Vol. 93 No. 3, pp. 641–708.
DeFond, M.L. (1992), “The association between changes in client firm agency costs and auditor switching”, Auditing: A Journal of Practice and Theory, Vol. 11 No. 1, pp. 16–31.
DeFond, M.L., Wong, T.J. and Li, S. (1999), “The impact of improved auditor independence on audit market concentration in China”, Journal of Accounting and Economics, Vol. 28 No. 3, pp. 269–305.
Duh, R.-R., Ye, C. and Yu, L.-H. (2018), “Corruption and audit market concentration: an international investigation”, Asia-Pacific Journal of Accounting & Economics, Accepted.
Faccio, M. (2006), “Politically connected firms”, The American Economic Review, Vol. 96 No. 1, pp. 369–386.
Fisman, R. and Miguel, E. (2007), “Corruption, norms, and legal enforcement: Evidence from diplomatic parking tickets”, Journal of Political Economy, Vol. 115 No. 6, pp. 1020–1048.
Francis, J.R., Maydew, E.L. and Sparks, H.C. (1999), “The role of Big 6 auditors in the credible reporting of accruals”, Auditing: A Journal of Practice and Theory, Vol. 18 No. 2, pp. 17–34.
Francis, J.R., Michas, P.N. and Seavey, S.E. (2013), “Does audit market concentration harm the quality of audited earnings? Evidence from audit markets in 42 countries”, Contemporary Accounting Research, Vol. 30 No. 1, pp. 325–355.
Francis, J.R. and Wang, D. (2008), “The joint effect of investor protection and Big 4 audits on earnings quality around the world”, Contemporary Accounting Research, Vol. 25 No. 1, pp. 157–191.
Francis, J.R. and Wilson, E.R. (1988), “Auditor changes: A joint test of theories relating to agency costs and auditor differentiation”, The Accounting Review, Vol. 63 No. 4, pp. 663–682.
Di Guardo, M.C., Marrocu, E. and Paci, R. (2016), “The effect of local corruption on ownership
24
strategy in cross-border mergers and acquisitions”, Journal of Business Research, Vol. 69 No. 10, pp. 4225–4241.
Guedhami, O., Pittman, J.A. and Saffar, W. (2014), “Auditor choice in politically connected firms”, Journal of Accounting Research, Vol. 52 No. 1, pp. 107–162.
Gul, F.A., Chen, C.J.P. and Tsui, J.S.L. (2003), “Discretionary accounting accruals, managers’ incentives, and audit fees”, Contemporary Accounting Research, Vol. 20 No. 3, pp. 441–464.
Gul, F.A., Zhou, G. (Stephen) and Zhu, X. (Kevin). (2013), “Investor protection, firm informational problems, Big N auditors, and cost of debt around the world”, Auditing: A Journal of Practice and Theory, Vol. 32 No. 3, pp. 1–30.
Gunn, J. L. and Michas, P. N. (2018), "Auditor multinational expertise and audit quality", The Accounting Review, Vol. 93 No. 4, pp. 203-224.
Hameed, S., Magpile, J. and Runde, D.F. (2014), The Costs of Corruption, Center for Strategic & International Studies, Washington, DC, available at:https://doi.org/Available at: http://csis.org/files/publication/140204_Hameed_CostsOfCorruption_Web.pdf.
Healy, P. and Serafeim, G. (2016), “An analysis of firms’ self-reported anticorruption efforts”, The Accounting Review, Vol. 91 No. 2, pp. 489–511.
Hofstede, G. (1980), Culture’s Consequences: International Differences in Work Related Values, Sage, Beverly Hills, CA.
Hope, O.-K. (2003), “Disclosure practices, enforcement of accounting standards, and analysts’ forecast accuracy: An international study”, Journal of Accounting Research, Vol. 41 No. 2, pp. 235–272.
Hope, O.-K., Kang, T., Thomas, W. and Yoo, Y.K. (2008), “Culture and auditor choice: A test of the secrecy hypothesis”, Journal of Accounting and Public Policy, Vol. 27 No. 5, pp. 357–373.
Houqe, M.N., Monem, R.M. and van Zijl, T. (2012), “Government quality, auditor choice and adoption of IFRS: A cross country analysis”, Advances in Accounting, Vol. 28 No. 2, pp. 307–316.
Jensen, M.C. and Meckling, W.H. (1976), “Theory of the firm: Managerial behavior, agency costs and ownership structure”, Journal of Financial Economics, Vol. 3 No. 4, pp. 305–360.
Kaufmann, D. (2005), Myths and Realities Governance and Corruption, Working paper. Available at: http://siteresources.worldbank.org/INTWBIGOVANTCOR/Resources/2-1_Governance_and_Corruption_Kaufmann.pdfWorld Bank.
Kaufmann, D., Kraay, A. and Mastruzzi, M. (2007), Governance Matters VI: Aggregate and Individual Governance Indicators 1996–2006, World Bank policy research working paper. Available at: http://elibrary.worldbank.org/doi/pdf/10.1596/1813-9450-4280.
Klitgaard, R. (1988), Controlling Corruption, University of California Press, Berkeley.
Krishnan, J. (2005), “Audit committee quality and internal control: An empirical analysis”, The Accounting Review, Vol. 80 No. 2, pp. 649–675.
Lamoreaux, P.T., Michas, P.N. and Schultz, W.L. (2015), “Do accounting and audit quality
25
affect World Bank lending?”, The Accounting Review, Vol. 90 No. 2, pp. 703–738.
Lawrence, A., Minutti-Meza, M. and Zhang, P. (2011), “Can Big 4 versus non-Big 4 differences in audit-quality proxies be attributed to client characteristics?”, The Accounting Review, Vol. 86 No. 1, pp. 259–286.
Lennox, C. (2000), “Do companies successfully engage in opinion-shopping? Evidence from the UK”, Journal of Accounting and Economics, Vol. 29 No. 3, pp. 321–337.
Leuz, C., Nanda, D. and Wysocki, P.D. (2003), “Earnings management and investor protection: An international comparison”, Journal of Financial Economics, Vol. 69 No. 3, pp. 505–527.
Lyon, J. and Maher, M. (2005), “The importance of business risk in setting audit fees: Evidence from cases of client misconduct”, Journal of Accounting Research, Vol. 43 No. 1, pp. 133–151.
Maher, M.W. (1981), “The impact of regulation on controls: Firms’ response to the Foreign Corrupt Practices Act”, The Accounting Review, Vol. 56 No. 4, pp. 751–770.
Pagano, M. and Volpin, P.F. (2005), “The political economy of corporate governance”, American Economic Review, Vol. 95 No. 4, pp. 1005–1030.
La Porta, R., Lopez-De-Silanes, F. and Shleifer, A. (2006), “What works in securities laws?”, The Journal of Finance, Vol. 61 No. 1, pp. 1–32.
La Porta, R., Lopez-De-Silanes, F., Shleifer, A. and Vishny, R.W. (1997), “Legal determinants of external finance”, The Journal of Finance, Vol. 52 No. 3, pp. 1131–1150.
La Porta, R., Lopez-De-Silanes, F., Shleifer, A. and Vishny, R.W. (1998), “Law and finance”, Journal of Political Economy, Vol. 106 No. 6, pp. 1113–1155.
Reichelt, K. and Wang, D. (2010), “National and office-specific measures of auditor industry expertise and effects on audit quality”, Journal of Accounting Research, Vol. 48 No. 3, pp. 647–686.
Rose-Ackerman, S. (1997), “The political economy of corruption”, in Elliott, K.A. (Ed.), Corruption and the Global Economy, Washington, DC: Institute for International Economics, pp. 31–60.
Rose-Ackerman, S. (2004), “Governance and corruption”, in Bjørn Lomborg (Ed.), Global Crisis, Global Solutions, Cambridge University Press, Cambridge, UK, pp. 301–362.
Rose-Ackerman, S. (2011), “The law and economics of bribery and extortion”, Annual Review of Law and Social Science, Vol. 6, pp. 217–236.
Sandholtz, W. and Gray, M.M. (2003), “International integration and national corruption”, International Organization, Vol. 57 No. 04, pp. 761–800.
Sequeira, S. and Djankov, S. (2014), “Corruption and firm behavior: Evidence from African ports”, Journal of International Economics, Vol. 94 No. 2, pp. 277–294.
Spence, M. (1973), “Job market signaling”, The Quarterly Journal of Economics, Vol. 87 No. 3, pp. 355–374.
Stulz, R.M. (1999), “Globalization, corporate finance, and the cost of capital”, Journal of
26
Applied Corporate Finance, Vol. 12 No. 3, pp. 8–25.
Sunder, S. (2005), “Changing expectations as a source of and remedy for corruption”, Journal of Public Budgeting, Accounting & Financial Management, Vol. 17 No. 3, pp. 420–423.
Teoh, S.H. and Wong, T.J. (1993), “Perceived auditor quality and the earnings response coefficient”, The Accounting Review, Vol. 68 No. 2, pp. 346–366.
Uecker, W.C., Brief, A.P. and Kinney, W.R. (1981), “Perception of the internal and external auditor as a deterrent to corporate irregularities”, The Accounting Review, Vol. 56 No. 3, pp. 465–478.
Zhang, Y., Zhou, J. and Zhou, N. (2007), “Audit committee quality, auditor independence, and internal control weaknesses”, Journal of Accounting and Public Policy, Vol. 26 No. 3, pp. 300–327.

27
Appendix A
Variable Variable description Dependent variables: BIG4ijt An indicator variable that equals 1 if firm i hires a Big 4
auditor in year t and zero otherwise.
OPINIONijt, An indicator variable equal to 1 if firm i receives a qualified/ adverse opinion, or firm i’s auditor disclaims an opinion in year t and zero otherwise.
Test variable: CORRUPTIONjt The percentile rank of public sector corruption.
Control variables: CROSS_LISTijt An indicator variable that equals 1 if firm i is also listed on a
stock exchange outside its home country, j.
logASSETijt The natural logarithm of total assets.
AR_INVijt The sum of accounts receivable and inventory scaled by total assets.
PPEijt Net property, plant, and equipment scaled by total assets.
LEVERAGEijt Total debt scaled by total assets.
LOSSijt An indicator variable that equals 1 if firm i’s net income in year t is less than 0 and zero otherwise.
TOBINQijt The sum of total liabilities and the market value of equity scaled by total assets.
ISSUEijt An indicator variable that equals 1 if the firm issued either equity or debt (by an amount greater than or equal to 10% of the previous year’s common capital or long-term debt) in the three years prior to year t, and zero otherwise.
GLOBAL_EXPERTqt An industry-level indicator variable that equals 1 if a single audit firm audits over 30% of the total worldwide assets in industry q.
IFRSjt Indicator variable that equals 1 if country j follows IFRS in year t, and zero otherwise.
MANDATORY_ROTATIONjt An indicator variable that equals 1 if there is mandatory audit firm rotation in country j in year t.
(continued on next page)
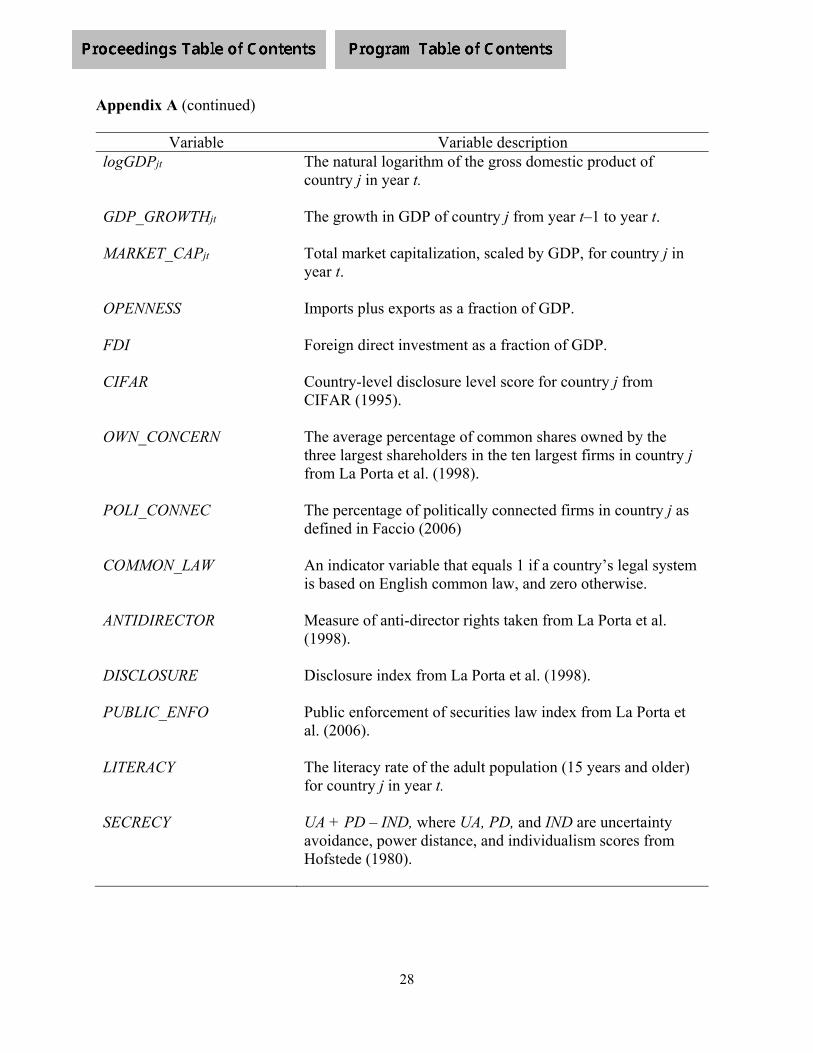
28
Appendix A (continued)
Variable Variable description logGDPjt The natural logarithm of the gross domestic product of
country j in year t.
GDP_GROWTHjt The growth in GDP of country j from year t–1 to year t.
MARKET_CAPjt Total market capitalization, scaled by GDP, for country j in year t.
OPENNESS Imports plus exports as a fraction of GDP.
FDI Foreign direct investment as a fraction of GDP.
CIFAR
Country-level disclosure level score for country j from CIFAR (1995).
OWN_CONCERN
The average percentage of common shares owned by the three largest shareholders in the ten largest firms in country j from La Porta et al. (1998).
POLI_CONNEC The percentage of politically connected firms in country j as defined in Faccio (2006)
COMMON_LAW An indicator variable that equals 1 if a country’s legal system is based on English common law, and zero otherwise.
ANTIDIRECTOR Measure of anti-director rights taken from La Porta et al. (1998).
DISCLOSURE Disclosure index from La Porta et al. (1998).
PUBLIC_ENFO Public enforcement of securities law index from La Porta et al. (2006).
LITERACY
The literacy rate of the adult population (15 years and older) for country j in year t.
SECRECY
UA + PD – IND, where UA, PD, and IND are uncertainty avoidance, power distance, and individualism scores from Hofstede (1980).

29
Table I Sample selection.
Number of observations
Firm-year observations in COMPUSTAT Global Vantage for firms with positive total assets over 2003–2012
293,853
Less: Firms from countries with fewer than 100 firm-year observations (847) Firms without market value (48,832) Firms missing data necessary to calculate firm-level variables (2,084) Financial and public utility firms (56,541) Firm-year observations for analysis of Big4/non-Big 4 auditor choice 185,549
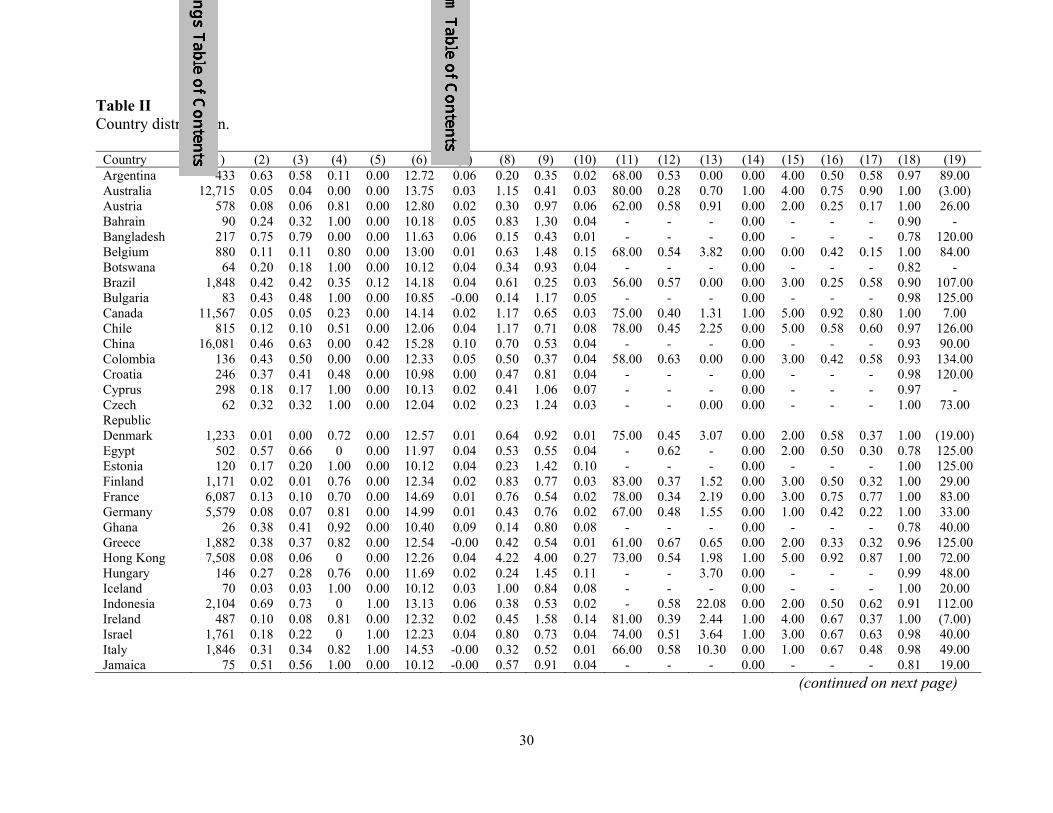
30
Table II Country distribution.
Country (1) (2) (3) (4) (5) (6) (7) (8) (9) (10) (11) (12) (13) (14) (15) (16) (17) (18) (19) Argentina 433 0.63 0.58 0.11 0.00 12.72 0.06 0.20 0.35 0.02 68.00 0.53 0.00 0.00 4.00 0.50 0.58 0.97 89.00 Australia 12,715 0.05 0.04 0.00 0.00 13.75 0.03 1.15 0.41 0.03 80.00 0.28 0.70 1.00 4.00 0.75 0.90 1.00 (3.00) Austria 578 0.08 0.06 0.81 0.00 12.80 0.02 0.30 0.97 0.06 62.00 0.58 0.91 0.00 2.00 0.25 0.17 1.00 26.00 Bahrain 90 0.24 0.32 1.00 0.00 10.18 0.05 0.83 1.30 0.04 - - - 0.00 - - - 0.90 - Bangladesh 217 0.75 0.79 0.00 0.00 11.63 0.06 0.15 0.43 0.01 - - - 0.00 - - - 0.78 120.00 Belgium 880 0.11 0.11 0.80 0.00 13.00 0.01 0.63 1.48 0.15 68.00 0.54 3.82 0.00 0.00 0.42 0.15 1.00 84.00 Botswana 64 0.20 0.18 1.00 0.00 10.12 0.04 0.34 0.93 0.04 - - - 0.00 - - - 0.82 - Brazil 1,848 0.42 0.42 0.35 0.12 14.18 0.04 0.61 0.25 0.03 56.00 0.57 0.00 0.00 3.00 0.25 0.58 0.90 107.00 Bulgaria 83 0.43 0.48 1.00 0.00 10.85 -0.00 0.14 1.17 0.05 - - - 0.00 - - - 0.98 125.00 Canada 11,567 0.05 0.05 0.23 0.00 14.14 0.02 1.17 0.65 0.03 75.00 0.40 1.31 1.00 5.00 0.92 0.80 1.00 7.00 Chile 815 0.12 0.10 0.51 0.00 12.06 0.04 1.17 0.71 0.08 78.00 0.45 2.25 0.00 5.00 0.58 0.60 0.97 126.00 China 16,081 0.46 0.63 0.00 0.42 15.28 0.10 0.70 0.53 0.04 - - - 0.00 - - - 0.93 90.00 Colombia 136 0.43 0.50 0.00 0.00 12.33 0.05 0.50 0.37 0.04 58.00 0.63 0.00 0.00 3.00 0.42 0.58 0.93 134.00 Croatia 246 0.37 0.41 0.48 0.00 10.98 0.00 0.47 0.81 0.04 - - - 0.00 - - - 0.98 120.00 Cyprus 298 0.18 0.17 1.00 0.00 10.13 0.02 0.41 1.06 0.07 - - - 0.00 - - - 0.97 - Czech Republic
62 0.32 0.32 1.00 0.00 12.04 0.02 0.23 1.24 0.03 - - 0.00 0.00 - - - 1.00 73.00
Denmark 1,233 0.01 0.00 0.72 0.00 12.57 0.01 0.64 0.92 0.01 75.00 0.45 3.07 0.00 2.00 0.58 0.37 1.00 (19.00) Egypt 502 0.57 0.66 0 0.00 11.97 0.04 0.53 0.55 0.04 - 0.62 - 0.00 2.00 0.50 0.30 0.78 125.00 Estonia 120 0.17 0.20 1.00 0.00 10.12 0.04 0.23 1.42 0.10 - - - 0.00 - - - 1.00 125.00 Finland 1,171 0.02 0.01 0.76 0.00 12.34 0.02 0.83 0.77 0.03 83.00 0.37 1.52 0.00 3.00 0.50 0.32 1.00 29.00 France 6,087 0.13 0.10 0.70 0.00 14.69 0.01 0.76 0.54 0.02 78.00 0.34 2.19 0.00 3.00 0.75 0.77 1.00 83.00 Germany 5,579 0.08 0.07 0.81 0.00 14.99 0.01 0.43 0.76 0.02 67.00 0.48 1.55 0.00 1.00 0.42 0.22 1.00 33.00 Ghana 26 0.38 0.41 0.92 0.00 10.40 0.09 0.14 0.80 0.08 - - - 0.00 - - - 0.78 40.00 Greece 1,882 0.38 0.37 0.82 0.00 12.54 -0.00 0.42 0.54 0.01 61.00 0.67 0.65 0.00 2.00 0.33 0.32 0.96 125.00 Hong Kong 7,508 0.08 0.06 0 0.00 12.26 0.04 4.22 4.00 0.27 73.00 0.54 1.98 1.00 5.00 0.92 0.87 1.00 72.00 Hungary 146 0.27 0.28 0.76 0.00 11.69 0.02 0.24 1.45 0.11 - - 3.70 0.00 - - - 0.99 48.00 Iceland 70 0.03 0.03 1.00 0.00 10.12 0.03 1.00 0.84 0.08 - - - 0.00 - - - 1.00 20.00 Indonesia 2,104 0.69 0.73 0 1.00 13.13 0.06 0.38 0.53 0.02 - 0.58 22.08 0.00 2.00 0.50 0.62 0.91 112.00 Ireland 487 0.10 0.08 0.81 0.00 12.32 0.02 0.45 1.58 0.14 81.00 0.39 2.44 1.00 4.00 0.67 0.37 1.00 (7.00) Israel 1,761 0.18 0.22 0 1.00 12.23 0.04 0.80 0.73 0.04 74.00 0.51 3.64 1.00 3.00 0.67 0.63 0.98 40.00 Italy 1,846 0.31 0.34 0.82 1.00 14.53 -0.00 0.32 0.52 0.01 66.00 0.58 10.30 0.00 1.00 0.67 0.48 0.98 49.00 Jamaica 75 0.51 0.56 1.00 0.00 10.12 -0.00 0.57 0.91 0.04 - - - 0.00 - - - 0.81 19.00
(continued on next page)
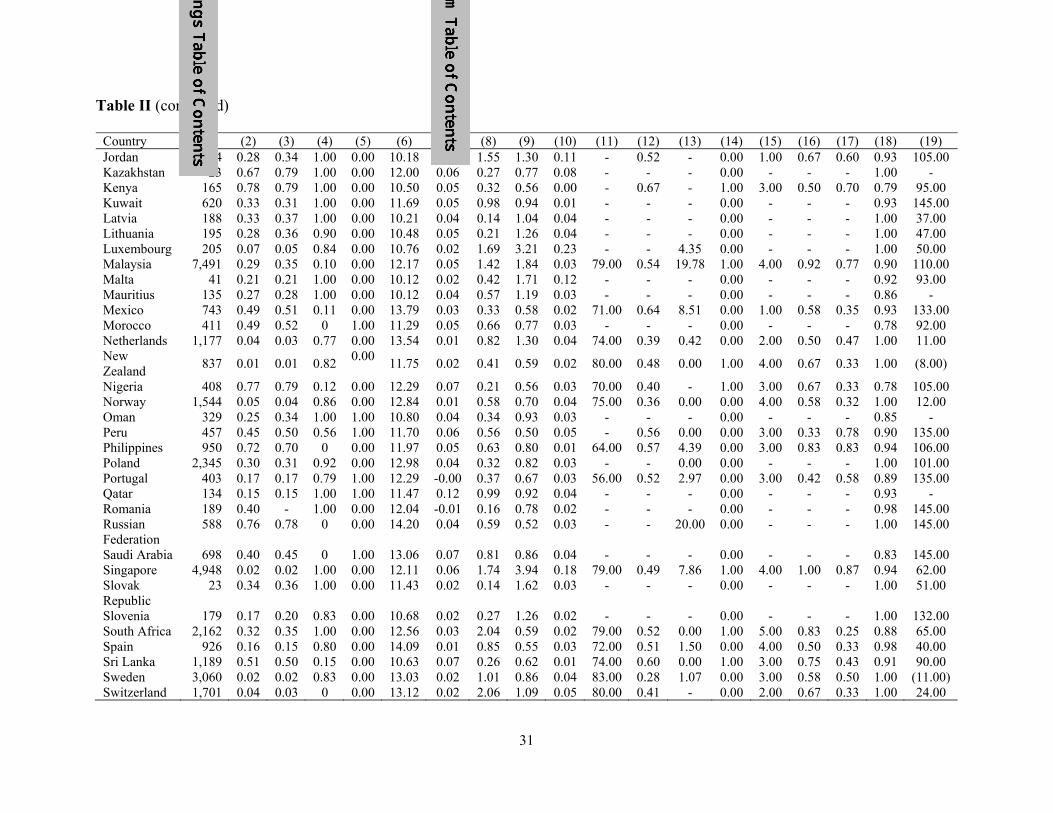
31
Table II (continued)
Country (1) (2) (3) (4) (5) (6) (7) (8) (9) (10) (11) (12) (13) (14) (15) (16) (17) (18) (19) Jordan 654 0.28 0.34 1.00 0.00 10.18 0.06 1.55 1.30 0.11 - 0.52 - 0.00 1.00 0.67 0.60 0.93 105.00 Kazakhstan 23 0.67 0.79 1.00 0.00 12.00 0.06 0.27 0.77 0.08 - - - 0.00 - - - 1.00 - Kenya 165 0.78 0.79 1.00 0.00 10.50 0.05 0.32 0.56 0.00 - 0.67 - 1.00 3.00 0.50 0.70 0.79 95.00 Kuwait 620 0.33 0.31 1.00 0.00 11.69 0.05 0.98 0.94 0.01 - - - 0.00 - - - 0.93 145.00 Latvia 188 0.33 0.37 1.00 0.00 10.21 0.04 0.14 1.04 0.04 - - - 0.00 - - - 1.00 37.00 Lithuania 195 0.28 0.36 0.90 0.00 10.48 0.05 0.21 1.26 0.04 - - - 0.00 - - - 1.00 47.00 Luxembourg 205 0.07 0.05 0.84 0.00 10.76 0.02 1.69 3.21 0.23 - - 4.35 0.00 - - - 1.00 50.00 Malaysia 7,491 0.29 0.35 0.10 0.00 12.17 0.05 1.42 1.84 0.03 79.00 0.54 19.78 1.00 4.00 0.92 0.77 0.90 110.00 Malta 41 0.21 0.21 1.00 0.00 10.12 0.02 0.42 1.71 0.12 - - - 0.00 - - - 0.92 93.00 Mauritius 135 0.27 0.28 1.00 0.00 10.12 0.04 0.57 1.19 0.03 - - - 0.00 - - - 0.86 - Mexico 743 0.49 0.51 0.11 0.00 13.79 0.03 0.33 0.58 0.02 71.00 0.64 8.51 0.00 1.00 0.58 0.35 0.93 133.00 Morocco 411 0.49 0.52 0 1.00 11.29 0.05 0.66 0.77 0.03 - - - 0.00 - - - 0.78 92.00 Netherlands 1,177 0.04 0.03 0.77 0.00 13.54 0.01 0.82 1.30 0.04 74.00 0.39 0.42 0.00 2.00 0.50 0.47 1.00 11.00 New Zealand
837 0.01 0.01 0.82 0.00
11.75 0.02 0.41 0.59 0.02 80.00 0.48 0.00 1.00 4.00 0.67 0.33 1.00 (8.00)
Nigeria 408 0.77 0.79 0.12 0.00 12.29 0.07 0.21 0.56 0.03 70.00 0.40 - 1.00 3.00 0.67 0.33 0.78 105.00 Norway 1,544 0.05 0.04 0.86 0.00 12.84 0.01 0.58 0.70 0.04 75.00 0.36 0.00 0.00 4.00 0.58 0.32 1.00 12.00 Oman 329 0.25 0.34 1.00 1.00 10.80 0.04 0.34 0.93 0.03 - - - 0.00 - - - 0.85 - Peru 457 0.45 0.50 0.56 1.00 11.70 0.06 0.56 0.50 0.05 - 0.56 0.00 0.00 3.00 0.33 0.78 0.90 135.00 Philippines 950 0.72 0.70 0 0.00 11.97 0.05 0.63 0.80 0.01 64.00 0.57 4.39 0.00 3.00 0.83 0.83 0.94 106.00 Poland 2,345 0.30 0.31 0.92 0.00 12.98 0.04 0.32 0.82 0.03 - - 0.00 0.00 - - - 1.00 101.00 Portugal 403 0.17 0.17 0.79 1.00 12.29 -0.00 0.37 0.67 0.03 56.00 0.52 2.97 0.00 3.00 0.42 0.58 0.89 135.00 Qatar 134 0.15 0.15 1.00 1.00 11.47 0.12 0.99 0.92 0.04 - - - 0.00 - - - 0.93 - Romania 189 0.40 - 1.00 0.00 12.04 -0.01 0.16 0.78 0.02 - - - 0.00 - - - 0.98 145.00 Russian Federation
588 0.76 0.78 0 0.00 14.20 0.04 0.59 0.52 0.03 - - 20.00 0.00 - - - 1.00 145.00
Saudi Arabia 698 0.40 0.45 0 1.00 13.06 0.07 0.81 0.86 0.04 - - - 0.00 - - - 0.83 145.00 Singapore 4,948 0.02 0.02 1.00 0.00 12.11 0.06 1.74 3.94 0.18 79.00 0.49 7.86 1.00 4.00 1.00 0.87 0.94 62.00 Slovak Republic
23 0.34 0.36 1.00 0.00 11.43 0.02 0.14 1.62 0.03 - - - 0.00 - - - 1.00 51.00
Slovenia 179 0.17 0.20 0.83 0.00 10.68 0.02 0.27 1.26 0.02 - - - 0.00 - - - 1.00 132.00 South Africa 2,162 0.32 0.35 1.00 0.00 12.56 0.03 2.04 0.59 0.02 79.00 0.52 0.00 1.00 5.00 0.83 0.25 0.88 65.00 Spain 926 0.16 0.15 0.80 0.00 14.09 0.01 0.85 0.55 0.03 72.00 0.51 1.50 0.00 4.00 0.50 0.33 0.98 40.00 Sri Lanka 1,189 0.51 0.50 0.15 0.00 10.63 0.07 0.26 0.62 0.01 74.00 0.60 0.00 1.00 3.00 0.75 0.43 0.91 90.00 Sweden 3,060 0.02 0.02 0.83 0.00 13.03 0.02 1.01 0.86 0.04 83.00 0.28 1.07 0.00 3.00 0.58 0.50 1.00 (11.00) Switzerland 1,701 0.04 0.03 0 0.00 13.12 0.02 2.06 1.09 0.05 80.00 0.41 - 0.00 2.00 0.67 0.33 1.00 24.00

32
(continued on next page) Table II (continued)
Country (1) (2) (3) (4) (5) (6) (7) (8) (9) (10) (11) (12) (13) (14) (15) (16) (17) (18) (19) Taiwan 11,985 0.20 0.24 0 0.00 12.94 0.04 1.42 1.10 0.01 58.00 0.18 3.38 0.00 3.00 0.75 0.52 1.00 110.00 Thailand 3,503 0.46 0.50 0 0.00 12.42 0.04 0.74 1.41 0.03 66.00 0.47 15.05 1.00 2.00 0.92 0.72 0.94 108.00 Trinidad and Tobago
58 0.46 0.50 0.62 0.00 10.14 0.01 0.61 0.98 0.06 - - - 0.00 - - - 0.98 86.00
Tunisia 176 0.35 0.45 0 1.00 10.63 0.04 0.18 1.02 0.04 - - - 0.00 - - - 0.79 - Turkey 1,581 0.37 0.40 0.62 1.00 13.34 0.05 0.33 0.51 0.02 58.00 0.59 1.19 0.00 2.00 0.50 0.63 0.90 114.00 Ukraine 43 0.77 0.78 0.23 0.00 11.93 0.02 0.22 1.02 0.05 - - - 0.00 - - - 1.00 145.00 United Arab Emirates
281 0.17 0.17 1.00 0.00 12.55 0.03 0.30 1.50 0.03 - - - 0.00 - - - 0.90 145.00
United Kingdom
12,369 0.08 0.07 0.81 0.00 14.72 0.02 1.21 0.57 0.05 85.00 0.19 7.17 1.00 5.00 0.83 0.68 1.00 (19.00)
United States
42,367 0.11 0.11 0 0.00 16.45 0.02 1.19 0.27 0.02 76.00 0.20 0.20 1.00 5.00 1.00 0.90 1.00 (5.00)
Venezuela 64 0.80 0.79 0.56 1.00 12.32 0.04 0.14 0.51 0.01 - 0.51 0.00 0.00 1.00 0.17 0.55 0.94 145.00 Vietnam 1,089 0.64 0.66 0 0.00 11.72 0.06 0.18 1.53 0.07 - - - 0.00 - - - 0.93 80.00 Zambia 43 0.61 0.63 0.88 0.00 10.12 0.08 0.15 0.66 0.06 - - - 0.00 - - - 0.78 75.00 Zimbabwe 162 0.79 0.79 1.00 0.00 10.12 0.03 1.23 0.90 0.02 72.00 0.55 0.00 1.00 3.00 0.50 0.42 0.84 -
This table presents the mean of country-level variables. Column (1) reports number of observations; (2) CORRUPTION based on Transparency International; (3) CORRUPTION based on the World Bank; (4) IFRS; (5) MANDATORY_ROTATION; (6) logGDP; (7) GDP_GROWTH; (8) MARKET_CAP; (9)OPENNESS; (10) FDI; (11) CIFAR; (12) OWN_CONCERN; (13) POLI_CONCERN; (14) COMMON_LAW; (15) ANTIDIRECTOR; (16) DISCLOSURE; (17) PUBLIC_ENFO; (18) LITERACY; and (19) SECRECY, respectively. Appendix A provides variable definitions.

33
Table III Descriptive statistics. Variable n Mean STD 25% Median 75% BIG4 185,549 0.514 0.500 0.000 1.000 1.000CORRUPTION (Transparency International) 185,549 0.190 0.173 0.070 0.120 0.270CORRUTPION (World Bank) 184,860 0.209 0.209 0.060 0.100 0.310CROSS_LIST 185,549 0.040 0.195 0.000 0.000 0.000logASSET 185,549 4.840 2.213 3.464 4.842 6.240AR_INV 185,549 0.281 0.206 0.105 0.258 0.422PPE 185,549 0.288 0.245 0.077 0.228 0.444LEVERAGE 185,549 0.578 0.727 0.284 0.481 0.659LOSS 185,549 0.348 0.476 0.000 0.000 1.000TOBINQ 185,549 2.522 5.015 0.998 1.367 2.151ISSUE 185,549 0.682 0.466 0.000 1.000 1.000GLOBAL_EXPERT 185,549 0.404 0.491 0.000 0.000 1.000IFRS 185,549 0.279 0.448 0.000 0.000 1.000MANDATORY_ROTATION 185,549 0.091 0.288 0.000 0.000 0.000logGDP 185,549 14.143 1.681 12.760 14.194 15.806GDP_GROWTH 185,549 0.035 0.035 0.018 0.028 0.053MARKET_CAP 185,549 1.146 0.787 0.663 1.140 1.338OPENNESS 185,549 0.878 0.924 0.389 0.580 0.895 FDI 185,549 0.042 0.062 0.012 0.023 0.044
This table presents descriptive statistics for the sample spanning 2003-2012. Appendix A provides variable definitions.

34
Table IV Correlation
(1) (2) (3) (4) (5) (6) (7) (8) (9) (10) (11) (12) (13) (14) (15) (16) (17) (18) (19) (20) (21) (22) (23) (24) (25) (26) (27)(1) 1.0 1.0 0.1 0.1 0.1 0.1 0.0 -0.2 0.0 0.0 0.0 -0.2 0.4 -0.2 0.4 -0.4 -0.1 -0.2 -0.5 0.5 0.5 -0.5 -0.4 -0.3 -0.2 -0.7 0.7(2) 1.0 1.0 0.1 0.1 0.1 0.1 0.0 -0.2 0.0 0.0 -0.1 -0.2 0.5 -0.2 0.5 -0.3 -0.1 -0.1 -0.5 0.4 0.5 -0.5 -0.4 -0.3 -0.3 -0.7 0.7(3) 0.1 0.1 1.0 0.1 0.0 0.0 0.0 0.0 0.0 0.0 0.0 0.0 0.1 0.0 0.1 0.0 0.0 0.0 0.0 0.0 0.0 -0.1 0.0 0.0 0.0 0.0 0.1(4) 0.1 0.1 0.1 1.0 0.0 0.1 -0.2 -0.4 -0.4 0.1 0.0 0.0 0.1 0.1 0.0 0.0 0.0 0.0 -0.1 0.1 0.0 -0.2 -0.1 -0.1 -0.1 -0.1 0.1(5) 0.2 0.2 0.0 0.0 1.0 -0.3 0.1 -0.2 -0.1 0.0 -0.1 0.1 0.1 -0.1 0.1 0.0 0.1 0.0 -0.1 0.1 0.1 -0.2 -0.2 -0.1 -0.2 -0.1 0.2(6) 0.1 0.1 0.0 0.2 -0.2 1.0 -0.1 0.0 -0.1 0.1 0.1 -0.1 0.0 -0.1 0.1 -0.1 0.0 0.0 -0.1 0.1 0.1 0.0 0.0 0.0 0.0 -0.1 0.1(7) 0.1 0.1 0.0 0.2 0.3 0.0 1.0 0.2 0.6 0.0 0.0 0.0 0.0 0.2 -0.1 0.0 -0.1 -0.1 0.0 -0.1 -0.1 0.0 0.1 0.1 0.1 0.0 -0.1(8) -0.2 -0.2 0.0 -0.4 -0.2 -0.1 0.0 1.0 0.2 0.0 0.0 0.0 -0.1 0.1 -0.2 0.0 -0.1 0.0 0.1 -0.1 -0.1 0.2 0.2 0.1 0.2 0.2 -0.3(9) -0.1 0.0 0.0 -0.1 -0.1 -0.1 0.0 0.0 1.0 0.0 0.0 -0.1 0.0 0.2 0.0 0.0 -0.1 -0.1 0.0 -0.1 -0.1 0.1 0.1 0.1 0.1 0.0 -0.1(10) 0.0 0.0 0.0 0.1 0.0 0.1 0.1 0.0 0.0 1.0 0.0 0.0 0.0 0.0 0.0 0.0 0.0 0.0 0.0 0.0 0.0 0.0 0.0 0.0 0.0 0.0 0.0(11) -0.1 -0.1 0.0 0.0 -0.1 0.1 0.0 0.0 0.0 0.0 1.0 0.0 -0.1 0.0 0.0 0.0 0.0 0.0 0.1 0.0 0.0 0.1 0.0 0.0 0.1 0.0 -0.1(12) -0.2 -0.2 0.0 0.0 0.1 -0.1 0.1 0.0 -0.1 0.0 0.0 1.0 0.0 -0.2 -0.2 -0.2 0.1 0.1 0.2 0.2 0.0 -0.2 -0.3 -0.4 -0.4 0.0 0.0(13) 0.4 0.4 0.1 0.1 0.1 0.0 0.0 -0.1 0.0 0.0 -0.1 0.0 1.0 0.0 0.2 -0.3 -0.1 -0.1 -0.2 0.3 0.2 -0.3 -0.3 -0.3 -0.1 -0.3 0.3(14) -0.1 0.0 0.0 0.1 -0.1 -0.2 0.1 0.1 0.3 0.0 0.0 -0.2 0.0 1.0 -0.2 -0.1 -0.6 -0.3 0.2 -0.7 -0.4 0.3 0.4 0.4 0.4 0.4 -0.6(15) 0.3 0.3 0.1 0.0 0.1 0.1 -0.1 -0.2 0.1 0.0 0.0 -0.2 0.2 -0.3 1.0 0.1 0.2 0.2 -0.1 0.2 0.2 -0.2 -0.1 0.0 0.0 -0.4 0.4(16) -0.4 -0.3 -0.1 -0.1 -0.1 -0.1 -0.1 0.1 0.1 0.0 0.0 -0.2 -0.3 0.0 0.1 1.0 0.7 0.7 0.1 0.1 0.0 0.4 0.4 0.4 0.3 0.2 -0.1(17) 0.0 0.0 0.0 0.0 0.1 0.1 -0.1 -0.2 -0.3 0.0 0.0 0.3 -0.1 -0.8 0.2 0.1 1.0 0.8 -0.1 0.5 0.3 0.1 0.0 0.1 0.0 -0.1 0.3(18) -0.1 -0.1 0.1 0.0 0.0 0.0 -0.1 -0.1 0.0 0.1 0.0 0.1 0.1 -0.3 0.3 0.1 0.4 1.0 0.1 0.3 0.1 0.2 0.1 0.1 0.1 0.0 0.1(19) -0.4 -0.4 0.0 -0.1 -0.1 -0.1 -0.1 0.1 0.1 0.0 0.1 0.2 -0.2 0.1 -0.1 0.2 -0.2 0.3 1.0 -0.2 0.1 0.6 0.5 0.4 0.4 0.1 -0.6(20) 0.1 0.1 0.0 0.0 0.1 0.1 0.0 -0.1 -0.2 0.0 0.0 0.2 0.3 -0.6 0.2 -0.2 0.4 0.3 -0.2 1.0 0.4 -0.3 -0.5 -0.5 -0.4 -0.6 0.6(21) 0.1 0.1 0.0 0.0 0.1 0.1 0.0 -0.1 -0.2 0.0 0.0 0.2 0.2 -0.5 0.2 0.1 0.7 0.2 0.0 0.2 1.0 0.0 -0.2 0.0 -0.1 -0.6 0.5(22) -0.4 -0.4 -0.1 -0.2 -0.2 -0.1 -0.1 0.2 0.1 0.0 0.1 -0.2 -0.3 0.2 -0.2 0.5 -0.3 0.0 0.4 -0.2 -0.2 1.0 0.8 0.8 0.7 0.2 -0.6(23) -0.3 -0.2 0.0 -0.1 -0.2 -0.1 -0.1 0.2 0.2 0.0 0.0 -0.2 -0.3 0.5 -0.1 0.4 -0.4 0.0 0.3 -0.4 -0.4 0.8 1.0 0.8 0.7 0.3 -0.6(24) -0.1 0.0 0.0 0.0 -0.1 -0.1 0.0 0.1 0.1 0.0 0.0 -0.4 -0.3 0.5 0.0 0.4 -0.4 0.0 0.2 -0.4 -0.3 0.8 0.8 1.0 0.8 0.2 -0.4(25) -0.2 -0.2 0.0 -0.1 -0.2 -0.1 -0.1 0.2 0.2 0.0 0.1 -0.5 -0.2 0.5 -0.1 0.3 -0.6 0.0 0.3 -0.3 -0.5 0.7 0.7 0.8 1.0 0.2 -0.4(26) -0.7 -0.7 -0.1 -0.1 -0.1 -0.2 0.0 0.2 0.1 0.0 0.0 -0.1 -0.4 0.4 -0.5 0.3 -0.3 -0.3 0.1 -0.7 -0.3 0.3 0.4 0.2 0.3 1.0 -0.6(27) 0.6 0.6 0.1 0.1 0.2 0.2 0.0 -0.2 -0.2 0.0 -0.1 -0.1 0.3 -0.6 0.4 -0.2 0.5 0.1 -0.6 0.6 0.4 -0.6 -0.6 -0.4 -0.5 -0.7 1.0This table presents correlations between the variables used in regressions. Pearson correlations are shown in the upper right half and Spearman correlations are shown in the bottom left half. Bold denotes significant difference from 0 at the 5% level or higher. Variable (1) CORRUPTION based on Transparency International; (2) CORRUPTION based on the World Bank; (3) CROSS_LIST; (4) logASSET; (5) AR_INV; (6) PPE; (7) LEVERAGE; (8) LOSS; (9) TOBINQ; (10) ISSUE; (11) GLOBAL_EXPERT; (12) IFRS; (13) MANDATORY_ROTATION; (14) logGDP; (15) GDP_GROWTH; (16) MARKET_CAP; (17) OPENNESS; (18) FDI; (19) CIFAR; (20) OWN_CONCERN; (21) POLI_CONCERN; (22) COMMON_LAW; (23) ANTIDIRECTOR; (24) DISCLOSURE; (25) PUBLIC_ENFO; (26) LITERACY; and (27) SECRECY, respectively. Appendix A provides variable definitions.
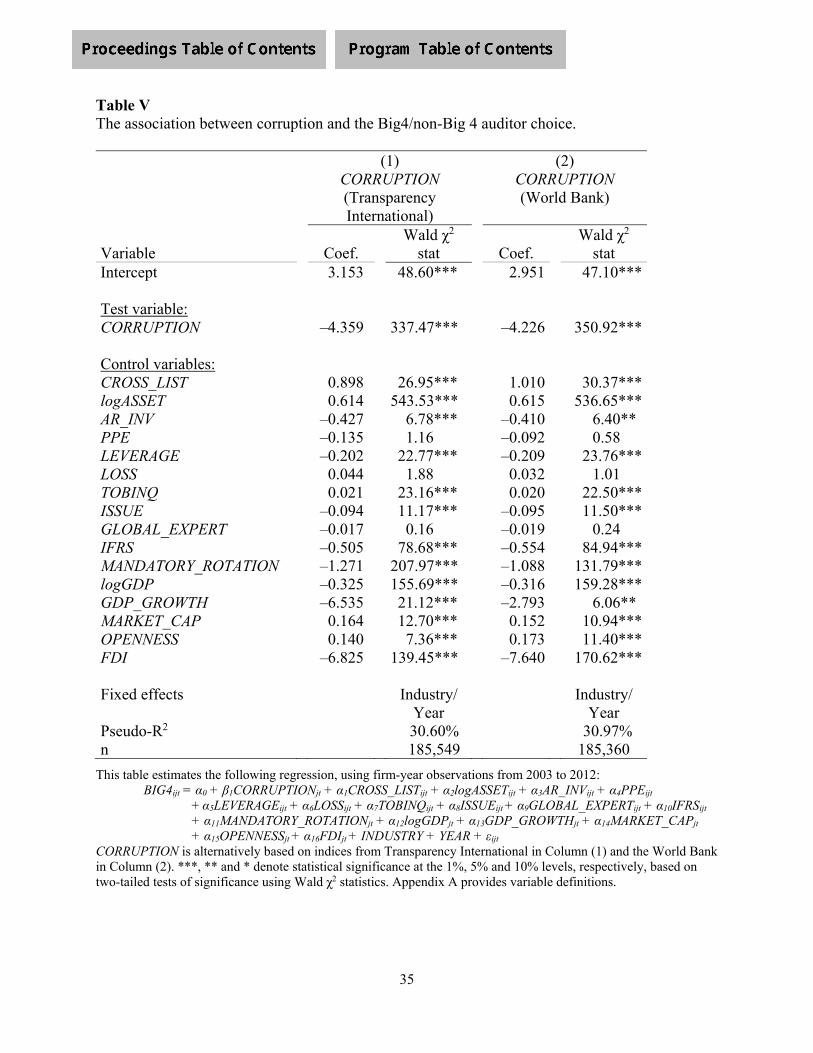
35
Table V The association between corruption and the Big4/non-Big 4 auditor choice.
(1) CORRUPTION (Transparency International)
(2) CORRUPTION (World Bank)
Variable
Coef.
Wald χ2 stat
Coef.
Wald χ2 stat
Intercept
3.153
48.60***
2.951
47.10***
Test variable:
CORRUPTION
–4.359
337.47***
–4.226
350.92***
Control variables:
CROSS_LIST
0.898
26.95***
1.010
30.37*** logASSET
0.614
543.53***
0.615
536.65*** AR_INV
–0.427
6.78***
–0.410
6.40** PPE
–0.135
1.16
–0.092
0.58 LEVERAGE
–0.202
22.77***
–0.209
23.76*** LOSS
0.044
1.88
0.032
1.01 TOBINQ
0.021
23.16***
0.020
22.50*** ISSUE
–0.094
11.17***
–0.095
11.50*** GLOBAL_EXPERT
–0.017
0.16
–0.019
0.24 IFRS
–0.505
78.68***
–0.554
84.94*** MANDATORY_ROTATION
–1.271
207.97***
–1.088
131.79*** logGDP
–0.325
155.69***
–0.316
159.28*** GDP_GROWTH
–6.535
21.12***
–2.793
6.06** MARKET_CAP
0.164
12.70***
0.152
10.94*** OPENNESS
0.140
7.36***
0.173
11.40*** FDI
–6.825
139.45***
–7.640
170.62***
Fixed effects
Industry/ Year
Industry/ Year
Pseudo-R2
30.60%
30.97% n
185,549
185,360
This table estimates the following regression, using firm-year observations from 2003 to 2012: BIG4ijt = α0 + β1CORRUPTIONjt + α1CROSS_LISTijt + α2logASSETijt + α3AR_INVijt + α4PPEijt
+ α5LEVERAGEijt + α6LOSSijt + α7TOBINQijt + α8ISSUEijt + α9GLOBAL_EXPERTijt + α10IFRSijt + α11MANDATORY_ROTATIONjt + α12logGDPjt + α13GDP_GROWTHjt + α14MARKET_CAPjt + α15OPENNESSjt + α16FDIjt + INDUSTRY + YEAR + εijt
CORRUPTION is alternatively based on indices from Transparency International in Column (1) and the World Bank in Column (2). ***, ** and * denote statistical significance at the 1%, 5% and 10% levels, respectively, based on two-tailed tests of significance using Wald χ2 statistics. Appendix A provides variable definitions.
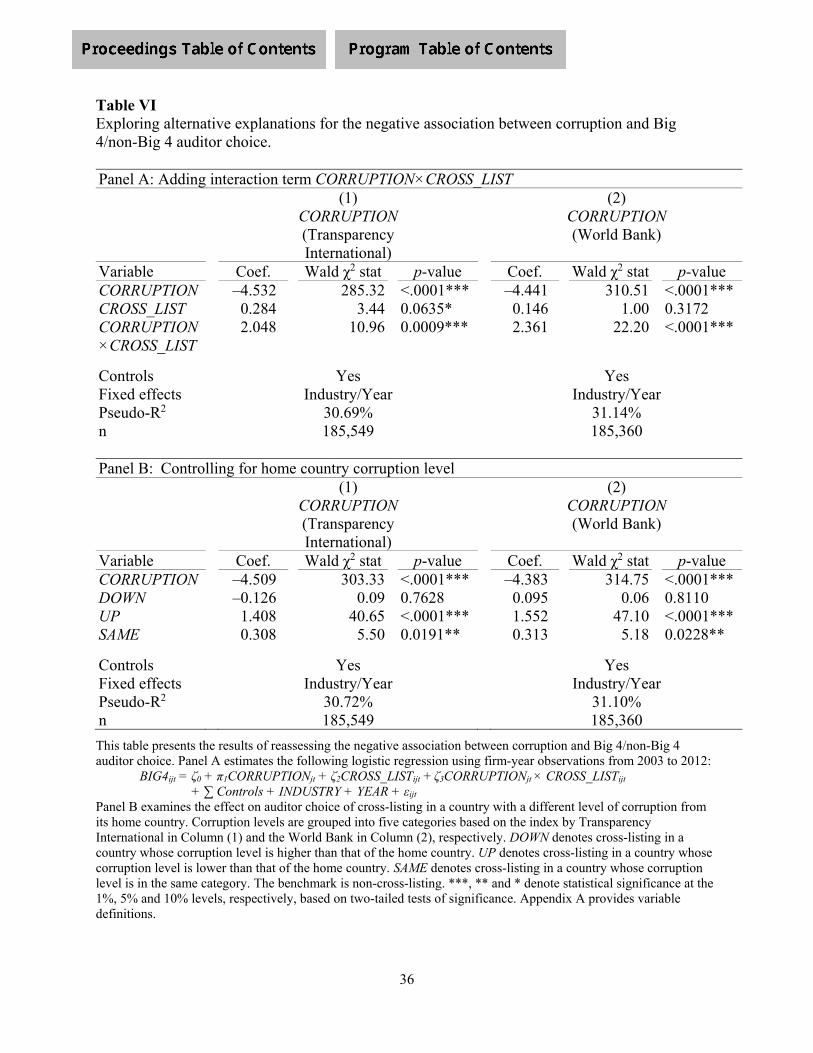
36
Table VI Exploring alternative explanations for the negative association between corruption and Big 4/non-Big 4 auditor choice. Panel A: Adding interaction term CORRUPTION×CROSS_LIST (1)
CORRUPTION (Transparency International)
(2) CORRUPTION (World Bank)
Variable Coef. Wald χ2 stat p-value Coef. Wald χ2 stat p-value CORRUPTION –4.532 285.32 <.0001*** –4.441 310.51 <.0001*** CROSS_LIST 0.284 3.44 0.0635* 0.146 1.00 0.3172 CORRUPTION×CROSS_LIST
2.048 10.96 0.0009*** 2.361 22.20 <.0001***
Controls Yes Yes Fixed effects Industry/Year Industry/Year Pseudo-R2 30.69% 31.14% n 185,549 185,360 Panel B: Controlling for home country corruption level (1)
CORRUPTION (Transparency International)
(2) CORRUPTION (World Bank)
Variable Coef. Wald χ2 stat p-value Coef. Wald χ2 stat p-value CORRUPTION –4.509 303.33 <.0001*** –4.383 314.75 <.0001*** DOWN –0.126 0.09 0.7628 0.095 0.06 0.8110 UP 1.408 40.65 <.0001*** 1.552 47.10 <.0001*** SAME 0.308 5.50 0.0191** 0.313 5.18 0.0228**
Controls Yes Yes Fixed effects Industry/Year Industry/Year Pseudo-R2 30.72% 31.10% n 185,549 185,360
This table presents the results of reassessing the negative association between corruption and Big 4/non-Big 4 auditor choice. Panel A estimates the following logistic regression using firm-year observations from 2003 to 2012:
BIG4ijt = ζ0 + π1CORRUPTIONjt + ζ2CROSS_LISTijt + ζ3CORRUPTIONjt × CROSS_LISTijt
+ ∑ Controls + INDUSTRY + YEAR + εijt Panel B examines the effect on auditor choice of cross-listing in a country with a different level of corruption from its home country. Corruption levels are grouped into five categories based on the index by Transparency International in Column (1) and the World Bank in Column (2), respectively. DOWN denotes cross-listing in a country whose corruption level is higher than that of the home country. UP denotes cross-listing in a country whose corruption level is lower than that of the home country. SAME denotes cross-listing in a country whose corruption level is in the same category. The benchmark is non-cross-listing. ***, ** and * denote statistical significance at the 1%, 5% and 10% levels, respectively, based on two-tailed tests of significance. Appendix A provides variable definitions.
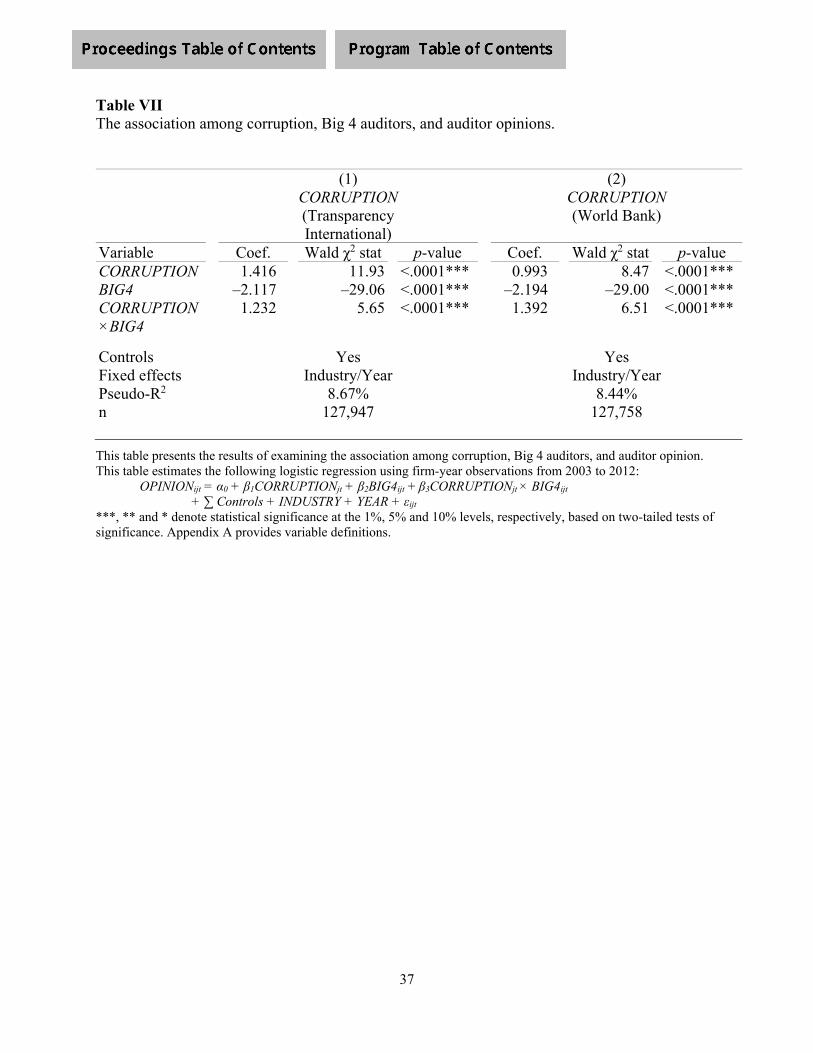
37
Table VII The association among corruption, Big 4 auditors, and auditor opinions.
(1)
CORRUPTION (Transparency International)
(2) CORRUPTION (World Bank)
Variable Coef. Wald χ2 stat p-value Coef. Wald χ2 stat p-value CORRUPTION 1.416 11.93 <.0001*** 0.993 8.47 <.0001*** BIG4 –2.117 –29.06 <.0001*** –2.194 –29.00 <.0001*** CORRUPTION×BIG4
1.232 5.65 <.0001*** 1.392 6.51 <.0001***
Controls Yes Yes Fixed effects Industry/Year Industry/Year Pseudo-R2 8.67% 8.44% n 127,947 127,758
This table presents the results of examining the association among corruption, Big 4 auditors, and auditor opinion. This table estimates the following logistic regression using firm-year observations from 2003 to 2012:
OPINIONijt = α0 + β1CORRUPTIONjt + β2BIG4ijt + β3CORRUPTIONjt × BIG4ijt
+ ∑ Controls + INDUSTRY + YEAR + εijt ***, ** and * denote statistical significance at the 1%, 5% and 10% levels, respectively, based on two-tailed tests of significance. Appendix A provides variable definitions.

38
Table VIII Sensitivity tests: Propensity score and firm size matching
This table presents the results of examining the association between corruption and audit choice by matching firms hiring Big 4 auditors with those not hiring Big 4 auditors using propensity score matching and firm size matching, respectively. This table estimates the following regression, covering the sample period from 2003 to 2012:
BIG4ijt = α0 + β1CORRUPTIONjt + α1CROSS_LISTijt + α2logASSETijt + α3AR_INVijt + α4PPEijt + α5LEVERAGEijt + α6LOSSijt + α7TOBINQijt + α8ISSUEijt + α9GLOBAL_EXPERTijt + α10IFRSijt + α11MANDATORY_ROTATIONjt + α12logGDPjt + α13GDP_GROWTHjt + α14MARKET_CAPjt + α15OPENNESSjt + α16FDIjt + INDUSTRY + YEAR + εijt
CORRUPTION is alternatively based on indices from Transparency International in Columns (1) and (2) and the World Bank in Columns (3) and (4). ***, ** and * denote statistical significance at the 1%, 5% and 10% levels, respectively, based on two-tailed tests of significance. Appendix A provides variable definitions.
CORRUPTION (Transparency International)
CORRUPTION (World Bank)
(1) Propensity
score matching
(2) Firm size matching
(3) Propensity
score matching
(4) Firm size matching
Variable Coef. Coef. Coef. Coef. Intercept 5.074*** 5.085*** 2.780*** 2.759*** Experimental variable: CORRUPTION –4.559*** –4.528*** –4.227*** –4.266*** Control variables: CROSS_LIST 1.110*** 1.092*** 1.153*** 1.156*** logASSET 0.547*** 0.547*** 0.554*** 0.555*** AR_INV 0.089 0.094 0.081 0.071 PPE –0.008 –0.019 –0.003 0.012 LEVERAGE –0.243*** –0.208*** –0.336*** –0.341*** LOSS –0.012 –0.037 –0.018 –0.015 TOBINQ 0.023*** 0.021*** 0.022*** 0.023*** ISSUE –0.117*** –0.138*** –0.135*** –0.139*** GLOBAL_EXPERT –0.041 –0.020 0.004 0.013 IFRS –0.447*** –0.451*** –0.459*** –0.476*** MANDATORY_ROTATION –0.906*** –0.933*** –0.957*** –0.960*** logGDP –0.461*** –0.461*** –0.293*** –0.290*** GDP_GROWTH –6.048*** –6.311*** –3.798*** –3.497*** MARKET__CAP 0.074* 0.084** 0.135*** 0.133*** OPENNESS 0.094* 0.077 0.176*** 0.157*** FDI –5.895*** –5.754*** –7.408*** –7.194*** Fixed effects Industry/Year Industry/Year Industry/Year Industry/Year Pseudo-R2 28.39% 28.56% 29.00% 29.33% n 94,122 86,246 106,212 98,136
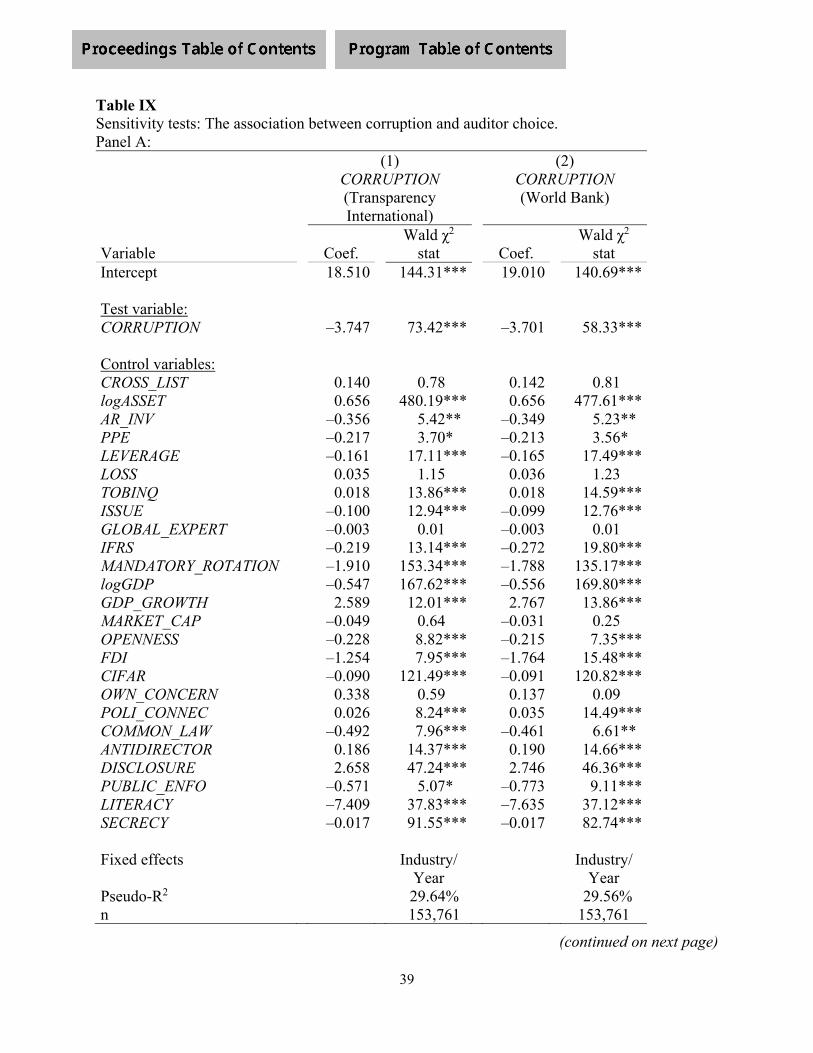
39
Table IX Sensitivity tests: The association between corruption and auditor choice. Panel A:
(1) CORRUPTION (Transparency International)
(2) CORRUPTION (World Bank)
Variable
Coef.
Wald χ2 stat
Coef.
Wald χ2 stat
Intercept
18.510
144.31***
19.010
140.69***
Test variable:
CORRUPTION
–3.747
73.42***
–3.701
58.33***
Control variables:
CROSS_LIST
0.140
0.78
0.142
0.81 logASSET
0.656
480.19***
0.656
477.61*** AR_INV
–0.356
5.42**
–0.349
5.23** PPE
–0.217
3.70*
–0.213
3.56* LEVERAGE
–0.161
17.11***
–0.165
17.49*** LOSS
0.035
1.15
0.036
1.23 TOBINQ
0.018
13.86***
0.018
14.59*** ISSUE
–0.100
12.94***
–0.099
12.76*** GLOBAL_EXPERT
–0.003
0.01
–0.003
0.01 IFRS
–0.219
13.14***
–0.272
19.80*** MANDATORY_ROTATION
–1.910
153.34***
–1.788
135.17*** logGDP
–0.547
167.62***
–0.556
169.80*** GDP_GROWTH
2.589
12.01***
2.767
13.86*** MARKET_CAP
–0.049
0.64
–0.031
0.25 OPENNESS
–0.228
8.82***
–0.215
7.35*** FDI
–1.254
7.95***
–1.764
15.48*** CIFAR
–0.090
121.49***
–0.091
120.82*** OWN_CONCERN
0.338
0.59
0.137
0.09 POLI_CONNEC
0.026
8.24***
0.035
14.49*** COMMON_LAW
–0.492
7.96***
–0.461
6.61** ANTIDIRECTOR
0.186
14.37***
0.190
14.66*** DISCLOSURE
2.658
47.24***
2.746
46.36*** PUBLIC_ENFO
–0.571
5.07*
–0.773
9.11*** LITERACY
–7.409
37.83***
–7.635
37.12*** SECRECY
–0.017
91.55***
–0.017
82.74***
Fixed effects
Industry/ Year
Industry/ Year
Pseudo-R2
29.64%
29.56% n
153,761
153,761
(continued on next page)
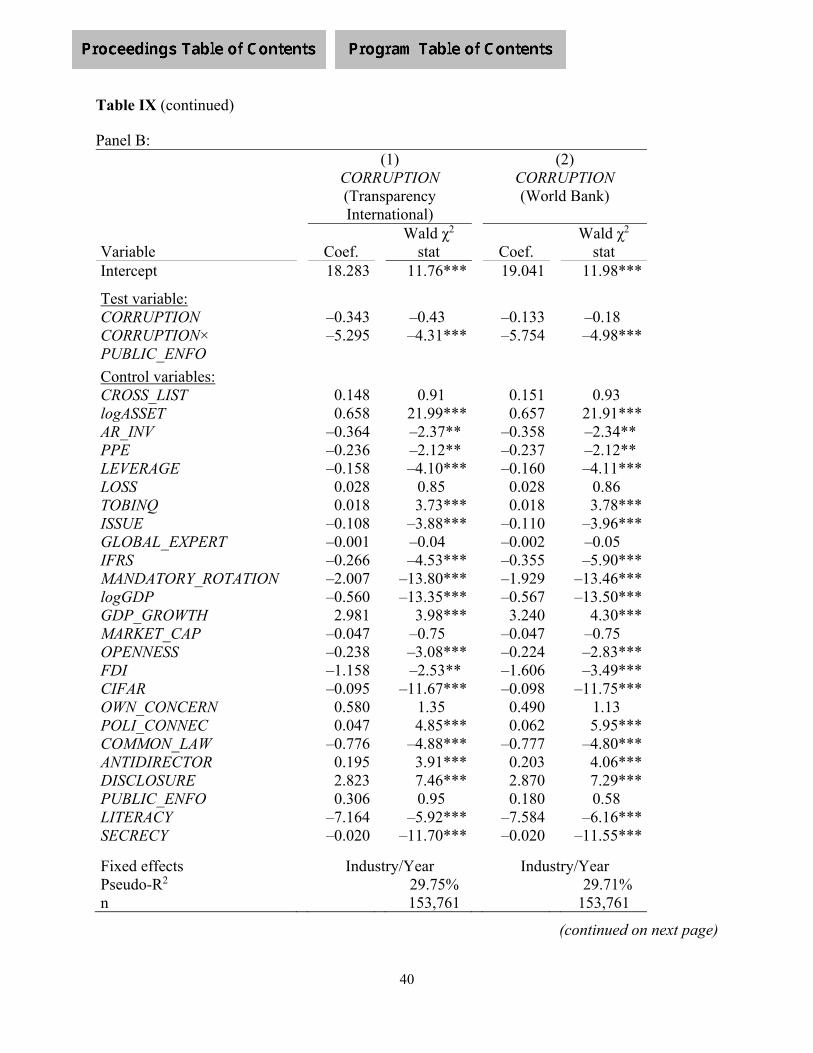
40
Table IX (continued) Panel B:
(1) CORRUPTION (Transparency International)
(2) CORRUPTION (World Bank)
Variable
Coef.
Wald χ2 stat
Coef.
Wald χ2 stat
Intercept
18.283
11.76***
19.041
11.98***
Test variable:
CORRUPTION
–0.343
–0.43
–0.133
–0.18 CORRUPTION× PUBLIC_ENFO
–5.295
–4.31***
–5.754
–4.98***
Control variables:
CROSS_LIST
0.148
0.91
0.151
0.93 logASSET
0.658
21.99***
0.657
21.91*** AR_INV
–0.364
–2.37**
–0.358
–2.34** PPE
–0.236
–2.12**
–0.237
–2.12** LEVERAGE
–0.158
–4.10***
–0.160
–4.11*** LOSS
0.028
0.85
0.028
0.86 TOBINQ
0.018
3.73***
0.018
3.78*** ISSUE
–0.108
–3.88***
–0.110
–3.96*** GLOBAL_EXPERT
–0.001
–0.04
–0.002
–0.05 IFRS
–0.266
–4.53***
–0.355
–5.90*** MANDATORY_ROTATION
–2.007
–13.80***
–1.929
–13.46*** logGDP
–0.560
–13.35***
–0.567
–13.50*** GDP_GROWTH
2.981
3.98***
3.240
4.30*** MARKET_CAP
–0.047
–0.75
–0.047
–0.75 OPENNESS
–0.238
–3.08***
–0.224
–2.83*** FDI
–1.158
–2.53**
–1.606
–3.49*** CIFAR
–0.095
–11.67***
–0.098
–11.75*** OWN_CONCERN
0.580
1.35
0.490
1.13 POLI_CONNEC
0.047
4.85***
0.062
5.95*** COMMON_LAW
–0.776
–4.88***
–0.777
–4.80*** ANTIDIRECTOR
0.195
3.91***
0.203
4.06*** DISCLOSURE
2.823
7.46***
2.870
7.29*** PUBLIC_ENFO
0.306
0.95
0.180
0.58 LITERACY
–7.164
–5.92***
–7.584
–6.16*** SECRECY
–0.020
–11.70***
–0.020
–11.55***
Fixed effects
Industry/Year
Industry/Year Pseudo-R2
29.75%
29.71% n
153,761
153,761
(continued on next page)

41
Table IX (continued)
Panel A estimates the following regression, using firm-year observations from 2003 to 2012: BIG4ijt = α0 + β1CORRUPTIONjt + α1CROSS_LISTijt + α2logASSETijt + α3AR_INVijt + α4PPEijt
+ α5LEVERAGEijt + α6LOSSijt + α7TOBINQijt + α8ISSUEijt + α9GLOBAL_EXPERTijt + α10IFRSijt + α11MANDATORY_ROTATIONjt + α12logGDPjt + α13GDP_GROWTHjt + α14MARKET_CAPjt + α15OPENNESSjt + α16FDIjt + α17CIFARjt + α18OWN_CONCERNjt + α19POLI_CONNECjt + α20COMMON_LAWjt + α21ANTIDIRECTORjt + α22DISCLOSUREjt + α23PUBLIC_ENFOjt + α24LITERACYjt + α25SECRECYjt +INDUSTRY + YEAR + εijt
Panel B estimates a similar regression and include the interaction term CORRUPTION×PUBLIC_ENFO. CORRUPTION is alternatively based on indices from Transparency International in Column (1) and the World Bank in Column (2). ***, ** and * denote statistical significance at the 1%, 5% and 10% levels, respectively, based on two-tailed tests of significance using Wald χ2 statistics. Appendix A provides variable definitions.