Occupation, Class and Social Networks in Urban China
10
Occupation, Class, and Social Networks in Urban China Bian Yanjie (Department of Social Sciences, Hong Kong University of Science and Technology), Ronald Breiger (University of Arizona), Deborah Davis (Yale University), Joseph Galaskiewicz (University of Arizona) Abstract :China’s class structure is changing dramatically in the wake of post-1978 market-oriented economic reforms. The creation of a mixed “market-socialist” economy has eroded the institutional bases of a cadre-dominated social hierarchy and created conditions for a new pattern of social stratification. Although conditions remain dynamic,results of a 1998 urban survey that measured strength and diversity of social ties among 400 households in Tianjin , Shanghai , Wuhan , and Shenzhen documented networks of social exchange that identify a class structure distinct from the cadre-dominated social hierarchy of the Mao era. In particular , analysis of visiting during the Lunar New Year celebration suggests an urban society simultaneously divided along two axes : one by economic success in the more privatized economy and one by distinctions in political authority at the workplace. Thus contrary to those who privilege market transactions as the primary engine for creating a new class hierarchy, we conclude that to understand processes of social stratification one needs theories and methods that work simultaneously with multiple dynamics of class differentiation rather than presuming linear hierarchy. In this paper, all the statistics is from a one-year investigation, which was to reveal the living standards and social living condition of each class who has gain diverse benefits from the market-oriented reforms. In particular, we’ve collected datum from four hundred families whose householders included cadres, managers of state-owned enterprise, technical professionals, workers and migrant workers who all lived in the four largest cities (Shanghai, Shenzhen, Tianjin and Wuhan), each of which covered 100 family samples. For getting sufficient number of samples, we’ve adopted the quota sampling method. Studying the occupational distribution of the whole population contrastively, we found out that samples of cadres, managers of state-owned enterprises and technical professionals occupied a higher proportion
Transcript of Occupation, Class and Social Networks in Urban China

Occupation, Class, and Social Networks in Urban China
Bian Yanjie (Department of Social Sciences, Hong Kong University of Science and Technology),
Ronald Breiger (University of Arizona), Deborah Davis (Yale University), Joseph Galaskiewicz (University of Arizona)
Abstract:China’s class structure is changing dramatically in the wake of post-1978
market-oriented economic reforms. The creation of a mixed “market-socialist”
economy has eroded the institutional bases of a cadre-dominated social hierarchy and
created conditions for a new pattern of social stratification. Although conditions
remain dynamic,results of a 1998 urban survey that measured strength and diversity
of social ties among 400 households in Tianjin , Shanghai , Wuhan , and
Shenzhen documented networks of social exchange that identify a class structure
distinct from the cadre-dominated social hierarchy of the Mao era. In
particular,analysis of visiting during the Lunar New Year celebration suggests an
urban society simultaneously divided along two axes:one by economic success in
the more privatized economy and one by distinctions in political authority at the
workplace. Thus contrary to those who privilege market transactions as the primary
engine for creating a new class hierarchy, we conclude that to understand processes
of social stratification one needs theories and methods that work simultaneously with
multiple dynamics of class differentiation rather than presuming linear hierarchy.
In this paper, all the statistics is from a one-year investigation, which was to
reveal the living standards and social living condition of each class who has gain
diverse benefits from the market-oriented reforms. In particular, we’ve collected
datum from four hundred families whose householders included cadres, managers of
state-owned enterprise, technical professionals, workers and migrant workers who all
lived in the four largest cities (Shanghai, Shenzhen, Tianjin and Wuhan), each of
which covered 100 family samples. For getting sufficient number of samples, we’ve
adopted the quota sampling method. Studying the occupational distribution of the
whole population contrastively, we found out that samples of cadres, managers of
state-owned enterprises and technical professionals occupied a higher proportion
while the sample proportion of workers, employees of service industry and migrant
workers were slightly lower. To avoid subjectivity, we firstly selected neighborhood
committees randomly in each city, and then took random samples from families in
various occupational classes according to the occupational categories registered by the
neighborhood committees. Referring to statistics of the sub-career population in the
2000 Census, occupations of the householders in our samples accounted for 80
percent of the total employees in all occupations in the four cities and 88 percent in
the national wide, as shown in Table one. Thus we have reasons to believe that the
conclusions of our analysis may reflect the general situation in urban China.
From January 1998 to January 1999, our investigators had four visiting surveys
of each family; the interval between two surveys was approximately three months. In
addition to a 60-90-minute face-to-face interview with the couple, we also asked them
to keep a daily record of social exchange: the first of which would record the Spring
Festival of 1998, and the second would be a record of situation in May of 1998. And
in this paper we will make use of the recorded materials on the social exchange of six
days during the Spring Festival (from New Year Eve to the fifth day of the spring
Festival). There are many different ways to assess the scope and intensity of social
exchange, but in Chinese families, regardless of the income level, people will more or
less involve in the exchange and visiting during the Lunar New Year celebration.
Therefore, we believe that Lunar New Year visiting is good focus when we have pilot
study on the mechanisms and modals of social exchange.
As in rural areas, in urban China social gathering and visiting are significant
moments that individuals and families develop, maintain or interrupt social
relationship (Yang, 1994; Yan, 1996). For example, being invited to a wedding,
funeral, birthday gathering or banquet means that you are one of the members in its
social network (Bian, 2001). Among many important moments of shaping exchange
models, the Lunar New Year is the most prevalent festival all over the country. Since
1949, the government has provided urban laborers for one-week long holiday.
Traditional celebrations began at the Lunar New Year's Eve and continued until the
fifteenth day, there were traditional celebrations or banquets every day. In recent
years, New Year greetings by phones have become popular, but among the core
members of the social networks, mutual visiting is still important social activities.
Although not everyone is the core member of the network, through a lot of
observation, we found out that there must be some core members of the network
among the visitors: no mutual visiting between close friends and relatives during the
Lunar New Year period is not justified (Bian Yanjie and Li Yu, 2001). Therefore,
basing on the event, social exchange during the Spring Festival is an important mean
of measuring the core members, the strength and composition of social network. It is
different from the survey of the neighborhood or the occasional exchange or
gathering, Gould’s (1993) Paris-use materials is an example. In our sample, each
family received an average of 17 visitors and received 20 telephone greetings, 44
percent of whom were relatives and 25 percent were friends, 20 percent were
colleagues, 8 percent were neighbors and 3 percent are other relations.
When recording the occupational class of those ones who paid New Year visits,
we adopted position methods which based on occupations (which was called position
generator),was invented for measuring the network structure with a center of
individuals (Lin and Dumin, 1986). Just as the survey of the occupational prestige,
these measurements could only bring in a small number of occupational types, but
they could be supposed to cover most of the occupations from different angles of the
prestige, socio-economic status or the possession of resources. In accordance with
purposes of our research, we firstly selected 20 types of occupations with various
occupational prestige and which were representative. At the same time, for the
facilitation of comparison, occupation being selected was basically limited to the one
whose prestige has accumulated a certain study (Lin and Xie, 1988; Bian, 1996).
During the interviews, we asked the respondent families to confirm that when paying
New Year visits, whether their exchange objects belonged to the categories of 20
occupations, and due to the wee records, there were 7 types of occupations that had
been incorporated into similar occupational groups; thus came out the 13 occupations
in Table One. Although these selected occupations did not represent all the urban
occupations, they had covered 80 percent of them and 88 percent of all the
occupations in the four cities which were the source of our sample (as shown in Table
one). In addition, these occupations reflected the differentiation configuration of the
power and professional skills of each class. Because of the limited information, the
factor that whether there is property right has not been and could not be added to the
occupation list.

Occupations of the householders have been divided into 13 types, which led to a
13 to 13 occupation exchange matrix, respectively on behalf of the respondents’
occupation and occupational status of individuals and families who pay New Year
visits. And this matrix is the data we analyzed and explained in this paper.
(1) Model and Analysis
Our model is based on the following contingency tables, we take occupation as
analytical unit to list contingency tables with a total of 13 by 13 boxes, and the
content is the respective frequency of the exchange among 13 occupations in Spring
Festival, details shown in Table Two.
To evaluate how much extent our research assumptions will consist with observation
values in Table Two, in other words, to observe whether the assumption accord with
the social reality, we have adopted the modeling strategy which used by Goodman
when he listed contingency tables for the homogeneity assessment(Goodman, 1981).
That is, expectation frequency (F) in each box is divided into five parts:
in which, when i belongs to class k, equals , and (1)
when (i, j) belong to sub-table s (k, l), equals
In the above expressions, is the expectation frequency of each box estimated by
using the model, the subscript letter i and j respectively refers to the occupations of
interviewees (horizontal row) and occupations of respondents who pay New Year
visits(vertical row). Letter k and l respectively represents to the class of interviewees
and the class of respondents who pay New Year visits, u represents parameters to be
estimated. When all the items and reach zero, then formula (1) will be
simplified to a fully independent model, the signification is that exchanges between
classes are immune to occupational attribution and boundaries between occupations.
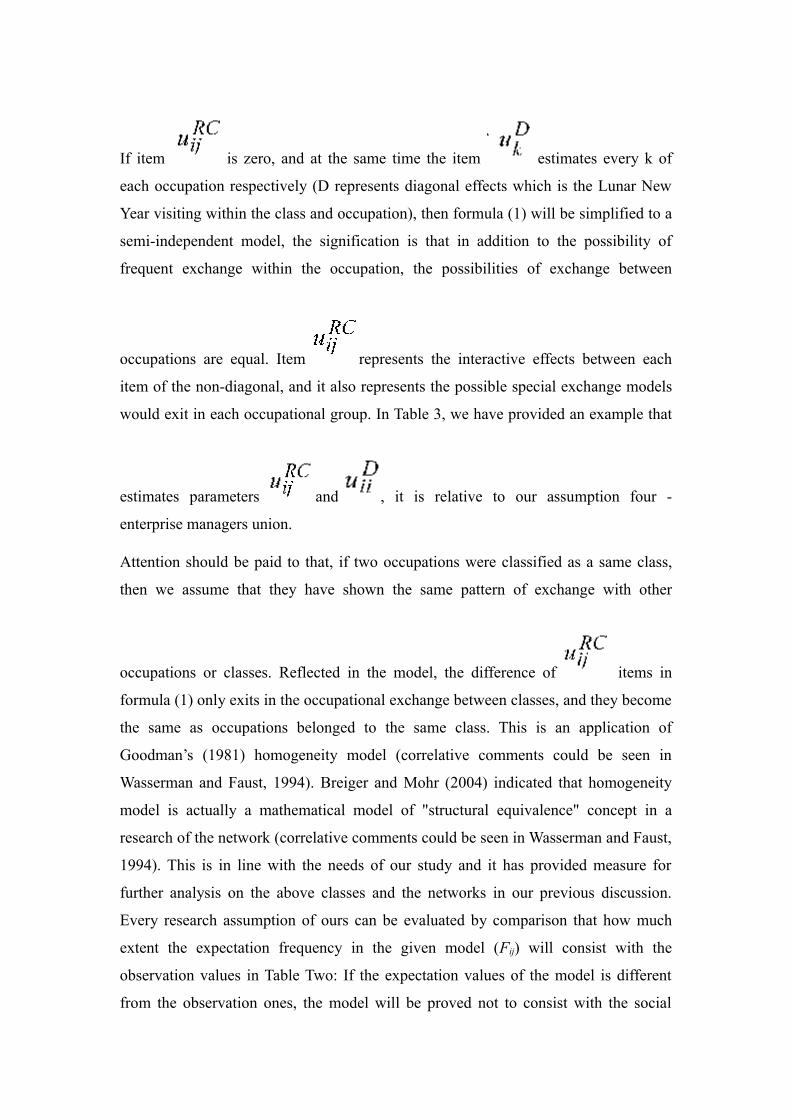
If item is zero, and at the same time the item estimates every k of
each occupation respectively (D represents diagonal effects which is the Lunar New
Year visiting within the class and occupation), then formula (1) will be simplified to a
semi-independent model, the signification is that in addition to the possibility of
frequent exchange within the occupation, the possibilities of exchange between
occupations are equal. Item represents the interactive effects between each
item of the non-diagonal, and it also represents the possible special exchange models
would exit in each occupational group. In Table 3, we have provided an example that
estimates parameters and , it is relative to our assumption four -
enterprise managers union.
Attention should be paid to that, if two occupations were classified as a same class,
then we assume that they have shown the same pattern of exchange with other
occupations or classes. Reflected in the model, the difference of items in
formula (1) only exits in the occupational exchange between classes, and they become
the same as occupations belonged to the same class. This is an application of
Goodman’s (1981) homogeneity model (correlative comments could be seen in
Wasserman and Faust, 1994). Breiger and Mohr (2004) indicated that homogeneity
model is actually a mathematical model of "structural equivalence" concept in a
research of the network (correlative comments could be seen in Wasserman and Faust,
1994). This is in line with the needs of our study and it has provided measure for
further analysis on the above classes and the networks in our previous discussion.
Every research assumption of ours can be evaluated by comparison that how much
extent the expectation frequency in the given model (Fij) will consist with the
observation values in Table Two: If the expectation values of the model is different
from the observation ones, the model will be proved not to consist with the social

reality, and it is not the "true" one, therefore, the assumption which the model
represents is not substantiated.
(Issue Four, “Open Times”, 2005)
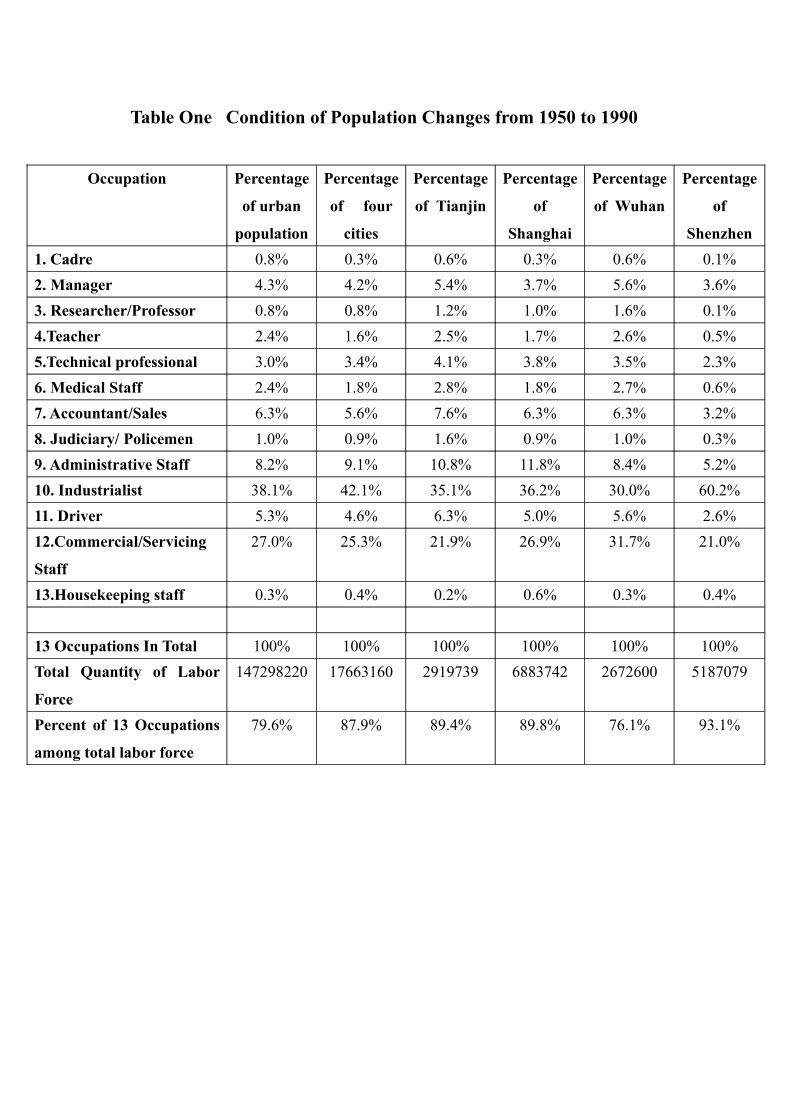
Table One Condition of Population Changes from 1950 to 1990
Occupation Percentage
of urban
population
Percentage
of four
cities
Percentage
of Tianjin
Percentage
of
Shanghai
Percentage
of Wuhan
Percentage
of
Shenzhen1. Cadre 0.8% 0.3% 0.6% 0.3% 0.6% 0.1%2. Manager 4.3% 4.2% 5.4% 3.7% 5.6% 3.6%3. Researcher/Professor 0.8% 0.8% 1.2% 1.0% 1.6% 0.1%4.Teacher 2.4% 1.6% 2.5% 1.7% 2.6% 0.5%5.Technical professional 3.0% 3.4% 4.1% 3.8% 3.5% 2.3%6. Medical Staff 2.4% 1.8% 2.8% 1.8% 2.7% 0.6%7. Accountant/Sales 6.3% 5.6% 7.6% 6.3% 6.3% 3.2%8. Judiciary/ Policemen 1.0% 0.9% 1.6% 0.9% 1.0% 0.3%9. Administrative Staff 8.2% 9.1% 10.8% 11.8% 8.4% 5.2%10. Industrialist 38.1% 42.1% 35.1% 36.2% 30.0% 60.2%11. Driver 5.3% 4.6% 6.3% 5.0% 5.6% 2.6%12.Commercial/Servicing
Staff
27.0% 25.3% 21.9% 26.9% 31.7% 21.0%
13.Housekeeping staff 0.3% 0.4% 0.2% 0.6% 0.3% 0.4%
13 Occupations In Total 100% 100% 100% 100% 100% 100%Total Quantity of Labor
Force
147298220 17663160 2919739 6883742 2672600 5187079
Percent of 13 Occupations
among total labor force
79.6% 87.9% 89.4% 89.8% 76.1% 93.1%

Table Two New Year Visiting and Exchange of 13 Occupations
Occupation of
Householders
Occupation of People with New Year Visiting Total
1 2 3 4 5 6 7 8 9 10 11 1
2
1
31. Cadre 13 17 8 13 6 6 11 5 19 8 9 2 1 1182. Manager 34 63 41 40 48 34 61 2
2
52 48 39 1
6
5 503
3. Researcher/Professor 2 13 14 11 14 9 11 6 9 11 5 4 1 1104.Teacher 6 8 4 13 4 6 8 3 6 7 6 1 0 725. Engineer 6 13 8 10 14 12 13 7 14 14 9 4 0 1246. Medical Staff 6 12 8 8 7 13 11 7 6 8 7 5 1 997. Accountants/Sales 7 19 9 14 13 18 26 1
0
16 17 14 5 3 171
8.Judiciary/ Policemen 4 6 2 3 1 6 5 5 8 7 4 2 0 539. Administrative Staff 10 11 6 7 6 10 18 11 12 13 10 4 3 12110. Industrialist 2 13 5 9 7 10 11 3 8 26 16 8 2 12011. Driver 3 7 0 6 2 3 6 3 4 6 9 3 1 5312.Commercial/Servicin
g Staff
6 18 6 10 4 12 23 8 15 27 19 1
5
2 165
13.Housekeeping staff 2 3 1 1 0 2 2 3 0 4 2 2 3 25Total 10
1
20
3
11
2
14
5
12
6
14
1
20
6
9
3
16
9
19
6
14
9
7
1
2
2
1734

Table Three Calculated Parameter Evaluation Values of (Diagonal) and
(Outside the Diagonal) in Accordance with Assumption Four
Occupation of the
Householders
Occupation of People with New Year Visiting
Occupation of the
Householders
1 8 9 2 7 3 4 5 6 10 11 12 13
1. Cadre 0.287 0.319 0.319 -0.031 -0.031 -0.133 -0.133 -0.133 -0.133 -0.156 -0.156 -0.156 -0.1562. Manager 0.319 0.287 0.319 -0.031 -0.031 -0.133 -0.133 -0.133 -0.133 -0.156 -0.156 -0.156 -0.1563. Researcher/Professor 0.319 0.319 0.287 -0.031 -0.031 -0.133 -0.133 -0.133 -0.133 -0.156 -0.156 -0.156 -0.1564.Teacher -0.020 -0.020 -0.020 0.132 0.005 0.133 0.133 0.133 0.133 -0.118 -0.118 -0.118 -0.1185. Engineer -0.020 -0.020 -0.020 0.005 0.132 0.133 0.133 0.133 0.133 -0.118 -0.118 -0.118 -0.1186. Medical Staff -0.056 -0.056 -0.056 -0.016 -0.016 0.700 0.207 0.207 0.207 -0.134 -0.134 -0.134 -0.1347. Accountants/Sales -0.056 -0.056 -0.056 -0.016 -0.016 0.207 0.700 0.207 0.207 -0.134 -0.134 -0.134 -0.1348. Judiciary/ Policemen -0.056 -0.056 -0.056 -0.016 -0.016 0.207 0.207 0.700 0.207 -0.134 -0.134 -0.134 -0.1349. Administrative Staff -0.056 -0.056 -0.056 -0.016 -0.016 0.207 0.207 0.207 0.700 -0.134 -0.134 -0.134 -0.13410. Industrialist -0.243 -0.243 -0.243 0.041 0.041 -0.207 -0.207 -0.207 -0.207 0.859 0.408 0.408 0.40811. Driver -0.243 -0.243 -0.243 0.041 0.041 -0.207 -0.207 -0.207 -0.207 0.408 0.859 0.408 0.40812.Commercial/Servicing
Staff
-0.243 -0.243 -0.243 0.041 0.041 -0.207 -0.207 -0.207 -0.207 0.408 0.408 0.859 0.408
13.Housekeeping staff -0.243 -0.243 -0.243 0.041 0.041 -0.207 -0.207 -0.207 -0.207 0.408 0.408 0.408 0.859

Bian Yanjie, Ronald Breiger, Deborah Davis, Joseph Galaskiewicz, Open Times, 2005, Issue 6
http://creativecommons.org/licenses/by-nd/2.0/fr/deed.fr