
Observation of Surface States with Algebraic Localization
9
Observation of surface states with algebraic localization G. Corrielli 1,2 , G. Della Valle 1,2 , A. Crespi 2,1 , R. Osellame 2,1 , and S. Longhi 1,2* 1 Dipartimento di Fisica - Politecnico di Milano, Piazza Leonardo da Vinci 32, 20133 Milan, Italy and 2 Istituto di Fotonica e Nanotecnologie - Consiglio Nazionale delle Ricerche, Piazza Leonardo da Vinci 32, 20133 Milan, Italy We introduce and experimentally demonstrate a class of surface bound states with algebraic decay in a one-dimensional tight-binding lattice. Such states have an energy embedded in the spectrum of scattered states and are structurally stable against perturbations of lattice parameters. Experimental demonstration of surface states with algebraic localization is presented in an array of evanescently-coupled optical waveguides with tailored coupling rates. PACS numbers: 03.65.Nk, 03.65.Ge, 42.82.Et, 73.20.At Surface waves localized at an interface between two dif- ferent media play an important role in different areas of physics [1]. A widespread belief is that surface waves are exponentially localized waves. Indeed, exponential local- ization is ubiquitous for evanescent waves. Exponential localization is found for electrons at the surface of a pe- riodic crystal, the so-called Tamm [2] and Shockley [3] surface states with energy in a gap, in disordered lattices as a result of Anderson localization [4], or at a metal- dielectric interfaces in the form of plamonic waves. How- ever, quantum mechanics does not exclude the existence of localized states with a lower than exponential localiza- tion. Sub-exponential localization, including a power-law decay of the wave function, can arise, for example, in lat- tice models with special kind of disorder [5, 6]. Surface states with algebraic localization were predicted 20 years ago in certain special potentials for the Schr¨ odinger equa- tion on a semi-infinite line [7]. Such surface states have an energy embedded in the continuous spectrum of scat- tered states, i.e. they belong to the class of bound states in the continuum (BIC) originally discovered by von Neu- mann and Wigner in a seminal paper [8] and found in a wide range of quantum and classical systems, including atomic and molecular systems [9–11], semiconductor and mesoscopic structures [12–16, 18], graphene [19], quan- tum Hall insulators [20], Hubbard models [21, 22], and optical structures [23–27]. Experimental demonstrations of BIC states, either in the bulk [26] or at the surface [27], have been recently reported in simple optical lattice sys- tems exploiting destructive Fano interference. Such BIC states are compact, i.e. they confine all the energy in few sites with no penetration into the lattice continuum, and are thus not suited to observe sub-exponential local- ization. Recently, surface states with sub-exponential lo- calization have been theoretically introduced by Molina and coworkers in a special tight-binding lattice model [28]. Such states are BIC modes which, as opposed to those earlier studied in Refs.[23, 26, 27], are not compact and penetrate in the lattice with a sub-exponential (but higher than algebraic) localization. However, like in [7] a specially-tailored local potential is required, which is of difficult experimental implementation. The observa- tion of surface states with sub-exponential localization remains to date elusive. In this Letter we introduce and experimentally demon- strate surface states with power-law decay in a semi- infinite tight-binding lattice model, which do not require any local potential. Algebraic localization exploits the existence of a BIC mode, and it is not related to a special kind of disorder in the lattice [5, 6]. Our scheme is ex- perimentally demonstrated in an array of coupled optical waveguides with tailored hopping rates, manufactured by femtosecond laser writing in fused silica. Algebraic local- ization of the surface state is proven by spectral recon- struction of the BIC eigenmode from beam propagation measurements. We consider a semi-infinite tight-binding lattice with inhomogeneous hopping rates κ n and site energies n (n =1, 2, 3, ...) described by the tight-binding Hamilto- nian ˆ H = - ∞ X n=1 {κ n |nihn +1| + κ n-1 |nihn - 1|}+ ∞ X n=1 n |nihn| (1) where κ n > 0 is the hopping rate between sites |ni and |n +1i, and κ 0 = 0. We assume that, far from n = 1, the lattice is homogeneous, i.e. n → 0 and κ n → κ as n →∞. The energy spectrum of ˆ H is obtained from the following eigenvalue equation for the occupation amplitudes ¯ c n of various lattice sites E ¯ c n = -κ n ¯ c n+1 - κ n-1 ¯ c n-1 + n ¯ c n (2) (n =1, 2, 3, ...). The linear spectrum of scattered states, i.e. the continuous spectrum of ˆ H, is provided by the tight-binding lattice band -2κ<E< 2κ. Bound states can arise owing to the inhomogeneity of the hopping rates κ n and/or of the local potential n . A method to create a single BIC surface state in a lattice with κ n = κ and with a specially tailored local potential n was proposed in Ref.[28]. Here we suggest a different and experimen- tally more accessible method to synthesize a discrete lat- tice that sustains an arbitrary number M ≥ 1 of surface BIC with algebraic localization that does not require any local potential, i.e. n = 0. Our idea is to introduce a modulation of the hopping rates κ n between adjacent arXiv:1306.3405v2 [cond-mat.mes-hall] 5 Nov 2013
Transcript of Observation of Surface States with Algebraic Localization

Observation of surface states with algebraic localization
G. Corrielli1,2, G. Della Valle1,2, A. Crespi2,1, R. Osellame2,1, and S. Longhi1,2∗1 Dipartimento di Fisica - Politecnico di Milano,
Piazza Leonardo da Vinci 32, 20133 Milan, Italy and2 Istituto di Fotonica e Nanotecnologie - Consiglio Nazionale delle Ricerche,
Piazza Leonardo da Vinci 32, 20133 Milan, Italy
We introduce and experimentally demonstrate a class of surface bound states with algebraicdecay in a one-dimensional tight-binding lattice. Such states have an energy embedded in thespectrum of scattered states and are structurally stable against perturbations of lattice parameters.Experimental demonstration of surface states with algebraic localization is presented in an array ofevanescently-coupled optical waveguides with tailored coupling rates.
PACS numbers: 03.65.Nk, 03.65.Ge, 42.82.Et, 73.20.At
Surface waves localized at an interface between two dif-ferent media play an important role in different areas ofphysics [1]. A widespread belief is that surface waves areexponentially localized waves. Indeed, exponential local-ization is ubiquitous for evanescent waves. Exponentiallocalization is found for electrons at the surface of a pe-riodic crystal, the so-called Tamm [2] and Shockley [3]surface states with energy in a gap, in disordered latticesas a result of Anderson localization [4], or at a metal-dielectric interfaces in the form of plamonic waves. How-ever, quantum mechanics does not exclude the existenceof localized states with a lower than exponential localiza-tion. Sub-exponential localization, including a power-lawdecay of the wave function, can arise, for example, in lat-tice models with special kind of disorder [5, 6]. Surfacestates with algebraic localization were predicted 20 yearsago in certain special potentials for the Schrodinger equa-tion on a semi-infinite line [7]. Such surface states havean energy embedded in the continuous spectrum of scat-tered states, i.e. they belong to the class of bound statesin the continuum (BIC) originally discovered by von Neu-mann and Wigner in a seminal paper [8] and found in awide range of quantum and classical systems, includingatomic and molecular systems [9–11], semiconductor andmesoscopic structures [12–16, 18], graphene [19], quan-tum Hall insulators [20], Hubbard models [21, 22], andoptical structures [23–27]. Experimental demonstrationsof BIC states, either in the bulk [26] or at the surface [27],have been recently reported in simple optical lattice sys-tems exploiting destructive Fano interference. Such BICstates are compact, i.e. they confine all the energy infew sites with no penetration into the lattice continuum,and are thus not suited to observe sub-exponential local-ization. Recently, surface states with sub-exponential lo-calization have been theoretically introduced by Molinaand coworkers in a special tight-binding lattice model[28]. Such states are BIC modes which, as opposed tothose earlier studied in Refs.[23, 26, 27], are not compactand penetrate in the lattice with a sub-exponential (buthigher than algebraic) localization. However, like in [7]a specially-tailored local potential is required, which isof difficult experimental implementation. The observa-tion of surface states with sub-exponential localization
remains to date elusive.In this Letter we introduce and experimentally demon-
strate surface states with power-law decay in a semi-infinite tight-binding lattice model, which do not requireany local potential. Algebraic localization exploits theexistence of a BIC mode, and it is not related to a specialkind of disorder in the lattice [5, 6]. Our scheme is ex-perimentally demonstrated in an array of coupled opticalwaveguides with tailored hopping rates, manufactured byfemtosecond laser writing in fused silica. Algebraic local-ization of the surface state is proven by spectral recon-struction of the BIC eigenmode from beam propagationmeasurements.
We consider a semi-infinite tight-binding lattice withinhomogeneous hopping rates κn and site energies εn(n = 1, 2, 3, ...) described by the tight-binding Hamilto-nian
H = −∞∑n=1
{κn|n〉〈n+ 1|+ κn−1|n〉〈n− 1|}+∞∑n=1
εn|n〉〈n|
(1)where κn > 0 is the hopping rate between sites |n〉 and|n + 1〉, and κ0 = 0. We assume that, far from n =1, the lattice is homogeneous, i.e. εn → 0 and κn →κ as n → ∞. The energy spectrum of H is obtainedfrom the following eigenvalue equation for the occupationamplitudes cn of various lattice sites
Ecn = −κncn+1 − κn−1cn−1 + εncn (2)
(n = 1, 2, 3, ...). The linear spectrum of scattered states,
i.e. the continuous spectrum of H, is provided by thetight-binding lattice band −2κ < E < 2κ. Bound statescan arise owing to the inhomogeneity of the hopping ratesκn and/or of the local potential εn. A method to createa single BIC surface state in a lattice with κn = κ andwith a specially tailored local potential εn was proposedin Ref.[28]. Here we suggest a different and experimen-tally more accessible method to synthesize a discrete lat-tice that sustains an arbitrary number M ≥ 1 of surfaceBIC with algebraic localization that does not require anylocal potential, i.e. εn = 0. Our idea is to introducea modulation of the hopping rates κn between adjacent
arX
iv:1
306.
3405
v2 [
cond
-mat
.mes
-hal
l] 5
Nov
201
3

2
FIG. 1. (Color online) (a) Schematic of a semi-infinite latticewith tailored hopping rates that sustains M = 1 BIC surfacestate with algebraic decay (β = 1). (b) Behavior of |cn|2 forthe BIC state. (c) Numerically-computed energy spectrum ofthe lattice comprising Ns = 501 sites, and (d) correspondingbehavior of the participation ratio R(E) of the eigenmodes.The BIC state has an energy E = 0. BOC modes are locatedclose to the band gap edges ±2κ. The outer BOC modes havean energy E = ±E0 ' ±2.557κ.
sites, which can be simply realized in a semi-infinite tight-binding lattice with inhomogeneous spacing of adjacentlattice sites. Some general properties of the HamiltonianH in the εn = 0 case and for inhomogeneous hoppingrates are discussed in the Supplemental Material [29].To realize a BIC state with algebraic localization, let usmodulate the lattice hopping rates κn as follows
κn =
{κ n 6= lN(l+1l
)βκ n = lN (l = 1, 2, 3, ...)
(3)
where N = M + 1 and β is an arbitrary real numberthat defines the power-law decay exponent (β > 1/2 fornormalizable states). Indeed, it can be readily shownthat Eqs.(2) admit of the following M surface states
c(σ)n = An sin(nqσ) (4)
with energies Eσ = −2κ cos qσ buried in the band of scat-tered states. In the previous equation, σ = 1, 2, ...,M ,qσ = πσ/N , An = N l−β for (l − 1)N < n ≤ lN(l = 1, 2, 3, ...), and N is a normalization constant. Asan example, in Fig.1(a) we show the very simple dis-crete lattice that sustains one surface BIC with the al-gebraic decay law cn ∼ 2/(n + 1), i.e. corresponding
to N = 2 and β = 1, with energy E = 0 at the cen-ter of the tight binding lattice band. The distributionof the surface BIC is depicted in Fig.1(b). In additionto surface BIC, the lattices defined by the sequence (3)sustain additional surface states in the gap, i.e. boundstates outside the continuum (BOC). As an example, inFig.1(c) we show the numerically-computed energy spec-trum of Eq.(2) in a lattice comprising Ns = 501 sitesfor N = 2 and β = 1, i.e. for the lattice shown inFig.1(a). The degree of localization of the eigenstatecn(E) with energy E is measured by the participation ra-tio R(E), given by R(E) = (
∑n |cn|2)2/(
∑n |cn|4) [28].
For localized modes, R ∼ 1 while for extended statesR ∼ Ns. The distribution of R(E) for the Ns = 501eigenmodes of the lattice of Fig.1(a) is shown in Fig.1(d).The figure clearly shows the existence of one BIC surfacestate at E = 0, together with a number of BOC sur-face states (26 for the truncated lattice with Ns = 501sites) with exponential decay tails and with energies out-side the lattice band. The two outer BOC states have anenergy E ∼ ±E0 ' ±2.56κ, whereas the energies of theother BOC modes condensate toward the band gap edgesE = ±2κ. The surface BIC turns out to be structurallyrobust against perturbations of lattice parameters, as dis-cussed in Ref. [29].
To experimentally demonstrate surface BIC modes, weimplemented the semi-infinite lattice of Fig.1(a) in an ar-ray of 40 evanescently-coupled optical waveguides man-ufactured by femtosecond laser waveguide writing on afused silica substrate (see, for instance, [30, 31]). Thesecond harmonic of an Yb-based femtosecond laser (Fem-toREGEN, HighQLaser GmbH), delivering 400 fs pulses,is used for the writing process. An optimal processingwindow was found at 20 kHz repetition rate, 300 nJ pulseenergy and 10 mm/s translation speed. The laser beamis focused at 170 µm below the glass surface by a 0.45NA, 20 × objective. The spacing dn between waveg-uide |n〉 and |n + 1〉 is engineered in order to imple-ment the desired coupling coefficients, namely κn/κ =1, 2, 1, 3/2, 1, 4/3, 1, 5/4, .... For our waveguide writingparameters, the coupling constant κn turns out to be wellfitted by the exponential curve κn = κ exp[−γ(dn − a)],where κ = 1.27 cm−1 is the coupling constant for awaveguide spacing a = 15 µm and γ = 0.20 µm−1. Thevalues of κn of the lattice of Fig.1(a) are obtained withspacings in the range dn = 11.5 ÷ 15 µm. The arraywas probed at λ = 633 nm from light emitted by a He-Ne laser. Note that in our optical setting the spatiallight propagation along the axial distance z of the ar-ray reproduces the temporal evolution of the occupationamplitudes cn(t) in the lattice model described by theHamiltonian (1), with t = z. To prove the existenceof the surface BIC mode with algebraic localization, wemeasured the propagation of a light beam in the arrayedstructure under suitable excitation at the input planeand used a spectral method to reconstruct the eigenen-ergy and profile of the BIC mode [32]. The method basi-cally requires to measure the correlation function C(t) of

3
FIG. 2. (Color online) (a) Schematic of the waveguide lattice; the red arrow indicates the waveguide where light is launched. (b)Mode excitation amplitude A(E) for initial lattice excitation at the boundary site, i.e. cn(0) = δn,1 (c) and (d) Experimentaland theoretical maps of the light intensity evolution in the lattice waveguides.
the evolving optical wave packet |ψ(n, t)〉 =∑n cn(t)|n〉,
i.e. C(t) = 〈ψ(0)|ψ(t)〉, and the evolution of cn(t) inthe various lattice sites. Fourier analysis of the correla-tion function enables to localize the position of the dis-crete eigenvalues as resonance peaks, whereas a Fourieranalysis of |ψ(n, t)〉 generates the eigenfunction profiles[32]. Technical details of the spectral method are givenin Ref.[29]. To correctly reconstruct the eigenvector cor-responding to the BIC state of the Hamiltonian (1), twoconditions should be met: (1) the initial wave packetshould have a non-negligible overlap with the BIC mode;and (2) the wave packet evolution should be monitoredfor a time T much longer than ∼ 1/κ. The latter con-dition arises because the BIC state is embedded into thespectrum of scattered states, whose contribution into thereconstructed state should be avoided. Once the two con-ditions (1) and (2) are met, the energy position E = E1 ofthe BIC state is found as a resonance peak of the Fouriertransform C(E) of C(t), i.e.
C(E) =
∫ ∞−∞
dtg(t)〈ψ(0)|ψ(t)〉 exp(iEt) (5)
whereas the corresponding eigenvector, apart from a nor-malization factor, is reconstructed via the relation
cn(E1) '∫ ∞−∞
dtg(t)cn(t) exp(iE1t). (6)
In Eqs.(5) and (6), g(t) is a window function of length∼ T , which can be chosen to be a Gaussian or a square-wave function [29, 32]. Its Fourier transform is the spec-tral filtering function, whose spectral width ∼ 1/T setsthe minimum separation in energy levels that can be re-solved [32]. In our experiment, to meet the above men-tioned conditions we propagated light along the array fora distance of 9 cm, corresponding to a time T ' 11.4/κ,and excited the system at the left boundary waveguiden = 1, see red arrow in Fig.2(a), corresponding to theinitial wave packet |ψ(n, 0)〉 = |1〉. For such an initial
condition, the various lattice eigenmodes are excited witha weight A(E) which is depicted in Fig.2(b). The figureclearly shows that the BIC state with energy E = 0 isthe most excited eigenstate, and the condition (1) aboveis met. Moreover, the propagated time T ' 11.4/κ islong enough to provide a satisfactory resolution of theBIC eigenvalue and a negligible contribution of the scat-tered states in the reconstruction of the BIC mode pro-file [29], according to the condition (2). As discussedin Ref.[29], for the lattice Hamiltonian (1) with εn = 0and for the chosen initial condition, cn(t) turn out tobe either real-valued or purely imaginary-valued. Sucha property greatly simplifies the experiment because ameasurement of the light intensity distributions |cn(t)|2is sufficient to retrieve the behavior of cn(t), and hencethe computation of the correlation function and recon-struction of the eigenvector according to Eqs.(5) and (6).In our experiment, the evolution of |cn(t)|2 was measuredby top-view imaging of the fluorescence signal emitted bythe waveguides where red light is propagating [31, 33, 34];further details are given in Ref.[29]. In Fig.2(c) we showthe measured map of light intensity evolution along the9-cm-long waveguide array. For comparison, the corre-sponding theoretical map is also shown in Fig.2(d). Notethe good agreement between the two maps. From themeasured intensity map, we extracted the evolution ofcn(t) in the various guides [29], and computed the spec-trum of the correlation function using a Gaussian filterg(t) = gG(t) = (1/T ) exp[−(t − T/2)2/w2], truncatedat t < 0 and t > T , with w = 2T/5. As comparedto the square-wave filter, the Gaussian one avoids theappearance of oscillatory tails in the resonance peak,which might be erroneously attributed to the occurrenceof other bund states. The computed spectrum |C(E)|2 ofthe autocorrelation function is shown in Fig.3(a), clearlyindicating a resonance peak at E = E1 = 0, i.e. the ex-istence of a bound state with energy E1 embedded intothe spectrum of scattered states. The outer BOC modesare very weakly excited by the initial wave packet and

4
FIG. 3. (Color online) (a) Spectrum of the autocorrelation
function |C(E)|2 versus normalized energy E/κ as obtainedfrom the experimental data (solid curve) and from the the-oretical analysis (dashed curve). The solid horizontal linemarks the continuous spectrum of the lattice band. The peakat E = 0 corresponds to the BIC mode. (b) ReconstructedBIC mode profile |cn(E = 0)|2 (crosses refer to the experimen-tal data, open circles to numerical simulations). (c) Best ex-ponential (solid line) and algebraic (dashed line) fitting curvesof |cn(E = 0)|2 at odd lattice sites. The algebraic fitting curveis |cn|2 = 1/[(n+ 1)/2]2α with best fit α = 0.96.
thus they are not visible in the spectrum of Fig.3(a).In Fig.3(b) we show the behavior of the reconstructedBIC eigenvector, obtained from Eq.(6) with E = 0, forlattice sites up to n = 14. In this case a square fil-ter g(t) has been used, which provides a slightly better
estimate than the Gaussian filter. As expected, the val-ues of |cn|2 of even-number waveguides are very small,whereas |cn|2 at odd-number waveguides shows a slowdecay. The results shown in Fig.3(a) and (b) are com-pared with the theoretical predictions based on Eqs.(5)and (6), where the amplitudes cn(t) are obtained by nu-merical integration of the coupled-mode equations ratherthan from the measured intensity map. To prove the al-gebraic (rather than exponential) localization of the BICstate, the reconstructed mode amplitudes |cn|2 are fit-ted, at odd lattice sites, by either an inverse power-lawcurve |cn|2 = 1/[(n+ 1)/2]2α or by an exponential curve|cn|2 = exp[−α(n − 1)] with a single fitting parameterα. The optimal fitting curves, obtained by minimizingthe root mean square deviation (RMSD), are shown inFig.3(c). The algebraic curve turns out to provide a muchbetter RMSD than the exponential one (RMSD 0.01006vs 0.04316), with an optimum fitting parameter α = 0.96,which deviates from the expected value α = 1 by ∼ 4%.
In conclusion, we have introduced and experimentallydemonstrated a new class of surface bound states withalgebraic localization. While exponential localization isubiquitous for evanescent waves, algebraic localizationis found when the lattice sustains bound states with anenergy buried in the spectrum of scattered states. Herea design procedure of surface states with algebraic decayhas been proposed for a tight-binding lattice model withinhomogeneous hopping rates and demonstrated usingoptical waveguide arrays. Our results provide the firstobservation of surface states with algebraic localizationin a controllable physical system and are expected to beof relevance to other fields, including ultracold atomsin optical lattices, electronic transport in quantumdot chains and mesoscopic structures, as well as otherphotonic systems.
This work was supported by the European Unionthrough the project FP7-ICT-2011-9-600838 (QWAD -Quantum Waveguides Application and Development).
∗ Corresponding author: [email protected]
[1] S.G. Davison and M. Steslicka, Basic Theory of SurfaceStates (Oxford Science Publications, New York, 1996).
[2] I.E. Tamm , Phys. Z. Sowjetunion 1, 733 (1937).[3] W. Shockley, Phys. Rev. 56, 317 (1939).[4] P.W. Anderson, Phys. Rev. 109, 1492 (1958).[5] T. A. L. Ziman, Phys. Rev. B 26, 7066 (1982); C. M.
Soukoulis, I. Webman, G. S. Grest, and E. N. Economou,Phys. Rev. B 26, 1838 (1982); Y. Morita and Y. Hat-sugai, Phys. Rev. Lett. 79, 3728 (1997); S.-J. Xiong andS. N. Evangelou, Phys. Rev. B 64, 113107 (2001).
[6] L. Sanchez-Palencia, D. Clement, P. Lugan, P. Bouyer,G. V. Shlyapnikov, and A. Aspect, Phys. Rev. Lett. 98,210401 (2007); J. Billy, V. Josse, Z. Zuo, A. Bernard, B.
Hambrecht, P. Lugan, D. Clement, L. Sanchez-Palencia,P. Bouyer, and A. Aspect, Nature (London) 453, 891(2008).
[7] J. Pappademos, U. Sukhatme, and A. Pagnamenta, Phys.Rev. A 48, 3525 (1993).
[8] J. von Neumann and E. Wigner, Phys. Z. 30, 465 (1929).[9] F.H. Stillinger and D.R. Herrick, Phys. Rev. A 11, 446
(1975).[10] H. Friedrich and D. Wintgen, Phys. Rev. A 31, 3964
(1985).[11] L.S. Cederbaum, R.S. Friedman, V.M. Ryaboy, and N.
Moiseyev, Phys. Rev. Lett. 90, 013001 (2003).[12] F. Capasso, C. Sirtori, J. Faist, D. L. Sivco, S-N. G. Chu,

5
and A. Y. Cho, Nature (London) 358, 565 (1992).[13] O. Olendski and L. Mikhailovska, Phys. Rev. B 67,
035310 (2003).[14] A.F. Sadreev, E.N. Bulgakov, and I. Rotter, Phys. Rev.
B 73, 235342 (2006).[15] G. Ordonez, K. Na, and S. Kim, Phys. Rev. A 73, 022113
(2006).[16] M.L. Ladron de Guevara and P.A. Orellana, Phys. Rev.
B 73, 205303 (2006).[17] P. A. Orellana, M. Amado, and F. Domnguez-Adame,
Nanotechnology 19, 195401 (2008).[18] A. Albo, D. Fekete, and G. Bahir, Phys. Rev. B 85,
115307 (2012).[19] J.W. Gonzalez, M. Pacheco, L. Rosales, and P.A. Orel-
lana, EPL 91, 66001 (2010).[20] B.-J. Yang, M. S. Bahramy, and N. Nagaosa, Nature
Commun. 4, 1524 (2013).[21] J.-M. Zhang, D. Braak, and M. Kollar, Phys. Rev. Lett.
109, 116405 (2012).[22] S. Longhi and G. Della Valle, J. Phys.: Condens. Matter
25, 235601 (2013).[23] S. Longhi, Eur. Phys. J. B 57, 45 (2007).[24] D.C. Marinica, A.G. Borisov, and S.V. Shabanov, Phys.
Rev. Lett. 100, 183902 (2008).[25] E.N. Bulgakov and A.F. Sadreev, Phys. Rev. B 78,
075105 (2008).[26] Y. Plotnik, O. Peleg, F. Dreisow, M. Heinrich, S. Nolte,
A. Szameit, and M. Segev, Phys. Rev. Lett. 107, 183901(2011).
[27] S. Weimann, Y. Xu, R. Keil, A.E. Miroshnichenko, S.Nolte, A.A. Sukhorukov, A. Szameit, and Y.S. Kivshar,arXiv:1304.4699
[28] M.I. Molina, A.E. Miroshnichenko, and Y.S. Kivshar,Phys. Rev. Lett. 108, 070401 (2012).
[29] See the Supplemental Material for a detailed description
of the properties of the Hamiltonian H and of the spectralmethod.
[30] G. Della Valle, R. Osellame, and P. Laporta, J. Opt. A11, 013001 (2009).
[31] A. Crespi, S. Longhi, and R. Osellame, Phys. Rev. Lett.108, 163601 (2012).
[32] M. D. Feit, J. A. Fleck, and A. Steiger, J. Comp. Phys.47, 412 (1982).
[33] A. Szameit, F. Dreisow, H. Hartung, S. Nolte, A.Tunnermann, and F. Lederer, Appl. Phys. Lett. 90,241113 (2007).
[34] G. Corrielli, A. Crespi, G. Della Valle, S. Longhi, and R.Osellame, Nature Comm. 4, 1555 (2013).
SUPPLEMENTAL MATERIAL
S.1. Properties of the lattice Hamiltonian. Letus consider the tight-binding lattice Hamiltonian, givenby Eq.(1) in the main text, for εn = 0
H = −∞∑n=1
(κn|n〉〈n+ 1|+ κn−1|n〉〈n− 1|) (S-1)
with κ0 = 0, κn > 0 for n ≥ 1, and κn → κ as n → ∞.The state vector |ψ(t)〉 =
∑∞n=1 cn(t)|n〉 of the system
evolves according to the Schrodinger equation (with ~ =1)
i∂t|ψ(t)〉 = H|ψ(t)〉, (S-2)
i.e. the following coupled-mode equations hold for theamplitudes cn(t) in the Wannier basis representation{|n〉}
idcndt
= −κncn+1 − κn−1cn−1. (S-3)
The following general properties hold.
Prop. I. The energy spectrum E of H is symmetricaround E = 0.In fact, if |φ1〉 =
∑n cn|n〉 is an eigenstate of H with
energy E1, i.e. H|φ1〉 = E1|φ1〉, then it can be readily
shown that |φ2〉 =∑n(−1)ncn|n〉 is an eigenvector of H
with energy E2 = −E1.
Prop. II. The continuous spectrum of H is dense inthe interval (−2κ, 2κ).This property follows from the fact that the semi-infinitelattice is asymptotically homogeneous. The asymptoticbehavior of the scattered state |φ(E)〉 =
∑n cn|n〉 with
energy E as n → ∞ is obtained from the asymptoticform of the eigenvalue equation H|φ(E)〉 = E|φ(E)〉 atn → ∞, i.e. −κ(cn+1 + cn−1) = Ecn. The most generalsolution of the asymptotic equation is given by
cn ∼ A(q)[exp(iqn) + r(q) exp(−iqn)], (S-4)
where r(q) is the reflection coefficient (|r(q)| = 1 for fluxconservation), 0 ≤ q ≤ π is the wave number of thescattered state with energy E = E(q) defined by thedispersion relation
E(q) = −2κ cos q, (S-5)
and A(q) is a normalization factor (for scattered states).The asymptotic form of scattered states given byEq.(S-4) is valid provided that A(q) does not vanish.This exceptional circumstance might occur at someenergies E whenever, starting from the asymptotic form(S-4) and propagating the amplitudes cn backward withrespect to the index n using e.g. a transfer matrixmethod, a secular growth of |cn| is found, which implies

6
A(q) → 0 for boundedness. At such special energies thescattered states do not have the form given by Eq.(S-4)and might become normalizable, i.e. BIC modes can befound. This case can occur rather generally at E = 0, asshown in the next proposition. For the inhomogeneouslattices considered in our work [see Eq.(3) given in text],missing of scattered states of the asymptotic form givenby Eq.(S-4) and the appearance of BIC states occurs fora finite set of energies.
Prop. III. The even-number occupation amplitudes ofthe eigenstate of H with energy E = 0 vanish, and theeigenstate may correspond to a normalizable state (i.e.a BIC state) with sub-exponential localization or to a
scattered (non-normalizable) state of H, depending onthe asymptotic behavior of the sequence {κn}.In fact, the eigenvalue equation H|φ〉 = E|φ〉 for E = 0yields κncn+1 + κn−1cn−1 = 0, which is satisfied by tak-ing (apart from a normalization factor) cn = 0 for n even,c1 = 1, and cn+1 = −(κn−1/κn)cn−1 (n = 2, 4, 6, ...).Note that |cn+1/cn−1|2 = (κn−1/κn)2 → 1 as n→∞, sothat from the ratio test of convergence the norm of theeigenvector 〈φ|φ〉 =
∑n=1,3,5,... |cn|2 may or may not
converge. In the former case the eigenstate correspondsto a BIC state and, since |cn+1/cn−1|2 → 1 as n → ∞,the localization is sub-exponential. In the latter casethe eigenstate is not normalizable and belongs to thecontinuous spectrum of H, despite its form is not givenby Eq.(S-4). For example, assuming for κn the formgiven by Eq.(3) in the main text, the eigenstate isnormalizable (i.e. it corresponds to a BIC mode) forβ > 1/2, whereas it is a scattered state for β < 1/2.
Prop. IV. For the initial lattice excitation|ψ(0)〉 =
∑n cn(0)|n〉, with cn(0) real numbers for
n odd (even) and cn(0) purely imaginary numbers for neven (odd), then the solutions cn(t) to the coupled-modeequations (S-3) remain alternately real and imaginarynumbers, i.e. cn(t) are real numbers for n odd (even)and cn(t) purely imaginary numbers for n even (odd) atany successive time t.Such a property follows straightforwardly from aninspection of Eqs.(S-3).
S.2. Structural stability of the BIC mode. Animportant issue for the experimental observation of aBIC mode is its structural stability [1], that is, whetherthe mode is stable against lattice perturbations of thehopping rate and site energy distributions caused, forexample, by imperfections in waveguide spacing andrefraction index distribution of waveguides. We checkedthe structural stability of the BIC mode with energyE = 0 by computing the energies and correspondingdistribution of eigenmodes of a lattice which differs fromthe target one, shown in Fig.1(a) given in the text, byadding perturbations δκn and δεn to the hopping ratesand site energies, respectively. The results obtainedassuming for δκn and δεn random numbers uniformly
FIG. 4. (Color online) BIC surface mode in a lattice withdisorder. (a) and (b) show a disorder realization of hoppingrates δκn and site energies δεn. (c) Energy spectrum of thedisordered lattice (Ns = 501 sites). (d) Participation ratioR(E) of lattice eigenmodes. (e) Behavior of |cn(E)|2 for theBIC localized eigenmode with energy E = −0.0137κ.
distributed in the interval (−0.05κ, 0.05κ), i.e. for amoderate disorder of ∼ 10%, are shown in Fig.4. Thecurve of the participation ratio R(E), shown in Fig.4(d),clearly indicates the persistence of one localized modewith an energy E ' −0.0137κ, which is slightly shiftedfrom E = 0. The distribution of |cn|2 of the BIC state isshown in Fig.4(e). The other eigenmodes with energiesinside the lattice band tend to show a certain degree oflocalization due to the disorder (Anderson localization),as discussed in Ref.[1].
S.3 Spectral Method. Spectral methods enablerather generally to reconstruct the discrete spectrum andthe profile of the corresponding eigenvectors of an Hamil-tonian H from the Fourier analysis of the temporal evo-lution of a wave packet [2,3]. Such methods are usefultools from a computational viewpoint [2,3], for examplefor an accurate estimate of eigenvalues and eigenvectorsof the Schrodinger equation, as well as for the analysisof experimental data in systems where the evolution ofa wave packet can be accessed. In our optical experi-

7
FIG. 5. (Color online) Schematic of the spectral filteringmethod to reconstruct the BIC mode with energy E1 em-bedded in the continuous spectrum of scattered states.
ment, the wave packet evolution is visualized by simplymonitoring the propagation of a light beam along thewaveguides of the array, as discussed in the main text.The method that we used to analyze our experimentaldata is a simple spectral filtering method, which is dis-cussed in Ref.[2]. The method is limited by the uncer-tainty principle [2,3], i.e. the spectral resolution of aneigenvalue is limited to ∼ 1/T for a wave packet evolvedfor a time interval T . However, the bound to the spec-tral resolution imposed by the time-energy uncertaintyprinciple, which could be avoided using more elaboratemethods [3,4], does not pose a relevant limitation for ourpurposes. The procedure used to extract the eigenvalueand the corresponding eigenvector of the BIC mode fol-lows the method of Ref.[2], extended to include the pres-ence of scattered (unbounded) states in the neighborhoodof the BIC mode. Let us indicate by Eα (α = 1, 2, 3, ...)
and E(q) the point and continuous spectrum of H, witheigenvectors |φα〉 and |φ(q)〉, respectively, forming an or-thonormal basis. If the system is initially prepared in thestate |ψ(0)〉, then the state vector evolves according to
|ψ(t)〉 = exp(−iHt)|ψ(0)〉 =∑α
aα|φα〉 exp(−iEαt)
+
∫dq a(q) exp[−iE(q)t]|φ(q)〉 (S-6)
where aα = 〈φα|ψ(0)〉, a(q) = 〈φ(q)|ψ(0)〉 and∑α |aα|2 +
∫dq|a(q)|2 = 1 for normalization.
To estimate the position of the discrete energy levels Eα,let us consider the Fourier transform C(E) of the correla-tion function C(t) = 〈ψ(0)|ψ(t)〉 with a temporal windowfunction g(t), i.e. [2]
C(E) =
∫ T
0
dt g(t)〈ψ(0)|ψ(t)〉 exp(iEt) (S-7)
where T is the maximum observation time. For the win-dow function, we typically assume a square-wave func-tion g(t) = gS(t) = 1/T for 0 < t < T and gS(t) = 0otherwise, or the Gaussian function g(t) = gG(t) =(1/T ) exp[−(t − T/2)2/w2] for 0 < t < T (with w <∼T/2) and gG(t) = 0 otherwise. Substitution of Eq.(S-6)
FIG. 6. (Color online) Reconstructed profile of the BIC modeat E1 = 0, based on the inversion relation (S-17), for increas-ing values of κT : (a) κT = 2, (b) κT = 10, and (c) κT = 20.The exact BIC mode profile is also shown in the figure forcomparison.
into Eq.(S-7) yields
C(E) =∑α
|aα|2G(E − Eα) +
∫dq|a(q)|2G(E − E(q))
(S-8)where G(E) ≡
∫∞−∞ dt g(t) exp(iEt) is the spectral filter
function. For example, assuming for the sake of definite-ness the square-wave window function g(t) = gS(t), onehas
G(E) = exp(iET/2)sin(ET/2)
(ET/2). (S-9)
The spectral resolution of the method is determined bythe banwidth of the filtering function |G(E)|2, which isgiven by ∆E ' 2π/T . In fact, let us assume that wewish to estimate the positions of the eigenvalues E1, E2,E3 ... of the bound states from the behavior of |C(E)|2.Let us first assume that there are not BIC modes, i.e.that E1, E2, E3,... are not embedded into the continu-ous spectrum of scattered states. This case is discussedin Ref.[2]. If the observation time T is long enough suchthat the resolution ∆E is smaller than the minimum sep-aration of the discrete energy levels Eα, from Eqs.(S-8)
and (S-9) is follows that |C(E)|2 shows a sequence ofpeaks at E = Eα of width ∼ ∆E, provided that |aα| is

8
non-negligible, i.e. provided that the initial wave packethas a non-vanishing projection into the eigenvector |φα〉.Hence the peaks of |C(E)|2 provide an estimation of thepositions of the discrete energy levels with a resolution∆E which is limited by the time-energy uncertainty prin-ciple, i.e. by the observation time T . The second case,which is of interest for our work, is the occurrence of aBIC mode with an energy E1 embedded into the spec-trum of scattered states, as sketched in Fig.5. In thiscase, the first term on the right hand side of Eq.(S-8)shows a peak at E ∼ E1, however since the energy E1
is buried into the continuous spectrum a contribution toC(E) arises as well as from the integral term on the righthand side of Eq.(S-8) owing to the finite bandwidth of thefiltering function, as shown in Fig.5. The presence of theBIC mode can be thus properly estimated provided thatthe latter contribution to C(E) is smaller than the formerone, i.e. provided that
I � |a1|2 (S-10)
where we have set
I =
∣∣∣∣∫ dq|a(q)|2G(E1 − E(q))
∣∣∣∣ . (S-11)
Such a requirement is generally satisfied whenever thespectral resolution ∆E is much smaller than the band-width of the continuous spectrum. In fact, let us considerspecifically the tight-binding lattice of Fig.1(a) given inthe text, which applies to our experiment. In this case thecontinuous spectrum spans the energy range (−2κ, 2κ),q is the wave number of scattered states with the energydispersion relation E(q) = −2κ cos q (0 ≤ q ≤ π), andthere is one BIC mode at energy E1 = 0, i.e. at the cen-ter of the band of scattered states. An upper limit to Ican be obtained from the Cauchy-Schwarz inequality
I2 ≤∫dq|a(q)|2
∫dq|G(E − E(q))|2
<
∫dq|G(E − E(q))|2 (S-12)
For an observation time T long enough such that thespectral resolution ∆E is much smaller than the band-width 4κ of the continuous spectrum, i.e. for κT � 1,one can assume |G(E)|2 ' (2π/T )δ(E), so that one ob-tains
I2 <2π
T
∫dqδ(E − E(q)) =
2π
T |(dE/dq)q1 |(S-13)
with E(q1) = E1. For E1 = 0 one has |(dE1/dq)|q1 = 2κ
and thus I <√π/(Tκ). Note that, since κT � 1, one
has I � 1 and thus the inequality (S-10) is readily sat-isfied, provided that the initial wave packet has a pro-jection |a1|2 onto the BIC mode of order ∼ 1. Note also
that the contribution to C(E) around E = E1 arisingfrom the BOC modes with energies E2, E3, ... outsidethe continuos band is negligible for E ∼ E1 since the
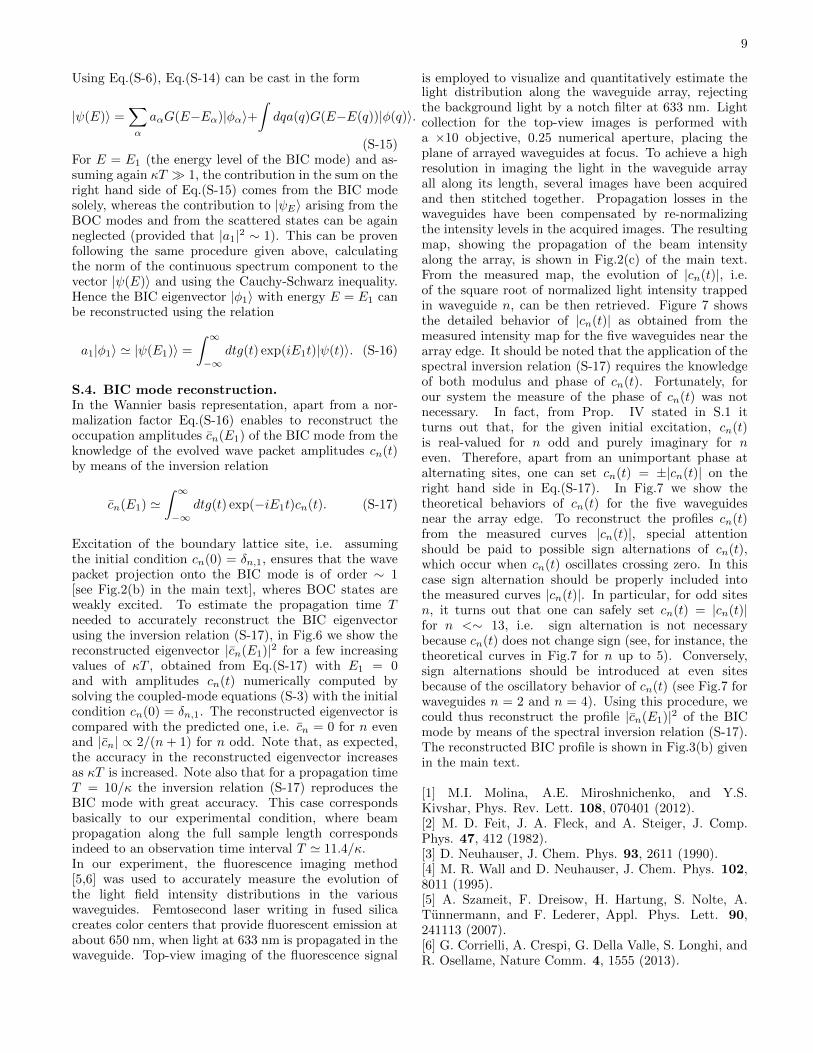
FIG. 7. (Color online) Evolution of the normalized ampli-tudes |cn(t)| along the the five waveguides n = 1, 2, 3, 4 and5 near the lattice edge, as obtained from the experimentalintensity map (dotted curves). The solid thin curves showthe behavior of cn(t) [Re(cn) for n odd, Im(cn) for n even] aspredicted by the coupled-mode equation model. The shadedareas show the time intervals where sign change is appliedto the experimental curves in the reconstruction of the modeprofile at even lattice sites.
spectral filter G(E) has a width ∆E much smaller than4κ (see Fig.5).Once the position of the energy level Eα has been es-timated from the peaks of |C(E)|2, the correspondingeigenvector |φα〉 can be approximately reconstructed byconsidering the Fourier transform of the evolved wavepacket with the time window g(t), i.e.
|ψ(E)〉 =
∫ ∞−∞
dtg(t) exp(−iEt)|ψ(t).〉 (S-14)
9
Using Eq.(S-6), Eq.(S-14) can be cast in the form
|ψ(E)〉 =∑α
aαG(E−Eα)|φα〉+∫dqa(q)G(E−E(q))|φ(q)〉.
(S-15)For E = E1 (the energy level of the BIC mode) and as-suming again κT � 1, the contribution in the sum on theright hand side of Eq.(S-15) comes from the BIC modesolely, whereas the contribution to |ψE〉 arising from theBOC modes and from the scattered states can be againneglected (provided that |a1|2 ∼ 1). This can be provenfollowing the same procedure given above, calculatingthe norm of the continuous spectrum component to thevector |ψ(E)〉 and using the Cauchy-Schwarz inequality.Hence the BIC eigenvector |φ1〉 with energy E = E1 canbe reconstructed using the relation
a1|φ1〉 ' |ψ(E1)〉 =
∫ ∞−∞
dtg(t) exp(iE1t)|ψ(t)〉. (S-16)
S.4. BIC mode reconstruction.In the Wannier basis representation, apart from a nor-malization factor Eq.(S-16) enables to reconstruct theoccupation amplitudes cn(E1) of the BIC mode from theknowledge of the evolved wave packet amplitudes cn(t)by means of the inversion relation
cn(E1) '∫ ∞−∞
dtg(t) exp(−iE1t)cn(t). (S-17)
Excitation of the boundary lattice site, i.e. assumingthe initial condition cn(0) = δn,1, ensures that the wavepacket projection onto the BIC mode is of order ∼ 1[see Fig.2(b) in the main text], wheres BOC states areweakly excited. To estimate the propagation time Tneeded to accurately reconstruct the BIC eigenvectorusing the inversion relation (S-17), in Fig.6 we show thereconstructed eigenvector |cn(E1)|2 for a few increasingvalues of κT , obtained from Eq.(S-17) with E1 = 0and with amplitudes cn(t) numerically computed bysolving the coupled-mode equations (S-3) with the initialcondition cn(0) = δn,1. The reconstructed eigenvector iscompared with the predicted one, i.e. cn = 0 for n evenand |cn| ∝ 2/(n + 1) for n odd. Note that, as expected,the accuracy in the reconstructed eigenvector increasesas κT is increased. Note also that for a propagation timeT = 10/κ the inversion relation (S-17) reproduces theBIC mode with great accuracy. This case correspondsbasically to our experimental condition, where beampropagation along the full sample length correspondsindeed to an observation time interval T ' 11.4/κ.In our experiment, the fluorescence imaging method[5,6] was used to accurately measure the evolution ofthe light field intensity distributions in the variouswaveguides. Femtosecond laser writing in fused silicacreates color centers that provide fluorescent emission atabout 650 nm, when light at 633 nm is propagated in thewaveguide. Top-view imaging of the fluorescence signal
is employed to visualize and quantitatively estimate thelight distribution along the waveguide array, rejectingthe background light by a notch filter at 633 nm. Lightcollection for the top-view images is performed witha ×10 objective, 0.25 numerical aperture, placing theplane of arrayed waveguides at focus. To achieve a highresolution in imaging the light in the waveguide arrayall along its length, several images have been acquiredand then stitched together. Propagation losses in thewaveguides have been compensated by re-normalizingthe intensity levels in the acquired images. The resultingmap, showing the propagation of the beam intensityalong the array, is shown in Fig.2(c) of the main text.From the measured map, the evolution of |cn(t)|, i.e.of the square root of normalized light intensity trappedin waveguide n, can be then retrieved. Figure 7 showsthe detailed behavior of |cn(t)| as obtained from themeasured intensity map for the five waveguides near thearray edge. It should be noted that the application of thespectral inversion relation (S-17) requires the knowledgeof both modulus and phase of cn(t). Fortunately, forour system the measure of the phase of cn(t) was notnecessary. In fact, from Prop. IV stated in S.1 itturns out that, for the given initial excitation, cn(t)is real-valued for n odd and purely imaginary for neven. Therefore, apart from an unimportant phase atalternating sites, one can set cn(t) = ±|cn(t)| on theright hand side in Eq.(S-17). In Fig.7 we show thetheoretical behaviors of cn(t) for the five waveguidesnear the array edge. To reconstruct the profiles cn(t)from the measured curves |cn(t)|, special attentionshould be paid to possible sign alternations of cn(t),which occur when cn(t) oscillates crossing zero. In thiscase sign alternation should be properly included intothe measured curves |cn(t)|. In particular, for odd sitesn, it turns out that one can safely set cn(t) = |cn(t)|for n <∼ 13, i.e. sign alternation is not necessarybecause cn(t) does not change sign (see, for instance, thetheoretical curves in Fig.7 for n up to 5). Conversely,sign alternations should be introduced at even sitesbecause of the oscillatory behavior of cn(t) (see Fig.7 forwaveguides n = 2 and n = 4). Using this procedure, wecould thus reconstruct the profile |cn(E1)|2 of the BICmode by means of the spectral inversion relation (S-17).The reconstructed BIC profile is shown in Fig.3(b) givenin the main text.
[1] M.I. Molina, A.E. Miroshnichenko, and Y.S.Kivshar, Phys. Rev. Lett. 108, 070401 (2012).[2] M. D. Feit, J. A. Fleck, and A. Steiger, J. Comp.Phys. 47, 412 (1982).[3] D. Neuhauser, J. Chem. Phys. 93, 2611 (1990).[4] M. R. Wall and D. Neuhauser, J. Chem. Phys. 102,8011 (1995).[5] A. Szameit, F. Dreisow, H. Hartung, S. Nolte, A.Tunnermann, and F. Lederer, Appl. Phys. Lett. 90,241113 (2007).[6] G. Corrielli, A. Crespi, G. Della Valle, S. Longhi, andR. Osellame, Nature Comm. 4, 1555 (2013).