Objective probabilities about future climate are a matter of opinion
20
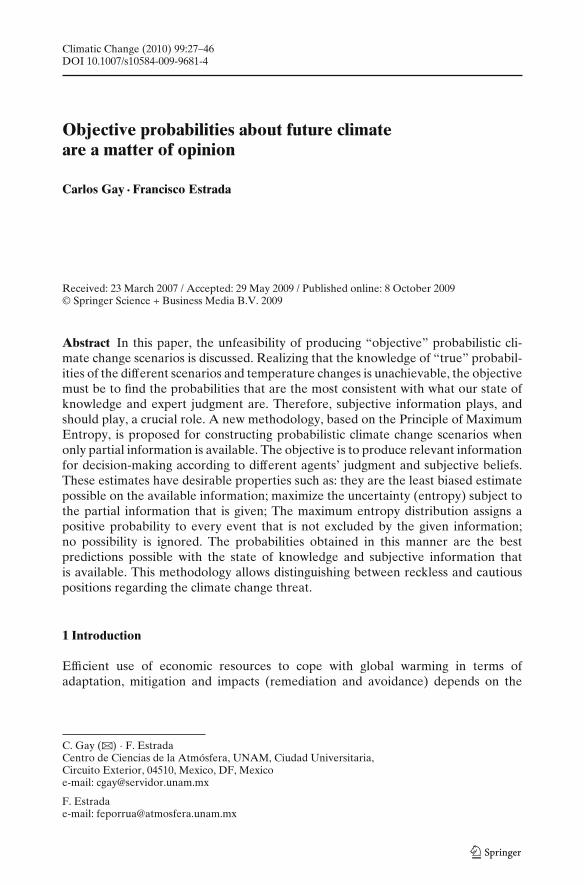
Climatic Change (2010) 99:27–46 DOI 10.1007/s10584-009-9681-4 Objective probabilities about future climate are a matter of opinion Carlos Gay · Francisco Estrada Received: 23 March 2007 / Accepted: 29 May 2009 / Published online: 8 October 2009 © Springer Science + Business Media B.V. 2009 Abstract In this paper, the unfeasibility of producing “objective” probabilistic cli- mate change scenarios is discussed. Realizing that the knowledge of “true” probabil- ities of the different scenarios and temperature changes is unachievable, the objective must be to find the probabilities that are the most consistent with what our state of knowledge and expert judgment are. Therefore, subjective information plays, and should play, a crucial role. A new methodology, based on the Principle of Maximum Entropy, is proposed for constructing probabilistic climate change scenarios when only partial information is available. The objective is to produce relevant information for decision-making according to different agents’ judgment and subjective beliefs. These estimates have desirable properties such as: they are the least biased estimate possible on the available information; maximize the uncertainty (entropy) subject to the partial information that is given; The maximum entropy distribution assigns a positive probability to every event that is not excluded by the given information; no possibility is ignored. The probabilities obtained in this manner are the best predictions possible with the state of knowledge and subjective information that is available. This methodology allows distinguishing between reckless and cautious positions regarding the climate change threat. 1 Introduction Efficient use of economic resources to cope with global warming in terms of adaptation, mitigation and impacts (remediation and avoidance) depends on the C. Gay (B ) · F. Estrada Centro de Ciencias de la Atmósfera, UNAM, Ciudad Universitaria, Circuito Exterior, 04510, Mexico, DF, Mexico e-mail: [email protected] F. Estrada e-mail: [email protected]
-
Upload
independent -
Category
Documents
-
view
0 -
download
0
Transcript of Objective probabilities about future climate are a matter of opinion
Climatic Change (2010) 99:27–46DOI 10.1007/s10584-009-9681-4
Objective probabilities about future climateare a matter of opinion
Carlos Gay · Francisco Estrada
Received: 23 March 2007 / Accepted: 29 May 2009 / Published online: 8 October 2009© Springer Science + Business Media B.V. 2009
Abstract In this paper, the unfeasibility of producing “objective” probabilistic cli-mate change scenarios is discussed. Realizing that the knowledge of “true” probabil-ities of the different scenarios and temperature changes is unachievable, the objectivemust be to find the probabilities that are the most consistent with what our state ofknowledge and expert judgment are. Therefore, subjective information plays, andshould play, a crucial role. A new methodology, based on the Principle of MaximumEntropy, is proposed for constructing probabilistic climate change scenarios whenonly partial information is available. The objective is to produce relevant informationfor decision-making according to different agents’ judgment and subjective beliefs.These estimates have desirable properties such as: they are the least biased estimatepossible on the available information; maximize the uncertainty (entropy) subject tothe partial information that is given; The maximum entropy distribution assigns apositive probability to every event that is not excluded by the given information;no possibility is ignored. The probabilities obtained in this manner are the bestpredictions possible with the state of knowledge and subjective information thatis available. This methodology allows distinguishing between reckless and cautiouspositions regarding the climate change threat.
1 Introduction
Efficient use of economic resources to cope with global warming in terms ofadaptation, mitigation and impacts (remediation and avoidance) depends on the
C. Gay (B) · F. EstradaCentro de Ciencias de la Atmósfera, UNAM, Ciudad Universitaria,Circuito Exterior, 04510, Mexico, DF, Mexicoe-mail: [email protected]
F. Estradae-mail: [email protected]

28 Climatic Change (2010) 99:27–46
amount, quality and interpretation of the information, and of the known uncertain-ties. Decision-making and risk assessment critically depend on how uncertainty ismanaged.
A great deal of effort in climate change has been devoted to reduce uncertainty(of different sources) in order to increase the usefulness of future climate scenariosfor the assessments of the potential impacts on human and natural systems (IPCC2001a). In recent years, great advances have been developed in making “the un-known known” (Schneider 2003): an increasing understanding of the climate systemhas permitted to improve the models’ complexity and ability to mimic it, providingmore confidence in climate scenarios, higher resolution in time and space, as well asthe possibility of constructing probabilistic climate change scenarios using differentstorylines and models. As noted by Schneider (2001), the decision of the IPCC, and inparticular of the SRES (Special Report on Emissions Scenarios. IPCC 2000) authors,of not assigning probabilities of occurrence to any emission scenario in order to notreveal any preference or policy recommendation, leaves decision-makers the dirtyjob of assigning arbitrary probabilities to temperature (and precipitation) changesin order to make this information useful for assessing the possible impacts. The factthat the IPCC qualifies every emission scenario as equally sound and that it statesthat any particular scenario is “no more or less likely than any other scenarios” haslead many to assume that it is most reasonable to assign a uniform distribution to theset of emission scenarios.1
Schneider (2001) showed that giving the same probability to each emissionscenario leads to bell-shaped histograms for global temperature for year 2100. Heargues that, even if emission scenarios were considered to be equally probable, theresulting temperature scenarios would not be so.2 Evidently, this information wouldbe very valuable for decision-making. Grübler and Nakicenovic (2001) questionedthe appropriateness and feasibility of assigning (subjective or objective) probabil-ities to future scenarios and state that Schneider’s position might be dangerousbecause it could lead to a dismissal of uncertainty. First of all, it is important toclarify that there is no “special uncertainty” in emission scenarios (and thereforein climate change scenarios) that prevents the use of (subjective) probabilities.3
This is a fake distinction of “climate change” uncertainty. In addition, althoughthey provide some valuable arguments regarding the unsuitability of using relative
1Although this could be perhaps the most “honest” way of doing so, it is also debatable: there isno evident symmetry in emission scenarios that makes them clearly equally probable. Low emissionscenarios imply political, economic and social efforts that, as can be learned form Kyoto, are noteasily attained, while “business as usual” or “higher emission” type scenarios do not. It seems that theclimate change threat, under the prevailing veil of skepticism and uncertainty, has not yet balancedthe odds enough to fully support a symmetry argument. Therefore, for many people, assigningthe same probability to each emission scenario could also be considered as arbitrary as any otherprobability assignment.2This argument assumes that probabilities and frequency ratios are the same. As will be discussedlater, this assumption has several inconvenients and indeed can dismiss uncertainty in an unjustifiablemanner.3Here we make the distinction between uncertainty and ignorance. Clearly it can be unfeasible toassign probabilities to outcomes which we are ignorant about their possible occurrence. Here we aredealing only with the known uncertainty reflected by SRES and the different climate models.
Climatic Change (2010) 99:27–46 29
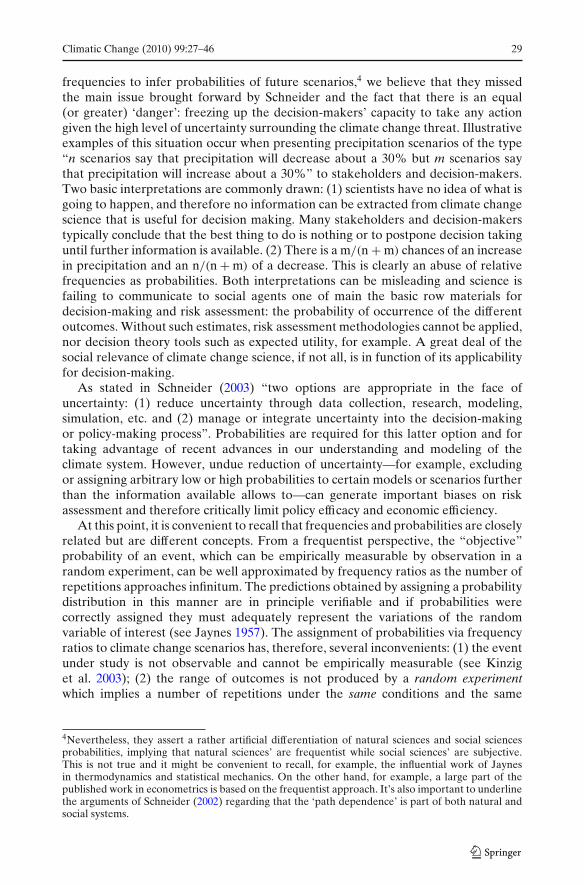
frequencies to infer probabilities of future scenarios,4 we believe that they missedthe main issue brought forward by Schneider and the fact that there is an equal(or greater) ‘danger’: freezing up the decision-makers’ capacity to take any actiongiven the high level of uncertainty surrounding the climate change threat. Illustrativeexamples of this situation occur when presenting precipitation scenarios of the type“n scenarios say that precipitation will decrease about a 30% but m scenarios saythat precipitation will increase about a 30%” to stakeholders and decision-makers.Two basic interpretations are commonly drawn: (1) scientists have no idea of what isgoing to happen, and therefore no information can be extracted from climate changescience that is useful for decision making. Many stakeholders and decision-makerstypically conclude that the best thing to do is nothing or to postpone decision takinguntil further information is available. (2) There is a m/(n + m) chances of an increasein precipitation and an n/(n + m) of a decrease. This is clearly an abuse of relativefrequencies as probabilities. Both interpretations can be misleading and science isfailing to communicate to social agents one of main the basic row materials fordecision-making and risk assessment: the probability of occurrence of the differentoutcomes. Without such estimates, risk assessment methodologies cannot be applied,nor decision theory tools such as expected utility, for example. A great deal of thesocial relevance of climate change science, if not all, is in function of its applicabilityfor decision-making.
As stated in Schneider (2003) “two options are appropriate in the face ofuncertainty: (1) reduce uncertainty through data collection, research, modeling,simulation, etc. and (2) manage or integrate uncertainty into the decision-makingor policy-making process”. Probabilities are required for this latter option and fortaking advantage of recent advances in our understanding and modeling of theclimate system. However, undue reduction of uncertainty—for example, excludingor assigning arbitrary low or high probabilities to certain models or scenarios furtherthan the information available allows to—can generate important biases on riskassessment and therefore critically limit policy efficacy and economic efficiency.
At this point, it is convenient to recall that frequencies and probabilities are closelyrelated but are different concepts. From a frequentist perspective, the “objective”probability of an event, which can be empirically measurable by observation in arandom experiment, can be well approximated by frequency ratios as the number ofrepetitions approaches infinitum. The predictions obtained by assigning a probabilitydistribution in this manner are in principle verifiable and if probabilities werecorrectly assigned they must adequately represent the variations of the randomvariable of interest (see Jaynes 1957). The assignment of probabilities via frequencyratios to climate change scenarios has, therefore, several inconvenients: (1) the eventunder study is not observable and cannot be empirically measurable (see Kinziget al. 2003); (2) the range of outcomes is not produced by a random experimentwhich implies a number of repetitions under the same conditions and the same
4Nevertheless, they assert a rather artificial differentiation of natural sciences and social sciencesprobabilities, implying that natural sciences’ are frequentist while social sciences’ are subjective.This is not true and it might be convenient to recall, for example, the influential work of Jaynesin thermodynamics and statistical mechanics. On the other hand, for example, a large part of thepublished work in econometrics is based on the frequentist approach. It’s also important to underlinethe arguments of Schneider (2002) regarding that the ‘path dependence’ is part of both natural andsocial systems.

30 Climatic Change (2010) 99:27–46
underlying data generating process: the use of different emissions scenarios (and/ormodels) prevent this; (3) we have only a limited number of outcomes from which wemust infer frequency ratios. It is convenient to recall that when using Monte Carlomethods to infer probability distributions, in most cases, several thousand repetitionsare needed. Furthermore, if we take a close look at emission and temperature figuresshown in the IPCC Third Assessment Report (IPCC 2001a), scenarios tend to clusterand produce “gaps” for certain values. These gaps imply zero probability for someintervals and are clearly not the product of any physical reason but a sampling prob-lem. This problem is not trivial and can generate important bias in the probabilitydistribution that is calculated; (4) it cannot be verified how well the probabilitydistribution fits reality; we have no observations for, say, 2100; (5) climate changescenarios might tend to cluster over a particular value because they rely on the sameinformation and because the models used might share similar modeling strategies(climate models can hardly be considered independent), and not necessarily becausethis particular value has greater probability than any other. Reading the same newson two different newspapers that rely on the same information source does not makeit more believable (Allen 2003).
The broad range of outcomes produced by the different climate change scenariosonly reflects our state of knowledge which we need to optimally process in orderto attain “best response” type of decision-making. The complexity of the systems(as well as their relationships and feedbacks) in study insure that the informationavailable for decision-making will always be partial and that “objective” scientificinformation will have to be complemented with “subjective” (expert) judgment.
Therefore, it is important to realize that we have to resign to ambitious questionssuch as “how likely is it that the world will get 6◦C hotter by 2100?” (Schneider2001). That is not known and will remain so until we reach that year (of courseour uncertainty will be smaller as we approach this date). Instead, we have to aska much modest question: given our state of knowledge, how strongly we believethe world will get 6◦C hotter by 2100? Evidently, there is no unique answer to thisquestion.
Since it is impossible to know the “true” probabilities of the different scenariosand temperature changes, the objective must be to find the probabilities that arethe most consistent with what our state of knowledge and expert judgment are. Ifthis is the case, optimal decision-making can be achieved: no matter what the actualoutcome is, and therefore, if the decision was right or wrong, it is still the optimalresponse given the information (objective and subjective) available. In this sense,the validity and usefulness of probabilistic climate change scenarios constructed inthis manner do not depend upon the true future climate values.
In this paper, we present the Maximum Entropy Principle as a useful tool forconstructing probabilistic climate change scenarios that are the least biased estimatespossible, consistent with the information at hand (including expert or decision-maker judgment) and that maximize what is not known. This warrants that noadditional, unintended assumptions are made and assigns a positive probabilityto every outcome that is not absolutely excluded by the available information.Entropy provides a measure of the uncertainty associated to a particular probabilitydistribution and therefore, how much information we are assuming to have when weassign it to an ensemble (set) of climate change scenarios. The Maximum EntropyPrinciple is presented as a simple and robust way of making use of both objective
Climatic Change (2010) 99:27–46 31
and subjective information, providing a systematic, unbiased and optimal approachfor assisting decision-making under uncertainty.
2 Entropy and the maximum entropy principle
2.1 Information theory entropy
Shannon (1948) introduced the “information theory” entropy which provides a mea-sure of the uncertainty associated to a given probability distribution. This measurecan be expressed as
H (X) = −Kn∑
i=1
pi log (pi)
Where X is a discrete random variable; pi is the probability of state i and K (a positiveconstant) is used to modify the unit of measure. K = 1 and the natural logarithm willbe used for the calculations presented in this paper.
It has been shown that information entropy is the unique measure of uncertaintyof a probability distribution that satisfies the following properties (Shannon 1948;Jaynes 1957):
1. H is a continuous function of the pi
2. If all pi are equal, the quantity A(n) = H(1/n, . . . , 1/n) is a monotonic increasingfunction of n. As a system increases the number of possible states, and all stateshave the same probability of occurrence, the uncertainty about what the outcomewill be is necessarily larger. If we trade a six-sided fair die for a ten-sided fair one,we would be more uncertain about the value of the outcome in the next toss.
3. The composition law. If a choice is broken down in two successive choices, theoriginal H should be a weighted sum of the individual values of H.
Other properties of information entropy are: If all events are equally likely to occurthen uncertainty reaches its maximum (uniform distribution); H ≥ 0 and is strictlyequal to zero when for some i, pi = 1 and for every j �= i, pj = 0. That is, i will occurwith no uncertainty; −log(pi) is referred as the surprise (surprisal) associated to theoutcome i. If pi is small, the surprise of learning that i was the actual outcome wouldbe large, and if pi is large the surprise that i occurred would be small. Therefore, H isthe expected value of the surprise and provides a measure of the surprise of learningthe value of X. −log(pi) is also interpreted as the information we gain when we knowthat the event i occurred. Thus, the greater H, the more informative (on average) ameasurement of X is.
These interpretations of entropy are useful for illustrating how different stake-holders’ beliefs might (or might not) be consistent with different probability assign-ments. Consider, for example, assigning equally probabilities to every outcomes. Dowe really believe that the surprise/information of learning that global temperatureby year 2100 is 1.4◦C or 5.8◦C is the same? Are the actions taken by governments upto this date consistent with this probability assignment? As will be shown later, withthis probability assignment the probabilities of surpassing some critical thresholdsthat have been defined as “dangerous” climate change are quite large.

32 Climatic Change (2010) 99:27–46
2.2 Maximum entropy principle
Jaynes (1957, 1962) proposed the Maximum Entropy Principle using Shannon’sentropy measure as a way for setting up probability distributions on the basis ofpartial knowledge. He showed that the maximum entropy estimate is the leastbiased estimate possible on the information at hand. This estimate maximizes theuncertainty (entropy) subject to the partial information that is given. That is, itproduces the closest probability assignment to a uniform distribution consistent withwhat is known. The maximum entropy distribution assigns a positive probability toevery event that is not excluded by the given information; no possibility is ignored(see Jaynes 1957).
In the following paragraphs the Jaynes (1957, 1962) Maximum Entropy formalismis presented.
Suppose the quantity x can take the values (x1, x2, ..., xn) where n can befinite or infinite and that the information expressed in terms of average values ormoment constraints { f1(x), f2(x), ..., fm(x)} is given, and where m < n. The objectiveis to determine the probabilities for each possible value of x consistent with theinformation at hand. Using the Maximum Entropy formalism, the problem can beexpressed as:
maxp
H(X
) = −Kn∑
i=1
pi log (pi) (1)
subject to
n∑
i=1
pi fk (xi) = yk, k = 1, 2, . . . , m(moment-consistency constraints
)(2)
n∑
i=1
pi = 1 (normalization condition) where pi ≥ 0 (3)
Note that the problem is ill-posed or underdetermined because there are n proba-bilities to be recovered but only m + 1 < n data points, consisting of the m moment-consistency constraints and that the sum of the n probabilities must equal 1 (Golanet al. 1996). A Lagrangian function can be used to recover the probabilities that areconsistent with the constraints (2) and (3):
L = −n∑
i=1
pi ln (pi) +m∑
k=1
λk
[yk −
n∑
i=1
pi fk (xi)
]+ μ
[1 −
n∑
i=1
pi
]
with the first order conditions
∂L∂pi
= − ln(
p̂i) − 1 −
m∑
k=1
λ̂k fk (xi) − μ̂ = 0
∂L∂λk
= yk −n∑
i=1
p̂i fk (xi) = 0
∂L∂μ
= 1 −n∑
i=1
p̂i = 0

Climatic Change (2010) 99:27–46 33
The formal solution to this system of n + m + 1 equations and parameters is
p̂i = 1
�(λ̂1, λ̂2, ..., λm
) exp
[−
m∑
k=1
λ̂k fk (xi)
]
where
�(λ̂)
=n∑
i=1
exp
[−
m∑
k=1
λ̂k fk (xi)
]
is a normalization factor called the partition function.The maximum entropy distribution does not have a closed-form solution
and therefore numerical optimization techniques are required for calculating theprobabilities.5
Of the infinite number of probability distributions that are consistent with thegiven information (that satisfy the constraints), the maximum entropy distribution isthe least biased estimate: any other probability assignment would imply assumptionsnot warranted by the available information. It allows to reason at best about theprobability of the n possible outcomes (not their relative frequencies) and to makethe best predictions consistent with the given information. This is not to say thatpredictions are correct, but that in order to improve them more information is needed(Jaynes 1957, 1962, 2003).
Although the Maximum Entropy Principle is not intended for estimating relativefrequencies,6 the probability that it assigns to the event xi is equal to an estimateof the relative frequency of this outcome in an infinitely large number of trials: themaximum entropy distribution is the same as the frequency distribution that can berealized in the greatest number of ways consistent with the given information (seeJaynes 1962; Golan et al. 1996).
3 Risk assessment and the construction of probabilistic climate change scenarios
3.1 Choosing the state of knowledge
It is important to notice that it is also impossible to know the true range of possiblechanges in climate variables for, say, 2100. The current knowledge and the intrinsicepistemic uncertainty in climate (including surprises and feedbacks), socioeconomicand emissions processes and modeling, make this unattainable. Then, the objectivemust be to choose a state of knowledge that is physically plausible and that reflectsthe range of uncertainty available in the current literature.
In this section, some of the possible effects of choosing different ranges (states ofknowledge) are shown. For illustrating purposes, consider the following examples.
5Nevertheless, this optimization problem can be solved using simple tools such as the Excel solverfunction.6In fact, the Maximum Entropy Principle is most helpful in cases where repetitions are impossible orirrelevant (Jaynes 1962).

34 Climatic Change (2010) 99:27–46
0
1
2
3
4
5
6
7
1990
1995
2000
2005
2010
2015
2020
2025
2030
2035
2040
2045
2050
2055
2060
2065
2070
2075
2080
2085
2090
2095
2100
Year
°C
Fig. 1 Global mean temperature scenarios for 2100 using 38 SRES emission scenarios and threeclimate sensitivities
Figure 1, shows a possible representation of the range of climate change scenarios,consisting of 114 global mean temperature scenarios using 38 SRES emission scenar-ios (families A1, A2, B1 and B2) and three sensitivities.7 In this case, the mean globaltemperature change for year 2100 ranges from 1.18◦C to 5.99◦C.
Table 1 summarizes three more possible representations of the state of knowledgeand their corresponding entropy8 and relative entropy. The relative entropy iscalculated as the ratio of a particular state of knowledge and the widest rangeconsidered, in this case the range of the IPCC’s likely ranges.
As is shown in Table 1, the selection of the range that would be used forrepresenting the state of knowledge can result in trading uncertainty by ignorance.In this case, part of the range of possible values is excluded from the beginning ofthe analysis, limiting the information available for decision-making and biasing theresulting probability distribution and subsequent assessments (for example, of thepotential impacts of climate change). The IPCC’s AR4 “best estimates”, if taken asthe representation of the current state of knowledge, entail a reduction of more than50% of the uncertainty; the range in the IPCC’s TAR would entail a reduction of an11% and; the scenarios in Fig. 1, a reduction of a 6%. Evidently, this is only usefulfor comparing two or more different possible state of knowledge. Furthermore, theIPCC’s likely ranges do not even attempt to represent the true range of possible
7These climate change scenarios were obtained using the MAGICC 4.1 software. The sensitivitiesused are 1.5◦C (low), 2.6◦C (medium) and 4.5◦C (high).8This value is computed for a (continuous) uniform distribution as ln(b − a) where b is the upperlimit and a the lower.

Climatic Change (2010) 99:27–46 35
Table 1 Different possiblestates of knowledge and theirentropy and relative entropy
State of knowledge Entropy Relativeentropy
IPCC AR4 best estimates (1.8◦C to 4◦C) 0.79 0.47IPCC TAR (1.4◦C to 5.8◦C) 1.48 0.89MAGICC (1.18◦C to 6◦C) 1.57 0.94IPCC AR4 likely ranges (1.1◦C to 6.4◦C) 1.67 1
outcomes (Meehl et al. 2007). According to the IPCC, each of the likely ranges issupposed to contain only about 66% to 90% of the probability mass.
Even though there are global temperature scenarios which project increases ofmore than 8◦C, the IPCC’s likely ranges are of special interest for two main reasons:they were produced by the consensus of the Working Group I and, they representthe range of possible global temperature increases that the IPCC’s decided to makepublic to decision-makers and the general public. For these reasons, we consider that,for this paper, it is the relevant state of knowledge to be used.
It is important to realize that the probability distributions obtained by theMaximum Entropy Principle are conditional on the chosen state of knowledge,but that for any given state of knowledge the Maximum Entropy estimate has thesame properties as described above and is the least biased estimate possible on theinformation at hand.
3.2 Current recommendations for handling uncertainties in climatechange scenarios
Uncertainty has to be preserved as much as possible in order not to bias thesubsequent analysis, but it also has to be processed in such a way that it is usefulfor decision making. This has been an important issue in climate change science andhas produced a variety of recommendations for dealing with uncertainty in climatechange assessments. At the present time, decisions regarding 2100 climate are tobe made with several centigrade degrees of uncertainty, similar to the differencein temperatures from glacial and interglacial periods. Although decision-makingregarding the climate change threat should be constantly updated as we approachthis date and further information is obtained, most of the actions that are capableof producing important reductions in GHG emissions that can lead to increasesin global temperature of less than 2◦C (for example) at a feasible cost, are to beimplemented in the next few decades (Parry et al. 2008a, b; Meinhausen and Hare2008, among others).
Even though several emission scenarios and models are now available, some ofthe earlier literature on the assessment of the potential impacts of climate changein human and ecological systems was developed selecting a single climate changescenario as input (a subjective selection of a single emission scenario, a model anda climate sensitivity). Evidently, this did not provide a good representation of theavailable state of knowledge at the time and arbitrarily dismissed all uncertainty,producing a degenerate probability distribution.9 This approach could only provide
9As stated in Jaynes (1962) “It is unreasonable to assign zero probability to any situation unless ourdata really rules out that case”

36 Climatic Change (2010) 99:27–46
illustrative examples of the potential consequences of climate change under veryrestrictive assumptions and therefore was likely to provide a very biased estimationof risk. Until less than a decade, recommendations10 suggested including at leasttwo (high and low) climate change scenarios in order to offer contrasting visionsof how climate could evolve and of its expected impacts/benefits (Hulme et al. 2002).Recommendations have changed little since then, and now what is recommendedis that climate scenarios should be: consistent with global projections, physicalplausible, applicable to impact assessment, and representative of future regionalchanges (IPCC-TGICA, 2007). Although all these recommendations provide impor-tant information, they still are limited to arbitrarily chosen possible outcomes (andassigning zero probability to any other) and they do not offer any measure of howprobable these outcomes are, and therefore this key element for decision making isstill missing. In all cases, uncertainty is arbitrarily dismissed. In practice, the scientificcommunity devoted to climate change impact assessment has not been able to fullyintegrate uncertainty and all rely on stringent subjective assumptions such as the onesreferred above (UNFCCC 2008a, b).
New methodologies that are more suitable for assessing the potential impacts ofclimate change under uncertainty (including the use of Monte Carlo methods, forexample Preston 2006; Nawaz and Adeloye 2006; Gay et al. 2006) are being devel-oped and implemented. Nevertheless, when the uncertainty becomes large and, forexample, the same probability is assigned to each climate scenario, impact scenariosbecome non-informative and tend to a uniform distribution: as contrasting views ofthe world get farther apart and are “mixed” in the same proportion, the inferencesabout the future get more and more confusing. Even when other distributions areapplied to the uncertainty, none of them can be considered objective and there is nomeasure of how much information is assumed for each of them, and therefore howmuch the impact scenario depends on this assumption. On the contrary, carefullyintegrating subjective (expert) information can produce probabilistic climate changescenarios that do not dismiss uncertainty and that are consistent with differentsubjective assumptions (information or expert judgment) regarding an average meantemperature change.
In this paper, the maximum entropy distribution is proposed as the least biasedprobabilistic representation of future climate values consistent with the expert ordecision-maker information. The objective is to produce relevant information fordecision-making according to different agents’ judgment. The fact that this proba-bility distribution maximizes the uncertainty consistent with the partial informationthat is available is the prime reason that justifies its use for inference (Jaynes 1957).
In order to obtain the maximum entropy distribution, two inputs are needed: (1)the range of possible outcomes of climate change scenarios obtained using climatemodels. The selection of this range has also an unavoidable subjective component,because the true range of possible future values of climate variables is unknown.For example, one important source of uncertainty, the climate sensitivity, is conven-tionally assumed to lay between 1.5◦C (low), 2.6◦C (medium) and 4.5◦C (high), witha best estimate of 3◦C (IPCC 2001b). A great number of climate simulations havebeen conducted assuming climate sensitivity is within this range. Nonetheless, it has
10See for example http://www.grida.no/climate/ipcc/emission/150.htm, http://www.ukcip.org.uk/scenarios/ukcip02/documentation/documents/UKCIP02_App.pdf

Climatic Change (2010) 99:27–46 37
been shown that climate sensitivity could be well beyond the high estimate (IPCC2001b). The choosing of this arbitrary range of possible values should aim to providea good representation of the known uncertainties and be physically plausible; (2) anarbitrarily chosen average mean change11 for the climate variable of interest. It isimportant to notice that, once the average mean change is subjectively chosen anda range of plausible values is selected as a representation of the state of knowledge,the rest of the procedure is completely objective. That is, the problem of finding theunknown probabilities becomes a pure inverse problem (Golan et al. 1996) that canbe solved using optimization techniques. This is a straightforward application of thedice problem shown in Jaynes (1957, 1962), but in this case the average value is notknown. The original six-sided dice problem of Jaynes assumes that the mean valueis given; what we are doing is creating different scenarios for different (subjective)estimations of this average value and conditional on the range of values chosenfor representing the state of knowledge. In the dice problem, scenarios could beconstructed: if the average value were 4.5, what would be the probability of having,say, a 2 in the next toss? What would this probability be if the average value was 3?and so on. In each case the best predictions consistent with the information availablewould still be those obtained using the Maximum Entropy Principle. Differentpeople can have different information about this average value and, therefore, themaximum entropy distribution will be different for each of them.12 Evidently, not allof them can be correct. Nevertheless, each person will be making the best predictionsconsistent with their information (right or wrong). For two people that have thesame information, the maximum entropy distribution will be exactly the same. TheMaximum Entropy principle can produce probabilistic scenarios that are maximallynoncommittal with regard to the missing information and still consistent with theexpert (subjective) information and the state of knowledge available.13
3.3 Suggestions for the selection of the average mean change
In this section two main suggestions for selecting the average mean change arepresented. The first one is based on the decision-maker’s cautionary/reckless attituderegarding the climate change threat and the second consist in a modification of
11In most cases, this average mean change will not correspond to the most probable change. Theaverage value “tilts” the probability distribution in favor of larger or smaller values depending onthe side the chosen average is with respect to the “center” value that can be obtained dividing theuncertainty range by 2. If the chosen average value is (smaller) larger than the uncertainty rangedivided by 2, then outcomes (smaller) larger than the chosen average will be more probable.12The same applies to different ranges of plausible values or representations of the state of knowl-edge. Once these subjective values are defined, the maximum entropy probabilities, conditional onthese subjective assumptions, can be obtained.13It is important to notice that: (1) the goal is not to produce a “correct” probability distribution,but to offer different probabilistic climate change scenarios that are consistent with a subjectively(arbitrarily) chosen average mean temperature (or precipitation) change; (2) The range of uncer-tainty is preserved, no storyline or emission scenario is assumed to occur for sure and every possibleoutcome has a positive probability (no possibility is ignored); (3) Physical climate models andemission scenarios are used only to enumerate the possible outcomes needed for statistical inference;(4) The probabilities that are obtained are conditional on the subjective chosen mean value and therepresentation (range of values) of the state of knowledge.

38 Climatic Change (2010) 99:27–46
one of the current recommendations for dealing with uncertainty in climate changescenarios.
3.3.1 Decision-maker’s attitude
The decision-maker’s attitude regarding the uncertainty surrounding climate changeprovides a useful way for selecting the average value needed for obtaining a maxi-mum entropy distribution. In the absence of additional information, the maximumentropy principle leads to a uniform distribution. This distribution will be consideredas neutral given that it does not include any subjective additional information. As-suming that there is no true, undisputed information, that can be used to objectivelyassign higher/lower values to the different outcomes, if a particular agent decidesto assign higher (lower) probabilities to the most favorable outcomes and smaller(higher) to the least favorable than a neutral agent would, the resulting probabilitydistribution could be associated to a reckless (cautious) attitude. All agents displaydifferent attitudes towards uncertainty.
In this paper we will use the term cautious agent for those agents that whenfacing an uncertain situation will assign a higher subjective probability of occurrenceto the least favorable outcomes than a neutral agent would. The particular levelof cautious/reckless attitude shown by a decision-maker would lead him to selectthe particular average mean change needed for constructing a probabilistic climatechange scenario that best reflects his attitude towards the threat of climate change.That is, the average mean change chosen by a particular decision-maker will revealhis type of attitude towards uncertainty. Different decision-makers with different at-titudes towards uncertainty will have different probabilistic climate change scenarios.A cautious decision-maker will tend to select a higher average mean change whichimplies higher probabilities for higher temperature increases, demonstrating hispreoccupation of possibly underestimating the probabilities of these less favorableoutcomes (higher impacts). Some actions consistent with this type of attitude couldbe, for example, devoting important international lobbing efforts for reducing GHGgases emissions, investing significant amounts of resources for preparing for thepotential impacts of climate change and for adaptation.
On the other hand, a reckless decision-maker will tend to select a lower averagemean change, assigning lower probability of occurrence to the least favorable out-comes, showing a lower level of concern for the possibility of underestimating theprobabilities of occurrence of these outcomes. Nevertheless, for most of the rangeof reckless attitudes, this type of decision-maker still believes that large increasesin temperature are possible, and therefore he will still devote some resources tomitigation, adaptation and for being prepared for the potential impacts of some ofthe most unfavorable outcomes.
A neutral decision-maker would choose an average mean change that assigns thesame probability to each possible outcome; his attitude does not lead him to givehigher or lower weights to any possible outcome. The noncommittal or “politicallycorrect” decision of the authors of the Special Report on Emissions Scenarios(IPCC 2000) of not offering any judgment as to the preference for any of theemission scenarios and of clearly stating that no policy recommendation is intendedcould be interpreted as a neutral position. Figure 2 shows some possible maximumentropy distributions reflecting different types and degrees of these attitudes towardsuncertainty.

Climatic Change (2010) 99:27–46 39
Fig. 2 Possible maximumentropy distributions for threetypes of agent: reckless,neutral and cautious
0
0.05
0.1
0.15
0.2
0.25
0.3
0.35
0.4
0.45
0.5
1 1.5 2 2.5 3 3.5 4 4.5 5 5.5 6
Reckless Cautious
Neutral
Assuming that decision-makers will assign the available resources for adaptation,mitigation and impact remediation and avoidance accordingly to their subjectiveprobabilistic climate change scenarios, it can be seen that there are efficiency andcost/benefit relations implied. First, a neutral agent would distribute the resourcesavailable among all possible outcomes not showing a particular preference to avoidor prepare for any outcome. When resources are scarce this might no be the mostefficient assignation. Selecting a lower average mean change in temperature couldimply higher costs due to lower preparation (adverse impacts) for the least favorableoutcomes, but reduces the possible costs due to over-preparation. A cautious agentwould focus most of the available resources on the least favorable outcomes and,therefore, in case of one of these outcomes actually realizes, be better prepared.Nevertheless, he is risking in incurring in higher preparation costs than actuallyneeded.
It can be useful to keep track of how much cautious/reckless a particular averagemean change represents. For this purpose, a linear function whose domain is thevalues obtained from the collection of climate change scenarios and its range is −1to 1 is proposed as a cautious/reckless index. The value of minus one representsthe most reckless attitude while the plus one value is the most cautious. The linearfunction could be considered as having the disadvantage of assuming that this indexincreases monotonically for all possible values and therefore, it might not providean adequate measure. Other non-linear functions (such as a cubic function) couldprovide a better way of measuring the changes in the index value that increasesslowly for values close to the arithmetic mean of the range of uncertainty and thatrapidly increase as the average mean change gets farther from this value (in this case3.5◦C). Nevertheless, it is recommended to restrain the cautious/reckless index to bean ordinal measure.
It is important to notice that trade between agents with different (even if slightlydifferent) estimates of probabilities is possible. Therefore, a cautious agent couldhedge trading risk with another less cautious agent.
3.3.2 Choosing arbitrary low and high average mean values
Another possible way for selecting the average mean change in climate changescenarios can consist on selecting arbitrary “low” and “high” average values. Alinear function can also be utilized for keeping track of how much these values differfrom the arithmetic mean value of the ensemble of climate change scenarios andtherefore for providing a measure of how extreme our assumptions regarding the

40 Climatic Change (2010) 99:27–46
selected average mean change are (−1 corresponding to the lowest average meanvalue possible and 1 to the highest). Common recommendations such as selectingmore than one climate change scenario can be easily adapted and, for example, “low”and “high” probabilistic climate change scenarios can be contrasted.
Measures such as the relative entropy and the information index can provideimportant information about how much the selected average mean change reducesuncertainty and of how informative this value is. These measures are helpful forkeeping track of how much our probabilistic scenario depends on our arbitraryassumptions.
The relative entropy is calculated as the ratio of the entropy of a particular distrib-ution and the entropy of a uniform distribution with the same support. This measureprovides a quantitative measure of how much the maximum uncertainty (that isobtained using a uniform distribution) is reduced by imposing a different distributionfor a given support. On the other hand, the information index14 provides a measureof how much the particular probabilistic scenario depends on “expert” subjectivejudgment. A high information value corresponds to a small relative entropy value,implying that a large part of the original uncertainty has been removed. That is, theresulting distribution depends heavily on the subjective information added.
The reckless/cautious index, the relative entropy and the information index canprovide a way of classifying the attitude of the different agents, of quantifying howmuch information they are assuming to have and, how much of the uncertainty isbeing removed.
4 Probabilistic climate change scenarios for 2100
The most important applications of this methodology for constructing probabilisticclimate change scenarios could be in risk and potential impact assessment usingMonte Carlo techniques, microeconomic theory (particularly, choice under uncer-tainty and game theory) and policy making. Nevertheless, in this section, for the sakeof simplicity, a very simple example is given. In addition, the results of this examplecan be compared to the frequentist results shown in Schneider (2001). Differentprobabilistic climate change scenarios are developed, each of them consistent withthe state of knowledge represented by the IPCC’s likely ranges and different degreesof reckless/cautious attitudes and arbitrary assumptions about the average meanglobal temperature change for 2100. Then, the probabilities of exceeding somethreshold values identified as “dangerous” climate change (Joachim et al. 2006;Bruckner and Schellnhuber 1999; Schneider and Lane 2006, for example) implied bydifferent assumptions are explored. It is important to notice that these probabilitiesare the best predictions possible with the available information and a particular setof arbitrary assumptions chosen by the decision-maker.
Figure 3a shows the probabilities of exceeding “threshold” values of 2◦C and3.5◦C increases in global temperature which have been identified as dangerousclimate change. These probabilities are produced using different maximum entropy
14The information index can be calculated as one minus the relative entropy.

Climatic Change (2010) 99:27–46 41
0.00
0.20
0.40
0.60
0.80
1.00
1.20 1.70 2.20 2.70 3.20 3.70 4.20 4.70 5.20 5.70 6.20 1.20 1.70 2.20 2.70 3.20 3.70 4.20 4.70 5.20 5.70 6.20
p>=3.5p>=2
0
0.1
0.2
0.3
0.4
0.5
0.6
0.7
Information index
a b
Fig. 3 a Probabilities of exceeding “threshold” values of 2◦C and 3.5◦C corresponding to differentsubjective selections of mean average change in the interval [1.2◦C, 6.3◦C]. b Information indexcorresponding to different subjective selections of mean average change in the interval [1.2◦C, 6.3◦C]
distributions for a range of arbitrary average mean change values from 1.2◦C to6.3◦C. As can be seen, the probabilities of surpassing these threshold values holdnon-linear relations with respect to the arbitrarily average mean change that ischosen, rapidly increasing for small values of the average mean change and slowlyapproaching to one for large values. Non-linear relations are also held with respectto different values of the proposed linear reckless/cautious index. Figure 3b presentsthe corresponding information index for the different average mean changes chosen.The information index can be interpreted as a measure of how much each of theseprobabilistic scenarios depend on the subjective information that is added for its con-struction. A non-committal, non-informative average mean change, correspondingto the arithmetic mean of the full range of outcomes (in this case 3.75), will producea uniform distribution. In this case, no additional subjective information is added,and uncertainty is maximized. This is the case of a decision-maker that thinks thatthere is no reason to believe that a particular outcome is more or less likely to occur(Principle of Insufficient Reason of Bernoulli and Laplace). Any other probabilityassignment becomes increasingly dependent on the agent’s subjective judgment ashis assumptions about the average mean change get farther from the arithmetic meanof the set of possible outcomes.
Table 1 presents estimations for particular values of the arbitrary chosen averagemean value and their corresponding degree of reckless/cautious attitude. As can beseen in this table, the probabilities of surpassing the chosen threshold values are quitelarge for most of the possible range of reckless/cautious attitudes (chosen averagemean temperature changes). Only for agents showing very high levels of recklessattitude, the probabilities of surpassing 2◦C are negligible. For example, the first rowTable 1 shows that when choosing an average mean change of 1.2◦C, an extremelyreckless attitude is assumed (a value of −0.96 of the linear reckless/cautious index).In this case, as revealed by the information index, the decision-maker’s subjectiveselection of the average mean change importantly reduces the relative entropyand therefore is considered to be highly informative and the resulting probabilitydistribution is highly influenced by his subjective information. Evidently, a decision-

42 Climatic Change (2010) 99:27–46
maker showing this particular level of reckless attitude is assuming a great risk oflarge losses due to the potential impacts associated to higher temperature increases.Given this probability assignment, the decision-maker does not have importantincentives for eliminating the worst possible outcomes through international lobbingfor reducing GHG emissions, investing in cleaner technology, or for building adap-tation capacities.
The probabilities of exceeding the 2◦C and 3.5◦C thresholds for a slightly lessreckless agent, who chooses an average mean change of 2◦C, increase rapidly upto 39.3% and 8.1% respectively (see Table 2, row 2).
On the other hand, an agent with a high level of caution (a 0.85 value of the linearreckless/cautious index) will produce another informative probability distributionthat gives almost certain probability of occurrence of temperatures higher than 2◦Cand 3◦C (see row 7 of Table 2). It is relevant to notice that, as indicated by the valueof information index, these conclusions greatly depend on the agent’s subjectivejudgment. This agent will act as if the worst outcomes are to occur and will try asmuch as he can to avoid them.
It is important to consider that this is a sequential process. Perception of risk for allagents will change as time goes by and a better picture of climate change is available.If climate change impacts continue to manifest, possible higher impacts will becomemore credible menaces and agents will update their perception of risk and beliefsabout their occurrence.
If a neutral attitude is assumed, our subjective beliefs do not lead us to assignhigher (lower) probabilities to any outcome, then the probabilities of surpassing 2◦Cand 3.5◦C are quite large (83.3% and 55.6% respectively) and it can be questionedhow many agents (governments) are acting as (at least) neutral regarding climatechange scenarios. The limited success of international negotiations (such as in thecase of the Kyoto protocol) might reveal that at present time a reckless attitude isthe dominant way of thinking.
Schneider (2001) shows two different frequentist estimations of the probability ofsurpassing 3.5◦C. Using 18 GCMs and six illustrative SRES scenarios he obtains a23% probability for this event, while using the same GCMs but only the highest andlowest SRES illustrative scenarios he finds a probability of 39%. These results arecomparable to our estimations for moderate-high levels of reckless attitudes.
Table 2 Probabilities of exceeding some threshold values identified as “dangerous” climate change
Average mean Linear reckless/ H(p) P(x ≥ 3.5) P(x ≥ 2) Relative Information Lambdab
change cautious indexa entropy index
1.2 −0.96 1.392 0.000 0.002 0.349 0.651 6.932.0 −0.67 3.247 0.081 0.393 0.814 0.186 1.033.0 −0.30 3.870 0.346 0.694 0.970 0.029 0.3243.75 0 3.989 0.556 0.833 1 0 04.0 0.11 3.976 0.623 0.870 0.997 0.003 −0.1045.0 0.48 3.643 0.868 0.971 0.913 0.087 −0.5986.0 0.85 2.501 0.999 1.00 0.627 0.373 −2.232aThis is also a linear measure of how far the selected average mean change is from 3.5◦CbLambda is the Lagrangian Multiplier and its value is the rate of change in the objective function(entropy) as the constraint is relaxed

Climatic Change (2010) 99:27–46 43
Selecting two arbitrarily “low” and “high” average mean changes can provide aparticular decision-maker intervals for the occurrence of some event. For example,choosing a 2.5◦C and a 3.5◦C average mean changes produces a [56.7%, 79.2%] forsurpassing a 2◦C threshold, and a [20.7%, 48.6%] for 3.5◦C.
5 Conclusions
This paper offers a methodology to process the objective and subjective informationavailable in a way that is consistent with the original SRES intentions: “Preferencesfor the scenarios presented here vary among users. . . While the writing team asa whole has no preference for any of the scenarios, and has no judgment as tothe probability or desirability of different scenarios, the open process and initialreactions to draft versions of this report show that individuals and interest groupsdo have such judgments”.15 The objective of this methodology is to produce relevantinformation for decision-making according to different agents’ judgment and levelsof reckless/cautious attitude. In this paper, the Maximum Entropy Principle is usedfor assigning probabilities to climate change scenarios when only partial informationis available. These estimates have desirable properties such as: they are the leastbiased estimate possible on the information at hand; maximize the uncertainty(entropy) subject to the partial information that is given. That is, it produces theclosest probability assignment to a uniform distribution consistent with what isknown; the maximum entropy distribution assigns a positive probability to everyevent that is not excluded by the given information; no possibility is ignored; Theprobabilities obtained in this manner are the best predictions possible with the stateof knowledge and subjective information that is available.
Now, in the wake of the release of the IPCC’s Forth Assessment Report (AR4), itis fundamental to discuss the new methodologies that are being proposed for dealingwith uncertainty and to bring forward some of our main concerns regarding this issue.Particular attention will be paid to the Summary for Policy-Makers (SMP-AR4) ofWorking Group I.
First of all, let’s not forget that the SPM-AR4 information is intended for policy-makers, which, in general, have no formal training in climate and/or uncertainty.When presenting “official” and “objective” “best estimates” and “likely ranges”, thiswill be the information that will be used for decision-making. These probabilitiescould be interpreted as “facts” such as “when flipping a fair coin, tails have a 50%chance of occurring”. This is not the case. It is not possible to produce “objective”probabilities and, therefore, best estimates and likely ranges are nothing but adevice and can be misleading. The IPCC is taking a strong position telling howdecision makers should weight the possible climate change (temperature) scenariosand should be aware of the responsibility of reducing uncertainty in this manner,unjustifiable in our opinion. Here are some of our reasons for making this judgmentof the way uncertainty is managed in the IPCC’s AR4:
• As stated before in this paper, it is important to realize that a unique and“objective” judgment regarding the probabilities of the different climate change
15http://www.grida.no/climate/ipcc/emission/142.htm#anc1

44 Climatic Change (2010) 99:27–46
scenarios is neither achievable nor desirable and therefore subjective informa-tion plays (and should play) a crucial role (whether we like it or not). TheIPCC’s “best estimates” and “likely ranges” are based on frequentist estimationsthat, as stated before, are really nothing but another way of setting subjectiveprobabilities. Therefore, the IPCC’s AR4 estimations should be regarded assubjective as any other estimation.
• As stated in Chapter 10 of the WGI of the IPCC’s AR4, all ensembles used inthe Report are “opportunity” ensembles, with no sampling methodology and arenot expected to represent the full range of uncertainty. This characteristic makesthe statistical interpretation of the range and statistical measures such as centraltendency and dispersion measures even more problematic.
• The “best estimates” are based on the empirical fact that the mean of an ensem-ble tends to provide a better forecast than any of its individual members becauseif the different members are independent and equally probable, then individualbiases tend to cancel. This is not the case in climate change scenarios. Two mainissues arise: (1) There is no warranty that a particular model or the ensemblemean will continue to perform as well in the future as it does now. (2) One of themain characteristics of climate change scenarios is the dominance of epistemicuncertainty, due to the lack of knowledge (for example, climate sensitivityand cloud parameterizations, among others). Techniques used for forecastingweather (and short-term climate) are suitable for aleatory uncertainty. These aredifferent types of uncertainty and epistemic uncertainty cannot be solved usingtechniques that were developed for addressing aleatory uncertainty.
• The “likely ranges” represent anywhere from 66% to 90% confidence intervals(about a plus/minus one or two standard deviation from the mean in a normaldistribution). These criterion leaves out the scenarios that represent higher risk.It is worth remembering that in any risk assessment situation, a great interestis placed in low-probability/high-impact outcomes. For the common decision-maker, scenarios outside these likely ranges will not be considered and thereforeuncertainty is dismissed by this subjective definition of “likely ranges”.
• Likely ranges are constructed as a fixed proportion of the multi-model average:For any given average value, likely ranges or 66–90% probability intervals canbe constructed by adding 60% of the multi-model mean value and subtracting40%. This is an oversimplification and posses the question of why running sucha “large” number of models.
• The IPCC keeps avoiding the emissions uncertainty and therefore, these proba-bilistic scenarios are conditional on the emission scenario for which we have noinformation regarding its probability of occurrence.
• According to the IPCC’s AR4 these best estimates and likely ranges are includedexplicitly to avoid loss of “policy-relevant information”. We strongly believe thatthis information is misleading and therefore should be used with caution.
• If we were to use the “best estimate” values for each emission scenario familyas the average mean change needed to apply the methodology in this paper,each of these “best estimates” would imply a reckless attitude. As a product ofthe constant proportions used to construct the “likely ranges” (plus 60% minus40% of the multi-model mean value), the resulting distribution would be biasedtowards the smaller increases in global temperature, assigning small probabilitiesto the worst outcomes.

Climatic Change (2010) 99:27–46 45
Although uncertainty can be reduced improving our understanding and the abilityof climate models to mimic the climate system (and also by eliminating “outlier”models if and only if are proven to be inadequate), it is important to bare in mindthat one of the main sources of uncertainty comes from emission scenarios. Thatis, a considerable amount of the uncertainty can be only eliminated through policy:if actions are taken to reduce emissions the largest temperature changes couldbe avoided; on the other hand if no action is taken the most probable result isthat the lower temperature changes will be eliminated. Any other way of reducinguncertainty is just arbitrary and increases our ignorance (Schneider 2003).
Acknowledgements The authors would like to thank an anonymous reviewer for his valuablecomments. The authors acknowledge financial support for this work from the Consejo Nacional deCiencia y Tecnología under grant CONACYT-SEMARNAT- 23836.
References
Allen MR (2003) Possible or probable? Nature 425:242Bruckner T, Schellnhuber HJ (1999) Climate change protection: the tolerable windows approach
(IPTS Report 34 1999)Gay C, Estrada F, Conde C, Bravo JL (2006) Uso de Métodos de Monte Carlo para la Evaluación de
la Vulnerabilidad y Riesgo ante Condiciones Actuales Bajo y Bajo Cambio Climático. V. Con-greso de la Asociación Española de Climatología. Zaragoza, España, pp 18–21 de septiembre,2006, pp 762–770
Golan A, Judge GG, Miller D (1996) Maximum entropy econometrics: robust estimation with limiteddata. Wiley, New York
Grübler A, Nakicenovic N (2001) Identifying dangers in an uncertain climate. Nature 412:15Hulme M, Jenkins GJ, Lu X, Turnpenny JR, Mitchell TD, Jones RG, Lowe J, Murphy JM, Hassell
D, Boorman P, McDonald R, Hill S (2002) Climate change scenarios for the United Kingdom:the UKCIP02 scientific report. Tyndall Centre for Climate Change Research, School of Environ-mental Sciences
IPCC (2000) Special report on emissions scenarios. In: Nakicenovic N, Swart R (eds) CambridgeUniversity Press, Cambridge, p 570
IPCC (2001a) Climate change 2001: synthesis report 2001—contribution of working group I, II, andIII to the third assessment report of the intergovernmental panel on climate change. In: WatsonRT, and the Core Writing Team (eds) Cambridge University Press, Cambridge, p 397
IPCC (2001b) Climate change 2001: impacts, adaptation, and vulnerability: contribution of workinggroup II to the third assessment report of the intergovernmental panel on climate change. In:Watson RT, the Core Writing Team (eds) Cambridge University Press, Cambridge, pp 1042
Jaynes ET (1957) Information theory and statistical mechanics. Phys Rev 106(4):620–630Jaynes ET (1962) Information theory and statistical mechanics. In: Ford KW (ed) Brandeis Univer-
sity Summer Institute lectures in theoretical physics, vol 3. Benjamin, New York, pp 181–218Jaynes ET (2003) Probability theory: the logic of science. Cambridge University Press, CambridgeJoachim H, Schnellnhuber HJ et al (eds) (2006) Avoiding dangerous climate change Cambridge
Univ. Press, CambridgeKinzig A, Starrett D, Arrow K, Aniyar S, Bolin B, Dasgupta P, Ehrlich P, Folke C, Hanemann M,
Heal G, Hoel M, Jansson AM, Jansson B-O, Kautsky N, Levin S, Lubchenco J, Mäler K-G,Pacala SW, Schneider SH, Siniscalco D, Walker B (2003) Coping with uncertainty: a call for anew science-policy forum. Ambio 32:330–335
Meehl GA, Stocker TF, Collins WD, Friedlingstein P, Gaye AT, Gregory JM, Kitoh A, Knutti R,Murphy JM, Noda A, Raper SCB, Watterson IG, Weaver AJ, Zhao Z-C (2007) Global climateprojections. In: Solomon S, Qin D, Manning M, Chen Z, Marquis M, Averyt KB, Tignor M,Miller HL (eds) Climate change 2007: the physical science basis. Contribution of working groupI to the fourth assessment report of the intergovernmental panel on climate change. CambridgeUniversity Press, Cambridge

46 Climatic Change (2010) 99:27–46
Meinhausen M, Hare B (2008) Missing the turn towards a low-emission path? Clim Change91(3):233–236. doi:10.1007/s10584-008-9486-x
Nawaz NR, Adeloye AJ (2006) Monte Carlo assessment of sampling uncertainty of climate changeimpacts on water resources yield in Yorkshire, England. Clim Change 78(2–4):257–292
Parry M, Lowe J, Hanson C (2008a) The consequences of delayed action on climate change. Preparedfor and submitted to the 14th Conference of the Parties, Poznan, Poland. December 2008http://www3.imperial.ac.uk/climatechange
Parry M, Palutikof J, Hanson C, Lowe J (2008b) Squaring up to reality. Nature Reports ClimateChange, June 2008, pp 1–3
Preston BL (2006) Risk-based reanalysis of the effects of climate change on U.S. cold-water habitat.Clim Change 76(1–2):91–119
Schneider SH (2001) What is ‘dangerous’ climate change? Nature 411:17–19Schneider SH (2002) Can we estimate the likelihood of climatic changes at 2100? An editorial
comment. Clim Change 52(4):441–451Schneider SH (2003). Imaginable surprise. In: Potter TD, Colman B (eds) Handbook of weather,
climate and water: atmospheric chemistry, hydrology, and societal impacts. Wiley, New YorkSchneider SH, Lane J (2006) An overview of “dangerous” climate change. In: Schellnhuber HJ (ed)
Avoiding dangerous climate change. Cambridge University Press, CambridgeShannon CE (1948) A mathematical theory of communication. Bell Syst Tech J 27:379–423, 623–656UNFCCC (2008a) Handbook on vulnerability and adaptation assessment. http://unfccc.int/resource/
userman_nc.pdf. Accessed 1 October 2008UNFCCC Secretariat (2008b) Compendium on methods and tools to evaluate impacts of, and
vulnerability to, climate change, pp 228