objective measures of sparkling wine style and quality
89
OBJECTIVE MEASURES OF SPARKLING WINE STYLE AND QUALITY FINAL REPORT to AUSTRALIAN GRAPE AND WINE AUTHORITY Principal Investigator: ASSOC. PROF. KERRY WILKINSON Project Number: UA 1205 Research Organisation: THE UNIVERSITY OF ADELAIDE Date: 30 th SEPTEMBER 2016
-
Upload
khangminh22 -
Category
Documents
-
view
3 -
download
0
Transcript of objective measures of sparkling wine style and quality

OBJECTIVE MEASURES OF SPARKLING
WINE STYLE AND QUALITY
FINAL REPORT to AUSTRALIAN GRAPE AND WINE AUTHORITY
Principal Investigator: ASSOC. PROF. KERRY WILKINSON
Project Number: UA 1205
Research Organisation: THE UNIVERSITY OF ADELAIDE
Date: 30th SEPTEMBER 2016

2
Project title: Objective measures of sparkling wine style and quality
Project No: UA1205
Author: Associate Professor Kerry Wilkinson
Date: 30th September 2016
Copyright Statement: This work is copyright. Apart from any use permitted under the
Copyright Act 1968, no part may be reproduced by any process without
written permission from the University of Adelaide.
The University of Adelaide
School of Agriculture, Food and Wine
Private Mailbox 1
Glen Osmond SA 5064
Australia
Telephone: (08) 8313 7360
Facsimile: (08) 8313 7116
Email: [email protected]

3
Table of Contents
Abstract……………………………………………………………………………..................... 4
Executive Summary…………………………………………………………………………….. 5
Background……………………………………………………………………………………… 8
Project Aims and Performance Targets…………………………………………………………. 9
Method…………………………………………………………………………………………... 11
Results and Discussion………………………………………………………………………….. 14
Part A: Analysis of the Australian sparkling wine market 14
Part B: Objective measures of the style and quality of Australian sparkling white wine. 16
Classification of sparkling wine style and quality by MIR spectroscopy. 16
Influence of production method on the sensory profiles and consumer
acceptance of different styles of Australian sparkling white wine. 27
Influence of production method on the chemical composition, foaming properties
and quality of Australian sparkling white wine. 40
Part C: Objective measures of the style and quality of Australian Moscato wines 51
Sensory profiles and consumer acceptance of different styles of Australian Moscato. 51
Part D: Objective measures of sparkling wine style and quality 65
Outcomes and Conclusion………………………………………………………………………. 68
Recommendations………………………………………………………………………………. 70
Appendix 1: Communication…………………………………………………………………… 71
Appendix 2: Intellectual Property………………………………………………………………. 73
Appendix 3: References………………………………………………………………………… 74
Appendix 4: Staff……………………………………………………………………………….. 87
Appendix 5: Budget Reconciliation…………………………………………………………….. 88

4
Abstract:
Sparkling wine represents a small but significant proportion of the Australian wine industry’s total
production and a market niche for which there is growing consumer interest. This project employed a
range of chemical and sensory analyses to profile the variation in composition, sensory properties and
quality amongst (i) Australian sparkling white wines and (ii) Australian Moscatos. Consumer
preferences for different styles of sparkling white wine and Moscato were also studied. Research
outcomes enable industry to better understand the domestic sparkling wine market and provide insight
which might inform production and/or marketing strategies, so as to influence consumer purchasing
decisions and consumption behaviour.

5
Executive Summary:
Sparkling wine represents a small but significant proportion (~10%, 37 ML) of the Australian wine
industry’s total production, yet surprisingly, little research has been undertaken to determine
Australian consumers’ preferences for the array of sparkling wine styles produced or to investigate the
appeal of different sparkling wine styles to new or emerging markets (e.g. the Millennials or
Generation Y). In 2012, Australian sparkling white wines accounted for the majority (54%) of total
sparkling wine sales in Australia (by value), but Champagne maintains a sizeable (19%) share
(Nielsen, 2012). The Australian wine industry seeks to capture a greater proportion of existing and
emerging sparkling wine markets, for financial gain. To achieve this, winemakers and wine marketers
need to better understand the relative importance of different styles of Australian sparkling wine, i.e.
white and pink Moscato, and sparkling white, rosé and red wines, and the target markets for each of
these wine segments. Sparkling wine producers might also benefit from identification of markers by
which wine style and quality can be determined, so that wine styles (and their marketing strategies) can
be better tailored to specific segments of the domestic market.
The key objectives of this project were therefore to characterise the relative importance of different
segments of the Australian sparkling wine sector, to gain insight into consumer preferences for
different styles of sparkling wine and their sensory properties, and to develop objective measures by
which sparkling wine style and quality can be determined.
To achieve these objectives, market sales data was obtained to determine the relative importance of
different sparkling wine styles. This enabled trends in sparkling wine sales to be established, including:
a significant increase in the share of sales (by value) for Champagne (from 8% to 19%) between 2005
and 2012; decreased sales (by value) for sparkling white wine (from 64% to 54%), sparkling rosé
(from 9% to 7%) and sparkling red wine (from 4% to 3%) between 2005 and 2012; and the rise in
popularity of Moscato, which in 2012 held 8% of overall sales value.
Based on this data, together with input from an industry reference group (comprising several
prominent Australian sparkling winemakers), a range of chemical and sensory analyses were
undertaken to profile the variation in composition, sensory properties and quality of: (i) 50 Australian
sparkling white wines – representative of not only the four key methods of sparkling wine production,
i.e. Méthode Traditionelle, transfer, Charmat and carbonation – but also a range of price points,
Australian wine regions and brands; and (ii) 24 Australian Moscato wines – also representative of a
range of price points, Australian wine regions and brands.

6
Compositional analyses included basic wine parameters such as pH, titratable acidity (TA), residual
sugar, alcohol and total phenolics, aroma profiling by gas chromatography-mass spectrometry (GC-
MS), and acid, sugar and phenolic profiling by high performance liquid chromatography (HPLC) and
fluorescence. In the case of sparkling white wines, protein, polysaccharide, amino acid and fatty
acid/ethyl ester determinations were also performed; as well as measurement of foaming properties,
such as foam volume (Vf) and foam lifetime (Lf). Sensory analyses included determinations of wine
quality by expert panels and sensory profiles by descriptive analysis (DA) with trained panels.
Statistical analysis of sensory data enabled identification of wine subsets (n=6 for both sparkling white
wines and Moscatos) for consumer acceptance testing; with wines selected to be representative of the
sensory diversity observed amongst each sparkling wine segment. Consumer acceptance tests enabled
the sensory appeal of different styles of Australian sparkling white wine and Moscato to be
determined. However, in recognition of the inherent diversity amongst wine consumers, segmentation
based on consumers’ individual liking scores was also performed, in order to identify consumer
clusters with distinct preferences for different wine styles.
The suitability of attenuated total reflection (ATR) mid-infrared (MIR) spectroscopy, combined with
multivariate data analysis – principal component analysis (PCA) and partial least squares regression
(PLSR) – was also evaluated as a rapid analytical technique for the classification of sparkling wine
style and quality. The MIR spectra of a range of Australian sparkling wines, i.e. sparkling white
(n=50), rosé (n=25), red (n=25), Prosecco (n=14) and Moscato (n=25) wines were recorded.
Qualitative compositional differences between wines were observed by MIR spectroscopy, and
following PCA, enabled discrimination of wines according to both sparkling wine style, and in the case
of sparkling white wines, production method.
This is the first study to profile the compositional, sensory and quality variation amongst Australian
sparkling white wines and Moscatos, and importantly, consumer acceptance of different styles of each
sparkling wine segment. Research findings enable industry to better understand the preferences of
different segments of the sparkling wine consumer market and might therefore be used to inform wine
production and/or marketing decisions, i.e. to tailor/target different styles of sparkling wine to specific
consumer segments.
Two complementary projects were established alongside the research outlined above: (i) an Honours
project at the University of South Australia (undertaken by Melissa Lane in 2013) titled Understanding
consumer preferences for Australian sparkling vs. French Champagne; and (ii) a PhD project at the

7
University of Adelaide (undertaken by Naomi Verdonk and due for completion in early 2018) titled
Understanding Australian wine consumers’ preferences for sparkling wine.
The research team gratefully acknowledges the Australian wine producers who generously donated
sparkling wines to the project, and the sparkling winemakers and wine show judges, University of
Adelaide staff and students, and wine consumers who participated in quality ratings, descriptive
analysis and consumer acceptance trials, respectively. Additionally, the direction, feedback and input
provided by the project’s industry reference group, comprising Ed Carr (Accolade Wines), Teresa
Heuzenroeder (Yalumba), Dan Buckle (Domaine Chandon) and Trina Smith (Treasury Wine Estates),
is greatly appreciated. The involvement of collaborators from The Australian Wine Research Institute
(Dr Paul Smith and Dr Jacqui McRae), CSIRO (Dr Paul Boss and Emily Nicholson) and The
University of Melbourne (Dr Kate Howell and Bruna Condé) is also gratefully acknowledged.
8
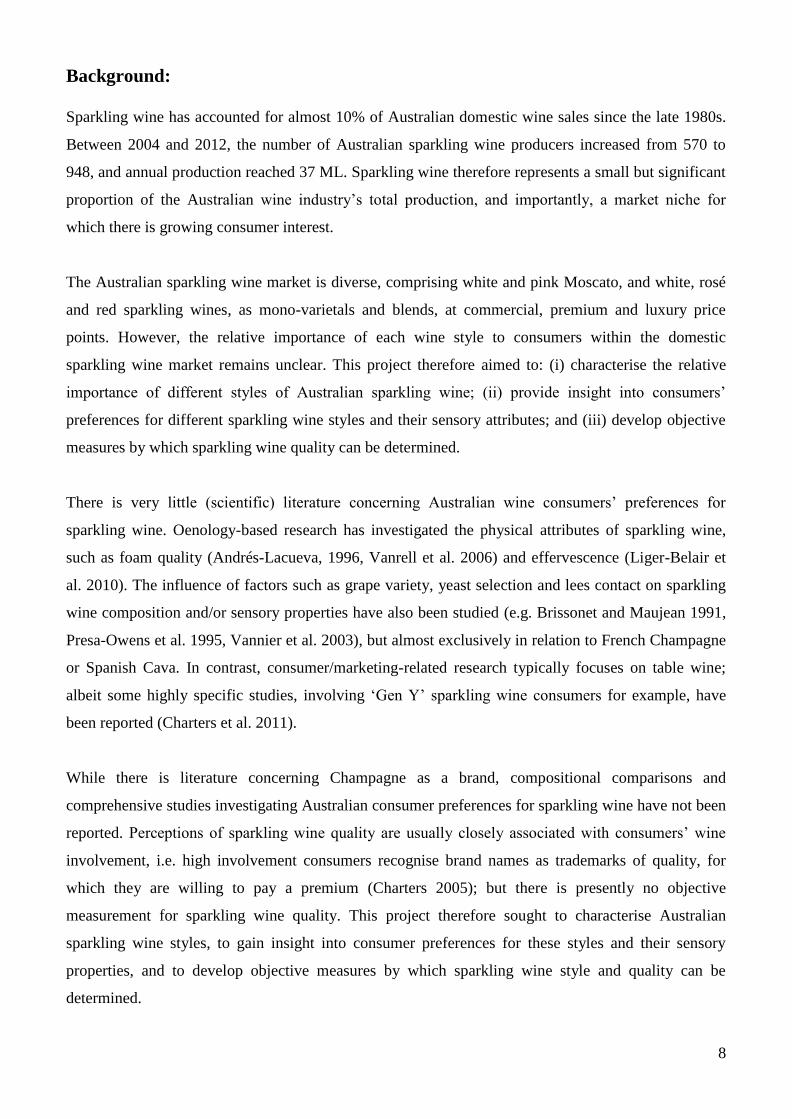
Background:
Sparkling wine has accounted for almost 10% of Australian domestic wine sales since the late 1980s.
Between 2004 and 2012, the number of Australian sparkling wine producers increased from 570 to
948, and annual production reached 37 ML. Sparkling wine therefore represents a small but significant
proportion of the Australian wine industry’s total production, and importantly, a market niche for
which there is growing consumer interest.
The Australian sparkling wine market is diverse, comprising white and pink Moscato, and white, rosé
and red sparkling wines, as mono-varietals and blends, at commercial, premium and luxury price
points. However, the relative importance of each wine style to consumers within the domestic
sparkling wine market remains unclear. This project therefore aimed to: (i) characterise the relative
importance of different styles of Australian sparkling wine; (ii) provide insight into consumers’
preferences for different sparkling wine styles and their sensory attributes; and (iii) develop objective
measures by which sparkling wine quality can be determined.
There is very little (scientific) literature concerning Australian wine consumers’ preferences for
sparkling wine. Oenology-based research has investigated the physical attributes of sparkling wine,
such as foam quality (Andrés-Lacueva, 1996, Vanrell et al. 2006) and effervescence (Liger-Belair et
al. 2010). The influence of factors such as grape variety, yeast selection and lees contact on sparkling
wine composition and/or sensory properties have also been studied (e.g. Brissonet and Maujean 1991,
Presa-Owens et al. 1995, Vannier et al. 2003), but almost exclusively in relation to French Champagne
or Spanish Cava. In contrast, consumer/marketing-related research typically focuses on table wine;
albeit some highly specific studies, involving ‘Gen Y’ sparkling wine consumers for example, have
been reported (Charters et al. 2011).
While there is literature concerning Champagne as a brand, compositional comparisons and
comprehensive studies investigating Australian consumer preferences for sparkling wine have not been
reported. Perceptions of sparkling wine quality are usually closely associated with consumers’ wine
involvement, i.e. high involvement consumers recognise brand names as trademarks of quality, for
which they are willing to pay a premium (Charters 2005); but there is presently no objective
measurement for sparkling wine quality. This project therefore sought to characterise Australian
sparkling wine styles, to gain insight into consumer preferences for these styles and their sensory
properties, and to develop objective measures by which sparkling wine style and quality can be
determined.

9
Project Aims and Performance Targets:
The project originally aimed to:
characterise the relative importance of different sparkling wine styles (Year 1)
employ a range of chemical and sensory analyses to profile the variation in composition, sensory
properties and quality of Moscato and sparkling white wines, including mapping trials to
determine consumer preferences for different Moscato and sparkling white wine styles (Years
1&2)
employ a range of chemical and sensory analyses to profile the variation in composition, sensory
properties and quality of Moscato and sparkling white wines, including mapping trials to
determine consumer preferences for different sparkling rosé and red wine styles (Years 2&3)
The research activities and outputs proposed in the original application are tabulated below:
Year 1 Activities Year 1 Outputs
Market sales data (obtained from AC Neilsen and via in-store observational studies) will be analysed to identify the relative importance of different sparkling wine styles (i.e. Moscato and sparkling white, rosé and red wines) to inform selection of wines representative of each market segment, for chemical and sensory analysis.
A shortlist of sparkling wines (8 to 12 per style, depending on the relative importance of each market segment) to be subjected to chemical and sensory analyses. Preparation of a factsheet or descriptive note describing the current Australian sparkling wine market and the relative importance of individual sparkling wine styles.
Descriptive sensory analysis of Moscato and sparkling white wines to characterise the sensory attributes (i.e. appearance, aroma, flavour, taste and mouthfeel) that define different styles of sparkling white wine; d-optimal selection will be used to inform selection of wines for consumer preference mapping.
A shortlist of Moscato and sparkling white wines (approximately 8) representative of the entire flavour map to be used for consumer preference mapping experiments.
Year 2 Activities Year 2 Outputs
Compositional analyses of Moscato and sparkling white wines using traditional wine chemistry (i.e. pH, TA, alcohol and colour measurements), GC-MS-O (for aroma profiling), IR spectroscopy, and HPLC/UPC and fluorescence (for acid, sugar and phenolic profiling). Consumer preference mapping of subset of Moscato and sparkling white wines (using 150 consumers to determine preference and for segmentation analysis). Statistical analysis (e.g. Principal Component Analysis and Linear Discriminant Analysis) of chemical, sensory and consumer data to identify style and/or quality markers for sparkling white wines.
Preparation of materials for publication/dissemination describing the application of chemical and sensory analyses (including consumer preference mapping) to identify key markers of preference and quality for Australian Moscato and sparkling white wine.
Sparkling white wines representative of different grape varieties, vintages, wine regions, production methods and price points will be chemically analysed (as above) to determine which factors most strongly influence wine composition and to validate the style and quality markers identified above. The quality of commercial sparkling wines will be determined by an expert panel and correlated with compositional data using chemometric analysis.
Preparation of materials for publication/dissemination describing the compositional differences of sparkling white wines representative of different grape varieties, vintages, regions (climates), production methods and price points and evaluating the classification of sparkling wine style and quality using the objective measures identified above.

10
Descriptive sensory analysis of sparkling rosé and red wines to characterise the sensory attributes (i.e. appearance, aroma, flavour, taste and mouthfeel) that define different styles of sparkling red wine; d-optimal selection will be used to inform selection of wines for consumer preference mapping.
A shortlist of sparkling rosé and red wines (approximately 8) representative of the entire flavour map to be used for consumer preference mapping experiments.
Year 3 Activities Year 3 Outputs
Compositional analyses of sparkling rosé and red wines using traditional wine chemistry (i.e. pH, TA, alcohol and colour measurements), GC-MS-O (for aroma profiling), IR spectroscopy, and HPLC/UPC and fluorescence (for acid, sugar and phenolic profiling). Consumer preference mapping of a subset of sparkling rosé and red wines (using 150 consumers to determine preference and for segmentation analysis). Statistical analysis (e.g. Principal Component Analysis and Linear Discriminant Analysis) of chemical, sensory and consumer data to identify style and/or quality markers for sparkling rosé and red wines.
Preparation of materials for publication/dissemination describing the application of chemical and sensory analyses (including consumer preference mapping) to identify key markers of preference and quality for Australian sparkling rosé and red wines.
Sparkling rosé and red wines representative of different grape varieties, vintages, wine regions, production methods and price points will be sourced and chemically analysed (as above) to determine which factors most influence wine composition and to validate the style and quality markers identified above. The quality of commercial sparkling wines will be determined by an expert panel and correlated with compositional data using chemometric analysis.
Preparation of materials for publication/dissemination describing the compositional differences of sparkling rosé and red wines representative of different grape varieties, vintages, regions (climates), production methods and price points and evaluating the classification of sparkling wine style and quality using the objective measures identified above.
However, following analysis of market sales data sourced from AC Nielsen and in consultation with an
industry reference group (comprising prominent Australian sparkling winemakers), the decision was
made to focus on sparkling white wine and then Moscato, as the two most commercially significant
segments of the sparkling wine market. As such, the project aims were to:
characterise the relative importance of different sparkling wine styles (Year 1)
employ a range of chemical and sensory analyses to profile the variation in composition,
sensory properties and quality of sparkling white wines, including mapping trials to determine
consumer preferences for different sparkling white wine styles (Years 1&2)
employ a range of chemical and sensory analyses to profile the variation in composition,
sensory properties and quality of Moscato wines, including mapping trials to determine
consumer preferences for different styles of Moscato (Years 2&3)

11
Method:
Part A: Analysis of the Australian sparkling wine market.
Market sales data, comprising sparkling wine sales (by volume and value) for 2005 and 2012, were
sourced from AC Neilsen. This enabled comparisons to be made regarding the relative importance of
different segments of the sparkling wine market. Results were also compared with findings from an
online survey which investigated the sparkling wine consumption behavior of 1,030 regular sparkling
wine consumers (undertaken by Naomi Verdonk as part of her PhD research).
Part B: Objective measures of the style and quality of Australian sparkling white wine.
Sparkling white wines: A range of commercial sparkling white wines (n=50), comprising Méthode
Traditionelle wines (n=20, priced $25 to $90), transfer wines (n=10, priced $10 to $31), Charmat
wines (n=10, priced $8 to $23) and carbonated wines (n=10, priced $5 to $24) were sourced (either
commercially or from industry), with input from an industry reference group comprising prominent
Australian sparkling winemakers: Ed Carr, Accolade Wines; Teresa Heuzenroeder, Yalumba; Dan
Buckle, Domaine Chandon; and Trina Smith, Treasury Wine Estates. The wines chosen were intended
to reflect not only the four key methods of sparkling wine production, but also a range of price points,
Australian wine regions and brands. With the exception of five carbonated wines, wines were made
from the traditional varieties, i.e. Chardonnay, Pinot Noir and Pinot Meunier, or blends thereof. Wines
were then subjected to various chemical and sensory analyses, to profile wine composition, sensory
properties and quality.
Chemical analysis of sparkling white wines: Samples were degassed (using an ultrasonic bath) and
basic chemical measurements, i.e. pH, titratable acidity (TA), residual sugar, alcohol and total
phenolics, performed according to published methodology (Iland et al. 2004). pH and TA (as tartaric
acid equivalents to an endpoint of pH 8.2) using a Crison CE95 Compact Titrator equipped with a
Crison Sampler 15 autosampler (Crison Instruments, SA, Alella, Spain). Glucose and fructose (i.e.
residual sugar) were measured enzymatically (Boehringer-Mannheim/R-BioPharm, Darmstadt,
Germany) using a liquid handling robot (Corbett 3800) and spectrophotometric plate reader (Tecan
M200 Infinite). Alcohol content (as % alcohol by volume) was measured with an alcolyzer (Anton
Paar GmbH, Graz, Austria). Total phenolics was measured as the absorbance of wine at 280 nm, using
either a GBC Cintra 40 or GBC Cintra 4040 UV-Visible spectrophotometer (GBC Scientific
Equipment, Melbourne, Australia).
Protein and polysaccharide analyses were performed in collaboration with the Australian Wine
Research Institute (AWRI). The composition and concentration of haze-forming proteins were

12
determined by high performance liquid chromatography (HPLC) according to a modified version of
methodology described by Van Sluyter and colleagues (2009), using an Agielent 1260 UHPLC
(Agilent Technologies, Santa Clara, USA). Polysaccharides (mannoproteins, arabinogalactans, and
rhamnogalacturonans) were also measured by HPLC, using previously published methods (Bindon et
al. 2013). Amino acid analyses were performed in collaboration with CSIRO. Amino acids were
determined as fluorescent 6-aminoquinolyl-N-hydroxysuccinimidyl carbamate (AQC) derivatives,
using AccQ-Fluor reagent kits (Waters, Tokyo, Japan) and HPLC. Foaming properties were measured
in collaboration with the University of Melbourne. Foamability and foam stability were calculated
from measurements of foam volume (Vf) and foam lifetime (Lf) performed using a robotic pourer and
image analysis, according to methods described by Condé and colleagues (Condé et al. 2017). The
volatile profiles of sparkling wines were determined by gas chromatography-mass spectrometry (GC-
MS) using a 7890A gas chromatograph coupled to a 5975C inert XL mass selective detector (Agilent
Technologies). Where appropriate, chemical data were analysed by one-way analysis of variance
(ANOVA) using GenStat (15th Edition, VSN International Limited, Herts, UK). Mean comparisons
were performed by least significant difference (LSD) multiple comparison test at P< 0.05.
Degassed sparkling white wine samples were also analysed by attenuated total reflection (ATR) mid-
infrared (MIR) spectroscopy, using a Bruker Alpha instrument (Bruker Optics, GmbH, Ettingen,
Germany), together with a selection of commercial sparkling rosé (n=25), sparkling red (n=25),
Prosecco (n=14) and Moscato (n=25) wines, which were also sourced either from retail outlets or from
industry. Spectral data were subjected to principal component analysis (PCA) and partial least squares
(PLS) regression.
Sensory analysis of sparkling white wines: The quality of sparkling white wines was determined by
an expert panel of 19 sparkling winemakers or wine show judges, using the 20 point scoring system
employed in Australian wine show judging (Gawel and Godden, 2008); while the sensory profiles of
sparkling wines were determined by descriptive analysis (DA, Lawless and Heymann, 2010), using a
trained panel comprising 10 research staff and students. Sensory data was subjected to statistical
analysis, i.e. an I-optimal computer-aided design of experiments algorithm, to identify a subset of
sparkling white wines that best reflected the sensory diversity of all sparkling wines, for consumer
testing. Initially seven wines were selected: two Méthode Traditionelle wines, three transfer wines, one
Charmat wine and one carbonated wine. However, one of the transfer wines was excluded (based on
limited production volume) in order to limit the acceptance testing to 6 wines so as to mitigate any risk
of consumers losing interest and/or experiencing sensory fatigue (Lawless and Heymann, 1998,
Hersleth et al. 2003, Lattey et al. 2007). One hundred and fifty consumers (of legal drinking age) were

13
recruited to participate in acceptance tests; with a higher proportion of females participating than males
(60% vs 40%), which likely reflects the perception that sparkling wine is a female drink (Charters et al
2011). Consumers were first asked to complete a questionnaire designed to capture demographic
information, as well as consumers’ alcohol consumption, (including sparkling wine consumption) and
wine involvement (Bruwer and Huang, 2012). The subset of sparkling white wines were then
presented to consumers in random order and consumers were asked to rate their liking of each using 9
cm line scales (anchored from dislike extremely to like extremely). Consumer acceptance data were
analysed using a combination of descriptive and multivariate techniques, including ANOVA (with
post-hoc Tukey's test), PLSR and PCA. Segmentation (cluster analysis) was also performed on
hedonic liking scores, to identify consumer clusters with distinct preferences for different styles of
sparkling white wine.
Part C: Objective measures of the style and quality of Australian Moscato.
Moscato wines: A range of commercial Moscatos (n=24), comprising both sparkling (n=16) and semi-
sparkling (n=8), and white (n=8) and pink (n=14) styles, were sourced (either commercially or from
industry), with input from the industry reference group (as above) The wines chosen were intended to
reflect a range of price points ($8 to $30), Australian wine regions and brands. Wines were then
subjected to various chemical and sensory analyses, to profile wine composition, sensory properties
and quality.
Chemical analysis of Moscato wines: Samples were degassed and basic chemical measurements
performed, as for sparkling white wines. The volatile profiles of Moscatos were again determined by
GC-MS.
Sensory analysis of Moscato wines: Moscato quality was again determined by an expert panel, this
time comprising 9 sparkling winemakers. The sensory profiles of each Moscato were also determined
by DA, using a trained panel comprising 10 research staff and students, and sensory data analysed by
PCA. Sensory data was then subjected to I-optimal prime analysis, to identify the subset of Moscato
wines that best reflected the sensory diversity of all Moscato wines, for consumer acceptance tests.
One hundred and forty consumers (of legal drinking age) were recruited to participate in acceptance
tests. Again, a considerably higher proportion of females participated than males (68% vs 32%).

14
Results and Discussion:
Part A: Analysis of the Australian sparkling wine market.
The Australian domestic sparkling wine market is quite diverse and comprises Moscato and white, rosé
and red sparkling wine styles, as mono-varietals and blends, at various price points; as well as
imported sparkling wines, including Champagne from France. Recent growth in domestic sparkling
wine sales has largely been driven by Champagne and Moscato (Table 1). Indeed, Australia remains a
significant importer of Champagne; with sales increasing from 8% in 2005 (worth AU$34 million) to
19% in 2012 (worth AU$102 million) (AC Nielsen Australia). Although Australian winemakers now
produce sparkling wines which rival those from Champagne houses in France, the tradition, heritage
and prestige associated with the Champagne brand infer superior product quality and reliability, and
therefore represent less purchase risk to consumers (Charters 2009). This likely explains the continued
growth in Champagne sales, which resulted in the decline observed in sparkling white, red and rosé
wine sales between 2005 and 2015.
Table 1. Distribution of sparkling wine sales in Australia for different wine styles based on percentage
of overall sales values of AU$444 million in 2005 and AU$545 million in 2012 (AC Nielsen
Australia).
Wine style
Percentage share of sales
(by value)
2005 2012
Champagne 8 19
Sparkling white wine 64 54
Sparkling rosé wine 9 7
Sparkling red wine 4 3
Moscato 0 8
Other 15 9
These results are similar to findings from a recent consumer survey, which investigated regular
sparkling wine consumers’ preferences for different sparkling wine styles. Sparkling white wine
accounted for the lion share (i.e. 42%) of the 1030 participants’ total sparkling wine consumption,
followed by Moscato (18%) and then Champagne (14%). Sparkling red (12%), rosé (9%) and Prosecco
(5%) were consumed less frequently.

15
The following paper was published in the Wine and Viticulture Journal in 2015 and presents the
sparkling wine sales data (by value) for 2005 and 2012, demonstrating the relative importance of
different segments of the sparkling wine market. The paper also presents preliminary results from: (i)
the online survey (undertaken by Naomi Verdonk as part of her PhD research) which investigated the
sparkling wine consumption and preferences of 1,030 regular Australian wine consumers; (ii) a
consumer trial (undertaken by Melissa Lane as part of her Honours research) which investigated
factors influencing consumer preferences for Australian sparkling wine vs. French Champagne; and
(iii) an observational study which investigated sparkling wine consumers’ purchasing behavior.
Verdonk, N.R., Culbert, J.A. and Wilkinson, K.L. (2015) All that sparkles: Consumer perceptions of
sparkling wine. Wine and Viticulture Journal 30, 71–73.

16
Part B: Objective measures of the style and quality of Australian sparkling white wine.
Classification of sparkling wine style and quality by MIR spectroscopy.
Classification of Sparkling Wine Style by MIR Spectroscopy
The ATR-MIR spectra of commercial sparkling wines showed moderate to strong absorbance peaks at
1045, 1085, 1640 and 3300 cm-1 (Figure 1); with peaks at 3300 and 1640 cm-1 corresponding to the
O–H stretching and bending respectively, associated with water (Hashimoto and Kameoka, 2000, Patz
et al. 2004). The MIR region between 1100 and 1000 cm-1 has previously been attributed to C–O
vibrations of sugars, such as glucose and fructose, and alcohols, phenols, esters and lactones (Williams
and Fleming, 1995). In particular, absorbance in the region of 1080 to 1045 cm-1 has been associated
with C–OH bonds present in primary alcohols (e.g. ethanol), glycerol and sugars (glucose and
fructose) (Cozzolino et al. 2009, 2011a, 2011b, Riovanto et al. 2011); i.e. compounds which are likely
to be constituents of sparkling wine.
Figure 1. Mean, maximum and minimum ATR-MIR spectra (4000–400 cm-1) obtained from
(degassed) sparkling wine samples (n = 139). Reproduced from Culbert et al. 2015.
A comparison of the minimum and maximum ATR-MIR spectra (Figure 1) obtained from the
(degassed) sparkling wine samples indicated most of the variation observed amongst the samples
occurred within the ‘fingerprint’ region; i.e. between 1500 and 900 cm-1. For grape and wine samples,
this region is known to contain absorbance bands attributable to water, sugars and phenolic compounds
(Shah et al. 2010), and results from stretching and/or bending of CH–OH, C–C, C–O and C–H bonds.

17
Multivariate analysis was therefore performed on the MIR ‘fingerprint’, given this region accounted
for the most variation.
The PCA score plot of the first two principal components (PC) derived from the ATR-MIR
‘fingerprint’ spectra of all sparkling wine samples is shown in Figure 2. The first principal component
(PC) explains 89% of the variation observed and resulted in clear separation of Moscato wines (lower
left quadrant) from the other sparkling wine styles. Separation of sparkling red (lower right quadrant)
and sparkling white, rosé and Prosecco wines (upper quadrants) was also observed. Several outliers
were observed, i.e. individual wines that did not cluster with other wines of the same style, namely:
three sparkling rosé wines and a sparkling red wine, that instead clustered amongst the Moscato wines;
and two sparkling rosé wines that instead clustered together with the remaining sparkling red wines. A
plausible explanation for these outliers is suggested below.
-0.00017
-0.00014
-0.00011
-0.00008
-0.00005
-0.00002
0.00001
0.00004
0.00007
0.00010
0.00013
-0.0006 -0.0005 -0.0004 -0.0003 -0.0002 -0.0001 0 0.0001 0.0002 0.0003 0.0004
PC
-2 (
9%)
PC-1 (89%)
Moscato
Rosé
Prosecco
Red
White
Figure 2. Score plot of the first two PC’s derived from the MIR ‘fingerprint’ (1500–900 cm-1) of
white, rosé, red, Prosecco and Moscato wines (n = 50, 25, 25, 14 and 25, respectively). Reproduced
from Culbert et al. 2015.
The clustering pattern of sparkling wines likely reflects compositional differences that can be
attributed to both varietal expression and wine style. In terms of grape variety: sparkling red wines
largely comprised Shiraz (or blends thereof); sparkling white wines comprised the classic varieties, i.e.
Chardonnay, Pinot Noir and/or Pinot Meunier; sparkling rosé wines were predominantly Pinot Noir (or

18
blends thereof); and Moscato comprised Muscat varieties. Analysis of several basic wine chemistry
parameters, i.e. pH, titratable acidity (TA), residual sugar (RS), alcohol content and total phenolics
(Table 2), demonstrated several large compositional differences between the various sparkling wine
styles; primarily related to residual sugar, alcohol and phenolic content. As expected, Moscato wines
had the highest residual sugar levels (91 g/L on average, compared with 10 to 30 g/L for the other
sparkling wines) and the lowest alcohol levels (i.e. 7%, compared with 11 to 13%). Sparkling red
wines typically had higher alcohol levels, and the highest total phenolics (due to the presence of grape
skins during primary fermentation). To determine to what extent these constituents influenced wine
clustering in the PCA score plot, the loadings for the first three PCs derived from the fingerprint region
of sparkling wine MIR spectra were evaluated (Figure 3).
Table 2. Composition of the different styles of sparkling wine studied.
Sparkling Wine Style pH TA
(g/L)
RS
(g/L)
Alcohol
(% abv)
Total Phenolics
(au)
White (n=50) range
mean
3.0 -3.5
3.2
5.8 – 9.6
7.5
0.5 – 20.1
11.2
10.3 – 13.1
11.9
0.3 – 5.8
2.9
Rosé (n=25) range
mean
3.1 – 3.5
3.3
5.3 – 8.4
6.8
5.1 – 86.7
22.9
7.9 – 13.7
11.6
2.2 – 6.2
4.0
Red (n=25) range
mean
3.4 – 3.9
3.5
5.1 – 7.5
6.3
7.2 – 117.6
32.7
8.4 – 15.0
13.4
37.1 – 67.0
49.9
Prosecco (n=14) range
mean
2.9 – 3.5
3.2
5.6 – 7.8
6.4
0.4 – 22.4
10.6
9.2 – 12.2
11.0
0.0 – 3.3
0.9
Moscato (n=25) range
mean
3.0 – 3.5
3.2
4.9 – 9.0
6.7
57.9 – 143.1
90.5
5.1 – 9.9
7.4
0.8 – 15.5
4.6
The highest loadings for PC-1 were observed at 1069, 1040 and 1020 cm-1. As indicated above,
absorbance in the region of 1080 to 1045 cm-1 is usually associated with the C–C and C–OH bonds of
primary alcohols (e.g. ethanol), glycerol and sugars (Bevin et al. 2005, Cozzolino et al. 2009, 2011a,
2011b, Riovanto et al. 2011, Fudge et al. 2012). This suggests the variation observed between samples
in the first principal component is largely explained by differences in residual sugar and alcohol
content. For PC-2, which explained 9% of variation, the highest loadings were also in this region (i.e.
at 1073 to 1008 cm-1). Less significant, but larger loadings were also observed for PC-2 within the
1500 to 1400 cm-1 region, which may be indicative of aromatic C–C stretching (Fudge et al. 2012)
and/or absorbance by CO=O, C=C, C–H2 and C–H3 bonds from organic acids and aldehydes
(Cozzolino et al. 2009, 2011a, Riovanto et al. 2011). PC-2 loadings were also observed at 1130 and

19
1150 cm-1, with the latter possibly being characteristic of pyranose sugars (Hashimoto and Kameoka,
2000). Therefore, in addition to sugar and alcohol, phenolics and organic acids may also have
contributed to the clustering patterns of the different sparkling wines.
Consideration of the basic chemical parameters of individual sparkling wines also helped to explain
the clustering of wines identified (above) as outliers. The three sparkling rosé wines and the sparkling
red wine that clustered amongst the Moscato wines were found to contain high residual sugar levels;
between 63 and 87 g/L, and 118 g/L, for the sparkling rosé and sparkling red wines, respectively. Of
the two remaining sparkling rosé wines that were clustered amongst the sparkling red wines, one also
had high residual sugar (i.e. 60 g/L), and both had unusually high alcohol levels (i.e. 13.4 and 13.7%).
The residual sugar and/or alcohol content of these sparkling wines may therefore have more strongly
influenced their clustering, than varietal expression. Collectively, these observations highlight the
influence of sugar and alcohol on the positioning of individual sparkling wines on the PCA score plot.
-0.25
-0.20
-0.15
-0.10
-0.05
0.00
0.05
0.10
0.15
0.20
0.25
1,500 1,429 1,358 1,287 1,216 1,146 1,075 1,004 933
Load
ings
Wavenumber (cm-1)
PC-1
PC-2
PC-3
Figure 3. Loadings for the first three principal components for the fingerprint region derived from the
MIR spectra of the sparkling wines. Reproduced from Culbert et al. 2015.
Classification of Sparkling White Wine Style and Quality by MIR Spectroscopy
In 2012, the sparkling white wine segment held the lion share of Australian sparkling wine sales, both
by value (54%) and by volume (61%) (Neilsen Australia, 2012). Sparkling white wines can also
exhibit diverse sensory properties, depending on their method of production, which in turn influences
quality and price. As such, the potential for ATR-MIR combined with PCA to classify sparkling white

20
wines according to production method and/or quality was evaluated. Score plots displaying the first
two PCs derived from the ‘fingerprint’ region of MIR spectra from 50 sparkling white wine samples
(analysed in duplicate, from two wine replicates) labelled according to production method and quality
scores are shown as Figures 4a and 4b, respectively.
Differences were observed in the PCA score plot of sparkling white wines by method of production
(Figure 4a). Carbonated and Charmat sparkling wines mostly clustered in the quadrants on the right;
while Transfer and Methodé Traditionelle sparkling wines mostly clustered in the quadrants on the left.
However, two carbonated wines and three Charmat wines overlapped with Transfer and Methodé
Traditionelle wines. Furthermore, while wine replicates (i.e. samples of the same wine, taken from
different bottles) clustered closely together, they rarely overlapped, which indicates some bottle to
bottle variation. The influence of production method on the style and sensory properties of sparkling
wines is well established; carbonated and Charmat sparkling wines are typically fruit-driven styles,
whereas Transfer and Methodé Traditionelle sparkling wines tend to exhibit complexity due to yeast
autolysis and lees aging, post-secondary fermentation (Iland and Gago, 1997); albeit sensory analysis
indicated some carbonated and Charmat wines exhibited complexity, while some Transfer and
Methodé Traditionelle wines displayed overt fruit aroma and flavour (data not shown). This may
explain the overlap of some carbonated and Charmat wines, with Transfer and Methodé Traditionelle
wines, and vice-versa.
-0.00005
-0.00002
0.00001
0.00004
-2.00E-04 -1.00E-04 0.00E+00 1.00E-04 2.00E-04
PC-
2 (
4%
)
PC-1 (90%)
CA
CH
MT
TR
B
a)
A
C
D

21
-0.00005
-0.00002
0.00001
0.00004
-2.00E-04 -1.00E-04 0.00E+00 1.00E-04 2.00E-04
PC-
2 (
4%
)
PC-1 (90%)
<15
15-15.4
15.5-15.9
16-16.9
≥17
Figure 4. Score plots of the first two PC’s derived from the ‘fingerprint’ region (1500–900 cm-1) of
MIR spectra from (degassed) sparkling white wines, labelled by (a) production method,
CA=carbonated (n=10), CH=Charmat (n=10), MT=Methodé Traditionelle (n=20) and TR=Transfer
(n=10); and by (b) quality scores. Sparkling wines located within the circled regions designated as A,
B, C and D have sensory profiles displayed in Figure 6. Reproduced from Culbert et al. 2015.
Classification of sparkling wines according to quality ratings was less evident, albeit a trend was
observed (Figure 4b). With the exception of one wine, wines given a quality score of 15.5 or above
(n=14) were located in the left-hand quadrants. However, within these quadrants there were also ten
wines with ratings between 15 and 15.4 and six wines given ratings below 15. The remaining 20 wines
(with quality scores of 15.4 or less), were located in the right-hand quadrants. The difficulty in
classifying sparkling wines based on quality scores may reflect the subjective nature of assessing
quality. Assessments which rely on individual’s perceptions, even assessments by experts, i.e.
winemakers or wine show judges, are inevitably less well calibrated than analytical instruments.
Furthermore, wines themselves can be deceiving. For instance, one of the carbonated sparkling wines
was produced from an aged base wine and it therefore exhibited an unusual level of complexity, which
may have contributed to its high quality score. Conversely, one Methodé Traditionelle wine exhibited
noticeable volatile acidity (VA) and consequently received an especially low quality score. Whilst VA
is ordinarily considered a winemaking fault, in this case, it was an intended to be indicative of a
deliberate house style.
b)

22
Partial least square (PLS) regression models were developed in order to determine any relationship
between sparkling wine sensory attributes and MIR spectral data. The sensory profiles of each
sparkling white wine were determined by descriptive analysis. A trained panel rated the intensity of 27
attributes, including a range of fruit and yeast-derived aromas and/or flavours, as well as sweetness,
acidity and complexity. Nine of these attributes gave coefficients of determination (i.e. R2) ≥ 0.50
(Table 3). The perception of sweetness gave the highest correlation, being R2=0.72; i.e. sweetness
ratings explained 72% of the variation within the PLS regression model. Ratings of confection and
tropical fruit (on the palate) explained more than 60% of variation in the models; while >50% of
variation was explained by intensity ratings for tropical fruit, floral and confectionary aromas and
meaty/savoury, toasty and floral flavours on the palate. Previous studies have suggested correlations
between spectral data and sensory attribute scores might result from co-linearity of compositional
variables such as ethanol or residual sugar, or between wavelengths or other sensory properties
(Cozzolino et al. 2005, 2006). It was interesting to note that the highest correlations were observed for
the sensory attributes rated on the palate, rather than on the nose (i.e. as aroma). Since most wine
volatile compounds are present at low concentrations (i.e. ng/L to mg/L levels), they are less likely to
influence MIR spectra than more abundant wine constituents. Furthermore, when sensory panellists
rate the intensity of aroma attributes, they may be preferentially evaluating the more volatile aroma
compounds, i.e. volatiles that are more abundant in the headspace of a wine glass. However, these
volatiles may not be representative of a sample’s entire composition (Cozzolino et al. 2006).
Table 3. Range, mean, standard deviation (SD) and cross validation statistics for sensory
attributes in sparkling white wine samples analysed by ATR-MIR spectroscopy.
Sensory Attribute Range Mean SD R2 SECV PLS Terms
Sweetness P 2.3 – 8.3 4.81 1.37 0.72 0.73 4
Confection P 1.6 – 7.2 3.57 1.27 0.63 0.77 4
Tropical Fruit P 4.3 – 9.4 6.27 1.30 0.61 0.82 4
Meaty/Savoury P 1.3 – 6.0 2.86 1.05 0.59 0.68 3
Toasty P 2.4 – 8.0 4.83 1.29 0.57 0.86 4
Tropical Fruit A 3.6 – 8.8 5.20 1.48 0.56 1.00 4
Floral P 3.2 – 7.7 4.72 1.07 0.51 0.76 4
Floral A 2.6 – 8.4 4.83 1.54 0.51 1.08 4
Confection A 1.6 – 7.2 3.43 1.27 0.50 0.91 4
A=aroma, P=palate; SECV=standard error of cross validation.
The loadings for optimal PLS1 calibrations for the five most highly correlated sensory attributes (i.e.
sweetness P, confectionary P, tropical fruit P, meaty/savoury P and toasty P) are shown in Figure 5.

23
The PLS loadings for sweetness, confectionary and tropical fruit followed similar patterns, with the
highest positive loadings at 1025 and 1100 cm-1; i.e. regions that had a large influence on the
calibration models that were developed. As indicated above, these regions correspond to vibrational
frequencies associated with the C–C and C–OH bonds of primary alcohols, glycerol and sugars (Bevin
et al. 2006, Cozzolino et al. 2009, 2011a, 2011b, Riovanto et al. 2011, Fudge et al. 2012). Since the
perception of sweetness is strongly influenced by both sugar and alcohol content, it is not surprisingly
that regions corresponding to these compounds showed the greatest influence in the model. While the
loadings for these three sensory attributes followed a similar pattern, there were differences in the size
of loadings for some regions. For instance, the model for tropical fruit had less influence at 1025 cm-1
but more influence at 1100 cm-1, compared to the other two attributes. Furthermore, sweetness had
higher positive loadings at 912 and 934 cm-1; regions associated with alkene and aromatic C–H
vibrational frequencies (Williams and Fleming, 1995). There was also some variation in the region
between 1420 and 1380 cm-1, which may be associated with stretching of C–H bonds from
polysaccharides. Interestingly, the loadings for the toasty attribute had an inverse relationship to
sweetness, confectionary and tropical fruit. Therefore, the wine constituents that contributed positively
to the models for sweetness, confectionary and tropical fruit had a negative influence on the model for
toasty. This suggests that the toasty model is driven by different wine constituents, particularly those
corresponding to bonds with vibrational frequencies at 1060 and 1136 cm-1. Furthermore, the toasty
attribute had positive loadings in the region of 1500–1400 cm-1, which could be related to volatile
phenols, such as guaiacol and 4-methylguaiacol, which can impart smoky characters to wine (Fudge et
al. 2012). However, this region has less influence in the model, as the loadings were relatively small.
The meaty/savoury and toasty attributes are indicative of yeast autolysis or lees aging, whereas the
‘fresher’ characters of sweetness, confectionary and tropical fruit are likely to be grape or fermentation
derived. It is therefore not surprising that the fresh characters appear to be driven by similar wine
constituents.
To further investigate the relationship between sparkling wine sensory attributes and MIR spectra,
comparisons were made between the sensory profiles of selected sparkling wines that were clustered
closely together; i.e. those circled in regions designated as A, B, C and D in Figure 4a. The sensory
profiles of Methodé Traditionelle (n=6), Transfer (n=3), Charmat (n=2) and carbonated (n=3)
sparkling wines are shown in Figures 6a–d, respectively. For simplification, only sensory attributes
which gave good correlations in the PLS regression models were included. Furthermore, the
carbonated sparkling wine located within circled region B was excluded. In general, wines that
clustered together in the PCA score plot (Figure 4a) were found to exhibit similar sensory profiles.

24
-0.30
-0.25
-0.20
-0.15
-0.10
-0.05
0.00
0.05
0.10
0.15
0.20
0.25
1,500 1,429 1,358 1,287 1,216 1,146 1,075 1,004 933
Load
ings
Wavenumber (cm-1)
Sweetness P
Confection P
Tropical P
Meaty/Savoury P
Toasty P
Figure 5. PLSR coefficients derived from analysis of the MIR fingerprint spectra (1500-900 cm-1)
against the top five correlated sensory attributes (sweetness P, confection P, tropical P, meaty/savoury
P and toasty P) for the sparkling white wines (P denotes palate). Reproduced from Culbert et al. 2015.
This was particularly evident for Methodé Traditionelle, Transfer and Charmat sparkling wines, but
less so for carbonated sparkling wines, which exhibited the most style variation. The Methodé
Traditionelle and Transfer wines exhibited considerable complexity, characterised by meaty/savoury
and toasty characters, which typically result from yeast autolysis and lees-aging post-secondary
fermentation. In some cases, sparkling wines are deliberately aged on yeast lees to enhance wine
complexity and texture (Iland and Gago, 1997). For example, production of MT17 involved >6 years
lees aging; this almost certainly contributed to the high ratings of toasty and complexity on the palate
(Figure 6a). In contrast, carbonated and Charmat sparkling wines predominantly exhibited fruit
characters (Figures 6c and d). The sensory profile of CA09 was more representative of the carbonated
sparkling wines studied; whereas CA06 and CA08 displayed unusually high complexity, due to
extended ageing of their base wine. Although these three carbonated wines were clustered together on
the PCA score plot (Figure 4a), their sensory profiles were less similar, suggesting different wine
constituents influenced the MIR spectra and sensory properties. Since the PLS loadings suggested
sugar and alcohol content both impacted the MIR spectra of sparkling wines, the sugar and alcohol
concentrations of the wines depicted in Figure 6 were compared (Table 4) and clustering did indeed
appear to be based on sugar and alcohol content. The Transfer sparkling wines (upper left quadrant)
were high in both sugar and alcohol; Methodé Traditionelle sparkling wines (lower left quadrant) were
low in sugar but higher in alcohol; Charmat sparkling wines (upper right quadrant) were high in sugar,

25
0.0
1.0
2.0
3.0
4.0
5.0
6.0
7.0
8.0
9.0
Tropical A
Floral A
Confectionary A
Toasty A
Tropical P
Floral PConfectionary P
Meaty/Savoury P
Toasty P
Sweetness P
Complexity P
MT09
MT10
MT13
MT15
MT17
MT18
0.0
1.0
2.0
3.0
4.0
5.0
6.0
7.0
8.0
9.0
Tropical A
Floral A
Confectionary A
Toasty A
Tropical P
Floral PConfectionary P
Meaty/Savoury P
Toasty P
Sweetness P
Complexity P
TR04
TR08
TR09
0.0
1.0
2.0
3.0
4.0
5.0
6.0
7.0
8.0
9.0
Tropical A
Floral A
Confectionary A
Toasty A
Tropical P
Floral PConfectionary P
Meaty/Savoury P
Toasty P
Sweetness P
Complexity P
CH01
CH02
0.0
1.0
2.0
3.0
4.0
5.0
6.0
7.0
8.0
9.0
Tropical A
Floral A
Confectionary A
Toasty A
Tropical P
Floral PConfectionary P
Meaty/Savoury P
Toasty P
Sweetness P
Complexity P
CA06
CA08
CA09
Figure 6. Sensory profiles of (a) Methodé Traditionelle (n=6) (b) Transfer (n=3) (c) Charmat (n=2) and (d) carbonated (n=3) sparkling wines that
clustered in the circled regions A, B, C and D respectively, on the PCA score plot displayed as Figure 4a. Reproduced from Culbert et al. 2015.
a) b)
c) d)

but lower in alcohol; carbonated sparkling wines (lower right quadrant) were low in sugar and alcohol.
The first PC therefore appears to be differentiating wines according to alcohol content, while the
second PC gives separation based on sugar content. A similar trend was observed when the sugar and
alcohol content of all sparkling wines was considered; on average: wines located within the upper left
quadrant (n=17) had 11.7 g/L of RS and 12.5% abv; wines within the upper right quadrant (n=12) had
13.7 g/L of RS and 11.2% abv; wine from the lower left quadrant (n=13 wines) had 8.2 g/L of RS and
12.1% abv; and wines situated in the lower right quadrant (n=8) had 11.3 g/L of RS and 11.2% abv.
Table 4. Mean sugar and alcohol concentrations for those wines located in the circled
regions A, B, C and D located in each of the quadrants in the PCA score plot (Figure 4a).
Upper left quadrant Upper right quadrant
Transfer (n=3) Charmat (n=2)
RS = 12.2 g/L RS = 17.3 g/L
Alcohol = 11.8% (abv) Alcohol = 11.2% (abv)
Lower left quadrant Lower right quadrant
Méthode Traditionelle (n=6) Carbonated (n=2)
RS = 6.2 g/L RS = 9.0 g/L
Alcohol = 11.9% (abv) Alcohol = 10.5% (abv)
RS = residual sugar; abv = alcohol by volume
In conclusion, this study demonstrated the capacity for ATR-MIR spectroscopy (combined with
multivariate analysis) to broadly classify sparkling wines according to both style and production
method. The results demonstrated qualitative compositional differences between wines that can be
observed by MIR spectroscopy and used to distinguish wines, following PCA. Interestingly,
discrimination was strongly influenced by the sugar and alcohol content of wines; i.e. two of the more
abundant wine constituents. However, some similarities in wine sensory profiles were also observed
for wines that were closely clustered based on the ‘fingerprint’ region of their MIR spectra. ATR-MIR
could therefore be used as a rapid method of screening large numbers of sparkling wines, so as to
inform selection of a subset of wines for more detailed compositional and/or sensory analysis, by gas
chromatography-mass spectrometry or descriptive analysis, for example.
Results from this study were published in Molecules in 2015: Culbert, J.A., Cozzolino, D., Ristic, R.
and Wilkinson, K.L. (2015) Classification of sparkling wine style and quality by MIR spectroscopy.
Molecules 20, 8341–8356.

27
Influence of production method on the sensory profiles and consumer
acceptance of different styles of Australian sparkling white wine.
Composition, bottle price and quality of sparkling white wines
Fifty Australian sparkling white wines produced via the four key production methods (carbonation,
Charmat, transfer and Méthode Traditionelle) were sourced (either commercially or from industry) and
a range of chemical and sensory analyses performed to: (i) characterise the sensory diversity amongst
different styles of Australian sparkling white wine; and (ii) to facilitate selection of a subset of wines
representative of that diversity, for consumer acceptance trials. The fifty sparkling white wines studied
were chosen to reflect a range of price points, i.e. $7 to $90, Australian wine regions, and brands
prominent in the domestic sparkling white wine market.
Table 5. Composition, price and quality of Australian sparkling white wines, by method of production.
pH TA
(g/L)
Residual
sugar
(g/L)
Alcohol
(% abv)
Total
phenolics
(au)
Price
(AUD)
Quality
ratings
(/20)
Méthode
Traditionelle
(n=20)
range 2.9 – 3.4 6.4 – 9.6 0.5 – 13.1 11.2 – 13.0 0.3 – 4.9 $25 – $90 13.9 – 17.4
mean 3.2 8.0 8.8 12.3 2.2 $43 15.8
Transfer
(n=10)
range 3.1 – 3.5 5.8 – 7.6 3.9 – 15.8 11.0 – 13.1 0.9 – 4.3 $10 – $31 14.1 – 15.6
mean 3.2 6.9 12.0 12.0 2.4 $23 15.0
Charmat
(n=10)
range 3.2 – 3.5 6.1 – 7.4 8.5 – 19.0 11.0 – 12.2 0.5 – 4.5 $8 – $23 14.4 – 15.2
mean 3.3 6.8 14.0 11.6 2.9 $15 14.7
Carbonation
(n=10)
range 3.1 – 3.4 6.4 – 9.2 7.9 – 13.5 10.3 – 12.5 2.5 – 5.8 $5 – $24 14.1 – 15.2
mean 3.3 7.6 12.4 11.1 4.7 $10 14.6
TA measured as g/L of tartaric acid.
Quality ratings determined by an expert panel (n=19) using a 20 point scoring system.
The pH, TA, residual sugar, alcohol and total phenolics of sparkling wines are reported in Table 5 (by
production method). Variation was observed in the composition of sparkling wines produced via the
same production method, but trends were also observed between wines made via different methods of
production. Méthode Traditionelle wines generally had higher TA and alcohol levels, but lower
residual sugar and total phenolics content. Charmat and carbonated wines tended to have higher
residual sugar levels and were lowest in alcohol content and highest in total phenolics. Carbonated
wines had substantially higher phenolic content than other sparkling wines, which may reflect
inclusion of higher press fractions of juice during base wine production. As expected, Méthode
Traditionelle wines were also the most expensive, ranging in price from $29 to $90 per bottle (and $43

28
per bottle, on average); average bottle prices for transfer, Charmat and carbonated wines followed
market hierarchy, being $23, $15 and $10, respectively (Table 5). Wine quality was determined by an
expert panel of sparkling winemakers and wine show judges, using the 20 point scoring system
employed in Australian wine show judging. Average quality ratings again reflected market hierarchy,
being 15.8, 15.0, 14.7 and 14.6 for Méthode Traditionelle, transfer, Charmat and carbonated wines
respectively (Table 5). The majority of Méthode Traditionelle wines (i.e. 18 of 20) were rated > 15.0,
the exceptions being two wines, MT01 and MT08 (rated 13.9 and 14.6 respectively), which exhibited
aldehydic notes that some winemakers considered a fault (data not shown). Expert panellists indicated
they rated wines according to: the size and persistence of the bead (bubble); the elegance of palate
structure and prominence of complexity (i.e. presence of developed characters derived from yeast
autolysis and ageing); the balance of sweetness, acidity and phenolics; and the absence of faults or
imbalance (data not shown). PLSR analysis of quality ratings and DA data confirmed sensory
attributes associated with yeast autolysis and aging, i.e. complexity, were positively correlated with
quality ratings (Figure 7).
Figure 7. PLSR of quality ratings vs. selected sensory attributes of Australian sparkling white wines.
Reproduced from Culbert et al. 2017a. Copyright 2017 Australian Society of Viticulture and Oenology
Inc.

29
Sensory profiles of Australian sparkling white wines
The sensory profiles of sparkling wines were determined by descriptive analysis (DA), with the
intensity of 24 aroma and/or flavour attributes being formally evaluated, as well as sweetness, acidity
and complexity (Table 6). The DA panel attempted, but was unable to reproducibly assess
effervescence, which was attributed to changes in effervescence due to carbon dioxide loss over time,
similar to that reported previously (Hood White and Heymann 2015).
Table 6. Attributes used in descriptive analysis of Australian sparkling white wines.
Attribute Definitions
Citrus lemon, grapefruit, lime, orange, mandarin
Stone Fruit apricot, nectarine, peach, white peach
Tropical pineapple, melon, lychee, banana, passionfruit
Pome Fruit apple, pear
Floral rose, perfume, blossom, honeysuckle
Confectionary turkish delight, bubble gum, musk, sherbet,
strawberries and cream
Yeasty Dough
Toasty biscuit, bread, brioche, buttery, popcorn
Meaty/Savoury savoury, meaty, vegemite, soy
Mushroom/Earthy mushroom, earthy
Honey Honey
Vanilla/Caramel vanilla, caramel, coconut, spice/clove
Aged/Developed nutty, kerosene, developed, Muscat/port, acetaldehyde
Sweetness intensity of sweetness perceived
Acidity intensity of acidity perceived
Complexity intensity of complex yeast-derived attributes
Effervescence overall perception of bubble size and flow
Sensory data obtained for each sparkling white wine was subjected to principal component analysis
(PCA), which gave the biplot shown in Figure 8. The first principal component explained 60% of
variation and separated wines based on the prominence of fruit vs. yeast-derived sensory attributes.
Méthode Traditionelle and transfer wines exhibited varying degrees of complexity, i.e. toasty,
meaty/savoury, yeasty, aged/developed characters. As such, the majority of these wines were located
in the quadrants on the right hand side of the biplot; the exceptions, being MT01, Tr02, Tr03, Tr04 and
Tr09, were located just left of the y axis, indicative of sensory profiles that comprised a combination of
both fruit and yeast-derived sensory attributes. Sparkling wines that were aged on lees for extended
periods of time (≥ 6 years), i.e. MT06, MT17 and MT19, clustered together and exhibited more intense
aged/developed and vanilla/caramel character, but less acidity. In contrast, carbonated and Charmat
wines predominantly exhibited fruit (tropical, stone fruit and pome fruit), floral and confectionery

30
Ca03
MT06
Tr10
Ca01
Ca02
Ca04
Ca05
Ca06
Ca07
Ca08
Ca09
Ca10
Ch01
Ch02
Ch03
Ch04
Ch05 Ch06
Ch08
Ch09Ch10
MT09MT01
MT02
MT03
MT04
MT05MT07
MT08
MT10
MT11
MT12
MT13
MT14
MT15
MT16
MT17
MT18
MT19
MT20
Ch07
Tr05
Tr03
Tr01
Tr02
Tr04
Tr06
Tr07
Tr08
Tr09
Citrus A
Stone Fruit A
Tropical A/P
Pome Fruit A
Floral A
Confectionary A
Meaty/Savoury A/PMushroom/Earthy A
Honey A
Vanilla/Caramel A
Aged/Developed A/P
Floral PConfectionary P
Mushroom/Earthy P
Honey P
Yeasty A/PToasty A/P
Vanilla/Caramel P
Sweetness
Acidity
Complexity
-2
-1.5
-1
-0.5
0
0.5
1
1.5
2
-2 1
PC2 15%
PC1 60%
Figure 8. PCA biplot of sensory attribute ratings of Australian sparkling white wines. Ca = carbonated wines, Ch = Charmat wines, Tr = transfer wines,
MT = Méthode Traditionelle wines; A = aroma attribute and P = palate attribute. Reproduced from Culbert et al. 2017a. Copyright 2017 Australian
Society of Viticulture and Oenology Inc.

31
characters and perceptible sweetness, and these wines tended to cluster on the left hand side of the
biplot (Figure 8). However, there were a few notable exceptions; several carbonated and Charmat
wines (Ca02, Ca06, Ca08 and Ch06) were found amongst the Méthode Traditionelle and transfer
wines, i.e. on the right hand side of the biplot. In the case of Ca06, which displayed unusually high
complexity, this likely reflects extended ageing of base wine prior to carbonation. The distribution of
quality scores generally followed a similar pattern, with wines positioned in quadrants on the right
typically given higher quality ratings than wines positioned in quadrants on the left. Indeed, the seven
wines considered to be of highest quality, i.e. MT06, MT12, MT14, MT16, MT17, MT18 and MT19
(for which quality ratings were ≥ 16.2), were those most closely associated with the developed
characters and complexity that the expert panel deemed indicative of sparkling wine quality. The
quality ratings of the carbonated and Charmat wines that clustered amongst the Méthode Traditionelle
and transfer wines ranged from 14.6 to 15.2, i.e. scores greater than or equal to the mean quality scores
attributed to carbonated and Charmat wines (Table 5). The second principal component explained a
further 15% of variation and separated wines based on the intensity of honey and vanilla/caramel
aromas and flavours vs. acidity.
Consumer acceptance of different styles of Australian sparkling white wine
Statistical analysis (I-optimal prime) was performed on sensory data in order to identify a subset of
sparkling wines, representative of the sensory diversity of all wines, to be evaluated in subsequent
consumer acceptance trials. Initially, seven wines were selected: two Méthode Traditionelle wines
(MT06 and MT09), three transfer wines (Tr03, Tr05 and Tr10), a Charmat wine (Ch07) and a
carbonated wine (Ca03); but the decision was made to preclude Tr05, to mitigate the risk of sensory
fatigue (Hersleth et al. 2003, Lattey et al. 2007, Lawless and Heymann, 1998). The final subset of six
wines (shown in bold in Figure 8 and Supp. Table 1) ranged in price from $7 to $70 according to
production method, but also varied in composition, sensory profiles and quality (Table 7, Figure 8,
Supp. Table 2). MT06 and MT09 were highest in TA and lowest in residual sugar, compared to the
other samples, but their alcohol and total phenolics levels differed. These wines were also considered
to be of highest quality; the increased bottle price and quality rating commanded by MT06 is
attributable to its extended period of lees ageing (i.e. 8 years). Of the subset of sparkling wines, Tr03
had the lowest TA and highest alcohol content. Tr10 had similar TA and residual sugar compared to
Tr03, but much higher total phenolics (2.4 vs. 0.9 au). The Charmat wine (Ch07) was highest in
residual sugar and lowest in TA; DA confirmed Ch07 to be a perceptibly sweet and fruit-dominant
style. The carbonated wine (Ca03) contained the highest total phenolics and lowest alcohol content. Of
the subset of wines, Ca03 was deemed to be of lowest quality (i.e. 14.4/20). Collectively these results
demonstrate the subset of sparkling white wines selected for consumer acceptance trials comprised
different compositions and sensory profiles, and therefore levels of quality, as intended.

32
Table 7. Composition, price and quality ratings of the subset of Australian sparkling white wines.
pH TA
(g/L)
Residual
sugar
(g/L)
Alcohol
(% abv)
Total
phenolics
(au)
Price
(AUD)
Quality
ratings
(/20)
MT06 3.2b 8.6 9.5c 12.7b 2.5b $70 16.6a
MT09 3.3ab 8.5 4.6c 12.0c 0.3c $41 15.6b
Tr03 3.2ab 7.6 10.5abc 13.1a 0.9c $23 14.8bc
Tr10 3.2ab 7.9 13.3ab 12.7b 2.4b $26 15.3bc
Ch07 3.3ab 7.8 17.3a 11.9c 2.0b $10 14.6c
Ca03 3.4a 8.4 11.6ab 11.1d 4.1a $7 14.4c
TA measured as g/L of tartaric acid. With the exception of price and quality rating, values are means
of 3 replicates.Quality ratings determined by an expert panel (n=19) using a 20 point scoring system.
Means within a column followed by different letters are significantly different (P = 0.05).
Table 8. Demographics, sparkling wine consumption and involvement of consumers.
Values represent percentage of consumers. a Involvement determined using the wine involvement scale (Bruwer and Huang, 2012), with low <
4.0/7 and high ≥ 4.0/7.
Total sample
(n=150)
Cluster 1
(n=37)
Cluster 2
(n=34)
Cluster 3
(n=47)
Cluster 4
(n=32)
Gender
Male 39.3 35.1 35.3 42.6 43.8
Female 60.7 64.9 64.7 57.4 56.2
Age (years)
18-34 39.5 35.1 50.0 38.6 34.4
35-54 36.0 43.3 23.5 40.9 34.4
55+ 24.5 21.6 26.5 20.5 31.2
Education
High school/certificate/diploma 40.7 37.8 35.3 40.4 50.0
Bachelor’s degree 35.3 43.3 41.2 31.9 25.0
Postgraduate 24.0 18.9 23.5 27.7 25.0
Household income (AUD)
<$30,000 12.8 18.9 15.1 10.9 6.2
$30,001-$50,000 17.6 27.1 15.1 6.5 25.0
$50,001-$75,000 15.5 16.2 18.2 15.2 12.5
$75,001-$100,000 17.6 16.2 9.1 30.4 9.4
$100,001-$200,000 28.4 18.9 36.4 26.1 34.4
>$200,000+ 8.1 2.7 6.1 10.9 12.5
Sparkling wine consumption
Low (< once every 2 months) 43.3 46.0 35.3 49.0 40.6
Medium (once every 1-2 months) 38.0 35.1 44.1 34.0 40.6
High (once a fortnight or more) 18.7 18.9 20.6 17.0 18.8
Wine involvementa
Low (<4.0) 30.0 40.5 14.7 38.3 21.9
High (≥4.0) 70.0 59.5 85.3 61.7 78.1

33
One hundred and fifty consumers were recruited to participate in acceptance tests (Table 8). A higher
proportion of females participated than males (60% vs. 40%) which may reflect a gender-based interest
(and/or preference) in sparkling wine, as has previously been suggested (Bruwer et al. 2011, Verdonk
et al. 2017). Consumers were distributed relatively evenly across the different age groups, almost 60%
held tertiary qualifications and approximately a third had household incomes >$100,000 per annum.
Most participants consumed sparkling wine at least once every 1-2 months (57%), and were highly
involved with wine (70%).
Table 9. Consumer liking scores for subset of Australian sparkling white wines.
Hedonic ratingsa
Total sample
(n=150)
Cluster 1
(n=37)
Cluster 2
(n=34)
Cluster 3
(n=47)
Cluster 4
(n=32)
MT06 4.4bc 5.2a 2.0c 5.4a 4.8bc
MT09 4.1c 2.9c 3.3b 3.9d 6.5a
Tr03 4.4bc 2.9c 5.2a 4.8bc 4.5bcd
Tr10 4.5b 5.9a 4.8a 2.8e 5.2b
Ch07 5.1a 5.5a 5.0a 5.6a 4.2cd
Ca03 4.5b 4.3b 5.2a 4.4cd 3.9d
Means within a column followed by different letters are significantly different (P = 0.05). a Hedonic ratings determined using a 9 cm line scale, with anchors from left (dislike extremely) to right
(like extremely).
Significant differences were observed between the liking scores given to the subset of sparkling wines,
which ranged from 4.1 to 5.1 (Table 9). On average, the Charmat wine (Ch07) was liked the most,
while MT09 was liked least; although there was no significant difference between liking scores for
Tr03, MT06 and MT09. The influence of factors such as gender, age, frequency of sparkling wine
consumption and wine involvement were all considered, but very few significant differences were
observed (Supp. Table 3). The Charmat wine remained the most liked sparkling wine, irrespective of
consumer age, consumption frequency or wine involvement; while older consumers tended to like
sparkling wines, Méthode Traditionelle and transfer wines in particular, more than younger consumers
(although liking scores were not statistically significant). Similarly, consumers who indicated they
consumed sparkling wine regularly (i.e. at least once a fortnight) tended to like sparkling wines more
than other consumers. Previous research has shown that consumer preferences for wine, including
sparkling wine and Champagne, can vary considerably (Lange et al. 2002, Combris et al. 2006, Vignes
and Gergaud 2007, Culbert et al. 2016), so cluster analysis was employed to differentiate consumers
based on their individual liking scores. Four distinct clusters comprising consumers with different
preferences for the subset of sparkling wines were identified (Tables 8 and 9). Cluster 1 comprised 37
consumers who liked MT06, Tr10 and Ch07, but disliked MT09 and Tr03. Cluster 2 (n=34) comprised

34
the highest proportion (85%) of highly involved consumers, yet surprisingly, these consumers disliked
Méthode Traditionelle wines, in favour of less complex sparkling wines. Cluster 3 (n=47) comprised
consumers who most liked MT06 and Ch07, but disliked Tr10; while Cluster 4 consumers (n=32) liked
MT09 the most and Ca03 the least. It could be hypothesised that younger consumers, particularly those
with lower disposable incomes, might be more familiar with the lower priced, fruit-driven carbonated
and Charmat wines, than with the more expensive, and complex, transfer and Méthode Traditionelle
wines. Conversely, older consumers, particularly those with higher disposable incomes could
reasonably be expected to afford, and therefore, more frequently consume, higher priced sparkling
wines. Thus, familiarity with different wine styles (i.e. fruit-driven vs. complex) might influence
sparkling wine preferences. To some extent, Cluster 2 represents younger consumers who tend to
prefer the more fruit-driven styles, while Cluster 4 represents older consumers who tend to like
sparkling wines which exhibit more complexity; albeit these trends were less obvious than in a recent
study concerning consumer preferences for Australian sparkling wine vs French Champagne (Culbert
et al. 2016).
PCA was performed on sensory data, liking scores (by consumer cluster) and quality ratings for the
subset of sparkling wines, to determine the extent to which different sensory attributes influenced
consumer wine preferences; with the first and second principal components explaining 66% and 18%
of variation, respectively (Figure 9). The stylistic preferences of Clusters 2 and 4 were more obvious
than for clusters 1 and 3. Cluster 2 was positioned between the carbonated and Charmat wines, i.e. the
wines that exhibited apparent fruit characters; whereas Cluster 4 was positioned in close proximity to
the more complex yeasty, mushroom/earthy MT09. In contrast, Clusters 1 and 3 were both located in
the top left quadrant, which perhaps reflects these clusters’ liking of a broader range of sparkling wine
styles.
Previous studies have shown that in blind tastings, consumers generally struggle to differentiate
sparkling wines, including Champagne, on the basis of quality (Lange et al. 2002, Combris et al. 2006,
Vignes and Gergaud 2007, Culbert et al. 2016), i.e. using intrinsic cues, such as wine aroma, flavour
and taste properties, alone. In retail and on premise situations, consumers can usually only assess a
wine’s sensory properties after it has been selected/purchased. As such, perceived quality, and
therefore purchase decisions, are based on extrinsic cues, such as price, packaging, labelling, and/or
brand (Lockshin and Corsi 2012); albeit prior consumption, wine style, grape variety and occasion
have also been shown to be important to consumers when selecting (table) wine (Johnson and Bastian
2007, Crump et al. 2014). In the case of sparkling wine, Champagne in particular, country of origin
also influences perceptions of quality and price (Lange et al. 2002, Combris et al. 2006, Culbert et al.
2016), together with consumption occasion (Verdonk et al. 2017). Indeed, previous research suggests

35
the symbolic aspects associated with sparkling wine consumption (i.e. occasion, celebration and
prestige) motivates consumers, especially younger consumers, much more than wine sensory
properties (Charters et al. 2011). Ultimately, consumer preferences for different styles of sparkling
white wine (i.e. based on the blind tastings) may not reflect their purchasing decisions, due to an array
of competing factors; but insight into the sensory attributes driving consumers’ sparkling wine
preferences will enable industry to better their tailor marketing strategies to target the different
segments of the sparkling wine consumer market.
MT06
MT09
Tr03
Tr10
Ch07
Ca03
Citrus A
Stone Fruit A
Tropical A/P
Pome Fruit A
Floral A
Confectionary A/P
Meaty/Savoury A/P
Mushroom/Earthy A
Honey A
Yeasty A/P
Toasty A
Vanilla/Caramel A
Aged/Developed A
Floral P
Mushroom/Earthy P
Honey P
Toasty P
Vanilla/Caramel P
Aged/Developed P
Sweetness
Acidity
Complexity
Cluster 1
Cluster 2
Cluster 3
Cluster 4
Quality
PC2 18%
PC1 66%
Figure 9. PCA biplot of sensory attribute ratings, liking scores (for consumer clusters) and quality
ratings for subset of Australian sparkling white wines. Ca = carbonated wines, Ch = Charmat wines, Tr
= transfer wines, MT = Méthode Traditionelle wines; A = aroma attribute and P = palate attribute.
Reproduced from Culbert et al. 2017a. Copyright 2017 Australian Society of Viticulture and Oenology
Inc.
Results from this study have demonstrated the diverse sensory profiles exhibited by different styles of
Australian sparkling white wines. Evaluation of sparkling wines by an expert panel confirmed

36
complexity was closely associated with wine quality, with those wines exhibiting the most intense
toasty, yeasty, aged/developed notes typically awarded the highest quality scores. Carbonated and
Charmat wines tended to be fruit-driven sparkling wines, that were generally considered to be of lower
quality. In contrast, varying degrees of complexity were observed in transfer and Méthode
Traditionelle wines. Consumer acceptance was seemingly unrelated to wine quality or production
method, with a $10 Charmat wine liked more than Méthode Traditionelle wines (on average).
Segmentation enabled identification of four consumer clusters, each with distinct sparkling wine
preferences. These research findings will enable industry to better understand the domestic sparkling
wine consumer market and may provide insights that can be used to tailor production and/or marketing
strategies to particular consumer segments.
Results from this study were published in the Australian Journal of Grape and Wine Research in 2017:
Culbert, J.A., Ristic, R., Ovington, L.A. Saliba, A.J. and Wilkinson, K.L. Influence of production
method on the sensory profiles and consumer acceptance of different styles of Australian sparkling
white wine. Australian Journal of Grape and Wine Research 23, 170–178.

37
Supplementary Table 1. Vintage, varietal composition, geographical origin, price and closure of the
Australian sparkling white wines studied.
Wine code Vintage Varieties Region Price
(AUD)
Closure
type
MT01 2011 PN, CH SA 34 cork
MT02 NV PN, CH, PM Vic 25 cork
MT03 2010 Ch, PN, PM Vic, SA, Tas 26 cork
MT04 NV Ch, PN, PM Tas 28 cork
MT05 2010 PN, CH Vic 35 cork
MT06* 2004 Ch, PN Tas 70 cork
MT07 2009 Ch, PN Tas 50 cork
MT08 2010 PN, CH SA 35 cork
MT09 2010 PN, Ch, PM Australia 41 cork
MT10 2009 Ch Vic 29 cork
MT11 2008 Ch, PN Tas 35 cork
MT12 NV Ch, PN Tas 32 cork
MT13 NV Ch, PN SE Australia 32 cork
MT14 2008 PN, CH Vic 47 cork
MT15 2008 Ch, PN, PM Tas 50 cork
MT16 NV PN, CH Tas 55 cork
MT17* 2004 Ch, PN Vic 55 cork
MT18 2009 Ch Vic 41 crown seal
MT19* 2004 Ch, PN Vic, Tas 90 cork
MT20* 2005 Ch, PN Tas 53 cork
Tr01 2011 PN, CH SE Australia 10 cork
Tr02 2011 Ch, PN SA 17 cork
Tr03 2008 PN, CH NSW and Vic 23 cork
Tr04 NV Ch, PN Vic, SA 18 cork
Tr05 NV PN, Ch, PM SA, Vic, NSW 25 cork
Tr06 2011 Ch, PN Tas 30 cork
Tr07 NV PN, CH SA 28 cork
Tr08 NV Ch, PN Tas 31 cork
Tr09 NV PN, CH, PM Vic 20 cork
Tr10 NV PN, CH Tas 26 cork
Ch01 NV Ch, PN SE Australia 12 cork
Ch02 NV Ch, PN SE Australia 9 screw cap
Ch03 NV PN, CH, PM Vic 14 cork
Ch04 NV Ch, PN SE Australia 8 cork
Ch05 NV Ch SA 23 cork
Ch06 NV PN, CH Tas 22 cork
Ch07 NV PN, Ch, PM SE Australia 9 cork
Ch08 NV Ch Vic 22 cork
Ch09 NV PN, CH SA 18 cork
Ch10 NV Ch, PN NSW, Vic 11 cork
Ca01 NV Sem, Ch Australia 5 cork
Ca02 NV Ch, CB WA 12 cork
Ca03 NV Ch, PN SE Australia 7 cork
Ca04 2012 Ch SA 14 Zork
Ca05 NV Ch, Co Australia 6 cork
Ca06 NV Ch, Sem, SB Australia 9 cork
Ca07 NV Ch, Sem Australia 9 cork
Ca08 NV Ch, PN Australia 8 cork
Ca09 NV Ch, PN SA 24 cork
Ca10 NV Ch, PN Vic 11 cork
MT = Méthode Traditionelle; Tr = Transfer; Ch = Charmat; Ca = Carbonated. NV = non-vintage. CB = Chenin Blanc; Ch =
Chardonnay; Co = Colombard; PM = Pinot Meunier; PN = Pinot Noir; SB = Sauvignon Blanc; Sem = Semillon; NSW =
New South Wales; SA = South Australia; SE = South Eastern; Tas =Tasmania; WA = Western Australia; Vic = Victoria. *
= wines aged on lees for extended periods of time (≥ 6 years).

38
Supplementary Table 2. Mean intensity ratings for sensory attributes of the subset of Australian
sparkling white wines.
MT06 MT09 Tr03 Tr10 Ch07 Ca03 P
Citrus A 5.1 4.5 5.1 4.8 5.6 5.6 ns
Stone Fruit A 6.2abc 5.4c 6.0abc 5.7bc 7.6a 7.1ab 0.0799
Tropical A 4.3b 4.3b 4.7b 4.5b 8.8a 6.1b 0.0002
Pome Fruit A 6.4 6.1 6.7 7.2 6.8 6.0 ns
Floral A 3.3bc 2.7c 4.4b 4.4b 7.4a 6.9a < 0.0001
Confectionary A 2.2cd 1.9d 4.7b 2.1d 6.2a 3.5bc < 0.0001
Yeasty A 5.8ab 6.4a 3.8c 4.1bc 3.3c 3.8c 0.007
Toasty A 7.7a 5.8b 5.0bc 4.6bc 2.7d 3.4cd < 0.0001
Meaty/Savoury A 5.2a 5.2a 1.8b 2.4b 1.1b 1.6b < 0.0001
Mushroom/Earthy A 3.9ab 4.6a 2.1cd 2.8bc 1.3d 2.0cd 0.0001
Honey A 5.0a 3.0b 4.4a 3.8ab 3.7ab 4.1ab 0.1062
Vanilla/Caramel A 4.8a 3.0b 4.0ab 4.0ab 3.0b 3.8ab 0.2246
Aged/Developed A 6.0a 5.0ab 5.4ab 3.7bc 1.4d 2.1cd < 0.0001
Tropical 5.4c 5.8bc 5.9bc 5.2c 9.4a 7.4b 0.0002
Floral 4.1bc 3.4c 5.0b 3.5c 7.7a 5.1b < 0.0001
Confectionary 2.5c 2.4c 4.2b 3.1bc 6.1a 4.3b 0.0003
Meaty/Savoury 4.9a 4.5a 2.0bc 2.8b 1.4c 2.2bc < 0.0001
Mushroom/Earthy 4.4a 4.3ab 2.9abc 3.6ab 1.8c 2.7bc 0.0001
Honey 4.4ab 3.2b 4.2ab 4.5ab 4.9a 4.0ab 0.2479
Yeasty 5.8a 6.0a 4.4ab 4.4ab 3.8b 5.1ab 0.1865
Toasty 7.3a 5.2b 5.3b 5.2b 2.4c 3.9bc < 0.0001
Vanilla/Caramel 4.8a 2.2c 4.3a 4.1ab 3.0bc 2.8c 0.0005
Aged/Developed 6.6a 4.8b 4.9b 4.9b 2.0c 2.7c < 0.0001
Sweetness 3.9c 3.3c 5.7ab 4.7bc 6.7a 4.5bc 0.0002
Acidity 9.3abc 9.7ab 8.3c 8.9bc 8.4c 10.4a 0.0074
Complexity 9.0a 7.1b 6.3b 7.0b 4.1c 5.9bc 0.0002
A = aroma attribute. Values are mean scores from three wine replicates presented to 10 judges in
replicated sensory sessions. Means within rows followed by different letters are significantly
different (p = 0.05, one way ANOVA, Tukey’s LSD post hoc); ns = not significant.

39
Supplementary Table 3. Liking scores for the subset of Australian sparkling white wines for
consumer clusters segmented according to gender, age, frequency of sparkling wine consumption and
wine involvement.
Hedonic ratingsa
MT06 MT09 Tr03 Tr10 Ch07 Ca03
Gender
Male (n=59) 4.6 4.4 a 4.7 4.6 5.3 4.2
Female (n=91) 4.4 3.9 b 4.1 4.4 5.0 4.6
Age (years)
18-34 (n=59) 3.9 3.6 4.1 4.2 5.1 4.2
35-54 (n=54) 4.7 4.1 4.5 4.5 5.4 4.6
55+ (n=37) 4.7 4.7 4.6 4.9 4.9 4.7
Sparkling wine consumptionb
Low (n=65) 4.3 3.7 4.2 4.2 5.1 4.1
Medium (n=57) 4.4 4.3 4.6 4.7 4.8 4.6
High (n=28) 4.7 4.3 4.4 4.8 5.8 5.0
Wine involvementc
Low (n=45) 5.1 3.6a 3.9a 4.0 5.5 4.2
High (n=105) 4.2 4.3b 4.5b 4.7 5.0 4.6
Means followed by different letters (within a column, by segmentation category) are significantly
different (P = 0.05, one-way ANOVA). a Hedonic ratings determined using a 9 cm line scale, with anchors from left (dislike extremely) to right
(like extremely). b Low being < once every 2 months; medium being once every 1-2 months; high being once a fortnight
or more.
c Involvement determined using the wine involvement scale (Bruwer and Huang, 2012), with low <
4.0/7 and high ≥ 4.0/7.

40
Influence of production method on the chemical composition, foaming properties
and quality of Australian carbonated and sparkling white wines.
The composition, foaming properties and quality of 50 sparkling white wines, representing the four
key methods of production employed in Australia (i.e. Méthode Traditionelle, transfer, Charmat and
carbonation), were measured to establish the variation amongst different styles of sparkling white
wine, and to determine to what extent production method influences the compositional factors that
drive sparkling wine style and quality.
Amino acid content of sparkling wines
The presence of amino acids, proteins and polysaccharides in sparkling wines and base wines has
received considerable attention in recognition of their contributions to foaming properties, body and
flavour (Brissonnet and Maujean 1993, López-Barajas et al. 2001) and therefore perceptions of quality
(Martínez-Lapuente et al. 2015). In the current study, carbonated wines had significantly higher total
amino acid levels than sparkling wines derived from other production methods (Table 10). This largely
reflected the considerably higher proline levels of carbonated wines, as well as elevated levels of
arginine and alanine (Figure 10, Supp. Table 4). Proline is generally accepted to be the predominant
amino acid present in must and wine (Huang and Ough 1991, Lehtonen 1996, Waterhouse et al. 2016),
although for some grape varieties, arginine (Huang and Ough 1991) or arginine and proline (Stines et
al 2000) predominate. In a study of Italian sparkling wines (Casoli and Colagrande 1982), proline
concentrations were up to ten times higher than the next most abundant amino acid. However, it should
be noted that amino acid composition can vary according to vineyard management, water availability
and nitrogen application (Bell and Henschke 2005); with proline accumulation considered to be a
physiological response to stress (Bertamini et al. 2006). During alcoholic fermentation, amino acids
provide nitrogen for yeast metabolism, either as free amino acids or via degradation of grape proteins;
(Lehtonen 1996, Waterhouse et al. 2016) but they can also be released during yeast autolysis
(Alexandre and Guilloux-Benatier 2006). Since most grape-derived amino acids are consumed during
fermentation, the higher amino acid levels observed in carbonated wines (which do not undergo
secondary fermentation and lees aging) were not unexpected. In contrast, sparkling wines produced via
Méthode Traditionelle, transfer and Charmat (which do undergo secondary fermentation) had similar
free amino acid concentrations, on average, being 931 to 976 mg/L (Table 10). Variation was
nevertheless still observed amongst wines produced by the same production method. In the case of
carbonated wines, amino acid levels ranged from 471 to 1924 mg/L, for example (Table 10);
differences may be attributable to grape variety and/or vineyard management practices (Bell and
Henschke 2005, Waterhouse et al. 2016). While the majority of the sparkling wines studied comprised
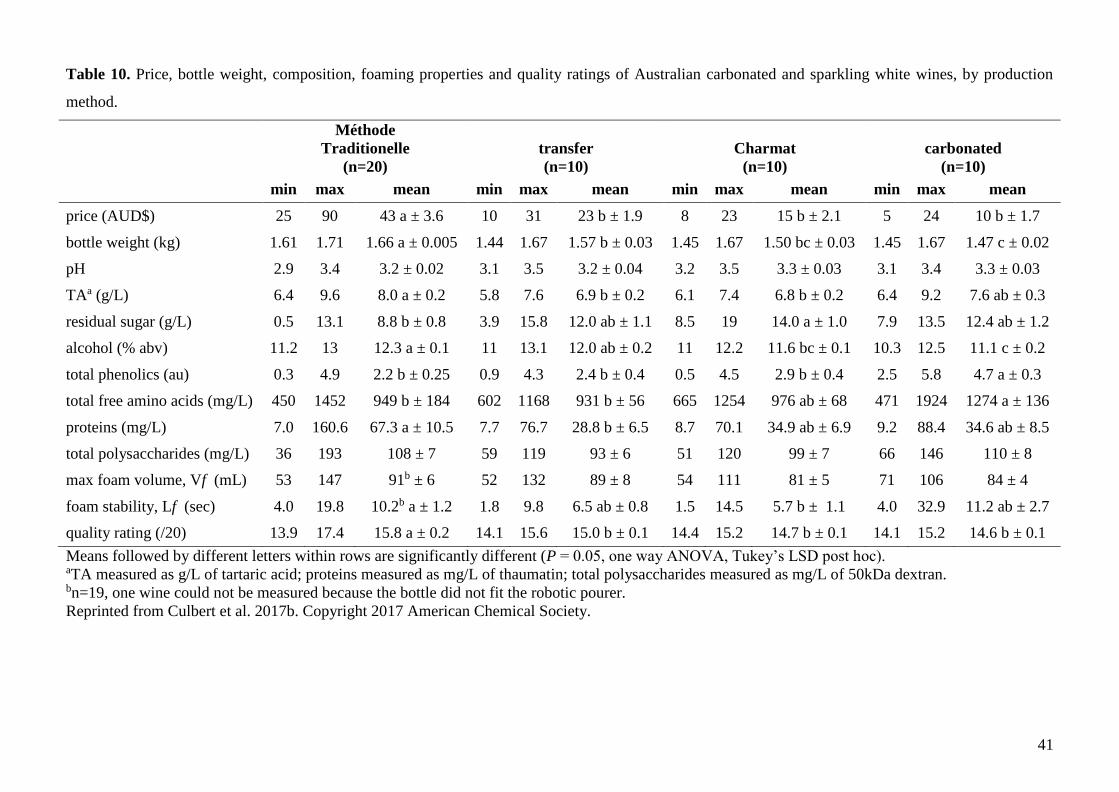
41
Table 10. Price, bottle weight, composition, foaming properties and quality ratings of Australian carbonated and sparkling white wines, by production
method.
Méthode
Traditionelle
(n=20)
transfer
(n=10)
Charmat
(n=10)
carbonated
(n=10)
min max mean min max mean min max mean min max mean
price (AUD$) 25 90 43 a ± 3.6 10 31 23 b ± 1.9 8 23 15 b ± 2.1 5 24 10 b ± 1.7
bottle weight (kg) 1.61 1.71 1.66 a ± 0.005 1.44 1.67 1.57 b ± 0.03 1.45 1.67 1.50 bc ± 0.03 1.45 1.67 1.47 c ± 0.02
pH 2.9 3.4 3.2 ± 0.02 3.1 3.5 3.2 ± 0.04 3.2 3.5 3.3 ± 0.03 3.1 3.4 3.3 ± 0.03
TAa (g/L) 6.4 9.6 8.0 a ± 0.2 5.8 7.6 6.9 b ± 0.2 6.1 7.4 6.8 b ± 0.2 6.4 9.2 7.6 ab ± 0.3
residual sugar (g/L) 0.5 13.1 8.8 b ± 0.8 3.9 15.8 12.0 ab ± 1.1 8.5 19 14.0 a ± 1.0 7.9 13.5 12.4 ab ± 1.2
alcohol (% abv) 11.2 13 12.3 a ± 0.1 11 13.1 12.0 ab ± 0.2 11 12.2 11.6 bc ± 0.1 10.3 12.5 11.1 c ± 0.2
total phenolics (au) 0.3 4.9 2.2 b ± 0.25 0.9 4.3 2.4 b ± 0.4 0.5 4.5 2.9 b ± 0.4 2.5 5.8 4.7 a ± 0.3
total free amino acids (mg/L) 450 1452 949 b ± 184 602 1168 931 b ± 56 665 1254 976 ab ± 68 471 1924 1274 a ± 136
proteins (mg/L) 7.0 160.6 67.3 a ± 10.5 7.7 76.7 28.8 b ± 6.5 8.7 70.1 34.9 ab ± 6.9 9.2 88.4 34.6 ab ± 8.5
total polysaccharides (mg/L) 36 193 108 ± 7 59 119 93 ± 6 51 120 99 ± 7 66 146 110 ± 8
max foam volume, Vf (mL) 53 147 91b ± 6 52 132 89 ± 8 54 111 81 ± 5 71 106 84 ± 4
foam stability, Lf (sec) 4.0 19.8 10.2b a ± 1.2 1.8 9.8 6.5 ab ± 0.8 1.5 14.5 5.7 b ± 1.1 4.0 32.9 11.2 ab ± 2.7
quality rating (/20) 13.9 17.4 15.8 a ± 0.2 14.1 15.6 15.0 b ± 0.1 14.4 15.2 14.7 b ± 0.1 14.1 15.2 14.6 b ± 0.1
Means followed by different letters within rows are significantly different (P = 0.05, one way ANOVA, Tukey’s LSD post hoc). aTA measured as g/L of tartaric acid; proteins measured as mg/L of thaumatin; total polysaccharides measured as mg/L of 50kDa dextran. bn=19, one wine could not be measured because the bottle did not fit the robotic pourer.
Reprinted from Culbert et al. 2017b. Copyright 2017 American Chemical Society.

42
the classic grape varieties, Chardonnay, Pinot Noir and Pinot Meunier (or blends thereof), several
carbonated wines comprised Chardonnay blended with non-classic varieties. It should also be noted
that carbonated wines are more likely to be produced from higher yielding vines, lower quality fruit
and/or riper fruit, with fruit maturity being another factor that influences amino acid concentrations
(Stines et al. 2000). Fruit destined for carbonated wine might also originate from warmer climates and
would therefore be more likely to be harvested from vines subject to temperature and/or water stress,
which, as previously indicated, can also influence proline accumulation (Bell and Henscke 2005,
Bertamini et al. 2006). Finally, winemaking practices, in particular the addition of diammonium
phosphate, may also influence amino acid metabolism during fermentation. Previous studies have
shown that amino acid levels can fluctuate considerably during bottle aging and yeast autolysis, so
there are likely multiple factors at play. Additionally, amino acids are known aroma precursors
(Feuillat and Charpentier 1982), so their degree of conversion to aroma compounds will also influence
wine amino acid concentrations.
0
100
200
300
400
500
600
700
Aspartic acid Glutamic acid Arginine Alanine Proline Lysine
mg/
L
Amino acid
Méthode Traditionelle
transfer
Charmat
carbonated
a
bbb
Figure 10. Mean concentrations for the most abundant amino acids for 50 Australian sparkling white
wines according to their production methods. Letters indicate statistical significance (P = 0.05, one-
way ANOVA, Tukey’s LSD post hoc). Reprinted from Culbert et al. 2017b. Copyright 2017 American
Chemical Society.
Protein content of sparkling wines
The method of sparkling wine production greatly impacted the protein content of finished wine,
particularly for Méthode Traditionelle wines, which on average, contained significantly more protein

43
(P<0.05) than other wines (Table 10). The HPLC-based analytical method employed in this study
specifically measured chitinases and thaumatin-like proteins (TLPs), i.e. the two protein classes
associated with the majority of haze formation in wine, for which molecular weights range between 21
and 32 kDa (Waterhouse et al. 2016). Other spectrophotometric-based protein methods, such as the
Bradford method, may be limited in wine analysis due to interferences from non-protein wine
constituents, ethanol and phenolic compounds in particular (Marchal et al. 1997). Previous studies
have shown that the majority of proteins present in Champagne base wines were chitinases and TLPs
(Brissonnet and Maujean 1993). However, of the fifty sparkling wines analysed in this study, all
contained TLPs and only one contained chitinases. This is mostly likely due to the reduced stability of
chitinases compared with TLPs. Research concerning the fate of these proteins during Champagne
production suggests reduced chitinase activity during fermentation and no detectable chitinase activity
in the final wine (Manteau et al. 2003). The Méthode Traditionelle wines studied here were found to
contain, on average, two-fold higher protein concentrations compared to sparkling wines made via
other methods (Table 10), which may relate to bentonite fining of base wines prior to carbonation or
secondary fermentation. Bentonite fining removes wine proteins and therefore impacts on foam quality
and persistence (García et al. 2009). Stabilisation treatment during the different stages of sparkling
wine production, such as bentonite addition, have been shown to remove around 75% of wine protein
and peptides (Luguera et al. 1998). The higher protein levels observed in Méthode Traditionelle wines
from the current study, might therefore reflect less stringent fining of base wines, relative to other
production methods, in order to achieve the organoleptic characteristics (e.g. foaming) associated with
higher quality sparkling wines.
Polysaccharide content of sparkling wines
Production method significantly influenced polysaccharide composition (Figure 11), although average
total polysaccharide concentrations were not statistically different (Table 10). On average, bottle
fermented Méthode Traditionelle and transfer wines contained a greater proportion of higher molecular
weight polysaccharides (i.e. 200 kDa), which typically represent yeast-derived mannoproteins (Bindon
et al. 2003), while Charmat and carbonated wines comprised a greater proportion of low molecular
weight polysaccharides (i.e. 10–50 kDa), which typically represent rhamnogalacturonans (Bindon et al.
2003) (Figure 2). Mannoproteins are yeast-derived and so bottle fermented wines that are aged on
yeast lees were expected to contain more high molecular weight polysaccharides, compared to batch
fermented production methods, such as Charmat and carbonation. However, mannoproteins can
degrade with age and/or enzyme activity, so greater lees aging does not necessarily equate to an
increase in mannoproteins. This may explain the low concentration of mannoproteins in the three
Méthode Traditionelle wines (MT06, MT17 and MT19) that were aged on yeast lees for extended
periods of time (≥ 6 years), being 41, 46 and 55 mg/L of 50 kDa dextran equivalents, relative to total

44
polysaccharide concentrations of 86, 114 and 193 mg/L of 50 kDa dextran equivalents, respectively.
Furthermore, these three wines did not contain the highest mannoprotein levels, which indicates other
factors may influence polysaccharide concentration and composition. The polysaccharide content of
base wines may increase where wine remains in contact with residual yeast prior to secondary
fermentation, but may decrease as a consequence of stabilization and/or filtration (López-Barajas et al
2001).
0
20
40
60
80
100
MéthodeTraditionelle
transfer Charmat carbonated
Per
cen
tage
of t
ota
l
High MW Med MW Low MW
abab
a
b
a ab
b b
a ab b
Figure 11. Polysaccharide content of Australian sparkling wines based on percentage contribution of
each of the high, medium and low molecular weight polysaccharides, by production method. Note:
High MW = 200 kDa; Med MW = 100 kDa; and Low MW = 50, 20 and 10 kDa. Letters indicate
statistical significance (P = 0.05, one-way ANOVA, Tukey’s LSD post hoc).
Reprinted from Culbert et al. 2017b. Copyright 2017 American Chemical Society.
Wine polysaccharides can vary considerably between wines, but direct comparisons of results from
previously published studies needs to account for the analytical method used for quantitation of
polysaccharides, which can otherwise influence results (Alexandre et al 2006). A recent study into
changes in polysaccharide composition during the production of Champagne found the highest
concentrations of mannoproteins and polysaccharides rich in AGP were measured in wines aged for 6
months (Martínez-Lapuente et al 2013). Increased polysaccharide concentrations are desirable, given
polysaccharides are associated with foamability, stability and mouthfeel (Alexandre et al 2006).

45
Fatty acid content of sparkling wines
Fatty acids are released into wine during yeast autolysis and can also influence sparkling wine foaming
properties. As such, the influence of production method on the free fatty acid content, i.e. hexanoic,
octanoic and decanoic acids and their corresponding ethyl esters, of sparkling wines was investigated
(Table 11). Irrespective of the method of production, sparkling wines were found to contain similar
quantities of hexanoic acid and ethyl hexanoate. Carbonated and Charmat wines were more abundant
in decanoic and octanoic acids, together with their corresponding ethyl esters, compared to Méthode
Traditionelle and transfer wines, with larger differences observed for decanoic acid and ethyl
decanoate (Table 11). However, the ratio of fatty acids to ethyl esters was similar, regardless of
production method. A previous study has suggested the foamability of sparkling wine is directly
proportional to the ester–fatty acid ratio (Gallart et al. 2002), but relatively consistent esterification
ratios were observed in this study. Ethyl hexanoate was approximately three-fold more abundant than
hexanoic acid for all production methods: 3.18 for carbonation; 3.30 for Charmat; 3.45 for transfer;
and 3.50 for Méthode Traditionelle). Decanoic acid was approximately twice as abundant as ethyl
decanoate; ester to acid ratios were: 0.50 for carbonation 0.50; 0.52 for Charmat; 0.47 for transfer; and
0.45 for Méthode Traditionelle. Ethyl octanoate was approximately 10-15% more abundant than
octanoic acid; ester to acid ratios were: 1.12 for carbonation; 1.15 for Charmat; 1.11 for transfer; and
1.16 for Méthode Traditionelle). These results suggest a relationship between free fatty acids and their
ethyl esters independent of production method. However, it wasn’t surprising that higher ethyl ester
concentrations were observed in fruit driven styles of sparkling wine (i.e. Charmat and carbonated
wines).
Table 11. Mean peak areas for C6, C8 and C10 fatty acids and their ethyl esters in Australian
carbonated and sparkling white wines, by production method.
Méthode
Traditionelle
(n=20)
transfer
(n=10)
Charmat
(n=10)
carbonated
(n=10)
hexanoic acid (C6) 1.59 1.61 1.67 1.70
octanoic acid (C8) 8.34 b 9.22 b 10.79 a 11.10 a
decanoic acid (C10) 1.39 d 1.92 c 3.50 b 4.18 a
ethyl hexanoate 5.45 5.34 5.40 5.34
ethyl octanoate 9.71 b 10.23 b 12.27 a 12.41 a
ethyl decanoate 0.63 c 0.93 b 1.85 a 2.09 a
Values are presented as peak area divided by 107.
Means within a row followed by different letters are significantly different (P = 0.05, one-way
ANOVA, Tukey’s LSD post hoc).
Reprinted from Culbert et al. 2017b. Copyright 2017 American Chemical Society.

46
Foaming properties of sparkling wines
The average maximum foam volumes (Vf) for Méthode Traditionelle and transfer wines were 91 and
89 mL respectively, but these results were not statistically significant to those of Charmat and
carbonated wines, being 81 and 84 mL respectively (Table 10). The maximum foam volume of
Méthode Traditionelle wines was found to vary the most (by as much as 94 mL), whereas variation
amongst transfer, Charmat and carbonated wines was from 80, 57 and 35 mL respectively.
Interestingly, no correlations were observed between maximum foam volume and price, bottle weight,
compositional parameters or quality ratings (data not shown).
The foam stability, on average, was highest for carbonated wines (11.2 sec) followed by Méthode
Traditionelle wines (10.2 sec), transfer wines (6.5 sec) and Charmat wines (5.7 sec). Foam stability
was expected to be highest for Méthode Traditionelle and transfer wines, since these wines were
highest in proteins and polysaccharides, i.e. sparkling wine constituents which have previously been
associated with foam stability (Brissonnet and Maujean 1991, Malvy et al. 1994, Luguera et al. 1998,
López-Barajas et al. 2001, Manteau et al. 2003, Martínez-Lapuente et al. 2013); although some studies
suggest foamability is inversely correlated with foam stability, and is therefore negatively correlated
with protein content (Andrés-Lacueva et al. 1996a, 1996b; López-Barajas et al. 1998). However, while
carbonated wines rated higher in foam stability overall, it should be noted that one carbonated wine,
which also contained significantly higher concentrations of TLPs, gave a foam stability measurement
of 32.9 sec. If this wine is deemed to be an outlier and is excluded from the carbonated wine dataset,
the average foam stability time for the remaining carbonated wines becomes 8.7 sec. This is still higher
than for transfer wines, and possibly reflects the elevated free amino acid concentrations of carbonated
wines. Correlation analysis revealed significant correlations for foam stability against proteins (r =
0.393), TA (r = 0.369), alcohol (r = –0.308) and the three amino acids, histidine (r = 0.443), arginine
(r = 0.325) and tyrosine (r = 0.332), but not fatty acids or their ethyl esters. Free fatty acids C8, C10,
and C12 and the ethyl esters of octanoic, decanoic and dodecanoic acids have previously been shown
to have no influence on the stability time of foam (Gallart et al. 2002). This observation was supported
by our findings which found no relationship between hexanoic, octanoic and decanoic acids and their
corresponding fatty acids to foam stability. Other studies suggest ethanol content may have a bigger
impact than lipids for higher alcohol wines (Dussaud et al. 1994).
Price, bottle weight and quality ratings of sparkling wines
The price, bottle weight and quality ratings of sparkling wines, by method of production, are provided
in Table 10. Bottle prices ranged from $7 to $90, with mean prices increasing according to production
method, i.e. from $10 per bottle for carbonation, to $15, $23 and $43 per bottle for Charmat, transfer
and Méthode Traditionelle, respectively. Bottle weights for Méthode Traditionelle wines were

47
significantly higher (P<0.05) than for the other production methods, followed by transfer, Charmat and
carbonated wines. This is likely due to the levels of dissolved carbon dioxide in sparkling wine being
influenced by production method; i.e. bottle fermentation typically generates 5–7 atmospheres of
pressure, compared to 3–4 for carbonated wines. Thus, wines with higher bottle pressures require
sturdier bottles (i.e. thicker glass) which consequently increases bottle weight. However, a previous
study reported an association between bottle weight and wine quality, which provides an extrinsic cue
for estimating price and quality (Piqueras-Fiszman and Spence 2012). In the current study, both price
and bottle weight were positively correlated with quality ratings; with sparkling wines produced via
traditional methods being awarded higher quality scores, packaged in heavier bottles and commanding
higher prices.
Table 12. Correlation coefficients for sparkling wine quality ratings against price, bottle weight,
foaming properties and compositional parameters.
Values in bold are significantly different from 0 (α=0.05).
Reprinted from Culbert et al. 2017b. Copyright 2017 American Chemical Society.
The average quality ratings for Méthode Traditionelle wines (15.8/20) were significantly higher than
those for transfer, Charmat and carbonated wines, being 15.0, 14.7 and 14.6/20 respectively (Table
10). Correlation analysis was performed on price, bottle weight, compositional parameters and
Parameter Coefficient (r) P value
price 0.715 < 0.0001
bottle weight 0.534 < 0.0001
pH -0.166 0.249
TA 0.177 0.220
residual sugar -0.441 0.001
alcohol 0.479 < 0.001
total phenolics -0.279 0.050
total free amino acids -0.020 0.891
aspartic acid 0.346 0.014
proteins 0.466 0.001
total polysaccharides -0.046 0.751
RG-I/RG-II (10 kDa) -0.396 0.004
max foam volume (Vf) -0.005 0.971
foam stability (Lf) 0.166 0.255
hexanoic acid -0.176 0.225
octanoic acid -0.547 < 0.0001
decanoic acid -0.425 0.002
ethyl hexanoate 0.132 0.367
ethyl octanoate -0.538 < 0.0001
ethyl decanoate -0.353 0.013

48
foaming properties in order to identify any correlations, either positive or negative, with quality ratings
(Table 12). The strongest positive correlations with quality were for price and bottle weight (r = 0.715
and 0.534, respectively), but positive correlations were also observed for alcohol (r = 0.479), aspartic
acid (r = 0.346) and proteins (r = 0.466). The strongest negative correlations with quality were for
octanoic acid and its corresponding ethyl ester (r = –0.547 and –0.538, respectively). Negative
correlations with quality were also observed for residual sugar (r = –0.441), total phenolics
(r = –0.279), low molecular weight RG’s (r = –0.396), decanoic acid (r = –0.425) and ethyl decanoate
(r = –0.353).
MT01
MT02
MT03
MT04
MT05
MT06
MT08
MT09
MT10
MT12
MT13MT14
MT15
MT16
MT17
MT18
MT19
MT20
Tr01
Tr02
Tr03
Tr04
Tr05
Tr06
Tr07
Tr08
Tr09Tr10
Ch01
Ch02
Ch03
Ch04Ch05
Ch06
Ch07Ch08
Ch09
Ch10
Ca01
Ca02
Ca03
Ca04
Ca05
Ca06
Ca07
Ca08
Ca09
Ca10
MT11
PriceBottle weight
pH
TA
Residual sugarAlcohol
Phenolics
Total amino acidsProteins
Total polysaccharides
MannoproteinsAGP
50 kDa polysaccharides20 kDa polysaccharides
10 kDa polysaccharides
Vf
Lf
Hexanoic acid
Decanoic acid
Octanoic acid
Ethyl hexanoate
Ethyl decanoate
Ethyl octanoate
Quality
PC2 18 %
PC1 31 %
Figure 12. PCA biplot of price, bottle weight, composition, foaming behaviour and quality ratings for
fifty Australian sparkling white wines. Ca = carbonated wines, Ch = Charmat wines, Tr = transfer
wines, MT = Méthode Traditionelle wines. Reprinted from Culbert et al. 2017b. Copyright 2017
American Chemical Society.
Principal component analysis (PCA) was performed on the price, bottle weight, compositional
parameters, foaming properties and quality ratings of each of the fifty sparkling wines, to determine
the extent to which different chemical and physical parameters influenced quality and how samples
clustered based on these attributes. The first and second principal components explained 31% and 18%
of variation, respectively (Figure 3). In agreement with correlation analysis, quality was found to be

49
closely associated with alcohol content, price and bottle weight, and to a lesser extent protein and AGP
levels. These attributes were found on the left of the PCA biplot and were mainly accounted for by
PC1. Wines were clearly positioned on the PCA biplot according to production method; with Méthode
Traditionelle wines located in the two left quadrants and, with the exception of two Charmat wines
(Ch08 and Ch09), Charmat and carbonated wines located in the two right quadrants. The majority
(n=6) of transfer wines were located amongst the Méthode Traditionelle wines in the left quadrants,
with the remaining four transfer wines (Tr01, Tr02, Tr04 and Tr08) located just right of the y-axis.
PC2 tended to separate wines of the same production method and was mainly driven by differences in
polysaccharide profiles (Figure 12).
Results from this study have demonstrated that production method plays a key role in the chemical
composition, foaming properties and quality of Australian sparkling white wines. Similarities were
observed in the composition of Méthode Traditionelle and transfer wines, as well as in Charmat and
carbonated wines. Méthode Traditionelle wines had elevated concentrations of protein and high
molecular weight polysaccharides, and were considered to be of superior quality. These wines
therefore commanded higher retail prices, which mitigate the increased costs associated with more
involved production processes; i.e. hand-harvesting, whole-bunch pressing of cool climate fruit, bottle
fermentation and/or lees aging. In contrast, carbonated wines tended to contain higher levels of fatty
acids and phenolics, and were considered to be of comparatively lower quality. Collectively, these
findings enable industry to better understand the impact of decisions made throughout production on
both sparkling wine style and quality. Compositional variations observed between wines made from
the same production method could form the basis of future studies, together with a more detailed
investigation into the compositional parameters driving sparkling wine foaming properties.
A manuscript based on this study has been published in the Journal of Agricultural and Food
Chemistry: Culbert, J.A., McRae, J., Condé, B.C., Schmidtke, L., Nicholson, E., Smith, P.A., Howell,
K.S., Boss, P.K. and Wilkinson, K.L. (2017) Influence of production method on the chemical
composition, foaming properties and quality of Australian carbonated and sparkling white wines.
Journal of Agricultural and Food Chemistry 65, 1353–1364.

50
Supplementary Table 4. Amino acid concentrations (mg/L) in Australian carbonated and sparkling white wines, by production method.
Méthode
Traditionelle
(n=20)
transfer
(n=10)
Charmat
(n=10)
carbonated
(n=10)
min max meana min max meana min max meana min max meana
aspartic acid 13.8 62.5 39.1 27.5 52.1 39.2 15.0 36.9 28.0 15.0 66.4 37.9
asparagine 11.8 45.0 30.0 16.0 54.3 33.1 15.2 41.5 30.1 13.8 39.7 30.1
Serine 3.2 37.7 16.7 6.8 36.1 17.4 4.7 24.4 14.3 6.1 38.9 21.5
glutamic acid 12.4 66.7 42.0 22.9 69.9 47.2 28.2 65.6 46.8 19.0 100.1 55.8
histadine 3.3 18.1 10.7 b 5.5 12.4 9.6 b 3.5 16.8 9.6 b 3.4 41.2 17.6 a
glycine 4.5 15.0 9.6 6.7 13.9 9.3 7.6 14.8 9.7 3.4 14.3 8.8
arginine 20.1 277.1 131.2 31.9 236.8 114.0 40.9 469.5 198.8 18.5 646.8 232.6
threonine 6.3 30.2 17.9 8.7 42.3 20.9 8.9 23.9 16.2 7.6 36.6 22.4
alanine 17.5 172.0 85.9 43.1 152.4 92.9 48.1 135.7 97.2 42.8 189.3 115.2
proline 259.3 620.9 405.6 b 227.3 520.5 389.9 b 285.2 568.8 381.4 b 271.6 883.8 556.7 a
tyrosine 3.1 30.2 17.5 9.4 23.3 16.6 12.3 24.3 18.1 0.0 35.2 19.5
Valine 3.8 26.3 12.9 10.0 20.9 14.9 8.0 17.8 12.5 4.6 30.1 16.8
Lysine 32.6 133.6 75.7 39.0 106.0 69.1 19.9 114.4 64.8 14.7 166.9 77.3
Isoleucine 0.0 10.8 3.3 1.2 6.6 3.8 0.0 8.4 2.4 0.0 15.0 5.6
Leucine 11.9 52.5 30.0 24.0 42.4 31.3 12.8 43.4 26.4 9.1 57.9 34.2
phenylalanine 8.3 32.8 21.2 18.1 28.6 22.1 11.0 27.3 19.4 6.5 33.3 22.4 aValues are means of two wine replicates per wine per production method. Values followed by different letters within rows are significantly different (p =
0.05, one way ANOVA, Tukey’s LSD post hoc). Reprinted from Culbert et al. 2017b. Copyright 2017 American Chemical Society.

51
Part C: Objective measures of the style and quality of Australian Moscato.
Sensory profiles and consumer acceptance of different styles of Australian Moscato.
Composition, price and quality of Moscato wines
Twenty four Australian Moscato wines, comprising both sparkling and semi-sparkling, and white
(n=10) and pink (n=14) wine styles, were sourced commercially or from industry. Wines were selected
with input from an industry reference group and comprised wines that reflected a range of price points
($8 to $30 per bottle), Australian wine regions, and brands prominent in the domestic market (i.e. high
volume sellers). Compositional and sensory analyses were performed to: (i) characterise the chemical,
sensory and quality diversity amongst the different Moscato wines; and (ii) identify a subset of wines
representative of that diversity, for use in consumer acceptance trials.
The composition, price and quality ratings of individual Moscato wines are reported in Table 13.
Collectively, wines were characterised by low pH (2.8 to 3.3), high acidity (TA ranged from 7.5 to
10.4 g/L), high residual sugar content (56.5 to 114.8 g/L) and low alcohol content (4.6 to 10.0% v/v),
which are typical of Moscato; with statistically significant differences observed amongst wines. As
expected, there was a large negative correlation between alcohol and residual sugar content (R = –0.70,
P < 0.001), which likely reflects the early arrest of secondary fermentation. Certainly those wines with
the highest residual sugar content, being M03, M12 and M22 (with ≥ 110 g/L), had some of the lowest
alcohol levels (i.e. 4.6 to 6.4% v/v). However, in some instances, for example M05, M11 and M21,
higher residual sugar and alcohol levels might reflect sugar adjustment (for example via the addition of
juice or juice concentrate). High levels of acidity are important for sweet wines, to achieve balance and
avoid a cloying sensation (Iland et al. 2009), and so the high TA levels observed were also anticipated;
but TA and residual sugar were not strongly correlated (R = 0.40, P = 0.055). Phenolic substances
ranged considerably, from 0.9 au for M03 to 9.2 au for M17. The phenolic content of sparkling white
wines can indicate quality, with higher quality Méthode Traditionelle wines tending to have lower
phenolic content (due to hand-picking, whole-bunch pressing and fermentation of lighter press
fractions), relative to sparkling wines made via the Charmat method or carbonation (Culbert et al.
2017). In the current study, there was only a weak (negative) correlation between phenolic substances
and quality ratings (R = –0.38, P = 0.064), suggesting any negative impacts of high phenolic content
were masked by the high residual sugar content.
The colour of Moscato wines was broadly classified as white or pink based on visual assessments, but
CIELAB measurements were performed to enable more detailed comparisons of wine colour (Supp.

52
Table 13. Vintage, region, price, closure type, composition and quality ratings of Moscato wines.
Wine
code Vintage Region
Pricea
(AUD)
Closure
type pH
TA
(g/L)
Residual
sugar
(g/L)
Alcohol
(% v/v)
Total
phenolics
(au)
Quality
ratingsb
(/20)
M01c NV SA 10 cork 3.1 abc 8.9 def 56.5 k 8.8 c 6.0 c 14.4 ab
M02 2013 SA 21 screw cap 3.1 abc 9.3 cde 71.5 hij 8.7 cd 8.9 a 15.2 ab
M03c 2014 NSW 30 screw cap 3.2 ab 8.8 efg 114.8 a 6.4 k 7.0 b 14.3 ab
M04 NV SA 9 cork 3.0 abc 8.7 fg 78.8 efghi 5.8 m 3.5 gh 14.5 ab
M05c NV Vic 16 cork 3.2 ab 7.8 jkl 92.4 bcd 6.4 k 2.7 ij 15.5 ab
M06 NV Vic 16 cork 3.3 a 7.7 kl 76.9 fghi 7.2 i 4.7 e 15.2 ab
M07 NV Vic 16 cork 3.1 abc 8.3 ghi 89.1 bcde 6.5 jk 2.1 j 15.7 a
M08 NV Vic 16 cork 3.2 ab 7.6 l 82.5 defgh 7.6 g 5.7 cd 15.0 ab
M09 2013 SA 16 screw cap 3.1 abc 9.4 c 73.8ghij 7.8 g 3.9 fg 16.3 a
M10 2013 SA 16 screw cap 3.1 abc 8.8 fg 74.1 fghij 8.0 f 6.1 c 14.9 ab
M11 2014 Vic 22 screw cap 3.1 abc 9.7 bc 93.8 bcd 6.2 l 7.0 b 13.3 b
M12 2014 Vic 20 crown seal 2.8 c 9.9 ab 113.8 a 5.3 n 4.2 ef 14.9 ab
M13 NV SA 8 cork 3.3 ab 7.5 l 74.9 fghij 8.5 de 0.9 k 15.4 ab
M14 NV SA 8 cork 3.2 abc 7.5 l 76.6 fghi 8.5 e 2.7 ij 15.4 ab
M15c 2013 SE Australia 10 screw cap 3.2 ab 8.1 hijk 70.5 hij 8.5 e 3.1 hi 14.7 ab
M16 NV SE Australia 9 cork 3.1 abc 8.8 def 69.9 ij 9.3 b 3.7 fgh 14.7 ab
M17 2014 WA 19 screw cap 3.3 a 8.2 hij 98.4 b 7.4 h 9.2 a 14.9 ab
M18 2013 SA 25 crown seal 3.1 abc 7.9 ijkl 85.9 cdef 8.4 e 3.6 fgh 15.5 ab
M19 2014 SA, Vic 20 crown seal 3.1 abc 8.5 fgh 72.1 hij 8.4 e 6.1 c 14.6 ab
M20c 2014 Vic 21 crown seal 3.1 abc 9.3 cd 97.5 bc 6.6 j 9.2 a 14.9 ab
M21 2013 SA 18 screw cap 3.1 abc 8.3 hij 85.4 defg 10.0 a 3.4 gh 14.8 ab
M22 2014 SA 18 crown seal 2.9 bc 10.4a 113.2 a 4.6 o 7.0 b 15.2 ab
M23 2013 SE Australia 11 cork 2.9 bc 8.9 def 76.3 fghij 7.7 g 5.3 d 15.6 a
M24c NV SE Australia 15 cork 3.0 abc 8.2 hij 64.3 jk 7.3 hi 1.4 k 15.3 ab
TA measured as g/L of tartaric acid. Values are the means of three replicates, with the exception of price and quality ratings.
Means within a column followed by different letters are significantly different (P = 0.05, one-way ANOVA). a Prices are for 750 mL bottles, with the exception of M17 (375 mL) and M22 (500 mL). b Quality ratings determined by an expert panel (n=9) using a 20 point scoring system. c Wines selected for consumer acceptance testing.

53
Table 5). Principal component analysis (PCA) of the CIELAB colour coordinates L*, a* and b*, gave
the biplot shown in Figure 13. The 10 white Moscato wines (M04, M05, M07, M09, M13, M15, M16,
M18, M21 and M24) were closely clustered near the x-axis on the right side of the biplot indicating the
similarity amongst their colours, whereas the remaining 14 wines were distributed predominantly
across the left-hand quadrants, reflecting their greater colour diversity (i.e. from orange to pink to light
red). M11 was the only pink Moscato located on the right side of the biplot, which was attributed to its
distinct pale orange colour. The first principal component explained 91.8% of the observed variation in
wine colour, with separation of white Moscato wines based on lightness (i.e. L* > 98) and the absence
of pink hues. Separation of pink Moscato wines was based on both reduced lightness (i.e. L* of
between 87.1 and 95.4) and the intensity of red (a*) and yellow (b*) hues (Supp. Table 5), and
accounted for a further 7.7% of the variation observed.
Figure 13. PCA biplot of CIELAB colour coordinates for Moscato wines. Reproduced from Culbert et
al. 2018. Copyright 2018 Australian Society of Viticulture and Oenology Inc.
Bottle price and quality ratings ranged from $8 to $30 and 13.3 to 16.3, respectively (Table 13). Wine
quality was determined by an expert panel of sparkling winemakers, who indicated they rated wines
according to the intensity of varietal aroma and flavour attributes; the balance between sweetness and
acidity; the palate structure (texture) and viscosity (weight); and in the case of older, more developed
wines, ‘prominence of an attractive honey note’ and ‘retention of freshness and vibrancy’. Whereas a
recent study found the quality of sparkling white wine closely reflected the method of production

54
(carbonation, Charmat, transfer or Méthode Traditionelle), and therefore bottle price (Culbert et al.
2017a), in this study, there was no correlation between price and wine quality (R = –0.21, P = 0.325).
Indeed, the most expensive Moscato, M03, received the second lowest quality rating (i.e. 14.3), while
the two least expensive Moscatos, M13 and M14, were both rated 15.4, putting them amongst the 7
most highly rated wines. However, only quality ratings for M07, M09 and M23 were found to be
statistically significant from M11.
The carbon dioxide content of wines wasn’t directly measured, but effervescence (bubble size and
flow) was evaluated by DA (described below). Closure type was considered likely to reflect the degree
of carbonation, with screw-cap closures being suitable for semi-sparkling (lightly carbonated) wines,
but cork or crown seal required for more highly carbonated wines, i.e. to account for increased bottle
pressure. Carbonation did not appear to influence wine quality, with the wines considered to be of
highest and lowest quality, i.e. M09 and M11 respectively, both sealed under screw-cap (suggesting
both were semi-sparkling wines).
Sensory profiles of Moscato wines
The sensory profiles of Moscato wines were determined by DA, with the intensity of 27 aroma and/or
flavour attributes being rated, together with viscosity/body, bitterness, sweetness, acidity and
effervescence (Table 14). Significant differences were observed for 24 of these attributes, which were
then subjected to PCA. The initial PCA biplot showed two Moscato wines, M12 and M21, as clear
outliers, i.e. these wines were positioned well away from both each other, and the remaining 22 wines
(data not shown); with M12 exhibiting prominent dried fruit characters, while M21 exhibited intense
oak, kerosene and aged characters. These wines did not exhibit the varietal expression typically
expected of Moscato and so the decision was made to omit these wines from both the PCA of sensory
data and the subsequent I-optimal prime statistical analysis (which would likely have resulted in
selection of both these wines for consumer acceptance testing). PCA was performed on sensory data
for the remaining 22 wines which gave the biplot shown in Figure 14. The first principal component
explained 35% of variation and separated wines based on the prominence of fruity, floral and
confectionary notes (i.e. stone fruit, tropical, apple/pear, floral/perfume, honey and confectionary
aromas and flavours) vs. complex characters (i.e. oaky/woody, yeasty/bready and kerosene/aged
characters). Three Moscatos, M10, M11 and M15, still exhibited a high degree of complexity and as
such, they were clustered together on the left side of the biplot; with another 3 wines, M01, M20 and
M23 also showing complexity, but to a lesser extent. In contrast, six Moscatos, M03, M05, M06, M07,
M09, M18, were positioned on the right side of the biplot, driven by intense fruity, floral and
confectionary aromas and flavours. The remaining wines were positioned around the origin, indicative
of sensory profiles that comprised a combination of both varietal and developed characters. The second

55
Table 14. Sensory attributes and reference standards used for descriptive analysis of Moscato wines.
Attribute Definitions Reference standarda
Intensity Perceived intensity of overall aroma or flavour Not applicable
Confectionary Turkish delight, bubble gum, musk, sherbet,
strawberries and cream
3.5 g lollies (half each of yellow, green and red ‘snakes’, cut in pieces) and
turkish delight (¼ of a Cadbury’s square)
Red fruit Strawberry, raspberry Half a strawberry and a raspberry
Stone fruitb Apricot, nectarine, peach, white peach 8.3 g dried peach and apricot mixture, 4.2 g fresh nectarine, 3.8 g fresh peach and
3.0 g fresh apricot
Tropical Pineapple, melon, lychee, banana, passionfruit 5.8 g rock melon (pulp and seeds), 2.3 g lychee, 1 mL lychee juice, 5.6 g
pineapple, 1 mL pineapple juice and 3.0 g passionfruit
Citrusb Lemon, grapefruit, lime, orange, mandarin 4.5 g grapefruit, 3.0 g lemon, 2.0 g lime and 3.0 g orange
Apple/pearb Apple, pear 6.0 g apple and 6.0 g pear
Floral/perfume Rose, perfume, blossom, honeysuckle ½ tablespoon of rose water, two jasmine flower petals, two rose flower petals and
0.3 g rose flower stamen
Dried fruit Dried fruit Dried peach and apricot mixture 8.3 g and raisins 3.0 g
Honey Honey 1.35 g honey
Green Green, grassy, herbal Mixture of grass clippings, parsley, tomato leaf and basil (0.2 g of each)
Yeasty/bready Dough 0.1 g dried yeast
Kerosene/aged Nutty, kerosene, developed Aged sparkling white wine with an apparent kerosene note
Oaky/woody Oaky, woody 2 untoasted oak chips
Viscosity/body Overall perception of palate weight Not applicable
Bitterness Perception of bitterness Not applicable
Sweetness Perception of sweetness Not applicable
Acidity Level of acid perceived Not applicable
Effervescence Overall perception of bubble size and flow Not applicable a Standards prepared in 20 mL of neutral dry white wine (except for the kerosene/aged standard). b All components were used, i.e. pulp and peel.

56
principal component explained an additional 19% of variation and may have be driven more by
taste and palate attributes, such as viscosity/body, bitterness, sweetness, acidity and effervescence.
When intensity ratings for effervescence were considered by closure type, wines under cork had the
highest effervescence ratings (being 8.1 to 9.6), followed by wines under crown seal (4.8 to 7.8),
while wines under screw cap had the lowest effervescence ratings (2.5 to 5.3), suggesting they were
only lightly carbonated, semi-sparkling wines. The Moscato wines under cork (i.e. M01, M04–
M08, M13, M14, M16, M23 and M24) were all positioned in the lower half of the PCA biplot,
suggesting effervescence may have influenced separation within the second dimension (Figure 14).
A further 12% of variation was explained by the third principal component (data not shown), with
variation in this dimension attributed to overall aroma intensity.
M02
M01
M03
M05
M06M07
M08
M04
M09
M10M11
M13
M14
M15
M16
M17
M20
M18
M19
M22
M23
M24
Intensity A
Confectionary A
Stone Fruit ATropical A
Apple/Pear A/P
Floral/Perfume A
Dried Fruit A
Honey A
Yeasty/bready A
Kerosene/aged A
Oaky/woody A
Intensity PConfectionary P
Stone Fruit PTropical P
Honey P
Kerosene/aged P
Oaky/woody P
Viscosity/body
Bitterness
Sweetness
Acidity
-1.6
-1.6 1.4
PC2 18%
PC1 36%
Figure 14. PCA biplot of selected sensory attribute ratings for Moscato wines (excluding M12 and
M21); A = aroma attribute and P = palate attribute. Reproduced from Culbert et al. 2018. Copyright
2018 Australian Society of Viticulture and Oenology Inc.
When wine quality was taken into account, wines with higher quality ratings (i.e. ratings ≥15.0/20)
tended to be positioned in quadrants on the right of the biplot; with the exception of M03 and M17,
which were given ratings of 14.3 and 14.9 respectively. Conversely, the majority of wines located
in quadrants on the left (8 of 11) were rated <15.0/20. Interestingly, the wines given the highest

57
quality ratings, i.e. M05, M07, M09, M13, M14, M18 and M23 (being ≥15.4/20), were not
clustered especially close together. Most were associated with varietal aromas and flavours, but
M23 instead exhibited moderate complexity, suggesting the expert panel valued an array of sensory
properties. PLSR analysis of DA data against mean quality ratings indicated aroma intensity,
confectionary, tropical fruit, apple/pear and floral/perfume aromas and apple/pear flavour were
positively correlated with Moscato quality, while stone fruit aroma and viscosity/body negatively
influenced quality (Figure 15).
Figure 15. PLSR coefficients for selected sensory attributes and chemical parameters vs. mean
quality ratings of Moscato wines; A = aroma attribute and P = palate attribute. Reproduced from
Culbert et al. 2018. Copyright 2018 Australian Society of Viticulture and Oenology Inc.
Correlation analysis confirmed several relationships between chemical measurements and the
intensity of taste and/or palate attributes. As expected, sweetness was positively correlated with
residual sugar (R = 0.53, P = 0.002) and negatively correlated with alcohol (R = –0.56, P = 0.004);
acidity was positively correlated with TA (R = 0.76, P = 0.0001) and negatively correlated with pH
(R = –0.73, P < 0.0001); and bitterness was positively correlated with alcohol (R = 0.93, P <
0.0001) and negatively correlated with residual sugar (R = –0.72, P < 0.0001). Viscosity/body was
positively correlated with residual sugar (R = 0.53, P = 0.0008), but negatively correlated with
alcohol content (R = –0.44, P = 0.032), which further supported the large negative correlation
observed between alcohol and residual sugar content.
Consumer acceptance of different styles of Moscato
Statistical analysis (I-optimal prime) was performed on sensory data to identify a subset of Moscato
wines, representative of the sensory diversity observed for all wines, for evaluation by consumers in

58
acceptance tests. M01, M03, M05, M10, M19 and M20 were initially selected, but since 5 of these
were pink Moscatos, the decision was made to substitute M10 and M19 with M15 and M24
respectively, to give 3 white and 3 pink Moscato wines. The final subset of six wines (highlighted
in bold in Figure 14) ranged in price from $10 to $30, and displayed the intended variation in
composition, sensory profiles and quality (Table 13, Figure 14). pH ranged from 3.0 to 3.2, TA
from 7.8 to 9.3 g/L, residual sugar from 56.5 to 114.8 g/L, alcohol content from 6.4 to 8.8% v/v and
phenolic substances from 1.4 to 9.2 au. Quality ratings varied from 14.3 to 15.5, but as indicated
above, were not significantly different. Importantly, quality ratings also varied, from 14.3 to 15.5.
Key sensory differences observed between the subset of Moscatos included both varietal
(confectionary, apple/pear, floral/perfume, stonefruit and tropical) and developed (oaky/woody,
honey, kerosene/aged) characters, as well as viscosity/body, bitterness, sweetness and
effervescence.
One hundred and forty consumers were recruited to participate in acceptance tests (Table 15), with
a considerably higher proportion of females being recruited than males (68% vs 32%). This was not
entirely surprising given the perception that sparkling wine is a ‘female drink’ (Charters et al. 2011)
and the self-selecting nature of recruitment, and was consistent with the gender bias (in favour of
female participants) experienced in several other recent sparkling wine-related studies involving
consumer trials (Culbert et al. 2016, 2017, Verdonk et al. 2017). A higher proportion of younger
consumers (aged 18 to 34 years) was also recruited, being 40% compared to 31.4% and 25.7%, for
35-54 year olds and ≥55 year olds, respectively. Almost 56% of consumers held tertiary
qualifications and just over one third had household incomes >$100,000 per annum. Most
consumers (almost 70%) consumed sparkling wine at least once every 1–2 months. Significant
differences were observed between the liking scores given to the subset of Moscato wines, which
ranged from 4.7 to 5.6 (Table 16). On average, the fruit driven Moscato, M05, was liked the most,
followed closely by M24, while M01, the wine that exhibited the most acidity and bitterness, was
liked least; albeit only the liking scores for M01 and M05 were significantly different. The extent to
which factors such as gender, age, frequency of sparkling wine consumption and wine involvement
might influence consumer wine preferences was also considered, but surprisingly, no statistically
significant differences in liking scores were not observed when consumers were segmented by
demographic factors (Supp. Table 6).

59
Table 15. Demographics, consumption and involvement of consumers and hedonic clusters.
Values represent percentage of consumers. a Data missing for 4 consumers (2 in each cluster). b Involvement determined using the wine involvement scale (Bruwer and Huang, 2012), with low
< 4.0/7 and high ≥ 4.0/7.
Recognising the inherent diversity typically observed amongst consumers, segmentation was
performed based on consumers’ individual liking scores, and two distinct clusters comprising
consumers with opposing preferences for the subset of Moscato wines were identified (Tables 15
and 16). Cluster 1 comprised 69 consumers, who liked M03, M05 and M20 equally, but disliked
M01; whereas Cluster 2, which comprised 71 consumers, most liked M01 and M24, i.e. the wines
liked least by Cluster 1. Demographic data indicated Cluster 1 comprised higher proportions of
younger, female and less educated consumers than Cluster 2. The majority of consumers from
Cluster 2 held tertiary qualifications and were more involved with wine than Cluster 1 consumers.
Total samplea
(n=140)
Cluster 1a
(n=69)
Cluster 2a
(n=71)
Gender
Male 32.1 26.1 38.0
Female 67.9 73.9 62.0
Age (years)a
18-34 40.0 43.5 36.6
35-54 31.4 27.5 35.2
55+ 25.7 26.1 25.4
Education
High school/certificate/diploma 44.3 53.6 35.2
Bachelor’s degree 41.4 34.8 47.9
Postgraduate 14.3 11.6 16.9
Household income (AUD)
<$30,000 7.1 8.7 5.6
$30,001-$50,000 13.6 13.0 14.1
$50,001-$75,000 21.4 24.6 18.3
$75,001-$100,000 20.7 20.3 21.1
$100,001-$200,000 31.4 29.0 33.8
>$200,000 5.7 4.3 7.0
Sparkling wine consumption
Once a fortnight or more 25.0 23.2 26.8
Once every 1-2 months 44.3 43.5 45.1
< Once every 2 months 30.7 33.3 28.2
Wine involvementb
Low (<4.0) 45.0 47.8 42.3
High (≥4.0) 55.0 52.2 57.7

60
Table 16. Consumer liking scores for subset of Moscato wines.
Hedonic ratingsa
Total sample
(n=140)
Cluster 1
(n=69)
Cluster 2
(n=71)
M01 4.7 b 4.3 d 5.0 ab
M03 5.1 ab 6.5 a 3.8 c
M05 5.6 a 6.5 a 4.7 bc
M15 4.9 ab 5.4 bc 4.4 bc
M20 5.0 ab 6.4 ab 3.7 c
M24 5.5 ab 5.0 cd 6.0 a
Means within a column followed by different letters are significantly different (P = 0.05, one-way
ANOVA). a Hedonic ratings determined using a 9 cm line scale, with anchors from left (dislike extremely) to
right (like extremely).
Cluster 2 consumers did not find fruity, confectionary characters or sweetness particularly
appealing, but instead preferred more acidic, less sweet Moscato wine styles, i.e. M01 (Table 13).
This is further supported by the comparatively lower liking scores given to the Moscatos with the
highest residual sugar content and perceived sweetness, i.e. M03 and M20. Cluster 1 consumers
liked most of the subset of Moscato wines, but did not find the complexity of M01 to their liking.
PCA was also performed on a combination of sensory data, liking scores (by consumer cluster) and
quality ratings for the Moscato wine subset, to determine the extent to which different sensory
attributes influenced consumer wine preferences (Figure 16). The first and second principal
components explained 44% and 37% of variation observed respectively, and the opposing stylistic
preferences of each cluster were clearly evident: Cluster 1 was positioned in the top right quadrant
in close proximity to M03, the wine with the most prominent fruit, honey and confectionary
characters and marked sweetness and viscosity/body; whereas Cluster 2 was positioned near the y-
axis at the bottom of the biplot, in proximity to M01 and M24, i.e. the wines which exhibited
greater acidity, varietal aromas and less apparent sweetness.
Considerable diversity was observed amongst the composition and sensory profiles of the Moscato
wines studied, with some exhibiting more prominent varietal characters, while others displayed
complex, developed notes. Mean hedonic ratings for the subset of Moscato wines ranged from 4.7
to 5.6, but segmentation of consumers according to their individual liking scores enabled

61
Figure 16. PCA biplot of sensory attribute ratings, liking scores (for consumer clusters) and quality
ratings for subset of Moscato wines; A = aroma attribute and P = palate attribute. Reproduced from
Culbert et al. 2018. Copyright 2018 Australian Society of Viticulture and Oenology Inc.
identification of two consumer clusters with opposing preferences for the different styles of
Moscato. While purchasing decisions are likely to be influenced by an array of competing factors,
including extrinsic factors such as price, brand and occasion, insight into the sensory attributes
driving consumer preferences for different styles of Moscato will enable industry to tailor wine
styles and marketing strategies to specific segments of the target market. While results from this
study did not identify preferences based on gender, age or wine involvement, anecdotal evidence
and published research alike, suggests gender and/or generational based differences in the
consumption patterns and/or perceptions of sparkling wine (and Champagne). Similar perceptions
of Moscato seem likely. Ongoing research efforts therefore aim to determine consumer perceptions
of Moscato, relative to other sparkling wine styles, in order to further characterise the domestic
Moscato consumer market.

62
A manuscript based on this study has been accepted for publication in the Australian Journal of
Grape and Wine Research: Culbert, J.A., Ristic, R., Ovington, L.A. Saliba, A.J. and Wilkinson,
K.L. (2018) Sensory profiles and consumer acceptance of different styles of Australian Moscato.
Australian Journal of Grape and Wine Research (in press).

63
Supplementary Table 5. CIELAB colour coordinates (L*, a* and b*) for Moscato wines.
L* a* b*
M01a 91.7 8.5 9.1
M02 91.9 10.1 9.1
M03a 94.4 4.8 10.1
M04 98.9 -0.5 4.0
M05a 98.4 -0.8 6.0
M06 88.8 11.5 9.3
M07 99.2 -0.7 4.5
M08 89.0 10.0 9.1
M09 98.6 -0.8 4.3
M10 87.1 16.1 13.4
M11 95.4 5.3 4.8
M12 91.9 9.9 7.2
M13 99.5 -0.5 3.4
M14 91.7 12.3 5.4
M15a 98.9 -1.0 5.4
M16 98.3 -0.4 4.1
M17 88.4 13.3 10.5
M18 98.6 -0.7 4.5
M19 89.7 11.4 8.4
M20a 90.7 10.6 9.8
M21 98.7 -0.9 5.3
M22 90.5 13.5 6.8
M23 94.7 5.8 7.9
M24a 98.6 -0.7 4.7 a Wines selected for consumer acceptance testing

64
Supplementary Table 6. Liking scores for the subset of Moscato wines for consumers segmented
according to gender, age, frequency of sparkling wine consumption and wine involvement.
Hedonic ratingsa
M01 M03 M05 M15 M20 M24
Gender
Male (n=45) 5.0 5.0 5.8 4.4 4.9 5.7
Female (n=95) 4.5 5.2 5.5 5.1 5.1 5.4
Ageb (years)
18-34 (n=56) 4.1 5.2 5.8 4.8 5.0 5.2
35-54 (n=44) 5.1 5.3 5.9 5.1 4.9 5.8
55+ (n=36) 5.2 4.5 4.8 4.8 5.2 5.4
Sparkling wine consumption
Low (n=35) 5.1 4.7 6.1 5.0 5.2 5.3
Medium (n=62) 4.5 5.2 5.5 5.2 5.1 5.7
High (n=43) 4.6 5.3 5.4 4.4 4.8 5.4
Wine involvementc
Low (n=63) 4.7 5.5 5.8 4.8 4.9 5.4
High (n=77) 4.7 4.8 5.5 5.0 5.2 5.6 a Hedonic ratings determined using a 9 cm line scale, with anchors from left (dislike extremely) to right
(like extremely). b Data from four consumers who did not specify their age is missing. c Involvement determined using the wine involvement scale (Bruwer and Huang, 2012), with low
< 4.0/7 and high ≥ 4.0/7.

65
Part D: Objective measures of sparkling wine style and quality.
A key objective of this project was to develop objective measures by which sparkling wine style and
quality can be determined. As such, correlation analysis was performed in an attempt to determine to
what extent parameters such as price, bottle weight, chemical composition, foaming properties and/or
intensity of sensory attributes influenced the quality ratings of sparkling white wines (Table 17) and
Moscatos (Table 18).
For physical and chemical parameters of sparkling white wines, the highest positive correlations with
quality were for price and bottle weight, being r=0.715 and 0.534, respectively. Other positive
correlations with quality included alcohol content (r=0.479), aspartic acid concentration (r=0.346) and
wine protein (r=0.466). Whereas the highest negative correlation with quality were observed for
octanoic acid and its corresponding ethyl ester, being r=–0.547 and –0.538, respectively. Other
negative correlations with quality included sugar content (r=–0.441), total phenolics (r=–0.279), low
molecular weight (i.e. 10 kDa) RG’s (r=–0.396), decanoic acid (r =–0.425) and ethyl decanoate (r=–
0.353).
Meaningful correlations with quality (both positive and negative) were also observed for the intensity
of many sensory attributes. Expert panellists indicated they rated wine quality according to: the size
and persistence of the bead (bubble); the elegance of palate structure and prominence of complexity
(i.e. presence of developed characters derived from yeast autolysis and ageing); the balance of
sweetness, acidity and phenolics; and the absence of faults or imbalance. This is consistent with the
correlations calculated for the sensory attributes of sparkling white wines. The highest positive
correlations with quality were observed for developed characters such as, mushroom/earthy aroma
(r=0.643), yeasty aroma (r=0.681), toasty aroma (r=0.717), aged/developed aroma (r=0.727),
meaty/savoury flavour (r=0.670), mushroom/earthy flavour (r=0.673), yeasty flavour (r=0.597), toasty
flavour (r=0.666), aged/developed flavour (r=0.747), and palate complexity (r=0.680). In contrast,
many of the fruity, floral and confectionary aromas and/or flavours, together with sweetness, gave
highly negative correlations (i.e. r≤–0.435).
Far fewer meaningful correlations were observed for Moscato wines (Table 2). Indeed, of the
parameters measured, only aroma intensity (r=0.450), confectionary aroma (r=0.585), tropical aroma
(r=0.504), floral/perfume aroma (r=0.522) and apple/pear flavour (r=0.451) were correlated with
quality.

66
Table 17. Correlation coefficients for sparkling white wine quality ratings against price, bottle weight,
foaming parameters, chemical composition and sensory properties.
Parameter Coefficient (r) P Parameter Coefficient (r) P
Price 0.715 <0.0001 Hexanoic acid -0.176 0.225
Bottle weight 0.534 <0.0001 Decanoic acid -0.547 < 0.0001
pH -0.166 0.249 Octanoic acid -0.425 0.002
TA 0.177 0.220 Ethyl hexanoate 0.132 0.367
Sugar -0.441 0.001 Ethyl decanoate -0.538 < 0.0001
Alcohol 0.479 <0.001 Ethyl octanoate -0.353 0.013
Phenolics -0.279 0.050 citrus A -0.518 < 0.001
Total amino acids -0.020 0.891 stone fruit A -0.557 < 0.0001
Asp 0.346 0.014 tropical A -0.478 < 0.001
Asn 0.144 0.320 pome fruit A -0.171 0.236
Ser 0.170 0.239 floral A -0.623 < 0.0001
Glu -0.031 0.829 confectionary A -0.498 < 0.001
His -0.072 0.619 meaty/savoury A 0.651 < 0.0001
Gly 0.239 0.095 mushroom/earthy A 0.643 < 0.0001
Arg -0.038 0.795 honey A 0.116 0.424
Thr 0.110 0.447 yeasty A 0.681 < 0.0001
Ala 0.076 0.599 toasty A 0.717 < 0.0001
Pro -0.107 0.460 vanilla/caramel A 0.435 0.002
Tyr 0.105 0.470 aged/developed A 0.727 < 0.0001
Val 0.074 0.611 citrus P -0.229 0.110
Lys -0.018 0.901 tropical P -0.552 < 0.0001
Ile 0.008 0.954 floral P -0.527 < 0.0001
Leu 0.013 0.927 confectionary P -0.540 < 0.0001
Phe 0.098 0.498 meaty/savoury P 0.670 < 0.0001
Proteins 0.466 0.001 mushroom/earthy P 0.673 < 0.0001
Total polysaccharides -0.046 0.751 honey P -0.125 0.385
Mannoproteins 0.018 0.903 yeasty P 0.597 < 0.0001
AGP 0.186 0.197 toasty P 0.666 < 0.0001
RG 1 0.012 0.933 vanilla/caramel P 0.371 0.008
RG 2 -0.051 0.725 aged/developed P 0.747 < 0.0001
RG 3 -0.396 0.004 sweetness -0.549 < 0.0001
Vf (mL) -0.005 0.971 acidity 0.371 0.008
Lf (s) 0.166 0.255 complexity 0.680 < 0.0001
Values in bold are different from 0 with a significance level α=0.05.
A = aroma attribute; P = palate attributes.

67
Table 18. Correlation coefficients for Moscato quality ratings against composition and sensory
properties.
Parameter Coefficient (r) P Parameter Coefficient (r) P
L* 0.193 0.367 kerosene/aged A -0.134 0.532
a* -0.178 0.406 oaky/woody A -0.144 0.503
b* -0.188 0.379 intensity P 0.238 0.263
% Alcohol 0.099 0.646 confectionary P 0.260 0.220
pH 0.023 0.913 red fruit P 0.039 0.858
TA -0.253 0.234 stone fruit P 0.125 0.561
Phenolics -0.387 0.062 tropical P 0.275 0.193
Sugar -0.145 0.498 citrus P 0.387 0.061
intensity A 0.450 0.027 apple/pear P 0.451 0.027
confectionary A 0.585 0.003 dried fruit P 0.158 0.461
red fruit A 0.149 0.488 honey P 0.195 0.361
stone fruit A 0.329 0.117 green P -0.092 0.669
tropical A 0.504 0.012 yeasty/bready P -0.114 0.595
citrus A 0.399 0.053 kerosene/aged P -0.148 0.489
apple/pear A 0.401 0.052 oaky/woody P -0.146 0.495
floral/perfume A 0.522 0.009 effervescence P 0.352 0.092
dried fruit A 0.218 0.306 viscosity/body P -0.106 0.621
honey A 0.379 0.068 bitterness P 0.045 0.836
green A -0.110 0.609 sweetness P 0.021 0.924
yeasty/bready A -0.195 0.361 acidity P -0.069 0.748
Values in bold are different from 0 with a significance level α=0.05.
A = aroma attribute; P = palate attributes.
Completion of two additional peer-reviewed publications describing the volatile composition of
sparkling white wines and Moscato wines is anticipated following submission of this final report and
correlation analysis of volatile data may identify other wine constituents that influence sparkling wine
quality (either positively or negatively), particularly given the extent to which sensory properties
seemed to be meaningfully correlated with quality scores.

68
Outcomes and Conclusion:
The key objectives of this project were to characterise the relative importance of different segments of
the Australian sparkling wine sector, to gain insight into consumer preferences for different styles of
sparkling wine and their sensory properties, and to develop objective measures by which sparkling
wine style and quality can be determined.
Many of the activities outlined in the original proposal (or approved project variations) were
completed as planned. Market sales data was obtained and used to determine the relative importance of
different segments of the sparkling wine sector; with results published as a paper in an industry
technical journal. Importantly, this data also informed the scope and direction of subsequent chemical
and sensory analyses (i.e. the focus on sparkling white wines in Years 1 and 2, and Moscato in Years 2
and 3, as indicated above).
Chemical and sensory analysis of sparkling wines was largely performed as proposed, albeit a larger
number of wines were analysed by ATR MIR than initially intended: i.e. 139 Australian sparkling
wines, comprising sparkling white (n=50), rosé (n=25), red (n=25), Prosecco (n=14) and Moscato
(n=25) wines. However, this enabled compositional differences between different sparkling wine
segments to be observed, and following principal component analysis (PCA), enabled discrimination
of wines according to both sparkling wine style, and in the case of sparkling white wines, by method of
production (and to a lesser extent, wine quality). Chemical and sensory analyses of a considerably
larger number of sparkling white wines was undertaken, than initially proposed (i.e. n=50). However,
this ensured a diverse range of sparkling white wines, representative of the four key methods of
production, a range of price points, Australian wine regions and brands were analysed. Opportunities
arose to undertake additional compositional analysis of the 50 sparkling white wines, i.e.: protein and
polysaccharide analysis in collaboration with the Australian Wine Research Institute; amino acid
profiling in collaboration with CSIRO; and measurement of foaming properties in collaboration with
The University of Melbourne. Chemical and sensory analysis of Moscato wines was completed as
planned. Collectively, this has culminated in three peer-reviewed papers (Culbert et al. 2015, 2017a,
2017b); with an additional paper currently under review. As indicated above, two additional
manuscripts (describing the volatile composition of sparkling white wines and Moscato wines,
respectively) are anticipated following submission of this final report. As such, the project will have
delivered the research outputs outlined in the original proposal (in terms of the number and nature of
publications), pending successful review and acceptance of manuscripts (but may still yield at least
two additional papers).

69
In terms of practical outcomes for the Australian wine industry, the project’s outcomes have
demonstrated the diversity in not only the sensory profiles of different styles of sparkling white wine
and Moscato, but also the diverse preferences of different segments of sparkling wine consumers.
Expert panel ratings demonstrated sparkling wine quality is closely associated with prominent toasty,
yeasty, aged/developed notes (i.e. attributes associated with yeast autolysis and lees aging typical of
the traditional method of sparkling wine production); whereas carbonated and Charmat sparkling
wines were typically fruit-driven styles and were generally considered to be of lower quality.
Irrespective of quality ratings, each of the sparkling white wines evaluated by consumers during
acceptance tests were considered favourably by at least one of the consumer clusters identified by
segmentation (based on individual liking scores). This highlights the diversity inherent amongst wine
consumers and suggests different marketing strategies might be needed to influence the consumption
behavior and/or purchasing decisions of consumers from different segments of the target market. This
was also evident following acceptance testing of Moscato wines. Although only two consumer clusters
were identified (based on segmentation according to individual liking scores), the two clusters were
found to have opposing preferences for the subset of Moscato wines. Surprisingly, neither study
identified meaningful preferences based on gender, age, frequency of sparkling wine consumption or
wine involvement, despite previous studies suggesting sparkling wine is often considered a ‘female
drink’ and/or symbolic of celebration and prestige to younger consumers (Charters et al. 2011).
Several studies have shown consumers rely on extrinsic cues, country of origin and brand in particular,
when evaluating the perceived quality and value of sparkling wines (Lange et al. 2002, Combris et al.
2006, Vignes and Gergaud 2007, Culbert et al. 2017a). Sparkling wine producers might therefore need
to exploit factors such as geographical origin, occasion and self-worth when marketing sparkling white
wines. In the case of Moscato, and despite the findings of the current study, it seems likely that the
sweet, fruity and refreshing characters typical of this segment of sparkling wine is likely to appeal to
younger and/or female consumers, including the Millennials, because these sensory attributes are both
familiar and approachable (Lesschaeve 2008, Dodd et al 2010). Moscato could therefore be considered
an entry level wine for consumers with limited wine experience; consumers whose wine preferences
will continue to evolve over time, as they gain greater experience, knowledge and involvement with
wine (Dodd et al. 2010). Consumer purchasing decisions will continue to be influenced by extrinsic
factors, so understanding consumers’ attitudes towards different sparkling wine segments, including
any preconceived expectations of particular sparkling wine styles, remains the focus of ongoing
research (being undertaken by PhD candidate, Naomi Verdonk).

70
Recommendations:
A key finding from this project was the extent to which the prominence of developed characters
(derived from yeast autolysis and/or ageing) influenced the quality ratings of sparkling white wines.
Indeed, the expert panel indicated complexity was one of the factors against which they based their
quality evaluations and this was further demonstrated through correlation analysis; i.e. the highest
positive correlations with quality were observed for yeasty, toasty, developed/aged characters.
Traditional sparkling winemaking involves two successive fermentations: primary fermentation
transforms grape must into base wine, while secondary fermentation generates carbon dioxide under
pressure to achieve the ‘bubble’. However, it’s the compositional changes that occur when sparkling
wine is subsequently aged on yeast lees, and their impact on the sensory and foaming properties of
wine, that ultimately determine sparkling wine quality. Whilst there have been extensive studies on
yeast autolysis, particularly concerning the influence of different conditions (e.g. fresh yeast vs. active
dry yeast, temperature, pH, and model wine systems vs. wine) on the autolysis process, some results
are contradictory. Furthermore, the complex nature of sparkling wine has hindered identification of the
key volatile compounds responsible for the aroma and flavour expected of traditional sparkling wines.
The mechanisms responsible for the induction of autolysis and cellular pathways involved during the
degradation of yeast cell walls are also poorly understood. Many of the volatile compounds identified
in traditional sparkling wines to date have been found in table wines, including wines made without
lees ageing. As such, the volatile compounds specifically derived from autolysis of yeast, and their
individual contributions to sparkling wine aroma and flavour, remain unclear. Factors such as grape
variety, region of origin (and climate), yeast strain, tirage age and storage conditions will likely
influence wine composition, and therefore sensory properties. Therefore, research that improves our
understanding of the autolysis process is essential to enable identification of: (i) the odour-active
compounds released during lees aging and their specific organoleptic impact(s); and potentially (ii)
methods for accelerating the autolysis process.

71
Appendix 1: Communication
Research findings have been formally communicated via publication in peer-reviewed scientific
journals and industry technical journals, and presentations at national and international conferences:
Peer-Reviewed Journal Articles:
Culbert, J.A., Ristic, R., Ovington, L.A. Saliba, A.J. and Wilkinson, K.L. (2018) Sensory profiles and
consumer acceptance of different styles of Australian Moscato. Australian Journal of Grape and Wine
Research (in press).
Culbert, J.A., Ristic, R., Ovington, L.A. Saliba, A.J. and Wilkinson, K.L. (2017a) Influence of
production method on the sensory profiles and consumer acceptance of different styles of Australian
sparkling white wine. Australian Journal of Grape and Wine Research 23, 170–178.
Culbert, J.A., McRae, J., Condé, B.C., Schmidtke, L., Nicholson, E., Smith, P.A., Howell, K.S., Boss,
P.K. and Wilkinson, K.L. (2017b) Influence of production method on the chemical composition,
foaming properties and quality of Australian carbonated and sparkling white wines. Journal of
Agricultural and Food Chemistry 65, 1378–1386.
Verdonk, N., Wilkinson, J., Culbert, J., Ristic, R., Pearce, K. and Wilkinson, K. (2017) Towards a
model of sparkling wine buyer behaviour. International Journal of Wine Business Research 29, 58–73.
Culbert, J., Verdonk, N., Ristic, R., Olarte Mantilla, S., Lane, M., Pearce, K., Cozzolino, D. and
Wilkinson, K. (2016) Understanding consumer preferences for Australians sparkling wine vs. French
Champagne. Beverages 2, 19.
Culbert, J.A., Cozzolino, D., Ristic, R. and Wilkinson, K.L. (2015) Classification of sparkling wine
style and quality by MIR spectroscopy. Molecules 20, 8341–8356.
Industry Journal Articles:
Verdonk, N.R., Culbert, J.A. and Wilkinson, K.L. (2015) All that sparkles: Consumer perceptions of
sparkling wine. Wine and Viticulture Journal 30, 71–73.

72
National Conference Presentations:
16th Australian Wine Industry Technical Conference, Adelaide, Australia, July 2016
Compositional variation amongst Australian sparkling white wines (oral presentation, invited
speaker) Culbert, J.A., McRae, J., Schmidtke, L., Nicholson, E., Boss, P., Smith, P.A., Wilkinson,
K.L.
Compositional variation amongst Australian sparkling white wines (poster presentation) Culbert,
J.A., McRae, J., Schmidtke, L., Nicholson, E., Boss, P., Smith, P.A., Wilkinson, K.L.
Crafty consumer mapping: Understanding consumer preferences for Australian sparkling wine
(workshop presentation) Wilkinson, K.L. and Culbert, J.A.
2014 Crush Grape and Wine Symposium, Adelaide, Australia, November 2014
Evaluating the quality of Australian sparkling wine (oral presentation) Culbert, J.A., Cozzolino,
D., Ristic, R., Pearce, K.L., Schmidtke, L., Saliba, A., Ovington, L., Wilkinson, K.L.
15th Australian Wine Industry Technical Conference, Sydney, Australia, July 2013
The Australian sparkling wine market: A snapshot (poster presentation)
Wilkinson, K.L., Ristic, R., Culbert, J.A., Wilkinson, J.W., Pearce, K.L.
International Conference Presentations:
In Vino Analytica Scientia, Trento, Italy, July 2015
Understanding consumer preferences for Australian sparkling wine vs. French Champagne
Culbert, J.A., Verdonk, N.R., Lane, M.J., Pearce, K.L., Ristic, R., Cozzolino, D., Wilkinson, K.L.
(poster presentation)
Macrowine 2014, Stellenbosch, South Africa, September 2014
Classification of Australian sparkling wine style and quality by ATR-MIR spectroscopy (poster
presentation) Culbert, J.A., Cozzolino, D., Ristic, R., Pearce, K.L. and Wilkinson K.L.
SenseAsia 2014, Changi, Singapore, May 2014
Consumer preferences for French Champagne and Australian sparkling wine (poster presentation)
Culbert, J.A., Ristic, R., Verdonk, N.R., Lane, M.J., Pearce, K.L., Wilkinson, J.W. and Wilkinson
K.L.

73
Appendix 2: Intellectual Property
The intellectual property arising from this project comprises knowledge regarding: (i) the extent to
which wine constituents (e.g. organic acids, proteins, polysaccharides, amino acids, fatty acids and
their ethyl esters, and volatile compounds) influence the sensory attributes (e.g. aroma, flavour, taste,
mouthfeel and/or foaming properties) and quality of sparkling white wine and Moscato; and (ii) the
sensory attributes driving consumer preferences for different styles of sparkling white wine and
Moscato. There is no requirement for intellectual property to be patented or subject to other forms of
IP protection. The majority of the project’s research findings are published in either peer-reviewed
scientific journals or industry technical journals.

74
Appendix 3: References
Abdallah, Z., Aguie-Beghin, V., Abou-Saleh, K., Douillard, R., and Bliard, C. (2010) Isolation and
analysis of macromolecular fractions responsible for the surface properties in native Champagne
wines. Food Research International 43, 982−987.
Alexandre, H. and Guilloux-Benatier, M. (2006) Yeast autolysis in sparkling wine – a review.
Australian Journal of Grape and Wine Research 12, 119–127.
Andrejczak, M. (2011) Moscato madness grips U.S. wine industry. Market Watch. Available online:
http://www.marketwatch.com/story/moscato-madness-grips-us-wine-industry-2011-08-18 (accessed
on 29 September 2016).
Andrés-Lacueva, C., López-Tamames, E., Lamuela-Raventós, R.M., Buxaderas, S. and de la Torre-
Boronat, M. del C. (1996a) Characteristics of sparkling base wines affecting foam behavior. Journal of
Agricultural and Food Chemistry 44, 989–995.
Andrés-Lacueva, C., Gallart, M., López-Tamames, E. and Lamuela-Raventós, R.M. (1996b) Influence
of variety and aging on foaming properties of sparkling wine (Cava) 1. Journal of Agricultural and
Food Chemistry 44, 3826–3829.
Andrés-Lacueva, C., Lamuela-Raventós, R.M., Buxaderas, S. and de la Torre-Boronat, M. del C.
(1997) Influence of variety and aging on foaming properties of sparkling wine (Cava) 2. Journal of
Agricultural and Food Chemistry 45, 2520–2525.
Bell, S.-J. and Henschke, P.A. (2005) Implications of nitrogen nutrition for grapes, fermentation and
wine. Australian Journal of Grape and Wine Research 11, 242−295.
Bertamini, M., Zulini, L., Muthuchelian, K. and Nedunchezhian, N. (2006) Effect of water deficit on
photosynthetic and other physiological responses in grapevine (Vitis vinifera L. cv. Riesling) plants.
Photosynthetica 44, 151−154.
Bevin, C.J., Fergusson, A.J., Perry, W.B., Janik, L.J. and Cozzolino, D. (2006) Development of a rapid
“fingerprinting” system for wine authenticity by mid-infrared spectroscopy. Journal of Agricultural
and Food Chemistry 54, 9713–9718.

75
Bevin, C.J., Dambergs, R.G., Fergusson, A.J. and Cozzolino, D. (2008) Varietal discrimination of
Australian wines by means of mid-infrared spectroscopy and multivariate analysis. Analytica Chimica
Acta 621, 19–23.
Bindon, K., Varela, C., Kennedy, J., Holt, H. and Herderich, M. (2013) Relationships between harvest
time and wine composition in Vitis vinifera L. cv. Cabernet Sauvignon 1. Grape and wine chemistry.
Food Chemistry 138, 1696–1705.
Blackman, J.W., Hopfer, H., Saliba, A.S., Schmidtke, L.M., Barril, C. and Scollary, G.R. Sensory
characterization of Hunter Valley Semillon aged in bottle. Flavour and Fragrance Journal 29, 340–349.
Bosch-Fusté, J., Riu-Aumatell, M., Guadayol, J.M., Caixach, J., López-Tamames, E. and Buxaderas,
S. (2007) Volatile profiles of sparkling wines obtained by three extraction methods and gas
chromatography–mass spectrometry (GC–MS) analysis. Food Chemistry 105, 428–435.
Bozdogan, A. and Canbas, A. (2011) Influence of yeast strain, immobilisation and ageing time on the
changes of free amino acids and amino acids in peptides in bottle-fermented sparkling wines obtained
from Vitis vinifera cv. Emir. International Journal of Food Science and Technology 46, 1113–1121.
Brissonet, F. and Maujean, A. (1991) Identification of some foam-active compounds in Champagne
base wines. American Journal of Enology and Viticulture 42, 97–102.
Brissonnet, F. and Maujean, A. (1993) Characterization of foaming proteins in a Champagne base
wine. American Journal of Enology and Viticulture 44, 297–301.
Bruwer, J. (2007) Exploring some male-female consumer dynamics in the domestic wine market.
Australian and New Zealand Wine Industry Journal 527, 106–108.
Bruwer, J. and Li, E. (2007) Wine-related lifestyle (WRL) segmentation: demographic and behavioural
factors. Journal of Wine Research 18, 19–34.
Bruwer, J., Saliba, A. and Miller, B. (2011) Consumer behaviour and sensory preference differences:
Implications for wine product marketing. Journal of Consumer Marketing 28, 5–18.
Bruwer, J. and Huang, J. (2012) Wine product involvement and consumers' BYOB behaviour in the
South Australian on-premise market. Asia Pacific Journal of Marketing and Logistics 24, 461–481.

76
Bruwer, J., Jiranek, V., Halstead, L. and Saliba, A.J. (2014) Lower alcohol wines in the UK market:
Some baseline consumer behaviour metrics. British Food Journal 116, 1143–1161.
Casoli, A. and Colagrande, O. (1982) Use of high-performance liquid chromatography for the
determination of amino acids in sparkling wines. American Journal of Enology and Viticulture 33,
135-139.
Chamkha, M., Cathala, B., Cheynier, V. and Douillard, R. (2003) Phenolic composition of
Champagnes from Chardonnay and Pinot noir vintages. Journal of Agricultural and Food Chemistry
51, 3179−3184.
Charpentier, C. (2000) Yeast autolysis and yeast macromolecules? Their contribution to wine flavour
and stability. American Journal of Enology and Viticulture 51, 271–275.
Charters, S. (2005) Drinking sparkling wine: An exploratory investigation. International Journal of
Wine Marketing 17, 54–68.
Charters, S. (2009) An ambivalent luxury: Images of champagne in the Australian market, paper
presented at Beccus Wine Conference: Fourth Interdisciplinary and International Wine Conference,
Dijon, France, 7-9 July.
Charters, S., Velikova, N., Ritchie, C., Fountain, J., Thach, L., Dodd, T.H., Fish, N., Herbst, F. and
Terblanche, N. (2011) Generation Y and sparkling wines: a cross-cultural perspective. International
Journal of Wine Business Research 23, 161–175.
Coelho, E., Coimbra, M.A., Nogueira, J.M.F. and Rocha, S.M. (2009) Quantification approach for
assessment of sparkling wine volatiles from different soils, ripening stages, and varieties by stir bar
sorptive extraction with liquid desorption. Analytica Chimica Acta 635, 214–221.
Combris, P., Lange, C. and Issanchou, S. (2006) Assessing the effect of information on the reservation
price for Champagne: What are consumers actually paying for? Journal of Wine Economics 1, 75–88.
Condé, B.C., Fuentes, S., Caron, M., Xiao, D., Collman, R. and Howell, K.S. (2017) Development of a
robotic and computer vision method to assess foam quality in sparkling wines. Food Control 71, 383–
392.

77
Cozzolino, D., Smyth, H.E., Lattey, K.A., Cynkar, W., Janik, L., Dambergs, R.G., Francis, I.L. and
Gishen, M. (2005) Relationship between sensory analysis and near infrared spectroscopy in Australian
Riesling and Chardonnay wines. Analytica Chimica Acta 539, 341–348.
Cozzolino, D., Smyth, H.E., Lattey, K.A., Cynkar, W., Janik, L., Dambergs, R.G., Francis, I.L. and
Gishen, M. (2006) Combining mass spectrometry based electronic nose, visible–near infrared
spectroscopy and chemometrics to assess the sensory properties of Australian Riesling wines.
Analytica Chimica Acta 563, 319–324.
Cozzolino, D., Holdstock, M., Dambergs, R.G., Cynkar, W.U. and Smith, P.A. (2009) Mid infrared
spectroscopy and multivariate analysis: A tool to discriminate between organic and non-organic wines
grown in Australia. Food Chemistry 116, 761–765.
Cozzolino, D., Cynkar, W., Shah, N. and Smith, P. (2011a) Feasibility study on the use of attenuated
total reflectance mid-infrared for analysis of compositional parameters in wine. Food Research
International 44, 181–186.
Cozzolino, D., Cynkar, W.U., Shah, N. and Smith, P.A. (2011b) Can spectroscopy geographically
classify Sauvignon Blanc wines from Australia and New Zealand? Food Chemistry 126, 673–678.
Cozzolino, D., Cynkar, W., Shah, N. and Smith, P. (2011) Technical solutions for analysis of grape
juice, must, and wine: the role of infrared spectroscopy and chemometrics. Analytical Bioanalytical
Chemistry 401, 1475–1484.
Crump, A.M., Johnson, T.E., Bastian, S.E.P., Bruwer, J. and Wilkinson, K.L. (2014) Consumers’
knowledge of and attitudes towards the role of oak in winemaking. International Journal of Wine
Research 6, 21–30.
Crump, A.M., Johnson, T.E., Wilkinson, K.L. and Bastian, S.E.P. (2015) Influence of oak maturation
regimen on composition, sensory properties, quality, and consumer acceptability of Cabernet
Sauvignon Wines. Journal of Agricultural and Food Chemistry 63, 1593–1600.
Culbert, J., Cozzolino, D., Ristic, R. and Wilkinson, K. (2015) Classification of sparkling wine style
and quality by MIR spectroscopy. Molecules 20, 8341–8356.

78
Culbert, J., Verdonk, N., Ristic, R., Olarte Mantilla, S., Lane, M., Pearce, K., Cozzolino, D. and
Wilkinson, K. (2016) Understanding consumer preferences for Australian sparkling wine vs. French
Champagne. Beverages 2, 19.
Culbert, J.A., Ristic, R., Ovington, L.A. Saliba, A.J. and Wilkinson, K.L. (2017a) Influence of
production method on the sensory profiles and consumer acceptance of different styles of Australian
sparkling white wine. Australian Journal of Grape and Wine Research 23, 170–178.
Culbert, J.A., McRae, J., Condé, B.C., Schmidtke, L., Nicholson, E., Smith, P.A., Howell, K.S., Boss,
P.K. and Wilkinson, K.L. (2017b) Influence of production method on the chemical composition,
foaming properties and quality of Australian carbonated and sparkling white wines. Journal of
Agricultural and Food Chemistry 65, 1378–1386.
Culbert, J.A., Ristic, R., Ovington, L.A., Saliba, A.J. and Wilkinson, K.L. (2018) Sensory profiels and
consumers acceptance of different styles of Australian Moscato. Australian Journal of Grape and Wine
Research (in press).
de la Presa-Owens, C., Schlich, P., Davies, H.D. and Noble A.C. (1998) Effect of Méthode
Champenoise process on aroma flavour of four V. vinifera varieties. American Journal of Enology and
Viticulture 49, 289–294.
Dodd, T.H., Kolyesnikova, N. and Wilcox, J.B. (2010) A matter of taste: Consumer preferences of
sweet and dry wines. The 5th International Conference of the Academy of Wine Business Research,
Auckland, New Zealand.
Dupin, I., McKinnon, B.M., Ryan, C., Boulay, M., Markides, A.J., Jones, G. P., Williams, P.J. and
Waters, E.J. (2000) Saccharomyces cerevisiae mannoproteins that protect wine from protein haze:
Their release during fermentation and lees contact and a proposal mechanism of action. Journal of
Agricultural and Food Chemistry 48, 3098−3105.
Dussaud, A., Robillard, B., Carles, B., Duteurtre, B. and Vignes-Adler, M. (1994) Exogenous lipids
and ethanol influences on the foam behavior of sparkling base wines. Journal of Food Science 59,
148−151.

79
Edelmann, A., Diewok, J., Schuster, K.C. and Lendl, B. (2001) Rapid method for the discrimination of
red wine cultivars based on mid-infrared spectroscopy of phenolic wine extracts. Journal of
Agricultural and Food Chemistry 49, 1139–1145.
Feuillat, M. and Charpentier, C. (1982) Autolysis of yeasts in Champagne. American Journal of
Enology and Viticulture 33, 6–13.
Fountain, J. and Fish, N. (2010) ‘It’s a happy drink’: Australasian Generation Y’s experiences and
perception of sparkling wine. Paper presented at 5th International Academy of Wine Business
Research Conference, New Zealand.
Francioli. S., Guerra, M., López-Tamames, E., Guadayoi, J.M. and Caixach, J. (1999) Aroma of
sparkling wines by headspace/solid phase microextraction and gas chromatography/mass spectrometry.
American Journal of Enology and Viticulture 50, 404–408.
Fudge, A.L., Wilkinson, K.L., Ristic, R. and Cozzolino, D. (2012) Classification of smoke tainted
wines using mid-infrared spectroscopy and chemometrics. Journal of Agricultural and Food Chemistry
60, 52−59.
Gallardo-Chacon, J. J., Vichi, S., Lopez-Tamames, E. and Buxaderas, S. (2010) Changes in the
sorption of diverse volatiles by Saccharomyces cerevisiae lees during sparkling wine aging. Journal of
Agricultural and Food Chemistry 58, 12426−12430.
Gallart, M., López-Tamames, E., Suberbiola, G. and Buxaderas, S. (2002) Influence of fatty acids on
wine foaming. Journal of Agricultural and Food Chemistry 50, 7042−7045.
García, M.J., Aleixandre, J.L., Álvarez, I. and Lizama, V. (2009) Foam aptitude of Bobal variety in
white sparkling wine elaboration and study of volatile compounds. European Food Research and
Technology 229, 133−139.
Gawel, R. and Godden, P.W. (2008) Evaluation of the consistency of wine quality assessments from
expert wine tasters. Australian Journal of Grape and Wine Research 14, 1–8.
Girbau-Solà, T., López-Tamames, E., Buján, J. and Buxaderas, S. (2002) Foam aptitude of Trepat and
Monastrell red varieties in Cava elaboration. 1. Base wine characteristics. Journal of Agricultural and
Food Chemistry 50, 5596–5599.

80
Hashimoto, A. and Kameoka, T. (2000) Mid-infrared spectroscopic determination of sugar contents in
plant-cell culture media using an ATR method. Applied Spectroscopy 54, 1005–1011.
Hersleth, M., Mevik, B.-H., Naes, T. and Guinard, J.-X. (2003) Effect of contextual factors on liking
for wine--use of robust design methodology. Food Quality and Preference 14, 615–622.
Hidalgo, P., Pueyo, E., Pozo-Bayón, M.A., Martínez-Rodríguez, A.J., Martín-Álvarez, A.J. and Polo,
M.C. (2004) Sensory and analytical study of Rosé sparkling wines manufactured by secondary
fermentation in the bottle. Journal of Agricultural and Food Chemistry 52, 6640–6645.
Hoffman, C.A. (2004) When consumers buy wine, what factors decide the final purchase? Australian
and New Zealand Wine Industry Journal 19, 82–91.
Hood White M.R. and Heymann, H. (2015) Assessing the sensory profiles of sparkling wine over time.
American Journal of Enology and Viticulture 66, 156–163.
Huang, Z. and Ough, C.S. (1991) Amino acid profiles of commercial grape juices and wines.
American Journal of Enology and Viticulture 42, 261-267.
Iland, P. and Gago, P. (1997) Australian Wine: From the Vine to the Glass. Patrick Iland Wine
Promotions: Adelaide, Australia; pp. 60–77.
Iland, P., Bruer, N., Edwards, G., Weeks, S. and Wilkes, E. (2004) Chemical analysis of grapes and
wine: Techniques and concepts. Patrick Iland Wine Promotions: Adelaide, Australia.
Iland, P., Gago, P., Caillard, A. and Dry, P. (2009). A Taste of the World of Wine. Patrick Iland Wine
Promotions: Adelaide, Australia.
Jennings, R. (2012) Moscato madness: Identifying the good stuff. The Huffington Post. Available
online: http://www.huffingtonpost.com/richard-jennings/best-moscato-wine_b_1261915.html
(accessed on 29 September 2016).

81
Johnson T.E. and Bastian, S.E.P. (2007) A preliminary study of the relationship between Australian
wine consumers’ wine expertise and their wine purchasing and consumption behaviour. Australian
Journal of Grape and Wine Research 13, 186–197.
Kemp, B., Alexandre, H., Robillard, B. and Marchal, R. (2015) Effect of production phase on bottle-
fermented sparkling wine quality. Journal of Agricultural and Food Chemistry 63, 19−38.
Lange, C., Martin, C., Chabanet, C., Combris, P. and Issanchou, S. (2002) Impact of the information
provided to consumers on their willingness to pay for Champagne: comparison with hedonic scores.
Food Quality and Preference 13, 597–608.
Lattey, K.A., Bramley, B.R., Francis, I.L., Herderich, M.J. and Pretorius, S. (2007) Wine quality and
consumer preferences; Understanding consumer needs. Australian and New Zealand Wine Industry
Journal 22, 31-39.
Lawless, H.T. and Heymann, H. (1998) Sensory Evaluation of Food: Principles and Practices.
(Chapman and Hall: New York, NY, USA) pp. 647-678.
Lawless, H.T. and Heymann, H. (2010) Descriptive analysis. Heldman, D.R. ed. Sensory Evaluation of
Food: Principles and Practices. (Springer: New York, NY, USA) pp. 227–253.
Lehtonen, P. (1996) Determination of amines and amino acids in wine - A review. American Journal
of Enology and Viticulture 47, 127–133.
Leroy, M.J., Charpentier, M., Duteurtre, B., Feuillat, M. and Charpentier, C. (1990) Yeast autolysis
during Champagne aging. American Journal of Enology and Viticulture 41, 21–28.
Lesschaeve, I. (2008) Wine consumer flavour preferences. In: Chassagne, D. (Ed.), Proceedings of the
First Wine Active Compounds symposium. OenoPluriMedia, Beaune, pp. 71–74.
Lesschaeve, I., Bowen, A. and Bruwer, J. (2012) Determining the impact of consumer characteristics
to project sensory preferences in commercial white wines. American Journal of Enology and
Viticulture 63, 487–493.
Liger-Belair, G., Marchal, R. and Jeandet, P. (2002) Close-up on bubble nucleation in a glass of
Champagne. American Journal of Enology and Viticulture 53, 151–153.

82
Liger-Belair, G. (2010) Chapter 1 - Visual perception of effervescence in Champagne and other
sparkling beverages. Advances in Food and Nutrition Research 61, 1–55.
Liu, L., Cozzolino, D., Cynkar, W.U., Gishen, M. and Colby, C.B. (2006) Geographic classification of
Spanish and Australian Tempranillo red wines by visible and near-infrared spectroscopy combined
with multivariate analysis. Journal of Agricultural and Food Chemistry 54, 6754–6759.
Lockshin, L. and Corsi, A.M. (2012) Consumer behaviour for wine 2.0: A review since 2003 and
future directions. Wine Economics and Policy 1, 2–23.
López-Barajas, M., López-Tamames, E., Buxaderas, S. and de la Torre-Boronat, M.C. (1998) Effect of
vinification and variety on foam capacity of wine. American Journal of Enology and Viticulture 49,
397–402.
López-Barajas, M., López-Tamames, E., Buxaderas, S., Suberbiola, G. and de la Torre-Boronat, M.C.
(2001) Influence of wine polysaccharides of different molecular mass on wine foaming. American
Journal of Enology and Viticulture 52, 146–150.
Luguera, C., Moreno-Arribas, V., Pueyo, E., Bartolome, B. and Polo, M.C. (1998) Fractionation and
partial characterization of protein fractions present at different stages of the production of sparkling
wines. Food Chemistry 63, 465–471.
McIntyre, E., Ovington, L.A., Saliba, A.J. and Moran, C.C. (2015) Qualitative study of alcohol
consumers who choose to avoid wine. Australian Journal of Grape and Wine Research 22, 182–189.
Malvy, J., Robillard, B. and Duteurtre, B. (1994) Influence of proteins on the foam behaviour of
champagne wines. Sciences des. Aliments 14, 87–98.
Manteau, S., Lambert, B., Jeandet, P. and Legendre, L. (2003) Changes in chitinase and thaumatin-like
pathogenesis-related proteins of grape berries during the Champagne winemaking process. American
Journal of Enology and Viticulture 54, 267–272.
Marin A.B., Jorgensen, E.M., Kennedy, J.A. and Ferrier, J. (2007) Effects of bottle closure type on
consumer perceptions of wine quality. American Journal of Enology and Viticulture 58, 182–191.

83
Marchal, R., Seguin, V. and Maujean, A. (1997) Quantification of interferences in the direct
measurement of proteins in wines from the Champagne region using the Bradford method. American
Journal of Enology and Viticulture 48, 303–309.
Martínez-Lapuente, L., Guadalupe, Z., Ayestarán, B., Ortega-Heras, M. and Pérez-Magariño, S. (2013)
Changes in polysaccharide composition during the sparkling winemaking and aging. Journal of
Agricultural and Food Chemistry 61, 12362–12373.
Martínez-Lapuente, L., Guadalupea, Z., Ayestarána, B. and Pérez-Magariñob, S. (2015) Role of major
wine constituents in the foam properties of white and rosé sparkling wines. Food Chemistry 174, 330–
338.
Martínez-Rodríguez, A.J., Carrascosa, A.V., Martín-Álvarez, P.J., Moreno-Arribas, V. and Polo, M.C.
(2002) Influence of the yeast strain on the changes of the amino acids, peptides and proteins during
sparkling wine production by the traditional method. Journal of Industrial Microbiology and
Biotechnology 29, 314–322.
Maujean, A., Poinsaut, P., Dantan, H., Brissonnet, F. and Cossiez, E. (1990) Etude de la tenue et de la
qualité de la mousse des vins effervescents. Bulletin de l’OIV 711, 405–426.
Moreno-Arribas, V., Pueyo, E., Polo, M.C. and Martín-Álvarez, P.J. (1998) Changes in the amino acid
composition of the different nitrogenous fractions during the aging of wine with yeasts. Journal of
Agricultural and Food Chemistry 46, 4042–4051.
Moreno-Arribas, V., Pueyo, E., Nieto, F.J., Martın-Álvarez, P.J. and Polo, M.C. (2000) Influence of
the polysaccharides and the nitrogen compounds on foaming properties of sparkling wines. Food
Chemistry 70, 309–317.
Morton, A.-L., Rivers, C., Charters, S. and Spinks, W. (2013) Champagne purchasing: the influence of
kudos and sentimentality. Qualitative Market Research: An International Journal 16, 150–164.
Mueller, S. and Szolnoki, G. (2010) The relative influence of packaging, labelling, branding and
sensory attributes on liking and purchase intent: consumers differ in their responsiveness. Food Quality
and Preference 21, 774–783.

84
Nielsen Australia. Australian Sparkling Wine Segment Data, 2012. Available online:
http://www.nielsen.com.au (accessed on 11 August 2016).
Parr, W.V., Heatherbell, D. and White, K.G. (2002) Demystifying wine expertise: Olfactory threshold,
perceptual skill and semantic memory in expert and novice wine judges. Chemical Senses 27, 747–
755.
Patz, C.-D., Blieke, A., Ristow, R. and Dietrich, H. (2004) Application of FT-MIR spectrometry in
wine analysis. Analytica Chimica Acta 513, 81–89.
Pérez-Magariño, S., Martínez-Lapuente, L., Bueno-Herrera, M., Ortega-Heras, M., Guadalupe, Z. and
Ayestarán, B. (2015) Use of commercial dry yeast products rich in mannoproteins for white and rosé
sparkling wine elaboration. Journal of Agriculture and Food Chemistry 63, 5670–5681.
Piqueras-Fiszman, B. and Spence, C. (2012) The weight of the bottle as a possible extrinsic cue with
which to estimate the price (and quality) of the wine? Observed correlations. Food Quality and
Preference 25, 41–45.
Pozo-Bayón, M.A., Pueyo, E., Martín-Álvarez, P.J., Martínez-Rodríguez, A.J. and Polo, M.C. (2003)
Influence of yeast strain, bentonite addition, and aging time on volatile compounds of sparkling wines.
American Journal of Enology and Viticulture 54, 273–278.
Pueyo, E., Martín-Alvarez, P.J. and Polo, M.C. (1995) Relationship between foam characteristics and
chemical composition in wines and Cavas (sparkling wines). American Journal of Enology and
Viticulture 46, 518–524.
Riovanto, R., Cynkar, W.U., Berzaghi, P. and Cozzolino, D. (2011) Discrimination between Shiraz
wines from different Australian regions: The role of spectroscopy and chemometrics. Journal of
Agricultural and Food Chemistry 59, 10356–10360.
Riu-Aumatell, M., Bosch-Fusté, J., López-Tamames, E. and Buxaderas, S. (2006) Development of
volatile compounds of cava (Spanish sparkling wine) during long ageing time in contact with lees.
Food Chemistry 95, 237–242.

85
Rowe, M. (2012) Sweeter wines, deeper beer lists on tap for 2013. Restaurant Hospitality. Available
online: http://restaurant-hospitality.com/drink-trends/sweeter-wines-deeper-beer-lists-tap-2013
(accessed on 29 September 2016).
Saliba, A.J., Bruwer, J. and MacDonald, J.B. (2015) Consumption metrics of Chardonnay wine
consumers in Australia. International Journal of Wine Research 7, 1–11.
Schaefer, A. (1997). Consumer knowledge and country of origin effects. European Journal of
Marketing 31, 56–72.
Shah, N., Cynkar, W., Smith, P. and Cozzolino, D. (2010) Use of attenuated total reflectance mid-
infrared for rapid and real-time analysis of compositional parameters in commercial white grape juice.
Journal of Agricultural and Food Chemistry 58, 3279–3283.
Smith, B.C. (2011) Fundamentals of Fourier Transform Infrared Spectroscopy, 2nd ed. CRC Press
(Taylor and Francis Group), Boca Raton, Florida, U.S.A.
Stines A.P., Grubb J., Gockowiak H., Henschke P.A., Høj P.B. and van Heeswijck R. (2000) Proline
and arginine accumulation in developing berries of Vitis vinifera L. in Australian vineyards: Influence
of vine cultivar, berry maturity and tissue type. Australian Journal of Grape and Wine Research 6,
150−158.
Thach, L. (2011) Wine for breakfast: Exploring wine occasions for gen Y. Paper presented at 6th
AWBR International Conference Bordeaux, France, 9-10 June 2011.
Torrens, J., Riu-Aumatell, M., Vichi, S., Lopez-Tamames, E. and Buxaderas, S. (2010) Assessment of
volatile and sensory profiles between base and sparkling wines. Journal of Agricultural and Food
Chemistry 58, 2455−2461.
Van Sluyter, S., Marangon, M., Stranks, S.D., Neilson, K.A., Hayasaka, Y., Haynes, P.A., Menz, R.I.
and Waters, E.J. (2009) Two-step purification of pathogenesis-related proteins from grape juice and
crystallization of thaumatin-like proteins. Journal of Agricultural and Food Chemistry 57, 11376–
11382.
86
Vannier, A., Bruna, O.X. and Feinberg, M.H. (1999) Application of sensory analysis to champagne
wine characterisation and discrimination. Food Quality and Preference 10, 101–107.
Vanrell, G., Canals, R., Esteruelas, M., Fort, F., Canals, J.M. and Zamora, F. (2007) Influence of the
use of bentonite as a riddling agent on foam quality and protein fraction of sparkling wines (Cava).
Food Chemistry 104, 148–155.
Veale, R. and Quester, P. (2009) Do consumer expectations match experience? Predicting the
influence of price and country of origin on perceptions of product quality. International Business
Review, 18, 134–144.
Verdonk, N., Culbert, J., Wilkinson, K., Ristic, R., Pearce, K., Lane, M. and Wilkinson, J. (2017)
Toward a model of sparkling wine buyer behaviour. International Journal of Wine Business Research
29, 58–73.
Vidal, S., Francis, L., Williams, P., Kwitkowski, M., Gawel, R., Cheynier, V. and Waters, E. (2004)
The mouth-feel properties of polysaccharides and anthocyanins in a winelike medium. Food Chemistry
85, 519−525.
Vignes, A. and Gergaud, O. (2007) Twilight of the idols in the market for Champagne: Dissonance or
consonance in consumer preferences? Journal of Wine Research 18, 147–162.
Waterhouse, A.L., Sacks, G.L. and Jeffery, D.W. (2016) Understanding Wine Chemistry. John Wiley
& Sons Ltd., West Sussex, U.K.
Williams, D.H. and Fleming, I. (1995) Spectroscopic Methods in Organic Chemistry, 5th ed.; McGraw
Hill Publishing, Berkshire, England, U.K.
Wine Australia (2012) Sparkling wine profile, viewed 14 May 2013,
http://www.wineaustralia.com/en/Winefacts%20Landing/Articles%20and%20Analysis/Article%20-
20Sparkling%20wine%20profile.aspx?ec_trk=followlist&ec_trk_data=Articles+and+Analysis
(accessed on 14 May 2013).
Wine Australia (2012) What’s the fizz? - A sparkling wine market overview. Winefacts 1–4.
http://www.wineaustralia.com/en/Winefacts%20search.aspx (accessed on 1 March 2015).
87
Wine Australia (2016) Register of protected geographical indications and other terms: Additional
terms. Available online:
http://www.wineaustralia.com/en/Production%20and%20Exporting/Register%20of%20Protected%20
GIs%20and%20Other%20Terms/Additional%20Terms.aspx (accessed on 29 September 2016).
Woodard, R. (2012) UK set for Moscato influx. Decanter. Available online:
http://www.decanter.com/wine-news/us-moscato-madness-about-to-hit-uk-32573/ (accessed on 29
September 2016).

88
Appendix 4: Staff
The University of Adelaide:
Associate Professor Kerry Wilkinson
Dr Julie Culbert
Dr Renata Ristic
Dr Daniel Cozzolino
Naomi Verdonk (PhD student)
Charles Sturt University:
Professor Anthony Saliba
Dr Leigh Schmidtke
Linda Ovington
The University of South Australia:
Dr John Wilkinson
Dr Karma Pearce
Melissa Lane (Honours student)
Compositional analyses were also undertaken in collaboration with staff and/or students from other
research organisations:
The Australian Wine Research Institute:
Dr Paul Smith
Dr Jacqui McRae
CSIRO:
Dr Paul Boss
Emily Nicholson
The University of Melbourne:
Dr Kate Howell
Bruna Condé

89
Appendix 5: Budget Reconciliation
The financial statement for this project has been submitted online via AGWA’s Clarity Investment
Management System.