Object and Gas Source Detection with Robotic Platforms in ...
8
Object and Gas Source Detection with Robotic Platforms in Perceptually-Degraded Environments Edward Terry, Xianmei Lei, Benjamin Morrell, Shreyansh Daftry and Ali-akbar Agha-mohammadi Jet Propulsion Laboratory, California Institute of Technology. Pasadena, CA, USA. Email: {firstname}.{lastname}@jpl.nasa.gov Abstract—In exploration-oriented robotic missions for disas- ter relief in unknown environments, it is of prime importance for a human supervisor to rapidly gain situational awareness of salient objects within the environment. In this paper, we present a cascaded and modular pipeline for the detection, localization and visualization of objects of interest that is adaptable to heterogeneous robots with arbitrary sensor configurations. We apply this pipeline for static objects which may be seen with the human eye as well as invisible spatially-diffuse phenomena such as gas and WiFi signals. We present results from its deployment in time-critical scenarios with multiple collaborative robots in a variety of harsh underground environments. For visually-observable objects, detections are made in both the color and thermal spectra using a state-of-the-art machine learning framework for object detection. We fine-tune a pre- trained convolutional neural network for a specific set of objects; in this case we use around 1000 images covering a range of poses and contexts for each object class. Once detected, a robust architecture for localization is used with outlier rejection and a hierarchy of fall-back distance measurement methods. Spatially-diffuse phenomena are registered by tracking signal strength over time. A human supervisor can optionally provide input to refine the automatically-generated detections with the help of intuitive map-based visualizations and object thumbnails ranked by classification confidence. I. INTRODUCTION Robots that can explore, operate and navigate in subter- ranean environments have long been an objective for robotics research. For outer space applications (Agha et al. [2], Husain et al. [11]), planetary caves and skylights offer exciting op- portunities for human settlement, understanding the planet’s evolution and the search for extraterrestrial life. Similarly for terrestrial applications (Morris [17]) that preclude safe human access, we want to better equip search and rescue teams to explore human-made tunnel systems, urban underground, and natural cave networks. This motivates the need for robots that can operate autonomously for a long duration in such complex environments, without humans. In recent years, autonomous robots have proven to be useful in a number of important applications. However, this progress has mostly focused on surface, aerial and space environments. The issues, technologies and systems that per- tain to underground spaces are unique. The current state-of- the-art for systems which integrate mobility, communication, perception and autonomy is underdeveloped relative to the functionality and rigor required for reliable underground operation. Inspired by this, DARPA has launched the Sub- terranean (SubT) Challenge (Chung [6]), the latest in the series of Grand Challenges. Its aim is to develop innovative Fig. 1. A pipeline for the detection and localization of designated objects of interest in subterranean environments is demonstrated with a fleet of heterogeneous unmanned ground vehicles. Here, a Boston Dynamics Spot Mini passes one of the objects, a backpack, in the Urban Circuit of the DARPA Subterranean Challenge. technologies to allow robot teams to rapidly map, navigate, search and exploit complex underground environments. From a perception standpoint, several aspects of un- derground environments make them perceptually-degraded: variable lighting conditions, variable wall surface colors and textures, the presence of obscurants such as smoke, dust or fog, and obstacles which limit the robot’s field of view. Furthermore, in a time-constrained, exploration-oriented mission, the primary goal is to push the unexplored frontier forward as rapidly as possible; it demands real-time onboard detection whose results must be lightweight enough to com- municate wirelessly back to base. In a search and rescue context, the main goal is to locate humans; objects such as backpacks and cell phones may also indicate a recent human presence (Fig. 1) and detections of noxious gases may help first responders build situational awareness about hazardous regions in the environment. Such objects are called artifacts in the SubT context. In both SubT and search and rescue contexts, we want to ensure that the human supervisor receives all potential sightings of true objects that the robot gets close to. Therefore, in contrast to typical goals of detection systems, we prioritize detecting all objects over minimizing the false positive rate. In this paper, we propose an object detection system for perceptually-degraded subterranean environments, and sum- marize our approach taken towards system development and testing for participation in the Tunnel and Urban Circuits of the DARPA SubT Challenge, which brought us second- and first-place finishes, respectively. This system is but one part of a complete framework which allows for the autonomous
-
Upload
khangminh22 -
Category
Documents
-
view
1 -
download
0
Transcript of Object and Gas Source Detection with Robotic Platforms in ...

Object and Gas Source Detection with RoboticPlatforms in Perceptually-Degraded Environments
Edward Terry, Xianmei Lei, Benjamin Morrell, Shreyansh Daftry and Ali-akbar Agha-mohammadiJet Propulsion Laboratory, California Institute of Technology. Pasadena, CA, USA.
Email: {firstname}.{lastname}@jpl.nasa.gov
Abstract—In exploration-oriented robotic missions for disas-ter relief in unknown environments, it is of prime importancefor a human supervisor to rapidly gain situational awareness ofsalient objects within the environment. In this paper, we presenta cascaded and modular pipeline for the detection, localizationand visualization of objects of interest that is adaptable toheterogeneous robots with arbitrary sensor configurations. Weapply this pipeline for static objects which may be seen with thehuman eye as well as invisible spatially-diffuse phenomena suchas gas and WiFi signals. We present results from its deploymentin time-critical scenarios with multiple collaborative robots ina variety of harsh underground environments.
For visually-observable objects, detections are made in boththe color and thermal spectra using a state-of-the-art machinelearning framework for object detection. We fine-tune a pre-trained convolutional neural network for a specific set of objects;in this case we use around 1000 images covering a range ofposes and contexts for each object class. Once detected, arobust architecture for localization is used with outlier rejectionand a hierarchy of fall-back distance measurement methods.Spatially-diffuse phenomena are registered by tracking signalstrength over time. A human supervisor can optionally provideinput to refine the automatically-generated detections with thehelp of intuitive map-based visualizations and object thumbnailsranked by classification confidence.
I. INTRODUCTION
Robots that can explore, operate and navigate in subter-ranean environments have long been an objective for roboticsresearch. For outer space applications (Agha et al. [2], Husainet al. [11]), planetary caves and skylights offer exciting op-portunities for human settlement, understanding the planet’sevolution and the search for extraterrestrial life. Similarly forterrestrial applications (Morris [17]) that preclude safe humanaccess, we want to better equip search and rescue teams toexplore human-made tunnel systems, urban underground, andnatural cave networks. This motivates the need for robotsthat can operate autonomously for a long duration in suchcomplex environments, without humans.
In recent years, autonomous robots have proven to beuseful in a number of important applications. However, thisprogress has mostly focused on surface, aerial and spaceenvironments. The issues, technologies and systems that per-tain to underground spaces are unique. The current state-of-the-art for systems which integrate mobility, communication,perception and autonomy is underdeveloped relative to thefunctionality and rigor required for reliable undergroundoperation. Inspired by this, DARPA has launched the Sub-terranean (SubT) Challenge (Chung [6]), the latest in theseries of Grand Challenges. Its aim is to develop innovative
Fig. 1. A pipeline for the detection and localization of designated objectsof interest in subterranean environments is demonstrated with a fleet ofheterogeneous unmanned ground vehicles. Here, a Boston Dynamics SpotMini passes one of the objects, a backpack, in the Urban Circuit of theDARPA Subterranean Challenge.
technologies to allow robot teams to rapidly map, navigate,search and exploit complex underground environments.
From a perception standpoint, several aspects of un-derground environments make them perceptually-degraded:variable lighting conditions, variable wall surface colors andtextures, the presence of obscurants such as smoke, dust orfog, and obstacles which limit the robot’s field of view.
Furthermore, in a time-constrained, exploration-orientedmission, the primary goal is to push the unexplored frontierforward as rapidly as possible; it demands real-time onboarddetection whose results must be lightweight enough to com-municate wirelessly back to base.
In a search and rescue context, the main goal is to locatehumans; objects such as backpacks and cell phones may alsoindicate a recent human presence (Fig. 1) and detectionsof noxious gases may help first responders build situationalawareness about hazardous regions in the environment. Suchobjects are called artifacts in the SubT context. In bothSubT and search and rescue contexts, we want to ensure thatthe human supervisor receives all potential sightings of trueobjects that the robot gets close to. Therefore, in contrast totypical goals of detection systems, we prioritize detecting allobjects over minimizing the false positive rate.
In this paper, we propose an object detection system forperceptually-degraded subterranean environments, and sum-marize our approach taken towards system development andtesting for participation in the Tunnel and Urban Circuits ofthe DARPA SubT Challenge, which brought us second- andfirst-place finishes, respectively. This system is but one partof a complete framework which allows for the autonomous
exploration, localization and mapping of an unknown envi-ronment. We refer readers to Agha [1] for details on thesefunctions which are out of the scope of this paper.
II. RELATED WORK
3D Object Detection: The advent of commodity depthcameras and lidar systems have spawned many 3D objectdetection methods (Choi and Christensen [5], Kehl et al.[12]). A majority of these algorithms work directly on3D point clouds and can be grouped into region-proposalmethods (Song and Xiao [23]) and single-shot methods (Zhouand Tuzel [26]). Besides directly operating in the 3D pointcloud space, some other detection algorithms project 3D pointcloud onto a 2D surface as depth maps or range scans (Linet al. [13], Chen et al. [4]). However, all of the above methodsare generally too computationally expensive for real-timeoperations; minimizing latency is critical for our application.
Image-based Object Detection: In recent years, Convo-lutional Neural Networks (CNNs) (Szegedy et al. [24], Fu-rukawa and Ponce [10]) have proven themselves to be highlycapable at object detection tasks even with wide-rangingobject scale, pose and illumination, surpassing longstandingclassical methods (Lowe et al. [16], Rothganger et al. [22]).Similar to 3D methods, single-shot CNN frameworks arefavored as an alternative to two-staged detection methodssuch as Faster-RCNN (Ren et al. [21]) that first find a fewcandidate locations in the image and then classifies themas objects or background. Recently, single shot architecturessuch as YOLO (Redmon et al. [20], Redmon and Farhadi[18]) and SSD (Liu et al. [15]) have been shown to strikea balance between accuracy and speed, making them asuitable choice for real-time autonomous systems. Yet, theseapproaches struggle to perform well in low-illuminationsettings.
Spatially-Diffuse Object Detection: The task of seekingthe source of a radio signal has been attempted in simula-tion for multiple cooperative agents by Atanasov et al. [3].Gas leaks have been detected with robot-mounted infraredspectrometers (Zhigang and Lu [25]) and specialized thermalimaging cameras (FLIR [9]).
Contributions
In this paper, we can efficiently detect and localize visibleobjects by breaking down the underlying 3D problem intotwo stages: use an image-based object detection pipeline tofirst find the object, then apply projective geometry to thatdetection to estimate its position explicitly. By splitting thedetection and localization tasks, we can utilize high qualityand fast detections from algorithms like YOLO, and applyit to generic camera types in our own relative localizationapproach. Furthermore, we propose a process for structureddata collection in perceptually-degraded environments whichallows this detection framework to be applied, with min-imal overhead, to a challenging real-world task with lowillumination. For the source-seeking behavior, we use low-cost off-the-shelf sensors that are fractions of the cost ofspectrometers and specialized cameras, and whose signals
Fig. 2. Object detection, localization and visualization pipeline
can be presented in an intuitive visualization to then exploithuman input, if available.
III. APPROACHA. Object Reporting Pipeline Overview
Fig. 2 shows the proposed object detection, localizationand visualization pipeline. For detection of visible objects, anRGB stream is input to a CNN, and the resulting detection ispassed to a relative localization module, which estimates theobject’s position with respect to the robot. WiFi strength andgas concentration is measured concurrently. A pose graph isused for global localization (see Fig. 10, left), with separateinstances on both the robot and on the base station. Newlandmark nodes and edges are added relative to the robot’spose for each object sighting. The relative pose to the robot iscombined with the latest estimate of the robot’s global pose(from a separate, assumed, global localization estimate) togenerate a global object position estimate. The object is thensent to the base station pose graph, which aggregates inputsfrom multiple robots, and then to a reconciliation modulewhich groups nearby object sightings. The resulting report issaved to a database and is presented for review by the humansupervisor on a browser-based user interface.
B. Detection
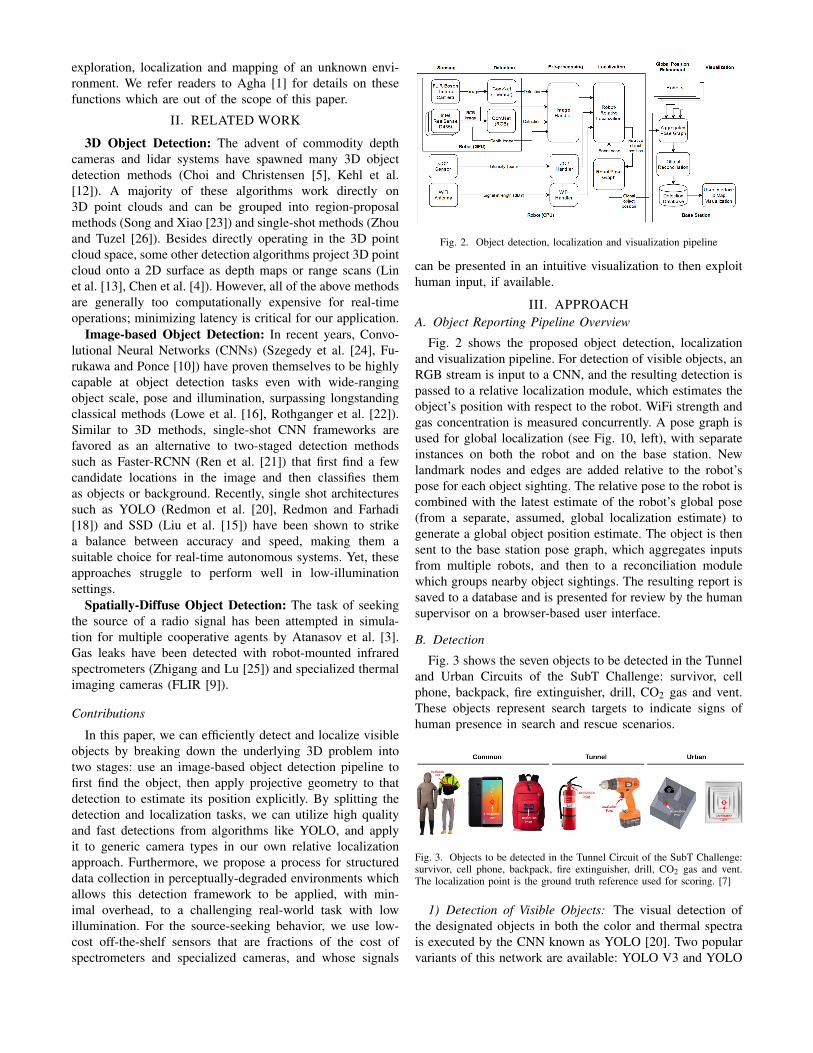
Fig. 3 shows the seven objects to be detected in the Tunneland Urban Circuits of the SubT Challenge: survivor, cellphone, backpack, fire extinguisher, drill, CO2 gas and vent.These objects represent search targets to indicate signs ofhuman presence in search and rescue scenarios.
Fig. 3. Objects to be detected in the Tunnel Circuit of the SubT Challenge:survivor, cell phone, backpack, fire extinguisher, drill, CO2 gas and vent.The localization point is the ground truth reference used for scoring. [7]
1) Detection of Visible Objects: The visual detection ofthe designated objects in both the color and thermal spectrais executed by the CNN known as YOLO [20]. Two popularvariants of this network are available: YOLO V3 and YOLO

V3 Tiny. We use the latter, with lower performance but a 6xfaster detection rate, to avoid missing objects as the robotquickly moves through an environment. The same networkarchitecture is used for both color and thermal image types,but with a separately trained network for each spectrum.
2) Detection of Spatially-Diffuse Objects: As distinct fromthe visually observable objects described above, the cellphone and gas objects emanate their signal in a point sourcefashion. The robot pose corresponding to the time of thehighest signal strength in a sequence of observations is setas the position estimate for these object types.
a) Cell Phone: WiFi is the most reliable way to detecta cell phone; visual methods are difficult because of itssmall scale and the changing appearance of its screen. Toaccurately map the peak signal from multiple sources, weneed to balance scanning rate on a single channel, andcross channel scanning. We achieve this by using the Linuxiwlist scan utility to output the signal strength in dBmof each access point in range of the robot at 1 Hz, as detectedby an off-the-shelf WiFi antenna. Direct range estimates fromthe cell phone based on signal strength were not attemptedbecause of the variance in signal propagation across differentbuilding geometries and wall surface properties.
b) Gas: Our approach is amenable to low-cost off-the-shelf gas sensors, opening up a range of sensing options.We use the Senseair K30 CO2 sensor as it has a suitablesensing range for the gas objects in the DARPA challenge,0-5000 ppm, and provides measurements at a sufficient speedto capture the peak concentration, every 2 sec.C. Visual/Thermal Detection Data Collection and Training
Given a specific detection task, such as for search andrescue in the SubT Challenge, there are a small subset ofobjects to be detected. This fact can be utilized to rapidlyadapt an existing network for the specific task. Our proposedapproach is to fine-tune the weights of a pre-existing network(YOLO V3 Tiny [19] pretrained on the MS COCO dataset2014 [14]) on a carefully selected set of images of the objectsof interest in representative environments (mines and powerplants, in this context). This custom dataset with approxi-mately 1000 images per category captured a distribution ofrepresentative visual challenges: low lighting, varying wallcolors, textures and markings and varying object poses. Thisdataset was incrementally built up over a year-long testcampaign to achieve a balanced distribution of conditions.It is this curated dataset that allows the network to performwell in perceptually-degraded conditions.
Training the model takes approximately 5 hours on anNvidia Titan Xp with a batch size of 64 and subdivisions of8, stopping at a loss of 0.3 to avoid overfitting. A standarddata augmentation process is applied, including spatial andcolor shifting. The model can be trivially extended to includemore categories of objects which may be of interest.
D. Robot-Relative Localization
In the second stage of our pipeline, we use purely geomet-ric approaches to estimate the position of objects. To filteroutliers and improve localization accuracy, we combine the
detections across multiple images, to feed into the relativelocalization module. A typical observation sequence of anobject contains an arbitrary number of observations of thesame object, depending on the robot’s speed, the object’sdistance and the detection rate. We assume there is a depthmeasurement for each image, which can be obtained bymultiple means, such as stereo, RGB-D, by using a localpoint cloud map from other sensors (such as lidar) or byusing the height of the bounding box and prior knowledge ofthe object’s size. When using stereo or RGB-D, the object’slocation for each observation is estimated by projecting thecentroid of the bounding box to the average depth of thepixels inside the bounding box. This helps to moderatethe effect of noise in the bounding box centroid or thepossibility that a background pixel, or one with a zero-depth(i.e. faulty) reading is at the centroid. We leverage thesedifferent methods of depth estimation in a priority queue toprovide robustness to sensor failure, a key element for long-term autonomy. If the highest priority method fails, due to ahardware failure or lack of information, then the next highestmethod is used.
A sequence of observations is defined to be complete if nonew observations are made of an object in the same categoryis made for 3 sec. The highest confidence image in thissequence is saved as a thumbnail for the object report.
Equation 1 defines the transformation chain which providesthe estimated world position of the object, where artTcam isfrom the relative localization module and camTrobot is basedon the robot’s CAD model.
artTrobot =art Tcam ·cam Trobot (1)
A linear Kalman Filter is used to estimate the object’slocation from multiple observations, with the state to be esti-mated x as the position of the object relative to the robot andthe measurement is the input from a camera z =art Tcam. Thepseudo-control input is to account for the robot movementrelative to the object u =−robotT−1
map,k−1 ·robot Tmap,k.
E. Global Localization
Once an observation sequence is complete, the object issent to a global localization algorithm, which is based ona global pose graph optimization framework described byEbadi et al. [8]. The module adds a node in the pose graphfor the object, along with a relative position factor to thenearest robot pose in time. The maps and pose graphs fromeach robot are aggregated on a base station version of thesame module. An example of the objects being included inthe pose graph can be seen in Fig. 10. The pose graph nodescorresponding to objects are optimized along with all othernodes, after events such as loop closures. The optimization ofthe graph moves the global position of the objects, promptingan update on the user interface.
F. Reconciliation
A reconciliation module associates repeat observations ofobjects using a simple distance metric for global position (setto 5 m in our tests). This is a basic implementation that is a

Fig. 4. A sample scored ob-ject report in the browser-based UI. This is the final stepin the pipeline, allowing thehuman supervisor to confirmincoming reports and modifythem if necessary.
placeholder for more advanced methods such as visual placerecognition.
G. Communicating Reports
The utility of the object reports depends on being able totransmit them from the robot to the base. The object data,along with mapping and other status information, is stored inan onboard buffer which is cleared when in communicationsrange, with object reports being given priority over otherrobot information. The bandwidth requirement of each objectmessage is approximately 30KB/s.
H. User Interface
The final stage of the pipeline is the user interface, whichconsists of a browser-based visualization of incoming objectreports stored in a local database, including a thumbnailimage and relevant metadata (Fig. 4). The human supervisorhas access to both the report on its own as well as its locationon the map if a broader context is desired.
IV. EXPERIMENTS AND RESULTS
A. Overview
Short of deployment in a live search and rescue scenario,the best way to test the effectiveness of these systemsfor real-time applications is in a time-critical competitionsetting. Hence, the experimental data presented here werecollected during the SubT Challenge. In the first phase of thecompetition known as the Tunnel Circuit, which was held atthe site of the National Institutes for Occupational Safety andHealth (NIOSH) in Pittsburgh, PA in August 2019, robots hadto explore a disused coal mine. The second phase, the UrbanCircuit, was held at the Satsop Business Park in Elma, WA inFebruary 2020. Detection data were collected from a total of8 one-hour runs of Huskies and Spots in both environments.The goal was to score points by localizing 20 instances ofthe objects specified in III-B to within a 5 m radius of theiractual position, with respect to a starting reference frame.There were 3-6 instances of each object type.
B. Hardware Implementation
The system configuration described in this paper hasbeen demonstrated on the Clearpath Robotics Husky A200unmanned ground vehicle (UGV) and Boston DynamicsSpot, as shown in Fig. 5. Each vehicle is equipped withthree Intel RealSense D435i RGB-D cameras, pointed tothe front, left and right and a FLIR Boson thermal camera.
The camera drivers and the CNN are run on an NvidiaJetson Xavier, a leading GPU processor for mobile robotapplications. The image streams and detection results aretransferred to the main robot CPU, where all other processingis performed. Diffuse LED lights with a cone of illuminationof approximately 120 deg are positioned next to each camera.
Fig. 5. Three Intel RealSense D435i cameras are used for object detectionand localization, shown here mounted on a Boston Dynamics Spot (left) andClearpath Robotics Husky A200 UGV (right). The thermal camera, WiFiantenna and CO2 sensor are also shown.
C. Visible Object Detection Performance
Fig. 6 depicts the distribution ranked by classification con-fidence, of true positive detections, represented by diamonds,of visually and thermally observable objects received at theBase Station, over all reports. It is apparent that the truepositive detections are found at a wide range of confidences.
To help visualize the detections behind these trends, Fig.9 presents three examples each of true and false positivesfor each object type. There were frequent (and sometimesvery convincing!) false positives caused by wall textures ormarkings which matched the shape and color of the targetobject.
D. Spatially-Diffuse Object Detection Performance
1) Cell Phone: Localization of the cell phone using WiFiwas generally reliable if the robot drove right past it. Howeverwhen it is close enough to pick up a signal but does not driveright by it, the best localization estimate it can make is fromthe peak signal recorded. If the report from this location isrejected, the human supervisor can then try to extrapolateits location by processing a visualization where the sphereradius corresponds to the signal strength (Fig. 7).
2) Gas: It was challenging to achieve high performancein CO2 detection and localization for two reasons. Firstly,as the environment was complex, with many small rooms,the robots did not necessarily enter the rooms with CO2,especially as the priority was to rapidly push the explorationfrontier forward. Secondly, there is an abrupt difference ingas concentration from one side of the doorway of the sourceroom to the other. If the robot did not enter the source room,not only did it not get a chance to sniff the peak, but it wouldalso struggle to detect what little might have leaked out fromthe room, owing to the 20 sec rise time of the sensor. Thenominal driving speed was too fast for the peak signal toregister before the robot had moved away from this zone.

Fig. 6. Distribution, ranked by classification confidence, of true positivereports (diamonds) of visually observable objects received at the BaseStation, over all reports, represented by each line. Each object is assigneda color and the different shades of each color are from separate runs. Notethe log scale on the horizontal axis, for clarity.
Fig. 7. Spatially-diffuse object signal strength readings are overlaid on themap, proportional to marker size and color (left: cell phone, right: gas).Readings are taken at 1Hz (cell phone) and 0.5Hz (gas).
Note that in the case of Fig. 7 at approximately 2 m fromthe source room, the concentration only reached 600 ppm, farshort of the 2000 ppm in the room itself. The correspondinglimited range of marker sizes made it harder for the humansupervisor to identify hot spots.
E. Localization Performance for Visual Detections
The precision of localization of objects relative to the robotis hard to quantify with this dataset. While the estimated andactual object positions are available in the global frame, theground truth robot pose is not, hence it is not possible tocalculate the relative localization component. Nonetheless,its qualitative performance may be seen in Fig. 10 (right) byobserving where the objects are within the map. An accuratelocalization should see the object inside the tunnel near to theposition a human could infer from the images. It is apparentthat the object positions are accurate (approximately <1merror) relative to local map features.
V. DISCUSSION
A high-level analysis was made of the scoring status forevery object in two Urban Circuit courses, including a rootcause analysis for unscored objects. Fig. 8 shows that amongthe unscored objects, in most cases, no robot was in thevicinity of the object. In 2-3 instances per run, the objectswere either invisible to any ground robot (i.e. in a wall cavityonly visible by drone) or outside the camera’s vertical fieldof view. In light of this, we are in the process of evaluatingconsumer-grade 360◦ cameras to expand the robot’s field ofview to see objects placed above the ground. The remainingcauses include not entering the gas room, map drift and a
Fig. 8. Scoring breakdown for the two highest-scoring Urban Circuit runs
missed detection by YOLO (in this case, a vent with highmotion blur in the frame). Pipeline/UI challenges refer toeither messages being dropped at some stage in the pipelineor the human supervisor not being able to discern the objectin the thumbnail, and hence not submitting it.
A major difference we found when working in a real-worldscenario as opposed to testing on datasets was that the typicalperformance metric of an object detection pipeline - jointlymaximizing precision and recall - was not as relevant asmaximizing recall itself, as it was unacceptable to miss anydetections. To maximize the chance of detecting all objects, itwas necessary to run a smaller network at a faster rate on therobot, and rely on the human (and in the near future, a higherperformance neural network) on the base station to furtherrefine the list of object candidates. The data in Fig. 6 indicatesthat the system is not yet ready for a fully autonomousdeployment without human oversight; the operator needs toreview the report candidates across the confidence spectrum.
The majority of future work is in reducing the visualdetection false positive rate, and we plan to investigate bothearly- and late-stage sensor fusion between the cameras andlidar. Such methods are also likely to decrease the relianceon using a single classification confidence value from YOLO,whose calculation process is not transparent, but which iscurrently the only way to rank object candidates on thebase station. A better metric would take more parametersinto account; the object’s distance from the camera, itsillumination and any partial occlusion.
VI. CONCLUSIONSThis paper has addressed the problem of how to archi-
tect and implement an object detection system that rapidlyprovides situational awareness to a human supervisor over-seeing a multi-robot time-critical search and rescue missionin an unknown underground environment. Detection resultsfor static, visible objects and invisible spatially-diffuse phe-nomena have been presented. In the case of the former, astructured data collection process allowed an existing neuralnetwork detection framework to be applied to a customdetection task with minimal overhead. Relative localizationis separated from the CNN for speed of operation, andto enable a robust architecture with a hierarchy of fall-back distance measurements. For the latter object type, avisualization of signal strength was used to assist localization.We incorporated these elements into an end-to-end pipelinefor detection, localization and visualization across multiplesensing modalities, that was successfully demonstrated in atime-constrained field test.

Fig. 9. For each of the five categories of objects to be detected visually, six examples including three true positive and three false positive detections areprovided, along with the classification confidence. Ideal detection conditions are when the object is close, well-illuminated and not obscured, producing avery high classification confidence when all three are true. Detections are still made when several of these conditions do not hold. False positive detectionshave a higher variation in confidence, and are typically caused by existing features in the environment which share color, form or aspect ratio featureswith their trained category. Confidence values for thermal images have a much higher range. One false negative example - a missed detection of a vent -is included here.
Fig. 10. Left: Detected objects are added to a global pose graph with an observation factor that handles detection by multiple robots and adjusts objectlocations based on periodic optimizations of the complete graph. Right: examples of a scored localization for each category of object with a visual meansof detection (left-right: survivor - white, drill - green, backpack - red, fire extinguisher - pink). The local and global maps in the top row are taken at thesame time as the image on the third row. The maps in the second row include the symbol for each object category, published after the termination of therespective observation sequence. In each case, the robot is moving from left to right. The bold white lines in the top row indicate the field of view of thecamera that took the image in the bottom row. The small green circles in the top and middle rows are pose graph nodes, with an average spacing of 1m.The green lines in the second row represent the relative position factors added to the pose graph. In each case, the eventual object position matches thelocation of the bulge in the local costmap, further validating the accuracy of the relative localization.

ACKNOWLEDGMENTSThe authors would like to thank Torkom Pailevanian,
Arash Kalantari, Thomas Touma, Alessandro Buscicchio andFernando Chavez for preparing the robot hardware, to JeremyNash, Kyohei Otsu and Nobuhiro Funabiki for their work onartifact visualization and CO2 sensor tuning. This researchwas carried out at the Jet Propulsion Laboratory, CaliforniaInstitute of Technology, under a contract with the NationalAeronautics and Space Administration (80NM0018D0004).2020 California Institute of Technology. Government spon-sorship acknowledged.
REFERENCES
[1] Ali Agha. Team CoSTAR, 2020. URL https://subt.jpl.nasa.gov/.
[2] Ali Agha, KL Mitchell, and PJ Boston. Robotic explo-ration of planetary subsurface voids in search for life.AGUFM, 2019:P41C–3463, 2019.
[3] Nikolay Atanasov, Jerome Le Ny, and George Pappas.Distributed algorithms for stochastic source seekingwith mobile robot networks: Technical report. arXivpreprint arXiv:1402.0051v2, 2014.
[4] Xiaozhi Chen, Kaustav Kundu, Yukun Zhu, Andrew GBerneshawi, Huimin Ma, Sanja Fidler, and Raquel Ur-tasun. 3d object proposals for accurate object class de-tection. In Advances in Neural Information ProcessingSystems, pages 424–432, 2015.
[5] Changhyun Choi and Henrik I Christensen. 3d tex-tureless object detection and tracking: An edge-basedapproach. In 2012 IEEE/RSJ International Conferenceon Intelligent Robots and Systems, pages 3877–3884.IEEE, 2012.
[6] Timothy Chung. Darpa subterranean challenge aimsto revolutionize underground capabilities. https://www.darpa.mil/news-events/2017-12-21.
[7] DARPA. Artifacts specification urban circuit event.https://www.subtchallenge.com/resources/SubTUrban Artifacts Specification.pdf.
[8] Kamak Ebadi, Yun Chang, Matteo Palieri, AlexStephens, Alex Hatteland, Erik Heiden, AbhishekThakur, Nobuhiro Funabiki, Benjamin Morrell, SallyWood, Luca Carlone, and Ali-akbar Agha-mohammadi.Lamp: Large-scale autonomous mapping and position-ing for exploration of perceptually-degraded subter-ranean environments. In IEEE International Conferenceon Robotics and Automation, 2020.
[9] FLIR. Remote detection and localization of gasleaks with autonomous mobile inspection robots intechnical facilities. URL https://www.flir.com/discover/instruments/gas-detection/remote-detection-and-localization-of-gas-leaks-with-autonomous-mobile-inspection-robots-in-technical-facilities/.
[10] Yasutaka Furukawa and Jean Ponce. Accurate, dense,and robust multiview stereopsis. 32(8):1362–1376,2010.
[11] Ammar Husain, Heather Jones, Balajee Kannan, UlandWong, Tiago Pimentel, Sarah Tang, Shreyansh Daftry,
Steven Huber, and William L Whittaker. Mappingplanetary caves with an autonomous, heterogeneousrobot team. In 2013 IEEE Aerospace Conference, pages1–13. IEEE, 2013.
[12] Wadim Kehl, Fausto Milletari, Federico Tombari, Slo-bodan Ilic, and Nassir Navab. Deep learning of localrgb-d patches for 3d object detection and 6d pose esti-mation. In European Conference on Computer Vision,pages 205–220. Springer, 2016.
[13] Dahua Lin, Sanja Fidler, and Raquel Urtasun. Holisticscene understanding for 3d object detection with rgbdcameras. In Proceedings of the IEEE International Con-ference on Computer Vision, pages 1417–1424, 2013.
[14] Tsung-Yi Lin, Michael Maire, Serge Belongie, JamesHays, Pietro Perona, Deva Ramanan, Piotr Dollar, andC Lawrence Zitnick. Microsoft coco: Common objectsin context. In European conference on computer vision,pages 740–755. Springer, 2014.
[15] Wei Liu, Dragomir Anguelov, Dumitru Erhan, ChristianSzegedy, Scott Reed, Cheng-Yang Fu, and Alexander CBerg. Ssd: Single shot multibox detector. In Europeanconference on computer vision, pages 21–37. Springer,2016.
[16] David G Lowe et al. Object recognition from localscale-invariant features. In iccv, volume 99, pages1150–1157, 1999.
[17] Aaron Christopher Morris. Robotic introspection forexploration and mapping of subterranean environments.ProQuest, 2007.
[18] Joseph Redmon and Ali Farhadi. Yolo9000: better,faster, stronger. In Proceedings of the IEEE confer-ence on computer vision and pattern recognition, pages7263–7271, 2017.
[19] Joseph Redmon and Ali Farhadi. Yolov3: An incre-mental improvement. arXiv preprint arXiv:1804.02767,2018.
[20] Joseph Redmon, Santosh Divvala, Ross Girshick, andAli Farhadi. You only look once: Unified, real-timeobject detection. In Proceedings of the IEEE conferenceon computer vision and pattern recognition, pages 779–788, 2016.
[21] Shaoqing Ren, Kaiming He, Ross Girshick, and JianSun. Faster r-cnn: Towards real-time object detectionwith region proposal networks. In Advances in neuralinformation processing systems, pages 91–99, 2015.
[22] Fred Rothganger, Svetlana Lazebnik, Cordelia Schmid,and Jean Ponce. 3d object modeling and recognitionusing local affine-invariant image descriptors and multi-view spatial constraints. International Journal of Com-puter Vision, 66(3):231–259, 2006.
[23] Shuran Song and Jianxiong Xiao. Sliding shapes for3d object detection in depth images. In European con-ference on computer vision, pages 634–651. Springer,2014.
[24] Christian Szegedy, Alexander Toshev, and Dumitru Er-han. Deep neural networks for object detection. In

Advances in neural information processing systems,pages 2553–2561, 2013.
[25] N. Zhigang and W. Lu. Hazardous gas detecting methodapplied in coal mine detection robot. In 2011 ThirdInternational Conference on Measuring Technology andMechatronics Automation, volume 2, pages 308–311,2011.
[26] Yin Zhou and Oncel Tuzel. Voxelnet: End-to-endlearning for point cloud based 3d object detection. InProceedings of the IEEE Conference on Computer Vi-sion and Pattern Recognition, pages 4490–4499, 2018.