Obesity, Lifestyle and Cardiovascular Risk in Down syndrome ...
144
%&*, %&* ! $"(%'$ % ! ")! %*!$", $$- %*!$" ! % %*!$" $!! "$%&$+ %% #$&!& " '&$&"! !%&&'& " % !% '&* " ! 0./1
-
Upload
khangminh22 -
Category
Documents
-
view
0 -
download
0
Transcript of Obesity, Lifestyle and Cardiovascular Risk in Down syndrome ...


© Marianne Nordstrøm, 2015 Series of dissertations submitted to the Faculty of Medicine, University of Oslo No. 2065 ISBN 978-82-8333-084-7 All rights reserved. No part of this publication may be reproduced or transmitted, in any form or by any means, without permission. Cover: Hanne Baadsgaard Utigard. Printed in Norway: AIT Oslo AS. Produced in co-operation with Akademika Publishing. The thesis is produced by Akademika Publishing merely in connection with the thesis defence. Kindly direct all inquiries regarding the thesis to the copyright holder or the unit which grants the doctorate.

III
The work presented in this thesis was performed at Frambu Resource Centre for Rare
Disorders and Department of Nutrition, Institute of Basic Medical Sciences, University of
Oslo, and has been carried out from October 2011 to March 2015. Financial founding was
provided by ExtraStiftelsen in collaboration with The Norwegian Association for Persons
with Developmental Disabilities (NFU), Frambu Resource Centre for Rare Disorders and
Johan Throne Holst Foundation for Nutritional Research.
My deepest gratitude goes to my supervisors, professors Svein O. Kolset and Benedicte Paus
for their excellent scientific guidance. Svein, I am especially grateful for your positive attitude
and your remarkable efforts to always be available. Benedicte, thank you so much for your
always positive remarks, intelligent comments and helpful suggestions.
Special thanks also go to the collaborating patient organizations; NFU, The national network
for Down syndrome, The national association for Prader-Willi syndrome and Norwegian
Associations for Williams syndrome for their collaboration and support in recruitment of
study participants. Great thanks also to Tone Hammerlund at NFU for the cooperation
throughout these years.
Gratitude goes to my co-authors Bjørge Herman Hansen, Lene Frost Andersen and Kjetil
Retterstøl for providing me with methodological knowledge, scientific experience as well as
excellent educational collaboration. Your contributions have been invaluable.
Throughout these years I have enjoyed being part of the scientific network at Department of
Nutrition and in the research group of Svein O. Kolset, providing me with good scientific
discussions, great laughs and friendships. Admiration and thanks goes especially to; Annicke
Stranda, Trine M Reine, Astri J Meen, Ingrid B. Moss Kolseth, Ingunn Narverud, Jackob Juel
Christiansen, Anne Juul Skjetne, and Tram Thu Voung,
Warm thanks also go to everybody at Frambu. The former and present leaders, for their
facilitation of the project and for their continuous trust in me. To all my present and former
inspiring and supportive colleagues especially; Kari Hagen, Kaja Giltvedt, Gro Trae, Sissel
W. Berdesen, Eva Næss, Wenche Åstrøm, Lise B Hoxmark, Rita S. Stige, Kari Stenslie,
Krister Fjermstad, Stine Borgen, Anders Wold, Simen Aabøe, Rasmus Dinessen, Mona Haug,

IV
Lisen Mohr, Simen Stokke, Kristin Solheim Hustad and Øyvind Kanavin. I would not have
been possible without you.
I would also like to express my gratitude to Tove Bergem-Ohr and her skillful colleagues at
the Interdisciplinary Medical Laboratory and Medical Biochemistry at Ahus University
Hospital.
My deepest thanks also goes to Torgeir Kolset, although I’ve never personally have meet him,
I’m sure his contributions to this work goes beyond my imagination.
Finally, I will thank all my friends and family for their continuous encouragement throughout
these years. A special thank goes to Andreas for his patience, support, and doubtless believe
in me, and to Gabriel and Dina for the endless joy.
Oslo, March 2015
Marianne Nordstrøm
V
Increased risk of obesity has been described for persons with mild to moderate intellectual
disability (ID) and unhealthy lifestyle has been documented. However this has not been
investigated to any great extent in relation to most specific genetic conditions associated with
ID. Moreover, there is a paucity of data describing the risk of developing atherosclerotic
cardiovascular disease (CVD) and the association with obesity in subgroups associated with
ID. To investigate and explore these perspectives a national cross-sectional study in persons
16-43 years of age with Down syndrome (DS) (n=40), Prader-Willi syndrome (PWS)(n=22)
and Williams syndrome (WS) (n=25) was conducted.
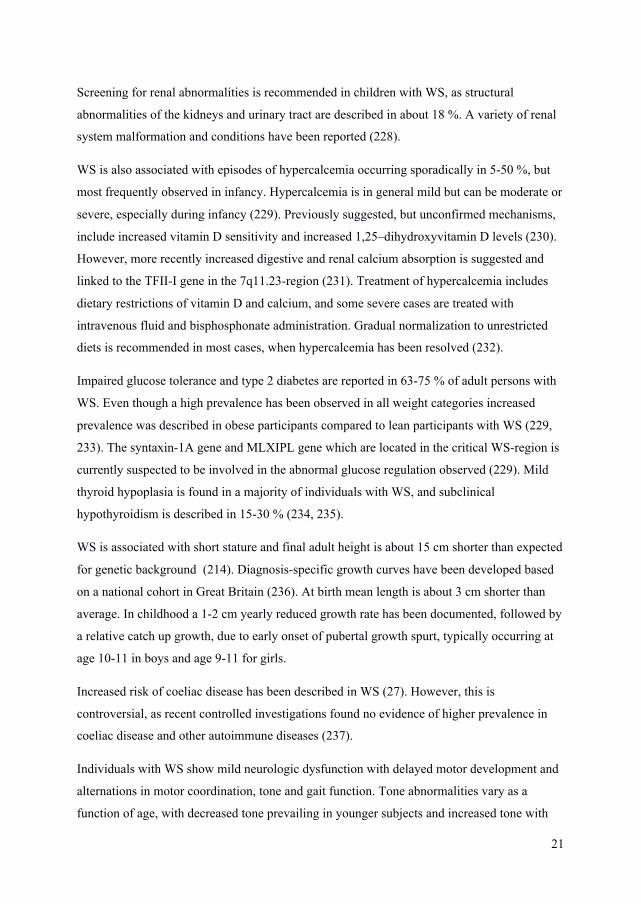
Accelerometer-determined physical activity was documented in paper I, and we found
sedentary lifestyle with low adherence to physical activity recommendations in all three
subgroups. Females in all subgroups were found to have especially low levels of physical
activity. No association between BMI and overall physical activity was detected, however
BMI was strongly associated with reduced physical capacity measured by six-minute walk
test.
In paper II we used a simplified self-reported food intake frequency assessment in
combination with supportive measurements of biomarkers in blood samples. We found that a
large proportion of persons with WS and DS living in community residences had low intake
frequencies of fruits and vegetables. Low consumption frequency of fish and less use of
omega-3 supplementation were also found in a majority of persons with WS.
When investigated in relation to living arrangements, increased food related autonomy was
found for persons with DS living in communities when compared to those living with
relatives. Furthermore, among the community-dwelling participants a larger proportion
frequently used precooked meals. The data also indicate that an increased proportion of
participants living in communities had more frequent intake of soft drinks. No other
significant differences in proportions with high and low consumptions frequency of the
investigated foods were found when participants in the different living arrangements were
compared.
Abdominal obesity was prevalent in all three subgroups and associated with increased risk of
CVD. Furthermore, diversity in risk of CVD was observed, which may be explained by the

VI
genetic basis of the studied syndromes. As presented in paper III, the PWS and WS groups
were found to have elevated risks of CVD, whereas DS was associated with low risk. High
prevalence of hypertension and type 2 diabetes was described in the PWS group. Similarly,
high prevalence of hypertension and clear indication of increased risk of type 2 diabetes was
also seen in the WS group but in combination with a more favourable blood lipid profile. In
DS low prevalence of hypertension and type 2 diabetes was noted, but with comparable
prevalence of metabolic syndrome as in the two other subgroups.
To improve the public health situation there is a need of diagnosis and gender adjusted
preventive strategies to promote weight reduction and improvements in lifestyle.
Furthermore, development of tailored diagnose-specific health checks is needed to ensure
optimal health outcome among adults with these genetic syndromes.

VII
List of scientific papers
I. Nordstrøm M, Hansen BH, Paus B, Kolset SO,. Accelerometer-determined physical
activity and walking capacity in persons with Down syndrome, Williams syndrome
and Prader-Willi syndrome. Res. Dev. Disabli. 2013:34, 4395-4430.
II. Nordstrøm M, Paus B, Andersen LF, Kolset SO,. Dietary aspects related to health and
obesity in in Williams syndrome, Down syndrome and Prader-Willi syndrome. Food
Nutr. Res. 2015:59, 25487.
III. Nordstrøm M, Paus B, Retterstøl K, Kolset SO,. The prevalence of metabolic risk
factors of atherosclerotic cardiovascular disease in Williams syndrome, Prader-Willi
syndrome and Down syndrome. (Revised and resubmitted manuscript)

VIII
Abbreviations
ADHD Attention deficit hyperactivity disorder
BMI Body mass index
CVD Cardiovascular disease
DS Down syndrome
HDL High density lipoprotein
ID Intellectual disability
IQ Intelligence quotient
LDL Low density lipoprotein
MVPA Moderate-to- vigorous physical activity
PWS Prader-Willi syndrome
RR Relative risk
SVAS Supravalvar aortic stenosis
WC Waist circumference
WS Williams syndrome

IX
Table of contents ................................................................................................................ III
.................................................................................................................................. V
List of scientific papers ........................................................................................................... VII
Abbreviations ........................................................................................................................ VIII
Table of contents ...................................................................................................................... IX
1 Introduction ........................................................................................................................ 1
1.1 Intellectual disability ................................................................................................... 1
1.2 Genetic causes of intellectual disability ...................................................................... 2
1.3 Health and health inequalities in persons with intellectual disability ......................... 3
1.4 Lifestyle related health in persons with intellectual disability .................................... 4
1.4.1 Overweight and obesity ........................................................................................ 4
1.4.2 Physical activity and physical fitness ................................................................... 5
1.4.3 Diet ....................................................................................................................... 7
1.4.4 Cardiovascular disease ......................................................................................... 9
1.5 Genetic disorders in this study ................................................................................... 10
1.5.1 Down syndrome ................................................................................................. 10
1.5.2 Prader-Willi syndrome ....................................................................................... 13
1.5.3 Williams syndrome ............................................................................................ 18
1.6 Need of new knowledge ............................................................................................ 22
2 Study aims ........................................................................................................................ 23
3 Methods ............................................................................................................................ 24
3.1 Ethical aspects ........................................................................................................... 24
3.2 Study design and population ...................................................................................... 25
3.3 Data collection ........................................................................................................... 27
3.4 Measurements ............................................................................................................ 27
3.4.1 Assessment of physical activity ......................................................................... 27
3.4.2 Physical capacity ................................................................................................ 28
3.4.3 Clinical Examination .......................................................................................... 29
3.4.4 Questionnaire collected data .............................................................................. 29
3.4.5 Biochemical measures ........................................................................................ 31
3.4.6 Other data ........................................................................................................... 31


1
1 Introduction
1.1 Intellectual disability Intellectual disability (ID) refers to incomplete development of cognition that cause
significant limitations in intellectual functioning, and adaptive behavior, and manifestation of
these symptoms before adult age (1). ID can be associated with other clinical findings as part
of a syndrome or can occur as an isolated phenotype. Intellectual disability is currently the
preferred international term (2, 3), although other terms as mental retardation, developmental
disabilities and learning disabilities are also being used for categorization of the condition
(1), but not always used with equal definitions, leading to some differences in the individuals
being included in this group. The continuous use of mental retardation has especially been
questioned because it implies a static, unchanging condition rather than one that can change
over time depending on its etiology and the available environmental support (2, 3). The term
ID is used throughout this thesis, regardless of terminology in the sources used for reference.
There are several systems globally for recognition of ID and classification of its severity. The
most widely distributed and the one used in Norway is The Tenth Revision of the
International Statistical Classification of Diseases and Related Health Problems (ICD- 10) (4).
Chapter V lists ID [mental retardation], and defines ID by intelligence quotient (IQ) below 70,
and divides the condition into levels of mild, moderate, severe, profound ID. The level of
severity reflects the extent of the intellectual impairment and daily functioning measured by
standardized intelligence tests and standardized tests for assessment of adaptive behaviors.
The diagnosis and category chosen should be based on global assessment and not on a single
or specific impairment in cognition or in behaviors alone. Mild ID is defined by IQ in the
range of 50-69, moderate ID by IQ 35-49, severe ID by IQ 20-34, and in profound ID IQ is
below 20 (4). The majority of the population with ID falls within the mild ID category with
descending occurrence with increase in severity. In persons diagnosed with ID, mild ID,
moderate ID, severe ID, and profound ID make up approximately 85 %, 10 %, 3-4 %, and 1-2
%, respectively (3).
The prevalence of ID across the world is about 1 %, however occurrence depend on definition
and diagnostic approached used. Furthermore, differences are also found based on age,
gender, and socioeconomic status (5-7). Increased prevalence of ID is reported in children and

2
adolescents compared to adults, more frequently observed in males compared to females, and
in low income countries compared to high income countries (5). In Norway, the prevalence of
ID is estimated to be 0.44 per 100 inhabitants and with geographic and urban-rural differences
in prevalence (8). The prevalence of ID was reported to be 0.62 per 100 in a pediatric cohort
born between 1980 and 1985 in Akershus County (9).
1.2 Genetic causes of intellectual disability There are multiple etiologies of ID, and causes can be classified by different classification
systems. Traditionally, causes have been classified based on the timing into; prenatal,
perinatal and postnatal causes (3). Others divide causes in to biological and environmental
(10). Classifications of etiological causes into a more specific subcategories have also been
suggested, such as genetic, acquired (congenital and developmental), environmental and
sociocultural, (11).
Genes plays important role in the causation of ID (Goldstein 2005). Although factors like e.g.
infection and trauma can result in cognitive impairment, most severe forms of ID have a
genetic basis (12, 13). New and improved genome wide diagnostic approaches, like whole-
exome sequencing and whole-genome sequencing have resulted in the identification of a
large number of etiologic genes and genomic rearrangements involved (12, 14).
Many genetic conditions associated with ID are due to chromosome disorders (12, 15). These
conditions are caused by genetic copy number variation due to abnormal chromosome
number, e.g. trisomy, or structure. In abnormal chromosome structure a part of the
chromosome may be extra, a so-called duplication, or missing, a so-called deletion. Changes
in chromosome structure may vary considerably in size, ranging from a kilobase affecting
single gene, to several megabases affecting larger segments of DNA. Other genetic
mechanisms related to ID include DNA sequence alternation or epigenetic changes where
expression of genes is altered without changing the DNA sequence, such as by defects in
methylation, turning on or off gene expression, identified in some individuals with ID (16).
Currently the understanding of genetics in ID is extensive, but far from complete as the
specific etiology remains unknown for a significant proportion of persons with ID (13).
3
1.3 Health and health inequalities in persons with intellectual disability Health in persons with ID reflects, as in the general population, complex interactions between
biology, behavioral, and environmental factors. In Norway, the health condition in the
population is in general good and life expectancies are high, however inequalities in health
are observed in relation to socioeconomic status (17). For persons with ID improved health
care, medical treatments and better education have resulted in increased life expectancies,
greater academic achievements and more fulfilling lives (3, 18-20). Yet, as a group these
individuals still experience poorer health and reduced life expectancies compared to the
general population (21-23). In a recent investigation from United Kingdom median life
expectancies from a cohort of persons with ID was reported to be 64 years. Furthermore, in
total 37 % of the deaths in the ID group were reported to be avoidable premature deaths, and
much higher compared to the general population where 13 % of the deaths were premature.
Females with ID was found to have even more reduced life expectancy compared to males,
with a median age of death 63 versus 65. The reduction in life expectancies compared to the
general population was 20 years for females and 13 years for males, respectively (24). The
difference in health status and life expectancies is to a certain extent avoidable and represent
health inequalities. Several key determinants of health inequalities that affect people with ID
have been recognized (25, 26). First, persons with ID are more likely to have congenital
abnormalities and genetic predispositions to certain health conditions (3, 27-29). Second,
persons with ID are exposed to less favorable social circumstances such as unemployment,
low economic status, and reduced social network (30). Third, persons with ID have increased
risk of unrecognized health needs (31). Underlying features are difficulties in recognition and
communication of health problems due to cognitive impairment from the individuals
themselves, lack of knowledge and skills to interpret expression of emerging health issues by
both careers and health professionals (32, 33). Furthermore, persons with ID take less part in
health screening programs (31). Fourth, persons with ID have high risk of unfavorable
lifestyle behaviors, especially related to obesity, inactivity and poor diets (34-37). Fifth,
compared to the general population less research includes persons with ID, leading to reduced
development of knowledge and treatments for these individuals (38).

4
1.4 Lifestyle related health in persons with intellectual disability
1.4.1 Overweight and obesity
Overweight and obesity can be defined as excess of adipose tissue. Increased body weight is
in the general population associated with higher risk of hypertension, dyslipidemia, type 2
diabetes, metabolic syndrome, coronary heart disease, stroke, sleep apnea, and some cancers
(39). Obesity is furthermore associated with increased risk of cardiovascular mortality (40).
Body mass index (BMI) is a ratio of weight-for-height that is commonly used for
classification of overweight and obesity, and is calculated by the formula: Kg/m2.
Table 1: Overweight and obesity in adults by use of BMI (39): Normal weight 18.5-24.9 Overweight 25.0-29.9 Obesity ≥ 30.0 Age and gender specific isoBMI-values are used in children less than 18 years of age.
It is well recognized that not only total amount of body fat is of interest, but also the
distribution of the adipose tissue. Waist circumference (WC) is a measurement of central
obesity and in the general population WC correlates and predicts obesity related
cardiometabolic complications better than BMI (41-44).
Table 2: Sex-specific cut points of WC for Caucasians defined by the risk of cardiometabolic complication (39) Males Females Increased ≥ 94 cm ≥ 80 cm Substantially increased ≥ 102 cm ≥ 88 cm Overweight and obesity rates have been increasing in most parts of the world including
Norway. The most recent report in the Norwegian population found the prevalence of obesity
to be about 13 – 14 % for persons 20-29 years. Overweight in the same age-category was
found in about 35 % of males and 25 % of females. In the age-group 30-39 years of age about
20 % was obese, 50 % of males and 20 % of females and were overweight, respectively (45).
In Norway, higher prevalence of obesity is found among persons with low educational level
compared to high educational level (46).

5
Numerous epidemiological reports over the past years have documented high prevalence of
overweight and obesity in persons with ID. Increased prevalence when compared to the
general population is found in adolescents, adults and elderly (34, 47-56). The high
prevalence of obesity among persons with ID is a major public health concerns as some
studies indicate that obesity also for persons with ID are associated with increased risk of
secondary health conditions (51, 53).
The prevalence of obesity varies within the ID group. Females are more likely to be obese
compared to males (34, 47, 49, 54, 55, 57). The risk of obesity is also increased in persons
with mild to moderate ID when compared to severe and profound ID (47, 53, 54, 57). Other
determinants associated with high risk of overweight and obesity includes independent living
in communities, daily soft drink consumption, use of atypical antipsychotic medication or
other medication with risk of weight gain, and reduced level of physical activity (49, 54, 57).
Studies also indicate that certain subgroups such as people with Down syndrome (DS),
Prader-Willi syndrome (PWS) and autism spectrum disorder may be at particular risk (28, 49,
51, 53, 57).
Underweight is also more common in ID that in the general population, but not as common as
obesity and is associated with severe ID (47, 57). Taken together, illustrates the heterogeneity
and complexity in weight related health issues for persons with ID.
1.4.2 Physical activity and physical fitness
Physical activity is defined as any bodily movement produced by skeletal muscles that
substantially increases energy expenditure (58). It is a complex human behavior carried out
for a variety of purposes (59) and differs further in four dimensions; frequency, intensity,
duration and the type of activity carried out. Physical fitness refers to a set of attributes that an
individual have or achieve and is linked to the person’s ability to carry out daily tasks. Health-
related components of physical fitness are cardiovascular endurance, muscular endurance and
strength, body composition, balance and flexibility (59).
Substantial empirical evidence confirms that regular participation in physical activity has a
positive impact on health in individuals of all ages and gender (60, 61). The impact of
physical activity shows an inverse dose-dependent relationship with health outcomes and all-
cause mortality (61, 62). Even so, numerous studies by use of questionnaires and objective

6
assessments, have found that people with ID are less likely to engage in physical activity, to
be more sedentary, and tend to be less physical fit compared to peers (36, 54, 57, 63-68).
In ID demographic factors such as gender, age, and level of ID have been documented to
affect physical activity. Some studies suggest that females are less active compared to males
(36, 54, 69, 70). Males were also described to be more interested in trying out new physical
activities (69). A decline in level of physical activity associated with ageing has been
observed (36, 69, 71), whereas others have not found this association (70). More severe levels
of ID correlate with reduced physical activity compared to milder ID phenotype (36).
For persons with ID many of the same barriers to physical activity as for people without
disabilities are reported, such as job, lack of necessary financial resources, weather and
preference of sedentary activities (72, 73). However unique barriers are also described and
include lack of transportation, reduced availability of physical activity resources, and absence
of guidance and social support (73-76).There is a particular concern regarding maintaining
organized physical activities over time (71). This highlights the necessity of continuity and
structured support for physical activity in people with ID (77).
Facilitators of physical activity also exist and have been described to be parents, teachers,
caregivers, and organizations that foster interest, social support and development of skills.
Moreover, social connections and interactions with other participants performing the activity
also seem important for maintenance of activities (77).
In individuals with ID, as in typically developed peers, physical fitness can improve as a
result of regular exercise. Studies have shown positive impact on cardiovascular capacity,
muscle strength, body composition, and balance after participation in exercise interventions
(78-81).
For persons with ID the level of physical activity and physical fitness may also be influenced
by physical attributes with the basis in the underlying condition. These features include low
muscle mass, reduced muscle tone, balance problems, difficulties in coordination of
movements, and impaired mitochondrial function as described in persons with DS (82, 83).
Currently such perspectives are less well studied in relation to physical activity. Nevertheless,
persons with DS and PWS have been found to engage less in physical activity compared to
persons with ID of other etiology (36, 84).
7
1.4.3 Diet
Food is essential for life and dietary habits are an integrated part of the lives for all people.
Over a lifespan the diet consumed can contribute to protect us from developing secondary
conditions such as cancer, cardiovascular disease and type 2 diabetes (85, 86).
Precise description of habitual dietary intakes is in general a challenge due to the complex
nature of food consumption, and that all traditional dietary assessment methods are associated
with different degrees of measurement errors (87). Dietary assessments in adults with ID add
even further methodological challenges related to the reduced cognitive functioning, and the
lack of validated methods for use in these populations (88).
To date most studies assessing diets in adults with ID have used proxy-assisted or proxy
reporters for completion of food frequency questionnaire or food diaries (35, 89-92).
Furthermore, observational methods and digital photography of meals alone and in
combination with other assessment techniques have also been used (55, 93). Proxy assisted
assessment is a method in which a support person, most often staff member, assist a
participant in completing the assessment. Proxy reporters implies that a staff member or close
family member complete the record or survey without participation by the person with ID.
Validations have shown that use of proxy-assisted methods may systematically underestimate
intakes (94). In addition, this approach is problematic when assessing diets in persons living
mostly independent. The use of photography alone or in combination with other techniques
has been shown to be a feasible and promising method for use in community settings for
adults, but further validation of these methods is needed (94-97).
Over the past years it has been recognized that nutritional biomarkers may provide more
objective indicator of intake. Such a technique has the potential to evaluate more precisely the
association between intakes and health outcomes and be of importance for possible
confirmation of compliance in dietary intervention studies. Today such biomarkers, although
few well documented markers exists, are increasingly being used in studies investigating
association with diet and health outcomes (98-102). Even so, these methods have yet not been
much used in investigations of adult persons with ID.
Most studies with assessment of diets in adults with ID involve persons with ID of mixed,
although a few studies involve persons with DS only (90, 91). The assessments conducted
provide indications of adult persons with ID make up a nutritional vulnerable group. Even so,

8
with exception of PWS and some information about DS, there are in general few studies on
diagnose-specific dietary vulnerabilities in adult persons with ID.
High total fat intakes have been suggested by some studies (37), with intakes of saturated
fatty acids and polyunsaturated fatty acids above and below recommendations, respectively
(89, 91, 92). The studies reporting the actual energy percent from fat, find mean intakes in the
range from 31 E % to 35 E % (89, 91, 92), and not all studies report high fat intakes (90, 93).
Therefore the evidence of high fat as a major dietary challenge in adults with ID is currently
weak. Intakes of fiber below recommendations have been reported indicating high intakes of
refined carbohydrates (89-93). Protein intakes were found to be sufficient (89-93). Low
intakes of alcohol are reported for the majority (89, 103), but was found to be higher in adults
living in less supervised settings in urban areas compared to more supervised and rural living
arrangements (57).
With regard to specific food groups and diet patterns, low intakes of fruit and vegetables have
consistently been reported for persons with ID (35, 37, 90, 93, 104). Furthermore, increased
body weight was associated with reduced consumption of fruit and vegetables in a cohort with
overweight and obese individuals (92), whereas this association was not significant in another
study comparing participants with normal weight and overweight to participants with obesity
(57). Consumption of fish is in general investigated to a limited extent but intakes below
recommendations have been described for a majority of the population (104). High intakes of
soft drinks have been documented in community-dwelling participants (57, 93). In the report
by Hsieh and colleagues nearly 60 % consumed soft drinks daily, and obesity was associated
with increased soft drink consumption (57). Eating habits with regular consumption of
convenience food, fast food and TV dinners has been reported by managers, support workers
and participants with ID themselves (105). Living in less supervised urban settings was
associated with higher consumption of fast food compared to other living arrangements (57).
A regular meal pattern with high frequency of snacking has also been described (92, 93).
Adolfsson et al reported in-between-meals to account for 26 % of all energy consumed. Buns
and cakes was the most frequently food items consumed in these meals. For about 30 % of the
participants, snacking contributed with more energy than any other meal consumed during the
day (93).

9
1.4.4 Cardiovascular disease
Cardiovascular disease (CVD) covers a wide range of diseases in the heart and vessels. In
newborns with genetic conditions associated with ID congenital heart defects is much more
common than in healthy newborns, where congenital heart defects affect < 1 % (106). Several
chromosomal syndromes such as DS and WS are associated with and show a fixed pattern of
congenital heart defects (107, 108). Improvements in cardiac surgery and treatments have
resulted in increased survival and better prognosis for the affected individuals (18).
In the general population and now increasingly in persons with ID due to longevity, CVD
caused by atherosclerosis is an important cause of morbidity and mortality (24).
Atherosclerosis is a complex process where the arteries become narrowed and hardened as a
result of an excessive build-up of plaques which can lead to serious cardiovascular
complications, such as coronary heart disease and heart failure. Eventually, a rupture in the
fibrous cap of the plaque can trigger the formation of blood clots which have the potential to
result in a myocardial infarction or stroke. Inflammatory processes are integrated and
important elements in all developmental stages of the atherosclerotic process (109).
Atherosclerosis develops though several stages and usually takes decades before symptoms
are noted, and for this reason age is an important risk factor. Well known modifiable risk
factors include physical inactivity, several dietary factors, hypertension, smoking, high blood
cholesterol, especially high levels of low density lipoprotein (LDL) cholesterol, high blood
glucose, and obesity (61, 110). Dietary risk factors associated with increased risk of CVD
include diets low in fruits and vegetables (111), diets rich in saturated fat (112, 113), those
high in sodium (114), and diets rich in processed meat (115). Protective dietary components
with the potential to reduce the risk of CVD have also been identified, such as regular whole
grain consumption (116), and frequent intakes of nuts (117). Furthermore, long-chained
omega-3 fatty acids of marine origin are associated with reduction in deaths from CVD (118).
High prevalence of cardiometabolic risk factors has been described for adolescents, adults and
older persons with ID (52, 104, 119, 120). A more recent study in older persons however did
not find increased prevalence of metabolic risk factors when compared to the general
population (121). Furthermore, for persons with ID 50 years or older similar prevalence as for
the general population were reported for coronary heart disease and stroke (122).

10
Increased prevalence of CVD risk factors has been shown in females, obese individuals and
persons with ID living independently in communities (53, 106, 121). A reduced risk of
atherosclerotic CVD has been reported for persons with DS (123, 124). DS is associated with
high prevalence of obesity and low physical activity, but with low risk of hypertension (125),
and few smokers has been reported in this group (126).
1.5 Genetic disorders in this study
1.5.1 Down syndrome
Down syndrome (DS) was named after John Langdon Down who published a phenotype
description of individuals with this syndrome in 1866 (127).
There are three different genotypes that all leads to DS (128). Trisomy 21, a condition caused
by an extra copy of chromosome 21, is most common affecting about 90-95 % of individuals
with DS. Translocation 21, results when a major part of chromosome 21 has been transferred
and attached to another chromosome, and DS will result if the offspring inherits the
translocation chromosome in addition to the two normal chromosomes 21. Mosaicism occurs
when not all of the body’s cells display trisomy 21, and is in general associated with a milder
phenotype (19, 128).
1.5.1.1 Prevalence of Down syndrome
DS is the most common identifiable genetic cause of ID, occurring in about 1:500
pregnancies, although the live birth prevalence varies between countries depending on the
maternal age, utilization of prenatal screening and pregnancy termination (129). In Norway all
expecting mothers 38 years or older at expected term are offered ultrasound examination for
fetal nuchal translucency. Amniocentesis or chorionic villus biopsy with karyotyping is
offered those at increased risk. Prenatal detection rate of DS in Norway was 43 % from 1984
to 2004, and 84 % of the detected cases resulted in pregnancy termination (130).
Based on information from the Norwegian medical birth registry, the prevalence of DS among
live births from 2010 to 2012 was about 1:900. In the same time period Trisomy 21 accounted
for 20 % of all cases presented to the Committees considering abortions of fetuses more than
12 weeks of gestational age (131). Previous validation has shown that the medical birth

11
registry holds valid information regarding DS, as only 7.8 % of all diagnosed cases was not
recorded in the registry (132).
Life expectancies for persons with DS have increased significantly and have influenced the
population prevalence (18, 19, 133). This is illustrated by the positive development
documented in Sweden where median age of death for a child with DS was 9.0 years in 1969-
1979, which increased to a median age of 54.9 years in 1991-2003 (18). Currently there is no
reliable estimate of the number of people living with DS in Norway. Estimates from other
countries have reported prevalence in the range from 1:770 to 1:1640 (134, 135).
1.5.1.2 Characteristics of Down syndrome
The syndrome has characteristic physical and dysmorphic features already present at birth
which makes it fairly easy to identify, and today diagnosis of DS for the vast majority is made
in the neonatal period and confirmed by genetic laboratory analysis (132).
Table 1: Neonatal dysmorphic features in Down syndrome 1. Flat facial profile 2. Slanted palebral fissures 3. Anormalous ears 4. Hypotonia 5. Poor moro reflex 6. Dysplasia of midphalanx of fifth finger 7. Transverse palmar crease 8. Excessive skin at nape of the neck 9. Hyperflexibility of joints 10. Dysplasia of pelvis
Adapted from Ostermaier, 2013 (29).
People with DS may have a variety of birth defects. Congenital heart defects are common and
found in about half of the children, with atrioventricular septal defect, secundum atrial septal
defect, and ventricular septal defect as the most frequent features (107). Increased risk of
congenital gastrointestinal abnormalities are present in about 7 % of the population, and
include esophageal atresia, pyloric stenosis, duodenal stenosis or atresia, Hirschsprung
disease, and anal atresia (136).
Most individuals with DS have cognitive impairment, although the range is wide. The
cognitive profile in DS most often includes language comprehension equal to mental age and
delayed development in language production (128). Weakness is described in verbal short-

12
term memory and explicit long-term memory, whereas visuospatial short-term memory and
associative learning are usually preserved (137). Increased response time in shifting,
flexibility of thoughts and action, is also described (138). Persons with DS have reduced risk
of significant behavioral and emotional problems compared to those with ID of mixed or
other etiologies. However rates of adaptive behavioral problems are increased compared to
typically developed peers and includes co-occurrence of attention deficit hyperactivity
disorder (ADHD) and autism spectrum disorders (139). In adult age early-onset dementia that
resembles Alzheimer’s disease is described in relation to DS, with decline in memory,
language and cognitive functioning, and individuals with DS over the age of 50 are at
substantial risk (137, 140, 141).
At birth weight, length and head circumference are less in children with DS, and growth rate
is reduced, resulting in lower final adult height. Diagnose specific growth charts are
developed from several national cohorts (142, 143). However, these charts do not include
weight for height charts and are therefore inadequate for monitoring of nutritional status.
A high risk of developing obesity is described in individuals with DS (49, 90, 91, 144).
Reduced physical activity (36, 63), a reduced basal metabolic rate (145) and increased risk of
subclinical hypothyroidism are described as underlying features (146).
Mitochondria are the cell structures that generate most of the cells supply of adenosine
triphosphate, used in the cell as a source of energy. Defective mitochondrial function is
described in DS, and is currently suspected to be involved in the increased risk of dementia,
reduced muscle tone and low level of physical activity (83).
Sensory problems are prevalent in DS, and visual problems that require interventions affect
the majority of the individuals (147). Hearing impairments are also common, with high
incidence of conductive, mixed and sensorineural hearing loss (148).
DS is associated with a variety of immune deficiencies (149, 150). These are thought to be
related to the increased susceptibility to autoimmune disorders such as thyroid autoimmunity
manifested as hypothyroidism or Graves’ disease, coeliac disease, type 1 diabetes, increased
risk of childhood leukemia, and testicular cancer later in life (151-153). In Norway, 4.8 % of
the children with DS born from 1999 to 2011 were diagnosed with coeliac disease (154).

13
The prevalence of atlantoaxial instability, a risk factor of spinal cord compression, is
increased in DS and affects about 10 % of the population (155, 156). Participation in ordinary
physical activities is not associated with adverse outcome for the affected individuals (157),
however currently there is not enough evidence regarding safety of physical activities with
high risk of spinal cord injury (158).
1.5.2 Prader-Willi syndrome
The syndrome was first described in 1956 and was originally named Prader-Labhart-Willi
syndrome. From the 1990ies and forward most authors use the term Prader-Willi syndrome.
PWS is caused by lack of paternally expression of genes in the 15q11-q13-region. There are
three main genetic mechanisms resulting in PWS. These are deletion, maternal uniparental
disomy 15 (UPD) or a less common imprinting defect (159). Most cases of PWS result from a
de novo deletion affecting about 65-75 % of the individuals with PWS (28). The PWS
deletion is sometimes described to consist of two subclasses, type 1 and type 2 deletions,
depending on the size and chromosomal breakpoint position. Type 1 includes a deletion of
four non-imprinted genes that is present in type 2 deletion. More adaptive behavioral
problems and obsessive-compulsive behaviors have been described in individuals with type 1
deletion when compared to individuals with type 2 deletions or UPD (160). However, other
investigations have questioned if there are clinical differences between individuals with the
two deletion types (161). The division of the deletion genotype into two subclasses is
therefore currently controversial. UPD, a situation with two chromosome 15 from the mother
and none from the father accounts for about 20-30 % of the individuals with PWS (28), and is
associated with advanced maternal age (162). There are some known differences between the
two main genotypes of the syndrome, where the deletion genotype, compared to UPD, is
associated with increased frequency of hypopigmentation, typical facial appearance and skin-
picking, higher pain threshold, and better visuo-spatial capacities (162, 163). The UPD
genotype is described to have higher average verbal IQ but not performance IQ, less
maladaptive behaviors, and increased risk of bipolar disorders, and psychiatric illness (164-
167). Lastly, imprinting defect is reported in 1-3 % of the individuals with PWS and is a
result of defects in the imprinting center leading to gene silencing in the chromosome 15
region (168).

14
1.5.2.1 Prevalence of Prader-Willi syndrome
The birth incidence of PWS has been reported to be 1:25.000-1:29.000 (169-171). However,
there is a large diversity in studies on population prevalence of this condition. In one region of
UK, Whittington and colleagues found a prevalence of 1:52.000 (171). From the Flanders in
the Netherlands Vogels and colleagues reported a prevalence of 1:76.600 (170), whereas
Grugni et al found a prevalence of 1: 134.000 in a national Italian investigation (172). All
authors reported their findings to be minimum prevalence. Few subjects above 30 years of age
were described in all reports, probably due to low identification rate in older persons, but also
a result of high mortality rate. Increased risk of premature death is reported for persons with
PWS, with a relative risk of 3.8 when compared to a multi etiological group of persons with
ID (173). Childhood deaths are associated with respiratory infections, while causes of deaths
in adults were described to be of mainly of cardiorespiratory origin (170, 172, 173). In
Norway to date there has been no systematic investigation of the birth incidence or population
prevalence of PWS.
1.5.2.2 Characteristics of Prader-Willi syndrome
PWS is a complex neurodevelopmental disorder. Hypothalamic dysfunction is linked to many
of the endocrinological disturbances associated with the condition (174), although changes in
other brain areas have also been observed (175).
Main clinical characteristics and clinical criteria previously used for diagnosis are shown in
Table 2. Today the clinical criteria are used less rigid as a guide for selection of candidates for
genetic investigations (163).

15
Table 2: Consensus clinical diagnostic criteria for Prader-Willi syndrome Major criteria
1. Neonatal hypotonia 2. Feeding problems with poor weight gain/failure to thrive 3. Excessive or rapid weight gain or weight-for-length charts after 12 months but before
6 years of age 4. Characteristic facial features with narrow face or bifrontal diameter, almond-shaped
eyes, small appearing mouth with thin upper lip and down-turned corners of the mouth 5. Hypogondaism with any of the following depending on age
a. Genital hypoplasia b. Delayed or incomplete gonadal maturation with delayed pubertal signs in the
absence of intervention 6. Global developmental delay 7. Hyperphagia/obsession with food
Minor criteria
1. Decreased fetal movement or infantile lethargy 2. Characteristic behavioral problems with temper tantrums, violent outbursts and
obsessive-compulsive behavior; tendency to be argumentative, oppositional, rigid, manipulative and stubborn; stealing or lying
3. Sleep disturbance or sleep apnea 4. Short stature for genetic background 5. Hypopigmentation 6. Small hands < 25th percentile and/or small feet <10th percentile 7. Narrow hands with straight ulnar borders 8. Eye abnormalities 9. Thick viscous salvia with crusting at corners of the mouth 10. Speech articulation defects 11. Skin picking
Supportive criteria
1. High pain threshold 2. Decreased vomiting 3. Temperature instability in infancy or altered temperature sensitivity in older children
or adults 4. Scoliosis/kyphosis 5. Early adrenarche 6. Osteoporosis 7. Unusual skill with jigsaw puzzle 8. Normal neuromuscular findings
Adapted from Holm et al 1993 (176) Reduced prenatal fetal activity is common, and hypotonia is a hallmark of the syndrome in the
neonatal period. Together with poor suck and neonatal feeding difficulties these findings are
important for early recognition and diagnosis of the condition. In a cohort of hypotonic
infants 10.7 % was diagnosed with PWS by use of molecular genetic testing (177). Global

16
developmental delay, affecting both motor milestones and language development is, together
with hypotonia, the most sensitive diagnostic criteria affecting >97 % of the children with
PWS. The dysmorphological features were the least sensitive, and present in less than half of
the persons with molecular verified diagnosis (163).
Most persons with PWS fall within the mild ID category, although some individuals are found
with moderate ID, and 7-19 % is reported to have an IQ above 70, but with expressed learning
difficulties (167, 178, 179). Relative cognitive strengths are described to be associative long-
term memory, visual perception, reading skills, and especially the assembling of jigsaw
puzzles. Weaknesses are described in relation to sequential processing, executive functioning,
mathematical skills and social cognitive functioning (165, 179-181).
The syndrome is associated with a number of distinct behaviors and is therefore described to
have a behavioral phenotype. Behavioral characteristics include a nearly universal excessive
interest in food and overeating in the absence of food access restrictions (28). Obsessive traits
are common and include hoarding, rigid and repetitive behaviors. Difficulties related to
unexpected changes often result in temper tantrums or outbursts, and autism spectrum
disorder is present in about a third of persons with PWS. Mood swings and self-harm,
especially skin-picking are also frequently observed (161, 180, 182-184).
Persons with PWS have high risk of developing morbid obesity due to hyperphagia and
reduced energy expenditure (84, 185, 186). The latter is mainly explained by altered body
composition with reduced muscle mass and increased fat mass which leads to a reduced basal
metabolic rate (187). Low levels of physical activity has also been recognized (82, 84), which
reduce the energy expenditure even further. Fat mass is mainly located subcutaneously and is
therefore associated with reduced adverse metabolic effects (188, 189).
The syndrome has traditionally been described to have two nutritional stages; poor feeding in
infancy followed by hyperphagia which, in absence of energy restrictions, will lead to
excessive weight gain and childhood onset of obesity (176). However more recent
examination of the natural history of the condition suggests a more gradual and complex
progression through five nutritional phases (190). The first phase is intrauterine with reduced
growth and weight status. In the second hypotonic phase, post-delivery, the child has
gradually resolving feeding difficulties and is not obese. In the third phase the child increases
its interests for food and increase daily caloric intake. If total intake is not controlled, the child

17
will gain weight such that it crosses standardized weight-for-height percentiles. However in
this phase the child is not insatiable and it is easy to control food intakes by use of scheduled
meals. The onset of the fourth phase is quite variable and reported from 3 years to as late as
15 years of age. This is the classical phase that most people typically associate with PWS,
with food seeking and manipulative behaviors to gain access to food, and with markedly
reduced satiety. In the fifth phase, the individual may still have increased appetite but not as
aggressively as previously seen. This phase occur only in a subset of individuals typically
after 30 years of age.
In PWS, prevention and treatment of obesity is essential. Treatment is supportive and lifelong
and includes regular physical activity in combination with a low-energy diet, together with
detailed meal plans, rigorous food supervision, and restricted access to food (191, 192).
After birth short stature is present in most individuals with PWS and is due to a relative
growth hormone deficiency. Growth hormone deficiency has been reported in 80 % of
children with PWS (193). Today, most children with PWS in western-countries receive
growth hormone treatment. Growth hormone therapy in PWS improves linear growth and
increases final height, but more importantly improves body composition by lowering body fat
percentage and increasing lean body mass (194-196). Improved physical functioning by
improvements in neuromuscular strengths and motor development are documented effects of
this treatment (197, 198). Systematic motor training in combination with growth hormone
therapy showed even more pronounced effect on motor development than growth hormone
treatment alone (197). There are further preliminary reports of improved cognitive
development due to growth hormone treatment (199). Growth hormone treatment appears to
change respiratory status in PWS, possible because of growth in tonsils and other lymphoid
tissue in the respiratory tract observed shortly after introduction of treatment. Evaluation of
sleep-related respiration status is therefore required prior to and shortly after starting
treatment due to safety concerns (194). Scoliosis is prevalent in PWS. Currently there is no
evidence from controlled investigations that growth hormone treatment increasing the
prevalence of scoliosis (198). Monitoring of scoliosis is however recommended for all
persons with PWS, regardless of growth hormone treatment (194, 195).
Positive effects is also described by use of growth hormone therapy in adults with
improvement in body composition (82, 200), and a more favorable lipoprotein profile; with
reduction of total cholesterol and LDL cholesterol, and increase in high density lipoprotein

18
(HDL) cholesterol (201). Growth hormone may possible have an adverse effect on glucose
regulation with increased risk of glucose intolerance in adults (201, 202).
PWS is associated with hypogonadism manifested as genital hypoplasia and without
intervention this will lead to incomplete pubertal development (28). Over the past years it has
become clear that PWS is also associated with other endocrine disturbances. These include
increased risk of hypothyroidism found in about 25 % of children with PWS (193), and
increased risk of adrenal insufficiency. The latter was found in 60 % among a randomly
selected group of children with PWS, and is possible linked to the increased risk of sudden
death during infection-related stress (203, 204).
1.5.3 Williams syndrome
Williams syndrome (WS), or Williams-Beuren syndrome, was named by J. C. P. Williams
who first described the syndrome in 1961 (205), and A. J. Beuren who published a report
describing three new persons with the same presentation in 1962 (206). In the scientific
literature both eponyms are used and imply the same genetic condition.
WS is caused by deletion of 26-28 continuous genes on chromosome 7q11.23 (27, 207). The
genetic segment is flanked by genes clusters organized into low-copy repeat blocks, so called
duplicons, which predisposes to unequal chromosome rearrangements (208).
The microdeletion in WS includes the ELN gene leading to insufficient production of elastin.
Haplonsufficiency of elastin is linked to the connective tissue abnormalities and
cardiovascular features associated with the syndrome (209). LIM Kinase 1 is another gene
located in the critical region and is possibly involved in development of the unique cognitive
characteristics (210)
1.5.3.1 The prevalence of Williams syndrome
The population prevalence of WS is in the literature often quoted to be approximately 1:
10.000. Currently there is only one formal investigation of the WS prevalence. Stromme et al
found a prevalence of 1:7500, based on identification of four cases with WS in an
investigation of children born 1980-1985 in Akershus county in Norway (211).

19
There is as paucity of data describing life expectancy in WS, although cardiovascular
associated premature death is reported (212). One study based on a cohort of 293 persons with
WS, found a 25-100 times higher risk of sudden cardiac death in the WS population compared
to controls (213).
1.5.3.2 Characteristics of Williams syndrome
Reduced growth rate, developmental delay, combined with distinctive facial appearance,
hypercalcemia, and stenosis of medium and large arteries are typical symptoms that can be
observed in children with WS (27, 108, 214). Today diagnosis is usually made in infancy or
early childhood by recognition of the characteristic features and is based on molecular testing
(27).
Table 3: Main characteristic features of Williams syndrome 1. Short stature Prenatal growth deficiency
Failure-to-thrive in infancy Reduced growth rate
2. Connective tissue
abnormalities Typical facial features Hoarse voice Joint laxity early in life followed by joint contractures Premature aging of the skin
3. Intellectual disability Global developmental delay Unique cognitive profile
4. Cardiovascular disease Supravalvar aortic stenosis Pulmonary arterial stenosis Ventricular septal defects Hypertension
5. Endocrine alterations Hypercalcemia
Glucose intolerance and type 2 diabetes Hypothyroidism Early puberty
The facial features which ranges from discrete to distinct, consist of broad forehead, flat nasal
bridge, short nose with a long philtrum, full lips, and a wide mouth (27). Later, small
unusually shaped and missing teeth due to developmental failure may be observed (215).
ID with global developmental delay is observed in early childhood. An average IQ of 50-60
has been described, with an IQ range of 40-100 (216). WS is further described to have a

20
phenotypic cognitive profile with relative strengths in verbal abilities, especially concrete
repetitive and expressive vocabulary, and strengths in facial processing skills combined with
weakness in visuospatial construction (216-218).
The personality in WS is described to be friendly, empathic and social, and typically include
involvement with unfamiliar people (219). Even so, individuals with WS have difficulties in
social judgment, an inflexible and repetitive social repertoire, and therefore difficulties in
making and keeping friends (218, 219). In addition, behavioral difficulties coexist and include
ADHD found in a majority of children with WS. Hyperactivity is declining in adolescence but
attention deficits persist (220). Specific phobias and fears are reported in 35-50 %, and
sensitivity to loud, unexpected noises is described as the most frequent spontaneously
reported fear (220, 221). Anxiety develops over time and generalized anxiety disorder is
frequently observed in adulthood (221). In WS enjoyment and interest for music is nearly
universal and increased emotional responsiveness to music is described (216).
Structural congenital cardiovascular abnormalities are found in about 80 % of the population,
with the majority of this including some form of arterial stenosis (108, 209, 222). One or
more stenosis may occur in numerous locations. The most common location is above the
aortic valve, supravalvar aortic stenosis (SVAS) and found in about 70 % of persons with WS
(108, 212, 222, 223). The severity of this condition ranges from trivial to severe. Isolated
SVAS is a distinct autosomal dominantly inherited in families with point mutations in the
gene, ELN. SVAS is rarely seen in persons without genetic mutations or deletions of the ELN
gene (27). Pulmonary arterial stenosis is the second most common location of stenosis and is
observed in about 40 % of the population (108, 212). In contrast to SVAS, pulmonary aortic
stenosis often regresses or resolves with time (212, 223). Other locations of stenosis include
aortic arch, coronary and renal arteries. Additional congenital heart abnormalities are also
reported and include ventricular septal defects seen in about 5 % of persons with the condition
(108, 212).
Increased vascular stiffness is present already in childhood and may lead to development of
hypertension which is reported in 40-55 % of adolescents and young adults with WS (224,
225). Elastin insufficiency leads to reduced vessel recoil capability and is linked to vascular
stiffness and increased risk of hypertension (226). In contrast, loss in functional copies of the
NCF1 gene protects against hypertension, likely through a lifelong reduced angiotensin II
mediated oxidative stress (226, 227). NCF1 is one of genes that are variably deleted in WS.
21
Screening for renal abnormalities is recommended in children with WS, as structural
abnormalities of the kidneys and urinary tract are described in about 18 %. A variety of renal
system malformation and conditions have been reported (228).
WS is also associated with episodes of hypercalcemia occurring sporadically in 5-50 %, but
most frequently observed in infancy. Hypercalcemia is in general mild but can be moderate or
severe, especially during infancy (229). Previously suggested, but unconfirmed mechanisms,
include increased vitamin D sensitivity and increased 1,25–dihydroxyvitamin D levels (230).
However, more recently increased digestive and renal calcium absorption is suggested and
linked to the TFII-I gene in the 7q11.23-region (231). Treatment of hypercalcemia includes
dietary restrictions of vitamin D and calcium, and some severe cases are treated with
intravenous fluid and bisphosphonate administration. Gradual normalization to unrestricted
diets is recommended in most cases, when hypercalcemia has been resolved (232).
Impaired glucose tolerance and type 2 diabetes are reported in 63-75 % of adult persons with
WS. Even though a high prevalence has been observed in all weight categories increased
prevalence was described in obese participants compared to lean participants with WS (229,
233). The syntaxin-1A gene and MLXIPL gene which are located in the critical WS-region is
currently suspected to be involved in the abnormal glucose regulation observed (229). Mild
thyroid hypoplasia is found in a majority of individuals with WS, and subclinical
hypothyroidism is described in 15-30 % (234, 235).
WS is associated with short stature and final adult height is about 15 cm shorter than expected
for genetic background (214). Diagnosis-specific growth curves have been developed based
on a national cohort in Great Britain (236). At birth mean length is about 3 cm shorter than
average. In childhood a 1-2 cm yearly reduced growth rate has been documented, followed by
a relative catch up growth, due to early onset of pubertal growth spurt, typically occurring at
age 10-11 in boys and age 9-11 for girls.
Increased risk of coeliac disease has been described in WS (27). However, this is
controversial, as recent controlled investigations found no evidence of higher prevalence in
coeliac disease and other autoimmune diseases (237).
Individuals with WS show mild neurologic dysfunction with delayed motor development and
alternations in motor coordination, tone and gait function. Tone abnormalities vary as a
function of age, with decreased tone prevailing in younger subjects and increased tone with

22
rigidity and contractures noted in some adult subjects (238). Later in life mild premature
aging in skin and premature graying of hair is observed (27).
1.6 Need of new knowledge Persons with ID are exposed to health inequality and there are currently few descriptions of
the public health challenges related to specific subgroups. Furthermore, there is a paucity of
data on lifestyles in subgroups associated with ID from the Norwegian health and support
context.
High risk of obesity has been described for persons with mild to moderate ID in general and
especially for persons with DS and PWS, but less explored in relation to WS. Physical
activity and diet are important lifestyle factors that influence the risk of obesity and have the
potential to affect short- and long term health. Currently there are few studies on diet and
physical activity in relation to genetic conditions associated with ID.
Moreover, atherosclerotic cardiovascular disease (CVD) has been documented as an
important cause of death also for persons with ID. Persons with ID represent a heterogeneous
group and possibly also with variability in risk of developing CVD. To date descriptions of
established metabolic risk factors of CVD in individuals with genetic syndromes and the
possible association with obesity has not been much studied. Such information is valuable for
development of tailored health checks and a personalized medicine approach in adult age for
these individuals.

23
2 Study aims The overall aim of this study was to investigate and describe lifestyle-related health risks in
persons with DS, PWS and WS, 16-40 years of age, and by comparing these subgroups
describe diagnosis specific vulnerabilities and common challenges.
The specific aims of the separate papers were as follows:
o To describe levels of physical activity and to investigate physical capacity in relation
to BMI in the studied subgroups (paper I).
o To describe some overall food intake frequency patterns for persons living in
community residences and explore this in relation to weight status. Moreover, to
explore differences in food related autonomy and food intake frequencies between
persons living with relatives and persons living in communities with support (paper
II).
o To explore and compare the prevalence of metabolic risk factors of CVD, and the
association between abdominal obesity and metabolic risk factors in the studied
subgroups (paper III).

24
3 Methods
3.1 Ethical aspects and information to the participants This study involves persons with cognitive impairments which represent vulnerable groups. In
planning of the study, scientific methods providing as little discomfort as possible for the
participants were selected. Emphasize was put in meeting the participants with respect,
adjusted information and means to empower the individuals to be active and contributing in
all parts of data collection. All test personnel involved in the study were professionals with
experience of working with persons affected by ID.
The ethical approval for this study was granted by The Regional Committee for Medical and
Health Research Ethics, Southeast Region. Simplified easy-to-read information about the
project was developed for the participants and an ordinary information letter was developed
for the parents and legal guardians. Informed written consent to participate was given by the
participants and parent/legal guardian. Both versions of the information letter clearly stated
that the participants at any time could withdraw from the study. In addition, to ensure that
participation was voluntary all test personnel were instructed to respect both oral and physical
signs of withdrawal.
In order to ensure that the participants had understood the implication of participating in the
study, they were informed again about the methods to be used after arrival at the location, but
prior to data collection. This was done in a plenary lecture using photos and demonstrations to
explain the data collection procedures. In this session, both participants and their support
persons were invited to ask questions. A short resume of the information was repeated by the
test personnel for each individual at the beginning of all data collection situations. In addition,
how to perform the six-minute walk test was showed in practise for all participants at the first
walk test situation.
An individual letter with information about the results obtained from the clinical examinations
and regular medical biochemical analysis was developed and sent by mail to all the
participants. For participants less than 18 years of age a copy of the letter was sent to the
parents, and for adult persons a copy was sent to the legal guardian. In the letter to all

25
participants with any result out of normal range contact with their general practitioner were
recommended.
3.2 Study design and population The thesis is based on a national descriptive cross-sectional study in persons with DS, PWS
and WS. Persons with these diagnoses were from February 2012 to January 2013 invited to
participate in the study. A convenient sampling frame was used. The inclusion criteria were
diagnosis with DS, PWS or WS verified by standardized clinical methods or by laboratory
genetic testing, age 16-45 years and returned consent forms signed by the participant and
legal guardian/parent. In addition, to ensure safety and support needs of the participants, all
attending participants had to come together with a parent or employed assistant.
Participants were recruited from all over Norway using information about the study circulated
in collaboration with the following nationwide patient organizations: The Norwegian
Association for Persons with Developmental Disabilities, The National Association for
Prader-Willi Syndrome, The Norwegian Association for Williams Syndrome, and The
Norwegian Network for Down Syndrome. These organizations spread information through
their information channels such as web-sites, member’s bulletins, Facebook groups, and
information brochures distributed by letter to members in relevant age-category. A study
specific web-site, www.helseibolig.no, was also developed with the purpose of spreading
information about the study. Informed consent form was posted and possible to download
from the website.
A total of 104 returned a signed consent forms and a total of 96 participants took part in the
data collection, after drop-out of four participants with PWS and three participants with DS.
In two participants with PWS drop-out was due to withdrawal. In the remaining cases, drop-
out was due to difficulties related to finding a support person with possibilities to travel and
participate at the courses where data collection was performed.
In persons where molecular testing already had been performed, a copy of laboratory genetic
test result was collected from the patient records at the genetic laboratory, and used as
verification of the diagnosis. For person with clinical diagnosis and no previous genetic
testing, or genetic testing performed with old genetic testing techniques, voluntary molecular
testing was offered as part of the study. In the remaining cases with clinical diagnosis,

26
assessment of standard clinical criteria was used for verification of diagnosis. A total of nine
participants were excluded from final analysis due to negative result of genetic testing and not
fulfilling clinical criteria, with a result of 87 participants eligible for inclusion in final
analysis.
Figure 1: Distribution of the study participants and the general population by health region
0
20
40
60
80Study participants (%)
General population (%)
Southeasthealth region
Westernhealth region
Centralhealth region
Northernhealth region
Percent
Participants from all four health regions in Norway participated in the study. Figure 1 display
the proportion of the study participants and the proportion of the general population living in
the different health regions (239).
In paper I the study population consist of 83 participants in the physical activity assessment
and all 87 participants were included in the analysis based on the results of the six-minute
walk tests. The drop-out in registration of physical activity was due to refusal to participate in
this part of the study by two participants, medical safety concerns for one participant and lack
of valid registration of activity in one of the returned accelerometers. In paper II the study
population consists of 81 persons, as this paper only included persons with PWS and WS
living in community residences with support. In paper III all participants ≥ 20 years old were
included (n= 72). The selection was performed to facilitate a comparison of prevalence rates
between the genetic syndromes and the general population. Data form the general population
was based on a Norwegian cohort study (HUNT-3) (240).

27
3.3 Data collection The data was, with the exception of daily physical activity, collected during seven two-day
courses held from October 2012 to February 2013 at Frambu, a national resource centre for
rare disorders in Norway. Frambu holds courses on a regular basis for different groups of
persons with developmental and intellectual disabilities of all ages, their families and
professionals from all parts of Norway. In total 10-15 study participants attended each course
where data collection was conducted. The participants attended the courses together with a
parent or employed caregiver.
At the courses the participants and their support persons were, in addition to taking part in the
study, offered a program with different health, nutrition and activity oriented topics. The
participants were invited to try out activities in practise such as; geocaching, fishing, digital
photography and sports activities by use of the game console Nintendo Wii. Further, the
program contained a voluntary group session lead by a dietitian with information and
discussion about how to choose and prepare healthy foods. In this session the participants
were invited to share success stories and good ideas with each other. Parallel to the program
for the participants, parents and caregivers participated in a program covering relevant health
promotion topics such as; medical management and good health support, adequate nutrition,
and motivation for lifestyle changes in adult persons with ID. In the evening the participants
and support persons were offered a social program with the other participants at the courses.
3.4 Measurements
3.4.1 Assessment of physical activity
Level of physical activity was assessed using the ActiGraph GT3X+ activity monitor
(ActiGraph, Pensacola, FL, USA). The devise registers acceleration in units called counts,
and samples data at a rate of 30 times per second in sampling intervals (epochs) of 10-
seconds. The accelerometers were initialized and downloaded using the ActiLife software
provided by the manufacturer of the monitors (ActiGraph, Pensacola, FL, USA).
To facilitate the possibility for comparison of results, the instructed wear time of the
accelerometers and data reduction procedure was identical to a Norwegian population study

28
on physical activity in adults (241). The following outcome variables were derived; counts per
minute (CPM), steps per day, minutes of intensity specific physical activity, and used in
paper I.
The participants and their support person received information about the activity monitors and
how to wear them during the courses at Frambu. In a plenary session the participants received
a full charged activity monitor in an elastic belt, a prepaid return envelope, activity
registration form and two reminder posters. At this session they were showed in practice how
to wear the device, and how to take it on and off. They were further instructed to wear the
device for seven consecutive days in their home environment during all waken hours, except
during swimming or bathing. In this session, photos were used in combination with oral
instruction. Parallel to wearing the device they were asked to record on a ready-made form
activity during the data collection period involving swimming, bicycling, resistance training
or skiing activities. A diary of these activities was chosen as they are frequently conducted
activities in the Norwegian population, and if performed regularly and with some duration can
lead to underestimation of the physical activity level when assessed by accelerometer
registrations. To increase compliance all participants were given two reminder-posters and
encouraged to hang them up in visible places in their own homes. The accelerometers were
initialized to start recording activity the day after returning back to their home environment.
Any wearing of the monitor from receiving the monitor to returning at home environment has
therefore not been registered. The accelerometers were returned by mail together with the
registration form of activities during the data collection period.
3.4.2 Physical capacity
Physical capacity was assessed by six-minute-walk test. The test was selected as it provides a
global assessment of exercise capacity, and has been found to be feasible and reliable when
used in individuals with ID (242, 243). The participants performed two six-minute walk-tests
during the same day with a break in-between. The first test was regarded as training, and for
all participants completing both tests (n=85), the results of the second test was used to
determine walking capacity in paper I.

29
3.4.3 Clinical Examination
Body composition was assessed by use of simple clinical standardized direct measurement
techniques. BMI was calculated using the standard formula (kg/m2) and standard definitions
was used to define normal weight, overweight and obesity in paper I and II (39). For WC,
sex-specific cut points for Caucasians proposed by World Health Organizations were used to
define increased and substantially increased WC and used as metabolic risk factors of CVD in
paper III (39). In the study no formal assessment of scoliosis was performed.
Blood pressure readings were performed in accordance to recommendations for blood
pressure measurements in research (244). The measures were performed by use of an upper
arm automatic blood pressure devise with oscillometric measurement technique (Microlife BP
A100 Plus, Microlife, Widnau, Switzerland). The Microlife BP A100 plus measurement
device has been clinically tested for its accuracy and passed the validation procedure in
accordance with the International protocol of the European Society of Hypertension (245,
246).
A multistep procedure was selected to reduce the possibility of false elevated blood pressure.
First, participants were familiarized with blood pressure measurements and screened for
differences in blood pressure between the arms on day one of the data collection. The next
day, blood pressure was taken three times with one minute intervals in between, after at least
ten minutes rest. Information of the prevalence of hypertension in paper III was derived with
use of recommended definitions and cut-points (247), and was based on measured blood
pressure in combination with information about current use of antihypertensive medication.
3.4.4 Questionnaire collected data
An electronic questionnaire was developed using the Questback software (Questback, Oslo,
Norway). The questionnaire covered topics like demographic information, living
arrangements and hours of support per week, education and main occupation. Medical
information was also collected by use of the questionnaire, and questions covered current use
of medication, previously diagnosis of cardiovascular diseases, and specific well known
medical comorbidities such as type I and type II diabetes, coeliac disease, hypothyroidism,
and hyperthyroidism. Furthermore, use of dietary supplements, intake frequency of selected

30
foods and alcohol, level of food related autonomy and smoking habits were also collected
using the questionnaire.
The method was selected and adjusted to facilitate for the participants to be informants.
Technical adjustments included; use of one question per screen lay-out, automatic routing
through the questionnaire, and when the main theme of the questions changed, this was
marked with illustrative pictures to prepare the participants of the new theme of the following
questions. During development, the questionnaire was sent to the collaborating parent
organisations and they were invited to give feedback about difficulty level of the questions. A
justification in the language used in the question asking for the participants level of support
was performed as a result of the feedback received form the patient organisations. To explore
the feasibility of the electronic questionnaire, two voluntary persons with mild ID were
invited to test answering the questionnaire before it was used in data collection. Both
participants successfully completed the questionnaire.
In order to increase the reliability for the answers and to reduce the possibility of missing
data, the participants and their support persons were prepared of the type of questions and
main themes of the questions to be answered. They were also showed in practise who to
manoeuvre in the questionnaire. The participants and the support person were specifically
asked to bring with them a complete list of all medication used and information about total
hour of support received per week, as these questions were regarded to be difficult to answer
without specific preparations.
In the data collection session the participants were offered a laptop with the questionnaires
directly available. The participants were put in front of the laptop with the support persons
sitting beside. The data collection was supervised by one test personnel who assisted all
participants with need of technical guidance and with formal or other questions about the
survey.
Demographic data were used as background information in papers I-III. Moreover, the
intake frequencies of foods, use of supplementation and food related autonomy were used in
paper II. Information about medical use, previous diagnosis of cardiovascular diseases, and
relevant comorbidities were together with biochemical and physical measures used to
describe the prevalence of metabolic risk factors of CVD in paper III.

31
3.4.5 Biochemical measures
Venous blood sample was collected from the participant in the morning after overnight
fasting. All participants were offered local anaesthetic skin treatment with prilocaine before
the venous puncture. Tubes for plasma and serum were centrifuged within 2 h.
The specialised analysis of six plasma carotenoids and fatty acids in erythrocyte membranes
in paper II were performed at a private laboratory with previous experience and standardized
routines for performing such analysis (Vita AS, Oslo, Norway).
In paper III to describe metabolic risk factors of CVD relevant biochemical measures in
blood was analysed. The clinical laboratory of the regional university hospital performed
blood analysis in accordance with standard protocols. The prevalence of the metabolic risk
factors were determined by use of cut-points and definitions published in clinical guidelines.
3.4.6 Other data
To supplement the data in paper III, the study applied for, received data and got permission
to publish prevalence data of the metabolic risk factors of CVD from HUNT-3 in a
comparable age-range. The HUNT study is a Norwegian longitudinal population health study.
The HUNT-3 survey, which is the latest data collection in this study, was started in 2006 and
completed in 2008 (240). The prevalence rates of metabolic risk factors of CVD in the
included groups were compared to those from the HUNT-3 population, and reported in paper
III.
3.5 Statistical analyses In papers I-III descriptive statistics were calculated for all demographic variables and
presented as mean with standard deviation (SD) or percent of population (%). Initially chi-
square, one-way analysis of variance (ANOVA), and independent t-test were used to identify
differences between the subgroups with respect to background variables.
In paper I linear regressions adjusted for age and BMI, where appropriate, were used to
evaluate overall physical activity, intensity specific physical activity and results of the six
minute walk test in the different groups.

32
In paper II ordinal categorical variables were dichotomized. Logistic regression models
adjusted for BMI were used to investigate the association between proportions with low and
high frequency consumers in the different food categories and use of omega-3
supplementation by diagnosis. However due to a zero cell, chi-square tests were used to
investigate proportions with low and high intake frequencies of fish by diagnosis. Linear
regression adjusted for BMI was used to investigate plasma carotenoids and erythrocyte fatty
acids to detect possible differences between the subgroups. Selection of reference group in the
linear regression models were based on initial analysis by use of ANOVA with Turkey post
hoc test.
Chi-square tests were also used to investigate possible differences by weight status category
in proportions with low and high food intake frequencies, and degree of participation in food
related tasks. Pearson’s correlation test was used to assess the association between BMI and
biomarkers in the different genetic syndromes.
Finally, chi-square tests were used to investigate proportions with high- and low-frequency
intake of foods, high and low degree of autonomy when living arrangements were compared
for persons with DS. Mann-Whitney tests were used to investigate differences in measured
biomarkers based on living arrangements.
In paper III the measured biochemical and physical values in the subgroups were compared
by use of one-way analysis of variance (ANOVA), or, if normality was violated, by use of
Kruskal-Wallis test. Chi-square tests were used to investigate differences in prevalence of risk
factors between genetic subgroups. However, in prevalence of type 2 diabetes due to low
numbers, Fishers exact test was used to compare the WS-group to the PWS-group only. Chi-
square tests were also used when the association between abdominal obesity and metabolic
risk factors was investigated. To compare the prevalence rates of the metabolic risk factors for
the included subgroups to those of the general population, relative risk estimates were
calculated for all three subgroups.
In paper I and II all statistical analyses were performed using SPSS 19 (SPSS Inc., Chicago,
IL, USA), whereas in paper III SPSS 22 were used. A p-value of less than 0.05 was regarded
as statistical significant.

33
4 Summary of results
4.1 Characteristics of the participants (Papers I-III) After evaluations of diagnosis by use of laboratory genetic test result or clinical criteria a total
of 87 participants were eligible for inclusion in final analysis and formed the basis for the
study populations of papers I-III. There is some variance in the total study population used in
the separate papers, due to some difference in exclusion criteria. The main characteristics of
the total study population are presented in Table 4. More females (n=54) than males (n=33)
participated, however no significant difference in age, BMI or living arrangements was
detected between the genders.
Table 4: Characteristics of Study Population by Diagnosis Down
Syndrome (n=40)
Williams Syndrome (n=25)
Prader-Willi Syndrome (n=22)
P-valuesb
Genetically verified diagnosis (%)
80.0 72.0 95.5 0.034*
Age (years) 26.8 (7.5) 31.5 (6.2) 28.1 (7.5) 0.048* Females (%) 62.5 64.0 59.1 0.94 BMI (Kg/m2) 31.8 (6.5) 26.6 (6.5) 30.7 (6.2) 0.007* Smokers (%) 0 4.0 9.1 0.17 Occupation 0.44 Student (%) 15 16 9 Supported employment (%) 60 68 77 Daycare attendant (%) 20 4 9 Unemployed (%) 5 12 5 Community residence (%) 60.0 84.0 90.9 Years lived in community residencea (years)
7.33 (4.87) 9.38 (5.76) 8.47 (5.51) 0.44
Level of support in communityb
residence 0.020*
0 - 30 hours/week (%) 54.2 47.6 40.0 31 - 60 hours/week (%) 20.8 23.8 10.0 More than 60 hours/week (%) 8.3 4.8 45.0 Level of support unknown (%) 16.7 23.8 5.0 The data are presented as percentage of the population or as the mean (standard deviation). aBased on community-dwelling participants only, n=32 for DS, n=21 for WS and n=21 for PWS bP-values are derived by comparison of the diagnoses using chi-square tests and one-way analysis of variance (ANOVA). *P<0.05

34
4.2 Paper I In total 83 participants took part in assessment of physical activity and all 87 participants
performed at least one six-minute walk test. Participants achieved a mean 6.2 days of valid
accelerometer measured activity and a mean wear time of 13.9 h ± 1.4 h per day. On average
the participants generated 294 counts per minute (cpm) or 6712 steps per day. Most of the day
(63 %) was spent in sedentary activities. No difference in total activity was detected between
the diagnoses. However a tendency of reduced activity level in the PWS group was noted, and
was related to the reduced time in lifestyle activities observed in this group. Similarly, no
difference in walking capacity was detected between the diagnosis groups.
Males were more active than females across all diagnoses, and accumulated a mean of 85 cpm
or 2137 steps per day more than females. Furthermore, males walked longer (41.0 m) than
females in the standardized six-minute walk test.
Adherence to physical activity recommendation was low, with only 12 % of the total
population meeting the recommendations of daily thirty minutes or more of moderate-to-
vigorous physical activity (MVPA) in bouts of 8-10 min.
Table 5: Adherence to physical activity recommendations by diagnosis Down Syndrome
(n=38) Williams Syndrome (n=24)
Prader-Willi Syndrome (n=21)
Males (%) 7.1 22.2 25.0 Females (%) 8.3 6.7 15.4 The relation between body weight and physical activity and walking capacity was
investigated by the BMI-derived categories; normal or underweight, overweight, and obesity.
No association between total physical activity and BMI were detected. However, normal and
underweight participants spent more time in sedentary activities, and obese participants
engaged less time in MVPA.
The mean distance walked however decreased with increased BMI-category, as shown in
Figure 2. Participants with overweight walked an average 33.6 m shorter than normal and
underweight participants. Moreover, participants with obesity walked an average of 78.1 m
shorter than participants with overweight.
35
Figure 2: Six-minute walking capacity in relation to body mass index
0
200
400
600
800
Normal orunderweightn=19
n=26 n=42
Met
ers
wal
ked
Overweight Obesity
4.3 Paper II In the first part, proportions with high and low food intake frequencies and measured
biomarkers related to food intakes were investigated and compared among community-
dwelling participants with the genetic conditions (n=65), and in relation to weight status. In
the second part, food related autonomy, food intake frequencies and measured biomarkers
were compared between participants with DS living in community residence (n=24), and
participants with DS living with relatives (n=16).
Daily fruit consumption was recorded in 70 % of participants with PWS, 33 % of participants
with DS and 15 % of participants with WS. Daily vegetable consumption was found in 85 %
of the PWS group, 29 % in the DS group, and 20 % in the WS group. Comparing the
diagnoses, a significant larger proportions in the PWS group were high frequency consumers
of fruits, and vegetables. Furthermore, higher total carotenoid levels in plasma were measured
in the PWS group compared to the WS group and the DS group. In WS, a larger proportion
was low frequency consumers of fish, and fewer used omega-3 fatty acid supplements.
Supporting these findings reduced contents of long chained omega-3 fatty acids were
measured in the erythrocyte membranes of persons with WS compared to the two other
groups.
Normal weight- and overweight participants with DS and PWS were more likely to be high
frequency consumers of fruits compared to obese peers. In addition, a negative association
between BMI and measured total plasma carotenoids were observed in these two subgroups,
36
however this association was only significant for participants with DS. In contrast, the lowest
concentrations of plasma carotenoids were detected in persons being underweight or in the
lower end of normal BMI range among participants with WS.
Persons with DS living in communities participated more often in decisions of what to eat,
groceries to buy, and preparations of warm meals, when compared to peers living with
relatives. No differences in intake frequencies of fruits, vegetables, fish, and use of
supplementations or measured biomarkers were detected when persons with DS living in
communities were compared to those living with relatives. However, a larger proportion in
community residences was found to be high frequency consumers of precooked meals.
Moreover, a non-significant tendency towards increased proportion with high frequency
consumption of soft-drinks was observed among the community-dwelling participants with
DS.
4.4 Paper III All study participants >20 years of age were included (n=72) and established metabolic risk
factors of CVD assessed. The prevalence rates in the included subgroups were compared to
those in the general Norwegian population, based on data from about 14.000 participants age
20-43 years in the HUNT-3 study. In addition, the association between abdominal obesity
and the CVD risk factors were investigated in the included subgroups.
Hypercholesterolemia determined by use of total cholesterol and LDL cholesterol, was found
among 40 % with PWS, 19.4 % with DS and 14.3 % with WS. No differences in increased
total cholesterol were detected when compared to the general population. In WS, better blood
lipid profile was observed when measured levels of HDL cholesterol, apolipoprotein A1 and
apolipoprotein B were compared to those of participants with PWS and WS. Furthermore, no
participants with WS were found with total cholesterol: HDL cholesterol ratio > 5, in contrast
to 40.0 % in the PWS group, 32.3 % in the DS group and 20.6 % in the general population.
A very high risk of hypertension was observed in the WS group (52.4 %), and with an almost
five times higher risk when compared to the general population. High risk of hypertension
was also observed in the PWS group (30.0 %), with 2.8 times increased risk compared to the
general population. No participants with DS were found with elevated blood pressure.

37
Metabolic syndrome was observed in 25.0 % with PWS, 19.4 % with DS and 14.3 % with
WS. No difference was observed when compared to the general population, where the
prevalence rates of metabolic syndrome was 23.2 %.
Type 2 diabetes was found in 15.0 % and 14.3 % with PWS and WS, respectively. The risk of
type 2 diabetes was found to be about three times higher in these groups compared to the
general population. Low prevalence of type 2 diabetes was recorded in the DS group.
Increased WC was observed in 71.4 % of participants with WS, 80.6 % of participants with
DS and 90.0 % of participants with PWS, but only significantly increased among participants
with PWS and participants with DS, when compared to the general population. Abdominal
obesity was prevalent and increased in all three subgroups when compared to the general
population. Abdominal obesity was furthermore associated with increased risk of
hypertension and metabolic syndrome. WS was the subgroup with the largest mean increased
in systolic and diastolic blood pressure when the persons with abdominal obesity was
compared to those with normal and increased WC.
The high risk of hypertension, type 2 diabetes, and abdominal obesity in the PWS and WS
groups, provides these subgroups with elevated risk of CVD. In DS, despite the high risk of
abdominal obesity, reduced risk of CVD were noted.

38
5 Discussion
5.1 Methodological considerations
5.1.1 Study populations
In studies with focus on lifestyle related health and open invitations to participate, there is a
possibility for selection bias towards participants with higher level of health consciousness
and participants living in more health conscious environments. On the other hand, data
collection was performed in courses with focus on providing both the participants themselves
and their caregivers with information about how to improve lifestyle in these populations.
This may have led to recruitment of persons with challenges related to lifestyle. In studies
from the general population, information about socio-economical and educational level are
demographic variables often used to investigate and describe study populations with regard to
overall health status and health consciousness (17). In populations with ID however such
approach is invalid, as most persons are offered specialised high school program and
thereafter supported employment with disability allowance as their primary source of income.
In Norway, the local municipalities are responsible for the disability services as stated in the
Health and Care Service Act. The national legislation further states that all persons with
disabilities have the right to be provided with support services to ensure adequate living
situations and health. However, there is variability in how the services are organized and
distributed between municipalities. This makes it difficult to find a common robust variable
that could imply the overall level of environmental health conscious in-between the
participants.
A strength of the study was the national wide recruitment and high participant rate from the
known Norwegian population of persons with PWS and WS. Unfortunately, in a national
perspective an overrepresentation from the southeast health region combined with
underrepresentation of participants from the central and northern part of the country occurred.
No formal assessment of cognitive functioning was performed in this study and is a limitation
as this makes it difficult to determine if the participants were representative for their
respective diagnosis in cognitive reasoning and overall cognitive functioning. In general, most
persons in the study populations cooperated well in all data collection situations. This

39
observation may at least partly be explained by the repeated adjusted information prior to data
collection, but may also indicate reduced levels of adaptive behavioural difficulties in the
study populations.
Drop-out in the study was low. A few participants (n=6) had difficulties in finding a support
persons with the possibility to accompany them in the travel and data collection. No further
investigations of these participants were conducted. In addition, prior to data collection two
persons with PWS withdrew from the study. This was not surprisingly as PWS is associated
with mood-swings and emotional difficulties related unfamiliar situations (182). Furthermore,
lack of valid accelerometer registration in the physical activity assessment was noted in four
cases. A part form this, in all other measures complete datasets were obtained.
5.1.2 Study design
The cross-sectional design of the study in this thesis prohibits the possibility to assess
causality. Longitudinal studies would be preferable for investigation of the role of different
lifestyle factors in relation to relevant health outcomes. However, cross-sectional studies are,
if conducted with sufficient accuracy, well suited for descriptive investigations, obtaining
prevalence data and for generalization of hypothesis (248).
A major strength of this thesis was that the investigations were performed in specific
subgroups rather than studying persons with ID as a homogenous group. Investigations
performed on populations of mixed ID, do not take in to account the differences in behaviors
and biological basis of the different conditions. For these reasons, investigations of persons
with mixed groups of ID likely will face difficulties in identifying health risks associated with
the specific conditions. Especially, when the behavioral phenotypes or biological pathways
related to the health issue may be changed as a result of the genetic makeup of the syndrome.
In this study we observed differences in intake frequency of foods reported in paper II that
may be related to behavioral phenotype. Moreover, in paper III we observed clear
differences in cardiovascular risk profile that are likely related to the genotype.
Self-reported methods are in general considered to be associated with bias. Because of the
cognitive impairments this is an even larger concern in the present study populations. The use
of proxy-reported measures also has important limitations in adult persons with ID living
independently in communities and many hours a day without support. For this reasons the use

40
of objective measures were regarded as preferable when feasible in the study. Furthermore,
the participants themselves were selected as informants when self-report measures were used.
This decision was based on the assumption that the overall level of ID was similar in the
included subgroups and that proxy-report from a mix of parents and employed support
persons were especially difficult. Good preparation of the participants with information and
training, together with adaptation and simplification of methods were performed to adjust the
methods to the abilities in the study population. Even so, the lack of formal investigation of
cognitive functioning in the study population is a weakness, as the cognitive abilities may
have been different between the compared subgroups. This is a concern in general and
especially in paper II where self-reported measures of intake frequencies and food related
autotomy were used. However, to support these data, biomarkers in blood related to dietary
intakes were measured and good agreement between the self-reported intake frequency and
measured parameters was obtained. Such a combination of two different methods strengthens
the data and facilitates conclusions.
A challenge in studies on subgroups with ID is the use of proper control groups. In all papers,
papers I-III, the included syndromes were compared with each other without formal control
groups. In addition, in paper I the results were compared to a recent large Norwegian
epidemiological study on physical activity in adults (241). The use of identical study
protocols is a strength in this comparison. In paper III prevalence data from the HUNT-3
study was used as comparison. Even though there were some differences in available
measures and methodology between our study and the HUNT-3, this comparison add
important information about the CVD risk profiles in the genetic syndrome. Unfortunately, it
was difficult to find relevant and comparable data on the food intake frequency data in paper
II. The simplified methodology used, to adjust to the cognitive impairments in the included
groups, lead to methodological differences and difficulties in comparison of the result from
the sturdy population to those in the general population. The results were therefore only
discussed in relation to relevant findings from the general population. In addition, to the best
of our knowledge, no formal assessment of dietary intakes in adults with ID has previously
been conducted in a Norwegian research setting, hampering the possibility to compare the
result to a population with ID of mixed etiology. These results must therefore be regarded as
preliminary.

41
5.1.3 Statistical considerations
The insufficient number of participants in this thesis gives the study low statistical power and
could have led to erroneous p-values, not detecting differences between the subgroups when
there actually is a difference (type II error). In sample size calculations performed as part of
preparation to the study at least 120 participants ideally should have been recruited, equally
distributed between the diagnoses. However, with a population of only 5.1 million persons to
recruit from and working with rare diagnosis with increased mortality rates, we were not able
to recruit this number of participants.
Strategies to increase the possibility to describe the differences such as collapse of categories
as performed in the ordinal variables paper II, led to loss of precision in the measured food
intake frequencies and description of food related autonomy.
Moreover, in papers I-III normal and underweight participants were collapsed with
participants presented with overweight or increased WC and compared to participants with
obesity or abdominal obesity, respectively. This analytic strategy were performed due to low
number of participants in the normal range, but may have led to an underestimation of the
association with excessive body fat mass.
Finally, in paper III the analysis comparing the diagnosis groups were not corrected for
differences in age and living situations as such statistical correction requires a sufficient
number of participants. Even so, the crude description of prevalence rates for the different
CVD risk factors likely provides important knowledge of the future risk of CVD in these
genetic conditions regardless of the comparison between the diagnosis groups.
5.2 Discussion of results Unfortunately, persons with ID are often excluded from national surveys and research aiming
to describe and improve the public health. The increased longevity in persons with ID (18, 19)
warrants increased focus on health promotion also in these groups. To the best of our
knowledge the study in this thesis is the first study from a Norwegian health and care context
to assess lifestyle and related health issues in specific genetic conditions associated with ID.
Thus, the thesis provides new knowledge about lifestyle and related health challenges in the
subgroups studied.

42
5.2.1 Major lifestyle related health risks
It is now well documented from diverse cohorts that overweight and obesity is a major public
health concern among persons with ID (34, 47, 55-57). Our study confirms the high risk of
obesity as a common health challenge in all three subgroups, and highlights a need for
interventions to reduce obesity. It has been recognised that DS and PWS may be at particular
risk of obesity (28, 49), but previously not described to any great extent in relation to WS.
Interestingly, WS seems to be a condition with a dual situation related to body weight.
Obesity was the prevailing problem but underweight was also detected in WS, which fits well
with the data providing evidence of increased prevalence of underweight in adult persons with
ID compared to the general population (47, 57). No gender differences in overweight and
obesity were detected in the study population, and were in contrast to several previous reports
where females with ID were found to present higher rates of obesity (54-57).
Diets and physical activity are important in relation to obesity as both factors influence the
body’s energy balance. More documentation on diets and physical activity, and facilitators
and barriers affecting these lifestyles are therefore important for our understanding of why the
groups are at particular risk of developing abnormal body weights. The overall physical
activity in the study population was lower when compared to the general population, and
especially low activity levels were noted in females in the study population compared to
females in the general population (241). Reduced levels of physical activities in females with
ID when compared to male peers have also been described previously (36, 54, 69, 70).
Furthermore, low adherence to physical activity recommendations was detected, indicating
sedentary lifestyles for a majority in the included groups, as documented for persons with ID
in multiple studies from other countries (36, 54, 66, 249).
The actual level of physical activity is however more difficult to compare between the
different studies due to methodological differences also in studies using objective
measurement techniques. These include some studies with pedometers (65, 66), whereas
others use accelerometers (36, 70), providing differences in outcome measures. Different data
processing procedures are also being used making comparisons, for example between our
study of physical activity and that of Phillips and colleagues difficult (36). In addition,
physical activity recommendation differs between countries and must be kept in mind when
comparing the proportions meeting physical activity recommendation in the different studies.
Even so, Peterson and colleagues investigated physical activity in community-dwelling

43
persons with mild to moderate ID, and found a mean of 6508 steps/day among their
participants (66). In a Swedish intervention study with aim of promoting healthy lifestyle in a
mixed group of persons with ID, a mean of 6296 steps/day was observed in the control group
(55). These results were close to the mean of 6712 steps/day observed in our study
population. In the intervention group of the Swedish study, a mean of 8042 steps/day was
recorded providing promising evidence of increased physical activity after health promoting
intervention in persons with ID (55). Other studies in groups of persons with ID have also
found that interventions can result in higher levels of physical activity and improved physical
fitness (250).
No association between BMI and overall physical activity was detected in our study and this
was in contrast to finding from the general population (251). Hence, supporting the notion
that unique barriers to physical activity may exists for the included groups (71, 75-77, 252).
Even so, reduced time in MVPA was noted in obese participants and in accordance with
previous descriptions (70). The reduced time in MVPA also fits well with the reduced
physical capacity observed with increased weight. These findings point towards the important
discussion about how obesity affects everyday life in persons with ID, and the fact that
reduced cardiorespiratory capacity may lead to reduced abilities to participate in society and
increased support needs (253). Overall the results warrants increased focus on promoting
physical activity in the subgroups, and imply that specific strategies for females are needed.
In general, few descriptions of diets in adult persons with ID living in communities exist, and
prior to the dietary assessment performed as part of this thesis, no description of diets
involving adult persons with WS were found in the literature. The low numbers of studies are
probably related to the lack of validated dietary assessment techniques for use in adult persons
with ID living in communities (88). New methods with use of digital photography, use of
web-based dietary assessments, as well as the field of nutritional biomarkers are evolving (87,
94, 95, 97, 100). This is promising and has the potential to provide us with more data with
improved quality in the future. Even so, these methods still needs further validations before a
standardized dietary assessment technique is developed for use in adult persons with
limitations in cognitive abilities.
In DS and WS relative few participants consumed fruits and vegetables daily, providing
evidence of intakes below recommended levels, and that increased intakes can be

44
recommended in these subgroups (254). The low intake of fruit and vegetables observed was
in line with previous descriptions in persons with ID (35, 37, 90, 92, 93, 104).
In DS, a negative association between BMI and measured total plasma carotenoids was
observed. Furthermore, normal weight- and overweight participants with DS and PWS were
compared to obese more likely to be high frequency consumers of fruits. From adults with ID
high frequency of snack meals has been reported and high intakes of energy were reported in
these meals (93). In a recent publication snack meals were the main contributing meal for fruit
intakes in the general Norwegian adult population (255). Altogether these findings may
indicate that more frequent use of fruits in snack meals could result in reduced energy intake
and more favourable weight outcome in adult persons with DS and PWS. Unfortunately, this
hypothesis cannot be answered by the data obtained in the study but should be evaluated in
future research.
Low intake frequencies of fish was observed in a majority of persons with WS combined with
less use of omega-3 fatty acid supplementations, and reduced omega-3 fatty acids found in
their erythrocyte membranes. This implies that persons with WS may have an elevated risk of
suboptimal intakes of essential omega-3 fatty acids and low dietary intakes of vitamin D. The
results obtained indicate a need for further evaluation of nutritional intakes among adults with
WS.
It is a paradox that the PWS group, the subgroup with the best described and well known
dietary challenges (191), was found to present the most favourable dietary intake pattern. The
findings illustrate the importance of good descriptions of dietary vulnerabilities associated
with specific subgroups and the use of targeted methods, management and support to achieve
defined goals.
It has been recognised that living arrangements for adults with ID affects the risk of
developing obesity and secondary health conditions, and that living in less structured
environments are associated with increased risk (56, 121). Less attention however has been on
evaluation of dietary intakes in relation to autonomy. Increased food related autonomy was
not associated with differences in intakes of fruits, vegetables and fish. In our study however
increased consumption of precooked meals and a tendency of increased intakes of soft drinks
were observed. The frequent use of precooked meals implies that persons with ID and their
caretakers need to be given guidance in how to find and select healthy precooked meals. This
45
as high energy and sodium intakes combined with low intakes of essential nutrients may be
consumed with if unhealthy meals are selected. Furthermore, it is important to ensure that the
uses of these meals are voluntary and not forced due to lack of support, as such practice
would be a violation of the right to self-determination. High intakes of soft drinks have been
recognized in previous descriptions, and high intakes were associated with increased risk of
obesity (57, 93). We did not detect an association between frequency of soft drink
consumption and BMI. However in our study we did not differentiate between sugar-
sweetened soft drinks and artificially-sweetened soft drinks. We believe, in light of current
policy, that there is an urgent need of further evaluation on the conflict between self-
determination and diet quality. This could promote a constructive discussion about how to
provide good health promoting support for persons with ID.
5.2.2 Relationship between genotype and risks of atherosclerotic cardiovascular disease
Specific genetic syndromes associated with ID most often present distinct patterns of medical
complications and comorbidities as has been described for all three genetic conditions
included in this study (27-29). Comorbidities present at birth or developing early in life is
currently best described. The risk of developing secondary health conditions, such as CVD, in
adulthood, and related to aging, is less well described in different genetic syndromes,
especially in rare genetic conditions (256).
The relationship between the presence of CVD risk factors and hard end points like CVD
events or death has not been extensively studied in adults with ID, let alone in small
subgroups. Yet, similar rates of CVD death were reported among persons 50 years old or
older with ID (122), and CVD was recognized as an important cause of death also for persons
with ID (24). Until further studied, it seems reasonable to assume that the presents of known
risk factors are accompanied by increased risk of CVD, also for subgroups associated with ID.
In this study we detected a distinct difference in metabolic risk profile between the subgroups,
with elevated risk for development of CVD in the PWS group and the WS group, and low risk
of CVD noted for the majority of participants with DS. These results are supported by the
high cardiovascular-related premature deaths reported in the PWS and WS groups (172, 213),
and the reduced risk of atherosclerosis described in DS (123).

46
Some of these measured differences in CVD risk between the diagnoses are likely related to
genetic alterations found in the respective condition. From a genetic point of view,
hemizygosity due to a deletion in the WS- critical region are accompanied with high risk of
congenital structural cardiovascular abnormalities (108, 209, 222). Moreover, increased risks
for development of major CVD risk factors later in life, such as hypertension and type 2
diabetes are also recognized (226, 229, 233). Our study confirms the elevated risk of
hypertension and type 2 diabetes. However we also demonstrated an association between
hypertension and abdominal obesity which emphasize the importance of integrating proper
medical treatment with lifestyle interventions to reduce body weight for individuals with
obesity in this subgroup. In PWS the lack of parentally active genes in the q11-q13 region on
chromosome 15 leads to alternation in neuronal development and are accompanied by a
distinct behavioral phenotype (28). Central in this is the hyperphagia which, if not externally
controlled, lead to development of morbid obesity early in life (191). The more recently
described complex endocrinological situation associated with the syndrome (188, 193, 203),
is also likely to influence the risk of developing secondary conditions such as CVD later in
life (257). In DS the reduced risk of atherosclerosis and hypertension is recognized, but the
biological mechanisms behind are currently not described, but are most likely connected to
the genetic basis of the diagnosis. Lower levels of homocysteine due to higher dosage of the
gene, cystathionine beta synthase, have been suggested to contribute to the reduced
development of atherosclerosis (126), but a causal relationship between homocysteine and
CVD has not been established. Reduced risk of CVD seems to be the prevailing situation
among individuals with DS, although it must be emphasized that not all persons present a low
CVD risk profile. In our study metabolic syndrome, unfavorable blood lipid levels, and high
prevalence of abdominal obesity were detected also in this subgroup. These finding are
supported by a Swedish cohort study, where atherosclerosis was reported to be the cause of
death among 7 % with DS (18).
The most common risk factor presented was abdominal obesity and linked to increased risk of
other important risk factors of CVD as well documented for the general population (40). The
second most prevalent risk factors found was hypertension, with an almost five times
increased risk observed in the WS group, and almost three times increased risk seen in the
PWS group. From the general population hypertension is recognized as major risk factor of
ischemic heart disease, heart failure, stroke and renal disease. Moreover, the relationship

47
between blood pressure and risk of CVD events is continuous, consistent, and independent of
other risk factors (247). In persons with hypertension healthy diet, weight control, and regular
exercise is recommended (258). In the general population randomized trials have shown
blood pressure lowering effects of increased fruit and vegetable consumption combined with
reduced intakes of sodium (259). Increased intakes of fruits and vegetables are highly relevant
in light of the low frequency intakes observed, especially among a majority of participants
with WS. In contrast to most other nutrients, sodium in foods is primarily added in
preparation or preservation. The frequent use of precooked meals described in persons living
in community residences, may therefore be accompanied by high intakes of sodium. This
implies that an evaluation of the total dietary intake of sodium from diets of persons with ID
living in communities may be important, especially if diagnosed with hypertension.
Elevated prevalence rates of type 2 diabetes were observed in the PWS group and a clear
tendency of increased risk was also seen in the WS group. Diabetes mellitus is a powerful risk
factor of CVD in the general population (260, 261), and most likely also in persons with ID.
Moreover, type 2 diabetes in itself is serious medical condition that influences everyday life
for persons affected, and with potentially severe complications related also to other organ
systems. Diabetic complications like micro- and macro vascular, nephropathy, neuropathy
and retinopathy are strongly influenced by glycemic control (262-264). To obtain glycemic
control, the individual have to combine information from nutritional intakes, level of physical
activity, and glucose-lowering medical treatment. This is a complex task, especially for
persons with cognitive limitations. Poor glycemic control has been reported in 52 % from a
cohort of persons with ID and diabetes. Furthermore, increased risk of emergency admission
due to diabetes related health complications were described in this group of adults with ID
(265). To reduce the risk of diabetes associated complications good support for optimal
diabetes management is therefore essential for the persons affected. In additions, health
promoting initiatives to reduce the risk for development of type 2 diabetes are important,
especially in high risk groups like the PWS group and the WS group. Again, such health
promoting initiatives points towards the importance of preventive strategies and programs for
weight reduction, increased physical activity and healthy diets to achieve such goal.

48
6 Conclusions In all three subgroups we observed reduced levels of physical activity when compared to the
general Norwegian population, and low adherence to physical activity recommendations.
Especially low levels of activity were noted among females. No association between total
physical activity and BMI was noted, however BMI was strongly associated with reduced
physical capacity. Thus, indicate that the high rates of obesity observed may increase the
individuals support needs and affect the person’s abilities to participate in society.
Low intake frequency of fruit and vegetables was observed in a relative large proportion of
persons with WS and DS. Furthermore, we found low intake frequencies of fish among the
majority of individuals with WS, and a reduced proportion using omega-3 supplementation
when compared to the two other subgroups. The results based on reported intake frequencies
were supported by the measured biomarkers. Altogether, WS was found to be a nutritionally
vulnerable group with both abdominal obesity and underweight detected, combined with
reduced dietary quality.
When compared to living with relatives living in communities was accompanied by increased
food related autonomy, but no difference in proportions with high and low intake frequencies
of fruits, vegetables and fish. However a larger proportion with frequent consumption of
precooked meals and indication of increased proportion with high intake frequency of soft
drinks could be demonstrated. To increase diet quality, the latter may represent important
areas to address in health promotion for persons with ID.
Abdominal obesity was the most prevalent metabolic risk factor observed and common in all
three subgroups. In additions, an association between several important risk factors of CVD
and abdominal obesity was observed, as previously recognized from the general population.
Apart from this, a clear diversity in risk of CVD was observed between the genetic subgroups.
The PWS and WS groups were found to present elevated risk, as high prevalence of several
important metabolic risk factors of CVD was observed in these groups. The DS was
associated with low risk of CVD, although not totally risk free.
To reduce the health inequality there is a need of diagnosis and gender adjusted strategies to
promote public health in the studied genetic subgroups. Such health promotion should
emphasise preventive strategies to avoid unhealthy weight gain, programs for weight

49
reduction, and improvements in lifestyle. Furthermore, development of tailored diagnose-
specific health checks is needed to ensure optimal health outcome among adults with these
genetic syndromes.
50
7 Future perspectives For persons with genetic conditions associated with ID still there is a need for more
knowledge of the developmental courses of secondary health complications related to lifestyle
in adult age and in relation to aging. Ideally, such studies should be prospective in order to
describe causal relationship. Improved recognition of secondary conditions that have a basis
in genetics and lifestyle, and subsequent application of appropriate interventions to modify
health outcomes in these genetic syndromes have the potential to reduce the described health
inequalities.
There is a need for further development of dietary assessment techniques for use in adults
with ID. Persons with ID are nutritionally vulnerable and new tools will be valuable in
monitoring diets and measure effects of health promotion interventions aiming to increase the
diet quality. The current legal and political view emphasizes equality, self-determination,
participation and integration for persons with ID. Indeed, this is a positive development for
the persons affected. However, in order to develop good support models integrating the right
to self-determination with health promotion, there is an urgent need for more knowledge on
how self-determinations influence levels of physical activity and dietary intake patterns.
Females with ID have lower median life expectancy when compared to males and the most
years of life lost compared to the general population (24). Females with ID seem to be less
engaged in physical activities when compared to male peers (36, 69). Furthermore, increased
risk of obesity is described in females with ID (55-57). Altogether this point towards an
important gender perspective which should be addressed in future interventions aiming to
improve public health in persons with ID.

51
8 References 1. World Health Organization. Atlas: Global Resources for Persons with Intellectual
Disabilities. Geneva, Switzerland: 2007. 2. Schalock RL, Luckasson RA, Shogren KA, Borthwick-Duffy S, Bradley V, Buntinx
WH, et al. The renaming of mental retardation: understanding the change to the term intellectual disability. Intellect Dev Disabil. 2007;45(2):116-24.
3. Harris J. Intellectual disability: Understanding Its development, Causes, Classification,
Evaluation, and Treatment. New York: Oxford University Press; 2006. 4. World Health Organization. International statistical classification of diseases and
related health problems. 10th revision, 2nd edition. Geneva: World Health Organization; 2004.
5. Maulik PK, Mascarenhas MN, Mathers CD, Dua T, Saxena S. Prevalence of
intellectual disability: a meta-analysis of population-based studies. Res Dev Disabil. 2011;32(2):419-36.
6. Stromme P, Magnus P. Correlations between socioeconomic status, IQ and aetiology
in mental retardation: a population-based study of Norwegian children. Soc Psychiatry Psychiatr Epidemiol. 2000;35(1):12-8.
7. Leonard H, Wen X. The epidemiology of mental retardation: challenges and
opportunities in the new millennium. Ment Retard Dev Disabil Res Rev. 2002;8(3):117-34.
8. Sondenaa E, Rasmussen K, Nottestad JA, Lauvrud C. Prevalence of intellectual
disabilities in Norway: Domestic variance. J Intellect Disabil Res. 2010;54(2):161-7. 9. Stromme P, Valvatne K. Mental retardation in Norway: prevalence and sub-
classification in a cohort of 30037 children born between 1980 and 1985. Acta Paediatr. 1998;87(3):291-6.
10. Stromme P. Aetiology in severe and mild mental retardation: a population-based study
of Norwegian children. Dev Med Child Neurol. 2000;42(2):76-86. 11. Katz G, Lazcano-Ponce E. Intellectual disability: definition, etiological factors,
classification, diagnosis, treatment and prognosis. Salud Publica Mex. 2008;50 Suppl 2:s132-41.

52
12. Topper S, Ober C, Das S. Exome sequencing and the genetics of intellectual disability. Clin Genet. 2011;80(2):117-26.
13. Gilissen C, Hehir-Kwa JY, Thung DT, van de Vorst M, van Bon BW, Willemsen MH,
et al. Genome sequencing identifies major causes of severe intellectual disability. Nature. 2014;511(7509):344-7.
14. Mefford HC, Batshaw ML, Hoffman EP. Genomics, intellectual disability, and autism.
N Engl J Med. 2012;366(8):733-43. 15. Bathy BC, JC. McMahon, WM. Neurodevelopmental Disorders and Medical Genetics.
In: Goldstein SR, CR. , editor. Handbook of Neurodevelopmental and Genetic Disorders in Adults. New York: The Guilford press; 2005.
16. Gropman AL, Batshaw ML. Epigenetics, copy number variation, and other molecular
mechanisms underlying neurodevelopmental disabilities: new insights and diagnostic approaches. J Dev Behav Pediatr. 2010;31(7):582-91.
17. Sosiale helseforskjeller i Norge. In: Folkehelserapporten 2014 [Internet]. Oslo:
Norwegian Institute of Public Health; 2014 Jun [Cited 2014 Sep 23]. Available from: http://www.fhi.no/artikler/?id=110779.
18. Englund AJ, B. Zander, C. S. Gustafsson, J. Anneren, G. Changes in mortality and
causes of death in the Swedish Down syndrome population. Am J Med Genet. 2013;161A(4):642-9.
19. Zhu JL, Hasle H, Correa A, Schendel D, Friedman JM, Olsen J, et al. Survival among
people with Down syndrome: a nationwide population-based study in Denmark. Genet Med. 2013;15(1):64-9.
20. Bittles AH, Petterson BA, Sullivan SG, Hussain R, Glasson EJ, Montgomery PD. The
influence of intellectual disability on life expectancy. J Gerontol A Biol Sci Med Sci. 2002;57(7):M470-2.
21. Ellingsen KE. Helseoppfølging av personser med utviklingshemning [Internet].
Trondheim: The National Institute on Intellctual Disability and Community; 2007 Dec [Cited 2014 Oct 14]. Available from: http://naku.no/node/308.
22. Emerson E, Robertson J, Baines S, Hatton C. The self-rated health of British adults
with intellectual disability. Res Dev Disabil. 2014;35(3):591-6.

53
23. Haveman M, Perry J, Salvador-Carulla L, Walsh PN, Kerr M, Van Schrojenstein Lantman-de Valk H, et al. Ageing and health status in adults with intellectual disabilities: results of the European POMONA II study. J Intellect Dev Disabil. 2011;36(1):49-60.
24. Heslop P, Blair PS, Fleming P, Hoghton M, Marriott A, Russ L. The Confidential
Inquiry into premature deaths of people with intellectual disabilities in the UK: a population-based study. Lancet. 2014;383(9920):889-95.
25. Emerson EB, S. Allerton, L. Welch, V. Health Inequalities & People with Learning
Disabilities in teh UK:2011 [Internet]. Cambridge, England:Publich Health England; 2011 Aug [Cited 2014 Oct 9]. Available from: https://www.improvinghealthandlives.org.uk/publications/978/Health_Inequalities_&_People_with_Learning_Disabilities_in_the_UK:_2011.
26. Krahn GL, Hammond L, Turner A. A cascade of disparities: health and health care
access for people with intellectual disabilities. Ment Retard Dev Disabil Res Rev. 2006;12(1):70-82.
27. Pober BR. Williams-Beuren syndrome. N Engl J Med. 2010;362(3):239-52. 28. Cassidy SB, Schwartz S, Miller JL, Driscoll DJ. Prader-Willi syndrome. Genet Med.
2012;14(1):10-26. 29. Ostermaier KK. Down syndrome: Clinical features and diagnosis. In:UpToDate. Post
TW (Ed), Up To Date; 2013 [cited 2014 Nov 14]. 30. Søderstrøm S, Tøssebro J. Innfridde mål eller brutte visjoner? Noen hovedlinjer i
utviklingen av levekår og tjenester for utviklingshemmede [Internet]. Trondheim: NTNU Samfunnsforskning, 2011 May [Cited 2014 Sept 24]. Available from: http://www.asvl.no/filestore/RapportInnfriddemlWEB-utgave.pdf
31. Robertson J, Roberts H, Emerson E, Turner S, Greig R. The impact of health checks
for people with intellectual disabilities: a systematic review of evidence. J Intellect Disabil Res. 2011;55(11):1009-19.
32. McGuire BE, Daly P, Smyth F. Chronic pain in people with an intellectual disability:
under-recognised and under-treated? J Intellect Disabil Res. 2010;54(3):240-5. 33. Lennox NG, Diggens J, Ugoni A. Health care for people with an intellectual disability:
General Practitioners' attitudes, and provision of care. J Intellect Dev Disabil. 2000;25(2):127-33.

54
34. Mikulovic J, Vanhelst J, Salleron J, Marcellini A, Compte R, Fardy PS, et al. Overweight in intellectually-disabled population: physical, behavioral and psychological characteristics. Res Dev Disabil. 2014;35(1):153-61.
35. McGuire BE, Daly P, Smyth F. Lifestyle and health behaviours of adults with an
intellectual disability. J Intellect Disabil Res. 2007;51(Pt 7):497-510. 36. Phillips AC, Holland AJ. Assessment of objectively measured physical activity levels
in individuals with intellectual disabilities with and without Down's syndrome. PloS one. 2011;6(12):e28618.
37. Draheim CC, Stanish HI, Williams DP, McCubbin JA. Dietary intake of adults with
mental retardation who reside in community settings. Am J Ment Retard. 2007;112(5):392-400.
38. Feldman MA, Bosett J, Collet C, Burnham-Riosa P. Where are persons with
intellectual disabilities in medical research? A survey of published clinical trials. J Intellect Disabil Res. 2014;58(9):800-9.
39. World Health Organization. Obesity: preventing and managing the global epidemic.
Report of a WHO consultation. Geneva, Switzerland: WHO; 2000. 40. Poirier P, Giles TD, Bray GA, Hong Y, Stern JS, Pi-Sunyer FX, et al. Obesity and
cardiovascular disease: pathophysiology, evaluation, and effect of weight loss: an update of the 1997 American Heart Association Scientific Statement on Obesity and Heart Disease from the Obesity Committee of the Council on Nutrition, Physical Activity, and Metabolism. Circulation. 2006;113(6):898-918.
41. Wang Y, Rimm EB, Stampfer MJ, Willett WC, Hu FB. Comparison of abdominal
adiposity and overall obesity in predicting risk of type 2 diabetes among men. Am J Clin Nutr. 2005;81(3):555-63.
42. Petursson H, Sigurdsson JA, Bengtsson C, Nilsen TI, Getz L. Body configuration as a
predictor of mortality: comparison of five anthropometric measures in a 12 year follow-up of the Norwegian HUNT 2 study. PloS one. 2011;6(10):e26621.
43. Lofgren I, Herron K, Zern T, West K, Patalay M, Shachter NS, et al. Waist
circumference is a better predictor than body mass index of coronary heart disease risk in overweight premenopausal women. J Nutr. 2004;134(5):1071-6.
55
44. Klein S, Allison DB, Heymsfield SB, Kelley DE, Leibel RL, Nonas C, et al. Waist Circumference and Cardiometabolic Risk: a Consensus Statement from Shaping America's Health: Association for Weight Management and Obesity Prevention; NAASO, the Obesity Society; the American Society for Nutrition; and the American Diabetes Association. Obesity (Silver Spring). 2007;15(5):1061-7.
45. Holmen J, Thoen H, Langhammer A, Midthjell K, Krokstad S,. Somatic Health. In:
Public Health Development, The Hunt Study, Norway [Internet]. Trondheim: Hunt Research Centre; 2011:17-68 [Cited 2014 Oct 3]. Available from: http://www.ntnu.no/documents/10304/1130562/folkehelse-i-endring-huntrapport-2011.pdf.
46. Meyer HE, Tverdal A. Development of body weight in the Norwegian population.
Prostag Leukotr Ess. 2005;73(1):3-7. 47. Hove O. Weight survey on adult persons with mental retardation living in the
community. Res Dev Disabil. 2004;25(1):9-17. 48. Mikulovic J, Marcellini A, Compte R, Duchateau G, Vanhelst J, Fardy PS, et al.
Prevalence of overweight in adolescents with intellectual deficiency. Differences in socio-educative context, physical activity and dietary habits. Appetite. 2011;56(2):403-7.
49. De Winter CF, Bastiaanse LP, Hilgenkamp TI, Evenhuis HM, Echteld MA.
Overweight and obesity in older people with intellectual disability. Res Dev Disabil. 2012;33(2):398-405.
50. Slevin E, Truesdale-Kennedy M, McConkey R, Livingstone B, Fleming P. Obesity
and overweight in intellectual and non-intellectually disabled children. J Intellect Disabil Res. 2014;58(3):211-20.
51. Rimmer JH, Yamaki K, Lowry BM, Wang E, Vogel LC. Obesity and obesity-related
secondary conditions in adolescents with intellectual/developmental disabilities. J Intellect Disabil Res. 2010;54(9):787-94.
52. Wallen EF, Mullersdorf M, Christensson K, Malm G, Ekblom O, Marcus C. High
prevalence of cardio-metabolic risk factors among adolescents with intellectual disability. Acta Paediatr. 2009;98(5):853-9.
53. Sohler N, Lubetkin E, Levy J, Soghomonian C, Rimmerman A. Factors associated
with obesity and coronary heart disease in people with intellectual disabilities. Soc Work Health Care. 2009;48(1):76-89.

56
54. Emerson E. Underweight, obesity and exercise among adults with intellectual disabilities in supported accommodation in Northern England. J Intellect Disabil Res. 2005;49(Pt 2):134-43.
55. Bergstrom H, Hagstromer M, Hagberg J, Elinder LS. A multi-component universal
intervention to improve diet and physical activity among adults with intellectual disabilities in community residences: a cluster randomised controlled trial. Res Dev Disabil. 2013;34(11):3847-57.
56. Melville CA, Hamilton S, Hankey CR, Miller S, Boyle S. The prevalence and
determinants of obesity in adults with intellectual disabilities. Obesity Rev. 2007;8(3):223-30.
57. Hsieh K, Rimmer JH, Heller T. Obesity and associated factors in adults with
intellectual disability. J Intellect Disabil Res. 2014;58(9):851-63. 58. Norwegian Directorate of Health. Anbefalinger om kosthold og fysisk aktivitet
Recommendations [Internet]. Oslo: Norwegian Directorate of Health, 2014 Mar [Cited Oct 3] Report No.: IS-2170. Available from: https://helsedirektoratet.no/publikasjoner/anbefalinger-om-kosthold-ernering-og-fysisk-aktivitet.
59. Caspersen CJ, Powell KE, Christenson GM. Physical activity, exercise, and physical
fitness: definitions and distinctions for health-related research. Public Health Rep. 1985;100(2):126-31.
60. Jeon CY, Lokken RP, Hu FB, van Dam RM. Physical activity of moderate intensity
and risk of type 2 diabetes: a systematic review. Diabetes Care. 2007;30(3):744-52. 61. Kohl HW, 3rd. Physical activity and cardiovascular disease: evidence for a dose
response. Med Sci Sports Exerc. 2001;33(6 Suppl):S472-83; discussion S93-4. 62. Lee IM, Skerrett PJ. Physical activity and all-cause mortality: what is the dose-
response relation? Med Sci Sports Exerc. 2001;33(6 Suppl):S459-71; discussion S93-4.
63. Temple VA, Stanish HI. Pedometer-measured physical activity of adults with
intellectual disability: predicting weekly step counts. Am J Intellect Dev Disabil. 2009;114(1):15-22.
64. Draheim CC, Williams DP, McCubbin JA. Prevalence of physical inactivity and
recommended physical activity in community-based adults with mental retardation. Ment Retard. 2002;40(6):436-44.

57
65. Hilgenkamp TI, van Wijck R, Evenhuis HM. Low physical fitness levels in older adults with ID: results of the HA-ID study. Res Dev Disabil. 2012;33(4):1048-58.
66. Peterson JJ, Janz KF, Lowe JB. Physical activity among adults with intellectual
disabilities living in community settings. Prev Med. 2008;47(1):101-6. 67. Graham A, Reid G. Physical fitness of adults with an intellectual disability: a 13-year
follow-up study. Res Q Exerc Sport. 2000;71(2):152-61. 68. Cowley PM, Ploutz-Snyder LL, Baynard T, Heffernan K, Jae SY, Hsu S, et al.
Physical fitness predicts functional tasks in individuals with Down syndrome. Med Sci Sports Exerc. 2010;42(2):388-93.
69. Badia M, Orgaz MB, Verdugo MA, Ullan AM. Patterns and determinants of leisure
participation of youth and adults with developmental disabilities. J Intellect Disabil Res. 2013;57(4):319-32.
70. Bodde AE, Seo DC, Frey GC, Van Puymbroeck M, Lohrmann DK. Correlates of
Moderate-to-Vigorous Physical Activity Participation in Adults With Intellectual Disabilities. Health Promot. 2012.
71. Caton S, Chadwick D, Chapman M, Turnbull S, Mitchell D, Stansfield J. Healthy
lifestyles for adults with intellectual disability: knowledge, barriers, and facilitators. J Intellect Dev Disabil. 2012;37(3):248-59.
72. Frey GC, Buchanan AM, Rosser Sandt DD. "I'd rather watch TV": an examination of
physical activity in adults with mental retardation. Ment Retard. 2005;43(4):241-54. 73. Temple VA, Walkley JW. Perspectives of constraining and enabling factors for health-
promoting physical activity by adults with intellectual disability. J Intellect Dev Disbil. 2007;32(1):28-38.
74. Rimmer JH, Riley B, Wang E, Rauworth A, Jurkowski J. Physical activity
participation among persons with disabilities: barriers and facilitators. Am J Prev Med. 2004;26(5):419-25.
75. Howie EK, Barnes TL, McDermott S, Mann JR, Clarkson J, Meriwether RA.
Availability of physical activity resources in the environment for adults with intellectual disabilities. Disabil Health J. 2012;5(1):41-8.

58
76. Martin E, McKenzie K, Newman E, Bowden K, Morris PG. Care staff intentions to support adults with an intellectual disability to engage in physical activity: an application of the Theory of Planned Behaviour. Res Dev Disabil. 2011;32(6):2535-41.
77. Temple VA. Factors associated with high levels of physical activity among adults with
intellectual disability. Int J Rehabil Res. 2009;32(1):89-92. 78. Elmahgoub SS, Calders P, Lambers S, Stegen SM, Van Laethem C, Cambier DC. The
effect of combined exercise training in adolescents who are overweight or obese with intellectual disability: the role of training frequency. J Strength Cond Res. 2011;25(8):2274-82.
79. Calders P, Elmahgoub S, de Mettelinge TR, Vandenbroeck C, Dewandele I, Rombaut
L, et al. Effect of combined exercise training on physical and metabolic fitness in adults with intellectual disability: a controlled trial. Clin Rehabil. 2011;25(12):1097-108.
80. Barwick RB, Tillman MD, Stopka CB, Dipnarine K, Delisle A, Sayedul Huq M.
Physical capacity and functional abilities improve in young adults with intellectual disabilities after functional training. J Strength Cond Res. 2012;26(6):1638-43.
81. Giagazoglou P, Kokaridas D, Sidiropoulou M, Patsiaouras A, Karra C, Neofotistou K.
Effects of a trampoline exercise intervention on motor performance and balance ability of children with intellectual disabilities. Res Dev Disabil. 2013;34(9):2701-7.
82. Butler MG, Smith BK, Lee J, Gibson C, Schmoll C, Moore WV, et al. Effects of
growth hormone treatment in adults with Prader-Willi syndrome. Growth Horm IGF Res. 2013;23:81-7.
83. Phillips AC, Sleigh A, McAllister CJ, Brage S, Carpenter TA, Kemp GJ, et al.
Defective mitochondrial function in vivo in skeletal muscle in adults with Down's syndrome: a 31P-MRS study. PloS one. 2013;8(12):e84031.
84. Butler MG, Theodoro MF, Bittel DC, Donnelly JE. Energy expenditure and physical
activity in Prader-Willi syndrome: comparison with obese subjects. Am J Med Genet. 2007;143(5):449-59.
85. World Cancer Research Fund/American Institute for Cancer Research. Food, nutrition,
physical activity, and the prevention of cancer: a global perspective. Second expert report. Washington DC.: American Institute for Cancer Research; 2007.
59
86. World Health Organization. Diet, nutrition, and the prevention of chronic diseases: report of a joint WHO/FAO expert consultation. Geneva: World Health Organization; 2003.
87. Boeing H. Nutritional epidemiology: New perspectives for understanding the diet-
disease relationship? Eur J Clin Nutr. 2013;67(5):424-9. 88. Humphries K, Traci MA, Seekins T. Nutrition and adults with intellectual or
developmental disabilities: systematic literature review results. Intellectual and developmental disabilities. 2009;47(3):163-85.
89. Bertoli S, Battezzati A, Merati G, Margonato V, Maggioni M, Testolin G, et al.
Nutritional status and dietary patterns in disabled people. Nutr Metab Cardiovas. 2006;16(2):100-12.
90. Braunschweig CL, Gomez S, Sheean P, Tomey KM, Rimmer J, Heller T. Nutritional
status and risk factors for chronic disease in urban-dwelling adults with Down syndrome. Am J Ment Retard. 2004;109(2):186-93.
91. Soler Marin A, Xandri Graupera JM. Nutritional status of intellectual disabled persons
with Down syndrome. Nutr Hosp. 2011;26(5):1059-66. 92. Ptomey L, Goetz J, Lee J, Donnelly J, Sullivan D. Diet Quality of Overweight and
Obese Adults with Intellectual and Developmental Disabilities as Measured by the Healthy Eating Index-2005. J Dev Phys Disabil. 2013;25(6):625-36.
93. Adolfsson P, Sydner YM, Fjellstrom C, Lewin B, Andersson A. Observed dietary
intake in adults with intellectual disability living in the community. Food Nutr Res. 2008;52.
94. Ptomey LT, Willis EA, Goetz JR, Lee J, Sullivan DK, Donnelly JE. Digital
photography improves estimates of dietary intake in adolescents with intellectual and developmental disabilities. Disabil Health J. 2014;8:146-50.
95. Elinder LS, Brunosson A, Bergstrom H, Hagstromer M, Patterson E. Validation of
personal digital photography to assess dietary quality among people with intellectual disabilities. J Intellect Disabil Res. 2012;56(2):221-6.
96. Humphries K, Traci MA, Seekins T. Food on film: Pilot test of an innovative method
for recording food intake of adults with intellectual disabilities living in the community. J Appl Res Intellect Disabil. 2008;21(2):168-73.

60
97. Ptomey LT, Herrmann SD, Lee J, Sullivan DK, Rondon MF, Donnelly JE. Photo-assisted recall increases estimates of energy and macronutrient intake in adults with intellectual and developmental disabilities. J Acad Nutr Diet. 2013;113(12):1704-9.
98. Fekete K, Marosvolgyi T, Jakobik V, Decsi T. Methods of assessment of n-3 long-
chain polyunsaturated fatty acid status in humans: a systematic review. Am J Clin Nutr. 2009;89(6):2070-84.
99. Hodson L, Skeaff CM, Fielding BA. Fatty acid composition of adipose tissue and
blood in humans and its use as a biomarker of dietary intake. Prog Lipid Res. 2008;47(5):348-80.
100. Jenab M, Slimani N, Bictash M, Ferrari P, Bingham SA. Biomarkers in nutritional
epidemiology: applications, needs and new horizons. Hum Genet. 2009;125(5-6):507-25.
101. Baldrick FR, Woodside JV, Elborn JS, Young IS, McKinley MC. Biomarkers of fruit
and vegetable intake in human intervention studies: a systematic review. Crit Rev Food Sci Nutr. 2011;51(9):795-815.
102. Potischman N. Biologic and methodologic issues for nutritional biomarkers. J Nutr.
2003;133 Suppl 3:875-80. 103. Robertson J, Emerson E, Gregory N, Hatto C, Turner S, Kessissoglou S, et al.
Lifestyle related risk factors for poor health in residential settings for people with intellectual disabilities. Res Dev Disabil. 2000;21(6):469-86.
104. De Winter CF, Magilsen KW, van Alfen JC, Penning C, Evenhuis HM. Prevalence of
cardiovascular risk factors in older people with intellectual disability. Am J Intellect Dev Disabil. 2009;114(6):427-36.
105. Johnson C, Hobson S, Garcia AC, Matthews J. Nutrition and food skills education for
adults with developmental disabilities. Can J Diet Pract Res. 2011;72(1):7-13. 106. Van den Akker M, Maaskant MA, van der Meijden RJ. Cardiac diseases in people
with intellectual disability. J Intellect Disabil Res. 2006;50(Pt 7):515-22. 107. Freeman SB, Bean LH, Allen EG, Tinker SW, Locke AE, Druschel C, et al. Ethnicity,
sex, and the incidence of congenital heart defects: a report from the National Down Syndrome Project. Genet Med. 2008;10(3):173-80.
108. Collins RT, 2nd. Cardiovascular disease in williams syndrome. Circulation.
2013;127(21):2125-34.
61
109. Libby P. Inflammation in atherosclerosis. Nature. 2002;420(6917):868-74. 110. Lim SS, Vos T, Flaxman AD, Danaei G, Shibuya K, Adair-Rohani H, et al. A
comparative risk assessment of burden of disease and injury attributable to 67 risk factors and risk factor clusters in 21 regions, 1990-2010: a systematic analysis for the Global Burden of Disease Study 2010. Lancet. 2012;380(9859):2224-60.
111. He FJ, Nowson CA, Lucas M, MacGregor GA. Increased consumption of fruit and
vegetables is related to a reduced risk of coronary heart disease: meta-analysis of cohort studies. J Hum Hypertens. 2007;21(9):717-28.
112. Schwingshackl L, Hoffmann G. Comparison of Effects of Long-Term Low-Fat vs
High-Fat Diets on Blood Lipid Levels in Overweight or Obese Patients: A Systematic Review and Meta-Analysis. J Acad Nutr Diet. 2013;113(12):1640-61.
113. Jakobsen MU, O'Reilly EJ, Heitmann BL, Pereira MA, Balter K, Fraser GE, et al.
Major types of dietary fat and risk of coronary heart disease: a pooled analysis of 11 cohort studies. Am J Clin Nutr. 2009;89(5):1425-32.
114. He FJ, MacGregor GA. Effect of modest salt reduction on blood pressure: a meta-
analysis of randomized trials. Implications for public health. J Hum Hypertens. 2002;16(11):761-70.
115. Micha R, Wallace SK, Mozaffarian D. Red and processed meat consumption and risk
of incident coronary heart disease, stroke, and diabetes mellitus: a systematic review and meta-analysis. Circulation. 2010;121(21):2271-83.
116. Mellen PB, Walsh TF, Herrington DM. Whole grain intake and cardiovascular
disease: a meta-analysis. Nutr Metab Cardiovas. 2008;18(4):283-90. 117. Kelly JH, Jr., Sabate J. Nuts and coronary heart disease: an epidemiological
perspective. Br J Nutr. 2006;96 Suppl 2:S61-7. 118. Mozaffarian D, Wu JH. Omega-3 fatty acids and cardiovascular disease: effects on
risk factors, molecular pathways, and clinical events. J Am Coll Cardiol. 2011;58(20):2047-67.
119. Wee LE, Koh GC, Auyong LS, Cheong A, Myo TT, Lin J, et al. Screening for
cardiovascular disease risk factors at baseline and post intervention among adults with intellectual disabilities in an urbanised Asian society. J Intellect Disabil Res. 2014;58(3):255-68.
62
120. Draheim CC. Cardiovascular disease prevalence and risk factors of persons with mental retardation. Ment Retard Dev Disabil Res Rev. 2006;12(1):3-12.
121. De Winter CF, Bastiaanse LP, Hilgenkamp TI, Evenhuis HM, Echteld MA.
Cardiovascular risk factors (diabetes, hypertension, hypercholesterolemia and metabolic syndrome) in older people with intellectual disability: Results of the HA-ID study. Res Dev Disabil. 2012;33(6):1722-31.
122. Jansen J, Rozeboom W, Penning C, Evenhuis HM. Prevalence and incidence of
myocardial infarction and cerebrovascular accident in ageing persons with intellectual disability. J Intellect Disabil Res. 2013;57(7):681-5.
123. Draheim CC, Geijer JR, Dengel DR. Comparison of intima-media thickness of the
carotid artery and cardiovascular disease risk factors in adults with versus without the Down syndrome. Am J Cardiol. 2010;106(10):1512-6.
124. Yla-Herttuala S, Luoma J, Nikkari T, Kivimaki T. Down's syndrome and
atherosclerosis. Atherosclerosis. 1989;76(2-3):269-72. 125. Draheim CC, McCubbin JA, Williams DP. Differences in cardiovascular disease risk
between nondiabetic adults with mental retardation with and without Down syndrome. Am J Ment Retard. 2002;107(3):201-11.
126. Vis JC, Duffels MG, Winter MM, Weijerman ME, Cobben JM, Huisman SA, et al.
Down syndrome: a cardiovascular perspective. J Intellect Disabil Res. 2009;53(5):419-25.
127. Down JL. Account of a second Case in which the Corpus Callosum was defective.
Medico-chirurgical transactions. 1866;49:195-7. 128. Hazlett HC. Down syndrome. In: Goldstein S, Reynolds CR, ed. Handbook of
neurodevelopmental and genetic disorders in adults. New York: Guilford Press; 2005. 129. Loane M, Morris JK, Addor MC, Arriola L, Budd J, Doray B, et al. Twenty-year
trends in the prevalence of Down syndrome and other trisomies in Europe: impact of maternal age and prenatal screening. Eur J Hum Genet. 2013;21(1):27-33.
130. Offerdal K, Blaas HG, Eik-Nes SH. Prenatal detection of trisomy 21 by second-
trimester ultrasound examination and maternal age in a non-selected population of 49 314 births in Norway. Ultrasound Obstet Gynecol. 2008;32(4):493-500.

63
131. Medical Birth Registry. Congenital malformation, Down syndrome [Serial Online] 2013. Norwegian Institute of Public Health [cited 2014 Apr 8]. Available from: http://mfr-nesstar.uib.no/mfr/.
132. Melve KK, Lie RT, Skjaerven R, Van Der Hagen CB, Gradek GA, Jonsrud C, et al.
Registration of Down syndrome in the Medical Birth Registry of Norway: validity and time trends. Acta Obstet Gynecol Scand. 2008;87(8):824-30.
133. Yang Q, Rasmussen SA, Friedman JM. Mortality associated with Down's syndrome in
the USA from 1983 to 1997: a population-based study. Lancet. 2002;359(9311):1019-25.
134. De Graaf G, Vis JC, Haveman M, van Hove G, de Graaf EAB, Tijssen JGP, et al.
Assessment of Prevalence of Persons with Down Syndrome: A Theory-based Demographic Model. J Appl Res Intellect Disabil. 2011;24(3):247-62.
135. Presson AP, Partyka G, Jensen KM, Devine OJ, Rasmussen SA, McCabe LL, et al.
Current estimate of Down Syndrome population prevalence in the United States. J Pediatr. 2013;163(4):1163-8.
136. Freeman SB, Torfs CP, Romitti PA, Royle MH, Druschel C, Hobbs CA, et al.
Congenital gastrointestinal defects in Down syndrome: a report from the Atlanta and National Down Syndrome Projects. Clin Genet. 2009;75(2):180-4.
137. Lott IT, Dierssen M. Cognitive deficits and associated neurological complications in
individuals with Down's syndrome. Lancet neurol. 2010;9(6):623-33. 138. Costanzo F, Varuzza C, Menghini D, Addona F, Gianesini T, Vicari S. Executive
functions in intellectual disabilities: A comparison between Williams syndrome and Down syndrome. Res Dev Disabil. 2013;34(5):1770-80.
139. Dykens EM. Psychiatric and behavioral disorders in persons with Down syndrome.
Ment Retard Dev Dis Res Rev. 2007;13(3):272-8. 140. Holland AJ, Hon J, Huppert FA, Stevens F, Watson P. Population-based study of the
prevalence and presentation of dementia in adults with Down's syndrome. Br J Psychiatry. 1998;172:493-8.
141. Zigman WB, Lott IT. Alzheimer's disease in Down syndrome: neurobiology and risk.
Ment Retard Dev Disabil Res Rev. 2007;13(3):237-46. 142. Myrelid A, Gustafsson J, Ollars B, Anneren G. Growth charts for Down's syndrome
from birth to 18 years of age. Arch Dis Child. 2002;87(2):97-103.
64
143. Cremers MJ, van der Tweel I, Boersma B, Wit JM, Zonderland M. Growth curves of Dutch children with Down's syndrome. J Intellect Disabil Res. 1996;40(Pt 5):412-20.
144. Melville CA, Cooper SA, McGrother CW, Thorp CF, Collacott R. Obesity in adults
with Down syndrome: a case-control study. J Intellect Disabil Res. 2005;49(Pt 2):125-33.
145. Luke A, Sutton M, Schoeller DA, Roizen NJ. Nutrient intake and obesity in
prepubescent children with Down syndrome. J Am Diet Assoc. 1996;96(12):1262-7. 146. Murray J, Ryan-Krause P. Obesity in children with Down syndrome: background and
recommendations for management. Pediatr Nurs. 2010;36(6):314-9. 147. Roizen NJ, Mets MB, Blondis TA. Ophthalmic Disorders in Children with down-
Syndrome. Dev Med Child Neurol. 1994;36(7):594-600. 148. Park AH, Wilson MA, Stevens PT, Harward R, Hohler N. Identification of hearing
loss in pediatric patients with Down syndrome. Otolaryngol Head Neck Surg. 2012;146(1):135-40.
149. Pellegrini FP, Marinoni M, Frangione V, Tedeschi A, Gandini V, Ciglia F, et al. Down
syndrome, autoimmunity and T regulatory cells. Clin Exp Immunol. 2012;169(3):238-43.
150. Bloemers BL, van Bleek GM, Kimpen JL, Bont L. Distinct abnormalities in the innate
immune system of children with Down syndrome. J Pediatr. 2010;156(5):804-9. 151. Graber E, Chacko E, Regelmann MO, Costin G, Rapaport R. Down syndrome and
thyroid function. Endocrinol Metab Clin North Am. 2012;41(4):735-45. 152. Marild K, Stephansson O, Grahnquist L, Cnattingius S, Soderman G, Ludvigsson JF.
Down Syndrome Is Associated with Elevated Risk of Celiac Disease: A Nationwide Case-Control Study. J Pediatr. 2013;163(1):237-42.
153. Goldacre MJ, Wotton CJ, Seagroatt V, Yeates D. Cancers and immune related
diseases associated with Down's syndrome: a record linkage study. Arch Dis Child. 2004;89(11):1014-7.
154. Stordal K, Bakken IJ, Suren P, Stene LC. Epidemiology of coeliac disease and
comorbidity in Norwegian children. J Pediatr Gastroenterol Nutr. 2013;57(4):467-71.
65
155. Maclachlan RA, Fidler KE, Yeh H, Hodgetts PG, Pharand G, Chau M. Cervical-Spine Abnormalities in Institutionalized Adults with Downs-Syndrome. J Intellect Disabil Res. 1993;37:277-85.
156. El-Khouri M, Mourao MA, Tobo A, Battistella LR, Herrero CF, Riberto M.
Prevalence of atlanto-occipital and atlantoaxial instability in adults with Down syndrome. World Neurosurg. 2014;82(1-2):215-8.
157. Cremers MJ, Bol E, de Roos F, van Gijn J. Risk of sports activities in children with
Down's syndrome and atlantoaxial instability. Lancet. 1993;342(8870):511-4. 158. Rao SJV, Caldwell P. Should children with Down's syndrome who have asymptomatic
atlantoaxial instability avoid horse riding? J Paediatr Child Health. 2010;46(12):774-6. 159. Butler MG. Prader-Willi Syndrome: Obesity due to Genomic Imprinting. Curr
Genomics. 2011;12(3):204-15. 160. Butler MG, Bittel DC, Kibiryeva N, Talebizadeh Z, Thompson T. Behavioral
differences among subjects with Prader-Willi syndrome and type I or type II deletion and maternal disomy. Pediatrics. 2004;113(3 Pt 1):565-73.
161. Dykens EM, Roof E. Behavior in Prader-Willi syndrome: relationship to genetic
subtypes and age. J Child Psychol Psychiatry. 2008;49(9):1001-8. 162. Cassidy SB, Forsythe M, Heeger S, Nicholls RD, Schork N, Benn P, et al. Comparison
of phenotype between patients with Prader-Willi syndrome due to deletion 15q and uniparental disomy 15. Am J Med Genet. 1997;68(4):433-40.
163. Gunay-Aygun M, Schwartz S, Heeger S, O'Riordan MA, Cassidy SB. The changing
purpose of Prader-Willi syndrome clinical diagnostic criteria and proposed revised criteria. Pediatrics. 2001;108(5):E92.
164. Boer H, Holland A, Whittington J, Butler J, Webb T, Clarke D. Psychotic illness in
people with Prader Willi syndrome due to chromosome 15 maternal uniparental disomy. Lancet. 2002;359(9301):135-6.
165. Whittington J, Holland A, Webb T, Butler J, Clarke D, Boer H. Cognitive abilities and
genotype in a population-based sample of people with Prader-Willi syndrome. J Intellect Disabil Res. 2004;48(Pt 2):172-87.
166. Dykens EM, Cassidy SB, King BH. Maladaptive behavior differences in Prader-Willi
syndrome due to paternal deletion versus maternal uniparental disomy. Am J Ment Retard. 1999;104(1):67-77.

66
167. Yang L, Zhan GD, Ding JJ, Wang HJ, Ma D, Huang GY, et al. Psychiatric illness and intellectual disability in the Prader-Willi syndrome with different molecular defects--a meta analysis. PloS one. 2013;8(8):e72640.
168. Buiting K, Gross S, Lich C, Gillessen-Kaesbach G, el-Maarri O, Horsthemke B.
Epimutations in Prader-Willi and Angelman syndromes: a molecular study of 136 patients with an imprinting defect. Am J Hum Genet. 2003;72(3):571-7.
169. Smith A, Egan J, Ridley G, Haan E, Montgomery P, Williams K, et al. Birth
prevalence of Prader-Willi syndrome in Australia. Arch Dis Child. 2003;88(3):263-4. 170. Vogels A, Van Den Ende J, Keymolen K, Mortier G, Devriendt K, Legius E, et al.
Minimum prevalence, birth incidence and cause of death for Prader-Willi syndrome in Flanders. Eur J Hum Genet. 2004;12(3):238-40.
171. Whittington JE, Holland AJ, Webb T, Butler J, Clarke D, Boer H. Population
prevalence and estimated birth incidence and mortality rate for people with Prader-Willi syndrome in one UK Health Region. J Med Genet. 2001;38(11):792-8.
172. Grugni G, Crino A, Bosio L, Corrias A, Cuttini M, De Toni T, et al. The Italian
National Survey for Prader-Willi syndrome: an epidemiologic study. Am J Med Genet. 2008;146(7):861-72.
173. Einfeld SL, Kavanagh SJ, Smith A, Evans EJ, Tonge BJ, Taffe J. Mortality in Prader-
Willi syndrome. Am J Ment Retard. 2006;111(3):193-8. 174. Swaab DF. Prader-Willi syndrome and the hypothalamus. Acta Paediatr Suppl. 1997;423:50-4. 175. Miller JL, Couch JA, Schmalfuss I, He G, Liu Y, Driscoll DJ. Intracranial
abnormalities detected by three-dimensional magnetic resonance imaging in Prader-Willi syndrome. Am J Med Genet. 2007;143A(5):476-83.
176. Holm VA, Cassidy SB, Butler MG, Hanchett JM, Greenswag LR, Whitman BY, et al.
Prader-Willi syndrome: consensus diagnostic criteria. Pediatrics. 1993;91(2):398-402. 177. Tuysuz B, Kartal N, Erener-Ercan T, Guclu-Geyik F, Vural M, Perk Y, et al.
Prevalence of Prader-Willi syndrome among infants with hypotonia. J Pediatr. 2014;164(5):1064-7.
178. Whittington J, Holland A, Webb T, Butler J, Clarke D, Boer H. Relationship between
clinical and genetic diagnosis of Prader-Willi syndrome. J Med Genet. 2002;39(12):926-32.

67
179. Copet P, Jauregi J, Laurier V, Ehlinger V, Arnaud C, Cobo AM, et al. Cognitive profile in a large French cohort of adults with Prader-Willi syndrome: differences between genotypes. J Intellect Disabil Res. 2010;54(3):204-15.
180. Lo ST, Siemensma E, Collin P, Hokken-Koelega A. Impaired theory of mind and
symptoms of Autism Spectrum Disorder in children with Prader-Willi syndrome. Res Dev Disabil. 2013;34(9):2764-73.
181. Dykens EM. Are jigsaw puzzle skills 'spared' in persons with Prader-Willi syndrome?
J Child Psychol Psychiatry. 2002;43(3):343-52. 182. Holland AJ, Whittington JE, Butler J, Webb T, Boer H, Clarke D. Behavioural
phenotypes associated with specific genetic disorders: evidence from a population-based study of people with Prader-Willi syndrome. Psychol Med. 2003;33(1):141-53.
183. Dykens EM, Leckman JF, Cassidy SB. Obsessions and compulsions in Prader-Willi
syndrome. J Child Psychol Psychiatry. 1996;37(8):995-1002. 184. Clarke DJ, Boer H, Whittington J, Holland A, Butler J, Webb T. Prader-Willi
syndrome, compulsive and ritualistic behaviours: the first population-based survey. Br J Psychiatry. 2002;180:358-62.
185. Holland AJ, Treasure J, Coskeran P, Dallow J, Milton N, Hillhouse E. Measurement
of excessive appetite and metabolic changes in Prader-Willi syndrome. Int J Obes Relat Metab Disord. 1993;17(9):527-32.
186. Lindgren AC, Barkeling B, Hagg A, Ritzen EM, Marcus C, Rossner S. Eating
behavior in Prader-Willi syndrome, normal weight, and obese control groups. J Pediatr. 2000;137(1):50-5.
187. Van Mil EA, Westerterp KR, Gerver WJ, Curfs LM, Schrander-Stumpel CT, Kester
AD, et al. Energy expenditure at rest and during sleep in children with Prader-Willi syndrome is explained by body composition. Am J Clin Nutr. 2000;71(3):752-6.
188. Sode-Carlsen R, Farholt S, Rabben KF, Bollerslev J, Schreiner T, Jurik AG, et al.
Body composition, endocrine and metabolic profiles in adults with Prader-Willi syndrome. Growth Horm IGF Res. 2010;20(3):179-84.
189. Goldstone AP, Thomas EL, Brynes AE, Bell JD, Frost G, Saeed N, et al. Visceral
adipose tissue and metabolic complications of obesity are reduced in Prader-Willi syndrome female adults: evidence for novel influences on body fat distribution. J Clin Endocrinol Metab. 2001;86(9):4330-8.

68
190. Miller JL, Lynn CH, Driscoll DC, Goldstone AP, Gold JA, Kimonis V, et al. Nutritional phases in Prader-Willi syndrome. Am J Med Genet. 2011;155A(5):1040-9.
191. Goldstone AP, Holland AJ, Hauffa BP, Hokken-Koelega AC, Tauber M, speakers
contributors at the Second Expert Meeting of the Comprehensive Care of Patients with PWS. Recommendations for the diagnosis and management of Prader-Willi syndrome. J Clin Endocrinol Metab. 2008;93(11):4183-97.
192. Miller JL, Lynn CH, Shuster J, Driscoll DJ. A reduced-energy intake, well-balanced
diet improves weight control in children with Prader-Willi syndrome. J Hum Nutr Diet. 2013;26(1):2-9.
193. Diene G, Mimoun E, Feigerlova E, Caula S, Molinas C, Grandjean H, et al. Endocrine
disorders in children with Prader-Willi syndrome--data from 142 children of the French database. Horm Res Paediatr. 2010;74(2):121-8.
194. Wolfgram PM, Carrel AL, Allen DB. Long-term effects of recombinant human growth
hormone therapy in children with Prader-Willi syndrome. Curr Opin Pediatr. 2013;25(4):509-14.
195. Meinhardt U, Christiansen JS, Farholt S, Lammer C, Ostergaard JR, Schmidt F, et al.
The efficacy and safety of long-term Norditropin(R) treatment in children with Prader-Willi syndrome. Horm Metab Res. 2013;45(7):532-6.
196. Carrel AL, Myers SE, Whitman BY, Allen DB. Benefits of long-term GH therapy in
Prader-Willi syndrome: a 4-year study. J Clin Endocrinol Metab. 2002;87(4):1581-5. 197. Reus L, Pelzer BJ, Otten BJ, Siemensma EP, van Alfen-van der Velden JA, Festen
DA, et al. Growth hormone combined with child-specific motor training improves motor development in infants with Prader-Willi syndrome: a randomized controlled trial. Res Dev Disabil. 2013;34(10):3092-103.
198. Carrel AL, Myers SE, Whitman BY, Eickhoff J, Allen DB. Long-term growth
hormone therapy changes the natural history of body composition and motor function in children with prader-willi syndrome. J Clin Endocrinol Metab. 2010;95(3):1131-6.
199. Siemensma EP, Tummers-de Lind van Wijngaarden RF, Festen DA, Troeman ZC, van
Alfen-van der Velden AA, Otten BJ, et al. Beneficial effects of growth hormone treatment on cognition in children with Prader-Willi syndrome: a randomized controlled trial and longitudinal study. J Clin Endocrinol Metab. 2012;97(7):2307-14.

69
200. Sode-Carlsen R, Farholt S, Rabben KF, Bollerslev J, Schreiner T, Jurik AG, et al. Growth hormone treatment in adults with Prader-Willi syndrome: the Scandinavian study. Endocrine. 2012;41(2):191-9.
201. Van der Klaauw AA, Romijn JA, Biermasz NR, Smit JW, van Doorn J, Dekkers OM,
et al. Sustained effects of recombinant GH replacement after 7 years of treatment in adults with GH deficiency. Eur J Endocrinol. 2006;155(5):701-8.
202. Jorgensen AP, Ueland T, Sode-Carlsen R, Schreiner T, Rabben KF, Farholt S, et al.
Glucose homeostasis in adults with Prader-Willi syndrome during treatment with growth hormone: Results from a 12-month prospective study. Growth Horm IGF Res. 2014;24(1):16-21.
203. De Lind van Wijngaarden RF, Otten BJ, Festen DA, Joosten KF, de Jong FH, Sweep
FC, et al. High prevalence of central adrenal insufficiency in patients with Prader-Willi syndrome. J Clin Endocrinol Metab. 2008;93(5):1649-54.
204. Stevenson DA, Anaya TM, Clayton-Smith J, Hall BD, Van Allen MI, Zori RT, et al.
Unexpected death and critical illness in Prader-Willi syndrome: report of ten individuals. Am J Med Genet. 2004;124A(2):158-64.
205. Williams JC, Barratt-Boyes BG, Lowe JB. Supravalvular aortic stenosis. Circulation.
1961;24:1311-8. 206. Beuren AJ, Apitz J, Harmjanz D. Supravalvular aortic stenosis in association with
mental retardation and a certain facial appearance. Circulation. 1962;26:1235-40. 207. Ewart AK, Morris CA, Atkinson D, Jin W, Sternes K, Spallone P, et al. Hemizygosity
at the elastin locus in a developmental disorder, Williams syndrome. Nat Genet. 1993;5(1):11-6.
208. Ji Y, Eichler EE, Schwartz S, Nicholls RD. Structure of Chromosomal Duplicons and
their Role in Mediating Human Genomic Disorders. Genome Res. 2000;10(5):597-610.
209. Adams GN, Schmaier AH. The Williams-Beuren Syndrome-a window into genetic
variants leading to the development of cardiovascular disease. PLoS genetics. 2012;8(2):e1002479.
210. Scott RW, Olson MF. LIM kinases: function, regulation and association with human
disease. J Mol Med (Berl). 2007;85(6):555-68.
70
211. Stromme P, Bjornstad PG, Ramstad K. Prevalence estimation of Williams syndrome. J Child Neurol. 2002;17(4):269-71.
212. Pober BR, Johnson M, Urban Z. Mechanisms and treatment of cardiovascular disease
in Williams-Beuren syndrome. J Clin Invest. 2008;118(5):1606-15. 213. Wessel A, Gravenhorst V, Buchhorn R, Gosch A, Partsch CJ, Pankau R. Risk of
sudden death in the Williams-Beuren syndrome. Am J Med Genet. 2004;127A(3):234-7.
214. Partsch CJ, Dreyer G, Gosch A, Winter M, Schneppenheim R, Wessel A, et al. Longitudinal evaluation of growth, puberty, and bone maturation in children with Williams syndrome. J Pediatr. 1999;134(1):82-9.
215. Axelsson S, Bjornland T, Kjaer I, Heiberg A, Storhaug K. Dental characteristics in
Williams syndrome: a clinical and radiographic evaluation. Acta Odontol Scand. 2003;61(3):129-36.
216. Martens MA, Wilson SJ, Reutens DC. Research Review: Williams syndrome: a
critical review of the cognitive, behavioral, and neuroanatomical phenotype. J Child Psychol Psychiatry. 2008;49(6):576-608.
217. Mervis CB, Robinson BF, Bertrand J, Morris CA, Klein-Tasman BP, Armstrong SC.
The Williams syndrome cognitive profile. Brain Cogn. 2000;44(3):604-28. 218. Morris CA. The behavioral phenotype of Williams syndrome: A recognizable pattern
of neurodevelopment. Am J Med Genet. 2010;154C(4):427-31. 219. Jarvinen A, Korenberg JR, Bellugi U. The social phenotype of Williams syndrome.
Curr Opin Neurobiol. 2013;23(3):414-22. 220. Leyfer OT, Woodruff-Borden J, Klein-Tasman BP, Fricke JS, Mervis CB. Prevalence
of psychiatric disorders in 4 to 16-year-olds with Williams syndrome. Am J Med Genet. 2006;141B(6):615-22.
221. Dykens EM. Anxiety, fears, and phobias in persons with Williams syndrome. Dev
neuropsychol. 2003;23(1-2):291-316. 222. Del Pasqua A, Rinelli G, Toscano A, Iacobelli R, Digilio C, Marino B, et al. New
findings concerning cardiovascular manifestations emerging from long-term follow-up of 150 patients with the Williams-Beuren-Beuren syndrome. Cardiol Young. 2009;19(6):563-7.

71
223. Gray Iii JC, Krazinski AW, Schoepf UJ, Meinel FG, Pietris NP, Suranyi P, et al. Cardiovascular manifestations of Williams syndrome: Imaging findings. J Cardiovasc Comput Tomogr. 2013;7(6):400-7.
224. Broder K, Reinhardt E, Ahern J, Lifton R, Tamborlane W, Pober B. Elevated
ambulatory blood pressure in 20 subjects with Williams syndrome. Am J Med Genet. 1999;83(5):356-60.
225. Eronen M, Peippo M, Hiippala A, Raatikka M, Arvio M, Johansson R, et al.
Cardiovascular manifestations in 75 patients with Williams syndrome. J Med Genet. 2002;39(8):554-8.
226. Kozel BA, Danback JR, Waxler JL, Knutsen RH, de Las Fuentes L, Reusz GS, et al.
Williams syndrome predisposes to vascular stiffness modified by antihypertensive use and copy number changes in NCF1. Hypertension. 2014;63(1):74-9.
227. Del Campo M, Antonell A, Magano LF, Munoz FJ, Flores R, Bayes M, et al.
Hemizygosity at the NCF1 gene in patients with Williams-Beuren syndrome decreases their risk of hypertension. Am J Hum Genet. 2006;78(4):533-42.
228. Pankau R, Partsch CJ, Winter M, Gosch A, Wessel A. Incidence and spectrum of renal
abnormalities in Williams-Beuren syndrome. Am J Med Genet. 1996;63(1):301-4. 229. Pober BR, Wang E, Caprio S, Petersen KF, Brandt C, Stanley T, et al. High
prevalence of diabetes and pre-diabetes in adults with Williams syndrome. Am J Med Genet. 2010;154C(2):291-8.
230. Garabedian M, Jacqz E, Guillozo H, Grimberg R, Guillot M, Gagnadoux MF, et al.
Elevated plasma 1,25-dihydroxyvitamin D concentrations in infants with hypercalcemia and an elfin facies. N Engl J Med. 1985;312(15):948-52.
231. Letavernier E, Rodenas A, Guerrot D, Haymann JP. Williams-Beuren syndrome
hypercalcemia: is TRPC3 a novel mediator in calcium homeostasis? Pediatrics. 2012;129(6):e1626-30.
232. Cagle AP, Waguespack SG, Buckingham BA, Shankar RR, Dimeglio LA. Severe
infantile hypercalcemia associated with Williams syndrome successfully treated with intravenously administered pamidronate. Pediatrics. 2004;114(4):1091-5.
233. Masserini B, Bedeschi MF, Bianchi V, Scuvera G, Beck-Peccoz P, Lalatta F, et al.
Prevalence of diabetes and pre-diabetes in a cohort of Italian young adults with Williams syndrome. Am J Med Genet. 2013;161(4):817-21.

72
234. Stagi S, Bindi G, Neri AS, Lapi E, Losi S, Jenuso R, et al. Thyroid function and morphology in patients affected by Williams syndrome. Clin Endocrinol (Oxf). 2005;63(4):456-60.
235. Cambiaso P, Orazi C, Digilio MC, Loche S, Capolino R, Tozzi A, et al. Thyroid
morphology and subclinical hypothyroidism in children and adolescents with Williams syndrome. J Pediatr. 2007;150(1):62-5.
236. Martin NDT, Smith WR, Cole TJ, Preece MA. New height, weight and head
circumference charts for British children with Williams syndrome. Arch Dis Child. 2007;92(7):598-601.
237. Stagi S, Lapi E, D'Avanzo MG, Perferi G, Romano S, Giglio S, et al. Coeliac disease
and risk for other autoimmune diseases in patients with Williams-Beuren syndrome. BMC Med Genet. 2014;15:61.
238. Gagliardi C, Martelli S, Burt MD, Borgatti R. Evolution of Neurologic Features in
Williams Syndrome. Pediatr Neurol. 2007;36(5):301-6. 239. Statistics Norway. Population [Serial Online]. 2014. [cited 2014 Dec 22]; Statistics
Norway. Available from: www.ssb.no. 240. Krokstad S, Langhammer A, Hveem K, Holmen TL, Midthjell K, Stene TR, et al.
Cohort Profile: the HUNT Study, Norway. Int J Epidemiol. 2013;42(4):968-77. 241. Hansen BH, Kolle E, Dyrstad SM, Holme I, Anderssen SA. Accelerometer-determined
physical activity in adults and older people. Med Sci Sports Exerc. 2012;44(2):266-72. 242. Elmahgoub SS, Van de Velde A, Peersman W, Cambier D, Calders P. Reproducibility,
validity and predictors of six-minute walk test in overweight and obese adolescents with intellectual disability. Disabil Rehabil. 2012;34(10):846-51.
243. Vis JC, Thoonsen H, Duffels MG, de Bruin-Bon RA, Huisman SA, van Dijk AP, et al.
Six-minute walk test in patients with Down syndrome: validity and reproducibility. Arch Phys Med Rehabil. 2009;90(8):1423-7.
244. Pickering TG, Hall JE, Appel LJ, Falkner BE, Graves J, Hill MN, et al.
Recommendations for blood pressure measurement in humans and experimental animals: Part 1: blood pressure measurement in humans: a statement for professionals from the Subcommittee of Professional and Public Education of the American Heart Association Council on High Blood Pressure Research. Hypertension. 2005;45(1):142-61.
73
245. Bonso E, Dorigatti F, Palatini P. Accuracy of the BP A100 blood pressure measuring device coupled with a single cuff with standard-size bladder over a wide range of arm circumferences. Blood Press Monit. 2009;14(5):216-9.
246. Belghazi J, El Feghali RN, Moussalem T, Rejdych M, Asmar RG. Validation of four
automatic devices for self-measurement of blood pressure according to the International Protocol of the European Society of Hypertension. Vasc Health Manage. 2007;3(4):389-400.
247. James PA, Oparil S, Carter BL, Cushman WC, Dennison-Himmelfarb C, Handler J, et
al. 2014 evidence-based guideline for the management of high blood pressure in adults: report from the panel members appointed to the Eighth Joint National Committee (JNC 8). JAMA. 2014;311(5):507-20.
248. Laake P HA, Thelle DS, Veierød MB. Epidemiologiske og kliniske
forskningsmetoder. Oslo: Gyldendal Norsk Forlag; 2007. 249. Hilgenkamp TI, Reis D, van Wijck R, Evenhuis HM. Physical activity levels in older
adults with intellectual disabilities are extremely low. Res Dev Disabil. 2012;33(2):477-83.
250. Heller T, McCubbin JA, Drum C, Peterson J. Physical activity and nutrition health
promotion interventions: what is working for people with intellectual disabilities? Intellect Dev Disabil. 2011;49(1):26-36.
251. Hansen BH, Holme I, Anderssen SA, Kolle E. Patterns of objectively measured
physical activity in normal weight, overweight, and obese individuals (20-85 years): a cross-sectional study. PloS one. 2013;8(1):e53044.
252. Temple VA. Barriers, enjoyment, and preference for physical activity among adults
with intellectual disability. Int J Rehabil Res. 2007;30(4):281-7. 253. Doody CM, Doody O. Health promotion for people with intellectual disability and
obesity. Br J Nurs. 2012;21(8):460, 2-5. 254. National Norwegian Nutrition Council. Kostråd for å fremme folkehelsen og
forebygge kroniske sykdommer: Metodologi og vitenskapelig kunnskapsgrunnlag. Oslo: The Norwegian Directorate of health; 2011.
255. Myhre JB, Loken EB, Wandel M, Andersen LF. Meal types as sources for intakes of
fruits, vegetables, fish and whole grains among Norwegian adults. Public health nutrition. 2014:1-11.
74
256. Dykens EM. Aging in rare intellectual disability syndromes. Dev Disabil Res Rev. 2013;18(1):75-83.
257. De Lind van Wijngaarden RF, Cianflone K, Gao Y, Leunissen RW, Hokken-Koelega
AC. Cardiovascular and metabolic risk profile and acylation-stimulating protein levels in children with Prader-Willi syndrome and effects of growth hormone treatment. J Clin Endocrinol Metab. 2010;95(4):1758-66.
258. Eckel RH, Jakicic JM, Ard JD, Hubbard VS, de Jesus JM, Lee IM, et al. 2013
AHA/ACC Guideline on Lifestyle Management to Reduce Cardiovascular Risk: A Report of the American College of Cardiology/American Heart Association Task Force on Practice Guidelines. Circulation. 2013.
259. Appel LJ, Moore TJ, Obarzanek E, Vollmer WM, Svetkey LP, Sacks FM, et al. A
clinical trial of the effects of dietary patterns on blood pressure. DASH Collaborative Research Group. N Engl J Med. 1997;336(16):1117-24.
260. Perk J, De Backer G, Gohlke H, Graham I, Reiner Z, Verschuren WM, et al. European
Guidelines on cardiovascular disease prevention in clinical practice (version 2012): The Fifth Joint Task Force of the European Society of Cardiology and Other Societies on Cardiovascular Disease Prevention in Clinical Practice. Atherosclerosis. 2012;223(1):1-68.
261. Zoungas S, Chalmers J, Ninomiya T, Li Q, Cooper ME, Colagiuri S, et al. Association
of HbA1c levels with vascular complications and death in patients with type 2 diabetes: evidence of glycaemic thresholds. Diabetologia. 2012;55(3):636-43.
262. Yau JW, Rogers SL, Kawasaki R, Lamoureux EL, Kowalski JW, Bek T, et al. Global
prevalence and major risk factors of diabetic retinopathy. Diabetes Care. 2012;35(3):556-64.
263. Ang L, Jaiswal M, Martin C, Pop-Busui R. Glucose control and diabetic neuropathy:
lessons from recent large clinical trials. Curr Diabetes Rep. 2014;14(9):528. 264. Harjutsalo V, Groop PH. Epidemiology and risk factors for diabetic kidney disease.
Adv Chronic Kidney Dis. 2014;21(3):260-6. 265. Taggart L, Coates V, Truesdale-Kennedy M. Management and quality indicators of
diabetes mellitus in people with intellectual disabilities. J Intellect Disabil Res. 2013;57(12):1152-63.

75


I


Accelerometer-determined physical activity and walkingcapacity in persons with Down syndrome, Williams syndromeand Prader–Willi syndrome
Marianne Nordstrøm a,e,*, Bjørge Herman Hansen b, Benedicte Paus c,d,Svein Olav Kolset e
a Frambu Resource Centre for Rare Disorders, Sandbakkveien 18, 1404 Siggerud, NorwaybNorwegian School of Sport Sciences, Department of Sports Medicine, Sognsveien 220, 0863 Oslo, NorwaycOslo University Hospital, Department of Medical Genetics, P.O. Box 4950, Nydalen, 0424 Oslo, NorwaydUniversity of Oslo, Institute of Clinical Medicine, Department of Medical Genetics, P.O. Box 1046, Blindern, 0317 Oslo, NorwayeUniversity of Oslo, Institute of Basic Medical Sciences, Department of Nutrition, P.O. Box 1046, Blindern, 0317 Oslo, Norway
Research in Developmental Disabilities 34 (2013) 4395–4403
A R T I C L E I N F O
Article history:
Received 2 August 2013
Accepted 10 September 2013
Available online 18 October 2013
Keywords:
Accelerometer
Physical activity
Six-minute walk test
Down syndrome
Williams syndrome
Prader–Willi syndrome
A B S T R A C T
In this study we describe by use of accelerometers the total physical activity (PA), intensity
pattern and walking capacity in 87 persons age 16–45 years with Down syndrome (DS),
Williams syndrome (WS) and Prader–Willi syndrome (PWS). Participants were recruited
from all over Norway, and lived either with their parents or in community residences with
support.
On average the participants generated 294 counts per minute (cpm) or 6712 steps per
day, with most of the day spent in sedentary activity, 522 min/day, followed by 212 min/
day in light PA, 71 min/day in lifestyle activity and 27 min/day in moderate-to-vigorous
physical activity (MVPA). Inactivity was prevalent, as only 12% meet the current Nordic
recommendations for PA.
When compared, no differences for total physical activity or time in MVPA were
observed between the three groups. However, participant with DS spent a mean of 73 min/
day less and 43 min/day less in sedentary activities compared to participants with PWS
and WS, respectively, (p = 0.011, 95% CI: �10.9; �80.1). In addition the DS-group spent a
mean of 66 min/day more in light PA than the PWS-group and 41 min/day more than the
WS-group, (p < 0.001, 95% CI: 29.3; 79.7). Participants with PWS spent on average 30 min/
day less in lifestyle activities compared to both participants with DS and WS, (p < 0.001,
95% CI: �14.2; �45.4). No association between total PA and BMI were observed. Males
were more active than females across all diagnoses. Males accumulated on average 85
counts per minutes more than females, (p = 0.002, 95% CI: 33.3; 136.7), 2137 more steps
per day, (p = 0.002, 95% CI: 778; 3496). The mean walking capacity during six-minutes was
507 m (SD 112 m) for males and 466 m (SD 88 m) for females. Distance walked during
testing decreased with 33.6 m when comparing normal or underweight participants to
overweight participants, and 78.1 m when comparing overweight to obese participants
(p < 0.001 95% CI: �40.4; �85.8). When adjusted for BMI no differences in walking
capacity between the three genetic conditions were observed.
� 2013 The Authors. Published by Elsevier Ltd.
* Corresponding author. Tel.: +47 64856047; fax: +47 64856099.
E-mail addresses: [email protected], [email protected] (M. Nordstrøm), [email protected] (B.H. Hansen),
[email protected] (B. Paus), [email protected] (S.O. Kolset).
Contents lists available at ScienceDirect
Research in Developmental Disabilities
0891-4222 � 2013 The Authors. Published by Elsevier Ltd.
http://dx.doi.org/10.1016/j.ridd.2013.09.021
Open access under CC BY-NC-SA license.
Open access under CC BY-NC-SA license.

1. Introduction
Regular physical activity (PA) and physical fitness improves functional ability, enhances independence and reduces therisk of non-communicable disorders such as cardiovascular disease, diabetes and several cancers (Nordic Council, 2005;WHO, 2010). The effectiveness of PA in relation to health depends on frequency, duration and intensity of activity, and isinherently difficult to assess due to its complex nature (Westerterp, 2009). Objective assessment of activity using activitymonitors overcome many of the challenges related to self-reported measures of PA, such as social desirability bias and recallbias. Thus, accelerometers provide valid and reliable estimates of the degree, nature, and pattern of physical activity(Westerterp, 2009).
Walking capacity is a measurement for everyday physical capacity and cardiovascular fitness and is related to both levelsof independence (Cowley et al., 2010) and long term health outcomes (Rasekaba, Lee, Naughton, Williams, & Holland, 2009).Walking is the most common form of exercise and PA in groups with intellectual disability (Draheim, Williams, & McCubbin,2002). The six-minute walk test (6MWT) is a feasible and objective submaximal exercise test that assesses the distance aperson can walk in six minutes (ATS Statement, 2002). In a variety of patient groups a distance less than 350 m walked in6MWT is associated with increased mortality (Rasekaba et al., 2009).
Down syndrome (DS), Williams syndrome (WS) and Prader–Willis syndrome (PWS) are genetic conditions associatedwith mild or moderate intellectual disability. DS is caused by the presence of an extra copy or major portion of chromosome21 (Hattori et al., 2000), WS by a deletion of the elastin gene on chromosome 7q11.23 (Morris, 2010) and PWS by the absenceof paternally expressed genes in the 15q11-q13 chromosome region due to deletion, maternal disomy 15 (UPD) or animprinting defect (Cassidy, Schwartz, Miller, & Driscoll, 2012). Even though molecular diagnosis is available today for allthree conditions, diagnosis is in some patients based on clinical manifestations alone, especially in the adult patientpopulation. Clinical manifestations of DS include typical physical, cognitive and behavioral characteristics which in mostcases are easily recognized (Hunter, 2010). WS are recognized by typical facial features, short stature and connective tissueabnormalities in addition to a unique social and cognitive profile (Morris, 2010). Characteristics of PWS includes hypotonia,hypogonadism, a unique behavioral profile and childhood onset of hyperphagia that in absence of energy restriction will leadto obesity (Cassidy et al., 2012). It has previously been reported that individuals with DS and PWS have increased risk ofinactivity and reduced physical capacity (Butler, Theodoro, Bittel, & Donnelly, 2007; Phillips & Holland, 2011; Temple &Stanish, 2009a), whereas specific knowledge on PA and everyday physical capacity in relation to WS is sparse.
In Norway all institutions for persons with intellectual disabilities closed, and individuals are offered supported living incommunity settings when moving from their parental homes (Beadle-Brown, Mansell, & Kozma, 2007). Independent livingof individuals with intellectual disability in community settings has previously been associated with inactivity, low physicalfitness and obesity (Doody & Doody, 2012; Draheim et al., 2002; Emerson, 2005; Hove, 2004; Martinez-Leal et al., 2011;Robertson et al., 2000). However, this knowledge is based on studies from countries with mixed types of living arrangements,where several confounding factors associated with persons living in institutions and persons living independently incommunities, respectively, may occur. The complete deinstitutionalization in Norway opens an unique opportunity forstudies of PA and physical capacity in a setting with increased focus on autonomy for all individuals, and for description ofsimilarities and differences between subgroups associated with intellectual disability.
The aim of this study was (1) to describe levels of accelerometer-determined overall PA and sedentary behavior amongpersons with DS, WS and PWS; and (2) to investigate PA and walking capacity in relation to body mass index (BMI).
2. Methods
2.1. Ethical approval and recruitment procedures
Ethical approval for the study was granted by the Regional Committees for Medical and Health Research Ethics, South-East region.
Participants were recruited through existing information channels in relevant national-wide patient organizations, suchas websites, membership bulletins etc. In addition a study-specific website was developed where general information,formal letter-to-participate and consent to participate-scheme was posted and available to download. In order to be eligiblefor inclusion, the individuals had to be between 16 and 45 years of age, and diagnosed with either DS, WS or PWS verified bystandardized clinical methods (Holm et al., 1993; Preus, 1984) or by laboratory genetic testing. We used a convenientsampling frame. All participants who returned written informed consent to participate-scheme, signed by both theparticipant and legal guardian/parent were invited to participate.
2.2. Participants
A total of 96 participants, 40 with DS, 28 with WS and 28 with PWS from all over Norway participated in the study. Allparticipants with clinical diagnosis were offered voluntary genetic testing for verification of their condition. Nineparticipants were eliminated from final analysis due to negative result from laboratory genetic testing and not for fillingclinical criteria. In total 27 participants with DS have genetically verified trisomy 21 and 13 have clinically diagnosis. OfParticipants with WS 18 have a genetically verified diagnosis whereas 7 have a clinically diagnosis (Preus, 1984). In the
M. Nordstrøm et al. / Research in Developmental Disabilities 34 (2013) 4395–44034396

PWS-group 21 have a genetically verified diagnosis (15 with deletion, 5 with UPD and 1 with unknown subtype) and onehave clinically verified diagnosis (Holm et al., 1993). A total of 83 participants were included in PA assessment analysis and87 in analysis of walking capacity.
2.3. Anthropometrics
The participant’s weight, only wearing underwear, was measured twice on an impedance scale (Tanita BC-418MA,Arligton Heights, IL, USA) and recorded to the nearest 0.1 kg. Height was measured twice in upright position with heelsplaced into the wall and with head fixed in Frankfurt plane by use of a wall mounted standiometer (Seca 222, Birmingham,UK) and recorded to the nearest 0.1 cm. BMI was categorized by use of standard definitions of underweight, normal weight,overweight and obese. IsoBMI was used to define cut-offs for participants from 16 to 18 years of age. Due to small samplesize, underweight participants (n = 3) were combined with normal weight in to a common normal or underweight category.
2.4. PA assessment
PA was assessed using the ActiGraph GT3X+ activity monitor (ActiGraph, Pensacola, FL, USA). The GTX3+ is lightweightand small and contains a micro-electro-mechanical system accelerometer (MEMS) that sampled the acceleration in threeplanes, by a 12-bit analog to digital converter, at 30 Hertz (user determined). The participants were instructed to wear thedevice in an elastic belt secured to the right hip in their home environment during all waking hours, except during swimmingor bathing, for seven consecutive days. All participants were given two reminder-posters and encouraged to hang them up invisible places in their own homes. The accelerometers were returned by mail together with a registration of activities duringthe data collection period involving swimming, bicycling, resistance training or skiing activities. A total of 83 participantsprovided valid accelerometer recordings and were included in analysis. Drop-out was due to refusal to participate by twoparticipants, medical safety concerns for one participant and lack of valid registration of activity in one of the returnedaccelerometers.
The acceleration data were stored in a raw and unfiltered format in units of gravity (Gs). Post-processing of the dataincluded extraction of vertical axis data in 60-s epochs and derivation of the following variables: counts per minutes (cpm),steps taken per day, and minutes of intensity specific PA (sedentary behavior, light PA, and moderate-to-vigorous PA). Thecut-points for intensity-specific PA have previously been used in large population studies on adults and older people(Hagstromer, Troiano, Sjostrom, & Berrigan, 2010; Hansen, Kolle, Dyrstad, Holme, & Anderssen, 2012). In order for aparticipant to be included in the analysis, a minimum of 4 days of at least 10 h per day of valid accelerometer recordings hadto be achieved. Accelerometer non-wear time, defined as any consecutive strings of minutes with zero counts of at least60 min with allowance for one interruption, was excluded from the analysis.
2.5. Assessment of walking capacity
Prior to the six-minute walk test (6MWT) all participants were familiarized with the test situation in two steps. First, thetest was explained in general by use of pictures by researcher and participants were instructed to wear appropriate clothingand shoes. Second, a test technician demonstrated how to perform the 6MWT prior to actual testing. The participantsperformed two 6MWTs during the same day with a break in-between. All 6MWTs were conducted in a hallway using 30 m(m) laps. The rounding points of the lap were marked with cones and in addition each 3 m of the lap was marked on the floor.Testing was performed in accordance with standardized guidelines (ATS Statement, 2002) with exception of more frequentuse of the encouragement component. Pulse oximetry (Creative Medical PC-60, Shenzhen, China) was used prior and rightafter testing. Two participants only completed one of the two tests; one due to medical safety concerns and the other due tolack of motivation for a second test.
2.6. Electronic questionnaire
Demographic data, information on place and type of residence and level of support were self-reported by use of anelectronic feedback management tool (QuestBack, Oslo, Norway). The questionnaire was completed by the participantstogether with a parent or assistant. Level of support was categorized into four categories; 0–30 h of support per week, 31–60 h of support per week, more than 60 h of support per week and level of support unknown.
2.7. Statistical analysis
Descriptive statistics were calculated for all variables and assessed for normality and homogeneity of variance, andpresented as mean with standard deviation (SD) or percent of population (%). To identify potential confounders that couldinterfere in the comparison between groups, initial analyses were performed by use of independent t-tests and analysis ofvariance (ANOVA) with use of turkey post hoc test where appropriate. Linear regressions adjusted for age and BMI whereappropriate, were used to evaluate the PA and results of 6MWT in the different groups. In all analysis comparing the differentgenetic conditions PWS were used as reference group, with exception of analysis of sedentary PA and Light PA where DS were
M. Nordstrøm et al. / Research in Developmental Disabilities 34 (2013) 4395–4403 4397

used as reference group. Standard residuals and multicollinearity were investigated in the regression models. In the analysisincluding 6MWT only the results of the second walk test were used. For participants with only one completed walk-test, theresults of this test were included. A p-value of less than 0.05 was regarded as statistical significant. All statistical analyseswere performed using SPSS 19 (SPSS Inc., Chicago, IL, USA).
3. Results
3.1. Sample characteristics
Characteristics of the study population are presented in Table 1. More females (n = 54) than males (n = 33) participated;however we found no significant differences in age, BMI or type of residence between the genders. Participants living withparents were overall 10.2 years younger than the participants living in supported community settings, (p < 0.001, 95% CI�7.2; �13.2). Of the participants living in supported community residences; 67% lived in group-homes, 20% in their ownapartments geographically close to other similar apartments, and 12% in independent housing facilities. In addition, 48%received 0–30 h per week of support, 18% from 31 to 60 h per week of support, 18% more than 60 h support per week,whereas the level of support were unknown in 15% of the participants. We found no differences in level of received supportbased on type of community residence. However, persons with PWS received more support than both DS (p = 0.023) and WS(p = 0.01).
A total of 78% of the study population was either overweight or obese. The DS-group had the highest average BMI followedby the PWS-group and WS-group. The difference in BMI by diagnosis adjusted for age was found to be 2.85 (p = 0.004, 95% CI1.19; 4.51).
3.2. Total PA and time spent in different PA intensities
Participants achieved a mean 6.2 days of valid activity recordings and a mean daily accelerometer wear time of13.9 h � 1.4 h. PA by diagnosis and gender is presented in Table 2. Regardless of diagnosis most of the day was spent in sedentaryactivity 522 min/day (63%), followed by 212 min/day of light activity (25%), 71 min/day in lifestyle activity (9%) and 27 min/day ofMVPA (3%). The total PA measured by cpm or steps per day did not differ significantly between the three groups. However atendency that participants with PWS were less active than DS and WS was detected. For overall activity the PWS-groupaccumulated in mean 57 and 65 cpm less compared to participants with DS and WS, respectively, (p = 0.055, 95% CI: �119.2; 1.4).A large variation in PA was observed, especially in the WS-group and PWS-group, with an activity range of 103–788 cpm in theWS-group and range of 55–515 cpm in the PWS-group. In the DS-group the range was found to be 178–546 cpm. Time in differentPA intensities is also presented in Table 2. Participant with DS spent a mean of 73 min/day less and 43 min/day less in sedentaryactivities compared to participants with PWS and WS, respectively, (p = 0.011, 95% CI: �10.9; �80.1). In addition the DS-groupspent a mean of 66 min/day more than the PWS-group and 41 min/day more than the WS-group in light activities (p < 0.001, 95%CI: 29.3; 79.7). For lifestyle activities the PWS-group spent a mean of 30 min/day less compared to both DS and WS, (p < 0.001,95% CI: �14.2; �45.4). No differences were found for time spent in MVPA. In all groups less than half of the time in MVPA wasspent in bouts of 10 min or more.
Males were more active than females across all diagnoses. Males accumulated on average 85 cpm more than females(p = 0.002, 95% CI: 33.3; 136.7), 2137 more steps per day (p = 0.002, 95% CI: 778; 3496). Males also spent 23.6 more minutes aday in lifestyle activities (p = 0.001, 95% CI: 9.4; 37.9) and 13.8 more minutes a day in MVPA (p = 0.003, 95% CI: 4.7; 22.9). Thelargest gender difference was found among participants with WS with a mean of 147 cpm higher for males, whereas themean gender differences were 63 cpm in DS-group and 56 cpm in PWS-group. No association with BMI-categories and totalPA were observed. However some differences in time accumulated in sedentary activities and bouts of MVPA were found.Results for the BMI-categories are presented in Table 3. Under or normal weight participants spent a mean of 75 min/day and62 min/day more in sedentary activities compared to overweight and obese, respectively (p = 0.003, 95% CI: 23.1; 105.2). Onaverage obese subjects spent about 5 min/day less in both MVPA and bouts of MVPA compared to both normal weight andoverweight subjects.
When participants living in supported community settings were compared to participants living with parents, nodifference in overall PA or activity intensities was detected. Level of received support was not associated with theparticipants PA.
Table 1
Characteristics of study population by diagnosis.
All (n = 87) Down Syndrome (n = 40) Williams syndrome (n = 25) Prader–Willi syndrome (n = 22)
Females (%) 62.1 62.5 64.0 59.1
Community residence (%) 74.7* 60.0 84.0 90.9
Age (years) 28.5 (7.5)* 26.8 (7.5) 31.5 (6.2) 28.1 (7.5)
BMI (kg/m2) 30.0 (6.7)* 31.8 (6.5) 26.6 (6.5) 30.7 (6.2)
Data presented as present of population or mean with (standard deviation).
* p < 0.05, when diagnosis were compared.
M. Nordstrøm et al. / Research in Developmental Disabilities 34 (2013) 4395–44034398

3.3. Adherence to physical activity recommendations
In the study population 12% meet the Nordic recommendations of physical activity (Nordic Council, 2005). More malesthan females met the recommendations, 14% and 10%, respectively. Diagnosis and gender specific prevalence are listed inTable 4. The highest proportions of participants meeting the PA recommendation were among participants with PWS (19%)followed by the participants with WS (13%) and participants with DS (8%).
Table 2
Physical activity (PA) by diagnosis and gender.
All (n = 83) Downs syndrome (n = 38) Williams syndrome (n = 24) Prader–Willi syndrome (n = 21)
Total PA (counts/min)
Male 347 (147.7)* 345 (93.4) 406 (204.7) 284 (142.7)
Female 262 (89.5) 282 (83.5) 259 (92.7) 228 (92.6)
All 294 (121.1) 306 (91.4) 314 (158.4) 249 (114.1)
Steps (steps/day)
Male 8051 (3808)* 7584 (2440) 9954 (4985) 6725 (3948)
Female 5914 (2421) 6578 (2783) 5469 (1577) 5199 (2341)
All 6712 (3167) 6949 (2673) 7151 (3883) 5781 (3053)
Sedentary (min/day)
Male 511 (86.9) 474 (91.0)y 524 (70.5) 559 (75.6)
Female 528 (76.3) 500 (63.0) 566 (91.2) 540 (63.9)
All 522 (80.3) 491 (74.4)y 534 (60.3) 564 (66.9)
Light PA (min/day)
Male 227 (66.8) 255 (71.5)y 228 (50.4) 177 (48.0)
Female 203 (56.5) 232 (52.6)y 182 (48.5) 173 (49.2)
All 212 (61.4) 240 (60.3)y 199 (53.4) 174 (47.5)
Lifestyle PA (min/day)
Male 86.0 (39.6)* 92.4 (29.6) 100.4 (53.5) 58.5 (24.6)yy
Female 62.3 (25.6) 70.4 (14.8) 66.3 (35.5) 43.0 (18.2)yy
All 71.2 (33.4) 78.5 (23.7) 79.1 (45.2) 48.9 (21.7)yy
MVPA (min/day)a
Male 35.8 (26.2)* 30.7 (17.7) 47.2 (34.4) 31.8 (27.7)
Female 22.0 (15.5) 22.5 (17.3) 20.5 (13.1) 22.7 (15.5)
All 27.1 (21.1) 25.5 (17.7) 30.5 (26.3) 26.2 (20.8)
Bouts MVPA (min/day)b
Male 13.8 (15.8) 8.9 (10.5) 18.1 (17.3) 17.7 (20.9)
Female 9.5 (12.2) 9.6 (12.4) 6.9 (11.7) 12.1 (12.4)
All 11.1 (13.7) 9.4 (11.6) 11.1 (15.1) 14.2 (15.1)
All data are presented as mean with (standard deviation).a Moderate-to-vigorous physical activity.b All MVPA that occurred in bouts of 10 min or more with allowance for interruptions of 1–2 min.
* p < 0.05, when all males were compared to all females.y p < 0.05, when diagnosis were compared by use of DS as reference group, adjusted for age and BMI.yy p < 0.05, when diagnosis were compared by use of PWS as reference group, adjusted for age and BMI.
Table 3
Physical activity (PA) by BMI category.
Normal or underweight (n = 18) Overweight (n = 25) Obesity (n = 38)
Total PA (counts/min) 269.5 (111.9) 334 (136.4) 278 (110.3)
Steps (steps/day) 6907 (3104) 7629 (3683) 6010 (2704)
Sedentary (min/day) 575 (54.3)* 500 (83.2) 512 (79.3)
Light PA (min/day) 182 (36.9) 228 (67.9) 215 (62.3)
Lifestyle PA (min/day) 55.8 (22.2) 80.8 (40.3) 71.8 (30.6)
MVPA (min/day)a 29.2 (19.6) 33.2 (24.6) 22.1 (18.4)*
Bouts MVPA (min/day)b 13.4 (14.1) 13.7 (14.9) 8.3 (12.5)*
All data are presented as mean with (standard deviation).
* p < 0.05, when BMI categories were compared.a Moderate-to-vigorous physical activity.b All MVPA that occurred in bouts of 10 min or more with allowance for interruptions of 1–2 min.
M. Nordstrøm et al. / Research in Developmental Disabilities 34 (2013) 4395–4403 4399

3.4. Walking capacity
We found no significant difference in walking capacity between participants living with parents compared to participantsliving in supported community residence. However, as shown in Table 5, we found an association in walking capacity withgender and BMI. Males walked on average 41.0 m longer (p = 0.014, 95% CI: 9.9; 86.3) compared with females. The meandistance walked during testing decreased with 33.6 m when comparing under or normal weight to overweight, and 78.1 mwhen comparing overweight to obese, (p < 0.001 95% CI: �40.4; �85.8). Participants with DS walked a mean of 54.7 mshorter than participants with WS and a mean of 49.6 m shorter than participants with PWS. However when this wasadjusted for differences in BMI, this association was no longer significant.
4. Discussion
This study provides objectively measured PA and walking capacity measures in three genetic conditions associated withintellectual disability recruited from all over Norway. The use of objective methods and standard protocols facilitate theopportunity for comparison with previous research in the general adult population in Norway. This study is to the best of ourknowledge, the first to report on PA and physical capacity for persons with WS.
Total PA and time in different PA intensities was in general for males in our study population in accordance to findingsfrom the general Norwegian adult population 20–64 years of age (Hansen et al., 2012). However, male participants with DSused less time in sedentary PA and more time in lifestyle activities compared to both other groups in our study and the adultNorwegian population. In addition we observed a tendency of male participants with WS to be more active and males with
Table 4
Prevalence of the population meeting current Nordic physical activity recommendationa.
�30 min of daily MVPAa
All (%) 12.0
Down syndrome
Male (%) 7.1
Female (%) 8.3
Williams syndrome
Male (%) 22.2
Female (%) 6.7
Prader–Willi syndrome
Male (%) 25.0
Female (%) 15.4
a Thirty minutes or more of daily moderate-to-vigorous physical activity in bouts of 8–10 min.
Table 5
Results of six-minute walk test by gender, diagnosis, place of residence and body mass index category.
6-Minute walk test
M (SD)
All (n = 87) 481.1 (99.1)
Male (n = 33) 506.6 (112.3)
Female (n = 54) 465.6 (87.5)
Diagnosis
Down syndrome (n = 40) 452.9 (91.6)
Williams syndrome (n = 25) 507.6 (81.9)
Prader–Willi syndrome (n = 22) 502.5 (118.9)
Place of residence
With parents (n = 22) 498.9 (107.1)
Supported living in communities (n = 65) 475.1 (96.3)
Body mass index category
Under or normal weight (n = 19) 545.0 (89.1)*
Overweight (n = 26) 511.4 (107.6)
Obesity (n = 40) 433.5 (72.5)
All data are presented as mean meter walked during test with (standard deviation).
* p < 0.05, when BMI categories were compared.
M. Nordstrøm et al. / Research in Developmental Disabilities 34 (2013) 4395–44034400
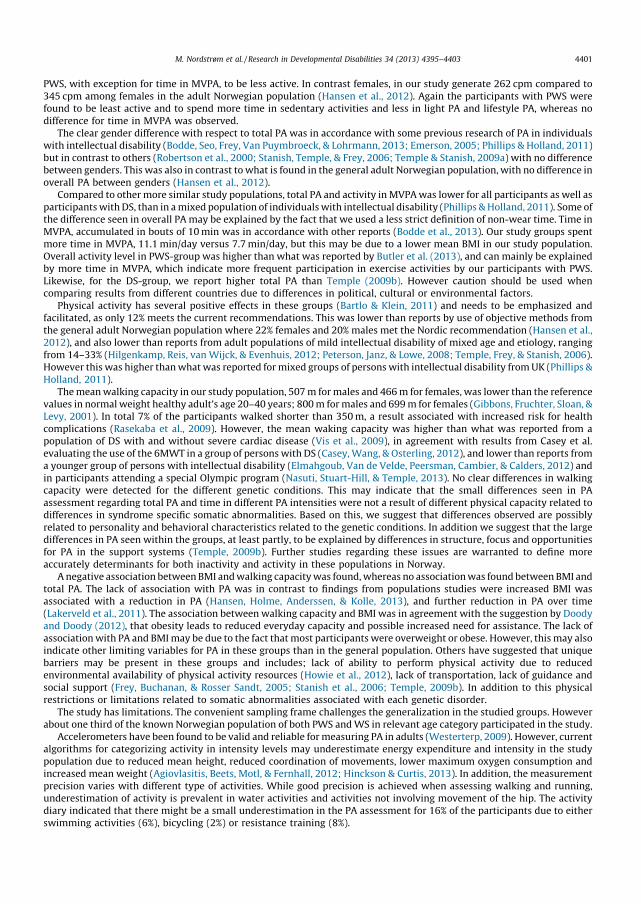
PWS, with exception for time in MVPA, to be less active. In contrast females, in our study generate 262 cpm compared to345 cpm among females in the adult Norwegian population (Hansen et al., 2012). Again the participants with PWS werefound to be least active and to spend more time in sedentary activities and less in light PA and lifestyle PA, whereas nodifference for time in MVPA was observed.
The clear gender difference with respect to total PA was in accordance with some previous research of PA in individualswith intellectual disability (Bodde, Seo, Frey, Van Puymbroeck, & Lohrmann, 2013; Emerson, 2005; Phillips & Holland, 2011)but in contrast to others (Robertson et al., 2000; Stanish, Temple, & Frey, 2006; Temple & Stanish, 2009a) with no differencebetween genders. This was also in contrast to what is found in the general adult Norwegian population, with no difference inoverall PA between genders (Hansen et al., 2012).
Compared to other more similar study populations, total PA and activity in MVPA was lower for all participants as well asparticipants with DS, than in a mixed population of individuals with intellectual disability (Phillips & Holland, 2011). Some ofthe difference seen in overall PA may be explained by the fact that we used a less strict definition of non-wear time. Time inMVPA, accumulated in bouts of 10 min was in accordance with other reports (Bodde et al., 2013). Our study groups spentmore time in MVPA, 11.1 min/day versus 7.7 min/day, but this may be due to a lower mean BMI in our study population.Overall activity level in PWS-group was higher than what was reported by Butler et al. (2013), and can mainly be explainedby more time in MVPA, which indicate more frequent participation in exercise activities by our participants with PWS.Likewise, for the DS-group, we report higher total PA than Temple (2009b). However caution should be used whencomparing results from different countries due to differences in political, cultural or environmental factors.
Physical activity has several positive effects in these groups (Bartlo & Klein, 2011) and needs to be emphasized andfacilitated, as only 12% meets the current recommendations. This was lower than reports by use of objective methods fromthe general adult Norwegian population where 22% females and 20% males met the Nordic recommendation (Hansen et al.,2012), and also lower than reports from adult populations of mild intellectual disability of mixed age and etiology, rangingfrom 14–33% (Hilgenkamp, Reis, van Wijck, & Evenhuis, 2012; Peterson, Janz, & Lowe, 2008; Temple, Frey, & Stanish, 2006).However this was higher than what was reported for mixed groups of persons with intellectual disability from UK (Phillips &Holland, 2011).
The mean walking capacity in our study population, 507 m for males and 466 m for females, was lower than the referencevalues in normal weight healthy adult’s age 20–40 years; 800 m for males and 699 m for females (Gibbons, Fruchter, Sloan, &Levy, 2001). In total 7% of the participants walked shorter than 350 m, a result associated with increased risk for healthcomplications (Rasekaba et al., 2009). However, the mean waking capacity was higher than what was reported from apopulation of DS with and without severe cardiac disease (Vis et al., 2009), in agreement with results from Casey et al.evaluating the use of the 6MWT in a group of persons with DS (Casey, Wang, & Osterling, 2012), and lower than reports froma younger group of persons with intellectual disability (Elmahgoub, Van de Velde, Peersman, Cambier, & Calders, 2012) andin participants attending a special Olympic program (Nasuti, Stuart-Hill, & Temple, 2013). No clear differences in walkingcapacity were detected for the different genetic conditions. This may indicate that the small differences seen in PAassessment regarding total PA and time in different PA intensities were not a result of different physical capacity related todifferences in syndrome specific somatic abnormalities. Based on this, we suggest that differences observed are possiblyrelated to personality and behavioral characteristics related to the genetic conditions. In addition we suggest that the largedifferences in PA seen within the groups, at least partly, to be explained by differences in structure, focus and opportunitiesfor PA in the support systems (Temple, 2009b). Further studies regarding these issues are warranted to define moreaccurately determinants for both inactivity and activity in these populations in Norway.
A negative association between BMI and walking capacity was found, whereas no association was found between BMI andtotal PA. The lack of association with PA was in contrast to findings from populations studies were increased BMI wasassociated with a reduction in PA (Hansen, Holme, Anderssen, & Kolle, 2013), and further reduction in PA over time(Lakerveld et al., 2011). The association between walking capacity and BMI was in agreement with the suggestion by Doodyand Doody (2012), that obesity leads to reduced everyday capacity and possible increased need for assistance. The lack ofassociation with PA and BMI may be due to the fact that most participants were overweight or obese. However, this may alsoindicate other limiting variables for PA in these groups than in the general population. Others have suggested that uniquebarriers may be present in these groups and includes; lack of ability to perform physical activity due to reducedenvironmental availability of physical activity resources (Howie et al., 2012), lack of transportation, lack of guidance andsocial support (Frey, Buchanan, & Rosser Sandt, 2005; Stanish et al., 2006; Temple, 2009b). In addition to this physicalrestrictions or limitations related to somatic abnormalities associated with each genetic disorder.
The study has limitations. The convenient sampling frame challenges the generalization in the studied groups. Howeverabout one third of the known Norwegian population of both PWS and WS in relevant age category participated in the study.
Accelerometers have been found to be valid and reliable for measuring PA in adults (Westerterp, 2009). However, currentalgorithms for categorizing activity in intensity levels may underestimate energy expenditure and intensity in the studypopulation due to reduced mean height, reduced coordination of movements, lower maximum oxygen consumption andincreased mean weight (Agiovlasitis, Beets, Motl, & Fernhall, 2012; Hinckson & Curtis, 2013). In addition, the measurementprecision varies with different type of activities. While good precision is achieved when assessing walking and running,underestimation of activity is prevalent in water activities and activities not involving movement of the hip. The activitydiary indicated that there might be a small underestimation in the PA assessment for 16% of the participants due to eitherswimming activities (6%), bicycling (2%) or resistance training (8%).
M. Nordstrøm et al. / Research in Developmental Disabilities 34 (2013) 4395–4403 4401

The standard reference method to measure cardiovascular fitness is the maximal oxygen consumption test (VO2 max).However, 6MWT provides a global assessment of exercise capacity and may better reflect everyday activity capacity thanlaboratory tests (ATS Statement, 2002). It is both feasible and reliable for individuals with an intellectual disability(Elmahgoub et al., 2012; Vis et al., 2009) but level of intellectual disability have effects on distance walked (Casey et al., 2012;Vis et al., 2009). In our groups the use of the results as an exact estimate of walking capacity may possibly also be affected bydiagnosis related to restrictions such as mental rigidity and fluctuations in motivation.
5. Conclusions
Inactivity was prevalent among individuals in all diagnosis and females were more inactive than males. When diagnoseswere compared similar results were obtained for total PA and time in MVPA. However, the participants with DS were foundto spend less time in sedentary activities and to spend more time in light PA, whereas participants with PWS spent less timein lifestyle PA. Walking capacity was lower in all groups tested compared to normal population but overall in accordancewith investigations in similar groups. A negative association between BMI and physical capacity was detected, whereas noassociation between BMI and total PA was observed.
An increased focus on promoting PA, especially MVPA and lifestyle PA in these groups is warranted, also in Norway. Inaddition, Norway is a country with emphasis on autonomy for adults with intellectual disability, and more researchinvestigating how best to facilitate and motivate for PA in individuals with intellectual disabilities are needed.
Acknowledgments
The study was funded by Extra Stiftelsen and Frambu Resource Center for Rare disorders. The authors thank allparticipants, their caretakers and the organizations; The Norwegian Association for persons with Developmental Disabilities,The National Association for Prader–Willi syndrome, The Norwegian Association for Williams syndrome and The NorwegianNetwork for Down syndrome for their collaboration and support. In addition we thank personnel at Frambu for taking part inthe data collection, especially Kaja Giltvedt, Sissel Widerøe Bredesen, Eva Elisabeth Næss and Kari Hagen.
References
Agiovlasitis, S., Beets, M. W., Motl, R. W., & Fernhall, B. (2012). Step-rate thresholds for moderate and vigorous-intensity activity in persons with Down syndrome.Journal of Science and Medicine in Sport, 15(5), 425–430.
ATS Statement. (2002). ATS statement: Guidelines for the six-minute walk test. American Journal of Respiratory and Critical Care Medicine, 166, 111–117.Bartlo, P., & Klein, P. J. (2011). Physical activity benefits and needs in adults with intellectual disabilities: Systematic review of the literature. American Journal on
Intellectual and Developmental Disabilities, 116, 220–232.Beadle-Brown, J., Mansell, J., & Kozma, A. (2007). Deinstitutionalization in intellectual disabilities. Current Opinion in Psychiatry, 20, 437–442.Bodde, A. E., Seo, D. C., Frey, G. C., Van Puymbroeck, M., & Lohrmann, D. K. (2013). Correlates of moderate-to-vigorous physical activity participation in adults with
intellectual disabilities. Health Promotion Practice, 14(5), 663–670.Butler, M. G., Smith, B. K., Lee, J., Gibson, C., Schmoll, C., Moore, W. V., et al. (2013). Effects of growth hormone treatment in adults with Prader–Willi syndrome.
Growth Hormone and IGF Research, 23(3), 81–87.Butler, M. G., Theodoro, M. F., Bittel, D. C., & Donnelly, J. E. (2007). Energy expenditure and physical activity in Prader–Willi syndrome: Comparison with obese
subjects. American Journal of Medical Genetics Part A, 143, 449–459.Casey, A. F., Wang, X., & Osterling, K. (2012). Test–retest reliability of the 6-minute walk test in individuals with Down Syndrome. Archives of Physical Medicine and
Rehabilitation, 93(11), 2068–2074.Cassidy, S. B., Schwartz, S., Miller, J. L., & Driscoll, D. J. (2012). Prader–Willi syndrome. Genetics in Medicine, 14, 10–26.Cowley, P. M., Ploutz-Snyder, L. L., Baynard, T., Heffernan, K., Jae, S. Y., Hsu, S., et al. (2010). Physical fitness predicts functional tasks in individuals with Down
syndrome. Medicine and Science in Sports and Exercise, 42, 388–393.Doody, C. M., & Doody, O. (2012). Health promotion for people with intellectual disability and obesity. British Journal of Nursing, 21(460), 462–465.Draheim, C. C., Williams, D. P., & McCubbin, J. A. (2002). Prevalence of physical inactivity and recommended physical activity in community-based adults with
mental retardation. Mental Retardation, 40, 436–444.Elmahgoub, S. S., Van de Velde, A., Peersman, W., Cambier, D., & Calders, P. (2012). Reproducibility, validity and predictors of six-minute walk test in overweight
and obese adolescents with intellectual disability. Disability and Rehabilitation, 34, 846–851.Emerson, E. (2005). Underweight, obesity and exercise among adults with intellectual disabilities in supported accommodation in Northern England. Journal of
Intellectual Disability Research, 49, 134–143.Frey, G. C., Buchanan, A. M., & Rosser Sandt, D. D. (2005). I’d rather watch TV: An examination of physical activity in adults with mental retardation. Mental
Retardation, 43, 241–254.Gibbons, W. J., Fruchter, N., Sloan, S., & Levy, R. D. (2001). Reference values for a multiple repetition 6-minute walk test in healthy adults older than 20 years.
Journal of Cardiopulmonary Rehabilitation and Prevention, 21, 87–93.Hagstromer, M., Troiano, R. P., Sjostrom, M., & Berrigan, D. (2010). Levels and patterns of objectively assessed physical activity – a comparison between Sweden
and the United States. American Journal of Epidemiology, 171, 1055–1064.Hansen, B. H., Holme, I., Anderssen, S. A., & Kolle, E. (2013). Patterns of objectively measured physical activity in normal weight, overweight, and obese individuals
(20–85 years): A cross-sectional study. PLoS ONE, 8, e53044.Hansen, B. H., Kolle, E., Dyrstad, S. M., Holme, I., & Anderssen, S. A. (2012). Accelerometer-determined physical activity in adults and older people. Medicine and
Science in Sports and Exercise, 44, 266–272.Hattori, M., Fujiyama, A., Taylor, T. D., Watanabe, H., Yada, T., Park, H. S., et al. (2000). The DNA sequence of human chromosome 21. Nature, 405, 311–319.Hilgenkamp, T. I., Reis, D., van Wijck, R., & Evenhuis, H. M. (2012). Physical activity levels in older adults with intellectual disabilities are extremely low. Research in
Developmental Disabilities, 33, 477–483.Hinckson, E. A., & Curtis, A. (2013). Measuring physical activity in children and youth living with intellectual disabilities: A systematic review. Research in
Developmental Disabilities, 34, 72–86.Holm, V. A., Cassidy, S. B., Butler, M. G., Hanchett, J. M., Greenswag, L. R., Whitman, B. Y., et al. (1993). Prader–Willi syndrome: Consensus diagnostic criteria.
Pediatrics, 91, 398–402.
M. Nordstrøm et al. / Research in Developmental Disabilities 34 (2013) 4395–44034402

Hove, O. (2004). Weight survey on adult persons with mental retardation living in the community. Research in Developmental Disabilities, 25, 9–17.Howie, E. K., Barnes, T. L., McDermott, S., Mann, J. R., Clarkson, J., & Meriwether, R. A. (2012). Availability of physical activity resources in the environment for adults
with intellectual disabilities. Disability and Health Journal, 5, 41–48.Hunter, A. G. W. (2010). Down syndrome. In J. E. A. Suzanne & B. Cassidy (Eds.), Management of genetic syndromes (3rd ed., pp. 309–335). Hoboken, New Jersey:
John Wiley & Sons.Lakerveld, J., Dunstan, D., Bot, S., Salmon, J., Dekker, J., Nijpels, G., et al. (2011). Abdominal obesity TV-viewing time and prospective declines in physical activity.
Preventive Medicine, 53, 299–302.Martinez-Leal, R., Salvador-Carulla, L., Linehan, C., Walsh, P., Weber, G., Van Hove, G., et al. (2011). The impact of living arrangements and deinstitutionalisation in
the health status of persons with intellectual disability in Europe. Journal of Intellectual Disability Research, 55, 858–872.Morris, C. A. (2010). Introduction: Williams syndrome. American Journal of Medical Genetics Part C: Seminars in Medical Genetics, 154C, 203–208.Nasuti, G., Stuart-Hill, L., & Temple, V. A. (2013). The six-minute walk test for adults with intellectual disability: A study of validity and reliability. Journal of
Intellectual and Developmental Disability, 38, 31–38.Nordic Council. (2005). Nordic nutrition recommendations 2004: Integrating nutrition and physical activity. Nordic Council of Ministers.Peterson, J. J., Janz, K. F., & Lowe, J. B. (2008). Physical activity among adults with intellectual disabilities living in community settings. Preventive Medicine, 47,
101–106.Phillips, A. C., & Holland, A. J. (2011). Assessment of objectively measured physical activity levels in individuals with intellectual disabilities with and without
Down’s syndrome. PLoS ONE, 6, e28618.Preus, M. (1984). The Williams syndrome: Objective definition and diagnosis. Clinical Genetics, 25, 422–428.Rasekaba, T., Lee, A. L., Naughton, M. T., Williams, T. J., & Holland, A. E. (2009). The six-minute walk test: A useful metric for the cardiopulmonary patient. Internal
Medicine Journal, 39, 495–501.Robertson, J., Emerson, E., Gregory, N., Hatto, C., Turner, S., Kessissoglou, S., et al. (2000). Lifestyle related risk factors for poor health in residential settings for
people with intellectual disabilities. Research in Developmental Disabilities, 21, 469–486.Stanish, H. I., Temple, V. A., & Frey, G. C. (2006). Health-promoting physical activity of adults with mental retardation. Mental Retardation and Developmental
Disabilities Research Reviews, 12, 13–21.Temple, V. A. (2009b). Factors associated with high levels of physical activity among adults with intellectual disability. International Journal of Rehabilitation
Research, 32, 89–92.Temple, V. A., Frey, G. C., & Stanish, H. I. (2006). Physical activity of adults with mental retardation: Review and research needs. American Journal of Health
Promotion, 21, 2–12.Temple, V. A., & Stanish, H. I. (2009a). Pedometer-measured physical activity of adults with intellectual disability: Predicting weekly step counts. American Journal
on Intellectual and Developmental Disabilities, 114, 15–22.Vis, J. C., Thoonsen, H., Duffels, M. G., de Bruin-Bon, R. A., Huisman, S. A., van Dijk, A. P., et al. (2009). Six-minute walk test in patients with Down syndrome:
Validity and reproducibility. Archives of Physical Medicine and Rehabilitation, 90, 1423–1427.Westerterp, K. R. (2009). Assessment of physical activity: A critical appraisal. European Journal of Applied Physiology and Occupational Physiology, 105, 823–828.WHO. (2010). Global recommendations on physical activity for health. Geneva: World Health Organization.
M. Nordstrøm et al. / Research in Developmental Disabilities 34 (2013) 4395–4403 4403


II


ORIGINAL ARTICLE
Dietary aspects related to health and obesity in Williamssyndrome, Down syndrome, and Prader�Willi syndrome
Marianne Nordstrøm1,2*, Benedicte Paus3,4, Lene F. Andersen2 and Svein Olav Kolset2
1Frambu Resource Centre for Rare Disorders, Siggerud, Norway; 2Department of Nutrition, Institute of Basic MedicalSciences, University of Oslo, Oslo, Norway; 3Institute of Clinical Medicine, University of Oslo, Oslo, Norway;4Department of Medical Genetics, Oslo University Hospital, Oslo, Norway
Abstract
Background: Dietary aspects that might contribute to development of obesity and secondary conditions are
not well documented in genetic subgroups associated with intellectual disability.
Objective: To describe the intake frequencies of selected foods in participants with Prader�Willi syndrome
(PWS), Down syndrome (DS), and Williams syndrome (WS), and investigate the association with body mass
index (BMI). To explore food-related autonomy and intake frequencies among persons with DS in different
living arrangements.
Methods: Self-reported intake frequencies and measurement of plasma carotenoids and erythrocyte content of
omega-3 fatty acids (FAs) were investigated in persons aged 16�42 years, with WS (n�21), DS (n�40), and
PWS (n�20).
Results: A larger proportion of participants with PWS showed high-frequency intake of fruits (p�0.012)
and vegetables (p�0.004), and had higher plasma carotenoids (pB0.001) compared to participants with DS
and WS. Furthermore, a larger proportion of participants with WS were low-frequency consumers of fish
(p�0.005), less likely to use omega-3 FA supplements (p�0.023), and had reduced erythrocyte concentrations
of long-chain omega-3 FAs (pB0.001), compared to participantswith PWS andDS. InDS, BMIwas negatively
associated with plasma carotenoids. Increased proportions of participants living in communities showed
high-frequency intake of precooked meals (p�0.030), and a tendency toward high-frequency consumption
of soft drinks (p�0.079), when compared to peers living with relatives. Participants in community residences
were also more likely to participate frequently in food-related decisions and preparations.
Conclusions: Persons with WS had a less-favorable dietary pattern when compared to persons with PWS.
A larger proportion of persons living in communities frequently consumed precooked meals and showed a
tendency of high-frequency soft drink consumption. Otherwise, their intake frequencies of the investigated
foods were similar to those living with relatives, but they participated more frequently in decisions and
preparations of foods.
Keywords: diet; carotenoids; omega-3 fatty acids; obesity; intellectual disability; autonomy; developmental disability;
living arrangements
Responsible Editor: Anna Olafsdottir, University of Iceland, Iceland.
Received: 18 July 2014; Revised: 5 November 2014; Accepted: 22 December 2014; Published: 3 February 2015
Currently, individuals with intellectual disability
(ID) enjoy an increased life expectancy (1, 2) and
experience increased integration in communities
combined with focus on normalization and autonomy (3).
Even so, persons with ID living in community residences
have a high risk of developing obesity and secondary
conditions related to poor lifestyle (4�7). In Norway all
persons with ID are offered community residence with
supportwhenmoving from their parental home. Support is
financed by the local municipality, and is provided based
on assessment of individual needs. This is a general
national policy and provides an opportunity for descrip-
tive studies of lifestyle-related factors in adult personswith
ID living in community residences and also for compar-
isons between different genetic subgroups, and to those
living with relatives.
A diet rich in fruit and vegetables and regular consump-
tion of fish and omega-3 fatty acids (FAs) of marine ori-
gin are associated with several favorable health outcomes
(8�11). In Norway, dietary guidelines to promote public
researchfood & nutrition�
Food & Nutrition Research 2015. # 2015 Marianne Nordstrøm et al. This is an Open Access article distributed under the terms of the Creative Commons CC-BY 4.0License (http://creativecommons.org/licenses/by/4.0/), allowing third parties to copy and redistribute the material in any medium or format and to remix, transform, and buildupon the material for any purpose, even commercially, provided the original work is properly cited and states its license.
1
Citation: Food & Nutrition Research 2015, 59: 25487 - http://dx.doi.org/10.3402/fnr.v59.25487(page number not for citation purpose)
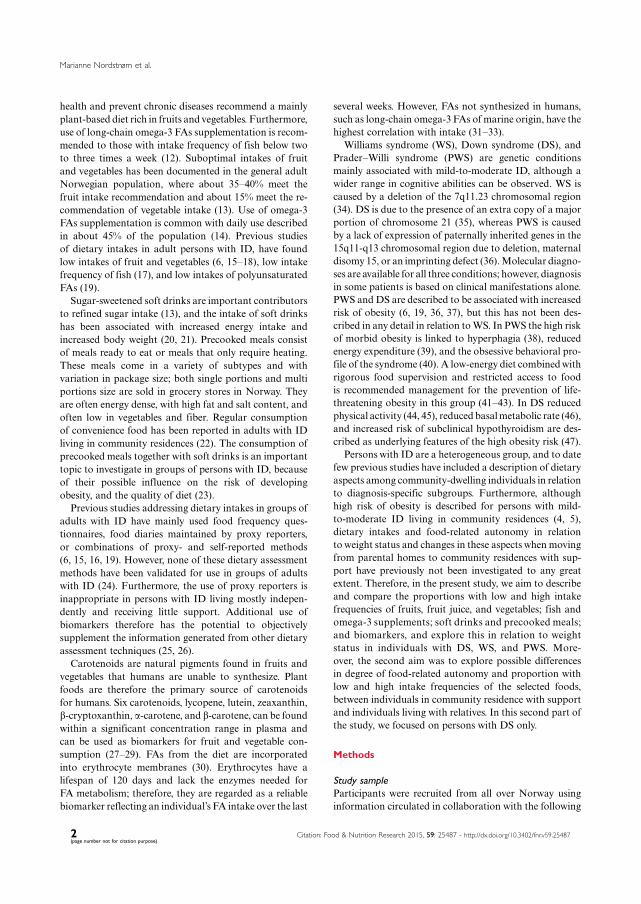
health and prevent chronic diseases recommend a mainly
plant-based diet rich in fruits andvegetables. Furthermore,
use of long-chain omega-3 FAs supplementation is recom-
mended to those with intake frequency of fish below two
to three times a week (12). Suboptimal intakes of fruit
and vegetables has been documented in the general adult
Norwegian population, where about 35�40% meet the
fruit intake recommendation and about 15% meet the re-
commendation of vegetable intake (13). Use of omega-3
FAs supplementation is common with daily use described
in about 45% of the population (14). Previous studies
of dietary intakes in adult persons with ID, have found
low intakes of fruit and vegetables (6, 15�18), low intake
frequency of fish (17), and low intakes of polyunsaturated
FAs (19).
Sugar-sweetened soft drinks are important contributors
to refined sugar intake (13), and the intake of soft drinks
has been associated with increased energy intake and
increased body weight (20, 21). Precooked meals consist
of meals ready to eat or meals that only require heating.
These meals come in a variety of subtypes and with
variation in package size; both single portions and multi
portions size are sold in grocery stores in Norway. They
are often energy dense, with high fat and salt content, and
often low in vegetables and fiber. Regular consumption
of convenience food has been reported in adults with ID
living in community residences (22). The consumption of
precooked meals together with soft drinks is an important
topic to investigate in groups of persons with ID, because
of their possible influence on the risk of developing
obesity, and the quality of diet (23).
Previous studies addressing dietary intakes in groups of
adults with ID have mainly used food frequency ques-
tionnaires, food diaries maintained by proxy reporters,
or combinations of proxy- and self-reported methods
(6, 15, 16, 19). However, none of these dietary assessment
methods have been validated for use in groups of adults
with ID (24). Furthermore, the use of proxy reporters is
inappropriate in persons with ID living mostly indepen-
dently and receiving little support. Additional use of
biomarkers therefore has the potential to objectively
supplement the information generated from other dietary
assessment techniques (25, 26).
Carotenoids are natural pigments found in fruits and
vegetables that humans are unable to synthesize. Plant
foods are therefore the primary source of carotenoids
for humans. Six carotenoids, lycopene, lutein, zeaxanthin,
b-cryptoxanthin, a-carotene, and b-carotene, can be foundwithin a significant concentration range in plasma and
can be used as biomarkers for fruit and vegetable con-
sumption (27�29). FAs from the diet are incorporated
into erythrocyte membranes (30). Erythrocytes have a
lifespan of 120 days and lack the enzymes needed for
FA metabolism; therefore, they are regarded as a reliable
biomarker reflecting an individual’s FA intake over the last
several weeks. However, FAs not synthesized in humans,
such as long-chain omega-3 FAs of marine origin, have the
highest correlation with intake (31�33).Williams syndrome (WS), Down syndrome (DS), and
Prader�Willi syndrome (PWS) are genetic conditions
mainly associated with mild-to-moderate ID, although a
wider range in cognitive abilities can be observed. WS is
caused by a deletion of the 7q11.23 chromosomal region
(34). DS is due to the presence of an extra copy of a major
portion of chromosome 21 (35), whereas PWS is caused
by a lack of expression of paternally inherited genes in the
15q11-q13 chromosomal region due to deletion, maternal
disomy 15, or an imprinting defect (36).Molecular diagno-
ses are available for all three conditions; however, diagnosis
in some patients is based on clinical manifestations alone.
PWS and DS are described to be associatedwith increased
risk of obesity (6, 19, 36, 37), but this has not been des-
cribed in any detail in relation toWS. In PWS the high risk
of morbid obesity is linked to hyperphagia (38), reduced
energy expenditure (39), and the obsessive behavioral pro-
file of the syndrome (40). A low-energy diet combinedwith
rigorous food supervision and restricted access to food
is recommended management for the prevention of life-
threatening obesity in this group (41�43). In DS reduced
physical activity (44, 45), reducedbasalmetabolic rate (46),
and increased risk of subclinical hypothyroidism are des-
cribed as underlying features of the high obesity risk (47).
Persons with ID are a heterogeneous group, and to date
few previous studies have included a description of dietary
aspects among community-dwelling individuals in relation
to diagnosis-specific subgroups. Furthermore, although
high risk of obesity is described for persons with mild-
to-moderate ID living in community residences (4, 5),
dietary intakes and food-related autonomy in relation
to weight status and changes in these aspects when moving
from parental homes to community residences with sup-
port have previously not been investigated to any great
extent. Therefore, in the present study, we aim to describe
and compare the proportions with low and high intake
frequencies of fruits, fruit juice, and vegetables; fish and
omega-3 supplements; soft drinks and precooked meals;
and biomarkers, and explore this in relation to weight
status in individuals with DS, WS, and PWS. More-
over, the second aim was to explore possible differences
in degree of food-related autonomy and proportion with
low and high intake frequencies of the selected foods,
between individuals in community residence with support
and individuals living with relatives. In this second part of
the study, we focused on persons with DS only.
Methods
Study sample
Participants were recruited from all over Norway using
information circulated in collaboration with the following
Marianne Nordstrøm et al.
2(page number not for citation purpose)
Citation: Food & Nutrition Research 2015, 59: 25487 - http://dx.doi.org/10.3402/fnr.v59.25487

nationwide patient organizations: The Norwegian Asso-
ciation for Persons with Developmental Disabilities, The
National Association for Prader�Willi syndrome, The
Norwegian Association for Williams’ Syndrome, and
The Norwegian Network for Down Syndrome. In addi-
tion, information on the study and consent forms were
posted on a study-specific website. The inclusion criteria
were diagnosis with DS, WS, or PWS verified by stan-
dardized clinical methods (48, 49) or by laboratory
genetic testing; age 16�45 years; and returned consent
forms signed by the participant and legal guardian or
parent. In total, 104 returned a signed consent forms.
Four participants with PWS, three participants with DS,
and one participant with WS dropped out of the study,
so a total of 96 participants took part in the data col-
lection. In the data analyses, a total of 81 participants
were included, after elimination of nine participants due
to negative results from laboratory genetic testing and for
not fulfilling the clinical diagnostic criteria. Furthermore,
two persons with PWS and four persons with WS living
with relatives were excluded, as they were too few to be
included in a comparison with diagnose specific peers
living in communities. For this reason, only participants
with DS were included in the analysis in which different
living arrangements were compared. Ethical approval for
the study was granted by the Regional Committee for
Medical and Health Research Ethics, Southeast Region.
Collection of data
Data were collected during courses held at a national
reference center for rare disorders in Norway. Participants
attended the courses together with a parent or employed
caregiver. All data collection was adapted to and per-
formed in a manner to promote the participants them-
selves to be active and the main informants. An electronic
questionnaire was used to collect demographic data (with
the exception of weight and height): information about
celiac disease diagnosis, hypothyroidism, and thyroid
hormones substitution therapy; information on the intake
frequency of fruits, vegetables, fruit juice, fish (including
fish eaten both in hot and cold meals), soft drinks, and
precooked meals; use of omega-3 supplementation; and
degree of participation in decision-making about food
and active preparation of food (Questback, Oslo, Norway).
The participants, together with a parent/caregiver,
used a computer to fill out the questionnaire during the
courses. The instructed role of the parent/caregiver was
to record the participant’s response, and not themselves
to be the main respondent. The food frequencies usedwere
as follows: less than once aweek, one to three times aweek,
four to six times a week, each day, and several times a day.
These categories were later collapsed into two categories:
three times a week or less, and four times a week or more,
representing low- and high-frequency intake, respectively.
Furthermore, we examined the proportion of daily fruit,
vegetables, fish, and soft drink consumption, and the
proportion of fish intake less than once a week. Infor-
mation on daily use of omega-3 supplementation was
collected based on ‘yes’ or ‘no’ responses with an addi-
tional open category in which participants could manually
report the subtype of supplementation. Autonomy-related
variables were collected in the following categories: never,
rarely, occasionally, often, or always. These categories
were later collapsed into two categories: ‘never, rarely, or
occasionally’ and ‘often or always’, representing a low and
high degree of autonomy, respectively. Weight was mea-
sured twice in light clothing on an impedance scale (Tanita
BC-418 MA, Arlington Heights, IL, USA) and recorded
to the nearest 0.1 kg. Height was measured twice in an
upright position with heels placed against the wall and
with head fixed in Frankfurt plane using a wall-mounted
stadiometer (Seca 222, Birmingham, UK) and recorded to
the nearest 0.1 cm. Body mass index (BMI) was calculated
using the standard formula. Blood samples were collected
in the morning in 4-ml lithium-heparin-gel plasma tubes
(Vacuette, Greiner Bio-one GmbH, Germany) after over-
night fasting. The tubes were centrifuged at room tem-
perature in a swing-out centrifuge at 1,500 g for 12 min
and kept on ice until placement in a �808C freezer. The
samples were thawed in a refrigerator overnight before
analyses of carotenoids and FAs were performed, at a
laboratory with standardized procedures to perform such
analyses.
Assessment of carotenoids
Plasma (100 mL) was pipetted into vials, proteins were pre-
cipitated, and carotenoidswere extractedwith isopropanol
containing an internal standard (b-Apo-8 carotenal).
After thorough mixing and subsequent centrifugation, an
aliquot of the isopropanol phase was injected into the
HPLC-UV. Separations were performed on a 3-mm YMC
C30 column (150�4.6 mm internal diameter; YMC,
Kyoto, Japan). Analyses were performed on a 100-series
HPLCwith a 1,260 diode array detector (453 nm) (Agilent
Technologies, Palo Alto, CA, USA).
FA assessment
Erythrocytes were vortexed and pipetted into vials, and
samplesweremethylatedwith 3NMeOHHCl.Methylated
FAs were extracted with hexane, and the samples were
neutralizedwith 3NKOH in water. The samples were then
mixed and centrifuged, and the hexane phase was injected
into a gas chromatograph with flame ionization detector.
Analyses were performed on a 7890A GC with a split
injectorwith a 7683Bautomatic liquid sampler using flame
ionization detection (Agilent Technologies, PaloAlto, CA,
USA). Separationswere performed on an SP-2380 column
(30 m�0.25 mm internal diameter�0.25 mm film thick-
ness) from Supelco (Sigma-Aldrich, St. Louis, MO, USA).
Dietary aspects related to health and obesity
Citation: Food & Nutrition Research 2015, 59: 25487 - http://dx.doi.org/10.3402/fnr.v59.25487 3(page number not for citation purpose)

Statistics
Standard descriptive statistics were calculated for all
variables. Initially chi-square, one-way analysis of variance
(ANOVA), and independent t-test were used to identify
differences between the subgroups with respect to back-
ground variables. Level of support was regarded as col-
lider in the investigations comparing the different genetic
subgroups, andwas for this reason considered not relevant
to adjust for in the statistical analysis. Normality was
assessed, and when violated, log-transformed variables
were used. Ordinal categorical variables were dichoto-
mized to avoid zero-cell problems and loss of statistical
power. Chi-square tests were used to investigate pro-
portions with low and high intake frequencies of fish by
diagnosis, due to a zero-cell. Otherwise logistic regres-
sion models adjusted for BMI were used to investigate
the association between proportions with low- and high-
frequency consumers in the different food categories
and use of omega-3 supplementation by diagnosis. Linear
regression adjusted for BMI was used to investigate
plasma carotenoids and erythrocyte FAs to detect differ-
ences between diagnoses. Based on initial analysis by use
of ANOVAwith Tukey post hoc test, the PWS-group was
used as reference and compared to a combined group
of persons with DS and WS in comparison of plasma
carotenoids. Similarly, in the investigation of erythrocyte
FAs, WS was used as reference and compared to a com-
bined group of persons with PWS and DS. Assumption
of linearity, interaction, and standard residualswere inves-
tigated when relevant in the models. Chi-square tests
were used to investigate differences in proportions with
low and high food intake frequencies and degree of par-
ticipation in food-related tasks based on BMI-category
in the diagnoses. In these analyses, to ensure test validity,
normal weight and overweight participants were collapsed
into one group and compared to obese participants.
Pearson’s correlation test was used to assess the association
between BMI and plasma carotenoids and erythrocyte
FAs by diagnosis. Chi-square tests were used to investigate
proportions with high- and low-frequency intake of foods,
high and low degree of autonomy, when living in commu-
nities was compared with living with relatives for persons
with DS. Similarly, Mann�Whitney tests were used to
investigate differences in plasma carotenoids and erythro-
cyte omega-3 FAs when the living arrangements were
compared. All statistical analyses were performed using
SPSS 19 (SPSS Inc., Chicago, IL, USA), and p-values
of less than 0.05 were regarded as statistically significant.
Results
The characteristics of the study population are pre-
sented by diagnosis in Table 1. More females than males
Table 1. Characteristics of the study population by living arrangement and diagnosis
Living in community residence Living with relatives
Prader�Willi
syndrome (n�20)
Williams
syndrome (n�21)
Down syndrome
(n�24)
Down syndrome
(n�16)
pa
Diagnosis
pb Living
arrangements
Age (years) 29.3 (5.3) 33.6 (6.4) 30.4 (6.4) 21.5 (5.8) 0.067 B0.001**
Females (%) 55.0 66.7 62.5 62.5 0.739 1.000
BMI (kg/m2) 30.9 (6.1) 28.2 (5.8) 32.8 (6.6) 30.6 (6.3) 0.050 0.250
Smokers (%) 10.0 4.8 0 0 0.289
Occupation 0.463 0.113
Student (%) 0 4.8 4.2 31.3
Employed (%) 85.0 81.0 66.7 50.0
Daycare attendant (%) 10.0 4.8 25.0 12.5
Unemployed (%) 5.0 9.5 4.2 6.3
Years lived in community
residence (years)
8.5 (5.5) 9.4 (5.8) 7.3 (4.9) 0.443
Level of support in community
residence**
0.020*
0�30 h/week (%) 40.0 47.6 54.2
31�60 h/week (%) 10.0 23.8 20.8
More than 60 h/week (%) 45.0 4.8 8.3
Level of support unknown (%) 5.0 23.8 16.7
The data are presented as percentage of the population or as the mean (standard deviation).ap-Values are derived by comparison of persons in community residence with different diagnosis using chi-square tests and one-way analysis of variance
(ANOVA); bp-values are derived by comparison of persons with DS living in community residence to persons with DS living with relatives using
chi-square tests and independent t-test.
*pB0.05.
**pB0.001.
Marianne Nordstrøm et al.
4(page number not for citation purpose)
Citation: Food & Nutrition Research 2015, 59: 25487 - http://dx.doi.org/10.3402/fnr.v59.25487

participated in the study; however, there was no significant
difference in age or BMI between the sexes. Likewise, the
sex distribution was similar in the genetic subgroups.
Overweight and obesity were prevalent, and 78% of the
total study population had a BMI �25 kg/m2. When
the diagnosis-groups were compared, there was a small
difference in BMI. Participants with DS and WS had the
highest and lowest BMI’s, respectively. Participants with
DS living with their parents were on average 8.9 years
younger than diagnosis-specific peers living in community
settings. All persons with PWS followed a diet and had
assistance to follow dietary regimens. None of the par-
ticipants with PWS decided independently the amount
of food to eat due to their well-known hyperphagia and
high risk of developing obesity. However, variable degree
of participation in food decisions was recorded. Some
individuals did not take any part in decisions and pre-
paration of food eaten, whereas most individuals took
some part in food decisions for example, what type of fruit
andvegetables to consume, what type of spreads to have on
their bread, etc. Three persons with DS had celiac disease.
Hypothyroidism was common and found in 17 persons
with DS (43.6%), three persons with WS (12.0%), and
three persons with PWS (13.6%).
In the PWS-group, a total of 70, 25, and 85% of
participants consumed daily fruit, fruit juice, and vegeta-
bles, respectively. In the DS-group daily consumption of
fruit was recorded in 33%, fruit juice in 37%, and vegetables
in 29%. For participants with WS, daily consumption
of fruit, fruit juice, and vegetables was recorded as 15, 9,
and 20%, respectively. The proportions with intake fre-
quency of three times or less and four times or more aweek
(low- and high-frequency intake) by diagnosis are shown in
Fig. 1. A larger proportion of participants with PWS were
Fruit
≤ 3 times/week ≥ 4 times/week
≤ 3 times/week ≥ 4 times/week ≤ 3 times/week ≥ 4 times/week
≤ 3 times/week ≥ 4 times/week
≤ 3 times/week ≥ 4 times/week≤ 3 times/week ≥ 4 times/week
0102030405060708090
100 *
DSWS
PWS
% o
f Pop
ulat
ion
Fruit juice
0102030405060708090
100 *
DSPWS
WS
% o
f Pop
ulat
ion
Vegetables
0102030405060708090
100* WS
DSPWS
% o
f Pop
ulat
ion
Fish
0102030405060708090
100* WS
DSPWS
% o
f Pop
ulat
ion
Soft drinks
0102030405060708090
100 WSDSPWS
% o
f Pop
ulat
ion
Precooked warm meals
0102030405060708090
100
PWS
WSDS
% o
f Pop
ulat
ion
Fig. 1. Proportion low- and high-frequency consumers by diagnosis. Intake frequencies are presented as a percentage of thepopulation diagnosed with WS (n�21), DS (n�24) or PWS (n�20).*pB0.05 when participants with PWS were compared to participants with WS and DS using logistic regression models adjustedfor BMI.
Dietary aspects related to health and obesity
Citation: Food & Nutrition Research 2015, 59: 25487 - http://dx.doi.org/10.3402/fnr.v59.25487 5(page number not for citation purpose)
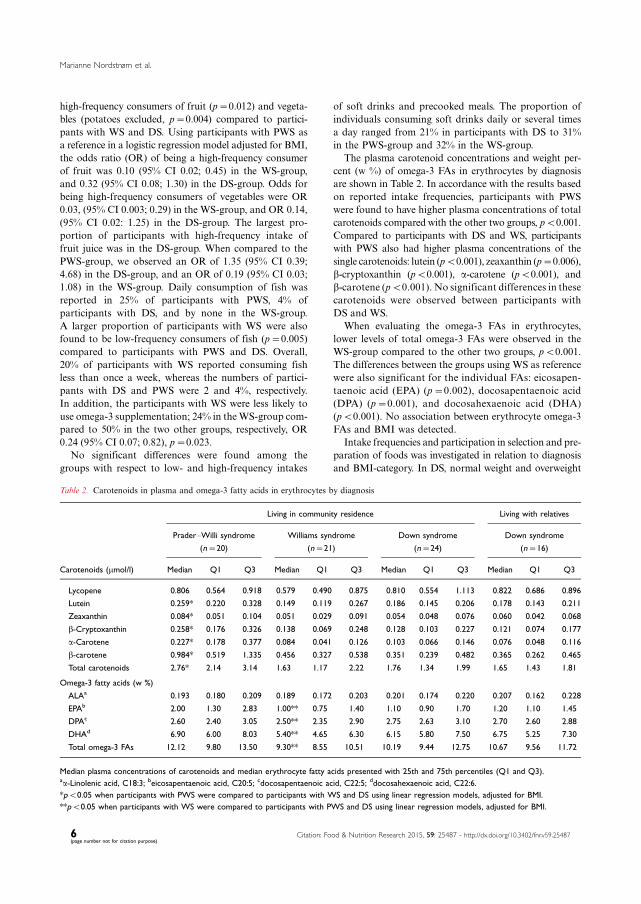
high-frequency consumers of fruit (p�0.012) and vegeta-
bles (potatoes excluded, p�0.004) compared to partici-
pants with WS and DS. Using participants with PWS as
a reference in a logistic regression model adjusted for BMI,
the odds ratio (OR) of being a high-frequency consumer
of fruit was 0.10 (95% CI 0.02; 0.45) in the WS-group,
and 0.32 (95% CI 0.08; 1.30) in the DS-group. Odds for
being high-frequency consumers of vegetables were OR
0.03, (95% CI 0.003; 0.29) in the WS-group, and OR 0.14,
(95% CI 0.02: 1.25) in the DS-group. The largest pro-
portion of participants with high-frequency intake of
fruit juice was in the DS-group. When compared to the
PWS-group, we observed an OR of 1.35 (95% CI 0.39;
4.68) in the DS-group, and an OR of 0.19 (95% CI 0.03;
1.08) in the WS-group. Daily consumption of fish was
reported in 25% of participants with PWS, 4% of
participants with DS, and by none in the WS-group.
A larger proportion of participants with WS were also
found to be low-frequency consumers of fish (p�0.005)
compared to participants with PWS and DS. Overall,
20% of participants with WS reported consuming fish
less than once a week, whereas the numbers of partici-
pants with DS and PWS were 2 and 4%, respectively.
In addition, the participants with WS were less likely to
use omega-3 supplementation; 24% in theWS-group com-
pared to 50% in the two other groups, respectively, OR
0.24 (95% CI 0.07; 0.82), p�0.023.
No significant differences were found among the
groups with respect to low- and high-frequency intakes
of soft drinks and precooked meals. The proportion of
individuals consuming soft drinks daily or several times
a day ranged from 21% in participants with DS to 31%
in the PWS-group and 32% in the WS-group.
The plasma carotenoid concentrations and weight per-
cent (w %) of omega-3 FAs in erythrocytes by diagnosis
are shown in Table 2. In accordance with the results based
on reported intake frequencies, participants with PWS
were found to have higher plasma concentrations of total
carotenoids compared with the other two groups, pB0.001.
Compared to participants with DS and WS, participants
with PWS also had higher plasma concentrations of the
single carotenoids: lutein (pB0.001), zeaxanthin (p�0.006),
b-cryptoxanthin (pB0.001), a-carotene (pB0.001), and
b-carotene (pB0.001). No significant differences in these
carotenoids were observed between participants with
DS and WS.
When evaluating the omega-3 FAs in erythrocytes,
lower levels of total omega-3 FAs were observed in the
WS-group compared to the other two groups, pB0.001.
The differences between the groups using WS as reference
were also significant for the individual FAs: eicosapen-
taenoic acid (EPA) (p�0.002), docosapentaenoic acid
(DPA) (p�0.001), and docosahexaenoic acid (DHA)
(pB0.001). No association between erythrocyte omega-3
FAs and BMI was detected.
Intake frequencies and participation in selection and pre-
paration of foods was investigated in relation to diagnosis
and BMI-category. In DS, normal weight and overweight
Table 2. Carotenoids in plasma and omega-3 fatty acids in erythrocytes by diagnosis
Living in community residence Living with relatives
Prader�Willi syndrome
(n�20)
Williams syndrome
(n�21)
Down syndrome
(n�24)
Down syndrome
(n�16)
Carotenoids (mmol/l) Median Q1 Q3 Median Q1 Q3 Median Q1 Q3 Median Q1 Q3
Lycopene 0.806 0.564 0.918 0.579 0.490 0.875 0.810 0.554 1.113 0.822 0.686 0.896
Lutein 0.259* 0.220 0.328 0.149 0.119 0.267 0.186 0.145 0.206 0.178 0.143 0.211
Zeaxanthin 0.084* 0.051 0.104 0.051 0.029 0.091 0.054 0.048 0.076 0.060 0.042 0.068
b-Cryptoxanthin 0.258* 0.176 0.326 0.138 0.069 0.248 0.128 0.103 0.227 0.121 0.074 0.177
a-Carotene 0.227* 0.178 0.377 0.084 0.041 0.126 0.103 0.066 0.146 0.076 0.048 0.116
b-carotene 0.984* 0.519 1.335 0.456 0.327 0.538 0.351 0.239 0.482 0.365 0.262 0.465
Total carotenoids 2.76* 2.14 3.14 1.63 1.17 2.22 1.76 1.34 1.99 1.65 1.43 1.81
Omega-3 fatty acids (w %)
ALAa 0.193 0.180 0.209 0.189 0.172 0.203 0.201 0.174 0.220 0.207 0.162 0.228
EPAb 2.00 1.30 2.83 1.00** 0.75 1.40 1.10 0.90 1.70 1.20 1.10 1.45
DPAc 2.60 2.40 3.05 2.50** 2.35 2.90 2.75 2.63 3.10 2.70 2.60 2.88
DHAd 6.90 6.00 8.03 5.40** 4.65 6.30 6.15 5.80 7.50 6.75 5.25 7.30
Total omega-3 FAs 12.12 9.80 13.50 9.30** 8.55 10.51 10.19 9.44 12.75 10.67 9.56 11.72
Median plasma concentrations of carotenoids and median erythrocyte fatty acids presented with 25th and 75th percentiles (Q1 and Q3).aa-Linolenic acid, C18:3; beicosapentaenoic acid, C20:5; cdocosapentaenoic acid, C22:5; ddocosahexaenoic acid, C22:6.
*pB0.05 when participants with PWS were compared to participants with WS and DS using linear regression models, adjusted for BMI.
**pB0.05 when participants with WS were compared to participants with PWS and DS using linear regression models, adjusted for BMI.
Marianne Nordstrøm et al.
6(page number not for citation purpose)
Citation: Food & Nutrition Research 2015, 59: 25487 - http://dx.doi.org/10.3402/fnr.v59.25487

participants were found to be more likely to consume fruits
four times or more per week compared to obese par-
ticipants, p�0.032. A similar tendency was observed for
intakes of vegetables, p�0.081, whereas no other difference
was observed in proportions with low and high intake
frequencies of foods, or in participation in food selection
and preparation by the groups based on BMI in DS. In
PWS, normal weight and overweight participants reported
more often intakes of fruit four times or more per week
compared to obese participants, p�0.013. No other signi-
ficant differences in the proportions with low and high
intake frequencies of foods or degree of participation in
food-related tasks were observed in the PWS-group when
this was evaluated in BMI-based groups. This was also the
case in the WS-group. In Fig. 2, the association between
BMI and measured plasma carotenoids is shown in the
different diagnose groups. Increased BMI was associated
with a reduction in total plasma carotenoids for persons
with PWS and DS. This correlation, however, was only
significant in DS, r �0.33, p�0.039. In contrast, the
lowest plasma carotenoid concentrations were found in
those categorized as underweight and lower end of normal
weight range among participants with WS.
When participants with DS living with parents (n�16)
were compared to those living in communities (n�24),
we found no differences in the proportions of low- and
high-frequency consumers of fruit, fruit juice, vegetables,
and fish. Moreover, no significant differences were ob-
served in any of the biomarkers measured in blood from
the two subgroups, as can be seen in Table 2. However,
as shown in Fig. 3, a larger proportion of high-frequency
consumers of precooked meals were observed in persons
living in community residences (p�0.030).We also observed
a trend toward a larger proportion of high-frequency con-
sumers of soft drinks in community-dwelling partici-
pants (p�0.079). As displayed in Fig. 4, when compared
to participants living with relatives, participants living in
communities had a higher degree of participation in deci-
sions regarding which foods to eat (p�0.037) and which
groceries to buy (pB0.001), and participated more in the
preparation of warm meals (p�0.005), whereas only small
changes were observed between the living arrangements
with respect to participation in cold meal preparation.
Discussion
In this study, we describe the proportion with low- and
high-frequency consumption of selected food groups that
are of particular interest to health and obesity in community-
dwelling participants with three different genetic conditions
associated with ID and compare the results to individuals
living with relatives. Norway has a general national policy
and transition practice for personswith ID, and this provides
a national cohort with reduced probability of systematic
differences in level of functioning or comorbidities between
the subgroups based on living arrangements. A difference
in age between the persons living in community residence
versus living with relatives was however seen, as people with
Fig. 2. The association between BMI and total carotenoidsby diagnosis. Scatter plot include participants with DS(n�40), participants with PWS (n�20), and participantswith WS (n�21). The correlation was tested by use ofperson’s correlation and significant for persons with DS,r�0.33, p�0.039.
Soft drinks
4 times/week0
20
40
60
80
100
With RelativesIn Communities
% o
f Pop
ulat
ion
Precooked warm meals
3 times/week 4 times/week0
20
40
60
80
100With RelativesIn Communities
*
% o
f Pop
ulat
ion
3 times/week
Fig. 3. Proportion low- and high-frequency consumersbased on living arrangement. Intake frequencies are pre-sented as a percentage of the population with DS living withrelatives (n�16) or in communities (n�24).*pB0.05 when participants with DS living in communityresidences were compared to diagnose specific peers livingwith relatives using chi-square tests.
Dietary aspects related to health and obesity
Citation: Food & Nutrition Research 2015, 59: 25487 - http://dx.doi.org/10.3402/fnr.v59.25487 7(page number not for citation purpose)
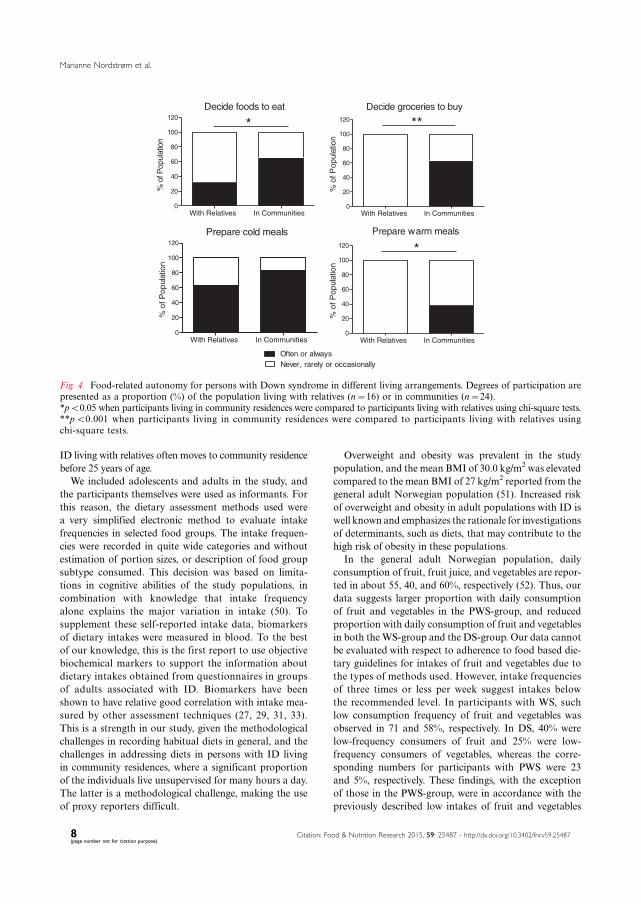
ID living with relatives often moves to community residence
before 25 years of age.
We included adolescents and adults in the study, and
the participants themselves were used as informants. For
this reason, the dietary assessment methods used were
a very simplified electronic method to evaluate intake
frequencies in selected food groups. The intake frequen-
cies were recorded in quite wide categories and without
estimation of portion sizes, or description of food group
subtype consumed. This decision was based on limita-
tions in cognitive abilities of the study populations, in
combination with knowledge that intake frequency
alone explains the major variation in intake (50). To
supplement these self-reported intake data, biomarkers
of dietary intakes were measured in blood. To the best
of our knowledge, this is the first report to use objective
biochemical markers to support the information about
dietary intakes obtained from questionnaires in groups
of adults associated with ID. Biomarkers have been
shown to have relative good correlation with intake mea-
sured by other assessment techniques (27, 29, 31, 33).
This is a strength in our study, given the methodological
challenges in recording habitual diets in general, and the
challenges in addressing diets in persons with ID living
in community residences, where a significant proportion
of the individuals live unsupervised for many hours a day.
The latter is a methodological challenge, making the use
of proxy reporters difficult.
Overweight and obesity was prevalent in the study
population, and the mean BMI of 30.0 kg/m2 was elevated
compared to the mean BMI of 27 kg/m2 reported from the
general adult Norwegian population (51). Increased risk
of overweight and obesity in adult populations with ID is
well known and emphasizes the rationale for investigations
of determinants, such as diets, that may contribute to the
high risk of obesity in these populations.
In the general adult Norwegian population, daily
consumption of fruit, fruit juice, and vegetables are repor-
ted in about 55, 40, and 60%, respectively (52). Thus, our
data suggests larger proportion with daily consumption
of fruit and vegetables in the PWS-group, and reduced
proportion with daily consumption of fruit and vegetables
in both the WS-group and the DS-group. Our data cannot
be evaluated with respect to adherence to food based die-
tary guidelines for intakes of fruit and vegetables due to
the types of methods used. However, intake frequencies
of three times or less per week suggest intakes below
the recommended level. In participants with WS, such
low consumption frequency of fruit and vegetables was
observed in 71 and 58%, respectively. In DS, 40% were
low-frequency consumers of fruit and 25% were low-
frequency consumers of vegetables, whereas the corre-
sponding numbers for participants with PWS were 23
and 5%, respectively. These findings, with the exception
of those in the PWS-group, were in accordance with the
previously described low intakes of fruit and vegetables
Never, rarely or occasionallyOften or always
Decide foods to eat
With Relatives In Communities0
20
40
60
80
100
120*
% o
f Pop
ulat
ion
Decide groceries to buy
With Relatives In Communities0
20
40
60
80
100
120 **
% o
f Pop
ulat
ion
Prepare cold meals
With Relatives In Communities0
20
40
60
80
100
120
% o
f Pop
ulat
ion
Prepare warm meals
With Relatives In Communities0
20
40
60
80
100
120 *
% o
f Pop
ulat
ion
Fig. 4. Food-related autonomy for persons with Down syndrome in different living arrangements. Degrees of participation arepresented as a proportion (%) of the population living with relatives (n�16) or in communities (n�24).*pB0.05 when participants living in community residences were compared to participants living with relatives using chi-square tests.**pB0.001 when participants living in community residences were compared to participants living with relatives usingchi-square tests.
Marianne Nordstrøm et al.
8(page number not for citation purpose)
Citation: Food & Nutrition Research 2015, 59: 25487 - http://dx.doi.org/10.3402/fnr.v59.25487
in several studies of community-dwelling persons with
ID (15, 16, 18) and with DS (6). However, low intake
frequency of fruit and vegetables has previously not been
described for an adult population withWS. These findings
are interesting in light of the high risk of developing
hypertension associated with WS (53), and the fact that
diets rich in fruits and vegetables may contribute to reduce
the risk of hypertension (54). Even so, this association
needs to be further evaluated in relation to WS.
The biomarkers studied overall support the data ob-
tained from the food intake frequency questionnaire.
A reduction in plasma carotenoids of about 40% in WS,
and about 35% in DS, was observed when compared to
measured levels in PWS. There are a few genetic alterations
know to affect the level of carotenoids in plasma (55).
However, none of these are located on the chromosomes
known to be involved in the included subgroups, and
provides support that the measured difference is due to
consumption inequality. Unfortunately, the measured
carotenoids cannot be used to calculate actual intake of
fruit and vegetables in the groups. However, the underly-
ing concept is that the use of such objective markers in
blood is related to intake and takes in to account effect of
absorption and metabolism such as oxidative stress and
excretion, and by this provides supportive data that should
be of high value in investigations on fruit and vegetable
intakes and health outcomes (25).
Increased BMI was associated with a reduction in
plasma carotenoid concentrations in the PWS and DS
groups, although this correlation was only significant for
individuals with DS. This might suggest that persons with
increased BMI in some subgroups consume less fruit and
vegetables. This tendency was supported by the results
based on reported intake frequencies in relation to BMI-
categories. This finding is furthermore in accordance with
descriptions from other investigations in overweight and
obese individuals with ID (16) and from adults in the
general populations where BMI has been found to be
negatively associated with plasma carotenoid levels (28).
Even so, it has also been suggested that the observed
difference in plasma carotenoids related to weight status
also might be influenced by difference in metabolism of
carotenoids in persons with excessive body weight com-
pared to persons with normal weight, although, the pos-
sible impact of this currently is not well described (25).
In WS, persons classified as having a BMI at the lower
end of normal range or as being underweight, showed
a tendency toward lower intake frequency of fruits and
vegetables and lower plasma concentrations of carote-
noids. No severely underweight individuals participated
in the study, but these findings may indicate that feed-
ing problems typically occurring in early childhood in
this group (34), for some individuals may persist into
adulthood and continue as selective eating or other
eating disorders (56). Obesity is described to be the most
frequent weight related problem in adults with ID (4, 5).
Nevertheless, the diversity observed between the groups
in this study elucidates the heterogeneity found in adults
with ID who were also underweight, and that feeding
problems are more frequently observed in these groups
compared to the general population (4). Further studies
investigating the association between diets and BMI
should describe and take into account individuals with
feeding problems and selective eating pattern, as these
individuals might also be found among persons in the
normal BMI-range.
About 10% of the general Norwegian population
consumes seafood daily (52) and about 15% consume
fish meals less than once aweek (13). When the diagnosis-
groups were compared, intake frequencies of fish and
omega-3 supplementations were lowest in the WS popula-
tion, and 20% of individuals in this group reported an
intake frequency of less than once a week, which is below
the recommended frequency of two to three times a
week for prevention of secondary conditions (12). In WS,
the combination of low-frequency consumption of fish,
less use of omega-3 supplementation, and reduced level of
long chained omega-3 FAs in erythrocyte membranes
indicate increased risk of insufficient intakes of essential
omega-3 FAs, and potentially also insufficient intake of
vitamin D. In Norway, fish and omega-3 supplements
containing vitamin D are the most important sources
of vitamin D. The reduced intakes of fish and omega-3
supplements found in the WS-group may be due to their
vitaminD content, where dietary restrictions in childhood,
implemented to resolve sporadic hypercalcemia, may have
contributed to a habit of low intakes that continue through
adolescence and into adulthood.
Data from the present study indicate that participants
with PWS comply better with dietary recommendations
for fruit, vegetables, fish, and omega-3 intake than parti-
cipants in theWS-group and, in some aspects, participants
in the DS-group. We suspect that this difference may be
explained by frequent use of restrictive low-energy diets,
in combination with the descriptions of dietary vulner-
abilities (41, 42), and increased level of support associated
with PWS in our study population.
About one-third of the study population consumed
soft drinks daily or several times a day, a result that is
similar to what is described from the general population
(52). Furthermore, there was a tendency toward higher
intake of soft drinks in community-dwelling participants
with DS compared to peers living with relatives. Frequent
consumption of soft drinks among persons living in
communities has also previously been reported (16, 18, 21).
Sugar-sweetened soft drinks are important contributors to
refined sugar intake (13) and are compared to artificially-
sweetened beverages associated with less-favorable health
outcome (57). Frequent use of sugar-sweetened soft drinks
may be one of the underlying factors contributing to the
Dietary aspects related to health and obesity
Citation: Food & Nutrition Research 2015, 59: 25487 - http://dx.doi.org/10.3402/fnr.v59.25487 9(page number not for citation purpose)
increased risk of obesity in community-dwelling persons
with ID (21). Unfortunately, in this study we do not have
data to differentiate between the use of sugar-sweetened
and artificially-sweetened soft drinks, and no association
was observed betweenobesity and high intake frequencyof
soft drinks in this study. Nevertheless, daily use of soft
drinkswith andwithout sugar is in general associatedwith
reduced dental health (58).
Intake of precooked meals was higher in community-
dwelling participants with DS. The use of precooked
meals in adults with ID can be a double-edged sword. On
one hand, these meals can provide nutritional indepen-
dence, but on the other hand, they are often energy dense,
with high fat and salt content, and with low content of
vegetables and fiber. Furthermore, they are often not
adjusted to the reduced energy needs associated with DS
and PWS, and if family-size package meals are selected,
persons with ID eating alone might have difficulties
dividing the meal into adequate portion size. For these
reasons the total energy intake from and nutrient con-
tent of these meals needs to be evaluated, as our data
indicate that they are an important part of the diet for a
significant proportion of persons living in community
residences. To comply with the law regulating the right to
self-determination, the use of these meals also needs to be
voluntary and not forced due to lack of proper training in
cooking skills or assistance.
Living in communities was accompanied by increased
influence on food choices and responsibility for foods.
In this study, no difference in proportions with low and
high intake frequencies of fruit, fruit juice, vegetables, fish,
and omega-3 supplementation was detected when persons
living in communities were compared to those living with
relatives. This is an important finding as it is a common
perception that increased autonomy in persons with ID in
general leads to overall poor diets. Nevertheless, if indi-
viduals with ID are given freedom to make dietary deci-
sions, this needs to be accompanied by proper training
regarding healthy food choices and food preparation
skills. Studies have shown that individuals with ID make
healthier food choices after intervention targeting nutri-
tional knowledge (59). Proper support in these aspectsmay
also be of importance in the transition periodwhenpersons
establish new routines in community settings. There might
also be a need to increase knowledge and skills in food-
related tasks among caregivers assisting these groups (60).
This study has several limitations. The method of re-
cruitment and low participant numbers limit the statistical
power and the generalizations, although approximately
one-third of the known population of PWS and WS in
Norway in the relevant age category participated, and we
recruited participants from all over the country. No formal
testing of intellectual functioning was conducted, and this
is an important limitation, as there may be differences in
these aspects related to the included genetic conditions,
even though all three conditions are associatedwith similar
level of ID. The fact that all participants cooperated well
andwere able to complete all aspects of the data collection,
indicates that the average level of functioning in the
study population might have been above the average in
the respective diagnosis. The simplified dietary assessment
technique used in this study does not include all aspects
of dietary intake, and can only be used to describe some
overall food intake frequency patterns. Additional use of
digital photography of meals consumed would probably
have improved the dietary intake estimates (61, 62).
Furthermore, a validation of the individuals’ abilities to
report diets at this consumption level would have been
valuable.Nevertheless, an agreement in results between the
reported intake frequencies and measured biomarkers was
observed, providing credibility and support to the results
obtained. For these reasons, the results of the present study
must be regarded as explorative rather than conclusive.
Persons with WS had a less-favorable dietary pattern,
as indicated by the larger proportion of low-frequency
consumers of fruits and vegetables as well as lower plasma
carotenoid concentrationswhen compared to personswith
PWS. In addition, a larger proportion of persons with WS
were low-frequency consumers of fish, fewer used omega-3
supplementation, and lower concentrations of erythrocyte
omega-3 FAswere observed in personswithWS compared
to persons with PWS and DS. A more comprehensive
assessment of diets in adult persons with WS is warranted
and should include assessment of medical and physical
aspects that might influence food intakes. An increased
proportion of persons with DS living in communities
were high-frequency consumers of precooked meals, and
there was a tendency toward a larger proportion of high-
frequency consumers of soft drinks, when compared to
peers living with relatives. Apart from this, their intake
frequencies of the investigated foods were similar to those
living with relatives, even though they had higher degree
of food-related autonomy.
Acknowledgements
This study was funded by the Extra Stiftelsen and Frambu Resource
Centre for Rare Disorders. The authors thank the collaborating
patient organizations and are grateful to Kari Hagen for her con-
tribution during data collection at Frambu.
Conflict of interest and funding
The authors declare no conflict of interests. The study
was founded by Extrastiftelsen and Frambu Resource
Centre for Rare Disorders.
References
1. Englund A, Jonsson B, Zander CS, Gustafsson J, Anneren G.
Changes in mortality and causes of death in the Swedish Down
syndrome population. Am J Med Genet A 2013; 161A: 642�9.
Marianne Nordstrøm et al.
10(page number not for citation purpose)
Citation: Food & Nutrition Research 2015, 59: 25487 - http://dx.doi.org/10.3402/fnr.v59.25487

2. Zhu JL, Hasle H, Correa A, Schendel D, Friedman JM, Olsen J,
et al. Survival among people with Down syndrome: a nation-
wide population-based study in Denmark. Genet Med 2013; 15:
64�9.3. Beadle-Brown J, Mansell J, Kozma A. Deinstitutionaliza-
tion in intellectual disabilities. Curr Opin Psychiatry 2007; 20:
437�42.4. Hove O. Weight survey on adult persons with mental retarda-
tion living in the community. Res Dev Disabil 2004; 25: 9�17.5. De Winter CF, Bastiaanse LP, Hilgenkamp TI, Evenhuis HM,
Echteld MA. Overweight and obesity in older people with
intellectual disability. Res Dev Disabil 2012; 33: 398�405.6. Braunschweig CL, Gomez S, Sheean P, Tomey KM, Rimmer J,
Heller T. Nutritional status and risk factors for chronic disease
in urban-dwelling adults with Down syndrome. Am J Ment
Retard 2004; 109: 186�93.7. Robertson J, Emerson E, Gregory N, Hatto C, Turner S,
Kessissoglou S, et al. Lifestyle related risk factors for poor health
in residential settings for people with intellectual disabilities. Res
Dev Disabil 2000; 21: 469�86.8. World Cancer Research Fund/American Institute of Cancer
Research (2007). Food, nutrition, physical activity, and the
prevention of cancer: a global perspective. Washington, DC:
American Institute of Cancer Research, 517 p.
9. World Health Organization (2003). Diet, nutrition, and the
prevention of chronic diseases: report of a joint WHO/FAO expert
consultation. Geneva: World Health Organization, 159 p.
10. Dauchet L, Amouyel P, Hercberg S, Dallongeville J. Fruit and
vegetable consumption and risk of coronary heart disease: a
meta-analysis of cohort studies. J Nutr 2006; 136: 2588�93.11. Mozaffarian D, Wu JH. Omega-3 fatty acids and cardiovascular
disease: effects on risk factors, molecular pathways, and clinical
events. J Am Coll Cardiol 2011; 58: 2047�67.12. Norwegian National Nutrition Council (2011). Dietary recom-
mendations for promotion of public health and prevention of
chronic diseases. Methiology and scientific evidence. Oslo: The
Norwegian Directorate of Health, 353 p. (In Norwegian)
13. Totland TH, Melnæs BK, Lundberg-Hallen N, Helland-Kigen
KM, Lund-Blix NA, Myhre JB, et al. (2012). Norkost 3: a
national dietary survey in Norway among men and women
18�70 years of age. Oslo: The Norwegian Directorate of Health,
70 p. (In Norwegian)
14. Brustad M, Braaten T, Lund E. Predictors for cod-liver oil
supplement use � the Norwegian Women and Cancer Study.
Eur J Clin Nutr 2004; 58: 128�36.15. Draheim CC, Stanish HI, Williams DP, McCubbin JA. Dietary
intake of adults with mental retardation who reside in commu-
nity settings. Am J Ment Retard 2007; 112: 392�400.16. Ptomey L, Goetz J, Lee J, Donnelly J, Sullivan D. Diet quality
of overweight and obese adults with intellectual and develop-
mental disabilities as measured by the healthy eating index-
2005. J Dev Phys Disabil 2013; 25: 625�36.17. de Winter CF, Magilsen KW, van Alfen JC, Penning C,
Evenhuis HM. Prevalence of cardiovascular risk factors in
older people with intellectual disability. Am J Intellect Dev
Disabil 2009; 114: 427�36.18. Adolfsson P, Sydner YM, Fjellstrom C, Lewin B, Andersson A.
Observed dietary intake in adults with intellectual disability
living in the community. Food Nutr Res 2008; 52: 1857, doi:
http://dx.doi.org/10.3402/fnr.v52i0.1857
19. Soler Marin A, Xandri Graupera JM. Nutritional status of
intellectual disabled persons with Down syndrome. Nutr Hosp
2011; 26: 1059�66.20. Vartanian LR, Schwartz MB, Brownell KD. Effects of soft
drink consumption on nutrition and health: a systematic review
and meta-analysis. Am J Public Health 2007; 97: 667�75.
21. Hsieh K, Rimmer JH, Heller T. Obesity and associated factors
in adults with intellectual disability. J Intellect Disabil Res 2014;
58: 851�63.22. Johnson C, Hobson S, Garcia AC, Matthews J. Nutrition and
food skills education for adults with developmental disabilities.
Can J Diet Pract Res 2011; 72: 7�13.23. Mesas AE, Guallar-Castillon P, Leon-Munoz LM, Graciani A,
Lopez-Garcia E, Gutierrez-Fisac JL, et al. Obesity-related
eating behaviors are associated with low physical activity and
poor diet quality in Spain. J Nutr 2012; 142: 1321�8.24. Humphries K, Traci MA, Seekins T. Nutrition and adults with
intellectual or developmental disabilities: systematic literature
review results. Intellect Dev Disabil 2009; 47: 163�85.25. Jenab M, Slimani N, Bictash M, Ferrari P, Bingham SA.
Biomarkers in nutritional epidemiology: applications, needs
and new horizons. Hum Genet 2009; 125: 507�25.26. Potischman N. Biologic and methodologic issues for nutritional
biomarkers. J Nutr 2003; 133: 875S�80S.27. Carlsen MH, Karlsen A, Lillegaard IT, Gran JM, Drevon CA,
Blomhoff R, et al. Relative validity of fruit and vegetable intake
estimated from an FFQ, using carotenoid and flavonoid biomar-
kers and the method of triads. Br J Nutr 2011; 105: 1530�8.28. Al-Delaimy WK, van Kappel AL, Ferrari P, Slimani N,
Steghens JP, Bingham S, et al. Plasma levels of six carotenoids
in nine European countries: report from the European Pro-
spective Investigation into Cancer and Nutrition (EPIC). Public
Health Nutr 2004; 7: 713�22.29. Brevik A, Andersen LF, Karlsen A, Trygg KU, Blomhoff R,
Drevon CA. Six carotenoids in plasma used to assess recom-
mended intake of fruits and vegetables in a controlled feeding
study. Eur J Clin Nutr 2004; 58: 1166�73.30. Hodson L, Skeaff CM, Fielding BA. Fatty acid composition of
adipose tissue and blood in humans and its use as a biomarker
of dietary intake. Prog Lipid Res 2008; 47: 348�80.31. Takkunen M, Agren J, Kuusisto J, Laakso M, Uusitupa M,
Schwab U. Dietary fat in relation to erythrocyte fatty acid
composition in men. Lipids 2013; 48: 1093�102.32. Fekete K, Marosvolgyi T, Jakobik V, Decsi T. Methods of
assessment of n-3 long-chain polyunsaturated fatty acid status
in humans: a systematic review. Am J Clin Nutr 2009; 89:
2070S�84S.33. Sun Q, Ma J, Campos H, Hankinson SE, Hu FB. Comparison
between plasma and erythrocyte fatty acid content as biomarkers
of fatty acid intake in US women. Am J Clin Nutr 2007; 86: 74�81.34. Morris CA. Introduction: Williams syndrome. Am J Med Genet
C Semin Med Genet 2010; 154C: 203�8.35. Hattori M, Fujiyama A, Taylor TD, Watanabe H, Yada T,
Park HS, et al. The DNA sequence of human chromosome 21.
Nature 2000; 405: 311�19.36. Cassidy SB, Schwartz S, Miller JL, Driscoll DJ. Prader-Willi
syndrome. Genet Med 2012; 14: 10�26.37. Melville CA, Cooper SA, McGrother CW, Thorp CF, Collacott
R. Obesity in adults with Down syndrome: a case-control study.
J Intellect Disabil Res 2005; 49: 125�33.38. Holland AJ, Treasure J, Coskeran P, Dallow J, Milton N,
Hillhouse E. Measurement of excessive appetite and metabolic
changes in Prader-Willi syndrome. Int J Obes Relat Metab
Disord 1993; 17: 527�32.39. Butler MG, Theodoro MF, Bittel DC, Donnelly JE. Energy
expenditure and physical activity in Prader-Willi syndrome:
comparison with obese subjects. Am J Med Genet A 2007; 143:
449�59.40. State MW, Dykens EM, Rosner B, Martin A, King BH.
Obsessive-compulsive symptoms in Prader-Willi and ‘‘Prader-
Willi-Like’’ patients. J Am Acad Child Adolesc Psychiatry 1999;
38: 329�34.
Dietary aspects related to health and obesity
Citation: Food & Nutrition Research 2015, 59: 25487 - http://dx.doi.org/10.3402/fnr.v59.25487 11(page number not for citation purpose)
41. Miller JL, Lynn CH, Shuster J, Driscoll DJ. A reduced-energy
intake, well-balanced diet improves weight control in children
with Prader-Willi syndrome. J Hum Nutr Diet 2013; 26: 2�9.42. Goldstone AP, Holland AJ, Hauffa BP, Hokken-Koelega AC,
Tauber M, speakers contributors at the Second Expert Meeting
of the Comprehensive Care of Patients with PWS. Recom-
mendations for the diagnosis and management of Prader-Willi
syndrome. J Clin Endocrinol Metab 2008; 93: 4183�97.43. Butler MG. Management of obesity in Prader-Willi syndrome.
Nat Clin Pract Endocrinol Metab 2006; 2: 592�3.44. Phillips AC, Holland AJ. Assessment of objectively measured
physical activity levels in individuals with intellectual disabilities
with and without Down’s syndrome. PLoS One 2011; 6: e28618.
45. Temple VA, Stanish HI. Pedometer-measured physical activity
of adults with intellectual disability: predicting weekly step
counts. Am J Intellect Dev Disabil 2009; 114: 15�22.46. Luke A, Sutton M, Schoeller DA, Roizen NJ. Nutrient intake
and obesity in prepubescent children with Down syndrome.
J Am Diet Assoc 1996; 96: 1262�7.47. Murray J, Ryan-Krause P. Obesity in children with Down
syndrome: background and recommendations for management.
Pediatr Nurs 2010; 36: 314�19.48. Holm VA, Cassidy SB, Butler MG, Hanchett JM, Greenswag
LR, Whitman BY, et al. Prader-Willi syndrome: consensus
diagnostic criteria. Pediatrics 1993; 91: 398�402.49. Preus M. The Williams syndrome: objective definition and
diagnosis. Clin Genet 1984; 25: 422�8.50. Noethlings U, Hoffmann K, Bergmann MM, Boeing H.
European Investigation into Cancer and Nutrition. Portion size
adds limited information on variance in food intake of partici-
pants in the EPIC-Potsdam study. J Nutr 2003; 133: 510�15.51. Holmen J TH, Langhammer A, Midthjell K, Krokstad S.
Somatic health. In: Public health development, the hunt study,
Norway. Trondheim, Norway: Hunt Forskningssenter; 2011,
pp. 17�64. Available from: http://www.ntnu.no/hunt/ [cited 30
June 2014].
52. Statistics Norway (2013). Health, care and social relations,
survey on living conditions, 2012. Statistics Norway. Available
from: http://www.ssb.no [cited 9 July 2014].
53. Adams GN, Schmaier AH. The Williams-Beuren Syndrome-a
window into genetic variants leading to the development of
cardiovascular disease. PLoS Genet 2012; 8: e1002479.
54. Wang L, Manson JE, Gaziano JM, Buring JE, Sesso HD. Fruit
and vegetable intake and the risk of hypertension in middle-aged
and older women. Am J Hypertens 2012; 25: 180�9.55. Borel P, Moussa M, Reboul E, Lyan B, Defoort C, Vincent-
Baudry S, et al. Human plasma levels of vitamin E and
carotenoids are associated with genetic polymorphisms in genes
involved in lipid metabolism. J Nutr 2007; 137: 2653�9.56. Young T, Apfeldorf W, Knepper J, Yager J. Severe eating
disorder in a 28-year-old man with William’s syndrome. Am J
Psychiatry 2009; 166: 25�31.57. de Koning L, Malik VS, Rimm EB, Willett WC, Hu FB. Sugar-
sweetened and artificially sweetened beverage consumption
and risk of type 2 diabetes in men. Am J Clin Nutr 2011; 93:
1321�7.58. Tahmassebi JF, Duggal MS, Malik-Kotru G, Curzon ME.
Soft drinks and dental health: a review of the current literature.
J Dent 2006; 34: 2�11.59. Mann J, Zhou H, McDermott S, Poston MB. Healthy behavior
change of adults with mental retardation: attendance in a health
promotion program. Am J Ment Retard 2006; 111: 62�73.60. Melville CA, Hamilton S, Miller S, Boyle S, Robinson N,
Pert C, et al. Carer knowledge and perceptions of healthy
lifestyles for adults with intellectual disabilities. J Appl Res
Intellect Disabil 2009; 22: 298�306.61. Ptomey LT, Willis EA, Goetz JR, Lee J, Sullivan DK, Donnelly
JE. Digital photography improves estimates of dietary intake in
adolescents with intellectual and developmental disabilities.
Disabil Health J 2015; 8: 146�50.62. Humphries K, Traci MA, Seekins T. Food on film: pilot test
of an innovative method for recording food intake of adults
with intellectual disabilities living in the community. J Appl Res
Intellect Disabil 2008; 21: 168�73.
*Marianne Nordstrøm
Frambu Resource Centre for Rare Disorders
Sandbakkveien 18,
NO-1404 Siggerud, Norway
Email: [email protected]
Marianne Nordstrøm et al.
12(page number not for citation purpose)
Citation: Food & Nutrition Research 2015, 59: 25487 - http://dx.doi.org/10.3402/fnr.v59.25487

III

1
Title
The prevalence of metabolic risk factors of atherosclerotic cardiovascular disease in
Williams syndrome, Prader-Willi syndrome and Down syndrome
Running Title
Risk of atherosclerotic cardiovascular disease
Marianne Nordstrøm, MS1,2*, Benedicte Paus, MD, PhD3,4, Kjetil Retterstøl MD, PhD2,5,
Svein O Kolset, PhD2
Marianne Nordstrøm; e-mail: [email protected]; phone: +47 64856047
Benedicte Paus; e-mail: [email protected]; phone: +47 23075580
Kjetil Retterstøl; e-mail: [email protected] ; phone: +47 22851521
Svein Olav Kolset ; e-mail: [email protected] ; phone : +47 22851383
1Frambu Resource Centre for Rare Disorders, Sandbakkveien 18,1404 Siggerud, Norway.
2University of Oslo, Institute of Basic Medical Sciences, Department of Nutrition, P.O Box
1046 Blindern, 0317 Oslo, Norway.
3Oslo University Hospital, Department of Medical Genetics, P.O Box 4950 Nydalen, 0424
Oslo, Norway
4University of Oslo, Institute of Clinical Medicine, P.O Box 1046 Blindern, 0317 Oslo,
Norway.

2
5Oslo University Hospital, Lipid Clinic, Department of Medicine, P.O Box 4950 Nydalen,
0424 Oslo, Norway.
*Corresponding Author:
Marianne Nordstrøm
Frambu Resource Centre for Rare Disorders, Sandbakkveien 18, 1404 Siggerud, Norway
Phone: +47 64856047
Fax: +47 64856099
E-mail: [email protected]
This study was funded by the ExtraStiftelsen and the Throne Holst Foundation. The founding
sources had no involvement in study design, interpretation of data or writing of the
manuscript. The authors declare no conflict of interests.
ACKNOWLEDGEMENTS
The authors thank HUNT Research Centre for their collaboration and contribution of data
from the HUNT-3 study. In addition, we would like to express our gratitude to Rita S. Stige,
Kari Stenslie, Gro Trae, Kari Hagen and Annicke Stranda for their contributions during data
collection.

3
ABSTRACT
Background
Risk of atherosclerotic cardiovascular disease (CVD) and association with abdominal obesity
have not been extensively studied in genetic syndromes associated with intellectual disability.
Methods
A cross-sectional study was conducted in individuals’ age 20-43 years with Williams
syndrome (WS) (n=21), Prader-Willi syndrome (PWS) (n=20) and Down syndrome (DS)
(n=31). Established metabolic risk factors of CVD were assessed.
Results
High prevalence of hypertension and type 2 diabetes was seen in the PWS group, whereas low
prevalence rates were found in DS. In WS, we found a high prevalence of hypertension and
indication of increased risk of type 2 diabetes, combined with better blood lipid profile.
Abdominal obesity was prevalent in all three subgroups and was associated with an increased
risk of hypertension and metabolic syndrome.
Conclusion
PWS and WS had increased risk of CVD. In order to prevent CVD in these groups, regular
assessments of the known risk factors are recommended.
KEYWORDS
Atherosclerosis, cardiovascular disease, abdominal obesity, hypertension, type 2 diabetes

4
INTRODUCTION
Atherosclerotic cardiovascular disease (CVD) is an important cause of death also in
individuals with intellectual disability (ID) (Heslop, 2013). Different groups with ID share
common health challenges, many of which are related to lifestyle such as high prevalence of
inactivity (Nordstrom, Hansen, Paus, & Kolset, 2013; Phillips & Holland, 2011). Even so,
from a genetic point of view they represent a heterogeneous group with distinct patterns of
comorbidities, possibly also with variability in risk of CVD.
Williams syndrome (WS, Williams-Beuren syndrome), Prader-Willi syndrome (PWS), and
Down syndrome (DS) are genetically determined conditions associated with mild to moderate
ID. The estimated prevalence of the conditions varies from 1:7500 in WS (Stromme,
Bjornstad, & Ramstad, 2002), to 1:25.000 in PWS (Smith et al., 2003), and 1:1200 in DS
(Presson et al., 2013).
WS is caused by a microdeletion of genes on chromosome 7q11.23, typically affecting 26-28
genes including the elastin coding gene, ELN (Pober, 2010). The lack of functional elastin in
WS (Nickerson, Greenberg, Keating, McCaskill, & Shaffer, 1995), is linked to development
of congenital cardiovascular abnormalities, observed in about 80 % of the patients. The
structural cardiovascular irregularity most often includes some form of arterial stenosis
(Adams & Schmaier, 2012; Collins, 2013; Del Pasqua et al., 2009). Furthermore, elastin
insufficiency may lead to vascular stiffness and development of hypertension (Kozel et al.,
2014), which is reported to occur in 40-55 % of young adults (Broder et al., 1999; Eronen et
al., 2002). In contrast, loss in functional copies of the NCF1 gene, which is one of the genes
variably deleted in WS, may have a protective effect against hypertension (Del Campo et al.,
2006; Kozel et al., 2014). Diabetes and impaired glucose tolerance is reported in 63-75 % of
adult persons with WS (Masserini et al., 2013; Pober et al., 2010). The syntaxin-1A gene and
MLXIPL gene, located in the 7q11.23-region, are suspected to be involved in the abnormal

5
glucose regulation reported in WS (Pober et al., 2010). Previously, a 25-100 times higher risk
of sudden cardiac death has been described in WS (Wessel et al., 2004).
PWS is due to lack of paternal expression of genes in the 15q11-q13-region caused by
deletion, maternal uniparental disomy 15, or an imprinting defect (M. G. Butler, 2011).
Clinical hallmarks of the condition include neonatal hypotonia, later hyperphagia and several
endocrine disturbances, such as growth hormone deficiency, hypogonadism and central
adrenal insufficiency (Cassidy, Schwartz, Miller, & Driscoll, 2012). The prevalence of
hypertension in persons with PWS is reported to range from 9-21 %, diabetes in 15-24 %, and
metabolic syndrome and dyslipidemia in 35 %, respectively. All factors were shown to be
associated with obesity (J. V. Butler et al., 2002; Grugni et al., 2012; Hoybye, Hilding,
Jacobsson, & Thoren, 2002; Sinnema et al., 2011; Sode-Carlsen et al., 2010). High risk of
obesity is recognized in PWS and a low-energy diet combined with rigorous food supervision
in combination with regular physical activity is recommended for prevention and treatment of
obesity (Goldstone et al., 2008). In PWS, a high premature mortality rate due to
cardiorespiratory complications has been described (Grugni et al., 2008)
DS is caused by an extra copy or major portion of chromosome 21 (Hattori et al., 2000).
Congenital heart defect is prevalent with atrioventricular and ventricular septal defects as the
most common features (Weijerman et al., 2010). DS has been associated with several risk
factors of CVD, including inactivity, high risk of obesity, and insulin resistance (Melville,
Cooper, McGrother, Thorp, & Collacott, 2005; Nordstrom et al., 2013; Real de Asua, Parra,
Costa, Moldenhauer, & Suarez, 2014). However, most persons with DS have low blood
pressure (Draheim, McCubbin, & Williams, 2002), and reduced formation of atherosclerotic
lesions in adult age (Draheim, Geijer, & Dengel, 2010). The biological mechanisms behind
this remain unknown. It has been suggested that lower levels of homocysteine due to higher

6
dosage of the gene, cystathionine beta synthase, contribute to the reduced development of
atherosclerosis (Vis et al., 2009).
Persons with mild to moderate ID have increased risk of developing obesity (Melville,
Hamilton, Hankey, Miller, & Boyle, 2007). Waist circumference (WC) provides information
about body shape and abdominal obesity, and WC has good predictive abilities for obesity-
related health risks (Janssen, Katzmarzyk, & Ross, 2004). In addition, WC is an easy tool to
use in clinical practices. Currently, few studies have investigated the association between
excessive abdominal fat mass and risk factors of CVD in specific conditions associated with
ID.
In this study we aimed 1) to explore the prevalence of metabolic risk factors of CVD in adults
with three different genetic conditions, and compare the prevalence rates in the included
groups to those in the general population, and 2) to investigate the associations between
abdominal obesity and the CVD risk factors. Our hypothesis was that persons with WS and
PWS have increased risk of CVD, whereas persons with DS display reduced CVD risk.
Furthermore, we hypothesized that abdominal obesity was associated with increased risk of
CVD in the investigated groups with ID.
METHODS
Participants
Information about the study was posted on a study-specific website and was spread in
collaboration with relevant nationwide patient organizations. Recruitment was performed
using a convenient sampling frame. Inclusion criteria were diagnosis with DS, WS or PWS,
age between 16-45 years, and returned consent forms to participate, signed by both the
participant and legal guardian/parent. All participants who returned a signed consent form

7
were invited to participate. A total of 96 participants from all over Norway took part in the
study. Seventy-two participants were included in the final analyses, after excluding 15
participants younger than 20 years of age, to facilitate a comparison of results to prevalence
data from a Norwegian cohort study. Furthermore, nine participants were excluded due to
negative results from laboratory genetic testing and assessment of clinical criteria. In total, 80 %
of the participants had their genetic condition verified by molecular testing, and the rest by
use of standard clinical methods. No participants reported any previous atherosclerotic CVD.
More information about characteristics of the study populations are presented in Table 1. The
Regional Committee for Medical and Health Research Ethics, Southeast Region provided
ethical approval for the study, with reference number 2012/140.
Data collection
We used an electronic questionnaire to collect demographic data, information on smoking
habits, alcohol consumption, current use of medication, information about previous diagnosis
of dyslipidemia, diabetes, hypertension and metabolic syndrome, medical history of coronary
heart disease and cerebrovascular disease. The participants, together with an employed
caregiver or parent, used a computer to fill out the questionnaire. Intakes of medication were
later categorized in accordance with their primary cause of prescription. Their alcohol intake
was collected in categories of: Never or less than once a month, 1-3 times a month, 1-2 times
a week, 3 times a week or more, and units of alcohol consumed on each occasion was
recorded.
Laboratory data
Blood samples were collected in the morning after overnight fasting and samples for plasma
and serum were centrifuged within 2 h. Analysis of hemoglobin A1c (HbA1c), total
cholesterol (cholesterol), high density lipoprotein (HDL) cholesterol, triglycerides (TG),

8
thyroid stimulating hormone (TSH), and free T4 was performed in fresh blood samples in
accordance with standard protocols at the clinical laboratory of the regional university
hospital. Low density lipoprotein (LDL) cholesterol was calculated using the Friedewald
formula. Determination of apolipoprotein A1 (apo A1), apolipoprotein B (apo B), lipoprotein
(a) (Lp (a)) was performed on heparin plasma after two freeze and thaw cycles with the use of
immunoturbidimetric assays. Lower sensitivity range for Lp (a) was 60 mg/l and values below
this were recorded as 50 mg/l.
Blood pressure
Blood pressure was measured by trained testing personnel according to recommendations
provided by the American Heart Association Council on high blood pressure research
(Pickering et al., 2005). An upper arm automatic blood pressure device with oscillometric
measurement technique was used (Microlife BP A100 Plus, Microlife, Widnau, Switzerland).
Participants were familiarized with blood pressure measurements and screened for differences
in blood pressure between the arms on day one of the data collection. The next day
measurements were taken three times with one minute intervals in between, after at least 10
minutes of rest prior to measurement. A mean of these three measurements was then
calculated and recorded. Measurements were taken in the arm with the highest pressure
recorded in the screening or, if no difference was observed, in the dominant arm. The mean
deviance in the measures was 4.9 mmHg in systolic and 4.8 mmHg in diastolic blood pressure.
Body composition
Body composition measurements were taken in light clothing with bare feet. WC was
measured twice by stretch-resistant tape (Seca, Birmingham, UK), with tape emphasized to be
horizontal, and the person placed in an upright position. Measurements were taken directly on
the skin, at the midpoint between the lowest rib and iliac crest after exhalation, and were

9
recorded at the nearest 0.1 cm. If the measurements differed more than 1.0 cm, a third
measurement was taken to determine which was the most reliable. An average of the two
recorded measurements was calculated and used.
Prevalence of metabolic risk factors in the general population
To facilitate a comparison of the included groups to the general Norwegian population,
prevalence data for the different metabolic risk factors was obtained from the HUNT 3 Study.
This is a large Norwegian cohort study with data collected from about 14,000 participants in
the age range of 20-43 years. The HUNT 3 survey is the latest data collection and was carried
out from 2006 to 2008 (Krokstad et al., 2013).
Definition of metabolic risk factors
Hypercholesterolemia was defined as serum total cholesterol ≥ 5.0 mmol/l and serum LDL
cholesterol ≥ 3.0 mmol/l or use of lipid-lowering medication (Perk et al., 2012). No
information about LDL cholesterol was available from the HUNT 3 study. Increased total
cholesterol was defined as total cholesterol ≥ 5.0 mmol/l, and used for comparison to the
general population. Increased total cholesterol: HDL cholesterol ratio was defined as ≥ 5
(Norheim, 2009).
Metabolic syndrome was defined if participants had three or more of the following criteria:
WC ≥94 cm for males and ≥ 80 cm for females; serum triglycerides ˃ 1.7 mmol/l; serum
HDL-cholesterol <1.0 mmol/l for males and <1.3 mmol/l for females; mean systolic blood
pressure of ≥130 mmHg and/or mean diastolic blood pressure of ≥85 mmHg or use of
antihypertensive medication; HbA1c ˃ 6.0 % or use of glucose-lowering medication (Alberti
et al., 2009; Nathan et al., 2008). In the general population; serum glucose > 7.8 mmol/l or
use of glucose-lowering medication replaced the above described HbA1c dependent criteria.

10
Diabetes was defined as HbA1c ≥6.5 % or previously diagnosed with diabetes and use of
glucose-lowering medication (The International Expert Committee, 2009). In the general
population diabetes was defined as serum glucose >11.1 mmol/l or previously diagnosed with
diabetes and use of glucose-lowering medication (The Expert Committee on the Diagnosis
and Classification of Diabetes Mellitus., 1997).
Hypertension was defined as mean systolic blood pressure ≥140 mmHg and/or mean diastolic
blood pressure ≥90 mmHg and/or use of antihypertensive medication (angiotensin II- receptor
antagonists, calcium antagonists or ACE-inhibitors) (James et al., 2014). Persons using
monotherapy with β-blockers were defined as having hypertension only if they reported
previous diagnoses of hypertension (n=1).
Abdominal fat mass was categorized by use of the recommended cut-point for Caucasians,
where WC ≥ 94 cm for males and ≥ 80 cm for females were defined as increased WC. WC ≥
102 cm for males and ≥ 88 cm for females were defined as abdominal obesity (World Health
Organization, 2000).
Statistical analysis
Initially, one-way analysis of variance (ANOVA) and Person’s chi-square test were used to
identify differences between the subgroups. All measured biochemical and physical variables
were checked for missing data, descriptive statistics calculated, and normality assessed. The
values in the subgroups were compared by use of ANOVA, or if normality was violated by
use of Kruskal-Wallis test. The proportions of persons fulfilling the criteria of the metabolic
risk factors were explored in contingency tables in subgroups based on genetic diagnosis. We
used Pearson’s chi-square tests to investigate differences in prevalence of risk factors between
genetic subgroups. For the comparison of increased total cholesterol: HDL cholesterol ratio,
only the PWS and DS group was included. Similarly, in hypertension only the WS and PWS

11
groups were compared. Furthermore, in prevalence of type 2 diabetes, due to low numbers we
used Fishers exact test to compare the WS group to the PWS group only. To compare the
prevalence rates of the metabolic risk factors of the included subgroups to those of the general
population, we calculated relative risk estimates for all three subgroups.
The associations between abdominal obesity and metabolic risk factors were investigated
using Pearson’s chi-square test. To ensure test validity a combined group of those with
normal WC and increased WC was used in comparison to abdominal obesity. In comparing
individuals with and without abdominal obesity, independent t-tests were used in measured
systolic and diastolic blood pressure. Prior to analysis, proportions using antihypertensive
medication in the groups were investigated. As the proportion using medication was equal in
the WC category groups, analysis was not corrected for use of medication. All statistical
analyses were performed using SPSS 22 (SPSS Inc., Chicago, IL, USA).
RESULTS
As shown in Table 1, there was a difference in age between the subgroups. Individuals with
WS were the oldest and those with DS the youngest. Among participants with DS, fewer lived
in community residences with support, compared to the WS and PWS group. Alcohol
consumption was low and all participants who reported drinking alcohol had an intake equal
to 1-2 units when alcohol was consumed. Few in the study population smoked. Furthermore,
analyses on biochemical and physical parameters were performed (Table 2). Thyroid-related
disorders were frequently reported and thyroid substitution therapy was used by 17
participants in the study population (Table 1). No participants had low levels of free T4 at
evaluation, but approximately 20 % in all three genetic subgroups were found to present
mildly elevated TSH levels and subclinical hypothyroidism. Nine participants with PWS were
on growth hormone therapy, but there were no significant differences in the measured
12
parameters (Table 2) when participants using growth hormone were compared to participants
without growth hormone treatment.
The prevalence of metabolic risk factors of CVD in the genetic conditions is presented in
Table 3A, and the prevalence rates from the general population in Table 3B. To investigate
possible differences between the subgroups, established metabolic risk factors were compared
both between the groups and with data from the general population. No differences in
prevalence of hypercholesterolemia or increased total cholesterol were evident when the three
subgroups were compared. In addition, no difference in prevalence of increased total
cholesterol was detected when we compared the subgroups to the general population, relative
risk (RR) 1.3, 95 % CI (0.93; 1.82), p=0.19 in the WS group, RR 1.2, 95 % CI (0.78; 1.7),
p=0.50 in the PWS group, and RR 1.2, 95 % CI (0.84; 1.6), p=0.41 in the DS group. A better
blood lipid profile, as indicated by higher HDL cholesterol and Apo A1 levels, and reduced
Apo B levels, total cholesterol: HDL cholesterol ratio, and Apo B: Apo A1 ratio (Table 2),
was evident when the WS group was compared to the PWS and DS groups. Furthermore,
reduced prevalence of increased total cholesterol: HDL cholesterol ratio was noted, (RR) 0.2,
95 % CI (0.02; 1.3), but this difference was not significant, p=0.07, when the WS group was
compared to the general population. In addition to this, we observed a high risk of
hypertension in the WS group, RR 4.8, 95 % CI (3.2; 7.2), p<0.001, and in the PWS group,
RR 2.7, 95 % CI (1.4; 5.3), p=0.007, when compared to prevalence in the general population.
Low prevalence of hypertension was observed in the DS group and lower levels in systolic
and diastolic blood pressure were measured when compared to the WS group and the PWS
group (Table 2). When the prevalence of metabolic syndrome was compared, no differences
between the diagnosis-groups were detected or when compared to the general population.
However, increased risk of type 2 diabetes was evident in the PWS group when compared to
the general population, RR 3.2, 95 % CI (1.0; 8.5), p=0.04. Furthermore, increased risk of
13
type 2 diabetes, although not significant, was also noted in the WS group, RR 3.0, 95 % CI
(0.93; 10.7), p=0.05, when compared to the general population. Low prevalence of type 2
diabetes was observed in the DS group.
Excessive abdominal fat mass was common in all three groups and there were no significant
differences in prevalence of increased WC and abdominal obesity when the subgroups were
compared to each other (Table 3A). Even so, in the WS group mean measured WC was
reduced compared to the other two groups (Table 2). Accordingly, in comparison with the
general population, elevated risk of increased WC was seen in the PWS group, RR 1.5, 95 %
CI (1.3; 1.7), p=0.007 and in the DS group, RR 1.3, 95 % CI (1.1; 1.6), p=0.02, but not in the
WS group. Moreover, we observed an increased risk of abdominal obesity in all included
subgroups when compared to the general population, with RR 1.8, 95 % CI (1.3; 2.5),
p=0.008 in the WS group, RR 2.3, 95 % CI (1.9; 2.9), p<0.001 in the PWS group, and 1.9, 95 %
CI (1.5; 2.4), p<0.001 in the DS group.
To investigate the association between abdominal obesity and the other risk factors presented,
all individuals with abdominal obesity were compared to a combined group of participants
with normal and increased WC. The mean age and gender distribution were similar in the
subgroups based on WC. Using the chi-square test, we found abdominal obesity to be
associated with hypertension, p=0.04, and metabolic syndrome, p=0.03.
In addition, abdominal obesity was associated with a mean increase in systolic blood pressure
of 13.0 mmHg, 95 % CI (5.4; 20.8), p=0.001, and mean increase in diastolic blood pressure of
7.6 mmHg, 95 % CI (2.1; 13.1), p=0.007. As shown in Figures 1A and 1B, WS was the
subgroup with the largest difference in measured systolic and diastolic blood pressure when
persons with abdominal obesity were compared to persons with normal and increased WC.

14
DISCUSSION
In this study we describe diversity in CVD risk profile between the included genetic
syndromes, and we found an increased risk of CVD in the PWS group and WS groups. High
prevalence of hypertension and type 2 diabetes was seen in the PWS group, whereas low
prevalence rates were found in DS. High prevalence of hypertension and a clear indication of
increased risk of type 2 diabetes were also seen in the WS group, combined with a better
blood lipid profile. Abdominal obesity was prevalent in all three subgroups and associated
with increased risk of CVD. The described elevated risk for development of CVD in the PWS
and the WS groups, are supported by previous reports of high premature mortality rate due to
cardiorespiratory complications and sudden cardiac deaths in these groups (Grugni et al.,
2008; Wessel et al., 2004). Hence, these data highlights the importance of identifying risk
factors of CVD, and persons within these groups at particular risk.
The prevalence of hypertension that we observed in the PWS group was higher than
previously reported (Hoybye et al., 2002; Sinnema et al., 2011). However, the latter reports
were based on younger individuals or relied on questionnaire-reported hypertension, which
may explain the differences observed. Apart from this, the prevalence rates of CVD risk
factors and the association with abdominal obesity in this study, were in accordance to
previous reports (J. V. Butler et al., 2002; Grugni et al., 2012; Hoybye et al., 2002; Sinnema
et al., 2011). One strength of this study is the use of biochemical and physical measures which
contrast with several previous reports that use questionnaires or interviews (J. V. Butler et al.,
2002; Sinnema et al., 2011). Furthermore, we assessed several established metabolic risk
factors, and observed multiple elevated metabolic risk factors. This finding elucidates that
individuals with PWS may benefit from regular assessment of their overall CVD risk.

15
Individuals with PWS have an extremely high risk of developing obesity due to the
hyperphagic behavior (Holland et al., 1993). The fat mass in PWS is mainly located
subcutaneously and is therefore accompanied by less adverse metabolic effects (Sode-Carlsen
et al., 2010). Even so, in this study elevated risk of metabolic complications was noted in
obese persons with PWS when compared to lean individuals. The large proportion with
abdominal obesity that was observed supports the need for lifelong strategies to reduce
morbid obesity in the PWS group. Controlled energy-restricted diets are essential and
macronutrient balanced diets combined with rich intakes of fiber have shown better body
weight outcomes compared to simple energy-restricted diets (Miller, Lynn, Shuster, &
Driscoll, 2013).
Trials with growth hormone treatment have indicated positive effects on blood lipids, body
composition measures and physical activity levels in PWS (M. G. Butler et al., 2013; Sode-
Carlsen et al., 2012; van der Klaauw et al., 2006). Possible adverse effects on glucose
regulation with an increased risk of insulin resistance have also been observed, and are
probably related to a normalization of fat mass distribution during treatment (Jorgensen et al.,
2014). In this study there were no significant differences in the levels of the measured
parameters between persons using and not using growth hormones. However, the study was
not designed for evaluation of potential effects of growth hormone treatment, and hence
probably lacks statistical power to evaluate any positive or adverse treatment effects.
Blood lipids have previously not been described in any great extent in adults with WS. We
found more favorable blood lipid profiles among persons in the WS group when compared to
the two other included subgroups. Indications of a higher level of physical activity among
males with WS compared to the two other groups have been reported and could be part of the
explanation of the difference observed (Nordstrom et al., 2013). A clear tendency of elevated
risk of type 2 diabetes was observed in WS and this was in line with the descriptions of a high

16
prevalence of type 2 diabetes and glucose intolerance in this group and linked to the genetic
hemizygozity in the 7q11.23-region (Pober et al., 2010). In addition, a high prevalence of
hypertension was observed. Previously, genetic alterations linked to the risk of hypertension
have been described (Kozel et al., 2014). A new perspective in this study was the described
association between abdominal obesity and an increase in blood pressure. The WS group was
the subgroup with the largest measured effect on blood pressure by abdominal obesity. This
indicates that abdominal obesity may be an important intervention target in prevention of
CVD among individuals in this vulnerable group.
In DS, the reduced risk of hypertension and the development of atherosclerosis are well
documented (Draheim et al., 2010; Draheim et al., 2002). Recently, abdominal obesity in DS
was demonstrated as being associated with an increased risk of insulin resistance and with
small non-significant adverse effects on blood lipids (Real de Asua et al., 2014). Our results
supports an increased risk associated with abdominal obesity, as abdominal obesity was found
to be accompanied with increased risk of metabolic syndrome.
Increased susceptibility to a variety of autoimmune disorders is described in DS. These
include type 1 diabetes and thyroid autoimmunity most often manifested as hypothyroidism
(Goldacre, Wotton, Seagroatt, & Yeates, 2004). No individuals with type 1 diabetes
participated and no participants with untreated hypothyroidism were detected. Even so,
subclinical hypothyroidism was noted in a relatively large subpopulation of all the included
genetic syndromes. Hypothyroidism and subclinical hypothyroidism are often accompanied
by serum lipid concentrations associated with increased risk of CVD, which can be improved
through thyroid replacement therapy (Asvold, Vatten, Nilsen, & Bjoro, 2007; Cappola &
Ladenson, 2003). Therefore, it may be important to monitor the thyroid function on a regular
basis for optimal long-term prevention of CVD in these genetic conditions.

17
This study has limitations. The small study sample, low statistical power and recruiting
procedure make the study explorative and hypothesis generating, rather than conclusive.
However, a low number of participants is a general challenge for studies on rare conditions,
and in this study about one third of the known Norwegian population of WS and PWS in the
relevant age category participated. Nevertheless, the low number of participants limits the
statistical procedures and increases the risk of type II errors. Unfortunately, statistical
corrections of potential confounders, such as diversity in living arrangements and age, were
difficult to perform when the diagnoses were compared. This may have influenced the results.
Furthermore, in comparison to the general population, there were some differences in time of
data collection, methodology, and available measured parameters. These differences include
non-fasting blood samples and lack of information about HbA1c values in the general
population, and also lack of information about blood glucose in the genetic subgroups. This
resulted in some differences in definitions of the metabolic risk factors used between the
study population and the general population. Although this comparison must be interpreted
with caution, the data presented does provide important information on the CVD risk profile
in the genetic conditions.
CONCLUSIONS
Heterogeneity in risk of CVD was observed between the included genetic conditions. PWS
and WS were found to have an increased risk of CVD, whereas DS was associated with
reduced risk. Abdominal obesity was prevalent and closely associated with important
metabolic risk factors in all three groups, suggesting a link between abdominal obesity and
increased CVD risk in the studied groups as is established in people without ID. In order to
identify and treat individuals at high CVD risk, regular assessment of the overall risk of CVD
is warranted in adult persons with PWS and WS.
18
CONFLICT OF INTEREST
None
REFERENCES
Adams, G. N., & Schmaier, A. H. (2012). The Williams-Beuren Syndrome-a window into
genetic variants leading to the development of cardiovascular disease. PLoS Genetics,
8(2), e1002479. doi: 10.1371/journal.pgen.1002479
Alberti, K. G., Eckel, R. H., Grundy, S. M., Zimmet, P. Z., Cleeman, J. I., Donato, K.
A., . . .Smith, S.C.Jr. (2009). Harmonizing the metabolic syndrome: a joint interim
statement of the International Diabetes Federation Task Force on Epidemiology and
Prevention; National Heart, Lung, and Blood Institute; American Heart Association;
World Heart Federation; International Atherosclerosis Society; and International
Association for the Study of Obesity. Circulation, 120(16), 1640-1645. doi:
10.1161/CIRCULATIONAHA.109.192644
Asvold, B. O., Vatten, L. J., Nilsen, T. I., & Bjoro, T. (2007). The association between TSH
within the reference range and serum lipid concentrations in a population-based study.
The HUNT Study. European Journal of Endocrinology, 156(2), 181-186. doi:
10.1530/eje.1.02333
Broder, K., Reinhardt, E., Ahern, J., Lifton, R., Tamborlane, W., & Pober, B. (1999).
Elevated ambulatory blood pressure in 20 subjects with Williams syndrome. American
Journal of Medical Genetics, 83(5), 356-360.
Butler, J. V., Whittington, J. E., Holland, A. J., Boer, H., Clarke, D., & Webb, T. (2002).
Prevalence of, and risk factors for, physical ill-health in people with Prader-Willi
syndrome: a population-based study. Developmental Medicine and Child Neurology,
44(4), 248-255.

19
Butler, M. G. (2011). Prader-Willi Syndrome: Obesity due to Genomic Imprinting. Current
Genomics, 12(3), 204-215. doi: 10.2174/138920211795677877
Butler, M. G., Smith, B. K., Lee, J., Gibson, C., Schmoll, C., Moore, W. V., & Donnelly, J. E.
(2013). Effects of growth hormone treatment in adults with Prader-Willi syndrome.
Growth Hormone and IGF Research. doi: 10.1016/j.ghir.2013.01.001
Cappola, A. R., & Ladenson, P. W. (2003). Hypothyroidism and atherosclerosis. Journal of
Clinical Endocrinology and Metabolism, 88(6), 2438-2444. doi: 10.1210/jc.2003-
030398
Cassidy, S. B., Schwartz, S., Miller, J. L., & Driscoll, D. J. (2012). Prader-Willi syndrome.
Genetics in Medicine, 14(1), 10-26. doi: 10.1038/gim.0b013e31822bead0
Collins, R. T., 2nd. (2013). Cardiovascular disease in williams syndrome. Circulation,
127(21), 2125-2134. doi: 10.1161/CIRCULATIONAHA.112.000064
Del Campo, M., Antonell, A., Magano, L. F., Munoz, F. J., Flores, R., Bayes, M., & Perez
Jurado, L. A. (2006). Hemizygosity at the NCF1 gene in patients with Williams-
Beuren syndrome decreases their risk of hypertension. American Journal of Human
Genetics, 78(4), 533-542. doi: 10.1086/501073
Del Pasqua, A., Rinelli, G., Toscano, A., Iacobelli, R., Digilio, C., Marino, B., . . . de Zorzi, A.
(2009). New findings concerning cardiovascular manifestations emerging from long-
term follow-up of 150 patients with the Williams-Beuren-Beuren syndrome.
Cardiology in the Young, 19(6), 563-567. doi: 10.1017/S1047951109990837
Draheim, C. C., Geijer, J. R., & Dengel, D. R. (2010). Comparison of intima-media thickness
of the carotid artery and cardiovascular disease risk factors in adults with versus
without the Down syndrome. American Journal of Cardiology, 106(10), 1512-1516.
doi: 10.1016/j.amjcard.2010.06.079

20
Draheim, C. C., McCubbin, J. A., & Williams, D. P. (2002). Differences in cardiovascular
disease risk between nondiabetic adults with mental retardation with and without
Down syndrome. American Journal of Mental Retardation, 107(3), 201-211. doi:
10.1352/0895-8017(2002)107<0201:DICDRB>2.0.CO;2
Eronen, M., Peippo, M., Hiippala, A., Raatikka, M., Arvio, M., Johansson, R., & Kahkonen,
M. (2002). Cardiovascular manifestations in 75 patients with Williams syndrome.
Journal of Medical Genetics, 39(8), 554-558.
Goldacre, M. J., Wotton, C. J., Seagroatt, V., & Yeates, D. (2004). Cancers and immune
related diseases associated with Down's syndrome: a record linkage study. Archives of
Disease in Childhood, 89(11), 1014-1017. doi: 10.1136/adc.2003.046219
Goldstone, A. P., Holland, A. J., Hauffa, B. P., Hokken-Koelega, A. C., Tauber, M., &
speakers contributors at the Second Expert Meeting of the Comprehensive Care of
Patients with, P. W. S. (2008). Recommendations for the diagnosis and management
of Prader-Willi syndrome. Journal of Clinical Endocrinology and Metabolism, 93(11),
4183-4197. doi: 10.1210/jc.2008-0649
Grugni, G., Crino, A., Bedogni, G., Cappa, M., Sartorio, A., Corrias, A., . . . Brambilla, P.
(2012). Metabolic syndrome in adult patients with Prader-Willi syndrome. Nutrition,
Metabolism and Cardiovascular Diseases Dis. doi: 10.1016/j.numecd.2012.11.006
Grugni, G., Crino, A., Bosio, L., Corrias, A., Cuttini, M., De Toni, T., . . . Chiumello, G.
(2008). The Italian National Survey for Prader-Willi syndrome: an epidemiologic
study. American Journal of Medical Genetics, 146(7), 861-872. doi:
10.1002/ajmg.a.32133
Hattori, M., Fujiyama, A., Taylor, T. D., Watanabe, H., Yada, T., Park, H. S., . . . Yaspo, M.L.
(2000). The DNA sequence of human chromosome 21. Nature, 405(6784), 311-319.
doi: 10.1038/35012518

21
Heslop, P. B., P. Flemming, P. Hoghton, M. Marriott, A. Russ, L. (2013). Confidential
Inquiry into premature deaths of people with learning disabilities (CIPOLD) (pp. 1-
133): Norah Fry Research Centre.
Holland, A. J., Treasure, J., Coskeran, P., Dallow, J., Milton, N., & Hillhouse, E. (1993).
Measurement of excessive appetite and metabolic changes in Prader-Willi syndrome.
International Journal of Obesity and Related Metabolic Disorders, 17(9), 527-532.
Hoybye, C., Hilding, A., Jacobsson, H., & Thoren, M. (2002). Metabolic profile and body
composition in adults with Prader-Willi syndrome and severe obesity. Journal of
Clinical Endocrinology and Metabolism, 87(8), 3590-3597. doi:
10.1210/jcem.87.8.8735
James, P. A., Oparil, S., Carter, B. L., Cushman, W. C., Dennison-Himmelfarb, C., Handler,
J., . . . Ortiz, E. (2014). 2014 evidence-based guideline for the management of high
blood pressure in adults: report from the panel members appointed to the Eighth Joint
National Committee (JNC 8). JAMA, 311(5), 507-520. doi:
10.1001/jama.2013.284427
Janssen, I., Katzmarzyk, P. T., & Ross, R. (2004). Waist circumference and not body mass
index explains obesity-related health risk. American Journal of Clinical Nutrition,
79(3), 379-384.
Jorgensen, A. P., Ueland, T., Sode-Carlsen, R., Schreiner, T., Rabben, K. F., Farholt, S., . . .
Bollerslev, J. (2014). Glucose homeostasis in adults with Prader-Willi syndrome
during treatment with growth hormone: Results from a 12-month prospective study.
Growth Hormone and IGF Research, 24(1), 16-21. doi: 10.1016/j.ghir.2013.11.002
Kozel, B. A., Danback, J. R., Waxler, J. L., Knutsen, R. H., de Las Fuentes, L., Reusz, G.
S., . . . Pober, B. R. (2014). Williams syndrome predisposes to vascular stiffness
22
modified by antihypertensive use and copy number changes in NCF1. Hypertension,
63(1), 74-79. doi: 10.1161/HYPERTENSIONAHA.113.02087
Krokstad, S., Langhammer, A., Hveem, K., Holmen, T. L., Midthjell, K., Stene, T. R., . . .
Holmen, J. (2013). Cohort Profile: the HUNT Study, Norway. International Journal of
Epidemiology, 42(4), 968-977. doi: 10.1093/ije/dys095
Masserini, B., Bedeschi, M. F., Bianchi, V., Scuvera, G., Beck-Peccoz, P., Lalatta, F., . . .
Orsi, E. (2013). Prevalence of diabetes and pre-diabetes in a cohort of Italian young
adults with Williams syndrome. American Journal of Medical Genetics, 161(4), 817-
821. doi: 10.1002/ajmg.a.35655
Melville, C. A., Cooper, S. A., McGrother, C. W., Thorp, C. F., & Collacott, R. (2005).
Obesity in adults with Down syndrome: a case-control study. Journal of Intellectual
Disability Research, 49(Pt 2), 125-133. doi: 10.1111/j.1365-2788.2004.00616.x
Melville, C. A., Hamilton, S., Hankey, C. R., Miller, S., & Boyle, S. (2007). The prevalence
and determinants of obesity in adults with intellectual disabilities. Obesity Reviews,
8(3), 223-230. doi: 10.1111/j.1467-789X.2006.00296.x
Miller, J. L., Lynn, C. H., Shuster, J., & Driscoll, D. J. (2013). A reduced-energy intake, well-
balanced diet improves weight control in children with Prader-Willi syndrome.
Journal of Human Nutrition and Dietetics, 26(1), 2-9. doi: 10.1111/j.1365-
277X.2012.01275.x
Nathan, D. M., Kuenen, J., Borg, R., Zheng, H., Schoenfeld, D., Heine, R. J., & Grp, A. S.
(2008). Translating the A1C assay into estimated average glucose values. Diabetes
Care, 31(8), 1473-1478. doi: Doi 10.2337/Dc08-0545
Nickerson, E., Greenberg, F., Keating, M. T., McCaskill, C., & Shaffer, L. G. (1995).
Deletions of the elastin gene at 7q11.23 occur in approximately 90% of patients with
Williams syndrome. American Journal of Human Genetics, 56(5), 1156-1161.

23
Nordstrom, M., Hansen, B. H., Paus, B., & Kolset, S. O. (2013). Accelerometer-determined
physical activity and walking capacity in persons with Down syndrome, Williams
syndrome and Prader-Willi syndrome. Research in Developmental Disabilities, 34(12),
4395-4403. doi: 10.1016/j.ridd.2013.09.021
Norheim, O., Gjelsvik, B., Kjeldsen, S.E., Klemsdal, T.O., Madsen, S., Meland, E., . . . ,
Ulvin, F. (2009). Retningslinjer for individuell primærforebygging av hjerte- og
karsykdom [National guidelines for individualised primary prevention of
cardiovascular disease]. IS-1550, (pp. 135): Directorate of health.
Perk, J., De Backer, G., Gohlke, H., Graham, I., Reiner, Z., Verschuren, W. M., . . . Zannad, F.
(2012). European Guidelines on cardiovascular disease prevention in clinical practice
(version 2012): The Fifth Joint Task Force of the European Society of Cardiology and
Other Societies on Cardiovascular Disease Prevention in Clinical Practice (constituted
by representatives of nine societies and by invited experts). Atherosclerosis, 223(1), 1-
68. doi: 10.1016/j.atherosclerosis.2012.05.007
Phillips, A. C., & Holland, A. J. (2011). Assessment of objectively measured physical activity
levels in individuals with intellectual disabilities with and without Down's syndrome.
PLoS One, 6(12), e28618. doi: 10.1371/journal.pone.0028618
Pickering, T. G., Hall, J. E., Appel, L. J., Falkner, B. E., Graves, J., Hill, M. N., . . . Roccella,
E. J. (2005). Recommendations for blood pressure measurement in humans and
experimental animals: Part 1: blood pressure measurement in humans: a statement for
professionals from the Subcommittee of Professional and Public Education of the
American Heart Association Council on High Blood Pressure Research. Hypertension,
45(1), 142-161. doi: 10.1161/01.HYP.0000150859.47929.8e
Pober, B. R. (2010). Williams-Beuren syndrome. New England Journal of Medicine, 362(3),
239-252. doi: 10.1056/NEJMra0903074

24
Pober, B. R., Wang, E., Caprio, S., Petersen, K. F., Brandt, C., Stanley, T., . . . Gulanski, B.
(2010). High prevalence of diabetes and pre-diabetes in adults with Williams
syndrome. American Journal of Medical Genetics, 154C(2), 291-298. doi:
10.1002/ajmg.c.30261
Presson, A. P., Partyka, G., Jensen, K. M., Devine, O. J., Rasmussen, S. A., McCabe, L. L., &
McCabe, E. R. (2013). Current estimate of Down Syndrome population prevalence in
the United States. Journal of Pediatrics, 163(4), 1163-1168. doi:
10.1016/j.jpeds.2013.06.013
Real de Asua, D., Parra, P., Costa, R., Moldenhauer, F., & Suarez, C. (2014). Evaluation of
the impact of abdominal obesity on glucose and lipid metabolism disorders in adults
with Down syndrome. Research in Developmental Disabilities, 35(11), 2942-2949.
doi: 10.1016/j.ridd.2014.07.038
Sinnema, M., Maaskant, M. A., van Schrojenstein Lantman-de Valk, H. M., van Nieuwpoort,
I. C., Drent, M. L., Curfs, L. M., & Schrander-Stumpel, C. T. (2011). Physical health
problems in adults with Prader-Willi syndrome. American Journal of Medical
Genetics, 155A(9), 2112-2124. doi: 10.1002/ajmg.a.34171
Smith, A., Egan, J., Ridley, G., Haan, E., Montgomery, P., Williams, K., & Elliott, E. (2003).
Birth prevalence of Prader-Willi syndrome in Australia. Archives of Disease in
Childhood, 88(3), 263-264.
Sode-Carlsen, R., Farholt, S., Rabben, K. F., Bollerslev, J., Schreiner, T., Jurik, A. G., . . .
Hoybye, C. (2010). Body composition, endocrine and metabolic profiles in adults with
Prader-Willi syndrome. Growth Hormone and IGF Research, 20(3), 179-184. doi:
10.1016/j.ghir.2009.12.004

25
Sode-Carlsen, R., Farholt, S., Rabben, K. F., Bollerslev, J., Schreiner, T., Jurik, A. G., . . .
Hoybye, C. (2012). Growth hormone treatment in adults with Prader-Willi syndrome:
the Scandinavian study. Endocrine, 41(2), 191-199. doi: 10.1007/s12020-011-9560-4
Stromme, P., Bjornstad, P. G., & Ramstad, K. (2002). Prevalence estimation of Williams
syndrome. Journal of Child Neurology, 17(4), 269-271.
The Expert Committee on the Diagnosis and Classification of Diabetes Mellitus. (1997)
Report of the Expert Committee on the Diagnosis and Classification of Diabetes
Mellitus. (1997). Diabetes Care, 20(7), 1183-1197.
The International Expert Committee. (2009). International Expert Committee report on the
role of the A1C assay in the diagnosis of diabetes. Diabetes Care, 32(7), 1327-1334.
doi: 10.2337/dc09-9033
Van der Klaauw, A. A., Romijn, J. A., Biermasz, N. R., Smit, J. W., van Doorn, J., Dekkers,
O. M., . . . Pereira, A. M. (2006). Sustained effects of recombinant GH replacement
after 7 years of treatment in adults with GH deficiency. European Journal of
Endocrinology, 155(5), 701-708. doi: 10.1530/eje.1.02283
Vis, J. C., Duffels, M. G., Winter, M. M., Weijerman, M. E., Cobben, J. M., Huisman, S. A.,
& Mulder, B. J. (2009). Down syndrome: a cardiovascular perspective. Journal of
Intellectual Disability Research, 53(5), 419-425. doi: 10.1111/j.1365-
2788.2009.01158.x
Weijerman, M. E., Van Furth, A. M., Van der Mooren, M. D., Van Weissenbruch, M. M.,
Rammeloo, L., Broers, C. J., & Gemke, R. J. (2010). Prevalence of congenital heart
defects and persistent pulmonary hypertension of the neonate with Down syndrome.
European Journal of Pediatrics, 169(10), 1195-1199. doi: 10.1007/s00431-010-1200-
0

26
Wessel, A., Gravenhorst, V., Buchhorn, R., Gosch, A., Partsch, C. J., & Pankau, R. (2004).
Risk of sudden death in the Williams-Beuren syndrome. American Journal of Medical
Genetics, 127A(3), 234-237. doi: 10.1002/ajmg.a.30012
World Health Organization. (2000). Obesity: preventing and managing the global epidemic.
Report of a WHO consultation (Vol. 894). Geneva, Switzerland: WHO.

27
Table 1: Characteristics of the study population by diagnosis Williams
syndrome (n=21)
Prader-Willi syndrome (n=20)
Down Syndrome (n=31)
P-values1
Age (years) 34.2 (5.4) 29.3 (5.3) 29.4 (6.6) 0.008* Males (%) 33 45 39 0.745 Community residence (%) 84 91 60 0.012* Occupation 0.304 Student (%) 0 0 3 Employed (%) 71 85 81 Daycare attendant (%) 5 10 23 Unemployed (%) 14 5 3 Alcohol consumption 0.586 Weekly 0 5 0 1-3 times a month 19 20 16 Less than once a month 81 75 84 Smokers (%) 5 10 0 0.215 Medication Lipid lowering medication (%) 0 0 3 Antihypertensive medication (%)
33 14 0
Glucose lowering medication (%)
14 5 0
Thyroid substitution therapy (%) 14 5 45 Growth hormone therapy (%) 0 45 0 Sex hormone therapy (%) 0 20 0 The data are presented as mean with (SD) or percentage of the population. 1P-values were derived from comparing the different diagnosis groups using one-way analysis of variance (ANOVA) and Pearson’s chi-square tests.

28
Table 2: Biochemical values and physical values by diagnosis Williams
syndrome (n=25) Prader-Willi syndrome (n=22)
Down syndrome (n=40)
p-values1
Median Min – Max
Median Min - Max
Median Min - Max
Cholesterol (mmol/l)
5.2 4.0 – 6.7
5.2 3.5 – 6.7
5.0 3.4 – 7.5
0.68a
LDL cholesterol (mmol/l)
3.0 2.0 – 4.0
3.0 2.0 – 4.0
3.0 1.0 – 4.8
0.21a
HDL cholesterol (mmol/l)
1.5 0.9 – 2.3
1.2 0.7 – 1.8
1.2 0.8 – 2.1
0.007b*
Cholesterol/ HDL cholesterol-ratio
3.5 2.6 – 4.7
4.3 2.4 – 8.1
4.0 1.8 – 9.4
0.023b
Triglycerides (mmol/l)
0.9 0.6 – 1.7
1.2 0.5 – 3.0
1.2 0.6 – 4.7
0.13b
Apo A1 (g/l) 1.6 1.0 – 2.1
1.4 1.0 – 1.9
1.4 1.0 – 2.1
0.03a*
Apo B (g/l) 0.9 0.6 – 1.1
1.1 0.7 – 1.4
1.0 0.4 – 1.6
0.06b*
Apo B/ Apo A1 –ratio
0.6 0.4 – 0.8
0.8 0.4 – 1.3
0.6 0.2 – 1.3
0.01b*
Lp(a) (mg/l) 232 50 – 1128
334 50 - 1449
386 50 - 2519
0.16b
HbA1c (%) 5.4 3.8 – 8.9
5.6 5.0 – 9.0
5.3 4.7 – 6.1
0.13b
Systolic blood pressure (mmHg)
125 102 – 163
123 108 - 152
113 87 - 132
0.001a*
Diastolic blood pressure (mmHg)
77 50 – 100
78 62 - 105
68 56 - 89 <0.001a*
WC (cm) 93 62 – 120
103 81 - 146
100 72 - 128
0.002a*
Data is presented as population medians with minimum and maximum values. P-values were derived by comparison of the subgroups with use of one-way analysis of variance (ANOVA)a or Kruskal-Wallis testb. * P<0.05.
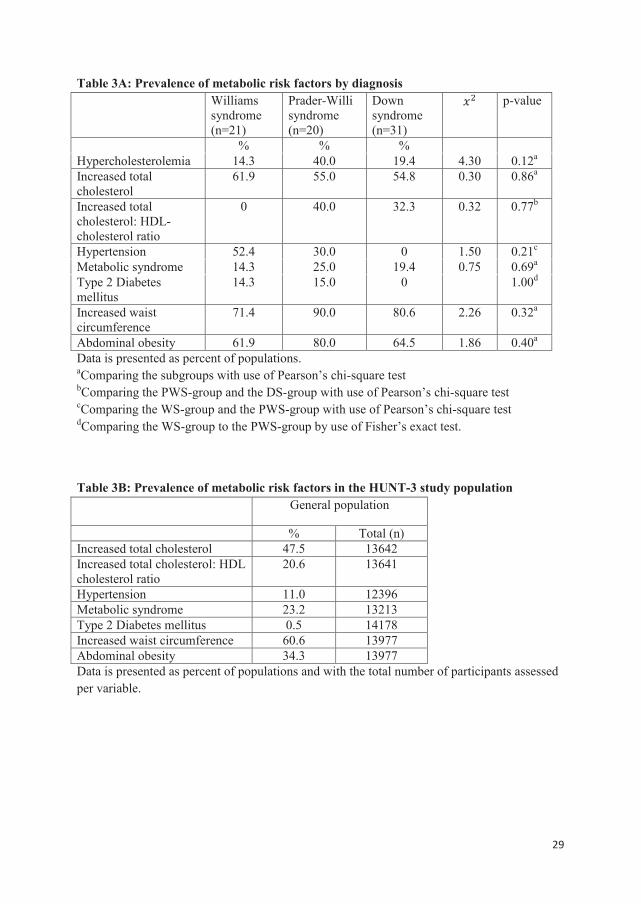
29
Table 3A: Prevalence of metabolic risk factors by diagnosis Williams
syndrome (n=21)
Prader-Willi syndrome (n=20)
Down syndrome (n=31)
p-value
% % % Hypercholesterolemia 14.3 40.0 19.4 4.30 0.12a
Increased total cholesterol
61.9 55.0 54.8 0.30 0.86a
Increased total cholesterol: HDL-cholesterol ratio
0 40.0 32.3 0.32 0.77b
Hypertension 52.4 30.0 0 1.50 0.21c
Metabolic syndrome 14.3 25.0 19.4 0.75 0.69a
Type 2 Diabetes mellitus
14.3 15.0 0 1.00d
Increased waist circumference
71.4 90.0 80.6 2.26 0.32a
Abdominal obesity 61.9 80.0 64.5 1.86 0.40a
Data is presented as percent of populations. aComparing the subgroups with use of Pearson’s chi-square test bComparing the PWS-group and the DS-group with use of Pearson’s chi-square test
cComparing the WS-group and the PWS-group with use of Pearson’s chi-square test dComparing the WS-group to the PWS-group by use of Fisher’s exact test.
Table 3B: Prevalence of metabolic risk factors in the HUNT-3 study population General population
% Total (n) Increased total cholesterol 47.5 13642 Increased total cholesterol: HDL cholesterol ratio
20.6 13641
Hypertension 11.0 12396 Metabolic syndrome 23.2 13213 Type 2 Diabetes mellitus 0.5 14178 Increased waist circumference 60.6 13977 Abdominal obesity 34.3 13977 Data is presented as percent of populations and with the total number of participants assessed per variable.

30
Figure 1: Blood pressure comparing normal waist circumference and increased waist
circumference to abdominal obesity by diagnosis
Box-plot with whiskers indicating min and max values. P-values were calculated by use of
independent t-tests comparing persons with normal- and increased WC to persons with
abdominal obesity by diagnosis.