Hybridization and agamospermy of Bidens in Northwestern Ontario
Hindawi Publishing CorporationJournal of ObesityVolume 2011, Article ID 267509, 5 pagesdoi:10.1155/2011/267509
Research Article
Obesity and Type 2 Diabetes Prevalence in Adults fromTwo Remote First Nations Communities in NorthwesternOntario, Canada
Pascal Imbeault,1 Francois Haman,2 Jules M. Blais,3 Shinjini Pal,2 Tim Seabert,3
Eva M. Krummel,3 and Michael A. Robidoux2
1 Behavioral and Metabolic Research Unit, School of Human Kinetics, Faculty of Health Sciences, University of Ottawa,125, University Street (room 350), Ottawa, ON, Canada K1N 6N5
2 Indigenous Health Group, School of Human Kinetics, Faculty of Health Sciences, University of Ottawa, Ottawa,ON, Canada K1N 6N5
3 Department of Biology, University of Ottawa, Ottawa, ON, Canada K1N 6N5
Correspondence should be addressed to Pascal Imbeault, [email protected]
Received 2 December 2010; Revised 21 January 2011; Accepted 15 February 2011
Academic Editor: Renato Pasquali
Copyright © 2011 Pascal Imbeault et al. This is an open access article distributed under the Creative Commons AttributionLicense, which permits unrestricted use, distribution, and reproduction in any medium, provided the original work is properlycited.
Objective. To assess the prevalence rates of obesity and type 2 diabetes in adults from two First Nations communities innorthwestern Ontario, Canada. Methods. Body weight, height, and waist circumference as well as fasting and postprandial glucoselevels following an oral glucose tolerance test were measured in 31 men and 41 women. Results. The mean age of the sample was43 ± 13 y. The prevalence of obesity was 65.3% and was comparable between men and women. 90.3% of the individuals presentedwaist circumference levels greater than the thresholds associated with an increased risk of developing health problems. 26 of the72 individuals (36.1%) were found to be type 2 diabetic. The prevalence of diabetes was not different between men and women.Conclusion. Using objective measurements, this study confirms that First Nations adults from remote communities of Canadacontinue to experience a disproportionately higher prevalence of obesity and type 2 diabetes than nonaboriginal Canadians.
1. Introduction
An excess of body weight, commonly referred to as obesity,has reached epidemic proportions in different segments ofthe population around the world [1]. In Canada, the obesityprevalence has risen steadily during the last 25 years, with23% of adults being classified as obese according to thelatest Canadian Community Health Surveys [2, 3]. Recentreports arising from the same community survey highlightthe greater prevalence of obesity in off-reserve aboriginalpopulation (i.e., 38%) compared to the rest of the adultpopulation [4, 5].
Amongst Canadian aboriginals, who constitute 3.4% (∼1million people) of the Canadian population, First NationsPeoples (First Nations peoples: according to the glossary
of the Indian and Northern Affairs of Canada (http://www.ainc-inac.gc.ca/ap/tln-eng.asp), this term refers to Canada’spopulation formerly defined as “Indian” under the 1876Indian Act.) represent the country’s largest aboriginal group(64% registered (Registered First Nations: according to theglossary of the Indian and Northern Affairs of Canada(http://www.ainc-inac.gc.ca/ap/tln-eng.asp), this term refersto Persons registered under the Indian Act of Canada.) andnonstatus First Nations versus 30% Metis and 4% Inuit)[6]. The First Nations Regional Longitudinal Health Survey2002/03 collected data on self-reported heights and weightsfrom on-reserve First Nations populations and showed thatthe overweight and obesity prevalence was also dispropor-tionally higher in adult First Nation (∼73%) than the generalpopulation (∼50%) [7]. This high prevalence of obesity

2 Journal of Obesity
among First Nations was identified to be partly responsiblefor the greater prevalence of self-reported diabetes in thispopulation. While this survey highlights a significant existingproblem that obesity and diabetes disproportionately affectFirst Nations adults, this population is generally understud-ied. Also, many of the studies conducted are limited by thereliance of self-reported data. Using ethnographic [8] andobjective clinical measures, the aim of this study was todescribe the prevalence of overweight/obesity as well as type2 diabetes in First Nations (Oji-Cree) adults living in tworemote communities from northwestern Ontario, Canada.
2. Methods
All research activities underwent ethics review and wereapproved by both the University of Ottawa’s and HealthCanada’s Research Ethics Boards.
2.1. Community Profiles and Participants. Wapekeka FirstNation (Angling Lake) is located 26 km Northwest ofKitchenuhmaykoosib Inninuwug (Big Trout Lake) and451 km northeast of Sioux Lookout in northwestern Ontario.The population is comprised of approximately 363 BandMembers (Band Members: according to the glossary of theIndian and Northern Affairs of Canada (http://www.ainc-inac.gc.ca/ap/tln-eng.asp), this term refers to a body of FirstNations for whose collective use and benefit lands havebeen set apart or money is held by the Crown, or declaredto be a band for the purposes of the Indian Act. Eachband has its own governing band council, usually consistingof one chief and several councilors. Community memberschoose the chief and councilors by election, or sometimesthrough custom. The members of a band generally sharecommon values, traditions, and practices rooted in theirancestral heritage.) with the majority (328) of the membersliving on reserve. Kasabonika Lake First Nation is locatedapproximately 30 km south of Wapekeka on the AsheweigRiver. The population is comprised of approximately 856Band Members with the majority (791) of the membersliving on reserve. Both Wapekeka and Kasabonika areaccessible year-round by air; during the winter months thecommunities are accessible by a winter-road constructedover the snow and ice. The main languages spoken are Oji-Cree and English.
A total of 83 people were recruited and interviewedthrough the assistance of local research coordinatorsand translators who were hired over the course of thestudy. Participants were recruited based on self-describeddietary behaviour as either relying predominantly on land-based food items (primarily wild game) or predominantlymarket foods. Semistructured interviews and participa-tion/observation in daily food practices assisted in deter-mining dietary behaviour of participants. A relative WildFood Index was designed to represent a range of wild foodconsumption, with 100 at the top and 0 at the bottom. 100represents the maximum level of wild food consumption,meaning people who eat entirely from wild food sources. Theopposite end of the scale represents people who never eatwild food. There was no one from either community who
ate only wild food or store bought food. Rather, there was acontinuum of wild food consumption frequency consumersin our samples. In both communities, 72 agreed to beresearch participants in the study. The inclusion criteria werethat a person must be Aboriginal, over 18 years of age, notpregnant, and free of type 1 diabetes. Most recent data fromIndian and Northern Affairs Canada indicates that 50% ofWapekeka’s population (164 people) is over 19 years of age[9]. Therefore the 39 volunteers from Wapekeka made upapproximately 24% of the eligible population. Similarly, 47%(372 people) of Kasabonika’s population is over 19 [10], andthus, the 33 participants made up approximately 9% of theeligible population.
2.2. Anthropometric and Insulin Sensitivity Assessments.Once interview and ethnographic dietary surveys were com-pleted in late September 2007, two research teams visited thetwo communities to conduct the clinical research betweenlate September and early November. Briefly, participantswere asked to report at nursing stations/clinic located ineach community in the morning following 24 h withoutheavy physical activity and after a 12 h fast. A total of 33participants completed the clinical trial in Kasabonika and39 participants completed the trial in Wapekeka.
Body weight was determined with a standard beam scaleand height and waist circumference were measured witha measuring tape. Body weight was measured after havingremoved shoes. Height was measured with the participant’sbare feet together, with heels, buttocks, back, and headagainst the wall, and following a normal inspiration. Basedon the Canadian guidelines for body weight classificationin adults [11], body mass index (BMI), defined as bodyweight in kilograms divided by square height in meters,was used to categorize an individual as underweight/normalweight (BMI < 25 kg/m2), overweight (25 kg/m2 ≤ BMI ≤29.9 kg/m2) or obese (BMI≥ 30 kg/m2). Waist circumferencewas measured, in duplicate (and averaged) at the mid-point between the last floating rib and the top of the iliaccrest [11].
2.3. Oral Glucose Tolerance Test. A 2 h OGTT was performedusing a 75 g solution of glucose. Participants were asked tofast for 12 h and to refrain from any exercise proceedingthe OGTT session. It was also requested that they do notsmoke or drink anything but water before their sessions. Ifthey had taken any medication in twelve hours precedingthe OGTT, this was also noted. After glucose ingestion,blood samples were taken after 15, 30, 60, and 120 minfor analysis of plasma glucose and insulin concentrations.Upon collection, samples were immediately centrifuged at3500 rpm and plasma was temporarily stored at−20◦C in theclinics, before being transferred to the laboratory where theywere stored at −80◦C for future assays.
Glucose concentrations were assayed using spectropho-tometric analysis (340 nm) after conversion of glucoseto glucose 6-phosphate by hexokinase and insulin levelswere analyzed by a commercially available enzyme-linkedimmunosorbent assay (ELISA) kit (Millipore, Billerica, MA,USA), as previously described [12]. Based on the report of
Journal of Obesity 3
Table 1: Descriptive characteristics of First Nations adults from twonorthwestern communities of Ontario, Canada.
Men(n = 31)
Women(n = 41)
Age (year) 42 ± 12 43 ± 13
Weight (kg) 97 ± 17 84 ± 14∗
BMI (kg/m2) 31.4 ± 4.5 32.6 ± 5.1
Waist circumference (cm) 112 ± 12 114 ± 14
Data are expressed as means ± standard deviation.BMI = body mass index.∗Significantly different from men at P < .01.
the expert committee on the diagnosis and classification ofdiabetes mellitus [13], participants with a fasting plasmaglucose level greater than or equal to 7.0 mmol/L and/or a 2 hafter glucose load level greater than or equal to 11.1 mmol/Lwere established type 2 diabetic (n = 26). The rest of theparticipants were considered nondiabetic (n = 46).
2.4. Statistical Analysis. The Student’s t-test was utilizedfor comparisons between men and women’ descriptivecharacteristics. The chi-square test of association was usedto determine whether the prevalence rates of obesity,overweight/obesity, and diabetes were equally distributedbetween men and women. Alpha was set at 0.05. Allanalyses were performed using SPSS Software 16.0 (SPSS Inc.Chicago, Ill, USA).
3. Results
The descriptive characteristics of participants are presentedin Table 1. The mean age was comparable between men andwomen. Body weight was significantly greater in men ascompared to women (P < .01). No significant differencewas observed in body mass index and waist circumferencebetween men and women.
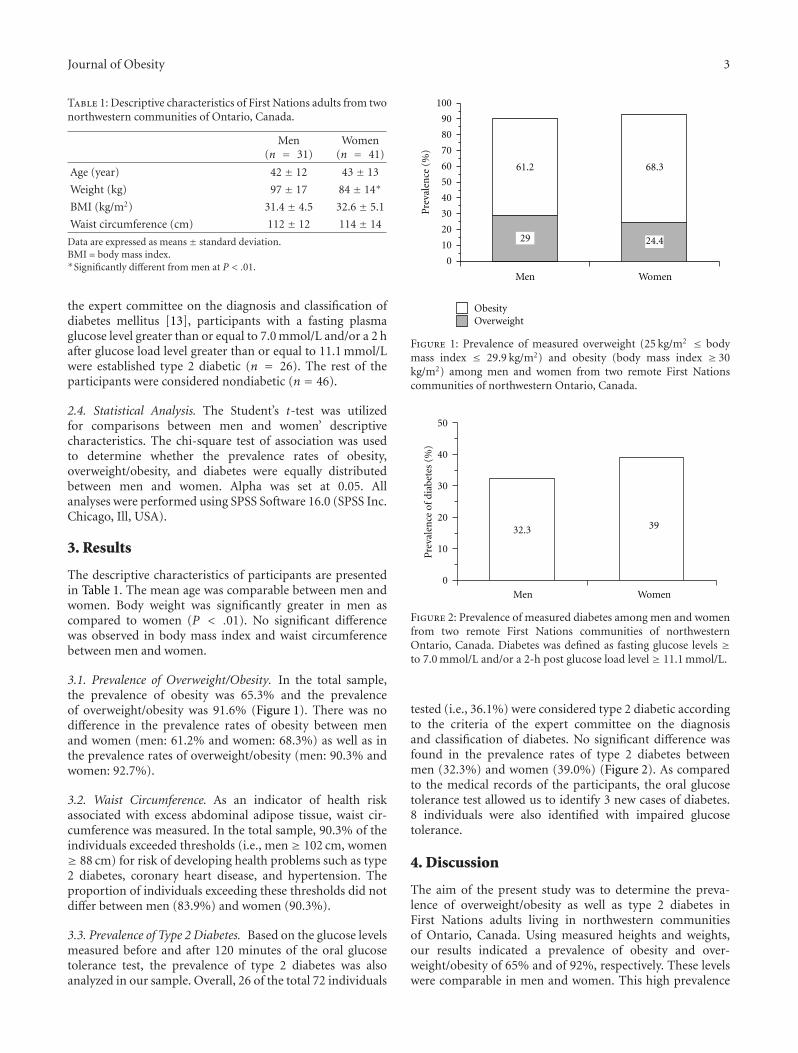
3.1. Prevalence of Overweight/Obesity. In the total sample,the prevalence of obesity was 65.3% and the prevalenceof overweight/obesity was 91.6% (Figure 1). There was nodifference in the prevalence rates of obesity between menand women (men: 61.2% and women: 68.3%) as well as inthe prevalence rates of overweight/obesity (men: 90.3% andwomen: 92.7%).
3.2. Waist Circumference. As an indicator of health riskassociated with excess abdominal adipose tissue, waist cir-cumference was measured. In the total sample, 90.3% of theindividuals exceeded thresholds (i.e., men ≥ 102 cm, women≥ 88 cm) for risk of developing health problems such as type2 diabetes, coronary heart disease, and hypertension. Theproportion of individuals exceeding these thresholds did notdiffer between men (83.9%) and women (90.3%).
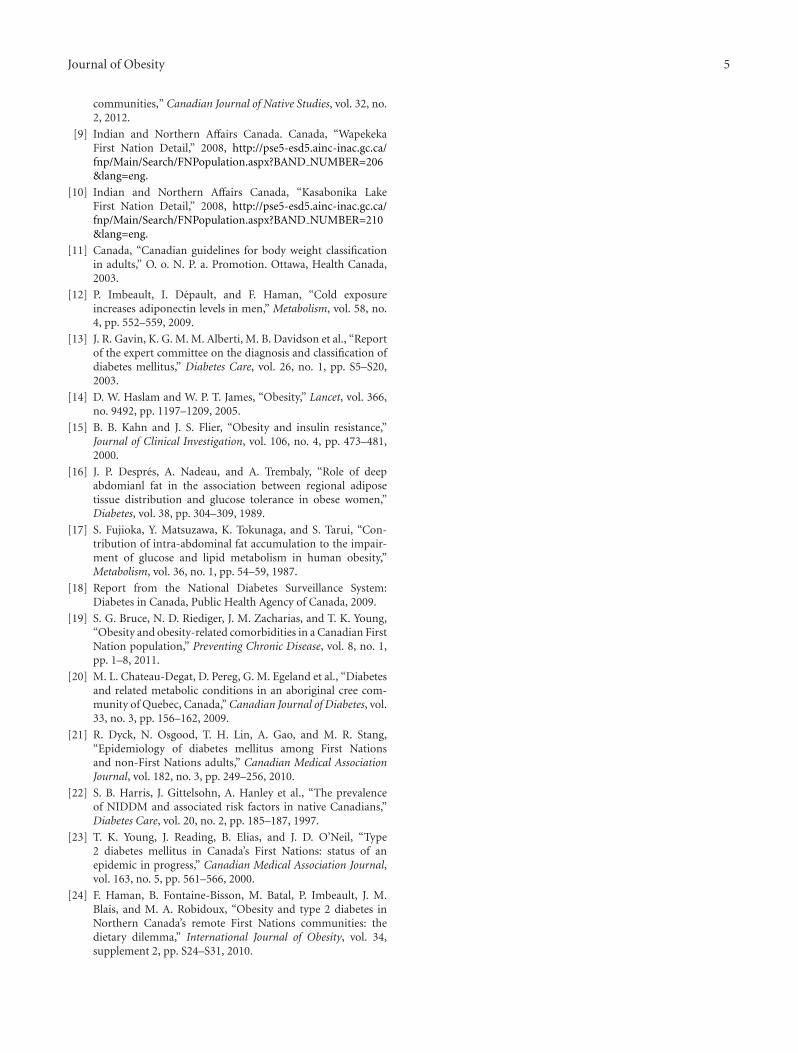
3.3. Prevalence of Type 2 Diabetes. Based on the glucose levelsmeasured before and after 120 minutes of the oral glucosetolerance test, the prevalence of type 2 diabetes was alsoanalyzed in our sample. Overall, 26 of the total 72 individuals
Men Women
0
10
20
30
40
50
60
70
80
90
100
Pre
vale
nce
(%)
29
61.2
24.4
68.3
OverweightObesity
Figure 1: Prevalence of measured overweight (25 kg/m2 ≤ bodymass index ≤ 29.9 kg/m2) and obesity (body mass index ≥ 30kg/m2) among men and women from two remote First Nationscommunities of northwestern Ontario, Canada.
Men Women
0
10
20
30
40
50P
reva
len
ceof
diab
etes
(%)
32.3 39
Figure 2: Prevalence of measured diabetes among men and womenfrom two remote First Nations communities of northwesternOntario, Canada. Diabetes was defined as fasting glucose levels ≥to 7.0 mmol/L and/or a 2-h post glucose load level ≥ 11.1 mmol/L.
tested (i.e., 36.1%) were considered type 2 diabetic accordingto the criteria of the expert committee on the diagnosisand classification of diabetes. No significant difference wasfound in the prevalence rates of type 2 diabetes betweenmen (32.3%) and women (39.0%) (Figure 2). As comparedto the medical records of the participants, the oral glucosetolerance test allowed us to identify 3 new cases of diabetes.8 individuals were also identified with impaired glucosetolerance.
4. Discussion
The aim of the present study was to determine the preva-lence of overweight/obesity as well as type 2 diabetes inFirst Nations adults living in northwestern communitiesof Ontario, Canada. Using measured heights and weights,our results indicated a prevalence of obesity and over-weight/obesity of 65% and of 92%, respectively. These levelswere comparable in men and women. This high prevalence

4 Journal of Obesity
of obesity was also accompanied by an excess of abdominaladipose tissue, as indicated by the measurement of waistcircumference which, in 90% of the sample, exceeded thethresholds for increased risk of health problems. Finally,using glucose levels measured before and after 2 h of an oralglucose tolerance test, we observed that 36.1% of our samplewas type 2 diabetics.
An excess of adipose tissue is now well recognized as oneof the most serious public health issues in the world [14] andwill likely get worse because obesity rates are continuing torise in most countries [1]. The results of the current studydo confirm the high prevalence of obesity in First Nationsadults from northwestern communities of Ontario. In fact,the prevalence of the whole sample studied was 65%, which isalmost twice as high as values reported in off-reserve Aborig-inal individuals from the 2004 Canadian Community HealthSurvey (i.e., 38%) [4, 5] and the 2002-2003 First NationsRegional Longitudinal Health Survey (36%) [7], whichrepresents on-reserve First Nations individuals of Canada. Inaddition, the results of our study confirm that the prevalenceof obesity in these First Nations communities (i.e., 65%) farexceeds that for nonaboriginals in Canada (i.e., 23%) [3].
Adiposity has a potent negative effect on insulin sensi-tivity [15]. It is also well recognized that a specific excessof adipose tissue at the abdominal level predisposes oneat a great risk of being characterized by insulin resistance[16, 17]. We found that only 7 of the 72 individuals studiedhad waist circumference measurements, a proxy of abdom-inal fat, below thresholds for decreased risk of developingmetabolic diseases. The prevalence of obesity in combinationwith high levels of abdominal adiposity, as indicated by themeasurement of waist circumference, most likely explains thehigh rates of type 2 diabetes observed in our sample—1 outof 3 individuals were found with type 2 diabetic. This figurefar exceeds the prevalence estimates of 8.3% of the Canadianpopulation aged between 18 to 74 years reported in themost recent National Diabetes Surveillance System (2006-07findings) [18]. Our results corroborate those of other studiesreporting that diabetes [19–23] and other comorbidities suchas dyslipidemia and hypertension [19] disproportionatelyaffects young First Nations adults across Canada.
Some limitations and strengths of this study shouldbe discussed. First, despite the fact that our sample sizerepresents 9% and 24% of the eligible adult population ineach community studied, we are aware that our findingshighlights a specific remote area of northwestern Ontarioand thus, could not be generalized to the entire populationof First Nations in Canada. Second, some estimates ofphysical activity levels and energy intake would have beenof merit. Finally, no cause-and-effect interpretation canbe invoked between the high prevalence of obesity andtype 2 diabetes in this sample because of the cross-sectionalnature of the study. The results of the present study arealso strengthened by different factors. First, anthropometricmeasurements were performed to objectively characterizethe adiposity levels as well as the regional fat distribution ofour participants. Second, an oral glucose tolerance test wasused to identify people with diabetes instead of using self-reported information or fasting glucose levels only.
Whether or not obesity and its comorbidities occur inindividuals and populations depend on biological, behav-ioral, and environmental factors. The question as to whythere is such a high prevalence of obesity, along with a dis-proportionately high rate of diabetes in Canada’s remote FirstNations communities is not under the scope of this study butwas recently reviewed by our group [24]. In summary, thisstudy highlights the gravity of the problem of obesity andtype 2 diabetes in First Nations adults. Efforts should nowbe directed at the individual and community levels to adoptand maintain healthy dietary and physical activity patterns toprevent further weight gain and, hopefully over time, to keepweight off.
Acknowledgments
The authors would like to thank Wapekeka and KasabonikaFirst Nations Chiefs and Councils for volunteering toparticipate in this study. They would like to thank theparticipants, research coordinators—Geraldine Brown andBarbara Cutfeet—Keith Mason, Laura Semple and family,Beatrice Anderson, Chris Anderson and family, and thehost of other community members who made us feel sowelcome throughout their stays in each community. Theywould like to thank the nurses and staff at the NursingStation in Kasabonika and the Nursing clinic in Wapekeka.They are grateful to the Shibogama First Nations Council,in particular the Executive Director Margaret Kenequanash,and Director of Finance and Administration, BeverleyChristink. Finally they would like to thank the NorthernFirst Nations Environmental Contaminant Program for thegenerous funding that made this research possible.
References
[1] International association for the study of Obesity, “Inter-national Obesity Task Force prevalence data,” 2010, http://www.iotf.org/database/index.asp.
[2] P. T. Katzmarzyk and C. Mason, “Prevalence of class I, II andIII obesity in Canada,” Canadian Medical Association Journal,vol. 174, no. 2, pp. 156–157, 2006.
[3] M. Tjepkema, “Adult obesity,” Health Reports, vol. 17, no. 3,pp. 9–25, 2006.
[4] D. Garriguet, “Obesity and the eating habits of the Aboriginalpopulation,” Health Reports, vol. 19, no. 1, pp. 21–35, 2008.
[5] P. T. Katzmarzyk, “Obesity and physical activity amongaboriginal canadians,” Obesity, vol. 16, no. 1, pp. 184–190,2008.
[6] Statistics Canada, “Aboriginal population profile,” 2010,http://www12.statcan.gc.ca/census-recensement/2006/dp-pd/prof/92-594/details/page.cfm?Lang=E&Geo1=PR&Code1=01&Geo2=PR&Code2=01&Data=Count&SearchText=canada&SearchType=Begins&SearchPR=01&B1=All&Custom=.
[7] First Nations Centre, First Nations regional longitudinalhealth survey (RHS) 2002/03: the people report. First Nationsinformation governance committee, assembly of First Nations.First Nations Centre at the national Aboriginal health organi-zation, 2005.
[8] M. A. Robidoux, M. Batal, P. Imbeault et al., “Tradi-tional foodways in two contemporary northern First Nations
Journal of Obesity 5
communities,” Canadian Journal of Native Studies, vol. 32, no.2, 2012.
[9] Indian and Northern Affairs Canada. Canada, “WapekekaFirst Nation Detail,” 2008, http://pse5-esd5.ainc-inac.gc.ca/fnp/Main/Search/FNPopulation.aspx?BAND NUMBER=206&lang=eng.
[10] Indian and Northern Affairs Canada, “Kasabonika LakeFirst Nation Detail,” 2008, http://pse5-esd5.ainc-inac.gc.ca/fnp/Main/Search/FNPopulation.aspx?BAND NUMBER=210&lang=eng.
[11] Canada, “Canadian guidelines for body weight classificationin adults,” O. o. N. P. a. Promotion. Ottawa, Health Canada,2003.
[12] P. Imbeault, I. Depault, and F. Haman, “Cold exposureincreases adiponectin levels in men,” Metabolism, vol. 58, no.4, pp. 552–559, 2009.
[13] J. R. Gavin, K. G. M. M. Alberti, M. B. Davidson et al., “Reportof the expert committee on the diagnosis and classification ofdiabetes mellitus,” Diabetes Care, vol. 26, no. 1, pp. S5–S20,2003.
[14] D. W. Haslam and W. P. T. James, “Obesity,” Lancet, vol. 366,no. 9492, pp. 1197–1209, 2005.
[15] B. B. Kahn and J. S. Flier, “Obesity and insulin resistance,”Journal of Clinical Investigation, vol. 106, no. 4, pp. 473–481,2000.
[16] J. P. Despres, A. Nadeau, and A. Trembaly, “Role of deepabdomianl fat in the association between regional adiposetissue distribution and glucose tolerance in obese women,”Diabetes, vol. 38, pp. 304–309, 1989.
[17] S. Fujioka, Y. Matsuzawa, K. Tokunaga, and S. Tarui, “Con-tribution of intra-abdominal fat accumulation to the impair-ment of glucose and lipid metabolism in human obesity,”Metabolism, vol. 36, no. 1, pp. 54–59, 1987.
[18] Report from the National Diabetes Surveillance System:Diabetes in Canada, Public Health Agency of Canada, 2009.
[19] S. G. Bruce, N. D. Riediger, J. M. Zacharias, and T. K. Young,“Obesity and obesity-related comorbidities in a Canadian FirstNation population,” Preventing Chronic Disease, vol. 8, no. 1,pp. 1–8, 2011.
[20] M. L. Chateau-Degat, D. Pereg, G. M. Egeland et al., “Diabetesand related metabolic conditions in an aboriginal cree com-munity of Quebec, Canada,” Canadian Journal of Diabetes, vol.33, no. 3, pp. 156–162, 2009.
[21] R. Dyck, N. Osgood, T. H. Lin, A. Gao, and M. R. Stang,“Epidemiology of diabetes mellitus among First Nationsand non-First Nations adults,” Canadian Medical AssociationJournal, vol. 182, no. 3, pp. 249–256, 2010.
[22] S. B. Harris, J. Gittelsohn, A. Hanley et al., “The prevalenceof NIDDM and associated risk factors in native Canadians,”Diabetes Care, vol. 20, no. 2, pp. 185–187, 1997.
[23] T. K. Young, J. Reading, B. Elias, and J. D. O’Neil, “Type2 diabetes mellitus in Canada’s First Nations: status of anepidemic in progress,” Canadian Medical Association Journal,vol. 163, no. 5, pp. 561–566, 2000.
[24] F. Haman, B. Fontaine-Bisson, M. Batal, P. Imbeault, J. M.Blais, and M. A. Robidoux, “Obesity and type 2 diabetes inNorthern Canada’s remote First Nations communities: thedietary dilemma,” International Journal of Obesity, vol. 34,supplement 2, pp. S24–S31, 2010.

Submit your manuscripts athttp://www.hindawi.com
Stem CellsInternational
Hindawi Publishing Corporationhttp://www.hindawi.com Volume 2014
Hindawi Publishing Corporationhttp://www.hindawi.com Volume 2014
MEDIATORSINFLAMMATION
of
Hindawi Publishing Corporationhttp://www.hindawi.com Volume 2014
Behavioural Neurology
EndocrinologyInternational Journal of
Hindawi Publishing Corporationhttp://www.hindawi.com Volume 2014
Hindawi Publishing Corporationhttp://www.hindawi.com Volume 2014
Disease Markers
Hindawi Publishing Corporationhttp://www.hindawi.com Volume 2014
BioMed Research International
OncologyJournal of
Hindawi Publishing Corporationhttp://www.hindawi.com Volume 2014
Hindawi Publishing Corporationhttp://www.hindawi.com Volume 2014
Oxidative Medicine and Cellular Longevity
Hindawi Publishing Corporationhttp://www.hindawi.com Volume 2014
PPAR Research
The Scientific World JournalHindawi Publishing Corporation http://www.hindawi.com Volume 2014
Immunology ResearchHindawi Publishing Corporationhttp://www.hindawi.com Volume 2014
Journal of
ObesityJournal of
Hindawi Publishing Corporationhttp://www.hindawi.com Volume 2014
Hindawi Publishing Corporationhttp://www.hindawi.com Volume 2014
Computational and Mathematical Methods in Medicine
OphthalmologyJournal of
Hindawi Publishing Corporationhttp://www.hindawi.com Volume 2014
Diabetes ResearchJournal of
Hindawi Publishing Corporationhttp://www.hindawi.com Volume 2014
Hindawi Publishing Corporationhttp://www.hindawi.com Volume 2014
Research and TreatmentAIDS
Hindawi Publishing Corporationhttp://www.hindawi.com Volume 2014
Gastroenterology Research and Practice
Hindawi Publishing Corporationhttp://www.hindawi.com Volume 2014
Parkinson’s Disease
Evidence-Based Complementary and Alternative Medicine
Volume 2014Hindawi Publishing Corporationhttp://www.hindawi.com
Copyright © 2022 FDOKUMEN