Nurturing Potential: The Impact of Talent Development on ...
252
Gardner-Webb University Gardner-Webb University Digital Commons @ Gardner-Webb University Digital Commons @ Gardner-Webb University Education Dissertations and Projects School of Education 2018 Nurturing Potential: The Impact of Talent Development on Nurturing Potential: The Impact of Talent Development on Underrepresented Gifted Populations Underrepresented Gifted Populations Sara Newell Follow this and additional works at: https://digitalcommons.gardner-webb.edu/education_etd Part of the Gifted Education Commons
-
Upload
khangminh22 -
Category
Documents
-
view
1 -
download
0
Transcript of Nurturing Potential: The Impact of Talent Development on ...

Gardner-Webb University Gardner-Webb University
Digital Commons @ Gardner-Webb University Digital Commons @ Gardner-Webb University
Education Dissertations and Projects School of Education
2018
Nurturing Potential: The Impact of Talent Development on Nurturing Potential: The Impact of Talent Development on
Underrepresented Gifted Populations Underrepresented Gifted Populations
Sara Newell
Follow this and additional works at: https://digitalcommons.gardner-webb.edu/education_etd
Part of the Gifted Education Commons

Nurturing Potential: The Impact of Talent Development on Underrepresented Gifted
Populations
By
Sara Elizabeth Newell
A Dissertation Submitted to the
Gardner-Webb University School of Education
in Partial Fulfillment of the Requirements
for the Degree of Doctor of Education
Gardner-Webb University
2018

ii
Approval Page
This dissertation was submitted by Sara Elizabeth Newell under the direction of the
persons listed below. It was submitted to the Gardner-Webb University School of
Education and approved in partial fulfillment of the requirements for the degree of
Doctor of Education at Gardner-Webb University.
__________________________________ ________________________
Sydney K. Brown, Ph.D. Date
Committee Chair
_________________________________ ________________________
Jennifer Putnam, Ed.D. Date
Committee Member
_________________________________ ________________________
Kelly Burgess, Ed.D. Date
Committee Member
_________________________________ ________________________
Sydney K. Brown, Ph.D. Date
Dean of the Gayle Bolt Price School
of Graduate Studies

iii
Acknowledgments
“Those who mind don’t matter, and those who matter don’t mind.” – Dr. Seuss
The truth of Dr. Seuss’s words was never clearer than it is now after completing
the dissertation process. Those who matter were pillars of support during my journey;
and without them, my dissertation would not have been possible. For that, I thank them.
First and foremost, I thank my committee for your hours of reading, coaching,
feedback, and support. My work is better because of you. Dr. Brown, thank you for your
guidance in thematic organization and theoretical frameworks and for fueling my passion
for a transformative study into an authentic piece of work; Dr. Putnam, thank you for
helping me become a sophisticated, academic writer and for your guidance on high-
ability students; and Dr. Burgess, thank you for imparting me with your knowledge of
data collection and analysis and for the many hours you gave to turn numbers into
research.
Thank you as well to my district for allowing this research study to occur,
empowering me through this study, and supporting the continuation of this research
beyond the timeframe of the study. Knowing this research was more than a dissertation
to the district will allow the voice of study participants to impact gifted education for
years to come. I also owe thanks to my cohort for their encouragement and motivation
when I lost mine and to my friends and my family for understanding when I needed to
stay home and work and for having faith in my ability even when I did not.
Most importantly though, thank you to my husband for cleaning, cooking, doing
laundry, running data, and for your endless love and belief in me even through endless
hours of work, breakdowns, and “stressful moments.” I love you forever and always.
To all of you . . . you are the ones who matter, because no matter what, you didn’t mind.

iv
Abstract
Nurturing Potential: The Impact of Talent Development on Underrepresented Gifted
Populations. Newell, Sara Elizabeth, 2018: Dissertation, Gardner-Webb University,
Underrepresented Populations/Gifted Education/Talent Development
Data on gifted education show a clear problem: lack of diversity in gifted education
programs. This fact is compounded by additional data showing a disparaging difference
in achievement of Caucasian versus minority students. Together, these concepts are
referred to as the excellence gap in gifted education. Talent development, or the location
and nurturing of potential talent in underrepresented populations, has been recommended
in the gifted community as a possible step in resolving these inequities (Ellis & Martin,
2017; Ford, 2010; National Association of Gifted Children [NAGC], 2015; Reinhard,
2016; Thornbury, 2010).
Through an explanatory mixed methods study, this research analyzed the impact
implementation of talent development strategies had on underrepresented populations
regarding achievement, motivation, and location of potential in a diverse, mid-sized,
urban district. The study focused on implementation of six talent development
components (alternative identification methods, training teachers, increased
collaboration, adjusted curriculum, cultivation of support networks, and increased
communication between home and school) with high-ability fourth- and fifth-grade
students at two of six elementary schools in the district over a 12-week period.
Findings of the study showed talent development reified “the Achilles Heel of gifted
education is its inability to adequately include children who don’t fall into the nice, neat
stereotype of good student” (Renzulli, 2005, p. 80); and talent development can serve as
the vehicle of promise for typically underrepresented students as it encourages educators
to locate, support, and serve students who do not fit the predetermined mold but show
potential for high achievement and success (Burney & Beilke, 2008).

v
Table of Contents
Page
Chapter 1: Introduction ........................................................................................................1
Introduction to the Study .....................................................................................................1
Background to the Study ......................................................................................................1
Problem Statement and Purpose of the Study ......................................................................2
Research Questions and Hypotheses ...................................................................................4
Theoretical Framework of the Study ...................................................................................5
Nature of the Study ..............................................................................................................7
Definitions............................................................................................................................8
Assumptions .......................................................................................................................10
Scope .................................................................................................................................11
Limitations/Delimitations ..................................................................................................11
Significance........................................................................................................................16
Summary ............................................................................................................................17
Chapter 2: Literature Review .............................................................................................18
Introduction ........................................................................................................................18
Literature Search Strategy..................................................................................................18
Theoretical Foundation ......................................................................................................19
Excellence Gap ..................................................................................................................21 Why Underrepresentation Exists .......................................................................................24
Ways Schools Can Decrease the Gap ................................................................................28
Talent Development Connects All .....................................................................................35
Identification Methods and Changing the Madness...........................................................40
Summary and Conclusions ................................................................................................42
Chapter 3: Methodology ....................................................................................................43
Introduction/Restatement of the Problem ..........................................................................43
Review of Research Questions ..........................................................................................43
Setting ................................................................................................................................44
Research Design and Rationale .........................................................................................48
Role of the Researcher .......................................................................................................49
Participant Selection Logic ................................................................................................50
Instrumentation ..................................................................................................................56
Intervention Studies ...........................................................................................................64
Procedures for Participation ...............................................................................................68
Data Collection Plan ..........................................................................................................69
Data Analysis Plan .............................................................................................................72
Threats to Validity .............................................................................................................76
Issues of Trustworthiness ...................................................................................................77
Summary ............................................................................................................................78
Chapter 4: Results ..............................................................................................................79
Review of Problem Statement ...........................................................................................79
Restatement of Research Focus .........................................................................................79
Overview of the Chapter ....................................................................................................81
Presentation of Results .......................................................................................................81
Summary of Results .........................................................................................................135
Chapter 5: Conclusions ....................................................................................................143

vi
Overview ..........................................................................................................................143
Summary of Research ......................................................................................................143
Interpretation of Findings ................................................................................................146
Limitations .......................................................................................................................155
Recommendations and Implications for the Future .........................................................160
References ........................................................................................................................163
Appendices .............................................................................................................................
A Teacher Survey ....................................................................................................170
B Parent Survey .......................................................................................................173
C Initial Teacher Focus Group Questions ...............................................................176
D Initial Parent Focus Group Questions ..................................................................179
E Final Focus Group Questions...............................................................................182
F Parent Survey–Preintervention Comparison Group .............................................186
G Parent Survey–Preintervention Treatment Group ................................................192
H Parent Survey–Postintervention Comparison Group ...........................................198
I Parent Survey–Postintervention Treatment Group ..............................................204
J Teacher Survey–Preintervention Comparison Group ..........................................210
K Teacher Survey–Preintervention Treatment Group .............................................218
L Teacher Survey–Postintervention Comparison Group ........................................227
M Teacher Survey–Postintervention Treatment Group ...........................................233
N Panorama Education Survey Results–Fall ...........................................................239
O Panorama Education Survey Results–Spring.......................................................242
Tables
1 Demographics of District vs. Demographics of AIG Identified Population ..........46
2 Demographics of School 1 .....................................................................................52
3 Demographics of School 2 .....................................................................................53
4 Demographics of School 3 .....................................................................................54
5 Demographics of School 4 .....................................................................................54
6 Demographics of School 5 .....................................................................................55
7 Demographics of School 6 .....................................................................................55
8 Matrix Aligning Research Terms and Tools ..........................................................57
9 Blooms-Banks Matrix ............................................................................................66
10 Methods Table: An “At a Glance” Guide ..............................................................75
11 Survey Alignment to Talent Development ............................................................84
12 Reasons for Not Recommending Students for Gifted Programs .........................101
13 Quantitative Representation of Cultural Values ..................................................103
14 Quantitative Breakdown of Parent and Teacher Focus Groups ...........................106
15 Focus Group Responses–Locating Potential Beyond IQ Testing ........................108
16 Focus Group Responses–Training Teachers in CLED Populations ....................110
17 Focus Group Responses–Increasing Collaborative Planning Time .....................111
18 Focus Group Responses–Adjusting Curriculum to Include Active Learning .....112
19 Focus Group Responses–Deliberately Cultivating Support Networks ................113
20 Focus Group Responses–Increasing Communication Between School
and Home .............................................................................................................115
21 Focus Group Responses–Having High Expectations for All Students ................116
22 t-Test and Chi-Square Results for i-Ready Testing .............................................118
23 t-Test and Chi-Square Results for GRS Academic Section .................................120

vii
24 Panorama Education Chi-Square Results ............................................................126
25 t-Test and Chi-Square Results for GRS Motivation Section ...............................128
26 Difference in Identification Between Talent Development and
Traditional Models ...............................................................................................132
27 Teacher Survey Responses to Explain Identification Numbers–Positive ............133
28 Teacher Survey Responses to Explain Identification Numbers–Negative ..........134
Figures
1 Phases of Data Collection Timeline .......................................................................72
2 Parent Survey Responses for Locating Potential Cluster ......................................85
3 Teacher Survey Responses for Locating Potential Cluster ....................................86
4 Parent Survey Responses for Training Teachers Cluster .......................................88
5 Teacher Survey Responses for Training Teachers Cluster–1 ................................89
6 Teacher Survey Responses for Training Teachers Cluster–2 ................................90
7 Teacher Survey Responses for Collaborative Planning Cluster ............................92
8 Parent Survey Responses for Adjusting Curriculum Cluster .................................94
9 Teacher Survey Responses for Adjusting Curriculum Cluster ..............................95
10 Parent Survey Responses for Cultivating Support Systems Cluster–1 ..................97
11 Parent Survey Responses for Cultivating Support Systems Cluster–2 ..................98
12 Teacher Survey Responses for Cultivating Support Systems Cluster .................100
13 Parent Survey Responses for Increasing Communication Cluster ......................102
14 Teacher Survey Responses for Increasing Communication Cluster ....................104
15 Average i-Ready Growth .....................................................................................117
16 Academic Growth on GRS Academic Achievement Component .......................119
17 Panorama Education Survey Responses–Engagement Domain ..........................124
18 Panorama Education Survey Responses–Grit Domain ........................................125
19 Motivation Growth on GRS Motivation Component ..........................................127
20 Average Attendance Pre and Postintervention ....................................................129
21 Pyramid of Talent Development Components .....................................................147
22 Cultural Values Wheel .........................................................................................153

1
Chapter 1: Introduction
Introduction to the Study
“A door, nothing special, pink like bubble gum, creates a barrier between students
that course through school accelerated (mostly Caucasian), and students that don’t
(mostly minority)” (Baker, 2013, “Gifted, Talented, and Separated,” para. 1). No longer
can this barrier be accepted, particularly considering that the Census Bureau predicts by
2023 public education will be represented by students who are majority minority
(Thornbury, 2010). Truly, the success of the American nation depends on reversing the
current state of underrepresentation of culturally, linguistically, and economically diverse
(CLED) students in America’s gifted classrooms.
Background to the Study
Underrepresentation of CLED students in gifted education is not a new
problem. In fact, the Office of Educational Research and Improvement (1993) called
attention to the problem of underrepresentation of CLED students in gifted education.
Research since this call to attention has focused on understanding barriers to gifted
identification of CLED students (Dunn, 2008; Grissom & Redding, 2016; Jarvis, 2009);
redefining the word giftedness (National Association of Gifted Children [NAGC], 2015;
Olszewski-Kubilius & Thomson, 2015; Saiying & Olszewski-Kubilius, 2016); and
implementing strategies which could be beneficial in locating gifted CLED students
(Hooper, 2013; Horn, 2014; Queen, 2006; Siegle et al., 2016). Gifted theorists claim the
use of talent development could attend to these barriers, helping to change the mindset of
education towards giftedness and encouraging the use of nontraditional methods of
instruction such as hands-on, problem-based learning (Thornbury, 2010). Additionally,
heavy focus is placed on the use of culturally relevant curriculum (Jarvis, 2009);

2
increasing teacher knowledge (Grissom & Redding, 2016); and building a support system
of all stakeholders in CLED student lives (Coleman & Shah-Coltrane, 2015). NAGC
(2015), in their Inaugural European-North American Summit on Talent Development,
called attention to ways talent development programs could be inclusive of these
elements and serve to positively influence underrepresentation in gifted programs.
Problem Statement and Purpose of the Study
Despite this research, the increased awareness of underrepresentation of CLED
students in gifted education, the implementation of laws which protect all children, and
the call for curriculum adjustments, the American education system unfortunately is no
closer to closing the excellence gap than it was 25 years ago when The National
Excellence Gap: A Case for Developing America’s Talent was first released (Office of
Educational Research and Improvement, 1993). One must question why the American
education system can acknowledge problems but not move to implement necessary
changes to fix them.
Henfield, Woo, and Bang (2017) argued it is because the education system
focuses more on naming the intervention than on researching actual implementation of
interventions. In fact, they pointed to a research desert in the area of actual programs
addressing the problem of underrepresentation in gifted education. Olszewski-Kubilius
and Clarenbach (2014) agreed, claiming if the education system hopes to close the gap
between subgroups of the American population, “we must make it clear…that we care
about the development of high levels of talent in students from all sectors of society AND
we have viable solutions to offer” (p. 108). Ford (2010) further supported these
statements, calling for research on programs proactively looking for potential in CLED
students. Beyond researchers, policymakers have even begun to call for research
3
regarding solutions to closing the excellence gap. Specifically, NAGC (2015) requested
the use of talent development to accomplish this call to action, making “building
consensus for the gifted education community regarding the import of a TD perspective
and future collaborative advocacy work” (p. 2) the focus of the 2017 National Gifted
Conference.
Considering this research, this study took an in-depth look at the impact of talent
development interventions on the academic and engagement domains of culturally
linguistically and/or economically diverse students in a mid-sized urban district where,
according to the U.S. Department of Civil Rights 20% Equity Allowance (Ford & King,
2014), a significant gap existed between the demographics of the entire student
population and the demographics of the student population served in gifted education.
Specifically, the study collected data on students in fourth and fifth grade in two of the
six district elementary schools. Using the Civil Rights Equity Allowance Rule (Ford &
King, 2014), students scoring in the top 20% of the district’s three most prevalent
subgroups (African-American, Hispanic, and Caucasian) received talent development
services based on the talent development framework of NAGC (2015). Talent
development interventions, in the form of problem-based learning experiences, were
provided by AIG specialists to the students meeting the previously stated qualifications
on a weekly basis. Within the elementary schools where the study was implemented, the
talent development interventions provided were in addition to any services already
provided for gifted students per the district’s state approved AIG plan. Data were
additionally collected for comparison purposes on students in the four other elementary
schools where students were still receiving the regular gifted programming of the district.

4
Research Questions and Hypotheses
Creswell (2014), Grant and Osanloo (2012), and Ravitch and Riggan (2017)
referred to research questions as the liaison between existing knowledge, the research
problem, and the research study. To determine the impact of talent development on
CLED populations, the study addressed one qualitative, one quantitative, and two hybrid
research questions. Creswell argued this mixed-methods approach allows a researcher to
“convey the importance of integrating and combining the quantitative and qualitative
elements of a study” (p. 152). Specifically, the transformative mixed methods research
questions intended to bring attention to how the lives of the marginalized groups being
studied “have been constrained and [what] strategies they can use to challenge or subvert
these constraints” (Creswell, 2014, p. 10).
The research questions for the study are listed as follows:
1. What elements of a talent development program have the greatest impact on
developing potential in underserved populations? [Qualitative research
question]
2. How does implementation of a talent development program impact
underrepresented populations regarding achievement? [Hybrid research
question]
3. How does implementation of a talent development program impact
underrepresented populations regarding engagement? [Hybrid research
question]
4. To what degree does a talent development program identify potentially gifted
CLED students in comparison to standardized identification methods?
[Quantitative research question]

5
Theoretical Framework of the Study
In taking an in-depth look at talent development with CLED students, the
researcher hoped to produce findings to initiate change in gifted education policy and
practice. For such change to happen, it was essential for the researcher to take a more
aggressive research stance, one “going far enough in advocating for an action agenda to
help marginalized people” (Creswell, 2014, p. 9). As recommended by Creswell (2014),
this stance could be achieved through a transformative research approach because
transformative research aligns with “a political change agenda to confront social
oppression” (p. 9).
Current research in the gifted education field points to the social oppression of
underrepresented (CLED) populations in gifted education. This information, in
conjunction with the Census Bureau statement that by 2023 public education will be
represented by students who are majority minority (Thornbury, 2010), makes this call to
action more pertinent now than it ever has been. Additionally, within the past 5 years,
NAGC (2015) has called for research that will speak to best practices shown to benefit
underrepresented groups.
Creswell (2014) further stated transformative research is collaborative, provides a
voice for its participants, and develops a study with the intention for results to impact
study participants. This research study was collaborative through the implementation of
Gifted Rating Scales (GRS) as an observation tool and the use of parent and teacher focus
groups as a method of qualitative data collection. Additionally, the district studied was
interested in the findings of such a study, so the research findings had the potential to
benefit the population groups being studied in a long-lasting way. Last, Creswell argued
the collaborative nature of transformative research could allow theoretical perspectives to

6
merge with philosophical assumptions, allowing researchers to “construct a picture of the
issues being examined” (p. 10), and participants to gain a clearer understanding of
results.
Mertens (2012) further contended the transformative paradigm “provides a
philosophical framework that focuses on ethics in terms of cultural responsiveness,
recognizing those dimensions of diversity associated with power differences, building
trusting relationships, and developing mixed methods that are conducive to social
change” (p. 802); however, because the transformative paradigm is a more recent
framework in research, Creswell (2014) recommended focusing this paradigm with a
specific educational theory. The theory this study used to focus the transformative
paradigm was the Educational Equity Theory.
As stated by the Center for Public Education (2016), the Educational Equity
Theory grew out of the U.S. Supreme Court Brown v. Board of Education decision and
initially spoke of equity of education as education being provided for all. Today, equity
is more comprehensive and includes opportunity and access, participation, and outcomes
(Center for Public Education, 2016). The Center for Public Education also connected
educational equity to the changing student population in America, the excellence gap in
gifted education, and the need for rigorous curriculum for all.
The transformative stance of this research developed through the Educational
Equity Theory addressed the concept of talent development and how the use of this
practice impacted the current excellence gap in gifted education. The talent development
framework developed by Olszewski-Kubilius and Thomson (2015) guided the
implementation components of the study. Some specific components of this talent
development framework included looking beyond an individual’s IQ, recognizing
7
noncognitive abilities, utilization of the growth mindset (talent is malleable), focusing on
general rather than specific skills as indicators of potential, attention to subgroup norms,
and deliberate cultivation of psychosocial skills to support students as they “become
gifted” (Olszewski-Kubilius & Thomson, 2015, pp. 53-54).
Additionally, Olszewski-Kubilius and Thomson (2015) called attention to the
influence of a student’s home life and/or culture on their development and recommended
one element of talent development interventions be an intentional building of
relationships between a student’s home and/or culture and the educators at the school
level in charge of implementing the academic component of talent development.
Renzulli (2015) further stated such connections increase levels of active student
engagement, transforming the way they approach, attend, and interact with their
education. The transformative framework of this study served to pull these concepts
together for all levels of participants in the study.
Nature of the Study
The collaborative nature of a transformative framework further supported the
explanatory mixed methods nature of this study, defined by Creswell (2014) as research
where the researcher collects quantitative data, completes data analysis, and then engages
in qualitative research to explain the quantitative results in more detail.
The initial quantitative data collected in this study included i-Ready diagnostic
assessments, GRS, Panorama Education Student Surveys, attendance reports, Naglieri
Nonverbal Ability Test (NNAT) screening results, and teacher and parent perception
surveys. Follow-up qualitative data were collected through teacher and parent focus
groups and post-teacher and post-parent perception surveys. The qualitative elements of
the explanatory mixed methods study allowed the researcher to utilize input from focus

8
groups and surveys to help explain the quantitative results of the study (Creswell, 2014).
When applied, the explanatory mixed methods research approach assisted the researcher
in determining whether the talent development approach to gifted education positively
impacted academic performance, engagement, and motivation of students typically
underrepresented in gifted programs.
This approach was important to the nature of the study because
underrepresentation in gifted education is a multi-faceted issue, with many contributing
factors; and engaging in qualitative data discussion with administration, teachers, and
parents helped explain discrepancies between data points and further informed the
quantitative data collected. Determining specific causes or most impactful solutions to
the issue of underrepresentation was essential if the researcher hoped to transform future
gifted education practices and policies, and the explanatory mixed methods approach
built necessary data knowledge for this transformation (Creswell, 2014).
Definitions
AIG coordinator. An AIG coordinator is the director of academically-
intellectually gifted services in a district; one who works with AIG specialists and regular
education teachers on developing and refining AIG services provided to students.
AIG specialist. An AIG specialist is an educator with a degree in gifted
education who works specifically with AIG identified students.
CLED students. CLED students are students with cultural, linguistic, or
economic diversity such as students from African-American or Hispanic backgrounds,
students learning English as a second language, or students from low socioeconomic
backgrounds (NAGC, 2015).
Cluster grouping. Cluster grouping refers to groups of four to eight gifted

9
students placed in a heterogeneous classroom who still receive specialized instruction
based on their gifted needs.
Cultural bias. Cultural bias is interpreting or judging a situation through
standards relative to one’s native culture. Cultural bias can be implicit or explicit in
nature.
Excellence gap. An excellence gap is “differences between subgroups of
students performing at the highest levels of achievement” (Plucker, Burroughs, & Song,
2010, p. 9).
Gifted. Gifted defines an individual with advanced ability in one or more of the
following areas: academic, intellectual, creativity, athletics, leadership, musical, or
social-emotional perception.
GRS. One form of a teacher rating scale developed by Pfeiffer and Jarosewich
(2007). The form has six profile areas districts can use for identifying gifted or high-
ability learners: intellectual ability, academic ability, creativity, artistic talent, leadership,
and motivation.
Multiple-criteria. Multiple-criteria means utilizing more than one method to
identify students for gifted services.
Naglieri Non-Verbal Ability Test (NNAT). A nonverbal aptitude test composed
of logic puzzles, given to students ages 4-18 to identify their level of general ability and
giftedness.
Regular education teacher. A regular education teacher is an educator with a
degree in education who works with all students; most regular education teachers will
have AIG students in the inclusion setting at some point in their career.
Talent development. Talent development is the use of instructional and

10
noninstructional strategies to locate potential talent in students and implement
interventions to nurture student potential into product.
Underrepresented population. An underrepresented population is a
demographic subgroup not equally represented in an educational program when
compared to the “norm” of the demographics in an area.
Assumptions
All research studies, as stated by Simon (2011a), have elements the study is
dependent upon but are out of the researcher’s control. Considering the transformative
explanatory mixed methods approach of this research study, one of the essential
assumptions to address was the assumption of participant honesty. The researcher
assumed participants who partook in the surveys and focus groups utilized in this study
did so in an honest and candid manner. To provide an environment where participants
felt they could be honest and candid, survey participation was optional, participants
remained anonymous, and results remained confidential. Focus group results were also
confidential, participants remained anonymous, and participation was optional.
Additionally, the researcher assumed participants who agreed to be part of the
study were truly interested in participation. As previously stated with the survey,
participation in the talent development program was optional; however, the researcher
still needed to ensure participants were not swayed into participation by external rewards
such as monetary rewards or other forms of recognition for students and/or families who
chose to participate. No rewards or recognition of this sort occurred. Furthermore, AIG
services currently provided in the district, as stated in the local AIG plan, were provided
for students who identified for these services whether the school was participating in the
additional talent development services or not. A principal’s decision to implement

11
additional talent development services for underrepresented groups did not positively or
negatively impact any other group. In addition to the absence of rewards and recognition
and the continuation of services as determined by the district’s AIG plan for all
nonparticipants, intervention participants and focus group participants were given the
opportunity to withdraw from the study at any time with no ramifications, allowing all
participants to exit the study if they in any way felt uncomfortable and/or were no longer
interested in being part of the study.
Scope
This dissertation follows a conventional five-chapter dissertation format with
Chapter 2 serving as a literature review, Chapter 3 providing methodology, Chapter 4
discussing findings, and Chapter 5 explaining the researcher’s conclusions and future
recommendations (Bingham, 2012, as cited in Brown, 2017). Each chapter reviews the
research problem before connecting the study to the chapter details. Chapter 2 presents
the literature and prior research the study was built upon to provide a comprehensive
view of the problem being studied. Chapter 3 provides an explanation of the study
participants, the study site, the data collection, and the data analysis. Chapter 4 presents
the results of the study, referencing results in relation to the research questions. Chapter
5 summarizes all the findings as they relate to future recommendations in policy change,
best practice, and research helpful in solving the research problem. Dissemination of
findings are expressed through the transformative paradigm and Educational Equity
Theory to “encourage use of the results to enhance social justice and human rights”
(Creswell, 2014, p. 71).
Limitations/Delimitations
Limitations. All research studies have limitations (influences the researcher

12
cannot control) and delimitations (choices specifically made by the researcher that could
impact the results; Baltimore County Public Schools, 2017). Many of the study’s
limitations and delimitations revolved around the site choices for the study. As
previously stated, there was a documented excellence gap and an issue with
underrepresentation of gifted CLED students in the district where the study took place,
and leaders within the district were looking for research to support a possible solution.
One limitation of this decision was the researcher’s role as the district’s AIG coordinator.
While this role placed the researcher in the field of the study, the researcher was not the
teacher of record for the students receiving the intervention, nor did the researcher
complete the GRS on these students. Additionally, the researcher was not the only AIG
specialist implementing talent development services within the district.
To account for possible bias which could influence the study, the researcher
showed both sides of the story, spent extended time in the field of study (to increase
accuracy of findings), and used peer debriefing through data collection (Creswell,
2014). Additionally, the researcher, in a position to control decision-making regarding
gifted education in the district, needed to take extra steps to build trust with teachers and
members of focus groups so data collected in these settings were valid.
Another limitation from site choice was the control the district gave to school
leaders regarding participation in the study. Within the district being studied, there were
six elementary schools. Only two administrators chose to have their schools participate
in the study. Of these two schools, one of the principals also required all staff to receive
training in gifted education and talent development. The principal at the other elementary
school highly encouraged their staff to receive this training but did not require it. While
teacher training is considered an important component to meeting the needs of CLED

13
students, planning with teachers is a required component of talent development services
(Olszewski-Kubilius & Thomson, 2015). Collaborative planning between the AIG
coordinator and regular education teachers happened at both participating elementary
schools.
Sampling of participants could also be considered a limitation for the study. As
previously mentioned, the study was conducted in the researcher’s district, so a sample of
convenience was utilized. For this reason, the results cannot be generally applied to the
entire population but could be suggested as applying to mid-sized, urban school districts
with similar demographics to the research site. Additionally, since focus groups were
created from a bank of interested teachers and parents, the researcher had to be
intentional in choosing participants, so a representative sample from the volunteer group
was created. These steps served to increase the validity of the overall study (Creswell,
2014).
Last, the 3-month time constraint of the research study needed to be considered.
An intervention such as talent development requires time for implementation to produce
change in achievement and identification. Three months did not really provide enough
time to determine if the intervention worked to the highest authentication. This time
constraint was another reason the researcher completed an explanatory study, specifically
probing focus groups of teachers and parents for their thoughts on how talent
development, based on the 3-month implementation, could impact future results in
achievement and identification of CLED populations.
Delimitations. In addition to these limitations, it is necessary to discuss
delimitations of the study such as the choice of intervention practice, study participants,
methodology, and evaluation instruments. Starting with the independent variable of the

14
intervention, the researcher reviewed numerous CLED best practices (valid instruments,
multiple sources, providing opportunity, increasing family involvement, adjusted
programing, and training teachers) as recommended by Dunn (2008), Ford (2010), and
Queen (2006) before settling on the intervention of talent development. While there were
many possible interventions shown to be beneficial to CLED students, talent
development was chosen for this study because NAGC (2015) recently noted talent
development as a best practice they were looking for sites to successfully implement.
Just as there were many interventions available, Peters and Pereira (2017) noted
there were numerous rating scales available (Scales for Rating the Behavioral
Characteristics of Superior Students, the Scales for Identifying Gifted Students, the
HOPE teacher rating scale, and the GRS). The researcher chose to use the GRS in this
study because the district already had access to this scale, teachers had training and
practice in this tool previously, and the research completed by Peters and Pereira stated
none of the four tools noted was significantly better than the others. The GRS, however,
did show the highest positive results regarding identification of underrepresented
populations, the focus population of the research study (Peters & Pereira, 2017).
Participant selection was another delimitation to call to attention. In determining
participant selection, the researcher needed to make decisions regarding three areas of
participant description: demographic subgroups, grade levels, and specific student
selection. When choosing the subgroups on which to focus in the study, the researcher
noted first the subgroups that were under/overrepresented in the district being studied.
The top three subgroups where there were discrepancies according to the U.S.
Department of Civil Rights Equity Allowance, which states there should be no greater
than a 20% discrepancy between general district demographics and demographics of

15
students served in special education programs (Ford & King, 2014), were African-
American, Hispanic, and Caucasian. Additionally, the researcher noted these three
subgroups were the three largest subgroups in the district. Urdan (2010) claimed the size
of these subgroups would develop a representative sample for the researcher, increasing
the strength of the study’s statistical analysis. The research of Ford and King (2014) and
Urdan supported the researcher’s decision to focus on the African-American, Hispanic,
and Caucasian subgroups for this study.
The second participant criteria, as determined by the researcher, was to focus the
study on fourth- and fifth-grade students. As noted in Urdan (2010), comparative
assessment measures are necessary for researchers to complete within-group and
between-group data comparisons. In the district where the study was being conducted,
the fourth through eighth graders took comparative assessment measures using i-Ready
benchmark assessments. Within this window of fourth through eighth grade, Olszewski-
Kubilius and Steenbergen-Hu (2017) and A. Harris (personal communication, November
8, 2017) found upper elementary grade ranges (fourth and fifth grade) to be the key time
for identification, because students in the upper elementary grade range have been given
enough academic foundation to support students on identification measures but still have
enough time remaining to build skills for high school honors courses.
Once the researcher decided to focus the research study on fourth and fifth
graders in the African-American, Hispanic, and Caucasian subgroups, the final
participant selection criteria of individual student participation was determined. Utilizing
the guidelines of the U.S. Department of Civil Rights Equity Allowance Rule (Ford &
King, 2014), the researcher chose to invite students in the top 20% of their subgroup to
receive the talent development intervention. Specifically, the guidelines utilized by the

16
researcher stated that when there was an extreme discrepancy between demographics of a
subgroup and the subgroup’s representation in a special education program, schools
should utilize the 80-20 philosophy (casting a net of representation for a minimum of
20% of each subgroup) developed from the Griggs v. Duke Power court case (D. Ford,
personal communication, November 9, 2017). According to D. Ford (personal
communication, November 9, 2017), the 80-20 philosophy, while not a perfect path to
equality of representation, is a way to guarantee each subgroup in the general population
is provided access and opportunity to all levels of education.
Finally, the decision to complete a transformative explanatory mixed methods
study was made based on research by Creswell (2014) stating mixed-methods research
“provides a stronger understanding of the problem or question than either by itself” (p.
215). Beginning the research with quantitative data provided a foundation for the
qualitative phase of the study, where the focus groups helped provide more depth and
insight into the quantitative results of the study (Creswell, 2014). Through the
explanatory mixed methods approach, the researcher was able to confirm or deny the
impact of talent development interventions and determine the most impactful elements of
the implemented program.
Significance
Olszewski-Kubilius and Thomson (2015) believed the call for talent development
research by NAGC (2015) and the recent holdings of talent development summits by
NACG policy groups hoping to locate school-based programs achieving success with
low-income and culturally diverse populations proved the field of gifted education was
finally ready to “examine its core tenets and ask difficult questions about whether they
are still valid or in need of revision” (p. 51). The Department of Education appeared to
17
support this discussion, recently requiring states to include specific action steps in their
gifted education plans (policy reports written every 3 years meant to summarize district
programming for gifted education) for CLED student development (Coleman & Shah-
Coltrane, 2015). Furthermore, Coleman and Shah-Coltrane (2015) recommended
researchers create and study pilot programs intended to nurture potential in early
grades. Siegle et al. (2016) supported this recommendation, stating, “promoting research
to uncover the essential program components linked to favorable academic outcomes of
identified gifted and underrepresented gifted students is of paramount importance” (p.
105).
Summary
Clearly, individuals from the local, state, and national levels are searching for
answers to the age-old problem of an excellence gap, demonstrated by the
underrepresentation of CLED students in gifted education. It is now clearer than ever, “if
we never reap the benefits of the untapped potential talent in these students, we will bear
the burden of their failure” (Friedman & Mandelbaum, 2011, p. 4). “The cost to the
nation in terms of talent unfulfilled and lives of promise wasted is enormous” (Burney &
Beilke, 2008, p. 305); and research in the area of talent development, if successful, could
“help move the field of gifted education toward a more sophisticated, nuanced, and
developmental approach to giftedness” (Saiying & Olszewski-Kubilius, 2016, p. 104),
resulting in success for all populations, rather than only some.

18
Chapter 2: Literature Review
Introduction
All children deserve a fair chance to have access to rigorous curriculum meant to
develop their potential; but unfortunately, NAGC (2017) recently noted high-achieving
students in CLED populations are 2.5 times less likely to be given this access. The
exclusion of certain populations in gifted education results in intentional enrichment of
students who fit a mold and a lack of attention to students who do not (Reinhard, 2016).
The result of this exclusion is a growing excellence gap in gifted education. Despite
awareness of this problem for decades, only recently has NAGC (2015) called for
researchers to locate solutions such as the Talent Development Model of Gifted
Education. Stressing the importance of such solutions, Reinhard (2016) and Wiggins-
Dockery (2017) warned of the long-term consequences in economic competitiveness for
the United States of America and the lack of cultivation of American talent if the
excellence gap in gifted education continues to grow. Now is the time. Something must
be done for subgroups of students who have previously not been given access to
educational opportunities allowing them to develop their giftedness and academic
potential.
Literature Search Strategy
The research questions for this study approach gifted education through a
transformative lens, with the study’s purpose being to assess one possible solution to the
growing problem of underrepresentation in gifted education. As the researcher developed
knowledge about the excellence gap and the use of the Talent Development Model in
gifted education, themes within the research emerged: the problem of the excellence gap
has existed for decades; there are consistent factors leading to an increase in the

19
excellence gap; extensive research exists on what students of CLED populations need;
few programs where these elements are implemented exist; and talent development is an
educational approach which accounts for research-based needs of CLED students. Using
a thematic outline to guide the literature review, the researcher completed a literature
search to develop the construct of the study. The literature review used to frame the
research study and researcher’s decisions is included in this section.
Theoretical Foundation
Javius (2017) defined educational equity as, “providing students and adults what
they need to exceed performance targets, then tapping into how students make meaning
through their cultural, racial, and social filters . . . to ensure success for all” (p. 18).
Educational equity, Javius contended, has moved to center stage in the education world
as excellence gaps have become prevalent in multiple subgroups and at multiple grade
levels. The researcher of this study believes in educational equity for all students and is
aware of the need to tap into student potential to close the gap educational inequity has
created.
Ford and King (2014) further noted educational equity is federal law. In fact, in
1971 through the Griggs v. Duke Power Co. court case, the Office of Civil Rights
instituted a 20% equity allowance, setting “a targeted goal for the minimally accepted
level of underrepresentation of each racial subgroup” (Ford & King, 2014, p. 304) when
reviewing placement in special education programs such as special education and gifted
education. A school or district’s adherence to the Civil Rights Equity Allowance is
determined by calculating an Equity Allowance Index (Ford & King, 2014). According
to Ford and King, the formula for a Gifted Education Equity Index is .8 x the total
percent of a subgroup in the school or district. The resulting percentage is the minimal

20
percentage of students in the specific subgroup who should be identified for gifted (or
special) education.
Equity of education, however, should not be a goal of an organization simply
because law mandates equality. Instead, Javius (2017) recommended researchers and
organizations striving for educational equity should look in depth at the theoretical
framework of the Equity Theory of Education. Specifically, Javius stated researchers
who use the Equity Theory of Education to guide their research study must understand
the why, how, and what behind the theory to fix gaps created by inequity.
First and foremost, Javius (2017) noted research studies must have a compelling
why that fills researchers with moral imperative and internal fire. The transformative
nature of this study illustrates the passion needed to get to the why of educational equity,
including the attention to root causes, acceptance of historical issues of power and
privilege, and the realization of the fact American schools were designed to accelerate
students from the prominent social class (the middle class) and culture (Caucasian) of the
country (Javius, 2017, p. 19).
Additionally, Javius (2017) noted the influence of the how and what of
educational equity. When referencing the how of educational equity, Javius claimed
rigorous instructional planning was essential, specifically the type of planning which
leads to culturally conscious teaching and understanding perspectives of multiple
cultures. From there, educational equity will result in the what, or the transformation of
both adults and students in the educational system ready to advocate against privilege and
inequity in the current educational system (Javius, 2017).
In the end, building a research study around the Equity Theory of Education could
be uncomfortable and go against the status quo, but a paradigm shift such as the one

21
necessary to transform the state of gifted education cannot occur without this discomfort
(Mezirow, 2009).
Excellence Gap
Plucker and Peters (2016) called to the attention of educators everywhere the fact
that the focus of the American education system more often lands on struggling students
and filling achievement gaps than on potential of higher-ability learners, in turn, failing to
encourage educational excellence. This lack of attention to high-ability students, Plucker
and Peters contended, has played a role in low-ranking achievement of the United States
in comparison with other countries and could eventually negatively impact the economic
growth of the country. Instead of striving for a narrowing of achievement gaps by
meeting minimum proficiency, Plucker and Peters argued, “gains could be made by
helping talented students learn and achieve at their full potential” (p. 52).
Defining the excellence gap. Many gaps exist in the education field:
achievement gaps, opportunity gaps, gender gaps, and race gaps. Plucker and Peters
(2016) called attention to another, possibly more dangerous, gap: the excellence gap,
often seen in gifted education. As defined by Plucker and Peters, the excellence gap is a
gap in achievement between students who began with similar initial ability, but due to
disparities in access to higher levels of curriculum and instruction, grow to achieve at
different levels. Furthermore, Plucker and Peters noted the excellence gap looked beyond
whether students were excellent regarding achievement to whether students who were
already high achievers were growing with gaps in performance between groups. Plucker
and Peters argued the excellence gap was one of the most perilous gaps in education
because the higher levels of access which created the excellence gap were only provided
to students who achieved at excellent levels, creating a vicious cycle and only

22
exacerbating the problem.
History of the problem. The excellence gap in gifted education has existed for
many years. Two famous reports calling attention to the problem of the excellence gap in
gifted education are Gallagher’s (1974) Talent Delayed-Talent Denied: The Culturally
Different Gifted Child and National Excellence: A Case for Developing America’s Talent
(Office of Educational Research and Improvement, 1993). In the 1974 report on gifted
education (cited in Coleman & Shah-Coltrane, 2015), Dr. James Gallagher addressed the
nature of school programs, the system implementing these programs, the social
environment of children, and public decisions impacting these programs. As reviewed by
Coleman and Shah-Coltrane (2015), assessment of these issues brought to the attention of
the gifted community how much “unused and unstimulated potentials of talented children
from culturally different backgrounds existed” (p. 70). A long 20 years later, National
Excellence: A Case for Developing America’s Talent called attention to similar concepts,
stating, the “United States is squandering one of its most precious resources; the gifts,
talents, and high interests of many of its students” (Office of Educational Research and
Improvement, 1993, p. 1). Both documents focused on the lack of access to CLED
students and called for a reform of the American education system that would increase
access to advanced educational opportunities for these students; however, 40 years after
the initial release of these powerful reports, the problems of underrepresentation in gifted
education are still present.
Olszewski-Kubilius and Clarenbach (2014) stated the nation is extremely aware
of this problem; but despite awareness of the problem, unfortunately, “the nation does not
yet seem committed to changing” (p. 103). Making changes to gifted curriculum, gifted
services, and the definition of giftedness are a priority if history is not to repeat itself.

23
Ultimately, “if we never reap the benefits of this untapped potential talent in these
students, we will bear the burden of their failure [in the future]” (Friedman &
Mandelbaum, 2011, p. 4).
Proof of the problem. Dunn (2008) and Ford (2010) found generally 41% of the
African-American population is underrepresented, while conversely, 17% of the
Caucasian population is overrepresented in gifted education; discrepancies determined by
comparing the demographics of a school with the demographics of the gifted education
program at the same school. Olszewski-Kubilius and Clarenbach (2014) stated this
comparison of demographics can show upwards of a 50% disproportionality between
school demographics and gifted programs at those same schools (p. 104). Ford (2010)
stated that at most there should be no more than a 20% discrepancy when looking at
racial breakdown within gifted education based on the Office of Civil Rights Equity
Allowance previously discussed (p. 34).
When looking at standardized testing, Grissom and Redding (2016) found similar
discrepancies existed, stating even when students had high achievement scores on
standardized testing, African-American students were 66% less likely than Caucasian
students to be identified as gifted and Hispanic students were 47% less likely than
Caucasian students to be identified as gifted.
Gallagher and Gallagher (2013) additionally looked at the low numbers of
students of poverty in gifted education, noting multiple sources showed an average of a
44% drop in low-income students who are identified as gifted in first to fifth grade (p.
113). Additionally, Gallagher and Gallagher found regular education classes these
students are placed in are typically fact-oriented and have a culture that can discourage
high achievement.

24
This underrepresentation in gifted classrooms of CLED students is a problem,
because as Thornbury (2010) stated, “gifted and talented individuals are present
throughout the distribution of society (regardless of culture, race, linguistic background
and socioeconomic status), so it is illogical to find enrollment in gifted and talented
programs disproportionate to the greater population” (p. 10). Going one step further,
Baker (2013) blamed the education system, calling it a “flawed system that reinforces
segregation and contributes to gaps in achievement” (para. 17). Thornbury stated
underrepresentation will become an increasingly larger problem if one looks at the
Census Bureau which predicts that by 2023, half of the children in the USA will be
current minorities (p. 22). Ford (2010) also discussed this increase and the urgency with
which solutions need to be developed.
Why Underrepresentation Exists
Numerous gifted education researchers have analyzed reasons for
underrepresentation in gifted education (Dunn, 2008; Ford, 2010; Grissom & Redding,
2016; Hammond, 2015), finding some of the most prominent causes of
underrepresentation to lie in biased identification and recruitment procedures; inability to
retain underrepresented populations in gifted programs; and student and teacher
perceptions of issues such as racial identity, reasons for motivation, and potential in high-
ability CLED students. Ford (2010) looked even further past these commonly noted
barriers to underlying root causes such as deficit thinking, colorblind ideology, and White
privilege. All three of these root causes, Ford (2010) noted, could be linked to low
expectations of underrepresented groups and the inability of educators to notice strengths
and potential in CLED students.
Biased identification standards and methods. Coleman and Shah-Coltrane
25
(2015) cited work of Gallagher (2001), which pointed to biased identification methods in
gifted education: standardized testing and narrow pathways. While Gallagher (2001, as
cited in Coleman and Shah-Coltrane) noted the importance of IQ in determining one’s
gifted ability, Gallagher (2001) also noted “IQ scores cannot measure ‘native ability,’ and
cannot be used alone without regard to motivational or social factors” (Coleman & Shah-
Coltrane, 2015, p. 71). Grissom and Redding (2016) further contended that even when
other assessments are utilized in conjunction with IQ testing, the narrow, achievement-
based definition of giftedness still leads to biased identification methods based on
academic achievement.
Carman and Taylor (2010) and Naglieri and Ford (2003) noted a common
response to these arguments about biased identification methods: Use of nonverbal tests
result in greater numbers of students identified for giftedness from racially diverse or
lower SES backgrounds. While in theory this belief makes sense, Carman and Taylor
found there was no significant difference in performance and, in turn, identification of
CLED populations when using nonverbal tests. D. Ford (personal communication,
November 12, 2017) contended the lack of difference in identification is attributed to the
implicit bias and culturally and linguistically loaded information, vocabulary, similarities,
and comprehension in the question stems of these assessments. Through multiple
research studies, Naglieri and Ford found the only test shown to lack these forms of bias
was NNAT. Ultimately, the message when looking at identification measures, including
nonverbal assessments, was nonverbal testing is an important tool to utilize in
identification but should not be the only tool used in the screening process (Carman &
Taylor, 2010; D. Ford, personal communication, November 12, 2017; Naglieri & Ford,
2003).

26
Educator perceptions. As identified in the previous section, because
underrepresented populations often miss the mark on standardized testing pathways,
teachers are left controlling the gateways to access for underrepresented populations.
Ford (2010) contended this pathway still presents a barrier for underrepresented
populations because educators are not trained in gifted characteristics of these
populations, blinding them from seeing potential in these students. Additionally, Ford
(2010) found deficit thinking, colorblindness, and White privilege to negatively impact
educators.
Deficit thinking, as defined by Ford (2010), is “grounded in the belief that
culturally different students are genetically and culturally inferior to White students” (p.
32). Olszewski-Kubilius and Clarenbach (2014) agreed, stating deficit thinking leads to
the inability of educators to see strengths in students who do not fit the mold of a typical
gifted student and can influence educator opinions on criteria, policies, curriculum, and
relationships regarding students from a different race or culture than themselves. Ford
(2010) suggested deficit thinking is enhanced through White privilege and the belief
education is solely an academic meritocracy where students are rewarded only for their
academic ability.
Converse to deficit thinking, colorblindness, or “being fair by not seeing
differences and treating everyone the same” (Ford, 2010, p. 32), can be just as
detrimental to CLED students. While educators believe they are being fair to all students,
refusal to see the differences between students of different cultures leads to
unintentionally skewed curriculum, policies, and criteria, similar to those brought about
through deficit thinking.
Grissom and Redding (2016) connected deficit thinking, colorblindness, and

27
White privilege to the Bureaucratic Representation Theory, defined as “who the providers
of the services are (the teachers) matter to the outputs (services) distributed to the client
population (the students)” (p. 2). In applying this theory to gifted services, Grissom and
Redding found teachers were more likely to recommend students of the same race as
themselves for gifted services; and in schools where there were few to no educators of
color, CLED students were recommended at even more disproportionately lower rates
than Caucasian students.
Cultural perceptions. Dunn (2008) noted that for many CLED students,
negative peer pressure was felt when they participated in gifted services (alienation in
gifted classes, isolation from peer groups, or accusations of acting White). Grantham and
Biddle (2014) agreed, stating, “peer accusations of acting White undermine gifted and
high-achieving Black students’ academic motivation and their interest in challenging
courses and programs” (p. 178). Lovett (2011) further pointed out CLED students who
are placed in mostly White gifted programs might have difficulty finding others “like
them” in their classes, leaving them to develop encouragement and support on their own
(p. 56). This ostracism by cultural peers impacts student self-concept and racial identity
development and has the potential to lead to a negative sense of self, increased social-
emotional concerns, desire to drop out of gifted services, and underperformance of fully
capable students (Grantham & Biddle, 2014; Lovett, 2011).
In addition to peer pressure, Burney and Beilke (2008) noted poverty and race are
not simply defined by money and color, and additional constraints could have a potential
impact on the successes of CLED students. For example, Burney and Beilke noted many
CLED families lack self-efficacy, or belief in their child’s ability to be successful in
gifted programs. Lovett (2011) supported this statement, noting parents in one of their
28
research case studies adamantly expressed concern that the expectations of the gifted
courses their child was being placed in were too high to equate to success. A. Harris
(personal communication, November 8, 2017) further noted students from CLED
populations often feel pressure from their families and communities to uphold certain
images and cultural expectations, which may hold them back from participating in gifted
programs.
Ways Schools Can Decrease the Gap
Dunn (2008) called attention to multiple opportunities for the future of gifted
education in relation to decreasing the excellence gap and problem of underrepresentation
of CLED populations in gifted education. Specific suggestions included implementing
culturally responsive teaching methods, redefining giftedness, improving the
identification process, promoting talent development, and addressing policy issues
(Dunn, 2008; Ford, 2013).
Culturally responsive curriculum methods. Curriculum can open doors for
underrepresented populations, but it can also serve as a greater barrier if it is not
developed with cultural considerations in mind (Jarvis, 2009). Breaking down the barrier
of curriculum, Jarvis (2009) argued, was the implementation of “the curriculum catalyst”
(p. 237), or an appropriate curriculum that can give students a sense of identity and result
in emergence of their individual talents. In fact, through research studies, Jarvis found
students who were provided a curriculum of opportunity were more likely to display
gifted traits than those who did not receive teaching through adjusted curriculum,
supporting the belief it was more likely for students exposed to appropriate curriculum to
be identified for gifted services.
Ford (2013) also called attention to the need for a culturally relevant curriculum,

29
or curriculum and instruction designed to meet the needs of CLED students and their
specific culturally based learning styles, by developing the Ford-Harris/Bloom-Banks
culturally responsive matrix. Eriksson and Lukens (2017) noted another culturally
responsive framework, the Culturally and Internationally Responsive Curriculum (CIRC),
implemented in Project ELEVATE (English Learner Excellence Evolving through
Advanced Teacher Education) with much success for underrepresented populations. As
with Ford’s (2013) matrix, the CIRC curriculum looks for engaging, collaborative,
multicultural, and responsive curriculum, along with lessons meant to provide the chance
to critically think, problem-solve, and attend to issues of social justice (Eriksson &
Lukens, 2017). Ultimately, Trotman-Scott and Ford (2017) stated, “when used correctly,
multicultural curriculum gives students an opportunity to reach their maximum academic
potential, as well as develop in areas that the teacher may otherwise not be aware” (slide
4).
One specific culturally responsive teaching method, recommended by Coleman
and Shah-Coltrane (2015) and supported by Tomlinson’s Parallel Curriculum (as cited in
Jarvis, 2009), proven to attend to the expectations listed in the two previous culturally
responsive frameworks is problem-based learning. Problem-based learning is “a model
of curriculum and instruction in which learning starts with an ill-structured, or open-
ended problem that is designed to lead students to specific content in the curriculum”
(Center for Talent Development, 2013, p. 1). The Center for Talent Development (2013),
Coleman and Shah-Coltrane, and Gallagher and Gallagher’s (2013) research reinforced
problem-based learning as a curricula choice for underrepresented populations.
Specifically, Gallagher and Gallagher utilized problem-based learning to identify students
with Advanced Academic Potential (AAP) and then continued to develop potential in

30
AAP identified students through a problem-based learning enriched curriculum.
Gallagher and Gallagher’s findings showed AAP students, specifically those in CLED
populations, showed a greater increase in motivation when using problem-based learning
experiences than regular education or lower-level learners (Gallagher & Gallagher,
2013). This research by Gallagher and Gallagher supported the use of problem-based
learning as a curriculum catalyst for underrepresented populations in this research study.
Queen (2006) additionally called attention to noninstructional, culturally
responsive methods that could enhance student achievement such as parent outreach and
teacher training. Davis, Brulles, and Kendrick-Dunn (2017) also stressed the importance
of parent outreach, stating when parents are invited to share their voice at the table of
discussion, they can serve as the cultural agents who bridge the gap between school,
community, and the home. Further connecting with Queen, Davis et al. noted this
outreach and inclusion often does not happen because teachers are not appropriately
trained in multicultural gifted education. If, instead, teachers were trained in needs of
CLED students, not only would CLED students benefit, a group of teachers who truly
value gifted education and could serve as advocates for underrepresented populations
would be developed.
Definition review. Over the years, the definition of gifted(ness) has been altered
numerous times. Dunn (2008) pointed to three pivotal documents or orders which have
led to adjustment of the definition of giftedness: The Marland Report in 1972, the Javits
Gifted and Talented Act of 1988, and the Office of Education Research and Improvement
in 1993, arguing the constant adjustments in the definition of gifted(ness) could increase
teacher bias and perception depending on the definition they were taught. The first
definition of giftedness, as argued by Dunn, was the Marland Report, where giftedness
31
was defined as showing outstanding abilities and capability of high performance in a
broad range of domains. Similar to the Marland Report, the Javits Act in 1988 defined
giftedness as evidence of high performance capability in a broad range of areas, only
removing the concept of psychomotor ability from the Marland Report definition (Dunn,
2008). The greatest change in definition, Dunn contended, was achieved in 1993 when
the Office of Education Research and Improvement removed the word “gifted” from the
definition, replacing it with “outstanding talent” (p. 18). While Queen (2006) agreed
with Dunn’s progression of the definition of giftedness, Queen noted other influential
reports or research that swayed development of the definition: Project Head Start in 1962
(making educators aware of the need to address talent in society); the increased use of the
Torrence Tests of Creative Thinking in the 1980s; and the debates between Gardner,
HermStein, Murray, and Gagne on the true meaning of giftedness.
Most recently, Olszewski-Kubilius and Clarenbach (2014) called attention to a
more necessary discussion than defining giftedness, the discussion of changing the
discussion of giftedness from performance of students to potential for performance in
students. Gifted education advocates, according to Olszewski-Kubilius and Clarenbach,
need to help education “move from the mindset that we identify first and serve second, to
the mindset that we serve first in order to develop talent that can then be identified” (p.
105). Renzulli (2002) and Tomlinson (2001, cited in Jarvis, 2009) agreed, stating the
definition of giftedness must be multi-faceted, consider cultural backgrounds, and look at
potential rather than only performance to bring about change in gifted education.
Mindset shift. Dai (2015) advocated for gifted education to look at the mindset
shift from performance to potential as the difference between the pyramid of
opportunities (the naturally selective mindset that places only a few at the top) and the
32
revolving door (the mindset that all individuals should be able to try out enrichment,
allowing those with potential, excellence, or motivation to stay).
Gifted education, Dai (2015) suggested, is currently driven by an elitist viewpoint
which is intensified by unclear identification methods and services only meant to impact
small numbers of “cognitively elite” students (p. 270). This viewpoint is compounded by
the meritocratic nature of the education system, where being gifted is determined by
criterion-based systems, excellence is possessed not earned, and being “gifted” is seen as
a privilege. Dai warned this IQ-stratified approach could create a “social efficiency
model” of a “gifted, average, and mentally challenged” (p. 270) breakdown of the
population. Opposing the social efficiency model is the egalitarianism viewpoint built on
the belief that everyone is equally capable and no merit-based selections are
needed. This viewpoint is just as troublesome as social efficiency when considering
under the egalitarianism viewpoint no social recognition is given for excellence and no
differentiated education is provided, making advanced education a moot point.
Instead of either of these thought processes, Dai (2015) suggested shifting
mindset to a talent development paradigm where a middle ground between the socially
elite and egalitarianism viewpoints could be created. Dai referred to this mindset as the
Jeffersonian Vision, or “a vision of human potential and ideal society, which sees human
potential as pluralistic rather than monolithic, and diverse talents as widely distributed
across all walks of life (rich and poor)” (p. 270). The Jeffersonian Vision, developed
from Gardner’s belief that intelligence is multidimensional and creativity is widely
distributed in a population, would encourage “society to cultivate talents and reward
people for what they do, not what they are” (Dai, 2015, p. 270).
Dai (2015) completed further research with the Jeffersonian principle to provide
33
justifications of this model. The key points he found included paying attention to
emergent talents; providing opportunity in the areas of high aptitude; and the use of
curriculum based on creativity, leadership, and innovation. Through these steps, a group
of elite performers, rather than an elitist mentality, is created. Locating this group of
performers required Dai and his fellow researchers to consider multiple criteria and
multiple methods of assessment, all elements shown to benefit typically underrepresented
gifted populations.
Increase student engagement. Renzulli (2015) asked educators to imagine
teaching students who were as excited about their core classes as they are for a robotics
competition or their school yearbook class. The reason these experiences do not typically
mirror the same excitement in students, Renzulli (2015) noted, is due to the fact students
are not engaged in core academics in the same ways they are engaged in robotics or
classes such as yearbook. While Renzulli (2015) did not deny core classes must teach as
prescribed by standards, he argued high-engagement activities could be aligned with
standards-based curriculum. Thornbury (2010) found talent development, particularly
with students of high potential, to be a pathway for increasing student engagement and
intrinsic motivation while still aligning to state standards. Specifically, Thornbury
pointed to the critical thinking, creative problem-solving, and deductive thinking
components of talent development programs as engaging factors and intrinsic motivators
for students. Thornbury further found these components to benefit typically
underrepresented populations because students from CLED populations “have fewer
opportunities to develop the academic skills (such as critical thinking and problem-
solving) necessary for success in school” (p. 33). Ford (2010) further noted, CLED
students often exhibit gifted potential in unique ways such as creative problem-solving

34
and deductive thinking.
Research by Renzulli and Reis (2009, as cited in Cleveland, 2017) confirmed the
connection between motivation and engagement, noting motivation to achieve is
necessary for a student to be engaged and on task. Renzulli and Reis (as cited in
Cleveland, 2017) also found both characteristics to be important indicators of potential
giftedness in students. Again, Ford (2010) supported these findings in relation to CLED
populations, stating that many times creativity and problem-solving rather than high
scores on standardized testing are the gifted characteristics CLED populations exude.
Cleveland (2017) found one way “to effectively document observable behaviors
such as motivation” and engagement (p. 12) was to utilize the GRS designed by Pfeiffer
and Jarosewich (2007). Pfeiffer and Jarosewich confirmed this finding, stating the
component of their rating scale ranking student motivation measures a student’s drive,
desire to succeed, and tendency to engage in challenging tasks even without
encouragement. Pfeiffer and Jarosewich found students who scored well on this section
could be characterized as having “a dynamic energy that drives or impels a student to
achieve” (p. 42). Renzulli (2015) believed this drive was necessary for students to be
engaged in learning. Additionally, Renzulli (2015) found when students were driven to
achieve, they expressed their engagement in learning through increased attendance at
school. As noted by Renzulli (2015), this increased attendance positively impacts
academic achievement, reversing the cycle of lack of access and achievement gaps with
CLED populations currently existing in the American education system.
Teacher training. Grissom and Redding (2016) warned that when teachers are
the gateway to students being flagged for services, these gateways can be clouded.
Furthermore, the use of biased identification processes can lead to unintentional
35
segregation in schools and increased inequality in gifted education. Instead, Olszewski-
Kubilius and Clarenbach (2014) encouraged school systems to train teachers and leaders
who will ensure the advanced education of CLED students is made a priority. Through
teacher training, deficit thinking decreases (Ford, 2010) and teachers become more likely
to notice behavioral indications of advanced reasoning and thinking in all students
(Olszewski-Kubilius & Clarenbach, 2014).
Eriksson and Lukens (2017) further supported these statements, noting the
importance of increasing teacher self-efficacy when dealing with CLED students through
the development of professional learning communities, professional development for
school staff, and continuous support for teachers by a gifted specialist. Ultimately, the
teachers in a school have the greatest impact on student achievement; and if CLED
students are to be positively impacted, the implementation begins with teacher training
(Eriksson & Lukens, 2017).
Talent Development Connects All
Jackson (2011, as cited in Hertzog, 2017) asked the question, “with all good
intentions and stipulations, why is there still not a systematic practice or pedagogy aimed
at developing high intellectual performance in all students instead of instilling
marginalizing practices for students of color, especially those in urban areas” (p. 219)?
Hertzog (2017) contended talent development pedagogy was the answer, stating a talent
development pedagogy “identifies and activates student strengths, elicits high intellectual
performance, provides enrichment, and integrates prerequisites of some format” (p. 220).
Additionally, Hertzog stated a talent development pedagogy has the potential to “increase
motivation, achievement, and engagement of students who were not normally identified
for gifted education services” (p. 220).

36
Defining talent development. NAGC (2017) noted the first step in
implementing talent development is developing a clear definition of what talent
development is. In the finalized position paper by NAGC (2017), talent development
was defined as providing opportunities for students to develop and present their talents in
multiple skills and domains rather than solely through their IQ. Thornbury (2010)
additionally defined talent development as an intervention found to “provide enriching
educational opportunities these [CLED] students otherwise would not receive” (p. 45).
Jarvis (2009) asked educators to look at the current gifted education system versus
a talent development framed gifted program as a DIP (Definition-Identity-Provision)
model versus a PEP (Provision-Evaluation-Provision) model. A DIP model has a clearly
defined definition for giftedness, students are identified based on their degree of fit with
this definition, and then students gain access to curriculum provisions based on their
identification (Jarvis, 2009). Instead, under the talent development mindset, students
receive services in a PEP model where curriculum provisions are provided with potential
for giftedness in mind, students are evaluated on their ability to interact with these
provisions, and then additional curriculum provisions are provided to students based on
their evaluations (Jarvis, 2009). Since the PEP model is “more authentic in nature and
less dependent on one standardized measure, minorities and other students typically
missed in gifted identification testing are more likely to be noticed” (Jarvis, 2009, p.
235).
Talent development framework. Olszewski-Kubilius and Clarenbach (2014)
looked at the school-based programs showcased at the NAGC summit to locate programs
that were achieving success with low-income, culturally diverse populations and then
provided what they considered a roadmap to repeating this success (based on common
37
elements of the successful programs). The roadmap included matching identification
procedures and programming with level of developed talent, building awareness about
diversity and high-ability learners, attending to noncognitive factors that affect
achievement, providing challenging and enriching curriculum, deliberately cultivating
support networks, and creating program components such as partnerships to equalize
opportunities (Olszewski-Kubilius & Clarenbach, 2014).
Taking into consideration the elements noted in Olszewski-Kubilius and
Clarenbach’s (2014) talent development framework, NAGC (2017) highlighted the
importance of attending to the social-emotional needs of CLED students. Olszewski-
Kubilius and Clarenbach agreed, noting no talent is developed exclusively in school, and
deliberate creation of support networks can help CLED students work through previously
mentioned perception and cultural barriers. Davis et al. (2017) further recommended
utilizing outside sources such as mentors who had struggled through the same path as
these underrepresented students, sport coaches, and faith-based connections as support
systems for CLED students. As a village, these support systems can help students
develop belief in their ability and motivation to succeed in gifted programs (Lovett, 2011;
Thornbury, 2010). By increasing self-efficacy, Burney and Beilke (2008) further found
comprehensive support systems could help the development of resilience in CLED
students in a way that could positively impact their academic success.
Additionally, NAGC (2017) called attention to the following tenets of the talent
development framework: attention to individual abilities, belief that intelligence is
malleable, existence of opportunity, development of mental and social skills, and
understanding the talent development pathway is a long-term project. Ultimately,
through implementation of this framework and these tenets, students should have the

38
opportunity to show gifted traits such as interest, motivation, humor, problem-solving
ability, inquiry, memory, imagination and creativity, insight, reasoning, and
communication skills to help identify them through gifted education standards.
Programs that work. While Henfield et al. (2017) pointed to a research desert in
the area of actual programs addressing the problem of underrepresentation in gifted
education, NAGC (2015) located a few pockets of excellence future talent development
research could attempt to imitate. Three of the highlighted programs, all funded by the
Jacob Javits Education Act of 1988, meant to identify high achievers who are not
identified as gifted, were the Young Scholars Program in Virginia, Project ELEVATE in
Florida, and Project U-Stars (a nationally renowned talent development method).
Young Scholars. Horn (2014) called Young Scholars a model rather than a
program, stating the notion of the model was to provide equity of opportunity to all
students. The Young Scholars model followed the tenets of a talent development
program, with initial identification of potential, nurturing and support for the
development of this potential, use of research-based interventions and culturally
responsive curriculum, and providing ongoing training for the professionals involved in
the implementation. Specifically, student portfolios, performance-based assessments, and
nonverbal ability tests were utilized to locate potential in students. Once a group of
students was located, model lessons were taught to these students by gifted specialists,
and teachers received extensive training on gifted characteristics and culturally
responsive teaching. Regular education teachers also completed GRS on the students in
the Young Scholars group to include in the portfolios of student work the teachers
developed. Young Scholars were also involved in summer camp programs where they
completed multiple problem-based activities and utilized The Parallel Curriculum by

39
Tomlinson et al. (2009) and The William and Mary Literature Units. While a very
successful program, Horn noted the hardest adjustment for leadership was changing their
mentality of giftedness from the notion giftedness is static to the notion giftedness is
malleable.
Project ELEVATE. Similar to Young Scholars, Eriksson and Lukens (2017)
stated the purpose of Project ELEVATE was to utilize alternative methods for
identification of giftedness and focus on developing excellence in identified students.
The four components of Project ELEVATE included identification of potential,
implementation of talent development, increased professional development, and
increased family engagement. After completing professional development on CIRC and
Developing Intercultural Competence and Excellence (DICE), Project ELEVATE
encouraged their teachers to develop culturally responsive lessons to be used in the talent
development program. Unlike Young Scholars, a year-long intervention, Project
ELEVATE was implemented in 8-week increments, with third- through fifth-grade
students being served in the fall and kindergarten through second-grade students being
served in the spring (Eriksson & Lukens, 2017). Project ELEVATE also had an extended
learning component, where additional talent development was offered to students in the
program after school or during the summer. Following the tenets of talent development,
support for staff was essential to the success of Project ELEVATE (Eriksson & Lukens,
2017).
Project U-Stars. Similar to both of the previous programs, Project U-Stars is
aimed at supporting teachers in the early recognition of and additional nurturing of CLED
students (M. Coleman, personal communication, November 8, 2017). Following the
tenets of talent development, Project U-Stars has a professional development element,
40
culturally responsive curriculum for teachers to use during implementation, and an
alternative method for identification. Unlike Young Scholars and Project ELEVATE
which utilize previously created teacher observation tools, Project U-Stars has created
their own assessment tool: TOPS. The TOPS tool is organized around nine domains of
giftedness: learns easily, shows advanced skills, displays curiosity and creativity, has
strong interests, shows advanced reasoning, displays spatial abilities, shows motivation,
shows social perceptiveness, and displays leadership (Coleman, Shah-Coltrane, &
Harrison, 2010). Using the TOPS tool, observation of students occurs over a 6-week
period, and students who illustrate gifted potential are then served through the Project U-
Stars program. Additionally, teachers are encouraged to use the results of the TOPS
portfolio when speaking with parents about their children’s abilities as well as an aid in
differentiating regular education curriculum.
Identification Methods and Changing the Madness
Ford (2013) warned educators about the current obsession with testing students in
American education. In particular, Ford (2013) discussed tests used in gifted education,
pointing to the fact these tests are subjective, biased, and unfair to CLED students.
Instead, Ford (2013) recommended assessment, which she defined as a more broad and
comprehensive approach to evaluation in the least discriminatory way. Assessment by
this definition involves more than one standardized test, requiring educators to collect
multiple data points. Furthermore, when these data points are culturally competent, more
students from underrepresented populations are identified for gifted education (Ford,
2013).
Multiple methods of identification. Grissom and Redding (2016) also
recommended using identification methods that “are not culture blind” (p. 16). Dunn

41
(2008) supported culturally appropriate identification practices as well, stating a
culturally appropriate identification mindset would result in the use of valid instruments,
multiple sources of evidence, providing opportunity for nurturing of potential, increasing
family involvement, and training teachers in identification procedures. Coleman and
Shah-Coltrane (2015) agreed with the use of multiple, culturally appropriate assessment
methods, stating while IQ is “the single most effective predictor of success in school” (p.
71), motivational and social factors must be considered when looking at CLED
populations where IQ alignment is not research proven.
As school systems look for other methods of identification, there are plenty of
choices available: The TAB Summary Form (Thornbury, 2010), the Children’s Academic
Intrinsic Motivation Inventory (Thornbury 2010), The Classroom Engagement Rubric
(Gallagher & Gallagher, 2013), Renzulli’s Scales for Rating Superior Students (Queen,
2006), TOPS (Coleman et al., 2010), and the Gifted Teacher Rating Scale (Peters &
Pereira, 2017) are some of the more well-known and research-based options. For this
reason, the tool school systems choose to utilize, Olszewski-Kubilius and Clarenbach
(2014) argued, is not as important as the intention to use the tool to cast a wider net and
serve a broader range of students in gifted programs.
Gifted-assignment gap. The intentional use of nontraditional identification
methods to identify gifted potential in students is what Grissom and Redding (2016)
referred to as decreasing the gifted-assignment gap. In addition to the tools previously
mentioned, Grissom and Redding recommended student background be obtained
(including information from the parent, student, and previous teachers) so the students’
probability of placement can be built off knowledge of the whole child. Baker (2013)
agreed, stating decreasing the gifted-assignment gap is essential because students in
42
gifted programs typically proceed to honors classes in high school; and when students
miss the opportunity in early years to be part of the program, they only get continuously
farther behind and are less prepared for the rigor necessary in high school and
beyond. Plucker and Peters (2016) also called attention to gifted-assignment gaps, noting
them as a cause of increased excellence gaps and perpetuation of the vicious cycle
keeping excellence gaps from decreasing.
Summary and Conclusions
“The only way diversity will conceivably get better is to give young, poor, [and
culturally diverse] kids the same opportunity young, affluent [White] kids get” (Baker,
2013, para. 43). Clearly, a problem of underrepresentation of CLED populations exists in
gifted education, and no longer can we ignore the problem. Additionally, educators can
no longer only make incremental changes to their practices, policies, or mindsets. For the
problem of underrepresentation in gifted education to change, the education system must
respect the problem and be willing to shake things up. As A. Harris (personal
communication, November 8, 2017) stated, educators need to change the game: “We
need a third end zone. Who knows what that game will look like, but the game will be
different, and different is what we need.”
43
Chapter 3: Methodology
Introduction/Restatement of the Problem
Gifted and talented individuals are present throughout the distribution of society;
and just as there is not only one image of a gifted student, one veritable definition of
giftedness does not exist either. If these statements are true, it seems fair to question why
so many of America’s gifted classes fail to include a diverse group of students and even
more so to adamantly search for ways the education system can alter the inequitable
situation it has created. One step towards the answer is in locating potential giftedness
rather than setting identification gateways students must cross. One research-based
intervention meeting this criterion and providing a possible solution to the
underrepresentation of CLED students in gifted education classrooms is talent
development. Through a transformative, explanatory mixed methods approach, this
research study determined if talent development could build a pathway to increase CLED
student participation in advanced education.
Review of Research Questions
The research questions for the study are listed as follows.
1. What elements of a talent development program have the greatest impact on
developing potential in underserved populations?
2. How does implementation of a talent development program impact
underrepresented populations regarding achievement?
3. How does implementation of a talent development program impact
underrepresented populations regarding engagement?
4. To what degree does a talent development program identify potentially gifted
CLED students in comparison to standardized identification methods?
44
Setting
The district where the study was completed is a mid-size, urban town located in
eastern North Carolina. According to OnBoard Informatics (2014), at the time of the
study, the population of the town was approximately 45,245 people, with a gender
breakdown of 47.7% male and 52.3% female and a demographic breakdown of 64.7%
Caucasian, 20.5% African-American, 11.6% Hispanic, and 3.6% other races (OnBoard
Informatics, 2014, p. 1).
Previously a mill town, the small city historically struggled with education. Many
of the families in the town did not receive college degrees because their families always
depended on the mill as their source of income. However, in 2003, the mill closed; and
in 2005 an entrepreneur purchased the property where the mill was located with plans to
erect a research institute. In the years after the mill closed, many families in town dealt
with economic strife. Recent data from OnBoard Informatics (2014), however, shows the
average income of the town increased from $35,532 in 2000 to $44,524 in 2014. The
impact of the research campus was also positive for the education system in the town,
providing resources, partnerships, and grant money for programs such as biotechnology
and agriculture in the schools. Despite this change, the district still contended with
poverty. In fact, based on the district free/reduced lunch average of 76.075% at the time
of the study, all students received free breakfast and lunch through the Community
Eligibility Provision program (A. Treanor, personal communication, October 12, 2016).
Additionally, between 2012 and 2018, three charter schools opened within or near
the school district. Creation of these institutions led to some parents pulling their
children from the city school system to attend the charter schools and, in turn, the school
system being held responsible for monetary debt. One initiative the school system began

45
to encourage parents to remain in the district was the implementation of magnet programs
at the elementary school level (at the time of the study the district had an arts magnet,
global studies magnet, and a Spanish immersion program). The goal of the magnet
programs was to offer innovative opportunities for students of all subgroups. The middle
and high school in the district also added arts programs such as dance, yoga, theater, and
speech and debate; and STEM programs such as Project Lead the Way and welding to
increase interest in students and parents at all educational levels. Implementation of these
programs aligned with the vision of the district to “create learning environments that
meet diverse and customized needs of students and prepare students for the globally
competitive 21st century” (district website).
Implementation of talent development was aimed at these same missions:
increasing interest from families to remain in the district, meeting student needs, and
preparing students for a globally competitive society. Additionally, recent data pointed to
underrepresentation of culturally linguistically and/or economically diverse students in
the gifted classrooms in the district when compared to the overall demographics district
wide. Table 1 shows the current demographics of the district in relation to the
demographics of the identified gifted population.

46
Table 1
Demographics of District vs. Demographics of AIG Identified Population
Grade Total Asian
n (%)
African-
American
n (%)
Hispanic
n (%)
American
Indian
n (%)
Two or
More
n (%)
Pacific
Islander
n (%)
Caucasian
n (%)
K- all 416 2
(.5%)
115
(27.6%)
123
(29.6%)
2
(.5%)
22
(5.2%)
2
(.5%)
150
(36.0%)
K-
identified
District does not identify AIG students until 3rd grade.
1- all 411 6
(1.2%)
100
(24.3%)
137
(33.3%)
0
(0%)
31
(7.5%)
3
(.7%)
134
(32.6%)
1-
identified
District does not identify AIG students until 3rd grade.
2- all 408 3
(.7%)
111
(27.2%)
129
(31.6%)
2
(.5%)
24
(5.9%)
1
(.3%)
138
(33.8%)
2-
identified
District does not identify AIG students until 3rd grade.
3- all 426 4
(.9%)
113
(26.5%)
157
(36.9%)
1
(.2%)
23
(5.4%)
0
(0%)
125
(29.3%)
3-
identified
20 1
(5%)
1
(5%)
8
(40%)
0
(0%)
0
(0%)
0
(0%)
10
(50%)
4- all 440 3
(.6%)
131
(29.8%)
157
(35.7%)
1
(.2%)
23
(5.2%)
0
(0%)
125
(28.4%)
4-
identified
39 0
(0%)
9
(23.1%)
9
(23.1%)
0
(0%)
4
(10.2%)
0
(0%)
17
(43.6%)
5- all 444
6
(1.2%)
121
(27.3%)
140
(31.5%)
1
(.2%)
24
(5.4%)
2
(.5%)
150
(33.8%)
5-
identified
34 2
(5.9%)
1
(2.9%)
4
(11.8%)
0
(0%)
0
(0%)
0
(0%)
27
(79.4%)
6- all 419 9
(2.1%)
103
(24.6%)
147
(35.1%)
3
(.7%)
27
(6.4%)
0
(0%)
130
(31.0%)
6-
identified
39 1
(2.6%)
3
(7.7%)
9
(23.1%)
0
(0%)
4
(10.3%)
0
(0%)
22
(56.4%)
7- all 405 4
(.9%)
107
(26.4%)
134
(33.1%)
3
(.7%)
19
(4.7%)
0
(0%)
138
(34.1%)
(continued)

47
Grade Total Asian
n (%)
African-
American
n (%)
Hispanic
n (%)
American
Indian
n (%)
Two or
More
n (%)
Pacific
Islander
n (%)
Caucasian
n (%)
7-
identified
55 1
(1.8%)
5
(9.1%)
11
(20%)
1
(1.8%)
4
(7.3%)
0
(0%)
33
(60%)
8- all 372 8
(2.2%)
103
(27.7%)
122
(32.8%)
0
(0%)
17
(4.6%)
0
(0%)
122
(32.8%)
8-
identified
50 1
(2%)
7
(14%)
14
(28%)
0
(0%)
1
(2%)
0
(0%)
27
(54%)
9- all 459 5
(1.9%)
132
(28.8%)
155
(33.8%)
0
(0%)
18
(3.9%)
0
(0%)
149
(32.5%)
9-
identified
52
2
(3.8%)
3
(5.8%)
12
(23.1%)
0
(0%)
1
(1.9%)
0
(0%)
34
(65.4%)
10- all 456 5
(1.1%)
147
(32.2%)
138
(30.3%)
0
(0%)
26
(5.7%)
2
(.4%)
138
(30.3%)
10-
identified
40 2
(5%)
5
(12.5%)
5
(12.5%)
0
(0%)
2
(5%)
0
(0%)
26
(65%)
11- all 389 8
(2.1%)
118
(30.3%)
116
(29.8%)
0
(0%)
25
(6.4%)
0
(0%)
122
(31.4%)
11-
identified
29
1
(3.4%)
1
(3.4%)
4
(13.8%)
0
(0%)
1
(3.4%)
0
(0%)
22
(75.9%)
12- all 338 5
(1.5%)
121
(35.8%)
74
(21.9%)
0
(0%)
14
(4.1%)
0
(0%)
124
(36.7%)
12-
identified
48 1
(2.1%)
2
(4.2%)
11
(23.0%)
0
(0%)
2
(4.2%)
0
(0%)
32
(66.7%)
Total- all 5534 71
(1.3%)
1586
(28.7%)
1748
(31.6%)
18
(.3%)
297
(5.4%)
11
(.2%)
1803
(32.6%)
Total-
identified
406 12
(3%)
37
(9.1%)
87
(21.4%)
1
(.2%)
19
(4.7%)
0
(0%)
250
(61.6%)
As shown in Table 1, the demographics of the school district in the study were
diverse, but a clear discrepancy existed in demographic representation in the gifted
program across all grades in the district. According to Ford and King (2014),
discrepancies of less than 10% between total district population and gifted population are
acceptable, discrepancies of 10%-19% are warning signs, and discrepancies of 20% or

48
more are unacceptable. As shown in Table 1, the greatest discrepancies between whole
district population and identified students are in the African-American and Caucasian
subgroups, with the Hispanic population showing pockets of inconsistent representation.
Research Design and Rationale
The research study followed an explanatory mixed methods design utilizing a
collaborative transformative framework. As defined by Creswell (2014), an explanatory
mixed methods research design allows the researcher to collect quantitative data,
complete data analysis, and then engage in qualitative research to explain the quantitative
results in more detail. Through the mixed-methods research, the researcher intended to
examine two dependent variables: academic performance and engagement of
students. The treatment, or independent variable of the study, was talent development
services. By comparing the dependent variables before and after the independent
variable was implemented and through utilizing qualitative data to further explain the
quantitative data collected, the researcher looked at two of the three “prototypic outcome
measures” suggested by Rosenthal and Rosnow (1991, as cited in Creswell, 2014, p.
169): the direction and amount of observed change.
The initial quantitative data collected in this study included i-Ready diagnostic
assessments, GRS, Panorama Education Student Surveys, attendance reports, NNAT
screening results, and teacher and parent perception surveys. Follow-up qualitative data
were collected through teacher and parent focus groups, and post-teacher and post-parent
perception surveys. The qualitative elements of the study allowed the researcher to
utilize input from other stakeholders to help explain the quantitative results of the study
(Creswell, 2014). Once applied, the explanatory mixed methods research approach
assisted the researcher in determining whether the talent development approach to gifted

49
education positively impacted academic performance and engagement of students
typically underrepresented in gifted programs.
This explanatory mixed methods approach was important to the nature of the
study because underrepresentation in gifted education is a multi-faceted issue with many
contributing factors; and while strong quantitative data sources were available to
illustrate achievement and representation of CLED students in gifted programs, the data
needed to be explored at a deeper level to account for the multiple factors of influence
which existed when looking at underrepresented populations. The collaborative
transformative framework enhanced the researcher’s understanding of the data collected
and increased the probability of the research results impacting future education practices
and policies.
Closing an achievement gap in education will not occur overnight, and small-level
initiatives such as this research study were unlikely to result in changes of significant
academic outcomes immediately; however, Noguera (2008) advised researchers
providing qualitative data to support even the smallest quantitative changes could turn
“effective strategies into incremental changes and higher rates of achievement for
minority groups in the future” (p. 99), providing support for the design of the explanatory
mixed methods study.
Role of the Researcher
In this explanatory mixed method research, the researcher had two separate roles,
defined by Simon (2011b) as an unbiased observer and as an instrument of data
collection. Simon (2011b) contended researchers in a quantitative study should be
theoretically nonexistent, with the ability for the quantitative data to be collected by any
other individual. All quantitative data sources utilized in the research study (i-Ready

50
diagnostic assessments, Panorama Education Survey results, Gifted Teacher Rating
Scales, attendance, NNATs, and teacher perception surveys) were set up to yield close to
similar results without regard to the person collecting the data and, for this study, were all
collected by someone other than the researcher. These research decisions allowed the
researcher to fulfill her role as an unbiased observer of quantitative data.
As a qualitative researcher, Simon (2011b) called the researcher an insider. The
researcher was an insider of the research through parent and teacher focus groups and
collection of qualitative survey results where coding of survey results was necessary. To
ensure the researcher remained objective in the qualitative research, focus groups were
monitored and recorded, a wide variety of literature was reviewed, and the researcher
worked with a parent and teacher advisory group to assist in the development of initial
questions and effective probing questions for the surveys and focus groups. Additionally,
the intention of the focus groups was to help the researcher explain the thematic results
from the surveys, ensuring any bias of the researcher was not present in the presentation
of study findings.
Participant Selection Logic
Three levels of participant selection were utilized in this study: demographic
subgroup decisions, grade level decisions, and school participation decisions. As noted
in Table 1, the three subgroups with inequitable discrepancies of representation in the
gifted program in this district included African-American (underrepresented), Hispanic
(underrepresented), and Caucasian (overrepresented) subgroups. In addition to showing
pernicious discrepancies in representation, these three subgroups were the three largest
subgroups in the district. Urdan (2010) stated the size of these populations in the district
provided a representative sample, defined as “purposely selected cases so they will match

51
the larger population on specific characteristics” (p. 3), for the research study. Within
these subgroups, the study focused on the top 20% of students in each subgroup, based on
the U.S. Department of Education Office for Civil Rights’ Equity Allowance
Discrepancy Rule (Ford, 2010).
In addition to the demographic participation selection, the study collected data on
fourth- and fifth-grade students in the district. Fourth- and fifth-grade students were the
intended focus groups for the research based on Olszewski-Kubilius and Steenbergen-
Hu’s (2017) finding that identification in upper elementary years “allows for sufficient
opportunity and time to have a significant impact on student preparation for high school,
but also allows program administrators to feel confident that talent potential could be
ascertained reliably with standardized testing” (p. 204). Since the district did not identify
students until the middle of third grade and used initial-year testing for third-grade
identification (which were different measurements than used in fourth through eighth
grade), using third-grade students in the research study could have skewed comparison
results of third grade with other grades. Conversely, students in the fourth and fifth grade
took valid and reliable common assessments, and identification procedures for both
grades were the same, so the level of confidence referenced by Olszewski-Kubilius and
Steenbergen-Hu (2017) was possible to achieve. Additionally, A. Harris (personal
communication, November 8, 2017) noted that students of talent who begin middle
school without the talent being recognized will be more likely not to use their talent, not
to be included in honors classes, or not receive access to opportunities that could develop
their potential.
The final participation selection criterion was administrative agreement to
participate in the study. It is important to note since talent development was not the only
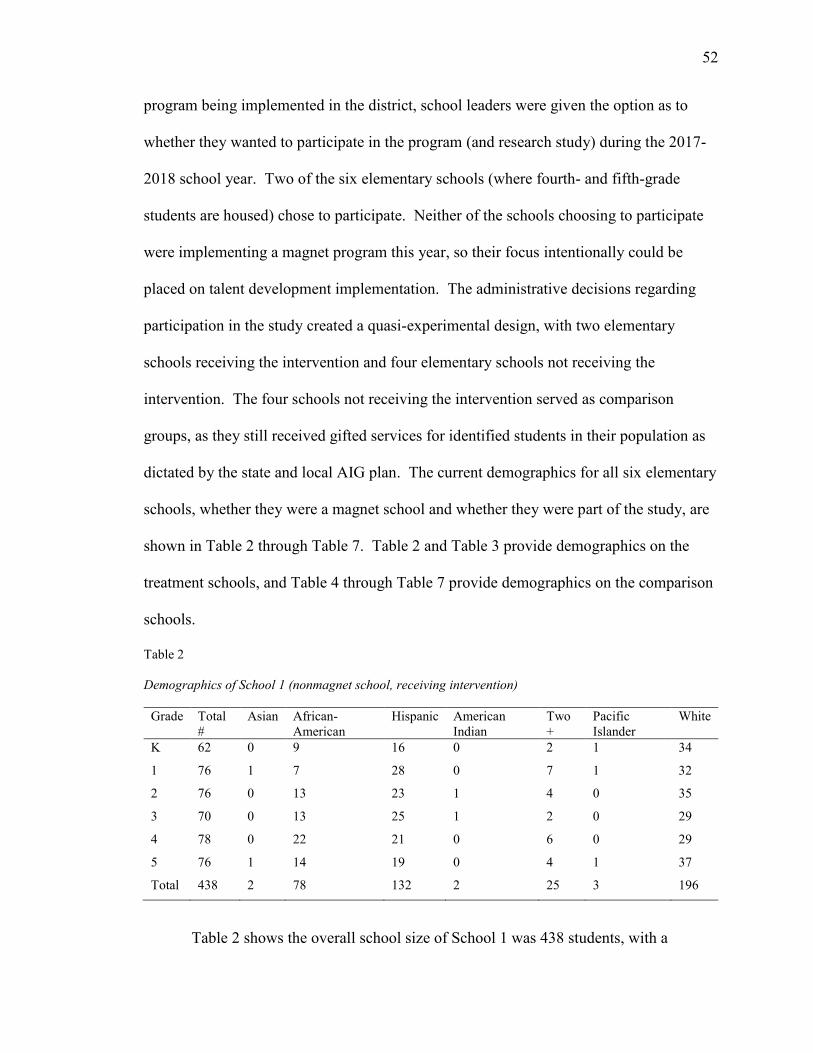
52
program being implemented in the district, school leaders were given the option as to
whether they wanted to participate in the program (and research study) during the 2017-
2018 school year. Two of the six elementary schools (where fourth- and fifth-grade
students are housed) chose to participate. Neither of the schools choosing to participate
were implementing a magnet program this year, so their focus intentionally could be
placed on talent development implementation. The administrative decisions regarding
participation in the study created a quasi-experimental design, with two elementary
schools receiving the intervention and four elementary schools not receiving the
intervention. The four schools not receiving the intervention served as comparison
groups, as they still received gifted services for identified students in their population as
dictated by the state and local AIG plan. The current demographics for all six elementary
schools, whether they were a magnet school and whether they were part of the study, are
shown in Table 2 through Table 7. Table 2 and Table 3 provide demographics on the
treatment schools, and Table 4 through Table 7 provide demographics on the comparison
schools.
Table 2
Demographics of School 1 (nonmagnet school, receiving intervention)
Grade Total
#
Asian African-
American
Hispanic American
Indian
Two
+
Pacific
Islander
White
K 62 0 9 16 0 2 1 34
1 76 1 7 28 0 7 1 32
2 76 0 13 23 1 4 0 35
3 70 0 13 25 1 2 0 29
4 78 0 22 21 0 6 0 29
5 76 1 14 19 0 4 1 37
Total 438 2 78 132 2 25 3 196
Table 2 shows the overall school size of School 1 was 438 students, with a
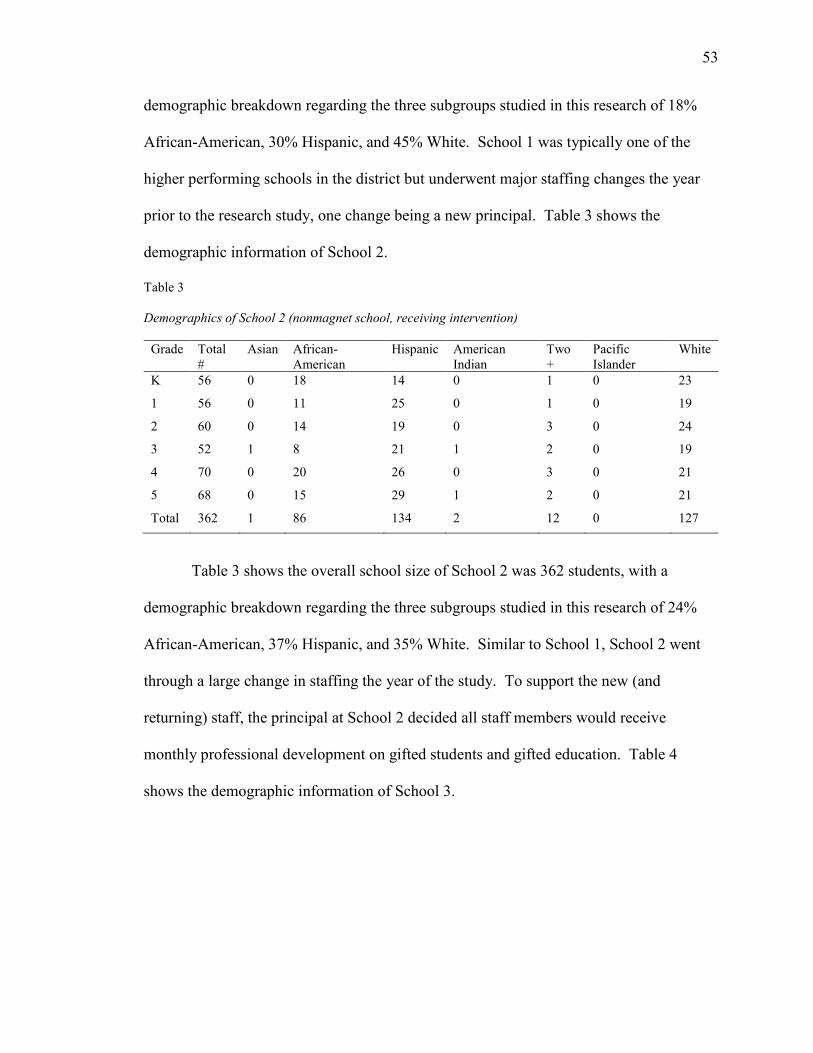
53
demographic breakdown regarding the three subgroups studied in this research of 18%
African-American, 30% Hispanic, and 45% White. School 1 was typically one of the
higher performing schools in the district but underwent major staffing changes the year
prior to the research study, one change being a new principal. Table 3 shows the
demographic information of School 2.
Table 3
Demographics of School 2 (nonmagnet school, receiving intervention)
Grade Total
#
Asian African-
American
Hispanic American
Indian
Two
+
Pacific
Islander
White
K 56 0 18 14 0 1 0 23
1 56 0 11 25 0 1 0 19
2 60 0 14 19 0 3 0 24
3 52 1 8 21 1 2 0 19
4 70 0 20 26 0 3 0 21
5 68 0 15 29 1 2 0 21
Total 362 1 86 134 2 12 0 127
Table 3 shows the overall school size of School 2 was 362 students, with a
demographic breakdown regarding the three subgroups studied in this research of 24%
African-American, 37% Hispanic, and 35% White. Similar to School 1, School 2 went
through a large change in staffing the year of the study. To support the new (and
returning) staff, the principal at School 2 decided all staff members would receive
monthly professional development on gifted students and gifted education. Table 4
shows the demographic information of School 3.

54
Table 4
Demographics of School 3 (nonmagnet school, not receiving intervention)
Grade Total
#
Asian African-
American
Hispanic American
Indian
Two
+
Pacific
Islander
White
Pre-K 4 0 3 1 0 0 0 0
K 72 0 23 13 1 8 0 27
1 85 1 30 20 0 4 0 30
2 75 1 25 18 0 5 0 26
3 102 2 30 27 0 5 1 37
4 88 0 36 23 1 4 0 24
5 94 3 32 12 0 7 1 39
Total 520 7 179 114 2 33 2 183
Table 4 shows the overall school size of School 3 was 520 students, with a
demographic breakdown regarding the three subgroups studied in this research of 34%
African-American, 22% Hispanic, and 35% White. School 3 was historically the
district’s least economically disadvantaged school in the district. Table 5 shows
demographics of School 4.
Table 5
Demographics of School 4 (magnet school, not receiving intervention)
Grade Total
#
Asian African-
American
Hispanic American
Indian
Two
+
Pacific
Islander
White
K 81 1 14 35 0 5 0 26
1 64 0 14 26 0 5 0 19
2 48 1 8 24 0 0 0 15
3 44 0 10 15 0 2 0 17
4 66 2 13 30 0 3 0 18
5 57 0 11 25 0 3 0 18
Total 360 4 70 155 0 18 0 113
Table 5 shows the overall school size of School 4 was 360 students, with a
demographic breakdown regarding the three subgroups studied in this research of 19%
African-American, 43% Hispanic, and 31% White. School 4 was historically one of the

55
district’s highest poverty schools. Additionally, School 4 implemented two magnet
programs during the 2017-2018 school year: a Spanish immersion program and a global
studies magnet. Table 6 shows demographics of School 5.
Table 6
Demographics of School 5 (magnet school, not receiving intervention)
Grade Total
#
Asian African-
American
Hispanic American
Indian
Two
+
Pacific
Islander
White
K 90 1 35 21 1 3 0 29
1 87 4 31 19 0 8 1 24
2 97 0 40 21 1 7 1 27
3 105 1 45 27 1 2 0 29
4 79 0 29 25 0 5 0 20
5 89 2 39 27 0 3 0 18
Total 547 8 219 140 3 28 2 147
Table 6 shows the overall school size of School 5 was 547 students, with a
demographic breakdown regarding the three subgroups studied in this research of 40%
African-American, 25% Hispanic, and 27% White. School 5 was the newest elementary
school in the district and was opened to highlight the new arts magnet program in the
district. Table 7 shows the demographic information for School 6.
Table 7
Demographics of School 6 (nonmagnet, not receiving intervention)
Grade Total
#
Asian African-
American
Hispanic American
Indian
Two
+
Pacific
Islander
White
Pre-K 72 2 30 17 0 5 0 18
K 44 0 10 21 0 2 1 10
1 43 0 7 19 0 6 1 10
2 54 1 12 25 0 5 0 11
3 55 0 7 27 0 8 0 13
4 60 1 11 32 0 2 0 14
5 61 0 10 28 0 5 0 18
Total 389 4 87 169 0 33 2 94

56
Table 7 shows the overall school size of School 6 was 389 students, with a
demographic breakdown regarding the three subgroups studied in this research of 22%
African-American, 43% Hispanic, and 24% White. School 6 was historically the
district’s highest poverty school. School 6 also saw many staffing changes the year the
study was completed.
The decision to utilize a quasi-experimental method of study, where participant
groups were receiving a modified intervention and comparison groups were receiving
their normal intervention, allowed the researcher to determine if the talent development
intervention had a greater positive, greater negative, or null effect on the students in the
district.
A visual of this design is shown here.
Group A O ------- X -------- O (Talent development services)
Group B O-------------------- O (Current level of services, no change)
In collecting information from multiple sites within the district where the services
were implemented, the researcher looked to generalize the results to underrepresented
populations throughout the district. This form of quasi-experimental design still upheld
Gardner-Webb University’s policy stating, “researchers will not withhold treatment from
any given group if such treatment is thought to be beneficial” (S. Brown, personal
communication, May 22, 2017), because the intent of the study was to serve all schools in
the district, even though not all district administration agreed to participate.
Instrumentation
Numerous instruments were used to collect data for this research study. These
tools were used to define the research question terms of potential (showing a capacity for
learning), achievement (successful completion of tasks), engagement (active involvement

57
in an activity), and identification (students meet the expectations of gifted as determined
by the district and reviewed in the district AIG plan). Table 8 illustrates which
instruments aligned with each specific research term.
Table 8
Matrix Aligning Research Terms and Tools
Research
Term
i-Ready GRS Panorama
Education
Survey
Teacher
Survey
Parent
Survey
Attendance NNAT Parent
Focus
Group
Teacher
Focus
Group
Potential X X
X
X X X
Achieve-
ment
X X
X X
Engage-
ment
X X
X X X X
Identifi-
cation
X
X
X X
As shown in Table 8, potential was determined by both qualitative and
quantitative data: i-Ready and NNAT scores were used to flag students in the top 20% of
their subgroup (based on the 20% Equity Index, Ford, 2010; Ford & King, 2014) as
having gifted potential; the GRS (a field observation checklist developed by Pearson
Education) and parent survey initially showed whether students had potential for higher
learning; and teacher and parent focus groups encouraged discussion of potential as seen
in the students throughout the study to determine alignment between parent opinion and
teacher perspective.
Achievement data were collected through i-Ready standardized benchmark
assessments. To operationalize equally for all grades involved in the study, the decision
was to utilize i-Ready district assessments because i-Ready uses a scale score, allowing
for inferential statistic calculations. Additionally, the district gave i-Ready assessments

58
to all students in fourth and fifth grade three times during the year, rather than only once,
as was the case with the End-of-Grade test. The Gifted Teacher Rating Scales discussed
in operationalizing potential were used to show achievement through informal
observations and teacher open-ended responses. Achievement, as with potential, was
also discussed in parent and teacher focus groups so a deeper understanding of student
achievement, which may not have shown up in testing data, could be explained.
Based on research by Renzulli (2015) on the School Enrichment Model
framework, students who enjoy school are more engaged in class and more enthusiastic
to attend school. Engagement was operationalized through looking at student attendance,
motivation, and perception towards school. The district naturally collected data on all
three of these categories. In the area of attendance, the researcher utilized PowerSchool
to collect attendance data on particular students; and the areas of motivation and
perception towards school were observed through Panorama Education surveys students
took throughout the school year. Parent and teacher focus groups also provided data on
engagement as the groups reviewed and explained their opinions regarding the
quantitative data results.
Last, the term identification was viewed in two different ways in this study:
identification of a student through the standard methods of the district and identification
regarding potential of giftedness seen in talent development. The NNAT results were
utilized as the standard determination of identification, and the GRS checklist scores
from the end of the study were used as identification of potential. These results were
compared to those completed prior to the study to show if potential was recognized in
any of the study participants. Additionally, parent and teacher focus groups were utilized
to identify and explain barriers or reasons the NNAT and GRS identification could differ.

59
Quantitative instruments. The quantitative measurement tools used in this
study included i-Ready assessments, GRS, Panorama Education surveys, teacher
perception surveys, attendance reports, and NNAT results.
i-Ready assessments. i-Ready diagnostic assessments are online assessments
intended to determine the level of reading and math skills in the students being assessed.
When developed, the i-Ready diagnostic assessments were aligned with Common Core
state standards so periodic completion of the exams could be predictors for level of
success of Common Core standardized exams. As previously mentioned, the research
study used i-Ready diagnostic assessments as the measure of achievement, because
unlike the End-of-Grade achievement test only given one time during the school year, i-
Ready diagnostic assessments were taken three times throughout the school year.
Additionally, Curriculum Associates (2016) noted i-Ready diagnostic assessments had a
.81 (ELA) and .84 (math) correlation to Common Core state exams. Curriculum
Associates further noted results of i-Ready diagnostic assessments showed “a .90 or
higher Area Under the Curve value, providing evidence i-Ready assessments can
accurately predict students’ proficiency status” (p. 3).
GRS. Another quantitative tool utilized in the study was the GRS observational
checklist. As noted by Dunn (2008) and Queen (2006), teacher input often serves as a
major deciding factor in identification of underrepresented gifted children. Therefore, if
this study was to adequately show how underrepresented children can become identified
through talent development, it was essential to involve teachers in the data collection
process. Teachers were included in the study using a focused protocol, the GRS,
developed by Pfeiffer and Jarosewich (2007). This tool was already utilized in the
district, so teachers had previously received training for using this tool. Due to the

60
makeup of the checklist (the Likert scale ranges from 1-9 and asks observers to first
determine a low [1-3]-middle [4-6]-high [7-9] range and then a low-middle-high range
from within that category), Peters and Pereira (2017) noted it was possible for a
statistically significant increase to occur in a short length of time.
Peters and Pereira (2017) additionally supported the use of the GRS, noting the
assessment was “developed based on the federal report National Excellence: A Case for
Developing America’s Talent” (p. 104) and had consistently been shown to have greater
fit indices for underrepresented populations than overrepresented populations.
Furthermore, internal consistency of the GRS ranged from .97 to .99, test-retest reliability
ranged from .83 to .97, and interrater reliability ranged from .64 to .79 (Peters & Pereira,
2017, p. 104).
Panorama education surveys. Additionally, district-wide surveys, developed by
Panorama Education, were used regularly within the district. To accommodate district
needs, Panorama Education provides districts with a list of possible questions to be
included in their survey, all questions which have been tested for validity (Panorama
Education, 2005). The district where the study was completed chose strands from the
bank of Panorama survey domains (classroom climate, engagement, grit, learning
strategies, mindset, pedagogical effectiveness, rigorous expectations, school belonging,
teacher-student relationship, and valuing the subject) and administered the survey to
students twice a school year. The survey domains chosen for the 2017-2018 district
survey were classroom climate, rigor, teacher-student relationships, pedagogical
effectiveness, classroom engagement, and grit. The survey data collected from these
domains were used to provide data on student engagement, motivation, and classroom
rigor from the perspective of the students for the district senior leadership team, school
61
administration, and classroom teachers. The research study used results to assess the
same domains.
Each of the domains were developed by Panorama Education through a six-step
design process including a literature review, interviews and focus groups, synthesis of
indicators, item creation (which follows best survey practice design), expert review, and
cognitive pretesting (Panorama Education, 2005, p. 4). After this rigorous development
stage, all scales were implemented in large-scale pilot tests and continue to be validated
each time a district utilizes the survey. The most recent survey validations show a
reliability of .70 or greater for each domain (Panorama Education, 2005). Additionally,
Panorama Education (2005) correlated their student responses with administrative
observations and found “students’ perceptions and administrators’ observations were
highly congruent with each other” (Panorama Education, 2005, p. 8).
Teacher and parent perception surveys. Creswell (2014) argued surveys allow
researchers to “generalize from a sample to a population so that inferences can be made
about some characteristic, attitude, or behavior of this population” (p. 157). The surveys
utilized in this research study looked at the population of teachers as well as the
population of students (through the eyes of the parents) in the study. Both surveys served
to collect data “on attributes of the large (district) population from a small group of
individuals” (Creswell, 2014, p. 157) in a short amount of time. While the surveys were
administered to specific groups (all teachers in the district and parents of participants) in
a convenience sample fashion, the demographic spread of these individuals was
characteristic of the entire population being studied.
The teacher survey utilized in this study was designed for this research study
using key themes in the study’s literature review. The questions were developed and

62
reviewed by a panel of four educators (district-level employees trained in research by the
American Research Institute). Questions were revised and refined based on the feedback
received during this session. Survey questions are included in Appendix A.
The parent survey utilized in this study was also designed by using key themes in
the study’s literature review. The questions were developed and reviewed by four parents
who have high-achieving students and are members of the underrepresented populations
being studied in this research. The parent panel helped refine the questions with specific
attention to implicit bias in the wording of the questions. The reviewed and refined
questions included in the parent survey are included in Appendix B.
Attendance reports. Attendance data were a naturally occurring form of data
collection in the district. PowerSchool attendance reports were run daily for
administration to review. These reports were utilized to monitor the attendance of
students who were in both the participant and comparison groups of the study.
NNATs. The NNAT is a culturally sensitive IQ test given to students throughout
the country to determine eligibility in gifted programs. The test is comprised of
geometric designs in 2X2 and 3X3 matrices, and students are asked to determine what
available shape belongs in the missing box of the matrix. Of all nonverbal tests reviewed
by Naglieri and Ford (2003), the NNAT fared best for underrepresented populations,
showing only a minimal difference of .25 (or 4 standard points) between Caucasian and
African-American students and a .17 (or 2.5 standard points) between Caucasian and
Hispanic students (p. 157). Additionally, Naglieri and Ford found student performance
on the NNAT was predictive of their scores on nationally normed achievement tests
(such as the SAT).
Qualitative instruments. Qualitatively, the study utilized focus groups and

63
open-ended survey questions which were thematically coded to analyze the research
questions.
Focus groups. The researcher’s goal of using focus groups was “to elicit a
narrative from the participants” (Butin, 2010, p. 98) to better gauge the components of a
gifted program that help develop potential as well as note the barriers preventing this
development. The researcher purposefully selected focus group participants to create a
demographically representative sample for the group, which Creswell (2014) suggested
makes it more possible to collect qualitative information that can help explain
discrepancies in quantitative data. Members of the focus groups were chosen randomly
from survey results where individuals were given a chance to express interest in being
part of a focus group. The intended group size of each focus group was five to eight
individuals (based on the recommendation of Krueger & Casey, 2009).
Additionally, the researcher used a second moderator (an individual who was not
part of the study) who “has characteristics similar to the participants” (Krueger & Casey,
2009, p. 164). The researcher set up the focus group and ensured probing questions were
asked when necessary, encouraging the second moderator to ask some of the questions
and probe for further details as needed. The decision to utilize a second moderator was
based on Krueger and Casey’s (2009) recommendation to include a demographically
similar moderator when working with cross-cultural focus groups. A different second
moderator was used in the teacher and parent focus groups to align characteristics of both
groups. Additionally, the researcher taped the focus group discussions and transcribed
both focus groups after the sessions. Transcription of the focus group discussions
allowed the researcher to focus on leading the discussion, rather than needing to take
copious notes during the discussion.

64
Utilizing the explanatory research design, while preliminary focus group
questions were designed, final questions for the focus groups were determined based on
initial survey results and other quantitative data collected during the study. The panel of
educators and parents who reviewed the initial survey questions also reviewed the
preliminary focus group questions for clarity, bias, and organizational order. Preliminary
focus group questions for the teacher focus group are included in Appendix C, and
preliminary focus group questions for the parent focus group are included in Appendix D.
The focus group questions were refined after data collection, and the same educator and
parent panels reviewed the revised questions prior to holding the focus group sessions.
The finalized focus group questions for the teacher and parent focus groups are shown in
Appendix E.
Survey questions. As reviewed previously, both survey tools (teacher and parent)
were designed specifically for this research study. Panels of individuals with the same
demographic makeup and background as the individuals taking the surveys reviewed
their respective surveys. This review included the review of open-ended questions as
well. In analysis of the survey results, parent and teacher focus groups were used to
explain the data and confirm thematic breakdowns developed by the researcher. The
continued involvement of other stakeholders besides the researcher increased the validity
and decreased the bias in the use of surveys in the study.
Intervention studies
The intervention of talent development in this study utilized three curriculum
models to provide participants with rigorous, engaging, and collaborative activities where
they could exhibit potential talent. The three frameworks included the talent
development framework, the Bloom-Banks culturally responsive framework, and the

65
problem-based learning curriculum design. Participants receiving the talent development
intervention received the intervention for a minimum of 1 hour each week from February
through April, totaling a minimum of 12 hours of talent development services. In
addition to the intervention of talent development, teachers received training to increase
their knowledge of talent development implementation. Teachers involved in the study
also planned with the AIG coordinator of the district to help increase the rigor and
challenge the talent development participants received in the regular classroom.
Talent development framework. As noted by NAGC (2017), there is not one
specific framework that aligns talent development to all populations. Instead, NAGC
(2017) has developed a set of tenets for educators to use when developing a framework
that they could implement to create a talent development program. Those tenets include
extending the pedagogy once thought exclusive only to gifted students to typically
underrepresented populations, using best practices with all students, increasing access to
challenging curriculum to typically underrepresented populations, and having high
ceiling expectations and personalization for these same groups (Plucker et al., 2010).
Additionally, talent development programs need to provide opportunities for students to
show giftedness in multiple domains over an extended period of time (NAGC, 2017).
Bloom-Banks culturally responsive framework. Ford (2013) discussed the
Blooms-Banks matrix and how it could be useful in developing a culturally responsive
framework for curriculum. The matrix, shown in Table 9, includes the spectrum of
Bloom’s Taxonomy (knowledge, comprehension, application, analysis, synthesis, and
evaluation) across the top of the matrix and Banks’ levels of culturally diverse education
(contributions, additive, transformation, and social action) along the side. The goal of a
multi-cultural curriculum is for lessons to fall in the boxed quadrant.

66
Table 9
Blooms-Banks Matrix (Ford, 2013, pp. 197-198)
Knowledge Comprehen-
sion
Application Analysis Synthesis Evaluation
Contribu-
tions
Students are
taught and
know facts
about
cultural
artifacts,
events,
groups, and
other
cultural
elements.
Students
show an
understanding
of information
about cultural
artifacts,
groups, etc.
Students are
asked to and
can apply
information
learned about
cultural
artifacts,
events, etc.
Students are
taught to
and can
analyze
information
about
cultural
artifacts,
groups, etc.
Students
are required
to and can
create a
new
product
from the
information
on cultural
artifacts,
groups, etc.
Students
are taught
to and can
evaluate
facts and
information
based on
cultural
artifacts,
groups, etc.
Additive Students are
taught and
know
concepts and
themes about
cultural
groups.
Students are
taught and
can
understand
cultural
concepts and
themes.
Students are
required to
and can apply
information
learned about
cultural
concepts and
themes.
Students are
taught to
and can
analyze
important
cultural
concepts
and themes.
Students
are asked to
and can
synthesize
important
about
cultural
concepts
and themes.
Students
are taught
to and can
critique and
evaluate
cultural
issues,
concepts
and themes. Trans-
formation
Students are
given
information
on important
cultural
elements,
groups, etc.
and can
understand
this
information
from
different
perspectives.
Students are
taught to
understand
and can
demonstrate
an
understanding
of important
cultural
concepts and
themes from
different
perspectives.
Students are
asked to and
can apply
their
understanding
of important
concepts and
themes from
different
perspectives.
Students are
taught to
and can
examine
important
cultural
concepts
and themes
from more
than one
perspective.
Students
are required
to and can
create a
product
based on
their new
perspective
or the
perspective
of another
group.
Students
are taught
to and can
critique,
evaluate or
judge
important
cultural
concepts
and themes
from
different
viewpoints.
Social
Action
Based on
information
about
cultural
artifacts, etc.
students
recommend
specific
social action.
Based on their
understanding
of important
concepts and
themes,
students
recommend
specific social
action.
Students
apply their
understanding
of important
social and
cultural
issues; they
also
recommend
AND take the
action they
recommend.
Students are
required to
and can
analyze
social and
cultural
issues from
different
perspectives
and they
take action
on these
issues.
Students
create a
plan of
action to
address a
social and
cultural
issue(s);
they seek
change.
Students
critique
important
social and
cultural
issues and
seek to
make
change.
According to the Bloom-Banks model for culturally responsive curriculum,

67
students in the transformation mode can view issues and events from the perspectives of
diverse racial and cultural groups, and students in the social action mode can make
decisions on these issues to the point where they become empowered to do something
about the issues. When students can approach curriculum topics with a transformation or
social action mentality and engage in analysis, synthesis, and evaluation of issues, they
are truly engaged in multi-cultural education.
Problem-based learning curriculum design. The researcher brought together
the talent development framework and Bloom-Banks model of curriculum instruction
through the implementation of problem-based learning. Gallagher and Gallagher (2013)
agreed with this implementation, stating many underrepresented students find themselves
engaging daily in curriculum that is “overly simplistic and fact-oriented” (p. 113).
Instead, these students need to have their interests piqued through the problem-based
learning design, which provides students with an ill-structured problem for which they
need to find a solution. In the process, students are engaged in learning about topics
included in the standard curriculum. Gallagher and Gallagher contended that not only did
problem-based learning increase engagement of students, it provided a chance for
teachers to observe gifted traits in students they otherwise may not have recognized.
Moore, Ford, and Milner (2005) agreed, stating problem-based learning can attend to the
cultural needs of underrepresented populations such as the need to communicate, move,
and express their individualism. Through the talent development intervention, the
researcher presented participants with multiple culturally relevant problem-based learning
assignments. Each assignment took approximately two to three weeks, allowing the
students to complete a minimum of four assignments during the intervention period.
Teachers who completed the GRS on the participants were asked to observe students

68
while they were working on the problem-based learning assignments as well as in the
regular classroom.
Teacher training. The final element of a successful talent development program
as noted by Grissom and Redding (2016), Horn (2014), and Sears (2016) was teacher
training. This research study included two levels of teacher training. The first required
element of teacher training was weekly meetings with the AIG coordinator. During these
meetings, teachers planned with the AIG coordinator, modifying lessons and activities so
they more closely mirrored the talent development framework outlined in the previous
three sections. Teachers were also able to ask questions about specific students,
characteristics of CLED learners, or other questions pertaining to gifted education and
multi-cultural curriculum during these meetings.
Additionally, teachers in the study were invited to participate in a local AIG
certification module where they learned more in-depth knowledge about gifted education
and CLED students. One school in the study agreed to provide this professional learning
to their entire staff, and the other school participating highly encouraged their staff to
partake. The module was available for all teachers in the school district.
Procedures for Participation
Specific determination of the experimental groups was established by looking at
subgroup data for all three subgroups being studied (African-American, Hispanic, and
Caucasian) for the i-Ready diagnostic assessments taken in September and January of the
2017-2018 school year. Within each subgroup, the top 20% of the students at
participating schools were invited to participate in the talent development intervention.
Students who returned permission slips to participate received the talent
development services as previously described. Teachers of these students completed a
69
preliminary GRS on the students, and parents were asked to complete an initial parent
survey. Throughout the study, i-Ready assessments, GRS, attendance, NNAT, and
survey data continued to be collected on the participants.
Prior to the focus groups, parents of students receiving the talent development
intervention were invited to participate in the focus group. The researcher randomly
selected focus group participants from those interested, ensuring creation of focus group
samples that were demographically representative of the intervention subgroups, a
suggestion by Creswell (2014) as a way to ensure as many discrepancies in quantitative
data as possible could be explained. Teachers participating in the focus group were
invited to participate based on their involvement in the talent development program.
While all teachers were involved in the survey responses, only teachers involved in the
talent development intervention were invited to the focus groups. This decision ensured
the teachers who were part of the focus group understood the procedures, data, and
students being discussed. Including parents and teachers who were aware of the study
and its purpose increased the effectiveness of the explanatory mixed methods research
design.
At the close of the study, parents and teachers were asked to complete a
postsurvey (mirroring the initial survey), and teachers completed a final GRS on the
participating students. Parents and teachers were made aware participation was
voluntary, and they were welcome to remove themselves from the research study at any
time.
Data Collection Plan
Quantitatively, the district collected multiple forms of data throughout the school
year due to “federal requirements, state-level decision making…and the particular district

70
initiatives” (Butin, 2010, p. 89). Additionally, the study utilized focus groups and open-
ended survey questions to provide qualitative study data. While these data have been
previously described, a schedule of data collection is explained here.
i-Ready assessments. i-Ready benchmark data were collected at three points: the
September 5-22 testing window, the January 17 through February 2 testing window, and
the April 9-27 testing window.
GRS. Teachers completed the GRS checklist on all students who fell in the top
20% of i-Ready results from the September and January testing window and completed a
GRS on the participants who were still part of the study at the end of April.
Panorama education surveys. The district administered the Panorama
Education survey in October and March of the 2017-2018 school year. Data from
October were used as preintervention data and data from March were used as
postintervention data.
Teacher perception surveys. Teacher perception surveys were given
preintervention (end of January) and postintervention (end of April). Two files of the
same survey were developed, with one being sent to schools implementing the
intervention and one being sent to schools not implementing the intervention. This
process allowed the researcher to effectively compare results and analyze the impact of
the study, while still allowing all survey participants to remain anonymous.
Attendance reports. Attendance reports were collected on all participants in the
study for each semester of the school year: August-January (preintervention), and
February-April (postintervention).
NNAT. NNAT scores were collected as a measure of baseline intelligence on all
study participants. Taken in the first 20 days of the school, NNAT data for all
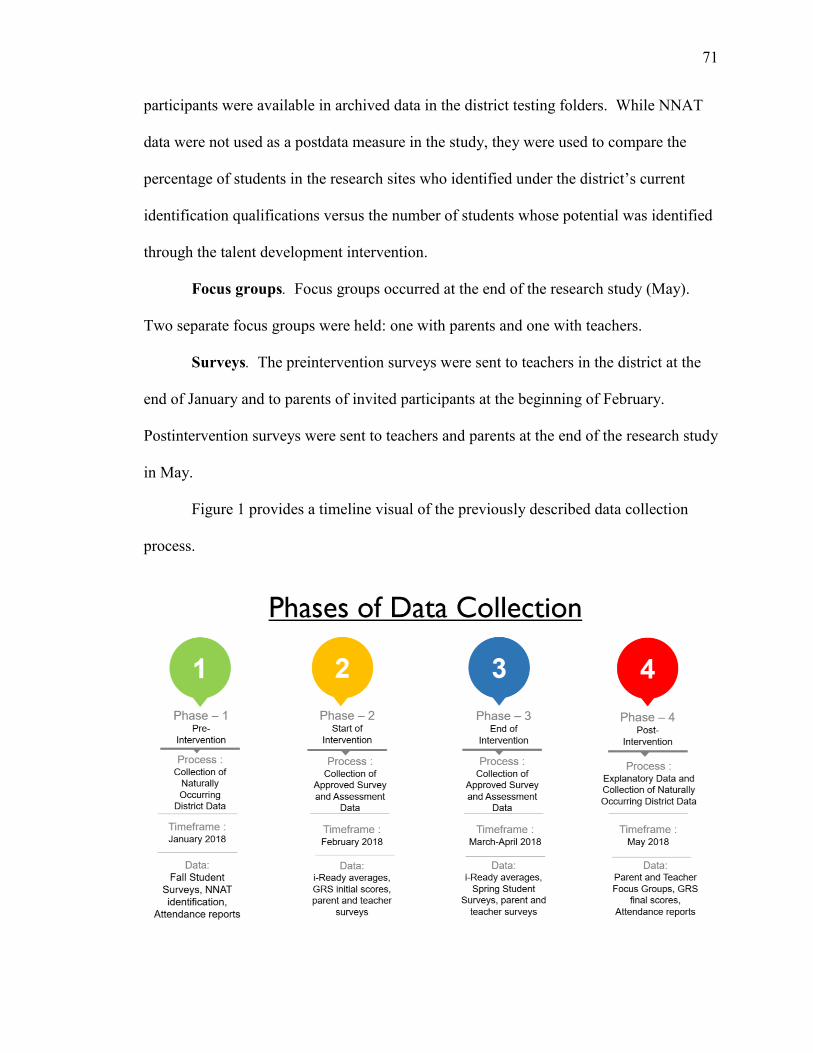
71
participants were available in archived data in the district testing folders. While NNAT
data were not used as a postdata measure in the study, they were used to compare the
percentage of students in the research sites who identified under the district’s current
identification qualifications versus the number of students whose potential was identified
through the talent development intervention.
Focus groups. Focus groups occurred at the end of the research study (May).
Two separate focus groups were held: one with parents and one with teachers.
Surveys. The preintervention surveys were sent to teachers in the district at the
end of January and to parents of invited participants at the beginning of February.
Postintervention surveys were sent to teachers and parents at the end of the research study
in May.
Figure 1 provides a timeline visual of the previously described data collection
process.

72
Figure 1. Phases of Data Collection. This figure shows a timeline for the data collection
completed throughout this research study.
As shown in Figure 1, data collection occurred throughout the study and was used
in an explanatory manner during the data analysis explained in the following section.
Data Analysis Plan
Creswell (2014) and Urdan (2010) stated the importance of choosing the most
effective statistics when completing data analysis. Additionally, Creswell and Urdan
believed a holistic account of research helped “develop a complex picture of the problem
or issue under study…and involved reporting multiple perspectives” (p. 186). Data
analysis helps researchers present a visual model of their holistic account. In looking at
multiple subgroups and their achievement and engagement levels before and after talent
development, the researcher analyzed means, ranges, and correlation comparisons of all
pre and posttest results for the participants in both the experimental and comparison
groups. These data analyses were represented in column and stacked column graphs
based on recommendations by Urdan.
In addition to descriptive statistics, Urdan (2010) suggested, “larger statistics [like
t tests and z scores] are more likely to be judged by the researcher to indicate a
meaningful, or statistically significant, effect in the sample” (p. 59). This suggestion
paired with the recommendation of Dr. Burgess, one of the committee members, to
“utilize t-tests and z-scores along with chi-squares in your final analysis” (K. Burgess,
personal communication, June 16, 2017).
In considering z scores, it is important to note z scores allow for comparison
between participants, whether normal distribution of data exist or not. In researching
73
CLED populations and talent development services, there are numerous external factors
essential to consider. The use of z scores and their confidence intervals helped account
for these variables.
T tests, in addition to z scores, were used to help “determine the practical
significance of the results” (Urdan, 2010, p. 77). According to Creswell (2014) and
Urdan (2010), this significance, or truth finding in a study, occurs when a researcher
identifies sample size, sample mean, standard deviation, and standard error of the mean in
order to determine a t value and then uses this value to calculate the degrees of freedom,
confidence intervals, and effect size. Using these data analyses in conjunction with z
scores enhanced the statistical significance of the study’s findings.
The third statistical analysis tool the researcher used was the chi-square analysis.
The chi-square analysis allowed the researcher to determine if there was a significant
difference between the observed frequencies and what would be expected (Urdan,
2010). Specifically, the researcher looked at data on how many students showed growth
through the talent development intervention per subgroup to determine how many
students in the normal population could be expected to be impacted by a similar talent
development intervention.
In addition to these statistics, Urdan (2010) noted the necessity to account for
external variables such as between-group and within-group differences, suggesting the
use of a grand mean which looks at the mean of all groups combined to compare
between-group data. Using a grand mean in this study, the researcher looked at the
impact of talent development on ALL students/groups included, compared this grand
mean to individual subgroup data, and then determined whether the impact of the
independent variable of talent development was statistically beneficial for some,

74
beneficial for all, or beneficial for none. Accounting for “other” variables that might
impact data results was a huge piece of this research because “variables are related to
each other in very complex ways” (Urdan, 2010, p. 130). Qualitative data collected in an
explanatory way through focus groups at the end of the study further assisted in looking
at variables through multiple lenses.
Table 10 illustrates how each analysis tool aligns with the data instruments and
research questions.

75
Table 10
Methods Table: An “At a Glance” Guide
Research Question Tools/
Instruments
Methodology
Type
Data Collected Method(s) of
Analysis
What elements of a talent
development program
have the greatest impact
on developing potential
in underserved
populations?
Parent and
Teacher Focus
Groups
Parent and
teacher
surveys
Qualitative Parent and teacher
responses about
each component of
the talent
development
program
Thematic Coding
Analyze negative
and positive
responses
Descriptive
statistics
How does
implementation of a
talent development
program impact
underrepresented
populations regarding
achievement?
i-Ready
GRS ratings
[Academic
section]
Parent and
Teacher Focus
Groups
Mixed
Methods
(QUAN +
qual)
i-Ready BOY-
MOY-EOY scores
GRS MOY-EOY
ratings
Teacher
reflections on
informal and
formal
observations
Subgroup
breakdowns of
growth using chi-
square (for i-Ready
and GRS)
Correlation analysis
between QUAN
data and qual focus
group responses
How does
implementation of a
talent development
program impact
underrepresented
populations regarding
engagement?
Panorama
Education
Surveys
[Engagement
and Grit]
GRS ratings
[Motivation
section]
Attendance
Reports
Parent and
Teacher Focus
Groups
Mixed
Methods
(QUAN +
qual)
Panorama
Education BOY-
EOY survey
responses
[Engagement and
Grit]
GRS MOY-EOY
ratings
PowerSchool
Attendance
Reports
Parent and
Teacher
perspective on
student
engagement
during
program/with
talent development
activities
Breakdowns of
growth using chi-
square (for
Panorama
Education Surveys
(full group only)
and for GRS (full
group and
subgroup))
Grand mean
comparison for
attendance
Correlation analysis
between QUAN
data and qual focus
group responses
(continued)
To what degree of NNAT Quantitative Previous Comparison of

76
Research Question Tools/
Instruments
Methodology
Type
Data Collected Method(s) of
Analysis
difference does a talent
development program
identify potentially gifted
CLED students in
comparison to
standardized
identification methods?
GRS [All
sections]
Teacher
surveys [coded
to quantitative
data]
identification
results
GRS EOY rating
Identification of
GRS (top 20%) to
Identification by
NNAT + EOG
through descriptive
statistics
Urdan (2010) reminded researchers all factors cannot be controlled within a study,
but “the key is to provide enough information so that readers of your results can make
sense of them” (p. 124). The data analysis tools chosen by the researcher intended to call
attention to possible variables and their impact on the study’s findings, so the research
would be useful for others. Ultimately, the goal of the research study was to go beyond
simply being able to generalize research results, to the production of statistically
significant results which would lead to the recommendation for further implementation of
talent development services in the district.
Threats to Validity
Taking into consideration the factors of the study, it was possible for there to be
threats to validity. Internally, the students participating in the study were of elementary
school age, and therefore maturation of some students but not others could impact the
results. Additionally, some students in the study/district historically dealt with external
life events that could negatively impact them and/or their results. These possible threats
were considered in the data analysis stage of the experiment and were controlled for by
using qualitative data that called attention to possible external factors. Last, while the
sites in the district were demographically similar, there were differing characteristics

77
between each site’s populations, so the ability to generalize results from one site to
another might be restricted. The researcher took this information into consideration and
recommended further experiments be conducted at other sites before confirming any
generalizations.
Issues of Trustworthiness
As noted by Davis et al. (2017) as well as Krueger and Casey (2009), the biggest
issue of trustworthiness for this study was the sensitivity of the topic being discussed,
namely, underrepresented populations in the gifted education program in the district.
While there was potential for heightened emotion around this topic, the researcher
continuously reinforced to all participants the goal of the research was to understand
needs and address concerns of the participants to determine appropriate interventions for
the future (Krueger & Casey, 2009). Additionally, the researcher listened to the
participants, particularly in the focus group setting, to show she was not assuming a
position of power over the participants. To positively impact this understanding, the
researcher had a moderator of a similar ethnic/racial background to the participants in the
study (for this study, a member of an underrepresented population) who assisted in
leading the focus group discussions (a recommendation of Krueger & Casey, 2009).
Ethical procedures. Creswell (2014) and Krueger and Casey (2009) both noted
building trust could be accomplished by completing the research study in an ethical
manner. Prior to the research study, the researcher obtained permission from the
participating district and school-level administrators and received approval from the
Institutional Review Board at Gardner-Webb University to complete the research study.
Throughout the study, the researcher ensured ethical procedures by obtaining informed
consent from all participants. As previously stated, no participants were required to

78
participate in the study, and no rewards were given to participants for their participation.
Additionally, throughout the study, the researcher collected data without being disruptive
to the organizations participating. When disseminating results, the researcher did not
disclose any participant names or identifying data and reported the findings as they were,
disclosing all results, positive or negative. Last, the results of the study were made
available for participants to review (Creswell, 2014; Krueger & Casey, 2009).
Summary
Underrepresentation of CLED students is not a one time, one place problem.
Ultimately, underrepresentation of CLED students is a national issue. It is for this reason
the researcher approached this study with a transformative mindset, involved
stakeholders of CLED populations and teachers of CLED students in the study, and
utilized data analysis tools proving to be both practically and statistically significant.
Ultimately, CLED students who are gifted deserve to have access to the same resources
as their Caucasian counterparts. This transformative, mixed methods explanatory study
showed implementation of a talent development framework could have a positive impact
on CLED student access to these gifted resources.

79
Chapter 4: Results
Review of Problem Statement
The education world is becoming a more diverse arena; and within the next 10
years, the current minority populations will be the majority (Ford, 2013; Thornbury,
2010). Despite this projected growth, the realm of gifted education remains culturally
stacked against minority populations: a discrepancy that has widened the excellence gap
in student achievement. To combat the growing excellence gap and underrepresentation
of CLED populations in gifted education, educators must take steps to increase the equity
of access to these programs. Without question, Plucker et al. (2010) warned that
allowing the excellence gap to widen further will deny the nation of future innovators and
will ultimately have a negative effect on America’s global competitiveness and survival
(Friedman & Mandelbaum, 2011).
Restatement of Research Focus
According to NAGC (2015), talent development interventions, such as the
intervention focused on in this research study, are one avenue shown to increase equity of
access for CLED populations in gifted education programs. Olszewski-Kubilius and
Thomson (2015) warned researchers, however, that talent development interventions are
multi-faceted and include numerous best practices. In particular, Olszewski-Kubilius and
Thomson called attention to the following elements of successful talent development
programs: professional development for teachers, initial enrichment provided to a greater
population of students, ongoing assessment so groups can be flexible, comprehensive
assessment so different giftedness can be measured, using local norms, looking for
students who have major jumps between benchmark assessments, and providing feedback
that encourages effort over success particularly for students in CLED populations. Ford

80
(2013) further noted communication between home and school, curriculum adjustments,
and multiple identification pathways as essential components of a talent development
program. The key components of the talent development intervention implemented in
this research study included looking beyond traditional assessment measures for gifted
potential, providing professional development for teachers, increasing collaboration
between regular education teachers and AIG specialists, making curriculum adjustments,
and cultivating student support networks with specific attention to an increased
communication between home and school. Ultimately, these components of a talent
development program were utilized to increase the access of CLED populations to gifted
education programs.
To best determine the impact of talent development on CLED populations as well
as develop a list of components within a talent development intervention that have the
greatest impact on CLED students, the research study was developed using an
explanatory mixed methods approach where the researcher collected quantitative data on
achievement and engagement and then utilized qualitative data from parent and teacher
focus groups and surveys to support the quantitative findings (Creswell, 2014). The
mixed-methods study specifically addressed the following research questions.
1. What elements of a talent development program have the greatest impact on
developing potential in underserved populations?
2. How does implementation of a talent development program impact
underrepresented populations regarding achievement?
3. How does implementation of a talent development program impact
underrepresented populations regarding engagement?
4. To what degree does a talent development program identify potentially gifted

81
CLED students in comparison to standardized identification methods?
Overview of the Chapter
The previously listed research questions were used to frame the following chapter
of the research report. Specifically, the chapter provides a review of each research
question, followed by the presentation and summary of results related to each research
question. As the research questions are analyzed, the data analyses used for each
research question are explained and a detailed description of results through tables,
charts, figures, and narratives is provided. As previously mentioned, the purpose of the
research study was to pinpoint specific components of a successful talent development
intervention as well as determine whether talent development interventions positively or
negatively impacted achievement and engagement in CLED populations. The research
study focused on the top 20% of students in fourth and fifth grade (defined by Ford &
King, 2014 as high-ability learners) for each of the three most prevalent demographic
populations in the district where the study was conducted (African-American, Caucasian,
and Hispanic). To account for any differences in subgroup results, data presented in this
chapter will frequently include subgroup analysis.
Presentation of Results
Research Question 1. As previously stated, talent development interventions are
multi-faceted and have numerous components meant to assist students socially,
emotionally, and academically. While a range of elements such as looking beyond IQ
tests, recognizing noncognitive abilities in students, paying attention to subgroup norms,
increasing communication between home and school, increasing student engagement
through active learning, providing professional learning to build awareness of CLED
populations, mentoring, and developing partnerships within the community are found to

82
be beneficial to talent development programs, gifted education researchers such as Ford
(2013), NAGC (2017), Olszewski-Kubilius and Thomson (2015), and Renzulli (2015)
have yet to develop one universal model for talent development implementation. The
absence of a universal talent development framework provides freedom for educators
who are implementing talent development programs but does not provide a foundation
for consistency among talent development programs.
Research Question 1, “What elements of a talent development program have the
greatest impact on developing potential in underserved populations,” was formed to
address the absence of a universal talent development framework. Specifically for this
research study, the researcher chose to implement the following elements from the talent
development frameworks of Ford (2013), NAGC (2017), Olszewski-Kubilius and
Thomson (2015), and Renzulli (2015): locating potential beyond IQ testing, training
teachers on CLED populations, increasing collaborative planning time with teachers,
adjusting curriculum to include more active learning through problem-based activities,
deliberately cultivating support networks, and increasing the communication between
school and home. Through Research Question 1, the researcher gained knowledge of
these consistent elements by collecting qualitative data from parent and teacher surveys
and parent and teacher focus groups.
Survey data. Parent and teacher surveys were sent to both the comparison and
treatment groups prior to implementing talent development services and at the close of
the 12-week program. Parent surveys focused on whether parents were informed about
gifted programming, the level of support parents felt their children had, whether their
children were acknowledged for accomplishments, whether students were held to high
academic expectations, and the educational equity of their child’s education. Parents

83
were also asked to share what their culture values, how they defined giftedness, and the
strengths and areas of improvement they saw for their child. Teacher surveys focused on
how teachers defined giftedness; the level of supports they felt were in place for parents,
teachers, and students in gifted programs; their perception of current gifted identification
methods; and their level of multi-cultural understanding. Teachers were also asked to
share how they defined giftedness, factors that would cause them to recommend or not
recommend students for a gifted program, and benefits and drawbacks they saw to using
teacher referrals to identify students for a gifted program.
The parent and teacher surveys for this research study were aligned with the talent
development framework the researcher used for the study. Prior to survey data
collection, the researcher met with a panel of teachers (for the teacher survey) and CLED
parents (for the parent survey) to align the components implemented through the research
study with the survey items. Based on panel review of survey items, some components
of the talent development intervention were more heavily accounted for in the surveys
than others. The panel team felt some themes were not survey conducive without further
explanation to survey participants, and the panel wanted to keep the survey focused on
information survey participants would be able to relate to and answer in an informed
manner. Table 11 shows the alignment between the surveys and talent development
components focused on in this research.

84
Table 11
Survey Alignment to Talent Development Components
Talent Development Component Aligned Items in
Parent Survey
Aligned Items in
Teacher Survey
Locating Potential Beyond IQ Testing
3, 10, 11, open-ended
2
9, 10, 11, 12, open-
ended 1
Training Teachers on CLED
Populations
12, 19, 20, open-
ended 3
2-4, 13, 15-17, open-
ended 2
Increasing Collaborative Planning
Time with Teachers
None 6, 7
Adjusting Curriculum to Include more
Active Learning
17, 18 14, open-ended 6
Deliberately Cultivating Support
Networks
4-9, 13-16 open-
ended 4
1, 8, open-ended 3
Increasing Communication Between
School and Home
1, 2, open-ended 1 5
As shown in Table 11, locating potential and training teachers were two of the
main components focused on in the parent and teacher surveys. These two components
were found in all frameworks reviewed by the researcher, and the panel of survey
creators additionally felt these two components could be addressed by both parents and
teachers in a knowledgeable way.
The parent and teacher surveys were sent to both the treatment and comparison
groups at the beginning and end of the 12-week intervention period. Results from the
parent and teacher surveys are presented in this section, and complete results of the
surveys can be found in Appendices F-M. Results shared in this section compare the
results of the pre and postsurveys for each group through stacked column graphs and
narrative explanations. Figures 2-15 show the breakdowns of each of the clusters with

85
treatment and comparison group pre and post responses. Open-ended responses and
focus group responses specifically supporting survey responses are summarized in the
narratives following the figures. Additional focus group data are elaborated on later in
this section.
Locating potential beyond IQ. Figure 2 begins with parent responses for cluster
one–locating potential beyond IQ.
Figure 2. Parent Survey Responses for Locating Potential Cluster. This figure shows the
positive and negative responses for the parents in the treatment and comparison groups
prior to and after the intervention period.
As shown in Figure 2, for both the pre and postsurvey results, the treatment and
control group had more positive than negative responses. The stacked graph additionally
shows the treatment group had more positive responses than the comparison group in all
questions in both the pre and postsurveys. Specifically, item three, which focused on
whether the district’s gifted education program adequately located gifted students,
0%
10%
20%
30%
40%
50%
60%
70%
80%
90%
100%
Locating Potential- Parent Responses
Positive Response Negative Response

86
showed greater agreement in the treatment group.
Additionally, the researcher analyzed open-ended item two on defining giftedness
to determine whether parents had a more traditional academic definition of giftedness or
a “beyond IQ” definition of giftedness. In the treatment group, presurveys showed 16
traditional and 10 nontraditional definitions, and the comparison group presurveys
showed 16 traditional and 13 nontraditional definitions. In the postsurvey, the treatment
group had 14 traditional and 19 nontraditional definitions, and the comparison group had
16 traditional and 12 nontraditional definitions. Figure 3 shows teacher survey responses
for the same theme–locating potential beyond IQ.
Figure 3. Teacher Survey Responses for Locating Potential Beyond IQ. This figure
shows the positive and negative responses for the teachers in the treatment and
comparison groups prior to and after the intervention period.
As with the parent survey, the treatment group had more positive responses than
the comparison group for all items. Looking specifically at item nine, which asked if the
0%
10%
20%
30%
40%
50%
60%
70%
80%
90%
100%
Locating Potential- Teacher Responses
Positive Responses Negative Responses

87
district had multiple pathways for gifted enrollment, a 100% positive response in the
treatment group was shown in the postsurvey. Items 10, 11, and 12, which related to
adequate enrollment of diverse populations, remained mostly the same between pre and
postsurveys in both groups.
Open-ended item one in the teacher survey, like open-ended item two in the
parent survey, asked teachers how they would define giftedness. This item was intended
to show whether teachers had a more traditional, academic definition of giftedness or a
“beyond IQ” definition of giftedness. In the treatment group, presurveys showed 15
traditional and 12 nontraditional definitions, and in the comparison group presurveys
showed 13 traditional and 10 nontraditional definitions. In the postsurvey, the treatment
group had seven traditional and eight nontraditional definitions, and the comparison
group had eight traditional and seven nontraditional definitions.
Training teachers of CLED populations. The second cluster of survey questions
addressed the component of training teachers of CLED populations. Figure 4 shows the
parent responses to this cluster.

88
Figure 4. Parent Survey Responses for Training Teachers. This figure shows the positive
and negative responses for the parents in the treatment and comparison groups prior to
and after the intervention period.
As with the cluster of locating potential, parent responses for training teachers
were mostly positive, with greater positive responses from the treatment group than
comparison group. Item 12, which asked whether the child’s teachers believed they
could be successful, was originally 100% positive in the comparison group but had a
slight negative response in the postsurvey results. The treatment group had the opposite
effect on item 12 with a slightly negative response in the presurvey and a 100% positive
response in the postsurvey. The treatment group also had a 100% positive response in the
postsurvey for item 20, “My child’s education is equal to others.”
Open-ended survey item three, which focused on strengths of children, was meant
to show what parents wanted teachers to acknowledge about their children (a skill that
could be developed through professional learning). Item three was also developed to
0%
10%
20%
30%
40%
50%
60%
70%
80%
90%
100%
Training Teachers- Parent Responses
Positive Responses Negative Responses

89
show alignment with parent definitions of giftedness. Data analysis of open-ended item
three showed 16 parents in the comparison group presurvey wanted their students to be
acknowledged for traditional gifted traits and 14 parents wanted their children to be
acknowledged for nontraditional traits; and 15 looked at traditional traits and 16 looked
for nontraditional traits to be acknowledged in the postsurvey. In the treatment group, 18
parents in the presurvey wanted their students to be acknowledged for traditional gifted
traits and 13 parents wanted their children to be acknowledged for nontraditional traits;
and 13 looked for traditional trait recognition and 20 looked for nontraditional trait
recognition in the postsurvey.
Teacher responses to the cluster of teacher training are included in Figure 5.
Figure 5. Teacher Survey Responses to Training Teachers. This figure shows the
positive and negative responses for the teachers in the treatment and comparison groups
prior to and after the intervention period.
Figure 5 illustrates the first teacher training cluster focused on teacher knowledge
0%
10%
20%
30%
40%
50%
60%
70%
80%
90%
100%
Teacher Responses- Training Teachers
Positve Responses Negative Responses
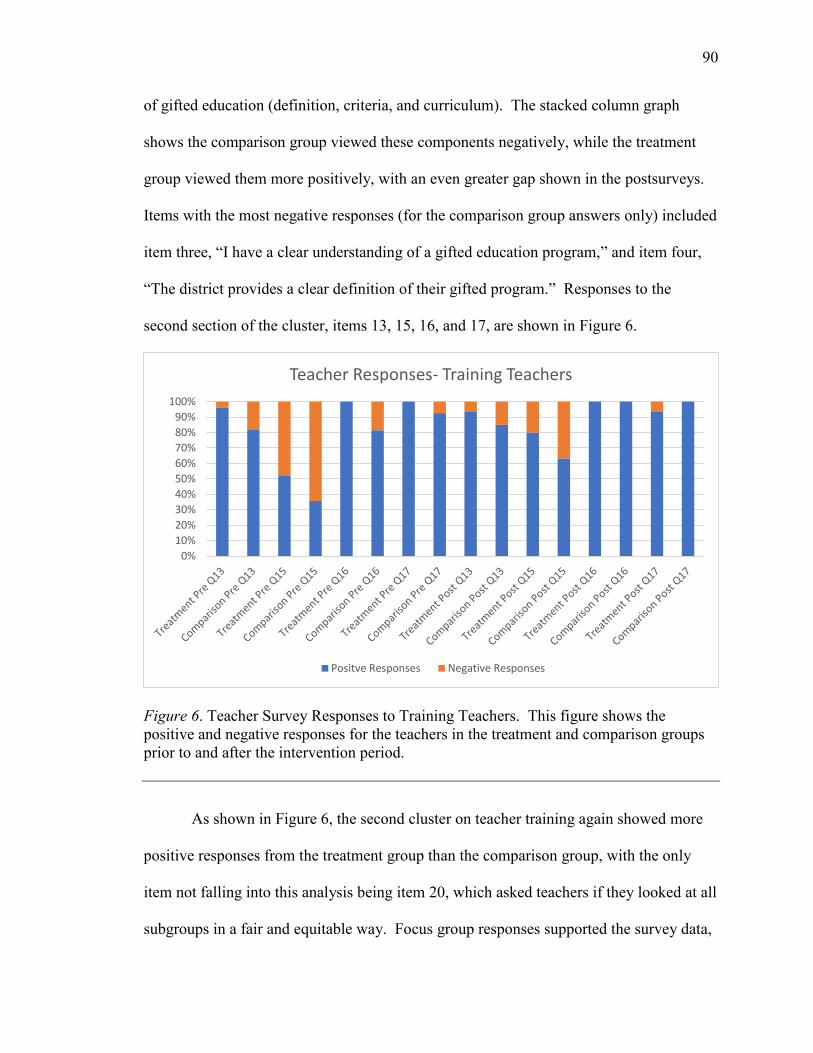
90
of gifted education (definition, criteria, and curriculum). The stacked column graph
shows the comparison group viewed these components negatively, while the treatment
group viewed them more positively, with an even greater gap shown in the postsurveys.
Items with the most negative responses (for the comparison group answers only) included
item three, “I have a clear understanding of a gifted education program,” and item four,
“The district provides a clear definition of their gifted program.” Responses to the
second section of the cluster, items 13, 15, 16, and 17, are shown in Figure 6.
Figure 6. Teacher Survey Responses to Training Teachers. This figure shows the
positive and negative responses for the teachers in the treatment and comparison groups
prior to and after the intervention period.
As shown in Figure 6, the second cluster on teacher training again showed more
positive responses from the treatment group than the comparison group, with the only
item not falling into this analysis being item 20, which asked teachers if they looked at all
subgroups in a fair and equitable way. Focus group responses supported the survey data,
0%
10%
20%
30%
40%
50%
60%
70%
80%
90%
100%
Teacher Responses- Training Teachers
Positve Responses Negative Responses

91
specifically drawing attention to the underlying biases teachers have and how they can
influence their decisions to recommend students. Focus group participants also called
attention to how the training provided during the intervention made them more aware of
what their biases were.
Increasing collaborative planning time with teachers. As noted previously,
increasing collaborative planning time between teachers and AIG specialists closely
aligns with the concept of providing professional development for teachers. The
researcher intentionally separated the two concepts for this research to determine if both
were necessary, or if one was more essential than the other. It is important to note, parent
responses, while related to training of teachers, were not related to collaborative
planning. Since parents are not present in the school building during teacher planning
sessions, the researcher and survey panel determined only teachers would be surveyed on
questions related to collaborative planning time. Figure 7 shows the teacher survey
responses to this cluster.

92
Figure 7. Teacher Survey Responses to Collaborative Planning with Teachers. This
figure shows the positive and negative responses for the teachers in the treatment and
comparison groups prior to and after the intervention period.
As shown in Figure 7, the action of providing resources and support to teachers
was not occurring in mass at either the treatment or control sites prior to the intervention,
as teachers in both groups noted negative response to these questions in the presurveys.
In the postsurveys, while the comparison group remained about the same in the
breakdown between positive and negative responses, the treatment group showed more
positive feedback on collaborative support. Support for this growth was addressed during
teacher focus groups when three different teachers called attention to how the
collaborative sessions during the program assisted them in better supporting gifted
students of all populations in their classrooms. The data analysis of these survey items
confirmed the greatest need in this cluster was in item seven, teachers needing more
support on the social and emotional needs of gifted learners.
0%
10%
20%
30%
40%
50%
60%
70%
80%
90%
100%
TreatmentPre Q6
ComparisonPre Q6
TreatmentPre Q7
ComparisonPre Q7
TreatmentPost Q6
ComparisonPost Q6
TreatmentPost Q7
ComparisonPost Q7
Collaborative Planning- Teacher Responses
Postive Responses Negative Responses

93
Adjusting curriculum to include more active learning. Coleman and Shah-
Coltrane (2015) and Gallagher and Gallagher (2013) discussed how collaborative
sessions between regular education teachers and specialists could lead to adjusting
curriculum and instructional practices to better meet the needs of CLED students.
Specifically, Ford (2013) reminded educators they cannot locate potential in CLED
students or serve their needs appropriately if they continue using sit-and-get traditional
teaching strategies. Instead, Gallagher and Gallagher and NAGC (2015) encouraged
teachers to focus on active learning such as the problem-based learning approach. Ford
(2013) and Hammond (2015) additionally directed educators to include multi-cultural
curriculum components in their classrooms. These research points were utilized to
develop the curriculum cluster of survey items which focused on whether teachers and
parents perceived engaging, multi-cultural lessons were being implemented in the
classroom. Figure 8 shows both parent responses to the survey items in this cluster.

94
Figure 8. Parent Survey Responses for Adjusting Curriculum. This figure shows the
positive and negative responses for the parents in the treatment and comparison groups
prior to and after the intervention period.
As shown in Figure 8, parents across both the treatment and comparison groups
perceived their children to be receiving engaging, culturally responsive curriculum that
met the needs of their child’s learning in presurveys. Additionally, survey responses
showed this perception improved in both groups over the 12-week intervention period.
Teacher survey responses, shown in Figure 9, supported these findings.
0%
10%
20%
30%
40%
50%
60%
70%
80%
90%
100%
TreatmentPre Q17
ComparisonPre Q17
TreatmentPre Q18
ComparisonPre Q18
TreatmentPost Q17
ComparisonPost Q17
TreatmentPost Q18
ComparisonPost Q18
Parent Responses- Adjusting Curriculum
Positive Responses Negative Responses

95
Figure 9. Teacher Survey Responses to Adjusting Curriculum. This figure shows the
positive and negative responses for the teachers in the treatment and comparison groups
prior to and after the intervention period.
As shown in Figure 9, teachers are adjusting their teaching to attend to the needs
of CLED populations. Teacher and parent focus group responses relating to the increase
of problem-based learning in the classroom, differentiation of lessons based on student
needs, and students feeling excited and engaged with what they were learning further
confirmed the overwhelmingly positive responses for this cluster of the parent and
teacher surveys.
In addition to making learning more active, Ford (2010, 2013) argued educators
needed to address multi-cultural education practices within their instruction. The
researcher knew to effectively assist in bringing about these curriculum changes, it was
essential to clarify teacher understanding of the principle of multi-cultural education.
Teacher survey open-ended item six addressed this need, asking teachers what their
0%
10%
20%
30%
40%
50%
60%
70%
80%
90%
100%
Treatment Pre Q14 Comparison Pre Q14 Treatment Post Q14 Comparison Post Q14
Teacher Responses- Adjusting Curriculum
Positive Responses Negative Responses

96
current understanding of multi-cultural education was. In analysis of the responses, the
researcher broke the responses into two categories: change of content and change of
perspective, based on Ford (2013) and Hammond’s (2015) notation of two avenues of
multi-cultural education: instruction changes and learning environment changes. In the
treatment group, 13 responses referenced changing content and 11 referenced changing
perspectives in the presurvey, while seven responses referenced changing content and
seven responses referenced changing perspective in the postsurvey. For the comparison
group, 11 responses referenced changing content and eight referenced changing
perspectives in the presurvey, while nine responses referenced changing content and four
responses referenced changing perspective in the postsurvey.
Deliberately cultivating support networks. Ford (2013) and Hammond (2015)
also called attention to the need not to simply serve CLED students in gifted education
but to cultivate support systems around them so they would be retained in the programs.
While culturally responsive instruction is one step in retaining CLED students in gifted
education, Ford (2013) pointed out relationships, expectations, student belief in self, and
the learning/growing environment of the child matter just as much, if not more. To
account for the multiple facets of support networks, many of the survey items related to
this cluster. The survey panel felt parents and teachers would have great insight on the
concept of deliberately cultivating support networks because they are in the trenches
building these supports daily.
Additionally, the survey panel felt parent perceptions of support systems were
extremely important, as sometimes educators may perceive situations one way while
parents see the situation differently. For this reason, in the parent survey, two sections
were devoted to support systems (one section focusing on outside-of-school support and
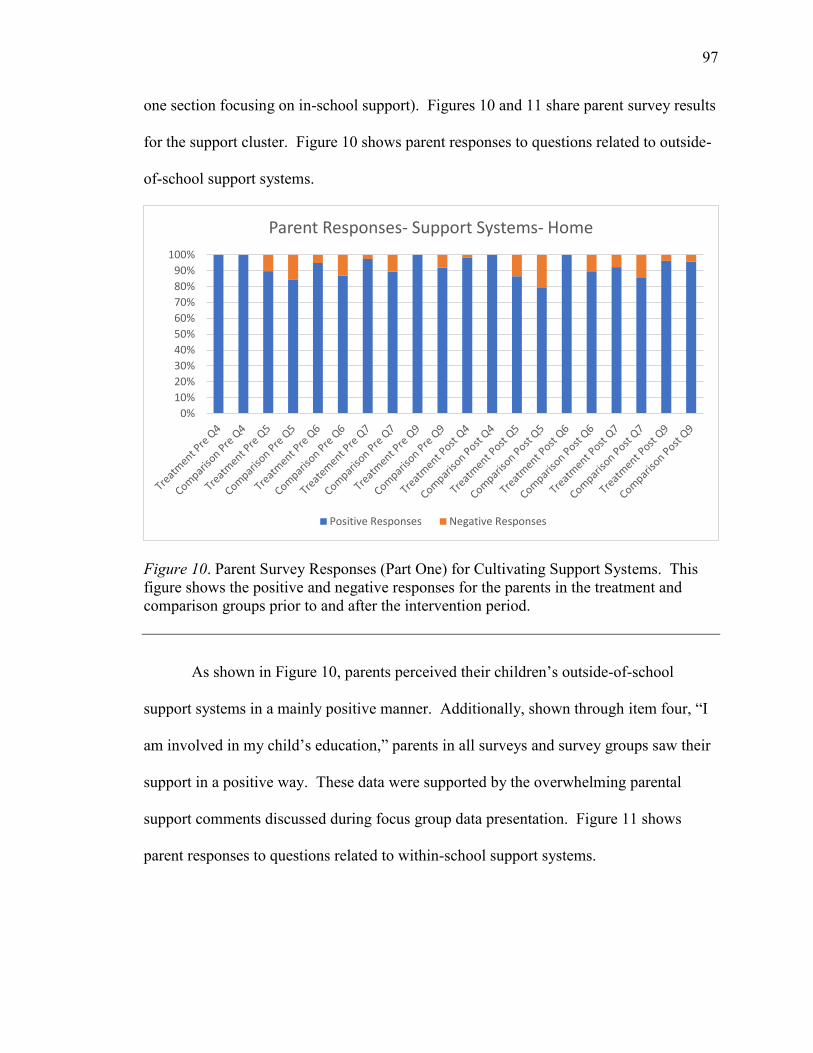
97
one section focusing on in-school support). Figures 10 and 11 share parent survey results
for the support cluster. Figure 10 shows parent responses to questions related to outside-
of-school support systems.
Figure 10. Parent Survey Responses (Part One) for Cultivating Support Systems. This
figure shows the positive and negative responses for the parents in the treatment and
comparison groups prior to and after the intervention period.
As shown in Figure 10, parents perceived their children’s outside-of-school
support systems in a mainly positive manner. Additionally, shown through item four, “I
am involved in my child’s education,” parents in all surveys and survey groups saw their
support in a positive way. These data were supported by the overwhelming parental
support comments discussed during focus group data presentation. Figure 11 shows
parent responses to questions related to within-school support systems.
0%
10%
20%
30%
40%
50%
60%
70%
80%
90%
100%
Parent Responses- Support Systems- Home
Positive Responses Negative Responses
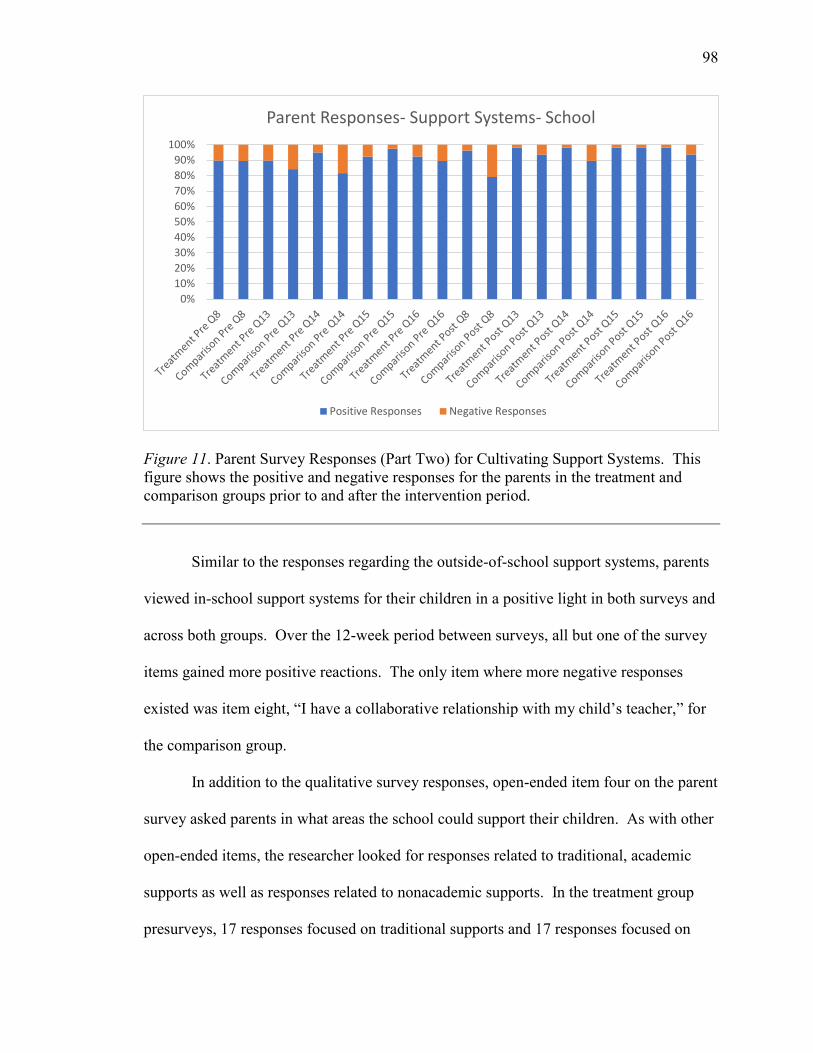
98
Figure 11. Parent Survey Responses (Part Two) for Cultivating Support Systems. This
figure shows the positive and negative responses for the parents in the treatment and
comparison groups prior to and after the intervention period.
Similar to the responses regarding the outside-of-school support systems, parents
viewed in-school support systems for their children in a positive light in both surveys and
across both groups. Over the 12-week period between surveys, all but one of the survey
items gained more positive reactions. The only item where more negative responses
existed was item eight, “I have a collaborative relationship with my child’s teacher,” for
the comparison group.
In addition to the qualitative survey responses, open-ended item four on the parent
survey asked parents in what areas the school could support their children. As with other
open-ended items, the researcher looked for responses related to traditional, academic
supports as well as responses related to nonacademic supports. In the treatment group
presurveys, 17 responses focused on traditional supports and 17 responses focused on
0%
10%
20%
30%
40%
50%
60%
70%
80%
90%
100%
Parent Responses- Support Systems- School
Positive Responses Negative Responses
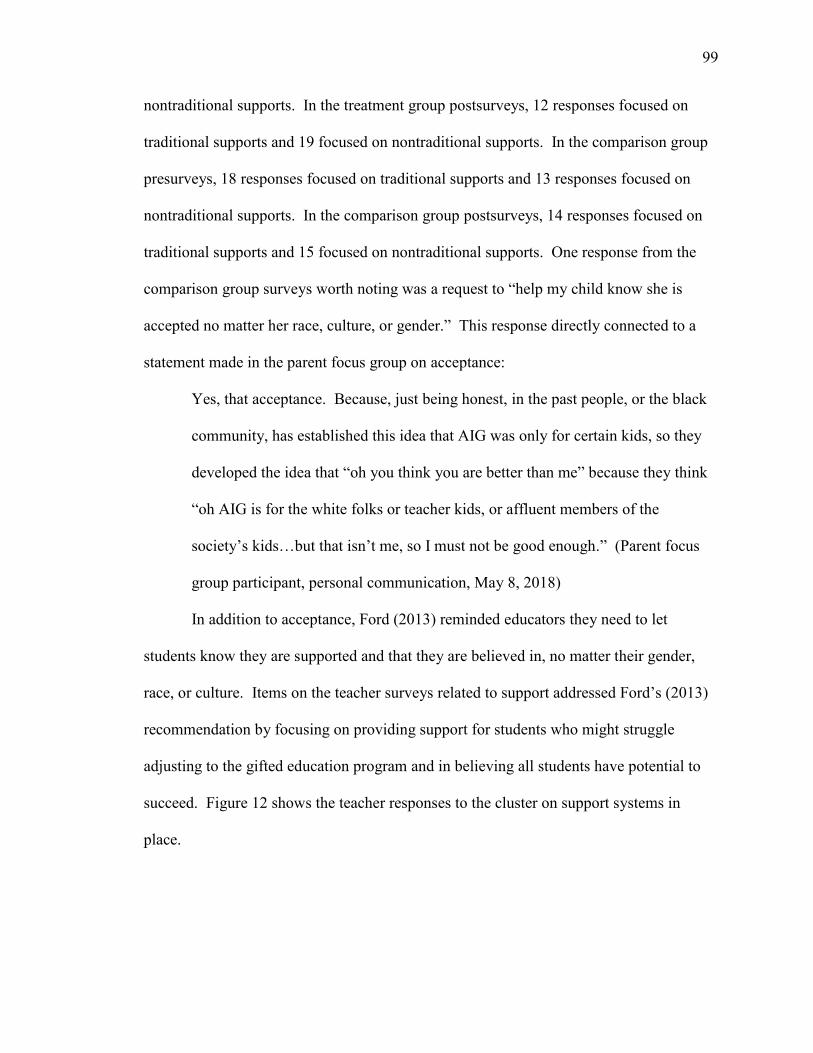
99
nontraditional supports. In the treatment group postsurveys, 12 responses focused on
traditional supports and 19 focused on nontraditional supports. In the comparison group
presurveys, 18 responses focused on traditional supports and 13 responses focused on
nontraditional supports. In the comparison group postsurveys, 14 responses focused on
traditional supports and 15 focused on nontraditional supports. One response from the
comparison group surveys worth noting was a request to “help my child know she is
accepted no matter her race, culture, or gender.” This response directly connected to a
statement made in the parent focus group on acceptance:
Yes, that acceptance. Because, just being honest, in the past people, or the black
community, has established this idea that AIG was only for certain kids, so they
developed the idea that “oh you think you are better than me” because they think
“oh AIG is for the white folks or teacher kids, or affluent members of the
society’s kids…but that isn’t me, so I must not be good enough.” (Parent focus
group participant, personal communication, May 8, 2018)
In addition to acceptance, Ford (2013) reminded educators they need to let
students know they are supported and that they are believed in, no matter their gender,
race, or culture. Items on the teacher surveys related to support addressed Ford’s (2013)
recommendation by focusing on providing support for students who might struggle
adjusting to the gifted education program and in believing all students have potential to
succeed. Figure 12 shows the teacher responses to the cluster on support systems in
place.
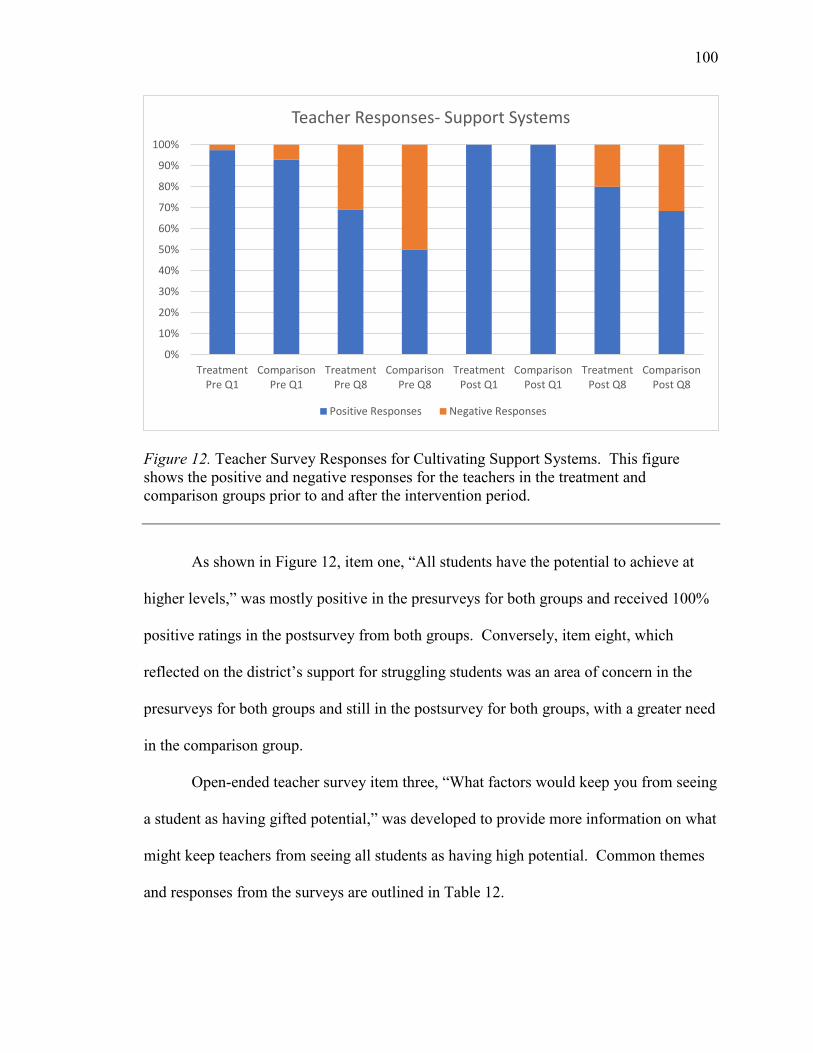
100
Figure 12. Teacher Survey Responses for Cultivating Support Systems. This figure
shows the positive and negative responses for the teachers in the treatment and
comparison groups prior to and after the intervention period.
As shown in Figure 12, item one, “All students have the potential to achieve at
higher levels,” was mostly positive in the presurveys for both groups and received 100%
positive ratings in the postsurvey from both groups. Conversely, item eight, which
reflected on the district’s support for struggling students was an area of concern in the
presurveys for both groups and still in the postsurvey for both groups, with a greater need
in the comparison group.
Open-ended teacher survey item three, “What factors would keep you from seeing
a student as having gifted potential,” was developed to provide more information on what
might keep teachers from seeing all students as having high potential. Common themes
and responses from the surveys are outlined in Table 12.
0%
10%
20%
30%
40%
50%
60%
70%
80%
90%
100%
TreatmentPre Q1
ComparisonPre Q1
TreatmentPre Q8
ComparisonPre Q8
TreatmentPost Q1
ComparisonPost Q1
TreatmentPost Q8
ComparisonPost Q8
Teacher Responses- Support Systems
Positive Responses Negative Responses

101
Table 12
Reasons for Not Recommending Students for Gifted Programs
Common Theme Treatment
Presurvey
Comparison
Presurvey
Treatment
Postsurvey
Comparison
Postsurvey
None
4 4 4 2
Grades
3 1 1 0
Work Ethic
6 6 3 4
Behavior
6 5 5 10
Program Barriers
(i.e., space)
2 1 0 0
Other
Doesn’t fit
mold, Shy
Attendance
issues
Maturity
As shown in Table 12, grades, work ethic, and behavior were the top three
barriers teachers saw in recommending students to gifted programs. While these three
barriers received about the same amount of responses per group per survey, behavior was
an increased concern in the comparison postsurvey. Additionally, none was a lower
response in the comparison postsurvey than in the presurvey or when compared to the
treatment group.
Increasing communication between home and school. The final component of
talent development focused on in this research study was increasing communication
between home and school, a component Davis (2008) and Davis et al. (2017) noted as the
most essential component to a successful talent development program. While the survey
panel predetermined increased communication would be a heavy focus during focus
groups, the parent and teacher surveys had a few items related to the component for
comparison and support purposes. Figure 13 shows the parent responses to this cluster.

102
Figure 13. Parent Survey Responses for Increasing Communication. This figure shows
the positive and negative responses for the parents in the treatment and comparison
groups prior to and after the intervention period.
As shown in Figure 13, both items one and two, which focused on whether
parents have received adequate information about the gifted program in the district, have
some negative responses. Both groups did, however, increase in positive responses from
the presurvey to postsurvey in both questions.
In addition to the focus on information about gifted programming, Gay (2010, as
cited in Hammond, 2015) noted, “positive relationships exemplified by caring are one of
the major pillars of cultural responsiveness” (p. 72). Based on Gay’s (as cited in
Hammond) research, open-ended item one, “What does your culture value,” was added to
the communication cluster, so the researcher could better understand how to build
relationships where open communication could occur. Responses from both the
treatment and comparison group for this item were extremely similar (both in the pre and
0%
10%
20%
30%
40%
50%
60%
70%
80%
90%
100%
TreatmentPre Q1
ComparisonPre Q1
TreatmentPre Q2
ComparisonPre Q2
TreatmentPost Q1
ComparisonPost Q1
TreatmentPost Q2
ComparisonPost Q2
Parent Responses- Increasing Communication
Positive Responses Negative Responses
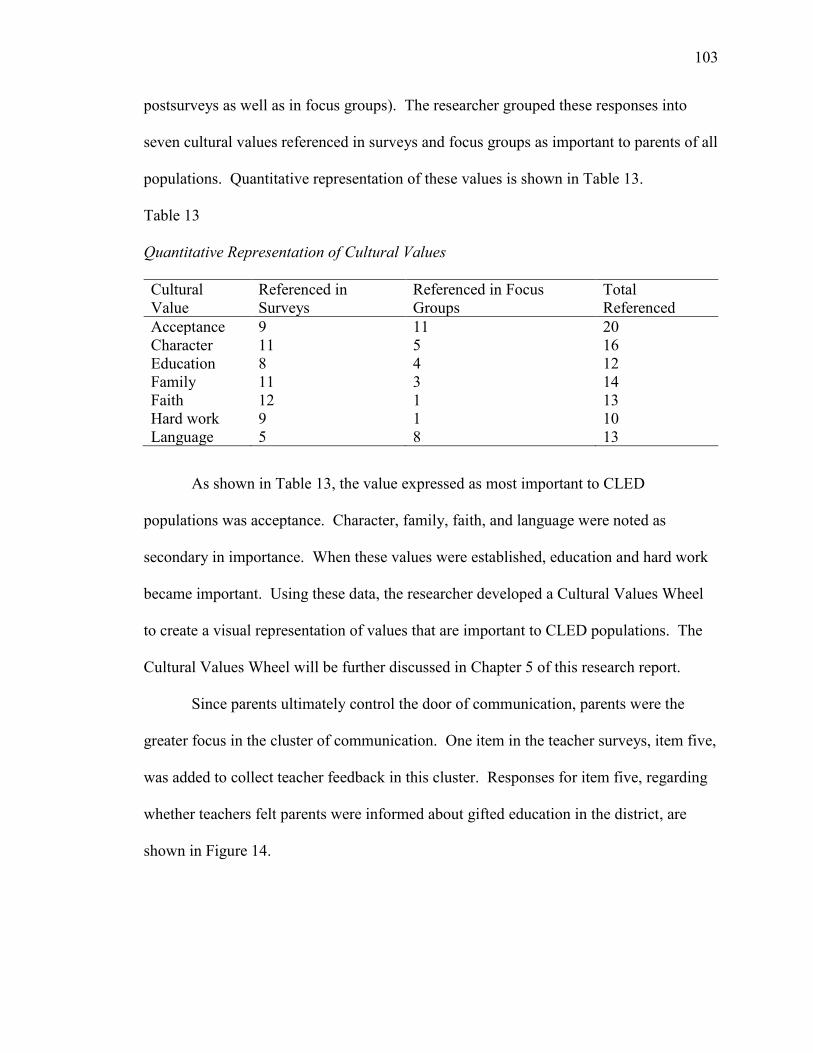
103
postsurveys as well as in focus groups). The researcher grouped these responses into
seven cultural values referenced in surveys and focus groups as important to parents of all
populations. Quantitative representation of these values is shown in Table 13.
Table 13
Quantitative Representation of Cultural Values
Cultural
Value
Referenced in
Surveys
Referenced in Focus
Groups
Total
Referenced
Acceptance 9 11 20
Character 11 5 16
Education 8 4 12
Family 11 3 14
Faith 12 1 13
Hard work 9 1 10
Language 5 8 13
As shown in Table 13, the value expressed as most important to CLED
populations was acceptance. Character, family, faith, and language were noted as
secondary in importance. When these values were established, education and hard work
became important. Using these data, the researcher developed a Cultural Values Wheel
to create a visual representation of values that are important to CLED populations. The
Cultural Values Wheel will be further discussed in Chapter 5 of this research report.
Since parents ultimately control the door of communication, parents were the
greater focus in the cluster of communication. One item in the teacher surveys, item five,
was added to collect teacher feedback in this cluster. Responses for item five, regarding
whether teachers felt parents were informed about gifted education in the district, are
shown in Figure 14.

104
Figure 14. Teacher Survey Responses for Increasing Communication Between Home and
School. This figure shows the positive and negative responses for the teachers in the
treatment and comparison groups prior to and after the intervention period.
As shown in Figure 14, teachers in both the treatment and comparison group see
room for improvement regarding communication between home and school, but both
groups also showed perception of growth in this area over the 12-week period of the
intervention.
Focus group data. In conjunction with parent and teacher surveys, the researcher
conducted one parent and one teacher focus group at the end of the 12-week program.
The focus groups were completed at the end of the intervention and after data collection,
according to the flow of an explanatory sequential mixed methods approach where
quantitative data are collected in phase one of the research, followed by qualitative data
collected in phase two of the research (Creswell, 2014, p. 224). Additionally, following
advice of Krueger and Casey (2009), parents and teachers involved in the focus groups
0%
10%
20%
30%
40%
50%
60%
70%
80%
90%
100%
Treatment Pre Q5 Comparison Pre Q5 Treatment Post Q5 Comparison Post Q5
Teacher Responses- Communication
Positive Responses Negative Responses

105
were connected to the study; teachers had students in the talent development intervention,
and parents had children in the talent development intervention. Parents in the focus
group were also part of the CLED populations being studied in the research. The focus
group questions were aligned with the survey questions and talent development
framework previously outlined to provide comparison data for the explanatory mixed
methods study. The focus group questions can be found in Appendix E.
Alignment to themes. Using the same panels of educators and CLED parents used
to align the survey with the research, the researcher and survey panel ensured the focus
group questions aligned to the surveys and research. This alignment allowed the
researcher to take answers from these focus group questions, transcribe them, and
thematically code the responses to determine which of the key elements of a talent
development program were most essential.
Table 14 quantitatively breaks down the focus group sessions as related to the
talent development components. One additional talent development component of
having high expectations was added to the list based on high numbers of parent and
teacher responses on this topic.
106
Table 14
Quantitative Breakdown of Parent and Teacher Focus Groups
Talent Development Component Referenced in
Parent Group
Referenced in
Teacher Group
Total
Locating Potential Beyond IQ Testing
12 16 28
Training Teachers in CLED
Populations
10 17 27
Increasing Collaborative Planning
Time with Teachers
0 6 6
Adjusting Curriculum to Include more
Active Learning
8 8 16
Deliberately Cultivating Support
Networks
20 7 27
Increasing Communication Between
School and Home
17 2 19
**Added based on focus group
responses: High Expectations for All
Students
3 5 8
As shown in Table 14, the top three components parents and teachers felt were
most essential to successful talent development programs included locating potential of
students beyond their IQ testing, training teachers in CLED populations, and deliberately
cultivating support networks for the students. These components were closely followed
by the concept of increasing communication between school and home and adjusting
curriculum to include more active learning. The least mentioned component of essential
talent development (even in the teacher group) was the element of increased collaborative
planning time between regular education teachers and AIG specialists. One other
concept the teachers and parents both brought up in their focus group discussions was
having high expectations for all students. While a lower number of responses fell in this

107
category, there were more responses noting the importance of high expectations than
there were for increased collaborative planning time, so the researcher included data from
the focus groups for this component of talent development. Information from the focus
groups as related to the talent development components are shared in the following
narratives.
Locating potential beyond IQ testing. Responses from the focus groups related to
locating potential beyond IQ testing revolved around the following concepts: looking at
multiple sources of data, the need to take the whole child into account, the detriment for
students who are not good test takers, and the hard line that gets drawn when one test
score is utilized to determine placement. Some specific quotes from focus groups related
to this theme are included in Table 15.

108
Table 15
Focus Group Responses–Locating Potential Beyond IQ Testing
Supporting Quote Focus
Group
“I think the biggest thing for me is to find where they are gifted. It is not
always just one area, but it is not always all areas either.
Teacher
“I think sometimes the kids [other students] are the best indicators…like
you see their eyes open as they say ‘you are really good at this subject.’”
Teacher
“Sometimes you just need to look at what the teacher says who has spent
time with them and knows what they are capable of everyday in the
classroom rather than trust a onetime test.”
Teacher
“Through this program it never became about one Naglieri score or one
EOG test, it was always about the whole student.”
Teacher
“You need to consider daily classroom observations…what if I didn’t test
well because something had gone wrong in my house, but my teacher says I
should be in the gifted classes because I am one of their best students?”
Parent
“There are always going to be kids who do not meet the criteria exactly or
specifically, but what do you do about that? If they don’t necessarily hit the
criteria head on but they are close why should we exclude them from that
opportunity?”
Parent
“I mean obviously we want to take the political part out of AIG
identification. There has to be integrity to the system and one test does not
provide integrity.”
Parent
A subtheme to the locating potential beyond IQ quotes shown in Table 15,
addressed in both the teacher and parent focus groups, was the concept of paying
attention to students who exhibit behavior problems in school. In fact, five responses
from the groups elaborated on or questioned whether students who are acting out
behaviorally might simply need to be challenged more within the classroom. One
participant specifically stated,
I almost look for giftedness through behavior problems because I discovered

109
some of the kids that get sent to the office repeatedly, when I sit down with them
with their work, you notice some incredibly special skills they have and you start
to wonder if these behaviors are why they are not being acknowledged for their
ability…are we allowing their behaviors to mask their potential? (Teacher focus
group participant, personal communication, May 4, 2018)
Other concepts that were addressed regarding looking beyond potential in learners
included the concept of developing a portfolio on students to show their learning over a
course of time and looking for students who exhibit critical thinking when solving
problems and/or who make large gains in their academics in a short period of time.
These points are discussed at greater length in the recommendations section of Chapter 5.
Training teachers in CLED populations. Another theme from the focus groups
was the importance of training teachers on students in CLED populations, such as in the
ways CLED students learn best; how they show giftedness differently; and most
importantly, how awareness of their differences is essential in seeing their potential.
Specifically, participants in both groups mentioned the need to use training to shift
teacher mindsets from the old mold of what a “typical gifted student” is to the new
understanding that there is no one-size-fits-all requirement to gifted education. One
extremely powerful quote on this shift was,
Too often we look at students and their success is judged by whether they
conform to the norms of school which are predominantly middle-class white
norms. Are you quiet? Do you sit there? Do you raise your hand? And if you
are loud and brazen and you are not comfortable sitting still then a lot of our
reaction to that is you are not bright and you are not able to handle school…and
that can actually be quite the opposite. (Teacher focus group participant, personal
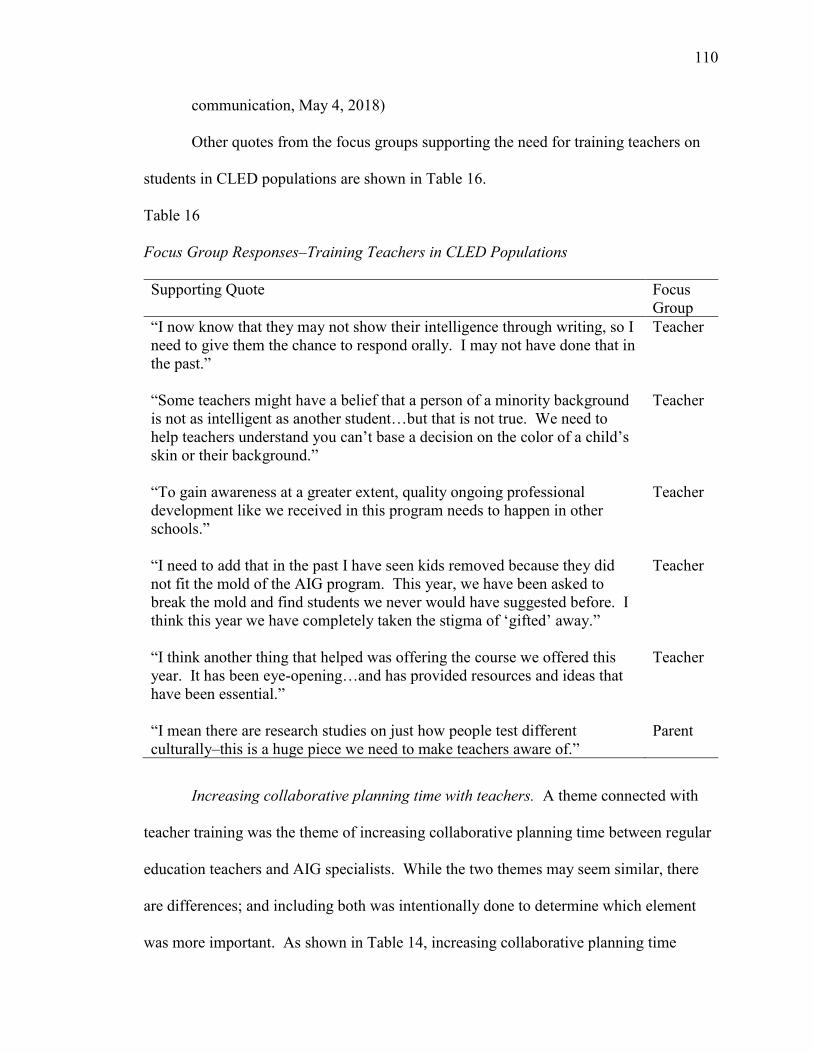
110
communication, May 4, 2018)
Other quotes from the focus groups supporting the need for training teachers on
students in CLED populations are shown in Table 16.
Table 16
Focus Group Responses–Training Teachers in CLED Populations
Supporting Quote Focus
Group
“I now know that they may not show their intelligence through writing, so I
need to give them the chance to respond orally. I may not have done that in
the past.”
Teacher
“Some teachers might have a belief that a person of a minority background
is not as intelligent as another student…but that is not true. We need to
help teachers understand you can’t base a decision on the color of a child’s
skin or their background.”
Teacher
“To gain awareness at a greater extent, quality ongoing professional
development like we received in this program needs to happen in other
schools.”
Teacher
“I need to add that in the past I have seen kids removed because they did
not fit the mold of the AIG program. This year, we have been asked to
break the mold and find students we never would have suggested before. I
think this year we have completely taken the stigma of ‘gifted’ away.”
Teacher
“I think another thing that helped was offering the course we offered this
year. It has been eye-opening…and has provided resources and ideas that
have been essential.”
Teacher
“I mean there are research studies on just how people test different
culturally–this is a huge piece we need to make teachers aware of.”
Parent
Increasing collaborative planning time with teachers. A theme connected with
teacher training was the theme of increasing collaborative planning time between regular
education teachers and AIG specialists. While the two themes may seem similar, there
are differences; and including both was intentionally done to determine which element
was more important. As shown in Table 14, increasing collaborative planning time

111
between teachers and specialists was the least important of all talent development
components. The few responses related to this theme focused on the ability for
classroom teachers to carry over talent development lessons into the regular classroom,
increase their access to instructional resources, and have a chance to discuss student data.
Some supporting quotes for collaborative planning time are shown in Table 17.
Table 17
Focus Group Responses–Increasing Collaborative Planning Time
Supporting Quote Focus
Group
“We are having them show giftedness in the classroom by trying to do
more problem-based learning things with them and using our outside
resources to support their learning.”
Teacher
“The instruction is not just something they are getting in the intervention
setting, we are both enriching and supporting each other’s classroom time.”
Teacher
“The planning meetings with you have made a difference to me. Through
them, even students who don’t see you are able to benefit from the
resources you have provided. So in class when I notice potential, I have
given them those activities.”
Teacher
Adjusting curriculum to include more active learning. The data on collaborative
planning and teacher training showed some comments alluding to adjusting curriculum to
make more active learning environments. Parents and teachers specifically connected
this theme to the idea of teacher training in that students of CLED populations learn
differently, so adjustment of curriculum would be necessary. When probed to further
elaborate on changes to the curriculum they were referencing, the common responses
circled around the concepts of activities that increased the excitement and engagement of
school, teaching of thinking skills, placing kids in a challenging environment, and
providing more choice to students. Choice, in fact, was mentioned on five separate

112
occasions during the focus group sessions. Some specific quotes to support the theme of
adjusting curriculum for CLED learners are included in Table 18.
Table 18
Focus Group Responses–Adjusting Curriculum to Include Active Learning
Supporting Quote Focus
Group
“When we started giving them choice within their product, I was like oh
they have an artistic talent, and now I am giving them a chance to show
that in product rather than give them a test.”
Teacher
“I know now I need to give them more audience time, presentation time.
As [she] mentioned, the kids can see the talents of their classmates then.”
Teacher
“We also need to fill in the gaps and level the playing field through our
curriculum. Like providing background experiences for the kids, watching
videos, going on field trips.”
Teacher
“We need to include more culturally relevant texts too so the students see
themselves in the situation. It helps them engage and learn from the text
when they can see themselves in the text.”
Teacher
“I think for us we really appreciated the problem model learning because it
has forced my child to think critically, problem-solve, and think outside the
box. He is also really excited to do the projects.”
Parent
“My daughter wants to be challenged, but she needs learning to be fun and
enjoyable, not stale and rigid. You know, so the students don’t even
realize they are learning.”
Parent
Deliberately cultivating support networks. All the above themes helped build the
foundation required to deliberately cultivate support networks for students. While
support can mean many things to different people, when the theme came up during focus
group discussions, parents and teachers focused on support networks that helped build
confidence, created access, developed positive relationships, and broke down barriers of
preconceived notions in gifted education. Specific comments supporting the need for
deliberately cultivating support networks are shown in Table 19.

113
Table 19
Focus Group Responses–Deliberately Cultivating Support Networks
Supporting Quote Focus
Group
“Students who knew they were close to being in AIG at the start of the year
and who were invited to be part of the group- it has boosted their
confidence and they are performing better in class. Confidence goes a long
way.”
Teacher
“We need to be a voice for the students you know don’t necessarily have
access to resources, providing them access to these resources, whether it is
the summer reading book or an extra field trip.”
Teacher
“Maybe we could hold a summer camp to focus on some science or math
skills… just like a football coach brings them in to prepare them physically,
schools need to bring them in to prepare them mentally.”
Parent
“And maybe a mentor, like a student already in the next grade. They could
talk to them and explain ‘I mean this is what we do, and it isn’t that bad’ so
the students have less anxiety. It would also give them somebody to
connect with too.”
Parent
Focus group participants also noted the importance of supporting students through
transition periods in their life and understanding how these transitions were more difficult
for high-ability CLED students. For example, parent participants called attention to the
concept of high-ability CLED students being seen by their peers as “acting White”
because they used more advanced vocabulary or feeling pressure from their peers who
were not in the gifted education classroom, even to the extent that one parent shared their
child was told, “they must be big time now.” Teacher participants also noted seeing
CLED students struggle with accepting their entrance into the gifted classroom. On the
positive side of cultivating support networks, one teacher shared a unique situation where
students in her room who were in the treatment group cultivated support between each
other. Here is the experience she shared:

114
I have a unique situation. I have someone who was regularly identified as AIG
and it became very uncool to be AIG so he became really lax in the classroom.
But through your program, a couple of their good friends started to go too, and I
noticed a change in class. All of a sudden it wasn’t this little isolated world…it
was no longer uncool to be smart. For others too, they are saying “I want to go
too, what do I have to do to get there next year?” (Teacher focus group
participant, personal communication, May 4, 2018)
Increasing communication between school and home. The final research
component of the talent development intervention was a focus on increasing
communication between school and home. In the teacher focus group, this theme was
barely touched upon; but in the parent group, it was a concern from all the participants.
Specific touch points brought up by parents regarding communication between school
and home were providing resources to parents, educating parents on gifted policies, and
helping parents see open dialogue and feedback were welcomed. Some specific quotes to
support the need for communication are shown in Table 20.

115
Table 20
Focus Group Responses–Increasing Communication Between School and Home
Supporting Quote Focus
Group
“I think a lot of times we just need to put more information out
there…maybe on the community channel or through ConnectEd messages.”
Teacher
“A big part of the educational piece might be in helping parents understand
what the criteria for the gifted program actually looks like.”
Teacher
“I think it would be very valuable in helping maintain my child’s success to
have things sent home over the summer or throughout the school year…like
giving me some tips on things he needs to work on so he doesn’t regress.”
Parent
“I think the ongoing communication- making sure that the communication
lines continue to be open.”
Parent
“You just have to be able to give parents the opportunity to provide tutoring
or hands-on sessions before you decide to deny services to a child.”
Parent
“We need parent meetings–not just flyers, but real meetings. Like what we
are doing here. We need to continue these to show you do want feedback
from the parents and you want to maintain open dialogue…that you will
allow people to voice their concerns.”
Parent
“We need to continue to remember to provide information in the languages
of our students. Seeing your language at least means you are accepted.”
Parent
Resoundingly, the message from the parents was that they cared about their
child’s education and wanted to be involved; but often, they were unaware of what they
needed to be doing to help, and this lack of information closed a door on their active
participation.
High expectations for all students. As noted in Table 14, one component of a
talent development program the researcher did not originally include as a focus but was
brought up eight times in the parent and teacher focus groups was the concept of high
expectations for all students. Parents and teachers alike wanted to see all students held to
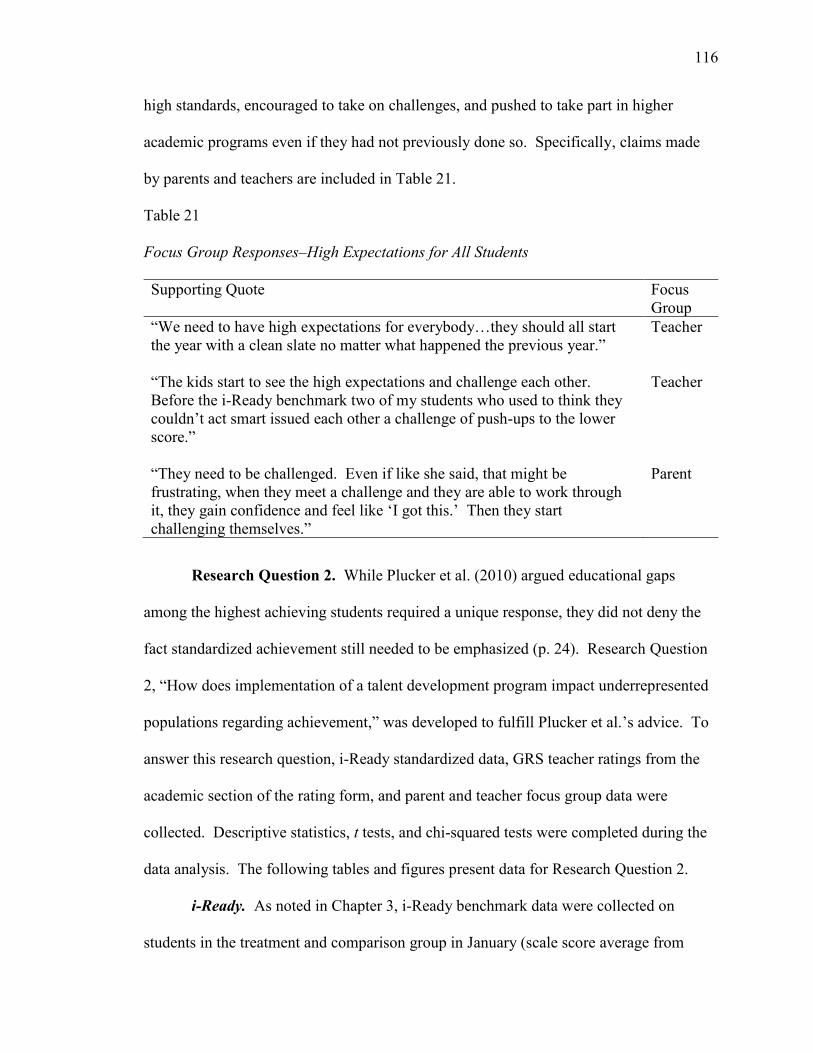
116
high standards, encouraged to take on challenges, and pushed to take part in higher
academic programs even if they had not previously done so. Specifically, claims made
by parents and teachers are included in Table 21.
Table 21
Focus Group Responses–High Expectations for All Students
Supporting Quote Focus
Group
“We need to have high expectations for everybody…they should all start
the year with a clean slate no matter what happened the previous year.”
Teacher
“The kids start to see the high expectations and challenge each other.
Before the i-Ready benchmark two of my students who used to think they
couldn’t act smart issued each other a challenge of push-ups to the lower
score.”
Teacher
“They need to be challenged. Even if like she said, that might be
frustrating, when they meet a challenge and they are able to work through
it, they gain confidence and feel like ‘I got this.’ Then they start
challenging themselves.”
Parent
Research Question 2. While Plucker et al. (2010) argued educational gaps
among the highest achieving students required a unique response, they did not deny the
fact standardized achievement still needed to be emphasized (p. 24). Research Question
2, “How does implementation of a talent development program impact underrepresented
populations regarding achievement,” was developed to fulfill Plucker et al.’s advice. To
answer this research question, i-Ready standardized data, GRS teacher ratings from the
academic section of the rating form, and parent and teacher focus group data were
collected. Descriptive statistics, t tests, and chi-squared tests were completed during the
data analysis. The following tables and figures present data for Research Question 2.
i-Ready. As noted in Chapter 3, i-Ready benchmark data were collected on
students in the treatment and comparison group in January (scale score average from
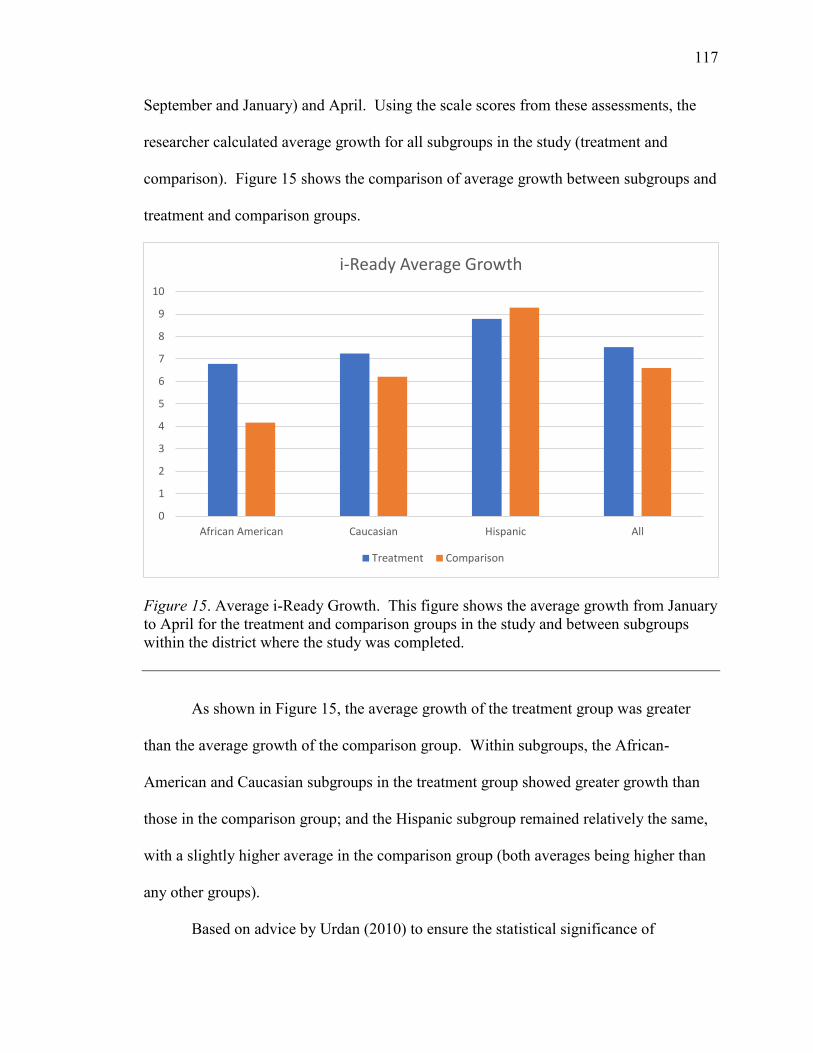
117
September and January) and April. Using the scale scores from these assessments, the
researcher calculated average growth for all subgroups in the study (treatment and
comparison). Figure 15 shows the comparison of average growth between subgroups and
treatment and comparison groups.
Figure 15. Average i-Ready Growth. This figure shows the average growth from January
to April for the treatment and comparison groups in the study and between subgroups
within the district where the study was completed.
As shown in Figure 15, the average growth of the treatment group was greater
than the average growth of the comparison group. Within subgroups, the African-
American and Caucasian subgroups in the treatment group showed greater growth than
those in the comparison group; and the Hispanic subgroup remained relatively the same,
with a slightly higher average in the comparison group (both averages being higher than
any other groups).
Based on advice by Urdan (2010) to ensure the statistical significance of
0
1
2
3
4
5
6
7
8
9
10
African American Caucasian Hispanic All
i-Ready Average Growth
Treatment Comparison
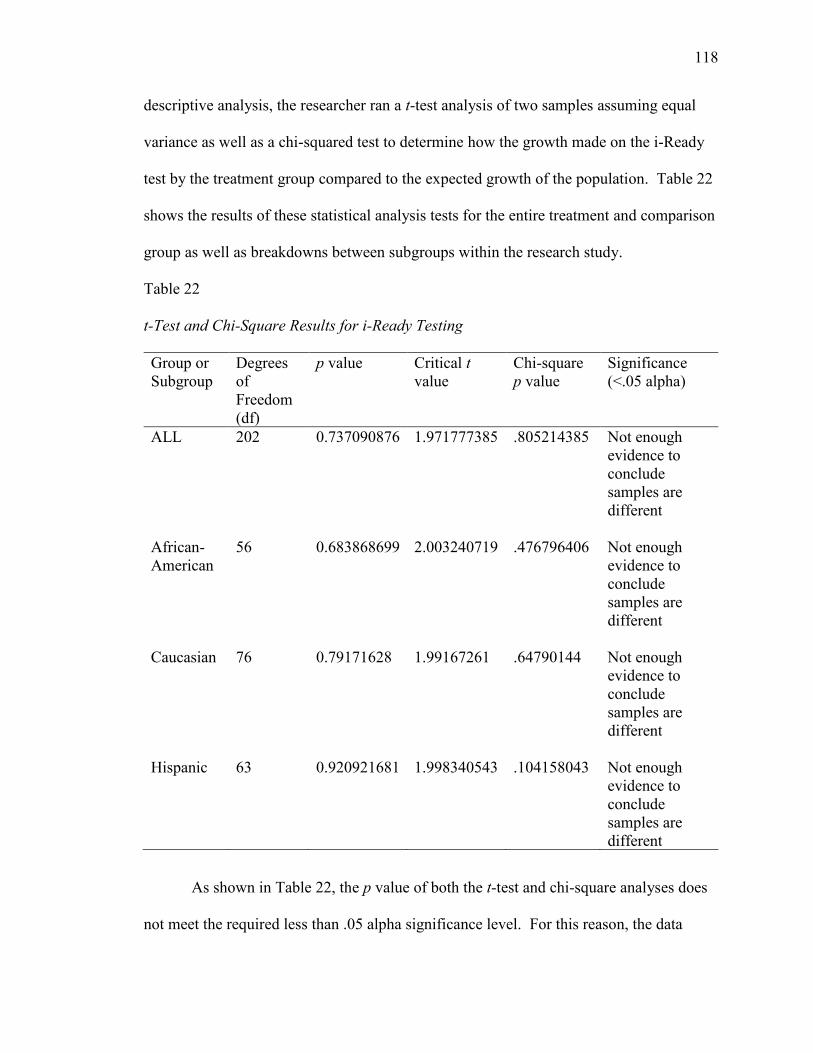
118
descriptive analysis, the researcher ran a t-test analysis of two samples assuming equal
variance as well as a chi-squared test to determine how the growth made on the i-Ready
test by the treatment group compared to the expected growth of the population. Table 22
shows the results of these statistical analysis tests for the entire treatment and comparison
group as well as breakdowns between subgroups within the research study.
Table 22
t-Test and Chi-Square Results for i-Ready Testing
Group or
Subgroup
Degrees
of
Freedom
(df)
p value Critical t
value
Chi-square
p value
Significance
(<.05 alpha)
ALL
202 0.737090876 1.971777385 .805214385 Not enough
evidence to
conclude
samples are
different
African-
American
56 0.683868699 2.003240719 .476796406 Not enough
evidence to
conclude
samples are
different
Caucasian
76 0.79171628 1.99167261 .64790144 Not enough
evidence to
conclude
samples are
different
Hispanic
63 0.920921681 1.998340543 .104158043 Not enough
evidence to
conclude
samples are
different
As shown in Table 22, the p value of both the t-test and chi-square analyses does
not meet the required less than .05 alpha significance level. For this reason, the data
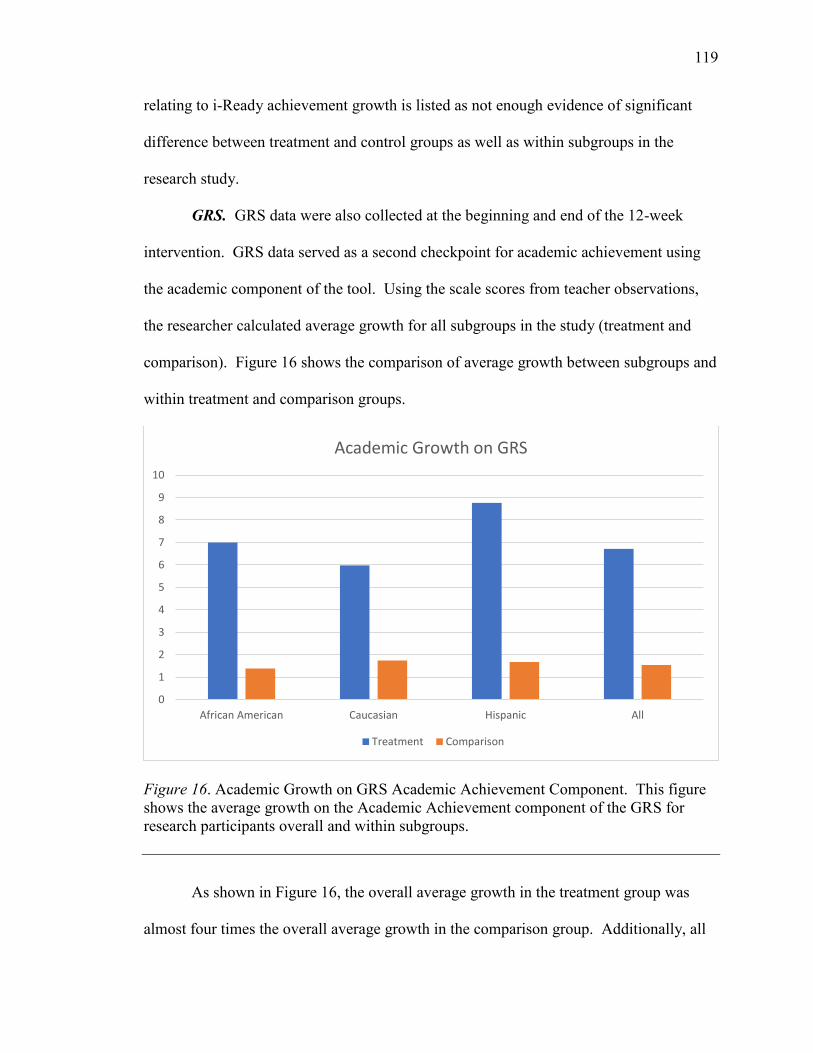
119
relating to i-Ready achievement growth is listed as not enough evidence of significant
difference between treatment and control groups as well as within subgroups in the
research study.
GRS. GRS data were also collected at the beginning and end of the 12-week
intervention. GRS data served as a second checkpoint for academic achievement using
the academic component of the tool. Using the scale scores from teacher observations,
the researcher calculated average growth for all subgroups in the study (treatment and
comparison). Figure 16 shows the comparison of average growth between subgroups and
within treatment and comparison groups.
Figure 16. Academic Growth on GRS Academic Achievement Component. This figure
shows the average growth on the Academic Achievement component of the GRS for
research participants overall and within subgroups.
As shown in Figure 16, the overall average growth in the treatment group was
almost four times the overall average growth in the comparison group. Additionally, all
0
1
2
3
4
5
6
7
8
9
10
African American Caucasian Hispanic All
Academic Growth on GRS
Treatment Comparison

120
subgroups in the treatment group showed greater growth than the subgroups of the
comparison group. Again, based on the advice of Urdan (2010), the researcher
completed a t-test analysis and chi-square analysis for the entire treatment and
comparison group as well as breakdowns between subgroups to determine the statistical
significance of these results. Table 23 shows the results of these statistical analysis tests
for the entire treatment and comparison group as well as breakdowns between subgroups
within the research study.
Table 23
t-Test and Chi-Square Results for GRS Academic Section
Group or
Subgroup
Degrees
of
Freedom
(df)
p value Critical t
value
Chi-square p
value
Significance
(<.05 alpha)
ALL
200 0.003558096 1.971896224 1.92341E-06 Enough evidence
to conclude
samples are
significantly
different
African-
American
55 0.008744868 2.004044783 .158516893 Not enough
evidence to
conclude samples
are different
Caucasian
76 0.001450611 1.99167261 .000586551 Enough evidence
to conclude
samples are
significantly
different
Hispanic
62 0.000213611 1.998971517 8.20089E-07 Enough evidence
to conclude
samples are
significantly
different
As shown in Table 23, when comparing the participants in the treatment and
control group, the overall t-test and chi-square analysis was less than the required .05

121
alpha, making the academic growth based on GRS ratings scales for the study significant
as a whole. Within the subgroups, the p values were also significant for the Caucasian
and Hispanic subgroups. The GRS academic rating scale results provided a greater than
.05 alpha for both tests in the African-American subgroup however, making the results
for that subgroup inconclusive.
Focus group responses. The last pieces of data collected for Research Question 2
were parent and teacher focus group data. While much of the focus group data were
previously explained, additional focus group data supporting academic growth of
students in the program are included here. In the parent focus group, parents referenced
increased achievement during the talent development intervention 13 times, sharing
observations of children who felt “thankful for their learning,” wanted to work on
academic work at home, and who they saw excelling in the classroom based on their new
confidence. Additionally, parents called attention to their personal interest in their child’s
achievement during their involvement in the talent development program, noting,
I don’t know if the resources are available or not, but I would be interested in
hearing about things we could do at home to ensure our child stays up to par with
their academics and can remain in the program. (Parent focus group participant,
personal communication, May 8, 2018)
As a parent, if I am informed of something my child is struggling with…I could
arrange tutoring or something. I mean really, I will eat rice with no gravy all
summer to make sure my child gets what they need academically. (Parent focus
group participant, personal communication, May 8, 2018)
Teachers also referenced increased achievement of students during the
intervention, with 19 notations of achievement increase and specific mention of increased

122
positive competition in their classrooms; the necessity to move students to higher
reading, math, or science groups due to their increased achievement during the program;
and the importance of looking at multiple avenues of achievement. Using an explanatory
mixed methods research approach allowed the researcher to use data from parent and
teacher focus groups to support the growth shown in the i-Ready and GRS quantitative
data.
Research Question 3. In addition to achievement, Renzulli (2015) noted the
importance of students being engaged in their learning. Research Question 3, “How does
implementation of a talent development program impact underrepresented populations
regarding engagement,” was developed to address this component of learning. Rezuilli
(2015) argued engagement plays an essential role in student achievement because
students who are engaged in their learning are more motivated to learn and are more
likely to attend school on a regular basis. To analyze engagement of students, the
researcher utilized Panorama Education surveys given by the district (with specific
attention to the engagement and grit section), GRS rating forms (the motivation section),
attendance reports, and parent and teacher focus group responses.
Panorama Education survey results. One data tool used to measure student
engagement was a naturally occurring data method of Panorama Education surveys given
by the district where the research study was completed. Panorama Education surveys are
given to students because “students play an essential role in informing teaching
effectiveness” (Panorama Education, 2015, p. 2). Panorama surveys have nine classroom
specific domains and 11 school specific domains for districts to utilize. For this research
study, data were collected in the engagement and grit domains based on research by
Hammond (2015) and Renzulli (2015) which showed connection between a student’s
123
mindset, their ability to persevere when challenged, and how engaged they were in their
personal success. Results from the Panorama Education surveys were collected for the
treatment and control groups in the fall (preintervention) and the spring
(postintervention). Results were analyzed by treatment and control only and not by
specific demographics, as with other data, to keep anonymity of the student responders.
General rather than specific reporting when related to student participants and their
opinions also upheld Gardner-Webb University’s policy regarding protection of children
in research studies. Full data results from the Panorama Education surveys can be found
in Appendix N (fall results) and Appendix O (spring results). The survey questions
collected by the district were in the areas of engagement, school climate, and grit. All
survey responses are provided in the appendices. Figures 17 and 18 show the survey
results in chart format for the engagement and grit categories. Figure 17 illustrates the
difference between treatment and comparison group responses for the engagement
category.

124
Figure 17. Panorama Education Survey Responses for Engagement Domain. This figure
shows the positive and negative responses of students in the treatment and comparison
group for the engagement domain of the student surveys. Data show survey results from
the fall and spring surveys.
As shown in Figure 17, all items in the engagement domain increased in the
percentage of negative responses from the presurvey to the postsurvey for both the
treatment and comparison group except for item six, “When you are not in school, how
often do you talk about ideas from class?” While responses only became slightly more
positive for this item, the trend was leaning in the positive direction. Figure 18 shows the
difference between treatment and comparison group responses for the grit category.
0%
10%
20%
30%
40%
50%
60%
70%
80%
90%
100%
Panorama Survey- Engagement Responses
Postive Response Negative Responses

125
Figure 18. Panorama Education Survey Responses for Grit Domain. This figure shows
the positive and negative responses of students in the treatment and comparison group for
the grit domain of the student surveys. Data show survey results from the fall and spring
surveys.
As shown in Figure 18, all items in the grit domain increased in the percentage of
negative responses from the presurvey to the postsurvey for both the treatment and
comparison group except for item 12, “When working on a project that matters, I can stay
focused despite distractions.” Unlike the results in the engagement domain for question
six, question 12 did not increase for both groups; instead, the treatment group showed
increased positive responses, and the comparison group showed increased negative
responses.
Last, the researcher ran chi-square analyses to determine if the difference between
treatment and comparison group responses was significant. All items were analyzed, but
for this research study, only questions one, three, six, eight, and nine [engagement
domain] and 10, 11, 12, and 13 [grit domain] were considered for research significance.
0%
10%
20%
30%
40%
50%
60%
70%
80%
90%
100%
Panorama Survey- Grit Responses
Positive Responses Negative Responses

126
Table 24 provides the questions of the survey and their respective chi-square analysis.
Table 24
Panorama Education Chi-Square Results
Question
#
Question FALL
Chi-square p
value
* must be <.05
to be
considered
significant
SPRING
Chi-square p
value
* must be <.05
to be
considered
significant
Engagement Questions [*] Grit Questions [^]
1
[*]
How excited are you about going to your classes?
.35358579 .848508296
2 How positive or negative is the energy of the school?
.229906872 .980840561
3
[*]
In your classes, how excited are you to participate?
.92760211 .978421149
4 How fair or unfair are the rules for the students at this
school?
.531115842 .00224941
5 At your school, how much does the behavior of other
students hurt or help your learning?
.081106974 .126181974
6
[*]
When you are not in school, how often do you talk about
ideas from your classes?
.435972412 .685693875
7 How often do your teachers seem excited to be teaching
your classes?
.833968801 .645934716
8
[*]
How focused are you on the activities in your classes?
.676083157 .1216659
9
[*]
How interested are you in your classes?
.767856145 .420287737
10
[^]
If you fail at an important goal, how likely are you to try
again?
.163842098 .865755735
11
[^]
If you have a problem while working towards an
important goal, how well can you keep working?
.869141143 .180470838
12
[^]
When you are working on a project that matters a lot to
you, how focused can you stay when there are lots of
distractions?
.961652692 .10971775
13
[^]
How often do you stay focused on the same goal for
more than 3 months at a time?
.583631826 .019601048
As shown in Table 24, most of the Panorama Education survey questions showed
normal distribution between the treatment and comparison group. The two items

127
showing a significant difference according to the less than .05 alpha requirement of a chi-
square analysis were item four (How fair/unfair are the rules at your school?), an item not
related to the engagement or grit domains, and item 13 (How often do you stay focused
on the same goal for more than three months at a time?), an item in the grit domain.
GRS ratings for motivation. GRS data were also collected at the beginning and
end of the 12-week intervention on student motivation. GRS data served as a second
checkpoint for student engagement using the motivation component of the tool. Using
the scale scores from teacher observations, the researcher calculated average growth for
all subgroups in the study (treatment and comparison). Figure 19 shows the comparison
of average growth between subgroups and within treatment and comparison groups.
Figure 19. Motivation Growth on GRS Motivation Component. This figure shows the
average growth on the motivation component of the GRS for research participants overall
and within subgroups.
The column chart shown in Figure 19 illustrates overall growth in motivation was
0
1
2
3
4
5
6
7
African American Caucasian Hispanic All
GRS Ratings- Motivation
Treatment Comparison

128
highest for the treatment group as well as for all subgroups within the treatment group
when compared to the comparison group. As with all other descriptive data in the
research study, the researcher also conducted t-test and chi-square analyses to determine
the significance of these averages. Table 25 shows the results of these statistical analysis
tests for the entire treatment and comparison group as well as breakdowns between
subgroups within the research study.
Table 25
t-Test and Chi-Square Results for GRS Motivation Section
Group or
Subgroup
Degrees
of
Freedom
(df)
p value Critical t
value
Chi-square
p value
Significance
(<.05 alpha)
ALL
200 4.71113E-08 1.971896224 1.79036E-
07
Enough
evidence to
conclude
samples are
significantly
different
African-
American
55 0.025082946 2.004044783 .217007754 Not enough
evidence to
conclude
samples are
different
Caucasian
76 2.5631E-06 1.99167261 .000289545 Enough
evidence to
conclude
samples are
significantly
different
Hispanic
62 0.003921419 1.998971517 .000454122 Enough
evidence to
conclude
samples are
significantly
different
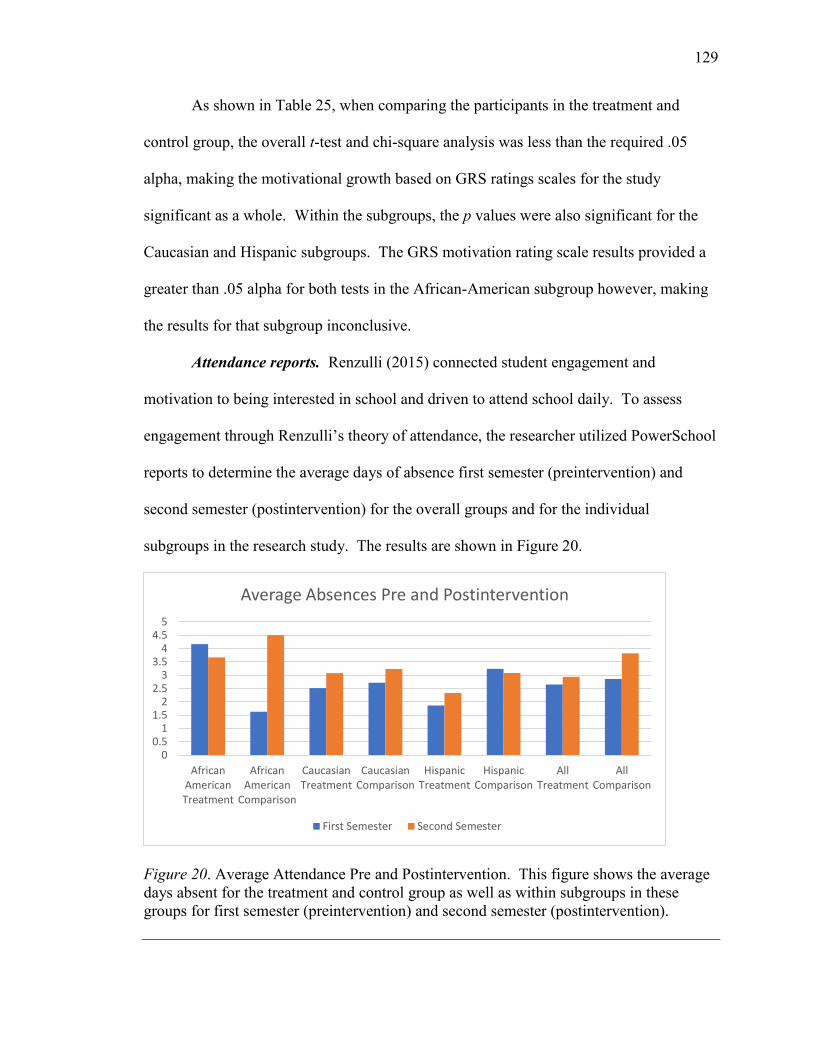
129
As shown in Table 25, when comparing the participants in the treatment and
control group, the overall t-test and chi-square analysis was less than the required .05
alpha, making the motivational growth based on GRS ratings scales for the study
significant as a whole. Within the subgroups, the p values were also significant for the
Caucasian and Hispanic subgroups. The GRS motivation rating scale results provided a
greater than .05 alpha for both tests in the African-American subgroup however, making
the results for that subgroup inconclusive.
Attendance reports. Renzulli (2015) connected student engagement and
motivation to being interested in school and driven to attend school daily. To assess
engagement through Renzulli’s theory of attendance, the researcher utilized PowerSchool
reports to determine the average days of absence first semester (preintervention) and
second semester (postintervention) for the overall groups and for the individual
subgroups in the research study. The results are shown in Figure 20.
Figure 20. Average Attendance Pre and Postintervention. This figure shows the average
days absent for the treatment and control group as well as within subgroups in these
groups for first semester (preintervention) and second semester (postintervention).
00.5
11.5
22.5
33.5
44.5
5
AfricanAmericanTreatment
AfricanAmerican
Comparison
CaucasianTreatment
CaucasianComparison
HispanicTreatment
HispanicComparison
AllTreatment
AllComparison
Average Absences Pre and Postintervention
First Semester Second Semester

130
As shown in Figure 20, most subgroups and the overall group of participants had
more days absent on average second semester than first. To help determine the
significance of these average absences between research study participants and
subgroups, the researcher calculated the grand mean for both groups. Overall, the study
participants missed 2.771 days in first semester and 3.468 days in second semester.
Comparing these grand means with the data from Figure 20 verified the researcher’s
original statement regarding normal increases in absences from first semester to second
semester. It is worth noting, however, attendance report data showed discrepancies in the
African-American subgroups, with the treatment group having fewer days on average
absent second semester (during the intervention) than would be considered normal based
on the grand mean, and the comparison group tripling their first quarter absences and
having more days absent on average second semester than would be considered normal
based on the grand mean.
Focus group responses. While focus group responses were elaborated on in the
presentation of findings for Research Question 1, teachers specifically called attention to
the engagement and increase in motivation they saw in students during the 12-week
intervention 11 times during the focus group sessions, and parents specifically called
attention to the engagement and increase in motivation they witnessed 13 times during
the focus group sessions. These responses were utilized to support Renzulli’s (2015)
research on student engagement and its impact on student achievement. One specific
response from the focus groups relating to engagement was,
Like last night after the baseball game I figured he would come home and want to
go to bed, but he was so excited about and wanted to work on his project for AIG.
This is unusual, but his enthusiasm has led him to personally take it on himself to
131
do these challenges. (Parent focus group participant, personal communication,
May 8. 2018)
Research Question 4. As with all previous research and data collection, the main
purpose of a talent development program is to increase the equity of access to gifted
education for CLED students. Research Question 4, “To what degree does a talent
development program identify potentially gifted CLED students in comparison to
standardized identification methods,” was developed to analyze the difference in students
who would identify for gifted education based on the district’s identification policy
(NNAT + End-of-Grade test percentile) and those who would identify based on the GRS
reporting measure (a score of 555 total or higher, an 85th percentile flag in the district).
Two forms of data were collected to answer Research Question 4: identification numbers
and coded themes from teacher surveys [open-ended items five and six].
Identification numbers. Table 26 shows the difference in identification between
methods and groups. Table 26 also notes the subgroups represented in the identification
changes.

132
Table 26
Difference in Identification Between Talent Development and Traditional Methods
Identification Method # Identified in Treatment
Group
# Identified in Comparison
Group
Traditional Method
(NNAT + End-of-Grade)
21/80 = 26.25% 30/132 = 22.73%
Talent Development
Method (Composite GRS
rating scale score)
Identified: 6/80 = 7.5%
32/122 = 24.24%
Difference in # Identified
(Talent Development –
Traditional)
Previously Identified: 3
New: 3
Previously Identified: 9
New: 23
Subgroup Breakdown of
Identification Difference
Previously Identified:
2 Caucasian, 1 Hispanic
Newly Identified: 2
African-American, 1
Hispanic
Previously Identified: 1
African-American, 7
Caucasian, 1 Hispanic
New: 5 African-American,
7 Caucasian, 11 Hispanic
As shown in Table 26, there are many discrepancies in the data between the
treatment and comparison group. When the original groups were compiled, 26.25%
(treatment) and 22.73% (comparison) of the students were identified through the district’s
identification requirements, making the groups comparable for the research study
(Creswell, 2014). At the close of the study, when teachers were asked to complete the
GRS rating scales on their students, a lower percentage (7.5%) was identified by the
treatment group, and a similar percentage (24.24%) to preintervention was identified by
the comparison group. When looking in depth at these identifications, however, there
was a greater percentage of newly identified students in the comparison group (71.8% of
the identified students were new) when compared to the treatment group (50% of the
identified students were new). Of the students who would have identified using the GRS,

133
27% were African-American, 27% were Caucasian, and 46% were Hispanic.
Teacher survey results. Continuing to uphold Creswell’s (2014) definition of an
explanatory mixed methods study, the researcher utilized data from teacher surveys to
further explain the results shared in Table 26. Open-ended item five, “What benefits do
you see in using teacher referrals to help identify students,” and item six, “What
disadvantages do you see in using teacher referrals to help identify gifted students,” from
the teacher surveys were used for this analysis. Quantitative coding results on benefits of
using a teacher referral process like the GRS are listed in Table 27.
Table 27
Teacher Surveys Responses to Explain Identification Numbers–Positive
Benefits Treatment
Presurvey
Treatment
Postsurvey
Comparison
Presurvey
Comparison
Postsurvey
Teachers know the
whole student
13 7 12 8
Test scores are not
always accurate
7 3 7 6
Referrals allow
multiple
perspectives
3 3 2 1
Referrals address
nonacademic
behaviors
3 0 0 1
As shown in Table 27, using teacher referrals such as the GRS is seen as
beneficial because teachers know the whole child and they provide a perspective of the
students beyond one NNAT or standardized test score. Quantitative coding results on
disadvantages of using a teacher referral process like the GRS are listed in Table 28.

134
Table 28
Teacher Surveys Responses to Explain Identification Numbers–Negative
Disadvantages Treatment
Presurvey
Treatment
Postsurvey
Comparison
Presurvey
Comparison
Postsurvey
Teachers may only
recommend students who
“fit the mold”
5 2 6 3
Teachers may have bias
towards or against
students
4 3 6 7
Teachers are not trained
in the referrals or rigor
necessary for scoring
authentically
3 3 4 3
Teacher referrals are
subjective
6 2 1 2
As shown in Table 28, using teacher referrals such as the GRS also has its
disadvantages. Some specific disadvantages teachers pointed out included teachers who
only recommend students who fit the typical gifted child “good kid” mold, teachers who
have bias towards or against other students, teachers who are not trained in gifted
education, and the subjective nature of teacher referrals. Teacher focus group
participants discussed the subjective nature of teacher referrals as well, noting sometimes
teachers have a cohort of students lower than normal, and the one student who is on par
with grade level standards appears gifted even though they are not. Focus group
participants felt these misconceptions occurred less when teachers were trained in gifted
education, further supporting the teacher survey results where lack of training was noted
as a disadvantage.

135
Summary of Results
Research Question 1. Research Question 1, “What elements of a talent
development program have the greatest impact on developing potential in underserved
populations,” addressed the absence of a universal talent development framework and
looked specifically at the components of locating potential beyond IQ testing, training
teachers in CLED populations, increasing collaborative planning time with teachers,
adjusting curriculum to include more active learning through problem-based activities,
and creating support networks through increasing communication between school and
home to determine which components were most essential to a successful talent
development program. Data collected for Research Question 1 were qualitative and
involved parent and teacher surveys (prior to and after treatment implementation) and
parent and teacher focus groups (after the treatment was implemented). These data were
analyzed through thematic coding, graphing of positive and negative responses, and
descriptive analysis of results. Each talent development component was independently
analyzed, and this analysis was used to determine overall importance of the components.
In the element of locating potential beyond IQ, data showed greater positive
responses from the treatment groups over the control groups, with treatment groups
calling attention to adequate location of gifted students using multiple pathways,
considering the whole child, and breaking the mold of having to meet the testing hard line
to receive services. Parent and teacher responses validated multiple pathways, defining
giftedness through both traditional and nontraditional traits.
When looking at training of teachers who work with CLED populations, data
showed greater positive responses from the treatment groups over the control groups,
specifically in understanding of gifted programming for all students, believing all

136
students could succeed, and noticing students were being given the chance for an
equitable education. Additionally, parents and teachers in the treatment groups were able
to acknowledge current inequitable practices and admit that a mindset shift in gifted
education was essential before change was possible. This ability to see inequities was
shown in teacher survey responses when the treatment group had more negative
responses in their postsurveys than presurveys regarding whether they felt they looked at
all students in fair and equitable ways.
Results regarding collaborative planning between teachers and specialists
continued the trend of more positive responses from the treatment group than the
comparison group. In fact, comparison group responses remained relatively unchanged.
Conversely, treatment groups felt resources that may not have been available previously
were available to them now. Treatment groups also reiterated the need to continue
building social-emotional resources, a statement supported by their increased awareness
in other survey responses.
When asked to address if curriculum approaches were being made more active,
parents and teachers in both the treatment and control groups showed increases in
positive responses over the 12-week implementation period. Focus group participants as
well as survey respondents addressed seeing more problem-based learning, critical
thinking, and choice activities in the classrooms. The researcher also asked these groups
to address whether multi-cultural curriculum was being implemented. All groups
responded positively to this statement as well, calling attention to both curriculum and
mindset shifts as related to multi-cultural education.
One element of multi-cultural education addressed in the research was cultivation
of support networks for CLED students. Survey results showed parents in both the

137
treatment and control groups felt outside-of-school support systems were extremely
positive. In-school relationships, while still extremely positive, did show an increase in
negative responses from the comparison group in the postsurveys. Additionally, survey
and focus group responses illustrated how relationships and acceptance could support
CLED students as respondents called attention to both academic and nonacademic
supports that could help students. One other notation from teacher surveys and focus
groups worth noting is the barrier of behavior in identifying CLED students for gifted
programs. The researcher connected this data point with building relationships, because
as Hammond (2015) noted, relationships have a great impact on student behavior.
Last, Research Question 1 looked at the impact communication between home
and school had on talent development programs. In both parent and teacher surveys, the
need for increased communication was evident. While responses did increase in
positivity over the 12-week treatment period, focus groups called attention to the need for
even more communication to occur. Focus group participants further pointed out the
student’s home can control whether it opens the door to the school, so it is essential for
educators to understand the values of CLED families. These values, as identified in
surveys and focus groups, included acceptance, family, language, faith, character,
education, and hard work, with acceptance being most important.
Overall, the data collected for Research Question 1 illustrated the most essential
component of a talent development program was awareness of CLED populations, which
can be cultivated through educator training. Additionally, once educated, districts should
begin to locate students using multiple methods of identification, increasing
communication between the home and the school throughout the process to cultivate
welcoming relationships with families and students in CLED populations. Once the

138
foundation of equitable programs is established, districts can turn the focus to specific
instructional adjustments, keeping in mind that communication, support, and high
expectations must be maintained.
Research Question 2. Research Question 2, “How does implementation of a
talent development program impact underrepresented populations regarding
achievement,” addressed the standardized expectations districts and states have for
students. Data were collected for Research Question 2 in a mixed-methods format and
included i-Ready benchmark results, GRS scores for the academic achievement domain,
and parent and teacher focus group responses. Data were analyzed through descriptive
statistics as well as inferential statistics in the form of t-test and chi-square analyzes.
Focus group responses were used to confirm or refute the qualitative data collected.
Review of i-Ready benchmark assessments showed higher overall growth on
average for the treatment group over the comparison group as well as for African-
American and Caucasian subgroups in the treatment group. Students in the Hispanic
subgroup showed greater average growth in the comparison group over the treatment
group. Despite overall average growth for all populations, t-test and chi-square analyzes
did not result in p values less than .05 alpha, meaning there was not enough evidence to
conclude the growth of the treatment groups was significantly different to the growth of
the comparison groups.
Review of the GRS scores in the academic domain, however, did show some
significant difference between treatment and comparison groups. Similar to i-Ready,
descriptive statistical analysis of GRS scores in the academic domain showed greater
average growth in all groups in the treatment group over the comparison group.
Additionally, when the researcher ran t-test and chi-square analyzes on GRS data, there
139
was enough evidence to conclude there was a statistical difference between the treatment
and control groups as a whole and for the Caucasian and Hispanic populations
independently. The p value for the African-American subgroup, while showing higher
average growth in descriptive statistics, did not provide enough evidence to conclude
there was a statistically significant difference between treatment and control groups for
this demographic subgroup. When asked to elaborate on achievement of CLED
populations involved in the talent development intervention, focus group participants felt
there was a significant change in daily academic achievement, supporting what the data
said regarding i-Ready and GRS score reports.
Research Question 3. Research Question 3, “How does implementation of a
talent development program impact underrepresented populations regarding
engagement,” addressed the element of engaging CLED students in their learning. This
question also followed the mixed-methods approach, as data were collected through
Panorama Education surveys, GRS scores in the motivation domain, attendance reports,
and parent and teacher focus groups. Data were analyzed using descriptive statistics, chi-
square analysis, grand mean, and explanatory correlation.
The first data source, Panorama Education surveys, was completed by students in
the district. Students were asked to respond to items regarding engagement and grit as
they applied to the classroom environment. Results between treatment and control
groups were very similar for each of the items in both domains, with the general trend for
both groups from preintervention to postintervention being in the negative direction. The
only items not receiving a greater negative response from pre to postsurvey were “When
you are not in school, how often do you talk about ideas from class” (a positive increase
for both treatment and control groups) and “When working on a project that matters, I
140
can stay focused despite distractions” (a positive increase for the treatment group only).
When a chi-square analysis was run on the survey results, all items in the engagement
and grit domains showed no significant difference between groups expect for item 13,
“How often do you stay focused on the same goal for more than three months at a time?”
This item showed a significant difference between the two groups, with the treatment
group being significantly more positive in their responses than the comparison group.
Review of the GRS scores in the motivation domain as with results from the GRS
scores in the academic domain showed a larger average increase in treatment group
scores to comparison group scores. In fact, most averages in the treatment group were
three times greater than the comparison group. When t-test and chi-square analyses were
run on these data, there was enough evidence to conclude there was a statistical
difference between the treatment and control groups as a whole and for the Caucasian and
Hispanic populations independently. The p value for the African-American subgroup,
while showing higher average growth in descriptive statistics, did not provide enough
evidence to conclude there was a statistically significant difference between treatment
and control groups for this demographic.
One area where the African-American population did show greater positive
results than other demographics was in attendance. In general, the attendance reports
showed a trend for most participants to have an increase in absences from first quarter to
second quarter; however, the African-American population in the treatment group had
fewer absences second quarter, and the African-American population in the comparison
group had more absences than considered average using the grand mean second quarter.
When asked to elaborate on engagement of CLED populations involved in the
talent development intervention, focus group participants felt there was a significant

141
change in level of engagement in the CLED students in the study. Parents of African-
American students further noted students being more interested in attending school,
confirming the attendance data the researcher collected.
Research Question 4. Research Question 4, “To what degree do talent
development programs identify potentially gifted CLED students in comparison to
standardized identification methods,” addressed the different methods of identification as
related to the researcher’s literature review: traditional standardized methods and
nontraditional observational methods. Data collected for Research Question 4 included
numbers of students in the treatment and control groups who were previously identified
by the district’s traditional methods of identification as well as numbers of students who
would be identified through the GRS nontraditional method of identification. These
numbers were compared and analyzed using descriptive statistics. Teacher survey data
were also quantitatively coded to show possible advantages and disadvantages to using
teacher referrals over standardized identification measures.
Review of these data points showed similar starting percentages of students in the
top 20% of the demographic subgroups as previously identified using the district’s
traditional identification methods. At the close of the study, GRS rating scales showed a
lower percentage of students identified in the treatment group and a similar percentage to
preintervention identified in the comparison group. Additionally, there was a greater
percentage of newly identified students in the comparison group when compared to the
treatment group. In both the treatment and comparison groups, the majority of newly
identified students were from CLED populations.
Teacher survey responses correlated with these data showing teacher referrals
were beneficial to CLED populations because teachers were able to address the whole
142
child (including nonacademic behaviors and observations in all subjects) through tools
such as the GRS, rather than trusting one standardized test score which is not always
accurate. Conversely, teachers warned against over referring students through teacher
referral tools, paying attention to teacher bias (particularly towards students who fit the
“good kid” mold), lack of teacher training in gifted education, and the subjective nature
of the tools.
Further interpretation of these findings and recommendations and implications
based on these findings can be found in Chapter 5.
143
Chapter 5: Conclusions
Overview
Javius (2017) reminded educators that “educational equity is about more than
closing gaps…it is about providing children what they need to exceed performance
targets…in turn ensuring success for all” (p. 18). Javius’s message served as the
foundation and driving force of this research study and is present throughout the final
chapter of the research report which provides a summary of the research, interpretation of
the research findings, limitations of the research, and recommendations and implications
for the future. Using these findings and recommendations, the researcher developed two
visual frameworks (a Pyramid of Talent Development Components, or essential practices,
and a CLED Cultural Values Wheel) which are included in the interpretation of findings
section of this report. Additionally, the researcher focused the recommendation section
around the framework of the Educational Equity Theory, explaining why, how, and what
to do to provide access to students with academic potential in ways that could break
down the walls of inequity gifted education has spent years building up (Javius, 2017).
Summary of Research
While inequities in gifted education have been acknowledged at the district, state,
and national level, actual action has been a slow-moving process. NAGC (2015) called
educators and researchers alike into action at their Talent Development Summit in 2015
and have since been encouraging leaders to join the charge for educational equity for
CLED populations. This call to action led the researcher to identify a district where
discrepancies with gifted programming existed. According to the U.S. Department of
Civil Rights 20% Equity Allowance (Ford & King, 2014), a significant gap existed
between the demographics of the entire student population and the demographics of the

144
gifted education population in the mid-sized urban district where the study was
conducted. The district leadership team, while aware of this discrepancy, had not been
able to change the discrepancy through previous programming adjustments and was
interested in the impact a talent development intervention would have on their CLED
populations.
Considering NAGC (2015) research and district needs, the researcher developed a
12-week talent development intervention, based on the talent development frameworks of
Ford (2013), NAGC (2017), Olszewski-Kubilius and Thomson (2015), and Renzulli
(2015), in the form of problem-based learning experiences to be provided to students in
the top 20% of the district’s three most prevalent subgroups (African-American,
Hispanic, and Caucasian). Through this intervention, students in the top 20% of these
demographics at two elementary schools in the district were provided intentional
instruction by gifted specialists on a weekly basis. Four other elementary schools in the
district chose not to receive the intervention but to continue current services as dictated
by the district AIG plan. Students in the top 20% of the African-American, Caucasian,
and Hispanic subgroups at these schools served as comparison groups in the research
study.
Through an explanatory mixed methods approach, qualitative and quantitative
data in the form of standardized test results, teacher observation tools, parent and teacher
surveys, student surveys, attendance records, and parent and teacher focus groups were
collected on both the treatment and comparison groups of students to answer the
following research questions.
1. What elements of a talent development program have the greatest impact on
developing potential in underserved populations?

145
2. How does implementation of a talent development program impact
underrepresented populations regarding achievement?
3. How does implementation of a talent development program impact
underrepresented populations regarding engagement?
4. To what degree does a talent development program identify potentially gifted
CLED students in comparison to standardized identification methods?
Using multiple data points to answer these four questions was an intentional
researcher decision meant to produce findings capable of initiating change in gifted
education policy and practice and capable of transforming an inequitable education
system into one where previously marginalized populations have a voice. To ensure the
framework of the study remained focused on the research questions in a transformative
manner, the researcher built the study around the Educational Equity Theory (Center for
Public Education, 2016; Javius, 2017). Additionally, the researcher intentionally
connected quantitative data collection with qualitative focus groups to support the
explanatory mixed methods research approach (Creswell, 2014). This approach assisted
the researcher in determining whether the talent development intervention implemented
for this study positively impacted academic performance, engagement, and motivation of
students typically underrepresented in gifted programs in this district.
The multiple layers of these decisions were necessary because
underrepresentation in gifted education is a multi-faceted issue with many contributing
factors; and simply collecting quantitative data over a 3-month period would not
effectively address all elements of a successful talent development intervention, a
necessity if the researcher hoped to transform future gifted education practices and
policies and “enhance social justice and human rights” (Creswell, 2014, p. 71).

146
Interpretation of Findings
Olszewski-Kubilius and Thomson (2015) believed the call for talent development
research by NAGC (2015) and the recent holdings of talent development summits by
NACG policy groups showed the field of gifted education was finally ready to “examine
its core tenets and ask difficult questions about whether they are still valid or in need of
revision” (p. 51). The Department of Education supported this charge as well, recently
adding requirements for states to include action steps in their policy reports addressing
CLED student development (Coleman & Shah-Coltrane, 2015). Additionally,
researchers such as Ford (2010) and Siegle et al. (2016) advocated for researchers to
locate programs where CLED students were receiving equitable education so they could
be replicated everywhere. This research study met the charge of these researchers and
the needs of CLED students, and the researcher hopes the findings from the study will
serve as the sounding board for CLED populations today and in the future.
Essential elements of a talent development program. While the call to action
for increased diversity in gifted education has been issued, defining components of
successful talent development programs still seems elusive. Olszewski-Kubilius and
Thomson (2015) connected vagueness in requirements to how multilayered a talent
development program must be to meet the needs of all CLED populations. To determine
best practices in talent development, talent development frameworks established by Ford
(2013), NAGC (2017), Olszewski-Kubilius and Thomson and Renzulli (2015) were
reviewed by the researcher and utilized in setting the parameters for the talent
development intervention used in this study. The researcher chose to examine school-
based elements of teacher training, collaborative planning, curriculum redesign, and
nontraditional versus traditional identification methods of identification as well as

147
outside-of-school elements of support networks and increased home-school
communication in this study. Through quantitative and qualitative data collection, these
elements were sorted by importance to create the Pyramid of Talent Development shown
in Figure 21.
Figure 21. Pyramid of Talent Development Components. This figure illustrates the
components of talent development reviewed in this research study; listing components
found to be most important as the foundation of the pyramid and additional concepts
building in importance on each another.
As shown in Figure 21, successful talent development programs begin with
educating educators. Ford (2013) confirmed this finding, reminding everyone today’s
society is built upon deficit thinking, intentional and unintentional prejudice, White
privilege, and hidden and visible bias; and until those working with CLED populations
148
can vocalize their underlying assumptions and beliefs, no program meant to benefit
CLED populations is possible. It is additionally important to note the base of the
Pyramid of Talent Development is not just awareness but includes the creation of a
culturally responsive mindset in educators. As Hammond (2015) warned, when
educators do not welcome, understand, or believe in CLED populations, seeing gifted
potential in them and appropriately serving them are impossible. The base on the
pyramid is the most difficult step in the implementation of a talent development program.
Once the mindset shift has begun though, the other levels of the pyramid are more easily
achieved. In fact, Ford (2013) even went as far as to argue all other components of a
talent development program could be in place; but if awareness and understanding were
not intentionally established, CLED students would still miss out on opportunities due to
implicit bias, deficit thinking, and colorblind conceptions of giftedness.
Ford’s (2013) research, along with the findings in this research study, play out in
the Pyramid of Talent Development in that once educators are aware and have begun
their shift in thinking, they are then able to see students differently and locate their
potential beyond the student’s IQ. As students are seen as having potential, educators
will need to communicate with parents about this potential as well as about how the
school and home can work together to grow this potential. The findings of this research
study prove CLED parents want this communication and will move mountains (or as one
parent focus group participant noted–“eat rice with no gravy”) to help their children be
successful.
The Pyramid of Talent Development does not stop here though; because as access
is granted to students in CLED populations, communication between school and home
and development of student support systems need to continue to be cultivated. As noted

149
in Ford (2013) and Hammond (2015), many CLED students have not been given access
to higher education in the past, and they will need scaffolding and support to rise to the
level of students who have been granted access for years. Much of this support comes in
the form of relationship building and cultivation of social-emotional deficits but also
requires redesign and adjustment of instructional practices. CLED students do not learn
best in the traditional sit-and-get school setting. They need active learning with authentic
purpose. They need a chance to share their opinions and have their voice heard. They
need to know it is okay to fail and even better to try again. Teachers who provide these
arenas for CLED populations are aware of their needs, have communicated with homes,
and have welcomed diversity into their worlds. These same teachers also believe in all
students and expect the best from every child in their classroom.
When the components shown on the Pyramid of Talent Development come
together and build upon each other, the equitable education setting that is created benefits
not only CLED students, but all students. Truly, if districts want to increase diversity and
maintain diverse settings in their gifted programs, they need to build a strong Pyramid of
Talent Development in their schools. Building a strong pyramid will not happen
overnight, but staying the course and remaining focused on connecting all of the
components will increase the educational equity and ultimately positively impact the
future of our nature (Friedman & Mandelbaum, 2011).
Academic pressures diminished. It is worth noting, districts are under a lot of
pressure to produce specific, standardized results, and many times district leaders are not
willing to wait the amount of time implementation of the Pyramid of Talent Development
will take. This concern was the catalyst behind Research Question 2, which looked at the
impact of a talent development intervention on CLED students and academic

150
achievement. As noted in Chapter 4, evidence from data collected on academic
achievement was inconclusive as far as statistical significance was concerned. The
researcher pointed out the time constraint of the study as influencing these results; 3
months of academic learning is simply not enough time to prove a significant difference
in standardized measures. Nevertheless, standardized data showed academic growth in
the treatment group at the same level as students in the comparison group, showing talent
development did not harm these students. Additionally, teachers and parents observed
increased confidence, interest in academics, and desire to learn in students who received
the talent development services. Costa and Kallick (2008) called these skills the Habits
of Mind and argued students with the Habits of Mind know how to behave intelligently
and have a disposition likely to result in academic achievement. This likelihood for
achievement was illustrated in the teacher ratings on the GRS forms. In fact, when
academic achievement was scored based on daily classroom observations, a significant
statistical difference existed between the treatment and comparison groups, with greater
growth in the treatment group. These data points give hope that continued
implementation of talent development interventions can produce statistically significant
changes in standardized assessments over time as the Habits of Mind being created
through these interventions are cultivated (Costa & Kallick, 2008; Hammond, 2015).
Engaging the habits of mind. Development of Habits of Mind, Hammond
(2015) and Renzulli (2015) argued, result in more engaged, independent learners, the
focus of Research Question 3. Specifically, participants in parent and teacher focus
groups made connections between the Habits of Mind of increased persistence by
students, striving for accuracy in classroom work, increased creativity, and renewed
desire for learning and the students involved in the talent development intervention

151
(Costa & Kallick, 2008). Data findings related to Research Question 3 further supported
the research of Hammond and Renzulli (2015) and the development on the Habits of
Mind (Costa & Kallick, 2008), as data showed a statistically significant difference in
engagement and motivation of students in the talent development intervention when
compared to students not receiving the intervention. It is important here to remember the
Pyramid of Talent Development. Students who were observed as engaged in their
learning had been chosen for this opportunity based on their potential, communication
had been made with their home, and the teachers who worked with them daily had been
trained in their needs. Additionally, when the students received talent development
services, the curriculum was adjusted to be more active and problem-based and support
was provided on a weekly basis. These changes are essential for increased engagement
to occur.
Locating potential through alternate methods. Ultimately, while Jarvis (2009)
asked educators to consider revamping identification pathways from the current DIP
model to a more CLED friendly PEP model, for districts to meet the U.S. Department of
Civil Rights 20% Equity Allowance (Ford & King, 2014), CLED students need to be
officially identified for gifted services. Research Question 4 looked at data points to
determine to what degree, if any, talent development programs could officially identify
students versus traditional methods. Research collected for this purpose showed that yes,
some students identified through the top 20% talent development philosophy will identify
by adding services and using other methods of identification. Others, however, will not.
In fact, even students who did not receive the intervention were located simply by using
alternative identification methods. Furthermore, students in the comparison group were
identified in greater capacity through alternative methods than were students in the

152
treatment group, a fact while seemingly optimistic, met with warnings from teachers
(both in the treatment and control groups) regarding over referral of students simply
because they fit a mold and/or teachers who were not properly trained in evaluating gifted
potential using the observation tools.
Referring again to the Pyramid of Talent Development and the foundation of the
pyramid being teacher training, the researcher noted teachers in the comparison group did
not receive training on traits of gifted potential in CLED populations and may have over
scored students using the GRS tool. Additionally, since the students these teachers were
rating were not receiving services, teachers may have over scored intentionally or
unintentionally in hopes the students would receive services in the future. Conversely,
teachers in the treatment group had been trained in traits of gifted potential and knew
their ratings would not remove students from these services. It is as Ford (2011a, cited in
Ford, 2013) claimed, “the less we know about others, the more we make up. The more
we know about others, the less we make up” (p. 83). Alternative methods to
identification can identify CLED populations, but authentic identification only happens
when educators have been properly trained in both the alternative methods of
identification being used and the populations of students being assessed.
Keeping culture in mind. In addition to all the interpretations previously stated,
one other clear message from the research study was while CLED populations have
similarities, they also have differences. Regarding similarities, the message was clear–all
CLED populations want to be accepted. Digging deeper into the meaning of acceptance,
CLED populations want others to understand their values of family, faith, character, and
language. Only after these values have been accepted can CLED populations buy into
education and working hard in the setting provided. To help visualize the values the
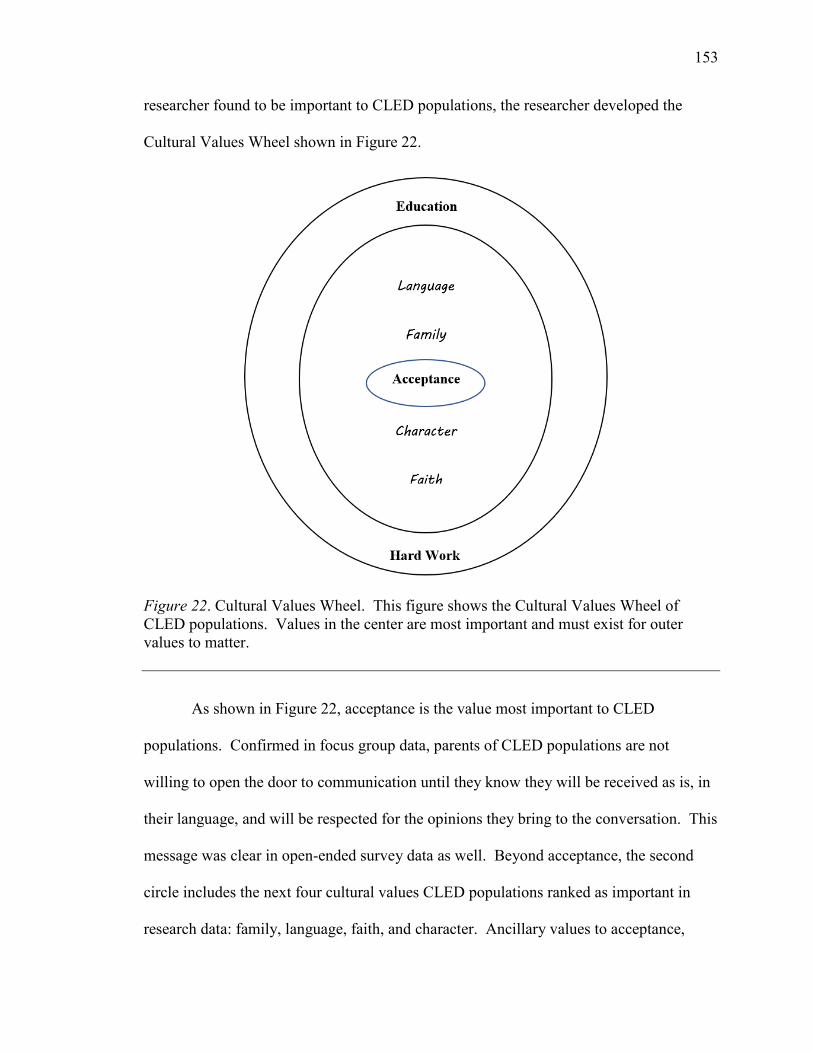
153
researcher found to be important to CLED populations, the researcher developed the
Cultural Values Wheel shown in Figure 22.
Figure 22. Cultural Values Wheel. This figure shows the Cultural Values Wheel of
CLED populations. Values in the center are most important and must exist for outer
values to matter.
As shown in Figure 22, acceptance is the value most important to CLED
populations. Confirmed in focus group data, parents of CLED populations are not
willing to open the door to communication until they know they will be received as is, in
their language, and will be respected for the opinions they bring to the conversation. This
message was clear in open-ended survey data as well. Beyond acceptance, the second
circle includes the next four cultural values CLED populations ranked as important in
research data: family, language, faith, and character. Ancillary values to acceptance,

154
these values are viewed by CLED families as necessary supports for attaining genuine
acceptance. Finally, shown in the outer circle, are values mentioned with less frequency
than the others: education and hard work, two values typically acted in domains outside
of the home. This layering of importance was supported by focus group conversations,
survey data, and research by Ford (2013) and Hammond (2015), which showed students
and parents in CLED populations value education and hard work but will be more likely
to act on these values in a positive way once they feel accepted, see the school domain as
an extension of their family domain, and understand the character of the person they are
working with is strong.
Conversely, CLED populations are different. For starters, African-American
families place high value on respect and partnerships. As dictated in the parent focus
groups, African-American families will work with schools only if they truly feel they are
valued. Brookfield (2000, as cited in Hammond, 2015) referred to relationships in
African-American subgroups as the “affective glue in teaching and learning” (p. 73).
While it can be argued relationships matter to all populations, educators must remember
that to make a difference with African-American populations, both regarding students
and parents, nothing matters more. Educators must also remember relationship building
takes time. In fact, the necessary time investment needed to build solid relationships
helps explain the inconclusive findings in the research study regarding African-American
subgroups. Three months was not enough time for these students to truly see acceptance
and build the relationships necessary for academic achievement and emotional change.
Within the Hispanic population, however, many families (at least as stated by
parents in the research focus groups) send their students to school already trusting the
schools to do what is necessary for their children. Additionally, many Hispanic families
155
are uncomfortable communicating with schools due to language barriers. As the
researcher realized when setting up focus groups, Hispanic parents were friendly on the
phone, complimentary about the program, and willing to attend the meeting; yet when the
time for the focus group came, few Hispanic parents attended. The parents who did
attend noted this absence was not due to disrespect but was out of fear of not being able
to communicate (even though a translator was present). Further conversation with
teachers showed these tendencies to also exist between teachers and Hispanic parents in
the classroom setting. Based on these findings, the researcher noted schools need to
focus their attention when working with the Hispanic population on the students in their
classroom. Not only does this strengthen relationships built with the students, it increases
the likelihood of the students relaying information about school to their parents.
Furthermore, Hispanic students in the study made the most growth, particularly in the
engagement domains, support for focusing on students in this population.
Again, what CLED populations primarily want is to be accepted. While
acceptance may be perceived differently in each population, acceptance is the key.
Keeping in mind the Cultural Values Wheel as schools build the Pyramid of Talent
Development will ensure all paths toward equitable education are taken.
Limitations
As noted in Chapter 1, all research studies have limitations. This research study
had four limitations which were discussed in Chapter 1 as well as two additional
limitations realized by the researcher during the explanatory phase of the data collection.
All the limitations are reviewed in this section.
Researcher’s role. As previously stated, there was a documented excellence gap
and an issue with underrepresentation of gifted CLED students in the district where the

156
study took place; and leaders within the district were looking for research to support a
possible solution. While this need and request provided the researcher with leadership
support, one limitation of the decision was the researcher’s role as the district’s AIG
coordinator. As the district AIG coordinator, the researcher was placed in the field of the
study on a regular basis and worked with some of the participants in both the treatment
and comparison groups. The researcher, however, was not the teacher of record for
students in either group, nor did the researcher complete the GRS on any of the students.
Additionally, the researcher was not the only AIG specialist implementing talent
development services within the district. A second AIG specialist also worked with some
of the treatment and comparison group students.
Creswell (2014) warned researchers when they were placed in the field of their
research the possibility exists for researcher bias. To account for possible bias which
could influence the study, the researcher showed both sides of the story in the research
report, spent extended time in the field of study (to increase accuracy of findings), and
used peer debriefing through data collection (Creswell, 2014) to ensure her personal bias
towards the study and/or the results did not influence the study and/or the results.
Additionally, the researcher utilized an explanatory mixed methods approach to the
research bringing others’ voices and opinions to the table. Through these steps, the
researcher worked to build trust with teachers and members of focus groups so data
collected in these settings was valid and the researcher’s role in the district did not
positively or negatively impact study results.
Administration choice. Another limitation from site choice was the control the
district gave to school leaders regarding participation in the study. Rather than require all
six elementary schools in the district to implement the talent development program,

157
administrators were given the option to implement the study or continue with the current
district gifted program. Two administrators chose to have their schools participate in the
study, while four administrators chose to continue gifted education services according to
the current district programming. Administration choice, while a limitation, allowed the
researcher to include a comparison group in the research study.
Furthermore, focusing on implementation in only two sites increased the
consistency of implementation. Specifically, the two elements of implementation
controlled by administration were teacher training and collaborative planning between
regular education teachers and the AIG coordinator. Of the two schools involved in the
study, one of the principals required all staff to receive training in gifted education
through a district level professional learning module. The principal at the other
elementary school highly encouraged their staff to receive this training but did not require
it (five of the eight teachers involved in the study participated in the training). Even
though training was not required at both sites, both administrators required their fourth-
and fifth-grade teachers to attend collaborative planning sessions with the AIG
coordinator. At these sessions, the AIG coordinator planned with the teachers but also
presented information from the teacher training sessions that related to the research study
for those participants who were not participating in the full training module.
Sampling of participants. As noted in the previous limitations, the study was
conducted in the researcher’s district. This decision created a sample of convenience.
Creswell (2014) reminded researchers that results received when using samples of
convenience cannot be generally applied to the entire population. Instead, the results can
only be suggested as applying to similar populations: in the case of this study, mid-sized,
urban school districts with similar demographics to the research site. Additionally, since
158
focus groups were utilized, the sample of convenience needed to be accounted for in
choosing focus group participants. To address this concern, the researcher formed focus
groups from a bank of interested teachers and parents, intentionally choosing participants
so a representative sample from the volunteer group was created. All these steps served
to increase the validity of the overall study despite utilizing a sample of convenience
(Creswell, 2014).
Time constraint. As Javius (2017) noted, creating educational equity is a multi-
tiered process requiring culture changes within organizations. These transformational
changes, Javius reminded educators, do not happen overnight. In fact, implementing
transformational change at an effective level can take anywhere from 3-5 years (Hall &
Hord, 2015). Therefore, the 3-month time constraint of the research study needed to be
considered as a limitation, particularly when addressing issues of change in standardized
achievement and identification. To account for the time constraint of the research study,
the researcher utilized the explanatory mixed methods approach (Creswell, 2014) and
intentionally probed focus groups of teachers and parents for their thoughts on how the
12-week talent development program data could impact future results in achievement and
identification of CLED populations.
Additional limitations. During the explanatory mixed methods research study,
the researcher determined two other possible study limitations that had not been
considered prior to implementation of the talent development program: the district’s
nurturing policy within their gifted programming and the ability for all staff to participate
in the district gifted education professional learning module.
District nurturing policy. Discrepancies in demographic representation of the
district’s gifted population, according to the U.S. Department of Education Civil Rights

159
20% Equity Allowance (Ford & King, 2014), had been acknowledged by district
administration in the past. In fact, this research study was not the first time the district
took steps to address these inequities. Over the previous 5 years, the district adjusted cut-
scores, implemented multiple pathways for identification, and added a nurturing
component to their gifted programming to build diversity. Despite intentional efforts,
discrepancies still existed, resulting in their support for this study.
When the researcher reflected on data with focus group participants, the nurturing
component of the district’s programming was addressed. Students included in the
nurturing program, as defined in the district AIG plan, were chosen based on grades,
standardized achievement scores slightly below the cut-line, and high-level benchmark
assessment scores. These students received the same gifted services dictated in the
district AIG plan as identified students. Some of these students, 58 (this number includes
the 30 identified students) of the 132 (43.93%) were the same students located by the
researcher when identifying the top 20% of the demographic subgroups. Since the four
schools where the study was not being implemented still received gifted services
according to the district plan, nurturing students falling in the top 20% group of the study
received similar interventions to those added to the study in the schools where the 12-
week talent development program was implemented. Even though the treatment groups
were receiving intentionally adjusted curriculum and the teachers in the treatment group
were receiving specific training for addressing the needs of students in the treatment
group, the comparison group students were still being served in an intentional manner.
This similarity could limit the results of the research data. While the researcher cannot
control this limitation, it will be discussed in the recommendation section of this research
report.

160
Gifted education module. In addition to some students in the comparison group
receiving similar services as all students in the treatment group, five of the 28 teachers in
the comparison group (17.8%) participated in the district’s gifted education professional
learning module, as this module was made available at the beginning of the school year to
all district staff. While the percentage of teachers in the comparison group was smaller
than the percentage of teachers from the treatment group (13 of 16, or 81.25%) who
participated in the module, involvement in the module by teachers in the comparison
group could have increased knowledge and understanding of gifted education in CLED
populations for teachers in the comparison group. If this growth in knowledge occurred,
data collected from teachers in the comparison could be limited as a comparison. This
increase in knowledge (just like the lack of knowledge mentioned in the Interpretation of
Findings) could have impacted the teacher ratings and/or created advocacy in these
teachers for underrepresented populations. Again, while the researcher cannot control
this limitation, it will be discussed in the recommendation section of this research report.
Recommendations and Implications for the Future
“Culturally different students are here to stay…the future is now, and we are in
this journey together” (Ford, 2013, p. 201). Moving forward, the research completed in
this study needs to continue. A teacher focus group participant (personal communication,
May 4, 2018), when asked what steps could be taken to increase awareness of
underrepresentation in gifted education, stated, “We do this program in other schools.
That is where it starts and the perception is changed. The changes trickle up and requires
acceptance of these kids.”
Personally, the researcher recommends two pathways for further research: (1) the
talent development intervention continues in the district where the study was conducted

161
to look at data over the course of time; and (2) the study is replicated in other districts
(with similar or different demographics) to see if results are similar. The researcher
recommends continuation of this research for complete districts to specifically account
for the limitations of time, programming similarities between treatment and comparison
groups, and the increased possibility to streamline training for teachers.
In addition to these recommendations, the researcher encourages future research
studies on talent development interventions to look more closely at students who are
reprimanded for behaviors that go against the grain of traditional schooling for hidden
giftedness and to consider researching the impact of portfolios as alternate assessments in
identification of students in CLED populations. Both these concepts were brought up in
parent and teacher focus groups, along with the specific detail that portfolios create a
picture of the whole child as well as illustrate when students make large gains in
achievement in short periods of time, a sign of giftedness in CLED populations (Coleman
et al., 2010).
No matter which path future researchers take, they cannot forget to start with the
focus on building awareness and acceptance of CLED populations. Advocates for
equitable gifted education programs need to help break the barriers years of meritocratic
education systems have built (Dai, 2015). Gifted education can no longer only be
provided to the “cognitively elite” students as a privilege for their good behavior (Dai,
2015, p. 270). Instead, advocates for equitable gifted education programs must change
the mindset of educators to a more Jeffersonian viewpoint built on the belief everyone is
equally capable; no merit-based selections are needed; and individuals should be judged
on what they can do, not who they are (Dai, 2015).
Unfortunately, until this mindset shift happens in gifted education, CLED

162
populations will not be seen for their true potential, and nothing will be accomplished. In
closing, consider the following statements from focus group participants.
It starts with access–and not just course access, access to experiences and
materials. If they [CLED populations] don’t have access to these supports, they
are denied access to the course. In the end it isn’t about their giftedness, it is all
about their inability to access what they need to be successful. (Teacher focus
group participant, personal communication, May 4, 2018)
“When we have a cut-off to opportunity, who are we really hurting in this situation…we
are hurting the child. In the end, if we hurt enough of our children- we are hurting our
community. Think about that” (Parent focus group participant, personal communication,
May 8, 2018).
Truly, these statements are what equity of access boils down to: Either we make
access equitable and everyone benefits, or we deny opportunity and our community and
eventually our nation fails. Today is the day to start becoming more aware of CLED
students among us with potential and the time when gifted educators need to take action
to ensure these CLED students receive equitable access to the same programs as their
Caucasian counterparts.

163
References
Baker, A. (2013, Jan 12). Gifted, talented, and separated: In one school, students are
divided by gifted label and race. The New York Times. Retrieved from
http://www.nytimes.com/2013/01/13/education/in-one-school-students-are-
divided-by-gifted-label-and-race.html?register=google
Baltimore County Public Schools. (2017). Develop a research proposal. Retrieved from
https://www.bcps.org/offices/lis/researchcourse/develop_writing_methodology_li
mitations.html
Brown, S. (2017). Retrieved July 21, 2017, from the GWU dissertation wiki:
https://gwudissertation.wikispaces.com/
Burney, V. H., & Beilke, J. R. (2008). The constraints of poverty on high achievement.
Journal for the Education of the Gifted, 31, 171-197.
Butin, D. W. (2010). The education dissertation. Thousand Oaks, CA: Sage
Publications.
Carman, C. A., & Taylor, D. K. (2010). Socioeconomic status effects on using the
Naglieri Nonverbal Ability Test (NNAT) to identify for gifted/talented. Gifted
Child Quarterly, 54(2), 75-84. doi:10.1177/0016986209355976
Center for Public Education. (2016). Educational equity: What does it mean? How do we
know when we reach it? [PDF document]. Retrieved from
http://www.centerforpubliceducation.org/educationalequity
Center for Talent Development. (2013). Problem-based learning 101: An interview with
Shelagh Gallagher [PDF Document]. Retrieved from
www.ctd.northwestern.edu/sites/default/files/talent-fall-2013-web.pdf
Cleveland, L. M. (2017). Examining the relationship between gifted behavior rating
scores and student academic performance (Doctoral dissertation). Retrieved from
ProQuest LLC. (10280435)
Coleman, M. R. & Shah-Coltrane, S. (2015). Children of promise: Dr. James Gallagher’s
thoughts on underrepresentation within gifted education. Journal for the
Education of Gifted, 38(1), 70-76. doi:10.1177/0162353214565556. Retrieved
from http://jeg.sagepub.com/content/38/1/70.full.pdf
Coleman, M. R., Shah-Coltrane, S., & Harrison, A. (2010). Teacher’s observation of
potential in students (TOPS): Individual student observation form. Arlington, VA:
Council for Exceptional Children. ISBN No. 0-86586-455-1.

164
Costa, A. L., & Kallick, B. (2008). Learning and leading with habits of mind: 16
essential characteristics for success. Alexandria, VA: Association for Supervision
and Curriculum Development.
Creswell, J. W. (2014). Research design: Qualitative, quantitative, and mixed methods
approaches (4th ed.). Thousand Oaks, CA: Sage Publications.
Curriculum Associates (2016). i-Ready diagnostic New York state validity study. [PDF
Document]. Retrieved from http://www.casamples.com/downloads/i-Ready-
Diagnostic-New-York-State-Validity-Study.pdf
Dai, D. Y. (2015). A Jeffersonian vision of nurturing talent and creativity: Toward a more
equitable and productive gifted education. Asia Pacific Education Review, 16(2),
269-279. doi://dx.doi.org/10.1007/s12564-015-9364-y
Davis, J. L. (2008). An exploration of the impact of family on the achievement of African-
American gifted learners originating from low-income environments (Doctoral
dissertation). Retrieved from ProQuest LLC. (UMI 3287895)
Davis, J. L., Brulles, D. M., & Kendrick-Dunn, T. B. (2017). Proceedings from the
National Gifted Convention ’17: Engaging families of students of color to
increase equity and retention in gifted and advanced learner programs. Charlotte,
NC.
Dunn, D. A. (2008) Educators’ perceptions of reasons for and strategies to correct the
underrepresentation of African Americans in gifted education programs
(Unpublished doctoral dissertation). Georgia Southern University, Statesboro,
GA. Retrieved from
http://digitalcommons.georgiasouthern.edu/cgi/viewcontent.cgi?article=1225&co
ntext=etd
Ellis, T., & Martin, R. (2017). The underrepresentation of minority students in gifted
education (Doctoral dissertation). Retrieved from ProQuest LLC. (10262700)
Eriksson, G., & Lukens, J. (2017). Proceedings from the National Gifted Convention ’17:
Shining a light on talent development for English language learners and students
impacted by poverty. Charlotte, NC.
Ford, D. Y. (2010). Underrepresentation of culturally different students in gifted
education: Reflections about current problems and recommendations for the
future. Gifted Child Today, 33(3), 31-35. Retrieved from
http://files.eric.ed.gov/fulltext/EJ893804.pdf
Ford, D. Y. (2013). Recruiting & retaining culturally different students in gifted
education. Waco, TX: Prufrock Press.

165
Ford, D. Y., & King, R. A. (2014). No Blacks allowed: Segregated gifted education in the
context of Brown v. Board of Education. The Journal of Negro Education, 83(3),
300-310. Retrieved from https://search-proquest-com.ezproxy.gardner-
webb.edu/docview/1650131314/fulltextPDF/3AE76C25E4404C20PQ/1?accounti
d=11041
Friedman, T. L., & Mandelbaum, M. (2011). That used to be us: How America fell
behind in the world it invented and how we can come back. New York, NY:
Picador/Farrar, Straus & Giroux.
Gallagher, J. J. (1974). Talent delayed-talent denied: The culturally different gifted child;
a conference report. Reston, VA: Foundation for Exceptional Children.
Gallagher, S. A., & Gallagher, J. J. (2013). Using problem-based learning to explore
unseen academic potential. Interdisciplinary Journal of Problem-Based Learning,
7(1), 111-131. Retrieved from
http://docs.lib.purdue.edu/cgi/viewcontent.cgi?article=1322&context=ijpbl
Grant, C., & Osanloo, A. (2012). Understanding, selecting, and integrating a theoretical
framework in dissertation research: Creating the blueprint for your “house.”
Administrative Issues Journal: Connecting Education, Practice, and Research,
4(2), 12-26. doi:10.5929/2014.4.2.9
Grantham, T. C., & Biddle, W. H. (2014). From bystander to upstander teacher for gifted
black students accused of being white. Gifted Child Today, 37(3), 178-187.
doi:10.1177/1076217514530117
Grissom, J. A., & Redding, C. (2016). Discretion and disproportionality: Explaining the
underrepresentation of high-achieving students of color in gifted programs. AERA
Open, 2(1), 1-25. doi:10.1177/2332858415622175. Retrieved from
http://ero.sagepub.com/content/spero/2/1/2332858415622175.full.pdf
Hall, G. E., & Hord, S. M. (2015). Implementing change: Patterns, principles, and
potholes (4th ed.). Upper Saddle River, NJ: Pearson Education Inc.
Hammond, Z. (2015). Culturally responsive teaching and the brain: Promoting authentic
engagement and rigor among culturally and linguistically diverse students.
Thousand Oaks, CA: SAGE Publications Inc.
Henfield, M. S., Woo, H., & Bang, N. M. (2017). Gifted ethnic minority students and
academic achievement: A meta-analysis. Gifted Child Quarterly, 61(1), 3-19.
Hertzog, N. B. (2017). Designing the learning context in school for talent development.
Gifted Child Quarterly, 61(3), 219-228. doi:10.1177/0016986217705712

166
Hooper, D. G. (2013). Anomaly or regularity: A phenomenological study of gifted
certified teachers' lived experiences with gifted students in an urban title I
elementary school (Doctoral dissertation). Retrieved from ProQuest LLC.
(3556825)
Horn, C. (2014). The young scholars model. In Adams, C. M., & Chandler, K. L. (Eds.),
Effective program models for gifted students from underserved populations (pp.
45-60). Waco, TX: Prufrock Press.
Jarvis, J. M. (2009). Planning to unmask potential through responsive curriculum: The
"famous five" exercise. Roeper Review, 31(4), 234-241. Retrieved from
http://search.proquest.com.ezproxy.gardner-
webb.edu/docview/206702816/fulltextPDF/7B5D5D1142FE498EPQ/1?accountid
=11041
Javius, E. L. (2017). Educational equity is about more than closing gaps. Leadership
Matters, May/June 2017, 18-21.
Krueger, R. A., & Casey, M. A. (2009). Focus groups: A practical guide for applied
research (4th ed.). Thousand Oaks, CA: SAGE Publications Inc.
Lovett, P. (2011). Solutions for Jay and other underrepresented gifted minority students.
Gifted Child Today, 34(1), 55-59.
Mertens, D. M. (2012). Transformative mixed methods: Addressing inequities. American
Behavioral Science, 56(6), 802-813. doi:10.1177/0002764211433797
Mezirow, J. (2009). An overview on transformative learning. In Illeris, K. (Ed.),
Contemporary theories of learning: Learning theorists…in their own words (pp.
90-105). New York, NY: Routledge.
Moore, J. L, Ford, D. Y, & Milner, H. R. (2005). Underachievement among gifted
students of color: Implications for educators. Theory into Practice, 44(2), 167-
177.
Naglieri, J. A., & Ford, D. Y. (2003). Addressing underrepresentation of gifted minority
children using the Naglieri Nonverbal Ability Test. Gifted Child Quarterly, 47(2),
155-160.
National Association of Gifted Children. (2015, November). Talent development task
force report to the board of directors. Retrieved from
http://www.nagc.org/sites/default/files/Governance/TalentDevelopmentTFReport
_11%2003%2015_FINAL.pdf
National Association of Gifted Children. (2017). Proceedings from the National Gifted
Convention ’17: Update on the work of the NAGC talent development task force.
Charlotte, NC.

167
Noguera, P. A. (2008). Creating schools where race does not predict achievement: The
role and significance of race in the racial achievement gap. The Journal of Negro
Education, 77(2), 90-103.
Office of Educational Research and Improvement. (1993). National excellence: A case
for developing America’s talent (ISBN-0-16-042928-5). Washington, DC: U.S.
Government Printing Office.
Olszewski-Kubilius, P., & Clarenbach, J. (2014). Closing the opportunity gap: Program
factors contributing to academic success in culturally different youth. Gifted Child
Today, 37(2), 102-110. Retrieved from
http://search.proquest.com/docview/1532147727/abstract/A189AE86A3214D71P
Q/14
Olszewski-Kubilius, P., & Steenbergen-Hu, S. (2017). Blending research-based practices
and practice embedded research: Project Excite that closes achievement and
excellence gaps for underrepresented gifted minority students. Gifted Child
Quarterly, 61(3), 202-209 doi:10.1177/0016986217701836
Olszewski-Kubilius, P., & Thomson, D. (2015). Talent development as a framework for
gifted education. Gifted Child Today, 38(1), 49-59.
doi:10.1177/1076217514556531
Onboard Informatics. (2014). City-data.com. Retrieved February 5, 2017, from
http://www.city-data.com/
Panorama Education. (2005). User guide: Panorama student survey [PDF Document].
Retrieved from http://www.panoramaed.com/resources
Peters, S. J., & Pereira, N. (2017). A replication of the internal validity structure of three
major teaching rating scales. Journal of Advanced Academics, 28(2), 101-119.
doi:10.1177/1932202X17701940
Pfeiffer, S. I., & Jarosewich, T. (2007). The gifted rating scales-school form: An analysis
of the standardization sample based on age, race, and diagnostic efficiency.
Gifted Child Quarterly, 51(1), 39-50. doi:10.1177/0016986206296658
Plucker, J. A., Burroughs, N., & Song, R. (2010). Mind the (other) gap: The growing
excellence gap in K-12 education [PDF Document]. Retrieved from
http://ceep.indiana.edu/pdf/The_Growing_Excellence_Gap_K12_Education.pdf
Plucker, J. A., & Peters, S. J. (2016). Excellence gaps in education: Expanding
opportunities for talented students. Cambridge, MA: Harvard Education Press.

168
Queen, A. E. (2006). A descriptive study of instructional and non-instructional strategies
supporting underrepresented gifted and talented elementary students in Orange
County schools. Retrieved from
http://ezproxy.gardner-
webb.edu/login?url=http://search.proquest.com/docview/304903735?accountid=1
1041
Ravitch, S. M., & Riggan, M. (2017). Reason & rigor: How conceptual frameworks
guide research (2nd ed.). Thousand Oaks, CA: Sage Publications.
Reinhard, J. J. (2016). From knowledge to practice: A gifted educator’s journey.
(Doctoral dissertation). Retrieved from ProQuest LLC. (10195017)
Renzulli, J. (2005). Applying gifted education pedagogy to total talent development for
all students. Theory into Practice, 44(2), 80-89.
Renzulli, J. S. (2015). The three E’s for successful academic achievement [PDF
Document]. Retrieved from https://gifted.uconn.edu/wp-
content/uploads/sites/961/2015/01/Three_Es.pdf
Saiying, S-H., & Olszewski-Kubilius, P. (2016). Gifted identification and the role of
gifted education: A commentary on “evaluating the gifted program of an urban
school district using a modified regression discontinuity design.” Journal of
Advanced Academics, 27(2), 99-108.
Sears, M. J. (2016). Experiences of elementary teachers using inclusion models to serve
gifted students. (Doctoral dissertation). Retrieved from ProQuest LLC.
(10165352)
Siegle, D., Gubbins, E. J., O’Rourke, P., Dulong-Langley, S., Mun, R. U., Luria,
S. R., . . . Plucker, J. A. (2016). Barriers to underserved students’ participation in
gifted programs and possible solutions. Journal for the Education of the Gifted,
39(2), 103-131. Retrieved from
http://journals.sagepub.com/doi/full/10.1177/0162353216640930
Simon, M. (2011a). Assumptions, limitations, delimitations, and scope of the study [PDF
Document]. Retrieved from http://www.dissertationrecipes.com/wp-
content/uploads/2011/04/Assumptions-Limitations-Delimitations-and-Scope-of-
the-Study.pdf
Simon, M. (2011b). The role of the researcher [PDF Document]. Retrieved from
http://dissertationrecipes.com/wp-content/uploads/2011/04/Role-of-the-
Researcher.pdf

169
Thornbury, E. I. (2010). Effects of school-wide talent development on gifted program
identification rates for traditionally underrepresented minority and low
socioeconomic elementary school students Retrieved from
http://search.proquest.com/docview/1370975248/abstract/71AACE3FD45A48D4
PQ/5
Tomlinson, C. A., Kaplan, S. N., Renzulli, J. S., Purcell, J. H., Leppien, J. H., Deborah,
B. E., … Imbeau, M. B. (2009). The parallel curriculum: A design to develop
learner potential and challenge advanced learners (2nd ed.). Thousand Oaks,
CA: SAGE Company.
Trotman-Scott, M. F., & Ford, D. Y. (2017). Multicultural differentiated instruction for
gifted students-The case of Michael. [PowerPoint slides]. Retrieved from
Proceedings from the National Gifted Convention ’17: Charlotte, NC.
Urdan, T. C. (2010). Statistics in plain English (3rd ed.). New York, NY: Taylor &
Francis Group.
Wiggins-Dockery, D. (2017). Addressing underrepresentation in gifted education: A
historical case study of policy and practice in one school district. (Doctoral
dissertation). Retrieved from ProQuest LLC. (10279749)
170
Appendix A
Teacher Survey
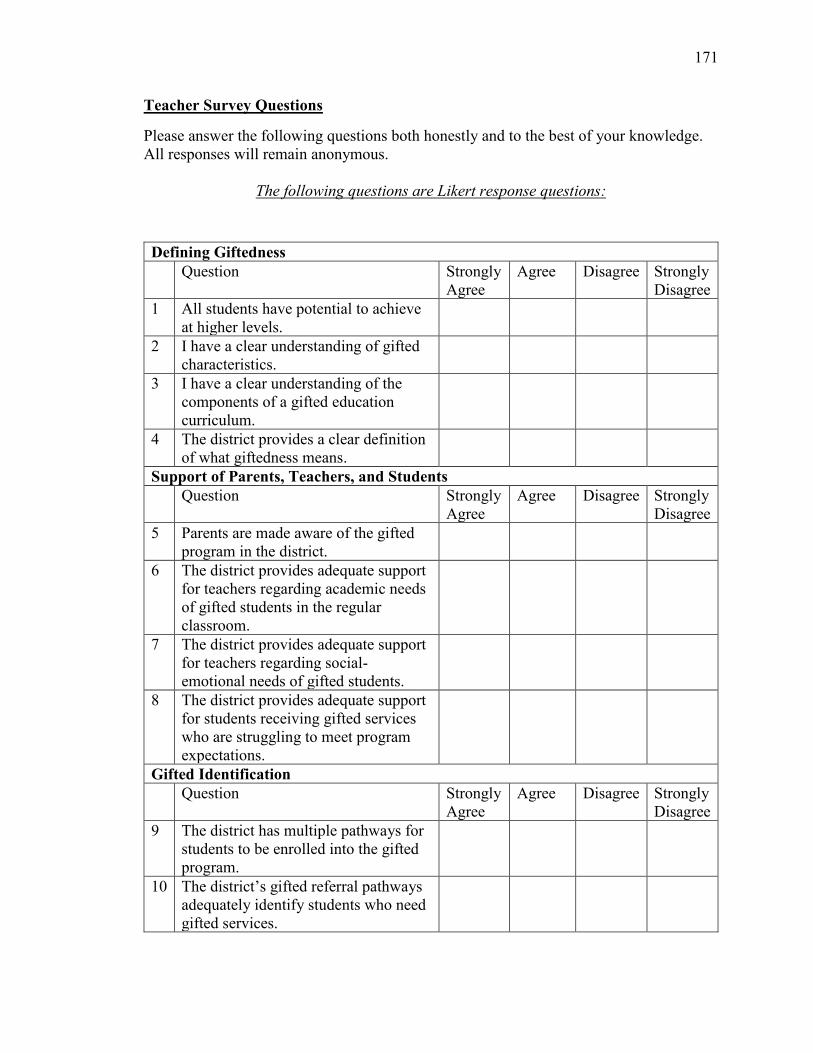
171
Teacher Survey Questions
Please answer the following questions both honestly and to the best of your knowledge.
All responses will remain anonymous.
The following questions are Likert response questions:
Defining Giftedness
Question Strongly
Agree
Agree Disagree Strongly
Disagree
1 All students have potential to achieve
at higher levels.
2 I have a clear understanding of gifted
characteristics.
3 I have a clear understanding of the
components of a gifted education
curriculum.
4 The district provides a clear definition
of what giftedness means.
Support of Parents, Teachers, and Students
Question Strongly
Agree
Agree Disagree Strongly
Disagree
5 Parents are made aware of the gifted
program in the district.
6 The district provides adequate support
for teachers regarding academic needs
of gifted students in the regular
classroom.
7 The district provides adequate support
for teachers regarding social-
emotional needs of gifted students.
8 The district provides adequate support
for students receiving gifted services
who are struggling to meet program
expectations.
Gifted Identification
Question Strongly
Agree
Agree Disagree Strongly
Disagree
9 The district has multiple pathways for
students to be enrolled into the gifted
program.
10 The district’s gifted referral pathways
adequately identify students who need
gifted services.

172
11 Gifted referral procedures fairly apply
to all students.
12 The district adequately enrolls
minority students in the gifted
program.
Multi-Cultural Understanding
Question Strongly
Agree
Agree Disagree Strongly
Disagree
13 I have a clear understanding of
multicultural education.
14 I implement multicultural education in
my classroom on a regular basis.
15 I have a clear understanding of gifted
traits in cultures different than my
own.
16 I am aware of cultural/socioeconomic
biases I have.
17 I look at all subgroups of students in a
fair and equitable way.
The following questions require a short answer:
1. How do you define the word gifted?
2. What traits do you look for when recommending students for the AIG program?
3. If a student has gifted potential, what factors might keep you from recommending him
or her for the AIG program?
4. What benefits do you see in using teacher referrals to help identify gifted students?
5. What disadvantages do you see in using teacher referrals to help identify gifted
students?
6. What does it mean to you to implement multicultural education?

173
Appendix B
Parent Survey

174
Parent Survey Questions
Please answer the following questions honestly. All responses will remain anonymous.
The following questions are Likert response questions:
Informed Programming
Question Strongly
Agree
Agree Disagree Strongly
Disagree
1 I have previously been informed about
the district’s gifted program.
2 Schools provide adequate information
about gifted education to all parents.
3 The current gifted identification
process in the district adequately
locates students who need gifted
services.
Support System
Question Strongly
Agree
Agree Disagree Strongly
Disagree
4 I am strongly involved in my child’s
education.
5 My child’s support system consists of
an extended family (church,
extracurricular groups, etc.).
6 My child’s peers support their high
academic achievement.
7 My child has adequate support outside
of school to develop their academic
potential.
8 I have a collaborative relationship
with my child’s teacher.
9 My child has adequate support at
school to develop their academic
potential.
Acknowledgment of Ability
Question Strongly
Agree
Agree Disagree Strongly
Disagree
10 My child’s academic accomplishments
are recognized by the school.
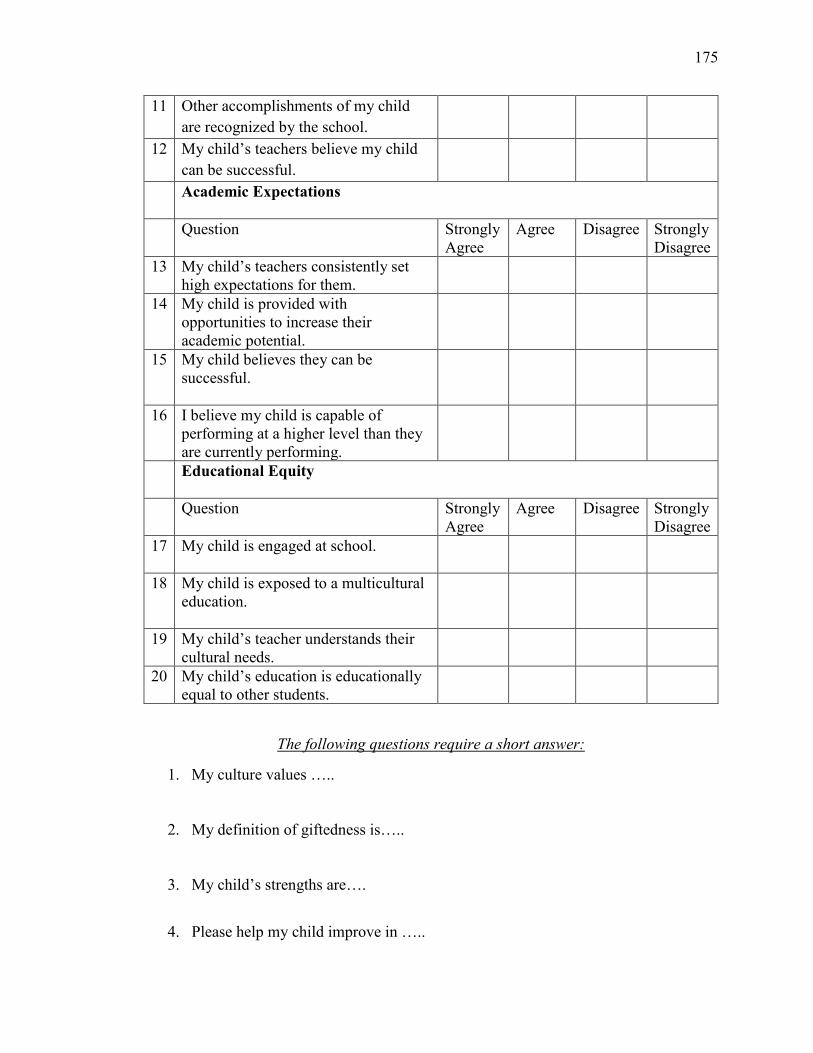
175
11 Other accomplishments of my child
are recognized by the school.
12 My child’s teachers believe my child
can be successful.
Academic Expectations
Question Strongly
Agree
Agree Disagree Strongly
Disagree
13 My child’s teachers consistently set
high expectations for them.
14 My child is provided with
opportunities to increase their
academic potential.
15 My child believes they can be
successful.
16 I believe my child is capable of
performing at a higher level than they
are currently performing.
Educational Equity
Question Strongly
Agree
Agree Disagree Strongly
Disagree
17 My child is engaged at school.
18 My child is exposed to a multicultural
education.
19 My child’s teacher understands their
cultural needs.
20 My child’s education is educationally
equal to other students.
The following questions require a short answer:
1. My culture values …..
2. My definition of giftedness is…..
3. My child’s strengths are….
4. Please help my child improve in …..

176
Appendix C
Teacher Focus Group Questions
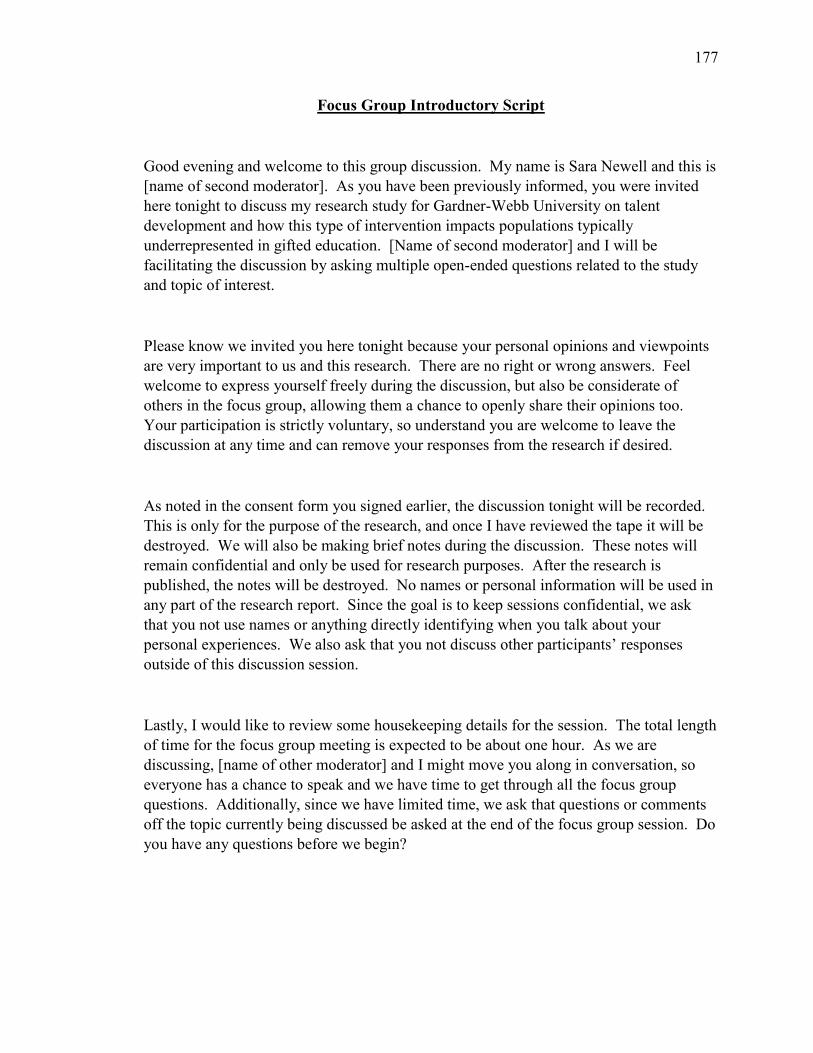
177
Focus Group Introductory Script
Good evening and welcome to this group discussion. My name is Sara Newell and this is
[name of second moderator]. As you have been previously informed, you were invited
here tonight to discuss my research study for Gardner-Webb University on talent
development and how this type of intervention impacts populations typically
underrepresented in gifted education. [Name of second moderator] and I will be
facilitating the discussion by asking multiple open-ended questions related to the study
and topic of interest.
Please know we invited you here tonight because your personal opinions and viewpoints
are very important to us and this research. There are no right or wrong answers. Feel
welcome to express yourself freely during the discussion, but also be considerate of
others in the focus group, allowing them a chance to openly share their opinions too.
Your participation is strictly voluntary, so understand you are welcome to leave the
discussion at any time and can remove your responses from the research if desired.
As noted in the consent form you signed earlier, the discussion tonight will be recorded.
This is only for the purpose of the research, and once I have reviewed the tape it will be
destroyed. We will also be making brief notes during the discussion. These notes will
remain confidential and only be used for research purposes. After the research is
published, the notes will be destroyed. No names or personal information will be used in
any part of the research report. Since the goal is to keep sessions confidential, we ask
that you not use names or anything directly identifying when you talk about your
personal experiences. We also ask that you not discuss other participants’ responses
outside of this discussion session.
Lastly, I would like to review some housekeeping details for the session. The total length
of time for the focus group meeting is expected to be about one hour. As we are
discussing, [name of other moderator] and I might move you along in conversation, so
everyone has a chance to speak and we have time to get through all the focus group
questions. Additionally, since we have limited time, we ask that questions or comments
off the topic currently being discussed be asked at the end of the focus group session. Do
you have any questions before we begin?

178
Teacher Focus Group Questions
1. How do your expectations differ for students of different backgrounds?
2. How do you allow students to show their giftedness in your classroom?
3. During problem-based learning activities what characteristics or actions did you
notice in students involved in the talent development intervention?
a. How did these observations compare with what you notice about those
same students on a regular day?
PROBING QUESTION: How did the levels of engagement differ in the talent
development students when they were completing problem-based learning
activities versus when they were working in the regular classroom?
4. Other than standardized testing, what other criteria could be included in
recommending gifted students for gifted programs?
5. How could teacher perceptions and/or knowledge impact the representation of
minority students in gifted education?
6. How could bias towards minority students impact their representation in gifted
education?
7. What steps can be taken to increase awareness towards the issue of
underrepresentation of minority students in gifted education?
8. What steps do you think schools can take to develop gifted potential in all
children?
PROBING QUESTION: How could the increase in use of a multicultural
curriculum impact observation and/or development of gifted potential in
all children?
Focus Group Closing Statement
I think we’ve come to the end of our questions. Let me be the first to say thank you for
your honest opinions – you were tremendously helpful at this important stage of the
research study. We truly appreciate your participation and the help you have provided
today. You will be given a debriefing statement with more information about the
research study and contact information, if needed in the future, as you leave. We hope
you have a wonderful evening and thank you again for your time.
179
Appendix D
Parent Focus Group Questions

180
Focus Group Introductory Script
Good evening and welcome to this group discussion. My name is Sara Newell and this is
[name of second moderator]. As you have been previously informed, you were invited
here tonight to discuss my research study for Gardner-Webb University on talent
development and how this type of intervention impacts populations typically
underrepresented in gifted education. [Name of second moderator] and I will be
facilitating the discussion by asking multiple open-ended questions related to the study
and topic of interest.
Please know we invited you here tonight because your personal opinions and viewpoints
are very important to us and this research. There are no right or wrong answers. Feel
welcome to express yourself freely during the discussion, but also be considerate of
others in the focus group, allowing them a chance to openly share their opinions too.
Your participation is strictly voluntary, so understand you are welcome to leave the
discussion at any time and can remove your responses from the research if desired.
As noted in the consent form you signed earlier, the discussion tonight will be recorded.
This is only for the purpose of the research, and once I have reviewed the tape it will be
destroyed. We will also be making brief notes during the discussion. These notes will
remain confidential and only be used for research purposes. After the research is
published, the notes will be destroyed. No names or personal information will be used in
any part of the research report. Since the goal is to keep sessions confidential, we ask
that you not use names or anything directly identifying when you talk about your
personal experiences. We also ask that you not discuss other participants’ responses
outside of this discussion session.
Lastly, I would like to review some housekeeping details for the session. The total length
of time for the focus group meeting is expected to be about one hour. As we are
discussing, [name of other moderator] and I might move you along in conversation, so
everyone has a chance to speak and we have time to get through all the focus group
questions. Additionally, since we have limited time, we ask that questions or comments
off the topic currently being discussed be asked at the end of the focus group session. Do
you have any questions before we begin?
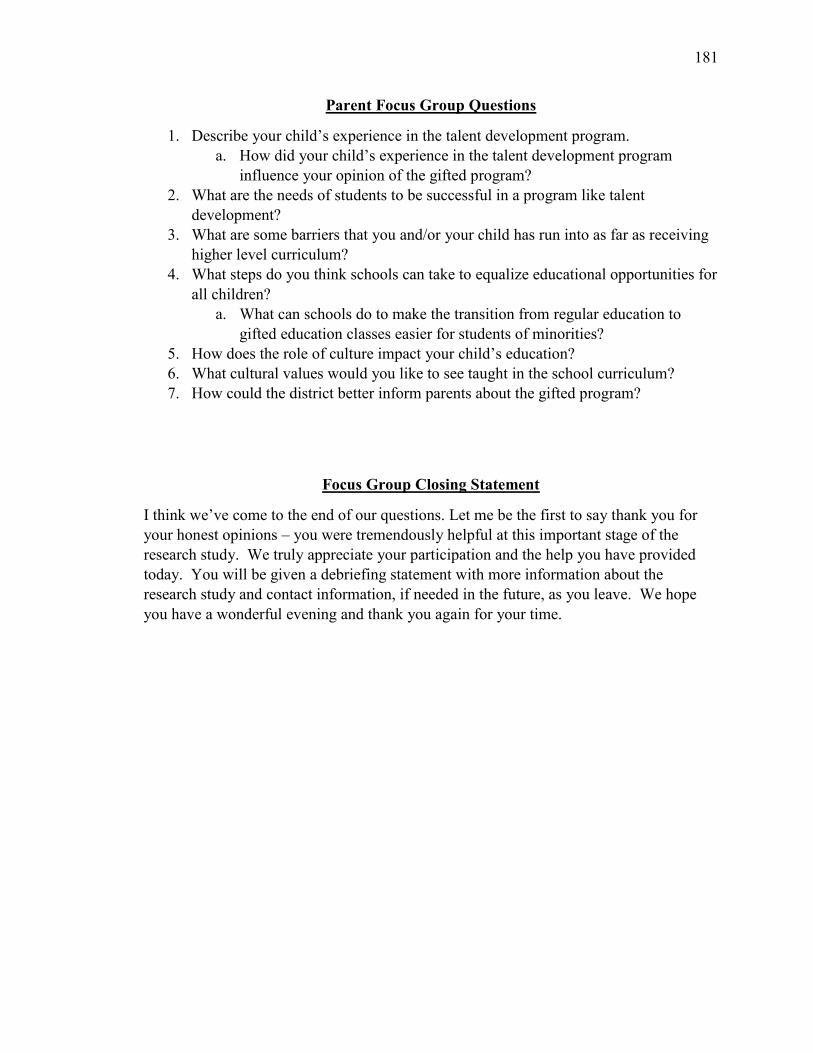
181
Parent Focus Group Questions
1. Describe your child’s experience in the talent development program.
a. How did your child’s experience in the talent development program
influence your opinion of the gifted program?
2. What are the needs of students to be successful in a program like talent
development?
3. What are some barriers that you and/or your child has run into as far as receiving
higher level curriculum?
4. What steps do you think schools can take to equalize educational opportunities for
all children?
a. What can schools do to make the transition from regular education to
gifted education classes easier for students of minorities?
5. How does the role of culture impact your child’s education?
6. What cultural values would you like to see taught in the school curriculum?
7. How could the district better inform parents about the gifted program?
Focus Group Closing Statement
I think we’ve come to the end of our questions. Let me be the first to say thank you for
your honest opinions – you were tremendously helpful at this important stage of the
research study. We truly appreciate your participation and the help you have provided
today. You will be given a debriefing statement with more information about the
research study and contact information, if needed in the future, as you leave. We hope
you have a wonderful evening and thank you again for your time.

182
Appendix E
Final Teacher Focus Group Questions

183
Focus Group Introductory Script
Good evening and welcome to this group discussion. My name is Sara Newell and this is
[name of second moderator]. As you have been previously informed, you were invited
here tonight to discuss my research study for Gardner-Webb University on talent
development and how this type of intervention impacts populations typically
underrepresented in gifted education. Doretha Grier (parent group)/Cara Wolford
(teacher group) and I will be facilitating the discussion by asking multiple open-ended
questions related to the study and topic of interest.
Please know we invited you here tonight because your personal opinions and viewpoints
are very important to us and this research. There are no right or wrong answers. Feel
welcome to express yourself freely during the discussion, but also be considerate of
others in the focus group, allowing them a chance to openly share their opinions too.
Your participation is strictly voluntary, so understand you are welcome to leave the
discussion at any time and can remove your responses from the research if desired.
As noted in the consent form you signed earlier, the discussion tonight will be recorded.
This is only for the purpose of the research, and once I have reviewed the tape it will be
destroyed. We will also be making brief notes during the discussion. These notes will
remain confidential and only be used for research purposes. After the research is
published, the notes will be destroyed. No names or personal information will be used in
any part of the research report. Since the goal is to keep sessions confidential, we ask
that you not use names or anything directly identifying when you talk about your
personal experiences. We also ask that you not discuss other participants’ responses
outside of this discussion session.
Lastly, I would like to review some housekeeping details for the session. The total length
of time for the focus group meeting is expected to be about one hour. As we are
discussing, [name of other moderator] and I might move you along in conversation, so
everyone has a chance to speak and we have time to get through all the focus group
questions. Additionally, since we have limited time, we ask that questions or comments
off the topic currently being discussed be asked at the end of the focus group session. Do
you have any questions before we begin?

184
Teacher Focus Group Questions
1. How do your expectations differ for students of different backgrounds?
2. How do you allow students to show their giftedness in your classroom?
3. During your students’ participation in the talent development intervention, what
characteristics or actions did you notice in these students in the regular
classroom?
a. How did these observations compare with what you noticed about these
same students prior to their participation in the talent development
intervention?
PROBING QUESTION: How did the levels of engagement differ in the talent
development students when they were completing problem-based learning
activities during their AIG time versus when they were working on more
academic based activities?
4. Other than standardized testing, what other criteria could be included in
recommending gifted students for gifted programs?
5. How could teacher perceptions and/or knowledge impact the representation of
minority students in gifted education?
PROBING QUESTION: How could bias towards minority students
impact their representation in gifted education?
6. What steps can be taken to increase awareness towards the issue of
underrepresentation of minority students in gifted education?
7. What steps do you think schools can take to develop gifted potential in all
children?
PROBING QUESTION: How could the increase in use of a multicultural
curriculum impact observation and/or development of gifted potential in
all children?
Parent Focus Group Questions
1. Please describe your child’s experience in the talent development program.
a. How, if at all, has your child’s engagement and attitude towards school
been impacted by their participation in the talent development program?
b. How did your child’s experience in the talent development program
influence your opinion of the gifted program?
2. What are the needs of students to be successful in a program like talent
development?
3. What are some barriers that you and/or your child has run into as far as receiving
higher level curriculum?

185
4. What steps do you think schools can take to equalize educational opportunities for
all children?
a. What can schools do to make the transition from regular education to
gifted education classes easier for students of minorities?
5. How does the role of culture impact your child’s education?
6. What cultural values would you like to see taught in the school curriculum?
7. How could the district better inform parents about the gifted program?
Focus Group Closing Statement
I think we’ve come to the end of our questions. Let me be the first to say thank you for
your honest opinions – you were tremendously helpful at this important stage of the
research study. We truly appreciate your participation and the help you have provided
today. You will be given a debriefing statement with more information about the
research study and contact information, if needed in the future, as you leave. We hope
you have a wonderful evening and thank you again for your time.

186
Appendix F
Parent Survey–Preintervention Comparison Group
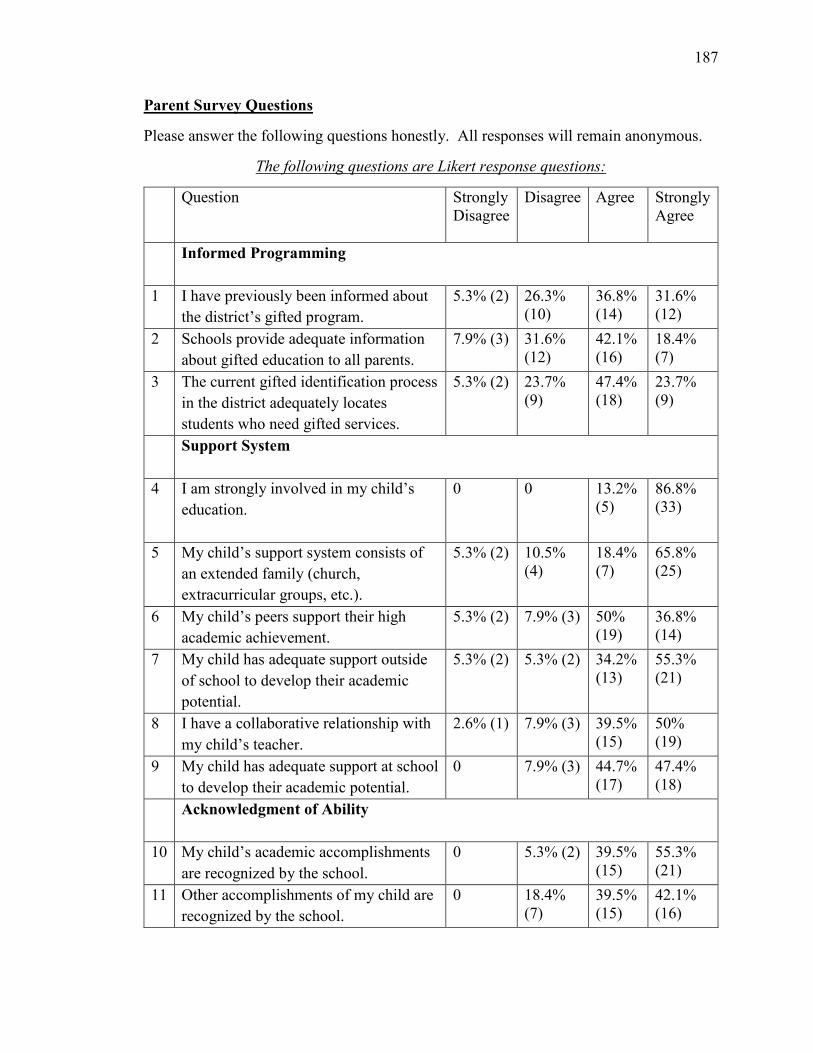
187
Parent Survey Questions
Please answer the following questions honestly. All responses will remain anonymous.
The following questions are Likert response questions:
Question Strongly
Disagree
Disagree Agree Strongly
Agree
Informed Programming
1 I have previously been informed about
the district’s gifted program.
5.3% (2) 26.3%
(10)
36.8%
(14)
31.6%
(12)
2 Schools provide adequate information
about gifted education to all parents.
7.9% (3) 31.6%
(12)
42.1%
(16)
18.4%
(7)
3 The current gifted identification process
in the district adequately locates
students who need gifted services.
5.3% (2) 23.7%
(9)
47.4%
(18)
23.7%
(9)
Support System
4 I am strongly involved in my child’s
education.
0 0 13.2%
(5)
86.8%
(33)
5 My child’s support system consists of
an extended family (church,
extracurricular groups, etc.).
5.3% (2) 10.5%
(4)
18.4%
(7)
65.8%
(25)
6 My child’s peers support their high
academic achievement.
5.3% (2) 7.9% (3) 50%
(19)
36.8%
(14)
7 My child has adequate support outside
of school to develop their academic
potential.
5.3% (2) 5.3% (2) 34.2%
(13)
55.3%
(21)
8 I have a collaborative relationship with
my child’s teacher.
2.6% (1) 7.9% (3) 39.5%
(15)
50%
(19)
9 My child has adequate support at school
to develop their academic potential.
0 7.9% (3) 44.7%
(17)
47.4%
(18)
Acknowledgment of Ability
10 My child’s academic accomplishments
are recognized by the school.
0 5.3% (2) 39.5%
(15)
55.3%
(21)
11 Other accomplishments of my child are
recognized by the school.
0 18.4%
(7)
39.5%
(15)
42.1%
(16)

188
12 My child’s teachers believe my child
can be successful.
0 0 31.6%
(12)
68.4%
(26)
Question Strongly
Disagree
Disagree Agree Strongly
Agree
Academic Expectations
13 My child’s teachers consistently set
high expectations for them.
0 15.8%
(6)
36.8%
(14)
47.4%
(18)
14 My child is provided with opportunities
to increase their academic potential.
0 18.4%
(7)
44.7%
(17)
36.8%
(14)
15 My child believes they can be
successful.
0 2.6% (1) 28.9%
(11)
68.4%
(26)
16 I believe my child is capable of
performing at a higher level than they
are currently performing.
0 10.5%
(4)
44.7%
(17)
44.7%
(17)
Educational Equity
17 My child is engaged at school.
0 10.5%
(4)
34.2%
(13)
55.3%
(21)
18 My child is exposed to a multicultural
education.
2.6% (1) 18.4%
(7)
36.8%
(14)
42.1%
(16)
19 My child’s teacher understands their
cultural needs.
0 28.9%
(11)
31.6%
(12)
39.5%
(15)
20 My child’s education is educationally
equal to other students.
0 13.2%
(5)
50%
(19)
36.8%
(14)
The following questions require a short answer:
My culture values …..
honesty
effort and honesty
are very important to my childs education and are not always a good influence (friend
wise)
Honesty, commitment, reliability
indian/american
N/A
family, god, the food are the one thing that is important in our culture. successfulness
independence
education and being the best you can be
self-help control, action/work orientation, informality
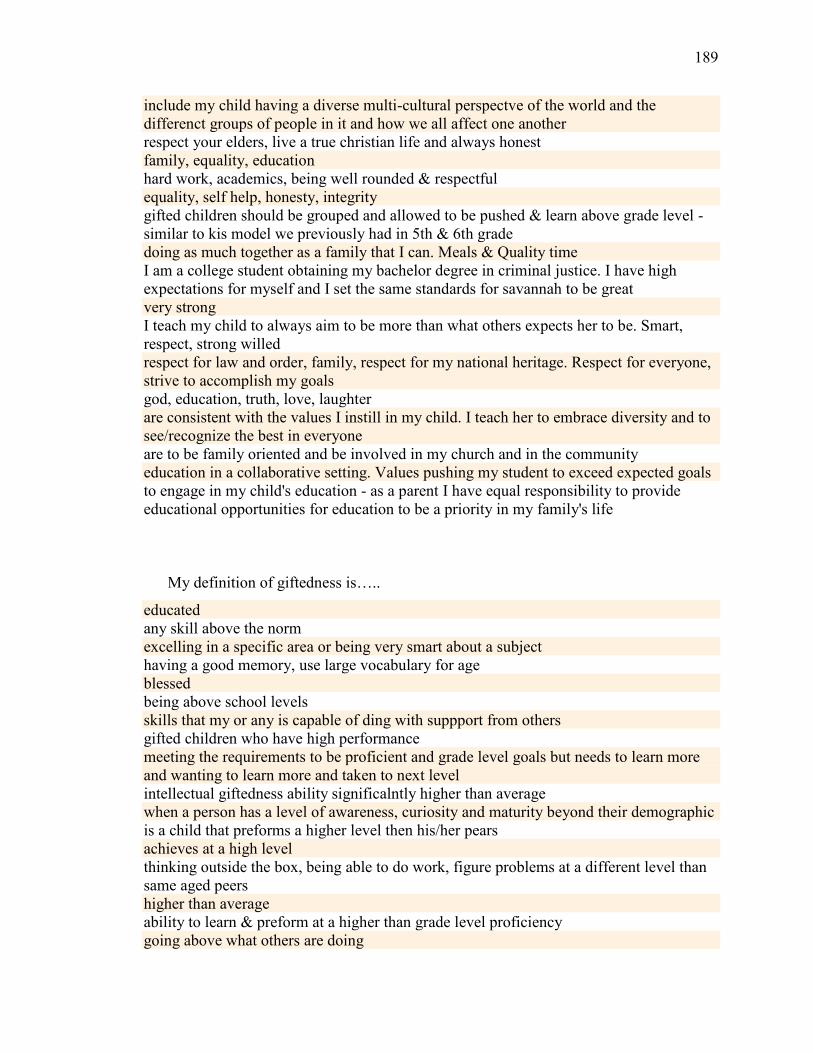
189
include my child having a diverse multi-cultural perspectve of the world and the
differenct groups of people in it and how we all affect one another
respect your elders, live a true christian life and always honest
family, equality, education
hard work, academics, being well rounded & respectful
equality, self help, honesty, integrity
gifted children should be grouped and allowed to be pushed & learn above grade level -
similar to kis model we previously had in 5th & 6th grade
doing as much together as a family that I can. Meals & Quality time
I am a college student obtaining my bachelor degree in criminal justice. I have high
expectations for myself and I set the same standards for savannah to be great
very strong
I teach my child to always aim to be more than what others expects her to be. Smart,
respect, strong willed
respect for law and order, family, respect for my national heritage. Respect for everyone,
strive to accomplish my goals
god, education, truth, love, laughter
are consistent with the values I instill in my child. I teach her to embrace diversity and to
see/recognize the best in everyone
are to be family oriented and be involved in my church and in the community
education in a collaborative setting. Values pushing my student to exceed expected goals
to engage in my child's education - as a parent I have equal responsibility to provide
educational opportunities for education to be a priority in my family's life
My definition of giftedness is…..
educated
any skill above the norm
excelling in a specific area or being very smart about a subject
having a good memory, use large vocabulary for age
blessed
being above school levels
skills that my or any is capable of ding with suppport from others
gifted children who have high performance
meeting the requirements to be proficient and grade level goals but needs to learn more
and wanting to learn more and taken to next level
intellectual giftedness ability significalntly higher than average
when a person has a level of awareness, curiosity and maturity beyond their demographic
is a child that preforms a higher level then his/her pears
achieves at a high level
thinking outside the box, being able to do work, figure problems at a different level than
same aged peers
higher than average
ability to learn & preform at a higher than grade level proficiency
going above what others are doing

190
special
A child performing above grade level
The ability to exceed standard expectations
someone very special
thinking outside of what most children her age is expected, when asked to perform a task
having something extra than the normal
higher than average, etc
a keen sense/ability to think things through with ingenuity and persistence, continuously
stimulated and eager to continuously learn & grow academically
a child that is eager to learn, that wants to learn new things, asks questions when they
don't know the answers, someone who retains gathered information, someone who thinks
mechanically and performs at a higher level than other students.
someone naturally born with a higher aptitude for something
an individual who is able to exceed expected achievement standards based on effort or
intellect
My child’s strengths are….
reading (3)
reading, math (2)
compassion for others, openess, tough spirit
she's a great reader, loves helping others, and has a great imagination
drawing, comprehension
jesus and beliving in herself
talking! Communication I would say its math as well
bravery, baseball, teamwork, math, reading
reading, science
compassion, empathy, math, reading, and offering a helping hand & kind word
His/her love of people, wants to do well in school and loves to read and write songs
math, reading informational text
numbers, problem solving, reading
family
math and his willingness to learn something new
working indepent, following rules
kindness
eager to learn, fun personality, reading, writing
she strives for greatness
art
being able to learn with no struggle
reading, following directions and disciplined
reading, communication, math when focused
Reading (oral/comprehension/vocabulary/pronunciation) Inquisitive to the extent of
getting all facts to form conclusions, has a natural desire to learn
reading, creating, directing/leading, wanting to learn, teaching, responsibility
imagination, building and creating
Advanced reading and math comprehension. The ability to quickly analyze/assess or
issue/learning standards and respond to it

191
Please help my child improve in …..
math (5)
social studies
perseverance and dealing with failure
math & science
everything he does, so he can be successfu
ELA
any subject that she is having trouble with. I would like my child to help in social sudies
and reading
grammar, spelling
gainging self confidence in math. She is very capable but doubts herself
overcoming social fears and apprehension problem-solving
math and confidence in his/her work
engagement of fiction text
continue to make him think!
science
writing gramatically correct, sentences & spelling
fractions
anything you can do to make his life better
Confident in knowing she was the correct answers often times savannah second guesses
herself instead of being confident in her answer
any area you see the need for improvement
understanding math (fractions)
focusing on one task at a time. Specific steps that she doesn't understand yet. Grammer.
Impulsivity/self control, Math (factors), word problems
handwriting public speaking (she's really anxious to learn cursive)
organization, goal setting
developing interest in areas of strength that are reliable and engaging to continue their
emotional & intellectual development. To foster independent learning & exploration
beyond the expected standards in the traditional classroom with individual curriculum
choices.
192
Appendix G
Parent Survey–Preintervention Treatment Group

193
Parent Survey Questions
Please answer the following questions honestly. All responses will remain anonymous.
The following questions are Likert response questions:
Question Strongly
Disagree
Disagree Agree Strongly
Agree
Informed Programming
1 I have previously been informed about
the district’s gifted program.
2.6% (1) 7.7% (3) 59%
(23)
30.8%
(12)
2 Schools provide adequate information
about gifted education to all parents.
2.6% (1) 17.9%
(7)
56.4%
(22)
23.1%
(9)
3 The current gifted identification process
in the district adequately locates
students who need gifted services.
0 12.8%
(5)
66.7%
(26)
20.5%
(8)
Support System
4 I am strongly involved in my child’s
education.
0 0 35.9%
(14)
64.1%
(25)
5 My child’s support system consists of
an extended family (church,
extracurricular groups, etc.).
5.1% (2) 5.1% (2) 35.9%
(14)
53.8%
(21)
6 My child’s peers support their high
academic achievement.
0 5.1% (2) 69.2%
(27)
25.6%
(10)
7 My child has adequate support outside
of school to develop their academic
potential.
0 2.6% (1) 43.6%
(17)
53.8%
(21)
8 I have a collaborative relationship with
my child’s teacher.
0 10.3%
(4)
51.3%
(20)
38.5%
(15)
9 My child has adequate support at school
to develop their academic potential.
0 0 51.3%
(20)
48.7%
(19)
Acknowledgment of Ability
10 My child’s academic accomplishments
are recognized by the school.
2.6% (1) 0 41%
(16)
56.4%
(22)
11 Other accomplishments of my child are
recognized by the school.
2.6% (1) 0 41%
(16)
56.4%
(22)

194
12 My child’s teachers believe my child
can be successful.
0 5.1% (2) 35.9%
(14)
59%
(23)
Question Strongly
Disagree
Disagree Agree Strongly
Agree
Academic Expectations
13 My child’s teachers consistently set
high expectations for them.
2.6% (1) 7.7% (3) 53.8%
(21)
35.9%
(14)
14 My child is provided with opportunities
to increase their academic potential.
0 5.1% (2) 56.4%
(22)
38.5%
(15)
15 My child believes they can be
successful.
0 7.7% (3) 30.8%
(12)
61.5%
(24)
16 I believe my child is capable of
performing at a higher level than they
are currently performing.
0 7.7% (3) 46.2%
(18)
46.2%
(18)
Educational Equity
17 My child is engaged at school.
0 10.3%
(4)
53.8%
(21)
35.9%
(14)
18 My child is exposed to a multicultural
education.
0 12.8%
(5)
61.5%
(24)
25.6%
(10)
19 My child’s teacher understands their
cultural needs.
0 15.4%
(6)
64.1%
(25)
20.5%
(8)
20 My child’s education is educationally
equal to other students.
2.6% (1) 0 71.8%
(28)
25.6%
(10)
The following questions require a short answer:
My culture values …..
arts, education & family
Hispanos
being thoughtful and kind, helping others, honest and respectful. Open-minded and fair,
while keeping my faith first and fore most
Christianity, and loving each other regardless of race
Believe in God, be the best person you can, try your best
family, religion and education
demonstrating good character & integrity, academic excellence, exploring opportunities,
positive influence in the community
hardwork, creativity, competativeness & success
perserverance, hard work
education and family
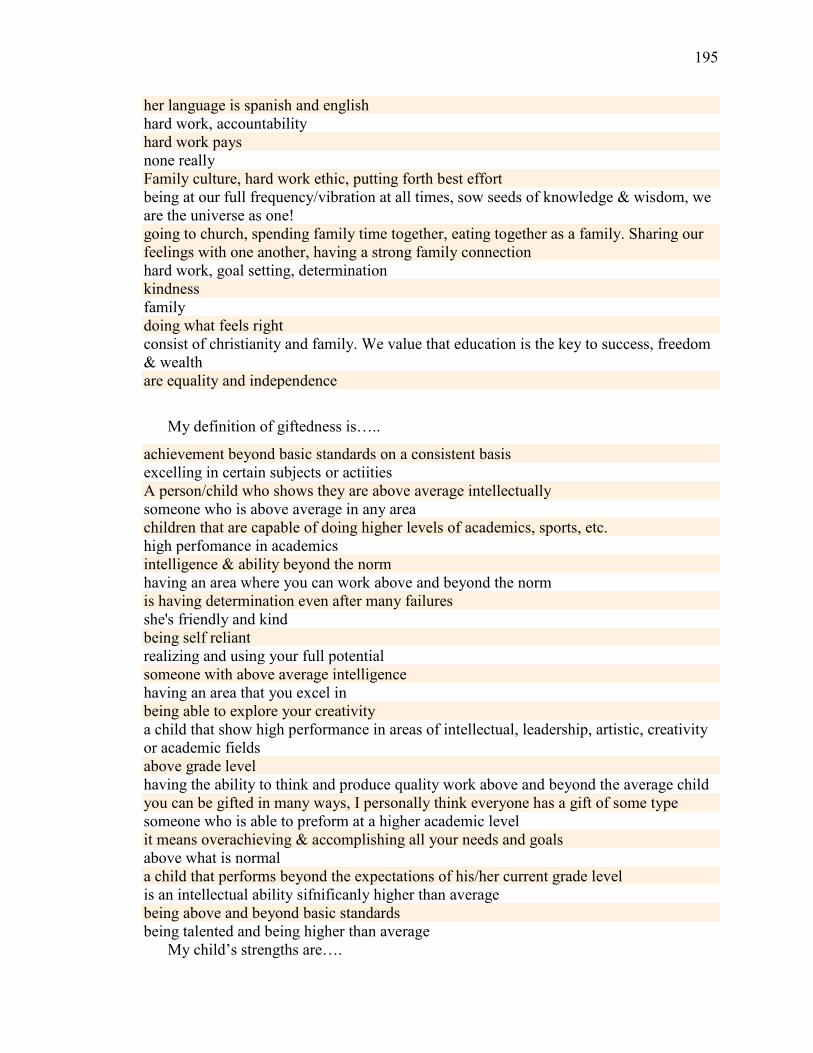
195
her language is spanish and english
hard work, accountability
hard work pays
none really
Family culture, hard work ethic, putting forth best effort
being at our full frequency/vibration at all times, sow seeds of knowledge & wisdom, we
are the universe as one!
going to church, spending family time together, eating together as a family. Sharing our
feelings with one another, having a strong family connection
hard work, goal setting, determination
kindness
family
doing what feels right
consist of christianity and family. We value that education is the key to success, freedom
& wealth
are equality and independence
My definition of giftedness is…..
achievement beyond basic standards on a consistent basis
excelling in certain subjects or actiities
A person/child who shows they are above average intellectually
someone who is above average in any area
children that are capable of doing higher levels of academics, sports, etc.
high perfomance in academics
intelligence & ability beyond the norm
having an area where you can work above and beyond the norm
is having determination even after many failures
she's friendly and kind
being self reliant
realizing and using your full potential
someone with above average intelligence
having an area that you excel in
being able to explore your creativity
a child that show high performance in areas of intellectual, leadership, artistic, creativity
or academic fields
above grade level
having the ability to think and produce quality work above and beyond the average child
you can be gifted in many ways, I personally think everyone has a gift of some type
someone who is able to preform at a higher academic level
it means overachieving & accomplishing all your needs and goals
above what is normal
a child that performs beyond the expectations of his/her current grade level
is an intellectual ability sifnificanly higher than average
being above and beyond basic standards
being talented and being higher than average
My child’s strengths are….

196
math
Mathematicas, Lectura
being independent and standing up for herself and others
Mathmatics, being able to catch on to things quickly
competitive and drive to be the best
math and writing ability and science
desire to learn & excel, competitive
intelligence, writing, creativity
reading, math, attention to detail
speaking, making friends, leadership
family
following directions, independent thinker
math/science
reading, writing short stories, technology, creative imagination, kindness, honest, fun to
be with
math, problem solving, drawing
reading comprehension, writing, science
Being independent, leadership, loving, love to learn, read, creative, strong work ethics,
organization, honesty, enthusiasm, writing, communication.
pushing himself
math, reading, thinking out loud, creativity, curious, needs to find out why, breaking
things apart
reading & writing
focus on tasks & puts in 100% effort
writing
reading, writing
reading, math, solving problems
communication, math skills & social studies
creative
math, science and story telling
reading, science
Please help my child improve in …..
reading (2)
reading due to it being boring to him
Vocabulario
slowing down and learning how to focus on her work to help improve her math skills
Science, and not getting so frusterated when he doesn't understand something
division problem solving
excelling beyond grade level, being involved in other school activities such as student
government, community involvment
symbolic thing
self confidence & to value how smart she is (and believe it)
self-esteem
math and reading
any area you feel she needs help

197
organizations @ School
social skills with other kids
writing, not giving up
multiplication/fractions
improve problem solving, strong listening skills, memorizing facts, classifying, working
in groups
reading confidence
completing of product instead of re-starting to make it better. Organization with thoughts
and information
the amount of effort put into work. applying themselves.
math (multiplication & division)
Confidence in academic abilities
the most topics possible
knowing its okay to be a leader and not a follower
reading comprehension & creative writing skills
writing skills, with the growing technology age and use of computers and tablets, I fear
writing with decrease
math & history

198
Appendix H
Parent Survey–Postintervention Comparison Group

199
Parent Survey Questions
Please answer the following questions honestly. All responses will remain anonymous.
The following questions are Likert response questions:
Question Strongly
Disagree
Disagree Agree Strongly
Agree
Informed Programming
1 I have previously been informed about
the district’s gifted program.
6.3% (3) 18.8%
(9)
58.3%
(28)
16.7%
(8)
2 Schools provide adequate information
about gifted education to all parents.
8.3% (4) 20.8%
(10)
56.3%
(27)
14.6%
(7)
3 The current gifted identification process
in the district adequately locates
students who need gifted services.
6.3% (3) 18.8%
(9)
62.5%
(30)
12.5%
(6)
Support System
4 I am strongly involved in my child’s
education.
0 0 33.3%
(16)
66.7%
(32)
5 My child’s support system consists of
an extended family (church,
extracurricular groups, etc.).
2.1% (1) 18.8%
(9)
35.4%
(17)
43.8%
(21)
6 My child’s peers support their high
academic achievement.
0 10.4%
(5)
64.6%
(31)
25%
(12)
7 My child has adequate support outside
of school to develop their academic
potential.
4.2% (2) 10.4%
(5)
33.3%
(16)
52.1%
(25)
8 I have a collaborative relationship with
my child’s teacher.
4.2% (2) 16.7%
(8)
45.8%
(22)
33.3%
(16)
9 My child has adequate support at school
to develop their academic potential.
2.1% (1) 2.1% (1) 60.4%
(29)
35.4%
(17)
Acknowledgment of Ability
10 My child’s academic accomplishments
are recognized by the school.
0 8.3% (4) 58.3%
(28)
33.3%
(16)
11 Other accomplishments of my child are
recognized by the school.
2.1% (1) 12.5%
(6)
62.5%
(30)
22.9%
(11)

200
12 My child’s teachers believe my child
can be successful.
0 2.1% (1) 43.8%
(21)
54.2%
(26)
Question Strongly
Disagree
Disagree Agree Strongly
Agree
Academic Expectations
13 My child’s teachers consistently set
high expectations for them.
2.1% (1) 4.2% (2) 62.5%
(30)
31.3%
(15)
14 My child is provided with opportunities
to increase their academic potential.
2.1% (1) 8.3% (4) 60.4%
(29)
29.2%
(14)
15 My child believes they can be
successful.
2.1% (1) 0 37.5%
(18)
60.4%
(29)
16 I believe my child is capable of
performing at a higher level than they
are currently performing.
2.1% (1) 4.2% (2) 47.9%
(23)
45.8%
(22)
Educational Equity
17 My child is engaged at school.
2.1% (1) 4.2% (2) 52.1%
(25)
41.7%
(20)
18 My child is exposed to a multicultural
education.
6.3% (3) 4.2% (2) 52.1%
(25)
37.5%
(18)
19 My child’s teacher understands their
cultural needs.
8.3% (4) 8.3% (4) 45.8%
(22)
37.5%
(18)
20 My child’s education is educationally
equal to other students.
6.3% (3) 6.3% (3) 58.3%
(28)
29.2%
(14)
The following questions require a short answer:
My culture values …..
very important (2)
I need teachers to understand parent point of view and family relationships before calling social
worker to investigate and accuse parents for child abuse
Education, spirituality
equality and personal development
equality for all
traditional, moral & ethical based
honesty, good morals and kind hearted. Trustworthy and responsible, considerate of others
feelings and needs
Honesty, integrity, empathy
I don't know if i ever really value what my "culture" sees as important. What I value as a parent to
young men is respect, integrity, and a desire to do your best in school.

201
"out of many people, one culture - West Indian Culture" Serve god, live in peace with our
community, live a life of integrity
family is very important to my hispanic culture
hard work and dedication
education - achievement
respect, morals, equality
to love one another
connection with family
learning
respect & value life
respect, dedication, determination, and persistance
my culture values are based on religion, marriage, raising children, decision making and problem
solving. Life values towards adolescents & elders, work expectations, authority, friendship &
leadership
education and respect of & to others
Empathy for others and their differences. All children learn differently and should be allowed to
express themselves as they learn
The importance of education
economic preparedness, education, family
family, being kind and respectful, always try your best
strong
My definition of giftedness is…..
Some teachers was very helpful but still some are destroy student and parent trust and
relationship
Ease in academics, common sense, problem solving
naturally exceeding the average
creative, intellect
any child that strives to succeed, despite adversity, disabilities, and or limitations. Children that
want to better their education
what my daughter is good for and the potential for performing
high achieving with exceptional potential
exceeds grade level and expectations
being able to easily tackle information that would require more time with other kids
Creativity, reads avidly, persistent intellectual curiosity
being aware that you can achieve big things in life if you work hard enough
the ability to strive for more and go beyond the norm
being able to excel in various things
high capacity, intellectual, artistic, academic
something that comes natural with no effort
academic, intelligence
perform above grade level
ability to achieve goals without little to no assistance
willpower
a student who exceeds grade level performance scholastically
giftedness in an individual is someone who excels in a subject or many subjects and/or their
personal strengths. There is a desire for them to learn and figure out how things work. Their
comprehension is usually extremely higher than their peers.

202
a person that excels in academics
Ambitious and extremely capable of exceeding the potential of the average student
exceeding average standards and expectations
When a child's ability level is higher than the norm for children their age
having educational needs that surpass those of your peers and require more of a challenge
needing enrichment above grade level
something that i'm very good on
intelegent
My child’s strengths are….
reading (3)
Kind and love support
Reading, English, science, story telling
anything mathmatical
artistic, academic skills, leadership qualities
Strong willed, analytical thinking while maintaining creativity. Dedicated, compassionate & fun
hard worker, kind, considerate, bright and confident
math & english
math, problem
compassion, kindness, math, science
avid reader, broad/creative writer
determination and a kind heart
energy and compassion
reading - science, math
she likes to read, robotics, math, she follows the rules, respectful
work well with others, quick learner
intelligent, respectful
determination to understand
determination
communication, art, and computer technology
comprehension, concentration, working alone or as team, following instructions, attentiveness,
cautiousness, self control, taking initiative, and taking responsibility. Expressing empathy and
sympathy.
reading, interest in science
self-confidant, honest, kind, smart and good work ethic, ambitious
math and english
creativity, leadership, artistic & organizational skills
reading, problem solving, emotional intelligence
easy going personality
math, run, main ideas
writing
Please help my child improve in …..
math (2)
patience and control anger
confidence in math
reading comprehension

203
expressing how he feels
handwriting
writing
asking teacher to explain how to do something. They don't like asking for the teacher to explain
something while others students are watching. They are embarrassed
impulse control (behavior)
all areas, reading comprehension, critical thinking
knowing that she is accepted no matter her race, culture or gender. Especially in cabarrus county
and kannapolis city schools
reading & comprehension
organization and goal setting
understanding why guidelines exist
science
being more outspoken
reading level
written comp.
self confidence in learning
science
working with others respectfully
hand writing, public speaking
writing and math
Asking questions when she's not certain about something. She doesn't what to ask for any
assistance or explanation in front of the other children
understanding differences
Sharing her ideas with others as she tends to be shy
speaking in front of unfamiliar groups/people
self confidence
grammer

204
Appendix I
Parent Survey–Postintervention Treatment Group

205
Parent Survey Questions
Please answer the following questions honestly. All responses will remain anonymous.
The following questions are Likert response questions:
Question Strongly
Disagree
Disagree Agree Strongly
Agree
Informed Programming
1 I have previously been informed about
the district’s gifted program.
0 5.8% (3) 51.9%
(27)
42.3%
(22)
2 Schools provide adequate information
about gifted education to all parents.
0 17.3%
(9)
50%
(26)
32.7%
(17)
3 The current gifted identification process
in the district adequately locates
students who need gifted services.
0 9.6% (5) 65.4%
(34)
25%
(13)
Support System
4 I am strongly involved in my child’s
education.
0 1.9% (1) 32.7%
(17)
65.4%
(34)
5 My child’s support system consists of
an extended family (church,
extracurricular groups, etc.).
5.8% (3) 7.7% (4) 28.8%
(15)
57.7%
(30)
6 My child’s peers support their high
academic achievement.
0 0 59.6%
(31)
40.4%
(21)
7 My child has adequate support outside
of school to develop their academic
potential.
1.9% (1) 5.8% (3) 28.8%
(15)
63.5%
(33)
8 I have a collaborative relationship with
my child’s teacher.
1.9% (1) 1.9% (1) 50%
(26)
46.2%
(24)
9 My child has adequate support at school
to develop their academic potential.
0 3.8% (2) 46.2%
24()
50%
(26)
Acknowledgment of Ability
10 My child’s academic accomplishments
are recognized by the school.
3.8% (2) 0 40.4%
(21)
55.8%
(29)
11 Other accomplishments of my child are
recognized by the school.
3.8% (2) 1.9% (1) 53.8%
(28)
40.4%
(21)

206
12 My child’s teachers believe my child
can be successful.
0 0 34.6%
(18)
65.4%
(34)
Question Strongly
Disagree
Disagree Agree Strongly
Agree
Academic Expectations
13 My child’s teachers consistently set
high expectations for them.
1.9% (1) 0 50%
(26)
48.1%
(25)
14 My child is provided with opportunities
to increase their academic potential.
1.9% (1) 0 46.2%
(24)
51.9%
(27)
15 My child believes they can be
successful.
0 1.9% (1) 25%
(13)
73.1%
(38)
16 I believe my child is capable of
performing at a higher level than they
are currently performing.
0 1.9% (1) 40.4%
(21)
57.7%
(30)
Educational Equity
17 My child is engaged at school.
0 1.9% (1) 42.3%
(22)
55.8%
(29)
18 My child is exposed to a multicultural
education.
0 9.6% (5) 46.2%
(24)
44.2%
(23)
19 My child’s teacher understands their
cultural needs.
0 3.8% (2) 53.8%
(28)
42.3%
(22)
20 My child’s education is educationally
equal to other students.
0 0 55.8%
(29)
44.2%
(23)
The following questions require a short answer:
My culture values …..
N/A (2)
school is very important and you should always try your best
family & education first
everyone is equal, no matter status or race
honesty, integrity, family
if a child is happy they will be successful
character
buying into the educational environment that produces a lifelong learner
faith, family, and a strong community to allow myles to thrive
family, faith, morals, music, respect, communication
none
strong discipline, respect for elders, the space to represent our african decents
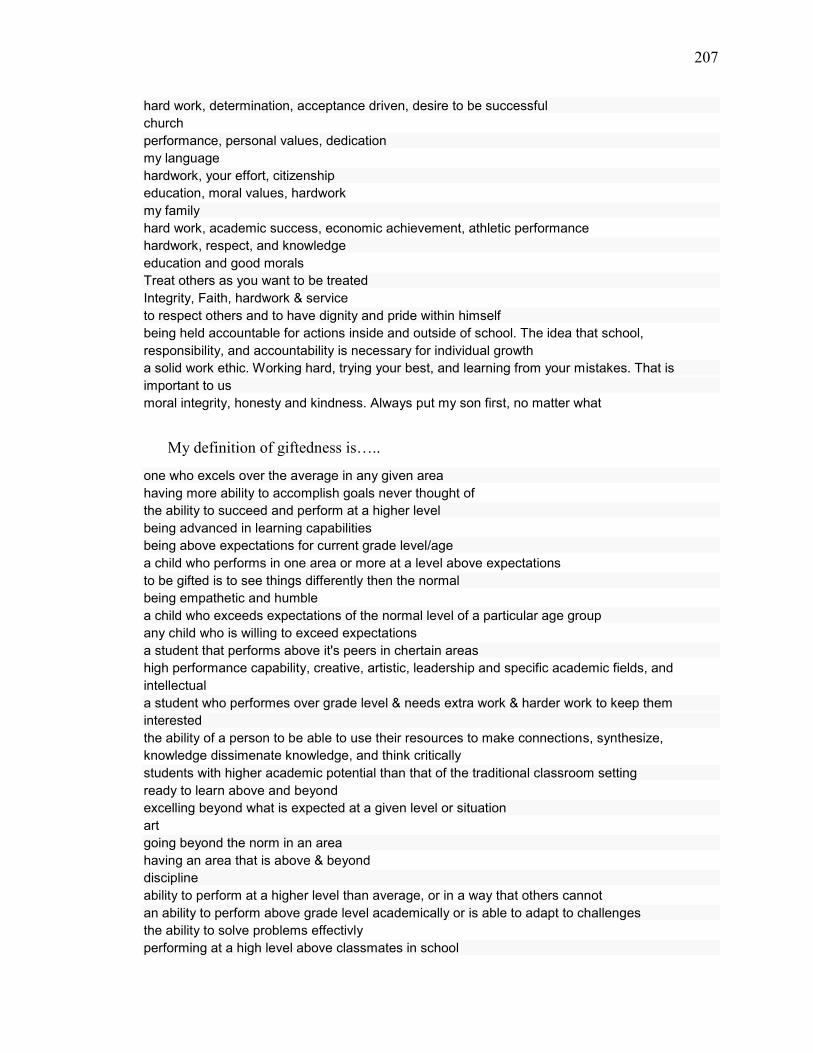
207
hard work, determination, acceptance driven, desire to be successful
church
performance, personal values, dedication
my language
hardwork, your effort, citizenship
education, moral values, hardwork
my family
hard work, academic success, economic achievement, athletic performance
hardwork, respect, and knowledge
education and good morals
Treat others as you want to be treated
Integrity, Faith, hardwork & service
to respect others and to have dignity and pride within himself
being held accountable for actions inside and outside of school. The idea that school,
responsibility, and accountability is necessary for individual growth
a solid work ethic. Working hard, trying your best, and learning from your mistakes. That is
important to us
moral integrity, honesty and kindness. Always put my son first, no matter what
My definition of giftedness is…..
one who excels over the average in any given area
having more ability to accomplish goals never thought of
the ability to succeed and perform at a higher level
being advanced in learning capabilities
being above expectations for current grade level/age
a child who performs in one area or more at a level above expectations
to be gifted is to see things differently then the normal
being empathetic and humble
a child who exceeds expectations of the normal level of a particular age group
any child who is willing to exceed expectations
a student that performs above it's peers in chertain areas
high performance capability, creative, artistic, leadership and specific academic fields, and
intellectual
a student who performes over grade level & needs extra work & harder work to keep them
interested
the ability of a person to be able to use their resources to make connections, synthesize,
knowledge dissimenate knowledge, and think critically
students with higher academic potential than that of the traditional classroom setting
ready to learn above and beyond
excelling beyond what is expected at a given level or situation
art
going beyond the norm in an area
having an area that is above & beyond
discipline
ability to perform at a higher level than average, or in a way that others cannot
an ability to perform above grade level academically or is able to adapt to challenges
the ability to solve problems effectivly
performing at a high level above classmates in school

208
children who show and go beyond the typical "standards"
developing at an above average growth rate in specific areas
you just are, its not something that can be taught. Seeing the world in a different way
above average. Where others may struggle, it comes natural with very little effort to the gifted.
using one's given talents and strengths in creative ways
a willingness to try, do, perform, learn, accomplish and understand a variety of topics that may
not be at their grade level
natural or learned ability to be great at either one thing or many things. I believe that each person
has a particular gift
My child’s strengths are….
math (2)
her determinationcompetitiveness
math, reading, science
thinking outside the box, adapting and problem solving
reading & math
math, details
math & reading
my child is very compassionate
helpful, caring
focus, work ethic, character
a quick learner; kindness; willing to push through to the next level
she is determined, kind, honesty and can be very creative
creativity, curiosity, bravery, determination, dedication, respectful, enthusiasm, honestly, being a
leader
critical thinking, leans quickly, articulates his thoughts very well when prompted, athletic
desire to excel
reading, math, science
academics, creativity, group interation
my family
caring, creative, determination
drawing, problem solving, curiosity
writing
math & science
he is great in academic areas
reading and problem solving
good moral values, science, art, empathetic
drive and ambition
Faith, honesty, determination & headstrong
reading, math, helping others
his imagination, quick wit, caring for others, and willingness to serve. When he sees the value in
something he will give 100% effort
creativity, curiosity, stubborness, willing to try most things. She also loves to teach and share with
others.
Smart, funny, strong, intuitive, honest, musical - teaches himself to play different instruments as
he knows I can't afford lessons yet he never complains. He is kind and can adapt to any
environment and there have been many hard times. He is quite frankly amazing

209
Please help my child improve in …..
math (2)
understanding that she doesn't have to be first in everything, as long as she puts in her best effort
in completing a task (or assignment) she doesn't have to beat herself up if she isn't first in class
N/A
pushing himself to the next level. Typical boy, sometimes lazy
putting his thoughts on paper
communication - verbal & written
writing skills
the dreaded word math problems
personal friendships
time management
asking for help when needed
math, would love to see more push in math area
Math, Listening skills, being bossy, impatient
none
eliminating his shyness and feeling more comfortable speaking in front of others and
strengthening his work ethic
confidence, ongoing academic efforts/success
showing her work, taking her time, talking when time to learn
Dealing with set backs & frustration
belief in her abilities
writing
multiplication
reading comprehension, grammar, ability to write
critical thinking skills. He has the knowledge but sometimes struggles to think out of the box to
apply it. I think exposure to more critical thinking challenges and teaching him the steps to think
through them would benefit him greatly
believing in himself
Strong willed, perfectionist & bossy
handwriting, getting along with peers
being more confident and secure with himself
organization, following through with activities. He needs his effort to be more with items he
doesn't see the value in.
her focus and time management. She strives for her idea of perfect that she often stops, and
starts over instead of purservering.
Academically, I would say math. However, I think he needs support with social issues as he has
had to grow up fast and took on adult roles that he should not have to - like being supportive to a
disabled mom (me) and never knowing if he will have a place to call home. Not your typical 10
year old worries.

210
Appendix J
Teacher Survey–Preintervention Comparison Group
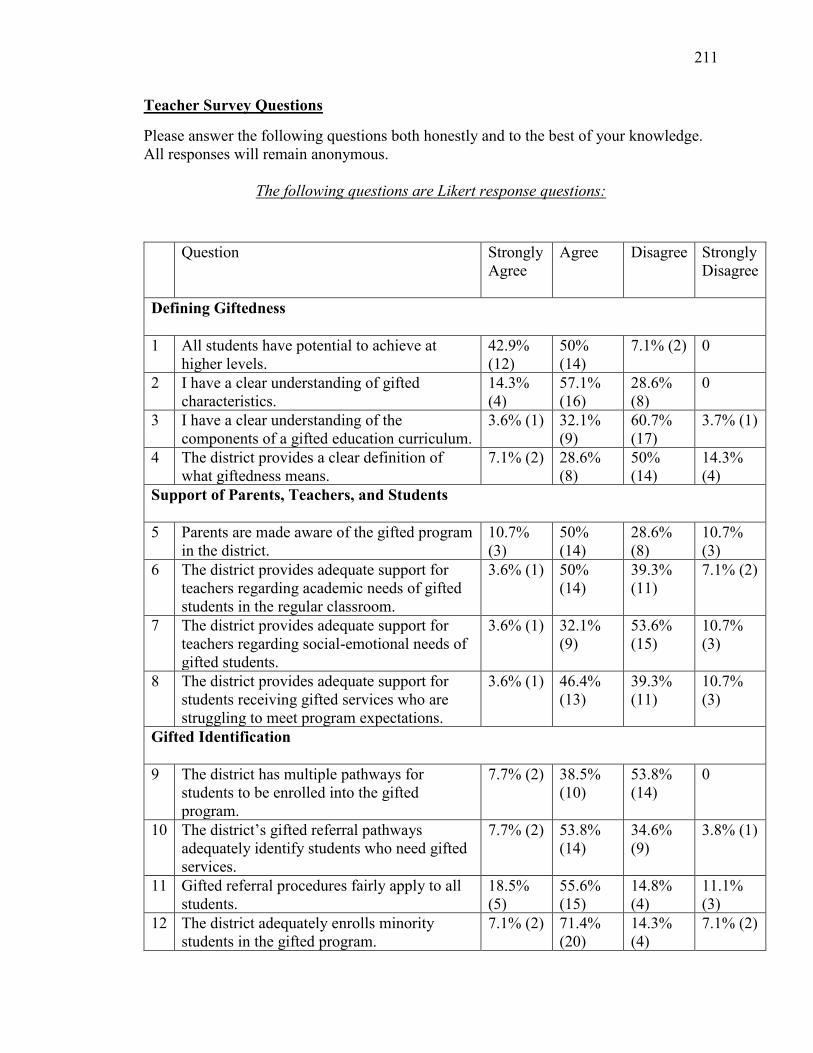
211
Teacher Survey Questions
Please answer the following questions both honestly and to the best of your knowledge.
All responses will remain anonymous.
The following questions are Likert response questions:
Question Strongly
Agree
Agree Disagree Strongly
Disagree
Defining Giftedness
1 All students have potential to achieve at
higher levels.
42.9%
(12)
50%
(14)
7.1% (2) 0
2 I have a clear understanding of gifted
characteristics.
14.3%
(4)
57.1%
(16)
28.6%
(8)
0
3 I have a clear understanding of the
components of a gifted education curriculum.
3.6% (1) 32.1%
(9)
60.7%
(17)
3.7% (1)
4 The district provides a clear definition of
what giftedness means.
7.1% (2) 28.6%
(8)
50%
(14)
14.3%
(4)
Support of Parents, Teachers, and Students
5 Parents are made aware of the gifted program
in the district.
10.7%
(3)
50%
(14)
28.6%
(8)
10.7%
(3)
6 The district provides adequate support for
teachers regarding academic needs of gifted
students in the regular classroom.
3.6% (1) 50%
(14)
39.3%
(11)
7.1% (2)
7 The district provides adequate support for
teachers regarding social-emotional needs of
gifted students.
3.6% (1) 32.1%
(9)
53.6%
(15)
10.7%
(3)
8 The district provides adequate support for
students receiving gifted services who are
struggling to meet program expectations.
3.6% (1) 46.4%
(13)
39.3%
(11)
10.7%
(3)
Gifted Identification
9 The district has multiple pathways for
students to be enrolled into the gifted
program.
7.7% (2) 38.5%
(10)
53.8%
(14)
0
10 The district’s gifted referral pathways
adequately identify students who need gifted
services.
7.7% (2) 53.8%
(14)
34.6%
(9)
3.8% (1)
11 Gifted referral procedures fairly apply to all
students.
18.5%
(5)
55.6%
(15)
14.8%
(4)
11.1%
(3)
12 The district adequately enrolls minority
students in the gifted program.
7.1% (2) 71.4%
(20)
14.3%
(4)
7.1% (2)

212
Question Strongly
Disagree
Disagree Agree Strongly
Agree
Multi-Cultural Understanding
13 I have a clear understanding of multicultural
education.
10.7%
(3)
71.4%
(20)
17.9%
(4)
0
14 I implement multicultural education in my
classroom on a regular basis.
17.9%
(5)
53.6%
(15)
28.6%
(8)
0
15 I have a clear understanding of gifted traits in
cultures different than my own.
7.4% (2) 40.7%
(11)
44.4%
(12)
7.4% (2)
16 I am aware of cultural/socioeconomic biases
I have.
7.4% (2) 74.1%
(20)
18.5%
(5)
0
17 I look at all subgroups of students in a fair
and equitable way.
25.9%
(7)
66.7%
(18)
7.4% (2) 0
The following questions require a short answer:
1. How do you define the word gifted?
A unique insight and perspective on problem solving and information intake.
The ability to apply critical thinking in multi- subjects
A student who demonstrates the intellectual critical thinking several grades higher than
what they are enrolled. It is more than just being "smart" and a straight "A" student.
Having a strength in an area that is beyond typical for the age
A student who thinks above and beyond what is expected of them.
Someone who goes above what I expect and then can show detailed explanation and
thinking of why they answered a question as they did.
Gifted students are higher than other peers academically OR socially
A person who understands concepts and general with little or no prior instructions. A
person is self motivated and always seeking new ways and concepts to better understand
and deal with the society around them.
Can perform in classroom well above expectations in one or many areas.
A student who is talented in one area, does not need to be educational
Having abilities to understand work in a more complex and advanced way
above average
Students who are working independently above their current grade level.
Students who learn and express their knowledge in many ways.
3-6 times throughout the year
Talented beyond standard
High achievers.
"Everyone is a genius, but if you judge a fish on its ability to climb a tree, it will live its
whole life thinking it is stupid." A. Einstein ...We all have gifts, we just need help
identifying them. In the classroom setting, I define gifted as academically excellent.
talented! there are many forms of gifted
A knowledge that sets them apart from peers

213
Students that have natural gift in art, music, math, etc. Students with unique problem
solving skills. Students with a curiosity and enthusiasm for certain areas math, science.etc
Student performing above grade level that will need additional services to meet their
academic and social needs
Students who are performing better than their peers or other students at the state level.
2. What traits do you look for when recommending students for the AIG program?
Inquisitiveness and the ability to consume and synthesize information in a unique way.
Critical thinking, high performance, risk-taking, creativity
Postive attitude, great work ethic, parental support, high achievement scores
Self-disciplined, Goal setter, inquisitive, use of imagination and creativity
Quick ability to learn, correct answers, explanations of work, and a high motivation to
learn.
creative, high academics, "think outside the box"
Self motivated, a willingness to learn, a person who looks outside and inside the concept
to fully understand the idea.
I look for motivation to learn. I look to see that they can complete tasks in one, or many,
areas well above grade level expectations.
Higher level thinking, hard working, the ability to think outside the box, and works at a
higher level then peers.
I look for someone who not only completes assignments correctly, but is going above and
beyond. Someone who is able to look at assignments from multiple perspectives.
working past their grade level without support
High achievement, problem solving skills, critical thinking skills
Knowledge that is above grade level.
quiet, hard working, able to solve problems in different ways
Exceeds average
N/A
I am part of the EC department, so AIG recommendations are not something with which I
am familiar.
determination strong desire to know more
Ability to advance quickly through topics and understand things at a deeper level
creative problem solving, eagerness to learn, aptitude or talent in a certain (or multiple
areas)
High emotional literacy as well as high academic grades
EOG Data
3. If a student has gifted potential, what factors might keep you from recommending them
for the AIG program?
Behavior (2)
None!
Low performance, low motivation, poor behavior
If the student is lazy and refuses to do work in the regular classroom, even if it is
challenging and meeting their needs.

214
None
Lack of motivation. Lack of interest in work. Or someone who does not turn in any work
in the normal classroom.
behavior (severe), unable to finish class work due to ability not defiance
The ability to understand and accept other peoples ideas. General attitude, and
willingness to go the extra mile in school and outside of school.
If they have behaviors or lack of motivation that impede their learning, but even then, I
would recommend them to the program and hope that they were successful. They need
the chance. So I guess nothing would keep me from recommending, but I would
communicate my concerns.
not completing work, doesn't demonstrate understanding outside of a test
behavior
Knowing who to contact within the school building
None, I want students to get the education that will help them the most.
Parents don't want the identification
N/A
Poor attendance
none
Honestly, the only that would keep me from recommending them would be "limited
space". We have such limited services at the elementary level. The only thing that would
keep me from referring a student would be if there were other students that I felt needed
the services more and slots were limited.
Maturity
Not being able to speak to someone about the qualifications
4. What benefits do you see in using teacher referrals to help identify gifted students?
Teachers have a unqiue insight into the way students process and share information, think
creatively and solve problems. These avenues can lead to identifying potentially gifted
students that may not perform well on the singular day an "aptitude test" is given.
I see great benefit in teacher referral—-teacher sees daily effort and performance that a
standaesized test may not show.
Could identify students who work hard, but fall a little short on academic/achievement
requirements.
Teachers can identify factors not seen in test scores, such as effort, responsibility,
determination and interest in learning/becoming a better student
I think that students do not always test well, even if they are gifted. A teacher works with
them daily and can identify the way they work and if they are a gifted student. Teachers
can see the potential of their gifted students that may not be identified.
The teachers know where their students are. They know who is below, who is on point
and who is exceeding that expectation. It would make sense to have teachers refer
students.
Teachers see the students more than the AIG teachers. The AIG process is also all based
off of EOG scores, and the NNAT. Yet we have many children that could be gifted in
social/emotional years.

215
Many teachers not only understand the scholastic ability but also observes the student
behavior and willingness to put in the extra the AIG program requires to excel in an
advanced program.
There are many students who do not test well. You see their potential in other ways.
It gives different perspective than a test, it offers nontest takers a chance to be in AIG, it
gives another data point that may be truer than a test
Sometimes, students might not be the best at taking a test so when they take the AIG
qualifying test, they might not pass, but they can show great ability in the classroom.
teachers spend the most amount of time with the kids and can see if they can apply what
they know in the classroom
We work with the students all day so we see their strengths and weaknesses.
Teachers know their students best.
Helps to get students identified who are not good test takers
They know students
N/A
Teachers should be well qualified to identify which students are gifted, and through
connecting with their students can see intelligence in spite of classroom performance.
Sometimes they might have test anxiety or not currently be pushed hard enough.
Teachers know the students best.
Quicker response than waiting on test results
I think this is very helpful because the teacher can provide a holistic view on students
academics.
5. What disadvantages do you see in using teacher referrals to help identify gifted
students?
N/A (2)
Favoritism, excellent behavior and good performance being mistaken for academically
gifted.
Teachers referring the highest student or smartest student in their class. They may be the
highest in that particular classroom, but it does not mean they are gifted.
There can be bias in teacher referrals
Teachers may select students who are above grade level but not necessarily gifted.
I could see how a teach might mistake a child to be gifted just because he or she makes
good grades.
Many times teachers will just look at "how high" a different child is compared to others
yet the others might be a lower group.
I think the teacher referral is one of the most important factors of the program, this person
or people see the day to day instruction of the child. Many students are able to perform on
a test or group of test very well. The most important factor is how does this student
perform on an ongoing basis. How does the student excel on a regular basis. Some
students that I have observed have no problems with taken written exams, however have
problems communicating in the classroom with others.
Teacher judgment can be flawed. Personal experience: My daughter was in the nurturing
group in K-1. When she got to 2nd grade she no longer was allowed to go. I was never
contacted about this. I went to her teacher and asked why and asked for her to be put back

216
in AIG nurturing. I did not get a response and the teacher left at Christmas. So I asked the
new teacher again. Still, I never was given a reason. My daughter loved to go to AIG. It
was very disappointing.
Sometimes data does not back it up, it's subjective
While you might think they are advanced, they might not be able to keep up with the
other students in AIG.
teacher bias
I am not fully trained in identifying students or knowing how to meet their needs.
Sometimes teachers do not see students’ potential if other factors ( disability, behavior)
get in the way.
Students don't always want to be part of the program, don't want the extra work, don't
come from a home where education is support enough to push the student to complete the
extra work
Biased
Some teachers may simply focus on reading or math levels, and discredit students with
poor behavior. Many gifted students have poor classroom behavior because they are not
challenged enough.
Case overload so those truly AIG will not receive proper services.
Bias for or against a certain student based on behavior, motivation,etc
Some teachers may not be aware of the lesser known traits of gifted individuals and that
may result in the teacher not recognizing the student as gifted.
6. What is does it mean to you to implement multicultural education?
Teach in such way that all cultures and walks of life feel accepted in the classroom.
Teaching students about all cultures - similarities/differences. Celebrate differences and
teach acceptance.
We don't try to force students to conform to the majority way of thinking, behaving or
learning. We accepts students for who they are and help them achieve to the best of their
potential.
Presenting students with opportunities to see how they can succeed and using people
from all cultures as models of success.
To take moments during the day and implement information found all over the globe
pertaining to that topic making sure it provides new insights and ideas to the given
subject.
Using different texts, and incorporating multi-culture into the classroom.
It means that we are open to including and promoting ideas from people and groups from
a wide variety of students.These groups come with different ideas, day to day experiences
and histories which can help other student understand the whole world around them.
To know what is culture and to explore your own. To understand that there are many
factors in a person's culture. To make great effort to make sure that you are showing
many cultures in many different ways through your instruction. To help them to explore
other cultures without judgement and to be free ask questions.
Incorporating my students interests and background into my class instruction.
Approaching my students in a way they relate to. Getting to know all my students
personally and finding ways to relate to them and connect them to our content.
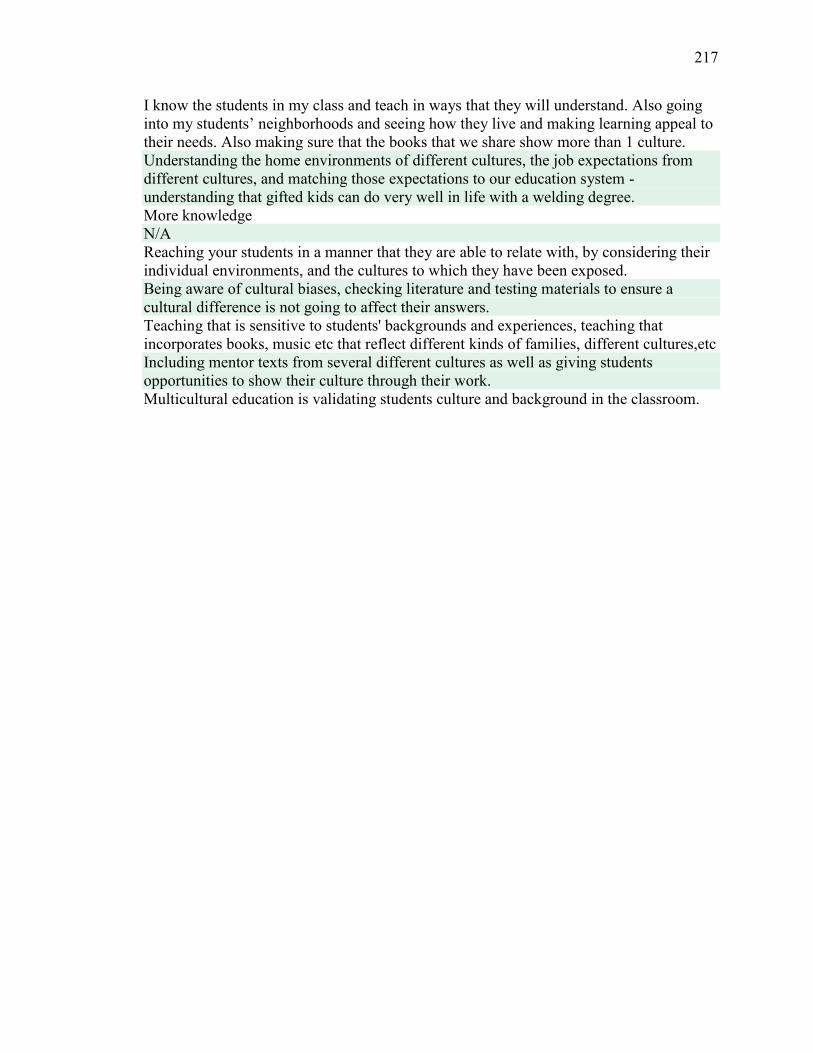
217
I know the students in my class and teach in ways that they will understand. Also going
into my students’ neighborhoods and seeing how they live and making learning appeal to
their needs. Also making sure that the books that we share show more than 1 culture.
Understanding the home environments of different cultures, the job expectations from
different cultures, and matching those expectations to our education system -
understanding that gifted kids can do very well in life with a welding degree.
More knowledge
N/A
Reaching your students in a manner that they are able to relate with, by considering their
individual environments, and the cultures to which they have been exposed.
Being aware of cultural biases, checking literature and testing materials to ensure a
cultural difference is not going to affect their answers.
Teaching that is sensitive to students' backgrounds and experiences, teaching that
incorporates books, music etc that reflect different kinds of families, different cultures,etc
Including mentor texts from several different cultures as well as giving students
opportunities to show their culture through their work.
Multicultural education is validating students culture and background in the classroom.

218
Appendix K
Teacher Survey–Preintervention Treatment Group

219
Teacher Survey Questions
Please answer the following questions both honestly and to the best of your knowledge.
All responses will remain anonymous.
The following questions are Likert response questions:
Question Strongly
Agree
Agree Disagree Strongly
Disagree
Defining Giftedness
1 All students have potential to achieve
at higher levels.
63%
(17)
33.3%
(9)
3.7% (1) 0
2 I have a clear understanding of gifted
characteristics.
25.9%
(7)
66.7%
(18)
7.4% (2) 0
3 I have a clear understanding of the
components of a gifted education
curriculum.
25.9%
(7)
55.6%
(15)
18.5%
(5)
0
4 The district provides a clear definition
of what giftedness means.
18.5%
(5)
59.3%
(16)
22.2%
(5)
0
Support of Parents, Teachers, and Students
5 Parents are made aware of the gifted
program in the district.
22.2%
(6)
63%
(17)
14.8%
(4)
0
6 The district provides adequate
support for teachers regarding
academic needs of gifted students in
the regular classroom.
14.8%
(4)
59.3%
(16)
22.2%
(6)
3.7% (1)
7 The district provides adequate
support for teachers regarding social-
emotional needs of gifted students.
14.8%
(4)
25.9 %
(7)
55.6%
(15)
3.7% (1)
8 The district provides adequate
support for students receiving gifted
services who are struggling to meet
program expectations.
11.5%
(3)
57.7%
(15)
26.9%
(7)
3.7% (1)
Gifted Identification
9 The district has multiple pathways for
students to be enrolled into the gifted
program.
14.8%
(4)
70.4%
(19)
14.8%
(4)
0
10 The district’s gifted referral pathways
adequately identify students who
need gifted services.
14.8%
(4)
66.7%
(18)
18.5%
(5)
0

220
11 Gifted referral procedures fairly apply
to all students.
19.2%
(5)
73.1%
(19)
3.8% (1) 3.8% (1)
12 The district adequately enrolls
minority students in the gifted
program.
18.5%
(5)
70.4%
(19)
7.4% (2)
3.7% (1)
Question Strongly
Disagree
Disagree Agree Strongly
Agree
Multi-Cultural Understanding
13 I have a clear understanding of
multicultural education.
44.4%
(12)
51.9%
(14)
3.7% (1) 0
14 I implement multicultural education
in my classroom on a regular basis.
25.9%
(7)
48.1%
(13)
25.9%
(7)
0
15 I have a clear understanding of gifted
traits in cultures different than my
own.
14.8 %
(4)
37%
(10)
48.1%
(13)
0
16 I am aware of cultural/socioeconomic
biases I have.
37%
(10)
63%
(17)
0 0
17 I look at all subgroups of students in a
fair and equitable way.
40.7%
(11)
59.3%
(16)
0 0
The following questions require a short answer:
1. How do you define the word gifted?
Students who have exceptional abilities in any areas that go beyond the curriculum for a
grade level.
A student who is very intelligent and goes above and beyond. They could be creative, and
excell in an area.
Talent that goes above and beyond normal standards
Students who have the ability to perform significantly higher than their peers and need
need specially designed instruction in order to reach their potential.
Having exceptional talent and natural ability
Able to think outside the realm of what is expected.
Students who use critical thinking skills, thinking outside the box, high aptitude and/or
achievement, goes above and beyond
Gifted are students that look at problems in a way that is not always typical. They can be
gifted in multiple areas; however, struggle greatly in others. Students who are gifted may
not necessarily perform well on academic task based on interest and giftedness.
Excelling in a certain area, could be academic or social
A student who has a higher and deeper level thinking and can discuss and apply their
thinking.
Having an ability naturally that is above the average population
The level of academic understanding, emotional status, and whole child being.
over achieving child who can work above grade level consistently, independently and
consistently

221
A student who may perform better in one or more subjects than their peers.
The ability to perform above grade level or in a unique way. Giftedness extends beyond
typical academic subjects (reading, writing, math, science) to include speaking and the
arts.
Students who preform above grade level expectations as well as students who use
creative reasoning or problem solving more developed than their average peer(s).
Having an exceptional ability that that requires unique opportunities to grow.
Academically Able, they are able to do and understand more than other students their
age.
Thinking outside the box, great critical thinking and logic skills, thinking beyond
students who are academically advanced with special skills in one or more areas
Children are gifted when their ability is above the norm for their age. Intellectual,
creative, artistic, leadership, or in a specific subject such as English language arts, math
or science are all places where a student can demonstrate that they are gifted.
Talent or natural ability in an area or areas
displays high performance in academically and intellectually
Shows high performance capability in many areas that are above the norm for their age.
2. What traits do you look for when recommending students for the AIG program?
s
Consistent work, reasoning and problem solving beyond grade level standards.
A student who works hard, needs a challenge and has the AIG characteristics.
positive, caring and willing to learn
In my position, I collaborate with the teachers who make the recommendations.
There are too many to mention since the students could exhibit different traits based on
what they are feeling at the moment.
Able to think critically.
critical thinking skills, going above and beyond, thinking outside the box
The way they look at problems and solve them. How they perform on multiple tasks and
how they solve them. Their assessment data as well as their work samples. Their
responses both verbal and in writing. I also consider their home lives as those might be a
negative impact as well as they may just be smart students with a good home life.
Students who show extra interest and thinking/problem solving skills in certain areas
higher level thinking, finishing work quickly with good quality.
above average/grade level intelligence or performance with grade level work
Motivation, Openness, Quick Grasp of Skills, Higher Level Thinking, Emotional balance
high achievement on a regular basis
Performance and potential
I look for self-starters who are inquisitive as well as the typical academic requirements
(above grade level).
Students who not only meet “E” requirements in grade level assignments but also
students who solve problem or approach tasks in creative ways.
ability to naturally exceed what is typical
Students who are above the average and excell in a subject.

222
good critical thinking skills, students who think differently or beyond what others think
high test scores (but not always), students that need to be challenged, areas of strengths,
performance in the classroom
Some traits that I would look for are quick learners, strong understanding of advanced
concepts and ideas, enjoys working with and solving problems, highly sensitive and has
intense and strong reactions, both emotionally and intellectually, extreme focus in one
area or wide range of interests and asks lots of questions.
students eagerness to learn, high level vocabulary, problem solving skills beyond grade
level expectations
deep thinking, creative thinker, self starter, logic and reason
Students who think outside the box, extend their thinking, are going beyond what I teach
them to do.
3. If a student has gifted potential, what factors might keep you from recommending them
for the AIG program?
none (2)
Because some AIG teachers in our district only want to work with students who fit a
perfect mold. So if they have any behavior, or other twice exceptional issues, they are
kicked out. So knowing this may happen, it would keep me from recommending them.
Poor grades, not organized, or does not complete the class work on time.
ability or thirst to learn
N/A
Behavior. I know that might sound awful but what I mean by that is I want them to take
the best advantage of the time in the program. If they are constantly acting out I would be
cautious in recommending him/her. However, ultimately, if I really thought they would
qualify, I would recommend and give my AIG coworker a heads up.
Not being consistent.
behavior, problems with focus (ADHD, ADD), immaturity
I may not recommend a student whom is not consistently performing well. I also might
not pick a student that is extremely shy and does not handle change well.
Behavior
extended assignments and independent literature studies.
extremely poor standardized test scores or classroom preformance
Spots available to serve, parents
Behavior, even though I know that some students may act out because they are bored
with the normal class work.
I will ALWAYS recommend a child to the gifted program if they meet my or the
district's requirements. I believe that it is up to the child to decide if they are interested in
continuing with the program.
Student’s work ethic and focus are the main reasons, in my experience, why I would keep
a student from being an active participant in AIG. Students who are intellectually or
academically gifted but don’t have the stamina or consistenty to be successful.
AIG students receive such minimal time with those certified to work with them.
Behaviors may be a factor
such a small margin and range, qualify
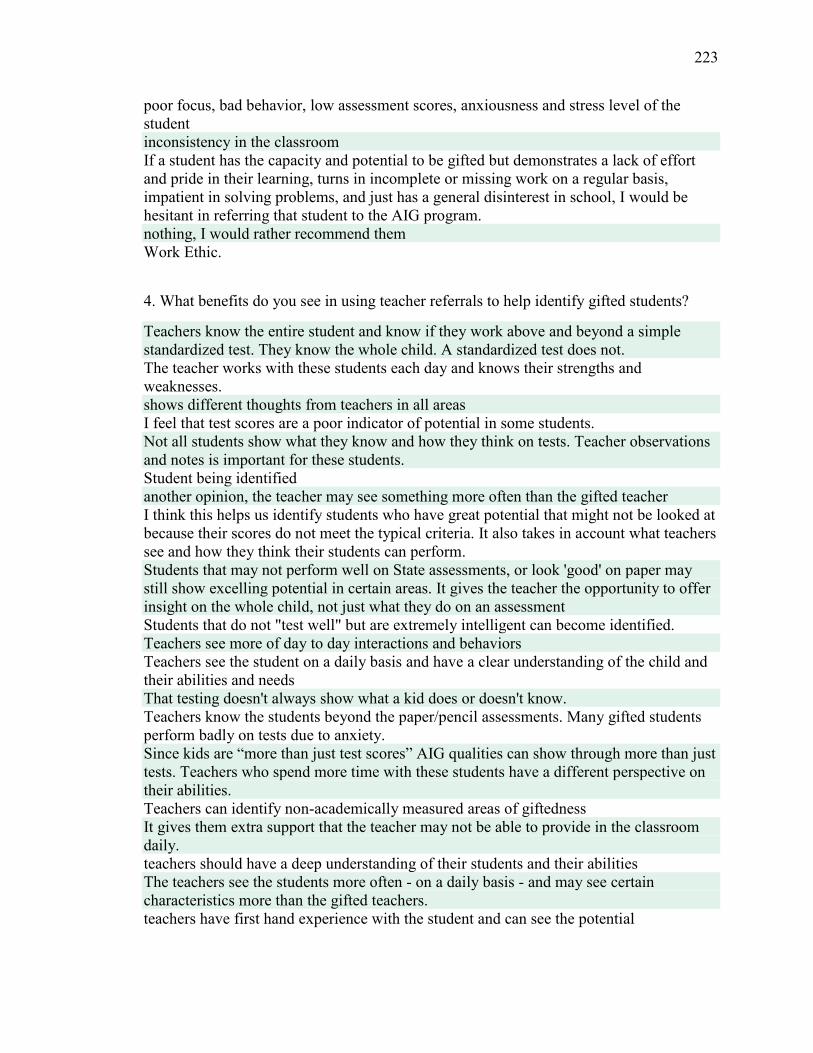
223
poor focus, bad behavior, low assessment scores, anxiousness and stress level of the
student
inconsistency in the classroom
If a student has the capacity and potential to be gifted but demonstrates a lack of effort
and pride in their learning, turns in incomplete or missing work on a regular basis,
impatient in solving problems, and just has a general disinterest in school, I would be
hesitant in referring that student to the AIG program.
nothing, I would rather recommend them
Work Ethic.
4. What benefits do you see in using teacher referrals to help identify gifted students?
Teachers know the entire student and know if they work above and beyond a simple
standardized test. They know the whole child. A standardized test does not.
The teacher works with these students each day and knows their strengths and
weaknesses.
shows different thoughts from teachers in all areas
I feel that test scores are a poor indicator of potential in some students.
Not all students show what they know and how they think on tests. Teacher observations
and notes is important for these students.
Student being identified
another opinion, the teacher may see something more often than the gifted teacher
I think this helps us identify students who have great potential that might not be looked at
because their scores do not meet the typical criteria. It also takes in account what teachers
see and how they think their students can perform.
Students that may not perform well on State assessments, or look 'good' on paper may
still show excelling potential in certain areas. It gives the teacher the opportunity to offer
insight on the whole child, not just what they do on an assessment
Students that do not "test well" but are extremely intelligent can become identified.
Teachers see more of day to day interactions and behaviors
Teachers see the student on a daily basis and have a clear understanding of the child and
their abilities and needs
That testing doesn't always show what a kid does or doesn't know.
Teachers know the students beyond the paper/pencil assessments. Many gifted students
perform badly on tests due to anxiety.
Since kids are “more than just test scores” AIG qualities can show through more than just
tests. Teachers who spend more time with these students have a different perspective on
their abilities.
Teachers can identify non-academically measured areas of giftedness
It gives them extra support that the teacher may not be able to provide in the classroom
daily.
teachers should have a deep understanding of their students and their abilities
The teachers see the students more often - on a daily basis - and may see certain
characteristics more than the gifted teachers.
teachers have first hand experience with the student and can see the potential

224
The benefits of teacher referrals in helping identifying gifted students is mainly in adding
the qualitative data to the quantitative data that is used for placement. Numbers can only
tell you so much. If a student excels at test taking but has difficulty in managing the day
to day responsibilities of a student, I would have a hard time recommending him or her.
However, if my observations inform and corroborate my judgment that the student, in the
classroom, demonstrates the traits of a gifted student but his or her data don't meet the
criteria or is on the fence, then I would advocate for the student to be considered.
teachers see different talents and abilities a student may have other that just using a test to
determine
the teacher sees the student involved in a variety of activities throughout the day that
would potentially show qualities of giftedness
Teachers know their students better than anyone else. Hear and see everything
5. What disadvantages do you see in using teacher referrals to help identify gifted
students?
none (3)
Some teachers do not assess using rigor. So a simple classroom assessment is not always
the best data. Also, not every teacher keeps good data and just looks and says that is a
great kid. That doesn't make them AIG.
Maybe some teachers might have favorites and not choose the students that really need to
be in the program.
N/A
Bias. I would be worried that a teacher my be bias toward a "good kid" and recommend
only those students instead of someone who is truly deserving.
n/a
Teachers may not have gifted training or understand giftedness
This can be subjective.
There are SO many more referrals that could be made, because all students excel at
something!
If a student is gifted but does not preform well for a teacher or the parents pressure a
teacher into identifying a student
They might think the student qualifies based on comparison of other students
achievements, but in the whole spectrum they do not.
teacher biases and parental pressure
If they like a student or not.
Teachers might only recommend the well-behaved, quiet students.
Kids that have challenging behaviors might be overlooked when teachers are
recommending students. Also, vice versa. Students that “mean well” or that try really
hard and are pretty successful in class might be recommended but unable to perform at
the AIG level.
Teacher bias and focus only on scores and not a more holistic view.
the teachers may not all refer their students.
Not all students test well, but could still be gifted
Some teachers may not understand the characteristics of gifted students.

225
over representation of students in program that have parents as teachers or higher income
levels...sometimes these students go to other districts and are no longer gifted and are just
average students. The poverty level in Kannapolis can make it difficult for teachers to
truly identify the gifted and not the advanced kids.
As a teacher spending as much time as i do with a student during the school day, I could
develop biases that might color my justification for recommending the student.
Personal relationships could get in the way.
6. What is does it mean to you to implement multicultural education?
Differentiating with cultures, not just standards. Exposing to a variety of cultures and
more than just reading various texts in English class.
An education that meets the needs of all students of any race or background.
education for all no matter cultural background
I believe that my job is to teach a love of and a respect for all people especially those who
are different from us.
Support, showcase, understand and be empathetic to all cultures within your room.
Implement and emerging cultures within the classroom into everyday teaching.
Use a variety of curriculum that addresses different cultures and the way they learn,
learning about different cultures, including children of all cultures and making sure that
they are valued and feel valued.
I think that means looking at students who they are as individuals and teaching them as
such. I also think it means teaching students using text written by varying cultures.
Giving multiple perspectives in lessons and understanding the advantages/disadvantages
particular cultures face
Creating a classroom environment that is inclusive and diversity is welcomed
Expose students to other cultures, methods, life, and understandings outside of what they
personally live day to day and their own opinions
include all students and their native language and cultures in your class, along with
reaching out to parents and family members Teach all students' perspectives nd about
differences within cultures and races
Not sure
Multi-cultural education means taking the time to acknowledge the cultural aspect of the
subject matter. For example, when exploring the ancient pyramids in Egypt, it is
important for students to be aware that other civilisations created pyramids as well.
Use methods and strategies that involve students and motivate them based on their
personal desires/needs. Using relevant topics, activities and advice to help students based
on what matter to them personally based on their background.
Using people and technology to connect or come together to discuss or share experiences
and information.
awareness of others cultures and traits
Acceptance of different cultures, and exposing different cultures through work samples,
literature, and social awareness
To treat all people fairly, to teach about other cultures, to show students that you
appreciate and value all cultures.

226
Providing a diverse rich education in the classroom highlighting cultures represented in
our community and globally. Making sure students are seeing wide examples of
characters in books with different cultures. Making sure videos shown are diverse in
nature. Using multicultural crayons in the classroom for skin tones.
I can modify or incorporate lessons to reflect the cultural diversity of the students in my
class.
embracing the different cultures and being sensitive to how children from every
background learn and express themselves as well as the impact family has on learning.
Using a variety of teaching/learning styles to reach every learner
use resources so all students can make connections to the content and relate similar
events in cultures to the content that is being taught
Implementing learning that addresses many different cultural norms.

227
Appendix L
Teacher Survey–Postintervention Comparison Group

228
Teacher Survey Questions
Please answer the following questions both honestly and to the best of your knowledge.
All responses will remain anonymous.
The following questions are Likert response questions:
Question Strongly
Agree
Agree Disagree Strongly
Disagree
Defining Giftedness
1 All students have potential to achieve
at higher levels.
45% (9) 55%
(11)
0 0
2 I have a clear understanding of gifted
characteristics.
30% (6) 55%
(11)
15% (3) 0
3 I have a clear understanding of the
components of a gifted education
curriculum.
15% (3) 35% (7) 50%
(10)
0
4 The district provides a clear definition
of what giftedness means.
10.5%
(2)
42.1 (8) 47.4%
(9)
0
Support of Parents, Teachers, and Students
5 Parents are made aware of the gifted
program in the district.
20% (4) 55%
(11)
20% (4) 5% (1)
6 The district provides adequate
support for teachers regarding
academic needs of gifted students in
the regular classroom.
10.5%
(2)
31.6%
(6)
57.9%
(11)
0
7 The district provides adequate
support for teachers regarding social-
emotional needs of gifted students.
5.3% (1) 26.3%
(5)
68.4%
(13)
0
8 The district provides adequate
support for students receiving gifted
services who are struggling to meet
program expectations.
5.3% (1) 63.2%
(12)
31.6%
(6)
0
Gifted Identification
9 The district has multiple pathways for
students to be enrolled into the gifted
program.
20% (4) 55%
(11)
20% (4) 5% (1)
10 The district’s gifted referral pathways
adequately identify students who
need gifted services.
11.1%
(2)
55.6%
(10)
27.8%
(5)
5.6% (1)
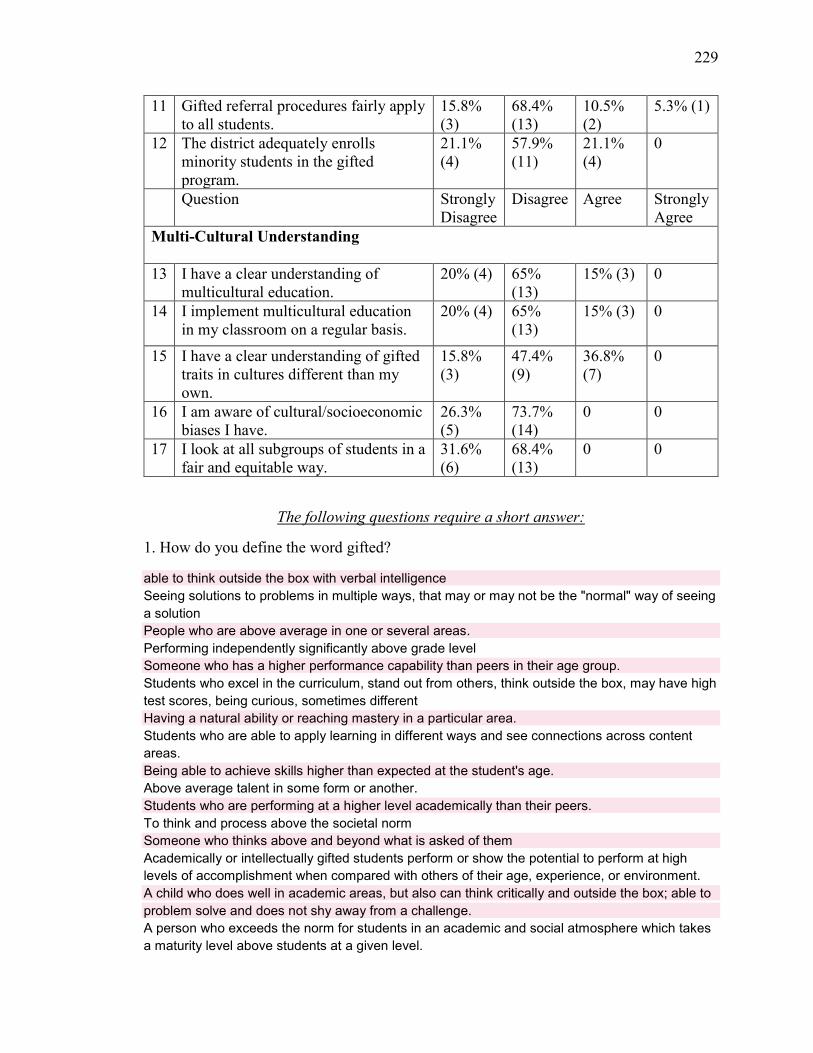
229
11 Gifted referral procedures fairly apply
to all students.
15.8%
(3)
68.4%
(13)
10.5%
(2)
5.3% (1)
12 The district adequately enrolls
minority students in the gifted
program.
21.1%
(4)
57.9%
(11)
21.1%
(4)
0
Question Strongly
Disagree
Disagree Agree Strongly
Agree
Multi-Cultural Understanding
13 I have a clear understanding of
multicultural education.
20% (4) 65%
(13)
15% (3) 0
14 I implement multicultural education
in my classroom on a regular basis.
20% (4) 65%
(13)
15% (3) 0
15 I have a clear understanding of gifted
traits in cultures different than my
own.
15.8%
(3)
47.4%
(9)
36.8%
(7)
0
16 I am aware of cultural/socioeconomic
biases I have.
26.3%
(5)
73.7%
(14)
0 0
17 I look at all subgroups of students in a
fair and equitable way.
31.6%
(6)
68.4%
(13)
0 0
The following questions require a short answer:
1. How do you define the word gifted?
able to think outside the box with verbal intelligence
Seeing solutions to problems in multiple ways, that may or may not be the "normal" way of seeing
a solution
People who are above average in one or several areas.
Performing independently significantly above grade level
Someone who has a higher performance capability than peers in their age group.
Students who excel in the curriculum, stand out from others, think outside the box, may have high
test scores, being curious, sometimes different
Having a natural ability or reaching mastery in a particular area.
Students who are able to apply learning in different ways and see connections across content
areas.
Being able to achieve skills higher than expected at the student's age.
Above average talent in some form or another.
Students who are performing at a higher level academically than their peers.
To think and process above the societal norm
Someone who thinks above and beyond what is asked of them
Academically or intellectually gifted students perform or show the potential to perform at high
levels of accomplishment when compared with others of their age, experience, or environment.
A child who does well in academic areas, but also can think critically and outside the box; able to
problem solve and does not shy away from a challenge.
A person who exceeds the norm for students in an academic and social atmosphere which takes
a maturity level above students at a given level.

230
2. What traits do you look for when recommending students for the AIG program?
personality, verbal and mental abilities
Creativity, logic and reasoning, critical thinking, deeper explanations
Students who show academic achievement above the expectation in one or several areas and
are motivated to learn.
Reasoning skills, mastery of above grade level work
Inquisitive, creative, risk taker, has an open mind
thinking outside the box, creative, critical thinking skills, high test scores, being curious, high level
vocabulary
Being in the EC department, I feel as if this survey does not apply to the area of which I'm gifted.
Creative thinking, high reading and math scores, critical thinking skills.
Ability to read and interpret what was read to a higher level and make references to other
learning.
Behavior, work ethic, and motivation.
A student who is performing significantly higher than their peers.
processing of multi-layered information and question strands, high proficiency
Students who tend to have a deeper understanding in literacy and can easily relate old concepts
to new concepts in math and implement different strategies for problems they have never seen
before.
performing 2 grade levels ahead of peers.
High EOG scores, high IQ, excellent performance in the classroom.
A maturity level in which the student is self motivated and looks for opportunities to advance his
academic and social growth associated with the given norms of other students in a like
atmosphere.
3. If a student has gifted potential, what factors might keep you from recommending them
for the AIG program?
behavior (2)
poor behavior, poor attitude
Extreme behaviors that would impede the learning of others. Lack of willingness to participate.
Many of my identified AIG students have trouble thinking for themselves and are not willing to try
new things.
severe behavior problems, unable to focus, laziness, not motivated
Severe behaviors
Behavior
none
Behavior, motivation
Maturity
sometimes-behavior limits
None
In the past I would say behavior but I have learned that their gifted potential may be a factor in the
behavior and they need the gifted services.
behavior and work habits
Personal maturity and a willingness to seek out other opportunities available.

231
4. What benefits do you see in using teacher referrals to help identify gifted students?
strongly ...they know the student better than anyone
It helps you to set aside those factors that keep you from recommending a student
There are lots of factors that should go into identification of students and data does not always
show.
teachers spend the majority of their day with these students and see their work across all subject
areas
Teachers work with their students every day and can see the process they use on a variety of
assignments and tasks. They see how they interact with their peers and how they tackle new
problems. Just seeing numbers on paper does not justify accepting/denying AIG services.
Teachers see students more often than gifted teachers, so they can give more insight the student
Teachers are able to identify first-hand the work of gifted students.
We are with them every day
I never have, I have only spoke to the AIG teacher about placing a student in. I had no clue there
was a referral process, I was never instructed on this.
More than just a test score, teachers see the full picture.
Teachers work with their students everyday and know them best.
you are able to process a wide range of gifted students in this fashion
Not all gifted students are great at test taking.
Testing is not always accurate.
I feel teacher referral is very important since he/she truly knows the potential of a given student.
many students are not strong test takers but very well may be quite gifted
Many students excel at test taking ability however, do not show the day to day drive necessary to
continue in an intense program necessary for a student to keep up with an intense program.
5. What disadvantages do you see in using teacher referrals to help identify gifted
students?
bias
Not all students fit the same criteria for being gifted
Teachers may favor students they know outside of school or teacher's kids.
teacher bias
Some teachers may not care for the learning styles of certain students, therefore not giving them
a fair chance to show their potential in the AIG program.
Sometimes people's opinions may not be accurate.
Many gifted students are not challenged in the regular classroom, and their teacher may think
that child is simply defiant or distracted.
Teachers not knowing the process or what the requirements are
Coming from other schools, I have one student that I believe should not be in the program
according to class assessments and work.
Bias
A teacher may have bias towards a student due to behavior and may not recommend them based
on behavior alone.
favorites among teachers always surface
Not all teachers understand what gifted is.
Teacher bias
personality conflicts

232
Teacher referrals is most important because the teacher she the habits on a day to day basis and
can identify a true AIG potential candidate.
6. What is does it mean to you to implement multicultural education?
na
To know and understand your own culture and make sure that you show multiple cultures when
you are teaching lessons. Students need to see themselves in the lesson. It's also great to
explore other cultures and beliefs to increase understanding of how other people live.
recognizing differences of students of different cultures and respecting their unique needs
Teaching to individual students' learning styles and embracing their differences. Creating a safe
learning environment for all learners.
Consider all cultures, being sensitive to and value all people, teach empathy and respect, using
global books, lessons, projects, activities, etc.
To reach students in the ways that are most familiar to their cultural environment and expose
other students to them.
Incorporating what your class in interested in or what supports their background knowledge.
Bringing in other cultures experiences and believes into what is being taught.
To teach other cultures and norms that are different then my own.
Including students’ different cultures in conversations and lessons
implementing cultural education other than my own
Incorporating instruction that relates to students from all backgrounds and students see others as
equal no matter where they come from or what they look like.
I think it is important for students to see and experience other cultures. Exposing students to
multicultural education helps students to see things in other perspectives.
Do and say what is acceptable to all cultures, and be mindful that all students are different and
come from all backgrounds.

233
Appendix M
Teacher Survey–Postintervention Treatment Group

234
Teacher Survey Questions
Please answer the following questions both honestly and to the best of your knowledge.
All responses will remain anonymous.
The following questions are Likert response questions:
Question Strongly
Agree
Agree Disagree Strongly
Disagree
Defining Giftedness
1 All students have potential to achieve
at higher levels.
73.3%
(11)
26.7%
(4)
0 0
2 I have a clear understanding of gifted
characteristics.
40% (6) 60% (9) 0 0
3 I have a clear understanding of the
components of a gifted education
curriculum.
28.6 %
(4)
64.3%
(9)
7.1% (1) 0
4 The district provides a clear definition
of what giftedness means.
42.9%
(6)
50% (7) 7.1% (1) 0
Support of Parents, Teachers, and Students
5 Parents are made aware of the gifted
program in the district.
26.7%
(4)
60% (9) 13.3%
(2)
0
6 The district provides adequate
support for teachers regarding
academic needs of gifted students in
the regular classroom.
20% (3) 60% (9) 20% (3) 0
7 The district provides adequate
support for teachers regarding social-
emotional needs of gifted students.
13.3%
(2)
53.3%
(8)
33.3%
(5)
0
8 The district provides adequate
support for students receiving gifted
services who are struggling to meet
program expectations.
20% (3) 60% (9) 20% (3) 0
Gifted Identification
9 The district has multiple pathways for
students to be enrolled into the gifted
program.
28.6%
(4)
71.4%
(10)
0 0
10 The district’s gifted referral pathways
adequately identify students who
need gifted services.
13.3%
(2)
66.7%
(10)
20% (3) 0

235
11 Gifted referral procedures fairly apply
to all students.
13.3%
(2)
73.3%
(11)
13.3%
(2)
0
12 The district adequately enrolls
minority students in the gifted
program.
35.7%
(2)
50% (5) 14.3%
(7)
0
Question Strongly
Disagree
Disagree Agree Strongly
Agree
Multi-Cultural Understanding
13 I have a clear understanding of
multicultural education.
13.3%
(2)
80%
(12)
6.7% (1) 0
14 I implement multicultural education
in my classroom on a regular basis.
20% (3) 66.7%
(10)
13.3%
(2)
0
15 I have a clear understanding of gifted
traits in cultures different than my
own.
6.7% (1) 73.3%
(11)
20% (3) 0
16 I am aware of cultural/socioeconomic
biases I have.
33.3%
(5)
66.7%
(10)
0 0
17 I look at all subgroups of students in a
fair and equitable way.
33.3%
(5)
60% (9) 6.7% (1) 0
The following questions require a short answer:
1. How do you define the word gifted?
Being able to answer higher level thinking questions. Being able to think through my answers with
prior knowledge
having strong strengths and academic characteristics in 1 or more area at a high level
Students with high intellectual, creative, artistic or other abilities that are a diverse group of
students with high potential and abilities.
A students who can excel and reach higher goals than their peers.
having a unique strength in an area academically, socially, creatively, and or mechanically
To be gifted means that students have academic or intellectual skills and abilities that are more
advanced in some aspect that an "average" peer.
Gifted is when a student has the ability to perform at a higher academic level than his/her peers
Students who have abilities above the typical student. All students have talents but not all
students are gifted. Gifted students usually see the world and problems differently.
Any special characteristics that a student exhibits.
Areas that need further challenging and are ready for pushing forward
Significantly above average performance in one or more areas.
Excelling in any academic/creative area
A student who shows the ability to move deeper into or across the curriculum.
2. What traits do you look for when recommending students for the AIG program?

236
Students who understand a concept easily, who want more challenging assignments. Who
someone’s seem bored or don’t want to do the work.
high test scores, boredom, students need to be challenged, students that work comes easy for,
students with growth mindset, academic skills that come easy with minimal or no teaching
needed, high retention rates, possible EC students
problem solving, thinking and reasoning that goes beyond the norm in an area/skill level
above average work in the classroom, higher level thinking
creative thinking, higher vocabulary, makes connections to things not usually found among others
Students' creativity, problem solving skills, and ability to persevere through challenges.
Problem solving skills, academic performance, growth
Students who look at problems in unique ways. I look for students who look to power through
problems and do not give up.
Hard working, creative, smart, organized etc.
Students that have traits to require more rigorous attention academics or emotional with higher
levels than an average student
Drive and potential to succeed
Students that excel in a particular area
The willingness or eagerness to do more or go above & beyond what the lesson requires. I also
look for other characteristics that fit other gifted profiles that may not appear as positive or where
a student may be more withdrawn.
3. If a student has gifted potential, what factors might keep you from recommending them
for the AIG program?
Behavior
low work ethic, non-growth mindset attitute
none, if a student has gifted potential then as the teacher you are denying services if you do not
reccomend them.
behavior
none, other than if the giftedness cannot be measured to qualify him or her
If students are not able to work independently or be responsible enough to handle the challenges
of AIG's academics but also organizational needs.
Behavior and/or ability to handle that program emotionally
If the student is incapable of applying themselves or giving their best
If they are a behavior problem. That time is limited and you don’t want behavior problem to waste
the time of all the other students.
Some students have parents that do not want them involved, behavior tendencies, inconsistency
in performance
Nothing that I can think of.
none
Parent input, academic performance/effort
4. What benefits do you see in using teacher referrals to help identify gifted students?
A teachers sees on a daily basis what a test can I show... determination and persistence
It gives students who may not be able to pass the test (because of language barriers) another
chance at being in the program for subjects like math.
teachers know students the best and can see potential where others can not see it
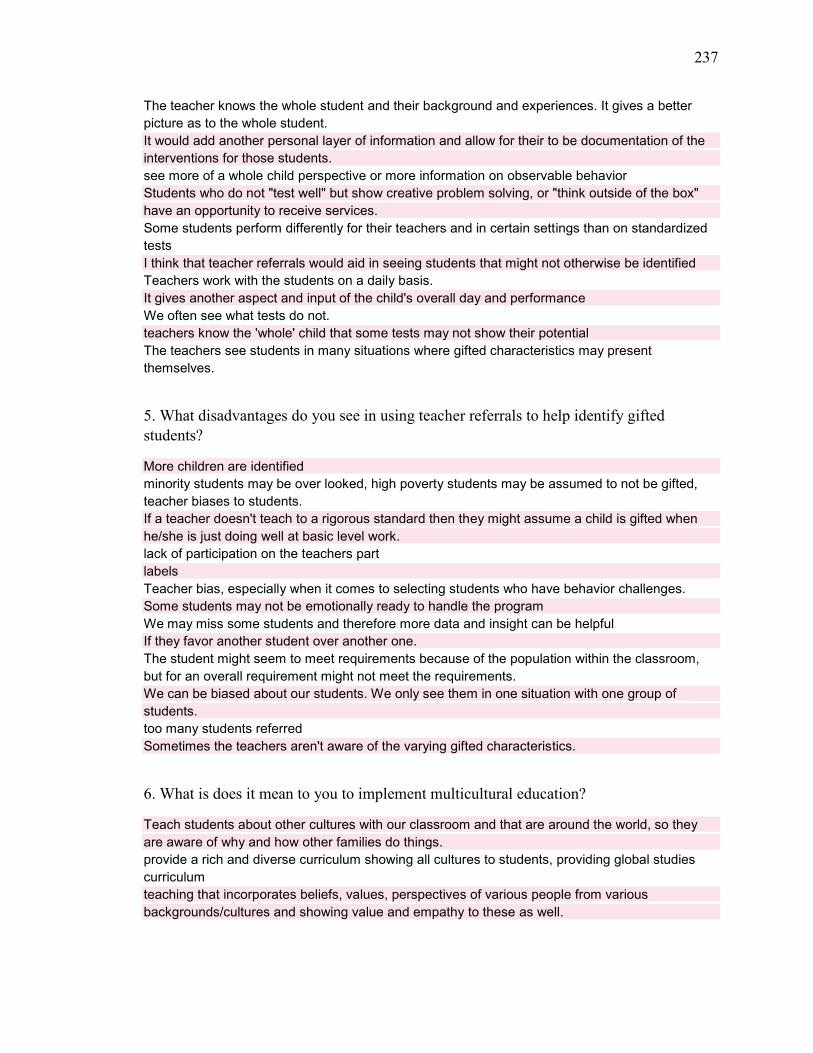
237
The teacher knows the whole student and their background and experiences. It gives a better
picture as to the whole student.
It would add another personal layer of information and allow for their to be documentation of the
interventions for those students.
see more of a whole child perspective or more information on observable behavior
Students who do not "test well" but show creative problem solving, or "think outside of the box"
have an opportunity to receive services.
Some students perform differently for their teachers and in certain settings than on standardized
tests
I think that teacher referrals would aid in seeing students that might not otherwise be identified
Teachers work with the students on a daily basis.
It gives another aspect and input of the child's overall day and performance
We often see what tests do not.
teachers know the 'whole' child that some tests may not show their potential
The teachers see students in many situations where gifted characteristics may present
themselves.
5. What disadvantages do you see in using teacher referrals to help identify gifted
students?
More children are identified
minority students may be over looked, high poverty students may be assumed to not be gifted,
teacher biases to students.
If a teacher doesn't teach to a rigorous standard then they might assume a child is gifted when
he/she is just doing well at basic level work.
lack of participation on the teachers part
labels
Teacher bias, especially when it comes to selecting students who have behavior challenges.
Some students may not be emotionally ready to handle the program
We may miss some students and therefore more data and insight can be helpful
If they favor another student over another one.
The student might seem to meet requirements because of the population within the classroom,
but for an overall requirement might not meet the requirements.
We can be biased about our students. We only see them in one situation with one group of
students.
too many students referred
Sometimes the teachers aren't aware of the varying gifted characteristics.
6. What is does it mean to you to implement multicultural education?
Teach students about other cultures with our classroom and that are around the world, so they
are aware of why and how other families do things.
provide a rich and diverse curriculum showing all cultures to students, providing global studies
curriculum
teaching that incorporates beliefs, values, perspectives of various people from various
backgrounds/cultures and showing value and empathy to these as well.

238
Include all types of cultures and learning styles, having sensitivity toward students and parents
different than yourself or others in your class, and allow them to share ideas from their culture
and learn from them.
bringing experiences and knowledge from different cultures to build awareness and broaden
perspective of our students
Making school relevant to each student based on what they value. Using different cultures to help
define what it means to be "successful" in a school setting.
Modeling how to accept and include all cultures and exposing children to the different cultures of
the world
It means giving options in instruction that can interest students of all cultures to meet their
academic needs and interests. We also need to not make assumptions about what students are
interested in based on culture. By leaving it up to choice we are creating an opportunity for
discovery.
Eduction that all students benefit from and materials and strategies that meet the needs of all
diverse learning styles and cultures.
You expose, education, incorporate different cultures within the daily teachings
To be knowledgeable about how other cultures act in the classroom.
teaching with all cultures in mind, having open discussions that show multiple view points, letting
students be proud of their cultures and share when relevant
To allow my instruction to reach and apply to all students. I realize that when implementing
multicultural instruction, I must go beyond my own experiences and appeal to those with differing
backgrounds, socioeconomic statuses, gender, races, and ethnicity using books, videos and
activities.

239
Appendix N
Panorama Education Survey Results–Fall

240
Question
#
Question Fall
Treatment
Positive
Responses
Fall
Treatment
Negative
Responses
Fall
Comparis
on
Positive
Response
s
Fall
Comparis
on
Negative
Response
s
1 How excited are
you about going to
your classes?
67%
(36)
33%
(18)
73.64%
(81)
26.36%
(29)
2 How positive or
negative is the
energy of the
school?
93.47%
(43)
6.53%
(3)
86.73%
(85)
13.27%
(13)
3 In your classes,
how excited are
you to participate?
70.37%
(38)
29.63%
(16)
71.05%
(81)
28.95%
(33)
4 How fair or unfair
are the rules for
the students at this
school?
82.35%
(42)
17.65%
(9)
78%
(78)
22%
(22)
5 At your school,
how much does
the behavior of
other students hurt
or help your
learning?
65%
(26)
35%
(14)
48.05%
(37)
51.95%
(40)
6 When you are not
in school, how
often do you talk
about ideas from
your classes?
55.56%
(30)
44.44%
(24)
49.12%
(56)
50.88%
(58)
7 How often do your
teachers seem
excited to be
teaching your
classes?
77.78%
(42)
22.22%
(12)
76.32%
(87)
23.68%
(27)
8 How focused are
you on the
84.91%
(45)
15.09%
(8)
82.30%
(93)
17.70%
(20)

241
activities in your
classes?
9 How interested are
you in your
classes?
70.37%
(38)
29.63%
(16)
72.57%
(82)
27.43%
(31)
10 If you fail at an
important goal,
how likely are you
to try again?
92.59%
(50)
7.41%
(4)
84.96%
(96)
15.04%
(17)
11 If you have a
problem while
working towards
an important goal,
how well can you
keep working?
83.33%
(45)
16.67%
(9)
82.30%
(93)
17.70%
(20)
12 When you are
working on a
project that
matters a lot to
you, how focused
can you stay when
there are lots of
distractions?
59.26%
(32)
40.94%
(22)
59.65%
(68)
40.35%
(46)
13 How often do you
stay focused on
the same goal for
more than 3
months at a time?
61.11%
(33)
38.89%
(21)
56.64%
(64)
43.36%
(49)

242
Appendix O
Panorama Education Survey Results–Spring

243
Question
#
Question Spring
Treatment
Positive
Responses
Spring
Treatment
Negative
Responses
Spring
Comparison
Positive
Responses
Spring
Comparison
Negative
Responses
1 How excited
are you about
going to your
classes?
54.35%
(24)
45.65%
(21)
52.68%
(59)
47.32%
(53)
2 How positive
or negative is
the energy of
the school?
84.21%
(32)
15.78%
(6)
84.04%
(79)
15.96%
(15)
3 In your classes,
how excited are
you to
participate?
56.52%
(26)
43.48%
(20)
56.76%
(63)
43.24%
(48)
4 How fair or
unfair are the
rules for the
students at this
school?
91.67%
(33)
8.33%
(3)
64.95%
(63)
35.05%
(34)
5 At your school,
how much does
the behavior of
other students
hurt or help
your learning?
48.39%
(15)
51.61%
(16)
32.35%
(22)
67.65%
(46)
6 When you are
not in school,
how often do
you talk about
ideas from your
classes?
60.87%
(28)
39.13%
(18)
64.29%
(72)
35.71%
(40)
7 How often do
your teachers
seem excited to
be teaching
your classes?
73.91%
(34)
26.09%
(12)
70.27%
(78)
29.73%
(33)

244
8 How focused
are you on the
activities in
your classes?
86.67%
(39)
13.33%
(6)
75.45%
(83)
24.55%
(27)
9 How interested
are you in your
classes?
56.52%
(26)
43.48%
(20)
63.39%
(71)
36.61%
(41)
10 If you fail at an
important goal,
how likely are
you to try
again?
78.26%
(36)
21.74%
(10)
79.46%
(89)
20.54%
(23)
11 If you have a
problem while
working
towards an
important goal,
how well can
you keep
working?
76.09%
(35)
23.91%
(11)
65.18%
(73)
34.82%
(39)
12 When you are
working on a
project that
matters a lot to
you, how
focused can
you stay when
there are lots of
distractions?
66.67%
(30)
33.33%
(15)
52.68%
(59)
47.32%
(53)
13 How often do
you stay
focused on the
same goal for
more than 3
months at a
time?
58.70%
(27)
41.30%
(19)
38.39%
(43)
61.61%
(69)