
Nuclear Pollution, Local and Regional Scale Transport and Dispersion Modeling: A Case Study of the...
16
Abstract—In this study, the local and regional scale transport and dispersion of radionuclides released during the 2011 Fukushima Daiichi Nuclear accident was modeled using the HYSPLIT model. Cesium-137 was chosen as the target pollutant due to its long half-life and its effects on man and the environment at large. The transport and dispersion was modeled for the first week after the accident since it was the period of peak emission and deposition. The model outputs show that peak deposition period was March 14-15, 2011, with ground level activities in the range of 10 3 – 10 6 Bq/m 2 . The affected parts of Japan mainland include Fukushima, Ibaraki, Tochigi, Saitama, Gunma, Chiba, and Tokyo Prefectures. The area northwest of the plant up to a distance of about 50 km shows the highest level of radioactive Simisola Ogundugba is with Environmental Engineering Department, Cyprus International University, Lefkosa via Mersin, Turkey (e- mail: [email protected]). deposition. Using appropriate dose conversion factor, the received dose within the first year after the accident was also estimated. Keywords— Accident, Dispersion, Nuclear, Hysplit. I.INTRODUCTION ue to the nature of radioactive materials, a major reactor accident in a nuclear power plant can lead to a catastrophe for people and the environment at large. By definition, a major reactor accident would involve the severe overheating and subsequent melting of the nuclear reactor core, which would cause a release of substantial quantity of radioactive materials, after breaching several barriers, into the environment. The major health and environmental threat would be due to the escape of the fission products to the atmosphere, from where they can be transported over long distances across trans- national boundaries. D Radioactive Pollution, Local and Regional Scale Transport and Dispersion Modeling: A Case Study of the Fukushima Nuclear Accident. Simisola Ogundugba, and Oluwadara Oke
Transcript of Nuclear Pollution, Local and Regional Scale Transport and Dispersion Modeling: A Case Study of the...
Abstract—In this study, the local and
regional scale transport and
dispersion of radionuclides released
during the 2011 Fukushima Daiichi
Nuclear accident was modeled using
the HYSPLIT model.
Cesium-137 was chosen as the target
pollutant due to its long half-life
and its effects on man and the
environment at large. The transport
and dispersion was modeled for the
first week after the accident since
it was the period of peak emission
and deposition. The model outputs
show that peak deposition period was
March 14-15, 2011, with ground level
activities in the range of 103 – 106
Bq/m2. The affected parts of Japan
mainland include Fukushima, Ibaraki,
Tochigi, Saitama, Gunma, Chiba, and
Tokyo Prefectures. The area
northwest of the plant up to a
distance of about 50 km shows the
highest level of radioactive
Simisola Ogundugba is with EnvironmentalEngineering Department, Cyprus InternationalUniversity, Lefkosa via Mersin, Turkey (e-mail: [email protected]).
deposition. Using appropriate dose
conversion factor, the received dose
within the first year after the
accident was also estimated.
Keywords— Accident, Dispersion,Nuclear, Hysplit.
I.INTRODUCTIONue to the nature of radioactive
materials, a major reactor
accident in a nuclear power plant
can lead to a catastrophe for people
and the environment at large. By
definition, a major reactor accident
would involve the severe overheating
and subsequent melting of the
nuclear reactor core, which would
cause a release of substantial
quantity of radioactive materials,
after breaching several barriers,
into the environment. The major
health and environmental threat
would be due to the escape of the
fission products to the atmosphere,
from where they can be transported
over long distances across trans-
national boundaries.
D
Radioactive Pollution, Local and Regional Scale Transport and
Dispersion Modeling: A Case Study of the Fukushima Nuclear
Accident.
Simisola Ogundugba, and Oluwadara Oke
The disaster that struck Japan’s
FDNPP-1 on March 11, 2011, caused
the most significant release of
radioactivity since that of
Chernobyl, Ukraine 1986 and was far
worse than the 1979 Three Mile
Island accident in USA. Unlike at
Chernobyl and Three Mile Island, the
disaster at Fukushima was initiated
by natural occurrence rather than
equipment failure and human error
although study on the plant reveals
some subtle design errors. At 14:46
JST on March 11, 2011 a magnitude
9.0 earthquake hit the pacific
shores of North-Eastern Japan
causing a shutdown of FDNPP-1 units
1, 2 and 3. Units 4, 5 and 6 were in
their periodic maintenance stages
[16].
After shutdown, the emergency diesel
generators (DG) started
automatically but at 15:27 JST, a
14-15m tsunami hit the coast
followed by high waves until 15:41
on the same day. All the DGs except
one in the unit 6 reactor building
were lost. This is due to the fact
that the failed DGs were installed
in the basement of the turbine
buildings. Therefore, the core
cooling function was basically lost
for units 1, 2 and 3 as well as the
fuel pool cooling function for these
units.
Because heat removal systems failed,
pressure built up to high levels in
the primary containments of units 1
through 3. The containments were
vented to the atmosphere to relieve
the pressure, allowing the escape of
radioactivity leaking from the
reactor cores.
A chemical reaction between the
fuel’s zirconium cladding and high-
temperature steam is believed to
have generated large amounts of
hydrogen in the containments of
units 1 through 3.
(1)
The hydrogen leaked from the
containments or the venting systems
into the reactor buildings and
caused large explosions in units 1,
3, and 4 [16].
The loss of cooling also affectedthe plant’s spent fuel pools whichhold fuel rods that have beenremoved from the reactors aftertheir ability to sustain a nuclearchain reaction has greatly reduced.Although much of the radioactivityin the spent fuel has been decayingfor many years, the large volumes ofspent fuel in the pools represent a

significant source of radioactivity.If water in the spent fuel poolsboils away or leaks out, the spentfuel rods may overheat and releaseradioactive material into the air.However, the explosions of reactorbuildings 1, 3, and 4 exposed thosepools to the atmosphere, and debrisfrom the explosions may have falleninto the pools and damaged thestored fuel [27].Cesium-137 is among the most common
heavy fission products. Fission of
various isotopes of thorium,
uranium, and plutonium all generate
about 6% Cesium-137 [18]. This high
fission yield results in an
abundance of cesium-137 in spent
nuclear fuel, as well as in regions
polluted by fission byproducts after
nuclear accidents [19]. The large
quantities of cesium-137 produced
during fission events pose a
persistent hazard. Its half-life of
about 30 years is long enough that
objects and regions contaminated by
cesium-137 remain dangerous to
humans for a generation or more, but
it is short enough to ensure that
even relatively small quantities of
cesium-137 release dangerous doses
of radiation (its specific
radioactivity is 3.2 × 10¹² Bq/g)
[19], [15].
Fig. 1: Decay Scheme of Cesium-137
II. ATMOSPHERIC DISPERSION ANDRADIONUCLIDE RELEASE
A. Theoretical and Physical Basis for DispersionAtmosphere is the most important
pathway for the long-range transport
of radio-nuclides released from a
nuclear accident. IAEA -Tecdoc 379
(1986) explains atmospheric
dispersion phenomenon, atmospheric
dispersion model and features of the
atmosphere affecting the dispersion
in this way: Atmospheric dispersion
is the transport of the effluent by
winds and the subsequent diffusion
by atmospheric turbulence. An
atmospheric dispersion model is a
mathematical relationship between
the rate of effluent release and the
distribution of its concentration in

the atmosphere. The generic equation
for isotropic dispersion is given
as:
(2)
Where: C is downwind concentration (Bq/m3)Q is emission rate (Bq/hr)U is wind speed (m/s) σy, σz are dispersion coefficients dependent on atmospheric stabilityH is the effective emission height (m)x, y, z are the plume coordinates
The factors contributing the
dispersion may be divided into
transport and trajectory process
(advection); diffusion by turbulent
eddies; and modifying process e.g.
depletion.
A. Transport and Trajectory Process
Most models consider the source to
be an ideal point source that is not
accompanied by energy release and
which does not have a significant
effect on atmospheric conditions.
However real sources are of finite
size and have momentum and buoyancy.
There is the initial kinetic energy
due to initial discharge energy and
the thermal energy when the
temperature of the effluents is
above normal atmospheric
temperature. This causes the
pollutant air mass to rise above its
release point while dispersing at
the same time. These effects are
important in regions near to the
source. For longer distances, the
ideal point source assumption is
more accurate for radionuclide
releases.
Puff is a term, which is used in
models that follows the movement of
air masses. A puff of a pollutant
released to the atmosphere travels
along the wind direction and
develops into a continuously
expanding cloud due to turbulent
eddies. The centers of mass of a
series of continuous puffs define a
plume trajectory. Its trajectory is
determined by the wind field and its
variation with time [19].
B. Diffusion by Turbulent Eddies
Wind speed and direction varies
continuously with time in three
dimensions. A long-term wind
direction record shows a summation
of rapid changes. This fluctuation
is referred to as turbulence and is
a basic feature of the atmospheric

transport responsible for eddy
diffusion. The part of the eddy size
spectrum taking part in the
diffusion process depends upon the
size of the cloud of dispersing
material. Eddies much smaller than
the cloud or plume size cause a
minor redistribution of the effluent
within the plume, while eddies much
larger than the plume or cloud cause
it to be bodily shifted without
altering the concentration
distribution inside the plume. As
the cloud travels downwind, the
scale of eddy motion responsible for
atmospheric diffusion increases
continuously [11].
C. Modifying Process (Atmospheric
Removal)
Process removing radionuclides from
the atmosphere and interaction of
nuclides with the earth’s surface
are very important for modeling
atmospheric transport and
consequences of nuclear accidents.
Especially for long-term
consequences, the amount of
deposited radioactivity contributes
more to the total dose received by
humans than the direct exposure from
the plume [1]. Three basic removal
processes contributing to further
depletion of activity are dry
deposition, wet deposition and
radioactive decay.
Dry deposition plays an important
role for most of the radionuclides
except noble gases. Different
materials have different dry
deposition velocities on different
surfaces. Dry deposition rate also
depends on weather conditions in
terms of wind speed and atmospheric
stability. Gravitational settling
has a significant effect on dry
deposition especially for heavy
particles (radius >1 μm) [1].
Radioactive materials can also be
deposited by the action of rain and
it is generally known as ‘wet
deposition’. Two separate processes,
termed washout and rainout, may be
considered. Washout is the
deposition of material by raindrops
falling through a plume (below-cloud
removal) while rainout is removal of
material embedded in raindrops
within the cloud (in-cloud removal).
Both rain and snow can remove
materials from the atmosphere. It is
shown that the washout coefficient
strongly depends on the size of the
particle. This factor, however, is
not included in most atmospheric
dispersion models [1]. Radioactive
decay effect is also treated for the
whole group of nuclides in the
formulation of radioactive chains
when the daughter nuclides are borne
and will grow in the plume with a
decay of the parent nuclides [11],
[20].
III.FEATURES OF THE LONG RANGETRANSPORTAs material dispersion takes place
over longer distances its motion is
affected by larger areas of the
atmosphere and features not
considered in short range modeling
have to be taken into consideration.
According to the IAEA Tecdoc-379
these include:
(i) Vertical changes of atmospheric
conditions encountered as plumes
grow, including wind direction shear
and the presence of elevated
inversions.
(ii) The variations in atmospheric
conditions, such as wind velocity,
stability and mixing layer depth
during the movement of the plume.
(iii) The spatial variation of
atmospheric conditions which means
that data obtained at a single
meteorological situation near the
release point may not quite
represent the conditions over the
region through which the plume is
dispersing.
IV.DESCRIPTION OF THE HYSPLIT MODELHySPLIT, Hybrid Single Particle
Lagrangian Integrated Transport
model was developed in NOAA Air
Resources Laboratory in the United
States for modeling the trajectories
of air parcels, or the transport,
dispersion, and deposition of
pollutants [4]. The inputs needed
for HySPLIT calculations are
pollutant species properties,
emission parameters, gridded
meteorological fields and output
deposition grid definitions. The
horizontal deformation of the wind
field, the wind shear, and the
vertical diffusivity profile are
used to compute dispersion rate.
Gridded meteorological data are
required for regular time intervals.
The meteorological data fields may
be provided on one of the different
vertical coordinate system:
Pressure-sigma, pressure-absolute,
terrain-sigma or a hybrid absolute-
pressure-sigma. The model has the
ability to treat the pollutant as
particles, or Gaussian puffs, or as
top/hat puffs. The term Hybrid
refers to the additional
capabilities of HySPLIT to treat the
pollutant as Gaussian or top/hat
puff in the horizontal while
treating the pollutant as a particle
for the purposes of modeling the
vertical dispersion. A key benefit
of this hybrid model is that the
higher dispersion accuracy of the
vertical particle treatment is
combined with the spatial resolution
benefits of horizontal puff
splitting.
V.METHODOLOGYA. Study PeriodRegarding the nature of this
accident, there was core meltdown
and it is certain that there will be
continuous release of radioactivity
to the environment over a long
period of time via the pathways of
air, water and land [11]. It is
however expedient to investigate the
periods of high and significant
release of radioactivity as this
will cause the highest radiological
consequences on the affected
population in the local, regional
and even global scale. Many of the
reviewed literature uphold the
premise that most of the significant
radioactive release occurred within
the first week after the accident.
it was within this period that
primary containment venting was
carried out in units 1 and 3, and it
was also this same period that the
hydrogen explosions took place in
units 1, 3, and 4 [8], [16], [21],
[25]. In lieu of the reliable facts
presented in the literature, the
first week after the accident from
12-19 March, 2011 is chosen as the
study period
B. Meteorological Input DataThere exist different meteorological
input fields available for use in
Hysplit. This study however uses the
National Weather Service’s National
Centers for Environmental Prediction
(NCEP)'s Global Data Assimilation
System (GDAS) in the Unites States
as the meteorological input data.
The upper air data field include
temperature in [ºK], u and w wind
speed component with respect to grid
in [m/s], pressure vertical velocity
in [hPa/s], geopotential height
[gpm] and vertical humidity [%]. The
surface data fields provided are 2 m
temperature in [ºK], 10 m u and w
components in [m/s], surface
pressure in [hPa], surface
temperature in [ºK], total
precipitation (6 hr accumulation) in
[m], momentum flux u-component at
surface in [N/m2], momentum flux v-
component at surface in [N/m2],
sensible heat net flux at surface in
[ W/m2], latent heat net flux at
surface in [W/m2], downward short
wave radiation flux at surface in
[ W/m2], relative humidity at 2 m
AGL in [ % ], volumetric soil
moisture content fraction of layer
0-10 cm below ground in [fraction],
total cloud cover for entire
atmosphere in [%].
D. Source Term
There are uncertainties surrounding
the actual release rates of the
radionuclides especially during the
early phase of the accident but were
assumed to be the same as the values
recorded at around 21:00 JST on
March 14 (Terada et al., 2012).
Several literature quotes various
source term estimates at different
periods after the accident for some
key radionuclides such as Cs-137, I-
131 and Xe-133 [8], [21], [22].
However the most comprehensive
estimate is seen in the works of
Stohl et al., 2012 which reports the
estimated activities in both the
reactor core units and the spent
fuel pools as at the time of the
accident, when the chain reaction in
the operating reactors was stopped.
The release rate of Cs-137 adopted
for the model run is calculated from
these estimated activities. HySPLIT
model is run using a point source
and as such the releases from the
reactor cores and the spent fuel
pools will be treated as a single
cumulative point source averaged
over the entire study period.
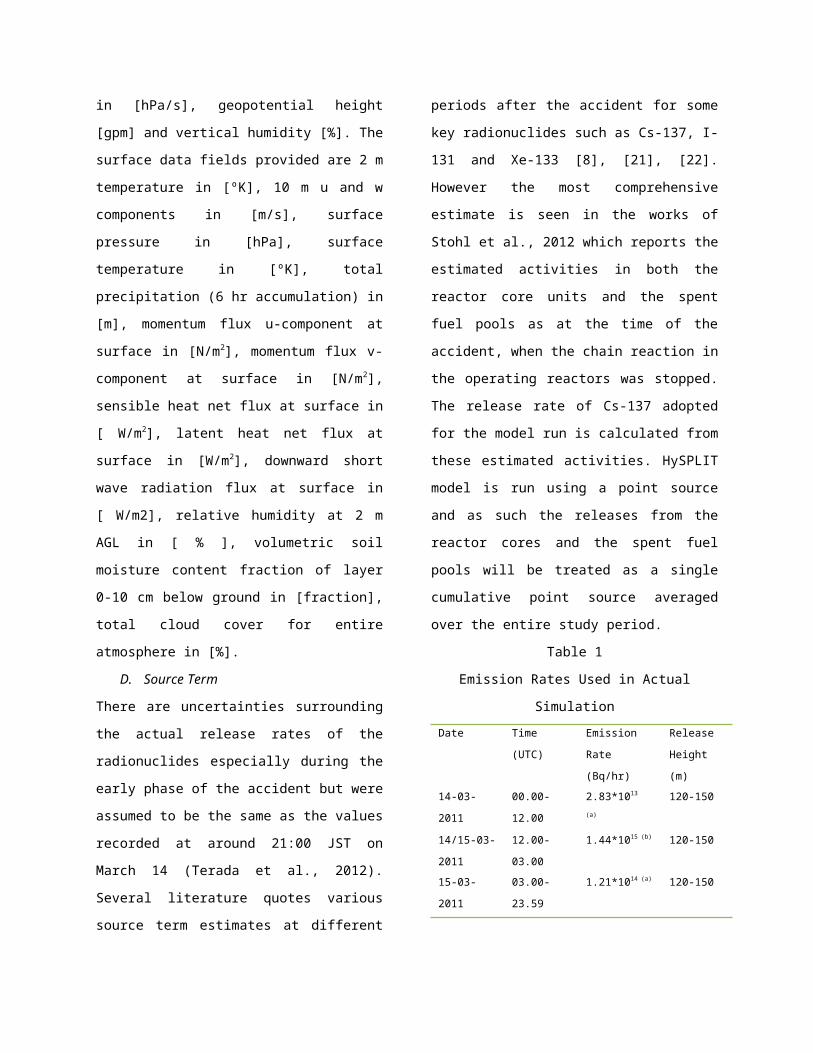
Table 1
Emission Rates Used in Actual
SimulationDate Time
(UTC)
Emission
Rate
(Bq/hr)
Release
Height
(m)14-03-
2011
00.00-
12.00
2.83*1013
(a)
120-150
14/15-03-
2011
12.00-
03.00
1.44*1015 (b) 120-150
15-03-
2011
03.00-
23.59
1.21*1014 (a) 120-150
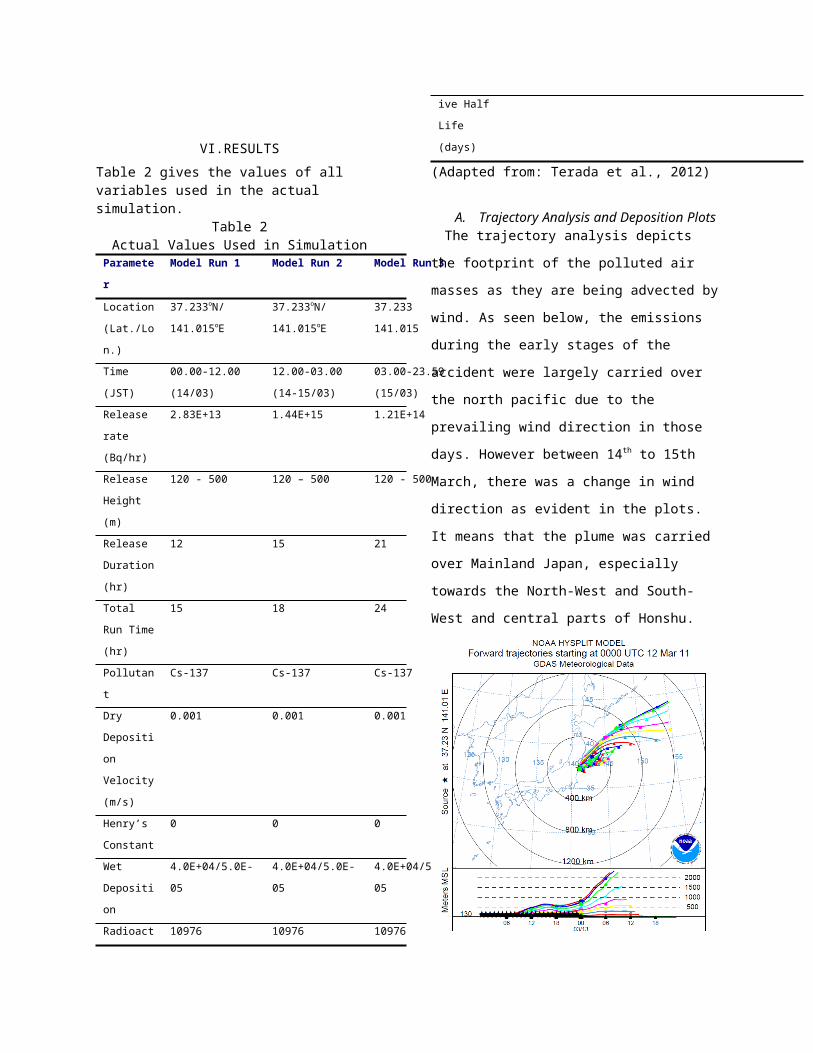
VI.RESULTSTable 2 gives the values of all variables used in the actual simulation.
Table 2Actual Values Used in Simulation
Paramete
r
Model Run 1 Model Run 2 Model Run 3
Location
(Lat./Lo
n.)
37.233oN/
141.015oE
37.233oN/
141.015oE
37.233
141.015
Time
(JST)
00.00-12.00
(14/03)
12.00-03.00
(14-15/03)
03.00-23.59
(15/03)
Release
rate
(Bq/hr)
2.83E+13 1.44E+15 1.21E+14
Release
Height
(m)
120 - 500 120 – 500 120 - 500
Release
Duration
(hr)
12 15 21
Total
Run Time
(hr)
15 18 24
Pollutan
t
Cs-137 Cs-137 Cs-137
Dry
Depositi
on
Velocity
(m/s)
0.001 0.001 0.001
Henry’s
Constant
0 0 0
Wet
Depositi
on
4.0E+04/5.0E-
05
4.0E+04/5.0E-
05
4.0E+04/5.0E-
05
Radioact 10976 10976 10976
ive Half
Life
(days)
(Adapted from: Terada et al., 2012)
A. Trajectory Analysis and Deposition PlotsThe trajectory analysis depicts
the footprint of the polluted air
masses as they are being advected by
wind. As seen below, the emissions
during the early stages of the
accident were largely carried over
the north pacific due to the
prevailing wind direction in those
days. However between 14th to 15th
March, there was a change in wind
direction as evident in the plots.
It means that the plume was carried
over Mainland Japan, especially
towards the North-West and South-
West and central parts of Honshu.
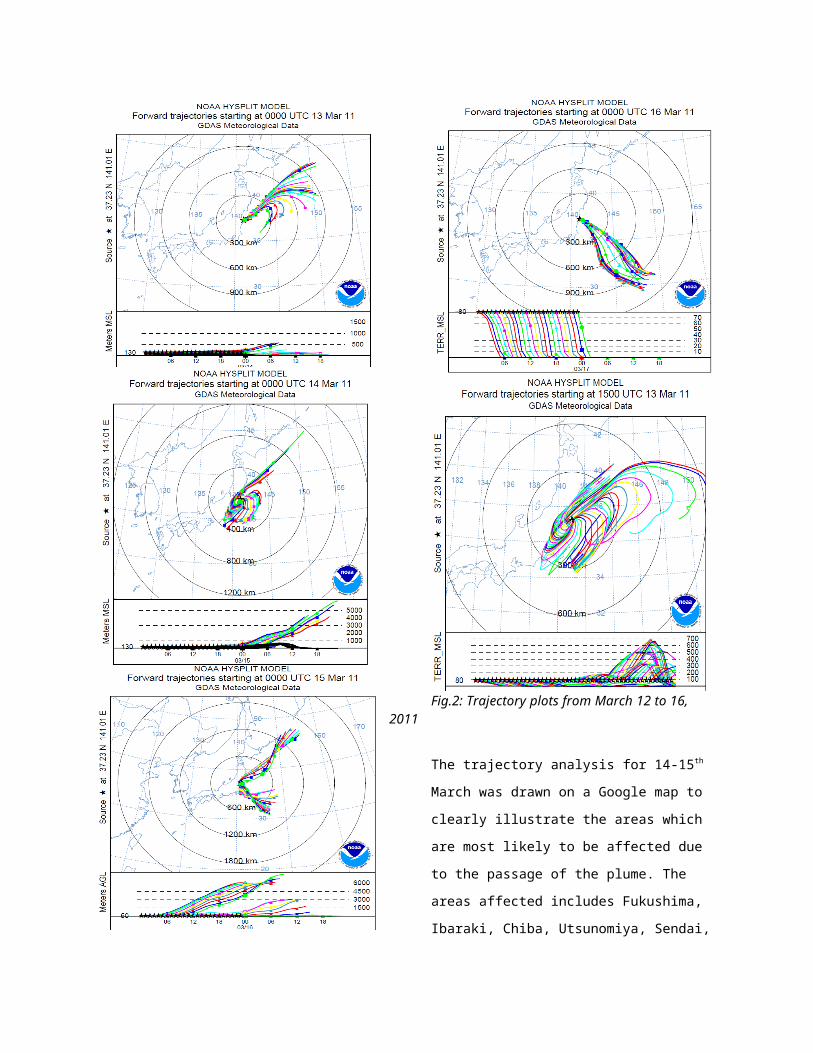
Fig.2: Trajectory plots from March 12 to 16, 2011
The trajectory analysis for 14-15th
March was drawn on a Google map to
clearly illustrate the areas which
are most likely to be affected due
to the passage of the plume. The
areas affected includes Fukushima,
Ibaraki, Chiba, Utsunomiya, Sendai,

Yokohama, Tokyo; spanning a radius
of about 300km around the power
plant.
Fig.3: Google Earth Plot of March 14-15
Trajectory
Fig.4: Google Earth Plot of Model Run 2
Fig.5: Google Earth plot of Model Run 3
The radioactive plume emitted from
FDNPP-1 first flowed towards the
North Pacific Ocean. The high-
concentration emission due to the
hydrogen explosion which occurred in
Unit-1 on March 12 was carried in
the North-Northwest direction from
the plant and caused a high amount
of dry deposition.
Another hydrogen explosion which
occurred on 14 March led to the
release of high-concentration plume
which started to flow in the South-
Southwest direction from the plant,
causing dry deposition along the
south-eastern area of Fukushima, and
Ibaraki prefectures. This plume
successfully dispersed and caused
widespread dry deposition reaching
far to Tokyo, Saitama, and Kanagawa
Prefectures although the extent was
not as high as those in the former
areas.
From the afternoon of March 15,
there was precipitation observed
widely across eastern Japan. This
precipitation encountered the
passing plume and this caused a high
amount of wet deposition mostly
concentrated around the area
Northwest direction from the FDNPP-
1.
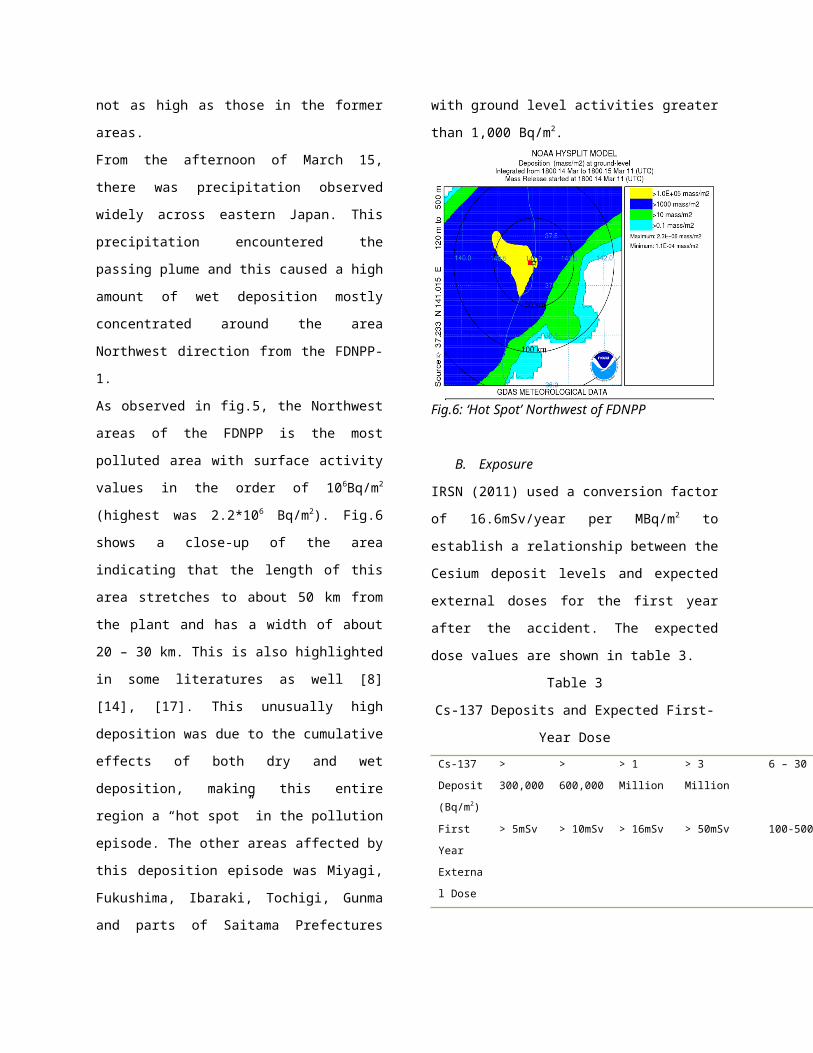
As observed in fig.5, the Northwest
areas of the FDNPP is the most
polluted area with surface activity
values in the order of 106Bq/m2
(highest was 2.2*106 Bq/m2). Fig.6
shows a close-up of the area
indicating that the length of this
area stretches to about 50 km from
the plant and has a width of about
20 – 30 km. This is also highlighted
in some literatures as well [8]
[14], [17]. This unusually high
deposition was due to the cumulative
effects of both dry and wet
deposition, making this entire
region a “hot spot” in the pollution
episode. The other areas affected by
this deposition episode was Miyagi,
Fukushima, Ibaraki, Tochigi, Gunma
and parts of Saitama Prefectures
with ground level activities greater
than 1,000 Bq/m2.
Fig.6: ‘Hot Spot’ Northwest of FDNPP
B. Exposure
IRSN (2011) used a conversion factor
of 16.6mSv/year per MBq/m2 to
establish a relationship between the
Cesium deposit levels and expected
external doses for the first year
after the accident. The expected
dose values are shown in table 3.
Table 3
Cs-137 Deposits and Expected First-
Year DoseCs-137
Deposit
(Bq/m2)
>
300,000
>
600,000
> 1
Million
> 3
Million
6 – 30 Million
First
Year
Externa
l Dose
> 5mSv > 10mSv > 16mSv > 50mSv 100-500mSv
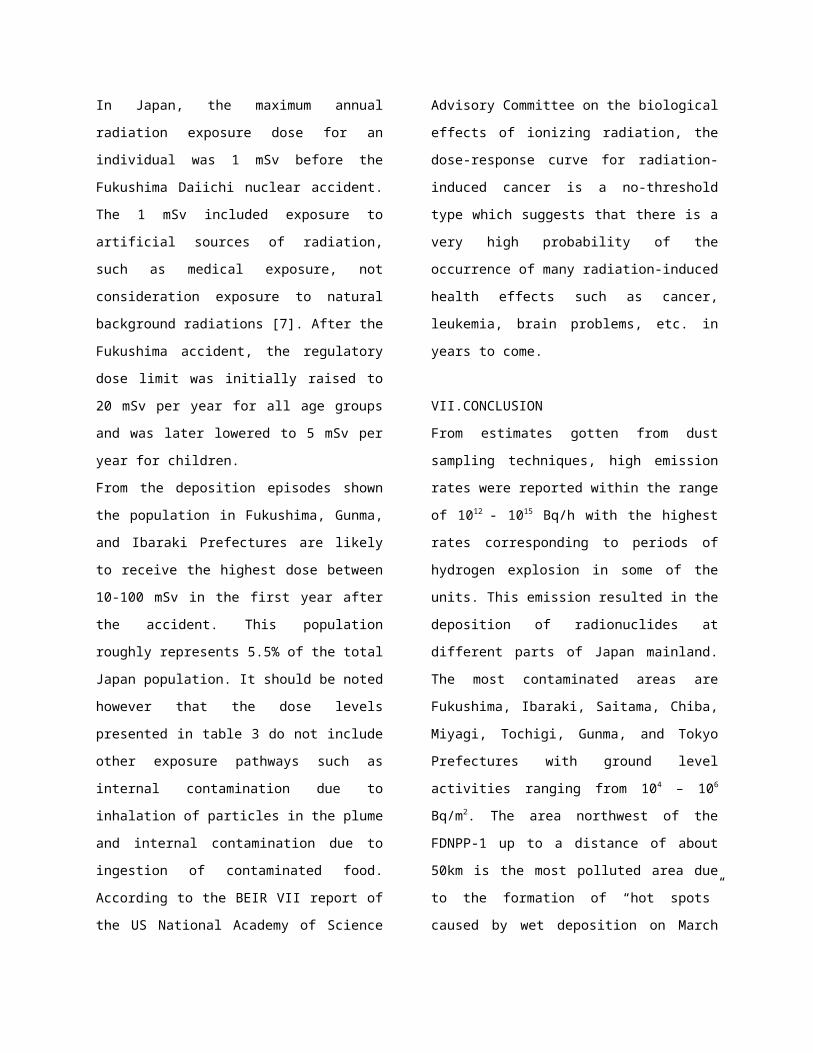
In Japan, the maximum annual
radiation exposure dose for an
individual was 1 mSv before the
Fukushima Daiichi nuclear accident.
The 1 mSv included exposure to
artificial sources of radiation,
such as medical exposure, not
consideration exposure to natural
background radiations [7]. After the
Fukushima accident, the regulatory
dose limit was initially raised to
20 mSv per year for all age groups
and was later lowered to 5 mSv per
year for children.
From the deposition episodes shown
the population in Fukushima, Gunma,
and Ibaraki Prefectures are likely
to receive the highest dose between
10-100 mSv in the first year after
the accident. This population
roughly represents 5.5% of the total
Japan population. It should be noted
however that the dose levels
presented in table 3 do not include
other exposure pathways such as
internal contamination due to
inhalation of particles in the plume
and internal contamination due to
ingestion of contaminated food.
According to the BEIR VII report of
the US National Academy of Science
Advisory Committee on the biological
effects of ionizing radiation, the
dose-response curve for radiation-
induced cancer is a no-threshold
type which suggests that there is a
very high probability of the
occurrence of many radiation-induced
health effects such as cancer,
leukemia, brain problems, etc. in
years to come.
VII.CONCLUSION
From estimates gotten from dust
sampling techniques, high emission
rates were reported within the range
of 1012 - 1015 Bq/h with the highest
rates corresponding to periods of
hydrogen explosion in some of the
units. This emission resulted in the
deposition of radionuclides at
different parts of Japan mainland.
The most contaminated areas are
Fukushima, Ibaraki, Saitama, Chiba,
Miyagi, Tochigi, Gunma, and Tokyo
Prefectures with ground level
activities ranging from 104 – 106
Bq/m2. The area northwest of the
FDNPP-1 up to a distance of about
50km is the most polluted area due
to the formation of “hot spots”
caused by wet deposition on March
15. This area is farther than the
initial 20km evacuation zone. As an
environmental engineer a good way to
verify these results would be taking
representative air and soil samples
in these areas for analysis but this
couldn’t be done because of many
constraints.
Using dose conversion factor
presented by IRSN, people living in
the affected areas will receive
annual external doses from 10 –
100mSv which is extremely higher
than the Japanese annual limit of
1mSv. The consequence of this would
be a high occurrence of radiation-
induced sicknesses such as cancer,
leukemia, brain damage, etc.
The results of the transport and
dispersion modeling show a high
degree of correlation with values
reported in literature. From the
results of the modeling it is worthy
to say that the HYSPLIT model is an
accurate tool for reproducing and
analyzing the transport and
dispersion of airborne pollutants
and can thus be used as an early
decision tool in emergency
situations.
REFERENCES[1] Baklanov A., Sorensen J.H.,
“Parameterization of Radionuclide Deposition in Atmospheric Long Range Transport Modeling”. Phys. Chem. Earth (B), Vol. 26, No. 10, December, 2000, pp.787-799.
[2] Draxler, R.R. (1999). “Hysplit _4 User’sGuide”
[3] Draxler, R.R., Hess G.D. (1997).“Description of The Hysplit_4 ModelingSystem”
[4] Draxler, R.R., Hess G.D. (1998). “AnOverview of the Hysplit_4 Modeling Systemfor Trajectories, Dispersion andDeposition”.
[5] Draxler, R.R. and Rolph, G.D. (2013).Hysplit (Hybrid Single-ParticleLagrangian Integrated Trajectory) ModelAccess via NOAA ARL Ready Website(Http://Www.Arl.Noaa.Gov/Hysplit.Php).NOAA Air Resources Laboratory, CollegePark, Md.
[6] E. Cardis, M. Vrijheid, M. Blettner, E.Gilbert. “The 15-Country CollaborativeStudy of Cancer Risk among RadiationWorkers in the Nuclear Industry:Estimates of Radiation-Related CancerRisks” Radiation Research April, 2007,167(4):396-416
[7] Genki Katata et al. (2012). “AtmosphericDischarge and Dispersion of Radionuclidesduring the FDNPP1 Accident. Part 1:Source Term Estimation and Local ScaleAtmospheric Dispersion in Early Phase ofthe Accident”, Journal of EnvironmentalRadioactivity 109: 103-113
[8] IAEA. (2003). “Tecdoc-1340: Manual forReactor Produced Radioisotopes”. Pages 5-7
[9] ICRP. (1993). “Publication 67: Age-Dependent Doses to Members of the PublicFrom Intake of Radionuclides: Part 2Ingestion Dose Coefficients”.
[10] International Atomic Energy Agency.(1986). “Tecdoc-379: AtmosphericDispersion Models for Application InRelation To Radionuclide Releases”.
[11] International Atomic Energy Agency.(1994). “Tecdoc-733: The Utilization ofReal Time Models as a Decision AidFollowing a Large Release ofRadionuclides into the Atmosphere”
[12] International Atomic Energy Agency.(2000). “IAEA Safety Glossary”. Version1.0.

[13] IRSSN. (2011). “Assessment On The 66th DayOf Projected External Doses ForPopulations Living In The North-WestFallout Zone Of The Fukushima NuclearAccident” Directorate Of RadiologicalProtection and Human Health, IRSN ReportDRPH/2011-10
[14] M. P. Unterweger, D. D. Hoppes, and F. J.Schima. (1992). "New and Revised Half-Life Measurements Results" Nucl. Instrum.Meth. Phys. Res. A312, 349.
[15] Mark Holt, Richard J. Campbell, and MaryBeth Nikitin. (2012). “Fukushima NuclearDisaster,” Congressional ResearchService.
[16] Morino Y, T. Ohara, and M. Nishizawa.(2011). “Atmospheric Behavior,Deposition, and Budget of RadioactiveMaterials from the Fukushima DaiichiNuclear Power Plant in March 2011,”Journal of Environ. Radioact. 34:69–90.
[17] N. Kocherov, M. Lammer, and O. Schwerer.(1997). "Handbook of Nuclear Data forSafeguards," International Atomic EnergyAgency.
[18] OECD. (2002). “Chernobyl: Assessment ofRadiological and Health Impacts”, NuclearEnergy Agency.
[19] Pecha, P., Kuca, P., Pechova, E. (2001).“Sensitivity Study of Influence of InputParameters Variations or Removal ProcessCalculations on Activity Depletion in theRadioactive Plume and Deposition on theGround”. 7th Int. Conf. On HarmonizationWithin Atmospheric Dispersion Modelingfor Regulatory Purposes.
[20] Stohl et al. (2012). “Xenon-133 andCesium-137 Releases into the Atmospherefrom the Fukushima Daiichi Nuclear PowerPlant: Determination of the Source Term,Atmospheric Dispersion, and Deposition”Atmospheric Chemistry and Physics, 12,2313-2343.
[21] TEPCO Official Release (Japanese). ManualShutdown during Reactor StartupOperations in Fukushima I-1. February 2,2009.
[22] TEPCO Official Release (Japanese). Over-Insertion of Control Rods in Fukushima I-3.
[23] TEPCO Official Release(Japanese). Fukushima I-5 Automatic ScramInformation
[24] Terada et al. (2012). “AtmosphericDischarge and Dispersion of Radionuclidesduring the FDNPP1 Accident Part II:Verification of the Source Term andAnalysis of Regional Scale AtmosphericDispersion” Journal of EnvironmentalRadioactivity 109: 103-113
[25] US-EPA. (2001). “EPA Facts About Cesuim-137”
[26] World Nuclear Association. (2011).“Fukushima Accident 2011,” Citing TheJapanese Nuclear And Industrial SafetyAgency (NISA).