
NTT DOCOMO, INC.
51
NTT DOCOMO, INC. Results for the nine months of the fiscal year ending Mar. 31, 2011 January 28, 2011 Copyright (C) 2011 NTT DOCOMO, INC. All rights reserved.
-
Upload
khangminh22 -
Category
Documents
-
view
4 -
download
0
Transcript of NTT DOCOMO, INC.

NTT DOCOMO, INC.
Results for the nine months
of the fiscal year ending Mar. 31, 2011
January 28, 2011Copyright (C) 2011 NTT DOCOMO, INC. All rights reserved.

RESULTS FOR 3Q OF FY2010RESULTS FOR 3Q OF FY2010
SLIDE No.
1 Forward-Looking StatementsThis presentation contains forward-looking statements such as forecasts of results of operations, management strategies, objectives and plans, forecasts of operational data such as the expected number of subscriptions, and the expected dividend payments. All forward-looking statements that are not historical facts are based on management’s current plans, expectations, assumptions and estimates based on the information currently available. Some of the projected numbers in this presentation were derived using certain assumptions that are indispensable for making such projections in addition to historical facts. These forward-looking statements are subject to various known and unknown risks, uncertainties and other factors that could cause our actual results to differ materially from those contained in or suggested by any forward-looking statement. Potential risks and uncertainties include, without limitation, the following:
(1) Changes in the business environment in the telecommunications industry, such as intensifying competition from other service providers or other technologies caused by Mobile Number Portability, new market entrants and other factors, could
limit our acquisition of new subscriptions and retention of existing subscriptions, or may lead to diminishing ARPU or an increase in our costs and expenses.
(2) Current and new services, usage patterns, and sales schemes introduced by our corporate group may not develop as planned, which could affect our financial condition and limit our growth.
(3) The introduction or change of various laws or regulations or
the application of such laws and regulations to our corporate group could restrict our business operations, which may adversely affect our financial condition and results of operations.
(4) Limitations in the amount of frequency spectrum or facilities made available to us could negatively affect our ability to maintain and improve our service quality and level of customer satisfaction.
(5) Other mobile service providers in the world may not adopt the technologies that are compatible with those used by our corporate group’s mobile communications system on a continual basis, which could affect our ability to sufficiently offer international services.
(6) Our domestic and international investments, alliances and collaborations may not produce the returns or provide the opportunities we expect.
(7) As electronic payment capability and many other new features
are built into our cellular phones/devices, and services of parties other than those belonging to our corporate group are provided through our cellular handsets/devices, potential problems resulting from malfunctions, defects or loss of handsets/devices, or imperfection of services provided by such other parties may arise, which could have an adverse effect on our financial condition and results of operations.
(8) Social problems that could be caused by misuse or misunderstanding of our products and services may adversely affect our credibility or corporate image.
(9) Inadequate handling of confidential business information including personal information by our corporate group, contractors and others, may adversely affect our credibility or corporate image.
(10) Owners of intellectual property rights that are essential for our business execution may not grant us the right to license or otherwise use such intellectual property rights on acceptable terms or at all, which may limit our ability to offer
certain technologies, products and/or services, and we may also
be held liable for damage compensation if we infringe the intellectual property rights of others.
(11) Natural disasters, power shortages, malfunctioning of equipment, software bugs, computer viruses, cyber attacks, hacking, unauthorized access and other problems could cause failures in the networks, distribution channel and/or other factors required for the provision of service, disrupting our ability to offer services to our subscribers and may adversely affect our credibility or corporate image.
(12) Concerns about wireless telecommunication health risks may adversely affect our financial condition and results of operations.
(13) Our parent company, NIPPON TELEGRAPH AND TELEPHONE CORPORATION (NTT), could exercise influence that may not be in the interests of our other shareholders.

FY2010/1QFY2010/1Q--33QQ
(cumulative)(cumulative)
Financial Results HighlightsFinancial Results Highlights
Copyright (C) 2011 NTT DOCOMO, INC. All rights reserved.

RESULTS FOR 3Q OF FY2010RESULTS FOR 3Q OF FY2010
SLIDE No.
3 U.S.GAAP
◆Consolidated financial statements in this document are unaudited.
◆Adjusted free cash flow excludes the effects of uncollected revenues due to bank holidays at the end of the fiscal year and changes in investments for cash management purposes with original maturities of longer than three months.
* For an explanation of the calculation processes of these numbers, please see the reconciliations to the most directly comparable financial measures calculated and presented in accordance with U.S. GAAP
and the IR page of our website, www.nttdocomo.co.jp
FY2010/1Q-3Q (cumulative) Financial Results
2009/4-12(1Q-3Q) (1)
2010/4-12(1Q-3Q) (2)
Changes(1) → (2)
FY2010FY2010(Full(Full--year forecast) year forecast)
(3)(3)(Announced(Announced10/28/2010)10/28/2010)
Progress to forecast
(2) / (3)
Operating Revenues
(Billions of yen) 3,242.43,242.4 3,209.13,209.1 --1.0%1.0% 4,209.0 76.2%76.2%
Cellular Services Revenues(Billions of yen) 2,662.72,662.7 2,598.82,598.8 --2.4%2.4% 3,405.0 76.3%76.3%
Operating Expenses
(Billions of yen) 2,539.72,539.7 2,450.62,450.6 --3.5%3.5% 3,369.0 72.7%72.7%
Operating Income
(Billions of yen) 702.7702.7 758.5758.5 +7.9%+7.9% 840.0 90.3%90.3%
Income Before Income Taxes(Billions of yen) 701.7701.7 748.6748.6 +6.7%+6.7% 838.0 89.3%89.3%
Net Income Attributable to
NTT DOCOMO, INC.
(Billions of yen)419.3419.3 444.0444.0 +5.9%+5.9% 497.0 89.3%89.3%
EBITDA Margin
(%)* 38.138.1 39.539.5 +1.4+1.4
PointsPoints 36.8 --
Adjusted Free Cash Flow(Billions of yen) * 178.1178.1 394.1394.1 +121.3%+121.3% 480.0 82.1%82.1%

RESULTS FOR 3Q OF FY2010RESULTS FOR 3Q OF FY2010
SLIDE No.
4 FY2010/1-3Q (cumulative) Financial
Results Highlights (1)
■ FY2010/1-3Q (cumulative) Financial
Results Highlights:Simultaneous achievement of “growth”,
“service level improvement”
and “cost control”
Smartphone sales (1-3Q cumulative): 1.26 million
YOY increase of packet revenues
(1-3Q cumulative) :
Up ¥76.6 billion
YOY increase of “other revenues”
(1-3Q cumulative)
: Up ¥54.6 billion
Actions for further growth
No. 1 customer satisfaction ranking
(Consumer, enterprise & data communications sectors)
Churn rate: 0.46%
(1-3Q cumulative)
Launch of Xi service
(Dec. 24, 2010)
Service level maintenance/improvement
Proper cost control
YOY decrease of equipment sales expenses
(1-3Q cumulative) : Down ¥42.4 billionYOY decrease of network-related costs
(1-3Q cumulative) : Down ¥45.3 billionYOY decrease of capital expenditures
(1-3Q cumulative) : Down ¥16.2 billion

RESULTS FOR 3Q OF FY2010RESULTS FOR 3Q OF FY2010
SLIDE No.
5 FY2010/1-3Q (cumulative) Financial
Results Highlights (2)
*1: Sum of cost of equipment sold and distributor commissions *2: Sum of communication networks charges, depreciation and amortization, and loss on disposal of property, plant and equipment
Decrease in network-
related costs*2:
Down ¥45.3 billion
FY2009/1-3Q (cumulative) FY2010/1-3Q (cumulative)
Operating
income
¥702.7 billion
Operating income
¥758.5 billion
Up ¥55.8 billion
(+7.9%)
year-on-year
Operating revenues:Down ¥33.2 billion
Operating expenses:Down ¥89.1 billion
Impact of “Value Plan”:
Down approx. ¥80.0 billion
Impact of “Value Plan”:Down approx. ¥80.0 billion
Decrease in equipment sales
expenses*1:Down ¥42.4 billion
Decrease in voice revenues:Down ¥140.5 billion
Key factors behind YOY changes in operating incomeKey factors behind YOY changes in operating income
Increase in other revenues:Up ¥54.6 billion
Decrease in
equipment sales revenues:
Down ¥23.9 billion
Decrease in
other expenses:Down ¥1.3 billion
Increase in
packet revenues:Up ¥76.6 billion

RESULTS FOR 3Q OF FY2010RESULTS FOR 3Q OF FY2010
SLIDE No.
6
0%
10%
20%
30%
40%
50%
60%
70%
80%
90%
08/9 08/12 09/3 09/6 09/9 09/12 10/3 10/6 10/9 10/125
10
15
20
25
30
35
40
45
50
20%
30%
40%
50%
60%
70%
80%
90%
100%
08/9 08/12 09/3 09/6 09/9 09/12 10/3 10/6 10/9 10/120
5
10
15
20
25
30
35
40
50%-OFF Monthly Charge Discount Plans/“Value Plan”
50%-Off Monthly Charge Discount Plans
No. of subs & subscription rate
50%-Off Monthly Charge Discount Plans
No. of subs & subscription rate“Value Plan”
subscriptions/
“Value Course”
selection rate
“Value Plan”
subscriptions/
“Value Course”
selection rate
(Million subs)(Selection rate: %)
Subscription rate:
68%
Subscription rate:
68%
:
50%-OFF monthly charge discount plan subscription rate
:No. of “MAX Discount”*2 subscriptions
(Million subs)(Subscription rate: %)
:No. of users subscribing to “Family Discount”*1+“Ichinen Discount”
for over 10 years
・
Subscription rate of billing plans offering 50% discount on basic monthly charge grew to over 80%
→
Negative impact on revenues became insignificant・
Number of “Value Plan”
subscriptions continued to increase
:
“Value Course”
selection rate*3
:
No. of “Value Plan”
subscriptions
*3: Percentage of users who chose “Value Course”
among total users who purchased
a handset using new handset purchase methods*1: Inclusive of “Office Discount”
and “Business Discount”
subscriptions *2: “Fami-wari
MAX 50”, “Hitoridemo
Discount 50”
and “Office-wari
MAX 50”

RESULTS FOR 3Q OF FY2010RESULTS FOR 3Q OF FY2010
SLIDE No.
7 Cellular(
Xi+FOMA+mova)ARPU
0
2,000
4,000
6,000
8,000
Voice ARPU 3,560 3,450 3,340 2,970 3,010 2,970 3,030 2,590 2,680 2,660 2,590 2,540
Packet ARPU 2,330 2,410 2,390 2,420 2,430 2,450 2,440 2,470 2,510 2,540 2,540 2,560
(Incl.) Int'l services ARPU 80 90 80 70 70 80 80 80 80 90 90 90
YOY changes in packet ARPU (%) 9.9 9.0 8.6 6.6 4.3 1.7 2.1 2.1 3.3 3.7 4.1 4.5
4-6(1Q) 7-9(2Q) 10-12(3Q) 09/1-3(4Q) 4-6(1Q) 7-9(2Q) 10-12(3Q) 10/1-3(4Q) 4-6(1Q) 7-9(2Q) 10-12(3Q) FY2010
(yen)
◆ For an explanation on ARPU, please see slide “Definition and Calculation Methods of MOU and ARPU”
in this document
・
FY2010/3Q (3 months)
aggregate ARPU: ¥5,130 (down 6.2% year-on-year)packet ARPU: ¥2,540 (up 4.1% year-on-year)
2,330 2,410 2,390 2,420
5,890 5,860 5,7305,390 5,440
2,430 2,450 2,510
5,420
FY2008 Aggregate ARPU: ¥5,710 (Down 10.2% year-on-year)
Voice: ¥3,330 (Down 20.0% year-on-year)Packet: ¥2,380 (Up 8.2% year-on-year)
FY2008 Aggregate ARPU: ¥5,710 (Down 10.2% year-on-year)
Voice: ¥3,330 (Down 20.0% year-on-year)Packet: ¥2,380 (Up 8.2% year-on-year)
5,470
2,440
(Full-year forecast)
FY2009 Aggregate ARPU: ¥5,350 (Down 6.3% year-on-year)
Voice: ¥2,900 (Down 12.9% year-on-year)
Packet: ¥2,450 (Up 2.9% year-on-year)
FY2009 Aggregate ARPU: ¥5,350 (Down 6.3% year-on-year)
Voice: ¥2,900 (Down 12.9% year-on-year)
Packet: ¥2,450 (Up 2.9% year-on-year)
2,470
5,060 5,100
2,560
FY2010FY2010
5,190 5,200
2,540
5,130
2,540

RESULTS FOR 3Q OF FY2010RESULTS FOR 3Q OF FY2010
SLIDE No.
8
1Q 2Q 3Q 4Q 1Q 2Q 3Q 4Q 1Q 2Q 3Q
Total Handset Sales
・Total no. of handsets sold in FY2010/1-3Q (cumulative): 13.59 million units (Up 4.4% year-on-year)
FY2008
◆ Calculated based on financial results materials of each company
◆Handsets sold by TU-KA and EMOBILE are not included
:
Total no. of handsets sold (docomo
+ au + SOFTBANK)
:
Total no. of handsets sold (docomo)
FY2009
(Million units)
5.32
FY2008 (full-year): 20.13 million
(Down 21.8% year-on-year)
4.464.95 4.515.35
4.34 4.205.03
FY2009 (full-year): 18.04 million(Down 10.4% year-on-year)
16.0
12.0
8.0
4.0
0
4.61
Full-year forecast:18.70 million
(Up 3.5% year-on-year)
FY2010
4.63
FY2010/1-3Q (cumulative):
13.59 million(Up 4.4% year-on-year)
4.34

RESULTS FOR 3Q OF FY2010RESULTS FOR 3Q OF FY2010
SLIDE No.
9
0.460.49
0.94
0.440.490.450.460.44
0.52
0.44
0.520.51
0.680.74
0.85
0.00
0.50
1.00
1.50
2.00
1Q 2Q 3Q 4Q 1Q 2Q 3Q 4Q 1Q 2Q 3Q 4Q 1Q 2Q 3Q
Churn Rate
・
FY2010/1-3Q(cumulative) churn rate: 0.46%
■ Cellular (Xi+FOMA+mova) Churn Rate
▲ MAX Discount services (Aug. 07)
▲Value Course (Nov. 07)
(%)
FY2007 FY2008
FY2007 full-year churn rate: 0.80% FY2008 full-year churn rate: 0.50%
FY2009
FY2009 full-year churn rate: 0.46%
SoftBankSoftBank
KDDI (au)KDDI (au)
docomodocomo
◆ Based on financial results materials of each company
FY2010

RESULTS FOR 3Q OF FY2010RESULTS FOR 3Q OF FY2010
SLIDE No.
10
0
20
40
60
80
100
3Q累計(4-12月)
No. of Net Additions
・Total no. of net additions for FY2010/1-3Q (cumulative): 1.13 million(Up 290,000 (+35%) year-on-year)
0.77
■ No. of net additions(Million subs)
: FY2009: FY2010
: FY2008
1-3Q (April-December) cumulative
1.00
0.80
0.60
0.40
0.20
0FY2009 FY2010
0.84
1.13
FY2008

RESULTS FOR 3Q OF FY2010RESULTS FOR 3Q OF FY2010
SLIDE No.
11
0
1,000
2,000
3,000
4,000
5,000
6,000
08/3 08/6 08/9 08/12 09/3 09/6 09/9 09/12 10/3 10/6 10/9 10/12 11/3
Subscriber Migration to FOMA / Xi
(Million subs)
mova
56.08
Numbers in parentheses indicate the percentage of FOMA+Xi
subscriptions to total cellular subscriptions
53.20
(94.9%)49.04(89.8%)
54.6053.39
43.95(82.3%)
9.445.56
2.88
・
Total number of migrations in FY2010/1-3Q (cumulative): 1.06 million
53.94
7.49
46.44(86.1%)
51.26(92.9%)
3.9355.19
52.05(93.9%)
3.3955.4454.86
50.25(91.6%)
4.626.668.43
47.49(87.7%)45.20
(84.3%)
53.63 54.1657.85
1.24
56.61
(98%)
60.0
40.0
30.0
20.0
10.0
50.0
2.35
54.16
(95.8%)
56.51
1.95
54.94
(96.6%)
56.89
FY2010/3Q (3 months) No. of migrations 260,000
FY2010/3Q (3 months) No. of migrations 260,000
◆ Inclusive of Communication Module Service subscriptionsFY2007 FY2008 FY2009
(Forecast)
0
FY2010
1.64
57.21
55.57
(97.1%)

Principal Actions and Results
Copyright (C) 2011 NTT DOCOMO, INC. All rights reserved.

RESULTS FOR 3Q OF FY2010RESULTS FOR 3Q OF FY2010
SLIDE No.
13 Principal Actions and Results ■ Made steadfast progress toward achievement of our major action
items for FY2010
Major action itemsMajor action items
Customer satisfaction improvement
Customer satisfaction improvement
Acquired No. 1 customer satisfaction ranking
(Consumer, enterprise & data communications sectors)
Acquired No. 1 customer satisfaction ranking
(Consumer, enterprise & data communications sectors)
Take-off of smartphone
marketTake-off of smartphone
market Cumulative sales for 1-3Q (9 months): 1.26 million units
Cumulative sales for 1-3Q (9 months): 1.26 million units
Smooth launch of LTE serviceSmooth launch of LTE service Launched Xi service on Dec. 24, 2010
Base station roll-out progressing steadily
Launched Xi service on Dec. 24, 2010
Base station roll-out progressing steadily
Increase of packet ARPUIncrease of packet ARPUAchieved steadfast YOY growth
1Q: Up ¥80 2Q: Up ¥90 3Q: Up ¥100
Cumulative packet revenues for 1-3Q (9 months): Up 6.5%
Achieved steadfast YOY growth
1Q: Up ¥80 2Q: Up ¥90 3Q: Up ¥100
Cumulative packet revenues for 1-3Q (9 months): Up 6.5%
Expansion of new business domains
Expansion of new business domains
Launched E-book service
Established operating company for
commissioned multimedia broadcasting service
Launched E-book service
Established operating company for
commissioned multimedia broadcasting service
Status of achievementStatus of achievement

RESULTS FOR 3Q OF FY2010RESULTS FOR 3Q OF FY2010
SLIDE No.
14
・
In FY2007, we changed our strategy to attach greater emphasis on
existing customers.
As a result of our actions in the last 3 years, we received the highest marks among Japan’s mobile phone operators in the 2010 Japan Mobile Phone Service StudySM, a customer-satisfaction study conducted by J.D. Power Asia Pacific*1
“Mobile Phone Checking Service”
Expanded “Battery
Pack Anshin
Support”
Executed “change”
in all frontsFY2010 study
Set a target to achieve “No. 1 customer satisfaction ranking in FY2010”
as part of our medium-term vision announced in October 2008
Overall scoreOverall score No. 1No. 1
“i-concier”, etc.
Review from
customers’
viewpoint Review from
customers’
viewpoint ServicesServices
PromotionsPromotions
New handset series
“Walk with you”
Field staff dispatch
within 48 hours
Handsets/devices
Handsets/devices
After-sales support, customer
treatment
After-sales support, customer
treatment
Area qualityArea quality
Billing plansBilling plans
Expanded
“Pake-hodai
double”
Achieved FY2010 Target:“Receive No. 1 ranking
in customer satisfaction”
Customer contact
Handsets
Call quality/area
Non-voice functions/services
Costs
*1 Source: J. D. Power Asia Pacific 2010 Japan Mobile Phone Service StudySM. Study results compiled based on responses from total 7,500 mobile phone users living in Japan. www.jdpower.co.jp
Customer Satisfaction Improvement (1)

RESULTS FOR 3Q OF FY2010RESULTS FOR 3Q OF FY2010
SLIDE No.
15・
Received No.1 ranking in J.D. Power Asia Pacific Japan Business Mobile Phone/PHS Service Customer
Satisfaction Index Study for 2 straight years (Sept. 16, 2010)*1
・
Received No. 1 ranking in Nikkei BP Consulting customer satisfaction survey on mobile data communications services for 2 straight years*2
Received highest score in 6 items out of
total 15 items including “overall satisfaction”
Area coverage (Outdoor & indoor)
Area coverage (Outdoor & indoor) Communication qualityCommunication quality
Responsiveness of retailer/shop attendants
Responsiveness of retailer/shop attendants After-sales supportAfter-sales support
*2
No. 1
satisfaction scores for:Service area Communication quality Overall rating
Data card use
<<Enterprise Sector>>
No. 1 ranking in FY2009-2010
customer satisfaction survey for 2 straight years
Customer Satisfaction Improvement (2)
*1
Source: J.D. Power Asia Pacific 2009-2010 Japan Business Mobile Phone/PHS Service Customer Satisfaction Index StudySM. Study results was based on 3,222 responses from individuals responsible for supervising or deciding upon telephone services at 2,345 businesses with more than 100 employees. (Each respondent evaluated
up to two mobile telephone/PHS providers). www.jdpower.co.jp
*2 Source; Nikkei BP Consulting “2nd
Mobile data devices customer satisfaction survey: area coverage (outdoor), area coverage (indoor) , communications quality (disruption of connection), responsiveness of retailer/shop attendants, after-sales support scores”
Responsiveness
of sales contact
Service content
Service quality
Cost
Overall scoreOverall score No. 1No. 1
Awarded No.1 for 2 straight years
Awarded No.1 for 2 straight years
<<Data Communications Services>>No. 1 ranking in FY2009-2010
customer satisfaction survey for 2 straight years

RESULTS FOR 3Q OF FY2010RESULTS FOR 3Q OF FY2010
SLIDE No.
16
0.0%
1.0%
2.0%
3.0%
4.0%
1Q 2Q 3Q 4Q 1Q 2Q 3Q2,350
2,400
2,450
2,500
2,550
Growth of Packet ARPU
No. of packet flat-rate services subs*2/Subscription rate*3
(Million subs)
0%
10%
20%
30%
40%
50%
60%
70%
09/6 09/9 09/12 10/3 10/6 10/9 10/120
5
10
15
20
25
30
35
:Subscription rate (left axis):
No. of subs (right axis)
(Subscription rate)
YOY packet ARPU comparison
【FY2010 Targets】
No. of packet flat-rate services subs:
31.90 million
Packet flat-rate services subscription rate: 63%
【FY2010 Targets】
No. of packet flat-rate services subs:
31.90 million
Packet flat-rate services subscription rate: 63%
Subscription rate:
60%
Subscription rate:
60%(Yen)
:YOY growth rate*1 (%):Packet ARPU (yen)
0
(Growth rate)
・
Year-on-year growth rate of packet ARPU has accelerated・
No. of packet flat-rate services subscriptions grew to approx. 30.20 million as a result of aggressive promotion
FY2010FY2009*1: Excludes impact of i-mode monthly charge hike applied from June 2008
*2: Include subscriptions to “Pake-hodai”, “Pake-hodai
full”, “Pake-hodai
double”, “Pake-hodai
simple”, “Biz-hodai”
services, flat-rate data plans and special plan for Xi data services
*3: Packet flat-rate services subscription rate= No. of packet flat-rate services subscriptions/(Total FOMA i-mode subs + No. of flat-rate subs without i-mode subscription + No. of data plan subs
+ No. of Xi data plan subs)

RESULTS FOR 3Q OF FY2010RESULTS FOR 3Q OF FY2010
SLIDE No.
17
380
390
400
410
420
430
1Q 2Q 3Q 4Q 1Q 2Q 3Q
Historical Growth of Packet Revenues
(Billions of yen)
・
Achieved steadfast increase in packet revenues・
Expanded uptake of smartphones/PC data services and increased i-mode revenues significantly contributed to growth of packet revenues
Historical growth of packet revenues
FY2010FY2009
i-modePC data, etc.
smartphones
【3Q (3 months)】
To grow packet revenues,
stronger initiatives need to be employed in all areas
Breakdown of increased packet revenues:
i-modePC data, etc.
smartphones
FY2010/1-3Q
(9 months cumulative)
Up ¥76.6 billion(Up 6.5%) year-on-year
Analysis of increased packet
revenues
【1-3Q
(9 months) cumulative】
Up ¥76.6 billion(Up 6.5%)
FY2010/1-3Q (cumulative):
1,261.8 billion
FY2009/1-3Q (cumulative):
1,185.2 billion

RESULTS FOR 3Q OF FY2010RESULTS FOR 3Q OF FY2010
SLIDE No.
18 Smartphones (1)
・
Sales of smartphones
accelerated following the release of winter/spring models・
Actively provided functional enhancements/OS version upgrades after release of devices
Rich lineup catered to diverse needs of customers
GALAXY S GALAXY Tab BlackBerry
Curve 9300REGZA
PhoneLYNX 3D Optimus
chat
Winter/spring: 7 models
Tablet-type
device (planned)
Functional enhancements/OS version upgrade
LYNX 3DREGZA
Phone
Version upgrade to Android 2.2Version upgrade to Android 2.2
Flash player 10.1 Enhancement of app execution speed
Flash player 10.1 Enhancement of app execution speed
Xperia
Compatibility with multi-touch capability
Jan. 19, 2011
Functional upgrade
completed
Mar.-Apr. 2011 (Planned)
Apr.-May 2011 (Planned)

RESULTS FOR 3Q OF FY2010RESULTS FOR 3Q OF FY2010
SLIDE No.
19
・
FY2010/1-3Q (9 months) cumulative smartphone
sales: 1.26 million units
Cumulative sales of smartphones
Smartphones (2)
0.0
0.5
1.0
1.5
Jun. Sep. Dec.
FY2010/3Q (9 months) cumulative sales:
1.26 millionFY2010/3Q (9 months) cumulative sales:
1.26 million
December 2010 (single month)
No. 1 smartphone
sales market share
at major mass retailers*
December 2010 (single month)
No. 1 smartphone
sales market share
at major mass retailers*
docomo
Company A
Company B
Company C
FY2010
Based on survey by GfK
Japan
* No. 1 market share among all carriers in mobile phone sales category for December 2010. Based on survey by GfK
Japan that aggregates the sales records of devices installing
either of the 4 OSs
(Android/i OS/WindowsMobile/Blackberry; tablet-type devices not included) at major mass retailers across Japan.
(Million units)
■
Smartphone sales market share
(for Dec. 2010)

RESULTS FOR 3Q OF FY2010RESULTS FOR 3Q OF FY2010
SLIDE No.
20
・
Expand variety of content provided on docomo
market・
Actively utilize service/content assets available on existing i-mode
Content and Services for Smartphones
ContentContent ServicesServices
Services already provided via i-mode
to be customized for smartphones
Services already provided via i-mode
to be customized for smartphones
Part of “map application”
functions to be
offered for smartphones
on a trial basis Period: Feb. 4 –
Oct. 31, 2011 (planned)
Part of “map application”
functions to be
offered for smartphones
on a trial basis Period: Feb. 4 –
Oct. 31, 2011 (planned)
Area map near current location
Nearby area info. search
Pedestrian/passenger navigation
Real-time traffic jam info.
Train transfer guide/
timetable
Smartphone
original content
Smartphone
original contentUse of i-mode
content assets
Use of i-mode
content assets
Targets for Mar. 31, 2011Targets for Mar. 31, 2011
Selected high-quality content Music/video:
1,000 titles
Music/video:
1,000 titlesE-books:
100,000 titles
E-books:
100,000 titlesDeco-mail content:
10,000 pcs
Deco-mail content:
10,000 pcs
Kisekae
application:
“Smart Home”Enables users to change wall paper
or icons easily in one batch
“Deco-mail Tori-hodai”
Offers 10,000 pieces
of deco-mail
pictograms for free!Up to Apr. 30, 2011
“Sekai-no-appli-kata”
Introduces world’s entertaining
and/or practical applications
with fun!

RESULTS FOR 3Q OF FY2010RESULTS FOR 3Q OF FY2010
SLIDE No.
21
・
Plan to introduce "Monthly Support" to make it easier for customers to purchase smartphones・
A prescribed amount for each model to be discounted from the monthly bill for up to 24 months
"Monthly Support"
"Monthly Support" (Planned for launch on Mar. 15, 2011)
Device to be purchased at a price after
applying discounts
Basic charge
Comm. charge
“Monthly
Support”
Billed
amount
"Monthly Support"
discount to be applied
Discount applied upon purchase of device
Current scheme "Monthly Support""Monthly Support"
Device price
Device price
Monthly bill
Monthly bill
Device to be purchased
at full price
Various discounts
Device
purchase
price
Basic charge
Comm. chargeBilled
amount
Discount to be applied to the bill for each month
・
Smartphones・
Tablet devices・
Book readersnow on sale or to be released in the future
Applicable to:
Conditions for application:
Simultaneous application to new packet flat-rate services or flat-rate data plans upon the purchase of device using the “Value Course”
Full price Full priceDevice
purchase
price

RESULTS FOR 3Q OF FY2010RESULTS FOR 3Q OF FY2010
SLIDE No.
22
・
Created new packet flat-rate services for smartphones
in conjunction with the introduction
of "Monthly Support"・
Selectable based on customer’s own usage status
New Packet Flat-Rate Services for Smartphones
(No. of packets)
¥5,460 “Pake-hodai
flat”
Full flat-rate serviceFull flat-rate service
<Rate (conceptual)>
(No. of packets)
¥5,985“Pake-hodai
double 2”
New two-tiered flat-rate serviceNew two-tiered flat-rate service
¥2,100
<Rate (conceptual)>
(Planned for launch Mar. 15, 2011)
Rate (tax included)
[¥/month]
(No. of packets)
¥5,985
(existing) “Pake-hodai
double”
¥390
<Rates (conceptual)>
New packet flat-rate servicesNew packet flat-rate services
Existing packet flat-rate service
Selectable
based on customer’s usage
status
Rate (tax included)
[¥/month]
Rate (tax included)
[¥/month]
¥525 cheaper than maximum monthly rate of existing
“Pake-hodai
double”
71,000 packets
114,000 packets

RESULTS FOR 3Q OF FY2010RESULTS FOR 3Q OF FY2010
SLIDE No.
23
Eligible customersEligible customers
“Ouen Student Discount” Campaign
Basic monthly charge
(i-mode phone/smartphone)
Basic monthly charge
(i-mode phone/smartphone)
Basic monthly charge:
¥390/month
After applying“Ouen
Student Discount”
Packet flat-rate services for smartphones
(Discounts applied only when smartphones
are used)
Packet flat-rate services for smartphones
(Discounts applied only when smartphones
are used)Rate (conceptual)
“Pake-hodai
simple”
(Discounts to be applied from Feb. 1, 2011)
(No. of packets)
¥5,985
¥0
¥5,460¥525 discount
¥5,985
“Pake-hodai
double 2”
(To be launched Mar. 15, 2011)
¥2,100
¥5,460
¥525 discount
(No. of packets)
¥5,460
“Pake-hodai
flat”
(To be launched Mar. 15, 2011)
¥4,935¥525 discount
Students
(New/existing subs)
Family members
of students
(New subs)
“Ouen
Student Discount”
Discounts applied for up to 37 months
↓
Max. total savings:
Approx. ¥33,000
Type Simple Value(¥780/month)
・
Promotional campaign for students in which the basic monthly charge will be discounted
to ¥390 for up to 3 years・
Additional discounts of ¥525 to be applied to the maximum monthly rates of packet flat-rate
services for smartphones
(Discounts to be applied from Feb. 1, 2011)
<Period for accepting applications: Jan. 28-May 31, 2011 >
Mail service (i-mode/sp-mode) provided for free when subscribed to Type Simple together with one of the 3 packet flat-rate services:
◆ Applicable only when the conditions for applying “Ouen
Student Discount”, e.g.,
currently subscribing to Type Simple (Value), etc.,
are met
Rate (tax included)
[¥/month]
Rate (tax included)
[¥/month]
(No. of packets)
Rate (tax included)
[¥/month]

RESULTS FOR 3Q OF FY2010RESULTS FOR 3Q OF FY2010
SLIDE No.
24
08/6 08/9 08/12 09/3 09/6 09/9 09/12 10/3 10/6 10/9 10/121Q 2Q 3Q 4Q 1Q 2Q 3Q 4Q 1Q 2Q 3Q
Data Communications (1)
* Total number of subscriptions to usage-based billing plans, “Flat-Rate Data Plan Standard”, “Flat-Rate Data Plan 64K”, and Xi data plan (including “Value Plans”)
(Million subs)
0.20
0.40
0.60
(1,000 units)
0.670.58
0.530.500.470.440.08
0.12 0.16 0.200.28
0.800.40
100
data device sales Data plan* subscriptions
0.10
0.80
200
0.96
FY10 full-year sales target: Approx. 700,000
1.00
Forecast as of Mar. 31, 2011:
Approx. 1.50 million
0.65
: Usage –based billing plans: Flat-rate data plans
1.20
1.07
0.55
0.771.21
・
Both no. of devices sold and subscriptions achieving favorable growth
•Source: Nikkei BP Consulting
“2nd
Mobile data devices customer satisfaction survey: area coverage (outdoor), area coverage (indoor) , communications quality (disruption of connection), responsiveness of retailer/shop attendants, after-sales support scores”
Data card use
No. 1 satisfaction scores for:
-
Service area
-
Communication quality
-
Overall rating
FY2010FY2009FY2008
1.40
0.911.34

RESULTS FOR 3Q OF FY2010RESULTS FOR 3Q OF FY2010
SLIDE No.
25
Create environment to have customers choose DOCOMOCreate environment to have customers choose DOCOMO
Broad area coverage/Favorable data speedsBroad area coverage/Favorable data speeds
Product lineupProduct lineup Billing planBilling plan
<Rates(Conceptual)>
(Until Apr. 30, 2011)
LTE/3G-enabled
mobile Wi-Fi router
LTE/3G-enabled
mobile Wi-Fi router
Planned for release
in FY2011
Product lineup that allows use of service with various devices
Card-type
Mobile Wi-FI router
Int’l roaming-
enabled
PC with built-in
communication
module
Data Communications (2)
・
Prepare proper environment to have customers choose our services,
with the aim of further reinforcing data device sales
Extended period of discount campaign for new subscribers
Rate (yen/month)
5,985
4,410Offer discount of
¥1,575/month for 1 year
NEWNEW
USB-type

RESULTS FOR 3Q OF FY2010RESULTS FOR 3Q OF FY2010
SLIDE No.
26 i-mode Packet Usage Expansion ・
Achieved steadfast increase in no. of “EveryStar”
subscribers through posting on iMenu,
etc. and shop-counter recommendations ・
“EveryStar”
has been adopted by broad segments including middle-aged and older users, which contributed to expanding the packet usage and ARPU of medium/light users
Adoption of “EveryStar” (Full-scale service launched on Jun. 7, 2010)
Posting on iMenu, etc.
Posting on iMenu, etc.
Recommendation
at docomo
Shops
Recommendation
at docomo
Shops
0
20
40
60
80
10/6 10/9 10/120% 20% 40% 60% 80% 100%
Steadfast subscriber growth
Age distribution of paid subscribersHistorical growth of subscribers
Service being used by broad age groups capturing middle-age &senior users
Jun. 2011
Nov. 2011
Content appealing to light users
Content appealing to light users
Continual use of service
through a mechanism that keep users unbored
Continual use of service
through a mechanism that keep users unbored
Contribution to packet usage expansion
&
packet ARPU growth
Contribution to packet usage expansion
&
packet ARPU growth
:Free subs:Paid subs
(1,000 subs) :10s :20s :30s:40s :50+
800
600
400
200

RESULTS FOR 3Q OF FY2010RESULTS FOR 3Q OF FY2010
SLIDE No.
27 “i-concier”
■ No. of subscriptions(Million subs)
2.00
4.00
08/12 09/3 09/06 09/09 09/12 10/3 10/6 10/9 10/12
1.560.93
6.00
2.34
(titles)
4.784.20
3.10
Steadfast growth
Steadfast growth 5.41
■ No. of content posted on iMenu
・
“i-concier”
subscriptions topped 5.80 million, growing in line with the increase in no. of compatible content
・
Newly added memo function to further improve ease of use
5.80
“i-concier”
functional enhancement
-Memo function-
Here’re some tips about
Shibuya Station
Don’t forget to buy a new CD!
Analyzes memo, and delivers related info
Sends a reminder based on the set place and time
Input memoBuy a new CD tomorrow night
in Shibuya
Map, weather, route search, link to area info, etc.
Map, weather, route search, link to area info, etc. 0
200
400
600
800
08/12 09/3 09/6 09/9 09/12 10/3 10/6 10/9 10/12
191191 244244
332332423423
493493548548
611611707707
775775

RESULTS FOR 3Q OF FY2010RESULTS FOR 3Q OF FY2010
SLIDE No.
28
Open applications store
App store Music store Book storeDistributes approx. 1.00 million songs
A wide array of popular
comics, novels and practical guides
・
No. of downloads for app and book stores increasing steadily・
User base of music store has broadened after enabling the use of
docomo
Points for payment of wider range of services
docomo market (i-mode)
“docomo
market”
(for i-mode) (Launched Dec. 6, 2010)
Usage trends
(For approx. one-month period)
Achieved over 1.00 million
downloads
More than 30 applications
recorded over 10,000 downloads
in 1 month
Achieved over 1.00 million
downloads
More than 30 applications
recorded over 10,000 downloads
in 1 month
No. of paid music downloads
reached approx. 500,000
Adoption expanded to broader user segments after enabling
the use of
docomo
Points for
payment of
wider range of services
No. of paid music downloads
reached approx. 500,000
Adoption expanded to broader user segments after enabling
the use of
docomo
Points for
payment of
wider range of services
Achieved over 1.50 million
downloads, mainly for free browsing of books, etc.
Titles targeted at women draw
greatest popularity, leading to acquisition of a different user
segment from that of app store
Achieved over 1.50 million
downloads, mainly for free browsing of books, etc.
Titles targeted at women draw
greatest popularity, leading to acquisition of a different user
segment from that of app store
Contributed to invigorating i-mode content market

RESULTS FOR 3Q OF FY2010RESULTS FOR 3Q OF FY2010
SLIDE No.
29 LTE (1)
・
Launched Xi (Pronounced
“Crossy”) service on Dec. 24, 2010・
Provide brand-new services leveraging LTE’s
distinctive features—“high-speed”, “large-capacity”
and “low-latency”
transmission
High-speed Low-latencyLarge-capacity
Approx. 10-fold* Approx.
1/4
Approx.
3-fold
Spectrum efficiency
Transmission latency
(maximum effect)
Transmission rate
* Comparison of LTE max. downlink speed of 75Mbps with HSPA max.
downlink speed of 7.2Mbps
(Comparison with FOMA (HSPA) service)The “X”
denotes both “connection”
and “infinite possibility”,
and the “i”
both individual user”
and “innovation.
■ LTE’s
distinctive features ■ Service brand/logo
LTE areas
3G area
Area expansion using an overlay approach to existing 3G areas
■ Devices (Data-only)
USB type ExpressCard
type
X i (Pronounced “Crossy”)
HSPA (max. downlink speed: 7.2Mbps)
connectivity in areas outside LTE coverage
Max. downlink speed: 75Mbps

RESULTS FOR 3Q OF FY2010RESULTS FOR 3Q OF FY2010
SLIDE No.
30 Xi Launch Ceremony
・
Launched LTE service on Dec. 24, 2010
■ Xi launch ceremony ■ Services to be realized by Xi (conceptual)
History view
Simultaneous translation
Mobile theater
Augmented Reality (AR) realized by Xi’s high-speed, large-
capacity & low-latency transmission combined with cloud computing techniques makes it possible to project an ancient view of a town on the mobile screen held against the scenery
Simultaneous translation service can be provided over Xi network by installing a foreign language translation function on the network side
Xi’s high-speed video downloading capability can transform your living room into a theater

RESULTS FOR 3Q OF FY2010RESULTS FOR 3Q OF FY2010
SLIDE No.
31
(From June)
Trial operation of comm
ercial network
LTE-related CAPEX:Approx ¥35.0 billion Approx. ¥100.0 billion Approx. ¥170.0 billion
FY2010 FY2011 FY2012
(Dec.)
FY2013 FY2014
Further area
expansion
LTE (2)
・
Achieving steadfast progress in base station roll-out ・
Planned base station deployment in FY2010: Approx. 1,000 BTSs
in Tokyo/Nagoya/Osaka
LTE service launch
▲
Data communication device▲
Mobile Wi-Fi router (planned)
▲
Handset-type device (planned)
Prefectural capital-size cities
Major cities across Japan
No. of base stations:
Approx. 1,000 BTSs
Approx.
7%
POP coverage
(breakdown)Tokyo: Approx. 800
Nagoya: Approx. 100
Osaka: Approx. 100
Approx.
15,000 BTSs
Approx. 40% POP coverage
Tokyo/Nagoya/Osaka
Approx.
35,000 BTSs
Approx. 70%
POP coverage
Approx.
5,000 BTSs
Approx. 20%
POP coverage

RESULTS FOR 3Q OF FY2010RESULTS FOR 3Q OF FY2010
SLIDE No.
32
~~
~~
・
Launched “Xi Start Campaign”
to offer discounts through April 2012, in view of
LTE’s
limited area coverage in the initial phase・
Aim to grow no. of LTE subscriptions to 15.00 million by Mar. 31, 2015
■ Billing plan(“Xi Data Plan Ninen”)
¥4,935
¥6,510(¥6,200)
(¥4,700)
¥9,135(¥8,700)
Beyond 5GB, ¥2,625 (¥2,500) will be charged for
each 2GB
Beyond 5GB, ¥2,625 (¥2,500) will be charged for
each 2GB
■ Subscriber expansion plan (conceptual)
0
5
10
15
20
FY2010 FY2011 FY2012 FY2013 FY2014
【Target】15 million subs in FY2014
【Target】15 million subs in FY2014
(million subs)
LTE (3)
[yen/month]
(Numbers in parentheses
indicate monthly amount excluding taxes)
¥1,000
Approx.3MB
(¥953)
Approx.20MB
5GB 7GB
Max. rate after campaign discount
(Through Apr. 31, 2012)
~~ ~~

RESULTS FOR 3Q OF FY2010RESULTS FOR 3Q OF FY2010
SLIDE No.
33・
Establsihed
a joint-venture company, 2Dfacto, Inc.,
together with Dai Nippon Printing Co.,
Ltd.
and CHI Group Co.,
Ltd. ・
Opened e-book store with the aim of offering hybrid service integrating physical and online book shops・
Compatible with book readers and various smartphone
models
E-Book Service
Start with approx. 20,000
books
Literary worksLiterary works
ComicsComicsetc.
Plan to increase toApprox. 100,000
by 2011/spring
New titlesNew titles
Newspapers/
magazines
Newspapers/
magazines
Video and otherrich content
Video and otherrich content
Content
(Launched Jan. 12, 2011)
Compatible devices
Payment
via sp mode
Convergence of
online/physical
shops
Multi-device
1 contentBookmark
sharingEvolve into a more convenient e-book store in the future
E-book service to be supported also by smartphones/book readers
to be released in future
etc.
Prepare wider variety of content
■
Smartphones: 6 models
・Xperia
・GALAXY S・GALAXY Tab
・LYNX
3D・REGZA Phone
・Optimus
chat
■ Bookreader: 1 model
・SH-07C
RESULTS FOR 3Q OF FY2010RESULTS FOR 3Q OF FY2010
SLIDE No.
34
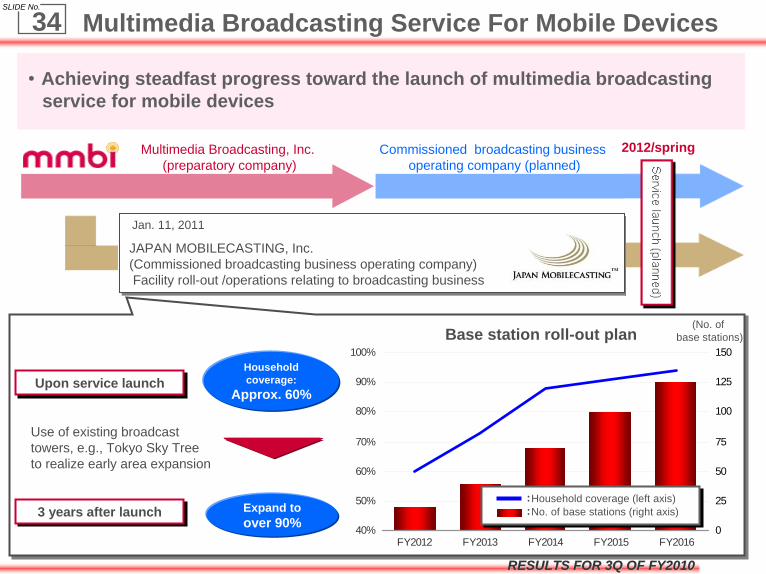
・
Achieving steadfast progress toward the launch of multimedia broadcasting
service for mobile devices
Multimedia Broadcasting Service For Mobile Devices
Multimedia Broadcasting, Inc.
(preparatory company)Commissioned broadcasting business
operating company (planned)2012/spring
40%
50%
60%
70%
80%
90%
100%
FY2012 FY2013 FY2014 FY2015 FY20160
25
50
75
100
125
150Base station roll-out plan
:Household coverage (left axis):No. of base stations (right axis)
Upon service launchUpon service launch
3 years after launch3 years after launch
Household coverage:
Approx. 60%
Expand to over 90%
Use of existing broadcast
towers, e.g., Tokyo Sky Tree
to realize early area expansion
JAPAN MOBILECASTING, Inc. (Commissioned broadcasting business operating company)
Facility roll-out /operations relating to broadcasting business
JAPAN MOBILECASTING, Inc. (Commissioned broadcasting business operating company)
Facility roll-out /operations relating to broadcasting business
Service launch (planned)Service launch (planned)
(No. of base stations)
Jan. 11, 2011

RESULTS FOR 3Q OF FY2010RESULTS FOR 3Q OF FY2010
SLIDE No.
35
30
40
50
60
70
80
09/4 5 6 7 8 9 10 11 12 10/1 2 3 4 5 6 7 8 9 10 11
Global Expansion (1) –TTSL/TTML (India)・
Subscriptions increasing steadily. 3G service launched in all circles where TTSL/TTML won
license・
Plan to enrich variety of value-added services (VAS) provided on 3G network, with the aim of
generating incremental revenues other than data communications charges
(Million subs)
■ No. of subscriptions*
Service areas3G: 9 circles
GSM: 18 circles
(Out of India’s total 22 circles)(As of Jan. 2011)
■ 3G/GSM roll-out (brand: TATA DOCOMO)
GSM service launch
(Jun. 24, 2009)
GSM service launch
(Jun. 24, 2009)
*: No. of subscriptions and market share are the total of GSM and CDMA services of TTSL and TTML (Source: TRAI)
Total subscriptions: 82.60 million
Market share: 11.3%*
Total subscriptions: 82.60 million
Market share: 11.3%*
(As of Nov. 30, 2010)
3G service launch
(Nov. 5, 2010)
3G service launch
(Nov. 5, 2010)
■ 3G billing plans
highlights
● Introduced rate plans to bill subscribers
for use of data
● Introduced bundled plans for voice/data
● Introduced flat-rate plan for data-only devices
■ Examples of 3G VAS
ComicsComics
App
store
Religious
video
distribution
GamingGaming Horoscope
video
Horoscope
video
Free mail
SNS management
app
VODVOD
Video
phone
Rate INR 350-2,000
Flat-rate fee INR 1,000-2,000
(Value-Added Services)

RESULTS FOR 3Q OF FY2010RESULTS FOR 3Q OF FY2010
SLIDE No.
36
(1) International roaming
(2) Enterprise services
(3) LTE and other network technologies
(4) Smartphones
(5) Common service platform
(1) International roaming
(2) Enterprise services
(3) LTE and other network technologies
(4) Smartphones
(5) Common service platform
Global Expansion (2) –Northeast Asia-
・
Pursue close cooperation with China Mobile (China) and KT (Korea) in view of
changes in business environment, e.g.,
progress of globalization and growing
adoption of smartphones, etc.
3-party business collaboration with China Mobile and KT (Announced Jan. 19, 2011)
Future-oriented studies on business cooperation
Future-oriented studies on business cooperation
Areas for business cooperation:Areas for business cooperation:
Aim to enhance customer convenience and expand the mobile communications market
in the fast-growing Northeast Asian countries
that have close exchanges with one another

RESULTS FOR 3Q OF FY2010RESULTS FOR 3Q OF FY2010
SLIDE No.
37 Preparations for SIM Unlock・
Preparations in progress to install a function that can disable SIM lock in the new handsets to be released after Apr. 1, 2011
・
SIM lock to be disabled after receiving subscriber’s application at docomo
Shop and consent on the important matters to be informed
○
○
○
Can be usedDOCOMO SIM
SIM of other
Japanese carriers
SIM of overseas
carriers
×SIM of different mobile
communication system
Same m
obile
comm
unication system
What is SIM unlock?
SIM unlocking procedures (plan under study)
Application by customer
at docomo
ShopExplanation of important matters
Unlock SIM
<SIM locked> <SIM lock disabled>
Items to be studied for SIM unlock
Can be used
Can be used
Cannot be used
Items to be explained to customer
upon disabling SIM lock
Disclosure of reference information concerning handset operations
after disabling SIM lock
A customer-oriented arrangement
between carriers for repair of handsets

RESULTS FOR 3Q OF FY2010RESULTS FOR 3Q OF FY2010
SLIDE No.
38
Mobile Phone Safety Program
classes
・Held approx. 5,500 classes in FY2010. Plan to hold cumulative 36,000 classes by Mar. 31, 2014
・Distributed educational videos to
all elementary/junior high schools in Japan for free (Approx. 32, 000 schools as of Dec. 31, 2010)
・Lectures to school teachers/staff
・Enrichment and expansion of handset operation menus for improved ease of use by the
elderly
Worked for conservation of environment and solution of social issues, to contribute to the development of sustainable society
Medium-term environmental target ・Reduce greenhouse gas emissions to less than 1.17 million t-CO2 by FY2010 → Likely to achieve
・Aim to achieve environmental contribution through the use of ICT services of over 5.3 million t-CO2 for FY2010 →Likely to achieve
Establish “docomo
Woods”
in all prefectures ・Completed in June 2010Completed in June 2010
Mobile Phone Safety Class
Educational video (DVD)
Roll-out of disaster-
prepared equipment compatible with upgraded network ・Increased no. of mobile base station vehicles equipped with satellite links (9 units deployed nationwide) ・Disaster response drills in view of actual operations simulating a major disaster. Publication of
disaster response manual
Functional enhancement of i-mode disaster message board service
・Introduction of “multi-company search”
function, enabling confirmation of messages across different operators (started Mar. 1, 2010) ・Functional improvement to make the message board easier to use
“For everyone”
Promotion of universal design
Barrier-free
renovation of shops
Barrier-free shops
・Renovation expected to be completed by Mar. 31, 2011* Except for shops where renovation is physically difficult, etc.
To improve customer responsiveness
・Customer treatment
training
Expanded no. of shops installed with videophone facility for language support
* Calculated with a conversion coefficient of 0.378kg-CO2/kwh
見込み
137
0
20
40
60
80
100
120
140
2006 2007 2008 2009 2010
(10,000t-CO2)
Natural base117
(fiscal year)
“Protecting the earth environment””
Environmental protection initiatives
“Safety & security”
Realization of safe & secure mobile society
“Ensure stable quality”
Various responses to natural disasters
Corporate Social Responsibility (CSR)
Forecast

RESULTS FOR 3Q OF FY2010RESULTS FOR 3Q OF FY2010
SLIDE No.
39 “SMART for GREEN 2020” Concept Image
Realization of low-carbon
society
Formation of recycling-
oriented society
Conservation of biodiversity

Names of companies, products, etc., contained in this document are trademarks or registered trademarks of their respective organizations

Appendices
Copyright (C) 2011 NTT DOCOMO, INC. All rights reserved.

RESULTS FOR 3Q OF FY2010RESULTS FOR 3Q OF FY2010
SLIDE No.
42
0
20
40
60
80
100
120
140
160
180
200
-25
-20
-15
-10
-5
0
5
10
15
20
25
MOU (left axis) 137 138 139 133 135 137 138 133 133 135 133
YOY changes in MOU (r ight axis) -2.1 -1.4 0 -1.5 -1.5 -0.7 -0.7 0 -1.5 -1.5 -3.6
4-6(1Q) 7-9(2Q) 10-12(3Q) 09/1-3(4Q) 4-6(1Q) 7-9(2Q) 10-12(3Q) 10/1-3(4Q) 4-6(1Q) 7-9(2Q) 10-12(3Q)
Cellular (Xi+FOMA+mova)
MOU
・
FY2010/1-3Q(cumulative) MOU: 134
minutes (Down 2.2% year-on-year)
◆For an explanation on MOU, please see “Definition and Calculation Methods of MOU and ARPU”
in this presentation.
(%)(minutes)
FY08 full-year MOU: 137 minutes
(Down 0.7% year-on-year)
FY08 full-year MOU: 137 minutes
(Down 0.7% year-on-year)FY09 full-year MOU: 136 minutes
(Down 0.7% year-on-year)
FY09 full-year MOU: 136 minutes
(Down 0.7% year-on-year)

RESULTS FOR 3Q OF FY2010RESULTS FOR 3Q OF FY2010
SLIDE No.
43 Operating Revenues U.S. GAAP
0
1,000
2,000
3,000
4,000
5,000
6,000
Equipment sales revenues 382.9 359.0 464.0
Other revenues 196.8 251.3 340.0
Cellular services revenues (voice, packet) 2,662.7 2,598.8 3,405.0
2009/4-12(1Q~3Q) 2010/4-12(1Q~3Q)2011/3
(Full year forecast)
(Billions of yen)
(Billions of yen)
◆ “International services revenues”
are included in “Cellular services revenues (voice, packet)”.
4,209.0Down
1.0%
3,209.13,242.4

RESULTS FOR 3Q OF FY2010RESULTS FOR 3Q OF FY2010
SLIDE No.
44 Operating Expenses U.S. GAAP
0
1,000
2,000
3,000
4,000
5,000
Personnel expenses 191.5 195.7 265.0
Taxes and public duties 29.2 29.1 39.0
Depreciation and amortization 511.5 496.1 683.0
Loss on disposal of property, plant andequipment and intangible assets
30.4 23.1 44.0
Communication network charges 234.3 211.6 267.0
Non-personnel expenses 1542.8 1,495.0 2,071.0
(Incl.) Revenue-linked expenses* 925.0 828.7 1,123.0
(Incl.) Other non-personnel expenses 617.8 666.3 948.0
2009/4-12(1Q~3Q) 2010/4-12(1Q~3Q)2011/3
(Full year forecast)(Billions of yen)
(Billions of yen)
* Revenue-linked expenses: Cost of equipment sold + distributor commissions + loyalty program expenses
3,369.0Down 3.5%
2,539.7 2,450.6

RESULTS FOR 3Q OF FY2010RESULTS FOR 3Q OF FY2010
SLIDE No.
45 Capital Expenditures
0
100
200
300
400
500
600
700
800
Other (information systems, etc.) 84.6 92.1 160.0
Mobile phone business (LTE) - 18.0 32.0
Mobile phone business (FOMA) 332.7 277.3 371.0
Mobile phone business (mova) 5.4 4.6 5.0
Mobile phone business (Other) 61.9 76.3 108.0
2009/4-12(1Q~3Q) 2010/4-12(1Q~3Q)2011/3
(Full year forecast)(Billions of yen)
(Billions of yen)
675.0
Down 3.3%
484.5 468.3

RESULTS FOR 3Q OF FY2010RESULTS FOR 3Q OF FY2010
SLIDE No.
462009/4-12
(1Q~3Q) (1)2010/4-12
(1Q~3Q) (2)Changes
(1) → (2)
2011/3
(Full-year forecast)(Announced 10/28/2010)
No. of Subscriptions (thousands)*1 55,436 57,21057,210 +3.2% 57,850mova 3,391 1,6361,636 -51.7% 1,240FOMA 52,045 55,57255,572 +6.8% 56,610Xi - 11 - -i-mode 48,688 48,53048,530 -0.3% 48,870
Cellular Phone
sp-mode - 936936 - -Communication Module Services 1,554 1,8781,878 +20.8% 1,920
Market share (%) 50.1 48.948.9 -1.2
Points -
Handsets sold (thousands)
(including handsets sold without
involving sales by DOCOMO)
Total handsets sold 13,009 13,58713,587 +4.4% -mova
New 9 55 -43.0% -Replacement 6 33 -55.4% -
FOMA
New 3,044 3,4783,478 +14.3% -Migration
from mova 1,850 1,0561,056 -42.9% -Other*2 8,101 9,0449,044 +11.6% -
Churn rate (%) 0.45 0.460.46 +0.01
Points -ARPU(Xi+FOMA+mova)(yen)*3 5,440 5,1705,170 -5.0% 5,100
MOU(Xi+FOMA+mova)(minutes)*3 137 134134 -2.2% -*1 Communication Module Service subscriptions are included in the number of cellular phone subscriptions in order to align the calculation method of subscribers with that of
other cellular phone carriers. (Market share, the number of handsets sold and churn rate are calculated inclusive of Communication Module Service subscriptions.)*2
Other includes purchases of additional handsets by existing FOMA subscribers.*3 For an explanation of MOU and ARPU, please see “Definition and Calculation Methods of MOU and ARPU”
in
this presentation.
Operational Results and Forecasts

RESULTS FOR 3Q OF FY2010RESULTS FOR 3Q OF FY2010
SLIDE No.
47 US GAAP
2009/10-12(3Q) (1)
2010/10-12(3Q) (2)
Changes(1) → (2)
Operating Revenues
(Billions of yen) 1,096.61,096.6 1,071.01,071.0 --2.3%2.3%
Cellular Services Revenues(Billions of yen) 896.6896.6 863.3863.3 --3.7%3.7%
Operating Expenses(Billions of yen) 879.1879.1 843.9843.9 --4.0%4.0%
Operating Income (Billions of yen) 217.4217.4 227.0227.0 +4.4%+4.4%
Income Before Income Taxes(Billions of yen) 221.8221.8 221.6221.6 --0.1%0.1%
Net Income attributable to NTT DOCOMO, INC.
(Billions of yen)134.6134.6 134.2134.2 --0.3%0.3%
EBITDA Margin
(%) * 36.336.3 38.138.1 +1.8+1.8
PointsPoints
Adjusted Free Cash Flow (Billions of yen) * 83.683.6 109.2109.2 ++30.7%30.7%
FY2010/3Q Financial Results
◆Consolidated financial statements in this document are unaudited.◆Adjusted free cash flow excludes the effects of changes in investment for cash management purposes derived from purchases, redemption at maturity
and disposals of financial instruments held for cash management purposes with original maturities of longer than three months.
* For an explanation of the calculation processes for these numbers, please see the reconciliations to the most directly comparable financial measures calculated and presented in accordance with GAAP and
the IR page of our website, www.nttdocomo.co.jp.

RESULTS FOR 3Q OF FY2010RESULTS FOR 3Q OF FY2010
SLIDE No.
48 Definition and Calculation Methods of MOU and ARPU◆ MOU (Minutes of Use): Average monthly communication time per subscription.
◆ ARPU (Average monthly Revenue Per Unit):Average monthly revenue per unit, or ARPU, is used to measure average monthly operating revenues attributable to designated services on a per
subscription basis. ARPU is calculated by dividing various revenue items included in operating revenues from our wireless services, such as basic monthly charges, voice communication charges and packet communication charges, from designated services which are incurred consistently each month, by the number of active subscriptions to the relevant services. Accordingly, the calculation of ARPU excludes revenues that are not representative of monthly average usage such as activation fees. We believe that our ARPU figures provide useful information to analyze the average usage per subscription and the impacts of changes in our billing arrangements. The revenue items included in the numerators of our ARPU figures are based on our U.S. GAAP results of operations. This definition applies to all ARPU figures hereinafter.
◆ Aggregate ARPU (Xi+FOMA+mova): Voice ARPU (Xi+FOMA+mova) + Packet ARPU (Xi+FOMA+mova) ◇ Voice ARPU (Xi+FOMA+mova): Voice ARPU (FOMA+mova) Related Revenues (basic monthly charges, voice communication charges) /
No. of active subscriptions (Xi+FOMA+mova)◇ Packet ARPU (Xi+FOMA+mova): Packet ARPU (Xi+FOMA+mova) Related Revenues (basic monthly charges, packet communication charges) /
No. of active subscriptions (Xi+FOMA+mova)◆ Aggregate ARPU (FOMA): Voice ARPU (FOMA) + Packet ARPU (FOMA)
◇ Voice ARPU (FOMA): Voice ARPU (FOMA) Related Revenues (basic monthly charges, voice
communication charges) / No. of active subscriptions (FOMA)
◇ Packet ARPU (FOMA): Packet ARPU (FOMA) Related Revenues (basic monthly charges, packet communication charges) / No. of active subscriptions (FOMA)
◆ Aggregate ARPU (mova): Voice ARPU (mova) + Packet ARPU (mova)◇ Voice ARPU (mova): Voice ARPU (mova) Related Revenues (basic monthly charges, voice communication charges) /
No. of active subscriptions (mova)◇Packet ARPU (mova): Packet ARPU (mova) Related Revenues (basic monthly charges, packet communication charges) /
No. of active subscriptions (mova)
◆ Active Subscriptions Calculation Methods:Sum of No. of active subscriptions for each month ((No. of subscriptions at the end of previous month + No. of subscriptions at the end of current month) / 2) during the relevant period
Note: Communication module services subscriptions and the revenues thereof are not included in the ARPU and MOU calculations.

RESULTS FOR 3Q OF FY2010RESULTS FOR 3Q OF FY2010
SLIDE No.
49 Reconciliation of the Disclosed Non-GAAP Financial Measures to the Most Directly Comparable GAAP Financial Measures
ⅰ. EBITDA and EBITDA margin Billions of yen
Year endedMarch 31, 2010
Nine months endedDecember 31, 2009
Three months endedDecember 31, 2010
Nine months endedDecember 31, 2010
a. EBITDA ¥ 1,568.1 ¥ 1,234.6 ¥ 407.6 ¥ 1,268.3(701.1) (511.5) (174.1) (496.1)
(32.7) (20.4) (6.4) (13.7)834.2 702.7 227.0 758.5
1.9 (1.0) (5.4) (9.9)(338.2) (283.8) (90.2) (303.4)
(0.9) 3.2 3.4 0.4(2.3) (1.7) (0.6) (1.7)
494.8 419.3 134.2 444.0
4,284.4 3,242.4 1,071.0 3,209.136.6% 38.1% 38.1% 39.5%11.5% 12.9% 12.5% 13.8%
Note:
ii. Free cash flows excluding irregular factors and changes in investments for cash management purposesBillions of yen
Year endedMarch 31, 2010
Nine months endedDecember 31, 2009
Three months endedDecember 31, 2010
Nine months endedDecember 31, 2010
¥ 416.9 ¥ 178.1 ¥ 109.2 ¥ 394.1- (178.0) (171.0) (171.0)
(398.0) (108.3) 11.8 11.518.9 (108.3) (50.0) 234.6
(1,163.9) (700.4) (171.2) (519.9)1,182.8 592.1 121.3 754.5
Notes: (1) Irregular factors represent the effects of uncollected revenues due to a bank closure at the end of the fiscal period.(2) Changes in investments for cash management purposes were derived from purchases, redemption at maturity and disposals of financial instruments held for cash management purposes with original maturities of longer than three months.
Changes in investments for cash management purposes (2)Free cash flowsNet cash used in investing activitiesNet cash provided by operating activities
Free cash flows excluding irregular factors and changes in investmentsfor cash management purposesIrregular factors (1)
EBITDA and EBITDA margin, as we use them, are different from EBITDA as used in Item 10(e) of regulation S-K and may not be comparable to similarly titled measures used by other companies.
b. Net income attributable to NTT DOCOMO, INC.
c. Operating revenues EBITDA margin (=a/c) Net income margin (=b/c)
Depreciation and amortizationLoss on sale or disposal of property, plant and equipmentOperating incomeOther income (expense)Income taxesEquity in net income (losses) of affiliates Less: Net (income) loss attributable to noncontrolling interests

Names of companies, products, etc., contained in this document are the trademarks or registered trademarks of their respective organizations