Ajinomoto Co., Inc.
44
1 Ajinomoto Co., Inc. Consolidated Results Fiscal Year Ended March 31, 2016 This document has been translated from the original Japanese as a guide for non-Japanese investors. It contains forward-looking statements based on a number of assumptions and beliefs made by management in light of information currently available. Actual financial results may differ materially depending on a number of factors, including changing economic conditions, legislative and regulatory developments, delay in new product launches, and pricing and product initiatives of competitors.
-
Upload
khangminh22 -
Category
Documents
-
view
0 -
download
0
Transcript of Ajinomoto Co., Inc.

1
Ajinomoto Co., Inc.
Consolidated Results
Fiscal Year Ended March 31, 2016
This document has been translated from the original Japanese as a guide for non-Japanese investors. It contains forward-looking statements based on a number of assumptions and beliefs made by management in light of information currently available. Actual financial results may differ materially depending on a number of factors, including changing economic conditions, legislative and regulatory developments, delay in new product launches, and pricing and product initiatives of competitors.

2
SUMMARY OF FINANCIAL STATEMENTS (Consolidated)
For the year ended March 31, 2016 Ajinomoto Co., Inc. May 10, 2016Stock Code: 2802 Listed exchanges: Tokyo URL: www.ajinomoto.com/en Inquiries: Koichi Morita President: Takaaki Nishii General Manager
Scheduled date of the general meeting of shareholders: June 29, 2016 Finance and Accounting Department
Scheduled date of starting payment of dividend:
June 30, 2016 Telephone: 813 5250-8161
Scheduled date of submission of securities report: Creation of supplementary results materials: Results briefing:
June 29, 2016 Yes Yes (for analysts)
1. Consolidated Financial Results for the Fiscal Year Ended March 31, 2016 1) Consolidated Operating Results Millions of yen, rounded down FY ended March 31, 2016 FY ended March 31, 2015 Change (%) Change (%) Net sales ........................................................................ 1,185,980 17.8 1,006,630 5.8Operating income .......................................................... 91,045 22.2 74,519 20.6Ordinary income ............................................................ 94,333 13.9 82,808 20.4Profit attributable to owners of parent ............................ 63,592 36.8 46,495 10.3Earnings per share (¥) ................................................... ¥108.14 ¥78.54 Fully diluted earnings per share (¥) ............................... - - Return on equity ............................................................ 9.8% 7.4% Ratio of ordinary income to total assets ......................... 7.5% 7.1% Ratio of operating income to net sales ........................... 7.7% 7.4% Notes: Comprehensive income:
FY ended March 31, 2016: ¥545 million (-99.5%) FY ended March 31, 2015: ¥106,147 million (43.0%)
Gain from investments in subsidiaries and affiliates accounted for by the equity method:
FY ended March 31, 2016: ¥1,558 million FY ended March 31, 2015: ¥5,177 million
2) Financial Position Millions of yen, rounded down
As of March 31, 2016 As of March 31, 2015 Total assets ................................................................... 1,263,264 1,255,090 Net assets ...................................................................... 696,302 743,489 Shareholders’ equity ratio (%) ....................................... 49.4% 53.3% Book value per share (¥) ............................................... ¥1074.36 ¥1,131.41
Note: Shareholders’ equity as of: March 31, 2016: ¥624,245 million
March 31, 2015 ¥669,576 million
3) Cash Flows Millions of yen, rounded down
FY ended March 31, 2016 FY ended March 31, 2015 Net cash provided by operating activities ...................... 125,219 109,259 Net cash used in investing activities .............................. (53,824) (140,391) Net cash used in financing activities .............................. (3,288) 52,822 Cash and cash equivalents at end of year ..................... 217,791 165,160
2. Dividends
FY ended
March 31, 2015FY ended
March 31, 2016FY ending
March 31, 2017 (forecast) Dividend per share Interim ............................................... ¥10.00 ¥13.00 ¥15.00 Year-end ........................................... ¥14.00 ¥15.00 ¥15.00 Annual .............................................. ¥24.00 ¥28.00 ¥30.00 Total annual dividend amount .............. ¥14,203 million ¥16,408 million - Dividend payout ratio ........................... 30.6% 25.9% 33.7% Ratio of dividends to net assets ........... 2.2% 2.5% -

3
3. Forecast for the Fiscal Year Ending March 31, 2017 Millions of yen
FY ending March 31, 2017
Net sales ......................................................
Change (%) 1,186,000 (0.0)
Operating income......................................... 91,000 (-0.0) Ordinary income........................................... 91,600 (2.9) Profit attributable to owners of parent .......... 51,000 (19.8) Earnings per share ....................................... ¥89.08 - Note: “Change %” indicates the percentage change compared to the previous fiscal year.
Notes: 1) Transfer of important subsidiaries during the period (Transfers of certain subsidiaries resulting in changes in the scope of
consolidation): Yes
Newly consolidated: 1 company (Ajinomoto General Foods, Inc.)
Removed from scope of consolidation: 2 companies (Windsor Quality Holdings, LP, and Ajinomoto Sweeteners Europe S.A.S.)
2) Changes in accounting policy, changes in accounting estimates, and retrospective restatements
(1) Changes in line with revision to accounting standards: Yes
(2) Other changes: None (3) Changes in accounting estimates: None
(4) Retrospective restatements: None Note: For more information, see page 28, “4. Consolidated Financial Statements, (5) Notes to the Consolidated Financial Statements, (Changes in
accounting policy)”.
3) Number of shares outstanding (ordinary shares)
(1) Number of shares outstanding at end of fiscal year (including treasury shares):
March 31, 2016: 583,762,654 shares March 31, 2015: 594,470,654 shares
(2) Number of treasury shares at end of fiscal year
March 31, 2016: 2,724,205 shares March 31, 2015: 2,663,656 shares
(3) Average number of shares during period
FY ended March 31, 2016: 588,064,906 shares
FY ended March 31, 2015: 591,984,957 shares
Note: See “Per Share Information” on page 41 for details on the number of outstanding shares used as the basis of calculation of earnings per share.
*Status of implementation of audit procedures This kessan tanshin document is outside the scope of audit procedures based on the Financial Instruments and Exchange Act. As of the time of its disclosure, audit procedures with respect to the financial statements were in the process of being implemented. *Forward-looking statements, such as business forecasts, made in these financial statements are based on managements’ estimates, assumptions and projections at the time of publication and do not represent a commitment from Ajinomoto. Co., Inc. (“the Company”) that they will be achieved. A number of factors could cause actual results to differ materially from expectations. For more information regarding our business forecasts, please refer to page 9, “1. ANALYSIS OF OPERATING RESULTS AND FINANCIAL POSITION, I. Analysis of Operating Results, 2. Outlook for the Fiscal Year Ending March 31, 2017” In the consolidated performance forecast, the average number of shares during period used to calculate the earnings per share considers the impact of the repurchase of own shares, based on the notice regarding the acquisition of own shares released today. (Method of obtaining supplementary results materials) Supplementary results materials will be published on the Company’s website on Tuesday, May 10, 2016.
4
Table of contents
1. Analysis Of Operating Results And Financial Position ................................................................................... 5I. Analysis of Operating Results ................................................................................................................ 5
II. Analysis of Financial Position ................................................................................................................. 11
III. Basic Policy Regarding Allocation of Profits and Dividends for Fiscal Year Ended March 31, 2016 12
and Fiscal Year Ending March 31, 2017 ................................................................................................
2. Management Policy ........................................................................................................................................ 13
I. Basic Management Policy ...................................................................................................................... 13II. Management Goals ................................................................................................................................ 13
III. Tasks Ahead and Medium- to Long-Term Management Strategies ...................................................... 13
3. Basic Rationale For the Selection Of Accounting Standards ......................................................................... 15
4. Consolidated Financial Statements ................................................................................................................ 16(1) Consolidated Balance Sheet .................................................................................................................. 16(2) Consolidated Statement of Income and Consolidated Statement of Comprehensive Income .............. 18
Consolidated Statement of Income ................... .................................................................................... 18
Consolidated Statement of Comprehensive Income .............................................................................. 19
(3) Consolidated Statement of Changes in Net Assets ............................................................................... 20 (4) Consolidated Statement of Cash Flows ................................................................................................. 22
(5) Notes to the Consolidated Financial Statements ................................................................................... 24
Notes Regarding Premise of a Going Concern .................................................................................... 24
Significant Items for the Preparation of Consolidated Financial Statements ....................................... 24 Changes in Accounting Policy .............................................................................................................. 28
Unapplied Accounting Standards, etc. ................................................................................................. 29
Changes in Presentation ...................................................................................................................... 29
Consolidated statement of Cash Flows 29
Consolidated Statement of Income ...................................................................................................... 30
Business Mergers, etc. ......................................................................................................................... 31
Segment Information ............................................................................................................................ 34
Per Share Information ........................................................................................................................... 41 Significant Subsequent Events. ............................................................................................................ 42

5
1. ANALYSIS OF OPERATING RESULTS AND FINANCIAL POSITION
I. Analysis of Operating Results In accordance with the Accounting Standard for Business Combinations (Accounting Standards Board of Japan (ASBJ)
Statement No. 21 of September 13, 2013), the Ajinomoto Group (“the Group”) has replaced the term ‘net income’ with ‘net
profit attributable to owners of parent’ from the fiscal year under review (April 1, 2015–March 31, 2016). For details, please refer to page 28, “4. Consolidated Financial Statements (5) Notes to the Consolidated Financial Statements
(Changes in accounting policy).
1. Consolidated results outline
Billions of yen, rounded down
Net sales Operating income Ordinary income
Profit attributable
to owners of parent
FY ended March 31, 2016 1,185.9 91.0 94.3 63.5
FY ended March 31, 2015 1,006.6 74.5 82.8 46.4
Change 117.8% 122.2% 113.9% 136.8%
Overview of results for the fiscal year under review In the fiscal year under review, the global economy as a whole achieved a moderate recovery, led by improving conditions in the United States and Europe, but countered to some extent by moderate slowdowns in the economies of China and
other emerging countries.
The Japanese economy displayed some signs of weakness in exports and production activity but remained on a
moderate recovery track, supported by improvement in the employment environment and a rebounding capital investment.
In this environment, Ajinomoto is implementing its 2014-2016 Medium-Term Management Plan with the aim of
becoming a “Genuine Global Specialty Company”. Under this plan, the Company is striving to “Advance Growth Drivers"
and “Reinforce the Business Structure” by pursuing specialty businesses, while also endeavoring to “Build a Stronger Management Foundation” to guide the Company over the longer term. Consolidated net sales for the fiscal year ended
March 31, 2016, expanded 17.8%, or ¥179.3 billion, to ¥1,185.9 billion. The gain primarily reflects growth in overseas sales of seasonings and processed foods and the inclusion of two additional companies in the scope of consolidation:
Windsor Quality Holdings, LP (now Ajinomoto Windsor, Inc.; hereafter “Windsor”), a U.S. frozen foods manufacturer and
distributor that was acquired on November 5, 2014, through the acquisition of all outstanding shares; and Ajinomoto General Foods, Inc. (hereafter “AGF”), whose shares were acquired on April 23, 2015. Operating income increased
22.2%, or ¥16.5 billion, to ¥91.0 billion, boosted by contributions from umami seasonings for processed food
manufacturers, the consolidation of AGF, an increase of sales in Seasonings and processed foods (Japan), and other
factors. Ordinary income increased 13.9%, or ¥11.5 billion, to ¥94.3 billion.
Profit attributable to owners of parent increased 36.8%, or ¥17.0 billion, to ¥63.5 billion. The increase includes an
extraordinary gain of ¥24.8 billion resulting from the sale of the Company’s entire equity stake in Nissin-Ajinomoto
Alimentos Ltda., an affiliated instant noodle company in Brazil, as well as an extraordinary gain of ¥18.0 billion realized as a valuation gain (gain on step acquisitions) upon the revaluation of equity interest in AGF held prior to the acquisition of
additional shares in April 2015 to their market value at the time of the additional acquisition. These extraordinary gains offset extraordinary losses related to business restructuring, including a ¥16.6 billion expense incurred for structural
reform of pharmaceutical business and ¥6.9 billion loss on liquidation of subsidiaries related to the sale of shares of a
French subsidiary engaged in production and sale of sweeteners.

6
Changes to main accounting items during the fiscal year under review Note: All comparisons are with the previous fiscal year, ended March 31, 2015, unless otherwise stated.
1) Net sales
Net sales increased 17.8%, or ¥179.3 billion, to ¥1,185.9 billion. By region, sales in Japan expanded 20.9%, or ¥96.2
billion, to ¥556.6 billion, as the consolidation of AGF contributed to a big gain in sales of coffee products. Overseas sales increased significantly, up 15.2%, or ¥83.1 billion, to ¥629.3 billion on increased sales of (1) frozen foods, which included
net sales at Windsor, (2) seasonings and processed foods, and (3) amino acids. By specific overseas geographic region,
sales increased 5.4% to ¥274.5 billion in Asia, 40.3% to ¥245.9 billion in the Americas, but fell 1.4% to ¥108.8 billion in Europe. The foreign sales ratio was 53.1%, compared with 54.3% in the previous fiscal year.
2) Cost of sales / Selling, general and administrative expenses
Cost of sales increased 16.6%, or ¥109.3 billion, to ¥768.8 billion, in line with the growth in net sales. The ratio of the cost
of sales to net sales improved by 0.7 percentage point to 64.8%, mainly due to the consolidation of AGF. Selling, general
and administrative expenses increased 19.6%, or ¥53.4 billion, to ¥326.0 billion, as continued efforts to reduce sales
promotion expenses were outweighed by the impact of an increase in consolidated subsidiaries.
3) Operating income
Operating income increased 22.2%, or ¥16.5 billion, to a record-high ¥91.0 billion. By region, operating income in Japan
expanded 29.6% to ¥38.4 billion, while operating income from overseas operations increased 17.3% to ¥52.6 billion.
Overall operating income at Japan operations rose sharply on contributions from coffee products and seasonings and processed foods, which offset a substantial decline in income from pharmaceuticals. Overseas profits increased
significantly as a whole by contributions from seasonings and processed foods and from frozen foods, which combined offset a sharp decline in profits at the animal nutrition business. By specific overseas geographic region, operating income
increased 22.9% to ¥37.4 billion in Asia, 0.7% to ¥11.7 billion in the Americas, and 24.6% to ¥3.4 billion in Europe. The
overseas operating income ratio was 57.8%, compared to 60.2% in the previous fiscal year.
4) Non-operating income (expenses)
The difference between non-operating income and non-operating expenses was a positive figure of ¥3.2 billion, a
decrease of ¥5.0 billion compared to the positive figure of ¥8.2 billion in the previous fiscal year. The main factors in this decrease were a decline in earnings of non-consolidated subsidiaries and affiliates and a smaller foreign exchange gain.
5) Ordinary income
Ordinary income increased 13.9%, or ¥11.5 billion, to a record-high ¥94.3 billion.
6) Extraordinary gains
Extraordinary gains in the year under review totaled ¥45.3 billion, compared with ¥12.8 billion in the previous fiscal year.
The main extraordinary gains recorded in the fiscal year under review were a ¥24.8 billion gain on the sale of the
Company’s entire equity holdings in Nissin-Ajinomoto Alimentos Ltda. and an ¥18.0 billion gain on step acquisitions of
additional shares of AGF.
7) Extraordinary losses
Extraordinary losses in the fiscal year under review totaled ¥39.3 billion, up from ¥16.6 billion in the previous fiscal year.
The main losses were a ¥16.6 billion on pharmaceutical business restructuring charges, a ¥6.9 billion loss on liquidation
of subsidiaries related to the sale of shares of a French subsidiary engaged in the production and sale of sweetener, and a ¥7.4 billion impairment loss (¥10.4 billion in the previous year) taken primarily on the manufacturing facilities of overseas
subsidiaries. The main impairment items in the fiscal year under review year were ¥3.3 billion for animal nutrition business manufacturing facilities in Thailand and ¥2.0 billion for seasoning manufacturing facilities in China.
7
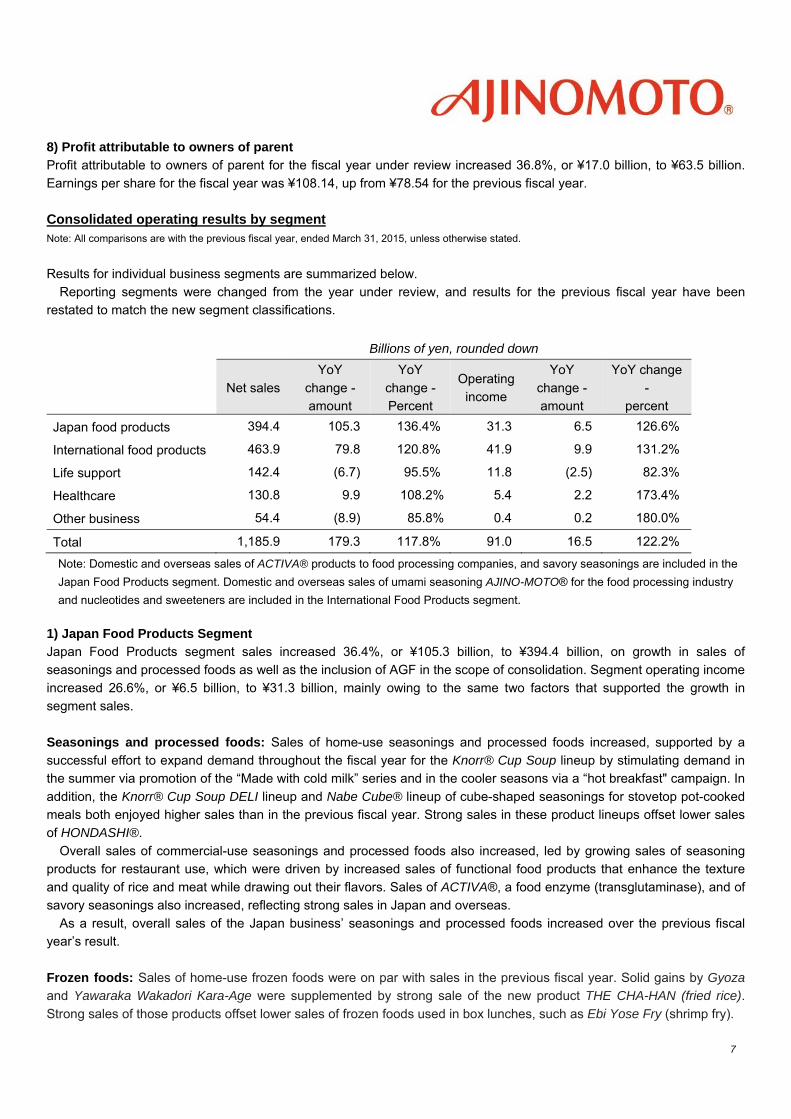
8) Profit attributable to owners of parent
Profit attributable to owners of parent for the fiscal year under review increased 36.8%, or ¥17.0 billion, to ¥63.5 billion.
Earnings per share for the fiscal year was ¥108.14, up from ¥78.54 for the previous fiscal year.
Consolidated operating results by segment Note: All comparisons are with the previous fiscal year, ended March 31, 2015, unless otherwise stated.
Results for individual business segments are summarized below.
Reporting segments were changed from the year under review, and results for the previous fiscal year have been restated to match the new segment classifications.
Billions of yen, rounded down
Net sales
YoY
change -amount
YoY
change - Percent
Operatingincome
YoY
change -amount
YoY change
- percent
Japan food products 394.4 105.3 136.4% 31.3 6.5 126.6%
International food products 463.9 79.8 120.8% 41.9 9.9 131.2%
Life support 142.4 (6.7) 95.5% 11.8 (2.5) 82.3%
Healthcare 130.8 9.9 108.2% 5.4 2.2 173.4%
Other business 54.4 (8.9) 85.8% 0.4 0.2 180.0%
Total 1,185.9 179.3 117.8% 91.0 16.5 122.2%
Note: Domestic and overseas sales of ACTIVA® products to food processing companies, and savory seasonings are included in the
Japan Food Products segment. Domestic and overseas sales of umami seasoning AJINO-MOTO® for the food processing industry
and nucleotides and sweeteners are included in the International Food Products segment.
1) Japan Food Products Segment Japan Food Products segment sales increased 36.4%, or ¥105.3 billion, to ¥394.4 billion, on growth in sales of
seasonings and processed foods as well as the inclusion of AGF in the scope of consolidation. Segment operating income
increased 26.6%, or ¥6.5 billion, to ¥31.3 billion, mainly owing to the same two factors that supported the growth in
segment sales.
Seasonings and processed foods: Sales of home-use seasonings and processed foods increased, supported by a
successful effort to expand demand throughout the fiscal year for the Knorr® Cup Soup lineup by stimulating demand in the summer via promotion of the “Made with cold milk” series and in the cooler seasons via a “hot breakfast" campaign. In
addition, the Knorr® Cup Soup DELI lineup and Nabe Cube® lineup of cube-shaped seasonings for stovetop pot-cooked meals both enjoyed higher sales than in the previous fiscal year. Strong sales in these product lineups offset lower sales
of HONDASHI®.
Overall sales of commercial-use seasonings and processed foods also increased, led by growing sales of seasoning products for restaurant use, which were driven by increased sales of functional food products that enhance the texture
and quality of rice and meat while drawing out their flavors. Sales of ACTIVA®, a food enzyme (transglutaminase), and of
savory seasonings also increased, reflecting strong sales in Japan and overseas.
As a result, overall sales of the Japan business’ seasonings and processed foods increased over the previous fiscal year’s result.
Frozen foods: Sales of home-use frozen foods were on par with sales in the previous fiscal year. Solid gains by Gyoza and Yawaraka Wakadori Kara-Age were supplemented by strong sale of the new product THE CHA-HAN (fried rice).
Strong sales of those products offset lower sales of frozen foods used in box lunches, such as Ebi Yose Fry (shrimp fry).

8
Sales of frozen foods targeted at the commercial market increased year on year on strong sales of chicken, dessert,
and gyoza product offerings.
As a result of the above, overall sales of frozen foods were in line with the previous fiscal year.
Coffee products: Owing to the consolidation of AGF from the first quarter of the current fiscal year, sales of AGF coffee
products are now included in the Japan Food Products segment. Home-use coffee products were strong across the board, with 3 in 1, regular coffee products, and instant coffee
products all posting sales gains. Gift-package products also did well.
Sales of commercial-use products were also strong, supported by increased sales to major customers.
2) International Food Products Segment International Food Products segment sales increased 20.8%, or ¥79.8 billion, to ¥463.9 billion, owing to the inclusion of
Windsor’s sales in consolidated results and to growth in sales of overseas seasonings and processed foods. Operating
income increased 31.2%, or ¥9.9 billion, to ¥41.9 billion, as a weaker yen and other factors increased profits on overseas
sales of umami seasonings for processed food manufacturers. Strong sales of frozen foods and of seasonings and
processed foods also contributed to the growth in segment operating income.
Seasonings and processed foods: In Asia, our umami seasoning AJI-NO-MOTO® enjoyed strong year-on-year sales growth in Vietnam, the Philippines, Indonesia, and Thailand. Sales of RosDee® flavor seasonings and instant noodles in
Thailand increased, and Masako® flavor seasonings in Indonesia also posted a large year-on-year gain. Sales of these
products and a positive impact from exchange rate fluctuations supported the overall growth in sales of our seasonings and processed foods in the Asian region.
In the Americas, region-wide sales fell as the negative effect of exchange rate fluctuations offset growth in sales on a local currency basis of such products as the flavor seasoning Sazón® in Brazil.
Sales in Europe and Africa declined on an overall basis, as sales of AJI-NO-MOTO® in Africa fell below the previous
fiscal year’s level.
As a result of the above, overseas sales of our seasonings and processed foods increased from the previous fiscal
year’s level.
Frozen foods: Overseas sales of frozen foods increased substantially, as strong growth in sales of rice products and noodles products, such as yakisoba, in North America were supplemented by the inclusion of Windsor sales in
consolidated results.
Umami seasonings and sweeteners for processed food manufacturers: Sales of AJI-NO-MOTO® to the food
processing industry increased, driven by expanding sales volumes and higher unit prices in Japan. Overseas sales were on par with the previous fiscal year’s result.
Sales of nucleotides decreased owing to a large decline in overseas sales volumes, which outweighed increased sales
volume in Japan.
Sales of sweeteners declined in the fiscal year under review, as strong growth in sales volumes of aspartame to food
processors was offset by a big drop in sales in South America of powdered juice RefrescoMID®, owing to the negative
impact of exchange rate fluctuations.
Overall, international sales of umami seasonings and sweeteners to processed food manufacturers fell below the previous fiscal year’s level.
3) Life Support Segment Life Support segment sales declined 4.5% or ¥6.7 billion to ¥142.4 billion, as lower sales of animal nutrition products
offset higher sales of specialty chemicals. Operating income fell 17.7%, or ¥2.5 billion, to ¥11.8 billion, with profits on specialty chemicals in line with the previous fiscal year while profits on animal nutrition products were substantially less
than in the previous fiscal year.

9
Animal nutrition: Sales of lysine and threonine declined owing to lower shipment volumes and unit prices. Tryptophan
sales fell sharply as a large decrease in unit price outweighed an increase in sales volume. Sales of specialty products,
such as Valine, were up year on year.
Overall, sales of animal nutrition products were lower than in the previous fiscal year.
Specialty chemicals: Sales of cosmetics ingredients increased in Japan and overseas. However, sales of insulation film
for build-up printed wiring board used in computers decreased.
Overall, specialty chemical sales were higher than in the previous fiscal year.
4) Healthcare segment: Healthcare segment sales increased 8.2% or ¥9.9 billion to ¥130.8 billion, as a significant sales increase of
pharmaceutical custom manufacturing services and a higher sales of amino acids for pharmaceuticals and foods offset a
decline in sales of pharmaceutical products. Operating income expanded 73.4%, or ¥2.2 billion, to ¥5.4 billion. Profits at
the pharmaceutical custom manufacturing business increased substantially while profits on sales of amino acids for
pharmaceuticals and foods were also higher than in the previous fiscal year. Profits on pharmaceutical sales, however, fell
sharply.
Amino acids: Sales of amino acids for pharmaceuticals and foods increased overall, as lower sales in Japan were offset
by an increase in overseas sales, partially owing to the favorable exchange rate translation.
Meanwhile, the pharmaceutical custom manufacturing business achieved strong sales growth on solid sales in North America, Europe and Japan.
Overall, the amino acids business boosted sales over the previous fiscal year’s result.
Pharmaceuticals: Sales of self-distributed products were, overall, on par with the previous fiscal year, as strong growth in
sales of MOVIPREP®, an orally ingested intestinal cleansing solution, outweighed the drop in sales of our branched-chain
amino acid formula LIVACT®, which felt the impact of stiff competition from generics and other rival products.
Sales of products sold through business tie-ups increased, as strong sales of risedronate including osteoporosis
treatment ACTONEL® offset a sharp decline in sales of antihypertensive calcium channel blocker ATELEC®, which felt
the impact of stiff competition from generic drugs and other rival products. Royalty income was lower than in the previous fiscal year.
Overall, sales at the pharmaceutical business fell short of the previous fiscal year’s result.
5) Other Business
Other Business sales declined 14.2%, or ¥8.9 billion, to ¥54.4 billion, but segment operating income increased 80.0%, or ¥0.2 billion, to ¥0.4 billion.
2. Outlook for the Fiscal Year Ending March 31, 2017
Billions of yen, rounded down
Net sales Operating
income
Ordinary
income
Profit (loss) attributable
to owners of parent
FY ending March 31, 2017 1,186.0 91.0 91.6 51.0
FY ended March 31, 2016 1,185.9 91.0 94.3 63.5
Change 100.0% 100.0% 97.1% 80.2%

10
The outlook for the global economy remains clouded by a number of uncertainties, including the impact of slowing
economic growth in emerging economies. However, the US economy continues on a moderate recovery track, and signs
of a turnaround in Europe are emerging. The Ajinomoto Group’s operating environment is expected to remain challenging,
as we face volatile foreign exchange markets and intensifying competition in our bulk and other businesses.
Under this environment, during the fiscal year to March 31, 2017, the final year of the Group’s 2014-2016 Medium-Term
Management Plan, we will strive toward realization of our longer-term goal of becoming a “Genuine Global Specialty Company”, by pursuing specialty businesses to achieve “Advance Growth Drivers" and “Reinforce the Business
Structure”, , while also endeavoring to “Build a Stronger Management Foundation”.
While pursuing these goals, we expect consolidated net sales in the fiscal year ending March 31, 2017, of ¥1,186 billion (on par with the previous year), operating income of ¥91.0 billion (on par with the previous year), and ordinary income of
¥91.6 billion (−2.9% YoY). We expect to post a profit attributable to owners of parent of ¥51.0 billion (−19.8% YoY). These forecasts are based on an assumed exchange rate of ¥110.0 to the U.S. dollar.

11
II. Analysis of Financial Position 1. Overview of year under review Consolidated financial position as of March 31, 2016 Total assets as of March 31, 2016 were ¥1,263.2 billion, ¥8.1 billion more than the ¥1,255.0 billion recorded one year
earlier. Although there was a decrease in yen values of the balance sheets of overseas subsidiaries after translation,
assets increased due to the Company’s additional acquisition of shares of Ajinomoto General Foods, Inc. (hereafter,
“AGF”) and AGF’s inclusion in the scope of consolidation from the first quarter.
Total liabilities were ¥566.9 billion, ¥55.3 billion more than the ¥511.6 billion recorded on March 31, 2015. Total interest-
bearing debt increased ¥53.1 billion from the end of the previous fiscal year to ¥264.7 billion. Net assets decreased ¥47.1 billion compared to the end of the previous fiscal year. Although there was an increase in
retained earnings, net assets decreased mainly due to the purchase of treasury stock and declines in the foreign currency
translation adjustments. Shareholders’ equity, which is net assets minus non-controlling interests, was ¥624.2 billion, and the shareholders’ equity ratio was 49.4%. Summary of consolidated cash flow Net cash provided by operating activities was ¥125.2 billion compared to ¥109.2 billion in the previous year. This was
mainly attributable to ¥100.3 billion in income before income taxes, ¥24.2 billion in gain (loss) on sale of shares in affiliated companies, including shares in Nissin-Ajinomoto Alimentos Ltda., and an ¥18.0 billion gain on step acquisitions
which is not related to movements of funds.
Net cash used in investing activities was an outflow of ¥53.8 billion compared to an outflow of ¥140.3 billion in the previous fiscal year. This was mainly attributable to outflows from the acquisition of tangible fixed assets and additional
acquisition of shares of AGF, which outweighed inflows from the sales of shares in Nissin-Ajinomoto Alimentos Ltda. Net cash used in financing activities was an outflow of ¥3.2 billion compared to an inflow of ¥52.8 billion in the previous
period. Although there was an inflow from the issuance of corporate bonds, the net outflow was mainly attributable to
acquisition of treasury stock.
As a result of the foregoing, cash and cash equivalents at March 31, 2016 totaled ¥217.7 billion, an increase of ¥52.6
billion compared to March 31, 2015.
Billions of yen, rounded down
FY ended
March 31, 2016
FY ended
March 31, 2015 Change
Net cash provided by operating
activities 125.2 109.2 15.9
Net cash provided by (used in) investing activities
(53.8) (140.3) 86.5
Net cash provided by (used in) financing activities
(3.2) 52.8 (56.1)
Effect of exchange rate changes on
cash and cash equivalents (14.1) 12.0 (26.2)
Increase (decrease) in cash and cash
equivalents 53.9 33.7 20.1
Increase (decrease) in initial balance
due to change in scope of consolidation(1.2) 1.3 (2.6)
Cash and cash equivalents at end of
period 217.7 165.1 52.6
12
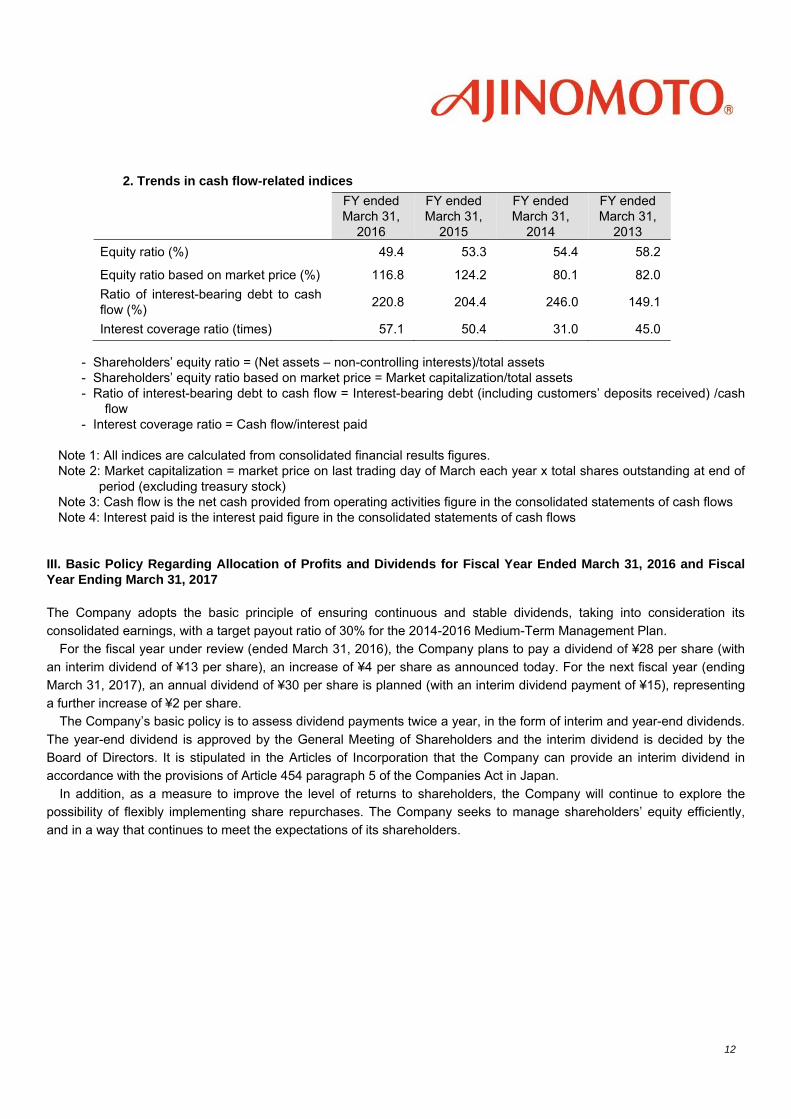
- Shareholders’ equity ratio = (Net assets – non-controlling interests)/total assets - Shareholders’ equity ratio based on market price = Market capitalization/total assets - Ratio of interest-bearing debt to cash flow = Interest-bearing debt (including customers’ deposits received) /cash
flow - Interest coverage ratio = Cash flow/interest paid
Note 1: All indices are calculated from consolidated financial results figures. Note 2: Market capitalization = market price on last trading day of March each year x total shares outstanding at end of
period (excluding treasury stock) Note 3: Cash flow is the net cash provided from operating activities figure in the consolidated statements of cash flows Note 4: Interest paid is the interest paid figure in the consolidated statements of cash flows
III. Basic Policy Regarding Allocation of Profits and Dividends for Fiscal Year Ended March 31, 2016 and Fiscal Year Ending March 31, 2017 The Company adopts the basic principle of ensuring continuous and stable dividends, taking into consideration its
consolidated earnings, with a target payout ratio of 30% for the 2014-2016 Medium-Term Management Plan.
For the fiscal year under review (ended March 31, 2016), the Company plans to pay a dividend of ¥28 per share (with
an interim dividend of ¥13 per share), an increase of ¥4 per share as announced today. For the next fiscal year (ending
March 31, 2017), an annual dividend of ¥30 per share is planned (with an interim dividend payment of ¥15), representing
a further increase of ¥2 per share. The Company’s basic policy is to assess dividend payments twice a year, in the form of interim and year-end dividends.
The year-end dividend is approved by the General Meeting of Shareholders and the interim dividend is decided by the
Board of Directors. It is stipulated in the Articles of Incorporation that the Company can provide an interim dividend in accordance with the provisions of Article 454 paragraph 5 of the Companies Act in Japan.
In addition, as a measure to improve the level of returns to shareholders, the Company will continue to explore the possibility of flexibly implementing share repurchases. The Company seeks to manage shareholders’ equity efficiently,
and in a way that continues to meet the expectations of its shareholders.
2. Trends in cash flow-related indices
FY ended March 31,
2016
FY ended March 31,
2015
FY ended March 31,
2014
FY ended March 31,
2013
Equity ratio (%) 49.4 53.3 54.4 58.2
Equity ratio based on market price (%) 116.8 124.2 80.1 82.0
Ratio of interest-bearing debt to cash flow (%)
220.8 204.4 246.0 149.1
Interest coverage ratio (times) 57.1 50.4 31.0 45.0

13
2. MANAGEMENT POLICY I. Basic Management Policy
What we are aiming for The Ajinomoto Group aspires to be “a group of companies that contributes to human health globally”, by contributing to
significant advances in Food and Health and working for Life, while always taking a global perspective. The Group aspires to contribute to resolving issues that face humankind in the 21st century—global sustainability, securing food sources, and
healthy living. Becoming a “Genuine Global Specialty Company”
The Ajinomoto Group aims to leverage its foundation of advanced bioscience and fine chemical technology to create specialty materials, using open and linked innovation to become a specialty foods group with technology-driven twin
pillars in consumer foods and amino science. II. Management Goals The Ajinomoto Group aims to achieve stable profit growth through specialization, and to establish itself as one of the top
ten corporate groups in the global food business.
The fiscal 2016 targets in the 2014-2016 Medium-Term Management Plan are for operating income of ¥91 billion (with an operating income ratio of 8%), ROE of 9%, and EPS at the 10% level.
For the fiscal year ending March 31, 2017, Ajinomoto forecasts operating income of ¥91 billion (for an operating margin of 7.7%), EPS of ¥89.08, and ROE of 8.1%, and is moving steadily forward toward the achievement of the structural goals
outlined in its medium-term management plan. III. Tasks Ahead and Medium- to Long-Term Management Strategies
<Pursuing the 2014-2016 Medium-Term Management Plan> Under the 2014-2016 Medium-Term Management Plan, the Ajinomoto Group is using the pursuit of specialization with the
aim of becoming a “Genuine Global Specialty Company”, engaging in “Further Reinforcement of Business Structure” and “Growth Driver Enhancement”. By combining proprietary technology with the ability to create value from the discovery of
customer opportunities, the Group seeks to create value in new, differentiated ways, specializing in bulk operations and
increasing capital efficiency through global growth and R&D leadership, while working on “Evolution of the Management
Foundation”. Growth Driver Advancement
1) Global growth In Japan, the Ajinomoto Group will pursue stable growth by continually creating value aligned with the needs of an
increasingly individualized and diverse customer base.
Overseas, the Group will build on its existing strong business foundation in Thailand, Indonesia, Vietnam, the
Philippines and Brazil to expand markets in the Middle East, Africa and elsewhere, aiming to achieve transformational
growth by capturing opportunities arising from the expansion of the middle class and modernization of lifestyles and
distribution.
In November 2014 the Ajinomoto Group acquired Windsor Quality Holdings, LP (currently Ajinomoto Windsor, Inc.), and by combining this company’s marketing skills, nationwide manufacturing and distribution network, and sales skills with the
Group’s technical skills and ability to develop products that are closely aligned to local needs, the Group aims to pursue
further growth in the North American market for Japanese and Asian frozen foods. In April 2015, Ajinomoto Co., Inc. acquired shares and made Ajinomoto General Foods, Inc. a consolidated subsidiary. By working together with powdered
and processed products as a common core, the companies will generate synergies in new product development and manufacturing. 2) R&D Leadership

14
As the world leader in seasonings, the Ajinomoto Group will grow its customer base by engaging even more deeply in the
pursuit of deliciousness, while driving growth by making use of proprietary expertise in cutting-edge biotechnology to
develop sophisticated new biomaterials, promote fermentation using fewer resources, and participate in regenerative
medicine and diagnostic support using AminoIndex technology.
Further Reinforcement of Business Structure 1) Shift to Specialty
For operations with remaining structural issues, the Ajinomoto Group will pursue specialty to increase the value add.
Specifically, in bulk business the Group will increase the proportion of high-value-added materials such as AjiPro®-L lysine agent for ruminant stock in the animal nutrition business. Regarding umami seasonings for processed food, the
Group will increase the retail product ratio by expanding its retail product lineup in and outside Japan based on taste substances and umami seasonings. In bulk business, cost competitiveness will be strengthened through the use of lower
resource fermentation technology and other initiatives. In pharmaceuticals, Japan’s largest specialty gastrointestinal
pharmaceutical company, EA Pharma Co., Ltd., was launched in April 2016 through the integration of Eisai Co., Ltd.’s
gastrointestinal disease treatment business into Ajinomoto Pharmaceuticals Co., Ltd. (absorption-type split). The
companies will generate marketing synergies while reviewing overlapping functions to raise efficiency and boost
profitability, while securing sufficient resources for new product development and ensuring continued growth.
2) Enhancement of Capital Efficiency
In each business value chain, the Ajinomoto Group will make flexible use of outsourcing while internalizing critical
processes, focusing on high added value to increase asset efficiency. Moreover, by constructing a global optimal supply structure compatible with demand, the Group will work to increase ROE and shareholder value.
Evolution of the Management Foundation
To achieve rapid growth in overseas markets, the Ajinomoto Group will expand the delegation of authority to headquarters
in overseas regions. At the same time, the Group introduced a common set of global governance rules for the entire
Ajinomoto Group (global governance policy) in April 2016 to establish an appropriate monitoring function and ensure a
flexible and efficient governance structure. The Group will also put in place a system to accelerate the development of the
next generation of management personnel, increasing diversity by promoting local hires into executive positions and
increasing the ratio of female managers, and creating a stable, sizable pool of global human resources. In addition, the Group will use existing products and resources to develop business opportunities in adjacent domains, working flexibly
with external resources as part of measures to drive rapid growth.
Based on the themes and intent of principles contained in the Corporate Governance Code that has applied to listed companies from June 2015, Ajinomoto Co., Inc. aims to proactively review its corporate governance, identifying and
addressing issues with the goal of realizing an effective corporate governance approach. In this way, the Company aims to accelerate the development of a proactive management decision making structure that will enable the Company to
continue competing strongly in international markets, engaging with shareholders to pursue sustainable growth and higher
corporate value over the medium and long term. <Contribution to key issues facing society in the 21st century through business activities> Since its establishment, the Ajinomoto Group has sustained its initial ambition of making food more delicious and
improving nutrition for people using Umami. The Group addresses such 21st century global issues as global sustainability, food resources and healthy living by means of pursuing Ajinomoto Group Shared Value (ASV), or the creation of social
and economic value by making social contributions through business activities. The Group contributes to health by
developing delicious, regionally appropriate foods and engaging in projects to improve the nutrition and health of people in
developing countries. The Group is also helping to reduce the total food resources needed to support people’s lifestyles,
by introducing bio-cycle technology to enable recycling oriented societies and adopting lower resource fermentation
technology. Ajinomoto Co., Inc. will continue to provide food and nutritional support to people living in areas affected by
the Great East Japan Earthquake until recovery is firmly established.

15
3. BASIC RATIONALE FOR THE SELECTION OF ACCOUNTING STANDARDS
The Company is currently considering the adoption of International Financial Reporting Standards (IFRS) for the fiscal
year ending March 2017, with the aim of enabling international comparison of financial information inside and outside of
the Group and improving communication with shareholders and investors.

16
4. Consolidated Financial Statements (1) Consolidated Balance Sheet
Millions of yen, rounded down As of March 31, 2016 As of March 31, 2015 Assets Current assets
Cash on hand and in banks ......................................... 221,242 168,294Notes and accounts receivable ................................... 181,860 202,980Marketable securities .................................................. - 608Goods and products .................................................... 116,303 117,297Goods in process ........................................................ 8,270 8,871Raw materials and supplies ........................................ 55,674 57,493Deferred tax assets ..................................................... 9,711 8,706Other ............................................................................ 33,448 44,959Allowance for doubtful accounts ................................. (1,191) (1,291)
Total current assets ................................................. 625,319 607,919Fixed assets Tangible fixed assets
Buildings and structures .............................................. 362,650 377,948Accumulated depreciation and accumulated impairment losses ....................................................
(218,576) (229,556)
Net buildings and structures .................................... 144,074 148,391
Machinery and vehicles ............................................... 588,820 609,015
Accumulated depreciation and accumulated impairment losses .................................................... (438,207) (456,824)Net machinery and vehicles..................................... 150,613 152,191
Tools, furniture and fixtures ......................................... 70,145 71,812Accumulated depreciation and accumulated impairment losses .................................................... (56,383) (58,259)Net tools, furniture and fixtures ................................ 13,762 13,553
Land ............................................................................. 53,772 47,583Leased assets ............................................................. 3,579 4,865
Accumulated depreciation and accumulated impairment losses .................................................... (1,861) (3,135)Net leased assets .................................................... 1,718 1,729
Construction in progress ............................................. 22,260 19,819
Total tangible fixed assets ......................................... 386,201 383,269
Intangible fixed assets Goodwill ....................................................................... 89,450 71,396Other ............................................................................ 46,560 49,259Total intangible fixed assets ...................................... 136,011 120,656
Investments and other assets Investments in securities ............................................. 96,133 125,440
Long-term loans receivable ......................................... 1,084 2,820
Deferred tax assets ..................................................... 4,930 3,986Net defined benefit assets ........................................... 964 698Other ............................................................................ 13,237 10,784Allowance for doubtful accounts ................................. (320) (299)
Allowance for investment losses ................................. (297) (186)
Total investments and other assets ........................... 115,732 143,244Total fixed assets .................................................... 637,944 647,170
Total assets 1,263,264 1,255,090

17
(Continued)
Millions of yen, rounded down
As of March 31, 2016 As of March 31, 2015
Liabilities
Current liabilities
Notes and accounts payable ..................................... 90,459 114,488
Short-term borrowings ............................................... 6,456 87,191
Commercial paper ...................................................... - 15,000
Current portion of bonds ............................................ - 15,000
Current portion of long-term borrowings .................... 11,189 18,677
Accrued income taxes ................................................ 10,288 7,725
Bonus reserve ............................................................ 9,863 7,601
Bonus reserve for directors and others ...................... 427 420
Provision for shareholder benefit program ................ 160 200
Asset retirement obligations 27 -
Other .......................................................................... 103,962 92,288
Total current liabilities ............................................. 232,834 358,594
Long-term liabilities
Corporate bonds ........................................................ 89,995 19,994
Long-term borrowings ................................................ 155,211 54,152
Deferred tax liabilities ................................................. 13,892 13,028
Accrued retirement benefits for directors and others.. 435 427
Provision for loss on guarantees ............................... 681 564
Allowance for environmental measures ..................... 585 648
Liability for retirement benefit ..................................... 52,325 43,631
Asset retirement obligations ...................................... 594 509
Other .......................................................................... 20,405 20,048
Total long-term liabilities ......................................... 334,127 153,006
Total Liabilities ............................................................ 566,962 511,600
Net assets Shareholders’ equity
Common stock .......................................................... 79,863 79,863
Capital surplus ........................................................... 26,031 53,725
Retained earnings ..................................................... 582,824 536,170 Treasury stock .......................................................... (6,944) (4,070)
Total shareholders’ equity 681,775 665,689
Accumulated other comprehensive income
Unrealized holding gain on securities ........................ 17,804 22,783
Unrealized gain (loss) from hedging instruments ...... (1,578) 223 Translation adjustments ............................................. (47,746) (4,655)
Accumulated adjustments for retirement benefits ..... (26,008) (14,465)
Total accumulated other comprehensive income (loss) ... (57,529) 3,886
Non-controlling interests ............................................ 72,056 73,913
Total net assets ........................................................... 696,302 743,489
Total liabilities & net assets ....................................... 1,263,264 1,255,090

18
(2) Consolidated Statement of Income and Consolidated Statement of Comprehensive Income Consolidated Statement of Income
Millions of yen, rounded down
FY ended Mar. 31, 2016 FY ended Mar. 31, 2015
Net sales ........................................................................ 1,185,980 1,006,630 Cost of sales .................................................................. 768,865 659,509 Gross profit ................................................................... 417,115 347,121 Selling, general and administrative expenses ............... 326,069 272,601
Operating income .................................................... 91,045 74,519 Non-operating income
Interest income ............................................................ 2,847 2,873 Dividend income .......................................................... 1,317 1,147 Equity in earnings of non-consolidated subsidiaries and affiliates ................................................................
1,558 5,177
Foreign exchange gain ................................................ 583 1,675 Other ............................................................................ 2,716 3,512
Total non-operating income .................................... 9,023 14,384 Non-operating expenses
Interest expense .......................................................... 2,269 2,140 Commission fee ........................................................... 72 675 Other ............................................................................ 3,394 3,281
Total non-operating expenses ................................. 5,736 6,096
Ordinary income ...................................................... 94,333 82,808 Extraordinary gains
Gain on sale of shares in affiliated companies *1 24,872 -
Gain on step acquisitions 18,027 -
Gain on abolishment of retirement benefit plan .......... - 9,290
Other ............................................................................ 2,438 3,568
Total extraordinary gains ......................................... 45,337 12,858
Extraordinary losses
Loss on liquidation of subsidiaries *2 6,937 - Loss on disposal of fixed assets ................................. 2,799 1,757 Pharmaceutical business restructuring charges *3 16,623 - Impairment losses ....................................................... *4 7,467 10,486 Other ............................................................................ 5,525 4,374
Total extraordinary losses ....................................... 39,352 16,617
Net income before taxes ............................................... 100,318 79,049
Income, inhabitant and business taxes ................................ 24,907 18,932 Income and other tax adjustments ............................... 2,140 4,741 Income taxes – total ...................................................... 27,047 23,673 Net income .................................................................... 73,270 55,375 Profit attributable to non-controlling interests ................ 9,678 8,880
Profit attributable to owners of parent ...................... 63,592 46,495

19
Consolidated Statement of Comprehensive Income Millions of yen, rounded down
FY ended Mar. 31, 2016 FY ended Mar. 31, 2015
Net income .................................................................... 73,270 55,375Other comprehensive income
Unrealized holding gain on securities ....................... (4,688) 8,929Unrealized gain (loss) from hedging instruments ...... (1,509) 143Translation adjustments ............................................. (57,756) 34,129Adjustment for retirement benefits ................................ (11,159) 6,110Share of other comprehensive income of equity method affiliates ......................................................... 2,387 1,459
Total other comprehensive income ........................ (72,724) 50,771 Comprehensive income 545 106,147
(Breakdown) Comprehensive income attributable to owners of
parent (426) 89,900
Comprehensive income attributable to non-controlling interests
972 16,247

20
(3) Consolidated Statement of Changes in Net Assets (Fiscal year ended March 31, 2016)
Millions of yen, rounded down Shareholders’ Equity Common
stock Capital surplus
Retained earnings
Treasury stock
Total shareholders'
equity Balances as of March 31, 2015 79,863 53,725 536,170 (4,070) 665,689Changes in fiscal year ended March 31, 2016 Dividends from retained earnings ............................ (15,978) (15,978)Profit attributable to owners of parent ...................... 63,592 63,592Changes in the scope of consolidation .................... (266) (266)Changes in the scope of equity method ..................
Changes in retained earnings at subsidiaries resulting from change in fiscal year end .................. (693) (693)Purchase of treasury stock ...................................... (30,167) (30,167)Disposal of treasury stock ........................................ (27,292) 27,293 1Changes in a parent’s ownership interest due to transactions with non-controlling interests (402) (402)Net changes of items other than those in shareholders' equity ................................................ Total of changes in fiscal year ended March 31, 2016 - (27,694) 46,653 (2,873) 16,086
Balances as of March 31, 2016 79,863 26,031 582,824 (6,944) 681,775
Millions of yen, rounded down Accumulated Other Comprehensive Income
Non-
controlling
interests
Total net
assets
Unrealized
holding
gain on
securities
Unrealized
gain (loss)
from
hedging
instruments
Translation
adjustments
Adjustment
for
retirement
benefits
Total
accumulated
other
comprehensi
ve income
Balances as of March 31, 2015 22,783 223 (4,655) (14,465) 3,886 73,913 743,489Changes in fiscal year ended March 31, 2016 Dividends from retained earnings ............................ (15,978)Profit attributable to owners of parent ...................... 63,592Changes in the scope of consolidation .................... (266)Changes in the scope of equity method .................. Changes in retained earnings at subsidiaries resulting from change in fiscal year end ..................
(693)
Purchase of treasury stock ...................................... (30,167)
Disposal of treasury stock ....................................... 1Changes in a parent’s ownership interest due to transactions with non-controlling interests (402)Net changes in items other than those in shareholders’ equity ................................................ (4,979) (1,802) (43,090) (11,543) (61,416) (1,856) (63,273)Total of changes in fiscal year ended March 31, 2016 (4,979) (1,802) (43,090) (11,543) (61,416) (1,856) (47,187)
Balances as of March 31, 2016 17,804 (1,578) (47,746) (26,008) (57,529) 72,056 696,302

21
(Continued)
(3) Consolidated Statement of Changes in Net Assets (Fiscal year ended March 31, 2015)
Millions of yen, rounded down Shareholders’ Equity Common
stock Capital surplus
Retained earnings
Treasury stock
Total shareholder
s' equity Balances as of March 31, 2014 79,863 83,443 501,945 (31,085) 634,168Changes in fiscal year ended March 31, 2015 Dividends from retained earnings ..................... (11,854) (11,854)Profit attributable to owners of parent ............... 46,495 46,495Changes in the scope of consolidation ............. (310) (310)Changes in the scope of equity method ............ (57) (57)Changes in retained earnings at subsidiaries resulting from change in fiscal year end ........... (47) (47)Purchase of treasury stock ............................... (2,706) (2,706)Disposal of treasury stock ................................. (29,718) 29,721 2Changes in a parent’s ownership interest due to transactions with non-controlling interests Net changes of items other than those in shareholders' equity .......................................... Total of changes in fiscal year ended March 31, 2015 - (29,718) 34,224 27,014 31,521
Balances as of March 31, 2015 79,863 53,725 536,170 (4,070) 665,689
Millions of yen, rounded down Accumulated Other Comprehensive Income
Non-
controlling
interests
Total net
assets
Unrealized
holding
gain on
securities
Unrealized
gain (loss)
from
hedging
instruments
Translation
adjustments
Adjustment
for
retirement
benefits
Total
accumulated
other
comprehensi
ve income
Balances as of March 31, 2014 13,043 (26) (31,668) (20,567) (39,218) 60,557 655,507Changes in fiscal year ended March 31, 2015 Dividends from retained earnings ............................ (11,854)Profit attributable to owners of parent ...................... 46,495Changes in the scope of consolidation .................... (300) (300) (611)
Changes in the scope of equity method .................. (57)Changes in retained earnings at subsidiaries resulting from change in fiscal year end ..................
(47)
Purchase of treasury stock ...................................... (2,706)Disposal of treasury stock ....................................... 2Changes in a parent’s ownership interest due to transactions with non-controlling interests Net changes in items other than those in shareholders’ equity ................................................ 9,739 249 27,013 6,402 43,405 13,355 56,760Total of changes in fiscal year ended March 31, 2015 9,739 249 27,013 6,102 43,104 13,355 87,981
Balances as of March 31, 2015 22,783 223 (4,655) (14,465) 3,886 73,913 743,489

22
(4) Consolidated Statement of Cash Flows Millions of yen, rounded down FY ended
Mar. 31, 2016 FY ended
Mar. 31, 2015 I. Cash flows from operating activities
Income before income taxes .......................................................... 100,318 79,049 Depreciation and amortization........................................................ 50,920 43,376 Loss on impairment of fixed assets ................................................ 7,467 10,486 Amortization of goodwill and negative goodwill.............................. 7,093 2,201 Increase (decrease) in allowance for doubtful accounts................ 40 (56) Increase (decrease) in bonus reserve ............................................ 1,639 1,461 Increase (decrease) in bonus reserve for directors and others ..... 7 97 Increase (decrease) in accrued employees’ retirement benefits ... (5,526) (1,957)
Increase (decrease) in allowance for directors' retirement benefits ...........................................................................................
(280) 12
Increase (decrease) in allowance for environmental measures..... (62) 306 Increase (decrease) in allowance for investment losses ............... 217 90 Increase (decrease) in provision for loss on guarantees ............... 116 564 Interest and dividend income ......................................................... (4,164) (4,020) Interest expense ............................................................................. 2,269 2,140 Equity in (earnings) loss of non-consolidated subsidiaries and affiliates ..........................................................................................
(1,558)
(5,177)
Loss (gain) on sale and disposal of tangible fixed assets .............. 2,074 598
Loss (gain) on sale of shares in affiliates ....................................... (24,298) -
Loss (gain) on liquidation of affiliates ............................................. 6,937 -
Pharmaceutical business restructuring charges 16,623 -
Loss (gain) on step acquisitions (18,027) -
Gain on abolishment of retirement benefit plan ............................. - (9,290)
Decrease (increase) in notes and accounts receivable ................. 12,494 92 Increase (decrease) in notes and accounts payable ..................... (2,039) 2,605 Decrease (increase) in inventories ................................................. 2,907 (4,768)
Increase (decrease) in accrued consumption tax .......................... (727) 3,258 Decrease (increase) in other current assets .................................. 2,653 (9,232) Increase (decrease) in other current liabilities ............................... 1,408 1,642
Other ............................................................................................... (11,569) 3,789
Sub-total ...................................................................................... 146,935 117,270Insurance fees received ................................................................. 356 100Interest and dividends received ..................................................... 5,901 5,370
Cancellation of contracts paid (3,835) - Interest paid .................................................................................... (2,191) (2,166) Income taxes paid .......................................................................... (21,947) (11,344) Refund of income taxes for prior periods ....................................... - 28
Net cash provided by operating activities............................. 125,219 109,259

23
(Continued)
Millions of yen, rounded down FY ended
Mar. 31, 2016 FY ended
Mar. 31, 2015 II. Cash flows from investing activities
Acquisition of tangible fixed assets ..................................................... (51,396) (45,056) Proceeds from sale of tangible fixed assets ........................................ 1,263 1,819 Acquisition of intangible assets ........................................................... (4,430) (3,875) Acquisition of investment securities .................................................... (2,369) (129) Proceeds from sale of investment securities ....................................... 13 15 Proceeds from sales of investments in subsidiaries resulting in change in scope of consolidation ........................................................
-
(91,461)
Acquisition of investments in subsidiaries resulting in change in scope of consolidation .........................................................................
(26,553)
-
Proceeds from sales of investments in subsidiaries resulting in change in scope of consolidation
4,133
-
Acquisition of shares of affiliates......................................................... (6,616) (2,456) Proceeds from sales of shares in subsidiaries .................................... 32,500 - Decrease (increase) in term deposits ................................................. (201) (572) Other .................................................................................................... (166) 1,325
Net cash used in investing activities ................... ............ .......... (53,824) (140,391)
III. Cash flows from financing activities Net change in short-term borrowings .................................................. (86,107) 72,939
Commercial paper ............................................................................... (15,000) 15,000
Proceeds from long-term debt ............................................................. 116,011 3,022
Repayment of long-term debt .............................................................. (22,381) (7,025)
Proceeds from issuance of bonds 70,000 - Redemption of bonds .......................................................................... (15,000) (15,000) Cash dividends paid ............................................................................ (15,982) (11,855) Distribution of dividends to non-controlling interests........................... (3,693) (2,794) Decrease (increase) in money held in trusts for repurchase of treasury stock ......................................................................................
-
2,520
Acquisition of treasury stock ................................................................ (30,187) (2,707) Sale of treasury stock .......................................................................... 1 2 Acquisition of investments in subsidiaries not resulting in change in scope of consolidation
(644)
-
Other .................................................................................................... (304) (1,279) Net cash provided by financing activities .................................. (3,288) 52,822
IV. Effect of exchange rate changes on cash and cash equivalents .....................................................................................
(14,180)
12,071
V. Increase (decrease) in cash and cash equivalents .................... 53,925 33,762 VI. Cash and cash equivalents at the beginning of the year .......... 165,160 130,028
Increase in cash and cash equivalents from newly consolidated subsidiaries..........................................................................................
278
1,356
Decrease in cash and cash equivalents on exclusion from consolidation
(460)
-
Increase (decrease) in cash and equivalents resulting from change of fiscal year end of consolidated subsidiaries ....................................
(1,112)
13
VII. Cash and cash equivalents at the end of the year .................... 217,791 165,160

24
(5) Notes to the Consolidated Financial Statements Notes Regarding Premise of a Going Concern No applicable items.
Significant Items for the Preparation of Consolidated Financial Statements
1. Scope of consolidation
(1) Number of consolidated subsidiaries: 96
(2) Names of main non-consolidated subsidiaries
Ajinomoto Toyo Frozen Noodles, Inc.
(Reasons for exclusion from scope of consolidation) Subsidiaries classified as non-consolidated are all small, and none has total assets, sales, current year net income
(corresponding to the percentage of shares held), retained earnings (corresponding to the percentage of shares held),
etc. that materially impact the consolidated financial statements.
(3) Ajinomoto General Foods, Inc. (AGF), and its two subsidiaries became consolidated subsidiaries through an
additional share acquisition by the Company. In addition, Ajinomoto SEA Regional Headquarters Co. Ltd.; Ajinomoto Genexine Co., Ltd.; Gaban Spice Manufacturing (M) SDN. BHD.; Si Ayutthaya Realestate Co., Ltd.; Erawan Industrial
Development Co., Ltd.; and Bangkok Animal Research Center Co., Ltd., were included in the scope of consolidated subsidiaries as they have become more material members of the Ajinomoto Group.
On the other hand, companies removed from the scope of consolidation including STAR AND SUN PTE. LTD. which
was removed following the transfer of the shares, Ajinomoto Sweeteners Europe S.A.S. which was removed following the recognition of ceasing to have a substantial controlling interest based on the contents of the share-transfer
agreement, and Shenzhen Amoy Foods Ltd., which was liquidated.
In addition, Windsor Quality Holdings, LP, its eight subsidiaries, and Amoy North America, Inc., were excluded from
the scope of consolidation following their integration with Ajinomoto Frozen Foods U.S.A., Inc. (AFU), as part of the
restructuring of the Company’s organization in North America. Following the absorption-type merger, AFU changed its
name to Ajinomoto Windsor, Inc., which is the surviving company.
2. Scope of application of the equity method
(1) Number of affiliated companies accounted for by the equity method: 4 companies
Names of main companies:
J-OIL MILLS, INC. (2) Major non-consolidated affiliated company not accounted for by the equity method is Kükre A.Ş. The company is
immaterial to the consolidated results (net income and retained earnings) and therefore it has immaterial impact as a
whole, they are not included in the scope of the equity method.
(3) NISSIN-AJINOMOTO ALIMENTOS LTDA. was removed from the scope of equity-method accounting following the
transfer of the Company’s entire equity stake, and AY PHARMACEUTICALS Co., Ltd. was also removed following the transfer of the shares. In addition, AGF was removed from the scope of equity-method when it became consolidated
subsidiaries through an additional share acquisition by the Company, Si Ayutthaya Real Estate, Erawan Industrial Development, and Bangkok Animal Research Center were also removed from the scope of equity-method when they
became consolidated subsidiaries as they have become more material members of the Ajinomoto Group.
3. Fiscal year, etc., of consolidated subsidiaries and affiliated companies accounted for by the equity method
The fiscal year-end for 14 consolidated subsidiaries including Ajinomoto del Peru S.A., is December 31, but all 15
prepare financial statements as of March 31 for consolidation purposes.

25
Ajinomoto Windsor, the surviving company created by an absorption-type merger, changed its fiscal year-end from the
December 31 year-end used by the former Windsor Quality Holdings, LP, to March 31. In accordance with this change,
loss and gain for the period of January 1, 2015 to March 31, 2015 has been incorporated as an adjustment of retained
earnings, and cash flow has been recorded as an increase (decrease) in cash and equivalents resulting from change of
fiscal year end of consolidated subsidiaries.
4. Accounting policies (1) Valuation standards and methods
1) Marketable securities
Other securities: Other securities for which market value is available are stated at market value at the fiscal year end and the changes
in market value, net of applicable income taxes, are directly charged or credited to net assets. The cost of such
securities sold is mainly determined by the moving-average method. Other securities for which a price is not available are stated at cost, mainly determined by the moving average
method.
2) Derivatives:
Derivatives are accounted for at fair value.
However, with respect to interest rate swaps for which criteria for special treatment are met, special treatment is, in principle, applied. Total treatment is applied with respect to interest rate and currency swaps, in cases where criteria
for total treatment (special treatment, appropriated treatment) are met.
3) Inventories: Inventories of the Company and its domestic consolidated subsidiaries are mainly stated at cost determined by the
average method (in cases where the profitability has declined, the book value is reduced accordingly). Inventories
of overseas consolidated subsidiaries are mainly stated at the lower of cost or market, cost being determined by
the average method.
(2) Depreciation and amortization of significant depreciable assets 1) Tangible fixed assets (excluding leased assets):
The Company and its consolidated subsidiaries recognize their depreciation expense mainly by using the straight-line method. The range of useful life is from 3 to 50 years for buildings and structures and from 2 to 20 years for
machinery and vehicles.
2) Intangible fixed assets (excluding leased assets):
Amortization of intangible fixed assets also is calculated mainly using the straight-line method. Computer software
held by the Company and its domestic consolidated subsidiaries for internal use is amortized by the straight-line
method over the estimated useful life (5 years). Customer-related assets also are amortized using the straight-line
method over the period of future expected earnings generation (6–15 years).
3) Lease assets
The straight-line method is applied with the useful life of the asset being the lease term and the residual value being zero. Finance lease transactions that do not transfer ownership, for which the starting date of the lease was March
31, 2008 or earlier, are accounted for as operating leases.
(3) Accounting for significant reserves 1) Allowance for doubtful accounts
An allowance for doubtful accounts is provided for possible bad debts at the amount estimated based on historical
bad debt experience for normal receivables and by reference to the individual collectability of specific doubtful
receivables.
2) Bonus reserve:

26
At certain consolidated subsidiaries, a bonus reserve for employees has been provided based on the estimated
amount to be paid to employees.
3) Accrued retirement benefits for directors and others:
At the Company and certain domestic consolidated subsidiaries, accrued retirement benefits for directors and others are provided at the amount required to be paid in accordance with internal rules in order to provide for payment of
severance benefits to those directors and others.
The Company abolished the system of payment of severance benefits to directors in June 2007, and has decided to pay severance benefits at the time of retirement with respect to the period in which the system was applied.
4) Provision for loss on guarantees
In preparation for payment relating to loss on guarantees and in consideration of the financial position, etc., of the guaranteed parties, an allowance has been recorded for the estimated amount of loss to be incurred.
5) Bonus reserve for directors and others:
In preparation for the payment of bonuses to directors and others, a bonus reserve for directors and others has
been provided for the amount of payment expected for the fiscal year ended March 31, 2016.
6) Allowance for environmental measures: In preparation for payment relating to disposal of polychlorinated biphenyl (PCB) and other wastes, an allowance for
environmental measures has been provided for the amount of costs expected to be incurred.
7) Provision for shareholder benefit program
In preparation for payment relating to the shareholder benefit program, a provision for shareholder benefit program
has been provided for the amount of payment expected, based on past results, for the fiscal year ending March 31,
2017.
(4) Accounting for retirement benefits for employees
1) Method of attributing expected benefit to periods
In calculating retirement benefit obligations, the method for attributing expected benefits to the fiscal year is based on the benefit formula.
2) Method for processing actuarial gains and losses and prior service cost
Prior service cost is amortized by the straight-line method over a period within the average remaining service years for employees (mainly 10 years) at the time of recognition. Actuarial gain and loss is amortized by the straight-line
method over a period within the average remaining service years for employees (mainly 10 years) at the time of
recognition, and allocated proportionately from the fiscal year following the respective fiscal year of recognition.
(5) Translation of significant assets and liabilities denominated in foreign currencies into yen
Monetary assets and liabilities denominated in foreign currencies have been translated into yen at the rates of exchange in effect at the fiscal year end. The resulting exchange gain or loss is charged or credited to income. Assets
and liabilities of overseas subsidiaries have been translated into yen at the exchange rates in effect as of the fiscal year-end, and revenues and expenses of overseas subsidiaries have been translated into yen at the average rates
prevailing during the fiscal year. The resulting translation differences are included in non-controlling interests and
translation adjustments in net assets.
(6) Hedge accounting
1) Hedge accounting method
The Company and its consolidated subsidiaries adopt deferred hedge accounting. Special treatment is, in principle,
applied with respect to interest rate swaps, in cases where criteria for special treatment are met. Total treatment is
applied with respect to interest rate and currency swaps, in cases where criteria for total treatment (special treatment, appropriated treatment) are met.
2) Means of hedging and transactions subject to hedging

27
Foreign exchange forward contracts Forecast transactions and sales transactions pertaining to the acquisition of stock of or
investments in affiliated companies
denominated in foreign currencies, forecast
transactions pertaining to the purchase
Interest rate swaps Interest paid on bond issues and other
borrowings
Interest rate and currency swaps Interest paid on borrowings, foreign currency
borrowings
3) Hedging policy
The Company and some of its consolidated subsidiaries hedge foreign exchange rate risk and interest rate risk for
certain transactions, mainly those that are financially significant and that can be recognized individually, based on
internal rules for derivative transactions.
4) Methods for evaluating the effectiveness of hedges
Assessment of hedge effectiveness is not undertaken for forward exchange contracts, as the material conditions
pertaining to the hedging instrument and the hedged item are identical. For interest rate swaps and interest rate and currency swaps for which special treatment is applied, evaluation of effectiveness is not conducted.
(7) Amortization of goodwill
As a general rule, goodwill is amortized on a straight-line basis over its estimated useful life. However, immaterial
goodwill is charged or credited to expense or income at the time of acquisition.
(8) Scope of ‘Cash’ in the Consolidated Statement of Cash Flows
The category ‘cash’ covers cash on hand, deposits with immediate liquidity, and easily convertible short-term
investments with low risk of price fluctuation that mature within three months of acquisition.
(9) Other significant items for the preparation of consolidated financial statements
1) Accounting for consumption taxes
Transactions of the Company and domestic consolidated subsidiaries subject to consumption tax and/or regional
consumption tax are recorded at amounts exclusive of the consumption tax. Unearned consumption tax is included in
‘Current assets – Other’, while unpaid consumption tax is included in ‘Current liabilities – Other.’
2) Adoption of consolidated tax accounting system
The Company and some of its consolidated subsidiaries adopt the consolidated taxation system, with Ajinomoto Co., Inc. as the consolidated taxable parent company.
3) Recognition of revenue from finance lease transactions
Revenue from finance lease transactions is not recorded in sales, but instead recorded by allocating the
corresponding amount of interest to each period.

28
Changes in Accounting Policy
The following changes to accounting policies were applied from the fiscal year under review: Accounting Standard for
Business Combinations (Accounting Standards Board of Japan (ASBJ) Statement No. 21 of September 13, 2013);
Accounting Standard for Consolidated Financial Statements (ASBJ Statement No. 22 of September 13, 2013); and
Accounting Standard for Business Divestitures (ASBJ Statement No. 7 of September 13, 2013). Accordingly, in cases where the parent company continues to have control, differences arising from changes in holdings of equity-method
subsidiaries are now recorded in capital surplus, and expenses related to business merger are now treated as expenses
in the consolidated financial statements for the year in which they arise. For business combinations which occur after the beginning of the current fiscal year, any change to the allocation of the acquisition cost arising from confirmation of the
provisional accounting treatment must now be reflected in the consolidated financial statements for the year in which the business combination occurred. In addition, some changes were made to presentation of net income and ‘minority
interests’ has been changed to ‘non-controlling interests’. Consolidated financial statements for the previous fiscal year
have been restated in order to reflect this change in presentation.
In the consolidated statement of cash flows for the fiscal year under review, cash flows stemming from the acquisition
or sale of shares of subsidiaries that does not result in changes in the scope of consolidation are included in ‘cash flows
from financing activities', while cash flows stemming from expenditures related to the acquisition of shares of a subsidiary
that result in changes in the scope of consolidation and cash flows stemming from expenditures related to the acquisition or sale of shares of subsidiaries that do not result in changes in the scope of consolidation are included in ‘cash flows
from operating activities’.
Application of the newly adopted accounting standards noted at the outset of this section has been implemented from the start of the fiscal year under review, in accordance with the transitional provisions in Article 58-2(4) of the Accounting
Standard for Business Combinations, Article 44-5(4) of the Accounting Standard for Consolidated Financial Statements, and Article 57-4(4) of the Accounting Standard for Business Divestitures.
As a result of these changes in accounting policy, operating income for the fiscal year under review increased ¥132
million, and ordinary income and income before income taxes each increased ¥122 million compared to the results that
would have obtained using the previous standards. In addition, the capital surplus as of the end of the current fiscal year
decreased ¥402 million compared to the result that would have obtained using the previous standards. Similarly, earnings
per share for the fiscal year under review increased ¥0.21 while net assets per share as of the end of the fiscal year
decreased by ¥0.48.

29
Unapplied Accounting Standards, etc. Implementation Guidance on Recoverability of Deferred Tax Assets (ASBJ Guidance No. 26 of March 28, 2016) 1. Outline The practical guidance on accounting standards and auditing standards (where it is related to the accounting treatment)
for tax effect accounting, issued by the Japanese Institute of Certified Public Accountants (JICPA), is to be transferred to
the competence of the Accounting Standards Board of Japan (ASBJ).
For the sake of the said transfer, “Implementation Guidance on Recoverability of Deferred Tax Assets (Implementation
Guidance)” has been issued by ASBJ, based, in principle, on the framework used in the "Audit Treatment of Judgments
with Regard to Recoverability of Deferred Tax Assets" (Report No. 66, the audit committee of the JICPA), where the recoverability is assessed in accordance with the 5 categories of a corporate entity. The Implementation Guidance made
certain necessary changes in the criteria for these categories and also in the treatment of the amount of deferred tax
assets. The Implementation Guidance thereby provides the guidelines in applying the “Accounting Standards for Tax Effect
Accounting,” by the Business Accounting Council, in view of recoverability of deferred tax assets.
(The requirements of classification and the changes in the treatment of the amount of deferred tax assets) Treatment of companies that do not fall into any of the five corporate categories Criteria for inclusion in categories 2 and 3 Treatment of deductible temporary differences that cannot be scheduled for category 2 entities Determination of the reasonable period of time for estimating future changes in amounts of taxable income
before adding or deducting temporary differences for category 3 entities Treatment of category 4 entities that also meet the criteria for inclusion in categories 2 and 3.
2. Scheduled date of adoption This standard will be applied from the start of the fiscal year beginning on April 1, March 2016.
3. Impact of adoption of this accounting standard The impact on the Company’s consolidated financial statements from the adoption of Implementation Guidance on
Recoverability of Deferred Tax Assets is under evaluation at the time of the preparation of consolidated financial
statements.
Changes in Presentation Consolidated Statement of Cash Flows
1. “Insurance income”, “Loss (gain) on sale of investment securities”, and “Loss (gain) on revaluation of investment securities”, all three of which were separate items in “Cash flows from operating activities” in the previous fiscal year’s Consolidated Statement of Cash Flows, have been included in “Other” in the statement for the fiscal year under review, as their individual amounts have become insignificant. Consolidated financial statements for the previous fiscal year have been restated in order to reflect this change in presentation.
As a result, “Insurance income” (minus ¥330 million) , “Loss (gain) on sale of investment securities” (minus ¥12
million), and a cash inflow entered under “Loss (gain) on revaluation of investment securities” (¥3 million) in the
previous fiscal year’s Consolidated Statement of Cash Flows have been consolidated into “Other” in the statement for
the fiscal year under review.
2. “Payments for long-term loan receivables”, which was included as a separate item under “Cash flows from investing activities” in the previous fiscal year’s Consolidated Statement of Cash Flows has been consolidated into “Other” in the statement for the fiscal year under review, as the related amount has become insignificant. Consolidated financial statements for the previous fiscal year have been restated in order to reflect this change in presentation.
As a result, the ¥150 million cash outflow related to “Payments for long-term loans receivable” in the previous year’s statement has been consolidated into "Other” in the statement for the fiscal year under review.

30
Consolidated Statement of Income *1. Gain on sale of shares of affiliated companies Fiscal year under review (April 1, 2015 – March 31, 2016)
A ¥24,872 million gain on the sale of shares in affiliated companies was recorded on the sale and transfer of the
Company’s entire equity stake in Nissin-Ajinomoto Alimentos Ltda. to a subsidiary of Nissin Foods Holdings Co., Ltd., in the third quarter of the fiscal year.
*2. Loss on liquidation of subsidiaries Fiscal year under review (April 1, 2015 – March 31, 2016)
A ¥6,937 million loss on the liquidation of subsidiaries was recorded in relation to the sale and removal from the scope
of consolidation of Ajinomoto Sweeteners Europe S.A.S. (ASE) in the second quarter of the fiscal year. The recorded loss reflects the difference between the value received for the transfer of ASE shares and the Company’s investment
in ASE and subsequent expenditures to sustain ASE’s business.
*3. Extraordinary loss related to expense incurred for structural reform of pharmaceutical business Fiscal year under review (April 1, 2015 – March 31, 2016)
The Company posted a total extraordinary loss of ¥16,623 million in the fiscal year under review owing to the establishment of EA Pharma Co., Ltd. (formerly Ajinomoto Pharmaceuticals Co., Ltd.) as a specialty pharmaceutical
company in the gastrointestinal field to begin operations from April 1, 2016. The loss includes (a) an impairment loss of ¥4,839 million on the Company’s fixed assets for pharmaceutical manufacturing and intellectual property rights, (b)
a ¥4,945 million loss on the sale of shares in affiliated companies related to the transfer of the Company's equity
holdings in an equity-method affiliate engaged in the infusion and dialysis business, and (c) ¥6,839 million in penalties incurred on the cancellation of contracts with multiple companies.
The assets against which impairment losses were recorded as a pharmaceutical business restructuring expense are
as follows:
Location Use Classification
Kawasaki City, Kanagawa
Prefecture and Yokkaichi
City, Mie Prefecture
Manufacturing equipment Buildings, structures, machinery and
vehicles, etc.
Chuo Ward, Tokyo Intellectual property rights Patent rights
The Ajinomoto Group mainly groups assets in accordance with management accounting business categories.
Furthermore, important idle assets and assets leased to others are grouped according to each individual asset.
The manufacturing equipment in Kawasaki and Yokkaichi have aged, and asset book value therefore was written down to the amount deemed to be recoverable in the future, resulting in an impairment loss of ¥2,269 million. The
above includes ¥1,522 million for buildings and structures, ¥638 million for machinery and vehicles, and ¥108 million
for others. The recoverable amount, based on utility value, was determined to be zero owing to the expectation of
negative future cash flow. The charge for the writeoff of intellectual property rights was based on a third-party
calculation of the fair value. The writeoffs totaled ¥2,569 million.
*4. Impairment losses Fiscal year under review (April 1, 2015 – March 31, 2016)
The main assets with respect to which impairment losses were recorded in the fiscal year under review are as follows.
In addition to the losses detailed below, the Company recorded other impairment losses totaling ¥2,079 million.
Location Use Classification
Thailand Manufacturing facilities Buildings, structures, machinery and vehicles, etc.
China Manufacturing facilities Buildings, structures, machinery and vehicles, etc.

31
The Ajinomoto Group mainly groups assets in accordance with management accounting business categories.
Furthermore, important idle assets and assets leased to others are grouped according to each individual asset.
The Company recorded an impairment loss on manufacturing facilities at its animal nutrition business in Thailand, as
falling unit sales prices caused by an oversupply of feed-use lysine in the Asian market and intense competition from rival companies have led to consecutive losses and diminished the business’ future prospects. The Company has
therefore reduced the book value of animal nutrition business in Thailand to the level deemed to be recoverable in the
future and accordingly booked an impairment loss of ¥3,316 million as an extraordinary loss. This impairment loss includes writedowns of ¥844 million on buildings and structures, ¥2,204 million on machinery and vehicles, and ¥268
million on other assets. The recoverable amount was based on net sale value.
The impairment loss on seasoning manufacturing equipment in China reflects management’s judgement that lower profit levels and other factors make recovery the Company’s investment unlikely. Asset book value therefore was
written down to the amount deemed to be recoverable in the future, resulting in an impairment loss of ¥2,070 million
taken as an extraordinary loss. The above includes ¥972 million for buildings and structures, ¥458 million for
machinery and vehicles, and ¥640 million for others. The recoverable amount, based on utility value, was determined
to be zero owing to the expectation of negative future cash flow.
Business Mergers, etc. 1. Integration through acquisition (1) Outline of business integration
1) Name of acquired company and business content
Name of acquired company: Ajinomoto General Foods, Inc. (AGF)
Business content: Manufacture and sale of foods and beverages
2) Reason for integration AGF was established in 1973 as a joint venture between Ajinomoto Co. and the U.S. company General Foods
Corporation, currently Mondelēz International, Inc. (hereafter, Mondelēz). Since AGF’s founding, its Japan coffee
business has developed new product markets, including the market for 3-in-1 coffee sticks, and continually created new value that meets consumer needs. Leveraging its marketing and technological capabilities, AGF has achieved the
top share in Japan’s home-use coffee products market (excluding canned coffee) and is also expanding its sales in the commercial-use segment. AGF markets a wide range of high-quality, delicious beverage products in addition to coffee,
including tea and cocoa. Ajinomoto and Mondelēz were engaged in continuing discussions about AGF’s operating
format. In the end, Mondelēz’s decision to reorganize its global coffee business paved the way for the agreement that
led to AGF becoming a wholly owned consolidated subsidiary of Ajinomoto, which had been contemplating that move
for some time.
Aiming to be “a genuine global specialty company,” Ajinomoto is strengthening its business structure and expanding
into adjacent domains (products adjacent to existing product domains and adjacent markets) as it prepares for a new stage of rapid growth. Since making AGF a consolidated subsidiary, Ajinomoto has been working with AGF's
management and employees on plans to expand AGF’s business. The parent and its subsidiary seek to realize
synergies in their coffee and powdered drink businesses in ASEAN countries and other markets. The two companies will strengthen their business structures by promoting cooperative efforts in all divisions, while also leveraging their
common core of powdered and processed products to create synergies in product development and production.
3) Date of integration
April 23, 2015
4) Legal form of integration Share acquisition via cash transaction
5) Post-integration company name

32
Ajinomoto General Foods Inc.
6) Percent of voting shares acquired
Percent of voting shares owned prior to integration: 50.0%
Percent of voting shares acquired on date of integration: 50.0% Voting share ownership ratio after integration: 100.0%
7) Primary basis for decision of the acquiring company
The Company acquired shares through a cash transaction.
8) Matters related to other transactions After acquiring the 50.0% of voting shares in AGF not already owned, the Company sold a 5.0% share to another
consolidated subsidiary, Ajinomoto Co. (Thailand) Ltd., to facilitate the early and certain creation of synergies in the
coffee and powdered drinks business in the ASEAN region. Even after this sale, the Ajinomoto Group retains 100%
ownership of voting shares.
(2) Period that AGF is included in consolidated financial results for the fiscal year under review April 1, 2015 to March 31, 2016
(3) Cost of acquisition and price breakdown:
Market value of AGF shares owned immediately before the integration: ¥27,000 million Cash payment for additional shares: ¥27,000 million
Acquisition cost: ¥54,000 million
(4) Main acquisition-related expense
Advisory and other fees ¥246 million
(5) Difference between acquired company’s acquisition cost and the sum of acquisition costs of each transaction
Gain on step acquisitions ¥18,027 million (6) Amount of goodwill, reason for its occurrence, amortization method and period
1) Amount of goodwill ¥30,261 million
When preparing consolidated financial statements for the first quarter of the fiscal year under review, the allocation for
the AGF acquisition cost was based on a provisional calculation made on the basis of reasonable information available
at the time. The confirmed final cost was allocated during the fourth quarter of the fiscal year under review.
2) Reason for occurrence Principal reason for the occurrence of goodwill related to the acquisition of AGF is the expected excess earnings
potential stemming from the company’s strong brands and customer base.
3) Amortization method and period Straight-line amortization over a period of 15 years
(7) Breakdown of assets and liabilities received on day of integration Current assets: ¥32,851 million
Fixed assets: ¥26,014 million
Total assets: ¥58,865 million
Current liabilities: ¥32,313 million
Long-term liabilities: ¥2,813 million
Total liabilities: ¥35,126 million
(8) Amount allocated to intangible assets other than goodwill, main component and amount, and weighted average amortization period
1) Amount allocated to intangible assets
¥5,704 million

33
2) Main component, amount, and amortization period
Customer-related assets ¥5,704 million 6 years
2. Transactions under common control (1) Outline of transaction
1) Names of subsidiaries and outline of their business Names of subsidiaries: Ajinomoto North America, Inc., Ajinomoto Frozen Foods USA, Inc., Ajinomoto North America
NJ, Inc., Windsor Quality Holdings, LP; Amoy North America, Inc.
Outline of business of subsidiaries: Manufacture and sales of amino acids, umami seasonings for processed foods, and frozen foods
2) Date of merger
April 1, 2015
3) Legal configuration of company merger
Ajinomoto North America, Inc.* transferred its amino acid and bulk food products businesses to Ajinomoto North
America NJ, Inc., and its consumer foods business to Ajinomoto Windsor, Inc. (formerly Ajinomoto Frozen Foods U.S.A.) by contribution in kind, and changed its name to Ajinomoto North America Holdings, Inc..
Additionally, an absorption-type merger was conducted, in which Ajinomoto Windsor, Inc.* was the surviving company
in a merger with Windsor Quality Holdings, LP*, and Amoy North America, Inc.* (a subsidiary of Amoy Food Limited.) Amoy Food Limited received shares in Ajinomoto North America Holdings as compensation for this absorption-type
merger, but sold those shares to the Company.
*A consolidated subsidiary of Ajinomoto Co.
4) Names of surviving companies Ajinomoto North America Holdings, Inc. (formerly Ajinomoto North America Inc)*
Ajinomoto Windsor, Inc. (formerly Ajinomoto Frozen Foods)*
Ajinomoto North America, Inc. (formerly Ajinomoto North America NJ, Inc.)*
*A consolidated subsidiary of Ajinomoto Co.
5) Other items regarding outline of business With the acquisition of Windsor Quality Holdings, LP last year, Ajinomoto Co. has decided to restructure its
organization in North America in line with its business model, to accelerate growth in the consumer foods business.
Ajinomoto will make further advancements in the marketing and sales capabilities of each business and accelerate
business development by dividing its operations into the consumer foods business – consolidated under Ajinomoto
Windsor, Inc., and the amino acids/foods for processed food manufacturers business – consolidated under Ajinomoto North America.
(2) Outline of accounting treatment conducted
This restructure was treated as a transaction under common control, based on the Accounting Standard for Business Mergers (ASBJ Statement No.21) of September 13, 2013, and the Guidance on Accounting Standard for Business
Combinations and Accounting Standard for Business Divestitures (ASBJ Guidance No.10) of September 13, 2013.
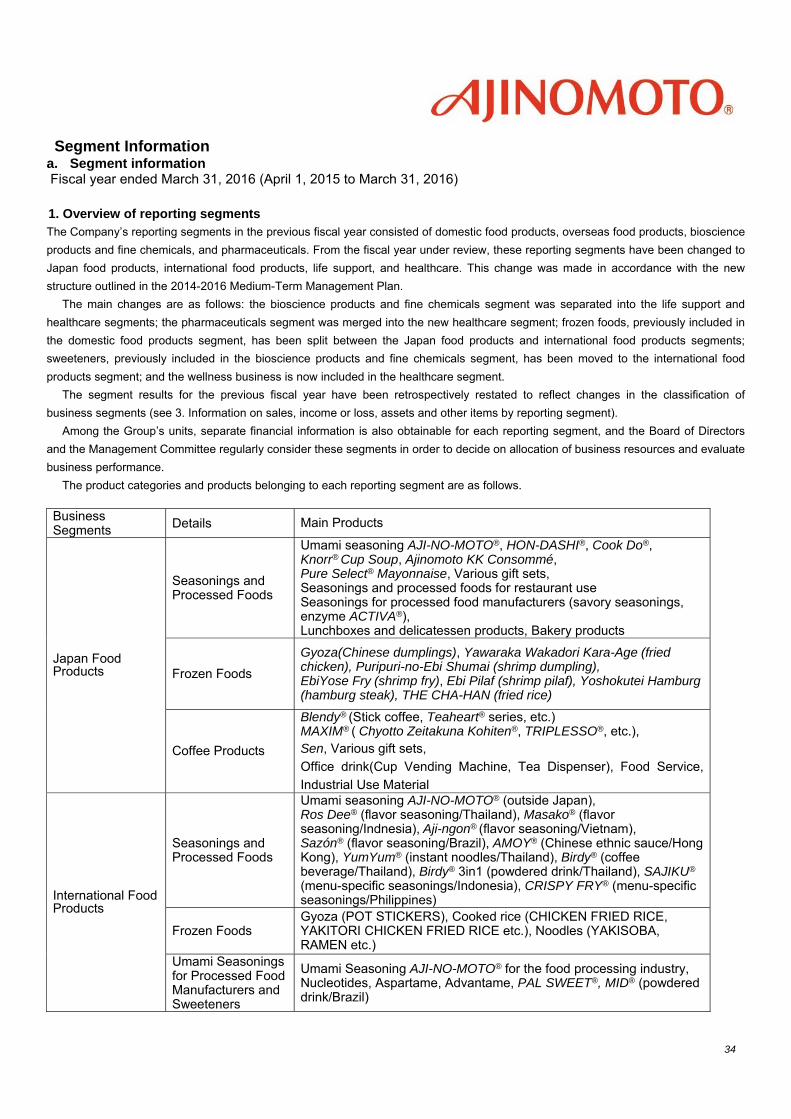
34
Segment Information a. Segment information Fiscal year ended March 31, 2016 (April 1, 2015 to March 31, 2016)
1. Overview of reporting segments The Company’s reporting segments in the previous fiscal year consisted of domestic food products, overseas food products, bioscience
products and fine chemicals, and pharmaceuticals. From the fiscal year under review, these reporting segments have been changed to
Japan food products, international food products, life support, and healthcare. This change was made in accordance with the new
structure outlined in the 2014-2016 Medium-Term Management Plan.
The main changes are as follows: the bioscience products and fine chemicals segment was separated into the life support and
healthcare segments; the pharmaceuticals segment was merged into the new healthcare segment; frozen foods, previously included in
the domestic food products segment, has been split between the Japan food products and international food products segments;
sweeteners, previously included in the bioscience products and fine chemicals segment, has been moved to the international food
products segment; and the wellness business is now included in the healthcare segment.
The segment results for the previous fiscal year have been retrospectively restated to reflect changes in the classification of
business segments (see 3. Information on sales, income or loss, assets and other items by reporting segment).
Among the Group’s units, separate financial information is also obtainable for each reporting segment, and the Board of Directors
and the Management Committee regularly consider these segments in order to decide on allocation of business resources and evaluate
business performance.
The product categories and products belonging to each reporting segment are as follows. Business Segments Details Main Products
Japan Food Products
Seasonings and Processed Foods
Umami seasoning AJI-NO-MOTO®, HON-DASHI®, Cook Do®, Knorr® Cup Soup, Ajinomoto KK Consommé, Pure Select® Mayonnaise, Various gift sets, Seasonings and processed foods for restaurant use Seasonings for processed food manufacturers (savory seasonings, enzyme ACTIVA®), Lunchboxes and delicatessen products, Bakery products
Frozen Foods
Gyoza(Chinese dumplings), Yawaraka Wakadori Kara-Age (fried chicken), Puripuri-no-Ebi Shumai (shrimp dumpling), EbiYose Fry (shrimp fry), Ebi Pilaf (shrimp pilaf), Yoshokutei Hamburg (hamburg steak), THE CHA-HAN (fried rice)
Coffee Products
Blendy® (Stick coffee, Teaheart® series, etc.)MAXIM® ( Chyotto Zeitakuna Kohiten®, TRIPLESSO®, etc.), Sen, Various gift sets,
Office drink(Cup Vending Machine, Tea Dispenser), Food Service,
Industrial Use Material
International Food Products
Seasonings and Processed Foods
Umami seasoning AJI-NO-MOTO® (outside Japan), Ros Dee® (flavor seasoning/Thailand), Masako® (flavor seasoning/Indnesia), Aji-ngon® (flavor seasoning/Vietnam), Sazón® (flavor seasoning/Brazil), AMOY® (Chinese ethnic sauce/Hong Kong), YumYum® (instant noodles/Thailand), Birdy® (coffee beverage/Thailand), Birdy® 3in1 (powdered drink/Thailand), SAJIKU® (menu-specific seasonings/Indonesia), CRISPY FRY® (menu-specific seasonings/Philippines)
Frozen Foods Gyoza (POT STICKERS), Cooked rice (CHICKEN FRIED RICE, YAKITORI CHICKEN FRIED RICE etc.), Noodles (YAKISOBA, RAMEN etc.)
Umami Seasonings for Processed Food Manufacturers and Sweeteners
Umami Seasoning AJI-NO-MOTO® for the food processing industry, Nucleotides, Aspartame, Advantame, PAL SWEET®, MID® (powdered drink/Brazil)

35
Life Support
Animal Nutrition Lysine, Threonine, Tryptophan, Valine, AjiPro®-L
Specialty Chemicals
Amisoft®, Amilite® (mild surfactant), Ajidew® (humectant), JINO® ,AEF (insulation film for build-up printed wiring board), AEF (Ajinomoto Encapsulation Film)
Healthcare
Amino Acids
Amino acids (for intravenous drip etc.), Anti-cancer drugs, Autoimmune disease drug, Pharmaceutical intermediates and Active ingredients for Anti-AIDs drug, Agrochemical surfactants, Natural extracts
Pharmaceuticals Gastrointestinal disease treatment (LIVACT®, ELENTAL®, MOVIPREP®) Metabolic diseases, etc. (ATELEC®, FASTIC®, ACTONEL®, ATEDIO®)
Others Fundamental Foods (Glyna®, Amino Aile®, Capsiate Natura®) Nutrition Care Foods (Medimeal®, Aqua Solita®) Functional foods (amino VITAL®)
2. Methods of calculating amounts for net sales, income or loss, assets and other items by reporting segment
The accounting treatment methods for each reporting business segment are broadly similar to those outlined in “Significant items for the preparation of consolidated financial statements”.
Reporting segment income figures are on an operating income basis. Internal sales between segments are mainly based on prices for third-party transactions.

36
3. Information on sales, income or loss, assets and other items by reporting segment
Note 1. Other business includes the business tie-ups, the packaging business, the logistics business and other service businesses.
Note 2. Adjustments are as follows:
(1) Adjustments of ¥292,622 million for segment assets mainly includes, ‘Corporate’ assets of ¥339,734 million and intersegment
offsetting of receivables against payables of minus ¥44,991 million. ‘Corporate’ assets primarily consist of the Group’s cash
and equivalents, long-term investments, land not used in operations, and certain assets associated with administrative
divisions and research facilities.
(2) Adjustments of ¥5,667 million for ‘Depreciation’ is depreciation related to ‘Corporate’ assets.
(3) Adjustments of ¥4,026 million for ‘Increase in tangible and intangible fixed assets’ is the acquisition cost of tangible and
intangible fixed assets related to ‘Corporate’ assets.
Fiscal year ended March 31, 2016
Millions of yen, rounded down
Reporting segment
Other
Business
*1
Adjustment
amount*2 ConsolidatedJapan
Food
Products
International
Food
Products
Life Support Healthcare
Sales
(1) Sales to third
parties ...................394,408 463,905 142,415 130,844 54,406 - 1,185,980
(2) Intra-group sales
and transfers .........3,000 5,734 3,412 2,163 56,560 (70,870) -
Total sales......... 397,408 469,639 145,827 133,008 110,967 (70,870) 1,185,980
Segment income
(loss) (Operating
income (loss)) ...........
31,390 41,969 11,810 5,415 460 - 91,045
Segment assets ........ 278,596 336,583 113,532 147,182 94,746 292,622 1,263,264
Other
Depreciation ........... 10,544 17,808 7,453 7,271 2,174 5,667 50,920
Increase in
tangible and
intangible fixed
assets .......................
17,349 19,818 7,701 8,165 1,805 4,026 58,867
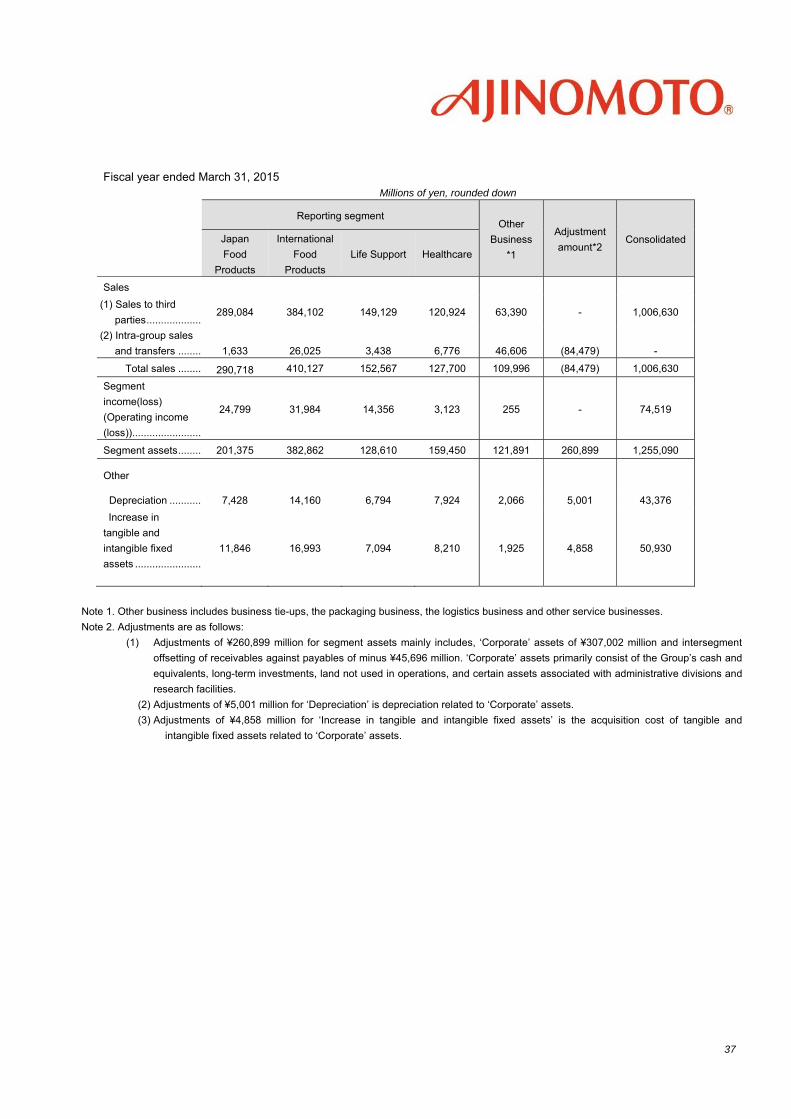
37
Note 1. Other business includes business tie-ups, the packaging business, the logistics business and other service businesses.
Note 2. Adjustments are as follows:
(1) Adjustments of ¥260,899 million for segment assets mainly includes, ‘Corporate’ assets of ¥307,002 million and intersegment
offsetting of receivables against payables of minus ¥45,696 million. ‘Corporate’ assets primarily consist of the Group’s cash and
equivalents, long-term investments, land not used in operations, and certain assets associated with administrative divisions and
research facilities.
(2) Adjustments of ¥5,001 million for ‘Depreciation’ is depreciation related to ‘Corporate’ assets.
(3) Adjustments of ¥4,858 million for ‘Increase in tangible and intangible fixed assets’ is the acquisition cost of tangible and
intangible fixed assets related to ‘Corporate’ assets.
Fiscal year ended March 31, 2015
Millions of yen, rounded down
Reporting segment
Other
Business
*1
Adjustment
amount*2 ConsolidatedJapan
Food
Products
International
Food
Products
Life Support Healthcare
Sales (1) Sales to third
parties ...................289,084 384,102 149,129 120,924 63,390 - 1,006,630
(2) Intra-group sales
and transfers ........
1,633 26,025 3,438 6,776 46,606 (84,479) -
Total sales ........ 290,718 410,127 152,567 127,700 109,996 (84,479) 1,006,630
Segment
income(loss)
(Operating income
(loss))........................
24,799 31,984 14,356 3,123 255 - 74,519
Segment assets ........ 201,375 382,862 128,610 159,450 121,891 260,899 1,255,090
Other
Depreciation ........... 7,428 14,160 6,794 7,924 2,066 5,001 43,376
Increase in
tangible and
intangible fixed
assets .......................
11,846 16,993 7,094 8,210 1,925 4,858 50,930

38
Fiscal year ended March 31, 2016 1. Information by product and service
Information by product and service has been omitted as it contains the same information as Segment information. 2. Information by geographical area
(1) Sales
Millions of yen, rounded down
“Japan” “Asia” “Americas” “Europe” Total
Sales ........................................................... 556,099 282,268 240,436 107,176 1,185,980
Percentage of total consolidated sales ....... 46.9% 23.8% 20.3% 9.0% 100.0%
Note: Sales are based on the location of customers, and are classified by country or region.
(2) Tangible fixed assets
Millions of yen, rounded down
“Japan” “Asia” “Americas” “Europe” Total
Tangible fixed assets .................................. 170,178 100,311 68,194 47,517 386,201
Fiscal year ended March 31, 2015 1. Information by product and service Information by product and service has been omitted as it contains the same information as Segment information.
2. Information by geographical area
(1) Sales
Millions of yen, rounded down
“Japan” “Asia” “Americas” “Europe” Total
Sales ........................................................... 438,263 276,864 182,008 109,494 1,006,630
Percentage of total consolidated sales ....... 43.5% 27.5% 18.1% 10.9% 100.0%
Note: Sales are based on the location of customers, and are classified by country or region.
b. Related information
(2) Tangible fixed assets
Millions of yen, rounded down
“Japan” “Asia” “Americas” “Europe” Total
Tangible fixed assets .................................. 150,221 110,956 72,990 49,101 383,269
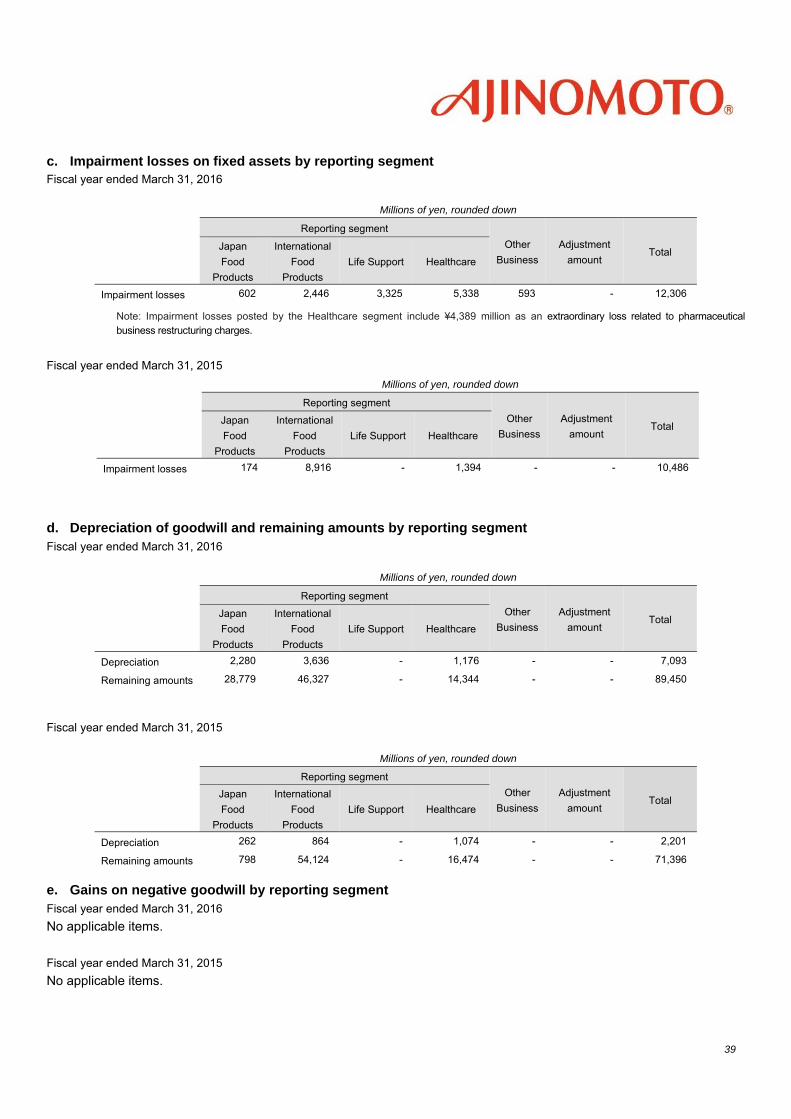
39
c. Impairment losses on fixed assets by reporting segment Fiscal year ended March 31, 2016
Note: Impairment losses posted by the Healthcare segment include ¥4,389 million as an extraordinary loss related to pharmaceutical business restructuring charges.
Fiscal year ended March 31, 2015
d. Depreciation of goodwill and remaining amounts by reporting segment Fiscal year ended March 31, 2016
Fiscal year ended March 31, 2015
e. Gains on negative goodwill by reporting segment Fiscal year ended March 31, 2016
No applicable items.
Fiscal year ended March 31, 2015
No applicable items.
Millions of yen, rounded down
Reporting segment
Other
Business
Adjustment
amount Total
Japan
Food
Products
International
Food
Products
Life Support Healthcare
Impairment losses 602 2,446 3,325 5,338 593 - 12,306
Millions of yen, rounded down
Reporting segment
Other
Business
Adjustment
amount Total
Japan
Food
Products
International
Food
Products
Life Support Healthcare
Impairment losses 174 8,916 - 1,394 - - 10,486
Millions of yen, rounded down
Reporting segment
Other
Business
Adjustment
amount Total
Japan
Food
Products
International
Food
Products
Life Support Healthcare
Depreciation 2,280 3,636 - 1,176 - - 7,093
Remaining amounts 28,779 46,327 - 14,344 - - 89,450
Millions of yen, rounded down
Reporting segment
Other
Business
Adjustment
amount Total
Japan
Food
Products
International
Food
Products
Life Support Healthcare
Depreciation 262 864 - 1,074 - - 2,201
Remaining amounts 798 54,124 - 16,474 - - 71,396

40
f. Segment information by location
Fiscal year ended March 31, 2016
Millions of yen, rounded down
“Japan” “Asia” “Americas” “Europe” Total
Sales to third parties ................................... 556,637 274,559 245,912 108,871 1,185,980
Percentage of total consolidated sales ....... 46.9% 23.2% 20.7% 9.2% 100.0%
Operating income ....................................... 38,408 37,441 11,734 3,460 91,045
Percentage of total consolidated
operating income ........................................42.2% 41.1% 12.9% 3.8% 100.0%
Fiscal year ended March 31, 2015
Millions of yen, rounded down
“Japan” “Asia” “Americas” “Europe” Total
Sales to third parties ................................... 460,402 260,440 175,317 110,469 1,006,630
Percentage of total consolidated sales ....... 45.7% 25.9% 17.4% 11.0% 100.0%
Operating income ....................................... 29,625 30,458 11,656 2,778 74,519
Percentage of total consolidated
operating income ........................................39.8% 40.9% 15.6% 3.7% 100.0%
Notes 1. Geographical area segments are categorized on the basis of geographic proximity and indicated in inverted commas. Notes 2. Main countries and regions in segments other than “Japan”:
“Asia”: Countries of East and Southeast Asia
“Americas”: Countries of North, Central and South America
“Europe”: Countries of Europe and Africa

41
Per Share Information
FY ended March 31, 2016 FY ended March 31, 2015
Net assets per share ................................................................ ¥1074.36 ¥1,131.41
Earnings per share ................................................................... ¥108.14 ¥78.54
Note 1: Fully diluted earnings per share is not stated for either year, since the Company does not have residual securities.
Note 2: The basis for calculation of net assets per share is as follows Millions of yen, rounded down
As of March 31, 2016 As of March 31, 2015
Total net assets on balance sheet ........................................... 696,302 743,489
Deductions from net assets
Non-controlling interests ................................................ 72,056 73,913
Total amount of deduction from net assets .............................. 72,056 73,913
Net assets attributable to common stock ................................. 624,245 669,576Number of shares of common stock used for the calculation of net assets per share (thousand shares) ..............................
581,038 591,806
Note 3: The basis for calculation of earnings per share is as follows Millions of yen, rounded down
FY ended March 31, 2016 FY ended March 31, 2015
Profit attributable to owners of parent ...................................... 63,592 46,495
Net income not attributable to common stock - -
Profit attributable to common stock owners of parent .............. 63,592 46,495Average number of shares of common stock outstanding during the year (thousand shares) ...........................................
588,064 591,984
Note: As outlined in Notes to the Consolidated Financial Statements, “4. CONSOLIDATED FINANCIAL STATEMENTS (5) Notes to the Consolidated
Financial Statements, (Changes in accounting policy), effective the fiscal year ended March 31 2016; the Company has applied the “Accounting
Standard for Business Combinations” (ASBJ Statement No. 21 of September 13, 2013), “Accounting Standard for Consolidated Financial Statements”
(ASBJ Statement No. 22 of September 13, 2013), and “Accounting Standard for Business Divestitures” (ASBJ Statement No. 7 of September 13, 2013).
As a result of this change, for the fiscal year, “Profit attributable to owners of parent” and “Profit attributable to common stock owners of parent” has
increased ¥122 million, and “Earnings per share” has increased ¥0.21, and “net assets per share” has decreased ¥0.48.

42
Significant Subsequent Events
1. Business Mergers, etc. Corporate integration by subsidiary
Based on an agreement entered into with Eisai Co., Ltd. (hereafter, Eisai) on October 15, 2015, Ajinomoto Co.’s wholly
owned subsidiary AJINOMOTO PHARMACEUTICALS CO., LTD. (hereafter, AJINOMOTO PHARMACEUTICALS)
succeeded to a portion of Eisai's gastrointestinal disease treatment business via an absorption-type split on April 1, 2016. As consideration for the absorption-type company split, shares of AJINOMOTO PHARMACEUTICALS were
allotted to Eisai on that date.
As a result, as of April 1, 2016, Ajinomoto’s equity interest in AJINOMOTO PHARMACEUTICALS was reduced to
40%, making the company an equity-method affiliate of Ajinomoto.
(1) Outline of corporate integration 1) Name and business content of parties to the integration, and name of the company after integration
Name of integrating company: AJINOMOTO PHARMACEUTICALS CO., LTD.
Business description: Research & development, manufacturing, and marketing of pharmaceuticals
Name of splitting company: Eisai Co., Ltd. Business description: Research & development and marketing (domestic) of pharmaceuticals in the field of
gastrointestinal diseases Name of the company after integration: EA Pharma Co. Ltd.
2) Purpose of establishing the integrated company Eisai has a long history of drug discovery and information provision activities in the field of gastrointestinal diseases
spanning more than 60 years, over which it has accumulated a wealth of experience, knowledge and networks that
have enabled it to create a robust development pipeline that has generated numerous superior pharmaceutical products. AJINOMOTO PHARMACEUTICALS, as a member of the Ajinomoto Group which endeavors to contribute to human
health globally based on amino acid technology founded upon the discovery of umami, possesses a unique pipeline and products unmatched by other companies, especially in the field of gastrointestinal diseases. The integration of Eisai’s
gastrointestinal disease business and AJINOMOTO PHARMACEUTICALS’ business will result in the establishment of
EA Pharma Co. Ltd., one of Japan’s largest gastrointestinal specialty pharmaceutical companies. While population aging has been accompanied by an increase in the incidence of gastrointestinal diseases, lifestyle
changes and increasing social stress have caused a sharp increase in the incidence of intractable autoimmune
diseases, such as Crohn's disease and ulcerative colitis, among younger people. The combined result has been an
expansion in unmet medical needs in the field of gastrointestinal disease. By combining the products of its forming
entities, the new integrated company will have a broad product lineup that will cover the upper and lower digestive tract
as well as the liver and pancreas, enabling it to provide a wider range of solutions and specialized information for
healthcare professionals in the field of gastrointestinal disease. In addition, the formation of the integrated company will bring together researchers with extensive expertise and know-how on gastrointestinal diseases and result in an even
more robust product development pipeline capable of launching a steady stream of new treatments that will help fulfill the aforementioned unmet medical needs in the field of gastrointestinal disease. Furthermore, the future marketing of
newly developed products through Eisai’s global business network will provide greater access to markets and patients,
thereby maximizing the benefit of the company’s efforts for patients around the globe. In addition to marketing synergies made possible by integration, the new company will endeavor to increase
profitability through the pursuit of greater efficiency by, for example, eliminating redundant functions. It also will
endeavor to secure the resources required to achieve development of new drugs and realize sustained growth. As one
of Japan’s largest gastrointestinal specialty pharmaceutical companies, the new integrated company will have a firm
grasp of the needs of gastrointestinal disease patients, which it will use to address those needs and provide more
qualitative benefits for patients and their families as well as healthcare professionals.
3) Date of establishment of integrated company

43
April 1, 2016
4) Overview of transaction, including legal form Eisai is the splitting company and AJINOMOTO PHARMACEUTICALS the succeeding company in an absorption-type
company split.
(2) Accounting treatment of the integration
Accounting treatment of the corporate integration will be in accordance with Accounting Standard for Business
Divestitures (ASBJ Statement No. 7, December 26, 2008) and Guidance on Accounting Standard for Business Combinations and Accounting Standard for Business Divestitures (ASBJ Guidance No. 10, December 26, 2008).
(3) Reporting business segment affected by the integration
Healthcare segment
2. Share Repurchase under the Provisions of the Company’s Articles of Incorporation Pursuant to Article 165, Paragraph (2) of the Companies Act
The Company authorized, at the Board of Directors’ Meeting of May 10, 2016, the following repurchase of its own shares
pursuant to the provisions of Article 156 of the Companies Act, as applied pursuant to the provisions of Paragraph 3,
Article 165 of the Companies Act:
(1) Purpose of the Share Repurchase:
To enhance the level of shareholders’ return and to improve capital efficiency. (2) Details of the Share Repurchase
1) Class of shares to be repurchased: Common stock 2) Total number of repurchasable shares: 15 million shares (maximum)
(Note: 2.58% of the total number of shares issued, excluding treasure shares) 3) Total repurchase amount: ¥30,000 million (maximum) 4) Repurchase period: From May 11, 2016 till July 29, 2016 5) Repurchase Method: Open market purchase through a trust bank 6) Others: Treasury shares thus repurchased shall all be cancelled in accordance with the resolution of its Board
of Directors’ Meeting, pursuant to the provisions of Article 178 of the Companies Act.
Note: Total number of shares outstanding as at March 31, 2016 (excluding treasury shares): 581,038,449 shares
Number of treasury shares as at March 31, 2016: 2,724,205 shares

44
Reference: Five year trends in consolidated financial results and key indicators
Millions of yen, rounded down
FY ending
March 31, 2017 (est.)
FY ended
March 31, 2016
FY ended
March 31, 2015
FY ended
March 31, 2014
FY ended
March 31, 2013
Net sales 1,186,000 1,185,980 1,006,630 951,359 984,967
Growth rate 0.0% 17.8% 5.8% - -
Operating income 91,000 91,045 74,519 61,807 71,232
Growth rate - 22.2% 20.6% - (1.9%)
Operating margin 7.7% 7.7% 7.4% 6.5% 7.2%
Ordinary income 91,600 94,333 82,808 68,800 77,167
Ordinary margin 7.7% 8.0% 8.2% 7.2% 7.8%
Profit (loss) attributable to owners of parent
51,000 63,592 46,495 42,159 48,373
Return on sales 4.3% 5.4% 4.6% 4.4% 4.9%
Net income (loss) per share (yen) ¥89.08 ¥108.14 ¥78.54 ¥68.67 ¥74.35
Return on equity - 9.8% 7.4% 7.1% 7.8%
Ratio of net income to total assets - 5.1% 4.0% 3.8% 4.4%
Total assets - 1,263,264 1,255,090 1,093,165 1,091,741
Net assets - 696,302 743,489 655,507 691,710
Interest-bearing debt - 264,704 211,594 142,954 119,314
Equity ratio - 49.4% 53.3% 54.4% 58.2%
Book value per share (yen) - ¥1,074.36 ¥1,131.41 ¥1,002.29 ¥1,004.38
Share price at end of period (yen) - ¥2,539.5 ¥2,634.5 ¥1,475 ¥1,415
P/E ratio (times) - 23.5 33.5 21.5 19.0
Dividend per share (yen) ¥30.0 ¥28.0 ¥24.0 ¥20.0 ¥18.0
Dividend payout ratio 33.7% 25.9% 30.6% 29.1% 24.2%
Net cash provided by operating activities
- 125,222 109,259 63,017 88,501
Net cash provided by (used in) investment activities
- (53,820) (140,391) (63,497) 15,201
Net cash provided by (used in) financing activities
- (3,274) 52,822 (55,248) (74,419)
Free cash flow - 71,401 (31,132) (479) 103,703
Number of consolidated subsidiaries - 96 99 89 86
Number of affiliated companies accounted for by the equity method
- 4 11 12 11
Notes: 1. Net sales is exclusive of consumption tax, etc.
2. Figures are based mainly on consolidated results (“kessan tanshin”) for each period
3. Free cash flow = net cash provided by operating activities + cash flow used in investing activities
4. From the fiscal year ended March 31, 2014, due to a change in accounting policy for the coffee and edible oils businesses and some other
businesses, amounts for the fiscal year to March 31, 2013 have restated to reflect this change.
5. From the fiscal year ended March 31, 2015, due to a change in accounting standards for recording sales, amounts have been restated to
reflect this change.