NSDI-12 DECEMBER 20-21, 2012 NEW DELHI
45
NSDI-12 DECEMBER 20-21, 2012 NEW DELHI
Transcript of NSDI-12 DECEMBER 20-21, 2012 NEW DELHI
NSDI-12 DECEMBER 20-21, 2012 NEW DELHI

Land Resources
• Vegetation
• Landuse
• Agriculture
• Forestry & Ecology
• Urban areas
• Water Resources
Earth Resources
• Soil Mapping
• Land degradation
• Hydrogeology
• Geomorphology
• Geoscience Appl.
Oceanography & Atmosphere
• Oceanography
• Atmospheric Science • Disaster
Management Support
Geoinformatics & Information Services
• Disaster Support
• Geodatabase organization
• Information Systems
• Data dissemination
• Customization
Capacity building
• Training
• Collaboration with Academia
• Involving Line departments, SRSACs – Execution of projects
Applications Domain
Thrust Areas :
- National Mapping Missions ;
- Disaster Management Information Support ;
- Climate Change Studies
- Research & development in upcoming technologies
- Information services through integrated NR Mapping & GIS
NATIONAL REMOTE SENSING CENTRE
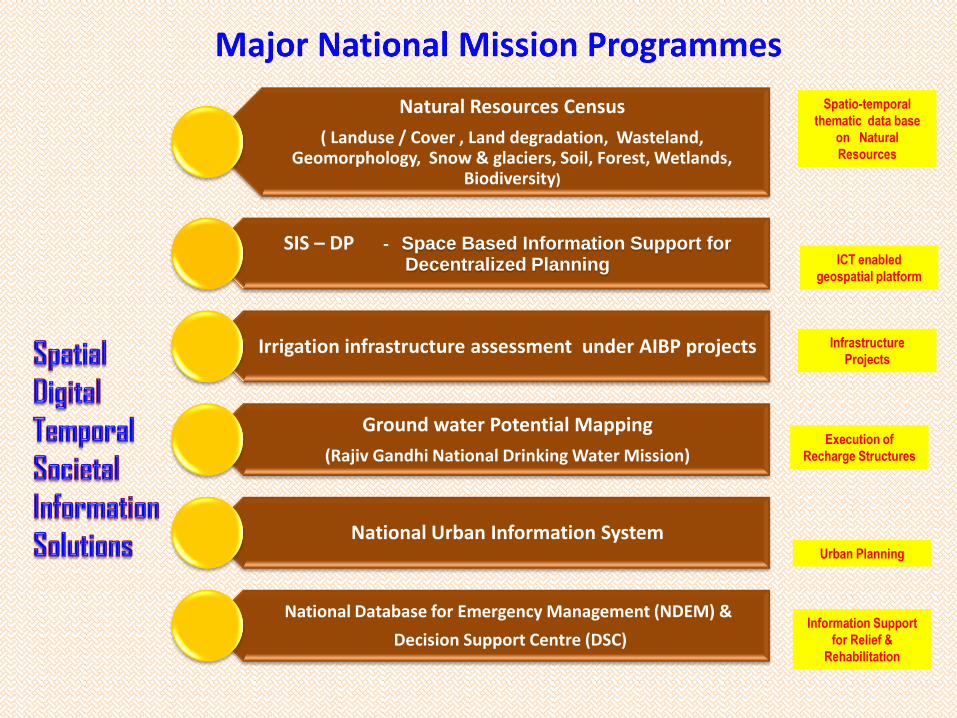
Natural Resources Census
( Landuse / Cover , Land degradation, Wasteland, Geomorphology, Snow & glaciers, Soil, Forest, Wetlands,
Biodiversity)
SIS – DP - Space Based Information Support for Decentralized Planning
Irrigation infrastructure assessment under AIBP projects
Ground water Potential Mapping
(Rajiv Gandhi National Drinking Water Mission)
National Urban Information System
National Database for Emergency Management (NDEM) &
Decision Support Centre (DSC)
Execution of
Recharge Structures
Infrastructure
Projects
ICT enabled
geospatial platform
Spatio-temporal
thematic data base
on Natural
Resources
Urban Planning
Information Support
for Relief &
Rehabilitation
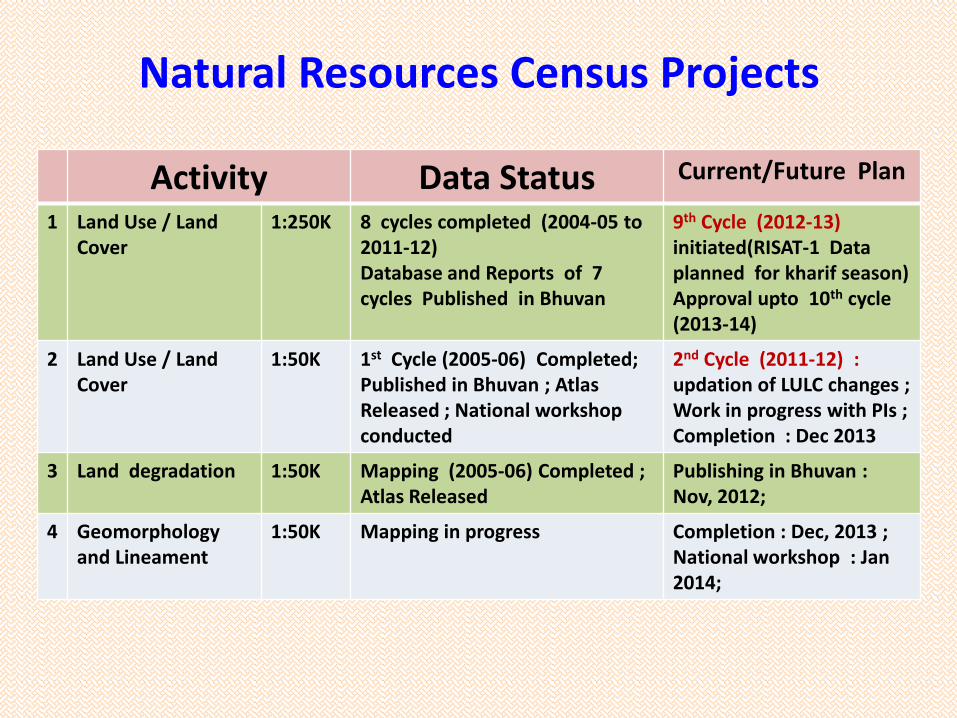
Natural Resources Census Projects
Activity Data Status Current/Future Plan
1 Land Use / Land Cover
1:250K 8 cycles completed (2004-05 to 2011-12) Database and Reports of 7 cycles Published in Bhuvan
9th Cycle (2012-13) initiated(RISAT-1 Data planned for kharif season) Approval upto 10th cycle (2013-14)
2 Land Use / Land Cover
1:50K 1st Cycle (2005-06) Completed; Published in Bhuvan ; Atlas Released ; National workshop conducted
2nd Cycle (2011-12) : updation of LULC changes ; Work in progress with PIs ; Completion : Dec 2013
3 Land degradation 1:50K Mapping (2005-06) Completed ; Atlas Released
Publishing in Bhuvan : Nov, 2012;
4 Geomorphology and Lineament
1:50K Mapping in progress Completion : Dec, 2013 ; National workshop : Jan 2014;
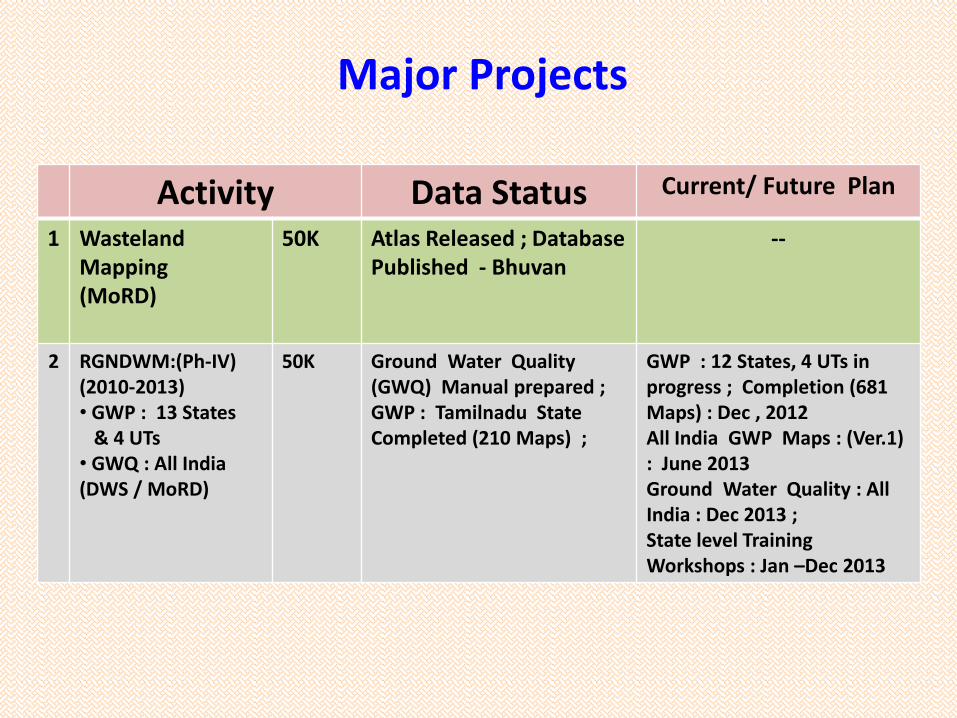
Major Projects
Activity Data Status Current/ Future Plan
1 Wasteland Mapping (MoRD)
50K Atlas Released ; Database Published - Bhuvan
--
2 RGNDWM:(Ph-IV) (2010-2013) • GWP : 13 States & 4 UTs • GWQ : All India (DWS / MoRD)
50K Ground Water Quality (GWQ) Manual prepared ; GWP : Tamilnadu State Completed (210 Maps) ;
GWP : 12 States, 4 UTs in progress ; Completion (681 Maps) : Dec , 2012 All India GWP Maps : (Ver.1) : June 2013 Ground Water Quality : All India : Dec 2013 ; State level Training Workshops : Jan –Dec 2013

Activity Current Status Future Plan 3 Assessment of
Irrigation Infrastructure –AIBP (CWC MoWR)
-- Mapping and Assessment of Irrigation Infrastructure : 30 Projects Completed
20 Projects in Progress . Completion : Dec, 2012 ; Workshop : Feb 2013;
4 Snow Melt Runoff Modelling (CWC MoWR)
-- Seasonal (3 months) forecast provided for Five Himalayan river basins (April, 2012) ; Hydrological modelling completed
Short term (10 Day) experimental forecast model in progress ; Completion : April , 2013; Operational forecast in 2014;
5 NUIS (MoUD)
10K 142 towns completed ; Stake holders Workshop Completed (July 2012) ; Database Published in Bhuvan
All 152 towns and Closeout Report : Dec 2012; New : 497 Class-1 Towns; Work initiated on Bhuvan
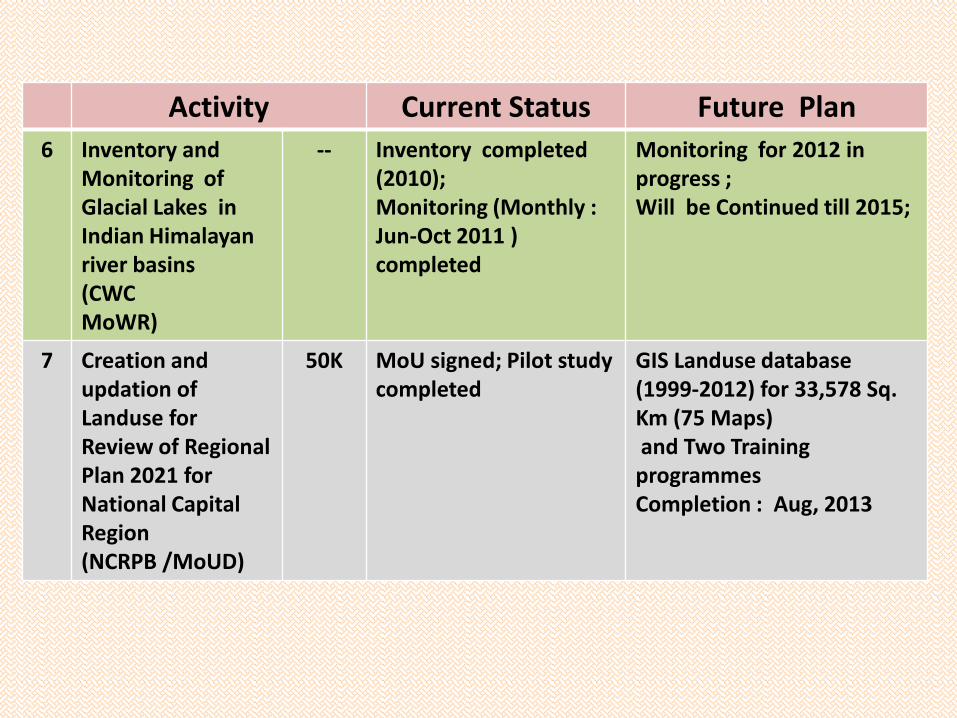
Activity Current Status Future Plan
6 Inventory and Monitoring of Glacial Lakes in Indian Himalayan river basins (CWC MoWR)
-- Inventory completed (2010); Monitoring (Monthly : Jun-Oct 2011 ) completed
Monitoring for 2012 in progress ; Will be Continued till 2015;
7 Creation and updation of Landuse for Review of Regional Plan 2021 for National Capital Region (NCRPB /MoUD)
50K MoU signed; Pilot study completed
GIS Landuse database (1999-2012) for 33,578 Sq. Km (75 Maps) and Two Training programmes Completion : Aug, 2013
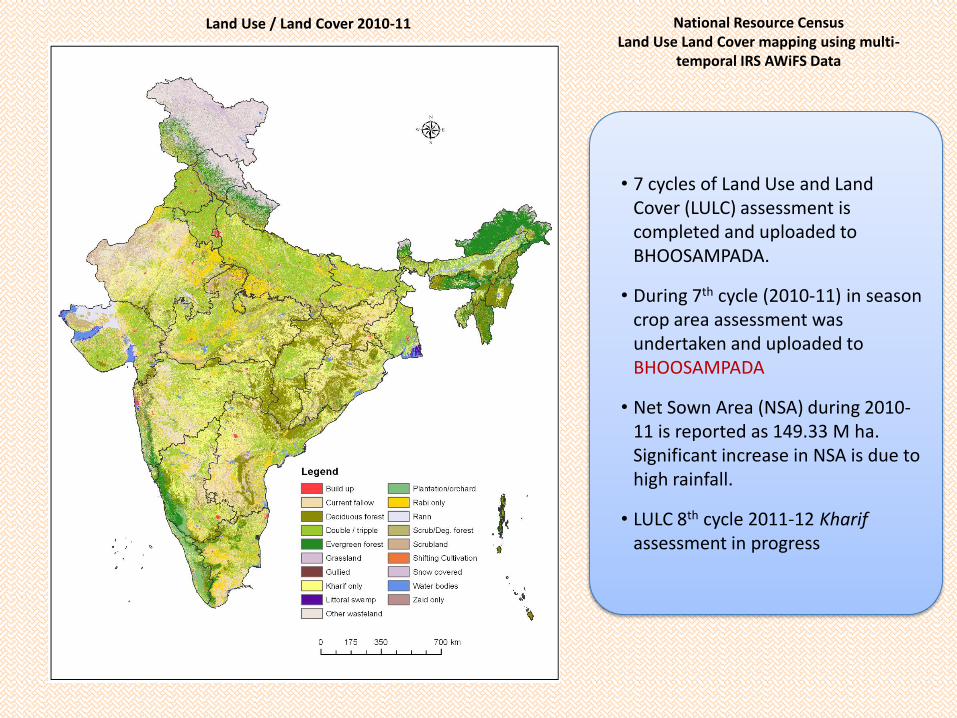
Land Use / Land Cover 2010-11
• 7 cycles of Land Use and Land Cover (LULC) assessment is completed and uploaded to BHOOSAMPADA.
• During 7th cycle (2010-11) in season crop area assessment was undertaken and uploaded to BHOOSAMPADA
• Net Sown Area (NSA) during 2010-11 is reported as 149.33 M ha. Significant increase in NSA is due to high rainfall.
• LULC 8th cycle 2011-12 Kharif assessment in progress
National Resource Census Land Use Land Cover mapping using multi-
temporal IRS AWiFS Data
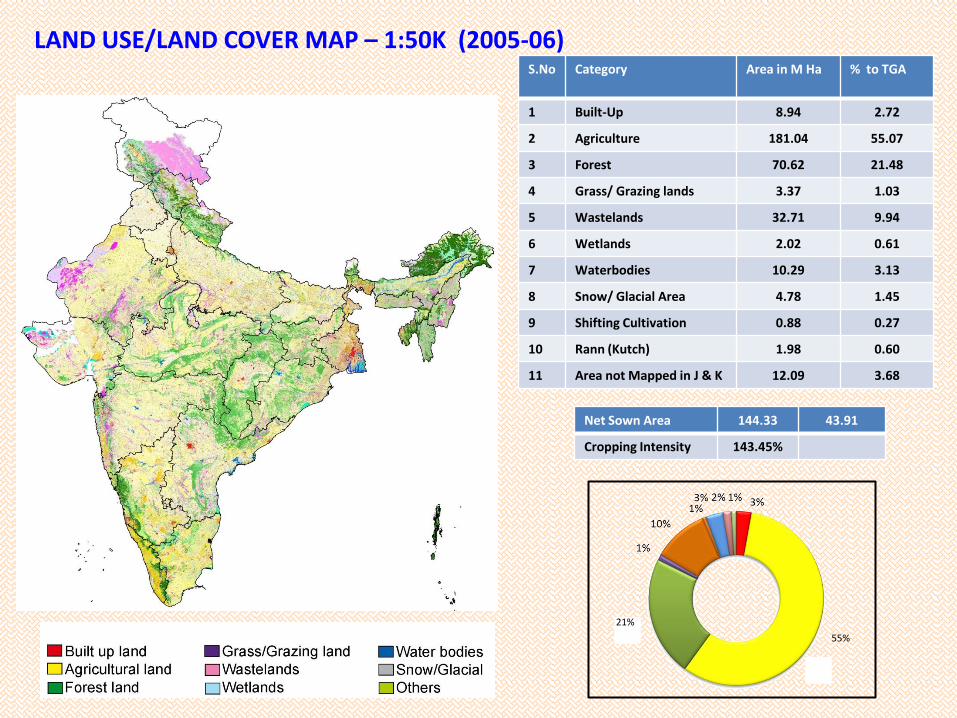
LAND USE/LAND COVER MAP – 1:50K (2005-06)
21%
55%
S.No Category Area in M Ha % to TGA
1 Built-Up 8.94 2.72
2 Agriculture 181.04 55.07
3 Forest 70.62 21.48
4 Grass/ Grazing lands 3.37 1.03
5 Wastelands 32.71 9.94
6 Wetlands 2.02 0.61
7 Waterbodies 10.29 3.13
8 Snow/ Glacial Area 4.78 1.45
9 Shifting Cultivation 0.88 0.27
10 Rann (Kutch) 1.98 0.60
11 Area not Mapped in J & K 12.09 3.68
Net Sown Area 144.33 43.91
Cropping Intensity 143.45%
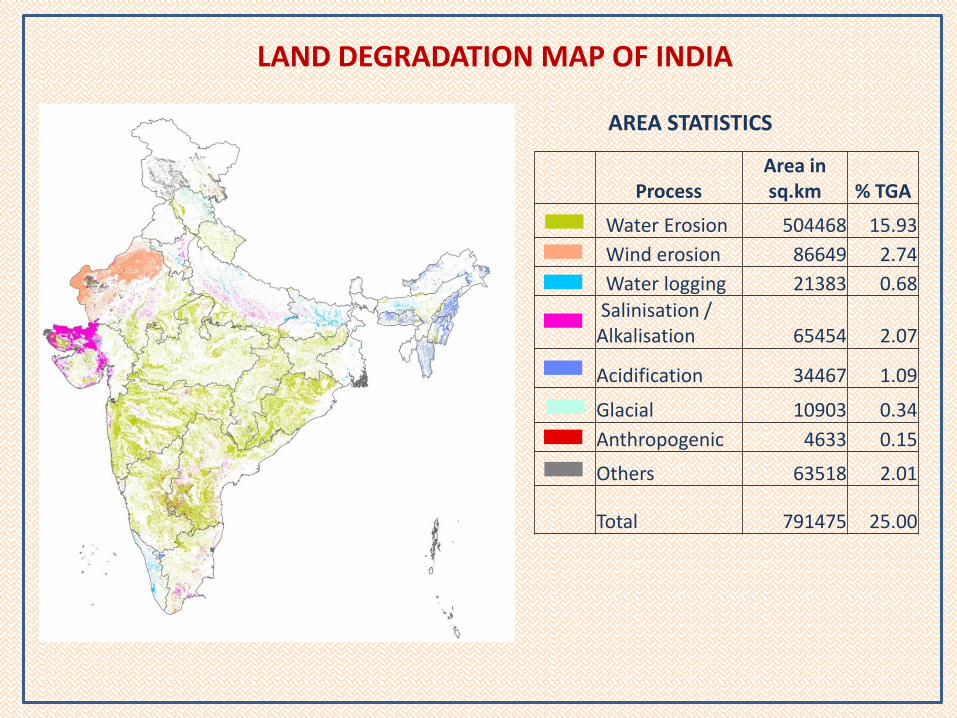
Process Area in sq.km % TGA
Water Erosion 504468 15.93
Wind erosion 86649 2.74
Water logging 21383 0.68
Salinisation / Alkalisation 65454 2.07
Acidification 34467 1.09
Glacial 10903 0.34
Anthropogenic 4633 0.15
Others 63518 2.01
Total 791475 25.00
LAND DEGRADATION MAP OF INDIA
AREA STATISTICS
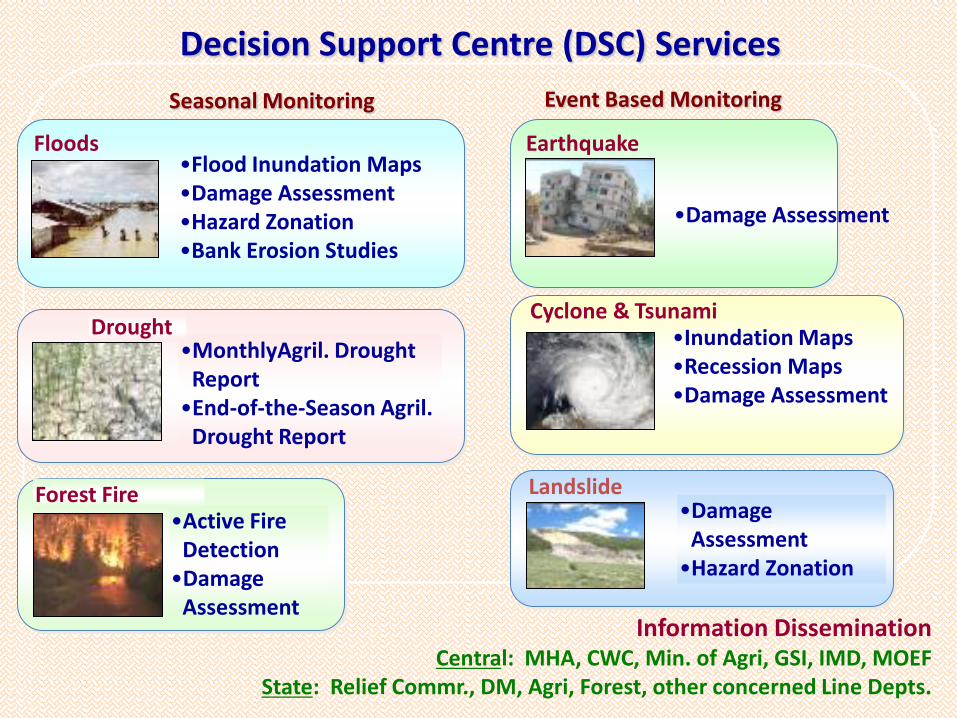
•Flood Inundation Maps •Damage Assessment •Hazard Zonation •Bank Erosion Studies
Floods
•MonthlyAgril. Drought Report
•End-of-the-Season Agril. Drought Report
Drought •Inundation Maps •Recession Maps •Damage Assessment
Cyclone & Tsunami
•Damage Assessment
Earthquake
•Damage Assessment
•Hazard Zonation
Landslide
•Active Fire Detection
•Damage Assessment
Forest Fire
Information Dissemination Central: MHA, CWC, Min. of Agri, GSI, IMD, MOEF
State: Relief Commr., DM, Agri, Forest, other concerned Line Depts.
Decision Support Centre (DSC) Services
Seasonal Monitoring Event Based Monitoring
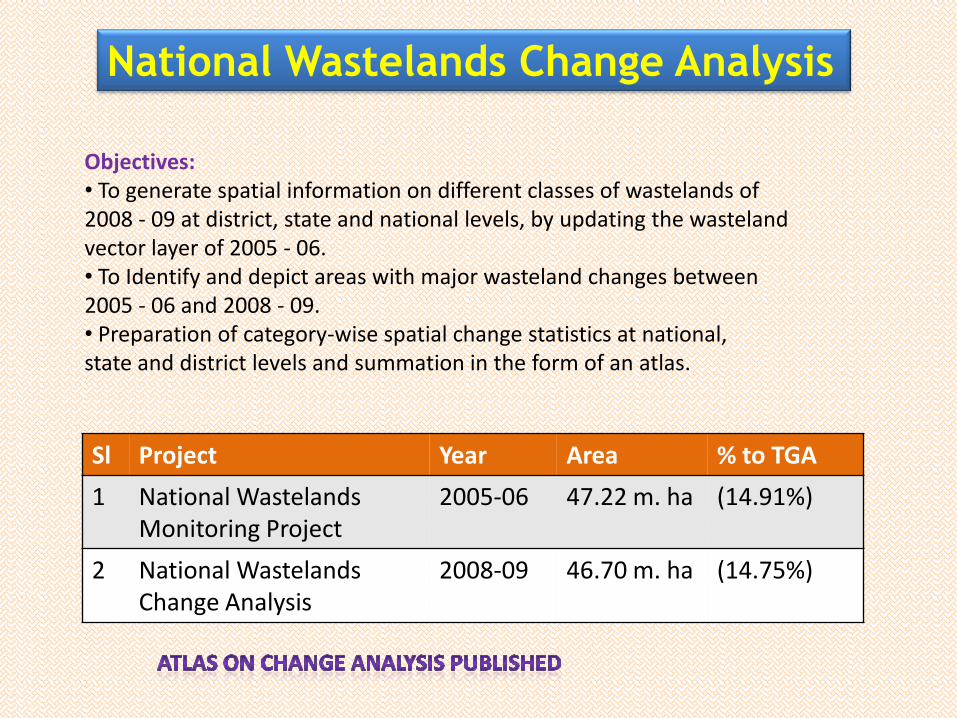
Sl Project Year Area % to TGA
1 National Wastelands Monitoring Project
2005-06
47.22 m. ha (14.91%)
2 National Wastelands Change Analysis
2008-09 46.70 m. ha (14.75%)
National Wastelands Change Analysis
Objectives: • To generate spatial information on different classes of wastelands of 2008 - 09 at district, state and national levels, by updating the wasteland vector layer of 2005 - 06. • To Identify and depict areas with major wasteland changes between 2005 - 06 and 2008 - 09. • Preparation of category-wise spatial change statistics at national, state and district levels and summation in the form of an atlas.
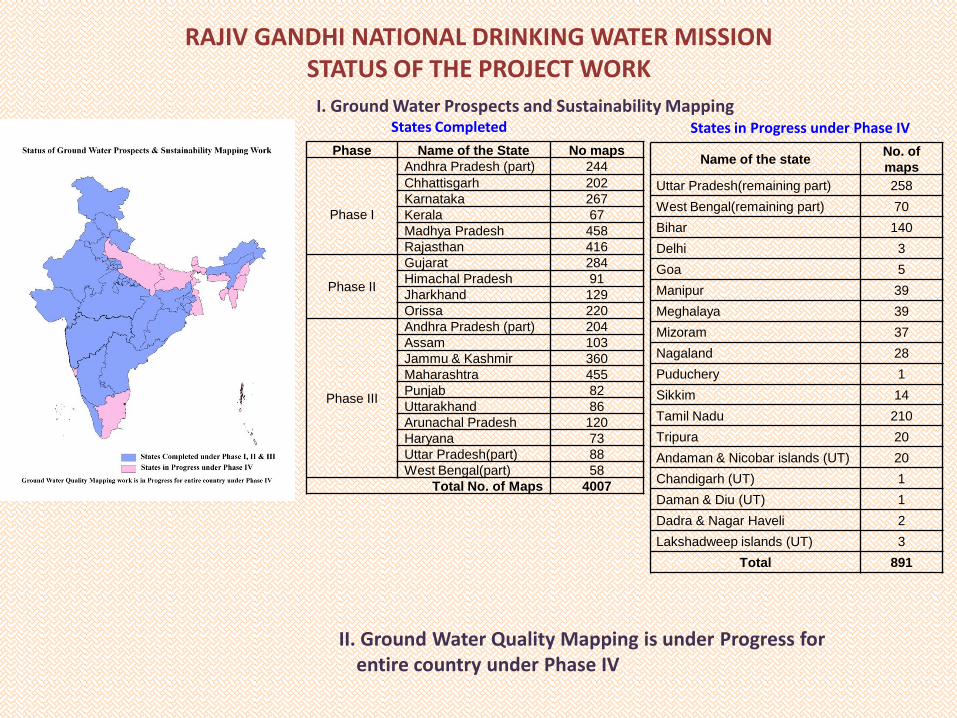
RAJIV GANDHI NATIONAL DRINKING WATER MISSION STATUS OF THE PROJECT WORK
Phase Name of the State No maps
Phase I
Andhra Pradesh (part) 244
Chhattisgarh 202
Karnataka 267
Kerala 67
Madhya Pradesh 458
Rajasthan 416
Phase II
Gujarat 284
Himachal Pradesh 91
Jharkhand 129
Orissa 220
Phase III
Andhra Pradesh (part) 204
Assam 103
Jammu & Kashmir 360
Maharashtra 455
Punjab 82
Uttarakhand 86
Arunachal Pradesh 120
Haryana 73
Uttar Pradesh(part) 88
West Bengal(part) 58
Total No. of Maps 4007
I. Ground Water Prospects and Sustainability Mapping
Name of the state No. of
maps
Uttar Pradesh(remaining part) 258
West Bengal(remaining part) 70
Bihar 140
Delhi 3
Goa 5
Manipur 39
Meghalaya 39
Mizoram 37
Nagaland 28
Puduchery 1
Sikkim 14
Tamil Nadu 210
Tripura 20
Andaman & Nicobar islands (UT) 20
Chandigarh (UT) 1
Daman & Diu (UT) 1
Dadra & Nagar Haveli 2
Lakshadweep islands (UT) 3
Total 891
States Completed States in Progress under Phase IV
II. Ground Water Quality Mapping is under Progress for entire country under Phase IV
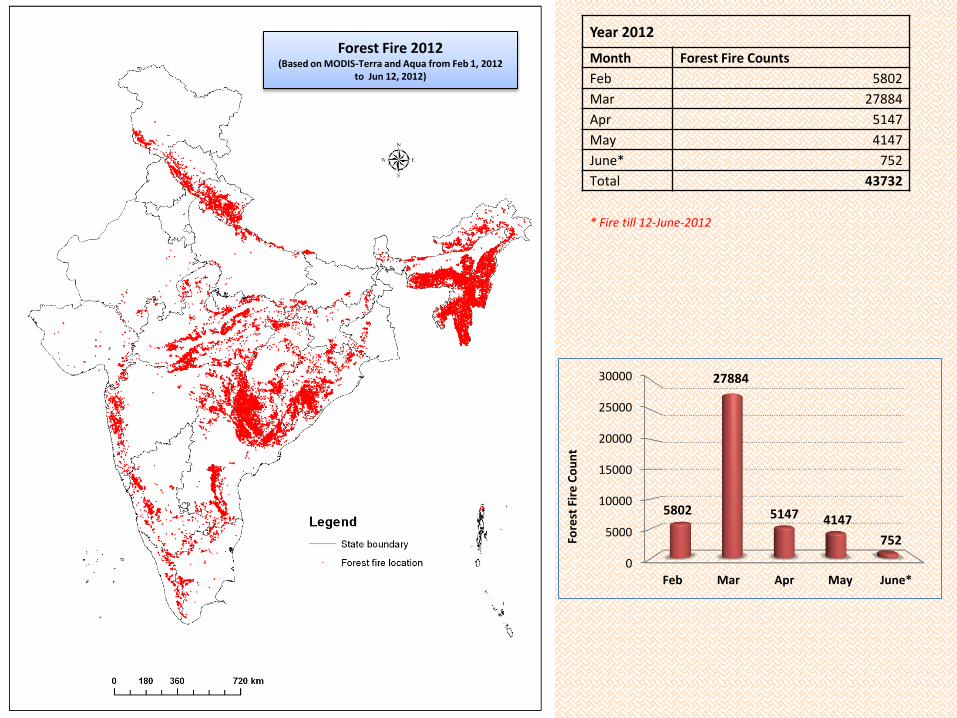
Forest Fire 2012 (Based on MODIS-Terra and Aqua from Feb 1, 2012
to Jun 12, 2012)
Year 2012
Month Forest Fire Counts
Feb 5802
Mar 27884
Apr 5147
May 4147
June* 752
Total 43732
* Fire till 12-June-2012
0
5000
10000
15000
20000
25000
30000
Feb Mar Apr May June*
5802
27884
5147 4147
752 Fore
st F
ire
Co
un
t
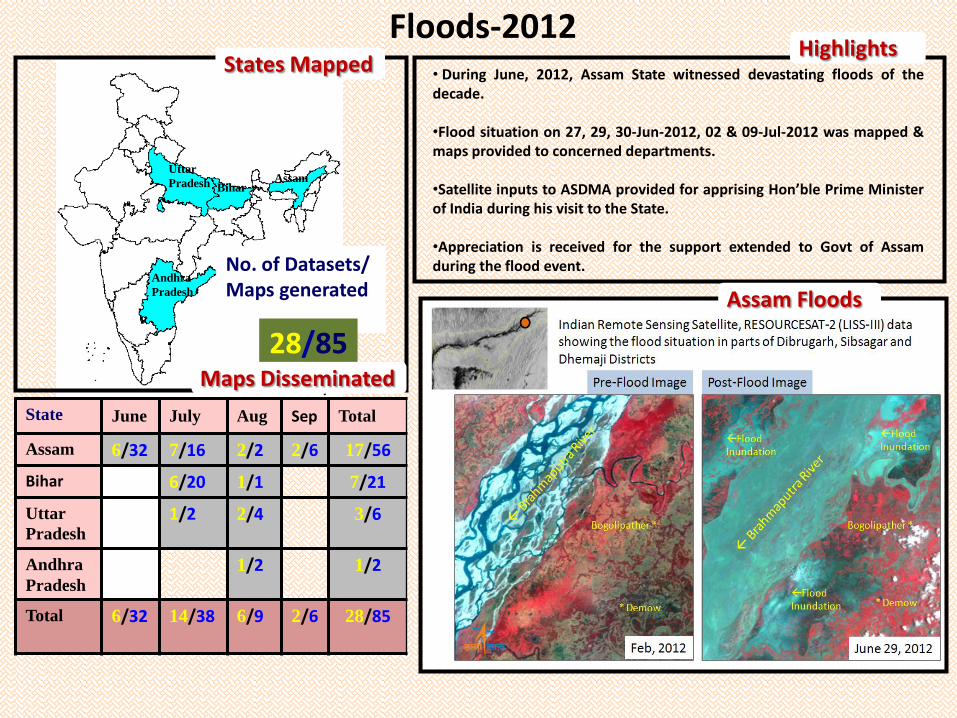
Floods-2012
Assam Uttar
Pradesh
Andhra
Pradesh
Bihar
State June July Aug Sep Total
Assam 6/32 7/16 2/2 2/6 17/56
Bihar 6/20 1/1 7/21
Uttar
Pradesh 1/2 2/4 3/6
Andhra
Pradesh
1/2 1/2
Total 6/32 14/38 6/9
2/6
28/85
No. of Datasets/ Maps generated
28/85
• During June, 2012, Assam State witnessed devastating floods of the decade.
•Flood situation on 27, 29, 30-Jun-2012, 02 & 09-Jul-2012 was mapped & maps provided to concerned departments.
•Satellite inputs to ASDMA provided for apprising Hon’ble Prime Minister of India during his visit to the State.
•Appreciation is received for the support extended to Govt of Assam during the flood event.
Assam Floods
Highlights States Mapped
Maps Disseminated
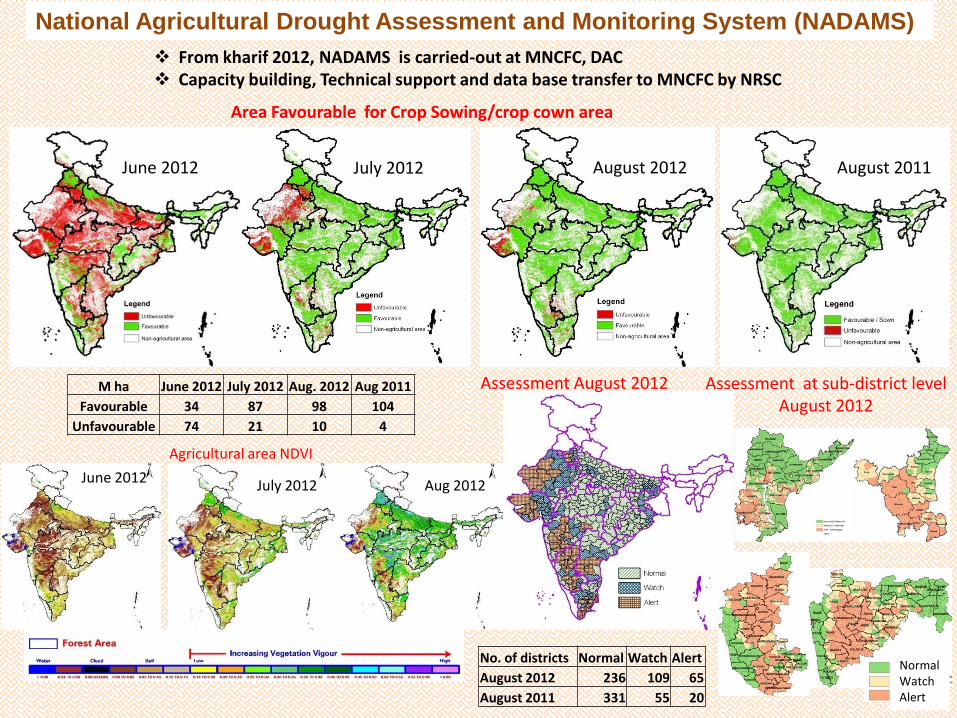
National Agricultural Drought Assessment and Monitoring System (NADAMS)
August 2012 July 2012 June 2012
Normal Watch Alert
Assessment August 2012
Sub-district level assessment
August 2012
From kharif 2012, NADAMS is carried-out at MNCFC, DAC Capacity building, Technical support and data base transfer to MNCFC by NRSC
AFCS, June 2012
M ha June 2012 July 2012 Aug. 2012 Aug 2011
Favourable 34 87 98 104
Unfavourable 74 21 10 4
July 2012 August 2011 June 2012
Area Favourable for Crop Sowing/crop cown area
Assessment at sub-district level August 2012
No. of districts Normal Watch Alert
August 2012 236 109 65
August 2011 331 55 20
Aug 2012
Agricultural area NDVI
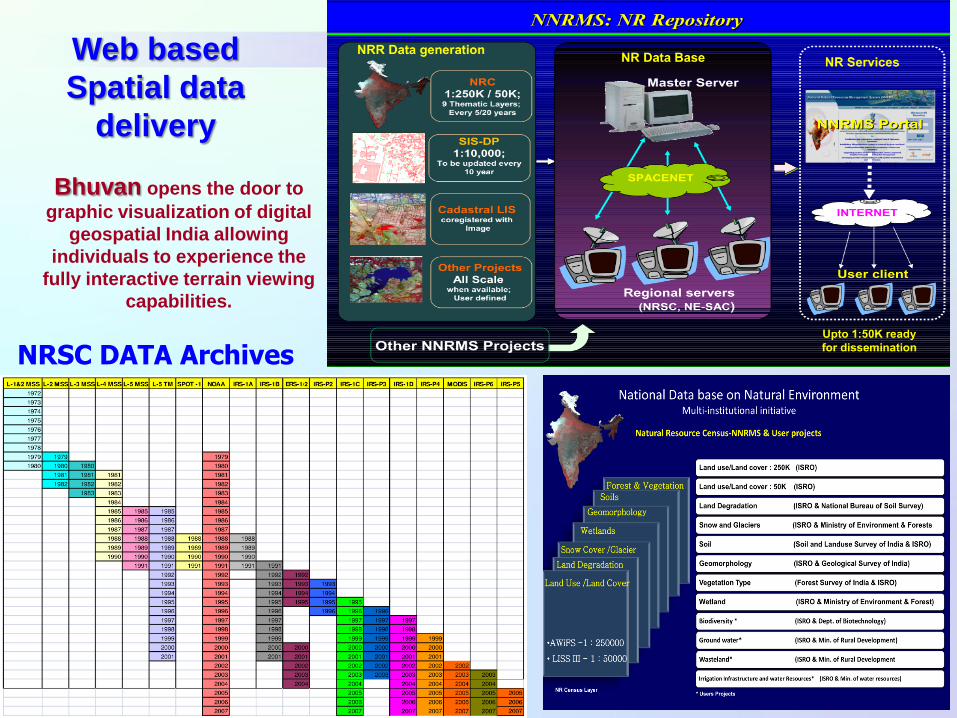
NRSC DATA Archives
Web based
Spatial data
delivery
Bhuvan opens the door to
graphic visualization of digital
geospatial India allowing
individuals to experience the
fully interactive terrain viewing
capabilities.

Bhuvan
www.bhuvan.nrsc.gov.in
Gateway to Indian Earth Observation Data Products & Services
To manifest the distinctiveness of Indian Earth
Observation capabilities through online rendering of multi- resolution, multi-temporal and multi-sensor IRS imagery; overlaying value added thematic information on
2D/3D virtual globe; providing satellite data and products for download; consume thematic datasets as OGC web services; And online Geo-Processing
Goal
Release 1
12 Aug 2009
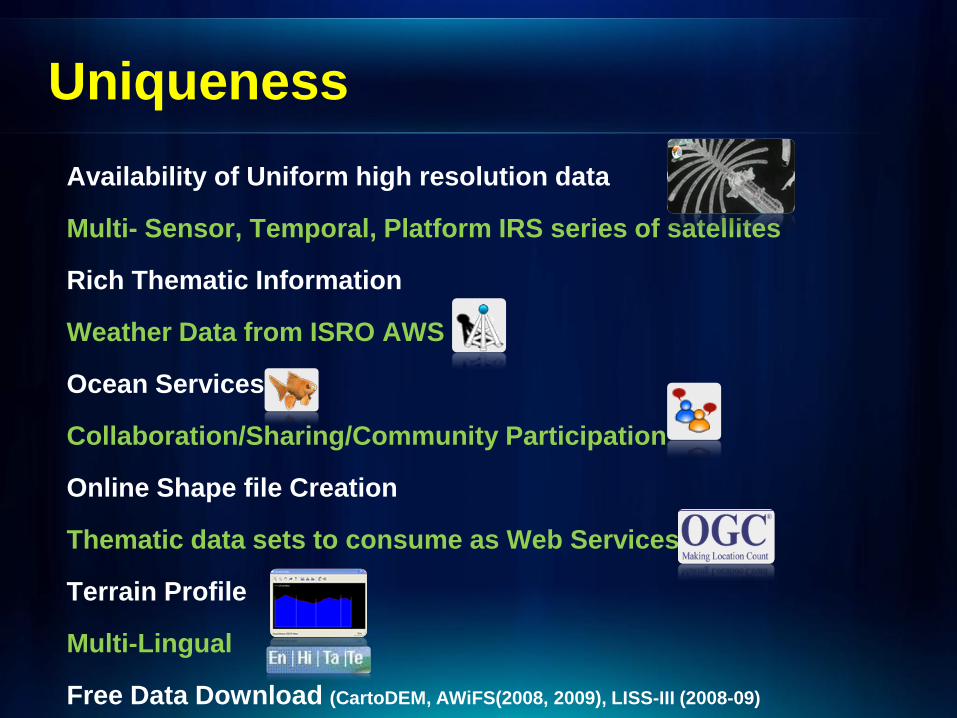
Uniqueness
Availability of Uniform high resolution data
Multi- Sensor, Temporal, Platform IRS series of satellites
Rich Thematic Information
Weather Data from ISRO AWS
Ocean Services
Collaboration/Sharing/Community Participation
Online Shape file Creation
Thematic data sets to consume as Web Services
Terrain Profile
Multi-Lingual
Free Data Download (CartoDEM, AWiFS(2008, 2009), LISS-III (2008-09)
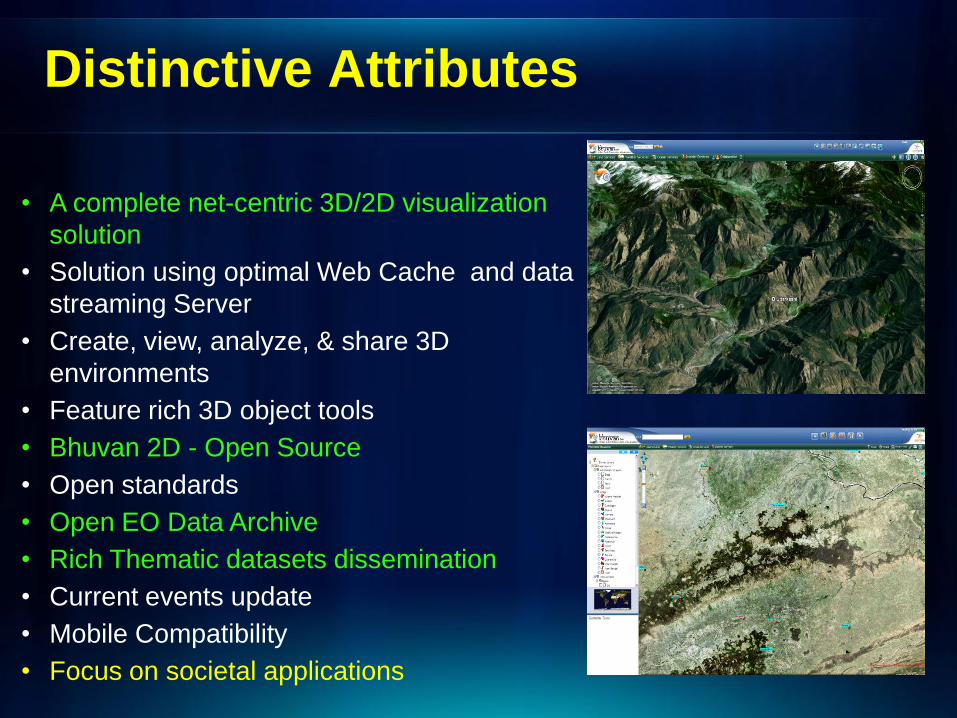
• A complete net-centric 3D/2D visualization
solution
• Solution using optimal Web Cache and data
streaming Server
• Create, view, analyze, & share 3D
environments
• Feature rich 3D object tools
• Bhuvan 2D - Open Source
• Open standards
• Open EO Data Archive
• Rich Thematic datasets dissemination
• Current events update
• Mobile Compatibility
• Focus on societal applications
Distinctive Attributes
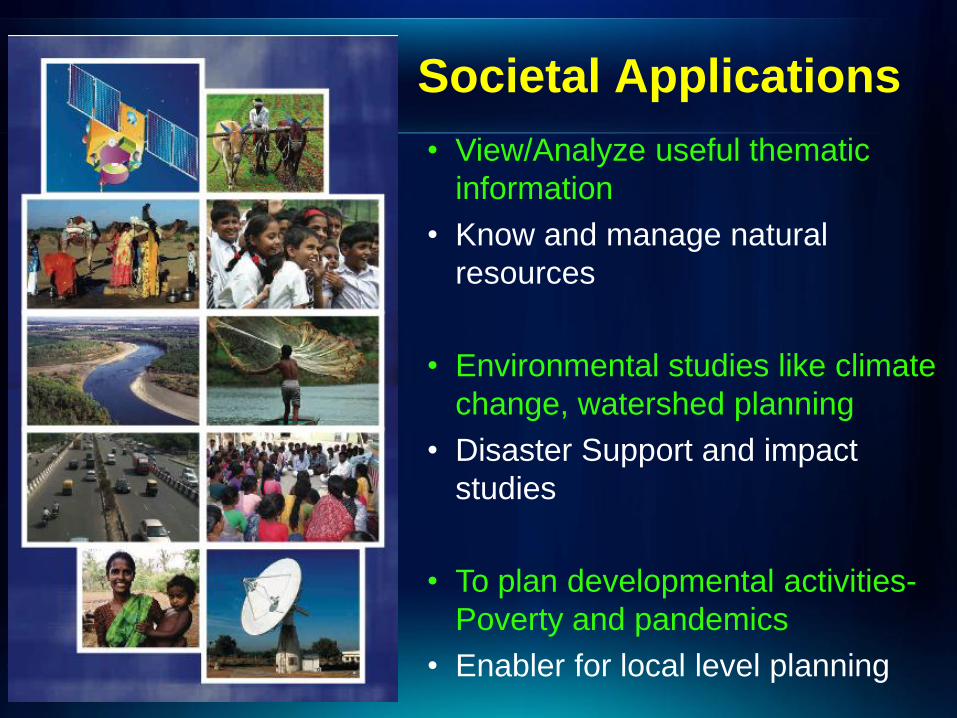
• View/Analyze useful thematic
information
• Know and manage natural
resources
• Environmental studies like climate
change, watershed planning
• Disaster Support and impact
studies
• To plan developmental activities-
Poverty and pandemics
• Enabler for local level planning
Societal Applications
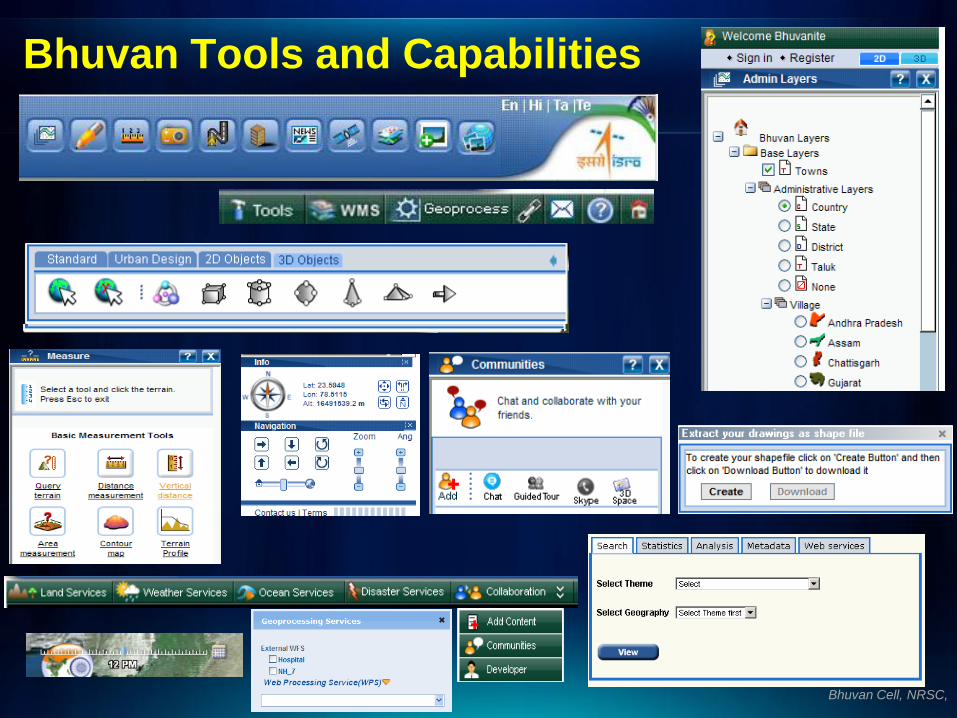
Bhuvan Tools and Capabilities
Bhuvan Cell, NRSC,
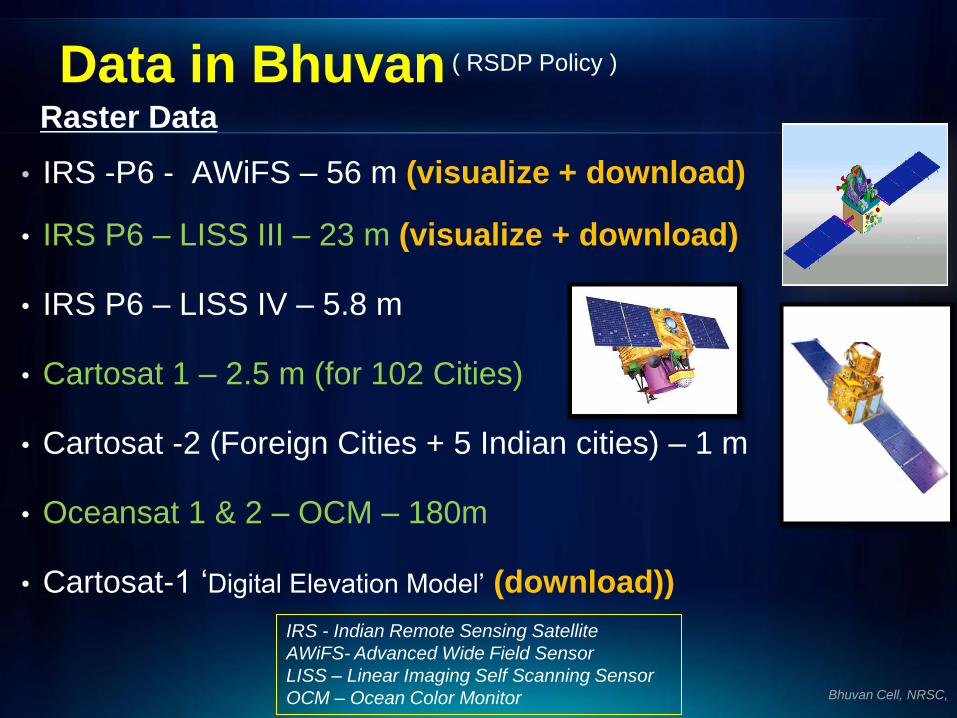
• IRS -P6 - AWiFS – 56 m (visualize + download)
• IRS P6 – LISS III – 23 m (visualize + download)
• IRS P6 – LISS IV – 5.8 m
• Cartosat 1 – 2.5 m (for 102 Cities)
• Cartosat -2 (Foreign Cities + 5 Indian cities) – 1 m
• Oceansat 1 & 2 – OCM – 180m
• Cartosat-1 ‘Digital Elevation Model’ (download))
Data in Bhuvan Raster Data
IRS - Indian Remote Sensing Satellite
AWiFS- Advanced Wide Field Sensor
LISS – Linear Imaging Self Scanning Sensor
OCM – Ocean Color Monitor
( RSDP Policy )
Bhuvan Cell, NRSC,
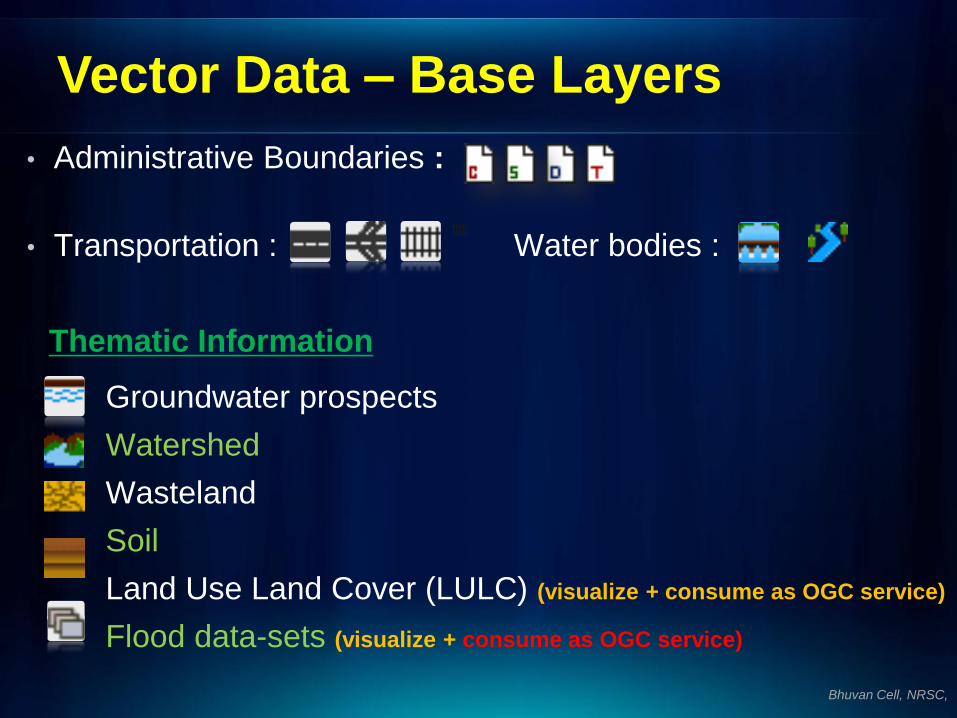
• Administrative Boundaries :
• Transportation : Water bodies :
Vector Data – Base Layers
Groundwater prospects
Watershed
Wasteland
Soil
Land Use Land Cover (LULC) (visualize + consume as OGC service)
Flood data-sets (visualize + consume as OGC service)
Thematic Information
Bhuvan Cell, NRSC,
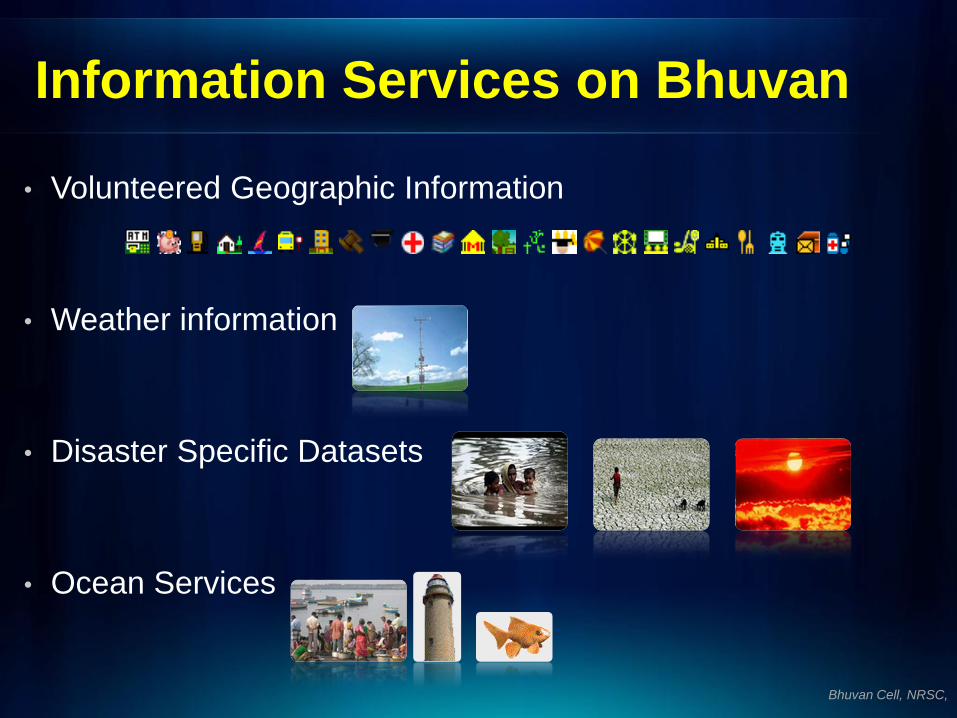
• Volunteered Geographic Information
• Weather information
• Disaster Specific Datasets
• Ocean Services
Information Services on Bhuvan
Bhuvan Cell, NRSC,
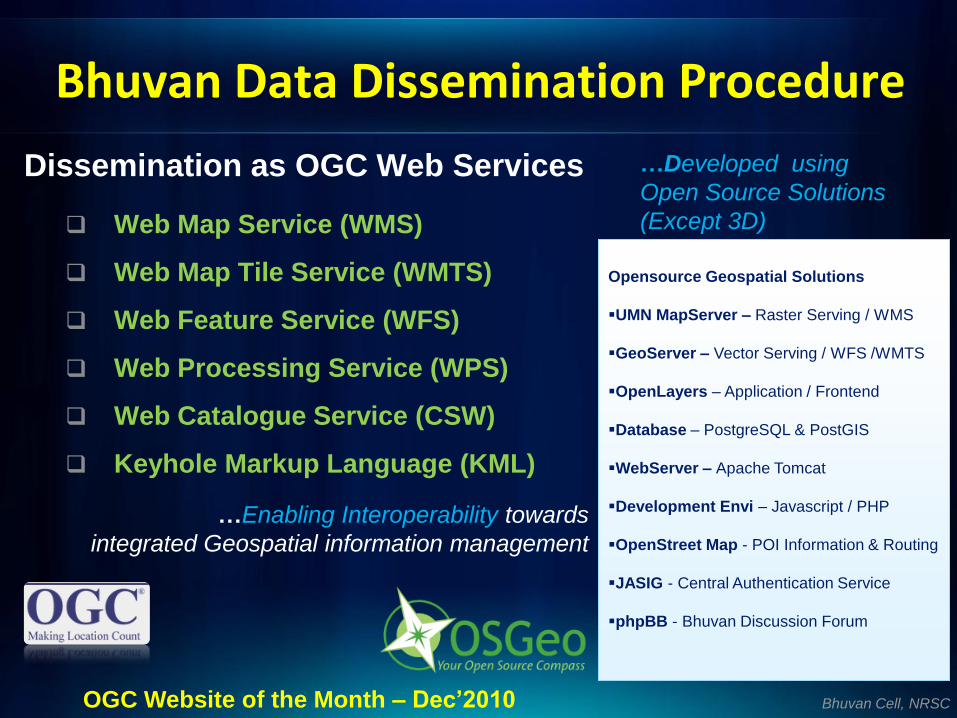
Dissemination as OGC Web Services
Web Map Service (WMS)
Web Map Tile Service (WMTS)
Web Feature Service (WFS)
Web Processing Service (WPS)
Web Catalogue Service (CSW)
Keyhole Markup Language (KML)
Bhuvan Data Dissemination Procedure
…Enabling Interoperability towards
integrated Geospatial information management
Bhuvan Cell, NRSC
Opensource Geospatial Solutions
UMN MapServer – Raster Serving / WMS
GeoServer – Vector Serving / WFS /WMTS
OpenLayers – Application / Frontend
Database – PostgreSQL & PostGIS
WebServer – Apache Tomcat
Development Envi – Javascript / PHP
OpenStreet Map - POI Information & Routing
JASIG - Central Authentication Service
phpBB - Bhuvan Discussion Forum
…Developed using
Open Source Solutions
(Except 3D)
OGC Website of the Month – Dec’2010
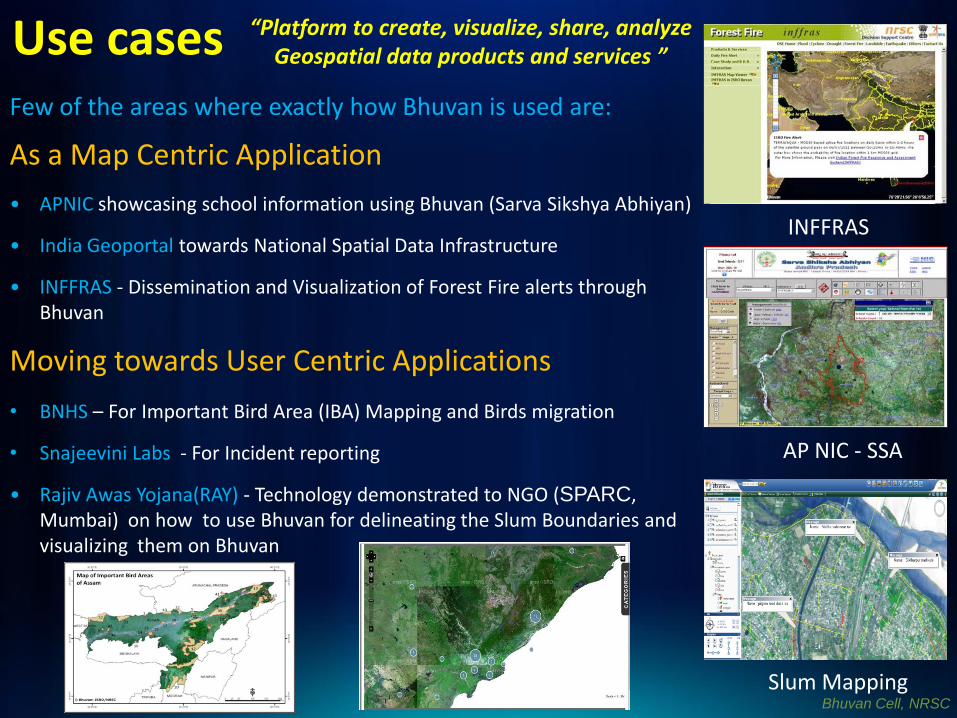
Use cases Few of the areas where exactly how Bhuvan is used are:
As a Map Centric Application
• APNIC showcasing school information using Bhuvan (Sarva Sikshya Abhiyan)
• India Geoportal towards National Spatial Data Infrastructure
• INFFRAS - Dissemination and Visualization of Forest Fire alerts through Bhuvan
Moving towards User Centric Applications
• BNHS – For Important Bird Area (IBA) Mapping and Birds migration
• Snajeevini Labs - For Incident reporting
• Rajiv Awas Yojana(RAY) - Technology demonstrated to NGO (SPARC, Mumbai) on how to use Bhuvan for delineating the Slum Boundaries and visualizing them on Bhuvan
AP NIC - SSA
INFFRAS
Slum Mapping Bhuvan Cell, NRSC
“Platform to create, visualize, share, analyze Geospatial data products and services ”

User centric Applications
• Andhra Pradesh – Forest Department • Community Forest Management
1. Visualization and querying 2. Online Editing 3. Spatial Query (Dynamic) 4. Analysis and Report 5. User data Upload(Shape File) “Van Samrakshan Samiti ; Species Information”
Bhuvan Cell, NRSC
AP FD
KFD
• Karnataka – Forest Department • Forest Monitoring System
1. Geospatial query 2. Monitoring of Assets 3. Online shape file creation 4. Change Analysis 5. Forest Fire alert
“Beat boundary; Asset layers; VFC; Green India Mission; Elephant Corridor; Forest Types”
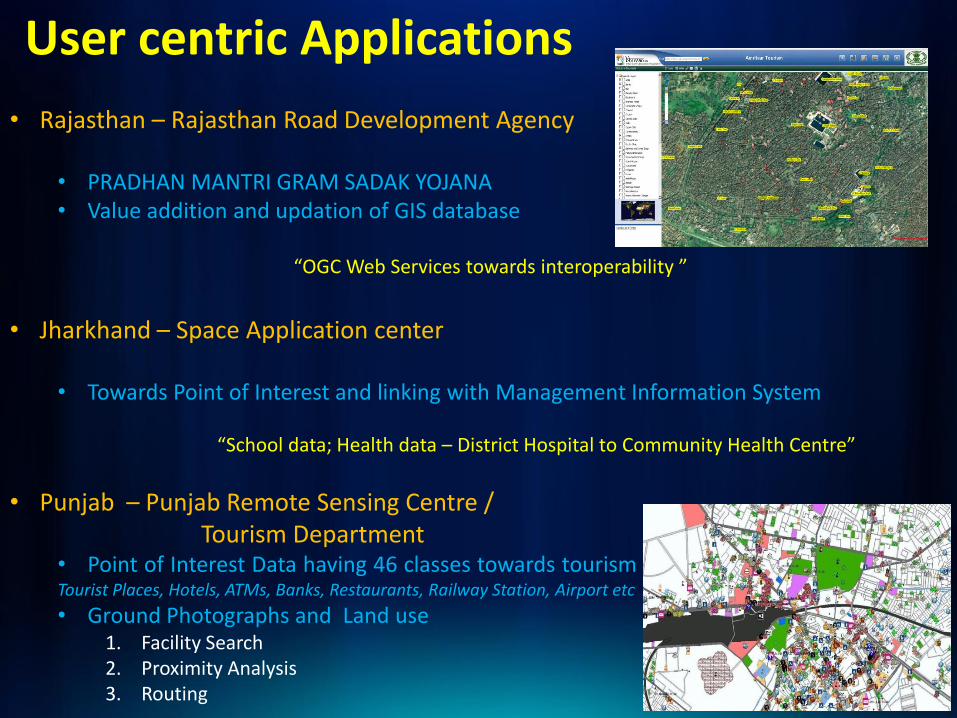
User centric Applications
• Rajasthan – Rajasthan Road Development Agency
• PRADHAN MANTRI GRAM SADAK YOJANA • Value addition and updation of GIS database
“OGC Web Services towards interoperability ”
Bhuvan Cell, NRSC
• Jharkhand – Space Application center
• Towards Point of Interest and linking with Management Information System “School data; Health data – District Hospital to Community Health Centre”
• Punjab – Punjab Remote Sensing Centre / Tourism Department
• Point of Interest Data having 46 classes towards tourism Tourist Places, Hotels, ATMs, Banks, Restaurants, Railway Station, Airport etc
• Ground Photographs and Land use 1. Facility Search 2. Proximity Analysis 3. Routing
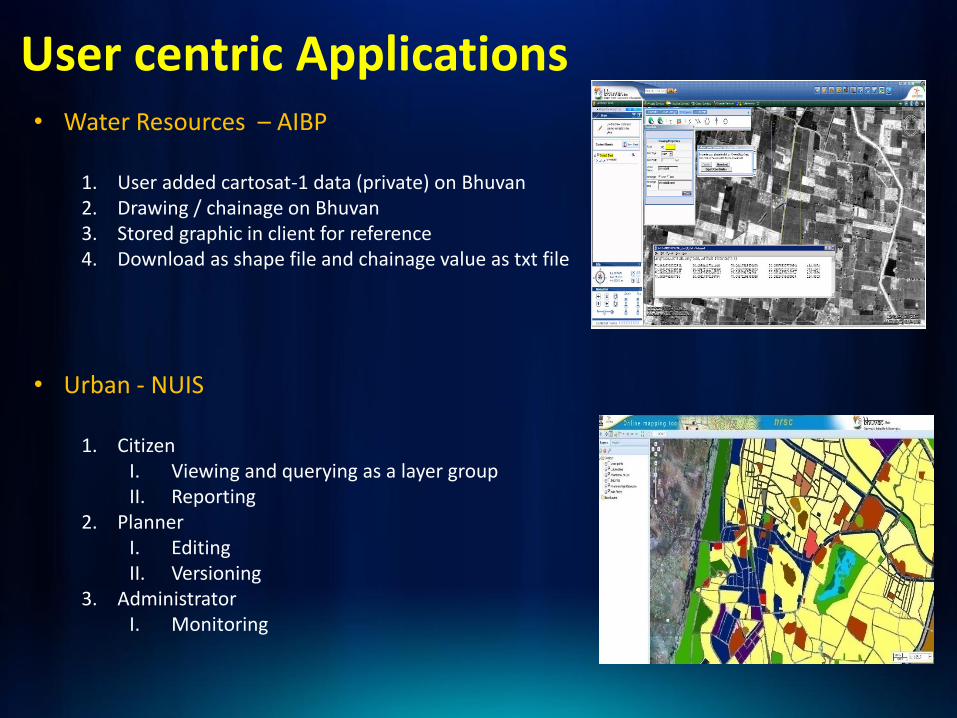
• Water Resources – AIBP
1. User added cartosat-1 data (private) on Bhuvan 2. Drawing / chainage on Bhuvan 3. Stored graphic in client for reference 4. Download as shape file and chainage value as txt file
User centric Applications
• Urban - NUIS
1. Citizen I. Viewing and querying as a layer group II. Reporting
2. Planner I. Editing II. Versioning
3. Administrator I. Monitoring
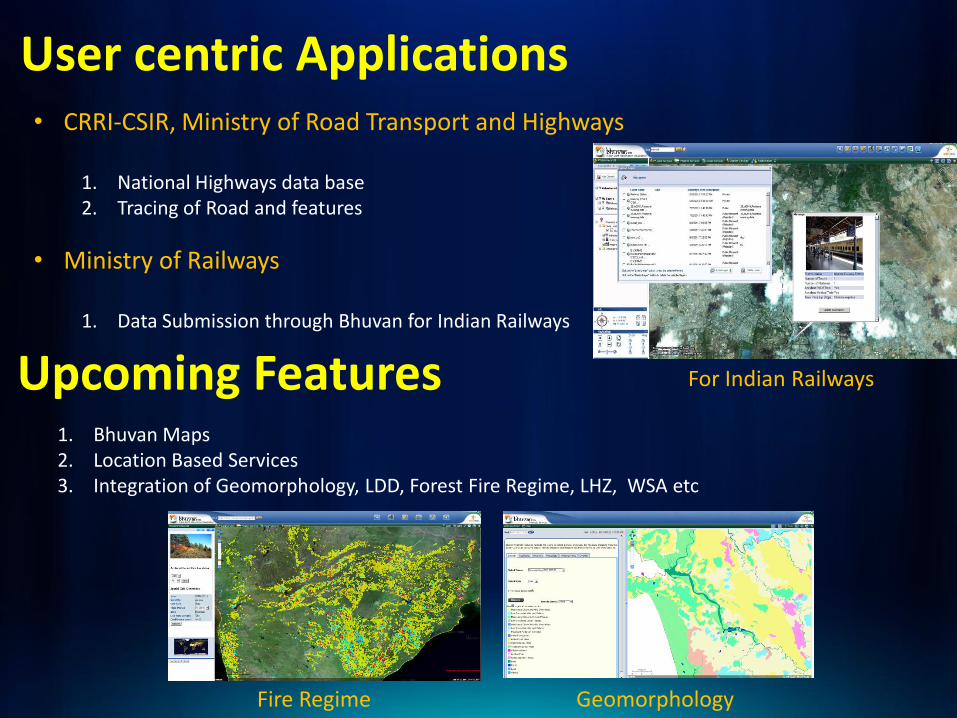
• CRRI-CSIR, Ministry of Road Transport and Highways
1. National Highways data base 2. Tracing of Road and features
User centric Applications
• Ministry of Railways
1. Data Submission through Bhuvan for Indian Railways
Upcoming Features
1. Bhuvan Maps 2. Location Based Services 3. Integration of Geomorphology, LDD, Forest Fire Regime, LHZ, WSA etc
Fire Regime Geomorphology
For Indian Railways
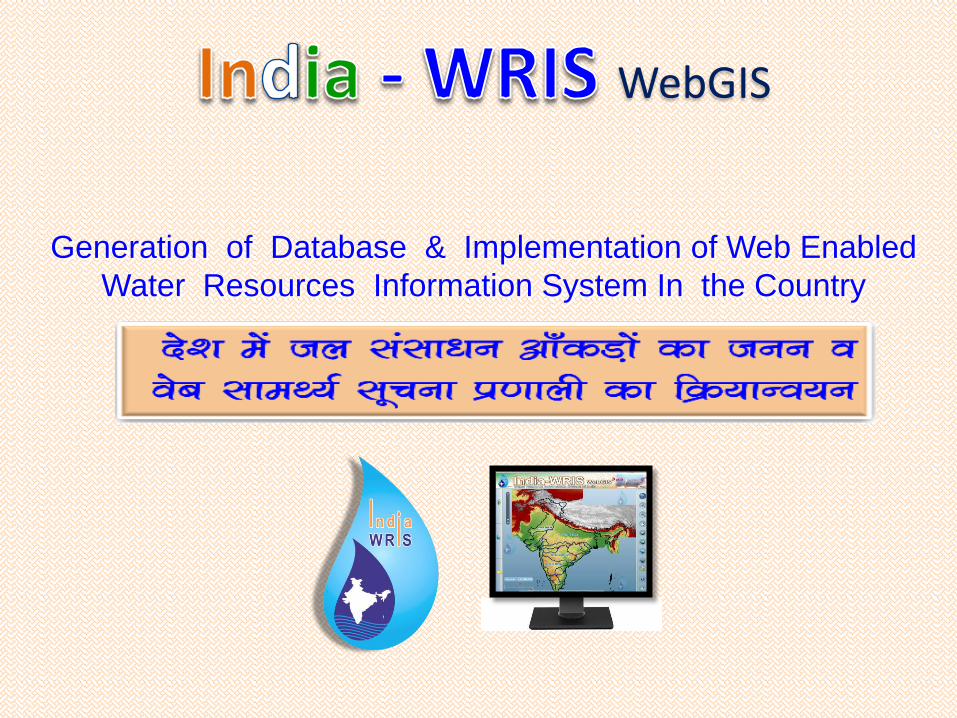
Generation of Database & Implementation of Web Enabled
Water Resources Information System In the Country
WebGIS

Real Time
Database
Dynamic Time series
datasets
Related Thematic Database
Foundation Geo-database
Generation Administrative
Foundation Geo-database generation
Water resources
Data types, Scope
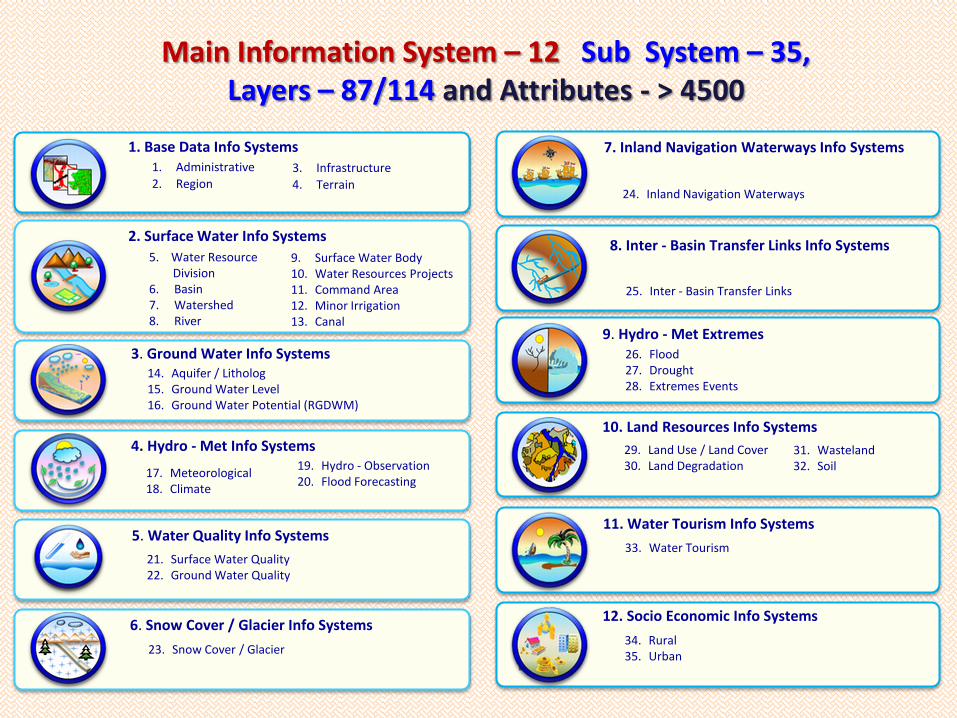
& Information Systems Main Information System – 12
I. BASE DATA INFO SYS
II. SURFACE WATER INFO SYS
III. GROUND WATER INFO SYS
IV. HYDRO – MET INFO SYS
V. WATER QUALITY INFO SYS
VI. SNOW COVER / GLACIER INFO SYS
VII. INLAND NAVIGATION WATERWAYS INFO
VIII. INTER-BASIN TRANSFER LINKS INFO SYS
IX. HYDROLOGICAL EXTREMES INFO SYS
X. LAND RESOURCES INFO SYS
XI. WATER TOURISM INFO SYS
XII. SOCIO – ECONOMIC INFO SYS

India-WRIS Version 3.0
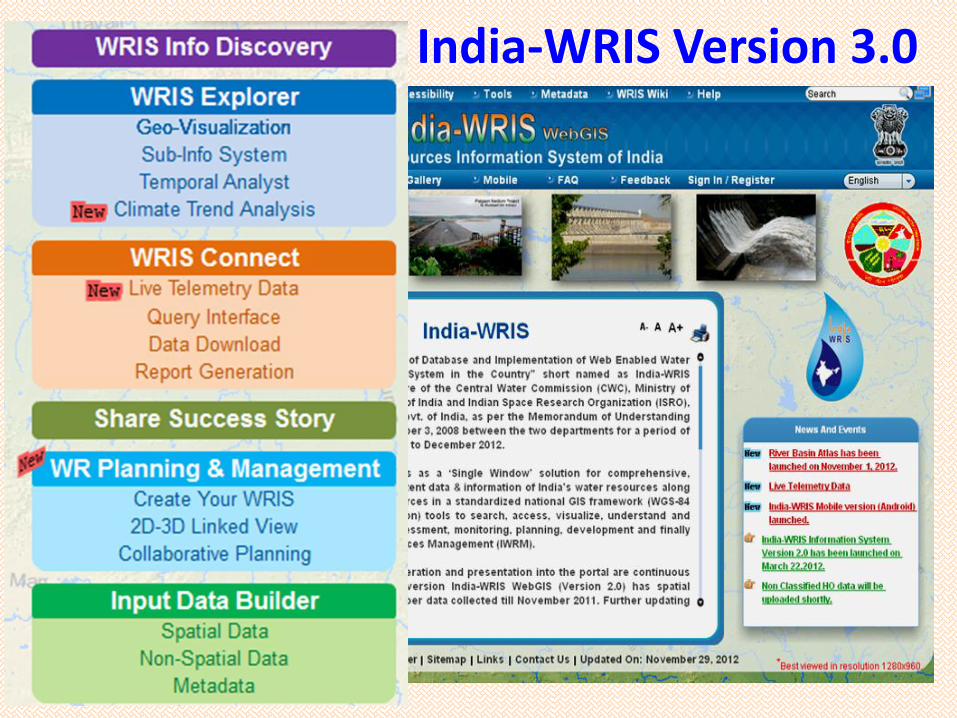
India-WRIS Version 3.0
9. Surface Water Body 10. Water Resources Projects 11. Command Area 12. Minor Irrigation 13. Canal
14. Aquifer / Litholog 15. Ground Water Level 16. Ground Water Potential (RGDWM)
5. Water Resource Division 6. Basin 7. Watershed 8. River
17. Meteorological 18. Climate
21. Surface Water Quality 22. Ground Water Quality
23. Snow Cover / Glacier
24. Inland Navigation Waterways
25. Inter - Basin Transfer Links
26. Flood 27. Drought 28. Extremes Events
29. Land Use / Land Cover 30. Land Degradation
33. Water Tourism
34. Rural 35. Urban
1. Administrative
2. Region
1. Base Data Info Systems
3. Infrastructure
4. Terrain
7. Inland Navigation Waterways Info Systems
8. Inter - Basin Transfer Links Info Systems
9. Hydro - Met Extremes
10. Land Resources Info Systems
11. Water Tourism Info Systems
12. Socio Economic Info Systems
2. Surface Water Info Systems
3. Ground Water Info Systems
4. Hydro - Met Info Systems
5. Water Quality Info Systems
6. Snow Cover / Glacier Info Systems
19. Hydro - Observation 20. Flood Forecasting
31. Wasteland 32. Soil
Main Information System – 12 Sub System – 35, Layers – 87/114 and Attributes - > 4500
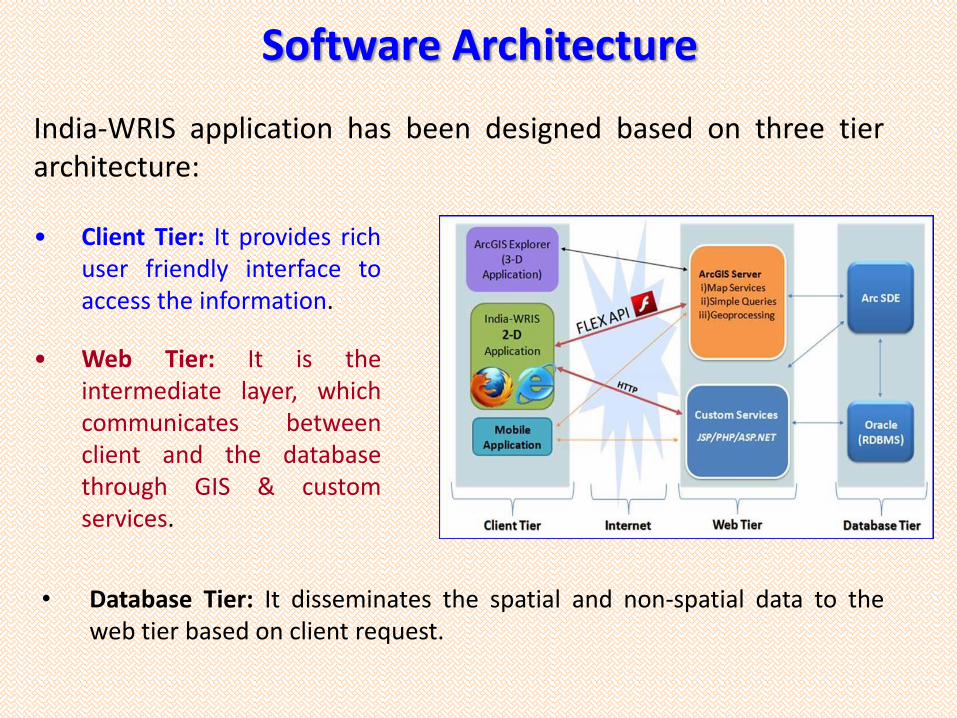
• Client Tier: It provides rich user friendly interface to access the information.
• Web Tier: It is the intermediate layer, which communicates between client and the database through GIS & custom services.
Software Architecture
India-WRIS application has been designed based on three tier architecture:
• Database Tier: It disseminates the spatial and non-spatial data to the web tier based on client request.
Elevation (m)
River
Watershed Bnd
475 - 500
500 - 525
525 - 550
550 - 600
600 - 650
650 - 700
700 - 800
800 - 900
900 - 1,000
1,000 - 1,500
1,500 - 2,000
Rainfall (mm)
500 - 600
600 - 700
700 - 800
800 - 1,000
1,000 - 1,200
1,200 - 1,600
1,600 - 2,000
2,000 - 2,400
2,400 - 2,800
2,800 - 3,200
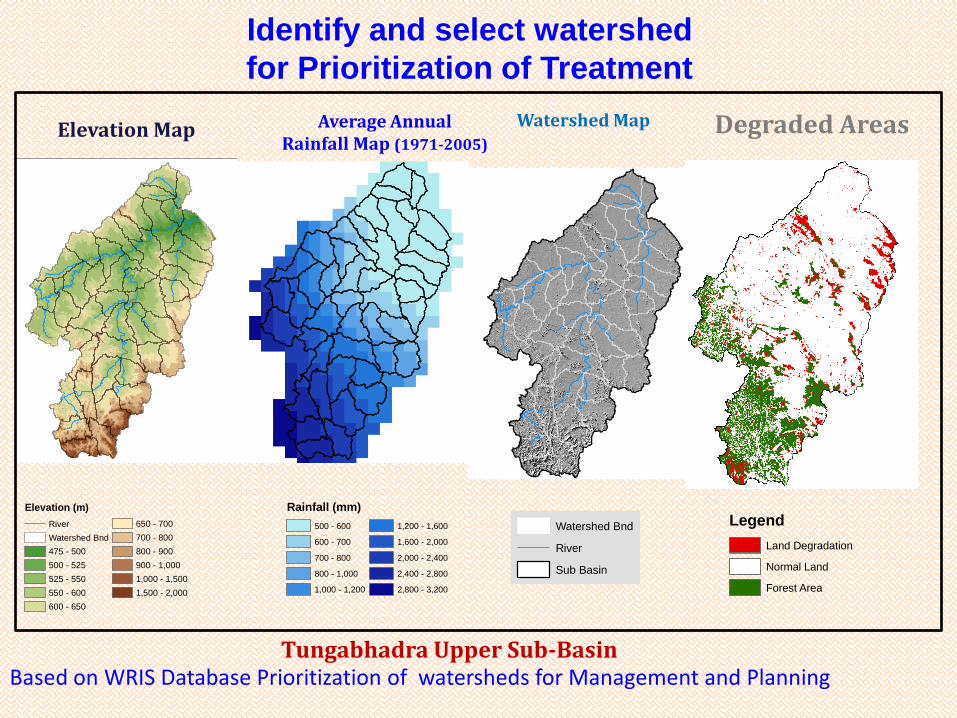
Elevation Map Average Annual Rainfall Map (1971-2005)
Identify and select watershed
for Prioritization of Treatment
Watershed Map
Watershed Bnd
River
Sub Basin
Degraded Areas
Tungabhadra Upper Sub-Basin Based on WRIS Database Prioritization of watersheds for Management and Planning
Legend
Land Degradation
Normal Land
Forest Area
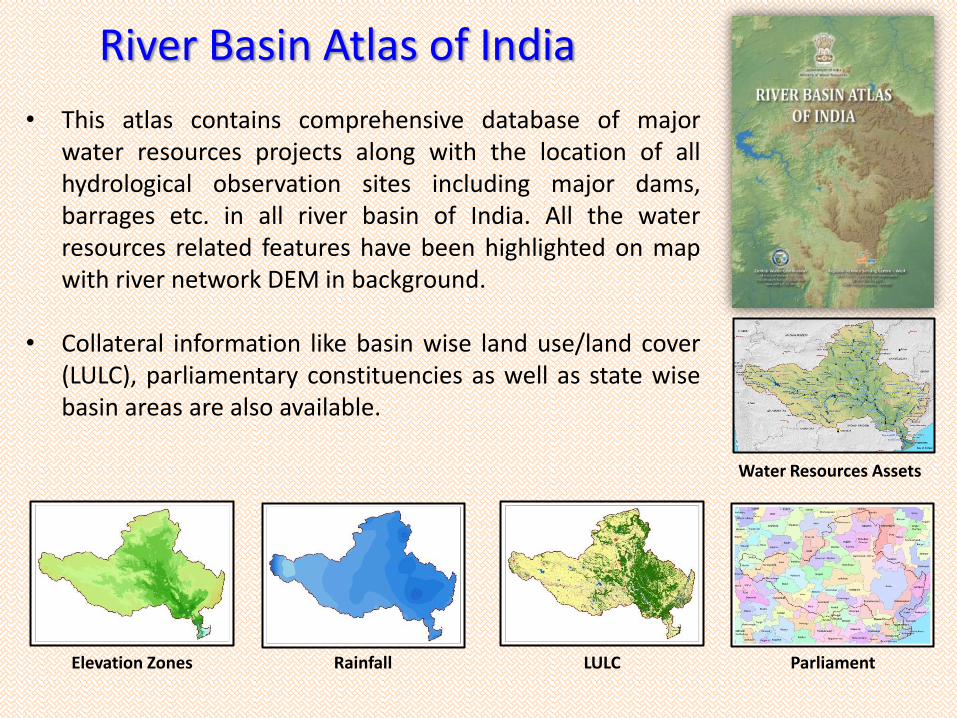
River Basin Atlas of India
• This atlas contains comprehensive database of major water resources projects along with the location of all hydrological observation sites including major dams, barrages etc. in all river basin of India. All the water resources related features have been highlighted on map with river network DEM in background.
• Collateral information like basin wise land use/land cover (LULC), parliamentary constituencies as well as state wise basin areas are also available.
Elevation Zones Rainfall LULC Parliament
Water Resources Assets
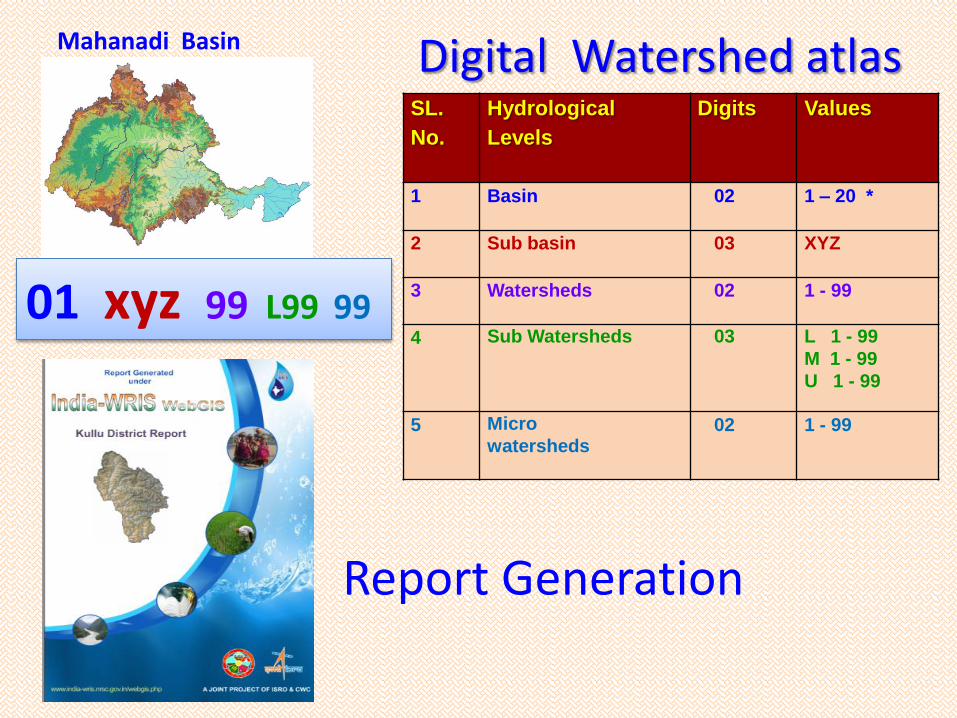
Mahanadi Basin
SL.
No.
Hydrological
Levels
Digits Values
1 Basin 02 1 – 20 *
2 Sub basin 03 XYZ
3 Watersheds 02 1 - 99
4 Sub Watersheds 03 L 1 - 99
M 1 - 99
U 1 - 99
5 Micro
watersheds 02 1 - 99
01 xyz 99 L99 99
Digital Watershed atlas
Report Generation
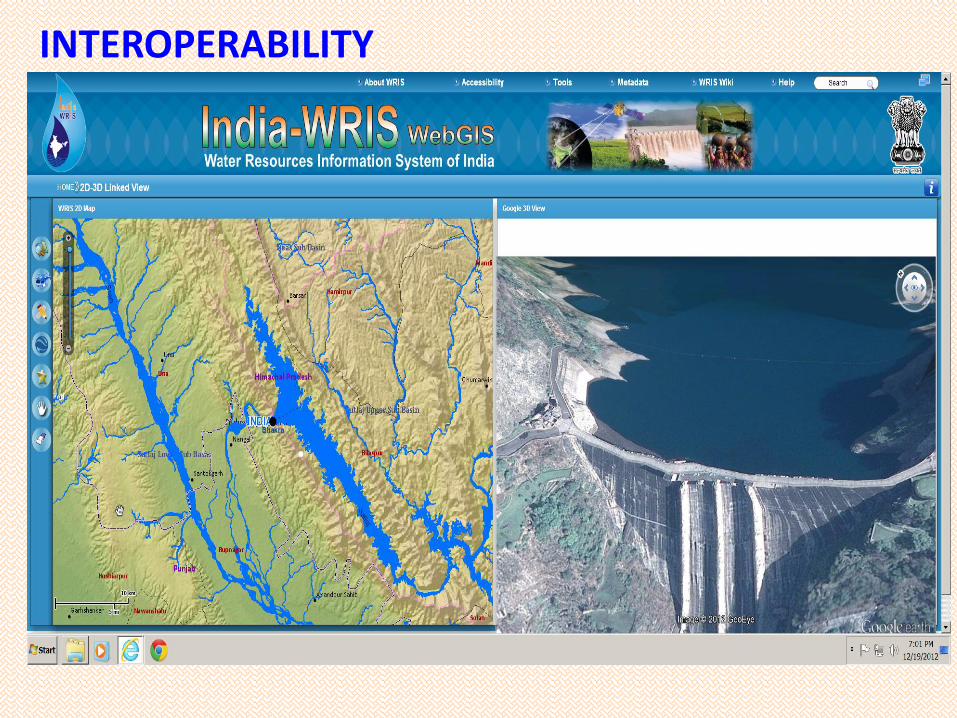
INTEROPERABILITY
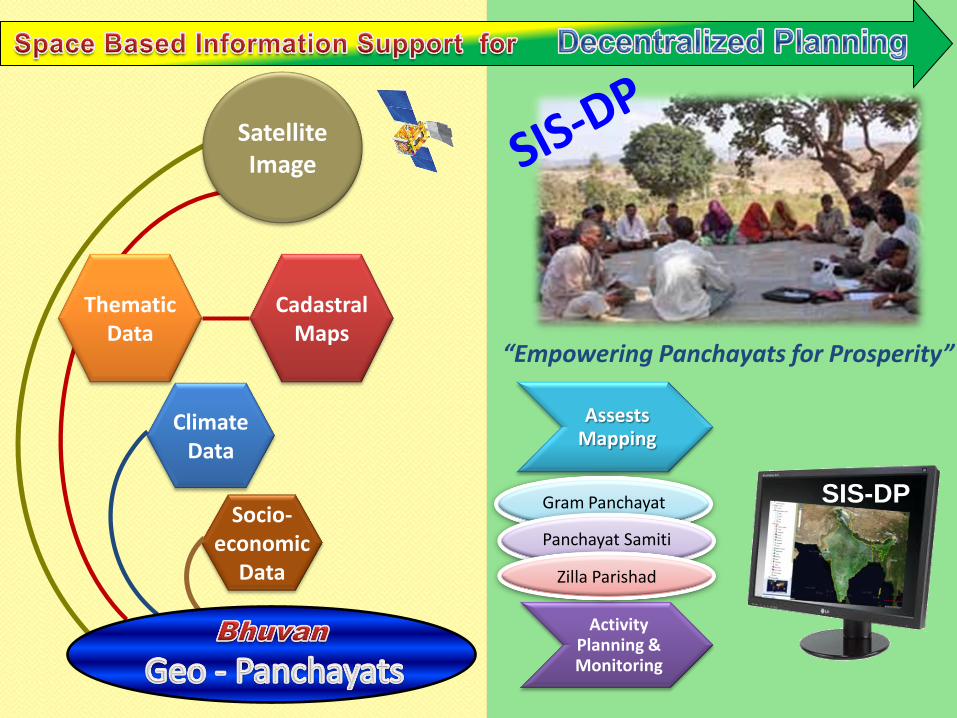
“Empowering Panchayats for Prosperity”
Cadastral Maps
Socio-economic
Data
Climate Data
Thematic Data
Satellite Image
Assests Mapping
Activity Planning & Monitoring
Gram Panchayat
Panchayat Samiti
Zilla Parishad
SIS-DP
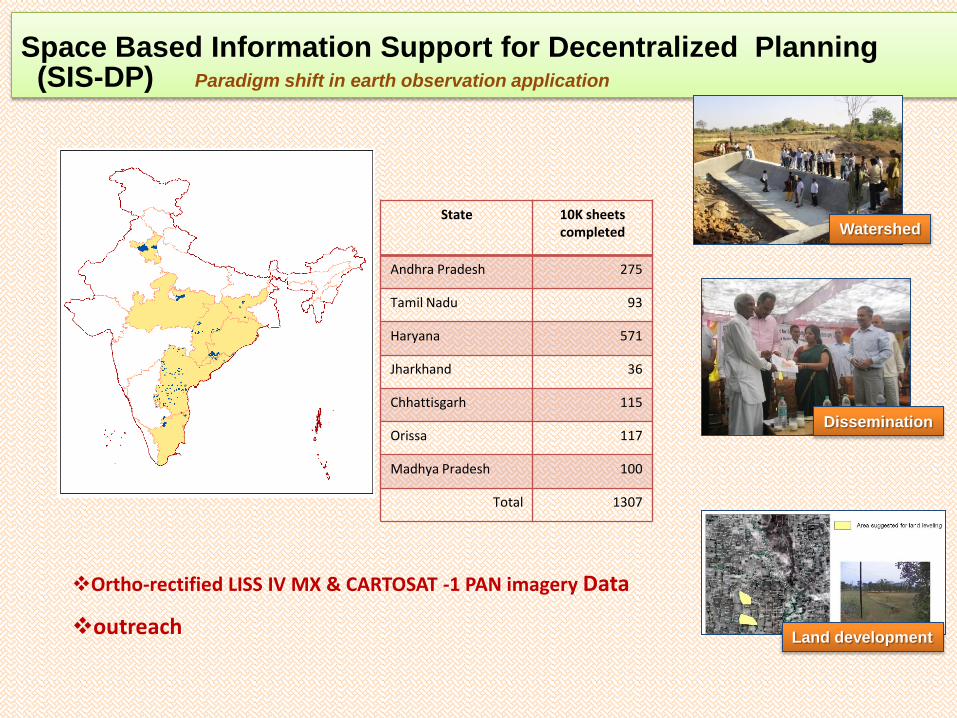
State 10K sheets completed
Andhra Pradesh 275
Tamil Nadu 93
Haryana 571
Jharkhand 36
Chhattisgarh 115
Orissa 117
Madhya Pradesh 100
Total 1307
Ortho-rectified LISS IV MX & CARTOSAT -1 PAN imagery Data
outreach
Space Based Information Support for Decentralized Planning (SIS-DP) Paradigm shift in earth observation application
Watershed
Dissemination
Land development
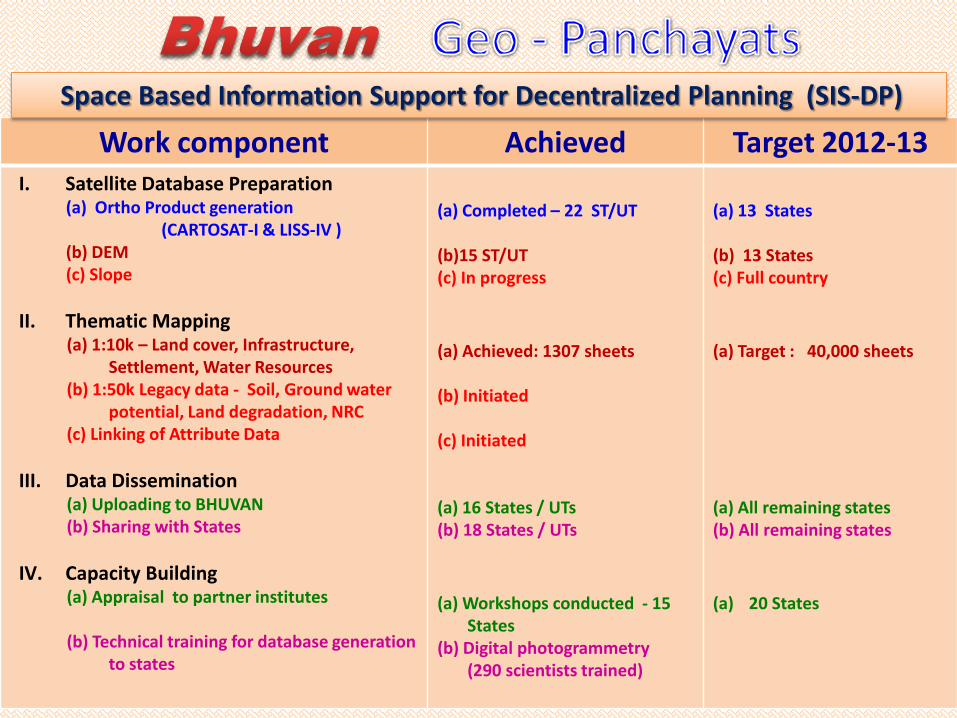
Work component Achieved Target 2012-13 I. Satellite Database Preparation
(a) Ortho Product generation (CARTOSAT-I & LISS-IV ) (b) DEM (c) Slope
II. Thematic Mapping (a) 1:10k – Land cover, Infrastructure,
Settlement, Water Resources (b) 1:50k Legacy data - Soil, Ground water
potential, Land degradation, NRC (c) Linking of Attribute Data
III. Data Dissemination (a) Uploading to BHUVAN (b) Sharing with States
IV. Capacity Building (a) Appraisal to partner institutes (b) Technical training for database generation
to states
(a) Completed – 22 ST/UT (b)15 ST/UT (c) In progress
(a) Achieved: 1307 sheets (b) Initiated (c) Initiated (a) 16 States / UTs (b) 18 States / UTs
(a) Workshops conducted - 15
States (b) Digital photogrammetry
(290 scientists trained)
(a) 13 States (b) 13 States (c) Full country
(a) Target : 40,000 sheets (a) All remaining states (b) All remaining states
(a) 20 States
Space Based Information Support for Decentralized Planning (SIS-DP)