NPR/PBS NewsHour/Marist Poll of 1322 National Adults This ...
23
How the Survey was Conducted Nature of the Sample: NPR/PBS NewsHour/Marist Poll of 1,322 National Adults This survey of 1,322 adults was conducted March 1 st through March 2 nd , 2022 by the Marist Poll sponsored in partnership with NPR and PBS NewsHour. Adults 18 years of age and older residing in the United States were contacted on landline or mobile numbers and interviewed by telephone using live interviewers. Survey questions were available in English or Spanish. Mobile telephone numbers were randomly selected based upon a list of telephone exchanges from throughout the nation. The exchanges were selected to ensure that each region was represented in proportion to its population. Mobile phones are treated as individual devices. After validation of age, personal ownership, and non-business-use of the mobile phone, interviews are typically conducted with the person answering the phone. To increase coverage, this mobile sample was supplemented by respondents reached through random dialing of landline phone numbers. Within each landline household, a single respondent is selected through a random selection process to increase the representativeness of traditionally under-covered survey populations. The samples were then combined and balanced to reflect the 2019 American Community Survey 1-year estimates for age, gender, income, race, and region. Results are statistically significant within ±3.8 percentage points. There are 1,237 registered voters. The results for this subset are statistically significant within ±4.0 percentage points. Tables include results for subgroups to only display crosstabs with an acceptable sampling error. It should be noted that although you may not see results listed for a certain group, it does not mean interviews were not completed with those individuals. It simply means the sample size is too small to report. The error margin was adjusted for sample weights and increases for cross-tabulations.
-
Upload
khangminh22 -
Category
Documents
-
view
0 -
download
0
Transcript of NPR/PBS NewsHour/Marist Poll of 1322 National Adults This ...

How the Survey was Conducted
Nature of the Sample: NPR/PBS NewsHour/Marist Poll of 1,322 National Adults This survey of 1,322 adults was conducted March 1st through March 2nd, 2022 by the Marist Poll sponsored in partnership with NPR and PBS NewsHour. Adults 18 years of age and older residing in the United States were contacted on landline or mobile numbers and interviewed by telephone using live interviewers. Survey questions were available in English or Spanish. Mobile telephone numbers were randomly selected based upon a list of telephone exchanges from throughout the nation. The exchanges were selected to ensure that each region was represented in proportion to its population. Mobile phones are treated as individual devices. After validation of age, personal ownership, and non-business-use of the mobile phone, interviews are typically conducted with the person answering the phone. To increase coverage, this mobile sample was supplemented by respondents reached through random dialing of landline phone numbers. Within each landline household, a single respondent is selected through a random selection process to increase the representativeness of traditionally under-covered survey populations. The samples were then combined and balanced to reflect the 2019 American Community Survey 1-year estimates for age, gender, income, race, and region. Results are statistically significant within ±3.8 percentage points. There are 1,237 registered voters. The results for this subset are statistically significant within ±4.0 percentage points. Tables include results for subgroups to only display crosstabs with an acceptable sampling error. It should be noted that although you may not see results listed for a certain group, it does not mean interviews were not completed with those individuals. It simply means the sample size is too small to report. The error margin was adjusted for sample weights and increases for cross-tabulations.
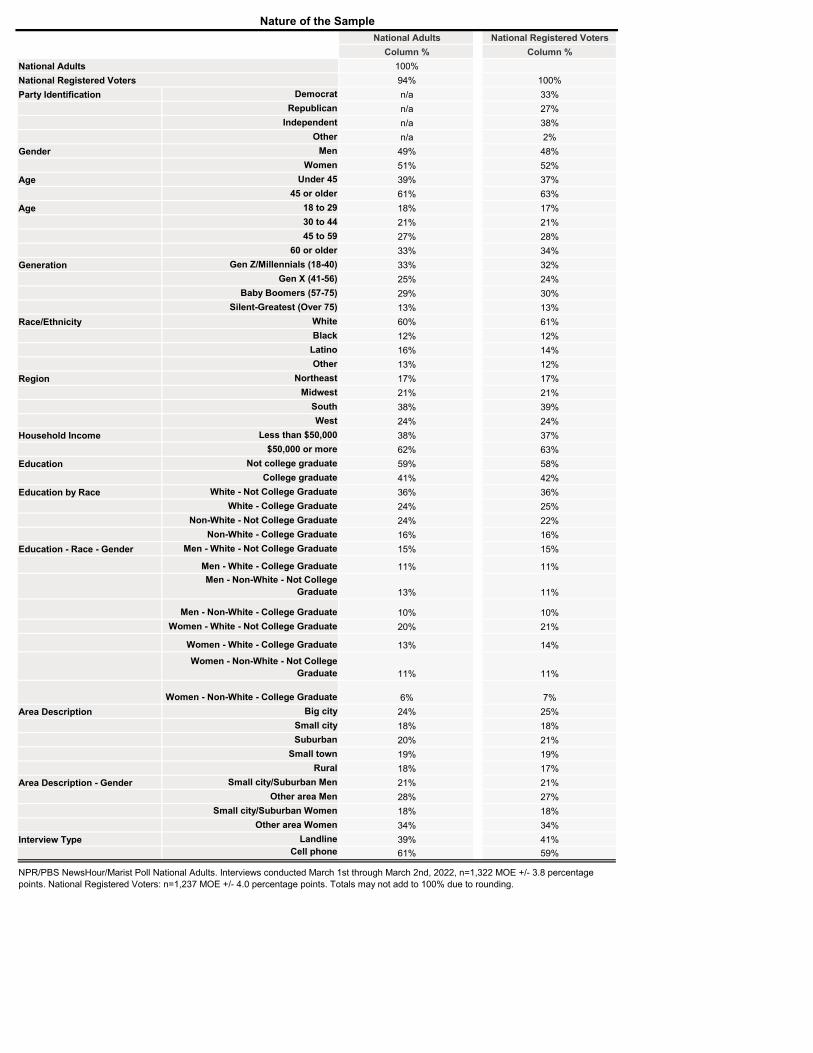
National Adults National Registered VotersColumn % Column %
100%94% 100%
Party Identification Democrat n/a 33%Republican n/a 27%
Independent n/a 38%Other n/a 2%
Gender Men 49% 48%Women 51% 52%
Age Under 45 39% 37%45 or older 61% 63%
Age 18 to 29 18% 17%30 to 44 21% 21%45 to 59 27% 28%
60 or older 33% 34%Generation Gen Z/Millennials (18-40) 33% 32%
Gen X (41-56) 25% 24%Baby Boomers (57-75) 29% 30%
Silent-Greatest (Over 75) 13% 13%Race/Ethnicity White 60% 61%
Black 12% 12%Latino 16% 14%Other 13% 12%
Region Northeast 17% 17%Midwest 21% 21%
South 38% 39%West 24% 24%
Household Income Less than $50,000 38% 37%$50,000 or more 62% 63%
Education Not college graduate 59% 58%College graduate 41% 42%
Education by Race White - Not College Graduate 36% 36%White - College Graduate 24% 25%
Non-White - Not College Graduate 24% 22%Non-White - College Graduate 16% 16%
Education - Race - Gender Men - White - Not College Graduate 15% 15%
Men - White - College Graduate 11% 11%Men - Non-White - Not College
Graduate 13% 11%
Men - Non-White - College Graduate 10% 10%Women - White - Not College Graduate 20% 21%
Women - White - College Graduate 13% 14%
Women - Non-White - Not College Graduate 11% 11%
Women - Non-White - College Graduate 6% 7%Area Description Big city 24% 25%
Small city 18% 18%Suburban 20% 21%
Small town 19% 19%Rural 18% 17%
Area Description - Gender Small city/Suburban Men 21% 21%Other area Men 28% 27%
Small city/Suburban Women 18% 18%Other area Women 34% 34%
Interview Type Landline 39% 41%Cell phone 61% 59%
Nature of the Sample
NPR/PBS NewsHour/Marist Poll National Adults. Interviews conducted March 1st through March 2nd, 2022, n=1,322 MOE +/- 3.8 percentage points. National Registered Voters: n=1,237 MOE +/- 4.0 percentage points. Totals may not add to 100% due to rounding.
National AdultsNational Registered Voters
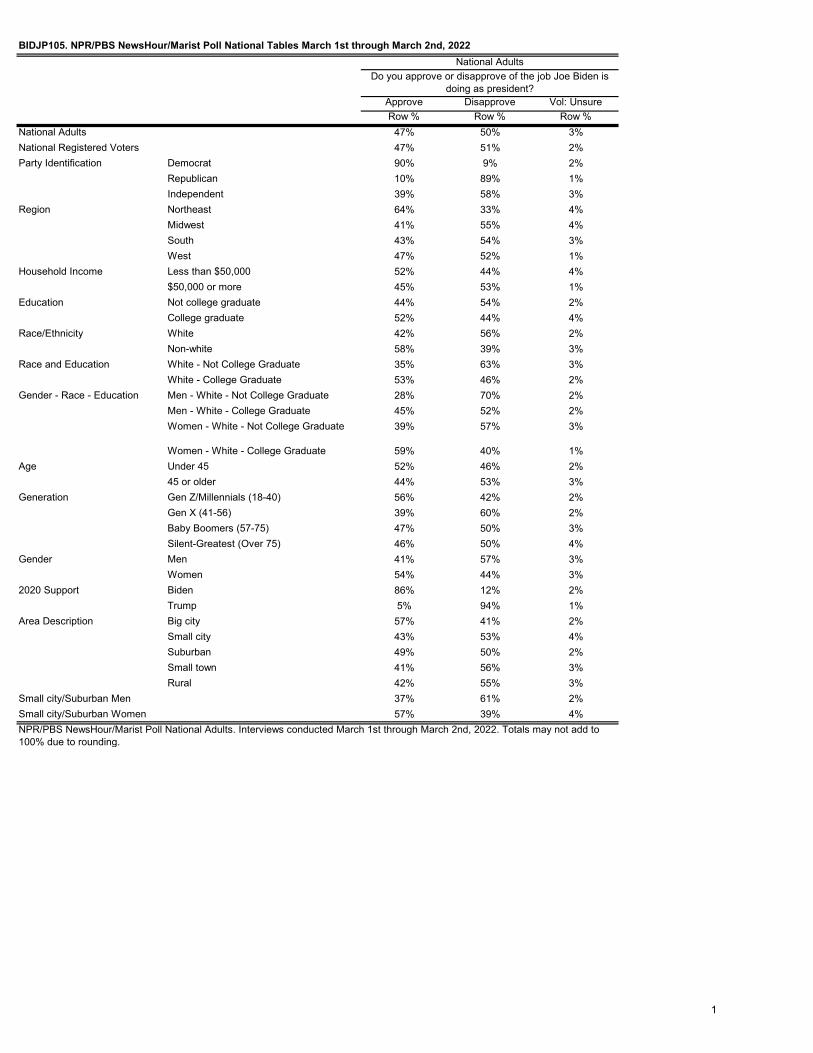
Approve Disapprove Vol: UnsureRow % Row % Row %
47% 50% 3%47% 51% 2%
Democrat 90% 9% 2%Republican 10% 89% 1%Independent 39% 58% 3%Northeast 64% 33% 4%Midwest 41% 55% 4%South 43% 54% 3%West 47% 52% 1%Less than $50,000 52% 44% 4%$50,000 or more 45% 53% 1%Not college graduate 44% 54% 2%College graduate 52% 44% 4%White 42% 56% 2%Non-white 58% 39% 3%White - Not College Graduate 35% 63% 3%White - College Graduate 53% 46% 2%Men - White - Not College Graduate 28% 70% 2%Men - White - College Graduate 45% 52% 2%Women - White - Not College Graduate 39% 57% 3%
Women - White - College Graduate 59% 40% 1%Under 45 52% 46% 2%45 or older 44% 53% 3%Gen Z/Millennials (18-40) 56% 42% 2%Gen X (41-56) 39% 60% 2%Baby Boomers (57-75) 47% 50% 3%Silent-Greatest (Over 75) 46% 50% 4%Men 41% 57% 3%Women 54% 44% 3%Biden 86% 12% 2%Trump 5% 94% 1%Big city 57% 41% 2%Small city 43% 53% 4%Suburban 49% 50% 2%Small town 41% 56% 3%Rural 42% 55% 3%
37% 61% 2%57% 39% 4%
NPR/PBS NewsHour/Marist Poll National Adults. Interviews conducted March 1st through March 2nd, 2022. Totals may not add to 100% due to rounding.
Gender
2020 Support
Area Description
Small city/Suburban MenSmall city/Suburban Women
Race/Ethnicity
Race and Education
Gender - Race - Education
Age
Generation
National Registered VotersParty Identification
Region
Household Income
Education
BIDJP105. NPR/PBS NewsHour/Marist Poll National Tables March 1st through March 2nd, 2022National Adults
Do you approve or disapprove of the job Joe Biden is doing as president?
National Adults
1

Approve Disapprove Vol: UnsureRow % Row % Row %
March 2022 47% 50% 3%February 2022 39% 55% 6%December 20th, 2021 41% 55% 3%December 9th, 2021 42% 51% 7%November 24th, 2021 42% 50% 8%November 1st, 2021 44% 49% 8%September 30th, 2021 45% 46% 9%September 3rd, 2021 43% 51% 7%August 2021 49% 44% 6%July 2021 50% 43% 7%June 2021 52% 46% 2%May 27th, 2021 52% 41% 7%May 17th, 2021 53% 41% 6%April 27th, 2021 54% 44% 3%April 16th, 2021 53% 39% 8%March 30th, 2021 52% 40% 8%March 11th, 2021 49% 42% 10%February 2021 51% 38% 11%January 2021 49% 35% 16%
BIDJP105TRND. Marist Poll National TrendNational Adults
Do you approve or disapprove of the job Joe Biden is doing as president?
Marist Poll National Adults
2
Strongly approve Approve DisapproveStrongly
disapprove Vol: UnsureRow % Row % Row % Row % Row %
18% 30% 12% 38% 3%18% 29% 12% 39% 2%
Democrat 39% 51% 5% 3% 2%Republican 4% 6% 9% 80% 1%Independent 11% 27% 21% 38% 3%Northeast 19% 45% 11% 22% 4%Midwest 14% 27% 18% 37% 4%South 18% 25% 12% 43% 3%West 19% 28% 10% 41% 1%Less than $50,000 18% 34% 11% 33% 4%$50,000 or more 16% 29% 14% 39% 1%Not college graduate 14% 30% 13% 40% 2%College graduate 23% 29% 11% 34% 4%White 16% 26% 13% 42% 2%Non-white 19% 39% 12% 27% 3%White - Not College Graduate 11% 24% 14% 49% 3%White - College Graduate 23% 30% 13% 33% 2%Men - White - Not College Graduate 8% 20% 18% 52% 2%Men - White - College Graduate 18% 27% 12% 40% 2%Women - White - Not College Graduate 13% 26% 11% 47% 3%
Women - White - College Graduate 27% 31% 13% 27% 1%Under 45 9% 43% 17% 29% 2%45 or older 23% 21% 10% 43% 3%Gen Z/Millennials (18-40) 9% 47% 17% 25% 2%Gen X (41-56) 14% 25% 15% 44% 2%Baby Boomers (57-75) 28% 19% 8% 43% 3%Silent-Greatest (Over 75) 26% 19% 8% 42% 4%Men 14% 27% 16% 41% 3%Women 21% 32% 10% 34% 3%Biden 35% 51% 9% 3% 2%Trump 0% 4% 11% 83% 1%Big city 21% 35% 14% 27% 2%Small city 16% 28% 19% 34% 4%Suburban 17% 31% 10% 39% 2%Small town 13% 28% 12% 44% 3%Rural 18% 24% 8% 47% 3%
10% 27% 18% 43% 2%24% 33% 10% 29% 4%Small city/Suburban Women
NPR/PBS NewsHour/Marist Poll National Adults. Interviews conducted March 1st through March 2nd, 2022. Totals may not add to 100% due to rounding.
Generation
Gender
2020 Support
Area Description
Small city/Suburban Men
Education
Race/Ethnicity
Race and Education
Gender - Race - Education
Age
National AdultsNational Registered VotersParty Identification
Region
Household Income
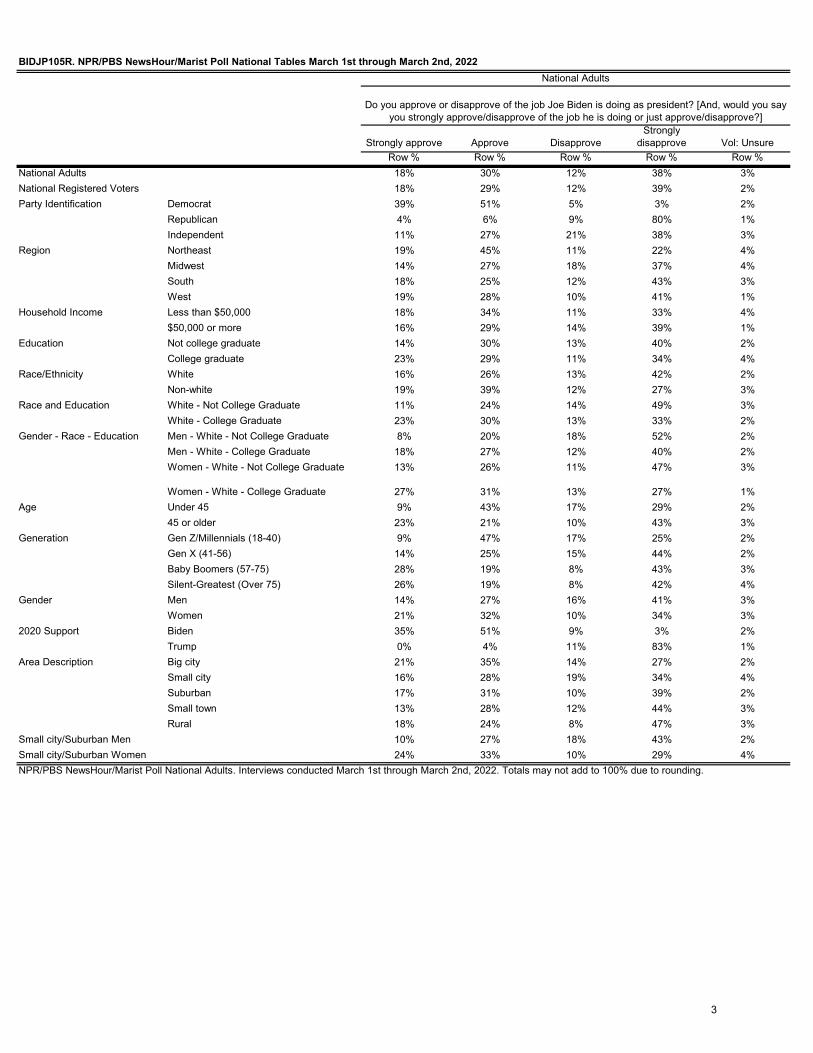
BIDJP105R. NPR/PBS NewsHour/Marist Poll National Tables March 1st through March 2nd, 2022National Adults
Do you approve or disapprove of the job Joe Biden is doing as president? [And, would you say you strongly approve/disapprove of the job he is doing or just approve/disapprove?]
3

Strongly approve Approve Disapprove Strongly disapprove Vol: UnsureRow % Row % Row % Row % Row %
March 2022 18% 30% 12% 38% 3%February 2022 14% 25% 14% 41% 6%December 20th, 2021 17% 24% 11% 44% 3%December 9th, 2021 16% 26% 13% 38% 7%November 24th, 2021 13% 29% 13% 37% 8%November 1st, 2021 15% 28% 12% 37% 8%September 30th, 2021 17% 28% 9% 37% 9%September 3rd, 2021 19% 23% 10% 41% 7%August 2021 19% 30% 15% 30% 6%July 2021 21% 29% 11% 32% 7%June 2021 24% 28% 13% 34% 2%May 27th 2021 21% 30% 13% 28% 7%May 17th, 2021 26% 26% 11% 30% 6%April 27th, 2021 25% 29% 12% 32% 3%April 16th, 2021 25% 28% 10% 29% 8%March 30th, 2021 22% 30% 11% 29% 8%March 11th, 2021 24% 24% 12% 30% 10%February 2021 23% 29% 13% 25% 11%January 2021 25% 25% 11% 24% 16%
National Adults
Do you approve or disapprove of the job Joe Biden is doing as president? [And, would you say you strongly approve/disapprove of the job he is doing or just approve/disapprove?]
Marist Poll National Adults
BIDJP105RTRND. Marist Poll National Trend
4

Approve Disapprove Vol: UnsureRow % Row % Row %
45% 53% 2%45% 53% 2%
Democrat 85% 13% 2%Republican 10% 89% 0%Independent 38% 58% 3%Northeast 61% 36% 3%Midwest 40% 58% 2%South 41% 57% 2%West 43% 53% 4%Less than $50,000 46% 50% 4%$50,000 or more 45% 54% 1%Not college graduate 41% 57% 3%College graduate 51% 46% 2%White 39% 58% 3%Non-white 55% 43% 2%White - Not College Graduate 31% 65% 4%White - College Graduate 51% 47% 2%Men - White - Not College Graduate 27% 69% 4%Men - White - College Graduate 46% 53% 1%Women - White - Not College Graduate 35% 61% 4%
Women - White - College Graduate 56% 42% 2%Under 45 50% 48% 2%45 or older 42% 55% 2%Gen Z/Millennials (18-40) 53% 44% 2%Gen X (41-56) 37% 62% 1%Baby Boomers (57-75) 45% 53% 2%Silent-Greatest (Over 75) 44% 51% 5%Men 39% 59% 2%Women 51% 47% 3%Biden 82% 15% 3%Trump 3% 96% 1%Big city 56% 41% 3%Small city 40% 56% 3%Suburban 49% 50% 1%Small town 39% 59% 2%Rural 36% 62% 3%
36% 62% 2%55% 43% 2%Small city/Suburban Women
NPR/PBS NewsHour/Marist Poll National Adults. Interviews conducted March 1st through March 2nd, 2022. Totals may not add to 100% due to rounding.
Generation
Gender
2020 Support
Area Description
Small city/Suburban Men
Education
Race/Ethnicity
Race and Education
Gender - Race - Education
Age
National AdultsNational Registered VotersParty Identification
Region
Household Income
BIDJPCV19. NPR/PBS NewsHour/Marist Poll National Tables March 1st through March 2nd, 2022National Adults
Do you approve or disapprove of how President Biden is handling the economy?
5

Approve Disapprove UnsureRow % Row % Row %
Joe Biden:March 2022 45% 53% 2%
February 2022 36% 58% 6%November 2021 42% 52% 6%September 2021 48% 48% 5%
July 2021 50% 45% 6%May 2021 51% 42% 7%
April 2021 54% 38% 9%March 30th, 2021 51% 41% 8%March 11th, 2021 46% 41% 13%
Donald Trump:December 2020 50% 45% 5%
October 2020 47% 46% 6%September 2020 49% 45% 6%
April 2020 50% 48% 2%March 2020 51% 45% 4%
February 2020 51% 40% 9%September 2019 47% 48% 5%
July 2019 53% 43% 4%Marist Poll National Adults
BIDJP115TRND. Marist Poll National TrendNational Adults
Do you approve or disapprove of how President Biden (Donald Trump) is handling the economy?
6

Approve Disapprove Vol: UnsureRow % Row % Row %
55% 43% 2%55% 44% 1%
Democrat 90% 10% 1%Republican 21% 76% 2%Independent 49% 50% 1%Northeast 68% 29% 3%Midwest 51% 48% 1%South 51% 47% 2%West 56% 43% 1%Less than $50,000 57% 41% 2%$50,000 or more 55% 44% 1%Not college graduate 52% 47% 2%College graduate 61% 38% 1%White 50% 48% 2%Non-white 65% 34% 1%White - Not College Graduate 44% 54% 2%White - College Graduate 61% 38% 1%Men - White - Not College Graduate 40% 59% 2%Men - White - College Graduate 55% 44% 2%Women - White - Not College Graduate 46% 51% 3%
Women - White - College Graduate 66% 33% 1%Under 45 61% 38% 1%45 or older 52% 46% 2%Gen Z/Millennials (18-40) 64% 35% 1%Gen X (41-56) 49% 51% 0%Baby Boomers (57-75) 54% 45% 2%Silent-Greatest (Over 75) 53% 43% 4%Men 53% 46% 2%Women 58% 41% 1%Biden 89% 10% 1%Trump 15% 84% 2%Big city 64% 34% 2%Small city 54% 45% 2%Suburban 57% 42% 1%Small town 48% 50% 2%Rural 49% 49% 2%
49% 50% 1%64% 35% 1%Small city/Suburban Women
NPR/PBS NewsHour/Marist Poll National Adults. Interviews conducted March 1st through March 2nd, 2022. Totals may not add to 100% due to rounding.
Generation
Gender
2020 Support
Area Description
Small city/Suburban Men
Education
Race/Ethnicity
Race and Education
Gender - Race - Education
Age
National AdultsNational Registered VotersParty Identification
Region
Household Income
BIDJPCV19. NPR/PBS NewsHour/Marist Poll National Tables March 1st through March 2nd, 2022National Adults
Do you approve or disapprove of how President Biden is handling the coronavirus pandemic?
7

Approve Disapprove Vol: UnsureRow % Row % Row %
Joe Biden:March 2022 55% 43% 2%
February 2022 47% 49% 3%December 2021 50% 44% 6%September 2021 55% 41% 4%
July 2021 64% 31% 5%May 2021 66% 29% 5%
March 30th, 2021 65% 28% 7%March 11th, 2021 62% 30% 8%
Donald Trump:January 2021 39% 57% 4%
December 2020 37% 59% 4%October 2020 38% 59% 3%
September 2020 40% 56% 4%April 2020 44% 55% 1%
March 2020 44% 49% 7%Marist Poll National Adults
National Adults
Do you approve or disapprove of how President Biden (Donald Trump) is handling the coronavirus pandemic?
BIDJPCV19TRND. Marist Poll National Trend
8
Approve Disapprove Vol: UnsureRow % Row % Row %
52% 44% 4%52% 45% 3%
Democrat 89% 7% 4%Republican 17% 82% 1%Independent 48% 50% 2%Northeast 64% 29% 7%Midwest 48% 49% 3%South 49% 49% 3%West 50% 44% 6%Less than $50,000 53% 41% 6%$50,000 or more 52% 45% 2%Not college graduate 47% 49% 4%College graduate 59% 37% 4%White 47% 49% 4%Non-white 62% 34% 4%White - Not College Graduate 38% 58% 4%White - College Graduate 60% 36% 4%Men - White - Not College Graduate 31% 65% 4%Men - White - College Graduate 54% 42% 4%Women - White - Not College Graduate 43% 53% 4%
Women - White - College Graduate 65% 32% 4%Under 45 58% 38% 5%45 or older 48% 48% 4%Gen Z/Millennials (18-40) 60% 35% 5%Gen X (41-56) 47% 50% 2%Baby Boomers (57-75) 47% 49% 4%Silent-Greatest (Over 75) 50% 43% 7%Men 48% 49% 3%Women 55% 40% 5%Biden 88% 8% 4%Trump 12% 86% 1%Big city 63% 34% 3%Small city 54% 42% 4%Suburban 53% 45% 2%Small town 44% 52% 3%Rural 40% 52% 8%
48% 50% 2%60% 36% 4%Small city/Suburban Women
NPR/PBS NewsHour/Marist Poll National Adults. Interviews conducted March 1st through March 2nd, 2022. Totals may not add to 100% due to rounding.
Generation
Gender
2020 Support
Area Description
Small city/Suburban Men
Education
Race/Ethnicity
Race and Education
Gender - Race - Education
Age
National AdultsNational Registered VotersParty Identification
Region
Household Income
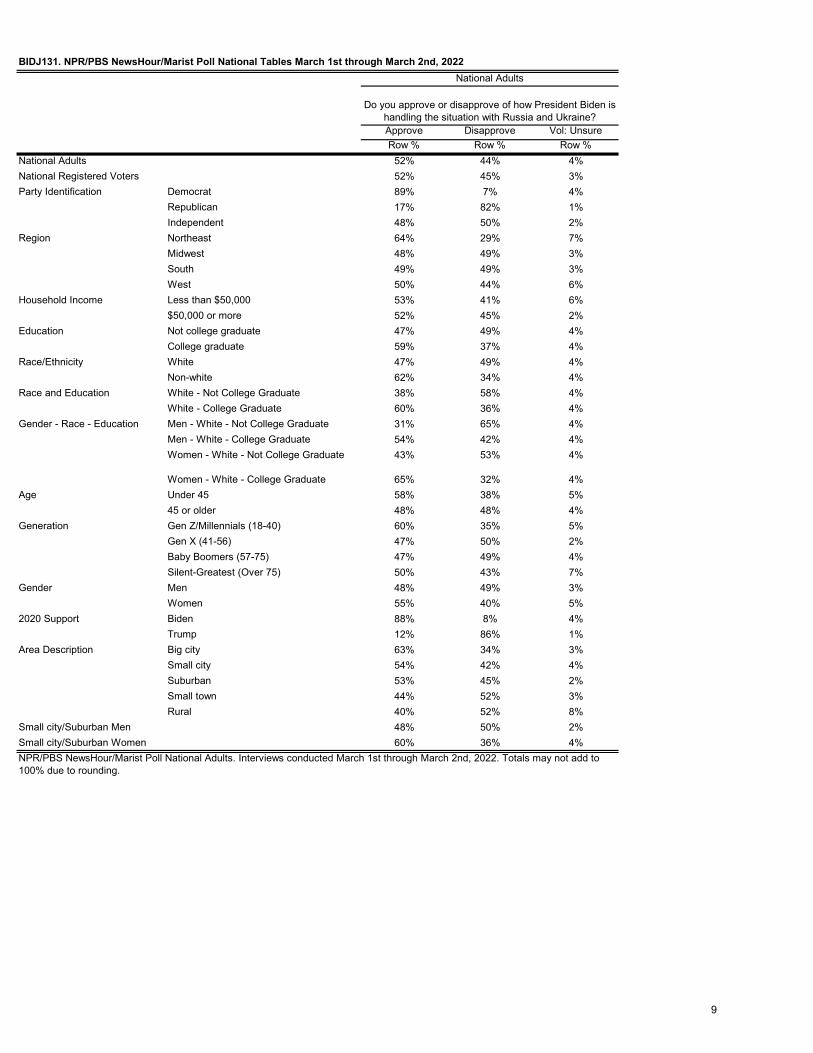
BIDJ131. NPR/PBS NewsHour/Marist Poll National Tables March 1st through March 2nd, 2022National Adults
Do you approve or disapprove of how President Biden is handling the situation with Russia and Ukraine?
9

Approve Disapprove Vol: UnsureRow % Row % Row %
March 2022 52% 44% 4%
February 2022 34% 50% 16%Marist Poll National Adults
BIDJ131TRND. Marist Poll National Trend
National Adults
Do you approve or disapprove of how President Biden is handling the situation with Russia and Ukraine?
10

Too cautious Too aggressive About right Vol: UnsureRow % Row % Row % Row %
43% 6% 46% 5%43% 6% 46% 5%
Democrat 16% 3% 79% 3%Republican 73% 7% 15% 5%Independent 47% 9% 39% 5%Northeast 38% 3% 53% 6%Midwest 44% 9% 44% 3%South 44% 6% 45% 5%West 42% 7% 44% 7%Less than $50,000 36% 7% 51% 6%$50,000 or more 47% 6% 44% 4%Not college graduate 45% 8% 42% 5%College graduate 39% 4% 52% 5%White 46% 5% 44% 5%Non-white 36% 8% 52% 4%White - Not College Graduate 50% 7% 37% 6%White - College Graduate 40% 2% 55% 4%Men - White - Not College Graduate 55% 8% 29% 7%Men - White - College Graduate 42% 2% 52% 4%Women - White - Not College Graduate 46% 7% 42% 5%
Women - White - College Graduate 38% 2% 57% 4%Under 45 41% 9% 45% 5%45 or older 44% 5% 46% 5%Gen Z/Millennials (18-40) 37% 10% 48% 5%Gen X (41-56) 52% 7% 39% 2%Baby Boomers (57-75) 43% 4% 48% 5%Silent-Greatest (Over 75) 41% 2% 49% 7%Men 48% 8% 40% 4%Women 38% 5% 52% 6%Biden 19% 3% 76% 2%Trump 72% 10% 13% 5%Big city 36% 5% 54% 6%Small city 43% 6% 45% 6%Suburban 48% 8% 42% 3%Small town 46% 8% 40% 5%Rural 45% 6% 45% 4%
53% 9% 35% 2%36% 4% 53% 6%Small city/Suburban Women
NPR/PBS NewsHour/Marist Poll National Adults. Interviews conducted March 1st through March 2nd, 2022. Totals may not add to 100% due to rounding.
Generation
Gender
2020 Support
Area Description
Small city/Suburban Men
Education
Race/Ethnicity
Race and Education
Gender - Race - Education
Age
National AdultsNational Registered VotersParty Identification
Region
Household Income
USRSPRUK1. NPR/PBS NewsHour/Marist Poll National Tables March 1st through March 2nd, 2022National Adults
Do you think President Biden´s handling of the conflict in Ukraine has been:
11
Very concerned/Concerned
Not very concerned/Not
concerned at all Vol: UnsureRow % Row % Row %
78% 21% 1%78% 21% 1%
Democrat 80% 20% 0%Republican 78% 21% 2%Independent 79% 21% 0%Northeast 82% 18% 0%Midwest 74% 26% 1%South 78% 20% 2%West 76% 23% 1%Less than $50,000 75% 23% 2%$50,000 or more 80% 20% 0%Not college graduate 76% 23% 2%College graduate 81% 19% 0%White 81% 17% 1%Non-white 71% 28% 1%White - Not College Graduate 80% 18% 2%White - College Graduate 83% 16% 0%Men - White - Not College Graduate 74% 21% 5%Men - White - College Graduate 80% 20% 0%Women - White - Not College Graduate 84% 16% 1%
Women - White - College Graduate 86% 14% 0%Under 45 70% 29% 1%45 or older 83% 16% 1%Gen Z/Millennials (18-40) 68% 31% 1%Gen X (41-56) 82% 18% 0%Baby Boomers (57-75) 85% 14% 1%Silent-Greatest (Over 75) 78% 21% 1%Men 72% 26% 2%Women 83% 17% 0%Biden 80% 20% 0%Trump 77% 22% 1%Big city 80% 20% 0%Small city 71% 27% 2%Suburban 76% 24% 0%Small town 74% 24% 2%Rural 87% 13% 0%
67% 32% 1%82% 17% 1%Small city/Suburban Women
NPR/PBS NewsHour/Marist Poll National Adults. Interviews conducted March 1st through March 2nd, 2022. Totals may not add to 100% due to rounding.
Generation
Gender
2020 Support
Area Description
Small city/Suburban Men
Education
Race/Ethnicity
Race and Education
Gender - Race - Education
Age
National AdultsNational Registered VotersParty Identification
Region
Household Income
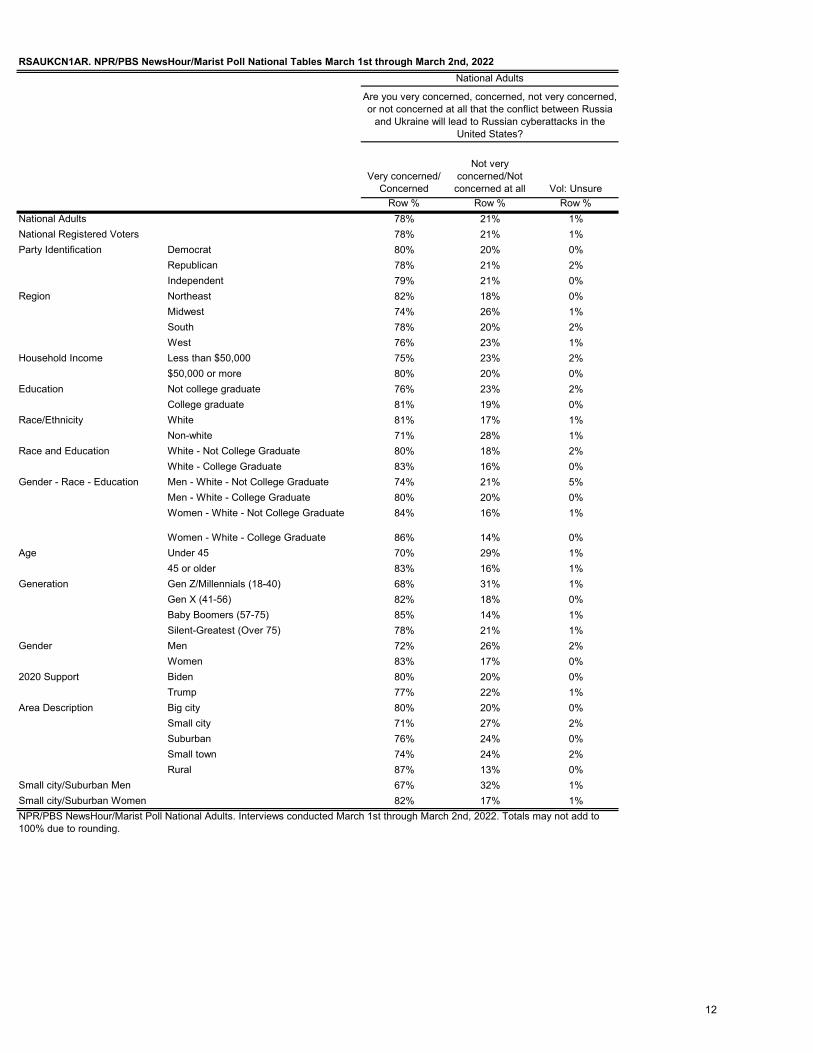
RSAUKCN1AR. NPR/PBS NewsHour/Marist Poll National Tables March 1st through March 2nd, 2022National Adults
Are you very concerned, concerned, not very concerned, or not concerned at all that the conflict between Russia
and Ukraine will lead to Russian cyberattacks in the United States?
12

Very concerned ConcernedNot very
concernedNot concerned at
all Vol: UnsureRow % Row % Row % Row % Row %
41% 37% 15% 6% 1%41% 38% 15% 6% 1%
Democrat 38% 42% 14% 5% 0%Republican 45% 32% 16% 5% 2%Independent 41% 38% 15% 6% 0%Northeast 42% 41% 16% 2% 0%Midwest 35% 39% 18% 7% 1%South 46% 33% 13% 6% 2%West 38% 38% 16% 7% 1%Less than $50,000 39% 36% 15% 8% 2%$50,000 or more 42% 38% 15% 5% 0%Not college graduate 41% 34% 16% 7% 2%College graduate 40% 41% 14% 5% 0%White 42% 39% 12% 5% 1%Non-white 38% 33% 21% 8% 1%White - Not College Graduate 45% 35% 12% 6% 2%White - College Graduate 39% 45% 12% 5% 0%Men - White - Not College Graduate 35% 40% 13% 8% 5%Men - White - College Graduate 34% 46% 15% 5% 0%Women - White - Not College Graduate 52% 31% 12% 4% 1%
Women - White - College Graduate 42% 44% 9% 5% 0%Under 45 36% 34% 22% 7% 1%45 or older 44% 38% 11% 5% 1%Gen Z/Millennials (18-40) 33% 35% 23% 7% 1%Gen X (41-56) 50% 32% 13% 5% 0%Baby Boomers (57-75) 46% 39% 9% 5% 1%Silent-Greatest (Over 75) 35% 43% 14% 6% 1%Men 33% 39% 20% 6% 2%Women 48% 35% 11% 5% 0%Biden 40% 40% 14% 5% 0%Trump 44% 33% 16% 6% 1%Big city 36% 43% 11% 9% 0%Small city 38% 34% 21% 6% 2%Suburban 40% 36% 20% 3% 0%Small town 40% 34% 17% 6% 2%Rural 52% 34% 9% 4% 0%
34% 33% 25% 7% 1%45% 37% 15% 3% 1%Small city/Suburban Women
NPR/PBS NewsHour/Marist Poll National Adults. Interviews conducted March 1st through March 2nd, 2022. Totals may not add to 100% due to rounding.
Generation
Gender
2020 Support
Area Description
Small city/Suburban Men
Education
Race/Ethnicity
Race and Education
Gender - Race - Education
Age
National AdultsNational Registered VotersParty Identification
Region
Household Income
RSAUKCN1A. NPR/PBS NewsHour/Marist Poll National Tables March 1st through March 2nd, 2022National Adults
Are you very concerned, concerned, not very concerned, or not concerned at all that the conflict between Russia and Ukraine will lead to Russian cyberattacks in the United States?
13

Very concerned/Concerned
Not very concerned/Not
concerned at all Vol: UnsureRow % Row % Row %
78% 21% 1%78% 21% 1%
Democrat 81% 19% 0%Republican 76% 21% 3%Independent 79% 21% 0%Northeast 85% 15% 0%Midwest 76% 23% 0%South 78% 21% 1%West 75% 22% 3%Less than $50,000 81% 17% 2%$50,000 or more 78% 22% 0%Not college graduate 79% 19% 2%College graduate 77% 23% 0%White 79% 19% 2%Non-white 77% 23% 0%White - Not College Graduate 79% 18% 3%White - College Graduate 80% 20% 0%Men - White - Not College Graduate 71% 25% 4%Men - White - College Graduate 79% 21% 0%Women - White - Not College Graduate 84% 13% 3%
Women - White - College Graduate 80% 20% 0%Under 45 74% 24% 2%45 or older 81% 18% 1%Gen Z/Millennials (18-40) 73% 24% 2%Gen X (41-56) 78% 22% 0%Baby Boomers (57-75) 83% 16% 1%Silent-Greatest (Over 75) 78% 20% 2%Men 74% 25% 1%Women 82% 17% 1%Biden 80% 20% 0%Trump 78% 20% 2%Big city 77% 21% 2%Small city 80% 19% 0%Suburban 80% 20% 0%Small town 76% 22% 2%Rural 78% 21% 1%
75% 25% 0%87% 13% 0%Small city/Suburban Women
NPR/PBS NewsHour/Marist Poll National Adults. Interviews conducted March 1st through March 2nd, 2022. Totals may not add to 100% due to rounding.
Generation
Gender
2020 Support
Area Description
Small city/Suburban Men
Education
Race/Ethnicity
Race and Education
Gender - Race - Education
Age
National AdultsNational Registered VotersParty Identification
Region
Household Income
RSAUKCN1BR. NPR/PBS NewsHour/Marist Poll National Tables March 1st through March 2nd, 2022National Adults
Are you very concerned, concerned, not very concerned, or not concerned at all that the conflict between Russia
and Ukraine will lead to a broader war in Europe?
14

Very concerned ConcernedNot very
concernedNot concerned at
all Vol: UnsureRow % Row % Row % Row % Row %
38% 40% 15% 6% 1%38% 40% 14% 6% 1%
Democrat 34% 47% 15% 4% 0%Republican 40% 37% 16% 4% 3%Independent 42% 37% 12% 9% 0%Northeast 45% 39% 11% 4% 0%Midwest 39% 38% 15% 8% 0%South 33% 45% 14% 6% 1%West 40% 35% 17% 6% 3%Less than $50,000 41% 40% 10% 7% 2%$50,000 or more 38% 40% 16% 5% 0%Not college graduate 39% 40% 13% 6% 2%College graduate 37% 41% 16% 7% 0%White 40% 39% 14% 5% 2%Non-white 34% 43% 15% 8% 0%White - Not College Graduate 42% 37% 13% 5% 3%White - College Graduate 39% 41% 16% 4% 0%Men - White - Not College Graduate 34% 38% 16% 9% 4%Men - White - College Graduate 36% 43% 16% 5% 0%Women - White - Not College Graduate 47% 37% 10% 3% 3%
Women - White - College Graduate 41% 39% 17% 3% 0%Under 45 36% 38% 18% 6% 2%45 or older 40% 41% 12% 6% 1%Gen Z/Millennials (18-40) 34% 39% 17% 7% 2%Gen X (41-56) 38% 40% 17% 5% 0%Baby Boomers (57-75) 43% 40% 11% 5% 1%Silent-Greatest (Over 75) 38% 40% 11% 9% 2%Men 34% 39% 16% 9% 1%Women 42% 41% 13% 3% 1%Biden 37% 43% 14% 6% 0%Trump 44% 34% 14% 6% 2%Big city 37% 40% 15% 6% 2%Small city 39% 41% 10% 9% 0%Suburban 38% 42% 16% 4% 0%Small town 31% 45% 17% 5% 2%Rural 45% 33% 14% 7% 1%
36% 39% 16% 9% 0%43% 44% 10% 3% 0%Small city/Suburban Women
NPR/PBS NewsHour/Marist Poll National Adults. Interviews conducted March 1st through March 2nd, 2022. Totals may not add to 100% due to rounding.
Generation
Gender
2020 Support
Area Description
Small city/Suburban Men
Education
Race/Ethnicity
Race and Education
Gender - Race - Education
Age
National AdultsNational Registered VotersParty Identification
Region
Household Income
RSAUKCN1B. NPR/PBS NewsHour/Marist Poll National Tables March 1st through March 2nd, 2022National Adults
Are you very concerned, concerned, not very concerned, or not concerned at all that the conflict between Russia and Ukraine will lead to a broader war in Europe?
15

Very concerned/Concerned
Not very concerned/Not
concerned at all Vol: UnsureRow % Row % Row %
70% 29% 1%71% 28% 1%
Democrat 72% 27% 1%Republican 70% 30% 0%Independent 73% 27% 0%Northeast 80% 20% 0%Midwest 70% 30% 0%South 68% 32% 0%West 68% 30% 2%Less than $50,000 76% 24% 1%$50,000 or more 68% 31% 0%Not college graduate 70% 29% 1%College graduate 70% 30% 0%White 72% 27% 1%Non-white 67% 32% 0%White - Not College Graduate 75% 24% 1%White - College Graduate 70% 30% 0%Men - White - Not College Graduate 63% 35% 1%Men - White - College Graduate 63% 37% 0%Women - White - Not College Graduate 83% 16% 1%
Women - White - College Graduate 75% 25% 0%Under 45 62% 38% 0%45 or older 76% 23% 1%Gen Z/Millennials (18-40) 61% 38% 1%Gen X (41-56) 70% 30% 0%Baby Boomers (57-75) 78% 21% 0%Silent-Greatest (Over 75) 78% 20% 2%Men 62% 38% 1%Women 79% 21% 1%Biden 74% 26% 0%Trump 69% 31% 0%Big city 64% 35% 0%Small city 71% 28% 1%Suburban 71% 29% 0%Small town 74% 26% 0%Rural 73% 26% 0%
62% 38% 0%82% 17% 0%Small city/Suburban Women
NPR/PBS NewsHour/Marist Poll National Adults. Interviews conducted March 1st through March 2nd, 2022. Totals may not add to 100% due to rounding.
Generation
Gender
2020 Support
Area Description
Small city/Suburban Men
Education
Race/Ethnicity
Race and Education
Gender - Race - Education
Age
National AdultsNational Registered VotersParty Identification
Region
Household Income
RSAUKCN1DR. NPR/PBS NewsHour/Marist Poll National Tables March 1st through March 2nd, 2022National Adults
Are you very concerned, concerned, not very concerned, or not concerned at all that the conflict between Russia and Ukraine will lead to the use of nuclear weapons?
16
Very concerned ConcernedNot very
concernedNot concerned at
all Vol: UnsureRow % Row % Row % Row % Row %
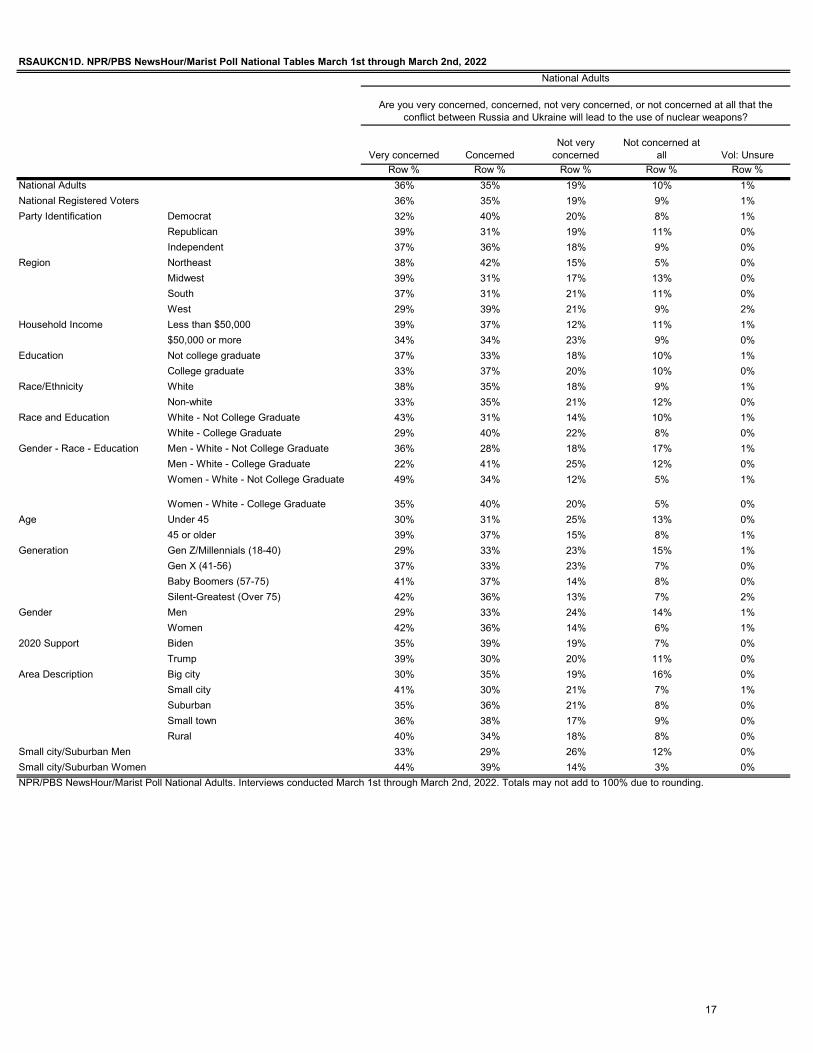
36% 35% 19% 10% 1%36% 35% 19% 9% 1%
Democrat 32% 40% 20% 8% 1%Republican 39% 31% 19% 11% 0%Independent 37% 36% 18% 9% 0%Northeast 38% 42% 15% 5% 0%Midwest 39% 31% 17% 13% 0%South 37% 31% 21% 11% 0%West 29% 39% 21% 9% 2%Less than $50,000 39% 37% 12% 11% 1%$50,000 or more 34% 34% 23% 9% 0%Not college graduate 37% 33% 18% 10% 1%College graduate 33% 37% 20% 10% 0%White 38% 35% 18% 9% 1%Non-white 33% 35% 21% 12% 0%White - Not College Graduate 43% 31% 14% 10% 1%White - College Graduate 29% 40% 22% 8% 0%Men - White - Not College Graduate 36% 28% 18% 17% 1%Men - White - College Graduate 22% 41% 25% 12% 0%Women - White - Not College Graduate 49% 34% 12% 5% 1%
Women - White - College Graduate 35% 40% 20% 5% 0%Under 45 30% 31% 25% 13% 0%45 or older 39% 37% 15% 8% 1%Gen Z/Millennials (18-40) 29% 33% 23% 15% 1%Gen X (41-56) 37% 33% 23% 7% 0%Baby Boomers (57-75) 41% 37% 14% 8% 0%Silent-Greatest (Over 75) 42% 36% 13% 7% 2%Men 29% 33% 24% 14% 1%Women 42% 36% 14% 6% 1%Biden 35% 39% 19% 7% 0%Trump 39% 30% 20% 11% 0%Big city 30% 35% 19% 16% 0%Small city 41% 30% 21% 7% 1%Suburban 35% 36% 21% 8% 0%Small town 36% 38% 17% 9% 0%Rural 40% 34% 18% 8% 0%
33% 29% 26% 12% 0%44% 39% 14% 3% 0%Small city/Suburban Women
NPR/PBS NewsHour/Marist Poll National Adults. Interviews conducted March 1st through March 2nd, 2022. Totals may not add to 100% due to rounding.
Generation
Gender
2020 Support
Area Description
Small city/Suburban Men
Education
Race/Ethnicity
Race and Education
Gender - Race - Education
Age
National AdultsNational Registered VotersParty Identification
Region
Household Income
RSAUKCN1D. NPR/PBS NewsHour/Marist Poll National Tables March 1st through March 2nd, 2022National Adults
Are you very concerned, concerned, not very concerned, or not concerned at all that the conflict between Russia and Ukraine will lead to the use of nuclear weapons?
17

Support Oppose Vol: UnsureRow % Row % Row %
83% 13% 4%84% 13% 3%
Democrat 88% 10% 2%Republican 79% 16% 5%Independent 84% 14% 2%Northeast 90% 9% 1%Midwest 79% 17% 4%South 81% 16% 3%West 84% 9% 6%Less than $50,000 76% 17% 7%$50,000 or more 87% 11% 2%Not college graduate 78% 17% 5%College graduate 89% 8% 3%White 86% 9% 5%Non-white 78% 20% 2%White - Not College Graduate 81% 11% 7%White - College Graduate 94% 5% 2%Men - White - Not College Graduate 82% 13% 5%Men - White - College Graduate 95% 5% 0%Women - White - Not College Graduate 81% 10% 9%
Women - White - College Graduate 93% 4% 3%Under 45 80% 15% 5%45 or older 85% 12% 3%Gen Z/Millennials (18-40) 79% 16% 5%Gen X (41-56) 85% 14% 1%Baby Boomers (57-75) 87% 10% 3%Silent-Greatest (Over 75) 81% 11% 8%Men 86% 12% 2%Women 80% 15% 5%Biden 89% 9% 2%Trump 76% 19% 5%Big city 78% 17% 4%Small city 82% 14% 4%Suburban 91% 8% 1%Small town 78% 17% 5%Rural 86% 10% 4%
88% 12% 0%84% 10% 5%Small city/Suburban Women
NPR/PBS NewsHour/Marist Poll National Adults. Interviews conducted March 1st through March 2nd, 2022. Totals may not add to 100% due to rounding.
Generation
Gender
2020 Support
Area Description
Small city/Suburban Men
Education
Race/Ethnicity
Race and Education
Gender - Race - Education
Age
National AdultsNational Registered VotersParty Identification
Region
Household Income
USSANRS1. NPR/PBS NewsHour/Marist Poll National Tables March 1st through March 2nd, 2022National Adults
Do you support or oppose the economic sanctions placed on Russia by the United States and its European
allies?
18

Support even if higher energy
prices
Support, but oppose if higher
energy prices
Support, but unsure if higher energy prices Oppose Vol: Unsure
Row % Row % Row % Row % Row %69% 12% 2% 13% 4%70% 11% 2% 13% 3%
Democrat 80% 7% 1% 10% 2%Republican 58% 16% 5% 16% 5%Independent 74% 9% 1% 14% 2%Northeast 80% 9% 1% 9% 1%Midwest 64% 11% 4% 17% 4%South 64% 15% 1% 16% 3%West 71% 9% 3% 9% 6%Less than $50,000 60% 15% 2% 17% 7%$50,000 or more 76% 10% 2% 11% 2%Not college graduate 60% 16% 2% 17% 5%College graduate 81% 6% 2% 8% 3%White 72% 12% 3% 9% 5%Non-white 65% 12% 2% 20% 2%White - Not College Graduate 63% 15% 3% 11% 7%White - College Graduate 85% 6% 2% 5% 2%Men - White - Not College Graduate 65% 16% 1% 13% 5%Men - White - College Graduate 85% 8% 2% 5% 0%Women - White - Not College Graduate 62% 15% 4% 10% 9%
Women - White - College Graduate 85% 5% 3% 4% 3%Under 45 68% 11% 0% 15% 5%45 or older 69% 12% 3% 12% 3%Gen Z/Millennials (18-40) 65% 13% 1% 16% 5%Gen X (41-56) 73% 10% 2% 14% 1%Baby Boomers (57-75) 72% 13% 2% 10% 3%Silent-Greatest (Over 75) 64% 11% 6% 11% 8%Men 71% 12% 2% 12% 2%Women 66% 11% 3% 15% 5%Biden 83% 5% 2% 9% 2%Trump 55% 19% 2% 19% 5%Big city 68% 9% 1% 17% 4%Small city 71% 8% 3% 14% 4%Suburban 81% 7% 3% 8% 1%Small town 62% 12% 4% 17% 5%Rural 60% 24% 2% 10% 4%
76% 11% 2% 12% 0%77% 4% 4% 10% 5%Small city/Suburban Women
NPR/PBS NewsHour/Marist Poll National Adults. Interviews conducted March 1st through March 2nd, 2022. Totals may not add to 100% due to rounding.
Generation
Gender
2020 Support
Area Description
Small city/Suburban Men
Education
Race/Ethnicity
Race and Education
Gender - Race - Education
Age
National AdultsNational Registered VotersParty Identification
Region
Household Income
USSANEC1R. NPR/PBS NewsHour/Marist Poll National Tables March 1st through March 2nd, 2022National Adults
Do you support or oppose the economic sanctions placed on Russia by the United States and its European allies? [If support: Do you support or oppose the economic sanctions placed on
Russia if it results in higher energy prices in the United States?]
19

Strengthened Weakened Vol: UnsureRow % Row % Row %
45% 51% 4%46% 50% 4%
Democrat 86% 10% 4%Republican 9% 87% 3%Independent 40% 56% 4%Northeast 58% 39% 3%Midwest 40% 55% 5%South 43% 54% 4%West 42% 52% 6%Less than $50,000 48% 45% 7%$50,000 or more 44% 54% 2%Not college graduate 40% 55% 5%College graduate 51% 45% 4%White 41% 53% 5%Non-white 52% 45% 3%White - Not College Graduate 34% 60% 7%White - College Graduate 52% 45% 4%Men - White - Not College Graduate 28% 66% 6%Men - White - College Graduate 45% 51% 4%Women - White - Not College Graduate 38% 55% 7%
Women - White - College Graduate 57% 39% 3%Under 45 47% 50% 3%45 or older 43% 52% 5%Gen Z/Millennials (18-40) 50% 46% 4%Gen X (41-56) 41% 58% 1%Baby Boomers (57-75) 44% 51% 5%Silent-Greatest (Over 75) 42% 47% 11%Men 39% 57% 4%Women 50% 45% 5%Biden 85% 11% 4%Trump 3% 95% 2%Big city 54% 42% 4%Small city 43% 51% 6%Suburban 46% 50% 4%Small town 41% 55% 4%Rural 35% 60% 4%
36% 60% 4%56% 38% 6%Small city/Suburban Women
NPR/PBS NewsHour/Marist Poll National Adults. Interviews conducted March 1st through March 2nd, 2022. Totals may not add to 100% due to rounding.
Generation
Gender
2020 Support
Area Description
Small city/Suburban Men
Education
Race/Ethnicity
Race and Education
Gender - Race - Education
Age
National AdultsNational Registered VotersParty Identification
Region
Household Income
USRLWLD1. NPR/PBS NewsHour/Marist Poll National Tables March 1st through March 2nd, 2022National Adults
Do you think the United States' role on the world stage has been strengthened or weakened by Joe Biden's
decisions as president?
20
Strengthened Weakened UnsureRow % Row % Row %
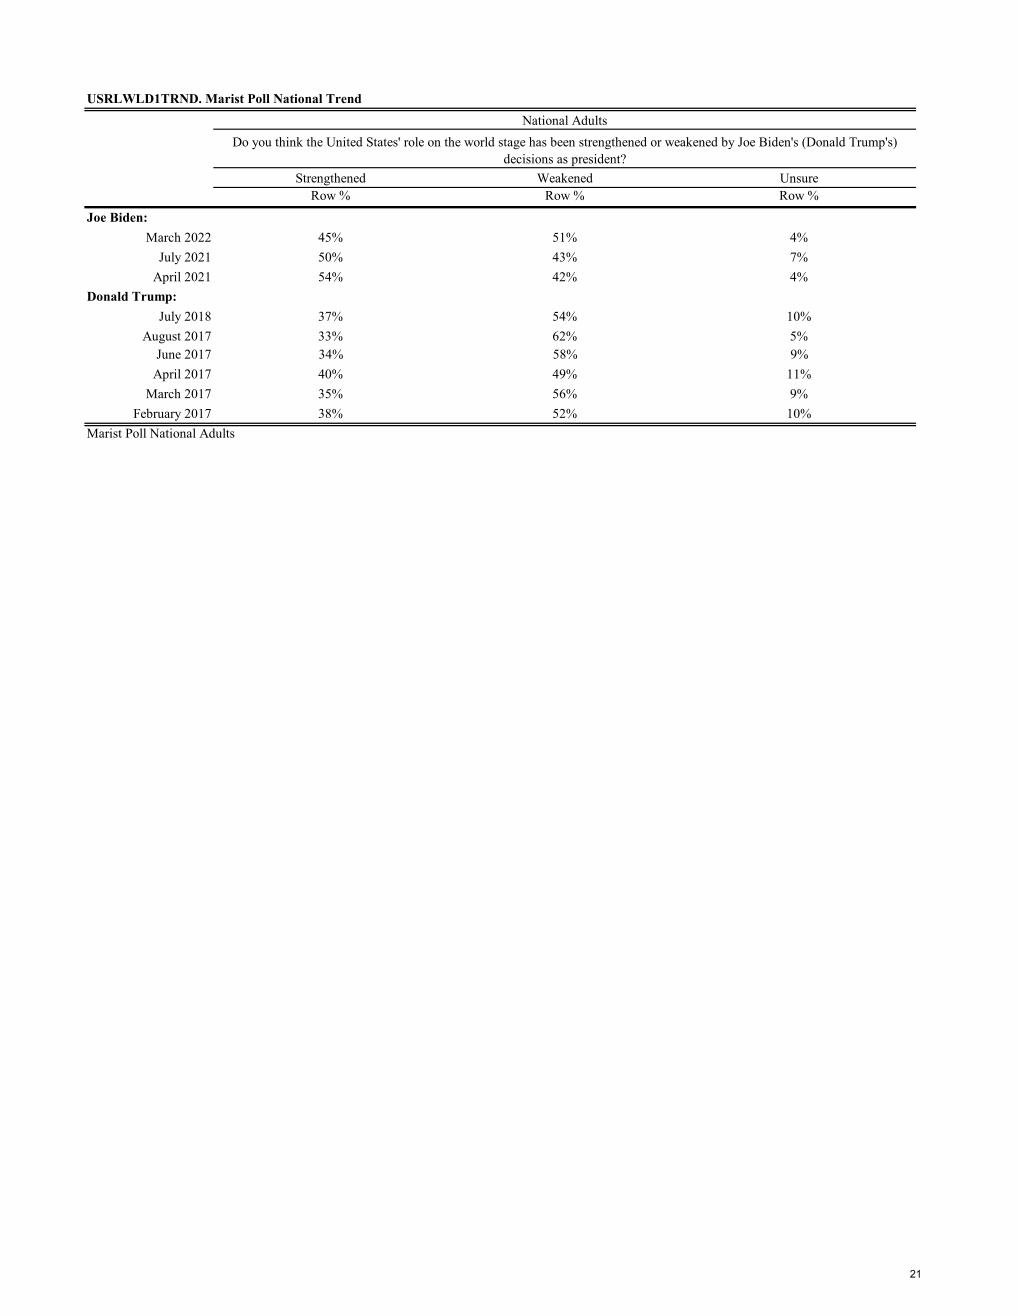
Joe Biden:March 2022 45% 51% 4%
July 2021 50% 43% 7%April 2021 54% 42% 4%
Donald Trump:July 2018 37% 54% 10%
August 2017 33% 62% 5%June 2017 34% 58% 9%
April 2017 40% 49% 11%March 2017 35% 56% 9%
February 2017 38% 52% 10%
USRLWLD1TRND. Marist Poll National Trend
Marist Poll National Adults
National AdultsDo you think the United States' role on the world stage has been strengthened or weakened by Joe Biden's (Donald Trump's)
decisions as president?
21