Novel Aspects of Ciliary Beat Regulation in Human Bronchial ...
115
Novel Aspects of Ciliary Beat Regulation in Human Bronchial Epithelial Cells Ph.D. Theses Zoltán Süttő M.D. Semmelweis University Budapest School of Ph.D. Studies in Clinical Medicine Tutor: Gábor Horváth M.D., Ph.D. Reviewers: Attila Szabó M.D., Ph.D. Tamás Major jr. M.D., Ph.D. Scientific Committee: President: Prof. Imre Hutás M.D., D.Sc. Members: Attila Somfay M.D., Ph.D Prof. György Böszörményi Nagy M.D., Ph.D. Budapest 2006.
-
Upload
khangminh22 -
Category
Documents
-
view
6 -
download
0
Transcript of Novel Aspects of Ciliary Beat Regulation in Human Bronchial ...

Novel Aspects of Ciliary Beat Regulation in Human Bronchial Epithelial Cells
Ph.D. Theses
Zoltán Süttő M.D.
Semmelweis University Budapest School of Ph.D. Studies in Clinical Medicine
Tutor: Gábor Horváth M.D., Ph.D. Reviewers: Attila Szabó M.D., Ph.D. Tamás Major jr. M.D., Ph.D. Scientific Committee:
President: Prof. Imre Hutás M.D., D.Sc. Members: Attila Somfay M.D., Ph.D
Prof. György Böszörményi Nagy M.D., Ph.D.
Budapest 2006.

2
TABLE OF CONTENTS
ABBREVIATIONS.......................................................................................................... 5
1. INTRODUCTION........................................................................................................ 8
1.1. Anatomy and structure of the mucociliary apparatus .......................................... 8
1.1.1. Bronchial epithelium..................................................................................... 9 1.1.2. Airway surface liquid.................................................................................... 9 1.1.3. Cilia ............................................................................................................. 10
1.2. Regulation of the mucociliary apparatus ........................................................... 11
1.2.1. Neuronal regulation..................................................................................... 11 1.2.2. Effect of autonomic agonists on the mucociliary apparatus ....................... 12
1.2.2.1 Cholinergic agonists ........................................................................... 12 1.2.2.2 β-adrenergic agonists.......................................................................... 13 1.2.2.3 Other mediators .................................................................................. 14
1.2.3. Autocrine and paracrine regulation............................................................. 15 1.2.3.1 Nucleotides ......................................................................................... 15 1.2.3.2 Acetylcholine...................................................................................... 15
1.3. Intracellular signaling of ciliary beating: role of cAMP and Ca2+.................... 18
1.3.1. cAMP .......................................................................................................... 18 1.3.2. Calcium ....................................................................................................... 19 1.3.3. Interplay between cAMP and [Ca2+]i .......................................................... 19 1.3.4. Synergism between cAMP and [Ca2+]i ....................................................... 21 1.3.5. Soluble adenylyl cyclase (sAC): a unique source of cAMP ....................... 21
1.3.5.1 Enzymatic characteristics and cellular distribution of sAC................ 21 1.3.5.2 Cytosolic ions: role of HCO3
- and H+ in ciliary activity .................... 22
1.4. : Regulation of catecholamine concentration at adrenergic receptor site: role of catecholamine transporters ................................................................................ 23
2. AIMS .......................................................................................................................... 26
3. MATERIALS AND METHODS ............................................................................... 27
3.1. Chemicals ........................................................................................................... 27
3.2. Solutions ............................................................................................................. 27
3.3. Cell isolation and culture techniques ................................................................. 28
3.3.1. Preparation of submerged tracheal epithelial cell cultures.......................... 28 3.3.2. Preparation of air liquid interface cultures of tracheal epithelium.............. 29

3
3.3.3. Human bronchial arterial smooth muscle cell isolation.............................. 30 3.3.4. Preparation of primary cultures of bronchial arterial SMCs....................... 31 3.3.5. Caki-1 cell culture ....................................................................................... 31
3.4. Selective permeabilization of the basolateral membrane of cells grown at the ALI ...................................................................................................................... 31
3.5. Measurement of CBF.......................................................................................... 32
3.6. Measurement of pHi............................................................................................ 33
3.6.1. Fluorometric pHi measurements ................................................................. 33 3.6.2. Calibration of pHi measurements ................................................................ 33
3.6.2.1 Preparation of the pH calibration curve.............................................. 33 3.6.2.2 pHi estimation..................................................................................... 34
3.6.3. Experimental procedures for pHi measurements......................................... 35
3.7. Measurement of [Ca2+]i...................................................................................... 35
3.8. Simultaneous measurement of CBF and pHi or [Ca2+]i ..................................... 36
3.9. mRNA-expression of sAC and catecholamine transporters................................ 36
3.9.1. RT-PCR....................................................................................................... 36 3.9.2. Cloning of cDNA fragments of sAC variants ............................................. 37
3.10. Expression of sAC-protein................................................................................ 38
3.10.1. Western blotting for sAC .......................................................................... 38 3.10.2. sAC-specific immunohystochemistry and immunocytochemistry ........... 38
3.11. Single-cell, fluorometric NE uptake measurements.......................................... 39
3.11.1. NE uptake experiments ............................................................................. 39 3.11.2. NE uptake assay ........................................................................................ 39
3.12. Immunochemical detection of a plasma membrane binding site for corticosterone in bronchial arterial SMC .......................................................... 40
3.13. Statistical analysis ............................................................................................ 41
4. RESULTS................................................................................................................... 42
4.1. Regulation of human airway ciliary beat frequency by pHi ............................... 42
4.1.1. The effect of changing pHi on CBF during ammonium prepulse ............... 42 4.1.2. The effect of changing pHi on CBF during removal of extracellular CO2.. 44 4.1.3. Inhibition and stimulation of PKA does not prevent the effect of pHi on
CBF.............................................................................................................. 46

4
4.1.4. Inhibition of protein phosphatases does not influence the effect of pHi on CBF.............................................................................................................. 48
4.1.5. pHi does not regulate CBF via changes in [Ca2+]i....................................... 49 4.1.6. Basolaterally permeabilized cells grown at the ALI ................................... 52 4.1.7. Correlation between pHi and CBF in permeabilized cells .......................... 53
4.2. sAC expression and cellular distribution in HAECs .......................................... 54
4.2.1. sAC mRNA expression ............................................................................... 54 4.2.2. Expression and cellular distribution of sAC protein ................................... 57 4.2.3. Effect of cytosolic HCO3
- on ciliary beating in HAECs ............................. 59
4.3. NE transporter mRNA expression profile in human airway epithelial cells ...... 61
4.4. Pharmacological characterization of NE uptake ............................................... 62
4.4.1. NE uptake characteristics in bronchial arterial SMCs ................................ 62 4.4.2. Inhibition of NE uptake by GSs .................................................................. 64 4.4.3. EMT inhibition by corticosterone is a nongenomic effect.......................... 65
5. DISCUSSION............................................................................................................. 69
5.1. Regulation of human airway ciliary beat frequency by pHi ............................... 69
5.2. Expression of sAC in human airway epithelial cells .......................................... 73
5.3. Expression and putative function of catecholamine transporters in human airway epithelial cells......................................................................................... 76
6. CONCLUSIONS ........................................................................................................ 81
SUMMARY ................................................................................................................... 82
ÖSSZEFOGLALÁS ....................................................................................................... 84
REFERENCES ............................................................................................................... 86
PUBLICATIONS LIST................................................................................................ 111
Publications relevant to theses ................................................................................ 111
Other publications ................................................................................................... 112
ACKNOWLEDGEMENTS ......................................................................................... 115
5
ABBREVIATIONS
acetyl-CoA acetyl coenzyme-A
ACh acetylcholine
AChE acethylcholinesterase
AKAP A-kinase anchoring protein
ALI air-liquid interface
ARS ATP regenerating system
ASL airway surface liquid
ATCC American Type Culture Collection
ATP adenosine 5'-triphosphate
ATPase adenosine triphosphatase
BCECF 2’7’-bis-(2-carboxyethyl)-5-(and-6)-carboxyfluorescein
BEGM bronchial epithelial growth medium
BK channel large conductance Ca2+-activated K+ channel
bp base pairs
BSA bovine serum albumin
[Ca2+]i intracellular calcium concentration
cAMP cyclic adenosine monophosphate
CBF ciliary beat frequency
cDNA complementary DNA
CFTR cystic fibrosis transmembrane conductance regulator
ChAT choline acetyltransferase
CHT choline high affinity transporter
COMT catecholamine-O-methyltransferase
6
COPD chronic obstructive pulmonary disease
DAPI 4,6-diamidino-2-phenylindole
DIC differential-interference-contrast
DMEM Dulbecco’s modified Eagle’s medium
DNase deoxyribonuclease
EMT extraneuronal monoamine transporter
F fluorescence
FBS fetal bovine serum
FFT fast Fourier transform
Fn mean fluorescence intensity value
GAPDH glyceraldehyde-3-phosphate dehydrogenase
GS stimulatory G-protein
GS glucocorticosteroid
HAEC human airway epithelial cell
[HCO3-]i intracellular bicarbonate concentration
HRP horseradish peroxidase
IC50 inhibitor concentration at 50% inhibition
IP3 inositol trisphosphate
KD dissociation constant
Ki inhibition constant
Km Michaelis constant (substrate concentration at half-
maximal enzyme velocity)
MAO monoamine oxidase
mRNA messenger RNA
NE norepinephrine

7
NET norepinephrine transporter
NFR normalized fluorescence ratio
OCT organic cation transporter
PBS phosphate-buffered saline
PCL periciliary liquid layer
PIP2 phosphatidyl inositol disphosphate
PKA cAMP-dependent protein kinase
PLC phospholipase C
RAR rapidly adapting stretch receptor
ROI region of interest
RT-PCR reverse transcriptase polymerase chain reaction
sAC soluble adenylyl cyclase
SEM standard error of the mean
SMC smooth muscle cell
SPG sucrose-potassium phosphate-glyoxylic acid
Tm annealing temperature
tmAC transmembrane adenylyl cyclase
TRITC tetramethylrhodamine isothiocyanate
TSA tyramide signal amplification
UTP uridine 5'-triphosphate
VIP vasoactive intestinal peptide
Vmax maximal enzyme velocity

8
1. INTRODUCTION
1.1. Anatomy and structure of the mucociliary apparatus
The ventilation of the lung ranges between 1,000 and 21,000 liters per 24 hours in
humans depending on body size and physical activity. This exposes the extensive
epithelial surface of the respiratory tract to a large burden of microorganisms as well as
inorganic and organic particulate and gaseous material. A series of defense systems
protect the airways against these potentially injurious actions. First, the mucociliary
apparatus serves as a mechanical barrier by trapping particulates in the surface liquid
and removing them from the airway. Second, a number of macromolecules secreted by
the airway epithelial cells, e.g. lysozyme, defensin, lactoferrin, leukocyte protease
inhibitor and lactoperoxidase, exhibits antimicrobial effects and thus, form a „chemical
shield”. Third, the surface liquids provide a „biologic barrier” function by interacting
with microorganisms and luminal inflammatory cells, thereby preventing them from
adhering to and migrating through the airway epithelium. The different defense systems
work together and are complementary to each other (Wanner et al., 1996; Chilvers &
O'Callaghan, 2000; Knowles & Boucher, 2002).
The present work will focus on the regulation of ciliary beat frequency (CBF), the
primary determinant of the effectiveness of the mucociliary apparatus and mucus
clearance. Mucociliary dysfunction is a frequent consequence of chronic airway
diseases such as asthma (Foster et al., 1982; Bateman et al., 1983a; Pavia et al., 1985;
O'Riordan et al., 1992), chronic bronchitis (Camner et al., 1973; Santa Cruz et al.,
1974b; Goodman et al., 1978; Vastag et al., 1986), and cystic fibrosis (Yeates et al.,
1976; Matthys & Kohler, 1986; Regnis et al., 1994), but can cause by itself airway
disease as illustrated by primary ciliary dyskinesia (Kollberg et al., 1978; Baum et al.,
1990; Regnis et al., 2000). Thus, the better understanding of CBF regulation could
provide useful therapeutic tools in restoring normal clearance in airway diseases.
9
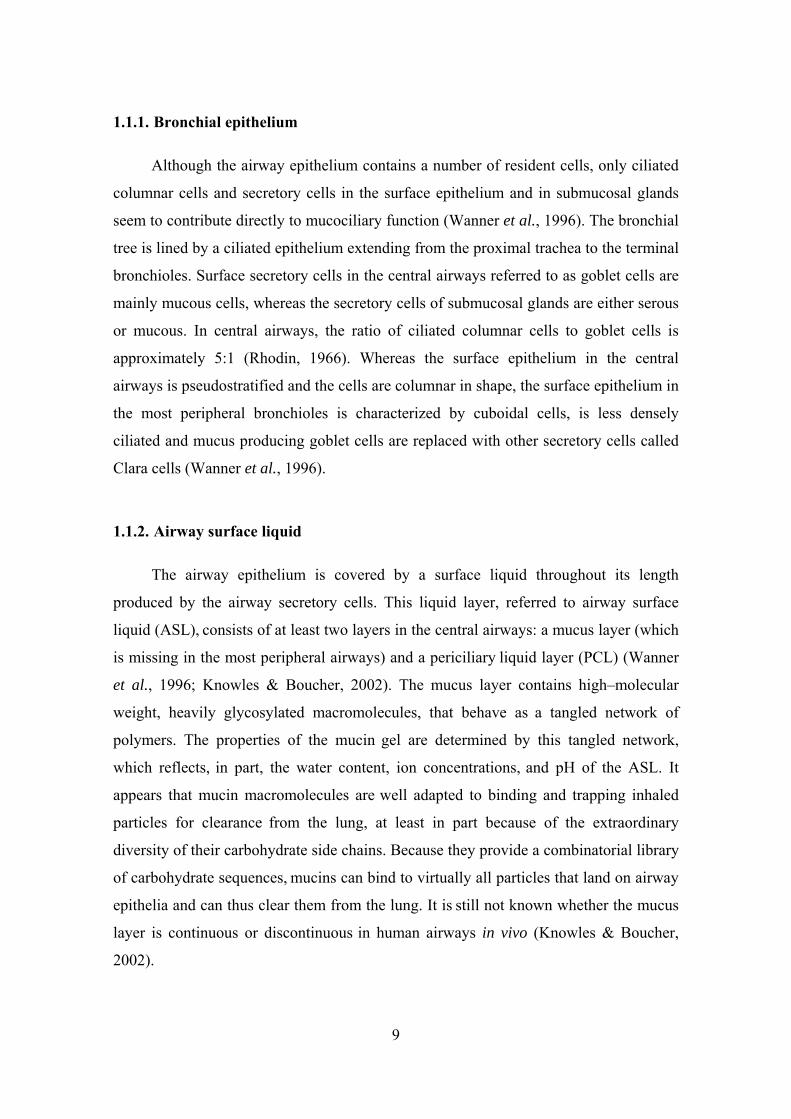
1.1.1. Bronchial epithelium
Although the airway epithelium contains a number of resident cells, only ciliated
columnar cells and secretory cells in the surface epithelium and in submucosal glands
seem to contribute directly to mucociliary function (Wanner et al., 1996). The bronchial
tree is lined by a ciliated epithelium extending from the proximal trachea to the terminal
bronchioles. Surface secretory cells in the central airways referred to as goblet cells are
mainly mucous cells, whereas the secretory cells of submucosal glands are either serous
or mucous. In central airways, the ratio of ciliated columnar cells to goblet cells is
approximately 5:1 (Rhodin, 1966). Whereas the surface epithelium in the central
airways is pseudostratified and the cells are columnar in shape, the surface epithelium in
the most peripheral bronchioles is characterized by cuboidal cells, is less densely
ciliated and mucus producing goblet cells are replaced with other secretory cells called
Clara cells (Wanner et al., 1996).
1.1.2. Airway surface liquid
The airway epithelium is covered by a surface liquid throughout its length
produced by the airway secretory cells. This liquid layer, referred to airway surface
liquid (ASL), consists of at least two layers in the central airways: a mucus layer (which
is missing in the most peripheral airways) and a periciliary liquid layer (PCL) (Wanner
et al., 1996; Knowles & Boucher, 2002). The mucus layer contains high–molecular
weight, heavily glycosylated macromolecules, that behave as a tangled network of
polymers. The properties of the mucin gel are determined by this tangled network,
which reflects, in part, the water content, ion concentrations, and pH of the ASL. It
appears that mucin macromolecules are well adapted to binding and trapping inhaled
particles for clearance from the lung, at least in part because of the extraordinary
diversity of their carbohydrate side chains. Because they provide a combinatorial library
of carbohydrate sequences, mucins can bind to virtually all particles that land on airway
epithelia and can thus clear them from the lung. It is still not known whether the mucus
layer is continuous or discontinuous in human airways in vivo (Knowles & Boucher,
2002).
10
The mucus-free zone at the cell surface, which approximates the height of the
outstretched cilia, is the PCL, also known as "sol" layer. PCL is crucial both because it
provides a low-viscosity solution in which cilia can beat rapidly and because it shields
the epithelial cell surface from the overlying mucus layer. The absence of the PCL
allows adhesive interactions between mobile mucins in the mucus layer and tethered
cell-surface mucins - the so called "glycocalyx", which covers the apical surface of
airway epithelial cells - greatly reducing the efficiency of mucociliary and cough
clearance (Knowles & Boucher, 2002).
1.1.3. Cilia
The surface of each tracheal columnar cell contains approximately 200 cilia with
an average length of 6 μm and a diameter of 0.1-0.2 μm. With an increase in airway
generations, there is a decrease in the relative number of ciliated cells, which are
characterized by fewer and shorter cilia than in the large bronchi (Wanner et al., 1996).
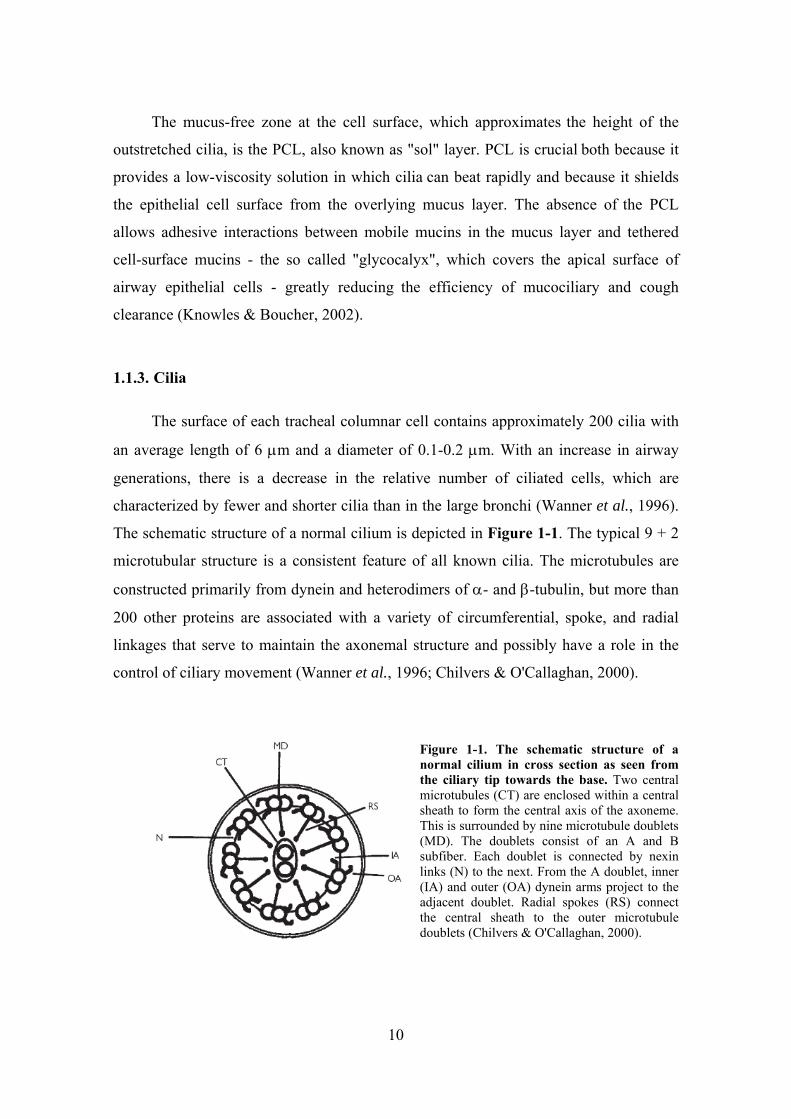
The schematic structure of a normal cilium is depicted in Figure 1-1. The typical 9 + 2
microtubular structure is a consistent feature of all known cilia. The microtubules are
constructed primarily from dynein and heterodimers of α- and β-tubulin, but more than
200 other proteins are associated with a variety of circumferential, spoke, and radial
linkages that serve to maintain the axonemal structure and possibly have a role in the
control of ciliary movement (Wanner et al., 1996; Chilvers & O'Callaghan, 2000).
Figure 1-1. The schematic structure of a normal cilium in cross section as seen from the ciliary tip towards the base. Two central microtubules (CT) are enclosed within a central sheath to form the central axis of the axoneme. This is surrounded by nine microtubule doublets (MD). The doublets consist of an A and B subfiber. Each doublet is connected by nexin links (N) to the next. From the A doublet, inner (IA) and outer (OA) dynein arms project to the adjacent doublet. Radial spokes (RS) connect the central sheath to the outer microtubule doublets (Chilvers & O'Callaghan, 2000).

11
The outer nine doublet microtubules consist of a complete A subfiber (13
protofilaments) upon which an incomplete B subfiber (10 to 11 protofilaments)
assembles. The nine outer doublet microtubules are connected to each other by nexin
links, and radial spokes connect the outer microtubules with projections originating
from the inner singlet microtubules. Dynein, the motor for ciliary movement, is an
adenosine triphosphatase (ATPase). An outer and an inner dynein arm originate from
each A subfiber of the outer doublet microtubule and project in a counterclockwise
direction (as seen from the tip) toward the B subfiber of the next doublet. The
mammalian outer arm dynein is a two-headed structure; less is known about the
morphology of inner arm dynein. Each dynein head contains a heavy chain ATPase to
which several dynein light chains and at least one intermediate chain are attached. These
chains anchor the dynein arm to the A microtubule and are involved in the regulation of
ciliary beating. At the tip of the cilium, the nine outer doublets simplify into a single A
fiber, which inserts into a transmembrane complex called the ciliary crown. The ciliary
crown carries three to seven short “claws”, which probable function is to mechanically
or chemically engage the overlying mucus layer during the effective ciliary stroke. At
the base, the nine outer doublets end in the basal body, which is anchored to the
cytoskeleton. The outer ciliary membrane covering the axoneme is continuous with the
cell surface membrane. Bridges between the ciliary membrane and the outer doublets
exist along the entire length of the cilium (Wanner et al., 1996; Chilvers & O'Callaghan,
2000).
1.2. Regulation of the mucociliary apparatus
1.2.1. Neuronal regulation
The mucociliary apparatus is innerved predominantly by the parasympathetic
nervous system. Catecholamine and vasoactive intestinal peptide (VIP) containing nerve
fibers as well as a rich network of cholinergic nerves have been shown in submucosal
glands, but not within the surface epithelium, of human bronchi (Partanen et al., 1982;
Laitinen, 1985a, b; Laitinen et al., 1985). Apparently, there are no efferent neurons
within the surface epithelium but this issue has not been fully clarified (Wanner et al.,

12
1996). Instead, electron microscopic studies have revealed intraepithelial sensory
(afferent) axons, either close to the lumen or near the basement membrane of human
bronchi (Laitinen, 1985b). These fibers are primarily unmyelinated capsaicin sensitive
C-fibers or thin, myelinated Aδ axons of rapidly adapting stretch receptors (RAR) and
are thought to participate in defensive autonomic reflex mechanisms like mucus
hypersecretion, cough and bronchoconstriction in response to certain chemical or
mechanical stimuli. Excitation of C-fiber endings may cause local axon reflex, a feature
also referred to as the “efferent” function of sensory nerves, resulting in the release of
neuropeptides (Wanner et al., 1996; Belvisi, 2002; Widdicombe, 2003).
It appears that baseline mucociliary function is not under autonomic control. For
example, the sympathetic and parasympathetic nervous system seems to lack an effect
on baseline glycoprotein secretion in cat (Wanner et al., 1996). However, both vagal
and sympathetic nerve stimulation as well as excitation of sensory nerve endings might
alter mucosal function by increasing mucus secretion and water transport towards the
airway (Wanner et al., 1996; Belvisi, 2002). In contrast to secretory responses, very
little is known about the effects of autonomic nerve stimulation on ciliary activity or
mucociliary clearance in the airways. Vagal section or vagal stimulation of dogs seems
to have no effect on in vivo ciliary activity in the large airways (Wanner et al., 1996).
1.2.2. Effect of autonomic agonists on the mucociliary apparatus
1.2.2.1 Cholinergic agonists
Although airway surface epithelium is not innerved by cholinergic nerves, these
cells express muscarinic receptors, similarly to submucosal gland cells. Human
bronchial epithelial cells express both M1 and M3 muscarinic receptor subtypes (Racke
& Matthiesen, 2004) while human submucosal gland cells express only M3 receptors
(Mak et al., 1992). M1 receptors seem to be restricted to the peripheral airways < 2 mm
(Racke et al., 2006). Furthermore, functionally active nicotinic receptors have recently
been demonstrated on human airway epithelial cells (Maus et al., 1998; Wang et al.,
2001; Wessler & Kirkpatrick, 2001; Carlisle et al., 2004).
13
Cholinergic antagonists, likewise other autonomic receptor antagonists, generally
do not influence baseline mucociliary clearance (Mercke et al., 1982; Wanner et al.,
1996). Atropine is a notable exception, which, in contrast to another anticholinergic
agent ipratropium bromide, depressed airway mucociliary transport in most studies,
probably by cilioinhibition (Foster et al., 1976; Mercke et al., 1982; Whiteside et al.,
1984; Groth et al., 1991; Wanner et al., 1996), yet this finding is not consistent
(Hybbinette & Mercke, 1982b; Mercke et al., 1982). However, almost all in vitro and in
vivo studies have found an enhancement of mucociliary clearance and ciliary activity by
the cholinergic agonists acetylcholine (ACh) and methacholine, but not vagal
stimulation, in different species (Cammer et al., 1974; Berger et al., 1978; Hybbinette &
Mercke, 1982b; Mercke et al., 1982; Wong et al., 1988a, b; Seybold et al., 1990;
Salathe & Bookman, 1995; Wanner et al., 1996). Cholinergic ciliostimulation in sheep
is mediated by M3 receptors coupled to pertussis-toxin-insensitive G-proteins involving
Ca2+-release from inositol trisphosphate (IP3) sensitive Ca2+-stores (Salathe &
Bookman, 1995; Salathe et al., 1997; Salathe & Bookman, 1999; Salathe et al., 2001).
1.2.2.2 β-adrenergic agonists
As mentioned above, microscopic studies have failed to show efferent autonomic
innervation in the surface epithelium of human bronchi (Partanen et al., 1982), however,
there is a high density of β-adrenergic receptors on human airway epithelial cells
(HAEC): surface cells express mainly β2-adrenergic receptors, whereas submucosal
gland cells express both β1- and β2-adrenergic receptors (Wanner et al., 1996).
Therefore it is not surprising that β-adrenergic receptor agonists, which are primarily
used as bronchodilators in the treatment of obstructive airway diseases, also influence
airway epithelial cell function. Besides opening apical ion channels, regulating cytokine
secretion and enhancing epithelial wound repair, one of their most important effects, at
least in terms of mucociliary clearance, is ciliostimulation (Salathe, 2002).
A number of clinical studies have demonstrated the short term stimulatory effect
of β-adrenergic receptor agonists on mucociliary clearance (Santa Cruz et al., 1974a;
Mossberg et al., 1976; Foster et al., 1982; Weiss et al., 1983; Vastag & Zsamboki,
1985; Matthys & Kohler, 1986; Yeates et al., 1986; Gatto, 1993). Most of the clinical

14
studies have proved that β-adrenergic receptor agonists augment mucociliary clearance
of healthy individuals (Tay et al., 1997; Svartengren et al., 1998), COPD and asthma
patients (Fazio & Lafortuna, 1981; Matthys et al., 1987; Hasani et al., 2003; Hasani et
al., 2005; Bennett et al., 2006) and animals (Hybbinette & Mercke, 1982a; Mercke et
al., 1982; Sabater et al., 2005) (but not delta F508 homozygous cystic fibrosis patients
(Mortensen et al., 1993)). However, some report contrast these results (Pavia et al.,
1980; Bateman et al., 1983b; Davies & Webster, 1989; Svartengren et al., 1998). The
interpretation of radioaerosol studies on mucociliary clearance is complicated by the
bronchodilatory effect of β-adrenergic receptor agonists, which permit a greater
penetration of the radioaerosol into the smaller airways where mucociliary clearance is
markedly slower (Salathe et al., 1996). This methodological problem is eliminated when
not the clearance of labeled particles but CBF, the primary determinant of mucociliary
clearance rate, is measured. The results of these studies are consistent in proving that β-
adrenergic receptor agonists increase CBF of mammalian, including human, airway
epithelial cells in vitro (Verdugo et al., 1980; Wong et al., 1988a; Sanderson & Dirksen,
1989; Devalia et al., 1992; Ingels et al., 1992; Tamaoki et al., 1993; Kanthakumar et al.,
1994; Lindberg et al., 1995; Frohock et al., 2002; Salathe, 2002; Allen-Gipson et al.,
2004; Shiima-Kinoshita et al., 2004; Piatti et al., 2005; Zhang et al., 2005) as well as in
vivo (Wong et al., 1988b; Lindberg et al., 1995).
1.2.2.3 Other mediators
α-adrenergic receptors are expressed in submucosal gland cells, mainly in serous
cells. Peptidergic receptors such as those mediating the effects of VIP and substance P
(neurokinin receptors) have also been identified on airway epithelial cells in animals
and in humans. In vagally induced mucus hypersecretion, neuropeptides also seem to be
involved, besides ACh (Wanner et al., 1996). Ephedrine has been reported to increase
CBF by some but not all investigators. Reported effects of alpha-adrenergic agonists on
CBF are conflicting: stable, decreasing and increasing CBF have all been reported.
Peptide mediators like substance P has a slight ciliostimulatory effect, but this has not
been found consistently, while neuropeptide Y was found to decrease CBF (Wanner et
al., 1996).

15
1.2.3. Autocrine and paracrine regulation
Recent data suggest that autocrine and paracrine mediators like 5' nucleotides and
ACh may have a role in the regulation of mucociliary clearance.
1.2.3.1 Nucleotides
As mentioned above, neuronal mechanisms are probably not involved in the
regulation of CBF, and the role of endocrine mechanisms are also unlikely as systemic
responses, for example to epinephrine, have time constants that are too long for this
function (Lazarowski et al., 2000; Lazarowski & Boucher, 2001; Knowles & Boucher,
2002; Lazarowski et al., 2003). Adenosine 5'-triphosphate (ATP) and uridine 5'-
triphosphate (UTP) are released by the airway epithelial cells across both the apical and
basolateral membrane in response to mechanical and osmotic stresses (Homolya et al.,
2000) and also under basal conditions. Released nucleotides interact with purinoceptors
at both membranes to trigger Ca2+-mobilization. Apical purinoceptors modulate cellular
functions like ciliary beating (Morse et al., 2001; Lieb et al., 2002), mucus secretion
(Knowles et al., 1991; Davis et al., 1992; Lethem et al., 1993) and ion channel activities
(Korngreen et al., 1998), i.e. the elements of the mucociliary apparatus, while
basolateral nucleotide release constitutes a paracrine mechanism by which mechanical
stresses signal adjacent cells not only within the epithelium, but also in the submucosa.
Airways also express a large number of extracellular nucleotidases that regulate
extracellular nucleotide concentrations. Furthermore, the hydrolysates of 5' nucleotides
also serve as ligands for specific receptors. These data strongly suggest that nucleotide
release by epithelial cells regulates mucus clearance rates in response to luminal stresses
(Knowles & Boucher, 2002; Picher & Boucher, 2003; Picher et al., 2003).
1.2.3.2 Acetylcholine
ACh represents the “classical” neurotransmitter of the parasympathetic nervous
system, but evidence has been provided that ACh is also synthesized and secreted by a
variety of non-neuronal tissues including human bronchial epithelium (Wessler &

16
Kirkpatrick, 2001; Proskocil et al., 2004). In fact, more or less all human cells fulfill the
three crucial conditions for the synthesis of acetylcholine: presence of the synthesizing
enzyme choline acetyltransferase (ChAT) and the substrates choline and acetyl
coenzyme-A (acetyl-CoA) (Wessler & Kirkpatrick, 2001).
The bronchial epithelium, however, not only secretes ACh, but also possesses all
the other elements essential for cholinergic regulation (Proskocil et al., 2004; Lips et al.,
2005), a system referred to as non-neuronal cholinergic system. While acetyl-CoA is
produced in the citric acid cycle, choline, the other substrate of ACh synthesis is
transported into the cells by specific transporters, which is the rate-limiting step in ACh
synthesis (Lips et al., 2003). Previously it was thought that choline high affinity
transporter (CHT) is restricted to the neurons, while non-neuronal cells express only a
low affinity choline uptake system (Wessler & Kirkpatrick, 2001). Recently CHT has
been shown to be expressed in human bronchial epithelial cells as well (Proskocil et al.,
2004). Immunolocalization has revealed that CHT is restricted to the apical membrane
of ciliated cells in rats (Pfeil et al., 2003). ChAT, the ACh-synthesizing enzyme, is
expressed in the surface epithelial and submucosal gland cells of human airways. The
most prominent ChAT immunoreactivity in ciliated bronchial cells has been shown at
basal bodies, where the cilia are embedded (Wessler & Kirkpatrick, 2001). ACh-release
from non-neuronal cells seems to be mediated by organic cation transporters (OCT),
especially by the isoforms OCT-1 and OCT-2 (Wessler & Kirkpatrick, 2001; Wessler et
al., 2003; Lips et al., 2005). OCTs, as discussed below in paragraph 1.4, are
polyspecific cation transporters and are best known about their role in cellular
catecholamine uptake. All three isoforms of OCT has been shown to be expressed in
human bronchial epithelium and to be localized (but not restricted) to the apical
membrane of ciliated cells (Lips et al., 2005). The effectors of ACh regulation, i.e.
muscarinic as well as nicotinic ACh-receptors are also expressed in HAEC (Mak et al.,
1992; Wanner et al., 1996; Racke & Matthiesen, 2004). The inactivating enzyme
acethylcholinesterase (AChE) has also been demonstrated in monkey bronchial
epithelial cell culture by virtue of its catalytic activity (Proskocil et al., 2004).
There are some basic differences between neuronal and non-neuronal cholinergic
systems. Non-neuronal cells are not endowed with effective storing organelles like
cholinergic vesicles and thus fail to concentrate ACh. In contrast to neuronal exocytotic

17
ACh-release, non-neuronal ACh release via OCTs seems to be continuously active upon
concentration gradient (Wessler et al., 2001; Lips et al., 2005). Furthermore, in contrast
to the cholinergic synapse, there are not known “hot spots” of highly concentrated ACh-
receptors; and finally, the elimination of non-neuronal ACh is much slower because of
low cholinesterase activity (Wessler et al., 2003).
These features of non-neuronal cholinergic system agree with the concept that
non-neuronal ACh acts continuously as a local signaling molecule involved in the
regulation of basic cell functions (Wessler et al., 2003), however, the physiological
relevance of airway non-neuronal cholinergic system remains to be determined. In
airway epithelium, there are substantial speculations concerning its function including
regulation of inflammatory mediator release from epithelial cells and contribution to the
regulation of epithelial layer integrity by the control of epithelial cell adhesion, cell–cell
interactions and proliferation (Racke & Matthiesen, 2004). Although non-neuronal ACh
is considered to be a local mediator, a recent study suggests that ACh secreted by the
mouse airway epithelium causes bronchoconstriction (Moffatt et al., 2004), however,
the specificity of this result has been questioned (Racke et al., 2006).
Several data mentioned above suggest that nonneuronal ACh might be involved in
CBF regulation. First of all, ACh is a well known regulator of CBF in mammalian
ciliated bronchial epithelial cells via M3 muscarinic receptor (Salathe et al., 1997),
though there is no cholinergic innervation in the surface epithelium (Partanen et al.,
1982). Furthermore, the subcellular distribution of ChAT in airway ciliated cells
characterized by an intense immunoreactivity close to the basal bodies of cilia (Racke &
Matthiesen, 2004) also suggests a functional relationship between non-neuronal ACh
and CBF regulation. The immunolocalization of OCTs and CHT in the apical
membrane of ciliated cells also supports this hypothesis (Lips et al., 2005). In addition
to bronchial epithelial cells, migrating immune cells in the airways also synthesize ACh
(Wessler & Kirkpatrick, 2001). Whether ACh released by these cells is involved in CBF
regulation remains to be answered.
18
1.3. Intracellular signaling of ciliary beating: role of cAMP and Ca2+
External stimuli affecting ciliary beating in HAECs are transduced mainly by two
intracellular second messengers, cAMP and intracellular calcium.
1.3.1. cAMP
Intracellular cAMP plays a crucial role in the regulation of CBF. Cytoplasmic
cAMP levels have been modulated in vitro by β2-adrenergic agonists that stimulate
transmembrane adenylyl cyclase (tmAC), forskolin that directly activates tmAC, and
membrane permeable cAMP analogues (e.g., Verdugo et al., 1980; Sanderson &
Dirksen, 1989; Tamaoki et al., 1989; Di Benedetto et al., 1991b; Lansley et al., 1992;
Wyatt et al., 1998). Increasing intracellular cAMP has been shown to increase human,
bovine, ovine, and rabbit CBF, and this increase was blockable by a broad specificity
protein kinase inhibitor implicating cAMP-dependent protein kinase (PKA) (Yang et
al., 1996; Wyatt et al., 1998; Salathe et al., 2000b; Frohock et al., 2002). The molecular
mechanism by which PKA increases mammalian CBF is likely analogous to the
stimulation of ciliary activity by cAMP in Paramecium. There, Hamasaki et al. (1989)
showed that PKA phosphorylated specific axonemal targets both in vitro and in
permeabilized cells. One with an apparent molecular weight of 29 kDa was extractable
by procedures used for the isolation of outer arm dynein and was identified to be a
dynein light chain (Hamasaki et al., 1991). The phosphorylation of this light chain
increases the velocity of microtubule gliding across dynein-coated surfaces in vitro and
the swimming speed of Paramecium in vivo (Hamasaki et al., 1991). In mammalian
respiratory cilia, axonemal PKA targets with similar molecular weights have been
identified by virtue of their cAMP-dependent phosphorylation (Salathe et al., 1993;
Sisson et al., 2000; Kultgen et al., 2002) and, in an ovine study, the target was found on
outer dynein arms (Salathe et al., 2000a). Since these dynein arms are responsible for
frequency regulation (Brokaw & Kamiya, 1987), this is the correct place for
phosphorylation targets to influence CBF. Experiments using isolated cilia also revealed
that PKA must be localized to cilia (Salathe et al., 1993; Kultgen et al., 2002), a fact
supported by the presence of an anti-PKA immunopositive protein in bovine axonemes
19
(Sisson et al., 2000) and a specific A-kinase anchoring protein (AKAP) in human
airway cilia (Kultgen et al., 2002).
1.3.2. Calcium
The mechanism by which CBF is adjusted by the intracellular calcium
concentration ([Ca2+]i) seems to differ between unicellular organisms and mammals. In
Paramecium, rising [Ca2+]i slows CBF to the point where the beat direction is reversed
(Naito & Kaneko, 1972). Mammalian cilia never reverse direction and [Ca2+]i rises
increase CBF (Verdugo, 1980; Girard & Kennedy, 1986; Sanderson & Dirksen, 1989;
Villalon et al., 1989; Sanderson et al., 1990; Di Benedetto et al., 1991a; Lansley et al.,
1992; Salathe & Bookman, 1995) whereas [Ca2+]i decreases lower CBF (Salathe &
Bookman, 1995). Recent evidence suggests that Ca2+ acts directly to change CBF, and
the Ca2+-binding protein is probably an integral part of the axonemal machinery
(Salathe & Bookman, 1999).
1.3.3. Interplay between cAMP and [Ca2+]i
The “classical” way to achieve intracellular cAMP production in HAECs is to
stimulate β-adrenergic receptors. β-adrenergic agonists augment CBF in airway
epithelial cells through a signaling cascade involving β2-adrenergic receptors, the α-
subunit of an adenylyl cyclase stimulatory G-protein (GS) to stimulate tmAC, cAMP,
PKA and the phosphorylation of a ciliary target protein. β3-adrenergic receptors might
also be involved but the data are conflicting (Tamaoki et al., 1993; Thomas & Liggett,
1993; Kelsen et al., 1995; Salathe, 2002). Nevertheless, a more complex signaling
pathway has also been observed in rabbit and ovine ciliated tracheal cells (Lansley et
al., 1992; Frohock et al., 2002; Zhang et al., 2005), where a calcium-coupled
acceleration of CBF, blockable by the inhibition of PKA, was also observed (left side of
the panel in Figure 1-2) (Frohock et al., 2002).
Conversely, cytoplasmic Ca2+ transients may stimulate cAMP production. Short-
term purinergic receptor stimulation of HAECs by ATP results in a transient increase of
[Ca2+]i through calcium-release from internal stores, which, in turn leads to a calcium-
20
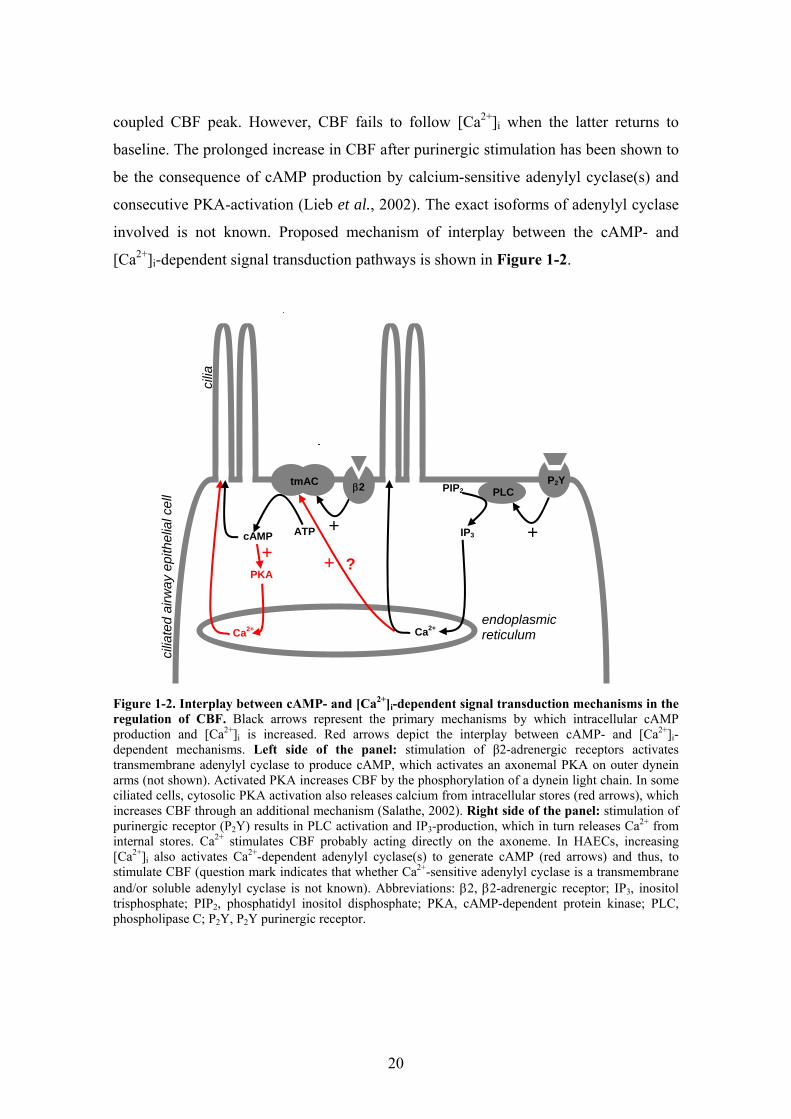
coupled CBF peak. However, CBF fails to follow [Ca2+]i when the latter returns to
baseline. The prolonged increase in CBF after purinergic stimulation has been shown to
be the consequence of cAMP production by calcium-sensitive adenylyl cyclase(s) and
consecutive PKA-activation (Lieb et al., 2002). The exact isoforms of adenylyl cyclase
involved is not known. Proposed mechanism of interplay between the cAMP- and
[Ca2+]i-dependent signal transduction pathways is shown in Figure 1-2.
Figure 1-2. Interplay between cAMP- and [Ca2+]i-dependent signal transduction mechanisms in the regulation of CBF. Black arrows represent the primary mechanisms by which intracellular cAMP production and [Ca2+]i is increased. Red arrows depict the interplay between cAMP- and [Ca2+]i-dependent mechanisms. Left side of the panel: stimulation of β2-adrenergic receptors activates transmembrane adenylyl cyclase to produce cAMP, which activates an axonemal PKA on outer dynein arms (not shown). Activated PKA increases CBF by the phosphorylation of a dynein light chain. In some ciliated cells, cytosolic PKA activation also releases calcium from intracellular stores (red arrows), which increases CBF through an additional mechanism (Salathe, 2002). Right side of the panel: stimulation of purinergic receptor (P2Y) results in PLC activation and IP3-production, which in turn releases Ca2+ from internal stores. Ca2+ stimulates CBF probably acting directly on the axoneme. In HAECs, increasing [Ca2+]i also activates Ca2+-dependent adenylyl cyclase(s) to generate cAMP (red arrows) and thus, to stimulate CBF (question mark indicates that whether Ca2+-sensitive adenylyl cyclase is a transmembrane and/or soluble adenylyl cyclase is not known). Abbreviations: β2, β2-adrenergic receptor; IP3, inositol trisphosphate; PIP2, phosphatidyl inositol disphosphate; PKA, cAMP-dependent protein kinase; PLC, phospholipase C; P2Y, P2Y purinergic receptor.
+ATP cAMP
PKA
Ca2+
P2Y PLC
tmAC β2
IP3 +
PIP2
endoplasmic reticulum
cilia
+
Ca2+
?+
cilia
ted
airw
ay e
pith
elia
l cel
l

21
1.3.4. Synergism between cAMP and [Ca2+]i
Besides the interplay of the two second messengers described above, a
fundamental synergistic interrelationship between cytoplasmic cAMP and [Ca2+]i has
also been demonstrated in a recent study (Ma et al., 2002). In these experiments,
cytoplasmic fluid of patch-clamped rabbit ciliated tracheal cells was replaced by the
pipette solution and thus, was directly controlled. These experiments showed that
spontaneous beating requires only MgATP, whereas stimulation of ciliary motility
requires both Ca2+ and cyclic nucleotides, in addition to MgATP: in the absence of
cytoplasmic cAMP, [Ca2+]i rises alone do not augment CBF and, on the other hand, in
the absence of cytoplasmic Ca2+, cAMP exerts only a slight ciliostimulatory effect
compared to that in the presence of cytoplasmic Ca2+. While the physiological [Ca2+]i
seems to be sufficient for synergistic augmentation of cAMP’s effect on CBF, little is
known about the regulation of baseline cAMP production in the axoneme, a
permissive factor necessary for CBF stimulation by [Ca2+]i transients.
1.3.5. Soluble adenylyl cyclase (sAC): a unique source of cAMP
1.3.5.1 Enzymatic characteristics and cellular distribution of sAC
Transmembrane adenylyl cyclase (tmAC), the commonly found adenylyl cyclase
in mammalian cells is sensitive to G-protein and Mg2+, can be activated by forskolin
and has a transmembrane domain. Another, distinct adenylyl cyclase activity was
described in testis (Braun & Dods, 1975; Braun et al., 1977; Neer, 1978) and called
soluble adenylyl cyclase (sAC). sAC differs from tmAC enzymatically by its 10-fold
lower affinity for substrate (Neer, 1978) and its insensitivity to G-protein activation or
forskolin (Buck et al., 1999). Rat testicular (Buck et al., 1999) and human sAC (Geng et
al., 2005) was only recently purified and cloned. Surprisingly, sAC is closely related to
cyanobacterial adenylyl cyclases but not to tmAC, possibly explaining the over 20-year
period from enzymatic characterization to cloning. Mammalian sAC is directly
activated by HCO3- in a pH-independent manner (Chen et al., 2000) and by Ca2+
(Jaiswal & Conti, 2003; Litvin et al., 2003). HCO3- stimulates sAC activity by
22
increasing its Vmax and relieving substrate inhibition, while Ca2+ decreases the enzyme’s
Km for its substrate, ATP-Mg2+ (Litvin et al., 2003).
In the C-terminal portion of sAC, a region not required for enzymatic activity, a
potential leucine zipper or coiled–coiled interaction domain of unknown significance
can be found. With the recent documentation of sAC’s presence within specific
microdomains of many cells (Zippin et al., 2003), this region could serve as a protein–
protein interaction domain, possibly tethering sAC to the cytoskeleton at these specific
locations and in close contact to its major effector PKA, anchored to the cytoskeleton by
AKAPs. Such microdomains where sAC can be found include mitochondria, centrioles,
mitotic spindles, mid-bodies, and nuclei, all of which contain cAMP targets (Zippin et
al., 2003).
These data suggest that cAMP signaling plays a fundamental role in many
biological systems and make a good case that cilia, or structures close to cilia such as
basal bodies, contain sAC as well (already shown to be present in centrioles) (Zippin et
al., 2003). Sperm motility and hyperactivation has long been known to require HCO3-
and cAMP; the process has recently been shown to depend on sAC activity (Esposito et
al., 2004; Luconi et al., 2005).
Whether sAC is expressed in ciliated HAECs is not known. Since airway cilia
and sperm flagella share both structural and functional similarities and the beating
of cilia and flagella are regulated by similar mechanisms at least with respect to
cAMP, it is possible that sAC also plays a role in regulating airway ciliary beating,
perhaps by maintaining a certain cAMP level in cilia necessary for Ca2+-related CBF
actions (as mentioned in paragraph 1.3.4). One objective of these studies was to test
the hypothesis that sAC is expressed in ciliated HAECs and co-localized to the cilia.
1.3.5.2 Cytosolic ions: role of HCO3- and H+ in ciliary activity
Intracellular bicarbonate concentration ([HCO3-]i), the regulator of sAC, is one of
the most important regulators of pHi as well. Therefore, when HCO3--related CBF
changes are being investigated, it is necessary to identify whether CBF changes are
caused by cAMP production (via sAC activation) or by pHi-alterations (independently
of sAC). However, it has not been clarified how pHi itself influences CBF in HAECs.

23
The few papers investigated the effect of extracellular pH changes (without measuring
pHi) reported no significant effect on CBF within a certain pH-range (Ingels et al.,
1991; Clary-Meinesz et al., 1998b). CBF, for example, was not significantly modified
when extracellular pH was varied between 7.5 and 10.5. Reversible and significantly
lower frequencies were observed below pH 7.0 for bronchi and below pH 5.0 for
bronchioles. Extreme pH values (> 11.0, < 3.0) caused ciliostasis within a few minutes
(Clary-Meinesz et al., 1998a). Similar results were found when exposing cell cultures to
SO2 making the bathing solutions extremely acid (Kienast et al., 1994). In addition,
although controversial, one study showed that human spermatozoa lacking outer dynein
arms, in contrast to normal spermatozoa, failed to show higher beat frequency during
mild alkalization, suggesting that outer dynein arms might be involved in the response
to changing pH, maybe independent of HCO3- (Keskes et al., 1998b). Thus, there is
some evidence that outer dynein arm activity, the ciliary frequency-sensitive location
(Brokaw & Kamiya, 1987), may be directly sensitive to pH. The kinase/phosphatase
system is also a potential target of pHi changes. The catalytic efficiency of PKA is
optimal at near neutral pH and is inhibited at acidic pH (Cox & Taylor, 1995); in
addition, acidic pH not only inhibits PKA but activates phosphatase to de-
phosphorylation PKA targets and vice versa (Reddy et al., 1998b).
Considering that no publication had ever reported the relationship of pHi to
CBF, these studies also aimed to clarify this issue.
1.4. : Regulation of catecholamine concentration at adrenergic
receptor site: role of catecholamine transporters
Adrenergic neurotransmitters and hormones have powerful physiologic effects,
therefore their concentration at the adrenergic synaptic cleft and in the bloodstream is
strictly regulated. Since catecholamines can be metabolized only intracellularly (the
metabolizing enzymes, catecholamine-O-methyltransferase (COMT) and monoamine
oxidase (MAO), reside intracellularly), and, as organic cations, cannot pass the
plasmamembrane freely, their inactivation is determined mainly by cellular uptake
processes via specialized transporters (Koepsell et al., 2003; Ciarimboli & Schlatter,
24
2005). The diverse group of these transport proteins can be divided into neuronal and
extraneuronal catecholamine transporters.
Neuronal uptake of norepinephrine (NE), also referred to as uptake-1 or reuptake,
takes place through an oligospecific catecholamine plasma membrane transporter, the
norepinephrine transporter (NET). Besides being expressed in neuronal tissue and
neuroendocrine cells of the adrenal medulla, NET is also present in some extraneuronal
tissue like placenta (Bottalico et al., 2004) and pulmonary capillary endothelial cells,
where its main function is to clear catecholamines from the circulation (Catravas &
Gillis, 1983; Bryan-Lluka et al., 1992; Westwood et al., 1996; Eisenhofer, 2001;
Koepsell et al., 2003).
Extraneuronal catecholamine uptake is mediated by the polyspecific electrogenic
organic cation transporters (OCT). Three isoforms of OCTs have been identified in
mammals including man: OCT-1 (Grundemann et al., 1994; Gorboulev et al., 1997),
OCT-2 (Okuda et al., 1996; Gorboulev et al., 1997) and the ‘classic’ uptake-2, the
corticosterone-sensitive extraneuronal monoamine transporter (EMT, also referred to as
OCT-3) (Grundemann et al., 1998; Kekuda et al., 1998; Verhaagh et al., 1999). The
different OCT isoforms have different organ distribution that may reflect their
specialized roles. In man, OCT-1 appears to be confined to the liver and intestine, OCT-
2 is mainly expressed in the kidney but also detectable in human placenta and in
cerebral neurons, whereas the classic EMT has a broad tissue distribution being
expressed in skeletal muscle, liver, placenta, kidney, heart, lung and brain (Gorboulev et
al., 1997; Eisenhofer, 2001; Koepsell et al., 2003). Most recently, all the three OCT
isoforms have been identified in human airway epithelium (Lips et al., 2005) where two
of them, OCT-1 and OCT-2 , seem to act also as ACh transporters, participating in the
local non-neuronal cholinergic system (see above in paragraph 1.2.3.2).
The role of catecholamine transporters in the inactivation of circulating
catecholamines and terminating the activation of postsynaptic receptors in the
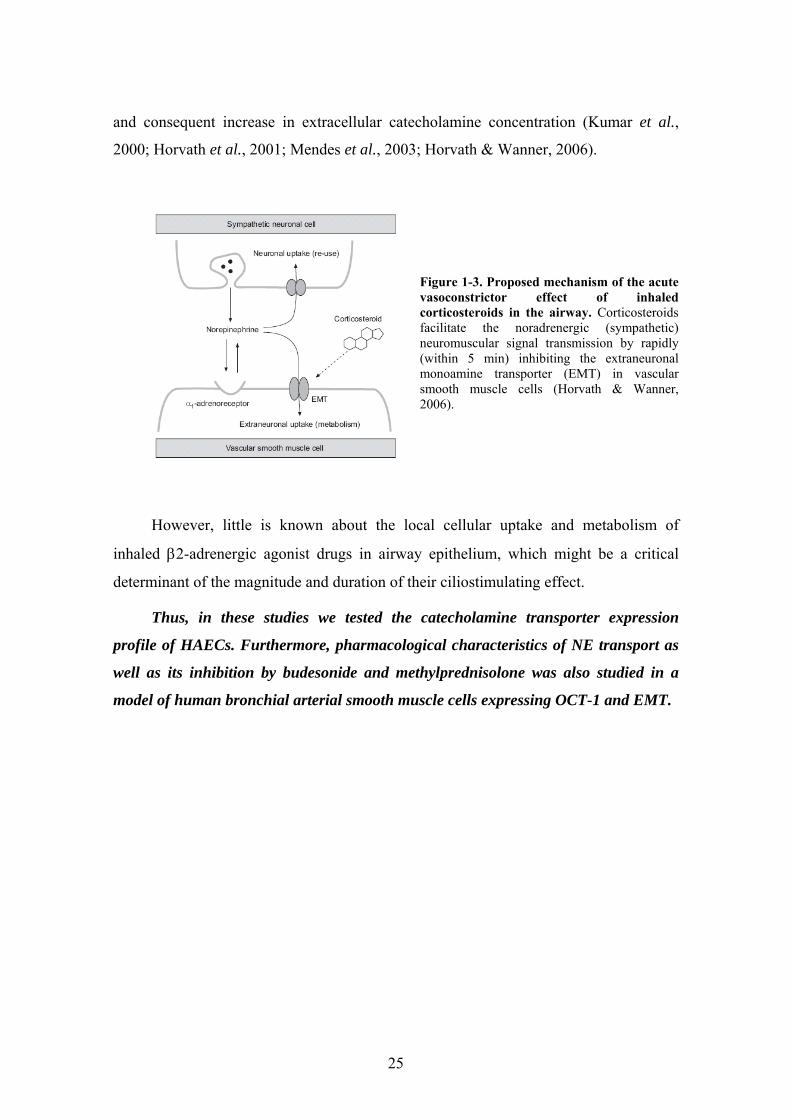
adrenergic synaptic cleft has been widely investigated (Eisenhofer, 2001). For example,
Figure 1-3 demonstrates the mechanism of bronchial arterial vasoconstriction resulting
from the inhibition of extraneuronal catecholamine uptake by glucocorticosteroids (GS)
25
and consequent increase in extracellular catecholamine concentration (Kumar et al.,
2000; Horvath et al., 2001; Mendes et al., 2003; Horvath & Wanner, 2006).
Figure 1-3. Proposed mechanism of the acute vasoconstrictor effect of inhaled corticosteroids in the airway. Corticosteroids facilitate the noradrenergic (sympathetic) neuromuscular signal transmission by rapidly (within 5 min) inhibiting the extraneuronal monoamine transporter (EMT) in vascular smooth muscle cells (Horvath & Wanner, 2006).
However, little is known about the local cellular uptake and metabolism of
inhaled β2-adrenergic agonist drugs in airway epithelium, which might be a critical
determinant of the magnitude and duration of their ciliostimulating effect.
Thus, in these studies we tested the catecholamine transporter expression
profile of HAECs. Furthermore, pharmacological characteristics of NE transport as
well as its inhibition by budesonide and methylprednisolone was also studied in a
model of human bronchial arterial smooth muscle cells expressing OCT-1 and EMT.

26
2. AIMS
1. sAC is a recently cloned adenylyl cyclase exhibiting completely different
structural and functional features than tmACs, the only known adenylyl cyclases in
bronchial epithelial cells so far. In contrast to tmACs, sAC is insensitive to G-protein
activation, but can be stimulated by HCO3-, independently of pH. Considering that
[HCO3-]i and pHi strictly correlate, and neither has ever been tested for ciliary effects,
we aimed to clarify how isolated pHi-changes influence CBF, a key issue for further
investigations of [HCO3-]i mediated CBF-effects. For this purpose, we performed
simultaneous CBF and pHi measurements on cultured HAECs.
2. To analyze the signaling mechanism by which pHi regulates CBF, we used
specific inhibitors of cAMP- and Ca2+-dependent signaling pathways and also measured
[Ca2+]i. Furthermore, we measured CBF on basolaterally permeabilized cells under the
direct control of pHi.
3. We also tested whether sAC mRNA and protein is expressed in HAECs. In
order to determine the subcellular localization of sAC, we performed
immunofluorescence studies on human tissue sections and cultured HAECs. Our
preliminary physiological experiments aimed to investigate sAC’s function in HAECs.
4. Another set of experiments targeted catecholamine transporter proteins, which
mediate cellular catecholamine uptake. Inhibition of cellular catecholamine uptake by
GSs has been shown to enhance adrenergic effects in vascular smooth muscle cells by
increasing extracellular catecholamine concentration. To test the hypothesis that GSs
have a similar effect on HAECs and thus, could enhance ciliostimulatory effect of
adrenergic agonists, we investigated the expression profile of HAECs for catecholamine
transporter mRNAs.
5. Finally we examined the pharmacologic characteristics of cellular
catecholamine uptake, including the effect of GSs on it as well as the mechanism by
which GSs inhibit cellular catecholamine uptake.
27
3. MATERIALS AND METHODS
3.1. Chemicals
LHC basal medium, Trace elements 100x, Stock 4 100x, and Stock 11 100x were
purchased from Biosource International (Rockville, MD, USA); Ham's nutrient F-12
and gentamicin from Gibco BRL Laboratories (Grand Island, NY, USA); the
acetoxymethyl ester form of the pH-sensitive dye 2’7’-bis-(2-carboxyethyl)-5-(and-6)-
carboxyfluorescein (BCECF) and fura-2 from Molecular Probes (Eugene, OR, USA);
nigericin from Molecular Probes (Eugene, OR, USA) and Calbiochem (La Jolla, CA,
USA); thapsigargin from Calbiochem (La Jolla, CA, USA); cyclosporin A from Fluka
(Buchs, Switzerland); and okadaic acid from Research Biochemicals International
(Natick, MA, USA). All other reagents were from Sigma Chemicals (St. Louis, MO,
USA) unless otherwise noted.
3.2. Solutions
Table 3-1 lists the compositions of solutions used for pHi experiments. The free
Ca2+ and Mg2+ concentration of EGTA- and ATP-containing solutions was estimated
using WebMAXC Standard software by Chris Patton from Stanford University,
available at http://www.stanford.edu/~cpatton/webmaxcS.html (constants used:
CMC1002.TCM).

28
Table 3-1: Composition of solutions. All concentrations are given in mM unless otherwise indicated. *Approximate free [Mg2+] after chelation by EGTA is 0.9 mM; †approximate free [Ca2+] after chelation by ATP is 0.1 mM; ‡pH was adjusted with concentrated NaOH solution unless otherwise indicated. CPK, creatine phosphokinase; CrP, creatine phosphate disodium salt.
3.3. Cell isolation and culture techniques
Human tissue was obtained from organ donors whose lungs were rejected for
transplant through the Life Alliance Organ Recovery Agency of the University of
Miami. Institutional Review Board-approved consents for use of these tissues for
research were obtained by the Life Alliance Organ Recovery Agency.
3.3.1. Preparation of submerged tracheal epithelial cell cultures
Primary cultures of tracheal epithelial cells were prepared as previously described
(Salathe & Bookman, 1995), with minor modifications. The mucosa from freshly
obtained tracheas was dissected from the underlying cartilage under sterile conditions
and incubated in 0.05 % protease (Sigma, Type 14) in Dulbecco’s modified Eagle’s
medium (DMEM) overnight at 4°C. After protease treatment, epithelial cells were

29
released by vigorous shaking, harvested by centrifugation and then plated on collagen-
coated glass coverslips (human placental collagen, Sigma) at a density of 1.5 – 6 x 10⁴
cells·cm-2. The culture medium consisted of 47.5% DMEM, 47.5% Ham's F-12 nutrient,
5% fetal bovine serum (FBS) + penicillin (10 U/ml) and streptomycin (10 µg/ml) for the
first two days after plating. Then, it was changed to growth factor medium (50 %
DMEM, 50 % Ham's F-12 medium supplemented with insulin (10 µg·ml-1), transferrin
(5 µg·ml-1), hydrocortisone (0.36 µg·ml-1), triiodothyronine (20 ng·ml-1), endothelial cell
growth supplement (7.5 µg·ml-1), penicillin (10 U·ml-1), and streptomycin (10 µg·ml-1).
The medium was exchanged every other day. Cells from these cultures were used for
measurements within 6 days after plating.
3.3.2. Preparation of air liquid interface cultures of tracheal epithelium
Human air-liquid interface (ALI) cultures were prepared according to published
methods (Adler et al., 1990; Bernacki et al., 1999; Nlend et al., 2002).
Tracheobronchial epithelial cells isolated as above were first plated on collagen-coated
plastic dishes and grown to confluence in bronchial epithelial growth medium (BEGM),
yielding undifferentiated airway epithelial cells. BEGM contained 50% DMEM and
50% LHC basal medium supplemented with insulin (5 µg·ml-1), hydrocortisone (72
ng·ml-1), epidermal growth factor (31.3 ng·ml-1), triiodothyronine (6.5 ng·ml-1),
transferrin (10 µg·ml-1), epinephrine (0.6 µg·ml-1), phosphorylethanolamine (70 ng·ml-
1), ethanolamine (31 ng·ml-1), bovine pituitary extract (1% vol/vol), bovine serum
albumin (0.5 mg·ml-1), CaCl2 (0.08 mM), trace elements 100x (1% vol/vol), stock 4
100x (1% vol/vol), stock 11 100x (1% vol/vol), retinoic acid (15 ng·ml-1), penicillin
(100 U·ml-1), streptomycin (100 µg·ml-1), gentamicin (10 µg·ml-1) and amphotericin
(0.25 µg·ml-1). Cells were passaged after enzyme dissociation with trypsin onto 24 mm
diameter, 3 µm pore-sized Transwell collagen-coated inserts (Corning Costar
Corporation, Cambridge, MA, USA). The ALI medium used for both the apical and
basolateral side of the cells was the same as BEGM except for the concentration of
epidermal growth factor (0.63 ng·ml-1), penicillin (10 U·ml-1), streptomycin (10 µg·ml-1)
and the absence of gentamicin and amphotericin. Cells were grown in an incubator at 37
°C in ambient air supplemented with 5 % CO2. The medium was exchanged every other

30
day. The apical medium was removed as soon as cells reached confluence (usually after
1 week). The ALI cultures were used for measurements after the cells fully re-
differentiated (about 4-8 weeks, Figure 3-1).
Figure 3-1. Human cells at ALI. Human cells grown and differentiated for 21 days at the ALI were fixed with formaldehyde/glutaraldehyde, dehydrated, and embedded in Spurr's resin. Thick section stained with toluidine blue. Differentiated, pseudostratified epithelium is seen with mainly ciliated and a few goblet cells. The support filter is visible below (bar = 10 µm).
3.3.3. Human bronchial arterial smooth muscle cell isolation
Major branches of bronchial arteries (approximately 0.5 to 1-mm diameter) from
the main bronchi of freshly obtained lungs were excised using a dissecting
stereomicroscope under sterile conditions. To confirm that the dissected structure was in
fact an artery, a small portion of each vessel was fixed in 4% formaldehyde in
phosphate-buffered saline (PBS), processed according to regular procedures for
histology, and stained with hematoxylin and eosin. The rest of the vessel was dissected
from adhering fat and connective tissue and opened longitudinally. Endothelial cells
were removed by scraping the inside surface. From this muscle preparation, strips were
cut transversely and immediately used for smooth muscle cell (SMC) isolation or RNA
extraction.
SMC isolation from human bronchial arterial smooth muscle was carried out
based on the method of Clapp and Gurney (Clapp & Gurney, 1991) with some
modifications. For isolation of SMCs, muscle strips were transferred to a constantly
oxygenated incubation solution (137 mM NaCl, 4.17 mM NaHCO3, 0.34 mM
NaH2PO4, 5.37 mM KCl, 0.44 mM KH2PO4, 7 mM glucose, 0.15 mM CaCl2, 2 mM
MgCl2, 10 mM HEPES, 0.02% bovine serum albumin (BSA), pH 7.4) containing 1.5
mg/ml papain and 2 mM DTT, and were incubated at 37°C for 30 min with shaking.
Then, the muscle strips were transferred to a constantly oxygenated incubation solution
containing 1.5 mg/ml collagenase type F and 1 mg/ml hyaluronidase type I-S, and were
incubated at 37°C an additional 20 min with shaking.

31
At the end of the digestion period, individual SMCs were obtained by gentle
titration followed by filtration through a 500 μm pore size sieve. Finally, cells were
collected by centrifugation at 1000 x g for 3 min and resuspended in fresh (enzyme-
free) incubation solution. The viability of freshly isolated SMCs after enzymatic
dispersion was always > 95% as tested by trypan blue exclusion. The SMC suspension
was deposited onto human placental collagen (type VI)-coated glass coverslips. Cells
were allowed to settle for 60 min at 37°C before NE uptake experiments.
3.3.4. Preparation of primary cultures of bronchial arterial SMCs
For immunochemical detection of a corticosterone binding site, bronchial arterial
SMCs were maintained for 3 days in DMEM supplemented with 10% FBS, 100 U/ml
penicillin, and 100 μg/ml streptomycin within a humidified atmosphere containing 5%
CO2 at 37°C. This was necessary since acutely dissociated cells did not sufficiently
adhere to the coverslips and were lost during the immunocytochemical procedure.
3.3.5. Caki-1 cell culture
To provide a positive control sample for RT-PCR optimization of EMT mRNA,
the human renal carcinoma-derived Caki-1 cell line was purchased from the American
Type Culture Collection (ATCC; Manassas, VA, USA). Caki-1 cells were cultured in
McCoy’s 5A medium (ATCC) supplemented with 10% FBS, 100 U/ml penicillin, and
100 μg/ml streptomycin within a humidified atmosphere containing 5% CO2 at 37°C.
Media were changed in every other day.
3.4. Selective permeabilization of the basolateral membrane of cells
grown at the ALI
The basolateral surface of the ALI culture of human bronchial epithelial cells was
exposed to the pore-forming agent Staphylococcus aureus alpha-toxin at 10,000 U·ml-1
concentration dissolved in solution 8 (Table 3-1) for 30 min at room temperature.

32
Solutions 8 and 9 were composed to reflect physiological intracellular K+, Na+ and Cl-
concentrations, however, we had to use 100 µM Ca2+ to avoid cell detachment (similar
to the experience of others (Ostedgaard et al., 1992)). For another set of experiments,
0.05% saponin was used basolaterally, as described in Results.
3.5. Measurement of CBF
Cells grown on coverslips in submerged culture were mounted at room
temperature onto the stage of a Nikon Eclipse E600FN (Nikon, Melville, NY, USA)
upright water-immersion lens microscope in an open (Warner Instrument RC-25F with
a working volume of 150 µl) or closed (Warner Instrument RC-21BR, working volume
of 260 µl) perfusion chamber. They were perfused constantly. Ciliated cells were
imaged with infrared differential interference contrast (DIC) optics with an optical gain
of 600x. For online CBF measurements, the light path was directed to a CCD video
camera (XC-7500 Sony) and a box of 3 x 3 pixels from the live, digitized, contrast-
enhanced video image was selected (where one pixel samples an area of 180 nm x 180
nm). The magnitude spectra from a fast Fourier transform (FFT) of each of the pixel's
intensity signals were computed online and displayed on the monitor for immediate
adjustments. The intensity signals were recorded and later used for analysis according to
published methods (Salathe & Bookman, 1999) using a sliding FFT window approach
(128 frames per FFT, sliding the FFT window through the data set by 100 frames at a
time), providing a frequency resolution of at least 0.23 Hz and a time resolution of ~3 s.
The individual FFT magnitude spectra were peak extracted for graphing (Salathe &
Bookman, 1999).
In order to measure CBF in cells grown at the air-liquid interface (but imaged
with the apical surface 'submerged'), we used a holding chamber for the Transwell
membranes allowing selective perfusion of the apical and basolateral sides of the cells.
Data acquisition and processing was identical to the one described for submerged
cultures.

33
3.6. Measurement of pHi
3.6.1. Fluorometric pHi measurements
Coverslips without a confluent monolayer (usually 1 day after plating) were
preferred for fluorescent measurement of pHi, because these ciliated cells could be more
easily calibrated for pHi using nigericin (see below). Coverslips were rinsed in solution
1 (Table 3-1) and loaded with 2.5 µM BCECF acetoxymethyl ester in solution 1 at 37˚C
for 15 - 30 min and again rinsed three times. For fluorescent measurements, a Lambda
DG4 excitation system (Sutter, Novato, CA, USA) was used with 10 nm wide excitation
filters centered on 495 and 440 nm (Chroma Technology Corp., Brattleboro, VT, USA).
'Ratio-tool' software from Isee Imaging (Raleigh, NC, USA) controlled the output of the
Lambda DG4. Ratiometric pH estimates were made by capturing the light (535 nm)
emitted from the cells for 200 ms through a 60x water immersion objective (Nikon Inc.)
and directing it to a cooled CCD camera (CoolSnap Hq, Photometrics, Tucson, AZ,
USA). Individual ciliated cells were identified as regions of interest (ROIs) and the
BCECF ratio of emission intensity after excitation at 495 and 440 nm was computed
within each ROI every 10 – 60 sec on a pixel-by-pixel basis (after background
fluorescence subtraction).
3.6.2. Calibration of pHi measurements
3.6.2.1 Preparation of the pH calibration curve
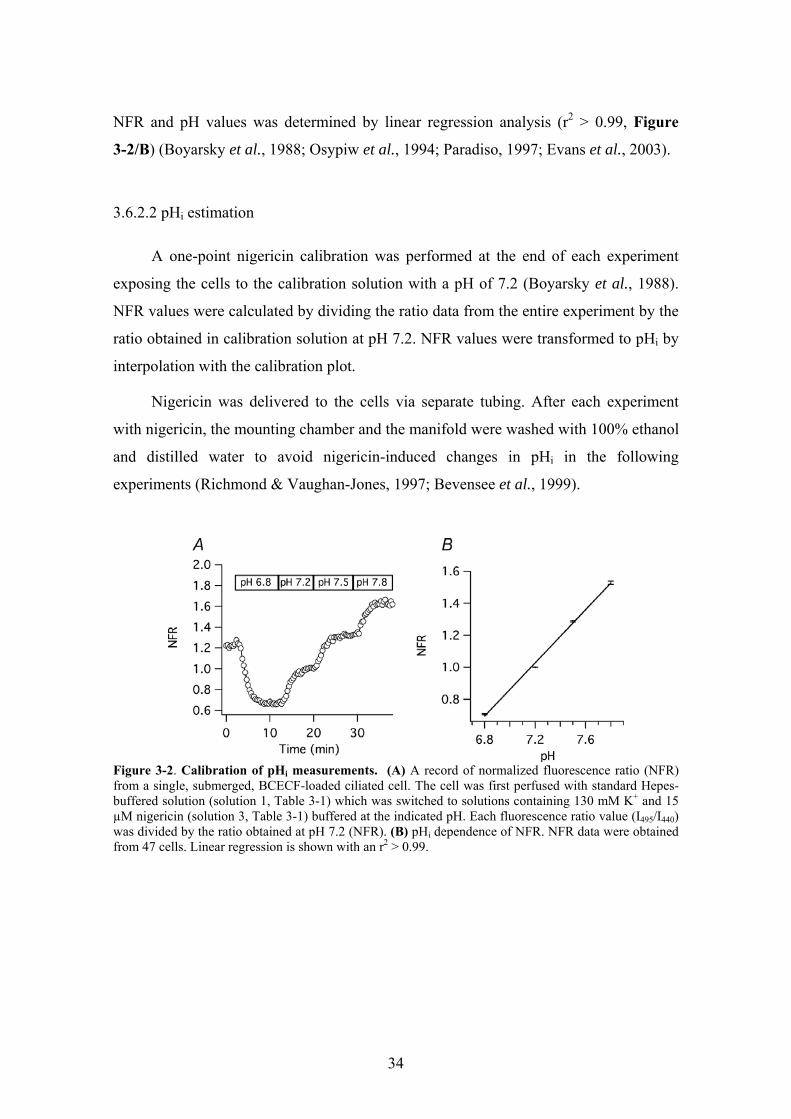
Nigericin was used to calibrate pHi measurements (Thomas et al., 1979). BCECF-
loaded cells were perfused with calibration solutions containing 15 µM nigericin and
130 mM KCl at pH 6.8, 7.2, 7.5, and 7.8, respectively (solutions 3, Table 3-1) while the
fluorescence ratio was measured. The ratio data were normalized to the ratio at pH 7.2
(normalized fluorescence ratio: NFR; Figure 3-2/A). Each ratio value was accepted
when the ratio reached a steady state level at a given calibration pH. Then, the
calibration curve was constructed by plotting the average NFR values from 47 cells (5
different organ donors) against the corresponding pH values. The correlation between
34
NFR and pH values was determined by linear regression analysis (r2 > 0.99, Figure
3-2/B) (Boyarsky et al., 1988; Osypiw et al., 1994; Paradiso, 1997; Evans et al., 2003).
3.6.2.2 pHi estimation
A one-point nigericin calibration was performed at the end of each experiment
exposing the cells to the calibration solution with a pH of 7.2 (Boyarsky et al., 1988).
NFR values were calculated by dividing the ratio data from the entire experiment by the
ratio obtained in calibration solution at pH 7.2. NFR values were transformed to pHi by
interpolation with the calibration plot.
Nigericin was delivered to the cells via separate tubing. After each experiment
with nigericin, the mounting chamber and the manifold were washed with 100% ethanol
and distilled water to avoid nigericin-induced changes in pHi in the following
experiments (Richmond & Vaughan-Jones, 1997; Bevensee et al., 1999).
Figure 3-2. Calibration of pHi measurements. (A) A record of normalized fluorescence ratio (NFR) from a single, submerged, BCECF-loaded ciliated cell. The cell was first perfused with standard Hepes-buffered solution (solution 1, Table 3-1) which was switched to solutions containing 130 mM K+ and 15 µM nigericin (solution 3, Table 3-1) buffered at the indicated pH. Each fluorescence ratio value (I495/I440) was divided by the ratio obtained at pH 7.2 (NFR). (B) pHi dependence of NFR. NFR data were obtained from 47 cells. Linear regression is shown with an r2 > 0.99.

35
3.6.3. Experimental procedures for pHi measurements
Three different methods were used to manipulate pHi: a) ammonium prepulse; b)
removal of CO2 from the extracellular medium; and c) permeabilization of the
basolateral membrane with the pore forming agent alpha-toxin (from Staphylococcus
aureus). For method a), bicarbonate-free solutions were used to avoid interference with
sAC. All coverslips and ALI cultures used in these experiments were washed with
bicarbonate free solution, mounted into an open chamber and exposed to ambient air for
at least 30 min before experiments to remove any remaining bicarbonate and CO2 from
the cells. Measurements in open chambers were performed during continuous perfusion
with the desired solution at a flow rate of 250 µl/min using a Harvard pump. After
changing from one solution to another, flow rate was increased to 1000 µl/min for one
minute to accelerate the full exchange of the bathing solution (NH4Cl prepulse was
applied for 2 minutes at 1000 µl/min). These changes in flow rates did not influence
CBF in control experiments, similar to our earlier findings (Lieb et al., 2002). For
method b), cells were loaded with BCECF in CO2/HCO3--buffered solution at 5%
ambient CO2 and then mounted into a closed chamber with delivery of all solutions via
a closed system. Cells were perfused at a constant flow rate of 1000 µl/min. Finally for
method c), ALI cultures were mounted into an open chamber with separate perfusion
ports for the apical and basolateral side, maintaining perfusion at 500 and 1000 µl/min
for the apical and basolateral side, respectively. Up to four cells per coverslip or ALI-
filter were measured in each experiment.
3.7. Measurement of [Ca2+]i
[Ca2+]i was measured with the same equipment used for pHi. Cells grown on
coverslips were loaded with 5 µM fura-2 acetoxymethyl ester in solution 1 (Table 3-1)
for 60 min at room temperature and were washed 3 times with solution 1. Cells were
excited through 10 nm wide excitation filters centered on 340 and 380 nm (Chroma
Technology Corp., Brattleboro, VT, USA), and the emitted light was captured at 535
nm. Fura-2 ratios were computed every 10-20 s, after background subtraction.
Calibration of the calcium signal was done with in vitro measurements as described

36
(Salathe & Bookman, 1995) according to Grynkiewicz (1985); however, we re-
estimated [Ca2+]i by adjusting fura-2’s Kd with changing pH (Lattanzio & Bartschat,
1991; Browning & Wilkins, 2002) as described below.
3.8. Simultaneous measurement of CBF and pHi or [Ca2+]i
By using a dual-image module and guiding the infrared signal for CBF
measurements to the XC-7500 Sony CCD camera while sending all fluorescence signals
(< 580 nm) to the cooled CCD camera, we were able to measure recordings of CBF and
fluorescence (i.e., pHi or [Ca2+]i) of the same single cell simultaneously.
3.9. mRNA-expression of sAC and catecholamine transporters
3.9.1. RT-PCR
Total RNA was extracted from human airway epithelial cells grown and
redifferentiated at the ALI, cultured Caki-1 cells and freshly isolated bronchial arterial
smooth muscle cells using the RNeasy Protect Mini Kit (Qiagen, Valencia, CA, USA).
Total RNA samples from human testis, brain, liver, and kidney were purchased from
Ambion (Austin, TX, USA). Extracted RNA samples were treated with DNase (DNase I
Amplification Grade; Life Technologies), precipitated with ethanol, and quantified
spectrophotometrically at 260 nm. Good quality of isolated RNA (28S to 18S rRNA
ratio > 1.75) was confirmed using an RNA 6000 LabChip Kit (Agilent Technologies,
Palo Alto, CA) and an Agilent 2100 Bioanalyzer (Agilent Technologies) provided by
the University of Miami DNA Microarray Facility. RNA (1 μg per sample) was used for
first strand cDNA synthesis with Superscript II RT (Life Technologies) using oligo-dT16
primers. For PCR amplification, oligonucleotide primers were designed based on the
published sequences of human sAC (GenBank accession number: NM_018417), NET
(GenBank accession number: NM_001043), OCT-1 (GenBank accession number:
NM_003057), OCT-2 (GenBank accession number: NM_003058), EMT (GenBank
accession number: NM_021977), and GAPDH (GenBank accession number:

37
NM_002046) cDNAs. PCR reactions were performed using Taq DNA polymerase (Life
Technologies). Optimized annealing temperatures and cycle numbers for each primer
pair are shown in Table 3-2.
Table 3-2: Oligonucleotide primers, annealing temperatures (Tm), cycle numbers, and product sizes for RT-PCR amplifications of sAC, catecholqmine transporter and GAPDH mRNAs.
Forward primer Reverse primer mRNA
Sequence Position Sequence Position Tm Cycles Size
sAC ctgagcagttggtggagatcctc 388-410 cagccagtcctatcttgactcgg 630-608 61°C 40 243 bp NET ggccacggtatggattgatgc 961-981 cctcccattgagctgtcaagg 1317-1297 60°C 36 357 bp
OCT-1 ggctggctacaccctaatcacag 759-781 agtccgtgaaccacaggtacatc 1177-1155 60°C 30 419 bp OCT-2 gtacaactggttcacgagctctg 1226-1248 cgccaagattcctaatgaatgtggg 1569-1545 60°C 30 344 bp EMT ctgggtggtccctgagtctcc 882-902 tcccaggcgcatgacaagtcc 1146-1126 61°C 26 265 bp
GAPDH cctgcaccaccaactgcttag 527-547 gcctgcttcaccaccttcttg 869-849 60°C 24 343 bp
RT-PCR products were electrophoresed on ethidium bromide-stained 2% or 3%
SeaKem agarose (BMA, Rockland, ME, USA) gels. Control reactions were performed
in the absence of RT to verify that the amplified products were from mRNA and not
from genomic DNA contamination. In the absence of RT, no PCR products were
observed. To confirm specific amplification, RT-PCR products were purified on a silica
spin columns (QiAquick PCR Purification Kit, Qiagen, Valencia, CA, USA), and
sequenced by the University of Miami DNA Core Laboratory. Sequences were
compared with the published cDNA sequences by PileUp (Wisconsin Package, GCG,
Madison, WI, USA).
3.9.2. Cloning of cDNA fragments of sAC variants
The sAC specific amplification resulted in multiple bands which were gel-purified
and ligated into pGEM-T Easy vector (Promega, Madison, WI, USA). Recombinant
plasmid vectors were introduced into DH5α E. coli (Invitrogen, Carlsbad, CA, USA).
DNA of the transformed cells was purified with Wizard Plus SV Minipreps Purification
System (Promega, Madison, WI, USA), restriction enzyme digested with EcoRI (New
England BioLabs, Ipswich, MA, USA), electrophoresed on 3% NuSieve GTG agarose
38
gel (BMA, Rockland, ME, USA) and sequenced by the University of Miami DNA Core
Laboratory.
3.10. Expression of sAC-protein
3.10.1. Western blotting for sAC
Protein extracts from ALI cultures of HAECs were obtained by lysis at 100 ◦C in
1% sodium dodecyl sulphate (SDS), 10 mM Tris pH 8.5, 0.1 M EDTA, followed by
sonication, and centrifugation 14,000 g, as described elsewhere (Forteza et al., 2005).
Protein extract was sent to the Department of Pharmacology of Joan and Sanford I.
Weill Medical College of Cornell University (New York, NY, USA), where
immunoblotting using sAC-specific monoclonal antibodies was kindly performed by L.
R. Levin and coworkers.
3.10.2. sAC-specific immunohystochemistry and immunocytochemistry
Human tracheal rings were immersed in 4% paraformaldehyde, embedded in
paraffin, cut into 3-µm sections, and processed by indirect immunofluorescence. After
deparaffinization, autofluorescence was reduced by incubating slides in 0.1% sodium
borohydride in PBS. Slides were subjected to antigen retrieval by incubating them in 10
mM citrate buffer (pH 6) for 15 min, were incubated in 0.3% H2O2 to quench
endogenous peroxidase activity and incubated with sAC-specific monoclonal mouse
antibodies (kindly provided by L. R. Levin and J. Buck, Cornell University, New York,
NY, USA) for 18 h at 4 C. Labeling was achieved using a horseradish peroxidase (HRP)
conjugated secondary goat anti-mouse antibody and developed with TSA 546
AlexaFluor (Molecular Probes, Eugene, OR, USA) according to the manufacturers
instructions. For visualizing the axonemes, acetylated anti-tubulin antibody (Molecular
Probes, Eugene, OR, USA) was used. A nonspecific monoclonal antibody served as the
nonimmune control. The emitted light was filtered and recorded with a cooled black and
white CCD camera (Quantix, Photometrics, Tucson, AZ). Fully differentiated human
airway epithelial cells grown at the ALI culture were fixed with 50% methanol/ 50%

39
acetone and underwent the same procedures as the tracheal tissue. Nuclei were
visualized with 4,6-diamidino-2-phenylindole (DAPI, Molecular Probes, Eugene, OR,
USA). Stained ALI cultures were imaged with confocal microscope. All
immunofluorescence pictures were pseudo-colored using Photoshop (Adobe).
3.11. Single-cell, fluorometric NE uptake measurements
3.11.1. NE uptake experiments
For NE uptake studies, human bronchial arterial SMCs were exposed to
incubation solution containing NE with or without different NE transporter inhibitors
(see below) at 37°C. To inhibit the intracellular NE-metabolizing enzymes, 500 μM
pargyline (MAO inhibitor) (Henseling, 1983) and 1 μM Ro-41-0960 (COMT inhibitor)
(Percy et al., 1999) were added into the incubation solution 30 min prior to the NE
uptake experiments. GSs, such as corticosterone, budesonide, and methylprednisolone,
were dissolved in ethanol and freshly diluted into the incubation solution just prior to
use. The final concentration of ethanol was 0.1%, a concentration with no significant
effect on NE uptake measurements as confirmed in control experiments using this
vehicle only.
3.11.2. NE uptake assay
At the end of the incubation period, SMCs were washed with ice-cold incubation
solution. Intracellular NE was visualized using a sucrose-potassium phosphate-
glyoxylic acid (SPG) method described for tissue slices (Torre & Surgeon, 1976; de la
Torre, 1980) and adapted by us for use in isolated vascular SMCs. Briefly, coverslips
with SMCs were washed with SPG solution (0.2 M sucrose, 236 mM KH2PO4, 1%
glyoxylic acid monohydrate, pH 7.4) at room temperature. After 5 min of air-drying, the
specimen was covered with a drop of light mineral oil. Then, the sample was sealed
with a coverslip and put into an oven at 95°C for 2.5 min.

40
To quantify fluorescence, a Nikon Eclipse E600FN microscope (Nikon, Melville,
NY, USA) with a Lambda DG-4 excitation system (Sutter Instruments, Novato, CA,
USA), a cooled CCD camera (Coolsnap HQ; Roper Scientific, Inc., NJ, USA), and Isee
software from ISee Imaging Systems (Raleigh, NC, USA) were used. Cells were
imaged at 600x with differential-interference-contrast (DIC) microscopy and individual
cells were identified as regions of interest. For quantification of the SPG fluorescence
(or intracellular NE concentration) in these cells (or regions of interest), a 10 nm wide
filter centered on 405 nm was used for excitation and the emission measured at > 455
nm using a long pass filter (emission maximum: 480 nm), integrating the signal for 1
second. The cooled CCD camera was always set to a predefined gain, which was held
constant throughout the experiments. SMCs were measured by selecting 5 well-
separated regions on each coverslip (5-10 cells per region).
Each single cell’s mean fluorescence intensity value (Fn), expressed in arbitrary
units, was corrected for background fluorescence by subtracting the mean Fn of SMCs
from the same tissue that had not been exposed to NE. Average NE uptake of each
experimental group was calculated using the mean normalized Fn of all cells. Since we
have shown that the intracellular fluorescence is nearly linear to the intracellular NE
concentration over a wide concentration range (see below), we chose to report here
mainly the fluorescence in arbitrary unit and only convert the values to NE
concentration for the Km determination of NE uptake.
3.12. Immunochemical detection of a plasma membrane binding site
for corticosterone in bronchial arterial SMC
Human bronchial arterial SMCs maintained on collagen-coated coverslips for 3
days were washed three times with PBS and incubated with 1 μM BSA, 1 μM
corticosterone-21-hemisuccinate-BSA, or 1 μM corticosterone-21-hemisuccinate-BSA
plus 100 μM corticosterone for 5 min at 37°C. Then the cells were fixed with 4%
paraformaldehyde buffered with PBS for 30 min at room temperature. Fixed cells were
washed with PBS containing 200 μg/ml goat IgG (blocking buffer) and incubated with
blocking buffer for 60 min at room temperature. After washing with blocking buffer,

41
cells were incubated with rabbit anti-BSA IgG primary antibody (10 μg/ml) (Molecular
Probes, Eugene, OR, USA) for 60 min at room temperature. After washing again with
blocking buffer, the cells were incubated with a tetramethylrhodamine isothiocyanate-
(TRITC) conjugated goat anti-rabbit IgG secondary antibody (20 μg/ml) for 60 min at
room temperature. After washing with PBS and mounting in permanent aqueous
mounting medium (Gel/Mount; Biomedia, Foster City, CA, USA), cells were visualized
on the Nikon Eclipse E600FN microscope described above and TRITC fluorescence
imaged using an appropriate excitation/emission filter set.
3.13. Statistical analysis
Two groups were compared using Student’s unpaired t test, while Tukey-Kramer
honestly significant difference test was used for comparison of more than two groups if
an analysis of variance indicated a significant difference between groups (JMP software,
SAS Institute Inc., Cary, NC, USA). A p < 0.05 was considered to be significant. Data
were expressed as mean ± SEM
Uptake experiments were carried out in triplicate with measurements on 25 to 50
cells each. For time-course analysis of NE uptake, the data were fit with nonlinear
regression methods using the Prism version 3.0a (GraphPad Software Inc., San Diego,
CA, USA) with the following equation: A(t) = kin/kout * (1 – e-kout * t), where A(t) is the
uptake of NE at the time t, kin and kout are the rate constants for inward and outward
transport, respectively, and t is incubation time. The variables for the fit were kin and
kout and, thus, were determined during the fitting procedure. Km was determined with
nonlinear regression fit (Prism) using the following equation: y = (Vmax * X)/(Km + x),
where y is uptake of x amount of NE. Again Vmax was a variable of the fitting procedure.
For IC50 calculations, the data were fit with a multisite inhibition model (Prism) using
the following equation: y = inhibitionmax + (inhibitionmin - inhibitionmax)/(1+10(logIC50 x
Hill slope)), where y is the effect of x amount of the inhibitor.

42
4. RESULTS
4.1. Regulation of human airway ciliary beat frequency by pHi
One of our basic aims was to investigate the expression and function of HCO3--
sensitive adenylyl cyclase, sAC in HAECs. As [HCO3-]i and pHi strictly correlate, first
we targeted to investigate how isolated pHi-changes influence CBF, a key issue for
further investigations of [HCO3-]i mediated CBF-effects.
4.1.1. The effect of changing pHi on CBF during ammonium prepulse
The ammonium prepulse technique was used to achieve a change in pHi of intact
cells without changing the pH of the bathing solution (pHo). Baseline CBF was 7.2 ± 0.2
Hz and baseline pH was 7.49 ± 0.02 (n = 63 cells from 7 different organ donors). When
the ammonium-free standard Hepes solution (solution 1, Table 3-1) was rapidly
switched to one containing 10 mM NH4Cl (10 mM NaCl was replaced by 10 mM
NH4Cl, solution 2, Table 3-1), CBF and pH increased at the same rate, considering the
time resolution of the measurements. CBF reached a maximum of 9.4 ± 0.2 Hz (31 ±
1% above baseline; p < 0.001) within 52 ± 7 s, whereas pH reached a maximum of 7.78
± 0.02 (p < 0.0001 compared to baseline) within 48 ± 6 s. Two minutes after the initial
change to ammonium chloride, the medium was switched back to the standard Hepes
solution. After removing extracellular NH4+, a rapid intracellular acidification took
place and CBF and pH rapidly decreased to 5.8 ± 0.2 Hz (19 ± 2% below original
baseline) and 7.24 ± 0.02, respectively. Figure 4-1/A and B shows two representative,
simultaneous recordings of CBF and pHi during and after ammonium-chloride
exposure. To better visualize the correlation between pHi and CBF, these two
parameters were plotted against each other in Figure 4-1/C-E.
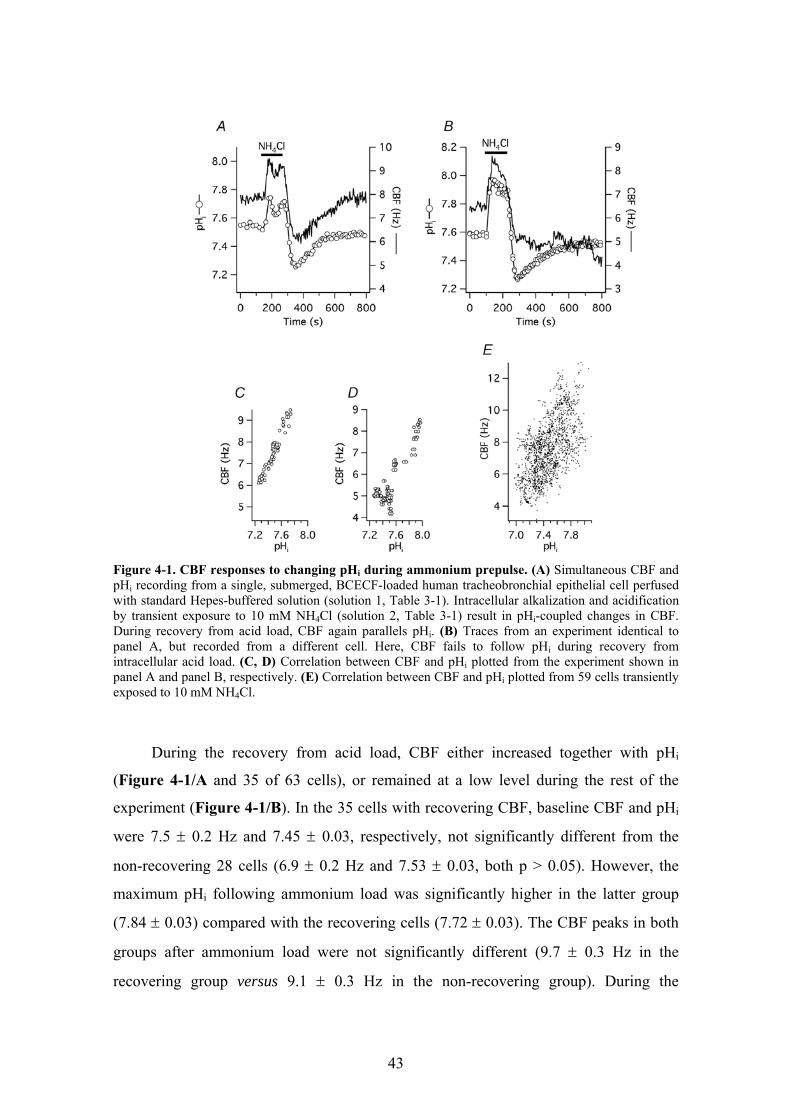
43
Figure 4-1. CBF responses to changing pHi during ammonium prepulse. (A) Simultaneous CBF and pHi recording from a single, submerged, BCECF-loaded human tracheobronchial epithelial cell perfused with standard Hepes-buffered solution (solution 1, Table 3-1). Intracellular alkalization and acidification by transient exposure to 10 mM NH4Cl (solution 2, Table 3-1) result in pHi-coupled changes in CBF. During recovery from acid load, CBF again parallels pHi. (B) Traces from an experiment identical to panel A, but recorded from a different cell. Here, CBF fails to follow pHi during recovery from intracellular acid load. (C, D) Correlation between CBF and pHi plotted from the experiment shown in panel A and panel B, respectively. (E) Correlation between CBF and pHi plotted from 59 cells transiently exposed to 10 mM NH4Cl.
During the recovery from acid load, CBF either increased together with pHi
(Figure 4-1/A and 35 of 63 cells), or remained at a low level during the rest of the
experiment (Figure 4-1/B). In the 35 cells with recovering CBF, baseline CBF and pHi
were 7.5 ± 0.2 Hz and 7.45 ± 0.03, respectively, not significantly different from the
non-recovering 28 cells (6.9 ± 0.2 Hz and 7.53 ± 0.03, both p > 0.05). However, the
maximum pHi following ammonium load was significantly higher in the latter group
(7.84 ± 0.03) compared with the recovering cells (7.72 ± 0.03). The CBF peaks in both
groups after ammonium load were not significantly different (9.7 ± 0.3 Hz in the
recovering group versus 9.1 ± 0.3 Hz in the non-recovering group). During the

44
following acidification phase, pHi in non-recovering cells was found to be significantly
higher than in cells that recovered their CBF (7.27 ± 0.03 versus 7.20 ± 0.02, p < 0.05);
on the other hand, CBF at pHi nadir was significantly higher in the recovering group
(6.1 ± 0.2 Hz) compared with the non-recovering group (5.4 ± 0.2 Hz). Since the
decrease of CBF during intracellular acidification was not significantly different
between the two groups, it is possible that a too severe alkalization was responsible for
the failure of these cells to recover their CBF after an acid load. This notion was
supported by the fact that a lower pH could be reached in many other cells without any
ill effects on CBF. However, other factors could also play a role as in other groups of
cells, high pHi did not seem to influence the ability of CBF to recover after acidification
(see inhibitor experiments below).
4.1.2. The effect of changing pHi on CBF during removal of extracellular CO2
An additional way to change pHi without changing pHo was to remove
extracellular CO2 (Thomas, 1984; Willumsen & Boucher, 1992; Paradiso et al., 2003).
For this purpose, cells in closed chambers were continuously perfused with CO2/HCO3--
buffered solution, pHo = 7.4 (25 mM NaCl of the standard Hepes solution was replaced
with 25 mM NaHCO3 following equilibration with 5% CO2/95% O2, pH 7.4, no Hepes,
solution 7, Table 3-1). Baseline pHi in this group of cells was 7.24 ± 0.02 (n = 13 cells
from two donors), significantly lower than in cells bathed in Hepes-buffered, nominally
CO2/HCO3--free solution (7.49 ± 0.02, see above; p < 0.0001). Similarly, baseline CBF
was significantly lower in CO2/HCO3--buffered than in Hepes-buffered solution (6.1 ±
0.3 vs. 7.2 ± 0.2 Hz, p < 0.005). When the CO2/HCO3--buffered solution was switched
to a nominally CO2/HCO3--free buffer of the same pH (25 mM NaHCO3 was replaced
by equimolar Na-gluconate, buffered with 10 mM Hepes; solution 6, Table 3-1), a rapid
increase in pHi to 7.75 ± 0.03 was seen (p < 0.0001). When the CO2/HCO3--buffered
medium was reapplied and extracellular CO2 entered the cell forming carbonic acid, pHi
fell below the original baseline to 7.04 ± 0.02 (p < 0.0001 compared to both baseline
and peak pHi), followed by a slow pHi recovery. Similar to the ammonium prepulse
experiments, CBF followed the changes in pHi, increasing from a baseline of 6.1 ± 0.3
Hz to 10.3 ± 0.5 Hz (or 71 ± 6% above baseline; p < 0.0001) and falling back to 5.7 ±

45
0.3 Hz (7 ± 3% below original baseline; p < 0.0001 compared to the peak CBF, but not
significantly different from baseline). The time course of the intracellular alkalization
and the parallel CBF increase was again within the resolution of the pHi measurement
(10 s): pHi reached its maximum within 92 ± 6 sec and CBF within 106 ± 13 sec.
Figure 4-2/A shows a representative experiment.
Even though removal of external CO2 both increased CBF and pHi significantly
more than the alkalization phase of ammonium prepulse, the ratio of these two
parameters (ΔCBF/ΔpHi) did not differ between the two methods (8.4 ± 0.6 sec-1 (pH
unit)-1 versus 7.7 ± 0.4 sec-1 (pH unit)-1 in the CO2 and NH4Cl group, respectively; p >
0.05).
Figure 4-2. CBF responses to changing pHi during removal of external CO2. (A) Simultaneous CBF and pHi recording from a single, submerged, BCECF-loaded human tracheobronchial epithelial cell, mounted into a closed chamber and perfused with CO2/HCO3
--buffered solution (solution 7, Table 3-1) in exchange with CO2/HCO3
--free, Hepes-buffered solution (solution 6, Table 3-1). (B) Correlation between CBF and pHi plotted from the experiment shown in panel A. (C) Correlation between CBF and pHi plotted from 13 cells during and after removal of external CO2 identical to the experiment shown in panel A.
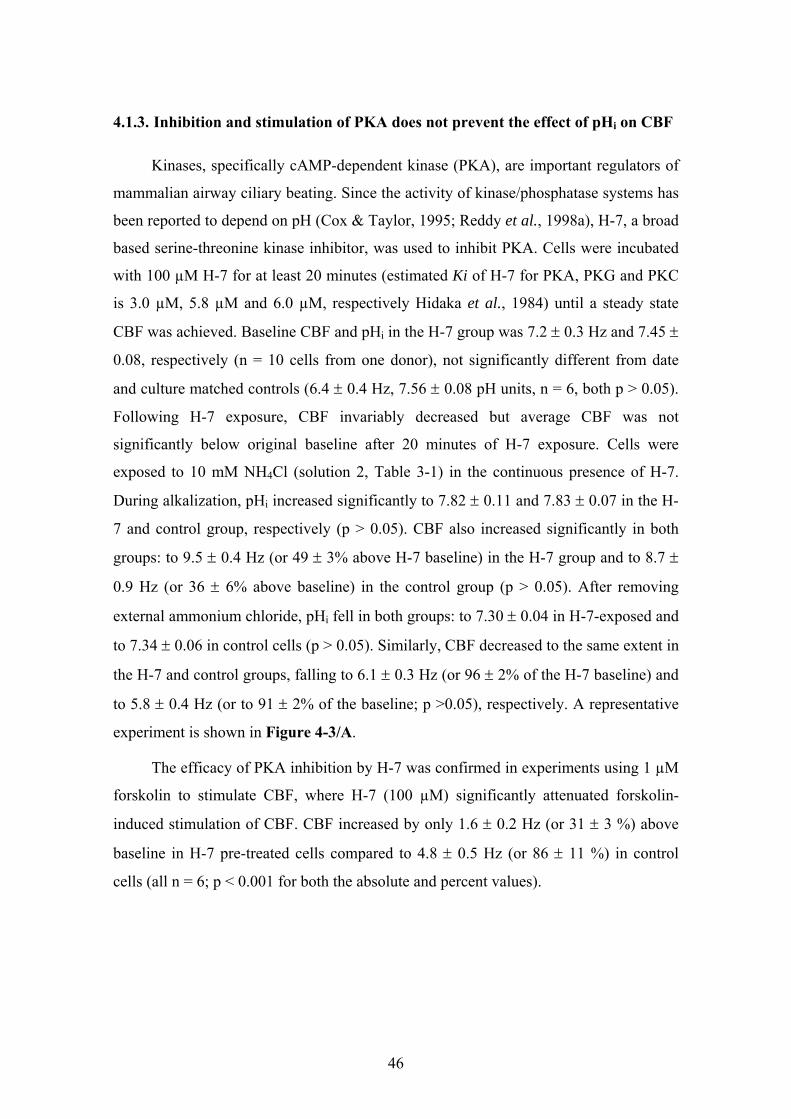
46
4.1.3. Inhibition and stimulation of PKA does not prevent the effect of pHi on CBF
Kinases, specifically cAMP-dependent kinase (PKA), are important regulators of
mammalian airway ciliary beating. Since the activity of kinase/phosphatase systems has
been reported to depend on pH (Cox & Taylor, 1995; Reddy et al., 1998a), H-7, a broad
based serine-threonine kinase inhibitor, was used to inhibit PKA. Cells were incubated
with 100 µM H-7 for at least 20 minutes (estimated Ki of H-7 for PKA, PKG and PKC
is 3.0 µM, 5.8 µM and 6.0 µM, respectively Hidaka et al., 1984) until a steady state
CBF was achieved. Baseline CBF and pHi in the H-7 group was 7.2 ± 0.3 Hz and 7.45 ±
0.08, respectively (n = 10 cells from one donor), not significantly different from date
and culture matched controls (6.4 ± 0.4 Hz, 7.56 ± 0.08 pH units, n = 6, both p > 0.05).
Following H-7 exposure, CBF invariably decreased but average CBF was not
significantly below original baseline after 20 minutes of H-7 exposure. Cells were
exposed to 10 mM NH4Cl (solution 2, Table 3-1) in the continuous presence of H-7.
During alkalization, pHi increased significantly to 7.82 ± 0.11 and 7.83 ± 0.07 in the H-
7 and control group, respectively (p > 0.05). CBF also increased significantly in both
groups: to 9.5 ± 0.4 Hz (or 49 ± 3% above H-7 baseline) in the H-7 group and to 8.7 ±
0.9 Hz (or 36 ± 6% above baseline) in the control group (p > 0.05). After removing
external ammonium chloride, pHi fell in both groups: to 7.30 ± 0.04 in H-7-exposed and
to 7.34 ± 0.06 in control cells (p > 0.05). Similarly, CBF decreased to the same extent in
the H-7 and control groups, falling to 6.1 ± 0.3 Hz (or 96 ± 2% of the H-7 baseline) and
to 5.8 ± 0.4 Hz (or to 91 ± 2% of the baseline; p >0.05), respectively. A representative
experiment is shown in Figure 4-3/A.
The efficacy of PKA inhibition by H-7 was confirmed in experiments using 1 µM
forskolin to stimulate CBF, where H-7 (100 µM) significantly attenuated forskolin-
induced stimulation of CBF. CBF increased by only 1.6 ± 0.2 Hz (or 31 ± 3 %) above
baseline in H-7 pre-treated cells compared to 4.8 ± 0.5 Hz (or 86 ± 11 %) in control
cells (all n = 6; p < 0.001 for both the absolute and percent values).

47
Figure 4-3. PKA is not involved in the pHi-mediated CBF changes. (A) Simultaneous CBF and pHi recording from a single, submerged, BCECF-loaded human tracheobronchial epithelial cell pre-treated and continuously perfused with 100 µM H-7 and transiently exposed to 10 mM NH4Cl. Neither the CBF nor the pHi responses differed from control cells (see Figure 4-1). (B) Simultaneous CBF and pHi recording from a single, submerged, BCECF-loaded human tracheobronchial epithelial cell continuously exposed to 10 µM forskolin followed by a transient exposure to 10 mM NH4Cl.
These data were confirmed with a more specific inhibitor of PKA, namely 10 µm
H-89 (Davies et al., 2000). The reported Ki values for PKA, CaM kinase II and PKC are
48 nM, 29.7mM, and 31.7mM, respectively. Cells were pre-incubated with H-89 for 20
min. As with H-7, H-89 did not influence the pH-mediated changes in CBF during
ammonium pre-pulse experiments (n = 4) compared with date- and culture-matched
control cells (n = 6). H-89 also inhibited the CBF increase upon exposure of cells to 10
µm forskolin (n = 7 for H-89/forskolin and n = 8 for forskolin control).
The possible role of PKA in mediating pHi-induced changes in CBF was also
tested by fully stimulating the enzyme with 10 µM forskolin prior to applying the
ammonium prepulse. Forskolin was continuously present during and after the
ammonium exposure. Baseline CBF and pHi in the forskolin group was 6.9 ± 0.4 Hz

48
and 7.61 ± 0.07, respectively (n = 15 cells from three donors), not significantly different
from the controls (6.4 ± 0.5 Hz, 7.52 ± 0.04 pH units, n = 14). Following forskolin
stimulation, CBF significantly increased by 42 ± 4% above baseline (up to 9.7 ± 0.5 Hz)
and pHi remained unchanged (7.63 ± 0.08). During the alkalizing phase of the
ammonium prepulse, pHi peaked at 7.99 ± 0.10 and 7.78 ± 0.03 in the forskolin and the
control group, respectively (p < 0.05 compared to the baseline in both groups, but not
significantly different from each other). In the forskolin group, peak CBF was 60 ± 6%
above the original baseline (absolute CBF value was 10.9 ± 0.6 Hz) and 13 ± 4% above
post-forskolin plateau. The percent change during alkalization of the control group cells
was 30 ± 3% above baseline (absolute CBF value: 8.3 ± 0.3 Hz, significantly lower than
peak CBF in the forskolin pre-treated cells, p < 0.001). These results show that even if
PKA is already stimulated, increasing pHi still further stimulates ciliary beating. During
acidification, pHi fell to 7.39 ± 0.07 in the forskolin pre-treated cells and to 7.26 ± 0.04
in the control cells (no significant difference between the two groups). As expected,
CBF in the forskolin stimulated cells was still 22 ± 4% above the original baseline
(absolute value: 8.4 ± 0.5 Hz) while the beating frequency in the control group was 32 ±
4% below baseline (absolute value: 4.3 ± 0.2 Hz; p < 0.0001; Figure 4-3/B).
4.1.4. Inhibition of protein phosphatases does not influence the effect of pHi on
CBF
To inhibit protein phosphatases, a combination of inhibitors was used: 10 µM
cyclosporin A (inhibitor of calcineurin, a type 2B protein phosphatase, at an IC50 = 5
nM, Cohen et al., 1989) and 1.5 µM okadaic acid (inhibitor of type 1 at an IC50 = 15 –
20 nM and type 2A protein phosphatase at an IC50 = 0.1 nM, Cohen et al., 1989).
Baseline CBF and pHi before application of the inhibitors was 6.7 ± 0.2 Hz and 7.46 ±
0.03, respectively (n = 11 cells from two donors), not significantly different from the
date and culture matched controls (7.0 ± 0.3 Hz, 7.57 ± 0.06 pH units, n = 10). Cells in
the phosphatase inhibitor group were perfused with the inhibitors for 17 min, resulting
in a statistically insignificant CBF decrease (6.0 ± 0.3 Hz) and unchanged pHi (7.47 ±
0.02). During the alkalization phase of the ammonium prepulse, both pHi and CBF

49
increased to the same level in both groups, significantly above baseline. Maximum pHi
was 7.86 ± 0.01 in inhibitor treated cells and 7.89 ± 0.06 in control cells (p > 0.05),
while maximum CBF was 8.3 ± 0.3 Hz (40 ± 4% above post-inhibitor plateau
frequency) in the inhibitor group and 9.4 ± 0.5 Hz (or 34 ± 3% above baseline) in the
control group (p > 0.05 for both percent and absolute changes). The nadir of pHi and
CBF (in percent decrease from baseline) during acidification did not differ between the
treated and control groups: pHi was 7.20 ± 0.03 and 7.27 ± 0.06, while CBF fell to 90 ±
3% of the CBF plateau reached after adding inhibitors and to 89 ± 3% of the baseline in
the two groups, respectively. A representative experiment is shown in Figure 4-4.
Figure 4-4. CBF responses to changing pHi during ammonium prepulse: lack of effect by phosphatase inhibition. Simultaneous CBF and pHi recording from a single, submerged, BCECF-loaded human tracheobronchial epithelial cell perfused with 10 µM cyclosporine A plus 1.5 µM okadaic acid and transiently exposed to 10 mM NH4Cl. Cyclosporine A plus okadaic acid did not change the CBF or pHi responses to NH4Cl compared to control cells.
4.1.5. pHi does not regulate CBF via changes in [Ca2+]i
[Ca2+]i plays a crucial role in regulating CBF (e.g., Salathe & Bookman, 1995;
Salathe et al., 1997; Salathe & Bookman, 1999; Ma et al., 2002; Zagoory et al., 2002).
It has been shown in several cell types that intracellular alkalization can increase, while
intracellular acidification can decrease [Ca2+]i via regulation of Ca2+-release from
intracellular stores (Thomas et al., 1979; Browning & Wilkins, 2002). We investigated
whether CBF regulation by pHi depends on [Ca2+]i.
First, [Ca2+]i and CBF from the same single cells were measured simultaneously
during ammonium prepulse. The estimated baseline [Ca2+]i of cells perfused with
standard Hepes-buffered solution (solution 1, Table 3-1) was 47.5 ± 10.3 nM, baseline

50
CBF was 8.0 ± 0.3 Hz (n = 18 from one donor). Two minutes after starting the
ammonium load (solution 2, Table 3-1), CBF increased as expected and significantly to
10.9 ± 0.4 Hz (37 ± 3% above the baseline). Estimated [Ca2+]i however, did not change
significantly (46.1 ± 7.6 nM). After the ammonium prepulse was completed and CBF
returned to baseline, P2Y receptors were stimulated with 10 µM ATP for one minute.
Exposure to ATP resulted in a significant increase in both estimated [Ca2+]i (peak: 234.3
± 36.4 nM) and CBF (peak: 12.6 ± 0.3 Hz or 61 ± 7% above baseline; see examples in
Figure 4-5/A and B). To estimate [Ca2+]i, constant Kd (400 nM, Browning & Wilkins,
2002), Rmax, Rmin, and β values were used according to Grynkiewicz (1985) using in
vitro calibration procedures as outlined in Materials and methods. However, the affinity
of fura-2 for Ca2+ has been reported to increase with increasing pH (i.e. Kd decreases at
alkaline pH). In addition, Rmax as well as β were found to be pH-dependent (Lattanzio &
Bartschat, 1991; Browning & Wilkins, 2002). Therefore, Rmax, Rmin, and β were
measured in vitro in the pH range of 7.0 – 8.0. The changes in Rmin and β were
negligible. The average maximum intracellular alkalization during ammonium prepulse
in our hands was ~ 0.30 pH units (from 7.50 to 7.80, see above). Taken our in vitro
estimations and an approximate 12.5% decrease in Kd (400 nM to 350 nM) based on the
study by Browning and Wilkins (2002), these changes would result in a 17% decreased
estimated [Ca2+]i. Thus, increases in [Ca2+]i are over-estimated and decreases are under-
estimated by the ratio data upon alkalization and therefore [Ca2+]i changes did not
explain the CBF increase upon rising pH.
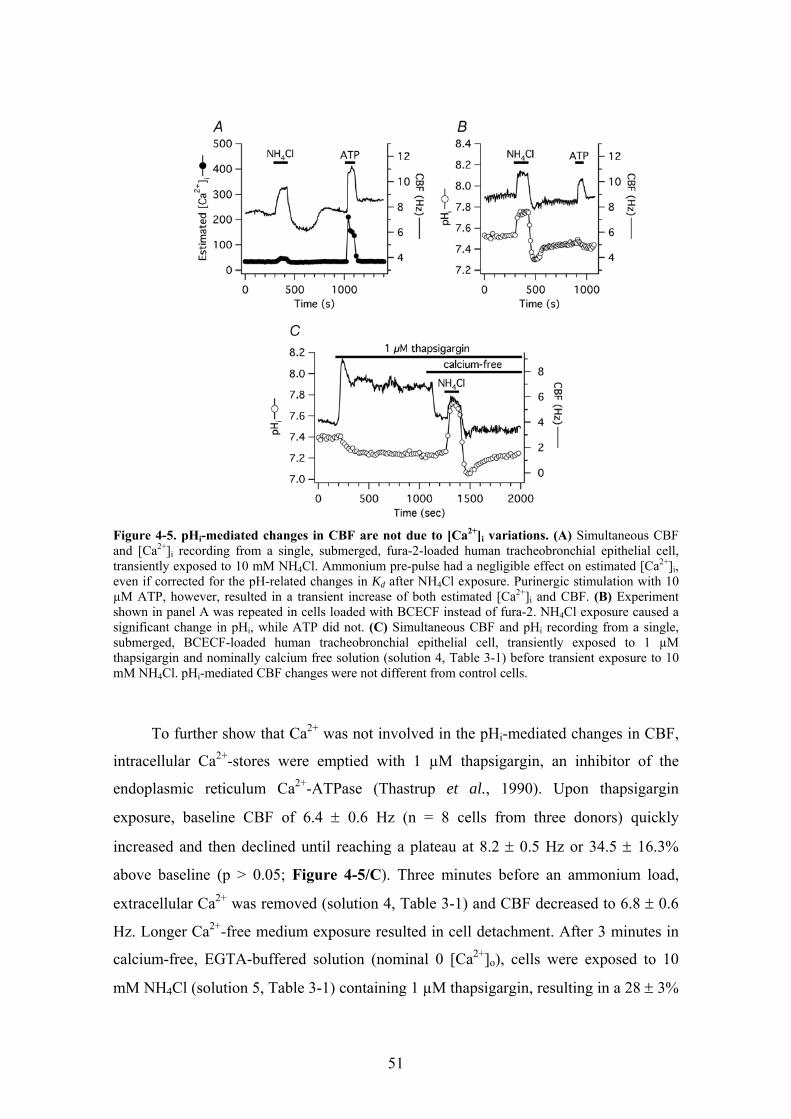
51
Figure 4-5. pHi-mediated changes in CBF are not due to [Ca2+]i variations. (A) Simultaneous CBF and [Ca2+]i recording from a single, submerged, fura-2-loaded human tracheobronchial epithelial cell, transiently exposed to 10 mM NH4Cl. Ammonium pre-pulse had a negligible effect on estimated [Ca2+]i, even if corrected for the pH-related changes in Kd after NH4Cl exposure. Purinergic stimulation with 10 µM ATP, however, resulted in a transient increase of both estimated [Ca2+]i and CBF. (B) Experiment shown in panel A was repeated in cells loaded with BCECF instead of fura-2. NH4Cl exposure caused a significant change in pHi, while ATP did not. (C) Simultaneous CBF and pHi recording from a single, submerged, BCECF-loaded human tracheobronchial epithelial cell, transiently exposed to 1 µM thapsigargin and nominally calcium free solution (solution 4, Table 3-1) before transient exposure to 10 mM NH4Cl. pHi-mediated CBF changes were not different from control cells.
To further show that Ca2+ was not involved in the pHi-mediated changes in CBF,
intracellular Ca2+-stores were emptied with 1 µM thapsigargin, an inhibitor of the
endoplasmic reticulum Ca2+-ATPase (Thastrup et al., 1990). Upon thapsigargin
exposure, baseline CBF of 6.4 ± 0.6 Hz (n = 8 cells from three donors) quickly
increased and then declined until reaching a plateau at 8.2 ± 0.5 Hz or 34.5 ± 16.3%
above baseline (p > 0.05; Figure 4-5/C). Three minutes before an ammonium load,
extracellular Ca2+ was removed (solution 4, Table 3-1) and CBF decreased to 6.8 ± 0.6
Hz. Longer Ca2+-free medium exposure resulted in cell detachment. After 3 minutes in
calcium-free, EGTA-buffered solution (nominal 0 [Ca2+]o), cells were exposed to 10
mM NH4Cl (solution 5, Table 3-1) containing 1 µM thapsigargin, resulting in a 28 ± 3%

52
acceleration of ciliary beating above pre-NH4Cl baseline (8.6 ± 0.7 Hz), a value not
significantly different from the 39 ± 5% increase from baseline of 6.3 ± 0.5 Hz to 8.7 ±
0.6 Hz seen in date-matched control cells (n = 5) neither exposed to thapsigargin or
calcium-free extracellular solution. Intracellular acid load after NH4Cl removal
significantly decreased CBF in both groups. Here, however, CBF of cells in nominally
free calcium solutions decreased significantly more than CBF of control cells: CBF
decreased 22 ± 3% below pre-ammonium challenge baseline to 5.3 ± 0.5 Hz vs. 5 ± 2%
to 6.0 ± 0.5 Hz, respectively (p < 0.05 for percentage values; p > 0.05 for the absolute
values). Baseline pHi was 7.38 ± 0.04 before ammonium exposure in cells bathed in
nominally free calcium solutions vs. 7.48 ± 0.04 baseline in control cells (p > 0.05). pHi
peaks were the same in both groups: 7.77 ± 0.04 in nominally free calcium solutions vs.
7.77 ± 0.05 in controls (p > 0.05); pHi nadir was 7.20 ± 0.04 vs. 7.27 ± 0.1, respectively
(p > 0.05).
4.1.6. Basolaterally permeabilized cells grown at the ALI
To control the cytoplasmic environment and to test whether the changes in CBF
seen in intact cells were directly related to changes in pH, the basolateral membrane of
human tracheobronchial epithelial cells re-differentiated at the ALI was selectively
permeabilized with Staphylococcus aureus alpha-toxin as described in Materials and
methods. Staphylococcus aureus alpha-toxin makes the membrane permeable to
molecules smaller than 5 kD, including nucleotides (Bhakdi & Tranum-Jensen, 1991;
Ostedgaard et al., 1992; Walev et al., 1993; Jonas et al., 1994; Reddy & Quinton, 1994;
Bhakdi et al., 1996; Detimary et al., 1996; Watanabe & Takano-Ohmuro, 2002). To
evaluate the efficacy of membrane permeabilization, the basolateral (i.e., intracellular)
solution containing 5 mM MgATP and an ATP regenerating system (ARS; 50 U·ml-1
creatine phosphokinase, 10 mM creatine phosphate disodium salt, solution 8 at pH 7.2,
Table 3-1) (Kakuta et al., 1985) was exchanged by a solution without ATP and ARS
(solution 9, Table 3-1). Seven minutes after the removal of this system, CBF fell from a
baseline of 6.7 ± 0.5 Hz by 4.2 ± 0.4 Hz (or by 62 ± 3 %; p < 0.0001 for both absolute
and percentage changes, n = 10 cells from two donors). These results suggested that the
basolateral membrane was permeable to ATP, even though the cilia were able to
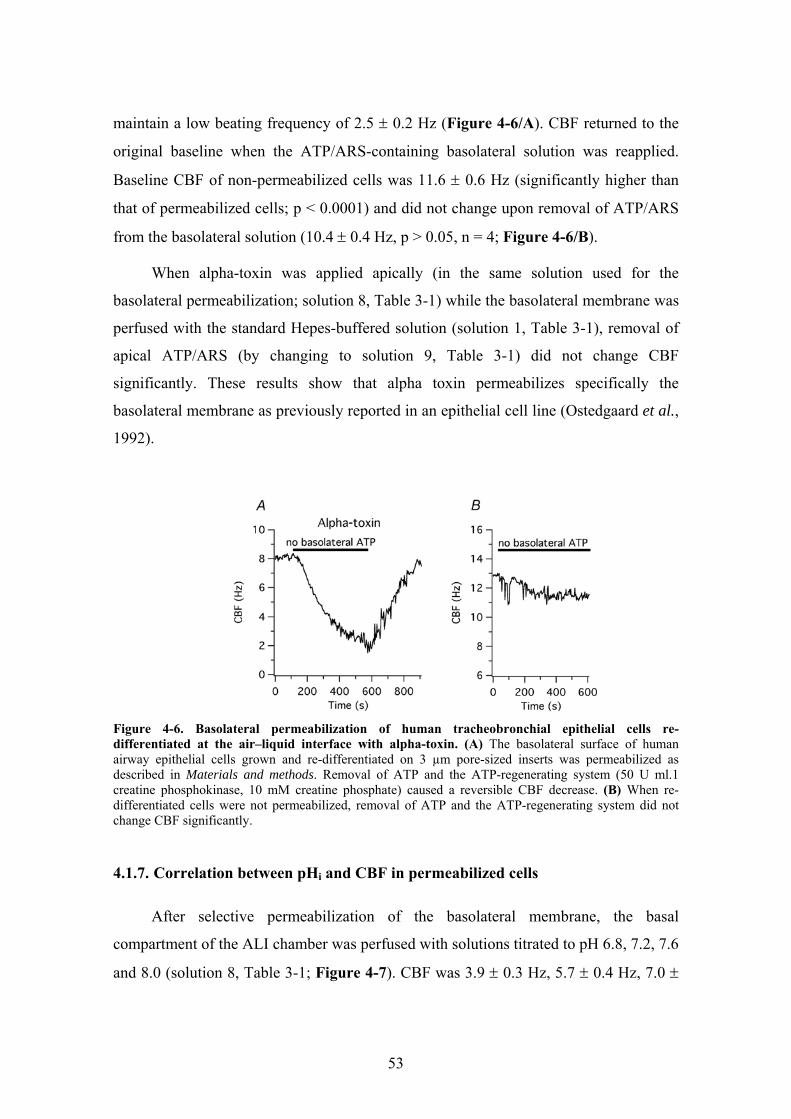
53
maintain a low beating frequency of 2.5 ± 0.2 Hz (Figure 4-6/A). CBF returned to the
original baseline when the ATP/ARS-containing basolateral solution was reapplied.
Baseline CBF of non-permeabilized cells was 11.6 ± 0.6 Hz (significantly higher than
that of permeabilized cells; p < 0.0001) and did not change upon removal of ATP/ARS
from the basolateral solution (10.4 ± 0.4 Hz, p > 0.05, n = 4; Figure 4-6/B).
When alpha-toxin was applied apically (in the same solution used for the
basolateral permeabilization; solution 8, Table 3-1) while the basolateral membrane was
perfused with the standard Hepes-buffered solution (solution 1, Table 3-1), removal of
apical ATP/ARS (by changing to solution 9, Table 3-1) did not change CBF
significantly. These results show that alpha toxin permeabilizes specifically the
basolateral membrane as previously reported in an epithelial cell line (Ostedgaard et al.,
1992).
Figure 4-6. Basolateral permeabilization of human tracheobronchial epithelial cells re-differentiated at the air–liquid interface with alpha-toxin. (A) The basolateral surface of human airway epithelial cells grown and re-differentiated on 3 µm pore-sized inserts was permeabilized as described in Materials and methods. Removal of ATP and the ATP-regenerating system (50 U ml.1 creatine phosphokinase, 10 mM creatine phosphate) caused a reversible CBF decrease. (B) When re-differentiated cells were not permeabilized, removal of ATP and the ATP-regenerating system did not change CBF significantly.
4.1.7. Correlation between pHi and CBF in permeabilized cells
After selective permeabilization of the basolateral membrane, the basal
compartment of the ALI chamber was perfused with solutions titrated to pH 6.8, 7.2, 7.6
and 8.0 (solution 8, Table 3-1; Figure 4-7). CBF was 3.9 ± 0.3 Hz, 5.7 ± 0.4 Hz, 7.0 ±

54
0.3 Hz, and 7.3 ± 0.3 Hz at pH 6.8, 7.2, 7.6, and 8.0, respectively (n = 18, each from
two different organ donors; Fig. 8B). All these values were significantly different from
each other except the ones measured at pH 7.6 and 8.0, suggesting that intracellular
alkalization had a ceiling effect on stimulating CBF in permeabilized cells.
Figure 4-7. Correlation between pHi and CBF in basolaterally permeabilized human tracheobronchial epithelial cells. (A) Representative measurement from a single re-differentiated cell permeabilized with alpha-toxin and basolaterally exposed to different solutions equilibrated at the shown pH. Increasing basolateral (i.e. intracellular) pH resulted in a CBF increase. (B) Data obtained as in panel A, but summarized for 18 measured cells. Shown are the mean ± SEM.
4.2. sAC expression and cellular distribution in HAECs
4.2.1. sAC mRNA expression
RNA extracted from HAECs grown at the ALI as well as commercially purchased
human testicular, brain, liver and kidney RNA were reverse transcripted into cDNA and
amplified by PCR using sAC specific primers shown in Table 3-2. Gel-electrophoresis
of PCR amplification products of testicular, airway epithelial and cerebral RNA
suggested three bands in the expected size (243 bps) range (Figure 4-8/B). The medium
sized band seemed to be the predominant in the lane of HAEC sample. PCR
amplification of liver cDNA seemed to produce two bands, while PCR of kidney cDNA
generated only one band. Subsequent cloning of RT-PCR products from HAEC RNA
and gel-electrophoresis of the restriction enzyme digested vectors confirmed the
presence of cDNA of three different sizes. Sequencing of the vector inserts revealed a

55
243 bp fragment of human testicular sAC cDNA (V1 Figure 4-8/D) and two variants: a
published sAC-variant (Reed et al., 1999; Reed et al., 2002; Geng et al., 2005) having
37 extra 5’ nucleotides to exon 5 derived from the intron sequence (V2, Figure 4-8/D),
and an unpublished variant containing 49 extra 5’ nucleotides (V3 Figure 4-8/D).
Vector inserts of four different clones containing the medium sized sAC fragment were
sequenced. Two of them were 100% identical to the published sAC-variant (Geng et al.,
2005); the third one contained an A instead of G in exon 5 (shown in green in Figure
4-8/D), while the fourth one missed a T in exon 4 and contained an A instead of G in
exon 5 (shown in red in Figure 4-8/D).

56
Figure 4-8. mRNA expression of soluble adenylyl cyclase (sAC) in human airway epithelial cells. (A) Schematic view of the coding region of human sAC with the location of catalytic domain 1 and 2 (black boxes with C1 and C2, respectively) and the forward (f) and reverse (r) primers used to amplify sAC-transcript from human airway epithelial cells. (B) RNA was extracted from human airway epithelial cells grown at the ALI (HAEC). Human testicular, brain, liver and kidney RNAs were purchased. Amplification products of RT-PCR using sAC-specific primers were visualized by gel-electrophoresis. (C) Cloning of RT-PCR products from human airway epithelial RNA and subsequent gel-electrophoresis of the restriction enzyme digested vectors confirmed the presence of cDNA of three different sizes. (D) Sequencing of the vector inserts revealed a 243 bps fragment of human sAC cDNA (V1) and two variants (V2 and V3). Boldfaced fragments represent the primers used for PCR-reaction, the extra 37 nucleotides in V2 and V3 are underlined and the insert of an additional 12 nucleotides in V3 is double underlined. Red and green letters in V2 indicate variable bases (see text). Exons are indicated by colored lines.
Mar
ker
Test
is
HA
EC
Bra
in
Live
r
Kid
ney
No
RT
Mar
ker
Mar
ker
sAC
(V1)
Mar
ker
sAC
(V2)
sAC
(V3)
310 271, 281
234 194
A
B C
sAC f (Exon 3)
r (Exon 5-6) C2 C1
Exon 3 Exon 4 h
V1 CTGAGCAGTTGGTGGAGATCCTCAACTACCACATAAGTGCAATAGTGGAGAAAGTGTTGA 60
V2 CTGAGCAGTTGGTGGAGATCCTCAACTACCACATAAGTGCAATAGTGGAGAAAGTGTTGA
V3 CTGAGCAGTTGGTGGAGATCCTCAACTACCACATAAGTGCAATAGTGGAGAAAGTGTTGA
Exon 4 h
V1 TTTTTGGAGGAGACATCCTGAAATTTGCAG------------------------------ 120
V2 TTTTTGGAGGAGACATCCTGAAATTTGCAG------------GGCAGGTCAAAAGCCCGC
V3 TTTTTGGAGGAGACATCCTGAAATTTGCAGATTGATCCCCGGGGCAGGTCAAAAGCCCGC
Exon 5 h
V1 -------------------GTGATGCACTGCTAGCCCTGTGGAGGGTGGAGCGAAAGCAG 180
V2 GGCATGTCTCTCTCTGAAGGTGATGCACTGCTAGCCCTGTGGAGGGTGGAGCGAAAGCAG
V3 GGCATGTCTCTCTCTGAAGGTGATGCACTGCTAGCCCTGTGGAGGGTGGAGCGAAAGCAG
Exon 5 h
V1 CTGAAAAACATTATCACAGTGGTAATTAAATGTAGCCTGGAGATCCATGGATTGTTTGAG 240
V2 CTGAAAAACATTATCACAGTGGTAATTAAATGTAGCCTGGAGATCCATGGATTGTTTGAG
V3 CTGAAAAACATTATCACAGTGGTAATTAAATGTAGCCTGGAGATCCATGGATTGTTTGAG
Exon 5 Exon 6 h
V1 ACCCAGGAGTGGGAAGAAGGCCTAGACATCCGAGTCAAGATAGGACTGGCTG 292
V2 ACCCAGGAGTGGGAAGAAGGCCTAGACATCCGAGTCAAGATAGGACTGGCTG
V3 ACCCAGGAGTGGGAAGAAGGCCTAGACATCCGAGTCAAGATAGGACTGGCTG
D
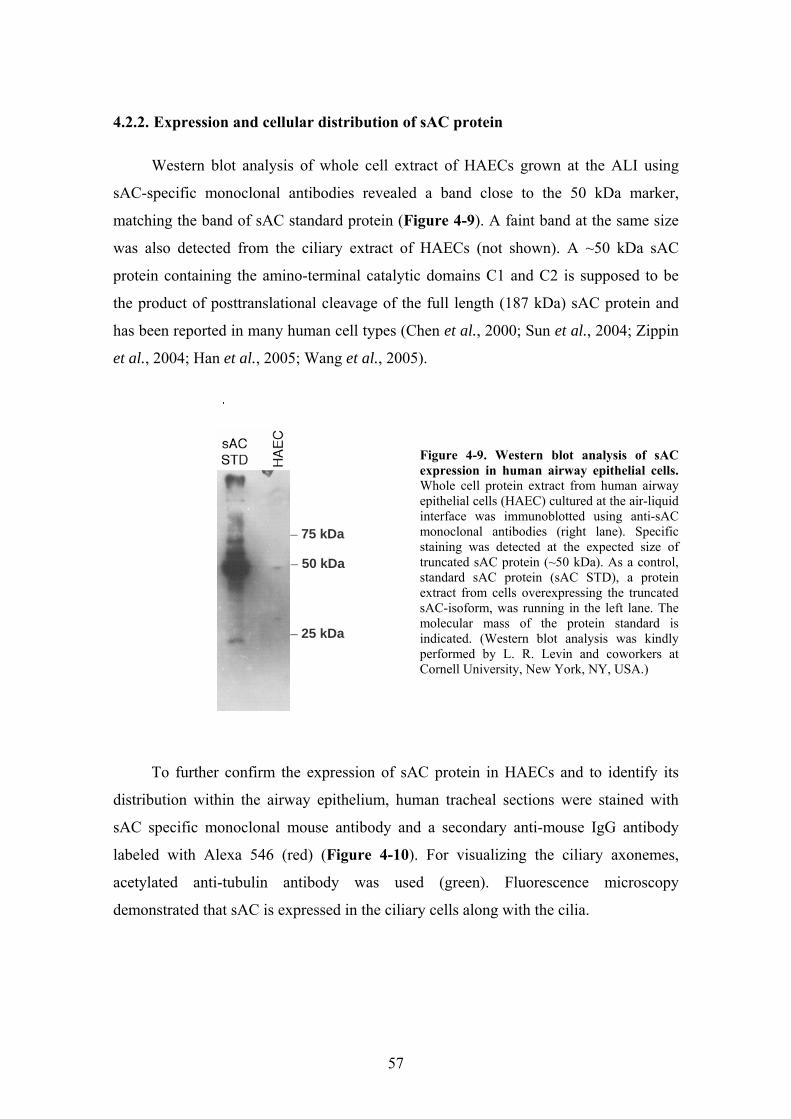
57
4.2.2. Expression and cellular distribution of sAC protein
Western blot analysis of whole cell extract of HAECs grown at the ALI using
sAC-specific monoclonal antibodies revealed a band close to the 50 kDa marker,
matching the band of sAC standard protein (Figure 4-9). A faint band at the same size
was also detected from the ciliary extract of HAECs (not shown). A ~50 kDa sAC
protein containing the amino-terminal catalytic domains C1 and C2 is supposed to be
the product of posttranslational cleavage of the full length (187 kDa) sAC protein and
has been reported in many human cell types (Chen et al., 2000; Sun et al., 2004; Zippin
et al., 2004; Han et al., 2005; Wang et al., 2005).
Figure 4-9. Western blot analysis of sAC expression in human airway epithelial cells. Whole cell protein extract from human airway epithelial cells (HAEC) cultured at the air-liquid interface was immunoblotted using anti-sAC monoclonal antibodies (right lane). Specific staining was detected at the expected size of truncated sAC protein (~50 kDa). As a control, standard sAC protein (sAC STD), a protein extract from cells overexpressing the truncated sAC-isoform, was running in the left lane. The molecular mass of the protein standard is indicated. (Western blot analysis was kindly performed by L. R. Levin and coworkers at Cornell University, New York, NY, USA.)
To further confirm the expression of sAC protein in HAECs and to identify its
distribution within the airway epithelium, human tracheal sections were stained with
sAC specific monoclonal mouse antibody and a secondary anti-mouse IgG antibody
labeled with Alexa 546 (red) (Figure 4-10). For visualizing the ciliary axonemes,
acetylated anti-tubulin antibody was used (green). Fluorescence microscopy
demonstrated that sAC is expressed in the ciliary cells along with the cilia.
50 kDa
75 kDa
25 kDa
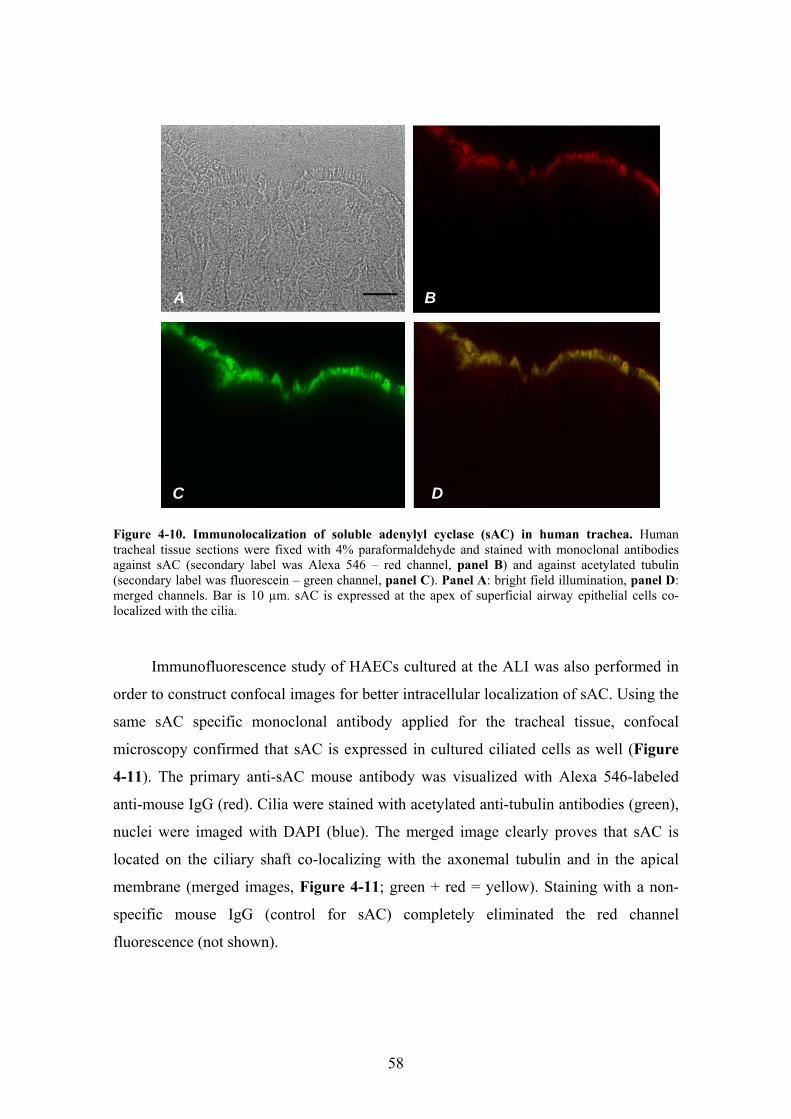
58
Figure 4-10. Immunolocalization of soluble adenylyl cyclase (sAC) in human trachea. Human tracheal tissue sections were fixed with 4% paraformaldehyde and stained with monoclonal antibodies against sAC (secondary label was Alexa 546 – red channel, panel B) and against acetylated tubulin (secondary label was fluorescein – green channel, panel C). Panel A: bright field illumination, panel D: merged channels. Bar is 10 µm. sAC is expressed at the apex of superficial airway epithelial cells co-localized with the cilia.
Immunofluorescence study of HAECs cultured at the ALI was also performed in
order to construct confocal images for better intracellular localization of sAC. Using the
same sAC specific monoclonal antibody applied for the tracheal tissue, confocal
microscopy confirmed that sAC is expressed in cultured ciliated cells as well (Figure
4-11). The primary anti-sAC mouse antibody was visualized with Alexa 546-labeled
anti-mouse IgG (red). Cilia were stained with acetylated anti-tubulin antibodies (green),
nuclei were imaged with DAPI (blue). The merged image clearly proves that sAC is
located on the ciliary shaft co-localizing with the axonemal tubulin and in the apical
membrane (merged images, Figure 4-11; green + red = yellow). Staining with a non-
specific mouse IgG (control for sAC) completely eliminated the red channel
fluorescence (not shown).
C
B
D
A

59
Figure 4-11. Immunolocalization of soluble adenylyl cyclase (sAC) in human airway epithelial cells cultured at the air-liquid interface. Fully differentiated human ALI cultures were fixed with 50% methanol/50% acetone and stained with antibodies against acetylated tubulin (AcTb; secondary label was fluorescein – green channel) and against sAC (secondary label was Alexa 546 – red channel). Finally, the nuclei were stained with DAPI (blue channel). The merged channels are shown as well. Three levels obtained with confocal microscopy are shown (ciliary level, apical membrane level below cilia and cellular or basolateral level) together with a z-axis reconstructed image (z stack). Bar is 10 µm (cells apparently flattened during mounting procedure). sAC is expressed apically and along the axoneme.
4.2.3. Effect of cytosolic HCO3- on ciliary beating in HAECs
To demonstrate that sAC expressed in HAECs is functioning and involved in
CBF-regulation, we performed preliminary experiments to test the effect of cytosolic
HCO3- on CBF. In order to overcome the difficulties of controlling [HCO3
-]i by
externally applied bicarbonate without changing pHi (see Figure 4-2/A), the basolateral

60
surface of a polarized HAEC culture was partially permeabilized by the detergent
saponin (Kakuta et al., 1985). For this purpose, ALI culture of HAECs was mounted in
a closed chamber allowing selective perfusion of the apical and basolateral membrane
of the cells. The basolateral membrane was perfused with an ATP containing buffer
(similar to solution 8 containing 10 mM ATP, pH 7.2, Table 3-1) followed by an ATP-
free solution (solution 9, Table 3-1), containing 0.05% saponin. The apical compartment
was perfused with HCO3--free Hepes buffer (similar to solution 1, Table 3-1, pH
adjusted to 7.2) and CBF of twelve ciliated cells was recorded simultaneously. CBF of
two representative cells is shown in Figure 4-12.
Figure 4-12. Effect of intracellular HCO3
- on CBF of intact and basolaterally permeabilized HAECs. Polarized culture of HAECs grown at the ALI was mounted in a closed chamber. Apical and basolateral surface of the culture was perfused separately as indicated by the bars and CBF was measured continuously. CBF of two representative cells of the same experiment are shown. The basolateral membrane of the cells was exposed to 0.05% saponin as indicated in the absence of ATP (“no ATP”). CBF of one cell (blue plot) started to decrease upon saponin treatment indicating ATP loss through the permeabilized membrane (full arrow). Saponin was then removed permanently in order to avoid cellular death. After re-applying basolateral ATP (as indicated by the end of “no ATP” bar), CBF of permeabilized cell suddenly increased while the intact cell (red plot) did not respond on basolateral ATP (empty arrows). Bilateral CO2/HCO3
- inhibited CBF of intact cell because of intracellular acidification, while stimulates ciliary beating of permeabilized cell possibly through activation of sAC (black triangles).
In order to avoid saponin-related toxicity, the basolateral saponin was temporarily
removed several times. As soon as CBF of at least one cell started to decrease indicating
cellular ATP-efflux because of membrane permeabilization (blue plot at the full arrow
in Figure 4-12), saponin was removed permanently from the basolateral perfusate. Re-
application of ATP to the basolateral membrane resulted in increasing CBF, further

61
confirming that attenuation of ciliary beating was the consequence of ATP loss. On the
contrary, those cells which remained intact (indicated by the absence of CBF change on
saponin) did not respond on basolateral ATP (red plot, Figure 4-12). Then, both the
apical and basolateral surfaces of the cells were exposed to CO2/HCO3--containing
buffers of the same pH (apical perfusate: solution 7 from Table 3-1, pH adjusted to 7.2;
basolateral perfusate: solution 8 from Table 3-1, 25 mM K-gluconate replaced by 25
mM KHCO3, equilibrated with 5% CO2, pH 7.2,). As expected based on the experiment
shown in Figure 4-2/A, intact cells responded on CO2/HCO3--containing buffers with
slowing ciliary beating because of intracellular acidification (CO2 freely crosses the
plasmamembrane and forms carbonic acid inside the cell, while HCO3- mainly remained
out of the cell). On the contrary, CO2/HCO3- augmented CBF of permeabilized cell in
the same culture, possibly via sAC-activation.
4.3. NE transporter mRNA expression profile in human airway
epithelial cells
Because non-neuronal cells may express various and/or multiple transport systems
for NE, RT-PCR reactions were initiated to examine the presence of neuronal (NET
(Pacholczyk et al., 1991)) and non-neuronal (OCT-1 (Grundemann et al., 1994), OCT-2
(Okuda et al., 1996), and EMT) transporter mRNAs in HAECs grown and
redifferentiated at the ALI, and freshly isolated bronchial arterial smooth muscle cells.
Based on the published expression data, human brain, liver, kidney, and Caki-1 cell line
mRNA samples were used to optimize the RT-PCR reactions for NET, OCT-1, OCT-2,
and EMT mRNAs, respectively. Gel electrophoresis of the RT-PCR products for these
samples showed bands of expected sizes (Figure 4-13). Gel-purification and sequence
analysis confirmed that these amplicons were fragments of the corresponding NE
transporter cDNAs. The isolated fragments contained only exon sequences (from at
least 3 different exons for each) confirming the amplification of mRNA rather than
genomic sequences (Grundemann & Schomig, 2000).
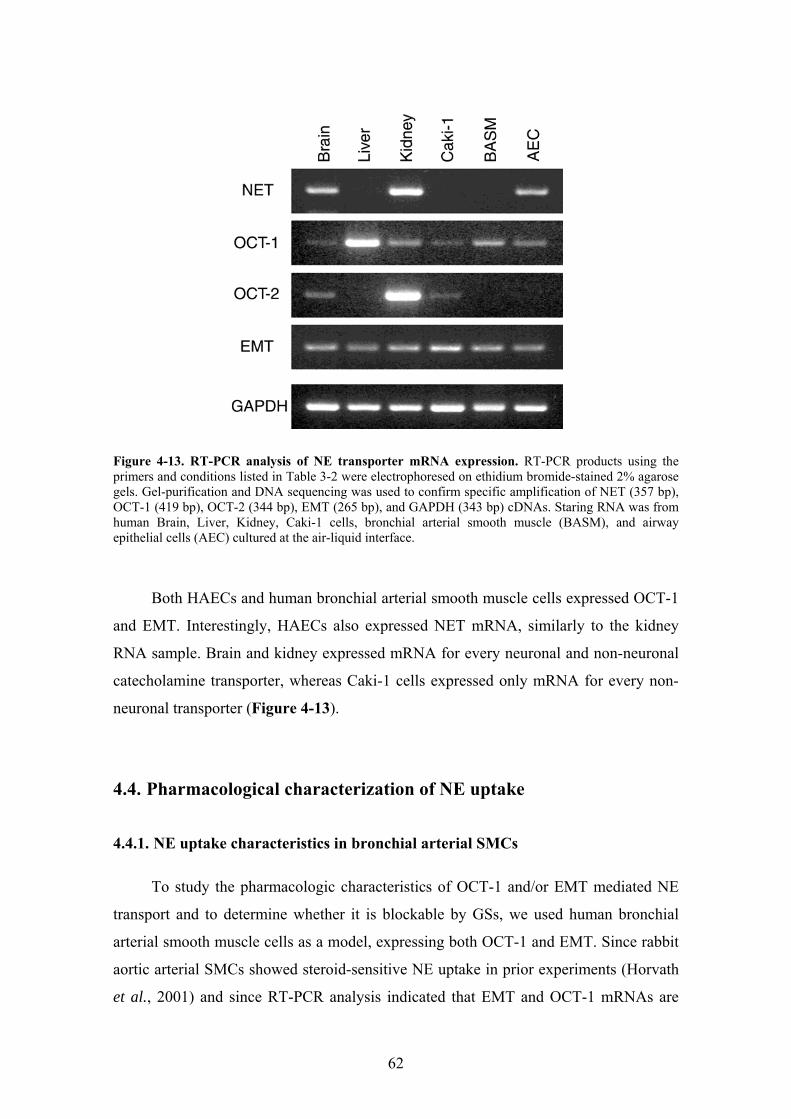
62
Figure 4-13. RT-PCR analysis of NE transporter mRNA expression. RT-PCR products using the primers and conditions listed in Table 3-2 were electrophoresed on ethidium bromide-stained 2% agarose gels. Gel-purification and DNA sequencing was used to confirm specific amplification of NET (357 bp), OCT-1 (419 bp), OCT-2 (344 bp), EMT (265 bp), and GAPDH (343 bp) cDNAs. Staring RNA was from human Brain, Liver, Kidney, Caki-1 cells, bronchial arterial smooth muscle (BASM), and airway epithelial cells (AEC) cultured at the air-liquid interface.
Both HAECs and human bronchial arterial smooth muscle cells expressed OCT-1
and EMT. Interestingly, HAECs also expressed NET mRNA, similarly to the kidney
RNA sample. Brain and kidney expressed mRNA for every neuronal and non-neuronal
catecholamine transporter, whereas Caki-1 cells expressed only mRNA for every non-
neuronal transporter (Figure 4-13).
4.4. Pharmacological characterization of NE uptake
4.4.1. NE uptake characteristics in bronchial arterial SMCs
To study the pharmacologic characteristics of OCT-1 and/or EMT mediated NE
transport and to determine whether it is blockable by GSs, we used human bronchial
arterial smooth muscle cells as a model, expressing both OCT-1 and EMT. Since rabbit
aortic arterial SMCs showed steroid-sensitive NE uptake in prior experiments (Horvath
et al., 2001) and since RT-PCR analysis indicated that EMT and OCT-1 mRNAs are

63
expressed in human bronchial arterial SMCs, NE uptake was measured in these cells in
the absence or presence of 10 μM corticosterone. This concentration was chosen to
inhibit EMT but not other OCT-1 (and OCT-2) in a significant amount (Martel et al.,
1999; Hayer-Zillgen et al., 2002); see also below. The amount of uptake blockable by
10 μM corticosterone was defined as EMT-mediated.
To show first that NE uptake into human bronchial arterial SMCs is a time-
dependent phenomenon, cells were incubated in 50 μM NE with and without 10 μM
corticosterone for 5, 15, 30, 45, and 90 min. NE uptake was detectable after 5 min and
increased in a time-dependent fashion for 45 min (Figure 4-14A). The concentration-
dependence was evaluated by incubating the cells in 25, 50, 250, and 1,000 μM NE with
and without 10 μM corticosterone for 5 min. EMT-mediated uptake seemed to saturate
towards 1,000 μM NE (Figure 4-14B). The calculated Km for NE uptake was
approximately 240 µM. This is close to the Km value of 245 µM calculated for NE
uptake into rabbit aortic SMCs (see above), a process likely mediated by EMT
(Schomig & Schonfeld, 1990).
Figure 4-14. Time- and concentration-dependence of NE uptake by human bronchial arterial SMCs. (A) Cells were exposed to 50 μM NE-containing incubation medium for different time periods. Shown is the EMT-mediated (solid circle) and not EMT-mediated (open circle) uptake of NE. EMT-mediated uptake was defined as the amount of uptake that was blockable by 10 μM corticosterone. (B) EMT-mediated NE uptake rates (v) were calculated from the 5-min time-point and plotted against NE concentrations. F is fluorescence in arbitrary units. Lines were fitted to the experimental data using nonlinear regression methods. Shown are means ± SEM for triplicate experiments with n of cells = 25-50 each.
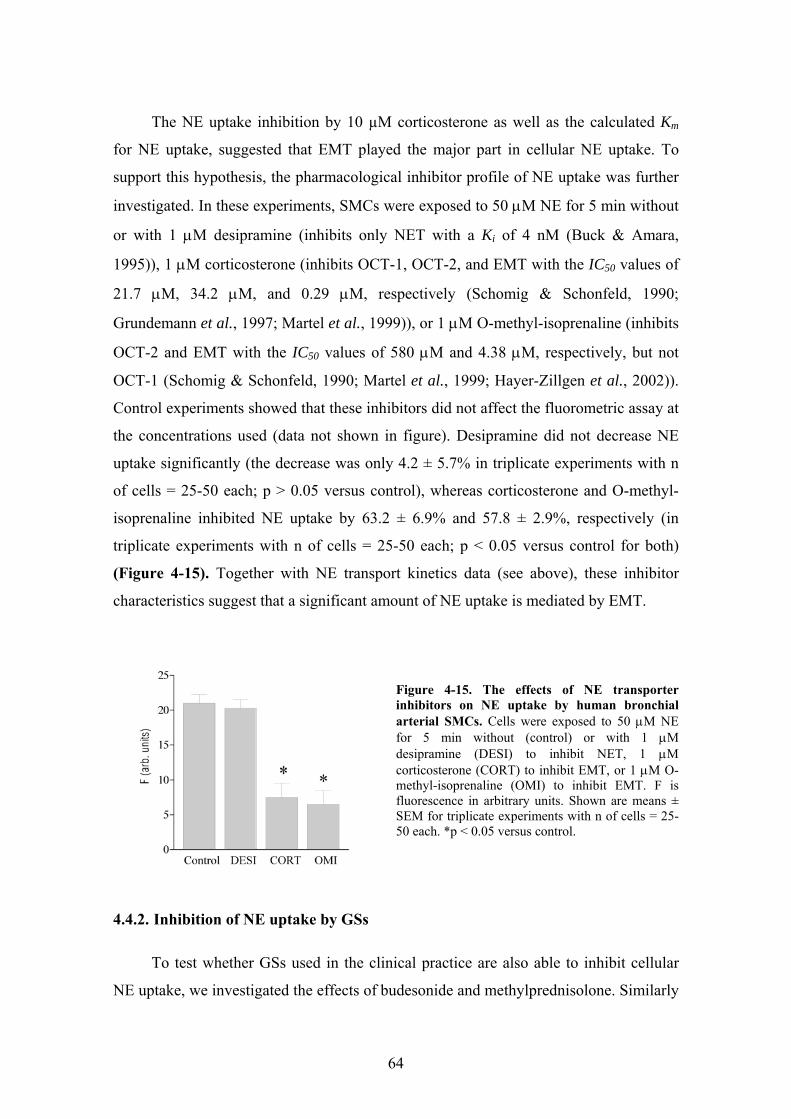
64
The NE uptake inhibition by 10 µM corticosterone as well as the calculated Km
for NE uptake, suggested that EMT played the major part in cellular NE uptake. To
support this hypothesis, the pharmacological inhibitor profile of NE uptake was further
investigated. In these experiments, SMCs were exposed to 50 μM NE for 5 min without
or with 1 μM desipramine (inhibits only NET with a Ki of 4 nM (Buck & Amara,
1995)), 1 μM corticosterone (inhibits OCT-1, OCT-2, and EMT with the IC50 values of
21.7 μM, 34.2 μM, and 0.29 μM, respectively (Schomig & Schonfeld, 1990;
Grundemann et al., 1997; Martel et al., 1999)), or 1 μM O-methyl-isoprenaline (inhibits
OCT-2 and EMT with the IC50 values of 580 μM and 4.38 μM, respectively, but not
OCT-1 (Schomig & Schonfeld, 1990; Martel et al., 1999; Hayer-Zillgen et al., 2002)).
Control experiments showed that these inhibitors did not affect the fluorometric assay at
the concentrations used (data not shown in figure). Desipramine did not decrease NE
uptake significantly (the decrease was only 4.2 ± 5.7% in triplicate experiments with n
of cells = 25-50 each; p > 0.05 versus control), whereas corticosterone and O-methyl-
isoprenaline inhibited NE uptake by 63.2 ± 6.9% and 57.8 ± 2.9%, respectively (in
triplicate experiments with n of cells = 25-50 each; p < 0.05 versus control for both)
(Figure 4-15). Together with NE transport kinetics data (see above), these inhibitor
characteristics suggest that a significant amount of NE uptake is mediated by EMT.
Figure 4-15. The effects of NE transporter inhibitors on NE uptake by human bronchial arterial SMCs. Cells were exposed to 50 μM NE for 5 min without (control) or with 1 μM desipramine (DESI) to inhibit NET, 1 μM corticosterone (CORT) to inhibit EMT, or 1 μM O-methyl-isoprenaline (OMI) to inhibit EMT. F is fluorescence in arbitrary units. Shown are means ± SEM for triplicate experiments with n of cells = 25-50 each. *p < 0.05 versus control.
4.4.2. Inhibition of NE uptake by GSs
To test whether GSs used in the clinical practice are also able to inhibit cellular
NE uptake, we investigated the effects of budesonide and methylprednisolone. Similarly

65
to corticosterone, budesonide and methylprednisolone inhibited NE uptake after 5 min
of incubation (Figure 4-16). The rank order for inhibitory potency was corticosterone >
budesonide > methylprednisolone. The calculated apparent IC50 values for these
compounds were 0.12 μM (close to the reported IC50 of 0.29 µM for EMT in other
cells), 0.89 μM, and 5.56 μM, respectively.
Figure 4-16. Inhibition of NE uptake by GSs in human bronchial arterial SMCs. Cells were exposed to 50 μM NE for 5 min in the presence of corticosterone, budesonide, or methylprednisolone. Data are shown as a percentage of NE uptake measured in the absence of inhibitors. Shown are means ± SEM for triplicate experiments with n of cells = 25-50 for each. The calculated IC50 values for corticosterone, budesonide, and methyl-prednisolone were 0.12 μM, 0.89 μM, and 5.56 μM, respectively.
4.4.3. EMT inhibition by corticosterone is a nongenomic effect
Evidence have been provided from our laboratory that NE uptake into rabbit
aortic smooth muscle cells is mediated by a nongenomic action of GSs independent on
transcription, protein synthesis, and membrane penetration of the drug (Horvath et al.,
2001). Here we repeated these experiments with human bronchial arterial SMCs. In
addition, we also examined the acute reversibility of the corticosterone effect and its
dependence on the classical, intracellular GS receptor.
To investigate reversibility, human bronchial arterial SMCs were exposed to 1
μM corticosterone for 5 min, which blocked NE uptake by about 65% in our
experiments (see above). Then the cells were transferred into a corticosterone-free
medium containing 50 μM NE for uptake measurements. There was no significant
difference in NE uptake between SMCs pretreated with corticosterone and control cells
not exposed to corticosterone (17.1 ± 2.2 versus 21.1 ± 0.9 arbitrary units; in triplicate

66
experiments with n of cells = 25-50 each; p > 0.05) (Figure 4-17A). Thus, the inhibition
of NE uptake by corticosterone is reversible after removal of the GS.
Figure 4-17. Corticosterone inhibits NE uptake into human bronchial arterial SMCs via a nongenomic mechanism. (A) Cells were exposed to 50 μM NE for 5 min without (control) or with 1 μM corticosterone (CORT). Additionally, cells were pre-treated with 1 μM corticosterone for 5 min but exposed to NE in corticosterone-free solutions (CORT⇒NE). (B) Cells were exposed to 50 μM NE without (control) or with 10 μM RU486 (RU) plus 1 μM corticosterone, 100 μM actinomycin D (ACT) plus 1 μM corticosterone, or 10 μM cycloheximide (CYC) plus 1 μM corticosterone. (C) Cells were exposed to 50 μM NE without (control) or with 1 μM corticosterone-BSA conjugate (CORT:BSA). F is fluorescence in arbitrary units. Shown are means ± SEM for triplicate experiments with n of cells = 25-50 for each. *p < 0.05 versus control.
To show that classical genomic pathway (i.e., binding to cytoplasmic receptors
thereby initiating changes in transcription and protein synthesis of target genes) was not
involved in corticosterone's rapid action, either 10 μM RU486 (a cytoplasmic GS
receptor antagonist), 100 μM actinomycin D (transcription inhibitor), or 10 μM
cycloheximide (protein synthesis inhibitor) was added to the incubation medium 30 min
prior to the addition of 50 μM NE and 1 μM corticosterone. Control experiments
showed that either RU486, actinomycin D, or cycloheximide did not inhibit NE uptake
at the concentrations used (data not shown in figure). Corticosterone inhibited NE
uptake by 66.7 ± 12.4%, 62.1 ± 6.8%, and 69.4 ± 11.6% in the presence of RU486,
actinomycin D, or cycloheximide (in triplicate experiments with n of cells = 25-50 each;
p < 0.05 versus control for all, p > 0.05 versus corticosterone-treated) (Figure 4-17B).
Thus, the NE uptake inhibition by corticosterone does neither depend on the
cytoplasmic GS receptor nor on changes in transcription or translation.
67
To investigate whether corticosterone acts at the plasma membrane,
corticosterone was prevented from entering the cell by conjugation to the membrane-
impermeant carrier protein BSA (Zheng & Ramirez, 1997, 1999). Corticosterone-21-
hemisuccinate-BSA (1 µM) decreased NE uptake into SMCs by 57.7 ± 16.3% (in
triplicate experiments with n of cells = 25-50 each; p < 0.05 versus control, p > 0.05
versus corticosterone-treated) (Figure 4-17C). Since membrane-impermeant
corticosterone also inhibited NE uptake into human bronchial arterial SMCs, we
concluded that the acute effects of GSs are likely mediated through a GS binding site at
the plasma membrane.
Inasmuch as the activity of the membrane-impermeant corticosterone-BSA
conjugate suggested that corticosterone acted at a site located at or in the plasma
membrane, we looked for further evidence of a membrane-binding site for
corticosterone in human bronchial arterial SMC. To immunocytochemically visualize
the binding of membrane-impermeant corticosterone-BSA conjugate to the plasma
membrane, rabbit IgG antibodies against BSA were used in combination with TRITC
labeled goat anti-rabbit IgG secondary antibodies (Figure 4-18). Fluorescent labeling
was absent in control cells that were incubated in 1 μM BSA-containing medium for 5
min (Figure 4-18A and B), whereas cells incubated in 1 μM corticosterone-21-
hemisuccinate-BSA for 5 min were specifically labeled (Figure 4-18C and D).
Inasmuch as the conjugated corticosterone was necessary for BSA binding, this
experiment demonstrated a binding site for corticosterone in the cell membrane.
Competition with 100 µM corticosterone completely inhibited binding of
corticosterone-21-hemisuccinate-BSA to the cells (Figure 4-18E and F), indicating that
corticosterone binding to the plasma membrane was specific.
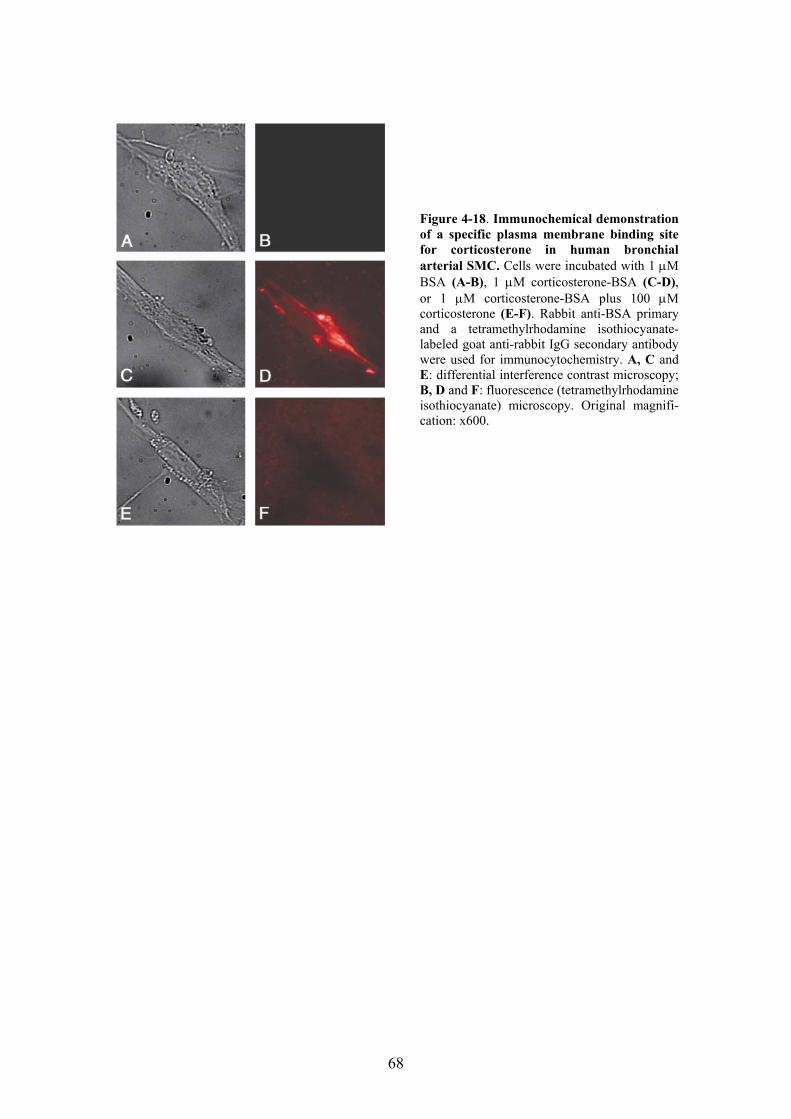
68
Figure 4-18. Immunochemical demonstration of a specific plasma membrane binding site for corticosterone in human bronchial arterial SMC. Cells were incubated with 1 μM BSA (A-B), 1 μM corticosterone-BSA (C-D), or 1 μM corticosterone-BSA plus 100 μM corticosterone (E-F). Rabbit anti-BSA primary and a tetramethylrhodamine isothiocyanate-labeled goat anti-rabbit IgG secondary antibody were used for immunocytochemistry. A, C and E: differential interference contrast microscopy; B, D and F: fluorescence (tetramethylrhodamine isothiocyanate) microscopy. Original magnifi-cation: x600.

69
5. DISCUSSION
5.1. Regulation of human airway ciliary beat frequency by pHi
Previous studies showed that extracellular alkaline solutions up to pH 9 – 10.5
had no effect on mammalian airway CBF, while extracellular acidic solutions attenuated
ciliary beating (van de Donk et al., 1980; Luk & Dulfano, 1983; Clary-Meinesz et al.,
1998a). However, the relationship between intracellular pH and CBF has been unclear.
Here we demonstrate that relatively small changes in pHi result in significant changes in
ciliary beating of human tracheobronchial epithelial cells. The observed changes in
ciliary beating are large enough to alter a more macroscopic physiological parameter,
i.e. mucociliary clearance: Seybold et al. (1990), for instance, found that a 16% increase
in CBF can lead to a 56% increase in mucociliary transport velocity in isolated whole
tracheas.
Our experiments suggest that changing pHi may directly act on the ciliary motile
machinery, possibly the outer dynein arm. The exact mechanism of how pHi changes
CBF remains unclear. One possibility is a change in the charge of histidine, possibly
affecting dynein ATPase or a dynein light chain that influences dynein ATPase activity.
To our knowledge, no data are available from the literature on the former hypothesis.
However, a dynein light chain conformation change has been reported to depend on pH-
induced changes in histidine ionization (Barbar et al., 2001). This dynein light chain,
LC8, has been originally found on outer dynein arms (Piperno & Luck, 1979), has been
reported to be important for flagellar beating and can be found as a dimer or monomer,
depending on pH-induced histidine ionization (Barbar et al., 2001). Thus, although
completely speculative, histidine charge changes on the outer dynein arm could be
important in pH-dependent modulation of CBF.
The baseline pHi of human airway tracheobronchial ciliated cells submerged in
nominally CO2/HCO3--free solutions (pH adjusted to 7.4) at room temperature was
surprisingly high at 7.49 ± 0.02. Poulsen et al. (1996), however, reported a similarly
high pHi (7.41 ± 0.09) in bovine tracheal epithelial cells bathed in CO2/HCO3--free
buffers. Similar pHi values were reported at 7.44 ± 0.01 in rat cardiac myocytes (Evans

70
et al., 2003), at 7.40 ± 0.02 in rat distal colon (Dagher et al., 1994), at 7.42 ± 0.02 in rat
ileum villus cells (Dagher et al., 1997), and at 7.67 ± 0.05 in rat ileum crypt cells
(Dagher et al., 1997). On the other hand, pHi of human nasal airway epithelial cells
bathed in CO2/HCO3--free medium reported by another group was considerably less at
7.08 – 7.16 (Willumsen & Boucher, 1992; Paradiso, 1997; Paradiso et al., 2003). The
reasons for these differences are not clear, but could be due to calibration issues,
differences in experimental temperatures (Roos & Boron, 1981), disparate cell types
and culturing methods (polarized cell culture). Our results using CO2/HCO3--buffered
solutions, however, agree with the published data: baseline pHi was 7.24 ± 0.02 in our
experiments, 0.24 pH units lower than in nominally CO2/HCO3--free solution (Paradiso
et al., 2003). The pHi changes in response to ammonium prepulse were similar to those
reported by others (Boyarsky et al., 1988; Singh et al., 1995; Paradiso, 1997; Ramirez et
al., 2000; Brett et al., 2002). Although both the basolateral and apical membrane was
available for NH4Cl in our submerged culture experiments, the shape of the pHi-plot
depicted in Figure 4-1/A and B suggested that the apical membrane responses were
predominant (Willumsen & Boucher, 1992; Boron et al., 1994; Singh et al., 1995;
Paradiso, 1997).
Our experiments in intact human tracheobronchial epithelial cells revealed a close
kinetic relationship between pHi and CBF in the examined pH-range of 7.0 – 7.8
(Figure 4-1, Figure 4-2). The changes occurred coincidentally at the beginning of the
alkalization and acidification phase of ammonium prepulse or external CO2-removal,
i.e. within the time resolution of the CBF measurements (3 sec) and pH recordings (10 -
20 sec).
However, in some experiments, CBF was slow to follow pHi during the pHi-
recovery from intracellular acidification or even remained low (Figure 4-1/B),
suggesting a prolonged or possibly irreversible, toxic effect of low pHi on cilia.
The mode of pHi-action on CBF is not completely clear, and the possibility with
histidine charge changes discussed above remains purely speculative. However, several
possibilities could be excluded. First, activation of sAC is unlikely, since all coverslips
and ALI cultures in this study, except those used for the CO2 removal experiments, were
perfused with CO2/HCO3--free solutions and exposed to ambient air for at least 30 min
71
before experimentation. Therefore, the intracellular [HCO3-] is expected to approach
zero in these cells and changes in pHi should not have been able to change sAC activity
via its HCO3-–sensitivity. Furthermore, the use of protein kinase inhibitors did not alter
the CBF response on pHi changes.
Protein kinase/phosphatase systems could also be plausible targets of pHi changes
since the catalytic efficiency of PKA is optimal at near neutral pH and is inhibited at
acidic pH (Cox & Taylor, 1995). Acidic pH not only inhibits PKA but also activates
phosphatases to de-phosphorylate PKA targets, while alkaline pH has the opposite
effect on both PKA and phosphatases (Reddy et al., 1998a). However, neither inhibition
of protein kinases with H-7, PKA with H-89 nor pre-stimulation of PKA by the
transmembrane adenylyl cyclase activator forskolin could attenuate CBF responses to
changing pHi. The same concentrations of the kinase inhibitors H-7 and H-89
significantly attenuated the CBF-stimulatory effect of forskolin, showing the efficacy of
these agents. The use of H-7 as a broad inhibitor also excluded other kinases relevant
for CBF (e.g., PKC). Similarly, pre-treatment with a mixture of two phosphatase
inhibitors failed to show any significant difference in the coupling of CBF and pHi
(Figure 4-3, Figure 4-4). Although it is more difficult to test the efficacy of
phosphatase inhibition, the combination of two inhibitors at the concentrations used (at
100, 3000 and 2000 times the estimated IC50 for phosphatase 1, 2A and 2B,
respectively) was likely sufficient to inhibit these enzymes.
Another important mediator of CBF regulation, [Ca2+]i, was also reported to be
influenced by pHi in several cell types (Thomas et al., 1979; Browning & Wilkins,
2002). However, we could not modify the coupling of pHi and CBF by emptying
internal Ca2+-stores with thapsigargin and inhibiting the influx of external Ca2+ using
nominally Ca2+-free bathing solutions (Figure 4-5/C). Simultaneous measurements of
[Ca2+]i and CBF during ammonium prepulse failed to show significant changes in
estimated [Ca2+]i when CBF changed (Figure 4-5/A), even when the estimated [Ca2+]i
was corrected for changes in the Kd of fura-2 due to pH (Lattanzio & Bartschat, 1991;
Browning & Wilkins, 2002). Although measurement of the fura-2 fluorescence of the
whole cell does not exclude the possibility of a localized rise in [Ca2+] in a subcellular
compartment, this possibility is unlikely since the absence of calcium in intracellular
stores as well as in the extracellular space did not change the results. The

72
physicochemical effect of increasing pH to decrease the concentration of ionized
calcium cannot account for the rise in CBF during alkalization as the opposite, namely a
decrease in CBF, would have been expected.
Our experiments on permeabilized cells (Figure 4-6, Figure 4-7) further confirm
that CBF is regulated by pHi and rule out the possibility that CBF changes during
ammonium prepulse were coupled to changes in extra- or intracellular NH4+ and/or NH3
concentrations rather than to changes in pHi. That ciliary beating was not completely
abolished in our permeabilized cells after 7 min perfusion with ATP and ARS-free
bathing solution could be due to the presence of non-diffusible pools of nucleotides
(Malaisse & Sener, 1987; Aprille, 1988; Detimary et al., 1996) and by residual
production of ATP close to cilia.
Together, these data suggest that phosphorylation/dephosphorylation events and
changes in [Ca2+]i are not responsible for the pHi–mediated changes in CBF and support
a direct action of pHi on axonemal proteins. Studies performed on demembranated
mammalian spermatozoa are of special interest in this regard because cilia and sperm
flagella share considerable ultrastructural similarities as well as some similarities in
their beat regulation, e.g. by PKA (for review see, Urner & Sakkas, 2003). Most
published experiments on demembranated spermatozoa demonstrate that mild
alkalization augments flagellar beat frequency (FBF) of spermatozoa of different
species (Gibbons & Gibbons, 1972; Brokaw & Kamiya, 1987; Keskes et al., 1998a).
One of these studies (Keskes et al., 1998a) also showed that human spermatozoa that
lack outer dynein arms failed to increase beat frequency during alkalization suggesting
that outer dynein arms, that mainly determine the frequency of ciliary beating (Brokaw
& Kamiya, 1987), might be directly involved in the response to changing pHi. Whether
the effects of pH on spermatozoa are mediated through the same mechanisms, remains
unclear since some of the pH effects in spermatozoa could be due to the activation of
sAC.
Our results show that intracellular alkalization results in faster ciliary beating,
while intracellular acidification attenuates CBF in human tracheobronchial epithelial
cells. Variations in pHi of airway epithelia may occur in vivo in response to shifting
luminal CO2 concentrations from 5% to 0.02% during a full breathing cycle (Willumsen

73
& Boucher, 1992). It is intriguing to speculate that a possible pHi change during the
breathing cycle might influence CBF in the large airways. If it occurs, it would result in
a faster ciliary beating during inspiration. Furthermore, airway diseases associated with
acidification of the surface liquid and possibly epithelium (e.g. asthma) could depress
ciliary activity, possibly contributing to the decrease in mucociliary clearance seen in
these diseases.
5.2. Expression of sAC in human airway epithelial cells
Our RT-PCR, immunoblot and immunostaining studies have shown the first time
that sAC is expressed in normal ciliated HAECs, both in tracheal tissue and cell culture.
Recently, Calu-3 cells, a human adenocarcinoma cell line with airway serous cell
properties, have also been shown to express sAC (Sun et al., 2004; Wang et al., 2005).
Our immunohistochemical (Figure 4-10) and immunocytochemical (Figure 4-11)
studies clearly demonstrate that sAC is expressed in the apical membrane and in the
cilia of HAECs. Within the cilia, sAC is co-localized with ciliary tubulin.
Our RT-PCR studies revealed cDNA fragments of three different sizes. The
shortest fragment was 100% identical to position 388-630 of human sAC cDNA (gi
21614540, NM 018417). Four clones of the medium sized fragment were sequenced,
two of which were 100% identical to a recently published sAC variant containing 37
extra 5’-nucleotides to exon 5 derived from the intron sequence (Geng et al., 2005).
However, two other clones showed variability in one base and one of them also missed
a T (Figure 4-8/D). We have also found a heretofore unpublished sAC transcript
containing an additional 12 bps of intron sequence, in addition to the 37 bps of the
already published sAC-variant. In addition to these sAC-transcript variants, a sAC
variant missing the entire exon 5 has also been described recently (Geng et al., 2005).
The reverse primer we used overlapped exon 5 and 6, therefore this short sAC-transcript
missing exon 5 might have escaped our notice. It is not clear whether all these variant
transcripts actually give rise to distinct polypeptides (Geng et al., 2005).
The preliminary experiment shown in Figure 4-12 suggests that increasing
[HCO3-]i results in faster ciliary beating in HAEC. In these experiments we used the

74
detergent saponin, instead of the pore forming agent Staphylococcus aureus alpha-toxin,
in order to achieve a better permeability of the basolateral membrane. Another advance
of saponin is that, as we found, cells become permeabilized randomly following a short
exposure to this detergent. This feature allowed us to perform simultaneous control
experiment using cells with intact basolateral membrane from the same culture.
However, we were also faced to some technical difficulties. Permeabilization by
saponin developed suddenly and overexposure of permeabilized cells to saponin often
resulted in cellular death. Monitoring of CBF in the absence of basolateral ATP during
saponin-exposure helped us to recognize immediately when basolateral membrane had
become permeable (indicated by falling CBF resulting from leaking ATP) and thus, to
withdraw saponin right away.
The opposite CBF-response on CO2/HCO3--containing solution in permeabilized
and intact cells suggests a HCO3-- rather than a pHi-effect; the increase in CBF in
permeabilized cells following exposure to CO2/HCO3- cannot be attributed to
intracellular alkalization, because basolateral pH was constant (kept at 7.2) and the
basolateral membrane was supposed to be freely permeable to both CO2 and HCO3-.
Indeed, if any change in pHi occurred, one can expect a slight cytosolic acidification
because of apical CO2-load without any significant apical HCO3--influx. However,
further studies, e.g. experiments using specific sAC- and PKA-inhibitors are needed to
demonstrate that HCO3--related increase in CBF results from sAC-activation and
cAMP-production.
Although here we have shown that sAC is expressed in the cilia of human ciliated
airway epithelial cells and our preliminary results on basolaterally permeabilized cells
loaded with CO2/HCO3- suggest that sAC is involved in the regulation of CBF, the
physiological role of sAC in these cells remains to be defined. One possible function of
sAC is to maintain a certain concentration of cAMP in the ciliary shaft. As mentioned in
section 1.3.4, rising [Ca2+]i has no effect on CBF in the absence of cAMP (Ma et al.,
2002). sAC, as an enzyme which is regulated independently of G-protein coupled
receptors but can be activated by certain cytosolic ions, might be a constitutive source
of cAMP in the ciliary compartment. Patch-clamp experiments reported by Ma et al.
(Ma et al., 2002) supports this hypothesis: in the absence of cAMP in the pipette
solution (i.e., cytosolic solution), CBF did not differ in cells perfused with a pipette
75
solution containing less than 1 nM Ca2+ compared to those cells which were perfused
with 100 nM or even 500 nM of Ca2+. Importantly, the pipette solutions in these
experiments did not contain any ion which is a known activator of sAC. Furthermore, an
apparent contradiction between these patch-clamp experiments and an older study of
basolaterally permeabilized canine tracheal epithelium (Kakuta et al., 1985), where
CBF was shown to be regulated by cytosolic Ca2+ in the absence of externally applied
cAMP could also be explained by this hypothesis: basolateral (i.e., intracellular)
solution used in the latter experiments contained SO3--ion, which is a weak activator of
sAC in vitro (Chen et al., 2000). Further studies from our laboratory not presented here
have shown that several types of tmACs, namely type 1 (tmAC1), tmAC3 and tmAC8
are also expressed in HAECs (Sutto et al., 2005). However, immunocytochemistry has
shown that none of them is colocalized with ciliary tubulin (figure not shown) further
supporting the theory that cAMP produced by sAC has a special role in the regulation of
ciliary beating.
Speculatively, sAC might also function as a buffer of pHi-related CBF alterations.
As we have shown, cellular CO2-load results in a fall in CBF because of cytosolic
acidification. Cellular CO2-load will shift the equation (1) to the left:
(1) H+ + HCO3- ⇔ CO2 + H2O.
Therefore, increasing [HCO3-]i might produce cAMP through the activation of
sAC, counterbalancing the attenuation of CBF upon increasing H+-concentration (i.e.,
acidification). In contrast to CO2-load, acidification caused by H+-load will result in a
decrease in [HCO3-]i as equation (1) will be shifted to the right; therefore sAC activation
by HCO3- will not be expected. However, a latest report has demonstrated that two
(randomly selected) prokaryotic adenylyl cyclases, Slr1991 and CyaB1, are actually
stimulated by dissolved CO2 and not by HCO3- (Hammer et al., 2006). If this result
could be extrapolated to human sAC, CBF decrease upon cellular H+-load could also be
opposed by sAC-related cAMP-production, however, our experiments using ammonium
prepulse showed that there was no significant difference in pHi-related CBF-transients
when protein kinase inhibitors were used (but those experiments were performed in the
virtual absence of CO2 and in open chamber).

76
5.3. Expression and putative function of catecholamine transporters in
human airway epithelial cells
RT-PCR using specific primers for four different catecholamine transporters
demonstrated the expression of OCT-1, EMT and NET in HAECs. Freshly isolated
human bronchial arterial smooth muscle cells expressed the same extraneuronal NE
transporters, i.e. OCT-1 and EMT, therefore we used this model for characterizing NE
uptake assay, as described previously (Horvath et al., 2001; Horvath et al., 2002). NE
uptake was mainly mediated by EMT, being sensitive to the inhibitors corticosterone
and O-methyl-isoprenaline (OMI), specific blockers of EMT but not OCT-1 and OCT-2
(Martel et al., 1999; Hayer-Zillgen et al., 2002). NE uptake was acutely blockable by
various GSs including budesonide and methylprednisolone. The inhibitory action of
GSs was rapidly reversible, and mediated by a non-genomic pathway possibly through a
specific GS binding site in the plasma membrane.
The physiologic function of catecholamine transporters expressed in HAECs is
not completely understood. We hypothesize that they may have a role in inactivating
hydrophilic β-adrenoceptor agonist drugs (e.g., salbutamol, formoterol) by mediating
their cellular uptake into the airway epithelial cells. In this regard, the rapid inhibitory
effect by GSs on this transport process might be of importance providing additional
rationale for combined inhaled β2-agonist/GS therapy in obstructive lung disease
(Figure 4-15 and Figure 4-16). Physiological mechanisms presumably underlying the
favorable effects of this combinatory treatment include increasing β2-receptor
expression (Mak et al., 1995a), restoring G-protein/β2-receptor coupling (Mak et al.,
1995b), and inhibition of β2-receptor downregulation (Hadcock et al., 1989) induced by
inhaled GSs. Conversely, β2-agonists prime the glucocorticoid receptor and effect its
nuclear localization by modulating its phosphorylation (Eickelberg et al., 1999). The
mutual potentiation of GSs’ and β2-agonists’ action through these mechanisms involves
gene transcription and takes hours to manifest itself. Our results presented here are in
keeping with an earlier report of a rabbit model from our laboratory (Horvath et al.,
2001) and provide evidence of a rapid, nongenomic inhibitory action of GSs on EMT-
mediated cellular NE uptake. This GS-mediated effect could increase the local
77
concentration of β2-agonists at β2-adrenergic receptor sites and hence potentiate β-
agonists’ effect on airway epithelium and mucociliary activity.
However, several questions remain to be answered. First, our NE uptake
experiments were carried out in a human bronchial arterial smooth muscle cell model
expressing OCT-1 and EMT. Therefore, our data on catecholamine transport and the
potency of GSs to inhibit this transport are to be confirmed in HAECs, which seem to
express NET as well, besides OCTs. Steroid inhibition of NET has been reported
(Horishita et al., 2002; Toyohira et al., 2003), therefore it can be predicted that GSs will
inhibit catecholamine uptake in HAECs as well, similarly to vascular smooth muscle
cells.
The second issue to be considered is whether β2-agonists used in the clinical
practice are substrates for and thus functionally inactivated by the corresponding
catecholamine transporters, similarly to NE. Therefore, further uptake experiments are
needed using these drugs.
Third, the potential inhibition of β2-agonist uptake by airway epithelial cells
could theoretically decrease the inhaled drug’s availability in deeper tissue layers such
as bronchial smooth muscle cells, the main target of β2-adrenergic agonist drugs.
Although there have no clinical data been reported supporting such a disadvantageous
effect of the combinatory inhaled β2-agonist/GS therapy, additional in vitro (e.g.,
transport studies on polarized epithelial cell culture) and in vivo studies are necessary to
clarify this issue.
A most recent study by Lips et al. has shown the expression of all three isoforms
of OCTs in HAECs (Lips et al., 2005). The reason for the discrepancy between this
report and our results regarding OCT-2 expression is not clear and might be explained
by methodological differences (e.g., mRNA extraction from cultured and
redifferentiated vs. abraded epithelial cells). The remaining NE uptake after blocking
EMT by corticosterone (Figure 4-14) could suggest the presence of functional OCT-2
or even OCT-1, which transporters are less sensitive to corticosterone (Hayer-Zillgen et
al., 2002). However, the experiment depicted in Figure 4-16 makes this assumption less
likely since concentrations of corticosterone > 1 µM did not decrease uptake into the
cells as would have been expected if OCT-2 or OCT-1 were to play a role, given the

78
IC50 of their inhibition by corticosterone, which is 34.2 µM and 21.7 µM, respectively
(Hayer-Zillgen et al., 2002). Alternatively, the remaining NE uptake after inhibition
could result from nonspecific uptake, possibly related to the measurement technique, or
less likely due to binding of NE to receptors on the cell surface.
Interestingly, besides the extraneuronal NE transporters (OCT-1 and EMT),
cultured HAECs seem to express the neuronal NE transporter (NET) mRNA as well.
Furthermore, total RNA sample from human kidney (purchased from Ambion, Austin,
TX, USA), also contained NET mRNA. NET has been known to be localized mainly at
sympathetic synapses (Koepsell et al., 2003). Besides being expressed in neurons and
adrenal neuroendocrine (chromaffine) cells, NET has been reported in some
extraneuronal tissues, namely in placenta and pulmonary capillary endothelial cells
(Eisenhofer, 2001; Bottalico et al., 2004). The known principal function of NET is
deactivating catecholamines. At the adrenergic synaptic cleft, NET participates in
terminating the activation of postsynaptic receptors; in pulmonary capillaries, NET
clears circulating catecholamines from the bloodstream; placental NET is supposed to
serve as a protective mechanism preventing vasoconstriction in the placental vascular
bed securing a stable blood flow to the fetus (Catravas & Gillis, 1983; Bryan-Lluka et
al., 1992; Westwood et al., 1996; Eisenhofer, 2001; Koepsell et al., 2003). However, to
our knowledge, neither in airway epithelial cells nor in kidney has NET expression been
reported thus far. Although contamination with neuronal mRNA might be possible in
the total RNA sample from human kidney, it seems unlikely in the case of HAECs,
since there is no evidence for adrenergic neurons in the surface epithelium of the human
bronchi (Partanen et al., 1982; Wanner et al., 1996; Belvisi, 2002). However, further
experiments, including immunofluorescence and functional studies are necessary to
confirm this result.
Perhaps the most significant implication of OCTs in airway epithelium is their
ability to mediate cellular ACh release, an attribute of the newly discovered
autocrine/paracrine non-neuronal cholinergic systems (Wessler & Kirkpatrick, 2001;
Wessler et al., 2003). Such an autocrine cholinergic regulation has been suggested in
many tissues (Wessler et al., 2003). An earlier functional study carried out in human
placenta, a useful model of non-neuronal cholinergic systems, suggested that ACh was
released by OCT-1 and EMT (Wessler et al., 2001). A most recent report by Lips et al.
79
mentioned above (Lips et al., 2005) has provided evidence that all three isoforms of
OCTs are expressed in the ciliated cells of human airway, are located in the luminal
membrane of ciliated cells, and two of them, OCT-1 and OCT-2 (but not EMT) mediate
ACh uptake and efflux when expressed in Xenopus laevis oocytes. Moreover,
budesonide (but not beclomethasone) inhibited OCT-2 mediated ACh efflux (Lips et al.,
2005). Human bronchial epithelium possesses all the components essential for a
functioning non-neuronal cholinergic system (Proskocil et al., 2004; Lips et al., 2005),
the physiological role of which, however, has not yet been elucidated. Several data
suggest that non-neuronal ACh release may contribute to CBF regulation in the airways
(as discussed in paragraph 1.2.3.2). Certainly, the bronchial non-neuronal cholinergic
system is a new, promising field of research in airway pathophysiology.
Taking these data together further conclusions can be drawn. An expression
pattern of OCTs, β-adrenergic receptors and NET in airway epithelial cells can make
one speculate that an extraneuronal adrenergic autocrine/paracrine system, similarly to
the non-neuronal cholinergic system, exists in the airway epithelium. This hypothesis,
although clearly speculative, could be supported by certain facts. First, OCTs, as bi-
directional transporters, are able to mediate not only uptake but also efflux of
catecholamines (Koepsell et al., 2003; Ciarimboli & Schlatter, 2005). Considering that
epinephrine is more potent stimulator of β-adrenergic receptors than NE, it is
noteworthy that, in terms of substrate specificity, both OCT-1 and EMT prefer
epinephrine over NE (Martel et al., 1999; Eisenhofer, 2001). Second, although the
expression of β-adrenergic receptors in HAEC has long been known, the physiological
source of their ligand has not been identified thus far. It seems very likely that
circulating catecholamines are unable to reach these receptors, at least those ones
expressed in the apical plasmamembrane (Wong et al., 1988a), and neuronal activation
is also impossible because bronchial surface epithelium seems to lack adrenergic
innervation (Partanen et al., 1982; Wanner et al., 1996). Looking for a physiological
source of β-adrenergic receptor ligand in the airway lumen, inflammatory cells appear
to be possible candidates, inasmuch they synthesize and secrete catecholamines
(Spengler et al., 1994; Musso et al., 1996; Bergquist & Silberring, 1998). Although this
hypothesis might be reasonable, lymphocytes seem to synthesize primarily NE (Musso
et al., 1996; Bergquist & Silberring, 1998; Musso et al., 1998), which is less potent
80
activator of β2-adrenergic receptors than epinephrine. The other possibility is that
airway epithelial cells release epinephrine, which would not be unprecedented:
epithelial cells in the skin, namely keratinocytes do synthesize and release both NE and
epinephrine thereby regulating keratinocyte differentiation in an autocrine, and
melanogenesis in melanocytes in a paracrine way (Schallreuter et al., 1992; Schallreuter
et al., 1995; Gillbro et al., 2004). In contrast to the known autocrine systems in HAEC
(i.e., the purinergic and the non-neuronal cholinergic system), which primarily regulate
[Ca2+]i, the extraneuronal β-adrenergic system would be an autocrine regulator of
intracellular cAMP, maybe in orchestration with sAC, perhaps in different subcellular
compartments. However, all these speculations should be confirmed by proving that
HAECs possess the armament for autocrine catecholaminergic regulation, i.e. that they
express the enzymes involved in the biosynthesis and degradation of catecholamines. If
this autocrine machinery existed in airway epithelium, NET and/or OCTs might be
responsible for catecholamine ‘reuptake’ into HAECs.

81
6. CONCLUSIONS
Our experiments presented here provide novel information on the regulation of
ciliary beating in HAECs.
1. Here we have shown the first time that intracellular acidification attenuates, while
intracellular alkalization augments ciliary beating in HAECs.
2. Phosphorylation/dephosphorylation events and [Ca2+]i changes do not mediate pHi-
induced CBF changes. pHi might directly act on the ciliary motile machinery.
3. RT-PCR, Western blotting, immunohisto- and immunocytochemical studies
revealed that ciliated HAECs express sAC, a recently cloned unique adenylyl
cyclase, which is regulated by certain cytosolic ions like HCO3- and Ca2+, but
independent of pHi-changes and G-protein regulation.
4. Immunofluorescence studies in tracheal tissue and cultured HAECs have shown
that sAC is located in the cilia and in the apical membrane of ciliated HAECs. Our
preliminary functional studies suggest that sAC may be involved in the regulation of
CBF.
5. We have also demonstrated that HAECs express mRNA for extraneuronal (OCT1,
EMT) and neuronal (NET) catecholamine transporters.
6. Using a model of airway vascular smooth muscle cell expressing OCT1 and EMT,
we have shown that NE uptake is acutely and reversibly blockable by a non-genomic
action of various GSs including budesonide and methylprednisolone.
82
SUMMARY
BACKGROUND. Ciliary function has a pivotal role in airway mucus clearance,
but the regulation of ciliary beat frequency (CBF) is still not completely understood. In
these studies we focused on two issues. (i) In human airway epithelial cells (HAEC),
transmembrane adenylyl cyclases (tmAC) are the only known source of cAMP. Soluble
adenylyl cyclase (sAC), a recently cloned enzyme, regulates flagellar motility in sperm.
In contrast to tmACs, sAC is insensitive to G-protein activation, but is stimulated by
HCO3-, independently of H+. Here we examined the expression and cellular distribution
of sAC in HAECs. Because functional experiments of sAC are complicated by the fact
that intracellular HCO3- concentration and intracellular pH (pHi) correlate, and neither
has ever been examined for ciliary effects, we also studied how pHi itself influences
CBF in HAECs. (ii) β-adrenergic agonists are the most important ciliostimulant drugs
of airway epithelium. Organic cation transporters (OCT) mediate non-neuronal
norepinephrine (NE) uptake and thus, inactivate NE at adrenergic receptors. NE uptake
by certain OCTs has been reported to be inhibited by glucocorticoids (GSs), thereby
increasing NE concentration at receptor sites. We hypothesized that inhaled β-
adrenergic agonists could also be potentiated by GSs inhibiting their uptake into
HAECs, and thus enhancing ciliostimulation. Therefore we tested the expression of
OCTs in HAECs and examined the characteristics, including GS-inhibition, of NE
transport.
RESULTS. (i) We have shown that sAC (both mRNA and protein) is expressed in
HAECs. Confocal microscopy localized sAC in the ciliary shaft, co-localizing with
axonemal tubulin. Preliminary functional studies have suggested that cytosolic HCO3-
stimulates CBF in HAECs. We also demonstrated that relatively small changes in pHi
result in significant changes in CBF in HAECs (increasing pHi increases CBF and vice
versa). Changing pHi may directly act on the ciliary motile machinery, as the
involvement of the kinase/phosphatase system, Ca2+ and sAC has been excluded. (ii)
mRNA for certain OCTs (OCT-1 and EMT) as well as neuronal epinephrine transporter
(NET) are expressed in HAECs. NE uptake of airway vascular smooth muscle cells
expressing both OCT-1 and EMT was acutely inhibited by GSs in a non-genomic way.
83
Further experiments are needed to define the role of catecholamine transporters
expressed by HAECs.

84
ÖSSZEFOGLALÁS
A légúti mucociliáris clearance fenntartásában a ciliumok működésének
kulcsszerepe van, azonban a ciliumok csapási frekvenciája (CBF) szabályozásának sok
részlete még tisztázatlan. Jelen vizsgálataink két kérdés tanulmányozását célozták. (i)
Az emberi légúti hámsejtek (HAEC) jelenleg ismert ciklikus AMP-t (cAMP) termelő
enzimei az ún. transzmembrán adenilciklázok (tmAC) csoportjába tartoznak. Egy
újonnan klónozott enzim, a szolubilis adenilcikláz (sAC) részt vesz a spermiumok
ostormozgásának szabályozásában. A sAC a tmAC-októl elkülönülő csoportot képez:
szemben a tmAC-okkal, működését nem befolyásolja a G-protein, viszont aktiválja a
HCO3--ion (függetlenül a pH-tól). Jelen kísérleteinkben egyrészt a sAC HAEC-ekben
való expresszióját és sejten belüli lokalizációját vizsgáltuk. Mivel a sAC funkcionális
vizsgálatát nehezíti az a tény, hogy a sejten belüli HCO3--koncentráció ([HCO3
-]i) és pH
(pHi) összefüggnek, és mind a [HCO3-]i, mind a pHi CBF-ra gyakorolt hatása
ismeretlen, jelen tanulmányban azt is megvizsgáltuk, hogy maga a pHi változása hogyan
hat a CBF-ra ezekben a sejtekben. (ii) A β-agonisták a legfontosabb ismert
ciliostimuláns gyógyszerek a légúti hám esetében. Az organikus kation transporterek
(OCT) felelősek a nem-neuronális sejtekbe történő noradrenalin (NE) felvételért és
ezáltal részt vesznek a NE inaktiválásában. A glukokortikoszteroidok (GS) gátolják a
bizonyos OCT-eken keresztül történő NE-felvételt és így növelhetik a NE
koncentrációját az adrenerg receptorok környezetében. Hasonló mechanizmust
feltételezve az inhalált β-agonisták és a HAEC-ek esetében, megvizsgáltuk az OCT-ek
expresszióját a HAEC-ekben és a NE transzport OCT-ek általi transzportjának
jellemzőit és a GS-ok gátló hatását is.
EREDMÉNYEK. (i) Kimutattuk mind a sAC mRNS, mind a sAC fehérje jelenlétét a
HAEC-ekben. Konfokális mikroszkóp segítségével a sAC a csillószőrös HAEC-ek
felszíni plazmamembránjában és magában a ciliumokban volt látható. A csillószőrökben
a sAC a tubulinnal azonos lokalizációban jelent meg. Funkcionális vizsgálataink kezdeti
eredményei arra utalnak, hogy a sejten belüli HCO3- serkenti a CBF-t ezekben a
sejtekben. Azt is kimutattuk, hogy relatíve kis pHi változás jelentős CBF változást
eredményez a HAEC-ekben (emelkedő pHi növeli a CBF-t és vica versa). A pHi
változás valószínűleg közvetlenül a ciliaris proteineken keresztül fejti ki ezt a hatását,
85
mivel a kináz/foszfatáz rendszer, a citoplazmatikus Ca2+ és a sAC szerepét kísérleteink
kizárták. (ii) Egyes OCT fehérjéket (OCT-1 és EMT), csakúgy, mint a neuronális
adrenalin transportert (NET) kódoló mRNS kimutatható volt a HAEC-ekben. A NE-
felvételt akutan, nem-genomiális mechanizmussal blokkolták a GS-ok mind az OCT-1,
mind az EMT mRNS-ét expresszáló légúti vascularis simaizomsejtekben. További
vizsgálatok szükségesek a katekolamin transzporterek HAEC-ekben betöltött élettani
szerepének tisztázásához.

86
REFERENCES
ADLER, K. B., CHENG, P. W. & KIM, K. C. (1990). Characterization of guinea pig tracheal epithelial cells maintained in biphasic organotypic culture: cellular composition and biochemical analysis of released glycoconjugates. American Journal of Respiratory Cell & Molecular Biology 2, 145-154.
ALLEN-GIPSON, D. S., ROMBERGER, D. J., FORGET, M. A., MAY, K. L., SISSON, J. H. & WYATT, T. A. (2004). IL-8 inhibits isoproterenol-stimulated ciliary beat frequency in bovine bronchial epithelial cells. J Aerosol Med 17, 107-115.
APRILLE, J. R. (1988). Regulation of the mitochondrial adenine nucleotide pool size in liver: mechanism and metabolic role. FASEB Journal 2, 2547-2556.
BARBAR, E., KLEINMAN, B., IMHOFF, D., LI, M., HAYS, T. S. & HARE, M. (2001). Dimerization and folding of LC8, a highly conserved light chain of cytoplasmic dynein. Biochemistry 40, 1596-1605.
BATEMAN, J. R., PAVIA, D., SHEAHAN, N. F., AGNEW, J. E. & CLARKE, S. W. (1983a). Impaired tracheobronchial clearance in patients with mild stable asthma. Thorax 38, 463-467.
BATEMAN, J. R., PAVIA, D., SHEAHAN, N. F., NEWMAN, S. P. & CLARKE, S. W. (1983b). Effects of terbutaline sulphate aerosol on bronchodilator response and lung mucociliary clearance in patients with mild stable asthma. Br J Clin Pharmacol 15, 695-700.
BAUM, G. L., ZWAS, S. T., KATZ, I. & ROTH, Y. (1990). Mucociliary clearance from central airways in patients with excessive sputum production with and without primary ciliary dyskinesia. Chest 98, 608-612.
BELVISI, M. G. (2002). Overview of the innervation of the lung. Curr Opin Pharmacol 2, 211-215.
BENNETT, W. D., ALMOND, M. A., ZEMAN, K. L., JOHNSON, J. G. & DONOHUE, J. F. (2006). Effect of salmeterol on mucociliary and cough clearance in chronic bronchitis. Pulm Pharmacol Ther 19, 96-100.
87
BERGER, J., ALBERT, R. E., SANBORN, K. & LIPPMANN, M. (1978). Effects of atropine and methacholine on deposition and clearance of inhaled particles in the donkey. J Toxicol Environ Health 4, 587-604.
BERGQUIST, J. & SILBERRING, J. (1998). Identification of catecholamines in the immune system by electrospray ionization mass spectrometry. Rapid Commun Mass Spectrom 12, 683-688.
BERNACKI, S. H., NELSON, A. L., ABDULLAH, L., SHEEHAN, J. K., HARRIS, A., DAVIS, C. W. & RANDELL, S. H. (1999). Mucin gene expression during differentiation of human airway epithelia in vitro. Muc4 and muc5b are strongly induced. American Journal of Respiratory Cell & Molecular Biology 20, 595-604.
BEVENSEE, M. O., BASHI, E. & BORON, W. F. (1999). Effect of trace levels of nigericin on intracellular pH and acid-base transport in rat renal mesangial cells. Journal of Membrane Biology 169, 131-139.
BHAKDI, S., BAYLEY, H., VALEVA, A., WALEV, I., WALKER, B., KEHOE, M. & PALMER, M. (1996). Staphylococcal alpha-toxin, streptolysin-O, and Escherichia coli hemolysin: prototypes of pore-forming bacterial cytolysins. Archives of Microbiology 165, 73-79.
BHAKDI, S. & TRANUM-JENSEN, J. (1991). Alpha-toxin of Staphylococcus aureus. Microbiological Reviews 55, 733-751.
BORON, W. F., WAISBREN, S. J., MODLIN, I. M. & GEIBEL, J. P. (1994). Unique permeability barrier of the apical surface of parietal and chief cells in isolated perfused gastric glands. Journal of Experimental Biology 196, 347-360.
BOTTALICO, B., LARSSON, I., BRODSZKI, J., HERNANDEZ-ANDRADE, E., CASSLEN, B., MARSAL, K. & HANSSON, S. R. (2004). Norepinephrine transporter (NET), serotonin transporter (SERT), vesicular monoamine transporter (VMAT2) and organic cation transporters (OCT1, 2 and EMT) in human placenta from pre-eclamptic and normotensive pregnancies. Placenta 25, 518-529.
BOYARSKY, G., GANZ, M. B., STERZEL, R. B. & BORON, W. F. (1988). pH regulation in single glomerular mesangial cells. I. Acid extrusion in absence and presence of HCO3. American Journal of Physiology 255, C844-856.
88
BRAUN, T. & DODS, R. F. (1975). Development of a Mn-2+-sensitive, "soluble" adenylate cyclase in rat testis. Proc Natl Acad Sci U S A 72, 1097-1101.
BRAUN, T., FRANK, H., DODS, R. & SEPSENWOL, S. (1977). Mn2+-sensitive, soluble adenylate cyclase in rat testis. Differentiation from other testicular nucleotide cyclases. Biochim Biophys Acta 481, 227-235.
BRETT, C. L., KELLY, T., SHELDON, C. & CHURCH, J. (2002). Regulation of Cl--HCO3- exchangers by cAMP-dependent protein kinase in adult rat hippocampal CA1 neurons. Journal of Physiology 545, 837-853.
BROKAW, C. J. & KAMIYA, R. (1987). Bending patterns of Chlamydomonas flagella: IV. Mutants with defects in inner and outer dynein arms indicate differences in dynein arm function. Cell Motility & the Cytoskeleton 8, 68-75.
BROWNING, J. A. & WILKINS, R. J. (2002). The effect of intracellular alkalinisation on intracellular Ca(2+) homeostasis in a human chondrocyte cell line. Pflugers Arch 444, 744-751.
BRYAN-LLUKA, L. J., WESTWOOD, N. N. & O'DONNELL, S. R. (1992). Vascular uptake of catecholamines in perfused lungs of the rat occurs by the same process as Uptake1 in noradrenergic neurones. Naunyn Schmiedebergs Arch Pharmacol 345, 319-326.
BUCK, J., SINCLAIR, M. L., SCHAPAL, L., CANN, M. J. & LEVIN, L. R. (1999). Cytosolic adenylyl cyclase defines a unique signaling molecule in mammals. Proc Natl Acad Sci U S A 96, 79-84.
BUCK, K. J. & AMARA, S. G. (1995). Structural domains of catecholamine transporter chimeras involved in selective inhibition by antidepressants and psychomotor stimulants. Mol Pharmacol 48, 1030-1037.
CAMMER, P., STRANDBERG, K. & PHILIPSON, K. (1974). Increased mucociliary transport by cholinergic stimulation. Arch Environ Health 29, 220-224.
CAMNER, P., MOSSBERG, B. & PHILIPSON, K. (1973). Tracheobronchial clearance and chronic obstructive lung disease. Scand J Respir Dis 54, 272-281.

89
CARLISLE, D. L., HOPKINS, T. M., GAITHER-DAVIS, A., SILHANEK, M. J., LUKETICH, J. D., CHRISTIE, N. A. & SIEGFRIED, J. M. (2004). Nicotine signals through muscle-type and neuronal nicotinic acetylcholine receptors in both human bronchial epithelial cells and airway fibroblasts. Respir Res 5, 27.
CATRAVAS, J. D. & GILLIS, C. N. (1983). Single-pass removal of [14C]-5-hydroxytryptamine and [3H]norepinephrine by rabbit lung, in vivo: kinetics and sites of removal. J Pharmacol Exp Ther 224, 28-33.
CHEN, Y., CANN, M. J., LITVIN, T. N., IOURGENKO, V., SINCLAIR, M. L., LEVIN, L. R. & BUCK, J. (2000). Soluble adenylyl cyclase as an evolutionarily conserved bicarbonate sensor. Science 289, 625-628.
CHILVERS, M. A. & O'CALLAGHAN, C. (2000). Local mucociliary defence mechanisms. Paediatr Respir Rev 1, 27-34.
CIARIMBOLI, G. & SCHLATTER, E. (2005). Regulation of organic cation transport. Pflugers Arch 449, 423-441.
CLAPP, L. H. & GURNEY, A. M. (1991). Outward currents in rabbit pulmonary artery cells dissociated with a new technique. Exp Physiol 76, 677-693.
CLARY-MEINESZ, C., MOUROUX, J., COSSON, J., HUITOREL, P. & BLAIVE, B. (1998a). Influence of external pH on ciliary beat frequency in human bronchi and bronchioles. Eur Respir J 11, 330-333.
CLARY-MEINESZ, C., MOUROUX, J., COSSON, J., HUITOREL, P. & BLAIVE, B. (1998b). Influence of external pH on ciliary beat frequency in human bronchi and bronchioles. Eur Respir J 11, 330-333.
COHEN, P., KLUMPP, S. & SCHELLING, D. L. (1989). An improved procedure for identifying and quantitating protein phosphatases in mammalian tissues. FEBS Lett 250, 596-600.
COX, S. & TAYLOR, S. S. (1995). Kinetic analysis of cAMP-dependent protein kinase: mutations at histidine 87 affect peptide binding and pH dependence. Biochemistry 34, 16203-16209.

90
DAGHER, P. C., CHAWLA, H., MICHAEL, J., EGNOR, R. W. & CHARNEY, A. N. (1997). Modulation of chloride secretion in the rat ileum by intracellular bicarbonate. Comp Biochem Physiol A Physiol 117, 89-97.
DAGHER, P. C., MORTON, T. Z., JOO, C. S., TAGLIETTA-KOHLBRECHER, A., EGNOR, R. W. & CHARNEY, A. N. (1994). Modulation of secretagogue-induced chloride secretion by intracellular bicarbonate. Am J Physiol 266, G929-934.
DAVIES, C. P. & WEBSTER, A. J. (1989). The effects of a beta 2-agonist (clenbuterol), and anti-bacterial drugs (trimethoprim with sulphadiazine; oxytetracycline) on calf mucociliary clearance. J Vet Pharmacol Ther 12, 217-224.
DAVIES, S. P., REDDY, H., CAIVANO, M. & COHEN, P. (2000). Specificity and mechanism of action of some commonly used protein kinase inhibitors. Biochem J 351, 95-105.
DAVIS, C. W., DOWELL, M. L., LETHEM, M. & VAN SCOTT, M. (1992). Goblet cell degranulation in isolated canine tracheal epithelium: response to exogenous ATP, ADP, and adenosine. Am J Physiol 262, C1313-1323.
DE LA TORRE, J. C. (1980). Standardization of the sucrose-potassium phosphate-glyoxylic acid histofluorescence method for tissue monoamines. Neurosci Lett 17, 339-340.
DETIMARY, P., JONAS, J. C. & HENQUIN, J. C. (1996). Stable and diffusible pools of nucleotides in pancreatic islet cells. Endocrinology 137, 4671-4676.
DEVALIA, J. L., SAPSFORD, R. J., RUSZNAK, C., TOUMBIS, M. J. & DAVIES, R. J. (1992). The effects of salmeterol and salbutamol on ciliary beat frequency of cultured human bronchial epithelial cells, in vitro. Pulm Pharmacol 5, 257-263.
DI BENEDETTO, G., MAGNUS, C. J., GRAY, P. T. & MEHTA, A. (1991a). Calcium regulation of ciliary beat frequency in human respiratory epithelium in vitro. J Physiol 439, 103-113.
DI BENEDETTO, G., MANARA-SHEDIAC, F. S. & MEHTA, A. (1991b). Effect of cyclic AMP on ciliary activity of human respiratory epithelium. Eur Respir J 4, 789-795.

91
EICKELBERG, O., ROTH, M., LORX, R., BRUCE, V., RUDIGER, J., JOHNSON, M. & BLOCK, L. H. (1999). Ligand-independent activation of the glucocorticoid receptor by beta2-adrenergic receptor agonists in primary human lung fibroblasts and vascular smooth muscle cells. Journal of Biological Chemistry 274, 1005-1010.
EISENHOFER, G. (2001). The role of neuronal and extraneuronal plasma membrane transporters in the inactivation of peripheral catecholamines. Pharmacol Ther 91, 35-62.
ESPOSITO, G., JAISWAL, B. S., XIE, F., KRAJNC-FRANKEN, M. A., ROBBEN, T. J., STRIK, A. M., KUIL, C., PHILIPSEN, R. L., VAN DUIN, M., CONTI, M. & GOSSEN, J. A. (2004). Mice deficient for soluble adenylyl cyclase are infertile because of a severe sperm-motility defect. Proc Natl Acad Sci U S A 101, 2993-2998.
EVANS, R. K., SCHWARTZ, D. D. & GLADDEN, L. B. (2003). Effect of myocardial volume overload and heart failure on lactate transport into isolated cardiac myocytes. Journal of Applied Physiology 94, 1169-1176.
FAZIO, F. & LAFORTUNA, C. (1981). Effect of inhaled salbutamol on mucociliary clearance in patients with chronic bronchitis. Chest 80, 827-830.
FORTEZA, R., SALATHE, M., MIOT, F. & CONNER, G. E. (2005). Regulated hydrogen peroxide production by Duox in human airway epithelial cells. Am J Respir Cell Mol Biol 32, 462-469.
FOSTER, W. M., BERGOFSKY, E. H., BOHNING, D. E., LIPPMANN, M. & ALBERT, R. E. (1976). Effect of adrenergic agents and their mode of action on mucociliary clearance in man. J Appl Physiol 41, 146-152.
FOSTER, W. M., LANGENBACK, E. G. & BERGOFSKY, E. H. (1982). Lung mucociliary function in man: interdependence of bronchial and tracheal mucus transport velocities with lung clearance in bronchial asthma and healthy subjects. Ann Occup Hyg 26, 227-244.
FROHOCK, J. I., WIJKSTROM-FREI, C. & SALATHE, M. (2002). Effects of albuterol enantiomers on ciliary beat frequency in ovine tracheal epithelial cells. Journal of Applied Physiology 92, 2396-2402.
GATTO, L. A. (1993). Cholinergic and adrenergic stimulation of mucociliary transport in the rat trachea. Respir Physiol 92, 209-217.

92
GENG, W., WANG, Z., ZHANG, J., REED, B. Y., PAK, C. Y. & MOE, O. W. (2005). Cloning and characterization of the human soluble adenylyl cyclase. Am J Physiol Cell Physiol 288, C1305-1316.
GIBBONS, B. H. & GIBBONS, I. R. (1972). Flagellar movement and adenosine triphosphatase activity in sea urchin sperm extracted with triton X-100. Journal of Cell Biology 54, 75-97.
GILLBRO, J. M., MARLES, L. K., HIBBERTS, N. A. & SCHALLREUTER, K. U. (2004). Autocrine catecholamine biosynthesis and the beta-adrenoceptor signal promote pigmentation in human epidermal melanocytes. J Invest Dermatol 123, 346-353.
GIRARD, P. R. & KENNEDY, J. R. (1986). Calcium regulation of ciliary activity in rabbit tracheal epithelial explants and outgrowth. Eur J Cell Biol 40, 203-209.
GOODMAN, R. M., YERGIN, B. M., LANDA, J. F., GOLIVANUX, M. H. & SACKNER, M. A. (1978). Relationship of smoking history and pulmonary function tests to tracheal mucous velocity in non-smokers, young smokers, ex-smokers, and patients with chronic bronchitis. American Review of Respiratory Disease 117, 205-214.
GORBOULEV, V., ULZHEIMER, J. C., AKHOUNDOVA, A., ULZHEIMER-TEUBER, I., KARBACH, U., QUESTER, S., BAUMANN, C., LANG, F., BUSCH, A. E. & KOEPSELL, H. (1997). Cloning and characterization of two human polyspecific organic cation transporters. DNA Cell Biol 16, 871-881.
GROTH, M. L., LANGENBACK, E. G. & FOSTER, W. M. (1991). Influence of inhaled atropine on lung mucociliary function in humans. Am Rev Respir Dis 144, 1042-1047.
GRUNDEMANN, D., BABIN-EBELL, J., MARTEL, F., ORDING, N., SCHMIDT, A. & SCHOMIG, E. (1997). Primary structure and functional expression of the apical organic cation transporter from kidney epithelial LLC-PK1 cells. J Biol Chem 272, 10408-10413.
GRUNDEMANN, D., GORBOULEV, V., GAMBARYAN, S., VEYHL, M. & KOEPSELL, H. (1994). Drug excretion mediated by a new prototype of polyspecific transporter. Nature 372, 549-552.
93
GRUNDEMANN, D., SCHECHINGER, B., RAPPOLD, G. A. & SCHOMIG, E. (1998). Molecular identification of the corticosterone-sensitive extraneuronal catecholamine transporter. Nat Neurosci 1, 349-351.
GRUNDEMANN, D. & SCHOMIG, E. (2000). Gene structures of the human non-neuronal monoamine transporters EMT and OCT2. Hum Genet 106, 627-635.
GRYNKIEWICZ, G., POENIE, M. & TSIEN, R. Y. (1985). A new generation of Ca2+ indicators with greatly improved fluorescence properties. J Biol Chem 260, 3440-3450.
HADCOCK, J. R., WANG, H. Y. & MALBON, C. C. (1989). Agonist-induced destabilization of beta-adrenergic receptor mRNA. Attenuation of glucocorticoid-induced up-regulation of beta-adrenergic receptors. Journal of Biological Chemistry 264, 19928-19933.
HAMASAKI, T., BARKALOW, K., RICHMOND, J. & SATIR, P. (1991). cAMP-stimulated phosphorylation of an axonemal polypeptide that copurifies with the 22S dynein arm regulates microtubule translocation velocity and swimming speed in Paramecium. Proc Natl Acad Sci U S A 88, 7918-7922.
HAMASAKI, T., MURTAUGH, T. J., SATIR, B. H. & SATIR, P. (1989). In vitro phosphorylation of Paramecium axonemes and permeabilized cells. Cell Motil Cytoskeleton 12, 1-11.
HAMMER, A., HODGSON, D. R. & CANN, M. J. (2006). Regulation of prokaryotic adenylyl cyclases by carbon dioxide. Biochem J.
HAN, H., STESSIN, A., ROBERTS, J., HESS, K., GAUTAM, N., KAMENETSKY, M., LOU, O., HYDE, E., NATHAN, N., MULLER, W. A., BUCK, J., LEVIN, L. R. & NATHAN, C. (2005). Calcium-sensing soluble adenylyl cyclase mediates TNF signal transduction in human neutrophils. J Exp Med 202, 353-361.
HASANI, A., TOMS, N., AGNEW, J. E., LLOYD, J. & DILWORTH, J. P. (2005). Mucociliary clearance in COPD can be increased by both a D2/beta2 and a standard beta2 agonists. Respir Med 99, 145-151.
HASANI, A., TOMS, N., O'CONNOR, J., DILWORTH, J. P. & AGNEW, J. E. (2003). Effect of salmeterol xinafoate on lung mucociliary clearance in patients with asthma. Respir Med 97, 667-671.

94
HAYER-ZILLGEN, M., BRUSS, M. & BONISCH, H. (2002). Expression and pharmacological profile of the human organic cation transporters hOCT1, hOCT2 and hOCT3. Br J Pharmacol 136, 829-836.
HENSELING, M. (1983). Kinetic constants for uptake and metabolism of 3H-(-)noradrenaline in rabbit aorta. Possible falsification of the constants by diffusion barriers within the vessel wall. Naunyn Schmiedebergs Arch Pharmacol 323, 12-23.
HIDAKA, H., INAGAKI, M., KAWAMOTO, S. & SASAKI, Y. (1984). Isoquinolinesulfonamides, novel and potent inhibitors of cyclic nucleotide dependent protein kinase and protein kinase C. Biochemistry 23, 5036-5041.
HOMOLYA, L., STEINBERG, T. H. & BOUCHER, R. C. (2000). Cell to cell communication in response to mechanical stress via bilateral release of ATP and UTP in polarized epithelia. J Cell Biol 150, 1349-1360.
HORISHITA, T., MINAMI, K., YANAGIHARA, N., SHIRAISHI, M., OKAMOTO, T., SHIGA, Y., UENO, S. & SHIGEMATSU, A. (2002). Alphaxalone, a neurosteroid anesthetic, inhibits norepinephrine transporter function in cultured bovine adrenal medullary cells. Anesth Analg 95, 1661-1666, table of contents.
HORVATH, G., LIEB, T., CONNER, G. E., SALATHE, M. & WANNER, A. (2001). Steroid sensitivity of norepinephrine uptake by human bronchial arterial and rabbit aortic smooth muscle cells. Am J Respir Cell Mol Biol 25, 500-506.
HORVATH, G., TORBATI, A., CONNER, G. E., SALATHE, M. & WANNER, A. (2002). Systemic ovalbumin sensitization downregulates norepinephrine uptake by rabbit aortic smooth muscle cells. Am J Respir Cell Mol Biol 27, 746-751.
HORVATH, G. & WANNER, A. (2006). Inhaled corticosteroids: effects on the airway vasculature in bronchial asthma. Eur Respir J 27, 172-187.
HYBBINETTE, J. C. & MERCKE, U. (1982a). Effects of sympathomimetic agonists and antagonists on mucociliary activity. Acta Otolaryngol 94, 121-130.
HYBBINETTE, J. C. & MERCKE, U. (1982b). Effects of the parasympathomimetic drug methacholine and its antagonist atropine on mucociliary activity. Acta Otolaryngol 93, 465-473.

95
INGELS, K. J., KORTMANN, M. J., NIJZIEL, M. R., GRAAMANS, K. & HUIZING, E. H. (1991). Factors influencing ciliary beat measurements. Rhinology 29, 17-26.
INGELS, K. J., MEEUWSEN, F., GRAAMANS, K. & HUIZING, E. H. (1992). Influence of sympathetic and parasympathetic substances in clinical concentrations on human nasal ciliary beat. Rhinology 30, 149-159.
JAISWAL, B. S. & CONTI, M. (2003). Calcium regulation of the soluble adenylyl cyclase expressed in mammalian spermatozoa. Proc Natl Acad Sci U S A 100, 10676-10681.
JONAS, D., WALEV, I., BERGER, T., LIEBETRAU, M., PALMER, M. & BHAKDI, S. (1994). Novel path to apoptosis: small transmembrane pores created by staphylococcal alpha-toxin in T lymphocytes evoke internucleosomal DNA degradation. Infection & Immunity 62, 1304-1312.
KAKUTA, Y., KANNO, T., SASAKI, H. & TAKISHIMA, T. (1985). Effect of Ca2+ on the ciliary beat frequency of skinned dog tracheal epithelium. Respir Physiol 60, 9-19.
KANTHAKUMAR, K., CUNDELL, D. R., JOHNSON, M., WILLS, P. J., TAYLOR, G. W., COLE, P. J. & WILSON, R. (1994). Effect of salmeterol on human nasal epithelial cell ciliary beating: inhibition of the ciliotoxin, pyocyanin. Br J Pharmacol 112, 493-498.
KEKUDA, R., PRASAD, P. D., WU, X., WANG, H., FEI, Y. J., LEIBACH, F. H. & GANAPATHY, V. (1998). Cloning and functional characterization of a potential-sensitive, polyspecific organic cation transporter (OCT3) most abundantly expressed in placenta. J Biol Chem 273, 15971-15979.
KELSEN, S. G., HIGGINS, N. C., ZHOU, S., MARDINI, I. A. & BENOVIC, J. L. (1995). Expression and function of the beta-adrenergic receptor coupled-adenylyl cyclase system on human airway epithelial cells. Am J Respir Crit Care Med 152, 1774-1783.
KESKES, L., GIROUX-WIDEMANN, V., SERRES, C., PIGNOT-PAINTRAND, I., JOUANNET, P. & FENEUX, D. (1998a). The reactivation of demembranated human spermatozoa lacking outer dynein arms is independent of pH. Molecular Reproduction & Development 49, 416-425.

96
KESKES, L., GIROUX-WIDEMANN, V., SERRES, C., PIGNOT-PAINTRAND, I., JOUANNET, P. & FENEUX, D. (1998b). The reactivation of demembranated human spermatozoa lacking outer dynein arms is independent of pH. Mol Reprod Dev 49, 416-425.
KIENAST, K., RIECHELMANN, H., KNORST, M., SCHLEGEL, J., MULLERQUERNHEIM, J., SCHELLENBERG, J. & FERLINZ, R. (1994). An Experimental Model for the Exposure of Human Ciliated Cells to Sulfur Dioxide at Different Concentrations. Clinical Investigator 72, 215-219.
KNOWLES, M. R. & BOUCHER, R. C. (2002). Mucus clearance as a primary innate defense mechanism for mammalian airways. J Clin Invest 109, 571-577.
KNOWLES, M. R., CLARKE, L. L. & BOUCHER, R. C. (1991). Activation by extracellular nucleotides of chloride secretion in the airway epithelia of patients with cystic fibrosis. N Engl J Med 325, 533-538.
KOEPSELL, H., SCHMITT, B. M. & GORBOULEV, V. (2003). Organic cation transporters. Reviews of Physiology Biochemistry & Pharmacology 150, 36-90.
KOLLBERG, H., MOSSBERG, B., AFZELIUS, B. A., PHILIPSON, K. & CAMNER, P. (1978). Cystic fibrosis compared with the immotile-cilia syndrome. A study of mucociliary clearance, ciliary ultrastructure, clinical picture and ventilatory function. Scand J Respir Dis 59, 297-306.
KORNGREEN, A., MA, W., PRIEL, Z. & SILBERBERG, S. D. (1998). Extracellular ATP directly gates a cation-selective channel in rabbit airway ciliated epithelial cells. J Physiol 508 ( Pt 3), 703-720.
KULTGEN, P. L., BYRD, S. K., OSTROWSKI, L. E. & MILGRAM, S. L. (2002). Characterization of an A-kinase anchoring protein in human ciliary axonemes. Mol Biol Cell 13, 4156-4166.
KUMAR, S. D., BRIEVA, J. L., DANTA, I. & WANNER, A. (2000). Transient effect of inhaled fluticasone on airway mucosal blood flow in subjects with and without asthma. Am J Respir Crit Care Med 161, 918-921.
LAITINEN, A. (1985a). Autonomic innervation of the human respiratory tract as revealed by histochemical and ultrastructural methods. Eur J Respir Dis Suppl 140, 1-42.

97
LAITINEN, A. (1985b). Ultrastructural organisation of intraepithelial nerves in the human airway tract. Thorax 40, 488-492.
LAITINEN, A., PARTANEN, M., HERVONEN, A., PELTO-HUIKKO, M. & LAITINEN, L. A. (1985). VIP like immunoreactive nerves in human respiratory tract. Light and electron microscopic study. Histochemistry 82, 313-319.
LANSLEY, A. B., SANDERSON, M. J. & DIRKSEN, E. R. (1992). Control of the beat cycle of respiratory tract cilia by Ca2+ and cAMP. American Journal of Physiology 263, L232-242.
LATTANZIO, F. A., JR. & BARTSCHAT, D. K. (1991). The effect of pH on rate constants, ion selectivity and thermodynamic properties of fluorescent calcium and magnesium indicators. Biochem Biophys Res Commun 177, 184-191.
LAZAROWSKI, E. R. & BOUCHER, R. C. (2001). UTP as an extracellular signaling molecule. News Physiol Sci 16, 1-5.
LAZAROWSKI, E. R., BOUCHER, R. C. & HARDEN, T. K. (2000). Constitutive release of ATP and evidence for major contribution of ecto-nucleotide pyrophosphatase and nucleoside diphosphokinase to extracellular nucleotide concentrations. J Biol Chem 275, 31061-31068.
LAZAROWSKI, E. R., BOUCHER, R. C. & HARDEN, T. K. (2003). Mechanisms of release of nucleotides and integration of their action as P2X- and P2Y-receptor activating molecules. Mol Pharmacol 64, 785-795.
LETHEM, M. I., DOWELL, M. L., VAN SCOTT, M., YANKASKAS, J. R., EGAN, T., BOUCHER, R. C. & DAVIS, C. W. (1993). Nucleotide regulation of goblet cells in human airway epithelial explants: normal exocytosis in cystic fibrosis. Am J Respir Cell Mol Biol 9, 315-322.
LIEB, T., FREI, C. W., FROHOCK, J. I., BOOKMAN, R. J. & SALATHE, M. (2002). Prolonged increase in ciliary beat frequency after short-term purinergic stimulation in human airway epithelial cells. J Physiol 538, 633-646.
LINDBERG, S., KHAN, R. & RUNER, T. (1995). The effects of formoterol, a long-acting beta 2-adrenoceptor agonist, on mucociliary activity. Eur J Pharmacol 285, 275-280.

98
LIPS, K. S., PFEIL, U., REINERS, K., RIMASCH, C., KUCHELMEISTER, K., BRAUN-DULLAEUS, R. C., HABERBERGER, R. V., SCHMIDT, R. & KUMMER, W. (2003). Expression of the high-affinity choline transporter CHT1 in rat and human arteries. J Histochem Cytochem 51, 1645-1654.
LIPS, K. S., VOLK, C., SCHMITT, B. M., PFEIL, U., ARNDT, P., MISKA, D., ERMERT, L., KUMMER, W. & KOEPSELL, H. (2005). Polyspecific cation transporters mediate luminal release of acetylcholine from bronchial epithelium. Am J Respir Cell Mol Biol 33, 79-88.
LITVIN, T. N., KAMENETSKY, M., ZARIFYAN, A., BUCK, J. & LEVIN, L. R. (2003). Kinetic properties of "soluble" adenylyl cyclase. Synergism between calcium and bicarbonate. Journal of Biological Chemistry 278, 15922-15926.
LUCONI, M., PORAZZI, I., FERRUZZI, P., MARCHIANI, S., FORTI, G. & BALDI, E. (2005). Tyrosine phosphorylation of the kinase anchoring protein 3 (AKAP3) and soluble adenylate cyclase are involved in the increase of human sperm motility by bicarbonate. Biol Reprod 72, 22-32.
LUK, C. K. & DULFANO, M. J. (1983). Effect of pH, viscosity and ionic-strength changes on ciliary beating frequency of human bronchial explants. Clinical Science 64, 449-451.
MA, W., SILBERBERG, S. D. & PRIEL, Z. (2002). Distinct axonemal processes underlie spontaneous and stimulated airway ciliary activity. Journal of General Physiology 120, 875-885.
MAK, J. C., BARANIUK, J. N. & BARNES, P. J. (1992). Localization of muscarinic receptor subtype mRNAs in human lung. Am J Respir Cell Mol Biol 7, 344-348.
MAK, J. C., NISHIKAWA, M. & BARNES, P. J. (1995a). Glucocorticosteroids increase beta 2-adrenergic receptor transcription in human lung. American Journal of Physiology 268, L41-46.
MAK, J. C., NISHIKAWA, M., SHIRASAKI, H., MIYAYASU, K. & BARNES, P. J. (1995b). Protective effects of a glucocorticoid on downregulation of pulmonary beta 2-adrenergic receptors in vivo. Journal of Clinical Investigation 96, 99-106.

99
MALAISSE, W. J. & SENER, A. (1987). Glucose-induced changes in cytosolic ATP content in pancreatic islets. Biochimica et Biophysica Acta 927, 190-195.
MARTEL, F., RIBEIRO, L., CALHAU, C. & AZEVEDO, I. (1999). Comparison between uptake2 and rOCT1: effects of catecholamines, metanephrines and corticosterone. Naunyn Schmiedebergs Arch Pharmacol 359, 303-309.
MATTHYS, H., DAIKELER, G., KRAUSS, B. & VASTAG, E. (1987). Action of tulobuterol and fenoterol on the mucociliary clearance. Respiration 51, 105-112.
MATTHYS, H. & KOHLER, D. (1986). Bronchial clearance in cystic fibrosis. Eur J Respir Dis Suppl 146, 311-318.
MAUS, A. D., PEREIRA, E. F., KARACHUNSKI, P. I., HORTON, R. M., NAVANEETHAM, D., MACKLIN, K., CORTES, W. S., ALBUQUERQUE, E. X. & CONTI-FINE, B. M. (1998). Human and rodent bronchial epithelial cells express functional nicotinic acetylcholine receptors. Mol Pharmacol 54, 779-788.
MENDES, E. S., PEREIRA, A., DANTA, I., DUNCAN, R. C. & WANNER, A. (2003). Comparative bronchial vasoconstrictive efficacy of inhaled glucocorticosteroids. European Respiratory Journal 21, 989-993.
MERCKE, U., HYBBINETTE, J. C. & LINDBERG, S. (1982). Parasympathetic and sympathetic influences on mucociliary activity in vivo. Rhinology 20, 201-204.
MOFFATT, J. D., COCKS, T. M. & PAGE, C. P. (2004). Role of the epithelium and acetylcholine in mediating the contraction to 5-hydroxytryptamine in the mouse isolated trachea. Br J Pharmacol 141, 1159-1166.
MORSE, D. M., SMULLEN, J. L. & DAVIS, C. W. (2001). Differential effects of UTP, ATP, and adenosine on ciliary activity of human nasal epithelial cells. Am J Physiol Cell Physiol 280, C1485-1497.
MORTENSEN, J., HANSEN, A., FALK, M., NIELSEN, I. K. & GROTH, S. (1993). Reduced effect of inhaled beta 2-adrenergic agonists on lung mucociliary clearance in patients with cystic fibrosis. Chest 103, 805-811.
100
MOSSBERG, B., STRANDBERG, K., PHILIPSON, K. & CAMNER, P. (1976). Tracheobronchial clearance in bronchial asthma: response to beta-adrenoceptor stimulation. Scand J Respir Dis 57, 119-128.
MUSSO, N. R., BRENCI, S., INDIVERI, F. & LOTTI, G. (1998). Acetylcholine-induced, calcium-dependent norepinephrine outflow from peripheral human lymphocytes. J Neuroimmunol 87, 82-87.
MUSSO, N. R., BRENCI, S., SETTI, M., INDIVERI, F. & LOTTI, G. (1996). Catecholamine content and in vitro catecholamine synthesis in peripheral human lymphocytes. J Clin Endocrinol Metab 81, 3553-3557.
NAITO, Y. & KANEKO, H. (1972). Reactivated triton-extracted models of paramecium: modification of ciliary movement by calcium ions. Science 176, 523-524.
NEER, E. J. (1978). Physical and functional properties of adenylate cyclase from mature rat testis. J Biol Chem 253, 5808-5812.
NLEND, M. C., BOOKMAN, R. J., CONNER, G. E. & SALATHE, M. (2002). Regulator of G-protein signaling protein 2 modulates purinergic calcium and ciliary beat frequency responses in airway epithelia. American Journal of Respiratory Cell & Molecular Biology 27, 436-445.
OKUDA, M., SAITO, H., URAKAMI, Y., TAKANO, M. & INUI, K. (1996). cDNA cloning and functional expression of a novel rat kidney organic cation transporter, OCT2. Biochem Biophys Res Commun 224, 500-507.
O'RIORDAN, T. G., ZWANG, J. & SMALDONE, G. C. (1992). Mucociliary clearance in adult asthma. Am Rev Respir Dis 146, 598-603.
OSTEDGAARD, L. S., SHASBY, D. M. & WELSH, M. J. (1992). Staphylococcus aureus alpha-toxin permeabilizes the basolateral membrane of a Cl(-)-secreting epithelium. American Journal of Physiology 263, L104-112.
OSYPIW, J. C., GLEESON, D., LOBLEY, R. W., PEMBERTON, P. W. & MCMAHON, R. F. (1994). Acid-base transport systems in a polarized human intestinal cell monolayer: Caco-2. Experimental Physiology 79, 723-739.

101
PACHOLCZYK, T., BLAKELY, R. D. & AMARA, S. G. (1991). Expression cloning of a cocaine- and antidepressant-sensitive human noradrenaline transporter. Nature 350, 350-354.
PARADISO, A. M. (1997). ATP-activated basolateral Na+/H+ exchange in human normal and cystic fibrosis airway epithelium. American Journal of Physiology 273, L148-158.
PARADISO, A. M., COAKLEY, R. D. & BOUCHER, R. C. (2003). Polarized distribution of HCO3- transport in human normal and cystic fibrosis nasal epithelia. Journal of Physiology 548, 203-218.
PARTANEN, M., LAITINEN, A., HERVONEN, A., TOIVANEN, M. & LAITINEN, L. A. (1982). Catecholamine- and acetylcholinesterase-containing nerves in human lower respiratory tract. Histochemistry 76, 175-188.
PAVIA, D., BATEMAN, J. R., SHEAHAN, N. F. & CLARKE, S. W. (1980). Clearance of lung secretions in patients with chronic bronchitis: effect of terbutaline and ipratropium bromide aerosols. Eur J Respir Dis 61, 245-253.
PAVIA, D., BATEMAN, J. R. M., SHEAHAN, N. F., AGNEW, J. E. & CLARKE, S. W. (1985). Tracheobronchial mucociliary clearance in asthma: impairment during remission. Thorax 40, 171-175.
PERCY, E., KAYE, D. M., LAMBERT, G. W., GRUSKIN, S., ESLER, M. D. & DU, X. J. (1999). Catechol-O-methyltransferase activity in CHO cells expressing norepinephrine transporter. Br J Pharmacol 128, 774-780.
PFEIL, U., LIPS, K. S., EBERLING, L., GRAU, V., HABERBERGER, R. V. & KUMMER, W. (2003). Expression of the high-affinity choline transporter, CHT1, in the rat trachea. Am J Respir Cell Mol Biol 28, 473-477.
PIATTI, G., AMBROSETTI, U., SANTUS, P. & ALLEGRA, L. (2005). Effects of salmeterol on cilia and mucus in COPD and pneumonia patients. Pharmacol Res 51, 165-168.
PICHER, M. & BOUCHER, R. C. (2003). Human airway ecto-adenylate kinase. A mechanism to propagate ATP signaling on airway surfaces. J Biol Chem 278, 11256-11264.

102
PICHER, M., BURCH, L. H., HIRSH, A. J., SPYCHALA, J. & BOUCHER, R. C. (2003). Ecto 5'-nucleotidase and nonspecific alkaline phosphatase. Two AMP-hydrolyzing ectoenzymes with distinct roles in human airways. J Biol Chem 278, 13468-13479.
PIPERNO, G. & LUCK, D. J. (1979). Axonemal adenosine triphosphatases from flagella of Chlamydomonas reinhardtii. Purification of two dyneins. J Biol Chem 254, 3084-3090.
POULSEN, J. H. & MACHEN, T. E. (1996). HCO3-dependent pHi regulation in tracheal epithelial cells. Pflugers Archiv - European Journal of Physiology 432, 546-554.
PROSKOCIL, B. J., SEKHON, H. S., JIA, Y., SAVCHENKO, V., BLAKELY, R. D., LINDSTROM, J. & SPINDEL, E. R. (2004). Acetylcholine is an autocrine or paracrine hormone synthesized and secreted by airway bronchial epithelial cells. Endocrinology 145, 2498-2506.
RACKE, K., JUERGENS, U. R. & MATTHIESEN, S. (2006). Control by cholinergic mechanisms. Eur J Pharmacol 533, 57-68.
RACKE, K. & MATTHIESEN, S. (2004). The airway cholinergic system: physiology and pharmacology. Pulm Pharmacol Ther 17, 181-198.
RAMIREZ, M. A., TORIANO, R., PARISI, M. & MALNIC, G. (2000). Control of cell pH in the T84 colon cell line. J Membr Biol 177, 149-157.
REDDY, M. M., KOPITO, R. R. & QUINTON, P. M. (1998a). Cytosolic pH regulates GCl through control of phosphorylation states of CFTR. American Journal of Physiology 275, C1040-1047.
REDDY, M. M., KOPITO, R. R. & QUINTON, P. M. (1998b). Cytosolic pH regulates GCl through control of phosphorylation states of CFTR. Am J Physiol 275, C1040-1047.
REDDY, M. M. & QUINTON, P. M. (1994). Rapid regulation of electrolyte absorption in sweat duct. Journal of Membrane Biology 140, 57-67.
REED, B. Y., GITOMER, W. L., HELLER, H. J., HSU, M. C., LEMKE, M., PADALINO, P. & PAK, C. Y. (2002). Identification and characterization of a gene with base

103
substitutions associated with the absorptive hypercalciuria phenotype and low spinal bone density. J Clin Endocrinol Metab 87, 1476-1485.
REED, B. Y., HELLER, H. J., GITOMER, W. L. & PAK, C. Y. (1999). Mapping a gene defect in absorptive hypercalciuria to chromosome 1q23.3-q24. J Clin Endocrinol Metab 84, 3907-3913.
REGNIS, J. A., ROBINSON, M., BAILEY, D. L., COOK, P., HOOPER, P., CHAN, H. K., GONDA, I., BAUTOVICH, G. & BYE, P. T. (1994). Mucociliary clearance in patients with cystic fibrosis and in normal subjects. Am J Respir Crit Care Med 150, 66-71.
REGNIS, J. A., ZEMAN, K. L., NOONE, P. G., KNOWLES, M. R. & BENNETT, W. D. (2000). Prolonged airway retention of insoluble particles in cystic fibrosis versus primary ciliary dyskinesia. Exp Lung Res 26, 149-162.
RHODIN, J. A. (1966). The ciliated cell. Ultrastructure and function of the human tracheal mucosa. Am Rev Respir Dis 93, Suppl:1-15.
RICHMOND, P. H. & VAUGHAN-JONES, R. D. (1997). Assessment of evidence for K+-H+ exchange in isolated type-1 cells of neonatal rat carotid body. Pflugers Archiv - European Journal of Physiology 434, 429-437.
ROOS, A. & BORON, W. F. (1981). Intracellular pH. Physiological Reviews 61, 296-434.
SABATER, J. R., LEE, T. A. & ABRAHAM, W. M. (2005). Comparative effects of salmeterol, albuterol, and ipratropium on normal and impaired mucociliary function in sheep. Chest 128, 3743-3749.
SALATHE, M. (2002). Effects of beta-agonists on airway epithelial cells. J Allergy Clin Immunol 110, S275-281.
SALATHE, M. & BOOKMAN, R. J. (1995). Coupling of [Ca2+]i and ciliary beating in cultured tracheal epithelial cells. J Cell Sci 108, 431-440.
SALATHE, M. & BOOKMAN, R. J. (1999). Mode of Ca2+ action on ciliary beat frequency in single ovine airway epithelial cells. J Physiol 520 Pt 3, 851-865.

104
SALATHE, M., IVONNET, P. I., LIEB, T. & BOOKMAN, R. J. (2001). Agonist-stimulated calcium decreases in ovine ciliated airway epithelial cells: role of mitochondria. Journal of Physiology 531, 13-26.
SALATHE, M., LIEB, T. & BOOKMAN, R. J. (2000a). Do cAMP and Ca2+ signals in cilia converge on outer dynein arms? Am J Respir Crit Care Med 161, A147.
SALATHE, M., LIEB, T. & BOOKMAN, R. J. (2000b). Lack of nitric oxide involvement in cholinergic modulation of ovine ciliary beat frequency. J Aerosol Med 13, 219-229.
SALATHE, M., LIPSON, E. J., IVONNET, P. I. & BOOKMAN, R. J. (1997). Muscarinic signaling in ciliated tracheal epithelial cells: dual effects on Ca2+ and ciliary beating. Am J Physiol 272, L301-310.
SALATHE, M., O'RIORDAN, T. G. & WANNER, A. (1996). Treatment of mucociliary dysfunction. Chest 110, 1048-1057.
SALATHE, M., PRATT, M. M. & WANNER, A. (1993). Cyclic AMP-dependent phosphorylation of a 26 kD axonemal protein in ovine cilia isolated from small tissue pieces. Am J Respir Cell Mol Biol 9, 306-314.
SANDERSON, M. J., CHARLES, A. C. & DIRKSEN, E. R. (1990). Mechanical stimulation and intercellular communication increases intracellular Ca2+ in epithelial cells. Cell Regul 1, 585-596.
SANDERSON, M. J. & DIRKSEN, E. R. (1989). Mechanosensitive and beta-adrenergic control of the ciliary beat frequency of mammalian respiratory tract cells in culture. Am Rev Respir Dis 139, 432-440.
SANTA CRUZ, R., LANDA, J., HIRSCH, J. & SACKNER, M. A. (1974a). Tracheal mucous velocity in normal man and patients with obstructive lung disease: effects of terbutaline. Am Rev Respir Dis 109, 458-463.
SANTA CRUZ, R., LANDA, J., HIRSCH, J. & SACKNER, M. A. (1974b). Tracheal mucous velocity in normal man and patients with obstructive lung disease: effects of terbutaline. American Review of Respiratory Disease 109, 458-463.

105
SCHALLREUTER, K. U., LEMKE, K. R., PITTELKOW, M. R., WOOD, J. M., KORNER, C. & MALIK, R. (1995). Catecholamines in human keratinocyte differentiation. J Invest Dermatol 104, 953-957.
SCHALLREUTER, K. U., WOOD, J. M., LEMKE, R., LEPOOLE, C., DAS, P., WESTERHOF, W., PITTELKOW, M. R. & THODY, A. J. (1992). Production of catecholamines in the human epidermis. Biochem Biophys Res Commun 189, 72-78.
SCHOMIG, E. & SCHONFELD, C. L. (1990). Extraneuronal noradrenaline transport (uptake2) in a human cell line (Caki-1 cells). Naunyn Schmiedebergs Arch Pharmacol 341, 404-410.
SEYBOLD, Z. V., MARIASSY, A. T., STROH, D., KIM, C. S., GAZEROGLU, H. & WANNER, A. (1990). Mucociliary interaction in vitro: effects of physiological and inflammatory stimuli. J Appl Physiol 68, 1421-1426.
SHIIMA-KINOSHITA, C., MIN, K. Y., HANAFUSA, T., MORI, H. & NAKAHARI, T. (2004). Beta 2-adrenergic regulation of ciliary beat frequency in rat bronchiolar epithelium: potentiation by isosmotic cell shrinkage. J Physiol 554, 403-416.
SINGH, S. K., BINDER, H. J., GEIBEL, J. P. & BORON, W. F. (1995). An apical permeability barrier to NH3/NH4+ in isolated, perfused colonic crypts. Proceedings of the National Academy of Sciences of the United States of America 92, 11573-11577.
SISSON, J. H., MOMMSEN, J., SPURZEM, J. R. & WYATT, T. A. (2000). Localization of PKA and PKG in bovine bronchial epithelial cells and axonemes. In Am J Respir Crit Care Med, vol. 161, pp. A449.
SPENGLER, R. N., CHENSUE, S. W., GIACHERIO, D. A., BLENK, N. & KUNKEL, S. L. (1994). Endogenous norepinephrine regulates tumor necrosis factor-alpha production from macrophages in vitro. J Immunol 152, 3024-3031.
SUN, X. C., CUI, M. & BONANNO, J. A. (2004). [HCO3-]-regulated expression and activity of soluble adenylyl cyclase in corneal endothelial and Calu-3 cells. BMC Physiol 4, 8.
SUTTO, Z., NLEND, M. C., CONNER, G. E., FREGEIN, N. & SALATHE, M. (2005). Polarized expression of Ca2+-sensitive adenylyl cyclases in human airway epithelial cells. Proc Am Thor Soc 2, A221.
106
SVARTENGREN, K., PHILIPSON, K., SVARTENGREN, M. & CAMNER, P. (1998). Effect of adrenergic stimulation on clearance from small ciliated airways in healthy subjects. Exp Lung Res 24, 149-158.
TAMAOKI, J., CHIYOTANI, A., SAKAI, N. & KONNO, K. (1993). Stimulation of ciliary motility mediated by atypical beta-adrenoceptor in canine bronchial epithelium. Life Sci 53, 1509-1515.
TAMAOKI, J., KONDO, M. & TAKIZAWA, T. (1989). Effect of cAMP on ciliary function in rabbit tracheal epithelial cells. J Appl Physiol 66, 1035-1039.
TAY, H. L., ARMOOGUM, N. & TAN, L. K. (1997). Nasal mucociliary clearance and salmeterol. Clin Otolaryngol Allied Sci 22, 68-70.
THASTRUP, O., CULLEN, P. J., DROBAK, B. K., HANLEY, M. R. & DAWSON, A. P. (1990). Thapsigargin, a tumor promoter, discharges intracellular Ca2+ stores by specific inhibition of the endoplasmic reticulum Ca2(+)-ATPase. Proc Natl Acad Sci U S A 87, 2466-2470.
THOMAS, J. A., BUCHSBAUM, R. N., ZIMNIAK, A. & RACKER, E. (1979). Intracellular pH measurements in Ehrlich ascites tumor cells utilizing spectroscopic probes generated in situ. Biochemistry 18, 2210-2218.
THOMAS, R. C. (1984). Experimental displacement of intracellular pH and the mechanism of its subsequent recovery. J Physiol 354, 3P-22P.
THOMAS, R. F. & LIGGETT, S. B. (1993). Lack of beta 3-adrenergic receptor mRNA expression in adipose and other metabolic tissues in the adult human. Mol Pharmacol 43, 343-348.
TORRE, J. C. & SURGEON, J. W. (1976). A methodological approach to rapid and sensitive monoamine histofluorescence using a modified glyoxylic acid technique: the SPG method. Histochemistry 49, 81-93.
TOYOHIRA, Y., UTSUNOMIYA, K., UENO, S., MINAMI, K., UEZONO, Y., YOSHIMURA, R., TSUTSUI, M., IZUMI, F. & YANAGIHARA, N. (2003). Inhibition of the norepinephrine transporter function in cultured bovine adrenal medullary cells by bisphenol A. Biochem Pharmacol 65, 2049-2054.

107
URNER, F. & SAKKAS, D. (2003). Protein phosphorylation in mammalian spermatozoa. Reproduction 125, 17-26.
VAN DE DONK, H. J., ZUIDEMA, J. & MERKUS, F. W. (1980). The influence of the pH and osmotic pressure upon tracheal ciliary beat frequency as determined with a new photo-electric registration device. Rhinology 18, 93-104.
VASTAG, E., MATTHYS, H., ZSAMBOKI, G., KOHLER, D. & DAIKELER, G. (1986). Mucociliary clearance in smokers. Eur J Respir Dis 68, 107-113.
VASTAG, E. & ZSAMBOKI, G. (1985). [Effect of beta-mimetics on bronchial mucus transport]. Orv Hetil 126, 323-326.
VERDUGO, P. (1980). Ca2+-dependent hormonal stimulation of ciliary activity. Nature 283, 764-765.
VERDUGO, P., JOHNSON, N. T. & TAM, P. Y. (1980). Beta-adrenergic stimulation of respiratory ciliary activity. J Appl Physiol 48, 868-871.
VERHAAGH, S., SCHWEIFER, N., BARLOW, D. P. & ZWART, R. (1999). Cloning of the mouse and human solute carrier 22a3 (Slc22a3/SLC22A3) identifies a conserved cluster of three organic cation transporters on mouse chromosome 17 and human 6q26-q27. Genomics 55, 209-218.
VILLALON, M., HINDS, T. R. & VERDUGO, P. (1989). Stimulus-response coupling in mammalian ciliated cells. Demonstration of two mechanisms of control for cytosolic [Ca2+]. Biophys J 56, 1255-1258.
WALEV, I., MARTIN, E., JONAS, D., MOHAMADZADEH, M., MULLER-KLIESER, W., KUNZ, L. & BHAKDI, S. (1993). Staphylococcal alpha-toxin kills human keratinocytes by permeabilizing the plasma membrane for monovalent ions. Infection & Immunity 61, 4972-4979.
WANG, Y., LAM, C. S., WU, F., WANG, W., DUAN, Y. & HUANG, P. (2005). Regulation of CFTR channels by HCO(3)--sensitive soluble adenylyl cyclase in human airway epithelial cells. Am J Physiol Cell Physiol 289, C1145-1151.

108
WANG, Y., PEREIRA, E. F., MAUS, A. D., OSTLIE, N. S., NAVANEETHAM, D., LEI, S., ALBUQUERQUE, E. X. & CONTI-FINE, B. M. (2001). Human bronchial epithelial and endothelial cells express alpha7 nicotinic acetylcholine receptors. Mol Pharmacol 60, 1201-1209.
WANNER, A., SALATHE, M. & O'RIORDAN, T. G. (1996). Mucociliary clearance in the airways. Am J Respir Crit Care Med 154, 1868-1902.
WATANABE, M. & TAKANO-OHMURO, H. (2002). Extensive skinning of cell membrane diminishes the force-inhibiting effect of okadaic acid on smooth muscles of Guinea pig hepatic portal vein. Japanese Journal of Physiology 52, 141-147.
WEISS, T., DOROW, P. & FELIX, R. (1983). Regional mucociliary removal of inhaled particles in smokers with small airways disease. Respiration 44, 338-345.
WESSLER, I., KILBINGER, H., BITTINGER, F., UNGER, R. & KIRKPATRICK, C. J. (2003). The non-neuronal cholinergic system in humans: expression, function and pathophysiology. Life Sci 72, 2055-2061.
WESSLER, I., ROTH, E., DEUTSCH, C., BROCKERHOFF, P., BITTINGER, F., KIRKPATRICK, C. J. & KILBINGER, H. (2001). Release of non-neuronal acetylcholine from the isolated human placenta is mediated by organic cation transporters. Br J Pharmacol 134, 951-956.
WESSLER, I. K. & KIRKPATRICK, C. J. (2001). The Non-neuronal cholinergic system: an emerging drug target in the airways. Pulm Pharmacol Ther 14, 423-434.
WESTWOOD, N. N., SCARCELLA, D. L. & BRYAN-LLUKA, L. J. (1996). Evidence for uptake1-mediated efflux of catecholamines from pulmonary endothelial cells of perfused lungs of rats. Naunyn Schmiedebergs Arch Pharmacol 353, 528-535.
WHITESIDE, M. E., LAUREDO, I., CHAPMAN, G. A., RATZAN, K. R., ABRAHAM, W. M. & WANNER, A. (1984). Effect of atropine on tracheal mucociliary clearance and bacterial counts. Bull Eur Physiopathol Respir 20, 347-351.
WIDDICOMBE, J. (2003). Functional morphology and physiology of pulmonary rapidly adapting receptors (RARs). Anat Rec A Discov Mol Cell Evol Biol 270, 2-10.
109
WILLUMSEN, N. J. & BOUCHER, R. C. (1992). Intracellular pH and its relationship to regulation of ion transport in normal and cystic fibrosis human nasal epithelia. J Physiol 455, 247-269.
WONG, L. B., MILLER, I. F. & YEATES, D. B. (1988a). Regulation of ciliary beat frequency by autonomic mechanisms: in vitro. J Appl Physiol 65, 1895-1901.
WONG, L. B., MILLER, I. F. & YEATES, D. B. (1988b). Stimulation of ciliary beat frequency by autonomic agonists: in vivo. J Appl Physiol 65, 971-981.
WYATT, T. A., SPURZEM, J. R., MAY, K. & SISSON, J. H. (1998). Regulation of ciliary beat frequency by both PKA and PKG in bovine airway epithelial cells. Am J Physiol 275, L827-835.
YANG, B., SCHLOSSER, R. J. & MCCAFFREY, T. V. (1996). Dual signal transduction mechanisms modulate ciliary beat frequency in upper airway epithelium. Am J Physiol 270, L745-751.
YEATES, D. B., SPEKTOR, D. M. & PITT, B. R. (1986). Effect of orally administered orciprenaline on tracheobronchial mucociliary clearance. Eur J Respir Dis 69, 100-108.
YEATES, D. B., STURGESS, J. M., KAHN, S. R., LEVISON, H. & ASPIN, N. (1976). Mucociliary transport in trachea of patients with cystic fibrosis. Archives of Disease in Childhood 51, 28-33.
ZAGOORY, O., BRAIMAN, A. & PRIEL, Z. (2002). The mechanism of ciliary stimulation by acetylcholine: roles of calcium, PKA, and PKG. Journal of General Physiology 119, 329-339.
ZHANG, L., HAN, D. & SANDERSON, M. J. (2005). Effect of isoproterenol on the regulation of rabbit airway ciliary beat frequency measured with high-speed digital and fluorescence microscopy. Ann Otol Rhinol Laryngol 114, 399-403.
ZHENG, J. & RAMIREZ, V. D. (1997). Demonstration of membrane estrogen binding proteins in rat brain by ligand blotting using a 17beta-estradiol-[125I]bovine serum albumin conjugate. Journal of Steroid Biochemistry & Molecular Biology 62, 327-336.

110
ZHENG, J. & RAMIREZ, V. D. (1999). Purification and identification of an estrogen binding protein from rat brain: oligomycin sensitivity-conferring protein (OSCP), a subunit of mitochondrial F0F1-ATP synthase/ATPase. Journal of Steroid Biochemistry & Molecular Biology 68, 65-75.
ZIPPIN, J. H., CHEN, Y., NAHIRNEY, P., KAMENETSKY, M., WUTTKE, M. S., FISCHMAN, D. A., LEVIN, L. R. & BUCK, J. (2003). Compartmentalization of bicarbonate-sensitive adenylyl cyclase in distinct signaling microdomains. Faseb J 17, 82-84.
ZIPPIN, J. H., FARRELL, J., HURON, D., KAMENETSKY, M., HESS, K. C., FISCHMAN, D. A., LEVIN, L. R. & BUCK, J. (2004). Bicarbonate-responsive "soluble" adenylyl cyclase defines a nuclear cAMP microdomain. J Cell Biol 164, 527-534.

111
LIST OF PUBLICATIONS
Publications relevant to theses
Articles
1. Sutto Z., Conner G.E., Salathe M.: Regulation of human airway ciliary beat frequency
by intracellular pH. J. Physiol. 560:519-32, 2004. IF = 4.346
2. Horvath G., Sutto Z., Torbati A., Conner G.E., Salathe M., Wanner A.:
Norepinephrine transport by the extraneuronal monoamine transporter in human
bronchial arterial smooth muscle cells. Am. J. Physiol. Lung Cell. Mol. Physiol.
285:L829-37, 2003. IF = 3.735
Abstracts
3. Sutto Z., Nlend M.C., Conner G.E., Fregein N., Salathe M.: Polarized expression of
Ca2+-sensitive adenylyl cyclases in human airway epithelial cells. Proc. Am. Thorac.
Soc. 2: A221, 2005.
4. Sutto Z., Conner G.E., Salathe M.: Evidence for direct regulation of ciliary beat
frequency by intracellular pH. Am. J. Respir. Crit. Care. Med. 169: A673, 2004.
5. Nlend M.C., Sutto Z., Horvath G., Conner G.E., Salathe M.: Expression of calcium-
sensitive adenylyl cyclases isoforms in human airway epithelial cells. Am. J. Respir.
Crit. Care. Med. 169: A675, 2004.
6. Sutto Z., Conner G.E., Salathe M.: Measurement of ciliary beat frequency on
permeabilized epithelial cells: correlation between intracellular pH and ciliary
beating. FASEB 18: A1053, 2004.
7. Sutto Z., Conner G.E., Salathe M.: Intracellular pH regulates ciliary beat frequency
in human airway epithelial cell. Am. J. Respir. Crit. Care. Med. 167: A398, 2003.
8. Horvath G., Sutto Z., Salathe M., Conner G.E., Wanner A.: Acute inhibition of the
extraneuronal catecholamine transporter by glucocorticosteroids in human bronchial
arteries. Am. J. Respir. Crit. Care. Med. 167: A1006, 2003.

112
9. Sutto Z., Conner G.E., Salathe M.: Bicarbonate regulates ciliary beat frequency in
human airway epithelial cell. Mol. Biol. Cell. 13: 191a, 2002.
10. Horvath G., Sutto Z., Salathe M., Conner G.E., Wanner A.: Nongenomic action of
corticosterone on norepinephrine uptake by human bronchial arterial smooth muscle
cells. Mol Biol Cell 13: 273a, 2002.
Other publications
Articles
1. Sutto Z.: Differential diagnosis of cough. Cough relief. Praxis 15(11): 11-19, 2006.
[Hungarian]
2. Sutto Z., Magyar P.: Tuberculosis and pregnancy. Med. Thor. 52: 195-9, 1999.
[Hungarian]
3. Sutto Z., Bartfai Z., Lantos A., Major T. jr., Vadasz G., Varnai Zs., Zsiray M.:
Human polyspecific intravenous immunoglobulin therapy in Wegener’s
granulomatosis. Med. Thor. 52: 134-8, 1999. [Hungarian]
4. Sutto Z.: New perspectives in the diagnosis and treatment of Wegener’s
granulomatosis. Orvoskepzes 73: 99-103, 1998. [Hungarian]
5. Vajda E., Sutto Z., Zsiray M., Appel J., Lantos A., Kardos K.: Malignant
mesothelioma of the pleura. Orv. Hetil. 137(5): 233-8, 1996. [Hungarian]
6. Nagy L., Sutto Z., Tolnay E., Terek K., Orosz M., Szentpaly O.: Eosinophil
secretory products in acute severe asthma. Orv. Hetil. 137(3): 121-4, 1996.
[Hungarian]
7. Sutto Z.: Environmental control of allergens. Haziorvos Tovabbkepzo Szemle 1:
186-8, 1996. [Hungarian]
8. Sutto Z., Nagy L.: Pulmonary edema due to heroin abuse. Med. Thor. 47: 341-7,
1994. [Hungarian]

113
9. Nagy L., Orosz M., Sutto Z.: Inflammatory mediators of allergy in upper respiratory
tract allergy. Orv. Hetil. 134:743-4, 1993. [Hungarian]
10. Nagy L., Sutto Z.: Neuroendocrine peptides in the course of asthma bronchiale.
Orvoskepzes 67: 264-8, 1992. [Hungarian]
Book Chapters
11. Tarjan E., Muller V., Orosz Zs., Sutto Z., Magyar P.: Pneumonia. In: Test questions
and explanations in the field of pulmonology. Ed. Magyar P., Lantos A. Medicina,
Budapest, Hungary, 2005., pp 134-146. [Hungarian]
12. Lantos A., Magyar Pal, Sutto Z.: Mycotic lung diseases. In: Test questions and
explanations in the field of pulmonology. Ed. Magyar P., Lantos A. Medicina,
Budapest, 2005., pp 173-180. [Hungarian]
13. Magyar P., Bohacs A., Sutto Z., Tamasi L., Vajda E.: Diffuse interstitial lung
diseases, eosinophilic lung diseases. In: Test questions and explanations in the field
of pulmonology. Ed. Magyar P., Lantos A. Medicina, Budapest, 2005., pp 219-232.
[Hungarian]
14. Lantos A., Appel J., Bohacs A., Bartfai Z., Magyar P., Rozgonyi Zs., Sutto Z.,
Tarjan E., Vastag E., Vajda E., Vardy Visi K.: Test questions related to case reports.
In: Test questions and explanations in the field of pulmonology. Ed. Magyar P.,
Lantos A. Medicina, Budapest, 2005., pp 341-410. [Hungarian]
15. Zsiray M., Sutto Z.: Interstitial lung diseases of unknown origin. In: Pulmonology.
Ed. Magyar P., Hutas I., Vastag E. Medicina, Budapest, 1998., pp 538-557.
[Hungarian]
16. Sutto Z.: Inflammatory diseases of the upper respiratory tract. In: Pulmonology. Ed.
Magyar P., Hutas I., Vastag E. Medicina, Budapest, 2002., pp 262-265. [Hungarian]
17. Orosz M., Szentpaly O., Bartfai Z., Nagy L., Sutto Z., Temesi G., Tolnay E.:
Airway diseases induced by grain dust and flour. In: Environmental pollutants and
the respiratory tract. Vol. 7. Ed. Szabo T., Miriszlai E. Heviz, Hungary 1997.
[Hungarian]
114
Abstracts
18. Szondy K., Ostoros Gy., Sutto Z., Lantos A., Magyar P.: Gemcitabine plus cisplatin
treatment for advanced NSCLC. Lung Cancer 25 (Suppl.1): S17, 1999.
19. Orosz M., Szentpaly O., Bartfai Z., Sutto Z., Nagy L.: Occupational allergic airways
diseases among health care workers. Med. Thor. 51: S24, 1998. [Hungarian]
20. Horvath G., Vajda E., Sutto Z., Vastag E., Magyar P.: Bronchodilating responses to
inhaled 20 μg, 80 μg and 120 μg ipratropium bromide followed by 400 μg fenoterol
in stable COPD, comparison with fenoterol alone. Eur. Respir. J. Abstracts Book
39S, 1998.
21. Varnai Zs., Lantos A., Sutto Z., Major T. jr.: Artificial ventilation during
bronchofiberoscopy in mechanically ventilated patients. Med. Thor. 49: S50, 1996.
[Hungarian]
22. Lantos A., Major T. jr., Sutto Z., Tarjan E., Vajda E., Varnai Zs.: Talc pleurodesis
for the treatment of secondary spontaneous pneumothorax with persistent air leak.
Med. Thor. 49: S51, 1996. [Hungarian]
23. Nagy L., Sutto Z., Tolnay E., Terek K., Orosz M., Szentpaly O.: Eosinophil
secretory products in acut severe asthma. Allergy, 51 (30): S62, 1996.
24. Lantos A., Bartfai Z., Sutto Z., Szondy K., Tarjan E., Varnai Zs., Zsiray M.:
Chemical pleurodesis with talc or tetracycline derivatives of malignant pleural
effusions Onkologia (Suppl.): 18, 1995.
25. Nagy L., Orosz M., Tolnay E., Sutto Z.: Eosinophil secretory products (ECP, EXP)
in acute severe asthma. Med. Thor. 1994. 47: S9, 1994.

115
ACKNOWLEDGEMENTS
The author wishes to express his sincere gratitude to all individuals at the Division
of Pulmonary and Critical Care Medicine, University of Miami School of Medicine
(UM) and the Department of Respiratory Diseases, Semmelweis University (SU) who
have contributed to these studies with special thanks to:
Matthias Salathe, M.D. (UM)
Gábor Horváth, M.D., Ph.D. (SU, UM)
Prof. Pál Magyar, M.D., D.Sc. (SU)
Marie-Christine Nlend, Ph.D. (UM)
Gregory E. Conner, Ph.D. (UM)
Prof. Adam Wanner, M.D. (UM)
Andreas Schmid, M.D. (UM)
Nathalie Schmid (UM)
Attila Kiss, M.D., Ph.D. (SU)
Erika Vajda, M.D. (SU)
Kinga Emődi, M.D. (SU)
These studies were completed in the asthma research laboratories of the Division
of Pulmonary and Critical Care Medicine at the University of Miami School of
Medicine (Miami, FL, USA) in 2002-2004.
This work was supported by grants from the American Heart Association (to Z.S. and
G.H.) and the National Institute of Health research grants (to M.S., G.C. and A.W.).