Not so private lives: National findings on the relationships and well-being of same-sex attracted...
125
Version 1.1
Transcript of Not so private lives: National findings on the relationships and well-being of same-sex attracted...

Version 1.1

Version 1.1

NOT SO PRIVATE LIVES ii
Acknowledgements
The authors are grateful to the following people for their assistance with this project: Iain Anderson
for kindly hosting the Not So Private Lives website; Elaine Crump for IT support, artwork and for
preparing the final document for printing; Linda Petrie for assistance with transgender and
transsexual content of the survey and for helping to promote the survey through LGBTI email
networks across the country; Gina Wilson for providing advice relating to the inclusion of intersex
participants; Rodney Croome as a consultant regarding same-sex relationships formalised through a
state or municipal registry in Australia; and Alison Pike and Una Harkin for helping prepare
documents for publication.
We would also like to thank Professor Carol Ryff for advice on the usage of the Scales of
Psychological Well-Being (PWB: Ryff, 1989) and for information on accessing comparative data from
the second National Survey of Midlife Development in the United States (MIDUS II). Thank you also
to Professors Ellen Riggle and Sharon Rostosky for providing comparative data from a US national
sample of lesbian, gay and bisexual adults (Rostosky, Riggle, Horne , & Miller, 2009).
A very special thank you to the many participants who donated their time to complete the online
survey, and to PFLAG Brisbane for support and funding, to make this research and resulting report
possible.
PFLAG (Parents and Friends of Lesbians and Gays) is
an international volunteer organisation supporting
family and friends of same-sex attracted individuals
who have disclosed their sexual identity.
PFLAG Brisbane Inc
Parents and Friends of Lesbians and Gays
Ph. (07) 3017 1739
www.pflagbrisbane.org.au
Sharon K Dane1 Barbara M Masser 1 Geoff MacDonald2 Julie M Duck1
1The University of Queensland 2University of Toronto
Address correspondence to Sharon K Dane, School of Psychology, The University of Queensland,
St. Lucia, QLD 4072, Australia. [email: [email protected]]
“Keeping families united”

NOT SO PRIVATE LIVES iii
Contents
Executive Summary ................................................................................................................................. 1
Research Background .............................................................................................................................. 5
Overview of Analytical Methods ............................................................................................................. 7
1. Demographics .................................................................................................................................. 9
1.1 Area of Residence ....................................................................................................................... 9
1.2 Cultural Ancestry ...................................................................................................................... 10
1.3 Age ............................................................................................................................................ 12
1.4 Education and Employment ..................................................................................................... 12
1.5 Religion ..................................................................................................................................... 14
2. Biological Sex, Gender Identity and Sexual Attraction .................................................................. 15
2.1 Sex, Gender Identity and Sexual Identity ................................................................................. 15
2.1.1 Transgender, Transsexual and Intersex Participants .......................................................... 16
2.2 Sexual and Romantic Attraction ............................................................................................... 17
2.2.1 Transgender, Transsexual and Intersex Participants .......................................................... 19
2.3 Sexual vs. Romantic Attractions ............................................................................................... 20
3. Awareness and First Disclosure of Sexuality ................................................................................. 21
3.1 Age First Aware ......................................................................................................................... 21
3.2 Age Sure .................................................................................................................................... 21
3.3 Age of First Disclosure .............................................................................................................. 21
3.4 Gender Differences Based on Age Cohort ................................................................................ 24
3.5 Transgender, Transsexual and Intersex Participants ................................................................ 26
4. Ongoing Disclosure of Sexuality .................................................................................................... 27
4.1 Experimental Research ............................................................................................................. 27
4.2 Timing of Disclosure – Survey Scenarios .................................................................................. 27
4.3 Overall Findings and in Relation to Well-Being and Stigma ..................................................... 29
4.4 Regular Partner and Partner ‘Disclosure Comfort’ Similarity ................................................... 29
4.5 Gender Identity and Disclosure ................................................................................................ 32
4.6 Transgender, Transsexual and Intersex Participants ................................................................ 33
4.7 Religion and Disclosure ............................................................................................................ 34
4.8 Acceptance and Disclosure ....................................................................................................... 35

NOT SO PRIVATE LIVES iv
5. Relationships and Recognition ...................................................................................................... 36
5.1 Relationship Background .......................................................................................................... 36
5.1.1 Current Relationship ........................................................................................................... 36
5.1.2 Length of Current Relationship ........................................................................................... 37
5.1.3 Transgender, Transsexual and Intersex Participants .......................................................... 39
5.1.4 Concluding Comment .......................................................................................................... 39
5.2 Current Legal Status of Same-Sex Relationship ........................................................................ 40
5.2.1 Gender Identity and Current Legal Status ........................................................................... 41
5.2.2 Commitment Ceremonies ................................................................................................... 42
5.3 Personal Preference for Legal Recognition of Same-Sex Relationship ..................................... 42
5.3.1 Gender Identity and Relationship Recognition ................................................................... 43
5.3.2 Age and Relationship Recognition ...................................................................................... 44
5.3.3 Relationship Recognition for Younger-Age Participants ..................................................... 45
5.3.4 Transgender, Transsexual and Intersex Participants .......................................................... 45
5.4 Preferred Legal Recognition of Relationship for those Partnered ........................................... 46
5.5 Preferred Options for Relationship Recognition in Australia ................................................... 49
5.6 Perceptions of the Public’s Attitude towards Same-Sex Relationships.................................... 49
5.7 Perceptions of Others’ Attitudes Regarding the Value of One’s Same-Sex Relationship ....... 51
5.8 Well-Being and Perceptions of How Others Value One’s Relationship .................................... 53
5.9 Summary ................................................................................................................................... 53
6. Children ......................................................................................................................................... 55
6.1 Children in a Person’s Life ........................................................................................................ 55
6.1.1 Number and Ages of Children ............................................................................................. 55
6.1.2 Percentages with Children According to Gender Identity and Age of Cohort .................... 56
6.2 Time Spent Sharing or Living with Children .............................................................................. 58
6.2.1 Time Shared for Those with All Children 20 Years of Age or Over ...................................... 58
6.2.2 Transgender, Transsexual and Intersex Participants .......................................................... 58
6.3 Marriage Preferences among those Partnered and Living with Children ................................ 59
7. Partners ......................................................................................................................................... 60
7.1 Partner Support ........................................................................................................................ 60
7.2 Relationship Satisfaction .......................................................................................................... 61
7.3 Partner ‘Disclosure Comfort’ Similarity .................................................................................... 62
7.3.1 Partner ‘Disclosure Comfort’ Similarity and Relationship Satisfaction ............................... 63

NOT SO PRIVATE LIVES v
7.4 Well-Being and Relationship Measures .................................................................................... 63
8. GLBTI Friends and Community ...................................................................................................... 64
8.1 Support from GLBTI friends ...................................................................................................... 64
8.2 Contact with the GLBTI Community ......................................................................................... 65
8.2.1 Gender Differences ............................................................................................................. 65
8.2.2 Age and Area of Residence .................................................................................................. 65
8.3 Feeling Connected to the GLBTI Community ........................................................................... 66
8.4 Perceived Support from the GLBTI Community ....................................................................... 67
8.5 Transgender, Transsexual and Intersex Participants ................................................................ 68
8.6 Well-being and Perceived Support from GLBTI Friends and Community ................................ 68
8.7 Summary ................................................................................................................................... 69
9. Family and Heterosexual Friends and Community ....................................................................... 70
9.1 ‘Out’ to Others .......................................................................................................................... 70
9.1.1 Proportion of Heterosexual Friends .................................................................................... 70
9.1.2 ‘Out’ to Heterosexual Friends, Contacts and Family ........................................................... 70
9.1.3 Proportion of Heterosexual Friends and Contacts Aware of Sexual Orientation ............... 71
9.2 Perceived Acceptance of Others .............................................................................................. 73
9.2.1 Age Differences for Perceptions of Acceptance .................................................................. 73
9.2.2 Overall Perceptions of Acceptance ..................................................................................... 75
9.3 Transgender, Transsexual and Intersex Participants ................................................................ 75
9.4 Well-being and Perceptions of Acceptance and GLBTI Support .............................................. 77
9.4.1 Interpretation of Findings on the Roles of Acceptance in Addition to GLBTI Support ....... 78
9.4.2 Acceptance and GLBTI Support for Those Partnered and ‘Out’ in All Areas ....................... 80
9.4.3 Acceptance and Relationship Status and Longevity ............................................................ 80
9.4.4 Concluding Comment .......................................................................................................... 80
10. Stigma and Psychological Well-Being ........................................................................................ 81
10.1 Perceived Stigma ...................................................................................................................... 81
10.1.1 Age and Gender Identity Differences ............................................................................... 83
10.1.2 Stigma and Urban vs. Rural Areas of Residence ............................................................... 83
10.1.3 Stigma, GLBTI Support and Well-being ............................................................................. 84
10.1.4 Transgender, Transsexual and Intersex Participants ........................................................ 84
10.2 Positive and Negative Mood .................................................................................................... 85
10.2.1 Age and Gender Identity Differences ............................................................................... 85

NOT SO PRIVATE LIVES vi
10.2.2 Comparative Figures (US national LGB sample and Australian random sample) ............. 87
10.2.3 Transgender, Transsexual and Intersex Participants ........................................................ 90
10.2.4 Summary ........................................................................................................................... 90
10.3 Psychological Well-Being Scales (PWB) .................................................................................... 91
10.3.1 Age and Gender Identity Differences ............................................................................... 91
10.3.2 Comparative Figures (US national sample) ....................................................................... 96
10.3.3 Transgender, Transsexual and Intersex Participants ........................................................ 97
Appendix – Auxiliary Report .................................................................................................................. 98
References ........................................................................................................................................... 111

NOT SO PRIVATE LIVES vii
List of Tables
Table 1. Numbers and percentages of participants according to area of current residence ................ 9
Table 2. Cultural ancestry (up to two ancestries) ................................................................................ 10
Table 3. Numbers and percentages of participants according to age group and gender identity ...... 12
Table 4. Numbers and percentages for highest level of education completed ................................... 13
Table 5. Numbers and percentages for current work status ............................................................... 13
Table 6. Current gender identity .......................................................................................................... 15
Table 7. Sexual identity by gender identity category ........................................................................... 16
Table 8. Sexual identity of transgender, transsexual and intersex participants .................................. 17
Table 9. Percentile ages of participants by gender identity for age first aware, age sure and age of
first disclosure of same-sex attractions ................................................................................................ 22
Table 10. Numbers of participants corresponding to data presented in Figure 6 for gender
differences by cohort, for age aware, age sure and age of first disclosure of same-sex attractions ... 26
Table 11. Numbers of transgender/transsexual and intersex participants in relation to preferences
for disclosing sexuality to heterosexual men vs. heterosexual women................................................ 33
Table 12. Type of current same-sex relationship ................................................................................. 36
Table 13. Number of participants with regular same-sex partner according to age group and gender
identity .................................................................................................................................................. 37
Table 14. Minimum number of years together in current relationship for 50% and 25% of male and
female gender identity groups according to age .................................................................................. 39
Table 15. Transgender/transsexual and intersex participants with regular same-sex partner ........... 39
Table 16. Reported current legal status of same-sex relationship for participants with a regular same-
sex partner, living together or apart ..................................................................................................... 40
Table 17. Reported current legal status of same-sex relationship for participants with a regular same-
sex partner according to gender identity .............................................................................................. 41
Table 18. Numbers of transgender/transsexual and intersex participants for personal preference for
relationship recognition ........................................................................................................................ 46
Table 19. Percentages of participants with children currently in their lives (one’s own or from a
current or previous relationship), expecting a child or who plan on having children, for the total
sample and those with a same-sex partner .......................................................................................... 55
Table 20. Percentages according to length of time spent with children for participants with at least
one child still under the age of 20 years, for each of the three gender identity groups ...................... 58
Table 21. Percentages of those who reported having contact with the GLBTI community (apart from
friends) by area of residence and age cohort ....................................................................................... 66

NOT SO PRIVATE LIVES viii
Table 22. Average scores for and percentages of transgender/transsexual and intersex participants
who reported finding the GLBTI community (apart from friends) very to extremely supportive ........ 68
Table 23. Percentages of participants ‘out’ to heterosexual friends, contacts, and family ................. 71
Table 24. Average scores (1 = not at all accepting to 9 = fully) and number of participants for
perceptions of acceptance by others according to age group .............................................................. 73
Table 25. Average scores for perceptions of acceptance from others (1 = not at all accepting to
9 = fully) for transgender/transsexual and intersex participants, and the general sample .................. 76
Table 26. Percentage of participants agreeing or disagreeing with statements on perceived stigma 82
Table 27. Perceived stigma scores for transgender/transsexual and intersex participants ................ 84
Table 28. Average scores for the PANAS positive affect and negative affect subscales by gender
identity and comparative figures based on a randomly selected Australian sample and a US national
LGB sample ............................................................................................................................................ 88
Table 29. Average scores for the PANAS positive affect and negative affect subscales by gender
identity and comparative figures based on a randomly selected Australian sample and a US national
LGB sample ............................................................................................................................................ 90
Table 30. Average scores for each of the six dimensions of Psychological Well-Being (PWB) and
overall scores by gender identity .......................................................................................................... 95
Table 31. Average scores for Scales of Psychological Well-Being (7-items per scale) for a subsample
of heterosexual participants from the MIDUS II and subsamples from the current survey (NSPL) ..... 97

NOT SO PRIVATE LIVES ix
List of Figures
Figure 1. Numbers and percentages of participants according to state/territory of residence ............ 9
Figure 2. Sexual and romantic attraction towards others for participants identifying as male .......... 18
Figure 3. Sexual and romantic attraction towards others for participants identifying as female ...... 18
Figure 4. Sexual and romantic attraction towards others for participants identifying as gender
different ................................................................................................................................................ 19
Figure 5. Mean ages of participants by gender identity for age first aware, age sure and age of first
disclosure of same-sex attractions ....................................................................................................... 22
Figure 6 (A, B and C). Mean ages by gender identity, for age first aware, age sure and age of first
disclosure of same-sex attractions according to age cohort ................................................................. 25
Figure 7. Percentages of participants for likelihood of ‘coming out’ for possibly positive (A), possibly
negative (B) and unclear (C) reactions to disclosure based on social interaction scenarios ................ 29
Figure 8. Percentages for likelihood of ‘coming out’ for possibly negative (scenario B) reactions to
disclosure for those currently same-sex partnered vs. not .................................................................. 30
Figure 9. Percentages for likelihood of ‘coming out’ for possibly negative (scenario B) reactions to
disclosure for low vs. high partner ‘disclosure comfort’ similarity for participants reporting a regular
partner of the same sex ........................................................................................................................ 31
Figure 10. Percentages in relation to participants’ preferences for ‘coming out’ to heterosexual men
vs. heterosexual women ....................................................................................................................... 33
Figure 11. Percentages of participants in relation to extent of religious influence (including the
religious beliefs of others) on decisions to disclose sexuality .............................................................. 34
Figure 12. Percentages of participants reporting a regular same-sex partner by age group and gender
identity .................................................................................................................................................. 37
Figure 13. Average length of current relationship with regular same-sex partner for participants
identifying as male or female ................................................................................................................ 38
Figure 14. Personal preference for relationship recognition - general sample (including those not
currently in a same-sex relationship) .................................................................................................... 42
Figure 15. Percentages of participants for personal preference for relationship recognition according
to gender identity groups ...................................................................................................................... 43
Figure 16. Percentages of participants for personal preference for relationship recognition according
to age group ......................................................................................................................................... 44
Figure 17. Percentages of participants for personal preference for relationship recognition according
to gender identity for participants 18-24 yrs ........................................................................................ 45
Figure 18. Preferred legal recognition for those currently in a same-sex de facto relationship ........ 46
Figure 19. Preferred legal recognition for those with a current same-sex relationship formalised
through a state or municipal registry .................................................................................................. 47

NOT SO PRIVATE LIVES x
Figure 20. Preferred legal recognition for those currently in an overseas recognised relationship
other than marriage - e.g., NZ Civil Union, UK Civil Partnership .......................................................... 47
Figure 21. Preferred legal recognition for those currently in an overseas marriage .......................... 48
Figure 22. Preferred legal recognition for those currently in a same-sex relationship with no legal
status .................................................................................................................................................... 48
Figure 23. Percentage of participants for preferred legal options for same-sex couples in Australia 49
Figure 24 (A and B). Participants perceptions of the Australian public’s perception of the value (i.e.,
worth) of same-sex relationships relative to different-sex relationships ............................................ 50
Figure 25 (A, B, C and D). Participants’ perceptions of how heterosexual friends, contacts and family
members valued their same-sex relationships relative to different-sex relationships ........................ 51
Figure 26. The relationship between overall psychological well-being (PWB) and perceptions of how
heterosexual friends value one’s same-sex relationship compared with different-sex marriages ...... 53
Figure 27. Percentages of female participants with children currently in their lives (one’s own or
from a current or previous relationship), expecting a child or who plan on having children ............... 56
Figure 28. Percentages of male participants with children currently in their lives (one’s own or from a
current or previous relationship), expecting a child or who plan on having children .......................... 57
Figure 29. Percentages of gender different participants with children currently in their lives (one’s
own or from a current or previous relationship), expecting a child or who plan on having children .. 57
Figure 30. Percentages of participants for perceived partner support scores by gender identity ...... 60
Figure 31 (A and B). Percentages of participants for response options for being satisfied (A) and
happy (B) in their current same-sex relationship by gender identity ................................................... 61
Figure 32. Average scores for partner ‘disclosure comfort’ similarity by age cohort .......................... 62
Figure 33. Average scores for relationship satisfaction for low vs. high levels of perceived partner
‘disclosure comfort’ similarity ............................................................................................................... 63
Figure 34. Percentages for participants perceived support from GLBTI friends by gender identity ... 64
Figure 35. Percentages of participants who reported contact vs. no contact with the GLBTI
community (apart from friends) by gender identity ............................................................................. 65
Figure 36. Percentages of participants for reported connection to the GLBTI community by age
cohort .................................................................................................................................................... 66
Figure 37. Percentages of participants according to responses for perceived support from GLBTI
community (apart from friends) by gender identity ............................................................................. 67
Figure 38. Percentages according to responses for proportion of heterosexual friends .................... 70
Figure 39. Average scores (1 = very few to 7 = all) for proportion of heterosexual friends and contacts
(apart from friends) aware of same-sex attractions ............................................................................. 72
Figure 40 . Average scores for perceptions of acceptance (1 = not at all to 9 = fully) for heterosexual
friends, contacts (apart from friends), mother, father and siblings ..................................................... 74

NOT SO PRIVATE LIVES xi
Figure 41. The contribution of heterosexual friends and heterosexual contacts acceptance in
addition to GLBTI friends’ and GLBTI community support in predicting overall well-being ................. 77
Figure 42. The contribution of family acceptance in addition to GLBTI support in predicting scores on
overall well-being .................................................................................................................................. 78
Figure 43. The contribution of heterosexual friends’ and parents’ acceptance in addition to support
from one’s same-sex partner and GLBTI friends in predicting overall well-being ................................ 79
Figure 44. Average scores, by age group, for the three gender identity groups for perceptions of
stigma in relation to same-sex attractions ............................................................................................ 83
Figure 45. Average scores for the PANAS negative affect subscale by gender identity ...................... 86
Figure 46. Average scores for the PANAS positive affect subscale by gender identity ........................ 86
Figure 47. Average scores for the PANAS negative affect subscale by gender, and comparative figures
based on a randomly selected Australian sample and a US national LGB sample................................ 89
Figure 48. Average scores for the PANAS positive affect subscale by gender, and comparative figures
based on a randomly selected Australian sample and a US national LGB sample................................ 89
Figure 49. Average score for Self-Acceptance by gender identity and age group ............................... 92
Figure 50. Average scores for Purpose in Life by gender identity and age group ................................ 92
Figure 51. Average scores for Autonomy by gender identity and age group ..................................... 93
Figure 52. Average scores for Environmental Mastery by gender identity and age group ................. 93
Figure 53. Average scores for Personal Growth by gender identity and age group ............................ 94
Figure 54. Average scores for Positive Relations with Others by gender identity and age group ....... 94
Figure 55. Average overall score for Psychological Well-Being (PWB) by gender identity and age
group ..................................................................................................................................................... 95

NOT SO PRIVATE LIVES xii

NOT SO PRIVATE LIVES 1
Executive Summary
Attractions
A significantly greater number of participants identifying as female reported a romantic
attraction exclusively to females, compared with a sexual attraction exclusively to females. This
pattern was reversed for males with significantly larger numbers reporting a sexual attraction
exclusively to males, compared with a romantic attraction exclusively to males.
From the total sample, close to a third of participants (29.9%) indicated a difference between the
extent to which they felt romantically attracted and the extent to which they felt sexually
attracted to males and/or females. Only 1.2% indicated an exactly equal attraction to males and
females, when it came to both romantic and sexual attraction. This suggests that even for
people who identify as bisexual it is rarely a simple case of equal attraction to men and women.
Awareness and First Disclosure of Same-Sex Attractions
Although males, as a group, were sure of their attractions before females, they took significantly
more time on average to disclose these attractions. On average, female and gender different
participants disclosed around one year after they felt sure of their sexuality, whereas for males
the average was three and a half years. These results are discussed in terms of the higher levels
of victimization reported by nonheterosexual males relative to their female counterparts.
Females in the oldest cohort reported, on average, being sure of their same-sex attractions close
to 7 ½ years later than females in the youngest cohort. This certainty was 3 years later for the
oldest cohort of males and 4 years later for the oldest cohort of gender different participants,
when compared with their younger counterparts. The greater differences found for females are
discussed in terms of longitudinal evidence for the greater ‘fluidity’ of female sexuality.
Ongoing Disclosure of Sexuality
Participants were presented with three scenarios in which they were asked to consider disclosing
their same-sex attractions to a presumed to be ‘straight’ couple at a social gathering unrelated to
work. Close to two-thirds (65.9%) of participants, who reported having a regular same-sex
partner, selected an option to disclose now to a couple depicted as being possibly conservative,
although for most this depended on its relevance to the conversation. By contrast, the majority
(53.8%) of participants who reported not currently having a regular partner stated they were not
likely to disclose at all or would most probably delay disclosure until another time. For those
partnered, opting to ‘come out’ was even greater among those who reported a higher level of
compatibility with their partner when it came to feeling comfortable with one’s sexuality.
The above findings suggest that, even for those who may wish to ‘come out’, deciding to disclose
may be hampered by one’s current single status or a lack of compatibility with a partner’s level of
disclosure comfort. Although casually introducing or mentioning a partner may facilitate
disclosure, in much the same way heterosexual individuals convey the nature of their
relationships, this option is not always possible for some.

NOT SO PRIVATE LIVES 2
Findings revealed that it was only the extent of religious influence on disclosure (including the
religious beliefs of others), rather than a person’s own religious beliefs, that was related to the
likelihood of ‘coming out’. Specifically, the greater the religious influence the significantly lower
the likelihood of disclosure, even for the ‘most likely to be positive’ outcome scenario.
The above results are discussed in relation to recent experimental research in Australia which
found heterosexual individuals responded more favourably to upfront disclosure of a person’s
same-sex attractions when compared with delayed.
Relationships and Recognition
Although participants identifying as female were significantly more likely to report having a
current same-sex partner, those identifying as male were significantly more likely to report being
in a current relationship of a longer duration.
The majority of participants (54.7 %) selected marriage as their personal choice for relationship
recognition (when including participants who did not complete the survey in full, the figure was
54.2% - see Appendix for Auxiliary Report). A federally recognised relationship documented at a
registry (other than marriage) was the second most popular option (27.6%) followed by de facto
status (14.8%). Of the sample, 2.9% reported that they preferred no legal status.
The younger the age of the participant the more likely they were to have selected marriage as
their personal choice. For example, 66.7% of those 18-19, and 62.8% of those 20-29 selected
marriage as their preference.
The majority preference for marriage was larger for participants identifying as female (58.1%),
when compared with male (50.7%) or gender different (44.7%). For the youngest cohort (< 25
years), however, differences between males and females were no longer observed with 63%
from both groups selecting the option to marry.
Irrespective of their personal choice, 78% reported that they would like to see marriage become
available as an option for same-sex couples in Australia, 59.7% reported that they would like to
see a federally recognised relationship other than marriage be made available and 48.4% stated
that they would like to see de facto recognition remain. These percentages indicate that many
participants selected multiple options, suggesting that simply having a choice was an important
factor.
Although a majority preference for marriage was found regardless of the legal status of a
participant’s same-sex relationship, preferences for marriage were higher among those currently
in a relationship formalised through a state or municipal registry, an overseas recognised civil
union/partnership, and an overseas recognised marriage.
The more people felt their relationships were valued on a comparable level with different-sex
relationships, the significantly greater their reported level of overall well-being.
NOT SO PRIVATE LIVES 3
Children
Overall, 29.2% of those indentifying as female, 10.0% of those identifying as male, and 25.5% of
gender different participants reported having children in their lives, either their own or the result
of a current or previous relationship. When considering the age group most likely to have
children, given that people in general are having children in later years (ABS, 2008), 47.1% of
female and 17.6% of male participants reported having children in their lives, whether their own
or the result of a current or previous relationship.
Close to a third of both young male and female participants (< 25 yrs) reported that they planned
to have children at some stage in their lives.
Of participants with at least one child in their lives under the age of 20, 64.7% of female, 24.1%
of male and 40% of gender different participants were living with these children full-time.
For participants with a same-sex partner and living full-time with children under the age of 13
(i.e., generally primary school age) 74.7% reported that they would prefer to marry. For those
with children under the age of 5 (i.e., non-school age) 80.8% selected marriage as their
preference.
Partners
Higher levels of perceived partner support, relationship satisfaction, and partner similarity in
being comfortable with one’s sexuality, were all significantly related to higher levels of
psychological well-being.
Participants in the youngest cohort (< 25 years) reported significantly less similarity between
themselves and their partner regarding ‘coming out’ to others, and being comfortable as a same-
sex couple, when compared with those in the two older cohorts (i.e., 25-34 years and 35+ years).
Participants identifying as female reported significantly higher levels of relationship satisfaction
and partner support, relative to male and gender different participants. This is consistent with
research in general, in which females tend to score higher than males for measures of positive
relationships with others (e.g., Ryff & Keyes, 1995).
GLBTI Friends and Community
Just over a third of participants reported that they did not have any contact with individuals
(apart from friends) from the GLBTI community. The younger the cohort the less likely they were
to have reported contact with the GLBTI community or feel connected to the GLBTI community,
with this being the case for both metropolitan and rural areas of residence.
Not surprisingly, those living in more populated areas were significantly more likely to report
feeling a greater connection with the GLBTI community, relative to those living in less populated
areas. For those with contact with the community, however, perceptions of support did not
differ between metropolitan and rural areas.

NOT SO PRIVATE LIVES 4
Family and Heterosexual Friends and Community
A majority of those under the age of 25 reported that ‘most’ to ‘all’ of their friends were
heterosexual, whereas for those in the oldest cohort (35+ years) the percentage was less than a
third. Nonetheless, and with the exception of those 60 years of age and over, older participants
were significantly more likely to report that a greater proportion of their heterosexual friends
were aware of their sexuality, relative to younger participants.
Even when first taking into account the support participants received from their GLBTI friends
and the GLBTI community, significantly higher levels of well-being were associated with greater
perceptions of acceptance from heterosexual friends, parents and the wider community.
The more people felt accepted by their heterosexual friends, parents and siblings the significantly
greater the likelihood of them having reported an ongoing same-sex relationship.
When taking into account age differences, people with a same-sex partner who felt more
accepted by their heterosexual friends and siblings were more likely to report a current
relationship of a significantly longer duration.
Stigma and Psychological Well-Being
The highest perceptions of stigma related to issues regarding same-sex attracted people and the
caring of children (e.g., a same-sex attracted teacher in a public school). Perceptions in relation
to stigma and employment were much more positive, with 78% agreeing to some extent that
employers would hire a same-sex attracted person if qualified.
Gender different participants and transgender/transsexual and intersex participants scored
higher on perceptions of stigma and lower on reported well-being, when compared with the
general sample.
Data were compared between a national American LGB sample (Rostosky et al., 2009), the
current sample and a random sample of Australians (MacKinnon et al., 1999). Participants from
both the American LGB survey and the current survey were found to score significantly higher on
negative emotional experiences but did not report less positive emotional experiences, when
compared with the Australian random sample. These differences for negative mood between
nonheterosexual individuals and those from the Australian random sample were more
pronounced in the case of male participants.
Relative to an American national sample (MIDUS II), participants in the current survey scored
significantly lower on the Environmental Mastery, Purpose in Life and Self-Acceptance dimensions
of well-being (PWB: Ryff, 1989). Participants from the current survey, however, scored
significantly higher on perceptions of Personal Growth. These findings are similar to those found
for comparisons between a subsample of American sexual minority participants and their
heterosexual counterparts (Riggle, Rostosky, & Danner, 2009)

NOT SO PRIVATE LIVES 5
Research Background
The Not So Private Lives online survey was conducted through the School of Psychology at The
University of Queensland, Australia. The aim of the survey was to add to the growing body of
research on the lives of sexual minorities in Australia. The questions within the survey focused on a)
the timing of disclosure of same-sex attractions b) preferred relationship recognition c) same-sex
attracted individuals’ perceptions of how others value their relationships relative to different-sex
relationships d) parenting, and e) the role of mainstream acceptance in relation to psychological
well-being, even when in the presence of LGBTI support.
Not So Private Lives is the first national study to examine same-sex attracted Australians’ preferences
for various forms of relationship recognition since the introduction of de facto status for same-sex
couples at a federal level. Further, it is the first major study to investigate preferences for
relationship recognition while taking into account the current legal status (in Australia or overseas) of
an individual’s same-sex relationship. Findings in these areas were presented at the Australian
Federal Senate hearing of the inquiry into the Marriage Equality Amendment Bill 2009
(Commonwealth of Australia. Senate Legal and Constitutional Affairs Committee, November 9, 2009).
The survey site was hosted as a secure site by Globalpark through its Unipark program for academic
research. Globalpark has its headquarters in Germany and is one of the leading international
suppliers of online software for academic and commercial research. All data collection and storage
were provided by Globalpark. The URL for the web-page entry to the survey was
www.notsoprivatelives.com. This report on the survey’s findings is currently available at this site.
Recruitment
The survey commenced on the 3rd April 2009 and ran until midnight, 15th August 2009. Responses to
the survey decreased substantially in the latter two weeks, suggesting the sample had reached its
maximum uptake. The survey was advertised online in the GLBTQI press for every state and territory
and in print in various GLBTQI magazines (e.g., LOTL, SX Magazine, Queensland Pride, AX National,
MCV and Sydney Star Observer). Information on the survey was also circulated through sexual
minority email networks across the country. Flyers and/or email information were sent to sexual
minority - businesses, health and community centres, sporting clubs, reading groups, parenting
groups, outdoor activity groups, city and country social clubs, chat rooms and coffee shops, as well as
university queer collectives and sexual minority welcoming religious organisations. The survey was
also promoted via Queer radio (e.g., JOY FM – Melbourne) and flyers were distributed at sexual
minority events (e.g., Brisbane Pride Day and the Brisbane Queer Film Festival). Participants were
also asked to consider informing their same-sex attracted friends/contacts about the survey.
Of the potential participants who started the survey, 192 did not pass the eligibility check (see
criteria for eligibility on p. 6) and a further 121 did not proceed past the session information page or
consent form. Of the 2,545 people who started the survey proper (i.e., answered Q.1), 2,056
completed the last question indicating a retention rate of 80.8%. Of this number, the responses of
24 participants were not included in the analyses due to a high percentage of missing data, leaving a
total number of 2,032.

NOT SO PRIVATE LIVES 6
Eligibility
Participants were invited to take part in the survey provided they met the criteria of being:
a) at least 18 years of age
b) a citizen or permanent resident of Australia
c) attracted (sexually and/or romantically) to people of the same sex
Participants, who did not select the ‘Yes’ option for all three of the questions addressing the criteria,
were thanked for their interest and directed away from the survey. Identification as same-sex
attracted was further verified by the Sexual Identity and Sexual and Romantic Attraction measures in
the main body of the survey (see Chapter 2).
Gender Different, Transgender, Transsexual and Intersex Participants
To be consistent with earlier experimental and survey research, which served as foundations for the
current study, this research focused on individuals who identified as same-sex attracted. Therefore,
this survey also welcomed gender different, transgender, transsexual and intersex participants who
felt that they met this criterion. It is acknowledged, however, that the term ‘same-sex attracted’, by
definition, can be problematic for those whose biological sex and/or gender identity do not adhere to
the assumptions that all people are born either strictly male or female, and that one’s sex defined at
birth is consistent with a person’s gender identity. As the survey did not attempt to explore how
participants might differentiate between their attractions in terms of sexual anatomy and their
attractions in terms of gender role, the term ‘same-sex attracted’ is used to broadly define an
individual’s personal assessment of their sexual and romantic attraction to others.
Auxiliary Report
An auxiliary report, based on the responses of 2, 232 participants, was released in August 2009. This
report detailed the findings in relation to a sub-set of questions presented in the first third of the
survey on current relationship status and preferences for relationship recognition. The examination
of these factors aimed to provide an insight into the preferences of same-sex attracted Australians
with regard to the legal recognition of their relationships, following the introduction of de facto
status for same-sex couples at a federal level. These findings were presented at the Australian
Federal Senate hearing of the inquiry into the Marriage Equality Amendment Bill 2009
(Commonwealth of Australia. Senate Legal and Constitutional Affairs Committee, November 9, 2009).
Findings from this larger sample were found to be consistent with those of the current sample of
2,032 (200 fewer) participants who completed the survey in full. Nonetheless, it was deemed more
appropriate to provide results to the inquiry based on the larger sample, to ensure the relationship
findings were not representative of people who may have been more inclined to complete a lengthy
survey. To compare ‘relationship recognition’ figures based on those who completed the survey in
full with those including participants who did not, refer to the findings discussed in Chapter 5 and
those provided in the Auxiliary Report provided in the Appendix.

NOT SO PRIVATE LIVES 7
Overview of Analytical Methods
A consistent analytical strategy was taken in that a variety of descriptive and inferential statistical
methods were employed including, but not limited to, Independent Factorial Analysis of Variance
(ANOVA), Factorial Repeated Measures ANOVA, Analysis of Covariance (ANCOVA), Multivariate
Analysis of Variance (MANOVA), Multivariate Analysis of Covariance (MANCOVA), Hierarchical
Multiple Regression, Binary Logistic Regression, and Pearson’s Chi-Square tests. For analyses
involving multiple comparisons between groups, the Bonferroni method was used to control the
familywise Type I error rate. For all analyses, results are discussed as being significant if p < .05.
In instances where a variable was both categorical and continuous (e.g., age group), analyses were
conducted based on both characterisations of the variable. Results related to these variables are
generally presented in bar graphs with the categorical data, to assist with the visual interpretation of
findings.
For the analyses of age as a categorical variable, results were presented based on either six age
groups (i.e., 18-19, 20-29, 30-39, 40-49, 50-59, 60+) or three age cohorts (i.e., <25, 25-34, 35+)1.
Although analyses were conducted for both numbers of categories, results are presented in the
report based on the most meaningful interpretation of findings. For example, if significant
differences were found between participants in the most senior age group (60+) relative to the rest
of the sample, findings are reported based on the six age groups in order to highlight these findings.
As all participants who selected the transgender/transsexual or intersex response options identified
as either male or female, these participants were included in all findings for the general sample. To
help increase visibility of these individuals in sexual minority research, separate analyses were also
provided, where appropriate.
For ease of interpretation, the ‘Gender Different’ and ‘Other’ response categories were combined to
form a single category (‘Gender Different’) to represent those who identified as other than male or
female. The most frequently described identity for those who selected the ‘Other’ option was
‘gender queer’. Although the number of gender different participants was relatively small (N = 47),
numbers were fairly well distributed across states/territories (NSW = 14, VIC = 12, QLD = 9, WA = 10,
ACT = 2).
In all cases, analyses were conducted to examine gender differences, age differences and
interactions between predictor variables. In the absence of any discussion of these findings,
differences were not found to be statistically significant.
1 The Australian Bureau of Statistics classifies youth as being from 15-24 years of age, young people generally as being up to
the age of 34, and those 35 and older as no longer young adults (ABS, 2009a; 2010)

NOT SO PRIVATE LIVES 8

NOT SO PRIVATE LIVES 9
11.91%
18.50%
2.07%
5.17%
28.79%
0.89%
26. 72%
5.95%
0 200 400 600 800
1
Number of respondents
Axi
sSt
ate/
Terr
ito
ryTi
tle ACT (121)
NSW (544)
NT (18)
QLD (585)
SA (105)
TAS (42)
VIC (376)
WA (242)
1. Demographics
A total of 2,032 participants completed the survey in full. This was 200 (9%) fewer than the number
who completed the first phase of the survey which included the Relationship Recognition measures
(see Appendix). Importantly, the characteristics of the sample on which the current report is based
did not differ substantially from those of the larger sample. For comparative figures, refer to the
Auxiliary Report in the Appendix.
1.1 Area of Residence
Participants were asked to select their state or territory of residence and the type of urban or rural
area in which they lived (see Figure 1 and Table 1). For this sample, thirty-two participants selected
the ‘currently living overseas’ option and were asked to provide the name of their home state or
territory in Australia. These numbers are accounted for in Figure 1 below. The survey attracted a
proportionately greater number of participants from Queensland, despite advertising across all
states and territories. This is likely to have been a result of the survey being conducted in
Queensland and advertised through The University of Queensland.
Figure 1. Numbers and percentages of participants according to state/territory of residence
Table 1. Numbers and percentages of participants according to area of current residence
N % Capital City 1494 73.5 Other metropolitan area (population 100,000 or more) 287 14.1 Large rural centre (25,000 – under 100,000) 131 6.4 Other rural area 103 5.1 Remote 17 0.8
(N = 2032)

NOT SO PRIVATE LIVES 10
1.2 Cultural Ancestry
Participants were asked to indicate their cultural background by nominating up to two ancestries, as
requested for the 2006 Australian Census. Thirty nine participants chose not to respond to this
question leaving a total of 1993 respondents. As participants were able to select up to two
ancestries (e.g., British and German), the percentages represent multiple responses and therefore
add up to over 100%. Where numbers were very small for a particular ancestry, they were either
grouped or represented as ‘Other’. The most frequently listed ancestries, aside from Australian, New
Zealander and British/Irish, were German, Italian, Chinese, Dutch, American, Greek, and Indian. With
the exception of American ancestry, these results are in keeping with those from the 2006 Australian
Census showing these six ancestries (Italian, German, Chinese, Greek, Dutch and Indian – order
according to Census results) as having the highest number of responses after Australian and
British/Irish (ABS, 2006). Eleven people (0.6%) self-identified as Indigenous Australians. As a group,
these Australians were underrepresented in the current sample. As at 30 June 2006, Australia’s
Indigenous population was estimated to be 2.5% of the total population (ABS). Although not
included in Table 2 below, 21 participants (1.1%) reported a Jewish ancestry, with this likely to be
due to the close association between Jewish religion and ethnicity. All participants reported being an
Australian citizen or permanent resident of Australia as part of the eligibility requirement of the
survey. Close to three-quarters (74.6%) reported that they had lived in Australia all their lives, with
the average duration for those who had not being 22.6 years (median = 21 years).
Table 2. Cultural ancestry (up to two ancestries)
N % Anglo/Australian/British Irish descent 1590 79.8 Australian Aboriginal and/or Torres Strait Islander 11 0.6 East Asian
Chinese
(Japanese, Korean, Mongolian, Taiwanese)
41
7
2.4
Eastern and South-eastern European
Polish
Russian
Croatian
Hungarian
Czech
Serbian
Other
13
11
10
7
6
4
21
3.6
Latin American/Caribbean 10 0.5
Middle Eastern
Lebanese
Israeli
Other
8
6
7
1.1

NOT SO PRIVATE LIVES 11
North American
American (USA)
Canadian
Native American
26
10
5
2.1
Northern European-Nordic (Danish, Swedish, Finnish, Norwegian) 16 0.8
Other Oceania
New Zealander
Maori
(Papua New Guinean, South Pacific Islander)
54
6
4
3.2
South African 14 0.7
South Asian
Indian
Sri Lankan
Pakistani
20
7
4
1.6
Southeast Asian
Filipino
Malay
Indonesian
(Singaporean, Vietnamese, Other)
14
7
5
8
1.7
Southern European
Italian
Greek
Maltese
Spanish
Portuguese
48
25
11
10
6
5.0
Western European
German
Dutch
French
Austrian
Swiss
Other
55
32
10
8
5
2
5.6
Other
European unspecified
Other African
8
7
0.8

NOT SO PRIVATE LIVES 12
1.3 Age
The mean age of this sample was 35.8 years (standard deviation 12.4) with a median age of 34 years.
Ages ranged from 18 to 82 years. Of the 81 participants in the ’60 plus’ age group, 17 were aged 70-
82. The mean ages according to gender identity were 35.4 for female, 36.8 for male, and 30.0 for
gender different participants. Table 3 below indicates the numbers and percentages of participants
by age group and according to gender identity (for description of ‘gender identity’, (see section. 2.1).
Table 3. Numbers and percentages of participants according to age group and gender identity
N
% of total % female % male
% gender different
18 - 19 121 6.0 51.2 43.8 5.0 20 - 29 634 31.2 53.9 42.3 3.8 30 - 39 537 26.5 62.0 35.9 2.1 40 - 49 441 21.7 56.7 42.4 0.9 50 - 59 215 10.6 51.2 47.9 0.9 60 + (60-82) 81 4.0 33.3 66.7 0.0 Total N = 2029. Three participants (1 female, 2 male) did not provide their age.
1.4 Education and Employment
Participants were asked to select their highest level of education completed (see Table 4). Three
participants did not specify their current level of education leaving a total of 2029 respondents for
this measure. Consistent with research findings involving sexual-minority individuals both overseas
(e.g., Cochran & Mays, 2009; Kurdek, 2008) and in Australia, the sample was highly educated when
compared with the general population. For example, the Australian Private Lives GLBTI survey
conducted in 2005, found 50.7% of participants reported having a university degree (Pitts, Smith,
Mitchell, & Patel, 2006). In the current survey, 60.8% of participants reported having a Bachelor
degree or above compared with 23% of the Australian population in general (ABS, 2009b). The
percentage of people with university degrees in Australia has increased over recent years (ABS,
2009b) which may account for some of the discrepancy between the findings from the earlier and
current Australian GLBTI surveys. It is also acknowledged that participants tend to be of higher
education in survey research in general (Kaye & Johnson, 1999). The main issue, however, is being
able to determine how representative this higher level of education status is of the sexual-minority
population is extremely difficult, given the lack of a description of this group in large population-
based studies and the stigma associated with reporting a sexual-minority status (Meyer & Wilson,
2009).

NOT SO PRIVATE LIVES 13
Table 4. Numbers and percentages for highest level of education completed
N %
Less than Year 10 27 1.3 Year 10 Certificate 78 3.8 Year 12 Certificate 358 17.6 Diploma/Trade Certificate 332 16.4 Undergraduate university degree 759 37.4 Postgraduate university diploma/degree 475 23.4
Total N = 2029 (three participants did not specify their education level).
For current employment status, participants were able to select multiple responses. The
percentages in Table 5 below, therefore, provide a total over 100%. When taking into account
multiple responses (e.g., a person who selected both full-time employment and being self-employed
is counted only once as employed), 78.9% of the sample reported being employed. The employment
rate for those not in full-time studies or retirement was 92.8%. Please note that the figures for
currently ‘not in paid employment’ are not to be interpreted as ‘unemployed’. Of the total sample,
27% reported currently being a student. According to a 2009 report from the Australian Bureau of
Statistics, 19% of the Australian population aged 15-64 was enrolled in a course of study (ABS). As
the current survey did not include individuals under 18, who as a group are more likely to be
students, the discrepancy is likely to be even greater. However, the number of students in this
survey is in keeping with the relatively high level of education of the sample.
Table 5. Numbers and percentages for current work status
N %
Full-time student 376 18.5 Part-time student 173 8.5 Full-time employment 1044 51.4 Part-time employment 404 19.9 Self-employed 194 9.5 Not in paid employment (incl. Volunteer work) 143 7.0 Retired 77 3.8
Total N = 2032 (number of participants who selected at least one response)

NOT SO PRIVATE LIVES 14
1.5 Religion
Participants were simply asked if they considered themselves to be a religious person rather than
asked to state their religious background. For this sample, 19% (n = 385) selected ‘yes’, 81% (n =
1646) selected ‘no’ and one person did not respond. In the Australian Private Lives GLBTI survey
conducted in 2005, close to 71% reported having no “current religion” (Pitts et al., 2006). The slightly
higher figures found for the current survey may be due to the different wording of the question
between the two surveys. Considering oneself to be non-religious and to have no current religion,
might not be interpreted as being one and the same. For example, some people may retain a strong
identity with a particular religion, due to the association with their school years, family background
and/or ethnicity, but may not necessarily believe in the teachings of that religion. Importantly,
41.9% of participants reported that religion (including the religious beliefs of others) plays a role in
their decisions to disclose their sexuality. Findings on religion as an influence on disclosure are
discussed in Chapter 4.

NOT SO PRIVATE LIVES 15
2. Biological Sex, Gender Identity and Sexual Attraction
2.1 Sex, Gender Identity and Sexual Identity
Participants were first asked to select their biological sex as defined at birth. Of the sample, 56.8%
(n = 1154) selected female, 43.1% (n = 875) selected male and 0.1% (n = 3) selected intersex. Four
intersex individuals reported that they were defined as male at birth, resulting in a total of seven
intersex participants. Five of these participants reported a female gender identity and two reported
a male gender identity. As ‘intersex’ is not a gender identity, and many are not defined as such at
birth, it is possible that larger numbers of intersex individuals participated in this survey. Some may
have reported a female, male or gender different identity without also indicating that they were
intersex. Percentages in relation to gender identity are provided in Table 6 below. The most
frequently described identity for those who selected the ‘Other’ option was ‘gender queer’. For ease
of interpretation, the ‘Gender Different’ and ‘Other’ response categories were combined to form a
single category (‘Gender Different’) to represent those who did not indicate a male or female
identity. When examining the numbers of transgender, transsexual, intersex, and gender different
participants, it is important to keep in mind that this survey was not open to all sexual minority
individuals but only those who identified as same-sex attracted. This is likely to have reduced the
participation of the already proportionately smaller number of transgender, transsexual and intersex
people in the sexual-minority population. It is also acknowledged that the term ‘same-sex attracted’,
by definition, can complicate matters for those whose gender identities and biological sex fall outside
of the binary definitions imposed by society.
Table 6. Current gender identity
N % Female 1107 54.5 Transgender/Transsexual - Female 11 .5 Intersex - Female 5 .3 Gender Different - Female 2 .1 Total Female 1125 55.4 Male 851 41.9 Transgender/Transsexual - Male 7 .3 Intersex - Male 2 .1 Total Male 860 42.3 Gender Different 26 1.3 Other (e.g., gender queer) 21 1.0 Total Gender Different (incl. Other) 47 2.3 Total N = 2032

NOT SO PRIVATE LIVES 16
Participants were also asked to nominate a sexual identity. The most frequent responses for the
total sample were gay, lesbian, bisexual, queer and no label, in that order. Table 7 below lists the
numbers and percentages for sexual identity for the total sample and provides a separate breakdown
by gender identity category. Consistent with research suggesting greater fluidity for female sexuality
and that females tend to be less ‘category specific’ (e.g., Diamond, 2003;2008), larger percentages of
those identifying as female, than male, nominated the terms bisexual, queer or no label. The terms
queer and bisexual were also nominated by a larger percent of gender different participants of
whom 83% reported being defined as biologically female at birth. The most frequent description of
sexual identity under the ‘Other’ category was ‘pansexual’. Eight participants (7 female, 1 male),
who identified as heterosexual, reported that they also had sexual and/or romantic attractions
towards members of the same sex.
Table 7. Sexual identity by gender identity category
Gender Identity
Female Female
Male Gender Diff
Biological Sex (as defined at birth) (defined at birth)
98.4% F
99.0% M
83.0% F
Total Sample Sexual Identity N % N %
% N %
% N %
% Gay 824 40.6 51 4.5 772 89.8 1 2.1 Lesbian 791 38.9 780 69.3 1 0.1 10 21.3 Bisexual 167 8.2 130 11.6 30 3.5 7 14.9 Queer 116 5.7 68 6.0 26 3.0 22 46.8 Heterosexual/Straight 8 0.4 7 0.6 1 0.1 0 0.0 No label 74 3.6 54 4.8 18 2.1 2 4.3 Not sure 16 0.8 15 1.3 0 0.0 1 2.1 Other (e.g., pansexual) 36 1.8 20 1.8 12 1.4 4 8.5
Total N = 2032, F = female, M = male
2.1.1 Transgender, Transsexual and Intersex Participants
Research findings for transgender, transsexual and intersex participants are often obscured due to
their relatively small numbers. Therefore, and only where appropriate, figures are provided
separately for these participants to provide greater visibility. However, results will also always be
included in data presented for the general sample. Table 8 provides the numbers for the reported
sexual identity of these participants. As noted earlier, all transgender/transsexual and intersex
participants reported having same-sex attractions, as part of the eligibility requirement of this
survey. This is likely to explain their smaller representation, as well as the smaller percentages
reporting a heterosexual identity, when compared with the Australian Private Lives GLBTI survey
(Pitts et al., 2006) conducted in 2005. For this earlier survey, 14% of these individuals reported a
heterosexual identity compared with 0.5% for the current survey. However, consistent with the
Private Lives survey, the most frequent response for transgender/transsexual females was ‘lesbian’
and for transgender/transsexual males was ‘queer’. Importantly, the small numbers of transgender,
transsexual and intersex participants in both surveys make it difficult to draw any conclusions on the
representativeness of the findings. Nonetheless, highlighting these responses is important in order

NOT SO PRIVATE LIVES 17
to create greater visibility, show the diversity within these groups, and identify consistencies
between earlier and future research.
Table 8. Sexual identity of transgender, transsexual and intersex participants
Trans-F (11) Trans-M (7) Intersex-F (5) Intersex-M (2)
Sexual Identity
Gay 0 0 0 0 Lesbian 5 0 2 0 Bisexual 2 1 2 1 Queer 1 5 0 1 Heterosexual/Straight 1 0 0 0 No label 0 1 0 0 Not sure 0 0 0 0 Other 2 0 1 0
F = female, M = male
2.2 Sexual and Romantic Attraction
Participants were invited to select the extent to which they felt sexually and romantically attracted to
either males or females. It is acknowledged that the modified version of the Kinsey Scale (Kinsey,
Pomeroy, & Martin, 1948) used for these questions, and which is utilised extensively in research
relating to same-sex attractions, is not inclusive of non-binary gender identities and intersex. The
option to select attracted to ‘equally males and females’ on the mid-point of the scale is not one and
the same as selecting an attraction to people who are biologically intersex or biologically either male
or female but gender identify as another, or being attracted to people who identify as gender
different. Although very few people did not respond to these questions (none of whom reported
being transgender, transsexual, gender different or intersex), some participants commented that
they felt quite constrained by the strictly binary options. Sexual and romantic attraction responses
for the three gender identity groups are provided in Figures 2, 3 and 4. Please note that the figures
for the two types of attractions do not necessarily represent the same participants at any given point
on the scale. For example, a person identifying as male and selecting a romantic attraction to ‘only
females’ may have also selected a sexual attraction to ‘equally males and females’.

NOT SO PRIVATE LIVES 18
72.0
18.9
3.1 3.61.2 1.1 0.2
76.4
18.9
2.3 1.1 0.6 0.5 0.20%
10%
20%
30%
40%
50%
60%
70%
80%
only males mainly males
slightly more males
equally males & females
slightly more
females
mainly females
only females
Romantic Attraction Sexual Attraction
0.21.6 2.6
6.1 5.8
24.0
59.8
0.2 0.72.9 4.9
8.0
33.5
49.9
0%
10%
20%
30%
40%
50%
60%
70%
80%
only males mainly males
slightly more males
equally males & females
slightly more
females
mainly females
only females
n
u
m
b
e
r
o
f
r
e
s
p
o
n
d
e
n
t
s
Partic
Romantic Attraction Sexual Attraction
Figure 2. Sexual and romantic attraction towards others for participants identifying as male (N = 854)
Figure 3. Sexual and romantic attraction towards others for participants identifying as female (N = 1123)

NOT SO PRIVATE LIVES 19
2.1 4.38.5
17.0
8.5
34.0
25.5
4.3 6.44.3
10.6
25.5
34.0
14.9
0%
10%
20%
30%
40%
50%
60%
70%
80%
only males mainly males
slightly more males
equally males & females
slightly more
females
mainly females
only females
Romantic Attraction Sexual Attraction
Figure 4. Sexual and romantic attraction towards others for participants identifying as gender different (N = 47))
The large majority of participants identifying as male reported being sexually attracted exclusively or
predominantly (95.3%) to males, as well as romantically attracted exclusively or predominately (91%)
to males. Comparably, the large majority of participants identifying as female reported being
sexually attracted exclusively or predominantly (83.4%) to females, as well as romantically attracted
exclusively or predominantly (83.8%) to females. Responses on the attraction scales were more
evenly distributed for participants identifying as gender different, although the majority reported
attraction on the ‘female’ side of the scales. Consistent with prior research (e.g., Pitts et al., 2006),
those who identified as male were significantly more likely than those who identified as female to
report being exclusively attracted to members of the same sex. More interestingly, a significantly
larger number of those who identified as female reported a romantic attraction exclusively to
females when compared with a sexual attraction exclusively to females (see Figure 3). Although the
statistical significance was less pronounced for those who identified as male, the pattern was
reversed with significantly larger numbers having reported a sexual attraction exclusively to males
compared with a romantic attraction exclusively to males (see Figure 2). In the case of gender
different participants, larger numbers reported being romantically attracted exclusively to females
than sexually attracted exclusively to females (see Figure 4). Although this was the same pattern
found for those who identified as female, the numbers for this group were comparatively small with
this difference not statistically significant.
2.2.1 Transgender, Transsexual and Intersex Participants
As well as being included in the findings for the general sample above, attraction responses relating
to transgender, transsexual and intersex participants are provided separately. For this survey, the
majority of female transgender/transsexual participants reported being sexually attracted exclusively
or predominantly (63.6%) to females and romantically attracted exclusively or predominantly (54.6%)
to females. Three participants (27.3%) reported an equal attraction to males and females for both

NOT SO PRIVATE LIVES 20
romantic and sexual attraction. The majority of male transgender/transsexual participants reported
being sexually attracted exclusively or predominantly (54.2%) to males with one participant (14.3%)
reporting a sexual attraction to mainly females and the remaining two participants an attraction
between these scale points. On the other hand, the numbers for romantic attraction for
transgender/transsexual males tended to be polarised with 42.9% reporting being romantically
attracted exclusively or predominantly to males and an equal 42.9% being romantically attracted
predominantly to females. The remainder responded between these scale points. For both sexual
and romantic attraction, 100% of intersex participants reported being mainly or exclusively attracted
to individuals of the gender to which they identified.
2.3 Sexual vs. Romantic Attractions
Overall, the findings from these measures indicate that sexual and romantic attractions are not
necessarily consistent. From the total sample, close to a third of participants (29.9%) indicated a
difference between the extent to which they felt romantically attracted and the extent to which they
felt sexually attracted to males and/or females. Further, only 1.2% of the sample indicated an equal
attraction to males and females when it came to both romantic and sexual attraction (for
interpretation of percentages provided in Figures 2, 3, & 4, (see section 2.2). This suggests that even
for people who identify as bisexual, it is rarely a simple case of equal attraction to men and women.
Distinguishing between the two types of attraction also allowed a person to clarify if they were
sexually attracted to neither males nor females but did have romantic attractions or vice versa.
Although the numbers were small, some participants clarified in the comment box provided for each
scale that they had only sexual attractions or only romantic attractions to people (e.g., “I’m
romantically attracted...but not sexually attracted to [anyone]”).

NOT SO PRIVATE LIVES 21
3. Awareness and First Disclosure of Sexuality
3.1 Age First Aware
Participants were first asked to recall at what age they first became aware of sexual and/or romantic
attractions to someone of the same sex. Due to the complexity of this question, particularly for
people who are transgender, transsexual or intersex, participants were invited to describe their
experiences if they preferred. The data provided in response to this question are likely to be
imprecise for a number of reasons. Like all retrospective data, it relies on the accuracy of memory.
Further, it is difficult to distinguish between the age at which a person realises at the time they have
certain attractions to others and the age at which they now realise they had these attractions.
Another issue is that what defines same-sex attractions for one person may be different for another.
For some participants, and consistent with research in this area (e.g., Savin-Williams, 2005), the
earliest memory was one of just feeling different from one’s peers. Despite the nature of this
question, the majority of participants were able to provide a specific age. In instances where a
relatively small range in age was given, the figures were averaged (e.g., “13-14” to 13.5; “15-17” to
16). Where the range provided was wider than three years (e.g., “21-24, “my teens”) or no age was
made clear, the response was not included for this particular analysis, resulting in a reduction of 9.8%
of the sample. Results for ‘age aware’ for the three gender identity groups are provided in Table 9
and Figure 5.
3.2 Age Sure
A second question asked participants at what age they felt sure within themselves that they had
same-sex attractions. Perhaps as a result of this question being a little less open to distortion than
the first, the sample size was reduced (based on criteria described above) by only 4.7% compared
with 9.8% for the question on first awareness. For some participants the inability to provide a
precise age was not due to memory issues but rather that they felt awareness was a subtle process,
or was difficult to pinpoint, with there being no defining age at which they felt sure (e.g., “I don’t
think it was a defined point, more a growing awareness since childhood”, “Sexuality is such a fluid
thing”). Importantly, even for those who made it clear that they felt sure about their attractions at a
certain age, several were not ‘self-accepting’ of their attractions at the time (e.g., “I felt
sure...although I tried to avert it or deny it”, “around 15...but denied it till around 17/18”). The
findings for ‘age sure’ of same-sex attractions are provided for the three gender identity groups in
Table 9 and Figure 5.
3.3 Age of First Disclosure
A third question asked participants at what age they first disclosed to others, including those with
similar attractions, that they were same-sex attracted. A separate response option was provided for
those who had never told anyone, with 23 participants (1.1%) reporting that this was the case. Of
the remaining sample of 2,009, 0.6% was not included in this particular analysis based on the criteria
stated in paragraph one above (i.e., the age range provided did not exceed 3 years). Results for ‘age
of first disclosure to others’ are provided for the three gender identity groups in Table 9 and Figure 5.

NOT SO PRIVATE LIVES 22
14.6
20.521.7
11.9
17
20.6
12.3
1717.9
0
5
10
15
20
25
age aware ( N=1832)
age sure (N=1936)
age 1st disclosure (N=1997)
Mea
n a
ge o
f p
arti
cip
ants
Female Male Gender Different
Table 9. Percentile ages of participants by gender identity for age first aware, age sure and age of first disclosure of same-sex attractions
Age Aware Age Sure Age First Disclosure Gender Identity Percentiles
Female (994) (1070) (1108)
25% by 11.0 16.0 17.0
50% by 14.0 19.0 19.0
75% by 17.0 24.0 25.0
Male (795) (824) (843)
25% by 9.0 13.0 16.0
50% by 12.0 16.0 19.0
75% by 14.0 18.0 22.0
Gender different (43) (42) (46)
25% by 7.0 13.5 15.0
50% by 12.0 16.0 17.0
75% by 15.0 18.5 19.3
Total N (1832) (1936) (1997)
Numbers of participants are provided in brackets ()
Figure 5. Mean ages of participants by gender identity for age first aware, age sure and age of first disclosure of same-sex attractions (total sample)

NOT SO PRIVATE LIVES 23
Participants who identified as female were found to be significantly older at the age they were first
aware of their same-sex attractions, as well as the age they were sure of these attractions, when
compared with those who identified as male or gender different. For the reported age of a person’s
first disclosure of their sexuality to anyone, those who identified as male were found to be
significantly younger than those who identified as female. Further, participants who identified as
gender different were significantly younger for age of first disclosure than both these groups.
Comparisons were also made between the time a person became sure of their sexuality and the time
it took to disclose their sexuality. Although males, as a group, were sure of their attractions before
females, they took significantly more time on average to disclose these attractions. Female and
gender different participants disclosed around one year after they felt sure of their sexuality,
whereas for males the average was three and a half years. Although sexual minorities in general can
experience negative reactions in relation to their sexuality, research has found higher levels of
prejudice towards gay men from other men than towards lesbians from other women (Herek, 2000).
Additionally, the Writing Themselves in Again national survey, involving sexual-minority youth in
Australia, found that although both males and females reported abuse in relation to their sexuality,
young males were more likely to state that they were targets of this abuse (Hillier, Turner, &
Mitchell, 2005). As such, adolescent males, although sure of their same-sex attractions at younger
ages, may, out of fear of these negative repercussions, deliberate for longer over when to first
disclose their feelings when compared with females. Another possibility is that by the time females
are sure of their sexuality they have, on average, reached a more mature age and may therefore feel
more confident in disclosing soon after.
Although findings discussed above are based on the average ages of participants according to
gender, it is important to note that both male and female participants who were most senior in this
survey (i.e., 60 years of age or over) did not disclose their same-sex attractions, on average, until
their early thirties (30.1 yrs for males and 32.6 yrs for females). Additionally, a quarter of the males
and females in this 60+ age group did not disclose for the first time until their 40s, 50s, or 60s.

NOT SO PRIVATE LIVES 24
3.4 Gender Differences Based on Age Cohort
To provide a more meaningful interpretation of the findings for awareness and disclosure of sexuality
based on gender identity, participants were grouped into one of three age cohorts (under 25, 25-34,
and 35 or older2). As can be seen in Figure 6 (A, B and C), gender differences were less pronounced
for younger cohorts relative to older with this mainly attributed to differences of those who
identified as female. Although results clearly indicated differences between the genders,
interpreting these findings in relation to age is restricted by the fact that the data do not allow for
comparisons between similar age groups at different periods in time (e.g., youth in the 1980s with
the youth of today). For example, the greater difference among females between cohorts may be
due to the possibility that female sexuality, which is argued to be more ‘fluid’ relative to male
(Baumeister, 2000), is likely to be influenced to a greater extent by the social conditions of the day
(e.g., Udry, Talbert, & Morris, 1986). Longitudinal research, however, also supports the possibility
that females, in their encounters with different relationships and situations, are likely to become
more aware of the fluidity of their sexuality as time goes by (Diamond, 2008). The findings discussed
below may be a reflection of both factors.
With the exception of the oldest cohort of females, awareness of same-sex attractions tended to
occur between the ages of 11 ½ and 13½. On average, females 35 years of age and over reported
becoming aware in their mid-teens, and for certain age groups within this cohort the average was
not until the late teens or early twenties. For example, females aged 50-59 generally reporting
becoming aware of their same-sex attractions at 19 years of age, and those 60 years, and over, at
around 23 years of age. For their male counterparts, however, the ages were 12 ½ years and 14
years respectively (averages are not provided for gender different participants in this instance, due to
the fact there were only two gender different individuals within these ages).
Females in the oldest cohort reported, on average, being sure of their same-sex attractions close to
7 ½ years later than females in the youngest cohort, whereas it was around 3 years later for the
oldest cohort of males and 4 years later for the oldest cohort of gender different participants, when
compared with their equivalent counterparts. When comparing age of first disclosure between the
youngest and oldest cohorts within each gender group, females in the oldest cohort reported this
occurring just over 8 ½ years later, whereas for males and gender different participants in the same
age group it was 6 years later and 3 ½ years later respectively.
For those under the age of 25 (Figure 6C), there were no significant differences between the ages in
which females, males and gender different participants first disclosed their same-sex attractions.
However, females, on average, were still significantly older (although only by one year) when first
aware and sure of their sexuality, compared with males. Also consistent with the results for the total
sample, males, although sure of their attractions before females, took significantly more time on
average to disclose these attractions. These young female participants disclosed approximately 4
months after feeling sure, whereas young male participants disclosed around one and a half years
later. The number of gender different participants for this reduced sample of under 25 year olds is
relatively small limiting the interpretation of any statistical comparisons (for numbers see Table 10).
2 The Australian Bureau of Statistics classifies youth as being from 15-24 years of age, young people generally as being up to
the age of 34, and those 35 and older as no longer young adults (ABS, 2009a; 2010). Analyses comparing gender differences between the six age groups of the survey (i.e., 18-19, 20-29, 30-39, 40-49, 50-59, 60+) revealed the same pattern of results for awareness and disclosure of sexuality as those found for the three main age cohorts.

NOT SO PRIVATE LIVES 25
F = 16.2
F = 23.7
M = 23.2
M = 12M = 18.2
GD = 20.2
GD = 13.2
GD = 19.7
F = 25.2
0
5
10
15
20
25
30
age aware (N=886)
age sure (N=940)
age 1st disclosure (N=970)
Mea
n a
ge o
f aw
aren
ess
and
d
iscl
osu
re
(A) 35 + age group
Female (F) Male (M) Gender Different (GD)
F =13.4
F = 18.7
M = 18.6
M = 11.5 M = 16.0 GD =17.4
GD = 12GD = 16.3
F =19.5
0
5
10
15
20
25
30
age aware (N=558)
age sure (N=586)
age 1st disclosure (N=603)M
ean
age
of
awar
enes
s an
d d
iscl
osu
re
(B) 25-34 age group
Female (F) Male (M) Gender Different (GD)
F =13
F =16.3
GD=16.6M =12 M =15.4
M=17
GD=11.9 GD=15.6
F =16.6
0
5
10
15
20
25
30
age aware (N=385)
age sure (N=407)
age 1st disclosure (N=421)
Mea
n a
ge o
f aw
aren
ess
and
d
iscl
osu
re
(C) < 25 age group
Female (F) Male (M) Gender Different (GD)
Figure 6 (A, B and C). Mean ages by gender identity, for age first aware, age sure and age of first disclosure of same-sex attractions according to age cohort

NOT SO PRIVATE LIVES 26
Table 10. Numbers of participants corresponding to data presented in Figure 6 for gender differences by cohort, for age aware, age sure and age of first disclosure of same-sex attractions
N Age Aware N Age Sure N 1st Disclosure
<25 yrs
Female 185 199 206 Male 183 192 197 Gender different 17 16 18
25 – 34 yrs
Female 338 358 369 Male 205 214 219 Gender different 15 14 15
35 + yrs
Female 470 512 532 Male 405 416 425 Gender different 11 12 13
Note: The aware, sure, and disclosure questions were presented to all participants, with numbers
varying due to number of invalid responses (refer to sections 3.1 – 3.3 for clarification).
3.5 Transgender, Transsexual and Intersex Participants
Participants who specifically selected the transgender, transsexual or intersex response options in
this survey reported either a male or female identity. They are, therefore, included in the findings for
these two larger groups presented previously. It is, nonetheless, important to acknowledge the very
different experiences of these individuals. As discussed earlier in this report, the term ‘same-sex
attracted’, by definition, can be problematic for those whose biological sex and/or gender identity do
not adhere to the assumptions that all people are born either strictly male or female and that one’s
sex defined at birth is consistent with a person’s gender identity. Although feelings of attraction to
certain others may remain stable over time, having to classify these as either same-sex or different-
sex attractions or identify at what stage they classify as one or the other, for those who transition, is
far from straightforward. It is not surprising, therefore, that several of these participants did not
provide a precise age for the awareness and first disclosure questions discussed above. Nonetheless,
nearly all participants attempted to explain their unique experiences and how it related to their sex
defined at birth, their current gender identity and/or time of transitioning. Importantly, all
transgender, transsexual and intersex participants considered themselves eligible for this survey,
given the ‘same-sex attracted’ requirement. As noted before, people who are transgender,
transsexual or intersex may also identify as heterosexual (e.g., Pitts et al., 2006).

NOT SO PRIVATE LIVES 27
4. Ongoing Disclosure of Sexuality
In contrast to the experience of disclosing one’s sexuality for the very first time, disclosure of sexual
attractions can be an ongoing process for people in general. Although the remark “Heterosexuals
don’t go around disclosing their sexuality, so why should I/they” is not uncommon, men who are
attracted to women and women who are attracted to men frequently disclose the nature of their
relationships through their everyday conversations. Although it is unlikely that anyone with only
‘different-sex’ attractions would explicitly state that they were “heterosexual”, they still convey a
disclosure message through statements like “I need to hurry up, my wife is picking me up in an hour”
or “my boyfriend makes the best chocolate cake”. The same form of indirect disclosure is obviously
also available to those with same-sex attractions. The difference is that, for this latter group, the
consequences of not remaining gender neutral in such conversations are less clear.
4.1 Experimental Research
A series of experimental studies conducted at The University of Queensland between 2005 and 2008
aimed to identify the reactions of heterosexual participants when confronted by a person ‘coming
out’ in the indirect manner described above. Male and female stage actors, who were in reality
same-sex attracted, disclosed their sexuality to a participant of their own sex either very early during
their interaction or much later. Findings showed that both male and female heterosexual
participants (total number over three years = 461) sat closer to the same-sex attracted person, liked
the person more, shared more about themselves with this person, reported that they were more
likely to be willing to introduce this person to their friends and were happier about meeting this
person in the future, when the same-sex attracted person disclosed earlier rather than later (Dane,
Masser, MacDonald, & Duck, 2010). Importantly, the form of disclosure used in this research was
one of low risk and was simply conducive to extending one’s friendship networks.
4.2 Timing of Disclosure – Survey Scenarios
The survey included a set of scenarios, in order to identify to what extent same-sex attracted people
are likely to use various disclosure strategies and at what stage of getting to know someone assumed
to be heterosexual they are more likely to use these. These scenarios, like the experiments
described above, involved a relatively low risk situation (e.g., not related to work or family) at a social
event in which an equal number of men and women were in attendance. Each scenario described
the same event, however, the people to whom disclosure was being considered appeared a) possibly
open-minded, b) possibly somewhat conservative or c) their stance was not clear. The order in which
participants were presented with the three scenarios in the survey was randomised. The wording of
the scenarios and the response options that followed are provided on the following page.

NOT SO PRIVATE LIVES 28
Scenario A (possibly positive reaction)
“You have been invited to a casual social gathering, unrelated to work, at which there are around 30 people (an
equal mixture of men and women) in attendance. You are not familiar with most of these people, however, you
assume you are in ‘straight’ company. Although these people are new to you, it is likely that you will have the
opportunity to meet them again. At a small outdoor table, you find yourself having a chat with a man and a
woman who arrived together. You do not know how these people feel about same-sex sexuality. However,
something about them gives you a hint that they may be open minded about things in general. This may be
something about their appearance, body language or something they have said on another topic.
Nonetheless, you can’t be sure about their feelings on same-sex sexuality. If you have a same-sex partner,
imagine he or she is also at this event. If you do not currently have a same-sex partner, imagine a friend (male
or female) is also at this event.
Scenario B (possibly negative reaction)
The same wording as Scenario A above with the wording in bold changed to “However, something about them
gives you a hint that they may be a little conservative (i.e., traditional) in their thinking on some issues. This
may be something about their appearance, body language or something they have said on another topic.”
Scenario C (reaction not clear)
The same wording as Scenario A above with the wording in bold changed to “Nothing about their appearance,
body language or their conversation provides any clue as to how they may feel.” with the redundant
sentence immediately following removed.
The Response Options
The same answer options were provided after each randomly ordered scenario and are detailed
below.
Q. For the hypothetical situation above, which of the responses below most closely describes how
you think you would most likely react given your current circumstances (e.g., single, partnered,
not ‘out’, partner not ‘out’). Note: Disclosure means making it known in some way that you are same-sex
attracted (e.g., introduce a partner, disclose the name of a past or present partner or offer some other
information that implies you are same-sex attracted).
o I don’t think I would disclose to this man and woman now or in the foreseeable future ( = 1)
o I would most probably wait to see if I got to know this man and woman better on another occasion
before deciding whether to disclose ( = 2)
o I would most probably disclose to this man and woman at this first meeting but only if it seemed
relevant to the topic of the conversation ( = 3)
o I would most probably disclose to this man and woman at this first meeting regardless of the topic of
the conversation (e.g. make a point of mentioning/introducing a partner or offering some other
information to make it clear) ( = 4)
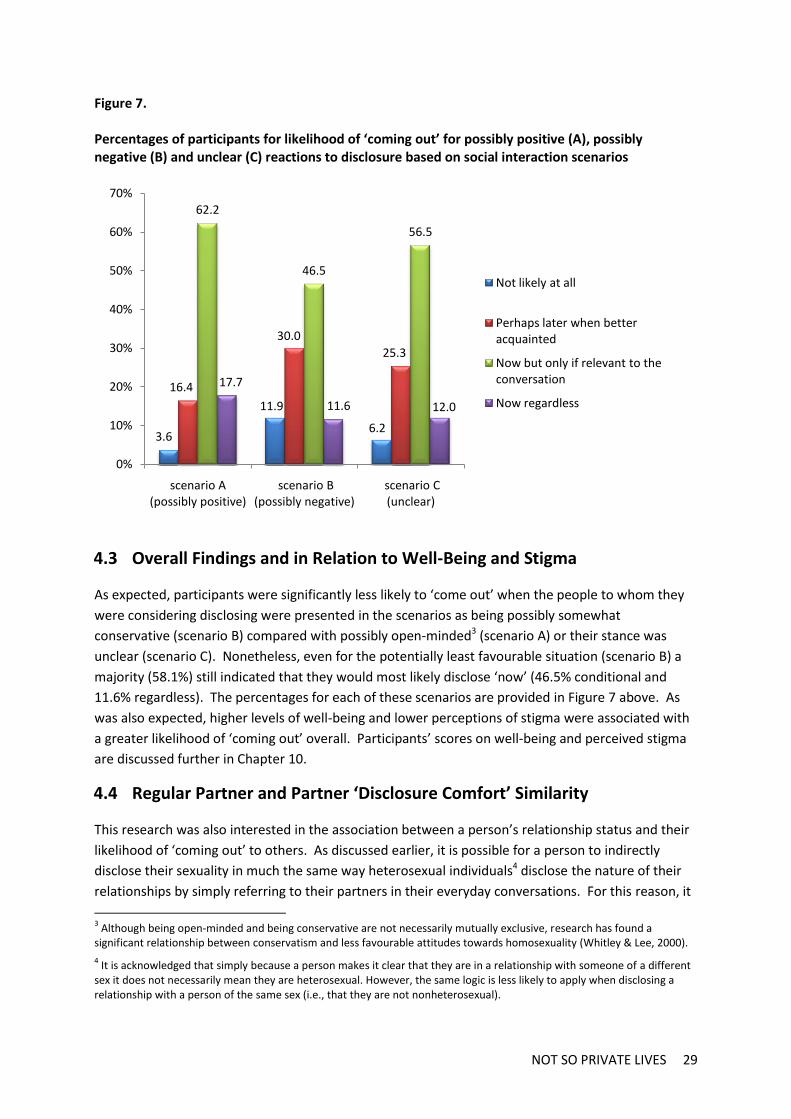
NOT SO PRIVATE LIVES 29
3.6
11.9
6.2
16.4
30.0
25.3
62.2
46.5
56.5
17.7
11.6 12.0
0%
10%
20%
30%
40%
50%
60%
70%
scenario A (possibly positive)
scenario B (possibly negative)
scenario C (unclear)
Not likely at all
Perhaps later when better acquainted
Now but only if relevant to the conversation
Now regardless
Figure 7. Percentages of participants for likelihood of ‘coming out’ for possibly positive (A), possibly negative (B) and unclear (C) reactions to disclosure based on social interaction scenarios
4.3 Overall Findings and in Relation to Well-Being and Stigma
As expected, participants were significantly less likely to ‘come out’ when the people to whom they
were considering disclosing were presented in the scenarios as being possibly somewhat
conservative (scenario B) compared with possibly open-minded3 (scenario A) or their stance was
unclear (scenario C). Nonetheless, even for the potentially least favourable situation (scenario B) a
majority (58.1%) still indicated that they would most likely disclose ‘now’ (46.5% conditional and
11.6% regardless). The percentages for each of these scenarios are provided in Figure 7 above. As
was also expected, higher levels of well-being and lower perceptions of stigma were associated with
a greater likelihood of ‘coming out’ overall. Participants’ scores on well-being and perceived stigma
are discussed further in Chapter 10.
4.4 Regular Partner and Partner ‘Disclosure Comfort’ Similarity
This research was also interested in the association between a person’s relationship status and their
likelihood of ‘coming out’ to others. As discussed earlier, it is possible for a person to indirectly
disclose their sexuality in much the same way heterosexual individuals4 disclose the nature of their
relationships by simply referring to their partners in their everyday conversations. For this reason, it
3 Although being open-minded and being conservative are not necessarily mutually exclusive, research has found a
significant relationship between conservatism and less favourable attitudes towards homosexuality (Whitley & Lee, 2000). 4 It is acknowledged that simply because a person makes it clear that they are in a relationship with someone of a different
sex it does not necessarily mean they are heterosexual. However, the same logic is less likely to apply when disclosing a relationship with a person of the same sex (i.e., that they are not nonheterosexual).

NOT SO PRIVATE LIVES 30
8.8
16.6
25.3
37.2
51.1
39.6
14.8
6.6
0%
10%
20%
30%
40%
50%
60%
70%
partnered (N=1225)
not partnered (N=803)
Not likely at all
Perhaps later when better acquainted
Now but only if relevant to the conversation
Now regardless
was anticipated that participants who reported currently having a regular partner5 would indicate, on
average, a higher likelihood of ‘coming out’ when compared with participants who reported not
currently having a regular partner or were in only casual relationships. Results showed that this was
in fact the case. Perhaps for people who are partnered, referring to their relationships may allow
disclosure to feel less awkward (or at least more relevant) in their casual conversations with others.
Another contributing factor may be the level of support offered by the presence of one’s partner
during the disclosure process. Results for being partnered vs. not partnered are provided in Figure 8
and those based on similarity to one’s partner in being comfortable about disclosing one’s sexuality
are provided in Figure 9. Although findings were significant for the likelihood of disclosure across the
three scenarios, for ease of interpretation and presentation, percentages are provided for scenario B
which was presented as being potentially the least favourable for disclosure.
Figure 8. Percentages for likelihood of ‘coming out’ for possibly negative (scenario B) reactions to disclosure for those currently same-sex partnered vs. not
For scenario B, close to two-thirds (65.9%) of participants who reported having a regular partner
selected an option to disclose now (51.1% and 14.8%), although for most this depended on its
relevance to the conversation. By contrast, the majority (53.8%) of participants who reported not
currently having a regular partner stated they were not likely to disclose at all or would most
probably delay disclosure until another time (16.6% and 37.2%). Importantly, even when a person’s
level of well-being was taken into account, having a regular partner was still significantly related to a
greater likelihood of disclosure for each of the three scenario cases and overall.
5 ‘Regular Partner’ was made distinct from ‘casual relationships only’ and ‘no primary partner but regular sex partners’. It
represents participants who selected either the ‘Regular partner (living together)’ or the ‘Regular partner (living separately)’ options for the ‘Current Same-Sex Relationship(s)’ question (see section 5.1.1). ‘Regular partner’, in all cases, refers to a regular same-sex partner. A separate question was presented regarding ‘different-sex’ relationships.

NOT SO PRIVATE LIVES 31
13.9
3.7
31.7
17.7
45.2
56.5
9.2
22.1
0%
10%
20%
30%
40%
50%
60%
70%
Partner disclosure comfort similarity
LOW
Partner disclosure comfort similarity
HIGH
Not likely at all
Perhaps later when better acquainted
Now but only if relevant to the conversation
Now regardless
Although some people may be happy to ‘come out’ to others during casual social interactions,
deciding to do so may hinge on their partner’s level of comfort with such disclosure. As such, this
research also looked at the relationship between partner similarity in relation to comfort with
disclosure/sexuality and the likelihood of ‘coming out’ for the three different scenarios. To assess
‘perceived partner similarity’ regarding this level of comfort, the survey included a five-item scale
devised by Mohr and Fassinger (2006) and asked participants to what extent they agreed or
disagreed with the statements. Examples of these items are “My partner and I are equally
comfortable being ‘out’ in public” and “My partner and I are equally comfortable being a same-sex
couple” (for more detail on this scale, refer to section 7.3). The low vs. high categories for partner
disclosure similarity (see Figure 9) were based on participants’ responses that were below the
median score and those that were above the median score.
Figure 9. Percentages for likelihood of ‘coming out’ for possibly negative (scenario B) reactions to disclosure for low vs. high partner ‘disclosure comfort’ similarity for participants reporting a regular partner of the same sex
Results indicated that although having a regular partner was related to a higher likelihood of ‘coming
out’ overall, having a partner with a similar level of comfort in disclosing was, not surprisingly,
related to a greater likelihood. Using scenario B as an example, over three-quarters (78.6%) of
participants, who perceived high levels of similarity with their partners regarding comfort in
disclosing, selected an option to disclose ‘now’ (56.5% if relevant and 22.1% regardless) despite the
prospect of encountering a possibly negative reaction by others (see Figure 10). For those who
perceived low levels of similarity, 54.4% selected an option to disclose ‘now’ (45.2% and 9.2%) and
for those with no current same-sex partner the numbers were under a majority at 46.2% (39.6% and
6.6%). Additionally, when considering the results for partner similarity for disclosure and perceptions
of how supportive a partner was in general, it was only partner disclosure similarity that was
significantly related to the likelihood of ‘coming out’.

NOT SO PRIVATE LIVES 32
4.4.1 Conclusion
Researchers have frequently discussed the benefits of ‘coming out’ for personal well-being and in
relation to changing societal attitudes (e.g., Herek, 2003). Further, recent experimental studies,
involving low risk casual encounters, have shown that heterosexual individuals respond more
positively to such disclosure when it occurs earlier rather than later (Dane et al., 2010). Overall, the
majority of participants for the hypothetical scenarios presented in this survey indicated that they
would most likely ‘come out’ during their first encounter to an assumed to be ‘straight’ couple at a
casual social gathering. For some this was if it was relevant to the conversation and for others it was
regardless. Interestingly, a majority was found for those partnered even when the situation was
depicted as being potentially negative, albeit a low risk casual encounter (scenario B). Nonetheless,
and although somewhat intuitive, it is important to acknowledge the additional challenges faced by
some individuals. The findings from this survey suggest that even for those who may wish to ‘come
out’, this decision may be hampered by their currently single status or a lack of compatibility with
their partner’s level of disclosure comfort. Although casually introducing or mentioning a partner
may facilitate disclosure in much the same way heterosexual individuals convey the nature of their
relationships, this option is not always possible for some. Several participants made it clear in the
accompanying comment boxes that if they had a partner they would be more inclined to disclose.
Many who reported having a partner stated that they would simply discuss or introduce their
partners. It is also acknowledged that relationship status and partner disclosure compatibility are
just two of a myriad of factors that are likely to be associated with decisions to ‘come out’ to others.
4.5 Gender Identity and Disclosure
No statistical differences were found between participants identifying as male, female or gender
different for the likelihood of ‘coming out’ to others for the hypothetical scenarios described above.
It is important to keep in mind that the event in the scenarios was described as having an equal
number of men and women in attendance. Further, the couple to whom ‘coming out’ was to be
considered consisted of a man and a woman. The rationale for presenting these equal numbers was
to ensure the scenarios, in terms of sex, were perceived similarly between participants. Nonetheless,
‘coming out’ in real life is not likely to always occur when in the company of both men and women.
Therefore, participants upon completion of the scenario questions were asked about their
preferences in relation to disclosing to heterosexual men vs. heterosexual women. As shown in
Figure 10 on the following page, the most frequent response for participants, regardless of their
gender identity, was that it made no difference whether a heterosexual person was male or female
when considering disclosing their sexuality, with the largest number for this equal preference being
for participants who identified as female (70.2%). For those to whom it did make a difference, the
percentages overall were higher towards a preference for disclosing to women, with the percentage
in this case being largest for participants who identified as male (48.8%). These results are consistent
with numerous studies that have found heterosexual men generally hold more negative attitudes
towards nonheterosexuals than do heterosexual women, and that this is mainly a consequence of
their negative evaluations of gay men as opposed to lesbians (Kite & Whitley, 2003). Only in the case
of gender different participants were the numbers very close to even when it came to a preference
for disclosing to either men or women.

NOT SO PRIVATE LIVES 33
0.8 1.36.40.9 3.6
14.9
49.4
70.2
59.6
33.9
18.4
12.814.9
6.5 6.4
0%
10%
20%
30%
40%
50%
60%
70%
80%
male (N=858)
female (N=1122)
gender different (N=47)
Much more likely men
Somewhat more likely men
Makes no difference
Somewhat more likely women
Much more likely women
Figure 10. Percentages in relation to participants’ preferences for ‘coming out’ to heterosexual men vs. heterosexual women
4.6 Transgender, Transsexual and Intersex Participants
The findings for transgender, transsexual and intersex participants for the likelihood of ‘coming out’,
based on the three scenarios presented, were in keeping with those of the general sample. In the
case of preferences for ‘coming out’ to either heterosexual men or women, overall the percentages
representing a preference for disclosing to women were higher compared with the general sample
(see Table 11). This is consistent with research suggesting that heterosexual men are more likely
than heterosexual women to negatively evaluate those who fundamentally challenge
heteronormative assumptions about sex and gender identity, and that women appear to be more
likely to make some distinction between sexual orientation, gender identity, and gender roles in their
evaluations (Nagoshi, Adams, Terrell, Hill, Brzuzy, & Nagoshi, 2008).
Table 11. Numbers of transgender/transsexual and intersex participants in relation to preferences for disclosing sexuality to heterosexual men vs. heterosexual women.
Trans-F Trans-M Intersex-F Intersex-M
Preference for disclosure
Much more likely men 0 0 0 0 Somewhat more likely men 0 0 0 0 Makes no difference 5 3 1 1 Somewhat more likely women 2 3 1 1 Much more likely women 4 1 3 0

NOT SO PRIVATE LIVES 34
58.1
10.0
15.8
7.9 6.02.2
0%
10%
20%
30%
40%
50%
60%
70%
No influence rarely sometimes but more
than rarely
about half of the time
most of the time
always
4.7 Religion and Disclosure
Identifying as a religious person was not significantly related to a person’s likelihood of ‘coming out’
based on the social interactions described in the three scenarios. Of the 385 participants in this
survey who stated that they considered themselves to be religious, less than half (48.3%) felt that
religion (including the religious beliefs of others) had an influence on their decisions to disclose or
not disclose their sexuality in everyday life. Further, of the 1646 participants who stated that they
did not consider themselves to be religious, 40.5% nonetheless felt religion (including the religious
beliefs of others) did have an influence on their decisions to disclose or not. Statistical analyses
revealed that it was only the extent of religious influence in everyday life, rather than one’s own
religious beliefs, which was significantly related to the likelihood of ‘coming out’ during the social
encounters depicted in the three hypothetical scenarios. Specifically, the greater the religious
influence the lower the likelihood of disclosure for all three scenarios, with this association strongest
for the ‘possibly negative reaction’ (scenario B) outcome. Figure 11 shows the percentages of
participants based on the responses for extent of religious influence on disclosure in everyday life.
Figure 11. Percentages of participants in relation to extent of religious influence (including the religious beliefs of others) on decisions to disclose sexuality (N = 2031)

NOT SO PRIVATE LIVES 35
4.8 Acceptance and Disclosure
As past experiences with disclosing one’s sexuality are likely to have some impact on ongoing
disclosure, this survey also looked at participants’ perceptions of acceptance from various sectors
and their association with the likelihood of ‘coming out’ during the social encounters depicted in the
three scenarios. When considering all five areas of acceptance together (i.e., heterosexual friends,
heterosexual contacts from the wider community, mother, father and siblings), it was perceived
acceptance from heterosexual friends, contacts from the wider community and from a mother which
were significantly related to a person’s likelihood of disclosing in the scenarios. Of these, a mother’s
acceptance was the stronger predictor, followed by heterosexual friends. These findings suggest that
experiences of disclosure to close others are, on average, likely to have some ongoing influence on
decisions to be relatively upfront, or not, regarding one’s sexuality.

NOT SO PRIVATE LIVES 36
5. Relationships and Recognition
NOTE: Findings for the ‘Relationship Recognition’ measures discussed in this chapter were presented
in an earlier report (Auxiliary Report) which was submitted to the Federal Senate inquiry into the
Marriage Equality Amendment Bill 2009 (Commonwealth of Australia. Senate Legal and
Constitutional Affairs Committee, November 9, 2009). The findings from this earlier report related to
the 2,232 participants who completed the ‘Relationship Recognition’ questions presented in the first
third of the survey. Results were found to be consistent between this larger sample and the current
sample of 2,032 (200 fewer) participants who completed the survey in full. Nonetheless, it was
deemed more appropriate to provide results to the Senate inquiry based on the larger sample, to
ensure the relationship findings were not just representative of people who may have been more
inclined to complete a lengthy survey. For comparisons between the results provided in this chapter
based on the responses of 2,032 participates with those of the larger sample of 2,232, please refer to
the Auxiliary Report in the Appendix.
5.1 Relationship Background
Of the current sample, 94.6% reported being in some type of same-sex relationship (including casual)
at some stage in their lives, with the remaining 5.4% stating that they had never been in any type of
same-sex relationship.
5.1.1 Current Relationship
Of the sample, 8.4% reported currently being in a different-sex relationship (worded as ‘opposite-
sex’ in the questionnaire) and 66% reported currently being in some form of same-sex relationship
(note: 5.1% reported currently being in a same-sex and different-sex relationship). The numbers and
percentages for ‘current same-sex relationship’ are provided in Table 12. The differences between
the findings for the larger sample of 2,232 and the current sample of 2,032 for ‘current relationship’
were minimal with 33.7% vs. 34% having reported not being in a current same-sex relationship of any
type and 60.7% vs. 60.4% having reported being in a relationship with a regular partner.
Table 12. Type of current same-sex relationship
N %
Regular partner (living together) 919 45.3 Regular partner (living apart) 307 15.1 No primary partner but regular sex partners 36 1.8 Casual relationship(s) only 77 3.8 Not currently in a same-sex relationship 690 34.0 Total N = 2029 (three participants did not respond)
Figure 12, on the following page, represents the percentages of participants who reported having a
regular same-sex partner according to participants’ age group and gender identity. As the small
number of gender different participants in this survey was reduced when considering only those with
a regular partner, the numbers for these participants are provided in Table 13 below Figure 12.

NOT SO PRIVATE LIVES 37
29.0
57.3
72.6 74.0 75.5
66.7
24.5
44.0
66.861.5
56.359.3
0%
10%
20%
30%
40%
50%
60%
70%
80%
18-19 20-29 30-39 40-49 50-59 60 plus
female male
When looking at the results for all ages combined, 66.0% of female, 54.2% of male and 38.3% of
gender different participants reported having a regular same-sex partner. This outcome is consistent
with that from the Australian Private Lives GLBTI survey (Pitt et al., 2006), which found higher
percentages of women (59.5%) than men (42.9%) reported a current same-sex relationship. For
numbers of participants represented in each of the categories, refer to Table 13 below Figure 12.
Figure 12. Percentages of participants reporting a regular same-sex partner by age group and gender identity
Table 13. Number of participants with regular same-sex partner according to age group and gender identity
Age group Female Yes (No) Male Yes (No) Gender different Yes (No)
18-19 18 (44) 13 (40) 1(5) 20-29 196 (146) 118 (150) 9 (15) 30-39 241 (91) 129 (64) 4 (7) 40-49 185 (65) 115 (72) 3 (1) 50-59 83 (27) 58 (45) 1 (1) 60 plus 18 (9) 32 (22) No cases
Total N = 2028 (four participants did not provide an age and/or their relationship status)
5.1.2 Length of Current Relationship
Figure 13 provides the average length of current relationship with a regular partner for participants
identifying as female or male. Due to the small number of gender different participants for this
reduced sample, the results for this group have not been included in Figure 13. The overall average
length of current relationship for gender different participants was 2.9 years with 25% of this group
having reported being in a relationship for 6 years or more. The longest current relationship for this
group was 12 years. Results overall showed that although higher percentages of those who

NOT SO PRIVATE LIVES 38
1.32.2
4.0
5.4
7.5
*5.2
0.34
2.4
5.5
8.2
11.111.8
0
2
4
6
8
10
12
14
18-19 20-29 30-39 40-49 50-59 60 plus
mea
n le
ngt
h in
yea
rs
female male
identified as female reported having a regular same-sex partner (see Figure 12), the average length
of these current relationships was significantly longer for those who identified as male compared
with female (see Figure 13). Results from the earlier Australian Private Lives GLBTI survey (Pitts et al.,
2006) found 41% of males reported being in their current relationship for 5 years or more compared
with 32% of females. For the current survey, the pattern was similar with 47% of those identifying as
male having reported to be in their current relationship for 5 years or more compared with 32.5% of
females.
Figure 13. Average length of current relationship with regular same-sex partner for participants identifying as male or female
* Numbers of female participants in the 60 + age-group were proportionately smaller relative
to their representation in other age groups. For numbers refer to Table 13.
The findings for females 60 years of age and older should be interpreted with caution, given the
relatively small number in this age group. Further, over half of the female participants in this older
age group reported a fairly recent relationship of 1 year duration or less. When considering the
longest reported relationship (rather than current) for female participants in this group, the average
length was 8.6 years which is consistent with the overall trend. Thirty participants from the overall
number of those identifying as male and female were not included in the data presented in Figure 13
above. Of these, 17 did not provide a duration and 13 stated that they were in a relationship for less
than one month, with no specific duration obtained. Of these participants, 6 (2 female, 4 male) were
from the 18-19 age group, 9 (6 female, 3 male) were from the 20-29 age group, 7 (6 female, 1 male)
were from the 30-39 age group, 5 (3 female, 2 male) were from the 40-49 age group, and 3 (2
female, 1 male) were from the 50-59 age group.
Table 14 lists the minimum length of current relationship for 50% and 25% of the male and female
gender identity groups according to age group. For example, 50% of male participants aged 40-49
reported being in a current same-sex relationship for 8 years or more, and 25% for 13 years or more
with the longest for this male age group being 26 years.

NOT SO PRIVATE LIVES 39
Table 14. Minimum number of years together in current relationship for 50% and 25% of male and female gender identity groups according to age
Age group Female 50%=>
Female 25%=>
Female longest
Male 50%=>
Male 25%=>
Male longest
18-19 1.0 2.0 4.0 0.2 0.6 1.0 20-29 1.2 3.0 10.0 2.0 4.0 11.0 30-39 3.0 6.0 15.0 5.0 9.0 17.0 40-49 3.0 9.0 23.0 8.0 13.0 26.0 50-59 5.0 11.0 31.0 7.0 19.0 33.0 60 plus 1.0 6.0 28.0 7.0 18.0 41.0
5.1.3 Transgender, Transsexual and Intersex Participants
Table 15 below lists the numbers of transgender, transsexual and intersex participants who reported
that they had a current regular same-sex partner. The current length of these relationships ranged
from 1 month to 10 years with the longest on average being for transgender/transsexual male
participants. Transgender/transsexual male participants who reported currently having a regular
partner were also younger relative to others listed in Table 15, with 80% being under the age of 35.
The large majority of those partnered in the remaining three groups were over the age of 35.
Table 15. Transgender/transsexual and intersex participants with regular same-sex partner
Yes (No) Transgender/Transsexual - Female 4 (7) Transgender/Transsexual - Male 5 (2) Intersex - Female 3 (2) Intersex - Male 0 (2)
5.1.4 Concluding Comment
Discussion of the findings in this chapter regarding the duration of same-sex relationships is not
meant to imply that longer relationships are necessarily better relationships. Further, any
interpretation of the length of relationships of participants in this survey is difficult due to a host of
factors. First, the data represent ongoing relationships, including those which were just recently
formed. Second, nonheterosexuals and their relationships continue to be perceived less favourably
by certain sectors (e.g., Newspoll, 2006) and at this moment relationships are not affirmed by society
through official registration or ceremonial process in Australian national law. Additionally, at the
time the current survey was conducted, Australian national law recognising de facto status for same-
sex couples had only just come into effect, and state and territory provisions for relationship
registration were relatively recent and available only in some jurisdictions. This restricted access to
any formal recognition of same-sex relationships in Australia may have some influence on the
longevity of these relationships. For example, researchers have argued that socially sanctioned

NOT SO PRIVATE LIVES 40
relationships, such as marriages (between different-sex couples), may provide for more enduring
relationships (albeit not necessarily positive) through perceptions of increased commitment and
social support (e.g., Cherlin, 2004). In keeping with this argument, an American study, involving 552
married same-sex couples living in Massachusetts, found that a substantial majority reported that
marriage had increased their commitment to their spouses, and that they felt more accepted by their
communities and families as a result (Ramos, Goldberg, & Badgett, 2009). Lastly, it is important to
acknowledge the many factors which could have inhibited the same-sex relationships of participants
in the current survey from forming in the first place. For example, and as discussed earlier in this
report (see section 3.3), those in older age groups ‘came out’, on average, to someone for the very
first time at significantly older ages. Therefore, in the case of more senior participants, some would
not have been able to even start a relationship with someone of the same sex until later years in life.
This would naturally have an impact on the length of the relationship relative to a person’s age.
5.2 Current Legal Status of Same-Sex Relationship
Note: Findings were initially released based on a larger sample of participants, including those
who did not complete the survey in full. For comparative figures see Appendix-Auxiliary Report.
Participants who reported that they currently had a regular same-sex partner (whether living
together or apart) were asked how they would describe their current same-sex relationship in legal
terms. To minimise confusion, participants were provided with examples for relationships formalised
through a state or municipal registry in Australia. These were ACT Civil Partnership, City of
Melbourne Relationship Declaration, City of Sydney Relationship Declaration, Tasmania Significant
Relationship, Victoria Domestic Partnership and Yarra City Council Relationship Declaration.
Examples of relationships recognised overseas were provided next to the relevant answer options
(see Table 16 below).
Table 16. Reported current legal status of same-sex relationship for participants with a regular same-sex partner, living together or apart
N % No legal status 484 39.5 De facto 660 53.8 Relationship formalised through a state or municipal registry (see examples above)
46 3.8
Overseas recognised relationship other than marriage (e.g., UK Civil Partnership, NZ Civil Union)
39 3.2
Overseas marriage (e.g., Canada, Netherlands, South Africa, Massachusetts)
22 1.8
Note: Respondents were able to select more than one option. Participants were able to select more than one option regarding the legal status of their current
relationship with their regular partner, resulting in a total of over 100%. The question asking
participants how they would describe the legal status of their same-sex relationship also provided
the option of selecting ‘Other’. Forty-six participants (3.8%) selected this ‘Other’ option. However,
the majority of these participants (29 out of 46) had also selected one of the categories listed in

NOT SO PRIVATE LIVES 41
Table 16 and simply utilised the ‘Other’ text box to clarify their selection. Three participants used the
‘Other’ option to state that they were unsure about the legal status of their relationship and 13 did
not make the legal status of their relationship clear in their description.
Responses for this second report were very similar to those for the Auxiliary Report on relationship
recognition (see Appendix). For example, 39.5% of this sample reported no legal status compared
with 40.5% in the first report and 53.8% reported being in a de facto relationship in this sample
compared with 53.1% in the first report.
5.2.1 Gender Identity and Current Legal Status
Table 17 lists the numbers and percentages of participants according to the reported legal status of
their relationships and their gender identity. Larger percentages of gender different participants
reported that their current relationship had no legal status when compared with those identifying as
male or female. It is important to note, however, that gender different participants were younger on
average when compared with the rest of the sample, with 50% aged 26 years or under. Legal status
of relationships was markedly similar between male and female identifying participants. However,
given the number of male identifying participants in this particular sample relative to female, larger
percentages of those who identified as male reported being in a formally registered relationship
whether in Australia or overseas. Small numbers of participants also selected the ‘Other’ option. For
clarification of these ‘Other’ responses, refer to section 5.2.
Table 17. Reported current legal status of same-sex relationship for participants with a regular same-sex partner according to gender identity
N - F % - F N - M % - M N- GD % - GD
No legal status 286 38.5 185 39.7 13 72.2 De facto 408 55.0 249 53.4 3 16.7 Relationship formalised through a state or municipal registry
26 3.5 20 4.3 - -
Overseas recognised relationship other than marriage (e.g., UK Civil Partnership, NZ Civil Union)
20 2.7 19 4.1 - -
Overseas marriage (e.g., Canada, Netherlands, South Africa, Massachusetts)
10 1.3 12 3.9 - -
Note: Respondents were able to select more than one option. F = Female, M = Male, GD = Gender Different

NOT SO PRIVATE LIVES 42
2.9% (54)
14.8% (279)
27.6% (519)
54.7% (1028)
None
De facto
Federally recognised registry - other than marriage
Marriage
5.2.2 Commitment Ceremonies
Of the participants with a current regular same-sex partner, 10.4% reported that they had a
commitment ceremony unrelated to any official registration of a relationship. Of these individuals,
70% identified as female and 70% were from the older cohort of 35 years of age or over, when
considering the three main cohorts in this survey (i.e., under 25 years, 25-34 years, 35+ years).
5.3 Personal Preference for Legal Recognition of Same-Sex Relationship
All participants, regardless of whether or not they were currently in a same-sex relationship, were
asked about their personal preference for legal relationship recognition in Australia. Figure 14 below
indicates the responses to the question “If you are or were to become involved in a long-term
committed same-sex relationship, in what way would you prefer Australian law to recognise your
relationship?”
Figure 14. Personal preference for relationship recognition - general sample (including those not currently in a same-sex relationship)
The percentages for personal preference for relationship recognition were consistent with those for
the earlier Auxiliary Report, which included the participants who did not complete the survey in full.
In the earlier report, 54.2% reported a preference for marriage vs. 54.7% for the current sample,
27.8% for a federally recognised relationship documented at a registry other than marriage vs. the
current 27.6%, 15.0% for de facto status vs. the current 14.8%, and 3.0% none vs. the current 2.9%.
Further, a clear majority preference for marriage was found for all states and the Australian Capital
Territory. The Northern Territory was the only area for which this was not the case with 23.5%
indicating that they would prefer to marry and an even percentage of 35.3% for both de facto and a
federally recognised relationship documented at a registry other than marriage. Although these
findings may reflect genuine differences in relationship preferences for this group compared with the
rest of the sample, the small number of participants (N =18) from this area very much limits the
extent to which these results can be interpreted as being representative.

NOT SO PRIVATE LIVES 43
2.5 3.17.9
14.6 15.410.5
24.8
30.8
36.8
58.1
50.7
44.7
0%
10%
20%
30%
40%
50%
60%
70%
female (N=1043)
male (N=799)
gender different (N = 38)
None
De facto
Federally recognised registry - other than marriage
Marriage
Of the total sample, six participants stated that they preferred a Civil Union and three stated that
they preferred a Civil Partnership, in the ‘Other’ text box provided. As both types of relationships are
forms of federally recognised relationships documented at a registry (other than marriage), these
nine responses were included in the main category ‘Federally recognised registry- other than
marriage’. Nineteen participants from this sample selected the ‘not applicable’ option (e.g., never
wish to be in a long-term committed same-sex relationship) and were therefore excluded from the
analysis. From the remaining sample of 2,013, 133 participants selected the ‘Other’ option with the
most common statement used to clarify this selection being that they simply wanted the same rights
as heterosexuals (e.g., “identical to opposite-sex relationship recognition and rights”, “exactly the
same as heterosexual couples”). These responses, although making an important statement, did not
make clear a single preference as instructed by the question. Therefore, these responses, along with
those from others who did not indicate a specific preference, were not included in this analysis.
However, it is acknowledged that making a specific choice may have been difficult for some
participants, particularly those who were not currently in a committed same-sex relationship.
5.3.1 Gender Identity and Relationship Recognition
Figure 15 shows the percentages for personal preference for relationship recognition according to
gender identity. Although the majority of both male and female identifying participants selected
‘marriage’ as their personal choice, the percentage was larger among those identifying as female
(when considering younger-age participants, this difference between males and females was no
longer observed - see Figure 17). Marriage was the most frequent option for gender different
participants, however, unlike for male and female respondents, marriage was the preferred option of
less than 50%. In all cases, a federally recognised relationship documented at a registry (other than
marriage) was the second most frequent choice, followed by de facto.
Figure 15. Percentages of participants for personal preference for relationship recognition according to gender identity groups

NOT SO PRIVATE LIVES 44
0.9 1.0 2.4 3.5
7.39.7
7.7 8.813.4
22.0 23.3 23.624.8
27.4 25.829.4 29.0 33.3
66.762.8
58.4
45.140.4
33.3
0%
10%
20%
30%
40%
50%
60%
70%
80%
18-19 20-29 30-39 40-49 50-59 60 plus
None De facto Federally recognised registry - other than marriage Marriage
5.3.2 Age and Relationship Recognition
Figure 16 below shows the percentages for participants’ personal preferences for relationship
recognition by age group. As three people did not provide their age, the numbers are three fewer
than those included in Figure 15 (for information on invalid responses refer to section 5.3). When
taking into account a person’s age, findings showed that the percentages of those who selected
marriage as their personal choice increased as the age of participants decreased. For example, two-
thirds of participants 18-19 selected marriage as their personal preference compared with one third
of those 60 years of age or older. Percentages for de facto and no legal recognition increased as age
of participants increased. Preferences for a federally recognised registry (other than marriage)
varied slightly between age groups, relative to the other three options. The majority of both male
and female participants in the three younger age groups (i.e., 18-19, 20-29, and 30-39) selected
marriage as their personal choice. Although marriage remained the most frequent response for both
male and female participants for the older age groups (except the 60+ group), the numbers in these
cases were less than 50%. For gender different participants, results showing a majority for marriage
was found only for those aged 18-19, with percentages evenly split between marriage and a federally
recognised registry (other than marriage) for the remaining age groups.
Figure 16. Percentages of participants for personal preference for relationship recognition according to age group (N = 1877)

NOT SO PRIVATE LIVES 45
1.0 1.6
9.84.8
26.330.1
52.9
62.9 63.4
47.1
0%
10%
20%
30%
40%
50%
60%
70%
female (N=205)
male (N=186)
gender different (N=17)
None
De facto
Federally recognised registry -other than marriage
Marriage
5.3.3 Relationship Recognition for Younger-Age Participants
As previously noted, although overall the majority of both male and female identifying participants
selected marriage as their personal choice (see Figure 15), the percentage was larger among those
identifying as female (58.1%) when compared with male (50.7%). When observing the findings for
preferred relationship recognition for the three main age categories in this survey (i.e., under 25, 25-
34, 35+), the greater preference for marriage among female participants, relative to male, was no
longer apparent for the youngest cohort. Younger-age participants are more likely to have
experienced greater mainstream acceptance relative to their years (Savin-Williams, 2005). Further,
the youngest of these have approached and/or entered into their adulthood during a time when the
definition of marriage, in a growing number of countries, has been extended to include two
consenting adults. It is possible then that this experience of greater social inclusion at least partially
explains the higher reported preference for marriage amongst these younger individuals (see Figure
16) and what appears to be a greater similarity between genders (see Figure 17).
Figure 17. Percentages of participants for personal preference for relationship recognition according to gender identity for participants 18-24 yrs
5.3.4 Transgender, Transsexual and Intersex Participants
Table 18 provides the numbers of transgender/transsexual and intersex participants according to
their personal preferences for relationship recognition. In the case of transgender/transsexual and
intersex participants identifying as female, the majority selected marriage as their personal choice.
For those identifying as male, the choice was more varied. Of the three participants with responses
missing, two transgender/transsexual participants (1 female, 1 male) stated in the comment box that
they simply felt all types of relationships should be available and treated equally. As this particular
question requested a personal choice, these important statements were noted but not included with
the main data. The remaining missing participant selected the ‘not applicable’ option.

NOT SO PRIVATE LIVES 46
1.5%
16.9%
26.0%
55.6%
None De facto Federally recognised registry - other than marriage Marriage
Table 18. Numbers of transgender/transsexual and intersex participants for personal preference for relationship recognition
None De facto Fed.
Registry Marriage Missing
Transgender/Transsexual - Female 1 1 2 6 1 Transgender/Transsexual - Male 1 2 1 1 2 Intersex - Female 0 0 0 5 0 Intersex - Male 0 0 2 0 0
5.4 Preferred Legal Recognition of Relationship for those Partnered
Figures 18 through to 22 indicate the personal preferences for the legal recognition of a committed
same-sex relationship for participants who reported currently having a regular same-sex partner
whether living together or apart (N = 1,226). Those with invalid responses, for reasons described in
section 5.3, were not included in these particular analyses leaving a total of 1,143 responses across
categories. Responses are grouped according to the current legal status of participants’ same-sex
relationships. For findings on the majority preferences for marriage (75-80%) for those partnered
and living with young children, refer to section 6.3.
Figure 18. Preferred legal recognition for those currently in a same-sex de facto relationship (N = 620)

NOT SO PRIVATE LIVES 47
2.7%
37.8%
59.5%
De facto Federally recognised registry - other than marriage Marriage
Figure 19. Preferred legal recognition for those with a current same-sex relationship formalised through a state or municipal registry - for examples, see section 5.2 (N = 45)
Figure 20. Preferred legal recognition for those currently in an overseas recognised relationship other than marriage - e.g., NZ Civil Union, UK Civil Partnership (N = 39)
2.2%
20.0%
77.8%
De facto Federally recognised registry - other than marriage Marriage

NOT SO PRIVATE LIVES 48
6.3%
13.1%
27.0%
53.6%
None De facto Federally recognised registry - other than marriage Marriage
9.1%
90.9%
Federally recognised registry - other than marriage Marriage
Figure 21. Preferred legal recognition for those currently in an overseas marriage (N = 22)
Figure 22. Preferred legal recognition for those currently in a same-sex relationship with no legal status (N = 484)

NOT SO PRIVATE LIVES 49
0.9
48.4
59.7
78.0
0%
10%
20%
30%
40%
50%
60%
70%
80%
90%
1
None (18)
De facto (984)
Federally recognised registry - other than marriage (1214)
Marriage (1585)
5.5 Preferred Options for Relationship Recognition in Australia
Participants were also asked about their preferences regarding legal recognition in Australia for
same-sex couples in general. Figure 23 below shows participants’ responses to the question
“Irrespective of your personal preference, which form(s) of relationship recognition would you like to
see remain and/or become available for same-sex couples in Australia?” Note: Participants in this
instance were able to select multiple options.
Figure 23. Percentages of participants for preferred legal options for same-sex couples in Australia (N =2032)
Of the total sample, 78% of participants reported that they felt marriage should be made available
for same-sex couples in Australia, 59.7% were in favour of the availability of a federally recognised
relationship documented at a registry, and 48.4% were in favour of the option for de facto status. As
this question allowed for multiple responses, these figures indicate that many felt that
nonheterosexual couples should simply be given a choice.
5.6 Perceptions of the Public’s Attitude towards Same-Sex Relationships
The survey also asked participants how they felt the Australian public viewed legally recognised
same-sex relationships relative to legally recognised different-sex relationships. Specifically,
participants were asked how equivalent in value (i.e., worth) they felt the public viewed a) same-sex
de facto relationships when compared with different-sex de facto relationships and b) current same-
sex options for officially registered relationships (e.g., domestic and civil partnerships) compared
with different-sex marriages. Figure 24 (A and B) provides the percentages of participants
responding to the scale 1 = not at all equivalent in value to 7 = absolutely equivalent in value. These
questions also included a separate option for those who felt unable to make a judgement. A total of
1,938 participants responded to both, 92 selecting ‘unsure’ for at least one of the questions and two
chose not to respond.

NOT SO PRIVATE LIVES 50
18.6
24.8
22.1
14.8
12.3
5.5
1.9
0%
5%
10%
15%
20%
25%
30%
(A). Different-sex marriage vs. current same-sex options (e.g., domestic or civil partnerships)
11.8
25.126.2
12.7
15.5
5.8
2.9
0%
5%
10%
15%
20%
25%
30%
(B). Different-sex de facto vs. same-sex de facto
Figure 24 (A and B). Participants perceptions of the Australian public’s perception of the value (i.e., worth) of same-sex relationships relative to different-sex relationships (N = 1938)
Overall, both types of same-sex relationships were perceived by participants as being considered by
the general public to be of lesser value than their different-sex counterparts6. Given the long and
ongoing battle for relationship recognition for nonheterosexual couples, this is not surprising. More
interestingly, and although the difference was not large, this discrepancy was significantly greater
when it came to different-sex marriages vs. other forms of relationship registration available to
same-sex couples. It is important to note, however, that de facto status for same-sex couples in
Australia came into effect only months before the commencement date of this survey. Further, a
relatively small number of same-sex couples have documented their relationships through a state or
municipal registry (TGLRG, 2010). Given this, perceptions in most cases were not likely to have been
based on any personal experience. Additionally, the responses to these questions do not necessarily
reflect participants’ personal views on the value of these different types of relationships, rather
simply how they feel they are valued by others.
6 Marriage is currently not available to same-sex couples in Australia, however, same-sex relationships can be formally
recognised through a state or municipal registry in some jurisdictions.

NOT SO PRIVATE LIVES 51
5.8 7.5
14.7
26.4
45.6
1.4 3.47.2
19.3
68.7
0%
10%
20%
30%
40%
50%
60%
70%
80%
a lot less in value
2 3 4 at least as much value
A. Perceptions of how heterosexual friends value one's same-sex relationship (N=1153)
compared with different-sex marriages (left)
compared with different-sex de facto (right)
5.7 Perceptions of Others’ Attitudes Regarding the Value of One’s Same-Sex
Relationship
Participants who reported having a same-sex partner were asked how equivalent in value (i.e.,
worth) they felt others, who were aware of their relationships, viewed their particular relationship
relative to different-sex de facto relationships and marriages. Unlike the previous questions, that
focused on perceptions of the public’s attitude towards same-sex relationships, these questions
allowed for a more personal assessment based on one’s own experiences. Response options ranged
from 1 = a lot less in value to 5 = at least as much value. Numbers of participants represent those
who answered both questions, had a regular same-sex partner and reported others were aware of
their relationships for each of the areas assessed. Analyses revealed that, in all cases, a person’s own
same-sex relationship was perceived to be seen by others as being of lesser value to a significantly
greater extent when compared with different-sex marriages than when compared with different-sex
de facto relationships. When considering the views of heterosexual friends and contacts apart from
friends (e.g., neighbours, co-workers, employers, and teachers) these findings were even more
pronounced among participants who reported that they would prefer to marry. Figure 25 provides
the percentages according to response options in relation to perceptions of heterosexual friends,
heterosexual contacts (apart from friends), parents and siblings. For example, 68.7% of participants
with a same-sex partner felt that their heterosexual friends, overall, considered their same-sex
relationships to have at least as much value as different-sex de facto relationships, however, only
45.6% reported the same when it came to comparisons with different-sex marriages. In the case of
family, 51.2% of participants felt that their parent(s) considered their same-sex relationships to have
at least as much value as different-sex de facto relationships, however, only a third (33.6%) reported
the same for the comparison with different-sex marriages.
Figure 25 (A, B, C and D). Participants’ perceptions of how heterosexual friends, contacts and family members valued their same-sex relationships relative to different-sex relationships

NOT SO PRIVATE LIVES 52
9.516.4
29.6 28.0
16.6
2.87.7
24.4
35.529.6
0%
10%
20%
30%
40%
50%
60%
70%
80%
a lot less in value
2 3 4 at least as much value
B. Perceptions of how heterosexual contacts value own relationship (N = 1075)
compared with different-sex marriages (left)
compared with different-sex de facto (right)
15.211.1
17.322.8
33.6
8.2 6.912.6
21.1
51.2
0%
10%
20%
30%
40%
50%
60%
70%
80%
a lot less in value
2 3 4 at least as much value
C. Perceptions of how parent(s) value own relationship (N = 1085)
compared with different-sex marriages (left)
compared with different-sex de facto (right)
9.0 9.0
14.5
21.6
45.9
3.9 5.0
11.416.9
62.8
0%
10%
20%
30%
40%
50%
60%
70%
80%
a lot less in value
2 3 4 at least as much value
D. Perceptions of how sibling(s) value own relationship (N = 1080)
compared with different-sex marriages (left)
compared with different-sex de facto (right)

NOT SO PRIVATE LIVES 53
10
15
20
25
30
35
40
a lot less 2 3 4 at least as much
Ave
rage
sco
re f
or
ove
rall
wel
l-b
ein
g (P
WB
)
value of relationship
5.8 Well-Being and Perceptions of How Others Value One’s Relationship
The more people felt their relationships were valued on a comparable level with different-sex
relationships the significantly greater their reported level of overall well-being. This was found to be
the case when considering the extent to which participants felt that their heterosexual friends,
heterosexual contacts (such as neighbours, employers, teachers or co-workers), parents and siblings
valued their same-sex relationships relative to different-sex de facto relationships and marriages. As
an example, Figure 26 below shows the relationship between well-being and perceptions of how
heterosexual friends value one’s same-sex relationship relative to different-sex marriages.
Figure 26. The relationship between overall psychological well-being (PWB) and perceptions of how heterosexual friends value one’s same-sex relationship compared with different-sex marriages
5.9 Summary
Despite the reference to percentages regarding the relationship recognition measures presented in
this survey, it is acknowledge that numbers are not necessarily relevant when it comes to the
argument for relationship equality. As is often stated, it is about the right to choose. The rationale
for obtaining figures for preferred relationship recognition in this survey was to be able to add to the
current literature on nonheterosexual relationships and provide information to help address the
many myths that propagate due to the limited information available.
This national survey was the first to examine same-sex attracted Australians’ preferences for various
forms of relationship recognition since the introduction of de facto status for same-sex couples at a
federal level. It is also the first major study to investigate preferences for relationship recognition,

NOT SO PRIVATE LIVES 54
while taking into account the current legal status (in Australia or overseas) of an individual’s
same-sex relationship.
Findings from the relationship recognition measures of this survey demonstrate that same-sex
attracted individuals, like other Australians, differ in the way they prefer their relationships to be
formally recognised. However, the results showed that the majority of same-sex attracted
participants selected marriage as their personal choice. A federally recognised relationship
documented at a registry other than marriage was the second most popular option, and de facto
status was the third. The preference for a relationship without any legal status was selected by only
2.9% of the overall sample.
Marriage was found to be the choice of the majority irrespective of the current legal status of
participants’ same-sex relationships (including no legal status). For example, of those currently in a
de facto relationship, 55.6% stated they preferred marriage for themselves, 26% stated that they
preferred a federally recognised relationship other than marriage, 16.9% selected de facto and 1.5%
chose no legal status (Note: for similar figures, including participants who did not complete the
survey in full, please refer to the Auxiliary Report).
Interestingly, the younger the age of the participant the more likely they were to have selected
marriage as their personal choice. For example, 66.7% of those 18-19 and 62.8% of those 20-29
selected marriage as their personal preference. Although the majority of both male and female
identifying participants reported that they preferred to marry, the percentage was significantly
higher for females. For younger-age participants (under 25 years) differences between males and
females were no longer observed with 63% from both groups selecting the option to marry.
Participants were also given the opportunity to select which forms of legal relationship recognition
they would like to see remain and/or become available in this country for same-sex couples in
general. Responses to this measure (which allowed for multiple selections) showed that 78% would
like to see marriage become available as an option, 59.7% would like to see a federally recognised
relationship other than marriage be made available and 48.4% would like to see de facto recognition
remain. These percentages indicate that many participants selected multiple options, suggesting
that simply having a choice was an important factor.
Participants with a regular same-sex partner reported that they felt their own same-sex relationship
was seen by others (heterosexual friends, contacts other than friends, and family) as being of lesser
value to a significantly greater extent when compared with different-sex marriages than when
compared with different-sex de facto relationships. Further, these findings were even more
pronounced among those who reported that they would like to be able to marry, supporting the
argument that a desire to marry, among other factors, is likely to be influenced by one’s perception
of the value society places on such unions. Importantly, the more participants felt others valued
their relationships, relative to different-sex relationships, the greater their reported psychological
well-being.

NOT SO PRIVATE LIVES 55
6. Children
6.1 Children in a Person’s Life
Participants were asked if there were any children (young or adult) in their lives, whether their own
or the result of a current or previous relationship. The response options were ‘No’, ‘Yes’ ‘Expecting a
child’ and ‘Planning on having children’. As a person could have children but also plan on or be
expecting another, participants could select more than one option. Those who responded with ‘yes’
were then asked about the extent to which they lived or spent time with the child/children and each
child’s age.
When looking at the total sample, 29.2% of females, 10.0% of males and 25.5% of gender different
participants reported having children in their lives, whether their own or the result of a current or
previous relationship (see Figure 19). For those with a current same-sex partner, a third of both
gender different and female participants reported having children in their lives compared with 13.9%
of partnered males. The similar percentages for female and gender different participants may be
largely attributed to the fact that 83% of gender different participants reported that they were
defined as biologically female at birth. Although not included in the figures below, some participants
mentioned in the comment box provided that although they did not have their own children, or
those from a current or previous relationship, they were nonetheless a substantial part of their
nieces and/or nephews lives. A more meaningful interpretation of these findings (i.e., percentages
for those at ages most likely to have children) is provided on the following page.
Table 19. Percentages of participants with children currently in their lives (one’s own or from a current or previous relationship), expecting a child or who plan on having children, for the total sample and those with a same-sex partner
Children Female
Total Female
Partnered Male Total
Male Partnered
Gender Different
Total
Gender Different
Partnered
(1125) (742) (860) (466) (47) (18) Plan on having 19.4% 20.9% 13.1% 11.4% 23.4% 22.2% Expecting 1.0% 1.1% 0.1% 0.0% 0.0% 0.0% Have 29.2% 33.4% 10.0% 13.9% 25.5% 33.3%
Numbers of participants are provided in brackets ( ). Multiple responses were possible.
6.1.1 Number and Ages of Children
The average number of children for participants with children in their lives, whether their own or the
result of a current or previous relationship, was 1.9. Fifteen participants did not provide a specific
number. Of the remaining sample of 411, 41.1% reported one child, 35.8% two children and 23.1%
three children or more. For participants in the youngest cohort in this survey (< 25 years) 50%
reported the eldest child to be 3 years of age or younger, for those aged 25-34 years, 50% reported
the eldest to be 7 or younger and for those aged 35 years or over, 50% reported the eldest to be 18
or younger.

NOT SO PRIVATE LIVES 56
6.1.2 Percentages with Children According to Gender Identity and Age of Cohort
Figures 27 through to 29 provide the percentages of participants who reported that they had
children in their lives, whether their own or as a result of a current or previous relationship,
according to gender identity and age of cohort. Also included are the figures for those who reported
that they were expecting a child and those who reported that they planned on having children. More
than one selection was made possible. Overall 29.2 % of participants who identified as female
reporting having children in their lives, whether their own or as a result of a current or previous
relationship (see Table 19), however, when considering those in the age group most likely to have
children7 (i.e., those 35 years of age or over) the figure was 47.1% (see Figure 27). Although a high
percentage (69.2%) of gender different participants 35 years of age and over reported that they had
children in their lives, the interpretation of this finding is severely limited due to the small number in
this age group (see Figure 29). For participants identifying as male, the overall percentage of those
with children in their lives was 10%, however, for males 35 years of age or over it was 17.6% (see
Figure 28).
Figure 27. Percentages of female participants with children currently in their lives (one’s own or from a current or previous relationship), expecting a child or who plan on having children
7 According to data from the 2006 Census, the percentages of women from the general population who had
not had children were 85.5% of those 20-24 years of age, 36.6% of those 30-34 years of age and 15.9% of those 40-44 years of age (ABS, 2008).
5.1
17.0
47.1
0.5 1.6 0.7
32.7 31.5
5.8
0%
10%
20%
30%
40%
50%
60%
70%
80%
18-24 (N=214)
25-34 (N=371)
35+ (N=539)
Axis female
Have
Expecting
Plan on having

NOT SO PRIVATE LIVES 57
11.16.3
69.2
27.831.3
7.7
0%
10%
20%
30%
40%
50%
60%
70%
80%
18-24 (N=18)
25-34 (N=16)
35+ (N=13)
gender different (83% defined biologically female at birth)
Have
Expecting
Plan on having
4.1
17.6
.02
29.5
19.0
2.7
0%
10%
20%
30%
40%
50%
60%
70%
80%
18-24 (N=200)
25-34 (N=221)
35+ (N=437)
male
Have
Expecting
Plan on having
Figure 28. Percentages of male participants with children currently in their lives (one’s own or from a current or previous relationship), expecting a child or who plan on having children
Figure 29. Percentages of gender different participants with children currently in their lives (one’s own or from a current or previous relationship), expecting a child or who plan on having children

NOT SO PRIVATE LIVES 58
6.2 Time Spent Sharing or Living with Children
Participants who reported having children as part of their lives (whether their own or from a current
or previous relationship) were asked about the extent to which they lived or spent time with the
child or children. As adult children are more likely to be living independently, analyses were first
conducted for those who reported at least one child still under the age of 208. As shown in Table 20
below, for those identifying as female, 95.3% spent time with these children, 89.7% spent time on a
regular basis (ranging from sometime to full-time) and 64.7% were with these children full-time. For
those identifying as male, 87% spent time with these children, 64.8% spent time on a regular basis
(ranging from sometime to full-time) and 24.1% were with these children full-time. For gender
different participants, 80% spent time with these children, 60% spent time on a regular basis
(sometime or full-time) and 40% were with them full-time.
Table 20. Percentages according to length of time spent with children for participants with at least one child still under the age of 20 years, for each of the three gender identity groups
Time with children Female Male Gender different
(232) (54) (10 ) None 4.7% 13.0% 20.0% Sometime (irregular) 5.6% 22.2% 20.0% Sometime (regular) 5.6% 33.3% 20.0% Half the time 9.5% 7.4% 0.0% Most of the time 9.9% 0.0% 0.0% Full-time 64.7% 24.1% 40.0%
Numbers of participants are provided in brackets ( ).
6.2.1 Time Shared for Those with All Children 20 Years of Age or Over
An additional 111 participants (74% female) had children in their lives of whom none were under 20
years of age. For this group, 61.3% spent time with these adult children and 25.3% spent time on a
regular basis (ranging from sometime to full-time). In the case of participants identifying as female,
with all children at least 20 years of age or older, 7.3% lived full-time with the adult child/children
and a further 6.1% spent most of the time with them.
6.2.2 Transgender, Transsexual and Intersex Participants
Of those who identified as transgender/transsexual female (N = 11), intersex female (N = 5) and
intersex male (N = 2), 40-50% reported having children in their lives, either their own or from a
current or previous relationship. Further, two of the participants who identified as
transgender/transsexual male (N = 7) and one who identified as transgender/transsexual female
reported that they planned on having children. Of those with children in their lives, at least 40%
spent time with these children on a regular basis and three of these participants lived with the
child/children full-time.
8 Based on data from the 2006-07 Family Characteristics and Transitions Survey, a 2009 report from the Australian Bureau
of Statistics revealed that women tend to first leave home at 19.8 years of age and men at 20.9 years of age (ABS, 2009a).

NOT SO PRIVATE LIVES 59
6.3 Marriage Preferences among those Partnered and Living with Children
A majority of participants (54.2%) who reported that children were not currently a part of their lives
still selected marriage as their personal choice for relationship recognition. The percentages
reporting a preference for marriage, however, were higher among participants with a same-sex
partner and living full-time with children, particularly young children. For these participants, and
where the eldest was reported to be under 13 years of age (generally primary school age or under),
74.7% reported they personally preferred marriage. In cases where the eldest was under 5 (generally
non-school age) the figure for marriage was 80.8%. Perhaps for these couples, the need to have
their relationships legitimised is of even greater concern, given the strong opposition to same-sex
parenting from certain sectors (e.g., ACL, 2008). It is important to note, however, that 95% of
participants partnered and living full-time with children, all under the age of 13, identified as female.

NOT SO PRIVATE LIVES 60
0%
10%
20%
30%
40%
50%
60%
70%
Partner Support
Female (N=742) Male (N=466) Gender different (N=18)
7. Partners
7.1 Partner Support
Participants were presented with the statement “Overall, I feel that when it comes to receiving
SUPPORT from my same-sex partner (in the way of being helpful, caring, or encouraging) I generally
feel she or he is:” with the response options ranging from 1 = not at all supportive to 9 = extremely
supportive. Figure 30 shows the percentages for each response option for those who reported
having a regular same-sex partner. Of this sample, 59.3% of female, 46.6% of male and 50% of
gender different participants reported that they felt their partners were extremely supportive.
Overall, over 80% of participants reported that their partner was at least very supportive. When
looking at the averages of support scores (1-9), those identifying as female reported significantly
higher levels of partner support (M = 8.06) compared with those identifying as male (M = 7.61). This
is in keeping with findings for females in general, in that females tend to score higher than males for
measures of positive relationships with others (e.g., Ryff & Keyes, 1995). The average score for
gender different participants was the same as for males (M = 7.61), however, the number of
participants in this case was small and no statistically significant differences were found between this
group and those identifying as female.
Figure 30. Percentages of participants for perceived partner support scores by gender identity

NOT SO PRIVATE LIVES 61
0%
10%
20%
30%
40%
50%
60%
70%
80%
Strongly disagree
2 3 4 5 Strongly agree
B. Happy with Relationship Title
Female (N=742) Male (N=466) Gender different (N=18)
0%
10%
20%
30%
40%
50%
60%
70%
80%
Strongly disagree
2 3 4 5 Strongly agree
A. Satisfied with Relationship
Female (N=742) Male (N=466) Gender different (N=18)
7.2 Relationship Satisfaction
Relationship satisfaction was measured using two items, with the scores combined and averaged to
form an overall score. The statements were “I am generally satisfied with my current same-sex
relationship” and “I am generally happy in my current same-sex relationship”. Response options
were 1 = Strongly Disagree, 2 = Moderately Disagree, 3 = Slightly Disagree, 4 = Slightly Agree, 5 =
Moderately Agree and 6 = Strongly Agree. Percentages for these response options are presented in
Figure 31 (A and B).
Figure 31 (A and B). Percentages of participants for response options for being satisfied (A) and happy (B) in their current same-sex relationship by gender identity

NOT SO PRIVATE LIVES 62
4.705.00
5.15
1
2
3
4
5
6
<25 yrs (N=158) 25-34 yrs (N=396) 35+ yrs (N=668)
Mea
n s
core
fo
r p
artn
er
dis
clo
sure
co
mfo
rt s
imila
rity
When observing the overall scores for relationship satisfaction, 64.6% of female, 54.7% of male, and
55.6% of gender different participants reported that they strongly agreed with the two statements
(i.e., both happy and satisfied). Irrespective of gender, over 80% of participants indicated that they
moderately to strongly agreed that they were satisfied with their current same-sex relationship.
When looking at the averages for relationship satisfaction scores, the difference between females
and males was statistically significant, although the difference was not large. The average score for
those identifying as female was 5.48 and for those identifying as male it was 5.31. The average score
for gender different participants was 5.22. Once again the numbers for this latter group were small,
limiting the interpretation of these findings.
7.3 Partner ‘Disclosure Comfort’ Similarity
As discussed earlier in Charter 4, on issues relating to ‘coming out’, the survey included a 5-item
partner similarity measure devised by Mohr and Fassinger (2006) which was found to predict
relationship quality. Participants were asked to what extent they agreed or disagreed with five
statements relating to the perceived similarity between oneself and one’s partner over the disclosure
of, and comfort with, one’s sexuality. The items were “My partner and I are equally comfortable
being ‘out’ in public”, “My partner and I are equally comfortable being ‘out’ to family”, “My partner
and I are equally comfortable being ‘out’ to heterosexual friends”, “My partner and I are equally
comfortable being a same-sex couple” and “My partner and I are equally comfortable about being
same-sex attracted”. Response options were 1 = Strongly Disagree, 2 = Moderately Disagree, 3 =
Slightly Disagree, 4 = Slightly Agree, 5 = Moderately Agree and 6 = Strongly Agree. Consistent with
previous research (Mohr & Fassinger, 2006), the scores for each of these items were combined and
averaged to provide an overall score for partner ’disclosure comfort’ similarity. Figure 32 provides
the average score for participants with a regular same-sex partner for each of the three age cohorts.
The youngest cohort (<25) reported significantly less partner ‘disclosure comfort’ similarity when
compared with the two older-age cohorts.
Figure 32. Average scores for partner ‘disclosure comfort’ similarity by age cohort

NOT SO PRIVATE LIVES 63
5.12
5.70
1
2
3
4
5
6
LOW HIGH
Mea
n s
core
fo
r re
lati
on
ship
sa
tisf
acti
on
Partner 'Disclosure Comfort' Similarity
7.3.1 Partner ‘Disclosure Comfort’ Similarity and Relationship Satisfaction
The greater the extent to which participants felt that they were similar to their partners in being ‘out’
and comfortable with their sexuality, the significantly greater their reported level of relationship
satisfaction9. Figure 33 shows the average scores for those who reported low levels vs. high levels of
partner ‘disclosure comfort’ similarity. The low vs. high categories were based on participants’
responses that were below the median score and those that were above the median score.
Response options were 1 = Strongly Disagree, 2 = Moderately Disagree, 3 = Slightly Disagree,
4 = Slightly Agree, 5 = Moderately Agree and 6 = Strongly Agree to being generally satisfied with
one’s current same-sex relationship. As a whole, participants reported that they were relatively
satisfied with their relationships. Those who scored low on partner ‘disclosure comfort’ similarity
reported on average that they ‘moderately agreed’ that they were satisfied with their relationship (M
= 5.12) whereas for those who scored high on partner ‘disclosure comfort’ similarity, the average was
approaching ‘strongly agreed’ (M = 5.70). For findings on partner ‘disclosure comfort’ similarity and
its relationship to likelihood of ‘coming out’ during the social encounters described in the three
scenarios presented in this survey, refer to section 4.4.
Figure 33. Average scores for relationship satisfaction for low vs. high levels of perceived partner ‘disclosure comfort’ similarity
7.4 Well-Being and Relationship Measures
Perceived partner support, relationship satisfaction and partner ‘disclosure comfort’ similarity were
all significantly associated with participants reported level of well-being. Specifically, those who
reported greater levels of perceived support, satisfaction, and similarity were more likely to report
higher levels of psychological well-being. For findings on the role of partner support, alongside the
role of heterosexual acceptance, in predicting well-being, refer to section 9.4.
9 Analyses were also conducted with ‘Disclosure Comfort’ Similarity as a continuous variable.

NOT SO PRIVATE LIVES 64
0%
10%
20%
30%
40%
50%
GLBTI friends support
Female (N=1102) Male (N=834) Gender different (N=44)
8. GLBTI Friends and Community
8.1 Support from GLBTI friends
Of the total sample, 51 (2.5%) participants reported that they did not have any GLBTI friends (22
females, 26 males, and 3 gender different). Close to 70% of these participants lived in capital cities.
Those who reported having these friends were presented with the question “Overall, how supportive
(helpful, caring or encouraging) do you find your GLBTI friends, NOT including a partner?” The
response options ranged from 1 = not at all supportive to 9 = extremely supportive. One person did
not respond to this question leaving a total of 1,980 participants. Of this sample, 41.1% of female,
35.3% of male and 38.6% of gender different participants reported that they felt their GLBTI friends
were extremely supportive (see Figure 34). Among females, 85% reported that their GLBTI friends
were very to extremely supportive. Among males the figure was 78% and for gender different
participants it was 79.5%. When looking at the averages of support scores (1-9), those identifying as
female reported significantly higher levels of GLBTI friendship support (M = 7.60) compared with
those identifying as male (M = 7.32). Once again, this is consistent with findings for females in
general, in that females tend to score higher than males for measures on positive relationships with
others (e.g., Ryff & Keyes, 1995) and is in keeping with an earlier study involving same-sex attracted
young adults in Australia (Dane & MacDonald, 2009). The average score for gender different
participants were similar to those for males (M = 7.34), however, numbers were small and no
statistically significant differences were found between this group and those identifying as female.
Figure 34. Percentages for participants perceived support from GLBTI friends by gender identity

NOT SO PRIVATE LIVES 65
37.4
62.6
30.2
69.8
36.2
63.8
0%
10%
20%
30%
40%
50%
60%
70%
80%
no yes
Contact with GLBTI community (apart from friends)
female (N=1122)
male (N=858)
gender different (N=47)
8.2 Contact with the GLBTI Community
8.2.1 Gender Differences
Following the question on support from GLBTI friends, participants were presented with the question
“Do you have any contact with individuals (apart from friends) from the GLBTI community (e.g., a
GLBTI employer, teacher, business or volunteer work associate, health professional)?” Response
options were “Yes” or “No”. Overall, just over a third (34.3%) of participants reported that they did
not have any contact with individuals from the GLBTI community when not including their GLBTI
friends. As shown in Figure 35, a higher percentage of those identifying as male (69.8%) reported
contact relative to female (62.6%), and gender different participants (63.8%). Five participants did
not respond to the question.
Figure 35. Percentages of participants who reported contact vs. no contact with the GLBTI community (apart from friends) by gender identity
8.2.2 Age and Area of Residence
Table 21 shows the percentages for those who reported contact with the GLBTI community based on
area of residence and age cohort. Numbers in brackets represent the total number of participants in
a particular category with figures representing the percentage of the total number who reported
having GLBTI community contact, aside from GLBTI friends. Not surprisingly, people living in capital
cities were more likely to have reported contact with the community relative to those living in other
areas (for a description of population sizes for area of residence, refer to Table 1, section 1.1).
Further, there was a significant relationship between age of participants and contact with the GLBTI
community. Specifically, the younger the cohort the less likely they were to have reported contact.

NOT SO PRIVATE LIVES 66
14.8
34.329.6
16.7
4.6
14.0
29.434.0
16.0
6.611.2
25.4
34.5
19.2
9.7
0%
10%
20%
30%
40%
50%
not at all slightly somewhat mostly very
Connected to the GLBTI community
<25 yrs (N=432) 25-34 yrs (N=608) 35+ (N=989)
Table 21. Percentages of those who reported having contact with the GLBTI community (apart from friends) by area of residence and age cohort
<25 yrs 25-34yrs 35+ yrs Total Capital City (300) 54.0% (469) 69.3% (718)74.4% (1487) 68.7% Other large metro area (population 100,000 or more)
(90) 53.3% (80) 58.8% (116) 65.5% (286) 59.8% Large rural centre 100,000)
(24) 33.3% (38) 55.3% (69) 52.2% (131) 49.6% Other rural area (17) 29.4% (16) 68.8% (70) 67.1% (103) 61.2% Remote (1) 00.0% (5) 40.0% (11) 63.6% (17) 52.9% Total (432) 51.6% (608) 66.8% (984) 71.1% (2024) Five participants did not respond to the contact question and three did not provide an age. Refer to
Table 1, section 1.1, for population sizes. Numbers in brackets represent total number living in area.
8.3 Feeling Connected to the GLBTI Community
To examine how connected people felt to the GLBTI community in general, all participants were
asked “How connected to the GLBTI community do you feel in your everyday life?” with response
options ranging from 1 = not at all to 5 = very. Although not all participants reported having contact
with the GLBTI community, some may nonetheless have felt a connection in some way, with results
indicating that this was in fact the case. For example, although 34.3% of the total sample reported
having no contact, only 12.8% overall indicated that they did not feel at all connected (see Figure 36).
When considering the age of participants, those of a younger age reported significantly less
connection to the community than those of an older age, which is consistent with the findings
discussed earlier, that younger participants reported significantly less contact with the community
than older participants (see summary in section 8.7 for findings in relation to proportion of
heterosexual friends). Further, living in more populated areas was significantly related to feeling
more connected to the GLBTI community.
Figure 36. Percentages of participants for reported connection to the GLBTI community by age cohort

NOT SO PRIVATE LIVES 67
8.4 Perceived Support from the GLBTI Community
Participants who reported having contact with individuals from the GLBTI community (apart from
friends) were then asked “Overall, how supportive (helpful, caring, or encouraging) do you feel people
from the wider GLBTI community (e.g., a GLBTI employer, teacher, business or volunteer work
associate, health professional) are for you”? Response options ranged from 1 = not at all supportive
to 9 = extremely supportive. Two people did not respond resulting in a sample of 1, 329 participants.
As shown in Figure 37, 27% of male, 24% of female and 20% of gender different participants reported
that they considered the GLBTI community to be extremely supportive. The percentages for those
who reported that they felt this community was at least very supportive (i.e., very to extremely) were
66.3% for female, 68.7% for male and 60% for gender different participants. The average scores for
community support were not found to be significantly different between males (M = 6.92), females
(M = 6.83), and gender different (M = 6.53) participants. Interestingly, no significant differences
were found for perceptions of community support based on age or area of residence. It is important
to keep in mind, however, that the scores represent only people who already had some form of
contact with the GLBTI community (i.e., those who reported no contact were not included in this
particular analysis). Further, the number of participants were small for those living in remote areas
(see Table 21), with nine having reported contact with the GLBTI community. For differences found
based on area of residence, refer to the findings on contact with and connection to the GLBTI
community (see section 8.2.2).
Figure 37. Percentages of participants according to responses for perceived support from GLBTI community (apart from friends) by gender identity
0%
10%
20%
30%
40%
50%
Support GLBTI Community (apart from friends)
female (N=700) male (N=599) gender different (N=30)

NOT SO PRIVATE LIVES 68
8.5 Transgender, Transsexual and Intersex Participants
Perceived support from GLBTI friends was relatively high among transgender/transsexual and
intersex participants, with 80 -100% in these groups having reported that these friends were very to
extremely supportive. Consistent with findings for the general sample, perceptions of support from
the wider GLBTI community were lower than for friends. Table 22 provides average scores for this
community support, the percentages of those who scores ranged from very to extremely supportive
and the numbers in each group that reported having contact with the wider GLBTI community. For
example, of the eight female transgender/transsexual participants with contact with the community,
75% reported that they perceived this community to be very to extremely supportive. Although the
small number of participants limits the interpretation of these findings, the lower levels of perceived
support, particularly for female intersex participants, should also be noted (for figures for the general
sample, refer to figure 37). Although perceived support in some instances was lower among these
groups, the extent to which these participants felt a connection with the community was in most
cases higher10, when compared with the general sample. Once again, it needs to be kept in mind
that all participants in this survey reported having same-sex attractions. An affiliation with the GLBTI
community may not be as high for transgender, transsexual or intersex individuals who identify as
heterosexual.
Table 22. Average scores for and percentages of transgender/transsexual and intersex participants who reported finding the GLBTI community (apart from friends) very to extremely supportive
Average score % high support Contact Yes (No)
contact
Trans - Female 7.13 75.0% 8 (3) Trans - Male 7.20 80.0% 5 (2) Intersex - Female 5.25 25.0% 4 (1) Intersex - Male 6.00 a 2 (0) Note: Percentages for those who perceived high support (very to extremely) are based on the
numbers of participants who reported having contact with the GLBTI community. Mean scores are
based on a 1-9 scale. a = Figures are not provided as doing so would identify participants’ scores due
to the small number of cases.
8.6 Well-being and Perceived Support from GLBTI Friends and Community
On average, participants who reported having contact with the wider GLBTI community scored
higher on psychological well-being than those who reported having no contact. The extent to which
participants felt supported by their GLBTI friends and the community was also related to their
psychological well-being, with those who reported higher levels of these types of support being more
likely to have reported higher levels of well-being. Support from GLBTI friends and the community
are discussed further in the next chapter (Chapter 9) in which their roles in predicting well-being are
considered alongside the roles of acceptance from heterosexual friends, family and the heterosexual
community.
10
Differences between groups are in these cases based on observed differences not statistical differences.

NOT SO PRIVATE LIVES 69
8.7 Summary
Although differences were not large when it came to the level of support participants felt that they
received from their GBLTI friends, those who identified as female reported statistically significantly
higher levels of support compared with those who identified as male. This is consistent with an
earlier study involving same-sex attracted young adults in Queensland, Australia (Dane &
MacDonald, 2009) and research showing that females in general tend to score higher for measures
evaluating positive relationships with others (Ryff & Keyes, 1995). For findings from the current
survey revealing higher scores for females on positive relationships with others, refer to Chapter 10.
When it came to contact with the wider GLBTI community (e.g., a GLBTI employer, teacher, business
or volunteer work associate, health professional), higher percentages of those identifying as male
reported contact relative to female and gender different participants. As expected, those living in
capital cities were more likely to report having contact with this community, relative to those living in
less populated areas. Further, people living in more populated areas were more likely to report
feeling a greater connection to the GLBTI community than those living in less populated areas. More
interestingly, younger participants were more likely to report less contact with the community and
lower levels of connectedness with the community than older age participants, even when taking
into account the population size of the areas in which participants lived. This is consistent with
findings discussed in the following chapter showing younger participants were more likely to report
having a greater proportion of heterosexual friends than participants of an older age, and that
people with a greater proportion of heterosexual friends were less likely to have contact with the
GLBTI community or feel connected with this community. Importantly, for those with contact, higher
levels of support from GLBTI friends and the wider GLBTI community were both related to higher
levels of overall well-being.

NOT SO PRIVATE LIVES 70
0%
10%
20%
30%
none very few few more than few <
half
half slightly more than
half
most (2/3) nearly all all
Proportion of heterosexual friends
<25 yrs (N=432) 25-34 yrs (N=608) 35+ yrs (N=988)
9. Family and Heterosexual Friends and Community
9.1 ‘Out’ to Others
9.1.1 Proportion of Heterosexual Friends
Participants were first presented with the question “When you consider the number of friends you
have in general, how many do you estimate to be heterosexual?” with response options ranging from
1 = none to 9 = all. One participant did not respond and three did not provide their age leaving a
total of 2,028 represented in Figure 38 below. A majority (52.3%) of those under the age of 25
reported that ‘most’ to ‘all’ of their friends were heterosexual. For those 25-34 years of age this
figure was 43.3% and for those 35 years and over it was less than a third (31.7%). The average scores
(ranging from 1-9) were 6.13 for the youngest cohort, 5.73 for the middle cohort and 5.34 for the
oldest cohort. Results showed that younger participants were significantly more likely to report
having a greater proportion of heterosexual friends than older age participants.
Figure 38. Percentages of participants according to responses for proportion of heterosexual friends
9.1.2 ‘Out’ to Heterosexual Friends, Contacts and Family
Participants were then asked if they currently had any heterosexual friends to whom they had
disclosed their same-sex attractions or who they were confident were aware of their same-sex
attractions. The same question was presented in relation to heterosexual contacts other than friends
(e.g., neighbours, co-workers, employers or teachers). They were then advised that if they
considered any of these individuals to be more of a friend, then they were to include them only in
the question about friends. Participants were also asked if they had disclosed their same-sex
attractions to their mother, father or siblings, or felt confident these individuals were aware of their
same-sex attractions. Table 23 presents the percentages of participants who reported that they had

NOT SO PRIVATE LIVES 71
disclosed their same-sex attractions’, or felt confident others were aware of their same-sex
attractions, for the five areas discussed above.
Table 23. Percentages of participants ‘out’ to heterosexual friends, contacts, and family
(N) Yes (N) No (N) Missing
contact
Heterosexual Friends (1965) 96.8% (66) 3.2% (1) Heterosexual Contacts (1724) 84.9% (307) 15.1% (1) Mother (1720) 84.8% (308) 15.2% (4) Father (1418) 70.0% (609) 30.0% (5) Siblings (1722) 88.8% (217) 11.2% 92 no siblings, (1)
)missing) (93)
Note: Percentages are based on totals for each sector minus missing or not applicable data.
Consistent with research in this area (e.g., Hillier, Turner, & Mitchell, 2005) a higher proportion of
participants reported their mother’s knowledge of their same-sex attractions (84.8%) than their
father’s (70.0%), with friends being the most likely to be aware (96.8%). However, the extent to
which individuals’ interpersonal networks as a whole knew of their sexual orientation, varied
between individuals. For example, of the total sample, only 60.5% indicated that others were aware
of their same-sex attractions in all areas (note: as not all individuals have siblings, this sector was not
included in the sum). This finding is consistent with an earlier study involving same-sex attracted
young adults in Australia (Dane & MacDonald, 2009) which found 59% reported being ‘out’ in all of
these four areas. This suggests that, although large percentages of sexual minority individuals report
being ‘out of the closet’, many appear to still have reservations about revealing their same-sex
attractions in certain sectors or at least feel less need to do so.
9.1.3 Proportion of Heterosexual Friends and Contacts Aware of Sexual Orientation
Participants who answered “Yes” to having heterosexual friends or contacts aware of their same-sex
attractions were then asked about the proportion of these friends or contacts they felt confident
were aware. Response options ranged from 1 = very few (e.g., one) to 7 = all. Findings revealed that
a majority (57%) reported that all of their heterosexual friends were aware of their same-sex
attractions and 87% reported that ‘most’ to ‘all’ were aware. In the case of heterosexual contacts
(apart from friends), 11.9% felt all their contacts were aware and 60.9% reported that ‘most’ to ‘all’
were aware. When considering the three main age cohorts of this survey (< 25 yrs, 25-34 yrs, 35+
years) results showed that those in the two older cohorts reported having a significantly greater
proportion of heterosexual friends and contacts aware of their same-sex attractions when compared
with the youngest cohort. When taking a closer look at this data, however, it became apparent that
there was a clear exception when it came to those 60 years of age or older, with this finding
discussed further on. Figure 39 shows the average scores for the proportion of heterosexual friends
and contacts aware for the six different age groups in this survey. The numbers represented in each
age group vary depending on the number ‘out’ to heterosexual friends vs. heterosexual contacts.
The numbers of participants were as follows: 18-19 (friends 114, contacts 83), 20-29 (friends 617,
contacts 501), 30-39 (friends 525, contacts 475), 40-49 (friends 425, contacts 408), 50-59 (friends
205, contacts 195), and 60+ (friends 76, contacts 60). Three people did not provide an age, three of
which were ‘out’ to friends and two of which were ‘out’ to contacts.

NOT SO PRIVATE LIVES 72
5.615.86
6.246.33
6.07
5.07
3.64
4.424.78 4.93
4.71
4.07
1
2
3
4
5
6
7
18-19 20-29 30-39 40-49 50-59 60+
Mea
n s
core
s fo
r p
rop
ort
ion
of
het
ero
sexu
al
frie
nd
s an
d c
on
tact
s aw
are
of
sexu
alit
y
Age group
Proportion heterosexual friends aware
Proportion heterosexual contacts aware
Figure 39. Average scores (1 = very few to 7 = all) for proportion of heterosexual friends and contacts (apart from friends) aware of same-sex attractions
When comparing all six age groups, analyses revealed that generally those in older age groups
reported having a greater proportion of heterosexual friends and contacts aware of their same-sex
attractions relative to those in younger age groups. Although the data are cross-sectional, these
findings overall suggest that perhaps over time individuals are likely to gradually increase the
proportion of their friends and contacts to whom they have disclosed their same-sex attractions.
Participants 60 years of age or over, however, reported a significantly smaller proportion of
heterosexual friends aware of their same-sex attractions than all other age groups except those 18-
19 years of age (although the mean score was also lower than for those 18-19 years of age, the
difference in this case was not statistically significant). In the case of the proportion of heterosexual
contacts aware, those 60 years of age or over reported a significantly smaller proportion of these
contacts aware, compared with the younger age groups consisting of those 30 to <50 years of age.
Recent public polls show that those in senior age groups are far more likely, on average, to have
experienced higher levels of prejudice and discrimination relative to younger sexual minority
individuals (e.g., Schafer & Shaw, 2009). These early negative experiences may have an ongoing
impact on more senior individuals’ decisions to be open about their sexuality. Additionally, senior
sexual minority individuals are more likely to be surrounded by older-age heterosexual individuals
from a less accepting era. Both these factors are likely to play a role in contributing to the lower
proportion of their heterosexual friends and contacts aware of their sexuality when compared with
younger generations. It is also important to keep in mind, when interpreting these findings, that the
older the participant, on average, the smaller the proportion of friends they reported to be
heterosexual (see Figure 38). Therefore, for younger people to increase the proportion of friends
aware of their same-sex attractions, they would in effect have to tell more friends relative to those in

NOT SO PRIVATE LIVES 73
older age groups. The same logic obviously does not apply when it comes to disclosing to the wider
community (i.e., heterosexual contacts).
9.2 Perceived Acceptance of Others
9.2.1 Age Differences for Perceptions of Acceptance
Participants who reported that at least some of their heterosexual friends were aware of their same-
sex attractions were then asked about the extent to which they felt that these friends, overall, were
accepting of their same-sex attractions. Response options ranged from 1 to 9 (1 = not at all
accepting, 2, 3 = somewhat, 4, 5 = mostly, 6, 7 = very, 8, 9 = fully). Similar questions were presented
to those who reported that at least some of their heterosexual contacts (apart from friends) were
aware and to those who reported their mother’s, father’s or siblings’ knowledge of their same-sex
attractions. In cases where a family member was deceased, participants were asked to consider how
they felt now about that family member’s level of acceptance at the time the family member was still
alive. Comment boxes were also provided in which participants could explain their relationship with
a particular family member, should they prefer to do so (e.g., “I have never met my father/mother”,
“my mother is a lesbian”, “I have two mothers”, “my mother/father died before I ‘came out’”, “my
brother is gay”). Table 24 lists the numbers of participants and average scores for each area of
acceptance by age group. As the numbers who reported being ‘out’ in these areas varied, the
numbers of participants for each of the acceptance measures varied accordingly. In some cases,
numbers were relatively small (e.g., 60+ age group for father’s acceptance) limiting the statistical
power of some group comparisons. Figure 40, following Table 24, provides a visual interpretation of
this data.
Table 24. Average scores (1 = not at all accepting to 9 = fully) and number of participants for perceptions of acceptance by others according to age group
Heterosexual Friends
Heterosexual Contacts Mother Father Siblings
18 - 19 (114) 7.34 (82) 5.57 (93) 5.77 (75) 5.69 (83) 6.99 20 - 29 (617) 7.74 (498) 6.10 (535) 6.23 (454) 6.04 (503) 7.10 30 - 39 (525) 7.91 (475) 6.13 (487) 6.38 (410) 6.38 (476) 7.18 40 - 49 (425) 8.14 (408) 6.15 (382) 6.68 (325) 6.23 (409) 7.04 50 - 59 (205) 7.72 (193) 5.80 (173) 6.40 (125) 5.92 (188) 7.12 60 + (60-82) (76) 6.92 (60) 5.70 (46) 5.80 (26) 5.19 (61) 6.08 Total (1962) 7.81 (1716) 6.05 (1716) 6.35 (1415) 6.14 (1720) 7.07 Missing data (3) (8) (4) (3) (2)
Note: Number of participants is provided in brackets ( ). Missing data represent participants who
reported others were aware of their sexuality, but did not provide an age or did not respond to the
question.

NOT SO PRIVATE LIVES 74
1
2
3
4
5
6
7
8
9
18-19 20-29 30-39 40-49 50-59 60+
Mea
n s
core
s fo
r p
erce
ived
acc
epta
nce
Age group
Heterosexual friends
Heterosexual contacts (apart from friends)
Mother
Father
Siblings
Figure 40 . Average scores for perceptions of acceptance (1 = not at all to 9 = fully) for heterosexual friends, contacts (apart from friends), mother, father and siblings
When first looking at the results for the three main cohorts in this survey, findings revealed that the
youngest cohort (<25 yrs) perceived, on average, significantly less acceptance from their
heterosexual friends, and from their mother, when compared with the two older cohorts (25-34 yrs,
and 35 yrs and over), and significantly less acceptance from their father when compared with the
middle cohort (25-34 yrs). These findings, overall, suggest that perceptions of acceptance may
increase with age for certain sectors. A frequent comment made by participants in the ‘comment
boxes’ provided was that others seemed to become more accepting as time went by (e.g., “She had
an extremely difficult time accepting this, however now accepts my partner as a member of the
family”). Analyses comparing all six age groups, however, once again found a clear exception for
those aged 60 and over. As a group they perceived significantly less acceptance from their
heterosexual friends and their siblings compared with all other age groups except those 18-19 years
of age (see Figure 40). Although scores for acceptance from friends and siblings for those aged 60
and over were also lower than the scores for 18-19 year olds, the differences in these cases were not
statistically significant. This pattern, showing a marked difference for the most senior group of
participants, was similar to that discussed previously regarding the proportion of heterosexual
friends and contacts aware of one’s same-sex attractions (see Figure 39). As noted earlier in this
chapter, these individuals were more likely to have experienced higher levels or prejudice and
discrimination regarding their sexuality, relative to younger generations. Further, senior sexual
minority individuals, relative to younger, are more likely to be in contact with heterosexual
individuals from an older generation. Research, including recent findings from Australia (Galaxy,
2009; Newspoll, 2006), showed that less favourable views of homosexuality and same-sex
relationships are still more likely to be held by those in more senior age groups (e.g., 50 yrs and
above).

NOT SO PRIVATE LIVES 75
9.2.2 Overall Perceptions of Acceptance
Despite these differences between age groups, perceptions of acceptance were overall relatively
high, with 84.4% having reported that their heterosexual friends were ‘very’ to ‘fully’ accepting
(average scores for acceptance are provided in Table 25 with scores for transgender/transsexual and
intersex participants). Although only 44.4% perceived their heterosexual contacts to be ‘very’ to
‘fully’ accepting, near double this figure (88.2%) reported that they were ‘mostly’ to ‘fully’ accepting.
Among those ‘out’ to family members, siblings generally appeared to be a good source of support
with over two-thirds (69.3%) of participants having rated their siblings as ‘very’ to ‘fully’ accepting.
Although a smaller majority reported that their mothers (56.9%) and fathers (53.2%) were ‘very’ to
‘fully’ accepting, just over a three quarters indicated that mothers and fathers were ‘mostly’ to ‘fully’
accepting. Nonetheless, 23.3% reported that their mothers and 24.4% reported that their fathers
were less than ‘mostly’ accepting. Approximately a quarter of these individuals were under the age
of 25. Findings such as these continue to be of concern, particularly when it comes to a lack of
parental acceptance for those in their youth. Further, the many stories provided by the participants
in this survey were a stark reminder of the contrasting experiences of acceptance and rejection. For
example, some wrote of their parents being fully accepting of both them and their partners, and how
they were proud of them until the day they died, while others told of how they were described as
being evil by their parents, who have not spoken with them since.
9.3 Transgender, Transsexual and Intersex Participants
Before discussing the findings for transgender/transsexual and intersex participants, it is
acknowledged that trying to isolate perceptions of acceptance of one’s same-sex attractions from
perceptions of acceptance based on gender identity and biological sex would be extremely difficult, if
not near impossible. This issue was acknowledged in the survey. The responses from these
participants are, therefore, likely to be influenced by their overall sexual minority status.
Relative to the general sample, perceptions of acceptance were in many cases lower for
transgender/transsexual and intersex participants. This appeared to be particularly so when it came
to acceptance from siblings, and a father’s acceptance for transgender/transsexual participants. It is
important to keep in mind, particularly when the number of participants are small for certain groups,
that average scores were based on responses from only those who reported others were aware of
their attractions for each of the five areas assessed (refer to Table 25).

NOT SO PRIVATE LIVES 76
Table 25. Average scores for perceptions of acceptance from others (1 = not at all accepting to 9 = fully) for transgender/transsexual and intersex participants, and the general sample
H Friends H Contacts Mother Father Siblings
Trans - F (N = 11) (11)6.91 (10) 5.30 (7) 5.29 (9)3.56 (10) 4.50 Trans - M (N = 7) (7)7.86 (7) 6.57 (6) 6.50 (5) 4.80 (7) 6.86 Intersex - F (N = 5) (5) 6.20 (3) 7.00 (5) 6.60 (2) 8.00 (5) 5.40 Intersex - M (N =2) (2) 6.00 a a a a
Note: Averages are based on responses from the number of participants (presented in brackets) who
reported others were aware of their same-sex attractions for each of the five domains.
a = Figures are not provided as doing so would identify participants’ scores due to the small
number of cases. H = heterosexual, F = female, M = male, N = total number

NOT SO PRIVATE LIVES 77
Well-being H Contacts' Acceptance
5.6%
GLBTI Friends' Support
3.0%
Well-being H Contacts' Acceptance
5.7%
GLBTI Community
Support 1.3%
Well-being H Friends'
Acceptance 7.7%
GLBTI Friends' Support
2.4%
9.4 Well-being and Perceptions of Acceptance and GLBTI Support
Greater perceptions of acceptance from all areas (heterosexual friends, heterosexual contacts apart
from friends, mother, father and siblings) were related to higher levels of reported well-being.
Likewise, perceptions of support from GLBTI friends, the GLBTI community and one’s partner
predicted well-being. What was of further interest, however, was the extent to which feeling
accepted was related to well-being, when first taking into account the level of support received from
similar others. For example, does acceptance from family, friends and the mainstream community
still play a role for those who feel that they already receive support from other sexual-minority
individuals? Results showed that this was in fact the case and built on similar findings from an earlier
smaller scale study (Dane & MacDonald, 2009), conducted by two of the researchers involved in the
current survey. Figures 41 to 43 provide a visual interpretation of the current survey’s findings with
results discussed in further detail in section 9.4.1.
Figure 41. The contribution of heterosexual friends and heterosexual contacts acceptance in addition to GLBTI friends’ and GLBTI community support in predicting overall well-being
H = heterosexual, GLBTI = gay, lesbian, bisexual, transgender, intersex, N = number of participants
N = 1889 N = 1656
N = 1188

NOT SO PRIVATE LIVES 78
Well-being Mother's
Acceptance 4.2%
GLBTI Friends' Support
2.8%
Well-being Father's Acceptance
5.1%
GLBTI Friends' Support
2.9%
Well-being Siblings'
Acceptance 3.3%
GLBTI Friends' Support
3.3%
Figure 42. The contribution of family acceptance in addition to GLBTI support in predicting scores on overall well-being
H = heterosexual, GLBTI = gay, lesbian, bisexual, transgender, intersex, N = number of participants
9.4.1 Interpretation of Findings on the Roles of Acceptance in Addition to GLBTI Support
As the areas in which participants reported that others were knowledgeable of their same-sex
attractions varied, separate analyses11 (represented by each Venn diagram) were conducted for each
area of acceptance, with numbers of participants varying accordingly. Additionally, 38 participants
did not fully complete the questions on well-being and were therefore not included in this set of
analyses. The percent figure provided in each of the ‘acceptance’ and ‘support’ circles represents the
unique contribution of these measures in predicting well-being when taking both of these factors
into account. The results in all cases showed that ‘GLBTI support’ significantly predicted well-being
and that perceptions of acceptance from each of the five areas assessed in this survey, significantly
11
Separate hierarchical multiple regression analyses were conducted for each of the five areas of acceptance. The percentages represent the unique proportion of variance in well-being scores predicted by the acceptance and GLBTI support variables. In each case GLBTI support significantly predicted well-being, and acceptance significantly added to this prediction. GLBTI support remained a significant predictor with the addition of the acceptance variables. There were no significant interactions found between the acceptance and support variables. A multiple regression analysis, in which all variables were considered when working together, is discussed in section 9.4.2.
N = 1658 N = 1372
N = 1655

NOT SO PRIVATE LIVES 79
Well-being H Friends Acceptance
4.6%
GLBTI Friends' Support
1.3%
Partner Support
4.2% Well-being Mother's Acceptance
2.9%
GLBTI Friends' Support
1.3%
Partner Support
5.0%
Well-being Father's Acceptance
3.3%
GLBTI Friends' Support
1.5%
Partner Support
5.3%
added to the prediction of well-being. These findings held even when taking into account the level
of perceived ‘GLBTI support’. For perceptions of acceptance from heterosexual friends and from
one’s father, results showed that although these factors predicted well-being in addition to support
from GLBTI friends for both male and female participants, acceptance from these sources were more
strongly related to the reported well-being of those identifying as male. For participants with a
same-sex partner, separate analyses revealed that perceived acceptance from heterosexual friends,
contacts, mother, father and siblings significantly added to the prediction of well-being even when
taking into account the reported level of support received from one’s same-sex partner and GLBTI
friends. Examples of these findings are presented in Figure 43.
Figure 43. The contribution of heterosexual friends’ and parents’ acceptance in addition to support from one’s same-sex partner and GLBTI friends in predicting overall well-being
H= heterosexual, GLBTI = gay, lesbian, bisexual, transgender, intersex, N = number of participants
N = 1275
N = 982
N = 1166

NOT SO PRIVATE LIVES 80
9.4.2 Acceptance and GLBTI Support for Those Partnered and ‘Out’ in All Areas
A separate analysis was conducted for participants who reported having a same-sex partner, GLBTI
friends, and reported that people were aware of their same-sex attractions in all areas assessed in
this survey (N = 846). Results revealed that support from one’s same-sex partner was the strongest
predictor of well-being, followed by acceptance from heterosexual contacts (apart from friends).
Perhaps for individuals who have already dealt with the hurdles of ‘coming out’ to heterosexual
friends and family, acceptance from the wider heterosexual community takes on a new importance.
These findings were consistent with those from an earlier study conducted by two of the researchers
involved in the current survey (Dane & MacDonald, 2009).
9.4.3 Acceptance and Relationship Status and Longevity
Findings also showed that perceptions of acceptance from heterosexual friends, parents and siblings
predicted whether participants were currently in an ongoing same-sex relationship. Specifically, the
more people felt accepted in relation to their sexuality, the greater was the likelihood of them having
reported that they had a regular partner. Further, and when first taking into account age differences,
participants with a regular partner who felt more accepted by their heterosexual friends and siblings
were more likely to have reported a current relationship of a longer duration.
9.4.4 Concluding Comment
Unlike (heterosexual) racial/ethnic minority group members, sexual minority individuals may be less
likely to experience the same sense of belonging provided by a shared minority status with family
and similar community members (e.g., neighbours). Telljohann and Price (1993) noted that even
when faced with high levels of social rejection, racial/ethnic and religious minority youth often had
the opportunity to receive strong family support in relation to their subculture and identity. This
critical difference may help explain why several racial/ethnic minority groups have been found to
have equivalent, and in some cases higher, levels of well-being when compared with the dominant
population (e.g., Breslau et al., 2006). This is not to suggest that sexual minority individuals lack
resilience or that support from like-minded others is inferior by comparison. Further, in no instances
do the results presented in this chapter suggest that perceptions of heterosexual acceptance are
more important than GLBTI support. Rather, and due to the unique socialisation of sexual minorities,
they simply suggest that even in the presence of receiving support from similar others, feeling
accepted by one’s family, heterosexual friends and the wider community still play important roles in
same-sex attracted people’s psychological well-being. The figures presented in all Venn diagrams
represent the factors that uniquely contributed to the prediction of well-being when they were
considered together. These findings concur with the argument that although support from other
sexual minority individuals appears to be critical, this support is likely to be most beneficial when
complemented by mainstream acceptance (Dane & MacDonald, 2009).

NOT SO PRIVATE LIVES 81
10. Stigma and Psychological Well-Being
This chapter focuses on participants’ scores on various measures of psychological well-being,
including perceptions of stigma in relation to being same-sex attracted. Well-being has been
frequently discussed within this report in the context of how it relates to several other factors
measured in this survey. For example, the relationship between well-being and the disclosure of
one’s sexuality is discussed in Chapter 4. The relationship between well-being and perceptions of
how others value a person’s same-sex relationship is discussed in Chapter 5, and its association with
relationship satisfaction is discussed in Chapter 7. Well-being and connection to the GLBTI
community is discussed in Chapter 8 and the findings on the relationship between well-being and
perceptions of acceptance, in addition to GLBTI support, are discussed in Chapter 9.
10.1 Perceived Stigma
Participants were asked about the extent to which they agreed or disagreed with a series of
statements relating to their perceptions of the stigma associated with nonheterosexuality. The
11-item scale was originally designed by Link (1987) in relation to mental illness and adapted by
Martin and Dean (1987) to relate to the expectations of rejection and discrimination of homosexuals.
It has been found to be a reliable measure when used with this population12 (e.g., Meyer, 1995). For
the purpose of the current survey, the word “homosexual” was replaced with the words “same-sex
attracted person”. The response options were 1 = strongly disagree to 6 = strongly agree.
Responses indicated that most participants felt that people with same-sex attractions were
stigmatised to some extent. Of the 2,025 participants who responded to all 11 items, 84% agreed
(between slightly and strongly) with at least one negative statement or disagreed (between slightly
and strongly) with at least one positive statement. The circumstances for which participants
appeared to have the highest perception of stigma were for those relating to the care of children.
For example, 63.3% disagreed to some extent that most people would accept a same-sex attracted
person as a teacher in a public school and 47.4% agreed to some extent that most people will not
hire a same-sex attracted person to care for their children. In contrast, perceptions in relation to
employment were much more positive. For example, 78.4% agreed to some extent that most
employers will hire a same-sex attracted person if he or she is qualified for the job. Table 26 on the
following page lists all 11 items and provides the percentages for those agreeing or disagreeing with
each statement. Within this table, for ease of interpretation, the ‘strongly agree’ and ‘moderately
agree’ responses were combined into a single ‘agree’ category, and the ‘strongly disagree’ and
‘moderately disagree’ responses into a single ‘disagree’ category.
12
In the Meyer (1995) study involving gay men, the reported internal reliability coefficient for the Stigma scale was α = .86. In the current survey, the internal reliability coefficient was α = .89.

NOT SO PRIVATE LIVES 82
Table 26. Percentages of participants agreeing or disagreeing with statements on perceived stigma
Agree Slightly Agree Slightly Disagree Disagree
“Most people would willingly accept a same-sex attracted person as a close friend.” 36.5% 31.5% 20.3% 11.6% “Most people believe that a same-sex attracted person is just as intelligent as the average person.” 68.3% 18.3% 9.6% 3.8% “Most people believe that a same-sex attracted person is just as trustworthy as the average citizen.” 50.7% 25.0% 15.5% 8.8% “Most people would accept a same-sex attracted person as a teacher of young children in a public school.” 15.2% 21.7% 25.5% 37.6% “Most people think that being same-sex attracted is a sign of personal failure.” 8.7% 15.5% 23.6% 52.3% “Most people will not hire a same-sex attracted person to care for their children.” 24.5% 22.9% 25.6% 27.0% “Most people think less of a same-sex attracted person.” 13.5% 24.3% 25.2% 36.9% “Most employers will hire a same-sex attracted person if he or she is qualified for the job.” 55.7% 22.7% 14.6% 7.0% “Most employers will pass over the application of a same-sex attracted person in favour of another applicant.” 9.9% 16.5% 24.7% 48.9% “Most people in the community would treat a same-sex attracted person just as they would treat anyone.” 25.7% 24.6% 25.5% 24.1% Once they know a person is same-sex attracted they will take her or his opinion less seriously.” 8.3% 15.5% 28.5% 47.6%
Note: The ‘strongly agree’ and ‘moderately agree’ responses are presented as a single ‘agree’
category, and the ‘strongly disagree’ and ‘moderately disagree ‘responses as a single ‘disagree’
category. Total N = 2025

NOT SO PRIVATE LIVES 83
1
2
3
4
5
6
18-19 20-29 30-39 40-49 50-59 60+
Mea
n s
core
fo
r p
erce
ived
sti
gma
Age group
female
male
gender different
10.1.1 Age and Gender Identity Differences
To provide average scores for perceived stigma, positively worded items were reversed scored with
the end result being the higher the score the higher the level of perceived stigma. Of the total
sample, 50% scored an average of 2.90 or higher on the stigma scale (ranging from 1 = low to 6 =
high), 10% scored an average of 4.00 or higher and 10% scored an average of less than 2.00. Results
revealed that there were no significance differences between the average scores of those who
identified as male (2.95) and those who identified as female (2.94), with results similar across all age
groups. Herek (2009), based on a national sample from the United States, likewise found little
difference between gay men, lesbians, bisexual men and bisexual women when using a modified and
shortened version of the same scale. Both males and females in the current survey, however,
reported significantly lower levels of perceived stigma compared with gender different participants
(3.40). When taking into account a person’s age and gender identity, the results revealed a trend
which indicated that these differences were mainly associated with the higher level of stigma
reported by gender different participants of a younger age (see Figure 44).
Figure 44. Average scores, by age group, for the three gender identity groups for perceptions of stigma in relation to same-sex attractions
10.1.2 Stigma and Urban vs. Rural Areas of Residence
Perceptions of stigma were not significantly related to the area (e.g., rural, metropolitan) in which
participants resided (see Table 1, section 1.1 for a description of area of residence). Although
research has found that people living in rural areas are more likely to have negative attitudes
towards homosexuality (Swank & Raiz, 2007), same-sex attracted people living in large cities may be
more likely to experience different types of discrimination and abuse compared with those living in
regional and remote areas. For example, findings from the Australian national Private Lives survey
(Pitt et al., 2006) showed that those living in major cities, where sexual minorities are visible in larger
numbers, were more likely to report personal insults or verbal abuse than people living in less
populated areas. In contrast, people living in outer regional Australia were more likely to have
reported experiencing threats of violence or physical attack relative to those in other areas. Put

NOT SO PRIVATE LIVES 84
simply, perhaps living in a highly populated area exposes one to more frequent homophobic
behaviour even if, on average, it is less severe than that experienced in rural and remote areas.
Another possibility, of course, is that people living in rural areas may be more likely to perceive high
perceptions of stigma, be less open about their sexuality, and therefore may be less likely to
participate in surveys of this nature.
10.1.3 Stigma, GLBTI Support and Well-being
Feeling supported by GLBTI friends and the GLBTI community were significantly related to lower
levels of perceived stigma and higher levels of well-being. Research conducted with racial minority
groups (e.g., Postmes & Branscombe, 2002) suggests that experiencing higher levels of support from
similar others may work as a buffer against the negative effects of feeling devalued by the dominant
population. In the case of concealable stigmas, however, such as sexual orientation, those who feel
more devalued may be less inclined to want to seek high levels of support from similar others, for
fear of increased visibility leading to further stigmatisation (Miller & Major, 2000). This could also
explain the relationship found in the current survey between lower perceptions of stigma and higher
perceptions of GLBTI support.
10.1.4 Transgender, Transsexual, and Intersex Participants
As discussed previously, it is unlikely that a transgender, transsexual, or intersex individual would be
able to neatly disentangle their perceptions of acceptance or non-acceptance based on sexual
orientation from the additional hurdles they are likely to face as sexual minorities (Lombardi,
Wilchins, Priesing, & Malouf, 2001). It is not surprising, therefore, that average scores for
perceptions of stigma were somewhat higher for this group when compared with the general sample
(see Table 27). For example, 75.7% of participants from the general sample agreed, at least to some
extent, that most people felt that a same-sex attracted person was trustworthy. Only 54.6% of
transgender/transsexual female participants and 40.0% of intersex female participants agreed, at
least to some extent, with this statement.
Table 27. Perceived stigma scores for transgender/transsexual and intersex participants
Average score 50% =>
Trans - F (N = 11) 3.35 3.27 Trans - M (N = 7) 3.08 2.27 Intersex - F (N = 5) 3.62 3.82 Intersex - M (N =2) 3.09 a
a = Figures are not provided as doing so would identify participants’ scores due to the small
number of cases. F = female, M = male, N = number of participants

NOT SO PRIVATE LIVES 85
10.2 Positive and Negative Mood
The PANAS (Watson, Clark, & Tellegen, 1988) is a widely used measure of both positive and negative
mood states and has also been found to be a reliable instrument when used with nonheterosexual
samples13 (e.g., Lee, Dean, & Jung, 2008; Rostosky, Riggle, Horne, & Miller, 2009). For this survey,
participants were asked to rate how they feel “in general” (i.e., on average) when presented with 10
positive adjectives (interested, excited, strong, enthusiastic, proud, alert, inspired, determined,
attentive, and active) and 10 negative adjectives (distressed, upset, guilty, scared, hostile, irritable,
ashamed, nervous, jittery, and afraid). Response options ranged from 1 = very slightly or not at all to
5 = extremely. Of the sample, 2,018 participants completed items on both scales (as three
participants did not provide their age, 2,015 are represented in the Figures 45 and 46).
The highest average scores for negative feelings (i.e., greater extent of a particular negative mood)
were found for the adjectives “irritable” (2.41) and “nervous” (2.36), whereas the lowest scores for
negative feelings were found for the adjectives “ashamed” (1.55) and “hostile” (1.70). The highest
average scores for positive feelings were found for the adjectives “interested” (4.00), “determined”
(3.93) and “proud” (3.81) and the lowest average score for positive feelings was found for the
adjective “excited” (3.43).
10.2.1 Age and Gender Identity Differences
Average PANAS scores (ranging from 10 to 50) for the positive and negative mood scales represent
the sum of the average scores for each scale’s items. Consistent with research findings based on a
sample from the Australian general population (MacKinnon et al., 1999), greater negative mood was
significantly associated with being younger. Gender different participants reported significantly
greater negative mood (average score = 24.11) when compared with those who identified as male
(20.10) or female (19.30), with differences still significant when taking into account participants’
ages. When taking into account age, there were also significant differences found between male and
female participants. Males reported significantly higher negative mood, relative to females, with this
difference more likely to be between males and females of an older age (see Figure 45).
Greater positive mood was significantly associated with being of an older age (see Figure 46). This
latter finding is not consistent with those involving participants from the Australian general
population (e.g., MacKinnon et al., 1999) in which younger people were found to report not only
higher levels of negative mood on the negative PANAS subscale but also higher levels of positive
mood on the positive PANAS subscale14. The average scores for the current survey were 37.50 for
participants identifying as female, 36.91 for participants identifying as male, and 35.36 for gender
different participants. When taking into account age differences, these gender differences for
positive mood were not statistically significant.
13
The positive and negative affect subscales of the PANAS have been found to have good internal consistency with the internal reliability coefficient ranging from α = .83 to α = .90 for Positive Affect and α = .85 to α = .90 for Negative Affect (Watson & Clark, 1994). For the current survey the internal reliability coefficients were α = .88 and α = .90 respectively. 14
The PANAS subscales have been found to be quasi-independent (Watson & Clark, 1994), such that participants may score high on the positive affect subscale while still scoring high on the negative affect subscale.

NOT SO PRIVATE LIVES 86
10
15
20
25
30
35
40
45
50
18-19 20-29 30-39 40-49 50-59 60+
Hig
her
ave
rage
sco
re =
hig
her
neg
ativ
e m
oo
d
Age group
female (N = 1117)
male (N = 851)
gender different (N = 47)
10
15
20
25
30
35
40
45
50
18-19 20-29 30-39 40-49 50-59 60+
Hig
her
ave
rage
sco
re =
hig
her
po
siti
ve
mo
od
Age Group
female (N = 1117)
male (N = 851)
gender different (N = 47)
Figure 45. Average scores for the PANAS negative affect subscale by gender identity
Figure 46. Average scores for the PANAS positive affect subscale by gender identity
Note: Average scores for gender different participants in the age group 50-59 represent two
participants.

NOT SO PRIVATE LIVES 87
10.2.2 Comparative Figures (US national LGB sample and Australian random sample)
Data from a US national sample of gay, lesbian and bisexual adults, reported in a paper by Rostosky,
Riggle, Horne, and Mille, (2009), were made available to the authors for comparative purposes
(E.D.B. Riggle, personal communication, April 10, 2010). Data from a random sample from the "The
Stress and Well-Being Study", undertaken by the Centre for Mental Health Research at the Australian
National University (ANU), were used to compare data from the current survey with that
representing the general Australian population (T. Jacomb, personal communication, April 12, 2010).
The ANU data, as described here, were based on figures provided in a study by MacKinnon et al.,
(1999). As the MacKinnon et al. (1999) study analysed a short 5-item version of the PANAS subscales,
the scores for all three studies (see Table 28, Figures 47 and 48) have been presented as overall
averages15, rather than a sum of item averages, to allow for comparisons between samples. The
findings reported here, however, need to be interpreted with caution. Although the age ranges for
the three samples were similar16, results do not take into account possible demographic differences.
Overall, the results based on the three samples showed that nonheterosexual participants reported
greater negative emotional experiences, but not less positive emotional experiences, relative to a
random sample from Australia. Female participants from the US national LGB survey scored
significantly higher on the PANAS negative mood subscale compared with females from the random
sample from Australia. Average scores for negative mood were similar between female participants
from the current survey and those from the Australian sample, however, when including only the 5
items used in the Canberra study, female participants from the current survey also scored
significantly higher for negative mood.17 18 Negative mood scores for male participants from the US
national LGB survey and those from the current survey were similar, however, male participants from
both these samples reported significantly higher negative mood relative to male participants from
the Australian random sample. Gender different participants reported significantly higher negative
mood relative to all other groups (see Figure 47).
For the PANAS positive mood subscale, scores for the US sample, the Australian random sample, and
for gender different participants in the current survey were comparable. Both male and female
participants from the current survey, however, reported significantly higher positive mood when
compared with their counterparts from the Australian and US samples (see Figure 48). One possible
explanation for the higher positive mood scores for the Australian same-sex attracted male and
female participants, at least when compared with the US sample, is that the current survey asked
participants about how they felt “in general” in relation to the 10 positive PANAS items (e.g., proud,
determined, inspired). For the US study, participants were asked to rate how they felt “during the
previous few weeks”. Comparisons between studies using the PANAS over different time frames
15
Average scores can be converted to a sum of item averages by multiplying these scores by 10 for the Not So Private Lives sample and the US LGB sample, and by 5 for the ANU Canberra sample. 16
The age range for participants from the ANU study, reported in MacKinnon et al., (1999), was 18-79 and the mean age was 42.2 (SD = 14.0). The age range for the US national LGB study (Rostosky et al., 2009) was 18-82 and the mean age was 39.1 (SD =12.8). For the current Not So Private Lives survey, the age range was likewise 18-82 and the mean age was 35.8 (SD = 12.3). 17
Analyses for the current survey were also conducted using only the 5 items used in the ANU study. Scores for positive affect remained unchanged, however, scores for negative affect increased for females from 1.93 to 2.03 (SD = .820), males from 2.01 to 2.08 (SD = .860) and gender different from 2.41 to 2.56 (SD = 1.102). 18
T-tests were conducted to analyse differences between groups.

NOT SO PRIVATE LIVES 88
indicated that scores tend to increase as the time frame considered lengthens (Watson & Clark,
1994). One of the studies included in Watson and Clark’s (1994) comparison involved Australian men
and women who, when presented with the PANAS subscales, were asked to rate how they felt “over
the last week” as well as how they felt “in general”. Findings showed that scores were higher for
positive mood when feelings were considered “in general” compared with the one week assessment,
and that this increase related to only positive mood scores not negative mood scores (Wilkinson,
1993; cited in Watson & Clark, 1994). Table 28 below lists the average scores (and standard
deviations) for the three samples while Figures 47 and 48 allow for a visual interpretation of these
results.
Table 28. Average scores for the PANAS positive affect and negative affect subscales by gender identity and comparative figures based on a randomly selected Australian sample and a US national LGB sample
N PANAS - Positive PANAS - Negative
NSPL – LGBTI sample Female 1118 3.75 (.645) 1.93 (.719) Male 853 3.69 (.703) 2.01 (.767)
Gender different 47 3.54 (.809) 2.41 (.992)
Aust. random sample
Female 1389 3.44 (.668) 1.92 (.814)
Male 1262 3.47 (.626) 1.70 (.656)
US LGB sample
Female 958 3.41 (.764) 2.07 (.729) Male 724 3.50 (.699) 2.00 (.666)
Standard deviations are provided in brackets (). To convert to sum of item averages, multiply
average scores and standard deviations for the NSPL and US samples by 10 and for the random
Australian sample by 5. N = number of participants.

NOT SO PRIVATE LIVES 89
1.93 1.92 2.072.011.70
2.00
2.41
1
1.5
2
2.5
3
3.5
4
4.5
5
NSPL Aust. LGBTI sample N = 2,018
Canberra Aust. sample N = 2,651
US national LGB sample N = 1,682
Hig
her
ave
rage
sco
re =
hig
her
neg
ativ
em
oo
d
Negative Mood
female male gender different
3.753.44 3.41
3.693.47 3.503.54
1
1.5
2
2.5
3
3.5
4
4.5
5
NSPL Aust. LGBTI sample N = 2,018
Canberra Aust. sample N = 2,651
US national LGB sample N = 1,682
Hig
her
aver
age
sco
re =
hig
her
po
siti
ve m
oo
d
Positive mood
female male gender different
Figure 47. Average scores for the PANAS negative affect subscale by gender identity, and comparative figures based on a randomly selected Australian sample and a US national LGB sample
Figure 48. Average scores for the PANAS positive affect subscale by gender identity, and comparative figures based on a randomly selected Australian sample and a US national LGB sample

NOT SO PRIVATE LIVES 90
10.2.3 Transgender, Transsexual, and Intersex Participants
Although included in the results for the general sample, scores for transgender/transsexual and
intersex participants are listed separately in Table 29 below. In keeping with the overall general
sample (see Figure 48), scores for positive mood were relatively high. Scores for negative mood for
transgender/transsexual female and intersex female participants, however, were higher relative to
the general sample and were more in keeping with those found for gender different participants (see
Figure 47). These higher scores for negative emotional experiences are consistent with the higher
scores found in the current survey on perceptions of stigma for transgender/transsexual female,
intersex female and gender different participants (see section 10.1.4).
Table 29. Average scores for the PANAS positive affect and negative affect subscales by gender identity and comparative figures based on a randomly selected Australian sample and a US national LGB sample
Positive Mood Negative Mood
Trans - F (N = 11) 3.61 (.822) 2.43 (.648) Trans - M (N = 7) 3.74 (.860) 2.01 (1.229) Intersex - F (N = 5) 3.42 (.867) 2.98 (.976) Intersex - M (N =2) 4.00 (.707) 1.95 (.919)
Note: Higher scores represent higher mood states. Standard deviations are presented in brackets ().
To covert scores to sum of item averages multiply by 10. F= female, M = male, N = total number.
10.2.4 Summary
Overall, participants identifying as nonheterosexual scored higher in relation to negative emotional
experiences but did not report less positive emotional experiences, relative to a random sample from
Australia (MacKinnon et al., 1999). Scores for the positive PANAS subscale for same-sex attracted
participants from a US national LGB survey (Rostosky et al., 2009) and the current national survey
were comparable, and in some cases higher, when compared with those from the random Australian
sample. In the case of negative emotional experiences, however, same-sex attracted participants
from the US survey and the current survey scored higher on the negative PANAS subscale, although
this finding was less pronounced in the case of same-sex attracted female participants relative to
their female counterparts from the Canberra study. While acknowledging numbers are small, of
greatest concern, and consistent with higher scores in the current survey on perceptions of stigma,
were the higher levels of negative emotional experiences reported by gender different, intersex
female, and transgender/transsexual female participants.

NOT SO PRIVATE LIVES 91
10.3 Psychological Well-Being Scales (PWB)
Participants were presented with the 42-item version of the Scales of Psychological Well-Being
(PWB: Ryff, 1989), which have been used across various age groups and translated to over 25
different languages (MIDUS, 2010). The scales, which focus on positive psychological functioning,
represent six dimensions of well-being: Self-Acceptance – positive evaluation of oneself and one’s
past life, Purpose in Life – the belief that one’s life is purposeful and meaningful, Autonomy – a sense
of self-determination, Environmental Mastery – the capacity to effectively manage one’s life and
surrounding world, Personal Growth – a sense of continued growth and development as a person,
Positive Relations with Others – the possession of quality relations with others. Participants were
asked about the extent to which they agreed or disagreed (1= strongly disagree to 6 = strongly agree)
with seven statements for each of these dimensions. Responses to negatively worded statements
were reversed scored such that higher scores indicate greater well-being.
10.3.1 Age and Gender Identity Differences
When considering scores on all six dimensions of psychological well-being combined (i.e., overall
well-being) older participants were significantly more likely to report higher well-being than younger
participants. Those identifying as female reported significantly higher well-being compared with
gender different participants and those identifying as male. Gender different participants reported
significantly lower well-being relative to both male and female participants (see Figure 55). Figures
49 through to 54 present the average scores for each of the six dimensions of psychological
well-being by gender identity and age group. For each of the six dimensions, older participants were
more likely to report significantly higher levels of well-being compared with younger. Female
participants scored significantly higher than male participants for Personal Growth and significantly
higher than both male and gender different participants for Positive Relations with Others and
Purpose in Life. Gender different participants scored significantly lower than female participants for
Purpose in Life and significantly lower than both female and male participants for Environmental
Mastery, Positive Relations with Others, and Self-Acceptance. The only dimension for which no
significant gender identity differences were found was Autonomy19.
An evaluation of scores on the Scales of Psychological Well-being (PWB), from multiple sources, has
shown that females in general tend to rate themselves higher on the Positive Relations with Others
and Personal Growth dimensions (Ryff, 1995). Female scores for the current survey, however, were
also higher for Purpose in Life and well-being overall. These higher female scores may, at least in
part, relate to the more overt prejudice same-sex attracted males appear to face when compared
with their female counterparts. Research from the Australian Private Lives GLBTI survey (Pitt et al.,
2006) revealed that greater percentages of male participants, relative to female, reported acts of
violence, and threats of violence or intimidation, with regard to their sexuality. Research has also
found higher levels of prejudice towards gay men from other men than towards lesbians from other
women (e.g., Herek, 2000).
19
Results described above are based on analyses of scores from participants who completed all items on all six well-being dimensions (N =1991). Additional analyses were conducted for each dimension, based on participants who completed all items on that particular dimension. The significance of the results remained unchanged, with the exception of those for Self Acceptance. For this dimension, differences between male and female scores went from being close to significant to significant, with females having scored higher.

NOT SO PRIVATE LIVES 92
10
15
20
25
30
35
40
18-19 20-29 30-39 40-49 50-59 60+
Ave
rage
sco
re f
or
self
-acc
epta
nce
Age group
female (N=1102)
male (N=844)
gender different (N=45)
10
15
20
25
30
35
40
18-19 20-29 30-39 40-49 50-59 60+
Ave
rage
sco
re f
or
pu
rpo
se in
life
Age group
female (N=1102)
male (N=844)
gender different (N=45)
The significantly lower scores for gender different participants on four out of the six well-being
dimensions is of great concern, particularly as these findings are consistent with this group’s
significantly higher scores on perceived stigma and negative emotional experiences, when compared
with participants identifying as male or female. It is unfortunate that in most survey research to date
responses for this group of individuals have been masked, due to the inclusion of strictly male or
female gender identity or biological sex category options.
Figure 49. Average score for Self-Acceptance by gender identity and age group
Figure 50. Average scores for Purpose in Life by gender identity and age group
Note: Average scores for gender different participants in the age group 50-59 represent two
participants.

NOT SO PRIVATE LIVES 93
10
15
20
25
30
35
40
18-19 20-29 30-39 40-49 50-59 60+
Ave
rage
sco
re f
or
auto
no
my
Autonomy
female (N = 1102)
male (N = 844)
gender different (N = 45)
10
15
20
25
30
35
40
18-19 20-29 30-39 40-49 50-59 60+
Ave
rage
sco
re f
or
envi
ron
men
tal
mas
tery
Age group
female (N = 1102)
male (N=844)
gender different (N = 45)
Figure 51. Average scores for Autonomy by gender identity and age group
Figure 52. Average scores for Environmental Mastery by gender identity and age group
Note: Average scores for gender different participants in the age group 50-59 represent two
participants.

NOT SO PRIVATE LIVES 94
10
15
20
25
30
35
40
18-19 20-29 30-39 40-49 50-59 60+
Ave
rage
sco
re f
or
per
son
al g
row
th
Age group
female (N=1102)
male (N=844)
gender different (N = 45)
10
15
20
25
30
35
40
18-19 20-29 30-39 40-49 50-59 60+
Ave
rage
sco
re f
or
po
siti
ve r
elat
ion
s w
ith
o
ther
s
Age group
female (N=1102)
male (N=844)
gender different (N=45)
Figure 53. Average scores for Personal Growth by gender identity and age group
Figure 54. Average scores for Positive Relations with Others by gender identity and age group
Note: Average scores for gender different participants in the age group 50-59 represent two
participants.

NOT SO PRIVATE LIVES 95
10
15
20
25
30
35
40
18-19 20-29 30-39 40-49 50-59 60+
Ave
rgae
sco
re f
or
ove
rall
wel
l-b
ein
g
female (N= 1102)
male (N=844)
gender different (N=45)
Figure 55. Average overall score for Psychological Well-Being (PWB) by gender identity and age group
Table 30. Average scores for each of the six dimensions of Psychological Well-Being (PWB) and overall scores by gender identity
Female Male Gender Diff
N 1102 844 45
Autonomy (α= .77) 30.91 (6.18) 30.93 (5.88) 31.04 (6.13) Environmental Mastery (α= .85) 30.74 (6.99) 30.31 (7.26) 26.02 (8.37) Personal Growth (α=.80) 35.58 (5.02) 34.49 (5.71) 34.51 (6.86)
Positive Relations with Others (α=.78) 33.85 (5.86) 32.53 (6.12) (6.11) (6.11
(6.11)
29.53 (8.39)
Purpose in Life (α = .80) 32.51 (6.13) 31.64 (6.47) 30.13 (6.88) Self-Acceptance (α=.88) 31.04 (7.33) 30.28 (7.73) 26.64 (9.14)
Overall Well-being (α = .95) 194.63 (30.47) 190.18 (32.58) 177.89 (37.89)
Total N =1991. Numbers of participants (N) represent those who completed all items on the six
dimensions (see footnote 19, p.91). Standard deviations are presented in brackets (). α = internal
reliability coefficient.

NOT SO PRIVATE LIVES 96
10.3.2 Comparative Figures (US national sample)
Scores for the Scales of Psychological Well-Being (PWB: Ryff, 1989) from the current survey (NSPL)
were compared with those from the second National Survey of Midlife Development in the United
States (MIDUS II). Information on the use of these scales and how best to convert scores20 based on
the 7-point scale response format used in the MIDUS II survey to a 6-point scale response format
used for the current survey was provided by the author of these scales, Professor Ryff (C. D. Ryff,
personal communication, April 9, 2010). As the MIDUS II sample represented a larger number of
participants in their senior years, scores were examined between a subsample of participants aged
30-60 from the MIDUS II dataset and a subsample of participants aged 30-60 from the current
survey. Due to the mean age of the MIDUS sample still being higher, an additional subsample from
the current survey, which included all participants aged 30 and over (i.e., 30-82), was also compared.
As the number of participants over the age of 60 in the current NSPL sample was relatively small
(n = 81), the average age for the two NSPL subsamples differed only slightly.
Results based on comparisons with the raw data from the MIDUS II survey showed that participants
from the current survey (for both subsamples) scored significantly lower21 than the subsample of
American heterosexual participants22 for Environmental Mastery, Purpose in Life and Self-
Acceptance, and significantly higher for Personal Growth. These findings are similar to those based
on a comparison by Riggle, Rostosky, and Danner (2009) of scores between American heterosexual
participants and American nonheterosexual participants from the earlier MIDUS I dataset. Riggle and
colleagues (2009) found that the sexual minority subsample scored lower on the same dimensions
found for the current survey with the addition of Positive Relations with Others. Interestingly,
Personal Growth was the one dimension for which they found sexual minority participants scored
higher, although, unlike the current findings, scores were not found to be significantly different from
the comparison group.
Although the consistencies found between the US findings for sexual minority participants’ scores
and those from the current survey are of interest, the interpretation of these findings are limited due
to the fact that demographic differences were not taken into account for the Australian comparison.
Further, in order to make comparisons with the MIDUS II data, which were based on an older-age
sample, sexual minority participants who were under the age of 30 were not included in the
analyses. As younger people were more likely to report lower well-being for all six dimensions, it
would be of greater interest to compare reported psychological well-being between young
heterosexual and young nonheterosexual national samples. Importantly, although the findings
presented here provide some evidence of reported lower well-being for sexual minority individuals
for certain aspects of well-being, results overall revealed that the majority of same-sex attracted
people in the current survey reported positive well-being. Individuals who perceived higher levels of
20
To convert scores from the MIDUS II dataset based on a 7-point scale response format to a 6-point scale format, half of the ‘neutral’ responses (i.e. a score of 4) were randomly assigned a score immediately above on the scale (i.e., slightly agree) and half immediately below (i.e., slightly disagree). Data were based on participants who completed all items on each of the 6 dimensions to be consistent with the current sample. 21
T-test were conducted to analyse differences between groups. 22
Participants who identified as ‘Homosexual’ or ‘Bisexual’ (the two nonheterosexual response options in the MIDUS II survey) were excluded from the MIDUS II subsample, in order to provide a heterosexual comparison.

NOT SO PRIVATE LIVES 97
stigma and lower levels of acceptance from others were more likely to report higher levels of
negative mood and lower levels of psychological well-being.
Table 31. Average scores for Scales of Psychological Well-Being (7-items per scale) for a subsample of heterosexual participants from the MIDUS II and subsamples from the current survey (NSPL)
MIDUS II (30-60 yrs) NSPL (30-60 yrs) NSPL (30-82 yrs)
N = 2350 N = 1182 N = 1249 30-60 yrs, M = 48.5 30-60 yrs, M = 41.7 30-82 yrs, M= 43.0
Autonomy 31.51 (5.78) 31.56 (6.00) 31.58 (5.98) Environmental Mastery 32.10 (6.09) 31.41 (7.03) 31.53 (7.01) Personal Growth 33.06 (5.68) 35.35 (5.35) 35.32 (5.42)
Positive Relat. w/Others 34.24 (5.83) 33.91 (5.89) 33.92 (5.88)
Purpose in Life 33.12 (5.68) 32.44 (6.21) 32.47 (6.20)
Self-Acceptance 32.17 (6.86) 31.27 (7.38) 31.35 (7.37)
Overall Well-being 196.19 (29.45) 195.93 (31.17) 196.18 (31.13)
M = mean age
10.3.3 Transgender, Transsexual and Intersex Participants
Similar to the scores for the general sample, transgender/transsexual and intersex participants
scored highest for the Personal Growth dimension of well-being and lowest for Environment Mastery.
Similar to gender different participants, however, scores were overall lower compared with male and
female scores for the general sample, for all groups except intersex males23. The average total well-
being scores were 181.55 (SD = 34.90) for transgender/transsexual females, 190.57 (SD = 53.96) for
transgender/transsexual males, 162.40 (SD = 37.90) for intersex females and 205.00 (SD = 8.49) for
intersex males.
23
These differences are based on observed differences not statistical differences.

NOT SO PRIVATE LIVES 98
Appendix – Auxiliary Report

NOT SO PRIVATE LIVES 99
NNOOTT SSOO PPRRIIVVAATTEE LLIIVVEESS TThhee IInnss aanndd OOuuttss ooff SSaammee--SSeexx RReellaattiioonnsshhiippss
AAuuxxiilliiaarryy RReeppoorrtt
A report on the analyses of relationship recognition
measures included in the Not So Private Lives online survey
for same-sex attracted Australians
August 2009
Total sample - 2232
MMss.. SShhaarroonn DDaannee,, DDrr.. BBaarrbbaarraa MMaasssseerr aanndd DDrr.. JJuulliiee DDuucckk
SScchhooooll ooff PPssyycchhoollooggyy –– TThhee UUnniivveerrssiittyy ooff QQuueeeennssllaanndd

NOT SO PRIVATE LIVES 100
CCoonntteennttss
Background.............................................................................3
Demographics.........................................................................4
State/territory of residence .........................................................................................4
Type of area of residence ............................................................................................4
Age................................................................................................................................5
Biological sex, gender identity & sexual identity .........................................................5
Employment .................................................................................................................6
Religion.........................................................................................................................6
Relationship Measures...........................................................6
Type of current same-sex relationship ........................................................................6
Current legal status of same-sex relationship .............................................................7
Personal preference for legal status (general sample) ................................................8
Personal preference for legal status - those with regular partner ..............................9
Preferred legal options for same-sex couples in Australia ........................................11
Summary..............................................................................12

NOT SO PRIVATE LIVES 101
Background
Not So Private Lives: The Ins and Outs of Same-Sex Relationships online survey was conducted
through the School of Psychology at The University of Queensland, Australia. The aim of the survey
was to add to the growing body of research on the lives of sexual minorities in Australia. The full
report of this survey is expected to be completed by November 2009. The report provided here is
based on the analyses of responses to a sub-set of questions within the survey. These questions
focused on current relationship status and preferences for relationship recognition. The examination
of these factors aimed to provide an insight into the preferences of same-sex attracted Australians
with regard to the legal recognition of their relationships following the introduction of de facto
status for same-sex couples at a federal level.
The survey site was hosted by Globalpark through its Unipark program for academic research.
Globalpark has its headquaters in Germany and is one of the leading international suppliers of online
software for academic and commercial research. All data collection and storage is provided by
Globalpark. The url for the web-page entry to the survey was www.notsoprivatelives.com
Recruitment Strategies
The survey commenced on the 3rd April 2009 and ran until midnight, 15th August 2009. Responses to
the survey decreased substantially in the latter two weeks, suggesting the sample had reached its
maximum uptake. The survey was advertised online in the LGBTQI press for every state and territory
and in print in various LGBTQI magazines. Information on the survey was also circulated through
sexual minority email networks across the country. Flyers and/or email information were sent to
sexual minority - businesses, health and community centres, sporting clubs, reading groups,
parenting groups, outdoor activity groups, city and country social clubs, chat rooms, and sexual
minority welcoming religious organisations. The survey was also promoted via Queer radio (e.g., JOY
FM – Melbourne) and flyers were distributed at sexual minority events (e.g., Brisbane Pride Day and
the Brisbane Queer Film Ferstival). Participants were also asked to consider informing their same-
sex attracted friends/contacts about the survey.
Eligibility
Participants were invited to take part in the survey provided they met the criteria of being:
a) at least 18 years of age
b) a citizen or permanent resident of Australia
c) attracted (sexually and/or romantically) to people of the same sex
Participants, who did not select the ‘Yes’ option for all three of the questions addressing the criteria,
were thanked for their interest and directed away from the survey. Identification as same-sex
attracted was further verified by the Sexual Identity and Sexual and Romantic Attraction measures in
the survey proper.

NOT SO PRIVATE LIVES 102
Demographics
The Preference for Legal Recognition of Same-Sex Relationships’ component of the survey
was completed by 2,232 participants in total. Demographic information for these
participants is provided below.
Figure 1:
Numbers and percentages of respondents according to state/territory of residence
All participants acknowledged that they were either citizens or permanent residents of
Australia. Thirty-three participants selected the ‘currently living overseas’ option and were
asked to provide the name of their home state or territory in Australia. These numbers (ACT
- 3, NSW - 10, QLD - 8, VIC - 9 and WA - 3) are accounted for in Figure 1 above. The survey
attracted a higher number of participants from Queensland, despite balancing advertising
across states and territories. This is likely to have been as a result of the survey being
conducted in Queensland and advertised under The University of Queensland logo.
Table 1
Numbers and percentages of respondents according to area of current residence
N %
Capital City 1643 73.6 Other metropolitan area (population 100,000 or more) 316 14.2 Large rural centre (25,000 – under 100,000) 144 6.5 Other rural area 111 5.0 Remote 18 0.8
Total N = 2232
11.51%
18.41%
2.06%
5.6%
28.41%
0.9%
27. 15%
5.96%
0 100 200 300 400 500 600 700
1
Number of respondents
Axi
s St
ate
/Te
rrit
ory
Titl
e
ACT (133)
NSW (606)
NT (20)
QLD (634)
SA (125)
TAS (46)
VIC (411)
WA (257)

NOT SO PRIVATE LIVES 103
Age
The mean age of this sample was 35.8 years with a range from 18 to 82 years. Table 2 below
indicates the numbers and percentages of participants by age group.
Table 2
Numbers and percentages of respondents according to age group
N %
18 - under 20 131 5 .9 20 - 29 701 31.4 30 - 39 585 26.3 40 - 49 484 21.7 50 - 59 236 10.6 60 - 69 74 3.3 70 - 82 17 0.8
Total N = 2228 (four participants did not provide their age).
Biological Sex, Gender Identity and Sexual Identity
Participants were first asked to select their biological sex as defined at birth. Of the sample,
56.2% (n = 1254) selected female, 43.6% (n = 974) selected male and 0.2% (n = 4) selected
intersex. Participants’ current gender identity is detailed in Table 3 below. When examining
the numbers of transgender, transsexual, intersex, and gender different participants, it is
important to note that this survey was not open to all sexual minority individuals but only
those who identified as same-sex attracted.
Table 3
Current gender identity of respondents
Total N = 2232
The most frequent responses for sexual identity were gay (40.9%), lesbian (37.9%), bisexual
(8%), queer (5.7%) and no label (3.8%). Larger numbers of those identifying as female than
N %
Female 1201 53.8 Transgender/Transsexual Female 13 0.6 Gender Different/Intersex Female 7 0.3
Male 948 42.5 Transgender/Transsexual Male 7 0. 3 Gender Different/Intersex Male 2 0.1
Gender Different 30 1.3 Other 24 1.1

NOT SO PRIVATE LIVES 104
male nominated the terms bisexual, queer or no label. These terms were also nominated by
the majority of gender different participants.
Employment
Table 4
Numbers and percentages of respondents according to current employment and/or
education status
Note: Respondents were able to select multiple responses for this measure.
Religion
Participants were simply asked if they considered themselves to be a religious person rather
than asked to state their religious background. Of this sample, 19.2% (n = 428) selected
‘yes’, 80.8% (n = 1803) selected ‘no’ and one person did not respond. However, 41.6% of
participants reported that religion (including the religious beliefs of others) plays a role in
their decisions to disclose their sexuality.
Relationship Measures
Of the sample, 66.3% of participants reported currently being in some form of same-sex
relationship. The numbers and percentages for these relationships are in Table 5 below.
Table 5
Type of current same-sex relationship
Total N = 2229 (three participants did not respond).
N %
Full-time student 412 18.5 Part-time student 189 8.5 Full-time employment 1156 51.8 Part-time employment 432 19.4 Self-employed 215 9 .6 Not in paid employment (incl. Volunteer work) 160 7. 2 Retired 81 3.6
N %
Regular partner (living together) 1008 45.2 Regular partner (living apart) 345 15.5 No primary partner or casual relationships only 125 5.6 Not currently in a same-sex relationship 751 33.7

NOT SO PRIVATE LIVES 105
Current Legal Status of Same-Sex Relationship
Participants who reported that they currently had a regular same-sex partner (whether living
together or apart) were asked how they would describe their current same-sex relationship
in legal terms. To minimise confusion, participants were provided with examples for
relationships formalised through a state or municipal registry in Australia. These were ACT
Civil Partnership, City of Melbourne Relationship Declaration, City of Sydney Relationship
Declaration, Tasmania Significant Relationship, Victoria Domestic Partnership and Yarra City
Council Relationship Declaration. Examples of relationships recognised overseas were
provided next to the relevant answer options (see Table 6 below).
Table 6
Reported current legal status of same-sex relationship for respondents with a regular
same-sex partner, living together or apart (N = 1353).
Note: Respondents were able to select more than one option.
The question asking participants how they would describe the legal status of their same-sex
relationship also provided the option of selecting ‘Other’. Forty-eight participants (3.5%)
selected this ‘Other’ option. However, the majority of these participants (31 out of 48) had
also selected one of the categories listed in Table 6 above and simply utilised the ‘Other’ text
box to clarify their selection. Three participants used the ‘Other’ option to state that they
were unsure about the legal status of their relationship and 13 did not make the legal status
of their relationship clear in their description.
Preferred Legal Recognition of Same-Sex Relationship
All participants, regardless of whether or not they were currently in a same-sex relationship,
were asked about their personal preference for legal relationship recognition in this country.
Figure 2 below indicates the responses to the question “If you are or were to become
involved in a long-term committed same-sex relationship, in what way would you prefer
Australian law to recognise your relationship?
N %
No legal status 548 40.5 De facto 719 53.1 Relationship formalised through a state or municipal registry (see examples above)
47 3.5
Overseas recognised relationship other than marriage (e.g., UK Civil Partnership, NZ Civil Union)
43 3.2
Overseas marriage (e.g., Canada, Netherlands, South Africa, Massachusetts)
23 1.7

NOT SO PRIVATE LIVES 106
Figure 2
Personal preference for relationship recognition - general sample (including those not
currently in a same-sex relationship).
Six participants stated that they preferred a Civil Union and three stated that they preferred
a Civil Partnership in the ‘Other’ text box provided. As both types of relationships are forms
of federally recognised relationships documented at a registry (other than marriage), these
nine responses were included in the main category ‘Federally recognised registry- other than
marriage’. Twenty-two participants selected the ‘not applicable’ option (e.g., never wish to
be in a long-term committed same-sex relationship) and were therefore excluded from the
analysis. From the remaining sample of 2210, 149 participants selected the ‘Other’ option
with the most common statement used to clarify this selection being that they simply
wanted the same rights as heterosexuals (e.g., “all ways permitted for opposite-sex
couples”, “exactly the same as heterosexual couples”). These responses, although making
an important statement, were more in keeping with a later question on a person’s general
preference for relationship recognition in which participants could select more than one
choice. Therefore, these responses, along with those from others who did not select a single
preference as instructed by the question, were not included in this analysis. However, it is
acknowledged that making a specific choice may have been difficult for some participants,
particularly those who were not currently in a committed same-sex relationship.
3.01% (62)
15.04% (310)
27.8% (573)
54.15% (1116)
None
De facto
Federally recognised registry - other than marriage
Marriage

NOT SO PRIVATE LIVES 107
Preferred legal recognition of same-sex relationship for participants with a regular same-
sex partner.
Figures 3 to 7 indicate the personal preferences for the legal recognition of a committed
same-sex relationship for participants who reported having a regular same-sex partner
whether living together or apart (N = 1353). Those with invalid responses, for reasons
described on the previous page, were excluded from analyses leaving a total of 1291
responses across categories. Responses are grouped according to the current legal status of
participants’ same-sex relationships.
Figure 3
Preferred legal recognition for those currently in a same-sex de facto relationship (N =677)
Figure 4
Preferred legal recognition for those with a current same-sex relationship formalised
through a state or municipal registry.
1.3%
17.7%
25.6%
55.4%
None De facto Federally recognised registy- other than marriage Marriage
2.17%
19.57%
78.26%
De facto Federally recognised registry - other than marriage Marriage

NOT SO PRIVATE LIVES 108
Figure 5
Preferred legal recognition for those currently in an overseas recognised relationship other
than marriage - e.g., NZ Civil Union, UK Civil Partnership (N = 40)
Figure 6
Preferred legal recognition for those currently in an overseas marriage (N = 23)
2.5%
37.5%
60%
De facto Federally recognised registry - other than marriage Marriage
8.7%
91.3%
Federally recognised registry - other than marriage Marriage

NOT SO PRIVATE LIVES 109
Figure 7
Preferred legal recognition for those currently in a same-sex relationship with no legal
status (N = 505)
Participants were also asked about their preferences regarding legal recognition in Australia
for same-sex couples in general. Figure 8 below shows participants’ responses to the
question “Irrespective of your personal preference, which form(s) of relationship recognition
would you like to see remain and/or become available for same-sex couples in Australia?”
Note: Participants in this instance were able to select multiple options. One participant did
not respond to this measure.
Figure 8
Respondents’ preferred legal options for same-sex couples in Australia (N =2231)
6.5%
12.7%
27.7%
53.1%
None De facto Federally recognised registry - other than marriage Marriage
1.2%
48%
59.9%
77.4%
0
200
400
600
800
1000
1200
1400
1600
1800
2000
None (27)De facto (1071)Federally recognised registry - other than marriage (1336)Marriage (1725)
Axi
s n
um
be
r o
f re
po
nd
en
ts
None (27)
De facto (1071)
Federally recognised registry - other than marriage (1336)

NOT SO PRIVATE LIVES 110
Auxiliary Report Summary
Not So Private Lives is the first national study to examine same-sex attracted Australians’ preferences
for various forms of relationship recognition since the introduction of de facto status for same-sex
couples at a federal level. It is also the first major study to investigate preferences for relationship
recognition while taking into account the current legal status (in Australia or overseas) of an
individual’s same-sex relationship.
Findings from the relationship recognition measures of this survey demonstrate that same-sex
attracted individuals, like other Australians, differ in the way they prefer their relationships to be
formally recognised. However, the results show that the majority of same-sex attracted participants
in this survey selected marriage as their personal choice. A federally recognised relationship
documented at a registry other than marriage was the second most popular option, and de facto
status was the third. The preference for a relationship without any legal status was selected by only
3% of the overall sample.
Interestingly, marriage was still the majority choice irrespective of the current legal status of
participants’ same-sex relationships (including no legal status). For example, of those currently in a
de facto relationship, 55.4% stated they preferred marriage for themselves, 25.6% stated that they
preferred a federally recognised relationship other than marriage, 17.7% selected de facto and 1.3%
chose no legal status.
Participants were also given the opportunity to select which forms of legal relationship recognition
they would like to see remain and/or become available in this country for same-sex couples in
general. Responses to this measure (which allowed for multiple selections) show that 77.4% would
like to see marriage become available as an option, 59.9% would like to see a federally recognised
relationship other than marriage be made available and 48% would like to see de facto recognition
remain. These numbers indicate that many participants selected multiple options, suggesting that
simply having a choice was an important factor.
Although the data from this survey indicate that marriage is not for everyone, the majority of same-
sex attracted participants in this national survey selected this type of relationship recognition as their
personal choice and as a choice to be made available for their fellow same-sex attracted Australians.

NOT SO PRIVATE LIVES 111
References
Australian Bureau of Statistics. (2006). Census fact sheet: Ancestry, Canberra.
Australian Bureau of Statistics. (2008). How many children have women in Australia had? (Cat. No 4102.0). Retrieved from: http://www.abs.gov.au/ausstats/[email protected]/Lookup/4102.0Chapter3202008
Australian Bureau of Statistics. (2009a). Home and away: The living arrangements of young people (Cat. No 4102.0). Retrieved from: http://www.abs.gov.au/AUSSTATS/[email protected]/Lookup/4102.0Main+Features50June+2009
Australian Bureau of Statistics. (2009b). Education and work, Australia (Cat. No 6227.0). Retrieved from: http://www.abs.gov.au/ausstats/[email protected]/mf/6227.0
Australian Bureau of Statistics. (2010). Children and youth statistics. Retrieved from: http://www.abs.gov.au/websitedbs/c311215.nsf/22b99697d1e47ad8ca2568e30008e1bc/c04c0f363a929bcfca256fc60025e847!OpenDocument
Australian Christian Lobby (ACL). (2008). Address to the Senate Standing Committee on Legal and Constitutional Affairs regarding the Same-Sex Relationships (Equal Treatment in Commonwealth Laws – General Law Reform) Bill 2008. Retrieved from: http://www.acl.org.au/pdfs/load_pdf_public.pdf?pdf_id=1187&from=SEARCH
Baumeister, R. F. (2000). Gender differences in erotic plasticity: The female sex drive as socially flexible and responsive. Psychological Bulletin, 126, 247-374.
Breslau, J., Aquilar-Gaxiola, S., Kendler, K. S., Su, M., Williams, D., Kessler, R.C. (2006). Specifying race-ethnic differences in risk for psychiatric disorders in a USA national sample. Psychological Medicine, 36, 57-68.
Cherlin, A. J. (2004). The deinstitutionalization of American marriage. Journal of Marriage and Family, 66, 848-861.
Cochran, S. D., & Mays, V. M. (2009). Burdens of psychiatric morbidity among lesbian, gay and bisexual individuals in the California Quality of Life Survey. Journal of Abnormal Psychology, 118, 647-658.
Commonwealth of Australia. Senate Legal and Constitutional Affairs Legislation Committee. (2009). Marriage Equality Amendment Bill 2009. (Official Hansard). Canberra, Australia: Commonwealth Government Printer.
Dane, S. K., & MacDonald. G. (2009). Heterosexuals’ acceptance predicts the well-being of same-sex attracted young adults beyond ingroup support. Journal of Social and Personal Relationships, 26, 659-677.
Dane, S. K., Masser, B. M., MacDonald, G., & Duck, J. M. (2010). Upfront and indirect: The effects of timing and manner in ‘coming out’ to others. Manuscript in preparation.
Diamond, L. M. (2003). What does sexual orientation orient? A behavioural model distinguishing romantic love and sexual desire. Psychological Review, 110, 173-192.
Diamond, L. M. (2008). Female bisexuality from adolescence to adulthood: Research from a 10-year longitudinal study. Developmental Psychology, 44, 5-14.
Galaxy Research. (2009). Same sex marriage report.
Herek, G. M. (2000). Sexual prejudice and gender: Do heterosexuals’ attitudes toward lesbian and gay men differ? Journal of Social Issues, 56, 251-266.
Herek, G. M. (2003). Why tell if you are not asked? Self-disclosure, intergroup contact, and heterosexuals’ attitudes toward lesbians and gay men. In L. D. Garnets & D. C. Kimmel (Eds). Psychological perspectives on lesbian, gay, and bisexual experiences. (pp. 270-292). New York: Columbia University Press.
Herek, G. M. (2009). Hate crimes and stigma related experiences among sexual minority adults in the United States: Prevalence estimates from a national probability sample. Journal of Interpersonal Violence, 24, 54-74.
Hillier, L., Turner, A., & Mitchell, A. (2005). Writing themselves in again: 6 years on – The 2nd
national report on the sexuality, health & well-being of same-sex attracted young people in Australia. Monograph 50, Australian Research Centre in Sex, Health and Society, La Trobe University, Melbourne.
Kaye, B. K., & Johnson, T. J. (1999). Research methodology: Taming the cyberfrontier: Techniques for improving online surveys. Social Science Computer Review, 17, 323-337.
Kinsey, A. C., Pomeroy, W. B., & Martin, C. E. (1948). Sexual behaviour in the human male. Philadelphia: W.B.
Kite, M. E., & Whitley, B. E. Jr., (2003). Do heterosexual men and women differ in their attitudes toward homosexuality? A conceptual and methodological analysis. In L. D. Garnets & D. C. Kimmel (Eds). Psychological perspectives on lesbian, gay, and bisexual experiences. (pp. 165-187). New York: Columbia University Press.
Kurdek, L. A. (2008). Change in relationship quality for partners from lesbian, gay male, and heterosexual couples. Journal of Family Psychology, 22, 701-711.
Lee, R. M., Dean, B. L., & Jung, K. (2008). Social connectedness, extraversion, and objective well-being: Testing a mediation model. Personality and Individual Differences, 45, 414-419.
Link, B. J. (1987). Understanding labeling effects in the area of mental disorders: An assessment of the effects of expectations of rejection. American Sociological Review, 52, 96-112.

NOT SO PRIVATE LIVES 112
Lombardi, E. L., Wilchins, R. A., Priesing, D., & Malouf, D. (2001). Gender violence: Transgender experiences with violence and discrimination. Journal of Homosexuality, 42, 89-101.
Mackinnon, A., Jorm, A. F., Christensen, H., Korten, A. E., Jacomb, P. A., & Rogers, B. (1999). A short form of the positive and negative affect schedule: Evaluation of factorial validity and invariance across demographic variables in a community sample. Personality and Individual Differences, 27, 405-416.
Martin, J. L., & Dean, L. (1987). Summary of measures: Mental health effects of AIDS on at-risk homosexual men. Divisions of Sociomedical Sciences, Columbia University, School of Public Health. Unpublished manuscript.
Meyer, I. H., & Wilson, P. A. (2008). Sampling lesbian, gay, and bisexual populations. Journal of Counseling Psychology. 56, 23-31.
Meyer, I. H. (1995). Minority stress and mental health in gay men. Journal of Health and Social Behaviour, 36, 38-56.
Midlife in the United States (MIDUS). (2010). A national study on health and aging. Retrieved from: http://midus.wisc.edu/miduspis/ryff.php
Miller, C. T., & Major, B. (2000). Coping with stigma and prejudice. In T. F. Heatherton, R. E. Kleck, M.R. Hebl, & J. G. Hull (Eds.), The social psychology of stigma (pp 243-272). New York: Guilford Press.
Mohr, J. J., & Fassinger, R. E (2006). Sexual orientation identity and romantic relationship quality in same-sex couples. Personality and Social Psychology Bulletin, 32, 1085-1099.
Nagoshi, J. L., Adams, K. A., Terrel, H. K., Hill, E. D., Brzuzy, S., & Nagoshi, C. T. (2008). Gender differences in correlates of homophobia and transphobia. Sex Roles, 59, 521-531.
Newspoll Market Research. (2006). Church and State.
Pitts, M., Smith, A., Mitchell, A., & Patel, S. (2006). Private lives: A report on the health and wellbeing of GLBTI Australians. Monograph 57, Australian Research Centre in Sex, Health and Society, La Trobe University, Melbourne.
Postmes, T., & Branscombe, N.R. (2002). Influence of long-term racial environmental composition on subjective well-being in African Americans. Journal of Personality and Social Psychology, 83, 735-751.
Ramos. C., Goldberg, N. G., & Badgett M. V. L. The effects of marriage equality in Massachusetts: A survey of the experiences and impact of marriage on same-sex couples. http://www.escholarship.org.uc.item/9dx6v3kj. The Williams Institute, UCLA School of Law, UC, Los Angeles.
Riggle, E. D. B., Rostosky, S. S., & Danner, F. (2009). LGB identity and eudaimonic well being in midlife. Journal of Homosexuality, 56, 786-798.
Rostosky, S. S., Riggle, E. D. B., Horne, S. G., & Miller, A. D. (2009). Marriage amendments and psychological distress in lesbian, gay and bisexual (LGB) adults. Journal of Counseling Psychology, 56, 56-66.
Ryff, C. D. (1989). Happiness is everything, or is it? Explorations on the meaning of psychological well-being. Journal of Personality and Social Psychology, 57, 1069-1081.
Ryff, C.D. (1995). Psychological well-being in adult life. Current Directions in Psychological Science, 4, 99-104.
Ryff, C. D., & Keyes, C. L. M. (1995). The structure of psychological well-being revisited. Journal of Personality and Social Psychology, 69, 719-727.
Savin-Williams, R. C. (2005). The new gay teenager. Cambridge. MA: Harvard University Press.
Schafer, C. E., & Shaw, G. M. (2009). The polls-trends: Tolerance in the United States. Public Opinion Quarterly, 73, 404-431.
Swank, E., & Raiz, L. (2007). Explaining comfort with homosexuality among social work students: The impact of demographic, contextual, and attitudinal factors. Journal of Social work Education, 43, 257-279.
Tasmanian Gay and Lesbians Rights Group (TGLRG). (2010). Couples give thumbs up to official relationship ceremonies. Retrieved from: http://tglrg.org/more/445_0_1_0_M/
Telljohann, S. K., & Price, J. H. (1993). A qualitative examination of adolescent homosexuals’ life experiences. Ramifications for secondary school personnel. Journal of Homosexuality, 26, 41-56.
Udry, J. R., Talbert, L. M., & Morris, N. M. (1986). Biosocial foundations for adolescent female sexuality. Demography, 23, 217-230.
Watson, D., & Clark L. A. (1994). The PANAS-X Manual for the Positive and Negative Affect Schedule: Expanded form. Iowa. The University of Iowa.
Watson, D., Clark, L. A., & Tellegen, A. (1988). Development and validation of brief measures of positive and negative affect: The PANAS scales. Journal of Personality and Social Psychology, 54, 1063-1070.
Whitley, B. E. Jr., & Lee, S. E. (2000). The relationship of authoritarianism and related constructs to attitudes towards homosexuality. Journal of Applied Social Psychology, 30, 144-170.