North East Association for Institutional Research November 4
180
North East Association for Institutional Research November 4 - 7, 2006, Philadelphia, PA 33rd Conference Proceedings
-
Upload
khangminh22 -
Category
Documents
-
view
0 -
download
0
Transcript of North East Association for Institutional Research November 4

North East Association for Institutional Research
November 4 - 7, 2006, Philadelphia, PA
33rd Conference Proceedings

Dear Colleagues: What follows are the Proceedings for the 33rd Annual Conference of the North East Association for Institutional Research (NEAIR) which was held in Philadelphia, Pennsylvania. The Proceedings include a variety of papers and presentations from that conference. We hope they will serve as a reference and resource for future professional endeavors. Congratulations go to Sally Lesik, winner of this year’s Best Paper Award, and Michelle Appel and Chad Muntz, winners of this year’s Best IR Report/Practitioner Paper Award. “Thanks” go to all who worked so hard to make the Philadelphia Conference the success that it was. The program as well as the central site attracted over 300 attendees, a record for NEAIR. Particular thanks go to Nancy Ludwig who served as the conference’s Program Chair. Nancy spent countless hours on all aspects of the program to insure that it was the best that it could be – securing stimulating and thought provoking keynote speakers; to reviewing the proposals; to making sure there was broad participation and something of interest for each of the different segments of Higher Education. Thanks also go out to Ellen Peters (Associate Program Chair) who assisted Nancy in carrying out these duties. Also, special thanks go out to Allison Walters who served as Local Arrangements Chair for this conference. She was able to solicit and secure computer and technical support from Drexel University’s Le Bow College of Business resulting in significant savings to the association and enabling computer-aided workshops to be held on-site. In addition, she worked tirelessly with the hotel and volunteers to make sure our presenters and attendees had an enjoyable experience in all aspects of their stay. A heartfelt “Thank You” goes to Beth Simpson, who not only provides administrative services to NEAIR but also provides substantial support to the President, Program Chair, and Local Arrangements Chair by making sure all bases are covered and attended to numerous details. Beth also serves as the cheerful and helpful welcoming committee when you arrive at the conference registration desk. A large “Thank You” goes to Cindy Clarke, Pre-conference Workshops Coordinator, for the great job she did in Philadelphia along with lots of good luck on her position as Program Chair for the upcoming NEAIR conference in New Brunswick. I would like to acknowledge the fine work of Roland Hall and Annemarie McMullin for making sure the association and conference websites were getting our message out in a timely and accurate way.
i

“Many Thanks” also go to Tim Walsh, Vendor Coordinator, for coordinating the participation of a fine group of vendors at the conference. “Thank You” Cathy Alvord, Publications Chair, for your excellent work throughout the year as well as your work on these Proceedings. Also appreciated are the valuable contributions of those who volunteered their time to review papers (Marilyn Blaustein) and poster submissions (Kathy Keenan) as well as staff the registration desk and lead a dinner groups. “Thank you” to the Evaluation Coordinators (Mindy Wang and Shu-Ling Chen). And last, but not least, “Thank You” to all members of the 2005/2006 Steering Committee for your help and support in the conference planning process and other association business throughout the year. I look forward to seeing you all in New Brunswick in 2007!
Marge Wiseman Marge Wiseman President, NEAIR 2005 - 2006
ii

NEAIR Leadership Team 2005 - 2006
OFFICERS: President Marjorie Wiseman President-Elect Martha Gray Recording Secretary (’05-’08) Kevin B. Murphy Treasurer (’05 -’08) Heather A. Kelly STEERING COMMITTEE MEMBERS: Past President Michelle Appel Program Chair Nancy Ludwig Local Arrangements Chair Allison Walters Publications Chair (Philly Conf) Catherine Alvord Member-At-Large (’04-‘06) Julie Alig Member-At-Large (’04-‘06) Phyllis Fitzpatrick Member-At-Large (’04-’07) Alan Sturtz Member-At-Large (’05-’07) Linda Junker Member-At-Large (’05-’08) Jeff Himmelberger Member-At-Large (’05-’08) Heather Roscoe ADMINISTRATIVE COORDINATOR (ex-officio) Beth Simpson
Committees of the NEAIR Steering Committee
Program (Standing Committee) Professional Development Service (Standing Comm.) Chair Chair Martha Gray Associate Program Chair Ellen Peters Pre-Conf Workshop Cord (Philly) Cindy Clarke Best Paper Coordinator Marilyn Blaustein Member (’04-’06) Julie Alig Poster Session Coordinator Kathleen Keenan Member (’04-’06) Jessica Shedd Evaluation Coordinators Mindy Wang Member (’05-’07) Emily Dibble Shu-Ling Chen Member (’05-’08) Jeff Himmelberger Local Arrangements (Standing Committee) Publications (Standing Committee) Chair [LAC] Allison Walters Chair Catherine Alvord Audio Visual Coordinator Drexel university Chair-Elect Jean Marriott Dinner Groups Louise Murray Vendor Coordinator Tim Walsh Site Selection ’05-’06 (Standing Committee) Chair Martha Gray Grants (Ad Hoc Committee) Member Heather Kelly Chair Phyllis Fitzpatrick Member Michael Dooris Chair-Elect Heather Roscoe Member Phyllis Fitzpatrick Member (’04-’06) John Pryor Member Kathleen Keenan Member (’05-’07) Louise Murray Immediate Past Chair (ex officio) Ellen Peters Web Advisory (Ad Hoc Committee) Chair Roland Hall Mentor (Ad Hoc Committee) Conference Web Coord. Annemarie McMullin Chair Alan Sturtz Member (ex officio) Beth Simpson Chair-Elect Linda Junker Program Chair (ex-officio) Nancy Ludwig LAC(ex-officio) Allison Walters Nomination (Standing Committee) Chair Michelle Appel Member Fred Cohen Member Qing Mack Member Eleanor Swanson PLEASE NOTE: Only NEAIR officers, the elected steering committee Members-At-Large, the Local Arrangements
Chair, the Program Chair, and the Publications Chair may vote. As of 7/20/2006
iii

Table of Contents Acknowledgment............................................................................................................................1 The Pluses and Minuses of Policy Analysis: Predicting the Impact of a New Grading Policy Michelle Appel, Chad Muntz**………………………………….…………….………...........2 The Qualitative Narrative Report of the Pennsylvania State System of Higher Education’s System Accountability Program, 2005-2006 Thomas Armstrong, Lou Bohl-Fabrian, Jim Moran, Khalil Yazdi…………….……….........20 Toward a More Realistic Approach to Community College Performance Assessment: An Analysis of the Environmental Correlates of Maryland Two-Year School Student Outcomes, 2000-2005 Karl Boughan………...............................................................................................................30 Considering Leaving Before They’ve Even Started: An Examination of Freshmen at Risk for Transfer Yiting Chang, Nava Lerer, Kathryn Talley………………………………………………….49 Challenging Opportunities for Institutional Researchers to Excel in Assessment Anne Marie Delaney…………………………………………………………………………57 A Thumb on the Scale? Ability, Income, and Degree Completion in a Public University Michael J. Dooris, Marianne Guidos…………………………………………………….…..66 Predicting Academic Success in the First-Year Chad L. May…………………………………………………………………………………76 In Their Own Words: Effectiveness in Institutional Research William E. Knight……………………………………………………………………………85 Studying Student Learning at Two-Year and Four-Year Institutions with CCSSE and the NSSE William E. Knight, Corby A. Coperthwaite, Mary Ann Coughlin………………..………..103 Do Academic Integration Programs Have a Casual Impact on Student Retention? A Study of a Developmental Mathematics Course Using Discrete-Time Survival and Regression-Discontinuity Analysis Sally A. Lesik*………………………………………………….……………………….…117 Students and Sensitive Issues: Disclosing Sexual Orientation and Transgenderism Heather S. Roscoe, Dawn Geronimo Terkla………………………….………………….…127
iv

The Grass is Always Greener: Analyzing Stability and Change Over-Time in U.S. News’ Peer Assessment Survey Scores Kyle V. Sweitzer, J. Fredericks Volkwein………………………………………………….138 MDs and PhDs, EdDs and MBAs: Comparing Graduate Program Prestige Ratings Across Professional Schools Kyle V. Sweitzer………………………….……………………………………………..….146 Penn State’s First-Year Seminar in Business: Integrating Student Transition with the World of Business Kyle V. Sweitzer, Vicki L. Baker…......................................................................................157 The Impact of Financial Aid on Freshman Retention Mindy Wang…......................................................................................................................167 * Winner 2006 Best Paper ** Winner 2006 Best IR Report/Practitioner Paper
v

Acknowledgment
I am proud to present the NEAIR 33RD Annual Conference Proceedings that records research work compiled by our members and presented at the 2006 annual conference. This year, ten NEAIR Colleagues and their co-authors submitted 13 conference papers to be included in the Proceedings. In addition to these research papers, practitioner papers and presentations are available in the “Members Only” portion of the NEAIR website. Four colleagues joined me to form an editorial committee – Eileen Driscoll, Cornell University; Jean Marriott, Carroll Community College; Alan Sturtz, Connecticut State University System; and Stephen Thorpe, Widener University. The committee members reviewed the submitted papers, and provided friendly comments and suggestions to the authors regarding language and clarity if necessary. I would like to express my gratitude to my colleagues who graciously volunteered their time to the review thus ensuring a professional Proceedings publication. Catherine Alvord, Publications Chair Cornell University
1

THE PLUSES AND MINUSES OF POLICY ANALYSIS:1 PREDICTING THE IMPACT OF A NEW GRADING POLICY2
Michelle Appel
Chad Muntz Office of Institutional Research and Planning
University of Maryland
Executive Summary
The purpose of this study was to better understand the impact of the new weighted plus/minus grading calculation on undergraduate graduation rates and course availability. Grades from the fall 2002 cohort of incoming undergraduate students were used to determine the impact on probation and dismissal with the accompanying impact on graduation rates. Additionally, all undergraduate courses assigning the C- grade during the 2003-04 and 2004-05 Academic Years were examined to understand course availability. Findings Impact on Graduation Rates and Cumulative GPAs:
Although semester GPA changes appear to have a relatively balanced impact (similar numbers of students positively and negatively impacted) over the long term, most students’ cumulative GPAs are affected negatively. After seven semesters, only the band of students with a GPA of 3.9 or above had a majority of the students who would be positively impacted by the policy change. The vast majority of students at all other GPA ranges would be hurt by the policy change.
Disciplinary actions would increase under the new policy. These findings are consistent with another analysis conducted by the Office of the Registrar, November 2003. The impact on disciplinary actions, particularly dismissals, also appears to be amplified when examined over time rather than for a single semester. Raising a cumulative GPA appears to be more difficult under the new plus/minus weighting system.
The number of dismissals more than doubled each semester after the first year, impacting the number of students who could persist to graduation. This could lower the graduation rate by approximately 2 percentage points if all of these dismissed students would have continued through graduation.
The potential impact for dismissal under the new grading system is more pronounced for minority students (particularly because the base is small). African American dismissals could decrease the graduation rate by as many as 7 percentage points. Hispanic rates could decrease by 5 percentage points.
1 NEAIR 2006 Best IR Practitioner Award. 2 This paper was presented to demonstrate a methodological approach to be used when predicting the impact of a new policy. Some results contained within this paper have been modified to mask individuals or units who may be impacted; this is intended to allow the presenters to demonstrate the process while protecting the confidentiality of units within the University.
2

Eliminating the C-, D+, and D- grades could reduce the impact on African American graduation rates to a 5-point decline. The decline in the overall graduation rate would not, however be impacted, as these grades make up a relatively small portion of the grade distribution.
Impact on Course Demand and Its Financial Implications:
Course Demand may change dependent on the acceptance of minus grades for fulfilling CORE and major requirements. If a minus grade is not deemed acceptable, this will increase course repeats, putting additional stress on course availability.
As many as 40 additional CORE sections per semester may be required to accommodate the increased demand. Additional course section units (as many as 40 more) may be required to accommodate major requirements or other prerequisites. Current waitlists may make this more pronounced.
If this were additional demand (versus a shift from demand for other courses) this could cost the University upwards of $320,000 per fiscal year at $4,000 per section.
Many CORE courses are held in large lecture halls. Space availability and utilization constraints may impact the University’s ability to offer additional course sections.
Limitations This study likely represents a worst-case scenario.
• All analyses assume that student behavior will not change under the new grading weights and that faculty will continue to utilize the plus minus system as they have in the past.
• The calculations on graduation rate impact assume that the additional dismissals would persist to graduation; this may overstate the impact on the graduation rates.
• The replacement of repeat course grades within the first 24 credits has not been incorporated into the semester GPA calculation.
• The calculations on course demand and availability examine the C-, assuming that a C (2.0) is the minimum passing grade. Although this is not a CORE requirement per se, it is often a requirement for pre-requisite courses and courses that simultaneously fulfill both major and CORE requirements.
• The course demand model assumes that all students achieving the C- would attempt to take the same course again; major changes, student motivation, and course repeat limits may combine to lower the actual demand.
• Course demand calculations combined partial demand for sections into a total that may overstate the number of sections that would actually be required. They also did not account for potential shifts in demand that may occur due to the potential increased repeat behavior.
• Several additional areas of impact exist that were not considered in this analysis, including the impact on graduate students, implications for Financial Aid recipients, and the impact on students applying to graduate programs.
Purpose
On December 12, 2005, the University Senate passed a policy assigning graduated numerical values to plus and minus grades. Prior to this policy, the University of Maryland
3

assigned the same weight to all grades with the same letter, regardless of the plus or minus values assigned by the faculty. The purpose of the current analysis was to identify any potential financial and academic impacts for the University of Maryland and its undergraduate students, given the new plus/minus grade weights. Introduction
Reports from Eastern Kentucky University (2003), North Carolina State University (1997), Georgia State University (1998), Western Illinois University (2005), and Wake Forest University (1997) were gathered to examine the research on plus/minus grading. A short summary of the general findings is presented here as a context in which to understand this impact analysis.
The positives of plus/minus grading systems identified in these studies were: the incentive to work hard all term; the rewards for students at multiple levels; the ability to better distinguish the quality of graduates; an increase in grading accuracy; and a lack of overall GPA change at the institution for any given semester. The use of plus/minus has been promoted as a potential aid for graduate school admissions and a tool to help committees distinguish between students.
The negatives identified were: the decrease in the number of 4.0 graduates, an increased negative impact on lower GPAs, a negative impact on 3.5 - 4.0 students (typically scholarship students), increased grade appeals, and increased grade changes. One study included results of a survey, which indicated that students perceived the potential for loss of scholarship or other merit-based aid as a negative impact.
One area still debated is the effect on grade inflation. Overall, many studies reported no overall institutional GPA change. However, it was noted that these studies did not address the inherent grading processes – which may not always be transparently objective – weakening their ability to conclusively address grade inflation in general.
An area unaddressed by these studies was the cumulative impact on the student body. Many studies utilized a point-in-time analysis of semester grades. Additionally, financial implications beyond administrative costs to the institution were not addressed. Method
There were two types of analyses conducted to investigate the impact of plus/minus grades – the first focused on the new student cohort of fall 2002, while the second explored the potential impact of C- grades on course demand. The fall 2002 cohort was used to investigate: 1) the change in student cumulative GPAs, and 2) the impact of C- on disciplinary actions of probation and dismissal for new freshmen.
4

Graduation Rate and Cumulative GPA:
For all students that entered in fall 2002, both new freshman and new transfers, semester GPAs and Cumulative GPAs were re-calculated based on the new weights. Grades from all applicable UM courses (including those taken in the summer or taken prior to fall 2002) were included in the calculation of the GPA. Courses were deemed applicable if they met the following criterion: regular grading method (e.g., not pass/fail or audit), officially enrolled course, completed course (i.e., not withdrawn or incomplete), and designation as applicable within the data warehouse (including applicable toward degree requirements); credit by exam and courses that are not official UM courses were eliminated from the analysis.
Cumulative and semester quality points were computed using the new weights passed by the Senate (A+=4.3, A=4, A-=3.7, B+=3.3, etc.). These quality points were then divided by cumulative and semester attempted credits (based on the credits from included courses) to determine the re-calculated GPA. Additional analyses eliminated the C-, D+, and D- grades by assigning the whole number quality points associated with the letter grade.
Academic actions for each semester were then re-computed. Students with a cumulative GPA of 2.0 or better were deemed in good standing. Those students with a cumulative GPA below 2.0 were then assigned the academic action of either probation or dismissal, depending on their prior and semester academic performance: a) students who were previously in good standing were assigned probation for their first semester with a cumulative GPA below 2.0; b) students with over 60 credits who were previously on probation were assigned to the dismissal category; c) students with under 60 credits who were previously on probation were assigned to dismissal if their semester GPA was below 2.0 or to continuing probation if their semester GPA was 2.0 or better. Course Demand:
To model course demand, the unit of analysis was the course section. All courses in which any student earned a grade of C- during the 2003-04 and 2004-05 academic years were examined to determine the potential impact of C- grades on course demand. Analyses examined the number of C- grades, the length of the course waitlist (if any), and the type of course (e.g., CORE) to understand the potential impact of course repeats due to C- grades.
To determine the demand generated by students repeating courses in which they earned a C-, potential additional section units were calculated. The number of C- grades earned was divided by the average section size for the course to determine a section unit for that course. Additional analyses included the number of students on the waitlist by adding them to the numerator. These were then summed to calculate the total section units required:
Total Section Units C- Only = Σ (# of C- grades / average course section size). Total Section Units C-+ Waitlist = Σ ([# of C- grades + waitlist]/ average course section size)
5

Assumptions/Methodological Caveats:
This analysis assumes that student behavior will not change under the new grading system. Inherent in the calculations on graduation rate impact is the assumption that the additional dismissals would persist to graduation; this may overstate the impact on the graduation rates. Additionally, the replacement of repeat course grades within the first 24 credits has not been incorporated into the semester GPA calculation (though it has, to the best of our knowledge, been accounted for in the cumulative GPA). The dismissals for spring 2003 were calculated off of a 2.0; the actual dismissals were calculated with a slightly lower GPA during implementation of the new Probation and Dismissal policy.
The calculations on course demand and availability may simplify the complex nature of student course selection and availability. They examine the C-, assuming that a C (2.0) is the minimum passing grade. Although this is not a CORE requirement per se, it is often a requirement for pre-requisite courses and courses that simultaneously fulfill both major and CORE requirements. For example, the Criminal Justice major requires MATH 111 or higher to be completed with a C or better; CJIS majors must also complete supporting sequence courses, frequently including CORE courses such as AMST 201, with a C or better.
These analyses also combined partial demand for sections (e.g., the need for .25 section units) into an overall total. To the extent that small course units (such as .1 section units) would not necessitate an additional section, this may overstate the number of sections that would actually be added. However combining multiple large section units (such as a series of three courses, each requiring .8 section units that may add to 2.4) may understate the need. The model assumes that, on balance, summing course units provides a reasonably accurate estimate of demand. Additionally, currently existing waitlists may be exacerbated by the increased demand. Results Impact on Graduation Rates and Cumulative GPA:
1) Changes in Semester GPAs under the new policy (versus the actual semester GPAs under the old policy) appear to evenly impact students, with similar numbers of negative change and positive change. In any given semester, there are many students both helped and hurt by the policy change when examining their semester GPA. See Appendix, Analysis 1a.
2) Over the long term, almost all cumulative GPAs are affected negatively. The lower the
cumulative GPA, the higher percentage of students affected negatively. After seven semesters, only the students with GPAs of 3.9 or above had a majority of students who had been helped by the policy change. The vast majority of students at all other GPA ranges were hurt by the policy change. See Appendix, Analysis 1a. Eliminating the C-, D+, and D- grades does not appreciably change this phenomenon; see Appendix, Analysis1b.
6

3) Disciplinary actions would likely increase under the new policy. These findings are consistent with another analysis conducted by the Office of the Registrar, November 2003. See Appendix, Analysis 2.
Because probation is more sensitive to single semester changes, while dismissal is more sensitive to cumulative academic performance, dismissals are more likely to be adversely impacted by the new policy. Over the long term, raising a cumulative GPA seems to be more difficult under the plus/minus system. The number of dismissals more than doubled each semester. This could lower the graduation rate by 2 percentage points, assuming all of these students would have continued to graduation. The impact of the new policy on dismissals is likely to differentially impact minorities. The increased number of African-American dismissals could lower that graduation rate by 7 percentage points; additional Hispanic dismissals could lower the graduation rate by 5 percentage points. Eliminating the C-, D+, and D- grades could mitigate the impact on African American and graduation rates but would not likely reduce the impact on the overall graduation rate or on the Hispanic graduation rate. Under this alternative, the African American graduation rate could decline by 5 percentage points rather than 7. Although it would intuitively seem that this would have a more significant impact, the small number of C- and D-grades, relative to the universe of all grades, makes it difficult for this alternative to have a large impact. This alternative also negates any positive impact that these students may derive from the D+ grades, although the number of these is minimal.
4) Over 1,000 students who began in fall 2002, predominantly those who began as New
Transfers, have already graduated; 1% of these students would not have had the required 2.0 for graduation under the new policy. Should C-, D+, and D- grades be eliminated, only 0.5% of graduates would be impacted.
Impact on Course Demand:
1) Course Demand may change dependent on the acceptance of minus grades. Under the
current policy, where all letter grades are given the same weight, a “minus” grade is considered acceptable for completion of CORE and major requirements. If the minus grade is no longer accepted for these requirements (i.e., the requirement is the whole number numeric equivalent) course repeats may increase.
2) Each semester, more than 2,500 grades of C- are given in about 700 courses. The new
policy could require repetition of this course work depending upon major requirements. Overall, this yields a cumulative course repeat impact of about 100 Section Units each semester. The demand may be absorbed by already existing capacity in those courses without waitlists.
3) If the same analysis considers only courses that typically have waitlists, there is still
appreciable demand from students required to repeat the course. The total section unit
7

demand generated by C- students for courses with a waitlist is about 80 section Units each semester. This does not include already existing demand reflected in the waitlist.
4) Students earning a C- yielded demand of about 40 additional section units needed each
semester in CORE courses. Current seat availability and course waitlists may impact this demand. Because many CORE courses are held in large lecture halls, space availability and utilization constraints may also impact the University’s ability to offer additional course sections.
5) The potential course demand created by the minus grades could have significant financial implications for the University, if additional sections were required. At a minimum, current resource allocation may be impacted because the need to repeat courses may alter already existing course taking patterns, shifting or changing the demand patterns that currently exist. If this were additional demand (versus a shift from demand for other courses) this could cost the University upwards of $320,000 per fiscal year (calculated at $4,000 per section for 40 sections per semester).
Limitations/Criticism
• This analysis considered only the impact on the undergraduates and undergraduate courses. Similar analysis of the impact on graduate students and courses would be required to fully understand the impact on all students at the University.
• This analysis was limited in its focus. Additional areas of impact to students include Financial Aid (e.g., would recipients of merit based aid remain eligible) and consideration for graduate school (e.g., would the student’s merit in the application process be impacted) as well as many others.
Graduation Rate Model Limitations:
• The model assumes that student behavior will not change. One purpose of plus/minus grades was to motivate all students in the grade distribution to work hard all semester long. It might be posited that C- students will rise to the expectation of C grades.
• Inherent in the calculations for changes in graduation rates is the assumption that the additional dismissals would persist to graduation; this may overstate the impact on the graduation rates.
• The replacement of repeat course grades within the first 24 credits has not been incorporated into the semester GPA calculation (though it has, to the best of our knowledge, been accounted for in the cumulative GPA).
• The dismissals for spring 2003 were calculated off of a 2.0; the actual dismissals were calculated with a slightly lower GPA during implementation of the new Probation and Dismissal policy.
Course Demand Model Limitations:
• The sum of Course Units from C- students are made up of small fractions that could be absorbed next term in the non-wait-list and wait-list courses.
8

• C- Students may shift demand by requiring more sections offered in core or lower-level courses. If so, demand for upper level and sequential courses may be lower, which will allow those instructors to switch their teaching load.
• To the extent that the requirement is a D (1.0) rather than a C, this methodology may overstate demand.
Appendix
Analyses 1.A Tables: Effect of new policy on Cumulative GPAs for New Fall 2002 Students. * Note: Percent bars may not total 100% because students without GPA changes are not represented with a bar.
Impact of Fall 2002 Cumulative GPA Change Under New Policy
0.0%20.0%40.0%60.0%80.0%
100.0%
2.0 an
d Belo
w
2.1 - 2
.2
2.3 - 2
.4
2.5 - 2
.6
2.7 - 2
.8
2.9 - 3
.0
3.1 - 3
.2
3.3 - 3
.4
3.5 - 3
.6
3.7 - 3
.8
3.9 an
d High
er
Original GPA Ranges
% w
/ a P
ositi
ve o
r N
egat
ive
Cha
nge
to
thei
r Cur
rent
GPA
Pos%Neg%
Impact of Fall 2002 Cumulative GPA Change Under New Policy
0100200300400500600700
2.0 and
Below
2.1 - 2
.2
2.3 - 2
.4
2.5 - 2
.6
2.7 - 2
.8
2.9 - 3
.0
3.1 - 3
.2
3.3 - 3
.4
3.5 - 3
.6
3.7 - 3
.8
3.9 and
High
er
Original GPA Ranges
Num
ber w
/ a P
ositi
ve
or N
egat
ive
Cha
nge
to
thei
r Cur
rent
GPA
NoPosNeg
9
Impact of Spring 2003 Cumulative GPA Change Under New Policy
0.0%20.0%40.0%60.0%80.0%
100.0%
2.0 an
d Belo
w
2.1 - 2
.2
2.3 - 2
.4
2.5 - 2
.6
2.7 - 2
.8
2.9 - 3
.0
3.1 - 3
.2
3.3 - 3
.4
3.5 - 3
.6
3.7 - 3
.8
3.9 an
d High
er
Original GPA Ranges
% w
/ a P
ositi
ve o
r N
egat
ive
Cha
nge
to th
eir
Cur
rent
G
PA
Pos%Neg%
Impact of Spring 2003 Cumulative GPA Change Under New Policy
0100
200300400500
2.0 an
d Below
2.1 - 2
.2
2.3 - 2
.4
2.5 - 2
.6
2.7 - 2
.8
2.9 - 3
.0
3.1 - 3
.2
3.3 - 3
.4
3.5 - 3
.6
3.7 - 3
.8
3.9 an
d Highe
r
Original GPA Ranges
Num
ber w
/ a P
ositi
ve o
r N
egat
ive
Cha
nge
to th
eir
Cur
rent
GPA No
PosNeg
Impact of Fall 2003 Cumulative GPA Change Under New Policy
0.0%20.0%40.0%60.0%80.0%
100.0%
2.0 an
d Belo
w
2.1 - 2
.2
2.3 - 2
.4
2.5 - 2
.6
2.7 - 2
.8
2.9 - 3
.0
3.1 - 3
.2
3.3 - 3
.4
3.5 - 3
.6
3.7 - 3
.8
3.9 an
d High
er
Original GPA Ranges
% w
/ a P
ositi
ve o
r N
egat
ive
Cha
nge
to th
eir
Cur
rent
GPA
Pos%Neg%
10

Impact of Fall 2003 Cumulative GPA Change Under New Policy
0100200300400500
2.0 an
d Below
2.1 - 2
.2
2.3 - 2
.4
2.5 - 2
.6
2.7 - 2
.8
2.9 - 3
.0
3.1 - 3
.2
3.3 - 3
.4
3.5 - 3
.6
3.7 - 3
.8
3.9 an
d Highe
r
Original GPA Ranges
Num
ber w
/ a P
ositi
ve o
rN
egat
ive
Cha
nge
to
thei
r Cur
rent
GPA
NoPosNeg
Impact of Spring 2004 Cumulative GPA Change Under New Policy
0.0%20.0%40.0%60.0%80.0%
100.0%
2.0 an
d Belo
w
2.1 - 2
.2
2.3 - 2
.4
2.5 - 2
.6
2.7 - 2
.8
2.9 - 3
.0
3.1 - 3
.2
3.3 - 3
.4
3.5 - 3
.6
3.7 - 3
.8
3.9 an
d High
er
Original GPA Ranges
% w
/ a P
ositi
ve o
r N
egat
ive
Cha
nge
to
thei
r Cur
rent
GPA
Pos%Neg%
Impact of Spring 2004 Cumulative GPA Change Under New Policy
0
100
200
300
400
2.0 an
d Below
2.1 - 2
.2
2.3 - 2
.4
2.5 - 2
.6
2.7 - 2
.8
2.9 - 3
.0
3.1 - 3
.2
3.3 - 3
.4
3.5 - 3
.6
3.7 - 3
.8
3.9 an
d Highe
r
Original GPA Ranges
Num
ber w
/ a P
ositi
ve
or N
egat
ive
Cha
nge
toth
eir C
urre
nt G
PA
NoPosNeg
11

Impact of Fall 2004 Cumulative GPA Change Under New Policy
0.0%20.0%40.0%60.0%80.0%
100.0%
2.0 an
d Belo
w
2.1 - 2
.2
2.3 - 2
.4
2.5 - 2
.6
2.7 - 2
.8
2.9 - 3
.0
3.1 - 3
.2
3.3 - 3
.4
3.5 - 3
.6
3.7 - 3
.8
3.9 an
d High
er
Original GPA Ranges
% w
/ a P
ositi
ve o
r N
egat
ive
Cha
nge
to
thei
r Cur
rent
GPA
Pos%Neg%
Impact of Fall 2004 Cumulative GPA Change Under New Policy
050
100150200250300350
2.0 an
d Below
2.1 - 2
.2
2.3 - 2
.4
2.5 - 2
.6
2.7 - 2
.8
2.9 - 3
.0
3.1 - 3
.2
3.3 - 3
.4
3.5 - 3
.6
3.7 - 3
.8
3.9 an
d Highe
r
Original GPA Ranges
Num
ber w
/ a P
ositi
ve
or N
egat
ive
Cha
nge
t oth
eir C
urre
nt G
PA
NoPosNeg
Impact of Spring 2005 Cumulative GPA Change Under New Policy
0.0%20.0%40.0%60.0%80.0%
100.0%
2.0 an
d Belo
w
2.1 - 2
.2
2.3 - 2
.4
2.5 - 2
.6
2.7 - 2
.8
2.9 - 3
.0
3.1 - 3
.2
3.3 - 3
.4
3.5 - 3
.6
3.7 - 3
.8
3.9 an
d High
er
Original GPA Ranges
% w
/ a P
ositi
ve o
r N
egat
ive
Cha
nge
to
thei
r Cur
rent
GPA
Pos%Neg%
12

Impact of Spring 2005 Cumulative GPA Change Under New Policy
050
100150200250300350
2.0 an
d Below
2.1 - 2
.2
2.3 - 2
.4
2.5 - 2
.6
2.7 - 2
.8
2.9 - 3
.0
3.1 - 3
.2
3.3 - 3
.4
3.5 - 3
.6
3.7 - 3
.8
3.9 an
d Highe
r
Original GPA Ranges
Num
ber w
/ a P
ositi
ve
or N
egat
ive
Cha
nge
t oth
eir C
urre
nt G
PA
NoPosNeg
Impact of Fall 2005 Cumulative GPA Change Under New Policy
0.0%20.0%40.0%60.0%80.0%
100.0%
2.0 an
d Belo
w
2.1 - 2
.2
2.3 - 2
.4
2.5 - 2
.6
2.7 - 2
.8
2.9 - 3
.0
3.1 - 3
.2
3.3 - 3
.4
3.5 - 3
.6
3.7 - 3
.8
3.9 an
d High
er
Original GPA Ranges
% w
/ a P
ositi
ve o
r N
egat
ive
Cha
nge
to
thei
r Cur
rent
GPA
Pos%Neg%
Impact of Fall 2005 Cumulative GPA Change Under New Policy
050
100150200250300350
2.0 and
Below
2.1 - 2
.2
2.3 - 2
.4
2.5 - 2
.6
2.7 - 2
.8
2.9 - 3
.0
3.1 - 3
.2
3.3 - 3
.4
3.5 - 3
.6
3.7 - 3
.8
3.9 and
High
er
Original GPA Ranges
Num
ber w
/ a P
ositi
ve
or N
egat
ive
Cha
nge
to th
eir C
urre
nt G
PA
NoPosNeg
13

Analyses 1.B Tables: Effect of ALTERNATE new policy on Cumulative GPAs for New Fall 2002 Students (2.0 for C- and all Ds have a 1.0) * Note: Percent bars may not total 100% because students without GPA changes are not represented with a bar.
Impact of Fall 2002 Cumulative GPA Change Under Alternate New Policy
0.0%20.0%40.0%60.0%80.0%
100.0%
2.0 an
d Belo
w
2.1 - 2
.2
2.3 - 2
.4
2.5 - 2
.6
2.7 - 2
.8
2.9 - 3
.0
3.1 - 3
.2
3.3 - 3
.4
3.5 - 3
.6
3.7 - 3
.8
3.9 an
d High
er
Original GPA Ranges
% w
/ a P
ositi
ve o
r N
egat
ive
Cha
nge
to
thei
r Cur
rent
GPA
Pos%Neg%
Impact of Fall 2002 Cumulative GPA Change Under Alternate New Policy
0100200300400500600700
2.0 and
Below
2.1 - 2
.2
2.3 - 2
.4
2.5 - 2
.6
2.7 - 2
.8
2.9 - 3
.0
3.1 - 3
.2
3.3 - 3
.4
3.5 - 3
.6
3.7 - 3
.8
3.9 and
High
er
Original GPA Ranges
Num
ber
w/ P
ositi
ve o
r N
egat
ive
Chan
ge to
thei
r Cu
rren
t GP
A
NoPosNeg
Impact of Spring 2003 Cumulative GPA Change Under Alternate New Policy
0100
200300400500
2.0 an
d Below
2.1 - 2
.2
2.3 - 2
.4
2.5 - 2
.6
2.7 - 2
.8
2.9 - 3
.0
3.1 - 3
.2
3.3 - 3
.4
3.5 - 3
.6
3.7 - 3
.8
3.9 an
d Highe
r
Original GPA Ranges
Num
ber
w/ P
ositi
ve o
r N
egat
ive
Cha
nge
to th
eir
Cur
rent
GPA No
PosNeg
14

Impact of Fall 2003 Cumulative GPA Change Under Alternate New Policy
0.0%20.0%40.0%60.0%80.0%
100.0%
2.0 an
d Belo
w
2.1 - 2
.2
2.3 - 2
.4
2.5 - 2
.6
2.7 - 2
.8
2.9 - 3
.0
3.1 - 3
.2
3.3 - 3
.4
3.5 - 3
.6
3.7 - 3
.8
3.9 an
d High
er
Original GPA Ranges
% w
/ a P
ositi
ve o
r N
egat
ive
Cha
nge
to th
eir
Cur
rent
GPA
Pos%Neg%
Impact of Fall 2003 Cumulative GPA Change Under Alternate New Policy
0100200300400500
2.0 an
d Below
2.1 - 2
.2
2.3 - 2
.4
2.5 - 2
.6
2.7 - 2
.8
2.9 - 3
.0
3.1 - 3
.2
3.3 - 3
.4
3.5 - 3
.6
3.7 - 3
.8
3.9 an
d Highe
r
Original GPA Ranges
Num
ber w
/ Pos
itive
or
Neg
ativ
e C
hang
e to
th
eir C
urre
nt G
PA
NoPosNeg
Impact of Spring 2004 Cumulative GPA Change Under Alternate New Policy
0.0%20.0%40.0%60.0%80.0%
100.0%
2.0 an
d Belo
w
2.1 - 2
.2
2.3 - 2
.4
2.5 - 2
.6
2.7 - 2
.8
2.9 - 3
.0
3.1 - 3
.2
3.3 - 3
.4
3.5 - 3
.6
3.7 - 3
.8
3.9 an
d High
er
Original GPA Ranges
% w
/ a P
ositi
ve o
r N
egat
ive
Cha
nge
to
thei
r Cur
rent
GPA
Pos%Neg%
15

Impact of Spring 2004 Cumulative GPA Change Under Alternate New Policy
0
100
200
300
400
2.0 an
d Below
2.1 - 2
.2
2.3 - 2
.4
2.5 - 2
.6
2.7 - 2
.8
2.9 - 3
.0
3.1 - 3
.2
3.3 - 3
.4
3.5 - 3
.6
3.7 - 3
.8
3.9 an
d Highe
r
Original GPA Ranges
Num
ber w
/ a P
ositi
ve
or N
egat
ive
Cha
nge
toth
eir C
urre
nt G
PA
NoPosNeg
Impact of Fall 2004 Cumulative GPA Change Under Alternate New Policy
0.0%20.0%40.0%60.0%80.0%
100.0%
2.0 an
d Belo
w
2.1 - 2
.2
2.3 - 2
.4
2.5 - 2
.6
2.7 - 2
.8
2.9 - 3
.0
3.1 - 3
.2
3.3 - 3
.4
3.5 - 3
.6
3.7 - 3
.8
3.9 an
d High
er
Original GPA Ranges
% w
/ a P
ositi
ve o
r N
egat
ive
Cha
nge
to
thei
r Cur
rent
GPA
Pos%Neg%
Impact of Fall 2004 Cumulative GPA Change Under Alternate New Policy
050
100150200250300350
2.0 an
d Below
2.1 - 2
.2
2.3 - 2
.4
2.5 - 2
.6
2.7 - 2
.8
2.9 - 3
.0
3.1 - 3
.2
3.3 - 3
.4
3.5 - 3
.6
3.7 - 3
.8
3.9 an
d Highe
r
Original GPA Ranges
Num
ber w
/ a P
ositi
ve
or N
egat
ive
Cha
nge
toth
eir C
urre
nt G
PA
NoPosNeg
16

Impact of Spring 2005 Cumulative GPA Change Under Alternate New Policy
0.0%20.0%40.0%60.0%80.0%
100.0%
2.0 an
d Belo
w
2.1 - 2
.2
2.3 - 2
.4
2.5 - 2
.6
2.7 - 2
.8
2.9 - 3
.0
3.1 - 3
.2
3.3 - 3
.4
3.5 - 3
.6
3.7 - 3
.8
3.9 an
d High
er
Original GPA Ranges
% w
/ a P
ositi
ve o
r N
egat
ive
Cha
nge
to
thei
r Cur
rent
GPA
Pos%Neg%
Impact of Spring 2005 Cumulative GPA Change Under Alternate New Policy
050
100150200250300350
2.0 an
d Below
2.1 - 2
.2
2.3 - 2
.4
2.5 - 2
.6
2.7 - 2
.8
2.9 - 3
.0
3.1 - 3
.2
3.3 - 3
.4
3.5 - 3
.6
3.7 - 3
.8
3.9 an
d Highe
r
Original GPA Ranges
Num
ber w
/ a P
ositi
ve
or N
egat
ive
Cha
nge
toth
eir C
urre
nt G
PA
NoPosNeg
Impact of Fall 2005 Cumulative GPA Change Under Alternate New Policy
0.0%20.0%40.0%60.0%80.0%
100.0%
2.0 an
d Belo
w
2.1 - 2
.2
2.3 - 2
.4
2.5 - 2
.6
2.7 - 2
.8
2.9 - 3
.0
3.1 - 3
.2
3.3 - 3
.4
3.5 - 3
.6
3.7 - 3
.8
3.9 an
d High
er
Original GPA Ranges
% w
/ a P
ositi
ve o
r N
egat
ive
Cha
nge
to
thei
r Cur
rent
GPA
Pos%Neg%
17

Impact of Fall 2005 Cumulative GPA Change Under Alternate New Policy
050
100150200250300350
2.0 and
Below
2.1 - 2
.2
2.3 - 2
.4
2.5 - 2
.6
2.7 - 2
.8
2.9 - 3
.0
3.1 - 3
.2
3.3 - 3
.4
3.5 - 3
.6
3.7 - 3
.8
3.9 and
High
er
Original GPA Ranges
Num
ber w
/ a P
ositi
ve
or N
egat
ive
Cha
nge
to th
eir C
urre
nt G
PA
NoPosNeg
Analyses 2 Table: Academic Dismissals
TOTAL DISMISSED BY RACE
Total American
Indian Asian African
American Hispanic White All
Other Total New Freshmen 4000 25 475 450 300 2500 250 Current Number Dismissed 200 5 25 75 25 75 25 % of New Freshmen Dismissed 5% 20% 5% 17% 8% 3% 10% New Policy 300 10 50 100 50 125 50 Change of New Policy 100 5 25 25 25 50 25 % Dismissed Under New Policy 8% 40% 11% 22% 17% 5% 20% Alt New Policy 250 10 40 90 40 100 40 Change of Alternate New Policy 50 5 15 15 15 25 15 % Dismissed Alt New Policy 6% 40% 8% 20% 13% 4% 16% NOTE: The numbers above are not actual - they are intended to illustrate the process and not actual UM results
18

Analysis 3 Tables: Section Unit Increases: Use of C- Grades and Approximate Impact (in Section Units) from Required Repeats
Total Section Units by Colleges Fall 03 Spring 04 Fall 04 Spring 05
College C- # Crs
AVG Sec
Sec Unit C-
# Crs
AVG Sec
Sec Unit C-
# Crs
AVG Sec
Sec Unit C-
# Crs
AVG Sec
Sec Unit
A 75 25 30.0 2.5 100 25 40.0 2.5 75 35 35.0 2.1 50 25 30.0 2.7 B 40 10 45.0 0.9 25 5 40.0 0.6 40 10 50.0 0.8 25 10 45.0 0.6 C 800 250 30.0 26.7 800 250 30.0 26.7 850 250 30.0 28.3 750 250 25.0 30.0 D 275 50 35.0 7.9 225 35 35.0 6.4 200 40 35.0 5.7 175 40 35.0 5.0 E 600 125 50.0 12.0 600 125 50.0 12.0 625 125 50.0 12.5 575 125 55.0 10.5 F 300 50 40.0 7.5 235 50 40.0 5.9 300 40 35.0 8.6 200 40 40.0 5.0 G 475 75 40.0 11.9 400 100 35.0 11.4 425 100 35.0 12.1 425 100 35.0 12.1 H 75 25 40.0 1.9 50 25 35.0 1.4 50 25 35.0 1.4 50 25 35.0 1.4 I 250 75 40.0 6.3 225 50 30.0 7.5 275 75 35.0 7.9 225 60 35.0 6.4 J 100 25 50.0 2.0 100 25 50.0 2.0 100 25 45.0 2.2 100 30 45.0 2.2 K 25 10 30.0 0.8 25 10 40.0 0.6 20 10 35.0 0.6 25 10 40.0 0.6 L 50 25 25.0 2.0 10 10 35 0.29 20 10 25.0 0.8 20 10 30.0 0.67
TOTAL (ALL) 3065 745 37.9 82.2 2795 710 38.3 77.4 2980 745 37.1 83.1 2620 725 37.5 76.2
C- is the number of students that received a C- grade. # CRS is the number of course that gave out a grade of C-. AVG Sec is the average section size of all section that had C- grades. Sec. Unit is the sum of each the impact of each C- student on each course. The impact was calculated by dividing the number of students who received a C- in a course by the section size of that course.
Impact of C- and Course Waitlist on Course Availability (in Section Units)
Total Section Units by Colleges Fall 03 Spring 04 Fall 04 Spring 05
College C- & Wait
# Crs
AVG Sec
Sec Unit
C- & Wait
# Crs
AVG Sec
Sec Unit
C- & Wait
# Crs
AVG Sec
Sec Unit
C- & Wait
# Crs
AVG Sec
Sec Unit
A 10 5 30.0 0.3 30 1 40.0 0.8 25 5 35.0 0.6 10 3 30.0 0.3 B 25 5 45.0 0.6 25 3 40.0 0.6 35 5 50.0 1.7 --- --- --- --- C 1300 125 30.0 43.3 1150 100 30.0 38.3 1300 125 30.0 51.1 1375 135 25.0 55.0 D 300 25 35.0 8.6 200 25 35.0 5.7 250 25 35.0 7.0 150 20 35.0 4.3 E 1200 75 50.0 24.0 1100 80 50.0 22.0 1100 75 50.0 29.1 1000 75 55.0 18.2 F 275 25 50.0 6.9 250 25 40.0 6.3 275 25 35.0 12.1 225 20 40.0 5.6 G 400 30 40.0 10.0 350 35 35.0 10.0 400 35 35.0 14.9 300 30 35.0 8.6 H 50 5 40.0 1.3 75 10 35.0 2.1 50 10 35.0 1.7 100 10 35.0 2.9 I 175 25 40.0 4.4 150 25 30.0 5.0 200 25 35.0 8.9 175 25 35.0 5.0 J 175 20 50.0 3.5 200 20 50.0 4.0 225 25 45.0 5.6 250 25 45.0 5.6 K 20 5 30.0 0.7 40 10 40.0 1.0 25 10 35.0 1.1 10 5 40.0 0.3 L 0 1 25.0 0.0 20 5 35.0 0.571 10 10 25.0 0.536 10 5 30.0 0.333
TOTAL (ALL) 3930 346 37.9 103.5 3590 339 38.3 96.4 3895 375 37.1 134.4 3605 353 36.8 106.0
C- & Wait is the number of students that received a C- grade combined with the waitlist. # CRS is the number of course with a waitlist that gave out a grade of C-. AVG Sec is the average section size of all sections. Sec. Unit is the sum of each the impact of each C- plus waitlist on each course. The impact was calculated by dividing the number of students.
19

THE QUALITATIVE NARRATIVE REPORT OF THE PENNSYLVANIA STATE SYSTEM OF HIGHER EDUCATION’S SYSTEM ACCOUNTABILITY PROGRAM
2005-20061
Thomas Armstrong Associate Director for Strategic Data Analysis and Reporting
Lou Bohl-Fabian Director of System Research and Analysis
Jim Moran Associate Vice Chancellor for Academic and Student Affairs
Khalil Yazdi Vice Chancellor for Information Technology
Office of the Chancellor Pennsylvania State System of Higher Education
Abstract: Annual performance reporting from Pennsylvania State System of Higher Education’s (PASSHE’s) System Accountability Program includes qualitative reporting and evaluations of the Narrative Assessment Statements and University Performance Plans. The 14 state-owned universities provide actions and outcomes in support of five Strategic Plan Goal Categories identified in the PASSHE’s Strategic Plan. Each university submission is evaluated according to six criteria including “lessons learned.” Qualitative performance reporting is linked with the Strategic Plan Goal Categories to move PASSHE and its universities in strategically desirable directions.
Introduction
Since 2001-02, the Pennsylvania State System of Higher Education (PASSHE) has published the annual System Accountability Report (Report) on institutional performance for the 14 universities separately and together as a System (Armstrong, et. al., 2004). A key rationale for producing performance-based reports is that higher education institutions are increasingly expected to provide evidence of accountability to stakeholders, including boards of trustees, accrediting agencies, legislators, students and families (Borden and Banta 1994).
As is the case with the PASSHE Report, measurements of performance usually include quantitative and/or qualitative data used to describe and assess an institution as it pursues its goals (Borden & Bottrill, Summer 1994). Furthermore, reporting is not confined to an assessment of the university only; value-added can be obtained from sharing lessons learned across universities that can enhance beneficial outcomes.
This year’s Report (August 2006) analyzed performance for 17 quantitative measures and additional qualitative measures. Each quantitative and qualitative measure is aligned with PASSHE’s Strategic Plan Goals. According to a recent survey by Burke and Minassians (2003),
1The authors would like to recognize Jeff Kinsey, Sara Senko, Scott Souders, Melinda Tobin, and Savita Wani, Pennsylvania State System of Higher Education, for their contributions to the System Accountability Program. Any errors are the responsibility of the authors.
20
46 states, including Pennsylvania, have implemented some form of accountability reporting for higher education.
Performance reporting is not static; reports change as stakeholders require different summary analyses. This year’s Report (August 2006) provided an expanded qualitative evaluative framework for the actions/outcomes of the Narrative Assessment Statement (NAS) and University Performance Plan (UPP) narratives and was included within the Executive Summary (see Armstrong, et. al., 2004). Furthermore, the Report included a single Matrix Narrative Report, Tab 2, which satisfied the reporting needs of both the NAS and UPP of all the universities. In addition, a summary Report (October 2006) was produced that included lessons learned or highlights from the content evaluation of the narratives from all 14 universities. The next section provides details of the single Matrix Narrative Report within the System Accountability Program.
Submissions Methodology for the Matrix Narrative Report
PASSHE developed the System Accountability Program (SAP) to assess the overall performance level of the System and each university on an annual basis. The first System Accountability Report was published in 2001-02. In 2004, the Board of Governor’s adopted PASSHE’s Strategic Plan, Leading the Way, which resulted in the alignment of quantitative and qualitative measures within Strategic Plan goal categories. PASSHE’s Strategic Plan goal categories are (1) Student Achievement and Success, (2) University and System Excellence, (3) Commonwealth Service, (4) Resource Development and Stewardship, and (5) Public Leadership.
Within each goal category, universities report narratives that link to either the NAS and/or the UPP. The NAS focuses on performance results that are not easily measured quantitatively. The UPP are university-specific goals and initiatives that reflect the strategic direction of the university and are designed to facilitate the measurement of the university’s performance. The UPP focus is on measurable performance results that are either quantitatively or qualitatively described. The NAS and UPP reporting categories are organized under the appropriate goal category, ensuring an integration of strategic planning, reporting, and the evaluation of university performance outcomes.
There are four required NAS reporting categories or “NAS descriptors”: (1) accreditation, (2) teacher certification tests, (3) system partnerships, and (4) private giving and endowments. All other reporting descriptors are optional.
University responses to UPP reporting categories are also presented under each Goal Category. The UPP reporting categories or “UPP goals” allow institutions more flexibility in highlighting university goals and showing evidence of progress in achieving them. There are 16 UPP goals that are aligned with each Strategic Plan Goal Category and also shown in Table 1.
21
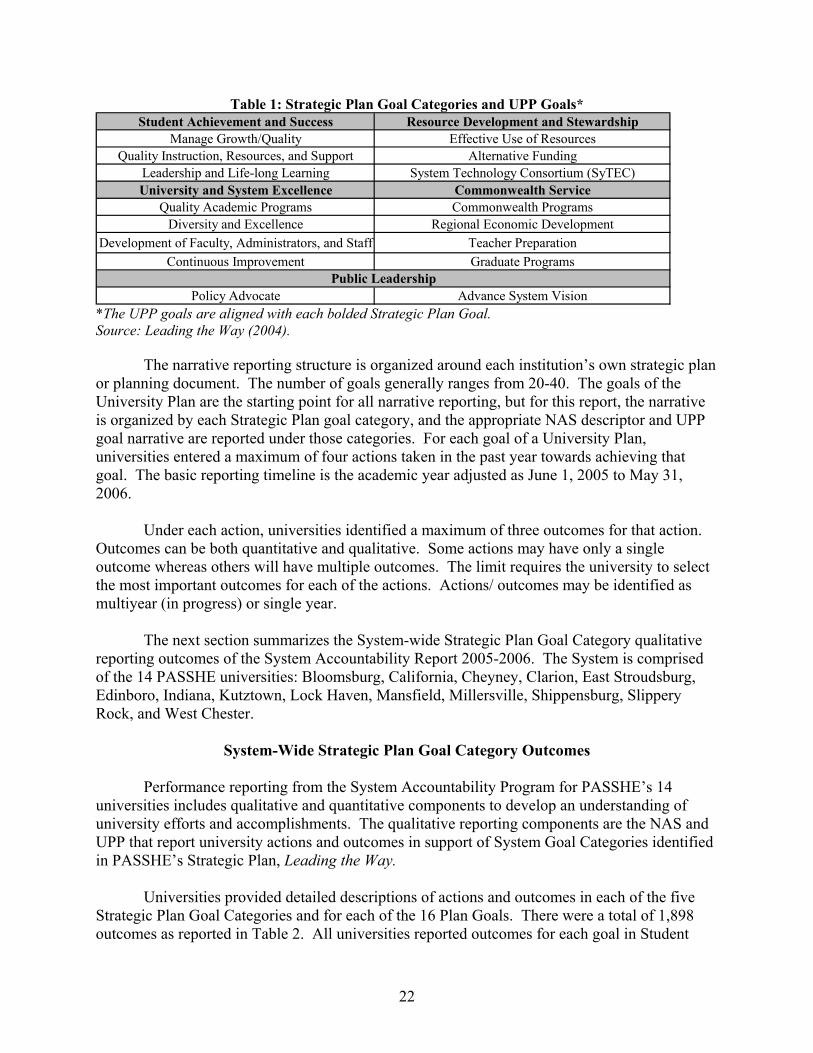
Table 1: Strategic Plan Goal Categories and UPP Goals* Student Achievement and Success Resource Development and Stewardship
Manage Growth/Quality Effective Use of ResourcesQuality Instruction, Resources, and Support Alternative Funding
Leadership and Life-long Learning System Technology Consortium (SyTEC)University and System Excellence Commonwealth Service
Quality Academic Programs Commonwealth ProgramsDiversity and Excellence Regional Economic Development
Development of Faculty, Administrators, and Staff Teacher PreparationContinuous Improvement Graduate Programs
Policy Advocate Advance System VisionPublic Leadership
*The UPP goals are aligned with each bolded Strategic Plan Goal. Source: Leading the Way (2004).
The narrative reporting structure is organized around each institution’s own strategic plan or planning document. The number of goals generally ranges from 20-40. The goals of the University Plan are the starting point for all narrative reporting, but for this report, the narrative is organized by each Strategic Plan goal category, and the appropriate NAS descriptor and UPP goal narrative are reported under those categories. For each goal of a University Plan, universities entered a maximum of four actions taken in the past year towards achieving that goal. The basic reporting timeline is the academic year adjusted as June 1, 2005 to May 31, 2006.
Under each action, universities identified a maximum of three outcomes for that action. Outcomes can be both quantitative and qualitative. Some actions may have only a single outcome whereas others will have multiple outcomes. The limit requires the university to select the most important outcomes for each of the actions. Actions/ outcomes may be identified as multiyear (in progress) or single year.
The next section summarizes the System-wide Strategic Plan Goal Category qualitative reporting outcomes of the System Accountability Report 2005-2006. The System is comprised of the 14 PASSHE universities: Bloomsburg, California, Cheyney, Clarion, East Stroudsburg, Edinboro, Indiana, Kutztown, Lock Haven, Mansfield, Millersville, Shippensburg, Slippery Rock, and West Chester.
System-Wide Strategic Plan Goal Category Outcomes
Performance reporting from the System Accountability Program for PASSHE’s 14 universities includes qualitative and quantitative components to develop an understanding of university efforts and accomplishments. The qualitative reporting components are the NAS and UPP that report university actions and outcomes in support of System Goal Categories identified in PASSHE’s Strategic Plan, Leading the Way.
Universities provided detailed descriptions of actions and outcomes in each of the five Strategic Plan Goal Categories and for each of the 16 Plan Goals. There were a total of 1,898 outcomes as reported in Table 2. All universities reported outcomes for each goal in Student
22
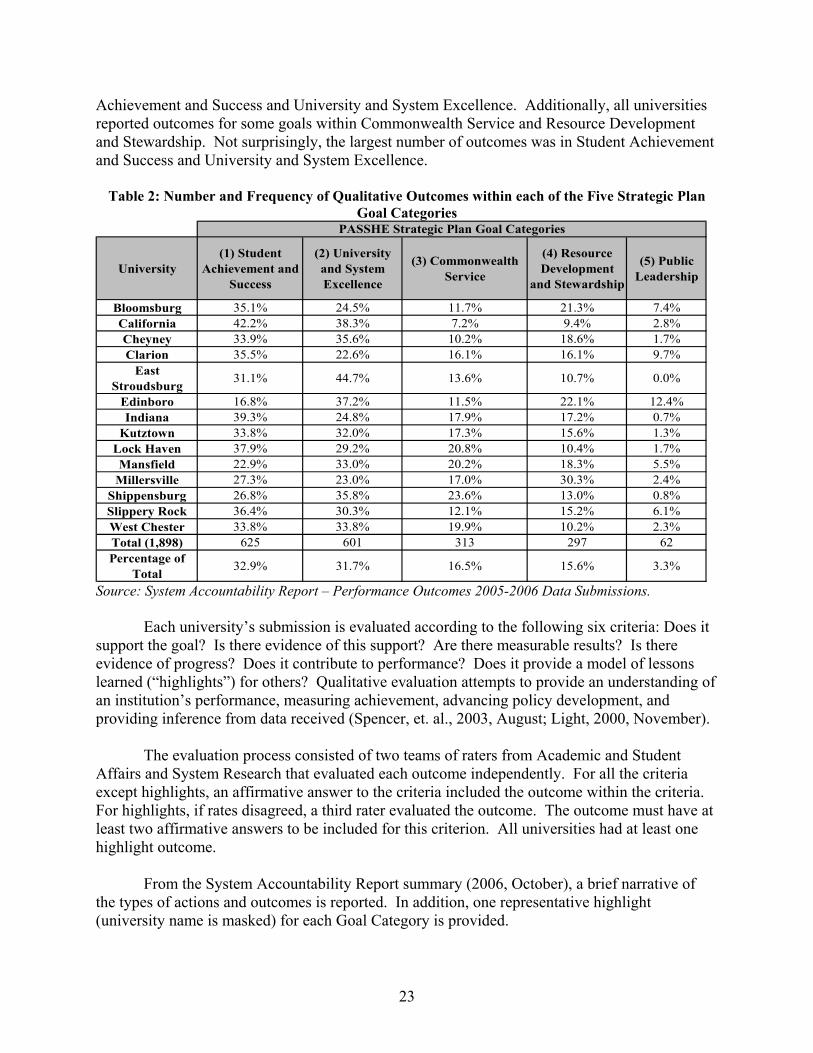
Achievement and Success and University and System Excellence. Additionally, all universities reported outcomes for some goals within Commonwealth Service and Resource Development and Stewardship. Not surprisingly, the largest number of outcomes was in Student Achievement and Success and University and System Excellence.
Table 2: Number and Frequency of Qualitative Outcomes within each of the Five Strategic Plan Goal Categories
University(1) Student
Achievement and Success
(2) University and System Excellence
(3) Commonwealth Service
(4) Resource Development
and Stewardship
(5) Public Leadership
Bloomsburg 35.1% 24.5% 11.7% 21.3% 7.4%California 42.2% 38.3% 7.2% 9.4% 2.8%Cheyney 33.9% 35.6% 10.2% 18.6% 1.7%Clarion 35.5% 22.6% 16.1% 16.1% 9.7%
East Stroudsburg 31.1% 44.7% 13.6% 10.7% 0.0%
Edinboro 16.8% 37.2% 11.5% 22.1% 12.4%Indiana 39.3% 24.8% 17.9% 17.2% 0.7%
Kutztown 33.8% 32.0% 17.3% 15.6% 1.3%Lock Haven 37.9% 29.2% 20.8% 10.4% 1.7%Mansfield 22.9% 33.0% 20.2% 18.3% 5.5%
Millersville 27.3% 23.0% 17.0% 30.3% 2.4%Shippensburg 26.8% 35.8% 23.6% 13.0% 0.8%Slippery Rock 36.4% 30.3% 12.1% 15.2% 6.1%West Chester 33.8% 33.8% 19.9% 10.2% 2.3%Total (1,898) 625 601 313 297 62Percentage of
Total 32.9% 31.7% 16.5% 15.6% 3.3%
PASSHE Strategic Plan Goal Categories
Source: System Accountability Report – Performance Outcomes 2005-2006 Data Submissions.
Each university’s submission is evaluated according to the following six criteria: Does it support the goal? Is there evidence of this support? Are there measurable results? Is there evidence of progress? Does it contribute to performance? Does it provide a model of lessons learned (“highlights”) for others? Qualitative evaluation attempts to provide an understanding of an institution’s performance, measuring achievement, advancing policy development, and providing inference from data received (Spencer, et. al., 2003, August; Light, 2000, November). The evaluation process consisted of two teams of raters from Academic and Student Affairs and System Research that evaluated each outcome independently. For all the criteria except highlights, an affirmative answer to the criteria included the outcome within the criteria. For highlights, if rates disagreed, a third rater evaluated the outcome. The outcome must have at least two affirmative answers to be included for this criterion. All universities had at least one highlight outcome.
From the System Accountability Report summary (2006, October), a brief narrative of the types of actions and outcomes is reported. In addition, one representative highlight (university name is masked) for each Goal Category is provided.
23

1. Student Achievement and Success There were 625 outcomes or 32.9% of the total outcomes reported in support of this Goal
Category, which was the most for any Goal Category. Every University listed outcomes for each of these three goals.
A. Manage growth to ensure access while enhancing the quality of State System
Universities. The actions and outcomes reported for this goal are clustered into 23 broad categories,
with the most frequently cited outcomes in enrollment management (43%), retention and graduation (14%), and community college transfers (8%). These are the areas where universities can make the greatest difference for new and returning students.
B. Enhance the quality of instruction, learning resources and support services
available to students. Continuing its dominance from the prior year, this goal once again had more outcomes
than any other. Universities reported initiatives and accomplishments in 28 different areas. More outcomes were included by far for learning environment (15%), library (12%), and technology (11%) than any other category. This distribution is intuitive, as the learning environment is perhaps the most important factor contributing to effective teaching and learning, while sufficient library resources are critical to support the academic enterprise, and technology has become a vital component in integrating efforts to enhance classroom and distance education instruction.
C. Provide all students with opportunities leading to active citizenship, social
responsibility and life-long learning. Most readers would consider the two previous goals—managing growth to ensure access
and enhancing the quality of instruction—as fundamental to the mission of all System Universities. What is equally important, but often overlooked, are the other opportunities Universities provide students to become socially responsible citizens committed to life-long learning. Universities reported many outcomes for leadership and life-long learning.
Highlight – Action: Opportunities. Expand opportunities for students of all backgrounds to
attend the University. Outcome: Outreach. The Academic Development Services Department administered the ACT
101 program to 175 low-income college students who are Pennsylvania residents. The five-year retention rate for these students is 84%, with a 78% graduation rate and 23% of graduates go on to attend graduate or professional school. The TRIO Student Support Services Program has 165 low-income first generation college students participate. The five-year retention rate for these students was 82%, with a 70% graduation rate and 31% enrollment in graduate or professional schools.
2. University and System Excellence
601 outcomes or 31.7% of the total outcomes were reported in support of this Goal Category. Every University listed outcomes for each of these four goals.
24

A. Focus the efforts of System Universities on high quality academic programs that meet the needs of Pennsylvania and its students.
To show evidence of high quality academic programs, Universities documented outcomes in accreditation, curriculum, and external recognition of program quality. In fact, these three categories were responsible for 70% of all outcomes, even though 18 broad categories were included.
B. Establish diversity as a cornerstone of excellence and leadership throughout the
System. Diversity has always been a high priority for the System, and University progress in
increasing diversity is measured by 26 quantitative sub-measures and seven performance-funding sub-measures. For this goal, Universities submitted outcomes in 21 areas, with the greatest frequency in initiatives for students of color (32%), learning environment (19%), and faculty quality (17%).
C. Provide all faculty, administrators and staff with professional and leadership
development to enhance performance. The largest investment System Universities make is in their personnel. Although
students are the reason Universities exist, the faculty and staff are the ones responsible for making the academic enterprise work.
D. Support an environment of continuous improvement to ensure efficiency, enhance
effectiveness and pursue excellence in System programs, services and activities. Continuous improvement has been practiced in higher education institutions for several
decades. Of the many outcomes reported in this area, the largest numbers were reported in external recognition/program quality (20%), strengthening management practices (13%), and learning environment (13%).
Highlight – Action: Support for Online Teaching. Recognizing that web-based programming
presents new challenges related to both teaching and learning, the University has mandated that all faculty teaching in web-based programs complete the eCollege certification program. In addition, eCollege has provided the University with the opportunity to participate in a national study by ETS, the eSIR survey.
Outcome: LISTSERV. During the spring of 2006, the University GO Listserv was created and become operational. This listserv provides a vehicle for disseminating useful resources for online teaching and learning, as well as serving as a venue for faculty to share best practices.
3. Commonwealth Service
There were 313 outcomes or 16.5% of the total outcomes reported in support of this Goal Category.
A. Develop an array of programs designed to meet best the higher education needs of the Commonwealth.
Long before the development of the System’s current Strategic Plan, PASSHE Universities were offering a range of professional programs that produced graduates in high need fields. That activity has increased since the plan was adopted in 2004. Eleven
25

Universities reported activities in primary areas for this goal. Of the 17 broad categories, the most common were enrollment management (14%), science and technology programs (11%), and initiatives for students from low socio-economic backgrounds (11%).
B. Enhance the capacity of the System to serve regional economic and community
development needs. As has been well documented in the recently released Economic Impact Study, System
Universities have a positive impact on their regions. For this goal, Universities described more outcomes in regional economic development (19%), collaboration with business and industry (16%) and workforce development (15%) than any of the other 20 categories. Because many of the same regional economic activities were listed in different categories, this summary will describe them interchangeably.
C. Retain the System’s status as the premier provider of teachers to the
Commonwealth. PASSHE has always been known for educating large numbers of highly qualified
teachers. This goal requires Universities to maintain those high standards as they prepare students to teach in classrooms. Of the 17 categories listed for this goal, a majority of outcomes were in teacher education programs and teacher certification texts (PRAXIS).
D. Support graduate programs designed to meet the needs of the Commonwealth Although the System primarily serves undergraduate students (who make up 87% of all
enrollments), graduate programs are becoming increasingly important as more occupations require graduate training for entry or promotion into technical or leadership positions. System Universities listed outcomes in ten general categories, but enrollment management, other high-need programs, and teacher education programs each accounted for 19% of all responses.
Highlight – Action: Science and Technology. Continue to develop innovative programs in the
area of science and technology to meet the rapidly changing needs of society. Outcome: Nanotechnology Manufacturing. Seven System Universities were awarded a $200,000
grant from the Pennsylvania Department of Community and Economic Development to develop nanotechnology modules for inclusion into science courses.
4. Resource Development and Stewardship
There were 297 outcomes or 15.6% of the total outcomes reported in support of this Goal Category.
A. Ensure that all System resources are used effectively and efficiently. The PASSHE Universities are state-owned, which means that a substantial percentage of
resources come from tax revenues. Therefore, the System has a responsibility to legislators, taxpayers, and parents to use these resources effectively and efficiently. Practicing wise stewardship is a System value, and one purpose of the accountability measures is to determine how effective and efficient Universities operate (both fiscally and programmatically). Although examples of University efforts in meeting this goal were found in 24 broad categories, the most commonly cited were initiatives to reduce
26

costs (17%), increase productivity (15%), administratively streamline (11%), and find new or expanded revenue sources (11%).
B. Increase the level of alternative funding to support new and existing programs and
services. Even though the State System receives $445 million annually in appropriations, that
amount represents only 38% of the total $1.2 billion budget. Tuition covers most of the remaining expenses, but additional revenues are needed to support new and existing programs and services. Universities have been successful in finding additional sources to supplement traditional revenues, including private giving efforts, grants and contracts. Of the 12 broad categories of outcomes Universities included for this goal, the most common were private giving and endowment growth (39%), new or expanded revenue sources (29%), and state or federal grants or contracts (22%).
C. Employ the System Technology Consortium (SyTEC) to promote efficiency and
effectiveness across the System. PASSHE is implementing a comprehensive enterprise reporting system that includes finance, human resources, and student modules (called Campus Management). Now that the Finance and Human Resource modules are fully implemented and used by all Universities, attention has turned to implementation of Campus Management for the pilot institutions. For this goal, Universities listed outcomes in seven categories, with technology (30%), administrative streamlining (22%), and increasing productivity (22%) responsible for almost three in four responses.
Highlight – Action: Supplier Diversity Initiative. Continue to implement the Supplier Diversity
Initiative to expand the University’s vendor base to include all qualified vendors and to enhance cost-saving opportunities for the University.
Outcome: Minority and Women Business Enterprise. University’s minority business enterprise/women business enterprise participation in the procurement area increased form 7.8% in 2004-05 to 12.5% in 2005-06.
5. Public Leadership
There were 62 outcomes or 3.3% of the total outcomes reported in support of this Goal Category.
A. Shape the policy framework for public higher education in the Commonwealth. Although Universities reported outcomes in 16 categories, the most common areas
reported were collaboration with government (15%) and corporate alliances (13%). An excellent example of the type of leadership Universities are practicing is the Government Agency Coordination Office (GACO) at California University. This is an economic development program that assists businesses with federal, state, and local contracts. Presidents and other campus officials are often speakers at events where business and community leaders are present, which gives these campus leaders forums for presenting information about the State System to influential audiences.
27

B. Advance the vision for the System through the policies, actions, communications, and programs of the Universities, the Board of Governors and the Office of the Chancellor. Universities reported outcomes in ten areas of advancing the System vision. Of these, new or expanded revenue sources and learning environment were responsible for 46% of all outcomes. Many outcomes were similar to those included in the previous goal. For example, Universities reported that their alumni had breakfast meetings with legislators and supported System appropriations through letter writing campaigns. University presidents are involved in many activities that advance the vision of the System.
Highlight – Action: Service Learning. Support service-learning activities and student service-oriented activities.
Outcome: Service Activities. Student organizations and athletic teams volunteered over 13,500 hours in community service projects, including clean-up efforts and other Hurricane Katrina-related activities. In addition, the faculty responded to meet the needs of students displaced by Hurricane Katrina by providing 4 free online courses through the Sloan-C Foundation. The University was one of 200 colleges nationwide and the only PASSHE institution involved in this project.
Conclusion
Performance reporting is anchored in results management. Strategic management links
performance reporting with strategic goals of an institution. This year’s System Accountability Report 2005-2006 (August 2006) links PASSHE goals with qualitative evaluation assessment of university actions and outcomes of their NAS and UPP narratives, including lessons learned, for continuous improvement. Universities and stakeholders are benefited by the knowledge they gain from this performance-based accountability program.
References: Armstrong, T. O.; Bohl-Fabian, L.; Garland, P.; & Yazdi, K. (2004). The integration of
performance evaluation and planning: Pennsylvania state system of higher education’s system accountability report 2003-2004. Northeast Association for Institutional Research Proceedings, 12-20.
Borden, V. M. H. & Banta, T. W. (1994). Using performance indicators to guide strategic decision making. New Directions for Institutional Research. 82. San Francisco: Jossey-Bass.
Borden, V. M. H. & Bottrill, K. V. (1994, Summer). Performance indicators: History, definitions, and methods. New Directions for Institutional Research. 82: 5-19.
Burke, J. C. & Minassians, H. (2003). Performance reporting: “Real” accountability or accountability “lite” seventh annual survey. Albany, N.Y.: Rockefeller Institute of Government.
Light, P. (2000, November). Government’s greatest achievements of the past half century. Brookings Reform Watch, 2: 1-15.
28

Office of the Chancellor. (2004). Leading the way, the Pennsylvania state system of higher education: A plan for strategic directions 2004-2009. Harrisburg: Pennsylvania State System of Higher Education.
Office of the Chancellor. (2006, August). System accountability report: Performance outcomes 2005-06. Harrisburg: Pennsylvania State System of Higher Education.
Office of the Chancellor. (2006, October). System accountability report: Performance outcomes 2005-06. Harrisburg: Pennsylvania State System of Higher Education.
Spencer, L.; Ritchie, J.; Lewis, J., & Dillon, L. (2003, August). Quality in qualitative evaluation: A framework for assessing research evidence. Government Chief Social Researcher’s Office, 1-17.
29
TOWARD A MORE REALISTIC APPROACH TO COMMUNITY COLLEGE PERFORMANCE ASSESSMENT:
AN ANALYSIS OF THE ENVIRONMENTAL CORRELATES OF MARYLAND TWO-YEAR SCHOOL STUDENT OUTCOMES, 2000-2005
Karl Boughan
Director of Institutional Research Prince George’s Community College
Introduction
Over a two-year period beginning in March 2004, community colleges in Maryland developed a revised set of accountability indicators for state-mandated performance accountability reporting based on an improved model for assessing student degree progress. This paper describes the components of this new Degree Progress Model, and then examines significant patterns in the cross-institutional database containing the same outcome indicators supplied to the state, but augmented with demographic and other institutional context data. Specifically, the analysis attempts to capture the ways three sets of environmental factors—service area characteristics, institutional characteristics, and student body characteristics—correlated with graduation-transfer and related outcomes rates for the sixteen Maryland community colleges. The analysis is exploratory with several methodological limitations, but suggestive of how environmental factors influence student outcomes. The paper concludes with a comparison of actual rates to expected rates following the assessment framework advocated by Astin.
Purpose and General Characteristics of the Degree Progress Analysis Model
The Degree Progress Analysis is a four-year cohort-based model for more realistic and useful assessment of community college institutional performance. The model was developed by a taskforce of the Maryland Community College Research Group (MCCRG), an affinity organization of Maryland community college institutional researchers, and has been adopted in 2005 by the Maryland Higher Education Commission (MHEC) for the student outcomes section of its annual community college institutional assessment report. The model takes into consideration not only the final outcome rate of program completion, but also transfer rate -- especially transfer without award – which increasingly represents the main “formal success experience” of community college students according to national data.
The model, however, additionally incorporates several interim measures of pre-graduation/transfer success. The most important of these are sophomore status achievement (no degree or transfer but 30 or more credits earned and the maintenance of a 2.0+ GPA) and continuing enrollment (plus the maintenance of a 2.0+ GPA) at the four-year census point without yet having achieved a degree or transfer. The first is a rough indicator of general education course completion and the attainment of the halfway point toward program completion. The second represents long-term retention and persistence in the pursuit of a higher education award. The total package of indicators is named the Degree Progress model because
30

it includes multiple measurements of progress toward or attainment of an associate degree (sophomore status, continuing enrollment, degree earning), or of progress toward a baccalaureate award (transfer rate). This provides a more nuanced and realistic picture of student outcomes, allowing for the tracking of types and relative levels of academic achievement. Furthermore, as a data analysis found in this paper will illustrate, the inclusion of interim indicators has the added benefit of providing institutional researchers and college administrators with ways of identifying trouble spots within the academic process that may spoil student chances for academic success. This moves institutional performance assessment away from its current bottom-line fixation and towards utility as a diagnostic tool.
As already mentioned, the indicator data of Degree Progress model is the result of cohort fourth-year analysis. The cohort employed in our model cohorts diverges from the conventional IPEDS definition (degree-seeking, full-time, first-time anywhere fall entrants). Model cohorts consist of all new fall entrants, without respect to their semester credit load or degree-seeking status. The only additional requirement for cohort inclusion is that its students have a record of 18 attempted credit hours. This approach was inspired by the cohort-defining criteria developed by the state of Florida for college performance assessment. Florida authorities were attempting to avoid the notoriously problematic identification of “degree-seekers” by means of highly volatile program curricula choices or admission-time response to an academic goal question. It was their feeling that students who attempted at least 18 credit hours had behaviorally expressed a seriousness of academic purpose tantamount to objective degree-seeking. They also reasoned that limiting cohorts to full-time students in the community college case tended to exclude the majority of those enrolled, leading to unrealistic outcomes results. Here also the 18 credit hour rule would prove helpful as a sort of full-time/part-time student equalizer in a shared cohort. The Degree Progress model as adopted by MHEC included sub-cohort reporting by developmental status groups (initially, college-ready according to developmental placement results; developmental program completers; and developmental program non-completers) and by race/ethnicity categories. (See Boughan and Clagett (2006) for a detailed review of model’s methodological underpinnings.)
The Degree Progress Model Illustrated
Table 1 presents the full Maryland Community College Degree Progress Model with example data drawn from Carroll Community College’s 2000 cohort. Currently, the model has nineteen interlocking components. The first three define the reporting cohort and the remainder provides the actual assessment data based on the performance of students in the reporting cohort, during the four-year assessment interval. The table’s line definitions show how each component rate is to be calculated and used in the construction of higher level components. The two shaded rows indicate the two performance assessment rates percent graduating or transferring, and percent successful or persisting that the MHEC has approved and will be requiring as part of the state’s community college accountability reporting beginning this year.
31

Table 1. The Elements of the Maryland Community College Degree Progress Paradigm
Line Line Definition Carroll Community College Example
1 First-time-any-college fall headcount 634 2 Attempting fewer than 18 hours over first 2 years 204 3 Cohort for analysis (Line 1 – Line 2) 430 4 % Earned Associate degree from this community college 26.7% 5 % Earned certificate, but no degree, from this community college 1.2% 6 % Total Associate and certificate graduates (Line 4 + Line 5) 27.9% 7 % Transferred to Maryland two-year/technical college 6.3% 8 % Transferred to Maryland public four-year college 24.2% 9 % Transferred to Maryland private 4-year college or university 4.7%
10 % Transferred to out-of-state college or university (10a+10b) 10.9% 11 % Total transfers (unduplicated sum of Lines 7 – 10) 46.0% 14 % Graduated this college and transferred (Line 6 ∏ Line 11) 19.5% 15 % Graduated and/or transferred {(Line 6 + Line 11) – Line 14} 54.4% 16 % No award or transfer, but 30 credits with GPA ≥ 2.00 16.0% 17 % Successful transition to higher ed (Line 15 + Line 16) 70.5% 18 % Enrolled at orig. institution last term of study period (Continuing) 3.7%
19 % Successful or persisting (Line 17 + Line 18) 74.2% NOTE: Shaded rows represent state required accountability measures.
Originally, the Degree Progress Model included Lines 12 and 13, which represented
degree progress at the transfer receiving school. At a recent meeting, the MCCRG, charged with overseeing the model’s technical development, voted to drop these elements because they do not relate directly to state community college outcomes, and because proper assessment would require adding at least two years to the assessment interval. It also decided to split Line 10 in future reporting into two components transfer to two-year and to four-year out-of-state schools to allow for the calculation of general two- and four-year transfer rates. (For a full cross-school review of all the rates found in Table 1, contact the author for the Appendix.)
Cross-College Analysis of Fall 2000 Degree Progress Data After Four Years
Research Context. In the remainder of this paper, we will present an analysis of community college performance data based on the Degree Progress reports collected from all sixteen public two-year institutions in the state of Maryland. Our goal was two-fold. First, we wanted to gain a deeper understanding of the full range of cross-institutional student outcome phenomena, in how the different schools compared and contrasted on a variety of indicators and what this suggested about the dynamics of their student bodies. The second goal was to trace as much of the above variation, especially that of the key graduation/transfer rate indicator, back to differences in school demographic environment, institutional characteristics, and type of student body.
Two important issues in educational assessment methodology suggested these research objectives. The first deals with questions concerning the utility of standard outcomes measures: How adequate is the classic graduation rate indicator (or graduation-transfer rate indicator) as a general measure of institutional performance? Does it do a good enough job of expressing the
32

relative academic success of its student body? Is it helpful in identifying those problem points in an academic process that needs addressing? Astin’s (1993a) famous I-E-O model of institutional performance posits a critical intervening “environmental” component between institutional input and output. Does this not suggest the utility of employing interim measures of student progress as supplements to final outcomes indicators?
The second issue cluster involves questions concerning the validity of assessing institutional performance without consideration of environmental context: How fair is it to judge the relative performances of community colleges without taking into account, systematically if possible, environmental factors importantly conditioning student success probabilities and over which institutions may have little or no control? Should not schools be evaluated in terms of what can reasonably be expected given their demographic, financial, and other impacting circumstances? This approach, in fact, has been explicitly recommended by Astin (1993b).
Literature Review. We began our study with a search for past institutional research bearing on the environmental correlates of community college student outcomes, especially within the context of a state system. We could find only one study that attempted this through a systematic analysis. Windham and Hackett (1996) analyzed the retention and graduation variation across Florida’s 28 two-year public colleges by means of linear regression analysis and found several explanatory institutional characteristics: influencing negatively were college size (FTE) and predominance of career of degree programs, while the most robust positive predictors turned out to be faculty salary and student support expenditure levels. The New Jersey State Commission on Higher Education, in a recent report (1998) detailed graduation and transfer trends for New Jersey’s 19 community colleges but carried out systematic analysis of student outcomes only on four-year public school data. This study was noteworthy, however, for using the case residuals (actual – predicted outcome) of its institutional characteristics-based predictive equation to measure “true” level of institutional performance. Neither of these two studies employed transfer as a student success indicator, nor did they consider service area demographics as an institutional background category.
A larger set of studies featured national community college databases built out of IPEDS and national survey data (e.g. NCES longitudinal surveys, CIRP, the Community College Student Experience Survey), but differed significantly in their selection of independent and dependent variables. For example, Bailey, Calcagno, Jenkins, Kienzl, and Leinbach (2005) used hard institutional characteristics data such as school size, proportion student body minority, and part-time student and part-time faculty percentages, finding that all of these correlated negatively with dependent variables measuring retention and degree attainment. They also discovered that unit level student characteristics tended to be stronger determinants of student outcomes than institutional characteristics in their equations. Habley and McClanahan (2005), on the other hand, defined institutional characteristics in terms of student support service configurations and reported a list of best practices, which associated strongly with institutional graduation rates, including the presence of various types of tutoring centers, advisor intervention programs, and ethnic support groups. Glover and Murrell (1998) took still another tack, basing their institutional characteristic data on student perceptions of peer and staff friendliness, faculty accessibility and course intellectual stimulation, and their outcomes variables on respondent-reported satisfaction with academic career and sense of intellectual and personal growth. These
33
two sets of factors were found to be significantly correlated. Then there is the study of Alfred and Peterson (1992) who conceptualized the characteristics of institutions in terms of dimensions of structure and operation. Their survey of a national sample of community college administrators and faculty uncovered a strong link between student success and attendance at schools featuring a “responsive” organizational culture known by its concern for school reputation in the student body and larger community, innovativeness and flexibility in the provision of student support services, and the active promotion of student-faculty/staff interaction. Last, there is the work of Yang (2005), noteworthy as the only institutional environment research we could find using transfer attainment as its dependent variable. Yang’s study related transfer rate negatively to revenue/FTE, high tuition, and the percentage of part-time and minority attendees in the student body. None of the studies, however, paid any attention to the possible impact of community college service area characteristics on student outcome, and none (with the exception of Yang’s) saw fit to include transfer attainment in their measures of student success.
Finally, we ran across a fair number of four-year school studies exploring the connection of institutional characteristics and graduation, most notably those by Astin, Tsui and Avalos (1996), Goenner and Snaith (2004), Mortenson (1997), Pascarella and Terenzini (1991), Porter (2000), and Scott and others (2004). The positive success correlates commonly turned up were high national test scores; good high school GPA; and student bodies with concentrations of full-time, female, minority, and lower aged attendees. They also generally agreed on the negative impact of school size, location in an urban environment, disproportion of part-time faculty, low spending on student services and general under funding.
Study Methodology. The plan for analyzing the Maryland degree progress data had two
parts. The research objective of the first part was to explore what the patterns in our expanded set of student outcomes indicators might tell us about the dynamics of student flow through Maryland’s 16 community colleges. Was it fairly uniform or were there interesting variations of interim and final outcomes to be detected? The analysis mainly involved examination of special arrangements of selected key indicators designed to bring out different outcomes “styles” if any. Outcome data were then subjected to systematic treatment by means of a cluster analysis (Ward’s method) to find discrete outcome pattern groupings among institutions. The data for analysis of outcomes by student developmental status was short one institutional case, the Community College of Baltimore County, due to data processing problems, that in analytic instances involving developmental data reduced the active sample to 15.
In the second phase of the research, we explored why institutional performance varied as it did. To what extent could different student outcomes by college be traceable to environmental factors? We conceptualized “environment“ as three sets of possible explanatory variables service area demographic and socio-economic characteristics; institutional characteristics involving level of financial resources, expenditure patterns, and faculty traits; and student body demographic and academic characteristics.
The service area data was derived from the 2000 U.S. Census, conveniently coinciding in time with the starting year of our student cohorts. Most Maryland community colleges serve a particular county, but three are assigned to multiple county territories, and in the later instance,
34

census data was pooled for these areas. For 2000 data on institutional and student body characteristics, we drew mostly from the historical data book published by the Maryland Association of Community Colleges (2005). Data included race/ethnicity, gender, age group, first semester course load, degree program, and Pell grant receipt. Developmental status came straight from the degree progress submissions.
To eliminate multicollinearity effects, always troublesome in data of this kind, and to identify the dimensions underlying the large number of variables we had assembled, we subjected the data elements of the three environmental sets to separate factor analyses (least-squares measurement, orthogonal rotation). This method yielded 10 meaningful factors described latter in this paper. These, normally distributed by mathematical nature, constituted the independent variables in a series of multiple linear regression analyses. As an independent variable for all of the regressions, we selected the graduation and/or transfer indicator (GT). This measure proved to be reasonably normal by the usual statistical tests (kurtosis=.493, Kolmogorov-Smirnov Z=.638).
This analysis is exploratory only, and we make no claims that the results of our regressions are in any way definitive, always statistically significant, or reliable overall or particularly in detail. We are well aware that using linear regression where the sample is slight (here n=16 and occasionally 15 cases) and where the data are aggregate involves important methodological problems, not the least of them the tendency to obtain very inflated estimates of association. Our defense is that the regression approach was the most efficient means to explore multiple environmental impacts on student outcomes, and in hindsight, that they yielded results making theoretical sense and generally resembled the findings of other researchers working in this area. As a practical matter, we feel that our methodology was sufficient to establish broad patterns of impact and to point the way to more robust future research.
Findings of the Degree Progress Data Analysis
Outcome Patterns. Table 2 displays cross-school summary data for the Degree Progress
Model’s two accountability indicators. When the 2000 cohort reporting for Maryland’s 16 community colleges was pooled, we found a rounded total system graduation/transfer (GT) rate of 47 percent and a 76 percent “success or persistence” (SP) rate (the graduation/transfer rate augmented by sophomore status attainment and continued study rates). When transfer attainment, a genuine indicator of educational progress, is joined with graduation attainment into a single formal achievement indicator, the resulting measure reveals an encouraging degree of academic progress made over four years by Maryland’s recent community college students. Almost half of them managed to meet their degree goal or to advance to the four-year level in their academic pursuits. Furthermore, when we allow for important pre-graduation achievement like attaining sophomore status (tantamount in most cases to fulfilling a student’s general education requirements) and retention through the fourth year, we can fairly say that over three out of four students made significant progress toward their degrees after four years.
Lastly, Table 2 calls attention to what institutional researchers have known all along, that much of the poor institutional performance typically reported by community colleges results from their high remediation burden. Almost three-fifths (59 percent) of Maryland community
35

college students who began their studies ready to begin taking college-level credit courses (no placement into developmental programs) managed to graduate or find places at four-year institutions within four years. In contrast, only 30 percent of those failing to finish their remediation programs did so (their GT rate reflects transfer success only). It also shows that developmental completers tended to do almost as well as college-ready students in terms of formal academic achievement (GT=53%) and equaled them in general academic progress (SP=84%), an indication of the efficacy of the state’s community college developmental programs when faithfully worked through.
Table 2. Maryland Community Colleges (N=16)
All Student Summary of Key Progress Rates of Fall 2000 Cohort after Four Years
Graduating and/or Transferring Successful or Persistent
All Students (N=14,588) 46.8% 75.6% College-ready Students (N=4,974) 58.6% 84.0% Developmental Completers (N=3,652) 52.8% 84.0% Developmental Non-Completers (N=3,446) 29.6% 53.4%
The above summary statistics, however, hide a multitude of important underlying institutional variations. A cross-school report of key indicator results would show GT values ranging from a high of 66 percent (Allegany College of Maryland) to a low of 23 percent (Baltimore City Community College), and SP values ranging from 92 to 45 percent (bounded by the same schools), with significant differences for interim indicator results. The next three tables are designed to bring out such degree progress patterns. Table 3 displays individual college rates for each component of the summary Success or Persistence indicator.
Table 3. 2000-2004 Success or Persistence Variations Across Maryland Community Colleges*
Community College % Not Successful or Persisting**
% Sophomore Status (No Award or
Transfer)
% Graduating and/or Transferring
% Continuing at Original CC (Last Term)
Statewide 23.0 20.3 46.8 9.9 Allegany C of MD 8.0 24.5 66.2 1.3 Garrett CC 24.0 12.8 63.2 0.0 Frederick CC 24.6 3.5 63.1 8.8 Howard CC 25.2 16.5 56.2 2.1 Harford CC 24.1 17.2 54.5 4.2 Carroll CC 25.9 16.0 54.4 3.7 Hagerstown CC 15.3 19.0 54.0 11.7 C of Southern MD 10.9 28.7 53.8 6.6 Cecil CC 16.3 23.2 51.6 8.9 Montgomery C 18.4 20.4 50.6 10.6 Anne Arundel CC 22.5 22.1 47.8 7.6 Wor-Wic CC 29.9 20.1 45.3 4.7 CC Baltimore Co 16.3 23.2 43.4 17.1 Chesapeake C 37.3 21.8 36.7 4.2 Prince George's CC 29.9 21.0 29.1 20.0 Baltimore City CC 55.1 13.7 23.0 8.2 *Row percentages sum to 100%. **100% - % Successful or Persisting
36

Table rows, representing individual colleges, are arranged in GT rate order (highest to lowest). The columns display outcomes in rough student throughput sequence. The first gives the percentage of a school cohort failing to fall into any of the SP sub-categories of achievement, an indication of the dropout rate. Column two shows the proportion of those without formal academic achievement, who nevertheless managed to attain sophomore status after four years of study. The third column gives the GT rate, while the last shows the percentage of cohort students still attending each school in the last term of the assessment period (continuing students).
The table patterns clearly suggest that degree progress is a complex phenomenon. For example, while the GT rates of the Allegany College of Maryland and Garrett Community College were both very high (66 and 63 percent, respectively), the former’s drop out rate was considerably lower (8 compared with 24 percent), and its Sophomore Only category was double that of the latter. At the opposite end of the GT spectrum, the GT rates of Prince George's (29 percent) and Baltimore City Community College (23 percent) are shown to be quite similar, but PGCC’s dropout rate turned out to be 25 percent lower, and its Continuing Student rate was more that twice BCCC’s rate (20 to 8 percent, respectively).
The findings displayed on Table 4, which breaks down the GT rate into its discrete
components (Award Only, Transfer Only, and Both Graduation and Transfer), show a similar variety of outcomes. At the statewide level, the majority of formal achievement turned out to be transfer without degree (54 percent), but at Prince George's Community College, 82 percent of
Table 4. 2000-2004 Pattern of Formal Achievement Across Maryland Community Colleges
% Formal Achievers* Community Colleges % Cohort Award and/or Transfer Award Only Award + Transfer Transfer Only
Statewide 46.8 22.2 23.9 53.8 Allegany C of MD 66.2 78.9 12.5 8.6 Garrett CC 63.2 26.3 27.2 46.5 Frederick CC 63.1 20.9 29.0 50.1 Howard CC 56.2 8.4 16.5 75.1 Harford CC 54.5 15.4 35.6 49.0 Carroll CC 54.4 15.4 35.8 48.7 Hagerstown CC 54.0 21.3 39.6 39.1 C of Southern MD 53.8 12.8 19.0 68.2 Cecil CC 51.6 24.6 17.2 58.1 Montgomery C 50.6 12.1 19.4 68.6 Anne Arundel CC 47.8 18.2 29.5 52.3 Wor-Wic CC 45.3 31.3 20.8 47.9 CC Baltimore Co 43.4 15.2 27.0 57.8 Chesapeake C 36.7 33.0 14.2 52.9 Prince George's CC 29.1 5.8 12.0 82.1 Baltimore City CC 23.0 12.6 9.6 77.8 *Formal Achiever row percentages sum to 100%; column percentages are inferred from the calculation of
% Award + Transfer (% Awards + % Transfers) - % Graduated or Transferred. successful students fell into this category, while only 9 percent of Allegany College of Maryland’s cohort successes did so. ACM’s predominant type of success was the terminal degree (79 percent) compared with an all-college 22 percent. On the other hand, the modal
37

success category for Hagerstown Community College’s high performing students was the traditional graduation and transfer outcome 40 percent, a rate nearly double that of the statewide level. We may also note that the table’s figures provide a partial explanation of the low graduation rates found for schools like Prince George's, Baltimore City, and Howard Community Colleges; transfer-only students made up 75 percent or more of their student successes.
Given the great diversity of school outcomes portrayed in Tables 3 and 4, we decided to perform a cluster analysis of the indicator data to clarify the patterning of the cross-school results. Table 5 presents the product of a Ward hierarchical grouping analysis of the Table 3-4 data. The analysis yielded six discrete clusters defining the Degree Progress personalities of the
Table 5. 2000-2004 Maryland Community College Degree Progress Clusters with Cluster Variable Indexed Means*
Degree Progress Clusters #1 #2 #3 #4 #5 #6
Degree Progress
Indicators
Career Student Success
(n=1)
Traditional Student
Outcomes
(n=5)
Good General
Perf.
(n=6)
Career Student Muddle-Through
(n=2)
Delayed Student
Progress
(n=1)
Struggling Unprepared
(n=1)
All-School
Indicator Rate
Basic Success Components Not Successful or
Persisting 33 95 76 140 176 230 24.0%
Sophomores Only 129 72 118 110 111 72 19.0% Graduating and/or
Transferring 134 117 102 83 59 46 49.6%
Continuing at Original CC 17 76 118 59 267 109 7.5%
Successful or Persisting 121 102 108 87 76 59 76.0% Type of Formal Achievement Graduating Only 447 99 65 113 15 25 11.7% Graduating and
Transferring 70 163 91 62 30 19 11.8%
Transferring Only 22 104 124 79 92 69 26.1% Supplementary Student Data Full-Time Students 171 109 101 81 74 97 33.0% College Ready Students 136 77 115 45 84 30 34.1% Transfer Program
Students 75 136 92 72 94 49 44.2%
*Indexed Mean = 100 * (Mean Cluster % / All-School %) Cluster Colleges: #1 Allegany; #2 Carroll, Frederick, Garrett, Hagerstown, Harford; #3 Anne Arundel, Cecil, Baltimore County, College of Southern Maryland, Howard, Montgomery; #4 Chesapeake, Wor-Wic; #5 Prince George's; #6 Baltimore City
16 colleges. The character of each cluster is revealed by the pattern of cluster means for the whole set of discriminant variables entered into the analysis. To highlight the inferential weight
38

of the cluster means, these are expressed in the table as indexed means proportionate deviations from the all-school rate (indexed mean = (cluster mean / all school mean) * 100). A cluster Index value of 100 indicates that the cluster’s mean equals the all-school mean, a value of more than 100 show the proportionate exceeding of the general mean, and one below 100 reveals the proportionate collective mean short-fall. Thus, Cluster 1’s Sophomore Status index value of 129 indicates a grouping mean 129 percent that of the all-school average of 19 percent. For post-analysis reference in the process of cluster interpretation, Table 5 also includes supplementary statistics on college student body academic characteristics.
In the table, the six clusters are arranged in collective GT rate sequence, from high to low. Three were above average performing groups. Cluster 1, nicknamed “Career Student Success,” consisted of a single school (Allegany College of Maryland) and was characterized by extreme rates of GT success, Sophomore Only attainment, but above all terminal degree acquisition (447 indexed mean). Its student body had very below average proportions of transfer program students, and greatly disproportionate concentration of full-time and college-ready students. Allegany has the most rural of all Maryland community college service areas. In the second cluster (“Traditional Student Outcomes”), the prime formal outcome turned out to be both graduating and transferring (163 indexed mean); the associated distinguishing student body traits were high enrollment in transfer degree programs, but a relatively low rate of college-readiness. Cluster 2 included five schools (Carroll, Frederick, Garrett, Hagerstown, and Harford community colleges), mostly middle size schools serving rural but rapidly developing counties. The third and most populous cluster, “Good General Performance,” consisted of six colleges, mostly with middling to large enrollments in suburban jurisdictions (Anne Arundel, Cecil, Baltimore County, Howard community colleges, Montgomery College, and the College of Southern Maryland). The cohorts of these schools show above average tendencies to transfer before graduating or to persist into the fourth year. Cluster 3 is the only group besides Cluster 1 to register above state level concentrations of college-ready students.
Cluster 4 (“Career Student Muddle-Through”) is the first of three with sub-par performance levels and includes two rural colleges Chesapeake and Wor-Wic community colleges. Their cohorts had large proportions of unsuccessful students (140 SP indexed rate), and if successful, students who tended disproportionately to select the terminal degree path. Cluster 4 cohorts also exhibited low rates of full-time attendance, college-readiness, and transfer program enrollment. The last two clusters were single-member and decidedly low performing. The Prince George's Community College cluster (5) featured students with very high dropout and low formal achievement probabilities, whose successes were measured mostly in terms of pre-graduate transfer. However, what really distinguished the Cluster 5 were its extreme disproportion of continuing students (267-indexed mean) and its somewhat high concentration of Sophomore Only attainers (111). These traits, along with academic status measures indicating a mainly part-time student body with great remediation needs, suggest the existence of a “Delayed Student Progress” syndrome, where rate of degree progress is inhibited. Indeed, historical data for PGCC indicates that the bulk of formal achievement, especially degree earning, occurs in the fifth and sixth year of study. Finally, the analysis identified a sixth cluster consisting entirely of Baltimore City Community College, which we nicknamed “Struggling Unprepareds.” Like Cluster 5, the dropout rate was extreme, but unlike PGCC, which at least showed a near average transfer without degree rate (92-indexed mean) and a very prominent continuing student rate
39

(267), all of BCCC’s achievement and retention levels fell far below the all-college levels. Furthermore, student remediation need here was the greatest of any cluster (30 indexed college-readinesses).
The specific make-up and traits of Maryland Community College Degree Progress clusters is unlikely to be of great interest to institutional researchers outside our state, but we have supplied cluster result details to illustrate an important point of concern to all who work with assessment indicators. Establishing an institutional performance hierarchy based on graduation rate, or even an enhanced final outcome indicator like Graduation and/or Transfer rate, is of little utility, except to those playing the praise and blame game. Assessment indicators should really point the way to understanding where degree progress problems occur in an institution and how they may be addressed. An assessment indicator system should be useful diagnostically, and to perform this function, multiple final and salient interim outcome indicators need to be present. Our phase, “one research,” demonstrates that among community colleges, degree progress may occur in a variety of stable, distinctive patterns, perhaps each requiring a difference ameliorative approach.
Environmental Correlates of Degree Progress. In the second phase of this research, we addressed the question of environment influences upon student academic advancement. Specifically, we sought to identify the forces, which facilitate or constrain degree progress across Maryland’s 16 community colleges. What are they, at what environmental level do they operate, what is their joint impact, and to what extent can the effects of any of the prime determinants discovered be harnessed or mitigated by impacted institutions? Answers to these questions are important in institutional performance assessment because they will tell us the degree to which performance-affecting conditions are fixed, and how much institutional effort can reasonably be expected to improve collective student performance.
To explore these matters we assembled a database representing Maryland community college environment circumstances at three levels: college service area demographics, institutional characteristics, and student body traits. We would have liked to include among our institutional data elements organizational culture and academic policies, but these were unavailable. The hypothesis is that the particular constellation of demographic and academic factors within a student body might establish the range of possible institutional performance.
As a preliminary to the environmental factor regression analysis, we subjected the 44 individual data elements in the database to factor analysis. This was done both to reduce the large number of variables to a more manageable number of environmental dimensions and to eliminate serious problems of multicollinearity. Three separate factor analyses were carried out, one for each set of environmental variables, to maintain the integrity of the three-level distinction in the resulting factor measures.
Table 6 reflects the outcome of these factor analyses and serves as a listing of the original data elements. It depicts the dimensional measures emerging from each level-based factor analysis, the factor loadings of the individual items that collectively provide the factor thematic interpretation, the nickname selected for each factor and the total inter-item variance captured by its extraction.
40
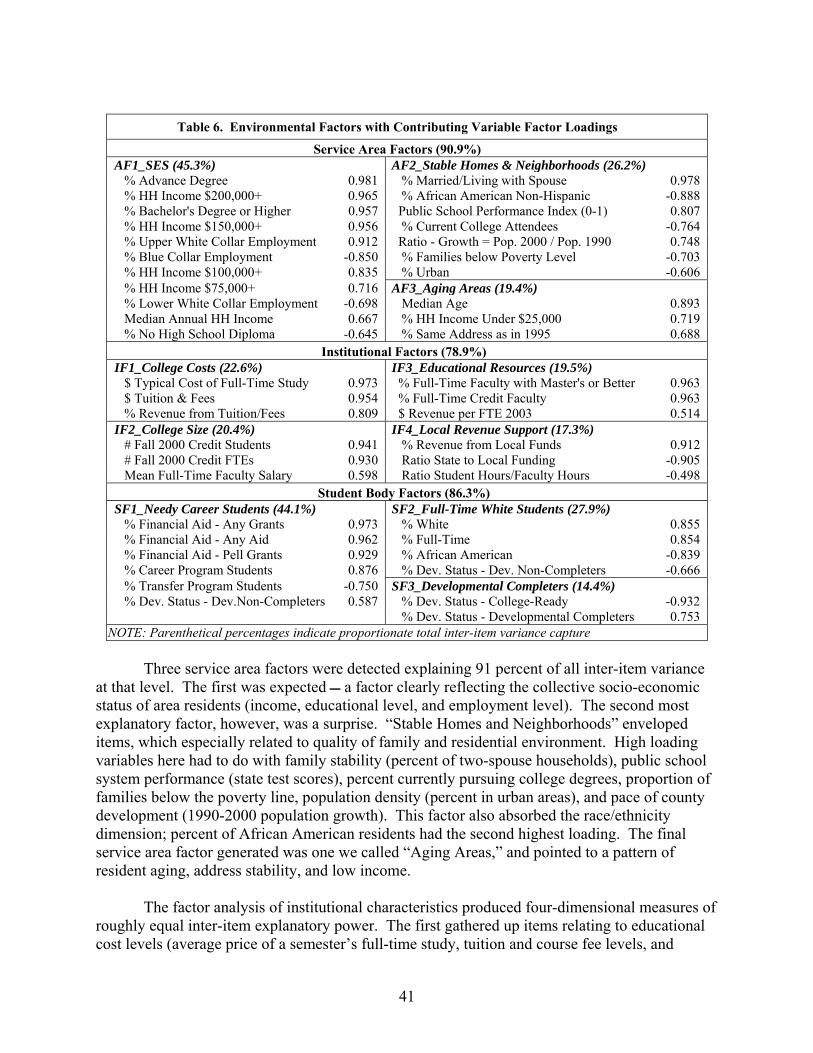
Table 6. Environmental Factors with Contributing Variable Factor Loadings
Service Area Factors (90.9%) AF1_SES (45.3%) AF2_Stable Homes & Neighborhoods (26.2%)
% Advance Degree 0.981 % Married/Living with Spouse 0.978 % HH Income $200,000+ 0.965 % African American Non-Hispanic -0.888 % Bachelor's Degree or Higher 0.957 Public School Performance Index (0-1) 0.807 % HH Income $150,000+ 0.956 % Current College Attendees -0.764 % Upper White Collar Employment 0.912 Ratio - Growth = Pop. 2000 / Pop. 1990 0.748 % Blue Collar Employment -0.850 % Families below Poverty Level -0.703 % HH Income $100,000+ 0.835 % Urban -0.606 % HH Income $75,000+ 0.716 AF3_Aging Areas (19.4%) % Lower White Collar Employment -0.698 Median Age 0.893 Median Annual HH Income 0.667 % HH Income Under $25,000 0.719 % No High School Diploma -0.645 % Same Address as in 1995 0.688
Institutional Factors (78.9%) IF1_College Costs (22.6%) IF3_Educational Resources (19.5%)
$ Typical Cost of Full-Time Study 0.973 % Full-Time Faculty with Master's or Better 0.963 $ Tuition & Fees 0.954 % Full-Time Credit Faculty 0.963 % Revenue from Tuition/Fees 0.809 $ Revenue per FTE 2003 0.514
IF2_College Size (20.4%) IF4_Local Revenue Support (17.3%) # Fall 2000 Credit Students 0.941 % Revenue from Local Funds 0.912 # Fall 2000 Credit FTEs 0.930 Ratio State to Local Funding -0.905 Mean Full-Time Faculty Salary 0.598 Ratio Student Hours/Faculty Hours -0.498
Student Body Factors (86.3%) SF1_Needy Career Students (44.1%) SF2_Full-Time White Students (27.9%)
% Financial Aid - Any Grants 0.973 % White 0.855 % Financial Aid - Any Aid 0.962 % Full-Time 0.854 % Financial Aid - Pell Grants 0.929 % African American -0.839 % Career Program Students 0.876 % Dev. Status - Dev. Non-Completers -0.666 % Transfer Program Students -0.750 SF3_Developmental Completers (14.4%) % Dev. Status - Dev.Non-Completers 0.587 % Dev. Status - College-Ready -0.932
% Dev. Status - Developmental Completers 0.753 NOTE: Parenthetical percentages indicate proportionate total inter-item variance capture
Three service area factors were detected explaining 91 percent of all inter-item variance
at that level. The first was expected a factor clearly reflecting the collective socio-economic status of area residents (income, educational level, and employment level). The second most explanatory factor, however, was a surprise. “Stable Homes and Neighborhoods” enveloped items, which especially related to quality of family and residential environment. High loading variables here had to do with family stability (percent of two-spouse households), public school system performance (state test scores), percent currently pursuing college degrees, proportion of families below the poverty line, population density (percent in urban areas), and pace of county development (1990-2000 population growth). This factor also absorbed the race/ethnicity dimension; percent of African American residents had the second highest loading. The final service area factor generated was one we called “Aging Areas,” and pointed to a pattern of resident aging, address stability, and low income.
The factor analysis of institutional characteristics produced four-dimensional measures of
roughly equal inter-item explanatory power. The first gathered up items relating to educational cost levels (average price of a semester’s full-time study, tuition and course fee levels, and
41

proportion of college revenue from tuition and fees). The second seemed to gauge institutional size from student headcount and FTE angles (it also weakly reflected the level of full-time faculty salary). Next, we found a dimensional measure of “Educational Resources.” Items most contributing to the emergence of this factor were those typically taken to indicate quality of the instructional environment (percent of faculty with advanced degrees, percent of faculty working full-time, ratio of college revenue to FTE). Interestingly, the item most associated with instructional quality the classroom student/faculty ratio fell into the final factor, which otherwise seemed to be characterized by gauges of county government revenue support.
Lastly, the analysis of student body data produced three difficult-to-name factors that appeared to distinguish combinations of traits representing types of students, rather than pure trait dimensions. The most inter-item explanatory factor was one we ended up calling “Needy Career Students”, based on a trait constellation featuring financial aid receipt (particularly of the need-based kind), enrollment in a career degree program as opposed to a transfer degree program and uncompleted developmental requirements. The second factor, dubbed “Full-Time White Students,” as its nickname suggests included white versus African American racial identity in its construction, but also tendencies to study full-time and to have fulfilled all developmental requirements if any. The last and weakest factor was based on high negative loading for percent college-ready and comparably high loading for percent completing required remediation.
Table 7 provides the zero-order level of association between college graduation or transfer rate, our independent variable in the regression analyses to follow, and the ten environmental factors just described. The highest GT factors correlate turned out to be Full-Time White Students (r2=.685) from the student body set, followed closely in association by Stable Homes and Neighborhoods (.539) from the service area set, and then Local Revenue Support (.378) from the institutional set. Thus, all three environmental levels were represented among the top three variance-explaining dimension measures.
Table 7. Community College Environmental Factors and Graduated or Transferred Indicator Association Zero-Order Pearson r Correlations
r r2 SF2_Full-Time White Students 0.828 0.685 AF2_Stable Homes & Neighborhoods 0.734 0.539 IF4_ Local Revenue Support 0.615 0.378 IF2_ College Size -0.400 0.160 SF1_Needy Career Students -0.296 0.088 AF3_Aging Areas 0.243 0.059 SF3_Developmental Completers -0.173 0.030 IF1_ College Costs 0.161 0.026 IF3_ Educational Resources 0.057 0.003 AF1_SES 0.044 0.002
The remaining seven factors fell far below a reasonable benchmarking of important
impact at r2=.300. The only other factor that had a somewhat robust association with GP was College Size (.160). Prominently highlighted as a prime predictor of student outcomes in other
42
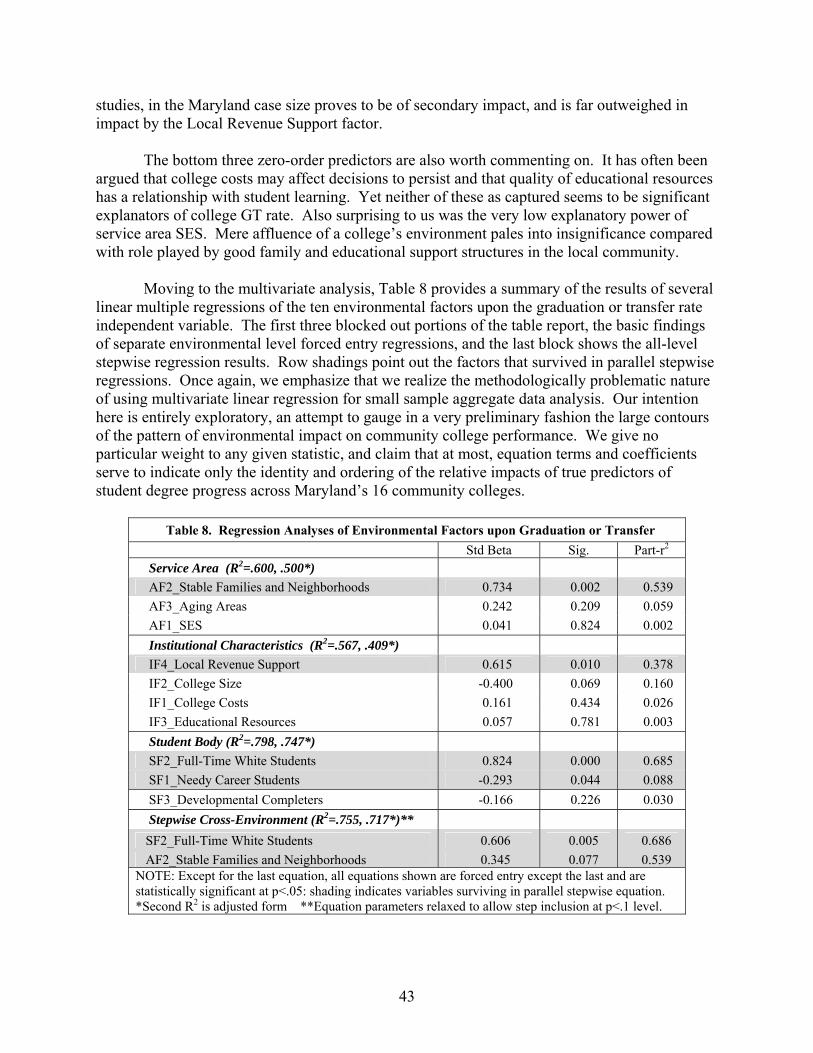
studies, in the Maryland case size proves to be of secondary impact, and is far outweighed in impact by the Local Revenue Support factor.
The bottom three zero-order predictors are also worth commenting on. It has often been
argued that college costs may affect decisions to persist and that quality of educational resources has a relationship with student learning. Yet neither of these as captured seems to be significant explanators of college GT rate. Also surprising to us was the very low explanatory power of service area SES. Mere affluence of a college’s environment pales into insignificance compared with role played by good family and educational support structures in the local community.
Moving to the multivariate analysis, Table 8 provides a summary of the results of several linear multiple regressions of the ten environmental factors upon the graduation or transfer rate independent variable. The first three blocked out portions of the table report, the basic findings of separate environmental level forced entry regressions, and the last block shows the all-level stepwise regression results. Row shadings point out the factors that survived in parallel stepwise regressions. Once again, we emphasize that we realize the methodologically problematic nature of using multivariate linear regression for small sample aggregate data analysis. Our intention here is entirely exploratory, an attempt to gauge in a very preliminary fashion the large contours of the pattern of environmental impact on community college performance. We give no particular weight to any given statistic, and claim that at most, equation terms and coefficients serve to indicate only the identity and ordering of the relative impacts of true predictors of student degree progress across Maryland’s 16 community colleges.
Table 8. Regression Analyses of Environmental Factors upon Graduation or Transfer
Std Beta Sig. Part-r2 Service Area (R2=.600, .500*) AF2_Stable Families and Neighborhoods 0.734 0.002 0.539 AF3_Aging Areas 0.242 0.209 0.059 AF1_SES 0.041 0.824 0.002 Institutional Characteristics (R2=.567, .409*) IF4_Local Revenue Support 0.615 0.010 0.378 IF2_College Size -0.400 0.069 0.160 IF1_College Costs 0.161 0.434 0.026 IF3_Educational Resources 0.057 0.781 0.003 Student Body (R2=.798, .747*) SF2_Full-Time White Students 0.824 0.000 0.685 SF1_Needy Career Students -0.293 0.044 0.088 SF3_Developmental Completers -0.166 0.226 0.030 Stepwise Cross-Environment (R2=.755, .717*)**
SF2_Full-Time White Students 0.606 0.005 0.686 AF2_Stable Families and Neighborhoods 0.345 0.077 0.539 NOTE: Except for the last equation, all equations shown are forced entry except the last and are statistically significant at p<.05: shading indicates variables surviving in parallel stepwise equation. *Second R2 is adjusted form **Equation parameters relaxed to allow step inclusion at p<.1 level.
43

The forced entry service area factor regression explains around 60 percent of the GT variance (50 percent adjusted). Stable Families and Neighborhoods emerged as the prime predictor (Standardize Beta=.734), followed at a good distance by Aging Areas (.242). Area SES seemed to make no real impact on GT rate (.041), and neither of the last two factor beta tests for statistical significance were sufficient for stepwise equation inclusions. The betas of the forced entry regression of institutional trait factors ranked Local Revenue Support highest in predictive power (.615), but also found College Size to be a relatively important predictor (-.400, the smaller the college the higher the GT rate). The parallel stepwise regression, however, included only a single factor term Local Revenue Support. Nevertheless, it was the student body factor set that formed the basis for the most robust equation (R2=.798, .747 adjusted). The factor with the highest beta (.824) was the one that combined full-time enrollment and low remediation need with white racial identity. The Needy Career Student factor also showed a statistically significant beta coefficient (-.293) of negative sign. Both of these showed up in the parallel stepwise equation, but the Developmental Completers factor failed to make the cut.
The all-factor stepwise regression equation (with a slightly relaxed item inclusion criterion) had only two factor terms Full-Time White Students (beta=.606, p=.005) and Stable Homes and Neighborhoods (beta=.345, p=.077). The equation R2 puts their joint variance explanatory power at 76 percent (72 percent adjusted), indicating a formidable level of degree progress determination. The equation answers one of the questions about environmental levels posed earlier: Do service area demographics have any direct effects upon institutional performance, or do they impact student outcome rates mainly by determining student body constitution? The answer suggested by our regression analysis, adding some additional correlation data, is that both causal paths are significant. Stable Homes and Neighborhoods correlates strongly with Full-Time White Students (Pearson r=.643), showing it to be a prime conditioner of student body make-up, but its strong beta coefficient indicates that it also plays a modest but real direct role in community college performance. The equation furthermore speaks to lack of salience of institutional characteristics. School trait factors were conspicuous by their absence from the equation. The present analysis, however, is too primitive to undergird any confident assertion about level of causality. Working out the precise causal network of factors, including those measuring institutional effects, will take a full-scale structural equation path analysis, research beyond the scope of this exploratory paper.
The final component of our research plan was an exploratory follow-up on Astin’s suggestion that the residuals of outcome explaining regression equations could be employed as superior assessment measures of institutional performance. We used the “best equation” just described to calculate the residuals for each Maryland community college (actual GT rate – expected GT rate given environmental factors). Then we tentatively interpreted these as measures of institutional effect relative to institutional environmental circumstance, and constructed Table 9 to assess the results. The left side of Table 9 displays actual Maryland community college GT rates in rank order (best to worst) and their expected GT rates according to the equation. The table’s right side shows the community colleges residuals and re-ranks institutions accordingly. Positive residuals imply doing better than expected performance and negative residuals tag underachieving institutions.
44

Table 9. Maryland Community Colleges Fall 2000 Cohort: Graduating or Transferring Rate ─ Actual versus Predicted
Community College Rank Actual Predicted Community College Rank Residual
Allegany C of MD 1 66.2 61.9 Howard CC 1 8.7 Garrett CC 2 63.2 61.6 Wor-Wic CC 2 7.5 Frederick CC 3 63.1 56.3 Frederick CC 4 6.8 Howard CC 4 56.2 47.5 C of Southern MD 5 4.4 Harford CC 5 54.5 51.1 Allegany C of MD 3 4.3 Carroll CC 6 54.4 59.2 Harford CC 6 3.5 Hagerstown CC 7 54.0 55.2 Garrett CC 7 1.6 C of Southern MD 8 53.8 49.4 Montgomery C 8 1.1 Cecil CC 9 51.6 59.6 Hagerstown CC 9 -1.2 Montgomery C 10 50.6 49.5 Prince George's CC 10 -1.3 Anne Arundel CC 11 47.8 51.8 Baltimore City CC 14 -3.2 Wor-Wic CC 12 45.3 37.8 CC Baltimore Co 11 -3.9 CC Baltimore Co 13 43.4 47.3 Anne Arundel CC 12 -4.1 Chesapeake C 14 36.7 47.9 Carroll CC 13 -4.8 Prince George's CC 15 29.1 30.3 Cecil CC 15 -8.0 Baltimore City CC 16 23.0 26.2 Chesapeake C 16 -11.3
Actual GT rank order and rank order based on GT relative to environmentally predicted
GT are quite different. For example, the actual outcome rank for Wor-Wic Community College was 12, but its performance relative to predicted outcome moved that institution into the number 2 position among Maryland community colleges. Carroll Community College suffered the opposite fate, falling from rank 6 to rank 13. Prince George's Community College, on the other hand, moved out of second-to-last place up to tenth. Originally, top-ranked Allegany College of Maryland dropped to fifth place. Also, the overall linear association of actual GT and GT equation residual proved to be at best modest Pearson r=.495 (r2=.245).
Strong caveats are in order. Our “best equation” is a highly provisional construct derived
from the analysis of too little data by some very problematic statistical techniques. The above exercise is only meant to suggest that it may be possible to use regression analysis to create a fairer and more realistic assessment methodology that takes into systematic account the environmental advantages and disadvantages of assessed institutions.
A Unit Recode Data Illustration
As a concluding note to the above aggregate level research, we would like to present some results from a unit record analysis on the interaction between student body characteristics and formal success outcomes. We were able to obtain parallel datasets containing Degree Progress and student attribute variables from two contrasting institutions inner-suburban Prince George's Community College and rural Carroll Community College. To proceed, we selected from these files variables representing two of the most powerful factors identified by the cross-institution environmental impact analysis credit load status (full-time/part-time) and college-readiness (remediation required or completed/not required), crossing them to produce four student status groupings shown in the row labels of Table 10.
45
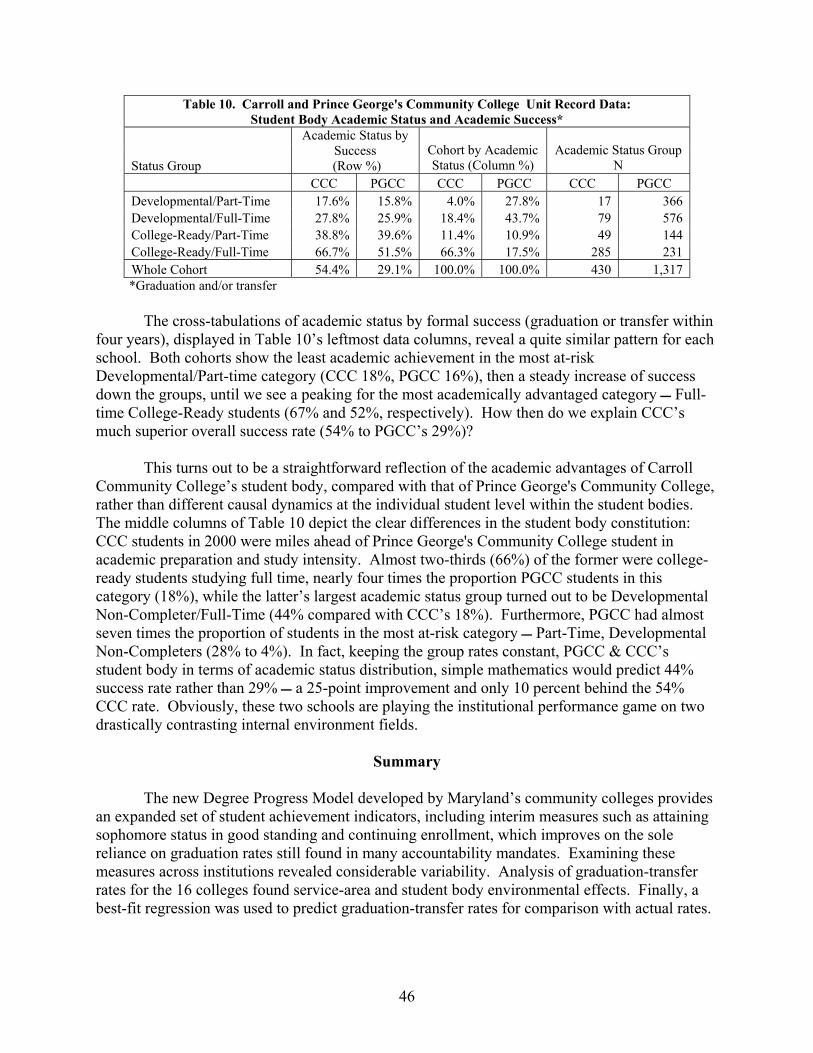
Table 10. Carroll and Prince George's Community College Unit Record Data: Student Body Academic Status and Academic Success*
Status Group
Academic Status by Success
(Row %) Cohort by Academic Status (Column %)
Academic Status Group N
CCC PGCC CCC PGCC CCC PGCC Developmental/Part-Time 17.6% 15.8% 4.0% 27.8% 17 366 Developmental/Full-Time 27.8% 25.9% 18.4% 43.7% 79 576 College-Ready/Part-Time 38.8% 39.6% 11.4% 10.9% 49 144 College-Ready/Full-Time 66.7% 51.5% 66.3% 17.5% 285 231 Whole Cohort 54.4% 29.1% 100.0% 100.0% 430 1,317
*Graduation and/or transfer
The cross-tabulations of academic status by formal success (graduation or transfer within four years), displayed in Table 10’s leftmost data columns, reveal a quite similar pattern for each school. Both cohorts show the least academic achievement in the most at-risk Developmental/Part-time category (CCC 18%, PGCC 16%), then a steady increase of success down the groups, until we see a peaking for the most academically advantaged category Full-time College-Ready students (67% and 52%, respectively). How then do we explain CCC’s much superior overall success rate (54% to PGCC’s 29%)?
This turns out to be a straightforward reflection of the academic advantages of Carroll Community College’s student body, compared with that of Prince George's Community College, rather than different causal dynamics at the individual student level within the student bodies. The middle columns of Table 10 depict the clear differences in the student body constitution: CCC students in 2000 were miles ahead of Prince George's Community College student in academic preparation and study intensity. Almost two-thirds (66%) of the former were college-ready students studying full time, nearly four times the proportion PGCC students in this category (18%), while the latter’s largest academic status group turned out to be Developmental Non-Completer/Full-Time (44% compared with CCC’s 18%). Furthermore, PGCC had almost seven times the proportion of students in the most at-risk category Part-Time, Developmental Non-Completers (28% to 4%). In fact, keeping the group rates constant, PGCC & CCC’s student body in terms of academic status distribution, simple mathematics would predict 44% success rate rather than 29% a 25-point improvement and only 10 percent behind the 54% CCC rate. Obviously, these two schools are playing the institutional performance game on two drastically contrasting internal environment fields.
Summary
The new Degree Progress Model developed by Maryland’s community colleges provides
an expanded set of student achievement indicators, including interim measures such as attaining sophomore status in good standing and continuing enrollment, which improves on the sole reliance on graduation rates still found in many accountability mandates. Examining these measures across institutions revealed considerable variability. Analysis of graduation-transfer rates for the 16 colleges found service-area and student body environmental effects. Finally, a best-fit regression was used to predict graduation-transfer rates for comparison with actual rates.
46

The research findings just summarized call into question the conventional focus on final outcomes indicators, especially sole reliance on graduation rate, as providing adequate grounds for institutional performance assessment. The data patterns demonstrate the advisability of considering a range of indicators, both final outcome (including transfer success), and pre-graduation indicators like sophomore status attainment and late persistence. Only a cross-indicator approach that tracks students through the academic process can enable college decision makers and oversight agencies to arrive at a realistic and useful assessment of degree progress at an institution. Assessment should be capable not only of judgment, but also more importantly, of yielding diagnostic insights pointing to needed institutional reforms. The data patterns also constitute an implicit criticism of environmentally contextless assessment. The discovery of a high level of impact upon cross-institutional academic outcomes by factors, like service area demographic, institutional characteristics, and student body traits, argues for the establishment and use of expected levels of institutional performance as a regular part of the assessment process. As a practical matter, cross-institutional analyses of multiple outcomes indicators and environment impacts a need for more accurate selection of institutional peer groups and in setting more realistic benchmarks for strategic planning indicators.
REFERENCES Alfred, R., Peterson, R. (1992). Making community colleges more effective: leading through
student success. Community College Consortium, Ann Arbor, MI Astin, A. W. (1993a). What matters in college: Four critical years revisited. San Francisco:
Jossey-Bass. Astin, A.W. (1993b). Assessment for Excellence. Phoenix, AZ: Oryx Press. Astin, A. W. Tsui, L., & Avalos, J. (1996). Degree attainment rates at American colleges and
universities: Effects of race, gender, and institutional type. Unpublished manuscript, University of California, Los Angeles, Graduate School of Education, Higher Education Research Institute.
Bailey, T., Calcagno, J., Jenkins, D., Kienzl, G., & Leinbach, T. (2005, January). The effects of institutional factors on the success of community college students. Community College Research Center, Teachers College, Columbia University.
Boughan, K. & Clagett, C. (2006). Degree progress measures for community colleges: The Maryland model. Paper presented at the annual forum of the Association for Institutional Research, Chicago, IL.
Glover, J. & Murrell, P. H. (1998). Campus environment and student involvement as predictors of outcomes of the community college experience. Journal of Applied Research in the Community College, 6(1), 5-14.
Goenner, C. & Snaith, S. (2004). Accounting for model uncertainty in the prediction of university graduation rates. Research in Higher Education, 45(1), 25-41.
Habley, W. R. & McClanahan, R. (2004). What works in student retention? Two-year public colleges. Iowa City: ACT.
Maryland Association of Community Colleges (2006). Maryland Association of Community Colleges historical data book: 1986 though present. Annapolis, MD.
47

Mortenson, T. (1997, April). Actual versus predicted institutional graduation rates for 1,100 colleges and universities. Postsecondary Education Opportunity, 58.
New Jersey State Commission on Higher Education (1998). Focusing on higher educational outcomes: 3rd annual systemwide accountability report (ED 428 608).
Pascarella, E. & Terenzini, P. (1991). How college affects students: Findings and insights from twenty years of research. San Francisco: Jossey-Bass.
Porter, S. (2005). The robustness of the “graduation rate performance” indicator used in the U.S. News and World Report college ranking. International Journal of Educational Advancement, 1(2), 10-30.
Scott, M., Bailey, T., & Kienzl, G. S. (2004). Institutions afloat? Determinants of college completion rates with a focus on the public urban college. New York: Columbia University, Teachers College, Community College Research Center.
Windham, P. & Hackett, E. (1997). The Florida community college accountability plan: An analysis of institutional characteristics and success at meeting state defined performance measures. Paper presented at the annual meeting of the Southern Association for Institutional Research, Hot Springs, AZ.
Yang, P. (2005), Transfer performance of community college students: Impacts of cost and institution. Journal of Applied Research in the Community College, 12(2), 147.
48

CONSIDERING LEAVING BEFORE THEY’VE EVEN STARTED: AN EXAMINATION OF FRESHMEN AT RISK FOR TRANSFER
Yiting Chang
Senior Research Analyst, Office of Research, Assessment and Planning Nava Lerer
Director, Office of Research, Assessment and Planning Adelphi University
Kathryn Talley Director, Office of Institutional Research
Chicago School of Professional Psychology
There is voluminous literature on retention of students in postsecondary institutions, especially targeting freshmen (Strauss & Volkwein, 2004; Gravely, 2003; Adelman, 2006; Astin, 1993; Pascarella & Terenzini, 1991). This research has tended to focus on the simple dichotomy of leaving versus staying at the college of initial enrollment. Only a few studies differentiate between students who left the institution but did not transfer, and those who left and transferred to another college. Unlike leavers who did not transfer, those who transfer have not rejected higher education; on the contrary, they have embraced it. These students have specifically rejected the institution of their initial enrollment, so much so that they are willing to undergo the inconvenience and cost of the university application procedure – and more importantly, the difficulty of acclimating to a new setting – a second time.
Entering freshmen who indicate that they are contemplating transfer even before the academic term begins – those we term “at risk for transfer” – warrant particular attention. Considering the substantial amounts of time and money that parents and students use to select a college and those university officials allocate to recruiting and admission processes, one would expect the “right” fit between most new students and their chosen universities. More than one-fourth of students at four-year postsecondary institutions, however, do not complete their college education at the institution where they initially enrolled (Porter, 2002). Therefore, studying students who are at risk for transfer and identifying the pathways that distinguish between those who actually transfer and those who remain enrolled at the initial institution can advance our understanding of student persistence. It can further help university practitioners develop more effective strategies for managing recruitment, admissions, and the first few critical days and weeks after students’ matriculation.
In explaining students’ retention, researchers have frequently relied on a “student-institution fit” perspective. The most well-known and widely used, Tinto’s model, describes the departure decision as depending on the degree of successful student integration into the academic and social structures of an institution (e.g., Cabrera, Castaneda, Nora & Hengstler, 1992; Kahn & Nauta, 2001; Hicks & Lerer, 2003). Academic and social integration are also thought to be influenced by factors such as family background, individual attributes, and pre-college preparation (Tinto 1975, 1987). Adding to the “student-institution fit” perspective are other studies suggesting that financial assistance and students’ certainty in their choice also play important roles in retention (Cabrera, Nora, & Castaneda, 1993; Porter, 2002).
49

Although Tinto theorized that interdependency of academic and social integration, including the existence of different patterns of integration (e.g., high academic integration with low social integration, low academic integration with low social integration), might impact student persistence, only one study has tested the interdependence theory (Tinto, 1997). Moreover, no study has empirically investigated the existence of integration patterns or the possible link between these patterns and student persistence. One reason that such research questions have not been generally examined might be because most studies have concentrated on variable-based relations and analyses (e.g., regression, path analysis) and not person-centered patterns of analyses (e.g., cluster analysis). The use of person-centered techniques such as cluster analysis is necessary to delineate subgroups of individuals who show similar patterns of adjustment across a series of measures, patterns that might be masked by aggregate, sample level variable-centered analyses. The person-centered strategy paints a more holistic picture of students as opposed to a singular focus on the relationships among variables. Tinto’s model of interdependency readily presents potential areas of investigation: What is the persistence of students who do well academically but suffer socially? Are those who do well socially, but do not succeed academically, retained in the institution where they initially enrolled? Which types of students are more likely to transfer? A person-centered cluster analysis can complement the variable-centered approach to answer these questions.
Following the logic of interdependency, this paper focuses on students identified as being “at risk for transfer” upon entry to college. The specific objectives of the paper are twofold: (1) to classify students into different subgroups who shared similar patterns in multiple domains of factors that might influence their decision to stay or transfer, and (2) to examine what subgroups of students were more likely to actually transfer. Guided by Tinto’s model of retention, demonstrated empirical evidence, and variable availabilities1, we selected eight domains of factors to examine student persistence: 1) demographic characteristics, 2) high school preparation, 3) financial assistance received, 4) school desirability/certainty, 5) motivation, 6) self confidence, 7) academic integration, 8) social integration.
Method Data and Sample Descriptions
Data were drawn from three sources: the Cooperative Institutional Research Program (CIRP) Freshman Survey, Adelphi’s institutional files, and National Student Clearinghouse (NSCL) data. The CIRP survey is administered annually during summer orientation to all incoming freshmen. The National Student Clearinghouse provides information about college attendance in most U.S. colleges2 and was used to identify students who transferred from Adelphi to another institution. Demographic and academic preparedness information was obtained from Adelphi’s student database. The final sample for this study consists of all CIRP respondents who could be matched in the other two databases3. Only students who indicated that they were considering transfer to another college before graduating (an item on the CIRP
1 Because secondary data were used, the authors are limited to the variables available in the databases. 2 A very small number of students refuse to have their data released; NSCL also does not track university enrollment in foreign countries. 3 Identifying information on the CIRP survey is available for fewer than half of all respondents, regrettably reducing the sample size.
50

survey) were selected for the study. Four years of CIRP, institutional, and NSCL data (20012002, 2003, and 2004) were combined for the analysis. This resulted in a sample of 743 students, with 132 (18 %) transferring to a different college by the start of their sophomore year. Seventy-one percent were female, 42 percent were ethnic minorities, and 25 percent were firsgeneration college students. Approximately equal proportions of residential and commuter students were
,
t-
in the sample. Measures
Demographic Characteristics: Four demographic variables were used: Gender (male = 1; female = 0), ethnicity (ethnic minority = 1; non-ethnic minority = 0), dormitory residence status (dorm resident = 1; commuter = 0), and first-generation college student status (1 = parents did not attend college; 0 = parents attended college). This latter variable was chosen as an indictor of socioeconomic status.
Academic Preparation: High school GPA was used to measure academic preparation, and was taken from Adelphi’s institutional files.
Financial Assistance Received: Financial assistance was measured by students’ response to a CIRP question inquiring as to the importance of financial assistance as a reason for choosing to attend Adelphi University (continuous variable from 1 = not very important to 3 = very important).
School desirability/certainty: School desirability or certainty was measured by students’ response to a CIRP question inquiring as to whether Adelphi University was their school of first choice (values ranged from 1 = less than 3rd choice to 4 = first choice).
Motivation: A composite of two questions from CIRP was used to depict students’ motivation in college: students’ best guess as to the chances that they would 1) make at least a "B" average, and 2) be satisfied with college. Responses for both questions were on a scale of 1 (no chance) to 4 (very good chance). The Alpha Crobach was 0.68 for this composite measure.
Self Confidence: Respondents in CIRP were asked to rate themselves on the following traits as compared with an average person of their age: academic ability, drive to achieve, math ability, writing ability, intellectual confidence, and social confidence. Responses for all items were on a scale of 1 (lowest 10%) to 5 (highest 10%). A composite score was created and the Alpha Crobach’s was 0.71.
Academic Integration: Academic integration depicted by the first-year cumulative GPA was calculated from Adelphi’s institutional file.
Social Integration: Tinto (1987) has suggested it is important to consider two facets of social integration: other students and faculty. Therefore, two items from CIRP were used to depict students’ social integration: Students’ best guess of the chances that they would, 1) communicate regularly with their professors, and 2) participate in student clubs/groups. Responses for these items were on a scale of 1 (no chance) to 4 (very good chance). The Alpha Crobach’s for this composite measure was 0.63.
51

Data Analysis Strategies K-Mean cluster analysis was used to answer our first research question regarding the
possibility of distinct student subgroups within the “at risk” group. Except for the demographic information, all domains of factors identified previously were used to classify students. Sequential logistic regression was used to answer the second research question: Which subgroups were more likely to transfer? The dependent variable was the departure decision (i.e., transfer versus re-enroll). The independent variables were the student subgroups, which were identified through the cluster analysis. Retention research indicates strong and reliable associations between student retention and their demographic characteristics (Adelman, 2006). To account for these expected associations, gender, ethnicity, family socioeconomic status, and dormitory residence status were included as control variables in all models.
Results Research Question 1: Identifying Student Subgroups
All variables were standardized before conducting the cluster analysis in order to avoid a situation where variables with larger values contribute more to the calculations of distance measures than those with smaller values. Five models consisting of different numbers of clusters (i.e., three-cluster, four-cluster, five-cluster, six-cluster, and seven-cluster) were tested. Although some patterns could be seen with visual inspection of the data when different numbers of clusters were tested, the six-cluster model showed the clearest patterns where the most meaningful interpretations could be made. In addition, the six-cluster solution was validated by conducting a series of ANOVA and post hoc tests. The results showed significant differences among the variables that distinguished among the clusters. Therefore, a six-cluster model for identifying student subgroups was chosen and interpreted. The means and standard deviations of all variables for each cluster, and the results of post hoc tests, are reported in Table 1. [Note: Contact author for figure presenting the means of all variables for each cluster.]
Table 1. Mean Scores of Measures as a Function of Clusters Cluster 1 Cluster 2 Cluster 3 Cluster 4 Cluster 5 Cluster 6 M SD M SD M SD M SD M SD M SD Academic
Preparation 2.67 0.42 3.59a 0.40 2.92b 0.50 3.25 0.39 3.68a 0.31 2.84b 0.38 Financial
Aid 1.78a,bf 0.54 2.65 0.42 1.86a,d,e 0.60 1.75b,d 0.46 2.11 0.44 1.79c,e 0.47 School
Desirability 3.67a 0.47 3.35 0.73 1.47 0.50 3.73a,c,d 0.46 3.84c,e 0.37 3.71b,d,e 0.47 Motivation 3.06a 0.43 3.66 0.33 3.27d 0.42 3.19a,d 0.44 3.67 0.34 3.75c 0.29 One’s
Confidence 3.24a,b,e 0.42 3.86c,d 0.48 3.22a,e,f 0.51 3.19b,f 0.45 3.70c 0.45 3.90d 0.46 Academic
Integration 2.33 0.49 3.44a,b 0.37 2.84c 0.56 3.29a 0.31 3.53b 0.29 2.87c 0.44 Social
Integration 2.97a 0.58 3.65b 0.41 2.84a 0.56 2.54 0.55 3.39c 0.45 3.48b,f 0.48 Note: Scores with the same subscript (letters for analyses between clusters) are not significantly
different from each other but are significantly different from scores with different subscripts or scores without subscripts (p<.05).
52

Cluster one, “poor preparation and low integration,” is characterized by students who had significantly lower scores in academic preparation and academic and social integration4 than the students in the other clusters. Cluster two, “good preparation and high integration/low school desirability,” is characterized by students who had significantly higher scores in academic preparation, academic and social integration, but lower scores in school desirability than the majority of the other clusters. Cluster three, “at risk for low integration/low school desirability,” is characterized by students who had significantly lower academic and social integration scores compared to the “good preparation and high integration/low school desirability” group, but higher scores compared with the “poor preparation and low integration” group. Students in this cluster also had the lowest score in school desirability. Cluster four, “high academic integration and low social integration,” is characterized by students who had significantly lower scores in social integration but equivalent scores in academic integration when compared with “good preparation and high integration/low school desirability.” Cluster five, “good preparation and high integration,” is characterized by having similar scores in academic preparation, academic and social integration compared with cluster two, “good preparation and high integration/low school desirability,” except in the area of school desirability. Cluster six, “at risk for low academic integration and high social integration,” is characterized by students who had lower scores in academic integration, but significantly higher scores in social integration when compared with cluster four “high academic integration and low social integration.”
Students in clusters two and five, which exhibited good preparation and high integration also had higher scores indicating that receiving financial aid was an important reason for attending Adelphi. Students who were in the “at risk for low academic integration and high social integration” cluster also reported a similar level of motivation and confidence as highly integrated clusters. Of the sample, 18 percent (n=135) were in cluster one, 10 percent (n=72) were in cluster two, 7 percent (n=52) were in cluster three, 21 percent (n=155) were in cluster four, 25 percent (n=188) were in cluster five, and 19 percent (n=141) were in cluster six. Research Question 2: Predicting the Likelihood of Transferring
Utilizing sequential logistic regression, we examined the likelihood of a particular cluster to transfer. “Transfer” was coded 1 and “re-enrolled at AU” was coded 0. Student clusters were coded as dummy variables with cluster five (good preparation and high integration) serving as the reference group5. The full model was first run against the dependent variable (departure decision) with independent (student clusters) and control variables (demographic characteristics); it was run again with the independent variable of student clusters dropped. Since the Chi-square difference between these two models was significant, we concluded that the independent variable had an effect on the decision to transfer after the control variables were taken into account. There were significant differences among students’ clusters above and beyond social and economic characteristics (i.e., ethnicity, gender, dormitory residence, and first-generation college student status). The results showed that when compared with the “good preparation and high integration” reference group, the “good preparation and high integration/low school desirability” group was not more likely to transfer. However, when some of the other clusters were compared with the reference group, the likelihood of transfers in the “poor preparation and low integration”
4 Social integration is the only theme, which is not significantly different from cluster three. 5 Based on the descriptive analysis, cluster five has the lowest transfer rate (8.5%) among all clusters. Therefore, it was chosen as the reference group.
53

group was 5.40 times higher, the “low social integration and high academic integration” group was 2.00 times higher, and the “at risk for low academic integration/high social integration” group was 2.34 times higher. The parameter estimates for logistic regression are reported in Table 2.
Table 2. Parameter Estimates for Logistic Regression Odds Ratios Control Variables
Minority 1.18 Gender 1.54 First-Generation College Student 1.07 Resided in Dormitory 1.74
Independent Variables Cluster 1 5.40* Cluster 2 1.25 Cluster 3 4.51* Cluster 4 2.00* Cluster 6 2.34*
Constant 0.30 *p<.05
Discussion
Beyond examining the significant factors affecting students’ departure decision, our
results highlight the notion that patterns of various associated factors matter in determining student persistence. Specifically, consistent with Tinto’s hypothesis, even for a population of students contemplating transfer before entering college, those with a combination of high academic and high social integration were more likely to stay at their initial college. In contrast, among those who were more likely to transfer were those clusters containing individuals who were poorly prepared academically and who were not integrated either academically or socially. Differing from previous findings is that school uncertainty did not appear to be important in the decision to stay or transfer, especially within the context of high academic and social integration. For students who were highly integrated, financial assistance also appeared to be of particular importance in reducing the risk for transferring.
Although evidence in the literature has been mixed regarding the importance of academic and social integration, our results showed that both types of integration are important in determining students’ decision to transfer. In our study, academic integration appeared to have a stronger effect, as students who displayed the pattern of “at risk for low academic integration and high social integration” had a higher likelihood of transferring than those in the “high academic integration and low social integration” cluster. Even though some have argued that social integration is more critical in students’ departure decision and that students sometimes stay in college when they are more socially integrated despite not performing well academically (e.g., Lotkowski, Robbins, & Noeth, 2004), our present results did not support these assertions.
Our divergent results as compared to other studies might be due to the fact that previous studies did not distinguish among different school types. As scholars such as Pascarella and
54

Chapman (1983) have suggested, the explanatory power of student integration differs greatly depending on the type of academic institution students attend (e.g., residential campus or not). Although social integration may play a stronger role in student retention in four-year residential institutions, academic integration has been hypothesized as more important at primarily commuter institutions (Tinto, 1997). Because Adelphi University is mainly a commuter campus and almost three-quarters of all new freshmen reside in the local region (i.e., within a 50 mile radius), we hypothesize that social integration might be relatively less important for them compared with freshmen at residential campuses. Freshmen at Adelphi are not attending college far from home; they already have established social networks in their home towns. The need for on-campus socialization might be less important. We recognize the need for caution when interpreting such results; however, our social integration measures were actually assessing “potential,” not “actual” integration, as CIRP was administered during freshman orientation. Students were only reporting their expectations, not their actual experiences. It is certainly possible that by the end of the freshman year, some of the students not expecting social integration actually integrated into the college’s social life.
Interestingly, students who were in the “at risk for low academic integration and high social integration” cluster reported similar levels of motivation and confidence as the two highly integrated clusters. This result might indicate the possibility of social desirability, since all variables, except for academic integration, were based on self-reporting. Another possible reason might be that students in this cluster were extremely motivated and thought highly of their own abilities. It is possible that although their first-year academic performance was relatively poor, they had been working hard and hoped to excel academically.
Implications for Practice/Future Research By the unique nature of the sample (i.e., students contemplating transfer to another
institution even before their freshman year at Adelphi begins) and utilization of person-centered and variable-centered analytic approaches, our current results provide both practical and methodological implications for student retention.
First, even though some (cited in Porter, 2002) have suggested that school desirability is pivotal in determining whether students stay or leave, our results do not support this argument. Our research provides evidence for Tinto’s hypothesis that students who are more integrated are more likely to stay, despite the fact that the university might not have been their first choice. These results suggest that even when students are not certain about the college they ultimately attend – to the point of contemplating transfer prior to the start of classes – if they are well prepared and the university provides financial assistance, they are more likely to stay than to transfer to another institution. This study also suggests that a person-centered approach such as cluster analysis can discover patterns of adjustment that are important in determining student persistence. Diverse populations of students might display different patterns of adjustment or integration and the link between the patterns and persistence might also differ, as literature has long suggested (Tinto, 1997). This methodology may also be tested on other populations, including community college students and non-traditional (especially older) students.
55

References
Adelman, C. (2006). The toolbox revisited: Paths to degree completion from high school through college. U.S. Department of Education. Washington, DC.
Astin, A. (1993). What matters in college? “Four critical years” revisited. San Francisco: Jossey-Bass.
Braxton, J., Sullivan, A., & Johnson, R. (1997). Appraising Tinto’s theory of college student departure. In J.C. Smart (Ed.) Higher Education: Handbook of theory and research, 12 107-164. New York: Agathon.
Cabrera, A., Castaneda, B., Nora, A., & Hengstler, D. (1992). The convergence between two theories of college persistence. Journal of Higher Education, 63, 143-164.
Cabrera, A., Nora, A., & Castaneda, M. (1993). The role of finances in the persistence process: A structural model. Research in Higher Education, 33, 571-593.
Feldman, K. & Newcomb. T. (1969). The impact of college on students. San Francisco: Jossey-Bass.
Gravely, A. (2003, May). Using logistic regression to assess the impact of first-year experience programs on student retention. Paper presented at the meeting of the Association for Institutional Research Annual Forum, Tampa, FL.
Hicks, R. & Lerer, N. (2003). Does student engagement predict retention: Exploring NSSE data. Paper presented at the meeting of Northeast Association for Institutional Research 30th Annual Conference, Saratoga Springs, NY.
Kahn, J. & Nauta, M. (2001). Social-cognitive predictors of first-year college persistence: The importance of proximal assessment. Research in Higher Education, 42, 633-652.
Lotkowski, V., Robbins, S., & Noeth, R. (2004). The role of academic and nonacademic factors in improving college retention. (ACT Policy Report). Iowa City, IA: ACT, Inc.
Porter, S. (2002). Including transfer-out behavior in retention models: Using the NSC enrollment search data. AIR Professional File: 82.
Pascarella, E. & Chapman, D. (1983). A multi-institutional, path analytic validation of Tinto’s model of college withdrawal. American Educational Research Journal, 20, 87-102.
Pascarella, E. & Terenzini, P. (1991). How college affects students: Findings and insights from twenty years of research. San Francisco: Jossey-Bass.
Stark, J. et al. (1989). Student goals for college and courses: A missing link in assessing and improving academic achievement. ASHE-ERIC Higher Education, 6. The George Washington University: Washington, D.C. (ED 317121).
Strauss, L. & Volkwein, F. (2004). Predictors of student commitment at two-year and four-year institutions. The Journal of Higher Education, 75, 203-227.
Tinto, V. (1975). Dropout from higher education: A theoretical synthesis of recent research. Review of Educational Research, 45, 89-125.
Tinto, V. (1987). Leaving college: Rethinking the causes and cures of student attrition. Chicago: University of Chicago Press
56

CHALLENGING OPPORTUNITIES FOR INSTITUTIONAL RESEARCHERS TO EXCEL IN ASSESSMENT
Anne Marie Delaney
Director of Institutional Research Babson College
Introduction
Increased focus on assessment of student learning in higher education institutions offers new, challenging opportunities for institutional researchers. This paper explores how institutional researchers can maximize these opportunities by: offering methodological guidance in the assessment process; reframing research results in the context of assessment; and designing new studies to produce assessment results. While accreditation requirements may be the initial catalyst for doing assessment, the overall goal should be to design an assessment program that promotes the goals of the institution and enhances student learning. “Scholars propose that assessment strategies that emphasize internal purposes such as institutional improvement rather than external purposes such as meeting state-level or accreditation requirements will foster internal support for assessment and enhance the likelihood of garnering positive impacts from assessment” (Peterson & Einarson, 2001, p. 632).
Part 1: Offering Methodological Guidance in the Assessment Process Opportunities to offer methodological guidance occur throughout the assessment process. The assessment literature offers a rich resource of ideas to guide the institutional researcher throughout the various phases of the assessment process. The following discussion highlights some of these ideas. Planning Phase. Banta (2002) identifies several features that should characterize the planning phase of assessment. These include: involving stakeholders; allowing sufficient time for development; having a written plan with clear purposes related to goals; and basing assessment approaches on clear, explicit program objectives. During this phase, critical principles of assessment need to be addressed. In addition, Banta (2002) notes that a theoretical model can effectively guide the entire assessment process from planning through analysis. Astin (l993) recommends the input-environment-outcome (I-E-O) model with the creation of a longitudinal retention file as the best long-term solution for assessment. This model is based on the assumption that one needs information about incoming student characteristics (inputs) in order to evaluate the impact of educational programs and experiences (environment) on outcomes. Astin (l993) also recommends that an assessment plan be developed during the initial stages of the assessment process as a guide for evaluating proposed assessment activities and to ensure that such activities achieve the goals of the assessment program. The assessment plan should identify factors likely to promote success and strategies to overcome barriers to success.
57

In her chapter, “Moving Assessment Forward: Enabling Conditions and Stumbling Blocks” Banta (l997) identified the following factors as important for creating a climate for success: strong, supportive leadership from the central administration; resources for implementation; an atmosphere of trust; and avenues for communicating results. Potential barriers to success include: lack of faculty support; change in institutional leadership or circumstances; limitations of assessment tools and methods; insufficient involvement of students; and insufficient use of results. Design Phase. Methodological guidance may be most needed during the design phase of the assessment when decisions need to be made regarding the overall approach to assessment; research designs; types of measures for assessing student learning; criteria for evaluating the validity and reliability of these measures; and the choice of analytical techniques for analyzing assessment results. In designing an assessment program one needs to consider whether the assessment will be formative or summative or a combination of the two approaches. While accreditation standards reflect a summative approach to assessment, research indicates that a formative approach is more likely to lead to success in the assessment effort (Peterson & Einarson, 2001). As Kuh, Pace and Vesper (l997, p. 436) observe: “Outcomes data represent what students have learned but they do not necessarily point to student behaviors and institutional practices that produce the outcomes.” Regarding research design, Astin and Lee (2003) caution against the use of a cross-sectional design and propose a longitudinal design, that includes students’ entering characteristics, to make inferences about institutional impact. “When follow-up assessment of undergraduates are coupled with prior input assessments on the same students when they first entered the institution, it becomes possible to measure growth or change in each student, thereby minimizing the risk associated with making causal inferences based only on a one-time assessment” (p. 657-658). To make correct inferences about program effectiveness, it is necessary that the measures be valid and reliable. The institutional researcher can play a critical role here by identifying the types of validity (construct, content, criterion and curricular) and reliability (stability and internal consistency) that should be addressed and the techniques that may be used to determine the measures’ validity and reliability. Another design decision involves the types of measures to be used. There are two broad types of assessment measures: direct and indirect. The former type measures what students have learned and is closely associated with a summative approach to assessment. The latter type assesses the process whereby students learn and is more closely associated with formative assessment. Allen (2004) describes indirect techniques as reports about learning rather than direct demonstrations of learning. A rationale for using indirect measures is that they yield information with which to make sense of the findings of summative assessment and potentially provide clear policy leverage for action. Implementation Phase. Institutional researchers can potentially enhance the success of the implementation phase of assessment by sharing ‘lessons learned’ from the literature. Grunewald
58

and Peterson (2002) found that faculty satisfaction with assessment increased if they perceived that student assessment was central to guiding undergraduate academic program improvement, enhancing students’ achievement and improving faculty instructional performance. Litters and Tompkins (2001) recommend that assessment activity be re-conceptualized according to Ernest Buyers’ scholarship of teaching, as a scholarly process whose products contribute to the broader conversations about teaching and learning. Successful assessment also requires effective collaboration among all involved professionals. Banta and Kuh (l998) contend that improving the quality of the undergraduate experience demands cooperation between the two groups on campus that spend the most time with students: faculty members and student affairs professionals. Some common themes reflected in effective collaboration between faculty and student affairs professionals include: strong administrative commitment to assessment; joint curriculum and assessment planning; campus-wide understanding of the goals for student development; coordination of in-and-out-of-class learning experiences, collaboration in the design and administration of assessment measures; and utilization of assessment findings to improve the entire student experience (Banta & Kuh, l998). Analysis Phase. Institutional researchers can assume a significant role in the analysis phase by offering technical advice and performing competent analyses. Advising on analysis should occur during the initial planning stages. Illustrative guidelines for the analysis include: linking the analysis to assessment questions; focusing on actionable issues; considering both quantitative and qualitative techniques; and outlining the final report during the planning phase. The emphasis should be on simplicity, making meaning of the data and taking the perspective of the audience for the assessment report. Utilization Phase. Elford (l996) describes organizational, information, researcher and decision-maker characteristics that affect utilization and offers ideas to influence these characteristics to promote utilization of assessment information. Particularly pertinent to this paper are the researcher characteristics that may enhance utilization: good interpersonal communication skills; an approachable style; an ability to assess the context of a decision; and professional credibility. Further, assessment information is likely to have the maximum impact when it is tailored to the perceptual style, sophistication and position of the decision makers for whom it is intended (Ewell, l989).
Part 2: Reframing Institutional Research Results in the Context of Assessment An institutional researcher may contribute to assessment by reframing completed institutional research studies in the context of assessment. This section presents excerpts from a report prepared by the author for the College’s upcoming accreditation. The report was organized in five sections: Admissions, Entering Freshmen, Graduation Rates, Graduating Seniors’ Evaluation and Alumni Assessment. The admission section addressed the question: How have the College's selectivity, yield and quality of freshmen changed over time? Selected results, comparing the study College’s data with peer institution norms, are presented in Tables 1, 2 and 3. As shown in Table 1, the College's
59
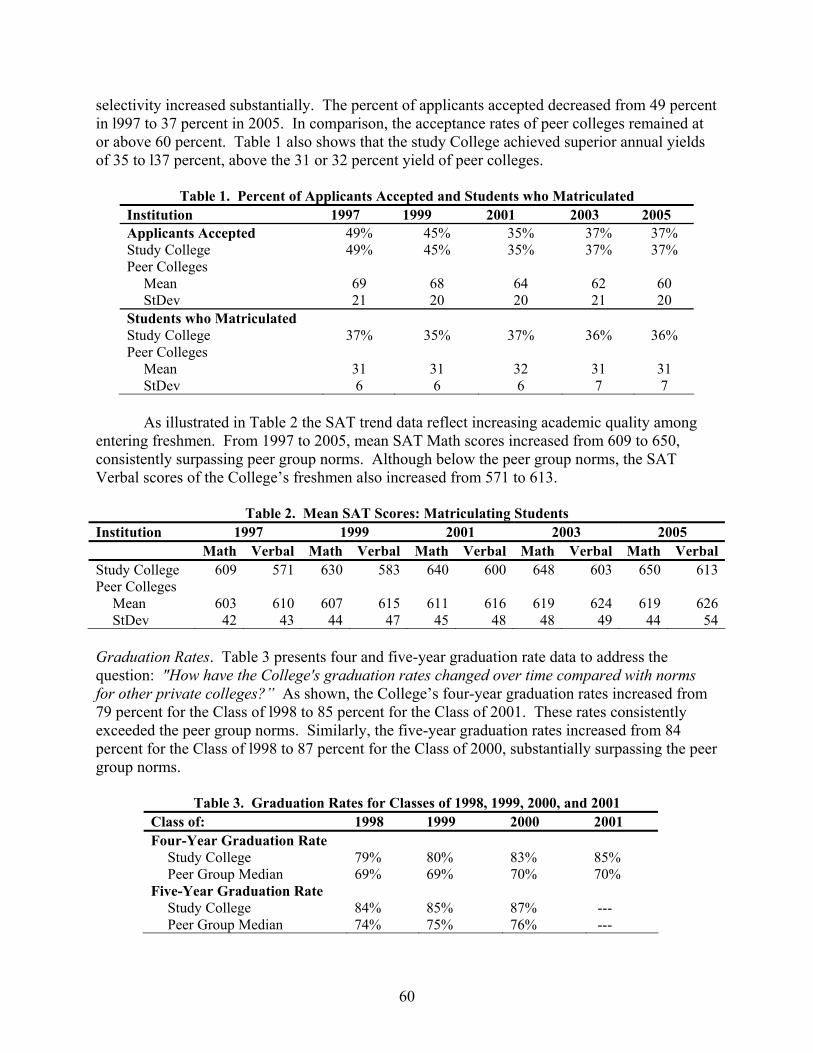
selectivity increased substantially. The percent of applicants accepted decreased from 49 percent in l997 to 37 percent in 2005. In comparison, the acceptance rates of peer colleges remained at or above 60 percent. Table 1 also shows that the study College achieved superior annual yields of 35 to l37 percent, above the 31 or 32 percent yield of peer colleges.
Table 1. Percent of Applicants Accepted and Students who Matriculated Institution 1997 1999 2001 2003 2005 Applicants Accepted 49% 45% 35% 37% 37% Study College 49% 45% 35% 37% 37% Peer Colleges
Mean 69 68 64 62 60 StDev 21 20 20 21 20
Students who Matriculated Study College 37% 35% 37% 36% 36% Peer Colleges
Mean 31 31 32 31 31 StDev 6 6 6 7 7
As illustrated in Table 2 the SAT trend data reflect increasing academic quality among entering freshmen. From 1997 to 2005, mean SAT Math scores increased from 609 to 650, consistently surpassing peer group norms. Although below the peer group norms, the SAT Verbal scores of the College’s freshmen also increased from 571 to 613.
Table 2. Mean SAT Scores: Matriculating Students Institution 1997 1999 2001 2003 2005 Math Verbal Math Verbal Math Verbal Math Verbal Math VerbalStudy College 609 571 630 583 640 600 648 603 650 613Peer Colleges
Mean 603 610 607 615 611 616 619 624 619 626StDev 42 43 44 47 45 48 48 49 44 54
Graduation Rates. Table 3 presents four and five-year graduation rate data to address the question: "How have the College's graduation rates changed over time compared with norms for other private colleges?” As shown, the College’s four-year graduation rates increased from 79 percent for the Class of l998 to 85 percent for the Class of 2001. These rates consistently exceeded the peer group norms. Similarly, the five-year graduation rates increased from 84 percent for the Class of l998 to 87 percent for the Class of 2000, substantially surpassing the peer group norms.
Table 3. Graduation Rates for Classes of 1998, 1999, 2000, and 2001 Class of: 1998 1999 2000 2001 Four-Year Graduation Rate
Study College 79% 80% 83% 85% Peer Group Median 69% 69% 70% 70%
Five-Year Graduation Rate Study College 84% 85% 87% --- Peer Group Median 74% 75% 76% ---
60

Graduating Seniors’ Evaluation. Senior survey trend data from l997 through 2005 were analyzed to address the question:
To what extent do students think their undergraduate education enhanced their abilities and talents? Results, presented in Table 4, reveal that seniors consistently perceived a positive impact of their education on their ability to gain in-depth knowledge; acquire new skills and knowledge; and think analytically. They also perceived a positive influence on their ability to be effective team members, use computers, and lead and speak in public. In contrast, seniors perceived significantly less effect of their education on their ability to understand the process of science, read or speak a foreign language and appreciate the arts. These data provide indirect evidence for assessment of student learning.
Table 4. Graduating Seniors’ Assessment of Study College’s Influence on Student Competencies and Growth
Mean Rating Competencies 1997 1999 2001 2003 2005 Overall F-ratio Intellectual Growth
Acquire New Skills and Knowledge 3.37 3.28 3.62 3.58 3.64 3.54 16.95*** Think Analytically and Logically 3.46 3.29 3.25` 3.22 3.21 3.29 4.94*** Gain in Depth Knowledge of a Field 3.41 3.30 3.26 3.15 3.18 3.26 3.91*** Intellectual Self-Confidence --- --- 3.16 3.15 3.06 3.12 2.40*
Leadership/Teamwork/Creativity Team Member/Cooperativeness+ 3.56 3.40 3.11 3.60 3.53 3.50 17.70*** Leadership 3.35 3.35 3.33 3.35 3.28 3.35 1.75 Formulate-Creative Ideas 3.19 3.05 2.95 2.88 2.92 3.03 7.14***
Numeracy Use Computers 3.53 3.48 3.52 3.36 3.31 3.44 4.11*** Use Quantitative Tools/Math Ability+ 2.90 2.99 2.53 3.04 3.00 2.99 19.01*** Evaluate Role of Science and Technology --- 2.06 2.76 2.46 2.32 2.43 19.81*** Understanding the Process of Science --- 1.68 2.06 2.01 1.83 1.93 10.66***
Rhetoric Oral Communication/Public Speaking+ 3.44 3.30 3.24 3.29 3.36 3.34 2.51* Write Effectively 3.10 2.91 2.98 2.81 2.78 2.91 6.03***
Ethics and Social Responsibility Identify Moral and Ethical Issues 2.71 2.48 2.63 2.71 2.67 2.69 5.20*** Develop Awareness of Social Problems --- 2.26 2.34 2.41 2.28 2.35 1.20
International/Multi-Cultural Perspective Relate Well to people of Different Races 2.96 2.76 --- 2.79 2.59 2.79 6.13*** Read or Speak a Foreign Language 1.49 1.46 1.65 1.55 1.52 1.58 2.07*
Personal Growth Understand Myself 3.19 3.07 2.94 2.96 2.87 2.99 5.79*** Social Self-Confidence --- --- 2.95 2.97 2.87 2.92 2.79* Understand Others --- --- 2.91 2.88 2.87 2.90 2.69* Appreciate the Arts 1.98 1.82 2.12 2.05 1.97 2.01 3.67***
Notes: These mean rating are based on the following scale: 1 ‘not at all,’ 2 ‘a little,’ 3 ‘moderately,’ and 4 ‘greatly.’
+ the second item was used in the 2001 survey. • p<.05; ***<=.001
61
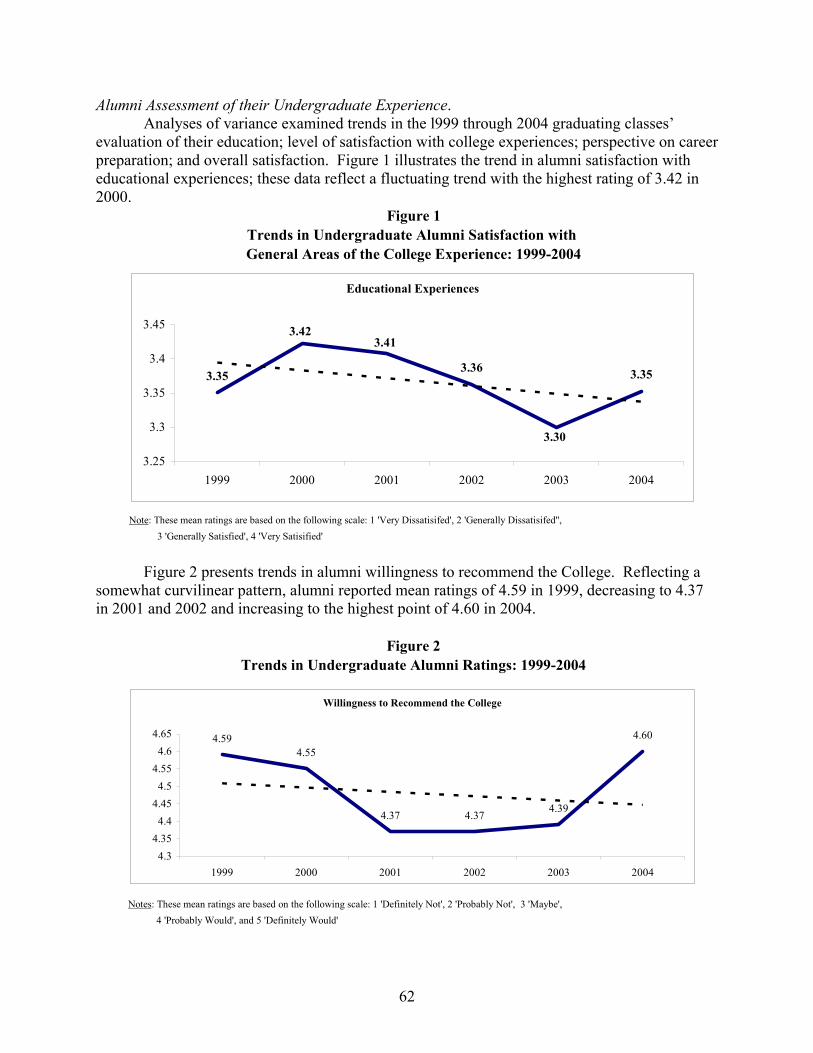
Alumni Assessment of their Undergraduate Experience. Analyses of variance examined trends in the l999 through 2004 graduating classes’
evaluation of their education; level of satisfaction with college experiences; perspective on career preparation; and overall satisfaction. Figure 1 illustrates the trend in alumni satisfaction with educational experiences; these data reflect a fluctuating trend with the highest rating of 3.42 in 2000.
Note: These mean ratings are based on the following scale: 1 'Very Dissatisifed', 2 'Generally Dissatisifed'', 3 'Generally Satisfied', 4 'Very Satisified'
Figure 1Trends in Undergraduate Alumni Satisfaction with General Areas of the College Experience: 1999-2004
Educational Experiences
3.353.36 3.35
3.30
3.413.42
3.25
3.3
3.35
3.4
3.45
1999 2000 2001 2002 2003 2004
Figure 2 presents trends in alumni willingness to recommend the College. Reflecting a somewhat curvilinear pattern, alumni reported mean ratings of 4.59 in 1999, decreasing to 4.37 in 2001 and 2002 and increasing to the highest point of 4.60 in 2004.
Notes: These mean ratings are based on the following scale: 1 'Definitely Not', 2 'Probably Not', 3 'Maybe', 4 'Probably Would', and 5 'Definitely Would'
Figure 2Trends in Undergraduate Alumni Ratings: 1999-2004
Willingness to Recommend the College
4.594.55
4.37 4.37 4.39
4.60
4.34.35
4.44.45
4.54.55
4.64.65
1999 2000 2001 2002 2003 2004
62

Part 3: Designing New Studies to Produce Assessment Results By focusing on assessment in the design phase of new studies, institutional researchers can enhance the relevance of their work to assessment. This section presents a research model the author employed to design and conduct an assessment focused senior survey. The application of this model is fully explored in a recent publication, Expanding Students' Voice in Assessment through Senior Survey Research (Delaney, 2005). The paper illustrates how the study was designed to reflect institutional and program goals; how analyses were conducted to produce indirect assessment data; and how results were translated into strategic policy recommendations. The following paragraphs highlight the major steps in this model. 1. Review the institutional mission. A college mission statement reflects the institution’s vision and values. It serves as a focal point for program planning and therefore provides a useful reference in an assessment study. The study College’s mission is to be an internationally recognized leader in management education. Through its programs and practices, the College educates innovative leaders capable of anticipating, initiating, and managing change. In a climate of entrepreneurial spirit, creative and analytical thinking, global perspectives, continuous learning and social responsibility, men and women of different cultures, origins, and life stages learn together to define the opportunities of the future. The goals articulated in this mission statement are reflected in the undergraduate curriculum, and several were operationally defined in the senior survey. 2. Identify the goals of the undergraduate academic program. Undergraduate program publications were used to identify academic program goals. The following five competencies of the undergraduate curriculum defined the goals: leadership/ teamwork/ creativity, rhetoric, numeracy and technology, ethics and social responsibility, and international/multi-cultural perspectives. Questionnaire items were generated to represent these competencies and additional items were created to address intellectual and personal growth goals of a college education. 3. Define the major components of the undergraduate student life experience. College publications were used to identify the major components of student life, including the academic program, residential life, campus life, student services and other college resources. 4. Develop a means to evaluate academic goal achievement and satisfaction with student life. A customized senior survey was designed for this study. The major section focused on students’ evaluation of their education with respect to goals accomplished and level of satisfaction experienced. Specific questionnaire items were created in each of these major areas. For example, academic experience items included the quality of course instruction, faculty attitude and availability, academic advising, and availability of courses. Additional questions solicited information about students’ participation in college experiences, career values, educational and career plans, and demographic and academic background information. Most items were common to a consortium senior survey, thus providing a basis for comparison with peer institutions. 5. Design a statistical analysis plan to address planning and policy issues. The analyses followed a systematic plan, focusing first on univariate results in summary form. Next, bivariate analyses were conducted to identify relationships between individual student characteristics and
63

assessment and satisfaction. Analysis of variance was employed to answer the questions: How have graduating seniors’ evaluation and levels of satisfaction changed over time? Are there significant differences in evaluation and satisfaction between male and female and between domestic and international students? Multiple regression was used to predict overall satisfaction and to simulate how improvements in one area might increase overall satisfaction. Logistic regression was utilized to predict the probability of choosing the same institution and to assess how changes in one area would affect students’ decision to choose the same college again. 6. Translate the results of the study into recommendations for planning and policy development. To ensure an impact on policy, results were translated into twelve strategic policy recommendations. Five recommendations advocated improvements and seven recommendations suggested ways positive results could enhance the institution’s reputation.
Conclusion This paper presents the increased focus on assessment in accreditation as a challenging opportunity for institutional researchers. To meet this challenge, institutional researchers must have the required methodological expertise and take the initiative to influence the quality and effectiveness of assessment by offering methodological guidance; reframing their work in the context of assessment; and designing new studies responsive to accreditation requirements on assessment. Ideas and strategies presented in this paper elaborate on a previous recommendation that institutional researchers increase involvement in the academic arena by conducting research to inform academic policies and support various constituencies, including accrediting boards, educational policy committees, academic deans, and faculty members (Delaney, l997).
References
Allen, M. (2004). Assessing academic programs in higher education. Bolton, MA: Anker Publishing Company.
Astin, A. W. (1993). Assessment for excellence. Phoenix, AZ: American Council on Education and The Oryx Press.
Astin, A.W. & Lee, J. J. (2003). How risky are one-shot cross-sectional assessments of undergraduate students? Research in Higher Education 44 (6), 657-672.
Banta, T. W. (1997). Moving assessment forward: Enabling conditions and stumbling blocks. New Directions for Higher Education 25 (4), 79-91.
Banta, T. (2002). Building a scholarship of assessment. San Francisco, CA: Jossey-Bass. Banta, T. W. & Kuh, G. D. (1998). A missing link in assessment: Collaboration between
academic and student affairs professionals. Change 30 (2), 40-46. Delaney, A. M. (1997). The role of institutional research in higher education: Enabling
researchers to meet new challenges. Research in Higher Education, 38(1), 1-16. Delaney, A. M. (2005, Summer). Expanding students' voice in assessment through senior survey
research. Association for Institutional Research Professional File, No. 96. Elford, I. C. (1996). Utilization of student outcomes assessment information in Institutional
decision making. International Journal of Educational Management 10 (3), 36-45.
64

Ewell, P. T. (1989). Information for decision: What’s the use? New Directions for Institutional Research, 64, 7-19.
Grunwald, H. & Peterson, M. W. (2002, June). Factors that promote faculty involvement in and satisfaction with institutional and classroom student assessment. Paper presented at the Annual Forum of the Association for Institutional Research, Toronto, Canada.
Kuh, G. D., Pace, C. R. & Vesper, N. (1997). The development of process indicators to estimate student gains associated with good practices in undergraduate education. Research in Higher Education 38 (4), 435-454.
Litterst, J. K. & Tompkins, P. (2001). Assessment as a scholarship of teaching. Journal of the Association for Communication Administration 30, 1-12.
Peterson, M. W. & Einarson, M. K. (2001). What are colleges doing about student assessment? Does it make a difference? The Journal of Higher Education 72(6), 629-669.
Tinto, V. (1997). Classrooms as communities: Exploring the educational character of student persistence. Journal of Higher Education, 68, 599-623.
Wlodkowski, R., Maudlin, J., & Gahn, S. (2001) Learning in the fast lane: Adult learners’ persistence and success in accelerated college programs. (New Agenda Series, 4:1). Indianapolis, IN: Lumina Foundation for Education.
65

A THUMB ON THE SCALE? ABILITY, INCOME, AND DEGREE COMPLETION IN A PUBLIC UNIVERSITY1
Michael J. Dooris Marianne Guidos
Office of Planning and Institutional Assessment The Pennsylvania State University
Abstract: This paper examines academic ability, ability to pay, and degree completion for bachelor’s degree students at a large, selective public university. We ask: How does the path to a degree compare for low-income and high-income students of similar academic ability? Does income act as a “thumb on the scale?” The evidence analyzed here suggests that it does, and that the disadvantage to lower-income students is more pronounced than some prominent higher education observers’ claim.
Affordability, Participation, and Degree Completion
The literature on access and affordability presents two competing views. Some say that
lower-income students are increasingly being priced out, especially from top-tier institutions. Others argue that participation is largely a success story for higher education.
The View that Lower-Income Students Are Being “Priced Out”
National data suggest that participation and persistence have long been related to income, and that the situation has become more pronounced since the late 1970s and early 1980s. For example, overall participation rates moved from about 70 percent to about 90 percent for students from the top income quartile during that period, while fluctuating at around 50 percent or so for the bottom income quartile (Fitzgerald & Delaney, 2002).
Carnevale and Rose (2003) have provided dramatic evidence on how ability to pay relates to access, especially in selective colleges and universities. Consider the numbers 146, 74, and 3. The figure 146 represents the number of top-tier colleges and universities in the U.S.; this is based on several of the usual metrics, including entering students’ high school grades, SAT scores, and acceptance rates, (those 146 institutions include the university, Penn State on which we focus in this paper). Seventy-four percent is the proportion of students at these 146 highly selective institutions who came from families in the top socioeconomic quartile. In addition, just 3 percent of students at these colleges and universities came from the bottom socioeconomic quartile.
Carnevale and Rose’s analysis includes SAT and high school grades, parental income,
admissions preferences, and more, and it delivers a clear and stark message. Socio-economic background appears to be an extremely important factor in terms of who goes to America’s best colleges and universities. “The reality that many high school students from low-SES families are 1 This analysis represents an ongoing collaboration with Anna Griswold, Penn State’s Assistant Vice President for Undergraduate Admissions and Executive Director for Student Aid, and her staff.
66

qualified for college but do not attend or attend but go to colleges that are less selective than their qualifications justify is not widely recognized” (Carnevale & Rose, 2003, p. 41). “The conventional view that academic preparation is a monolithic barrier to access and choice among low-SES students is greatly overstated” (Carnevale & Rose, 2003, p. 38). “There is even less socioeconomic diversity than racial or ethnic diversity at the most selective colleges” (Carnevale & Rose, 2003, p. 11).
Those findings are buttressed by Thomas Mortensen’s Postsecondary Education OPPORTUNITY, which looks across American higher education, mostly via analyses of large national datasets compiled by the U.S. Census Bureau and the National Center for Education Statistics. Mortensen’s results over many years have illustrated that at every stage on the path to a baccalaureate, “family income plays a strong, positive role” (for example, see “The Track to a Bachelor’s Degree from College,” 2001, p.1).
Don Heller is cited perhaps as widely as anyone working on the intersection of policy, affordability, access, and accountability. In testimony to U.S. Congress, he referenced a vast body of research confirming that “lower income students are the most sensitive to rising tuition prices, and they are the first to be priced out” (Heller, 2005, p. 17); that “highest income students have very little price sensitivity” (Heller, 2005, p. 17); that a recent federal report shows “that over 400,000 high school graduates who are academically qualified to attend a four-year college are unable to do so because of cost barriers” (Heller, 2005, p. 19); and that research “has demonstrated that merit aid is awarded disproportionately to students from higher income families, many of whom do not need that assistance to be able to go to college” (Heller, 2005, p. 19).
On that last point, Heller (2005) has also noted that “in 2003-04, institutions awarded more than $2 billion in grant aid to dependent students with family incomes in excess of $108,000, or approximately twice the median family income of all dependent students in the nation in that year” (p. 2). He recommended, “That these institutions conduct an evaluation of their own financial aid programs to determine whether they are working in consort with the goal of expanding access for underserved populations, or whether they are simply rewarding wealthier students who have had many social, financial, and academic advantages in the years before they went to college” (Heller, 2006, pp. 2-3).
Similarly, as reported in The Chronicle of Higher Education (Leubsdorf, 2006), many students at four-year public colleges and universities face a gap between their ability to pay for college and the cost of attending, even with money from financial aid. Sixty-three percent of students do not have enough money – from their family's expected contribution plus financial aid – to cover tuition and other expenses of attending college (those figures are based on data from a national 2003-04 survey of colleges and universities by the National Center for Education Statistics). The same report looked at students who do have enough money to pay for college yet receive financial aid anyway, noting that students from upper-income families, earning an average of $89,400 a year, had $3,400 more than necessary to pay for college without loans and $6,000 with loans. In other words, nationally, many students are not having their financial need met, while many are receiving aid but really do not have need.
67

The View that Access Is “Largely a Success Story”
On the other hand, some recent prominent reports have suggested that higher education is largely effective in terms of affordability, participation, and degree completion. In the 2005 book Equity and Excellence in American Higher Education, Bowen, Korowai and Tobin examined whether participation and outcomes differ according to the academic ability and socioeconomic status of students at 19 of the nation’s more selective private and public institutions (again, that dataset included Penn State). Bowen and his colleagues wrote that students from low-income families do appear to be disadvantaged, but only to a small extent. They saw “basic equality” (p. 134) and concluded that a “consistent pattern suggests that socioeconomic status does not affect progression” from application through admission, enrollment, and graduation (p. 100).
Similarly, a 2006 policy report (A Rising Tide, directed by Robert Zemsky at the University of Pennsylvania) concluded that higher education in Pennsylvania is expensive but affordable. That message was essentially positive, intended to “give pause to those who believe American higher education has a cost crisis or that the tuitions that colleges and universities charge are thwarting the opportunities of young people in large numbers” (The Education Policy and Leadership Center and Learning Alliance for Higher Education, 2006, p. 39). Those authors wrote that “higher education in Pennsylvania is largely a success story” and that public higher education in the Commonwealth of Pennsylvania is “largely effective” in terms of participation and degree completion” (pp. 6-7).
Looking at the Evidence from One Public University
The literature’s competing perspectives led us to examine how family income relates to access and degree completion at Penn State. Overall, the university’s average graduation rates are high. The six-year rate is 84 percent at the flagship campus (a lower university-wide rate of 66 percent reflects a 53 percent graduation rate at other campuses, whose mission includes a two-year role for some location-bound students). However, those averages describe students in general; what can the evidence tell us about lower income students, in particular?
Research Design and Data Sources
For the purposes of this study, we focus on academic ability and ability to pay in relation to participation and degree completion. We have chosen this focus because much research indicates that these considerations are important. Also, they are of great practical interest in terms of, for example, how an institution structures its aid, whom it admits, and the objectives it sets for fundraising. We use family income, drawn from the Free Application for Federal Student Aid (FAFSA), as our measure of ability to pay. We use freshmen fall-semester GPA as our measure of academic performance (basically, this is first-semester GPA; a small number of students have some summer session courses on their transcripts as well.) Numerous retention and degree attainment studies in the past have found that first-semester and first-year grades play a significant part in explaining degree completion (Adelman, 2006; Desjardins, Kim & Rzonca, 2003; Reason, 2003).
68

Data Sources
The cohort we are studying includes 11,930 full-time baccalaureate students who began at Penn State at any of the 19 campuses relevant to this study in summer or fall 1999. We tracked those students through summer 2005 to determine six-year graduation rates. We mostly use internal Penn State electronic databases, such as transcript and financial aid files. A FAFSA figure for Expected Family Contribution – which is, of course, the amount a family is expected to contribute toward the cost of college – is available for about 80 percent of Penn State’s bachelor’s degree students. We also examine data from the National Student Clearinghouse to explore what happened, academically, to students who did not graduate from Penn State.
Analysis and Results
Of the 11,930 full-time baccalaureate students who began at Penn State in 1999, 7,923 (66 percent) had graduated by 1995. This paper analyzes the relationship among ability to pay, academic ability, and graduation rates for those students, and whether Penn State non-completers subsequently enrolled elsewhere. It also summarizes the results of regressing twelve different variables onto graduation.
Entering Students and Family Income
We have cited several reports that link participation with socioeconomic status and/or family income. An obvious first-cut question is whether this applies at Penn State, which (like all public universities) traditionally sees access as an important part of its mission.
Table 1 relates Penn State’s entering students and their 1998 reported family income from
FAFSA to the U.S. family income distribution for the same period. Income data were not available for 2,605 students; they are not included in the quintiles. Table 1 shows that at Penn State, family income is not as strongly related to the makeup of the entering class as might be expected based on the profile of the nation’s 146 most selective colleges and universities. Nonetheless, Table 1 shows that at Penn State, lower-income students are proportionally under-represented and higher-income students are over-represented.
Table 1. Distribution of Penn State 1999 First-time Full-time Cohort
By National Family Income Quintiles
U.S. Family IncomeQuintile, 1998 dollars1
# Students within Income Range
% Students within Income Range
Lowest fifth $0 - $21,599 974 10.4%Second fifth $21,600 - $37,692 1,343 14.4%Middle fifth $37,693 - $56,019 1,682 18.0%Fourth fifth $56,020 - $83,690 2,530 27.1%Highest fifth $83,691 and higher 2,796 30.0%
1 Source: U.S. Census Bureau (2004)
69

Ability to Pay, Academic Ability, and Graduation Rates
Table 2 summarizes family income data for all students in Penn State’s fall 1999 entering cohort who completed the Free Application for Federal Student Aid (FAFSA). As shown (and realizing that many of the students who do not complete the FAFSA are probably from higher-income families), 20 percent of these Penn State freshmen came from families with incomes of $32,454 or less; 20 percent came from families with incomes of $98,013 or more.
Table 2. Family Income (from FAFSA; N=9,326)
Family Income
Lowest Quintile $0 - $32,454
2nd Lowest Quintile $32,471 - $53,343
Middle Quintile $53,350 - $72,427
4th Quintile $72,431 - $98,009
Highest Quintile $98,013 - $1,028,997
Table 3 shows the distribution of first-fall semester grade point averages.
Table 3. Fall 1999 Grade Point Averages (N= 11,930)
Fall 1999 GPA
Lowest Quintile 0.00 – 2.29
2nd Lowest Quintile 2.30 – 2.79
Middle Quintile 2.80 – 3.14
4th Quintile 3.15 – 3.50
Highest Quintile 3.51 – 4.00
Table 4 maps graduation rates onto the high and low-income quintiles from Table 2 and the high and low GPA quintiles from Table 3. The resulting contrasts are pronounced. As shown, 89 percent of high-income, high-GPA students graduate within six years. That contrasts with the 72 percent graduation rate for low-income students of similar academic ability, for a difference of 17 percentage points. In addition, although the absolute graduation rates for low GPA students are much lower, at 36 percent and 20 percent, the difference between the graduation rates of high-income students and low-income students is very similar, at 16 percentage points.
Table 4. Six-Year Graduation Rates
By Academic Ability and Ability to Pay
High 72%
89% Academic
Ability
20%
36%
Low High Ability to Pay
70

Space does not permit showing detailed data that break down Table 4’s results for Penn State’s various colleges and campuses. However, we have examined those data, and strikingly similar patterns occur throughout the university. That is, almost regardless of how we define groups of students – high ability, low ability, by college, by campus – high-income students graduate at rates about 15 to 20 percentage points higher than do low income students of similar academic ability.
Multivariate Analysis of Factors Relating to Degree Completion
Because a considerable body of research suggests that many factors (high school GPA,
standardized test scores, residence on- or off-campus, study skills, and so on) relate to degree completion, we conducted a multivariate analysis on the dataset for 11,930 Penn State students. Since the outcome of interest is dichotomous – someone graduated or they did not – we use logistic regression for this analysis.
The dependent variable is graduation within six years. In building models and choosing variables, we ran Pearson correlation analyses and eliminated variables with correlation coefficients of 0.3 or greater to reduce collinearity (this removed Pell recipient status as a variable; it was highly collinear with income). A full analysis of twelve possible predictors of graduation was modeled, and a stepwise model was also run on these twelve variables. In addition, because the profile of students who start at the University Park campus differs from those who start at Penn State’s other campuses, separate models (both full and stepwise) were run for University Park and other campuses (that is, rather than using campus location as one of twelve independent predictors of graduation). Table 5 summarizes the test results for the full model, for all campuses.
Table 5. Factors Relating to Six-Year Graduation (All Penn State Campuses)
Variable Coefficient Wald χ 2 Odds Ratio Age in Fall 1999 (15-45 years) -0.0597 2.9569 0.942 Gender (female=0) -0.1117 *3.9206 0.894 Minority (minority=0) -0.0411 0.2417 0.960 First generation (no=0) -0.1065 3.3588 0.899 Residency (Pennsylvania=0) -0.3042 ***11.5094 0.783 Fall semester gap (0.00-4.00)1 1.1492 ***774.6980 3.156 High school class rank (in percentiles, 2-99) 0.0089 ***31.5127 1.009 SAT score (50-point increments) -0.0114 1.1500 0.989 Total financial aid (in $1,000’s) -0.0060 0.7795 0.994 Family income (in $10,000’s) 0.0468 ***34.6123 1.048 On- or off-campus (off-campus=0) 0.8148 ***135.3860 2.259 Campus (non-University Park=0) 0.6144 ***57.3922 1.849 Model χ 2 = 1622.7212 *** Nagelkerke R 2 = 0.3573
* p<.05 ** p<.01
d.f. = 12 *** p<.001 Concordant (predicted to observed) = 80.6%
1 The GPA increment is a full point – for example, the difference between a 2.50 and 3.50.
71

Overall Model Fit
As shown in Table 5, the Nagelkerke R2 was 0.3573 for the full model. This was the highest R2 of any of our models. This model was able to predict 80 percent of the observed cases. The model χ 2 statistic indicates that the model is significant overall.
Coefficients and Odds Ratios Logistic regression coefficients estimate the change in the log-odds of the outcome based on
a one-unit change in an independent variable. Those estimates are not easily interpreted, except for the fact that coefficients may be positive or negative; a positive coefficient indicates an increase in the log odds of the dependent variable while a negative coefficient indicates a decrease. So, for example, in Table 5, the results for gender show a lower likelihood of graduation for males, since that parameter estimate is negative (-0.1117) and gender is coded as male = 1.
Although the mathematics behind odds ratios are not intuitive (they represent an
exponential log transformation of the coefficients), odds ratios themselves are quite easy to interpret. The odds ratios for independent variables in this logistic regression represent the difference in the odds of graduating based on a one-unit change in an independent variable. For instance, in Table 5, the odds ratio for gender is 0.894. Thus, the odds for males graduating is just 0.894 that of the odds of females graduating. Likewise, the odds ratio for cumulative GPA in Table 5 of 3.156 suggests that the odds of graduating increase by 3.156 (that is, by 215.6 percent) for a full-point increase in GPA. The relative magnitude of the association between the dependent variable and each dichotomous independent variable can be readily compared. For example, the odds ratios of 0.894 for gender and 0.783 for residency indicate that there is a greater negative impact associated with being out-of-state than with being male. Because continuous variables such as age, aid amounts, and family income have more than two possible outcomes, their odds ratios cannot be compared as easily.
Significant Predictors
The likelihood of graduating in six years appears to be positively and significantly
associated with the following student characteristics (as shown in the results for the Wald χ 2 statistics in Table 5):
* female * higher family income * in-state resident * living on campus * higher first-semester GPA * University Park location (versus other campuses) * higher high-school class rank The logistic regression results confirm that academic ability and income are related to the
likelihood of graduation. Increases in both first-semester GPA and high school class rank both relate significantly to improved odds of graduation. For instance, every $10,000 increase in family income raises the odds of graduation by 4.8 percent.
72

The following student characteristics appear not to be statistically significant: age, minority/non-minority, first-generation status, SAT score, and total aid. This means that, for example, that we would not expect different graduation outcomes for minority and non-minority Penn State students who are similar in other respects, such as high school class rank, family income, and so on.
Alternative Logistic Regression Models
As noted, separate models (both full and stepwise) were also run for the University Park
flagship campus and other campuses. Those results are not tabulated in this paper because the findings are primarily of interest to an internal, Penn State audience. But in brief, all the models were significant based on the χ 2 statistic, and all were able to correctly predict at least 75 percent of the observed cases. The Nagelkerke R2 statistic ranged from 0.2512 to 0.3559 for those other models. In general, when campus location was withdrawn as a variable and the analyses separated by location, the results were similar in terms of the direction and significance of the other variables. The only exception was gender, which was a significant predictor in the full model. When the analyses were separated, gender was no longer statistically significant for students at University Park. At other locations, gender remained significant; at non-University Park campuses, females continued to have higher odds of graduation than did males.
Non-Completers and Subsequent Enrollment at Other Institutions
Determining all the reasons why students enrolled at Penn State but left before earning a
degree is beyond the scope of this paper. But we have explored whether students who left Penn State continued their education at other institutions, and how income levels and academic ability related to those enrollment patterns.
Table 6 presents data extracted from the National Student Clearinghouse, which is a comprehensive database of students enrolled at over 2,800 colleges and universities. At the time of this study, participating two-year and four-year colleges and universities, along with other trade and vocational institutions, enrolled 91 percent of the students in higher education in the United States. The Clearinghouse provides information on whether students who left Penn State subsequently attended other institutions of higher education.
As shown in Table 6, 61 percent of the students at the highest income level enrolled at another school compared to 43 percent of those at the lowest income level. In other words, the majority of the university’s non-completers are not dropping out of higher education. However, these data provide evidence that, once again, income matters. Within each level of academic ability, greater proportions of higher income students re-enrolled at other institutions than did lower income students.
73

Table 6. Enrollment Rates at Other Institutions for Penn State Non-Completers1
Lowest Income Quintile
2nd Lowest Income Quintile
Mid Income Level
Quintile
2nd Highest Income Quintile
Highest Income Quintile Total
Fall 1999 GPA Quintile #
Non
-co
mpl
eter
s %
Enr
olle
d El
sew
here
# N
on-
com
plet
es
% E
nrol
led
Else
whe
re
# N
on-
com
plet
es
% E
nrol
led
Else
whe
re
# N
on-
com
plet
es
% E
nrol
led
Else
whe
re
# N
on-
com
plet
es
% E
nrol
led
Else
whe
re
# N
on-
com
plet
es
Lowest GPA 388 43% 234 49% 234 53% 203 54% 185 62% 1,244 2nd Lowest 172 36% 149 48% 149 44% 144 41% 137 62% 751 Mid-GPA 131 44% 114 52% 99 55% 102 47% 90 56% 536 2nd Highest 84 48% 96 59% 92 61% 90 58% 72 54% 434 Highest GPA 76 58% 82 62% 66 70% 60 72% 57 74% 341
Total 851 43% 675 52% 640 54% 599 52% 541 61% 3,306 1. 701 non-completers did not have income data available; those students are not included in this table.
Conclusions and Practical Implications
Some have argued, and we believe, that America’s colleges and universities do a very good job for most students. Nonetheless, it appears to us that it is reasonable to examine closely whether, and to what extent, a particular segment of students – those from lower-income families – may be systematically and materially disadvantaged in earning a degree from the most selective higher education institutions in the United States.
This paper has examined the evidence on academic ability, ability to pay, and degree completion in detail. We have used four different approaches to explore a detailed source of objective data for nearly 12,000 students in a selective public university. Our results are clear and consistent. When other factors are taken into account, differences in ability to pay relate substantively and significantly to the likelihood that students will graduate in six years.
Analyses such as this can inform decisions about admissions, financial aid, fundraising, and
the mix of need-based and merit-based aid. These matters are of great importance for higher education, and for the students and families that the nation’s public universities and colleges serve.
References Adelman, C. (2006). The toolbox revisited: Paths to degree completion from high school through
college. Washington, D.C.: U.S. Department of Education. Bowen, W. G., Kurzweil, M. A., & Tobin, E. M., in collaboration with Pichler, S. C. (2005).
Equity and excellence in American higher education. Charlottesville, VA: University of Virginia Press.
Carnevale, A. P. & Rose, S. J. (2003). Socioeconomic status, race/ethnicity, and selective college admissions. New York: The Century Foundation.
74

DesJardins, S. L., Kim, D. O., & Rzonca, C. S. (2003). A nested analysis of factors affecting bachelor's degree completion. Journal of College Student Retention 4(4), 407-435.
The Education Policy and Leadership Center and Learning Alliance for Higher Education. (2006). A rising tide: The state of higher education in the Commonwealth of Pennsylvania. Philadelphia, PA: The University of Pennsylvania.
Fitzgerald, B. K. & Delaney, J. A. (2002). Educational opportunity in America. In D. E. Heller (Ed.), Condition of Access. Westport, CT: Praeger.
Heller, D. E. (2006, September). The elephant in the student aid office. Inside Higher Ed, pp. 1-3. Retrieved October 18, 2006 from http://www.insidehighered.com/views/2006/09/25/heller
Heller, D. E. (2005, April 19). College access: Is government part of the solution, or part of the problem? Hearing testimony before the Committee on Education and the Workforce, U.S. House of Representatives, One Hundred Ninth Congress. Washington, D.C.: U.S. Government Printing Office.
King, J. E. (2002) Crucial choices: How students’ financial decisions affect their academic success. Washington, D.C.: American Council on Education.
Leubsdorf, B. (2006, June 9). College 'affordability gap' hits lower-income students hardest, report says. The Chronicle of Higher Education. Retrieved June 9, 2006, from http://www.chronicle.com
Reason, R. D. (2003). Student variables that predict retention: Recent research and new developments. NASPA Journal 40(4), 172-191.
The track to a bachelor’s degree from college. (2001, March). Postsecondary Education OPPORTUNITY, 105.
U.S. Census Bureau (2004, July 14). Percent distribution of families, by selected characteristics within income quintile and top 5 percent in 1998. Retrieved October 10, 2006, from http://pubdb3.census.gov/macro/031999/quint/15_000.htm
75

PREDICTING ACADEMIC SUCCESS IN THE FIRST-YEAR
Chad L. May Director, Office of Institutional Research and Analysis
Cabrini College
Introduction and Literature Review Research on student success has traditionally operationalized success as students’ grades (or grade-point average), persistence, graduation, cognitive gains (critical thinking, writing, etc.), affective domains (opinions, attitudes, behaviors), and/or multiple outcomes. Measures such as SAT or ACT scores, high school grade-point average, and class rank have all been used to predict collegiate grades (Ramist, Lewis, & McCamley-Jenkins, 1994; Stricker, Rock, & Burton, 1996). A number of studies have shown positive relationship between high school performance in specific subjects such as mathematics, English, and the natural sciences (Bridgeman & Wendler, 1991; Ethington & Wolfe, 1984; Ferarri & Parker, 1992; Carstens & Beck, 1986) to students’ success in college. Another set of research has concentrated on affective constructs to predict student success in college. A large amount of the research has concentrated on personality constructs, demographic indexes, interest measures, involvement, and motivation (Astin, 1993; Pascarella & Terenzini, 1991; Allen, 1999; Berger & Milem, 1999; Elkins, Braxton, & James, 2000; Breen & Lindsay, 2002; Gelin, 2003; Struthers, Perry, & Menec, 2000). Other research has concentrated on students’ perceptions of the academic environment (Beck & Davidson, 2001) and on perceived social support (DeBerard, Spielmans, & Julka, 2004). Other research has concentrated on self-efficacy and educational attainment (Grabowski, Call, & Mortimer, 2001). Ting conducted a study on Asian-Americans and found that a realistic self-appraisal system, successful leadership experience, and demonstrated community service along with SAT-Math scores were predictors of students’ grade-point averages (Ting, 2000). This indicates the need for students to understand themselves and be able to cope with the social environment of the campus. This supports Tinto’s theory of student departure in which he argues that two main components for students to withdraw from higher education is when they can’t become acclimated or integrated into the academic and social fabric of an institution (Tinto, 1993). Another significant variable in the prediction of first-year grades was successful leadership experience that shows the ability to communicate, engage in a social group, establish relationship in social situations, organize, and complete a task in a team. Ting suggests that these non-cognitive variables were significantly related to student success because they assisted students to cope with stressors such as loneliness, isolation, anxiety and racism (Ting, 2000). Another class of studies has used student self-reported data to identify significant predictors or factors in students’ grades. In a single institution study, House used Astin’s Input-Environment-Outcomes assessment model (Astin, 1993) to investigate significant predictors of first-year grades, adjustment to academic demands of college, developing effective study skills, growth in critical thinking skills, and satisfaction with overall instruction (House & Rode, 2003).
76

Many studies have documented the importance of the first year of college to academic success (Barefoot et al., 2005; Kuh et al, 2004; Adelman, 2006). There have been a number of research studies that have investigated specific first-year programs that institutions have designed to increase student success in the first year of college (Ting, Grant, & Peinert, 2000; Walker, 2002; Zhao & Kuh, 2004; Barefoot et al., 2005). A joint venture between the Higher Education Research Institute (HERI) at the University of California Los Angeles and the Policy Center on the First-Year Experience created the Your First College Year (YFCY) survey. This survey was to specifically study the first year of a student’s college career empirically in a way that had not been done previously. They developed the YFCY to post-test the freshman survey already a part of the Cooperative Institutional Research Program (CIRP) administered by HERI. Keup and Stolzenberg (2004) report the results of the national administration of the YFCY in 2003. In their monograph they present a detailed examination of the national data providing a snapshot of the first-year experience, a longitudinal perspective on the first year of college, subgroup comparisons (resident-commuter and male-female), and end with some implications and conclusions. Most of their study employs descriptive statistics to describe students’ experience (nationally) as represented in the YFCY survey and then the growth measured by the pre-test instrument, the CIRP Freshman survey. They conclude that the data from this longitudinal study, “…have the potential for important descriptive, comparative, and multivariate analyses of the first-year experience on an institutional, consortium, or system-wide sample of students as well as nationwide aggregate data” (Keup & Stolzenberg, 2004, p. 66). This study heeds their call to use the longitudinal data to study an institution’s first-year student experience. Since the YFCY is a relatively new national survey instrument there is not a lot of research published in which it has been the main measurement used to study student success. Unlike the National Survey of Student Engagement (NSSE), the YFCY takes a longitudinal perspective of student perceptions as encouraged by Astin and Lee (Astin & Lee, 2003). There have been a few examples (House & Rode, 2003) but this current study attempts to build on the student success literature employing the use of this newer national survey instrument.
Methodology At the end of the spring 2003 semester, the Office of Institutional Research and Analysis administered a survey to approximately 205 first-year students through their SEM 100 and/or honors courses. The response rate for the survey was moderately high, 60 percent, and the sample appeared to match the population on a number of characteristics. This current analysis uses Astin’s I-E-O (Astin, 1991) assessment model to investigate the factors predicting or related to an outcome measure entitled “Academic Success.” To achieve this, the survey asked students to rate the level that they felt successful in adjusting to the academic demands of college, developing effective study skills, managing their time effectively, and understanding what professors expect. Students were also asked to provide their current undergraduate grade-point average. This scale had a national alpha coefficient of 0.70 while locally it was 0.72 indicating the scale has moderately high internal consistency. It should be noted that this variable also has face and content validity since it uses a student’s self-reported grade-point average. There is substantial research showing high correlation between self-reported academic progress and actual academic progress. We are fairly confident that students accurately reported their cumulative GPA.
77
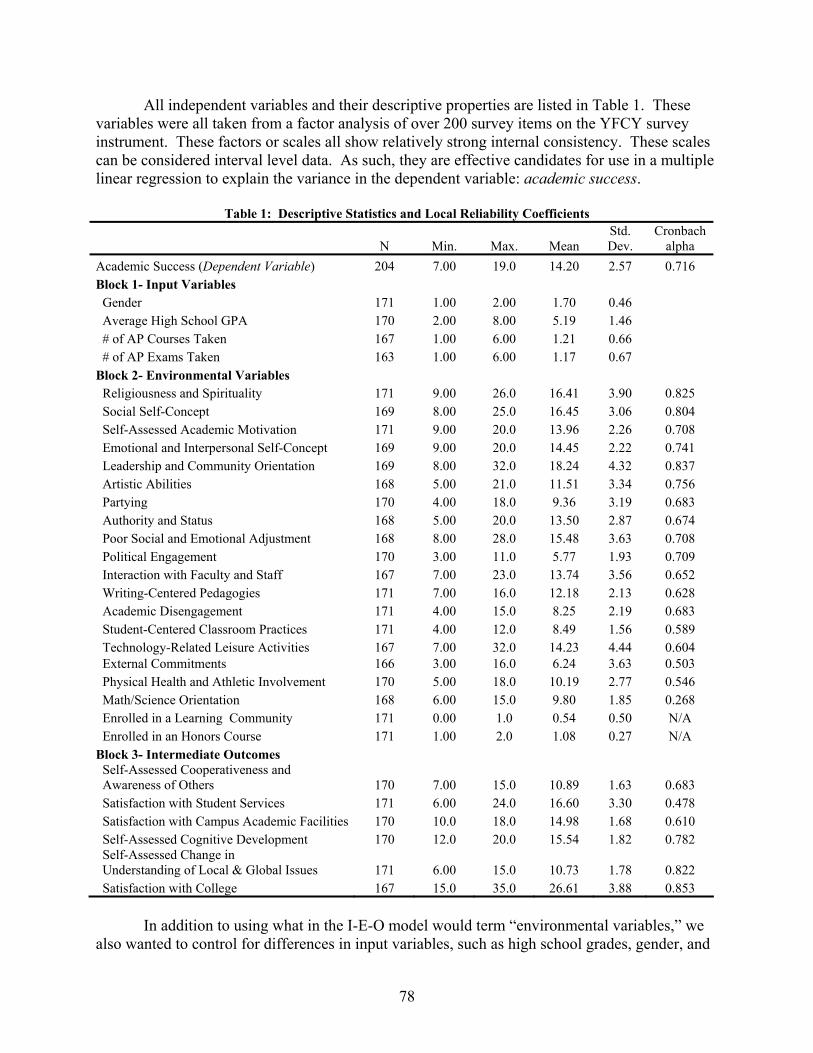
All independent variables and their descriptive properties are listed in Table 1. These variables were all taken from a factor analysis of over 200 survey items on the YFCY survey instrument. These factors or scales all show relatively strong internal consistency. These scales can be considered interval level data. As such, they are effective candidates for use in a multiple linear regression to explain the variance in the dependent variable: academic success.
Table 1: Descriptive Statistics and Local Reliability Coefficients
N Min. Max. Mean Std. Dev.
Cronbach alpha
Academic Success (Dependent Variable) 204 7.00 19.0 14.20 2.57 0.716 Block 1- Input Variables Gender 171 1.00 2.00 1.70 0.46 Average High School GPA 170 2.00 8.00 5.19 1.46 # of AP Courses Taken 167 1.00 6.00 1.21 0.66 # of AP Exams Taken 163 1.00 6.00 1.17 0.67 Block 2- Environmental Variables Religiousness and Spirituality 171 9.00 26.0 16.41 3.90 0.825 Social Self-Concept 169 8.00 25.0 16.45 3.06 0.804 Self-Assessed Academic Motivation 171 9.00 20.0 13.96 2.26 0.708 Emotional and Interpersonal Self-Concept 169 9.00 20.0 14.45 2.22 0.741 Leadership and Community Orientation 169 8.00 32.0 18.24 4.32 0.837 Artistic Abilities 168 5.00 21.0 11.51 3.34 0.756 Partying 170 4.00 18.0 9.36 3.19 0.683 Authority and Status 168 5.00 20.0 13.50 2.87 0.674 Poor Social and Emotional Adjustment 168 8.00 28.0 15.48 3.63 0.708 Political Engagement 170 3.00 11.0 5.77 1.93 0.709 Interaction with Faculty and Staff 167 7.00 23.0 13.74 3.56 0.652 Writing-Centered Pedagogies 171 7.00 16.0 12.18 2.13 0.628 Academic Disengagement 171 4.00 15.0 8.25 2.19 0.683 Student-Centered Classroom Practices 171 4.00 12.0 8.49 1.56 0.589 Technology-Related Leisure Activities 167 7.00 32.0 14.23 4.44 0.604 External Commitments 166 3.00 16.0 6.24 3.63 0.503 Physical Health and Athletic Involvement 170 5.00 18.0 10.19 2.77 0.546 Math/Science Orientation 168 6.00 15.0 9.80 1.85 0.268 Enrolled in a Learning Community 171 0.00 1.0 0.54 0.50 N/A Enrolled in an Honors Course 171 1.00 2.0 1.08 0.27 N/A Block 3- Intermediate Outcomes Self-Assessed Cooperativeness and Awareness of Others 170 7.00 15.0 10.89 1.63 0.683 Satisfaction with Student Services 171 6.00 24.0 16.60 3.30 0.478 Satisfaction with Campus Academic Facilities 170 10.0 18.0 14.98 1.68 0.610 Self-Assessed Cognitive Development 170 12.0 20.0 15.54 1.82 0.782 Self-Assessed Change in Understanding of Local & Global Issues 171 6.00 15.0 10.73 1.78 0.822 Satisfaction with College 167 15.0 35.0 26.61 3.88 0.853 In addition to using what in the I-E-O model would term “environmental variables,” we also wanted to control for differences in input variables, such as high school grades, gender, and
78

the number of AP courses and exams taken. SAT scores were removed from the analysis because there were too many missing values in this dataset to use a replacement procedure. In the third block, we have six scales that in the I-E-O model are considered intermediate outcomes. To determine which variables have significant predictive ability on a student’s academic success, we conducted a stepwise blocked regression analysis in which we blocked variables based on the I-E-O model. We narrowed the dataset to only those students who had taken both the freshman survey during orientation and those that completed the YFCY instrument which yielded a smaller sample size (n=171) for the regression analysis. This gave us an opportunity to evaluate each of the blocks in the analysis individually before including the variables in the subsequent blocks. We used an alpha level of .05 for entry into the model and .10 for exclusion from the final model within each block. There were a number of missing values within this dataset and if the analysis were conducted dropping subjects who had a missing value for any variable in the analysis would reduce the sample to 129 therefore we needed to deal with missing values. To do so we used mean replacement. The overarching goal was to build the best model using this set of variables to investigate those that have a significant relationship with the dependent variable, academic success.
Results The final regression model predicts approximately 49 percent of the variation in students’ scores on the academic success scale. After running a series of diagnostic tests, it was found that the final model achieved fits the data fairly well and none of the linear regression model assumptions was overtly violated. Both residuals and multi-collinearity tests showed acceptable values. However, there was one multicollinearity test, the condition index, which had a final value of 31.7 at the last step of the regression model that could indicate a slight multicollinearity problem. The other tests for multicollinearity were well within acceptable ranges. This researcher is comfortable in making conclusions from the model achieved even with the condition index equal to 31.7. Now we will look at the significant predictors in the model. Table 2 shows the final step of the regression model and the variables that were selected for the final model. It should not be surprising that a student’s high school grades entered the model as the first input variable. In fact, it was the only input variable to be included in the final model. The second variable in this model was the scale measuring a student’s academic disengagement. This scale consisted of four items that asked students to respond to the frequency they had come late to class, skipped class, turned in “sub-par” assignments, and turned in course assignments late. This variable had a negative coefficient value demonstrating that frequent engagement in these activities can be linked directly to lower academic success.
79

Table 2: Final Regression Coefficients on Predicting Academic Success
Note: The regression took five steps and its final R2=0.486.
Variable B SE B β t-value Sig. Tolerance VIF (Constant) 8.976 1.629 5.512 .000 Average High School Grade .333 .106 .184 3.134 .002 .900 1.111 Academic Disengagement -.556 .070 -.465 -7.978 .000 .917 1.091 Self-Assessed Academic Motivation .198 .075 .171 2.629 .009 .737 1.357
Enrolled in Honors Course 1.450 .548 .152 2.646 .009 .945 1.058 Self-Assessed Cognitive Development .251 .087 .174 2.874 .005 .852 1.174
A student’s self-assessed academic motivation was the third variable to enter the regression model. This scale consists of four self-ratings where students were asked to rate themselves compared to their peers on the following characteristics: drive to achieve, persistence, writing ability, and intellectual self-confidence. Higher scores on this scale logically mirror higher scores on the academic success scale. The next variable to enter the equation was a dichotomous variable that asked if a student had taken an honors course during their first year. This should not be surprising considering honors students are generally higher achieving students at this institution. They generally have higher incoming SAT and high school grade-point averages than non-honors students, but what is interesting is that even after controlling for the other significant variables in the model, having taken an honors course is still related to academic success. The final variable in the model was an intermediate outcome, which was a student’s self-assessed cognitive development. This scale consisted of four items asking the student to rate how much they have changed in the fist year of college in the following areas: analytical and problem-solving skills, critical thinking skills, general knowledge, and knowledge of a particular field or discipline. This should not be a surprising finding, but does suggest some interesting implications and conclusions.
Conclusions/Discussion
The results of this study were consistent with other studies concerning predictors of academic success (Astin, 1993; Beck & Davidson, 2001; DeBarard, Spielmans, Julka, 2004; Murtaugh, Burns, & Schuster, 1999; Pike & Saupe, 2002; Rau & Durand, 2000; Zajacova, Lynch, & Epenshade, 2004). This study showed that high school grades are the first and foremost predictor of future academic success, which is consistent with other studies. The next conclusion seems intuitive and is supported by much of the literature on student engagement/involvement, when active engagement in academic coursework decreases, so does the likelihood of success. Faculty and Student Development personnel may find it beneficial to collaborate on ways to increase students’ engagement with their academic coursework. Faculty should be conscious of the amount of work assigned over limited time spans to assure high quality work completed in a timely fashion. Courses that many first-year students take should be evaluated to insure that the pedagogical and assessment techniques are designed to increase
80

student engagement with the coursework. The College and its students both share the responsibility of maintaining active engagement in coursework. The third interesting result is that a student’s self-assessed academic motivation is positively related to a student’s academic success. This provides support to various theories on self-efficacy and motivation (Zajacova, Lynch, & Epenshade, 2004). The ability to assess a student’s self-rated ability on attributes like drive to achieve, persistence, writing, and intellectual self-confidence seem to be vitally important. Developing a short questionnaire to measure a student’s academic motivation prior to matriculation could be useful in improving the identification of at-risk students. It could also provide the College with a better model than SAT scores and high school grades alone. Another interesting finding is that even after controlling for the most important input effect of high school GPA and other significant environmental variables, whether a student took an honors course is related to academic success. Even though this probably indicates that honors students feel as though they were successful and achieve higher GPAs than non-honors students achieve, this does provide some support that first-year honors students are having more success than non-honors students. This is an important finding for the director of the honors program. The only intermediate outcome to enter the final model is self-assessed cognitive development. This suggests that of all the other intermediate outcomes the one that is most predictive of overall student academic success is a student’s perception of increased knowledge and skills in critical thinking, analytic reasoning, problem-solving, and knowledge of a particular discipline. This provides some evidence of validity for the dependent variable, academic success, as increased development of important intellectual skills has been shown to be related to student overall academic achievement. Looking at the variables that did not enter the regression equation is almost as important as looking at the ones that did enter the equation when using the I-E-O assessment model. One of the most striking variables that did not enter the regression model and in fact was not even significant prior to any variables entering the equation was the dichotomous variable identifying whether a student was enrolled in a learning community during the first semester at the institution. The literature on learning communities suggests that those programs increase student learning and success; however, these results suggest that being involved in a learning community had no relationship to academic success. It should be noted that this was the first year in which a learning community program had been established at the institution and the focus of this paper was not to evaluate the learning community program but barred mention. It should also be noted that in the first step of the regression all of the intermediate outcomes were significantly related to academic success except for self-assessed change in understanding of local and global issues. This shows how highly correlated those outcomes are to academic success. There are a few limitations of this study. First, this study was conducted at a single institution and the sample size was relatively small. Second, this study used composite scales that were created through an additive process and there are certainly other methods to form scales or factors. Third, this study used the statistical technique of multiple linear regression while one could have used path analysis or structural equation modeling (SEM) as there were a
81
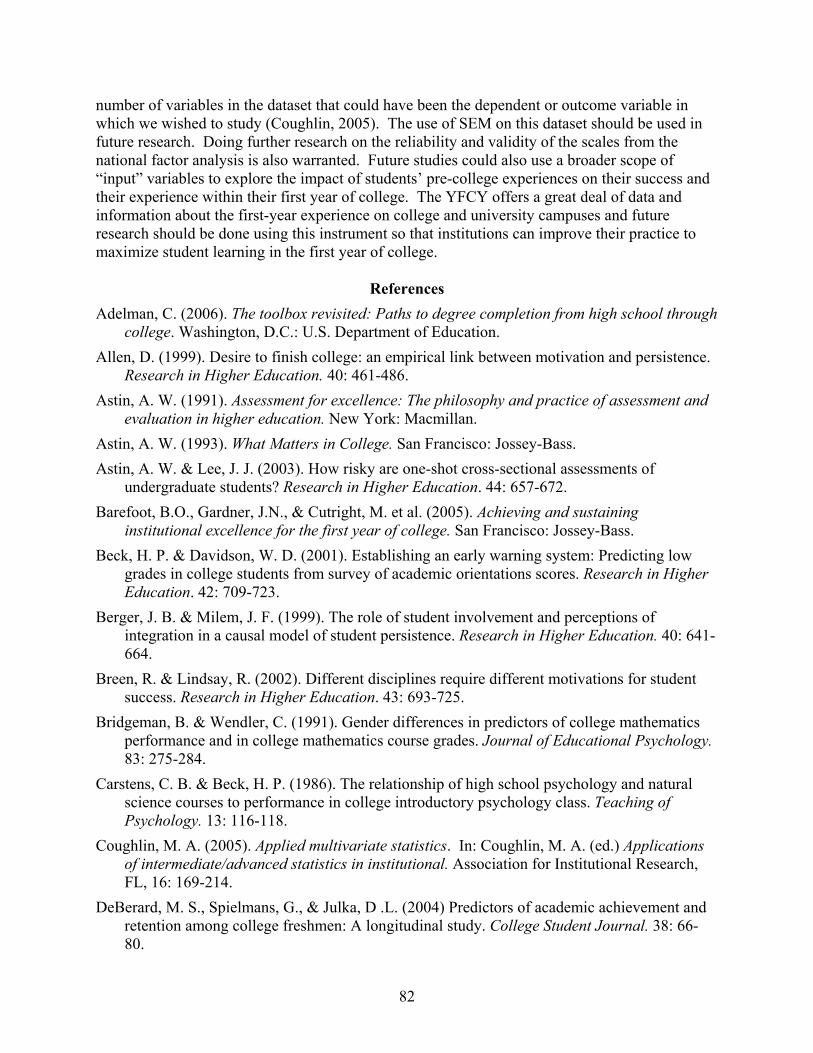
number of variables in the dataset that could have been the dependent or outcome variable in which we wished to study (Coughlin, 2005). The use of SEM on this dataset should be used in future research. Doing further research on the reliability and validity of the scales from the national factor analysis is also warranted. Future studies could also use a broader scope of “input” variables to explore the impact of students’ pre-college experiences on their success and their experience within their first year of college. The YFCY offers a great deal of data and information about the first-year experience on college and university campuses and future research should be done using this instrument so that institutions can improve their practice to maximize student learning in the first year of college.
References
Adelman, C. (2006). The toolbox revisited: Paths to degree completion from high school through college. Washington, D.C.: U.S. Department of Education.
Allen, D. (1999). Desire to finish college: an empirical link between motivation and persistence. Research in Higher Education. 40: 461-486.
Astin, A. W. (1991). Assessment for excellence: The philosophy and practice of assessment and evaluation in higher education. New York: Macmillan.
Astin, A. W. (1993). What Matters in College. San Francisco: Jossey-Bass. Astin, A. W. & Lee, J. J. (2003). How risky are one-shot cross-sectional assessments of
undergraduate students? Research in Higher Education. 44: 657-672. Barefoot, B.O., Gardner, J.N., & Cutright, M. et al. (2005). Achieving and sustaining
institutional excellence for the first year of college. San Francisco: Jossey-Bass. Beck, H. P. & Davidson, W. D. (2001). Establishing an early warning system: Predicting low
grades in college students from survey of academic orientations scores. Research in Higher Education. 42: 709-723.
Berger, J. B. & Milem, J. F. (1999). The role of student involvement and perceptions of integration in a causal model of student persistence. Research in Higher Education. 40: 641-664.
Breen, R. & Lindsay, R. (2002). Different disciplines require different motivations for student success. Research in Higher Education. 43: 693-725.
Bridgeman, B. & Wendler, C. (1991). Gender differences in predictors of college mathematics performance and in college mathematics course grades. Journal of Educational Psychology. 83: 275-284.
Carstens, C. B. & Beck, H. P. (1986). The relationship of high school psychology and natural science courses to performance in college introductory psychology class. Teaching of Psychology. 13: 116-118.
Coughlin, M. A. (2005). Applied multivariate statistics. In: Coughlin, M. A. (ed.) Applications of intermediate/advanced statistics in institutional. Association for Institutional Research, FL, 16: 169-214.
DeBerard, M. S., Spielmans, G., & Julka, D .L. (2004) Predictors of academic achievement and retention among college freshmen: A longitudinal study. College Student Journal. 38: 66-80.
82
Elkins, S. A., Braxton, J. M., & James, G. W. (2000). Tinto’s separation stage and its influence on first-semester college student persistence. Research in Higher Education. 41: 251-268.
Ethington, C. A. & Wolfe, L. M. (1984). Sex differences in a causal model of mathematics achievement. Journal for Research in Mathematics Education. 15: 361-377.
Ferrari, J. R. & Parker, J. T. (1992). High School achievement, self-efficacy, and locus of control as predictors of freshman academic performance. Psychological Reports. 71: 515-518.
Gelin, A. (2003). The effects of undergraduate student involvement on critical thinking: A meta-analysis of the literature 1991-2000. Journal of College Student Development. 44: 746-762.
Grabowski, L. J. S., Call, K. T., & Mortimer, J. T. (2001). Global and economic self-efficacy in the educational attainment process. Social Psychology Quarterly. 64: 164-179.
House, J. D. & Rode, D. (2003). The effects of entering characteristics and first-year experiences on student growth and achievement. Paper presented at the Annual Conference on the First-Year Experience, Atlanta, GA.
Keup, J. R. & Stolzenberg, E .B. (2004). The 2003 your first college year (YFCY) survey: Exploring the academic and personal experiences of first-year students (Monograph No. 40). Columbia, SC: University of South Carolina, National Resource Center for the First-Year Experience and Students in Transition.
Kuh, G. D., Kinzie, J., Schuh, J. H., & Whitt, E. J. et al. (2004). Student success in college: creating conditions that matter. American Association of Higher Education.
Murtaugh, P. A., Burns, L. D., & Schuster, J. (1999). Predicting the retention of university students. Research in Higher Education. 40: 355-371.
Pascarella, E. T. & Terenzini, P. T. (1991). How college affects students. San Francisco: Jossey-Bass.
Pike, G. R. & Saupe, J. L. (2002). Does high school matter? An analysis of three methods of predicting first-year grades. Research in Higher Education 43:187-207.
Ramist, L., Lewis, C., & McCamley-Jenkins, L. (1994). Student group differences in predicting college grades: Sex, language, and ethnic groups. (College Board Report No. 93-1, ETS RR No. 94-27). New York: College Entrance Examination Board.
Rau, W. & Durand, A. (2000). The academic ethic and college grades: Does hard work help students to “make the grade?” Sociology of Education. 73: 19-38.
Struthers, C. W., Perry, R. P., & Menec, V. H. (2000). An examination of the relationship among Academic stress, coping, motivation, and performance in college. Research in Higher Education. 41: 581-592.
Stricker, L. J., Rock, D. A., & Burton, N. W. (1996). Using the SAT and high school record in academic guidance. Educational and Psychological Measurement. 56: 626-641.
Ting, S. R. (2000). Predicting Asian Americans’ academic performance in the first year of college: An approach combining SAT scores and noncognitive variables. Journal of College Student Development. 41: 442-449.
Ting, S. R., Grant, S., & Peinert, S .L. (2000). The excellence-commitment-and-effective-learning (ExCEL): An integrated approach for first year college students’ success. Journal of College Student Development. 41: 353-360.
83
Ting, S. R. & Robinson, T. L. (1998). First year academic success: a prediction combining cognitive and psychosocial variables for Caucasians and African American students. Journal of College Student Development. 39: 599-610.
Tinto, V. (1993). Leaving college: Rethinking the causes and cures of student attrition. Chicago: University of Chicago Press.
Walker, A. A. (2002). Learning communities and their perceived effect on students’ academic abilities. Paper presented at the American Education Research Association Annual Meeting, New Orleans, LA.
Zajacova, A., Lynch, S. M., & Epenshade, T. J. (2005) Self-efficacy, stress, and academic success in college. Research in Higher Education. 46: 677-706.
Zhao, C-M. & Kuh, G. D. (2004). Adding value: learning communities and student engagement. Research in Higher Education. 45: 115-138.
84

IN THEIR OWN WORDS: EFFECTIVENESS IN INSTITUTIONAL RESEARCH
William E. Knight Assistant Vice President for Planning and Accountability and
Faculty Professional Associate, Higher Education and Student Affairs Office of Institutional Research Bowling Green State University
Institutional research is viewed by a variety of constituencies as essential to allowing higher education to survive and thrive in the current environment. The funding crisis; competition from both traditional and nontraditional sectors; pressures to show effectiveness in student learning, contributions to economic development and community engagement; and the need for effective enrollment management are just a few examples of areas where institutional research has been called upon to contribute to decision making and planning. (Howard, 2001; Hutchings & Shulman, 2006; Kuh and Associates, 2005; Saupe, 1990)
As Peterson (1999) points out, our profession is fortunate in that we have a long history
of self-reflection. We have pondered topics such as what institutional research is (Dressel, 1971; Fincher, 1985; Lasher & Firnberg, 1983; Peterson & Corcoran, 1985; Saupe, 1990), how it should be organized (Presley, 1990), what skills and expertise it requires (Terenzini, 1993), and what roles and activities practitioners should embrace (Billups, F. D. & DeLucia, L. A., 1990; Chan, S. S., 1993; Chase, 1979; Gubasta, 1976; Hurst, Matier, & Sidle, 1998; Keller, 1995; Lohman, 1998; Matier, Sidle, & Hurst, 1995; Sanford, 1983, 1995; Terenzini, 1995; Volkwein, 1990, 1999). Periodic surveys (e.g., Lindquist, 1999; Muffo, 1999) describe the characteristics, settings, and activities of institutional researchers. Numerous professional development opportunities, including conferences, workshops, institutes, publications, graduate coursework and certification, grant programs, and professional organizations, exist to allow us to maintain and enhance our career effectiveness (Knight, 2003).
Some institutional researchers have studied the characteristics and experiences of their
colleagues in order to learn how we can enhance our effectiveness in our roles at our institutions or organizations. Augustine (2001) concluded that effective use of institutional research studies is associated with transmission of findings through multiple media, congruence in disciplinary backgrounds between the researcher and decision-makers, organizational placement of the IR office, frequent communication between researchers and decision-makers use of qualitative methods, provision of advice on use of research results. Clyburn (1991) found that many small, private colleges lacked an institutional research function and where it did exist it tended to suffer from lack of coordination, commitment, and support. Delaney’s (1997) survey of institutional researchers at New England colleges and universities revealed that the scope of the function, the reporting relationship, and the size and qualifications of the staff varied significantly with institutional size, level, and control. She also found that the likelihood of involvement of institutional research offices with research (as contrasted with reporting), planning, and policy development varied with institutional size, level, control, and staff size and qualifications. Delaney (2000) concluded that institutional researchers who perceived themselves to be more effective felt that they had more opportunities for autonomy and leadership and were more likely
85

to have their work used in executive decision making, include policy recommendations in reports, conduct follow-up studies on the impact of their work, have a doctorate, be part of a strong professional network, and describe their positions as challenging. Using a survey of institutional researchers in the Northeast, Delaney (2001) identified workload, limited opportunity for advancement, stress, lack of recognition, concern for producing quality work within time constraints, and financial and moral support as the most common challenges practitioners face to their engagement in policy. She concluded through the use of a path analysis model that practitioners who were in higher positions and who had more experience and higher education levels, a mentor, a strong professional network, and an independent job structure can more effectively meet such challenges and actively engage in policy development. Huntington & Clagett (1991) learned that the most prevalent problems experienced by institutional researchers include workload and staffing, perceptions of the function, access to institutional leaders, and access to and reliability of institutional information systems. Knight, Moore, & Coperthwaite (1997) sought to empirically validate Terenzini’s (1993) thoughts on the knowledge and skills necessary for effective institutional research; they found that practitioners employed in the field for a greater number of years, those with doctoral degrees, those with the title of associate director, and those who reported directly to the institution’s president perceived themselves to be more effective. Storrar (1981) determined that institutional researchers’ at large, public universities experience role conflict that impinges upon their perceived effectiveness.
The profession of institutional research has benefited from turning its analytic lens back
upon itself. Some clear patterns have emerged about how practitioners can negotiate professional challenges and increase their effectiveness, which the literature has operationally defined as having a tangible impact on decision-making, planning, and policy formation. Still, more of the story remains to be told. Many of the suggestions for improving effectiveness made by theorists and practitioners in institutional research, while based upon valuable lived experience, were not arrived at through rigorous research methods. Further, the research studies that have been carried out to determine correlates of effectiveness have been limited by the fact that the dependent variable is self-reported effectiveness. While not wishing to impugn the importance of this work or the responses of our colleagues, it does seem that validation of self-reported effectiveness, through such means as feedback from colleagues (Delaney, 2001) would add substance to this line of inquiry. Finally, the studies carried out thus far have all been within the objectivist, deductive, positivist paradigms, which assume that truth exists independently of experience, simply waiting to be discovered and having the same meaning for all (Crotty,1998). One of several alternative approaches to understanding effectiveness in institutional research includes using a constructionist epistemology, a related theoretical perspective such as phenomenology, and methods such as interviews, document, analysis, and observation. Such an inductive approach holds that meaning is constructed by human beings as they engage with the world, that the possibility for new meaning emerges when we lay aside our prevailing understanding, and that depth and detail emerge when data collection and analysis are not limited to preexisting categories (Patton, 2002). The goal of this study is to use such an alternative approach to arrive at responses to the following research questions:
86

1. How do institutional researchers who have been identified as effective by their colleagues view effectiveness in the profession?
2. What are the personal and professional characteristics and experiences of such institutional researchers?
3. What opportunities to improve their effectiveness have such institutional researchers taken advantage of?
4. What barriers to effectiveness have such institutional researchers faced and how have they overcome them?
5. What suggestions do such institutional researchers have for improving effectiveness throughout the profession?
Methods
This study was carried out using qualitative research methods since the research
questions are descriptive and open-ended in nature and require somewhat lengthy responses from a small group of persons with particular viewpoints (Bogdan & Biklen, 1998, Merriam, 1998). Techniques of naturalistic inquiry were employed, which affected sampling techniques, participant selection, research design, and data analysis (Erlandson, Harris, Skipper, & Allen, 1993; Lincoln & Guba, 1985; Miles & Huberman, 1994; Patton, 2002).
The initial pool of effective institutional researchers was established based upon
nomination by colleagues throughout the country. Email messages asking practitioners to nominate colleagues were sent via the listprocs of the Association for institutional research and several of its regional and state affiliates. Nominations were also solicited at the Association for Institutional Research national conference. These efforts yielded 26 nominations. The researcher then narrowed the list of candidates to a smaller number (eight) that provided for maximum variability in terms of the candidates institutions, job titles, longevity in institutional research, and personal characteristics. Candidates were then contacted and asked if they were willing to participate in the study; all agreed.
Participants submitted copies of their resumes to the researcher and participated in
individual on-site interviews (except for one interview that was carried out via telephone), which were tape recorded and captured in written transcripts. The appropriateness of the questions was confirmed by a national panel of experts who provided feedback about both the interview questions as well as an overall proposal for the study. The researcher maintained a reflective journal in order to record observations made during the research process. The reflective journal, analysis of resumes, and analysis of interview transcripts served as methods of data triangulation of the results (Patton, 2002).
Data analysis yielded two types of findings: detailed descriptions of each case, which
were used to document uniqueness, and shared patterns that emerge across cases (Patton, 2002). Data analysis involved breaking material into small units of observation, developing initial themes or categories within the findings, and considering alternative interpretations that will either confirm the initial themes or lead to the creation of new ones. The researcher attempted to bracket his knowledge and presuppositions so as not to taint the findings (Crotty, 1998), but rather to focus on participants’ perspectives (Bogdan & Biklen, 1998). Two peer debriefers were
87

used to test themes and alternative conclusions (Lincoln & Guba, 1985). Preliminary conclusions were shared with participants for their confirmation and elaboration; this constitutes a member check (Lincoln & Guba, 1985). An audit trail of study materials will serve to provide for dependability and confirmability. All names noted in the results are pseudonyms.
Results Profiles of the Participants
Henry. Henry has been an IR director at a large, urban community college in the Midwest for 15 years. He previously served as Director of Planning at a community college system office, giving him a total of 23 years in the profession. He has also served as a dean of continuing education, executive director of a regional higher education consortium, director of a state vocational council, and as a community college instructor, providing for a total of 30 years of professional experience in higher education. He holds a bachelor’s degree in Political Science, an MPA, and an MBA, and has completed additional graduate coursework in educational leadership. He has been active as a member and committee member in AIR and has done some consulting.
His office consists of 5.75 FTE staff members, including himself, an assistant director,
three project analysts, and an administrative coordinator. Office activities typically include federal and state reporting, responding to college guidebook and other external surveys, carrying out an annual research agenda (that includes program evaluations, student surveys, and various requested studies that are undertaken through a request for proposal process), process improvement surveys supporting regional accreditation, maintaining databases for program review, supporting for the planning process, involvement with the Achieving the Dream project, responding to many ad hoc information requests, interaction with campus information technology staff concerning the data warehouse, a limited role in assessment and program review, support for specialized accreditation, and attendance at state board of regents meetings. Henry’s reporting line has recently shifted from the president’s chief of staff to a newly created Senior Vice President. He sees his primary responsibility as office management, support for accreditation activities, and interaction with campus leaders and staff.
Elizabeth. At the time of the interview, Elizabeth was transitioning from her role as an
associate vice president for information technology, research, and planning at a West coast community college to a new position as a vice president with responsibility for technology and learning services for a community college district in the same state. She served as a director at the college for four years before her three years as an associate vice president. She previously was employed as a program associate for a government institute, a research analyst at a private university, a graduate assistant, and a faculty member, giving her a total of 10 years of institutional research-related experience and 14 years of professional experience in academe. She holds a bachelor’s degree in mathematics and masters and doctoral degrees in higher education. She has 13 publications, 43 conference presentations and 3 book reviews, and has served as a member, committee member, and member of the board of directors for AIR, a member and associate editor for the Society for College and University Planning (SCUP), a member and editor for the National Community College Council for Research and Planning, a member of the board of directors for the Institute for the Study of Knowledge Management, and
88

as a member and leader of the institutional research and community college groups in her state. She has received awards from her state’s community college group and from her graduate institution.
Her office consists of herself and a full-time institutional research analyst. The office’s
responsibilities include descriptive and analytic studies; projections; responses to ad hoc information requests; administering surveys; federal and state reporting; coordination of all disciplinary accreditation activities; coordination of her college’s regional accreditation self-study and site visit; designing the college’s three-year college plan and carrying out annual evaluations of progress toward its goals; membership in many committees; responsibility for the institution’s data warehouse; training college staff in the use of decision support systems; assessment at the institutional, program, and general education levels; and strong role in enrollment management. The analyst creates routine reports, responds to surveys, provides information for program review, and extracts data from administrative systems; Elizabeth carries out all of the other activities noted above personally. She reports directly to the College’s president.
Martha. Martha has served as the IR director at a private, historically African American
college in the South for 19 years. She previously served as a faculty member at the college; she has a total of 34 years of professional experience in higher education. She holds bachelors and master’s degrees in mathematics and a master’s degree in computer science. Martha has presented numerous workshops and authored several institutional research publications at her institution. She has attended many leadership training conferences and curriculum institutes, and has received several grants. She has provided leadership to her college’s Title III program, its accreditation activities, and to the National Youth Sports Program and the Ford Teacher Scholar Program. She is an active member and presenter at AIR, a member and past board member of her state’s institutional research professional organization, a member and leader of AIR’s Traditionally Black College and University special interest group, and a member of the Association for the Study of Higher Education, the Southern Association for Institutional Research (SAIR), and the National Council of Teachers of Mathematics. She has received numerous institutional recognitions as well as AIR’s Charles I Brown Award.
Martha, an administrative assistant, and some student employees make up her office staff.
Office responsibilities include producing a fact book, responding to ad hoc information requests; reporting to federal, state, and accreditation agencies; administering a graduating senior survey; assists others on campus with surveys; and producing research briefs. The administrative assistant is responsible for data entry and data integrity edits, while Martha carries out the other responsibilities. She reports to a director of planning and evaluation as well as the college’s academic vice president.
Linda. Linda has served as associate director of IR, director, executive director, and
(currently) assistant vice president in a large, urban, private research university in the South for 23 years. She has also served as a statistical consultant at the university, a programmer in private industry, and instructor of statistics, and a research assistant, giving her 31 years total professional experience in higher education. She holds a bachelor’s degree in mathematics, masters and doctoral degrees in quantitative psychology, and a master’s degree in computer
89

science. She has been a member, member of numerous committees, and past president of AIR, Southern AIR, and the Higher Education Data Consortium, a member and member of various committees for SCUP, CAUSE, the National Association of College and University Business Officers, the National Association of Independent Colleges and Universities, the National Center for Educational Statistics, and the National Postsecondary Education Cooperative; and a member of the Common Data Set Advisory Board. She has received the Outstanding Service Award from both AIR and SAIR.
Linda’s office consists of herself, an assistant director, a systems specialist, three research
analysts and an administrative assistant. The office carries out a broad range of internal and external reports, including all official enrollment, admissions, financial aid, retention, graduation, and human resources reporting; administers a battery of surveys with students and employee; provides dashboards for senior leaders; and manage ad hoc surveys and focus groups, external reporting, a fact book, school-level fact files, and enrollment projections. Linda’s describes her role in the office as managing, attending meetings, checking results, and being proactive. She reports to a vice president for information technology.
Kim. Kim has been a director of institutional research at a comprehensive public
university in the South for two years. She was previously employed as the director of a state higher education information system, director of management information and analysis at another institution, a management technician in a state system office, and a graduate assistant. Kim has nine years of professional experience in higher education. She is or has been a member of AIR, Northeastern AIR, Southern AIR, her state AIR affiliate, SCUP, and the Data Warehouse Institute. She holds bachelors and masters degrees in psychology and is pursuing a doctoral degree in educational administration and leadership studies.
Kim’s colleagues include an associate director, two programmer-analysts, two technical-
clerical support staff, and an administrative assistant. The office serves as the university’s official information source, carries out reports to state and federal agencies, responds to external surveys, administers surveys to students, carries out qualitative research with students, produces a fact book and academic department profiles, does faculty salary and workload studies, and benchmarks institutional performance against that of peers. Kim reports to an associate provost. She sees her role as bringing vision to the office.
Marshall. Marshall has served in the roles of IR director, assistant vice president, and
(currently) executive assistant to the president at a public doctoral university in the Midwest for eleven years. Previously, he served as a research analyst at another institution for two years. He has also been an admissions counselor and a faculty member, giving him a total of 19 years of professional experience in academe. He holds bachelor’s and master’s degrees in international relations and a doctoral degree in political science. He has 6 publications and 23 conference presentations, and has done several consulting activities. He is a member of AIR, the American Association of Higher Education (AAHE), his state institutional research group, SCUP, and several community organizations. He is a member and past president of the Consortium for Assessment and Planning Support, serves as a trainer for creative problem solving, and holds a Harvard Management Development Program certificate.
90

In addition to himself, the institutional research staff at Marshall’s university consists of an associate director, an assistant director, two research analysts, a data manager, and two administrative assistants. Office activities include production of a factbook and analytic studies; administration of surveys; internal and external reporting; production faculty workload analyses, information for program review, academic department profiles; and supporting assessment, institutional effectiveness, and strategic planning activities. Marshall describes his role as translating strategic issues into institutional research projects and putting information in front of people.
Frank. Frank has served as the IR director at a public, comprehensive university in the
Midwest for 19 years. He was also a research associate at another institution and a research associate at a state board of regents, giving him a total of 23 years of experience in institutional research. During his tenure at his university, he has also served as the coordinator of a Title III grant. He has also served as an associate project director, instructor, and graduate assistant, giving him a total of 27 years of academic professional experience. He has a bachelor’s degree in history and master’s and doctoral degrees in higher education. He has 10 publications, 37 conference presentations, and experience doing consulting at numerous organizations. He is a member and has often been a committee member at AIR, ASHE, SCUP, CAUSE, the American Educational Research Association, the American Association of Collegiate Registrars and Admissions Officers, and his state board of regents and institutional research organization. Frank is also a member of several community groups.
Frank’s office colleagues include a half-time assessment coordinator, a full-time
administrative assistant, one graduate assistant, and two student employees. The office is responsible for producing a factbook, internal and external reporting, carrying out a self-directed research agenda, coordinating university planning, coordinating and consulting about assessment of student learning, and serving on many committees. Frank reports to the vice president for academic affairs at his institution.
Susan. Susan has served as the IR director at a large, public university in the Midwest for
31 years, before which she served as assistant director and a research assistant, giving her a total of 34 years of experience in institutional research. She also served as an administrative assistant at another office at the same university, giving her a total of 36 years of professional experience in higher education. She has an associate degree and bachelor’s and master’s degrees in accounting. She is the author of 34 publications and 49 conference presentations, and has carried out several consulting activities. She is a member and has been past president, past national conference chair, and member of numerous committees at AIR; co-founder of the Midwest Association for Institutional Research; member, committee member, and past national conference chair at CAUSE; member and past national conference chair for SCUP; and a member of ASHE and EDUCAUSE, and the American Society for Quality Control. She has received AIR’s Distinguished Member and Outstanding Service Awards.
Susan’s office is comprised of 15 headcount staff, including herself, an associate director,
two assistant directors, eight analysts, a statistical and information officer, an assessment and survey coordinator, and an administrative assistant. The office coordinates university strategic planning and academic program review; provides a web-based departmental management
91

information system; responds to internal and external data requests; carries out state and federal reporting; administers a broad program of surveys; coordinates and consults concerning assessment of student learning; carries out enrollment management, financial, workload, and salary analyses; and coordinates accreditation activities. Susan reports to the university’s provost, who is the chief academic and operating officer.
Themes
The Meaning of Effectiveness in Institutional Research.
The overwhelming response to the question about what effectiveness means in institutional research was having the information produced considered in decision-making. Each of the participants gave some variation of this response. Several noted, however, that other factors such as politics and personalities affect the decision process; directions implied by empirical information do not always hold sway. Susan referred to this as having one’s institution be “data informed” rather than “data driven.”
Somewhat related was the notion that it often takes quite a bit of time for the benefit of
institutional research to be realized. Susan said: I tell new staff when they come on board that you will see the impact of your work, but it may take a couple of years. The gestation period is quite lengthy. But if you stick around long enough, you’ll see a particular analysis that you know has implications on how the University ought to think about creating new programs, eliminating new programs, or just helping them to chart their course. You’ll see it. And that is probably what is most satisfying. I do think that for me that is the gage of effectiveness.
Most of the participants also stated or implied that having one’s information used in
decision making, while important, is really an instrumental goal; the ultimate benefit of the work follows the implementation of those decisions so that the institution can improve in some way. Martha, Frank, and Linda felt that helping students to succeed is an end product of institutional research that is particularly important and satisfying to them. Frank stated:
Anybody can report anything effectively. Anybody can fill out IPEDS forms. What you need to ask yourself is if what you do makes a difference in the lives of the students and the campus. If you can answer yes to that, you are being effective. I’d die if all I did was fill out IPEDS forms, I’d literally die.
A final take on the meaning of effectiveness in institutional research was the very
practical idea of doing whatever it is to make institutional leaders happy. This suggests that customers rather than practitioners of institutional research may be the best judges of effectiveness. It also introduces the often-repeated comment that offices must continue to evaluate their ability to meet clients’ needs. Susan illustrates this point:
The other thing that I always tell new staff is that we exist only because someone finds our work valuable. We are not paying people. We are not registering students. We are
92

not paying the bills. We are not cleaning the offices. Our analytical work must be of a measure that people find valuable, or we don’t exist.
Characteristics of Effective Practitioners.
The analysis of resumes and office activities and characteristics may have served more to illustrate the diversity of the participants than to point to the common hallmarks of their effectiveness. There was considerable diversity among them in terms of sex, race, age, longevity in the profession, number of institutional research positions held, educational backgrounds, office staffing, and reporting relationships. Only two commonalities were evident from the analysis of resumes and from observations. First, the magnitude and breadth of activities within all of the participants’ offices was quite large. They did lots of work and lots of different work. “We do it all” was a phrase used several times to characterize their activities. Some of the participants even had responsibilities not generally associated with institutional research, such as managing information technology, overseeing a testing center, and serving as the president’s chief of staff. Interestingly, although there might be some relationship to institutional size, two- and three-person offices seemed to be engaged in as wide an array of activities as those with much larger staffs. The other commonality was a large degree of experience among the office staff. Kim, for example, although her professional experience in institutional research and in her current role specifically was relatively low as compared to most of the other participants, noted that her colleagues have over 70 years of combined experience.
Several categories of responses emerged in response to the question about what
institutional researchers need to know, to be able to do, or to be like to be effective. The most often cited of these was the need to understand institutional context, personalities, and processes. Susan noted:
Related to that is it depends upon the person receiving the information. I have worked for eight academic officers at least and I’ve worked from the extreme of “you do the analysis, but I want to get the data set” . . . to the other extreme of “give me the bottom line.” So it’s sizing up your particular administrator and developing your responses according to what they best need and how far they want to dig down.
Henry discussed the need to understand the culture of higher education, to understand the
impact of reporting and research, and to understand idiosyncratic decisions. He also stressed, “being able to figure out how the place gets the job done” at one’s institution:
You really need to develop an eye for process, which is something you really have to work to acquire in higher education. [For example] somebody in Registration years ago decided we’re going to define this field that way and didn’t think about what impact it had on everybody else.
Martha and Kim explained the importance of understanding the perspectives of multiple
constituencies, realizing that multiple answers are possible to a given problem, and recognizing that people get defensive when institutional research is viewed as an interloper.
93

Closely related to the response of needing to understand context was the response concerning the need to build relationships and gain trust. Elizabeth offered the following:
Gauging how effective you are is [related to] how many people know about you. And I can tell you that everybody on this campus knows who I am. Why is that? Its because what we provide . . . is done in such a way that we end up serving everybody one way or another. . . . I am the type of person who is very outgoing. I know that some institutional research folks have the tendency to just sit in their offices and not interact too much, but the key is building relationships, and being out there, and being very responsive with quality stuff quickly. . . . I think effectiveness is related to being able to build relationships and gain trust, having your product on high demand and being used, and being able to make suggestions and being proactive rather than reactive, getting to know the operation of the college so well, and making suggestions in areas that people didn’t think about.
Related to understanding people and processes and building relationships and trust was
the idea of using the unique perspective available to institutional researchers to provide what Susan called “leadership from below.” The idea is develop the ability to slowly and quietly, but tenaciously and persuasively, work toward the institution’s best interests. Henry noted, “You try to find the points of influence. . . . You have to keep chiseling away at it.” He discussed “being an intermediary among the leadership to carry bad news forward.” Similarly, Susan stated:
A term I like to use a lot is fly below the radar. Its times I know I have moved information from one end of the administration building to the other . . . in a non-threatening way. I know it sounds trite, but I work for the greater glory of the University of _____. I’m a __ alum, I care deeply about this place.
Several participants noted that understanding perspectives and context is facilitated by
having frequent access to key people and being involved in high level activities (e.g., accreditation, strategic planning) than lend visibility to the office. Being visible, being in the right place at the right time to make important contributions, allows IR to demonstrate its usefulness. As Elizabeth stated:
Being part of the Cabinet makes me extremely effective because you know what is needed at the highest level and you understand what is expected. If you are at a lower level, you may never know exactly what is needed. Reporting to the president is key and being part of Cabinet is tremendously helpful. It is also important to use this opportunity to contribute to show your value.”
Most of those interviewed listed key personal characteristics of effectiveness that might
be considered traits of professionalism. These included being objective, creative, flexible, timely, accurate, logical, cooperative, and responsive; having a broad perspective, not sacrificing principles or ethical standards; being able to function under pressure; actively listening; knowing your own capabilities and biases; wanting to and having the ability to learn new things; constantly re-evaluate the role of the office; keeping up with best practices; having network of
94

colleagues; and being willing to embrace change. Several people also noted the importance of having a sense of humor; for example, Martha cited the need to
. . . smile when you are asked the same question the third time because you have lost the information that I gave you before.
Martha, Susan, and Linda also discussed the importance of maintaining project
documentation, an activity calendar, and a procedures manual. Both Martha and Susan discussed at length the importance of data integrity for effective
IR. Martha referred to this as the need to “have a critical eye for data consistency,” and Susan stated:
Your work needs to be reliable, be credible, you need to be consistent. Obviously we like to do things flawlessly, but that realistically isn’t going to happen, but you need to minimize because once you have set out a data set or an analysis you don’t want to come back two days later and say “Oh, we had a big bust” and someone else has now acted and they have to step back. So we have a lot of processes in place to try to minimize that, but sometimes things still do happen. You have to know enough to say, “this doesn’t pass the test of reasonableness.”
Marshall and Susan explained that an important characteristic of effectiveness is having
the ability to convey information effectively. Marshall stated, “I have built my career on an ability to portray information in meaningful ways.” Susan offered the following:
Another aspect is to decide what is pertinent to a particular issue and don’t bury people in data. That’s not what they want. They need for you to get it processed, pull out the key things, and present it in a way that they can quickly assimilate it.
Only a few of the participants noted the importance of what Terenzini (1993) calls
technical/analytical skills. Martha and Kim discussed the need to be able to work with various types of computer software; Elizabeth volunteered the importance of accessing, manipulating, and analyzing data without the support of information technology colleagues outside of the office; and Kim commented upon understanding the epistemological bases of research approaches and their corresponding methodologies. Several persons noted that not everyone in a multi-person IR office needs to have the full compliment of technical/analytical skills as long as they are found overall among the staff.
Barriers and Opportunities.
Perhaps not surprisingly, several of the participants mentioned workload, handling multiple simultaneous requests for information, and not having adequate staff support as their greatest obstacles to effectiveness.
Lack of utilization of the products and services provided by the IR office was another
barrier that was mentioned. This may be related to the barrier of lack of trust. In both situations, participants volunteered that these problems take time, effort, and knowing the right approach to
95

be able to overcome. Issues of campus politics and personalities were also part of this theme. Linda commented upon the difficulties of a prior leader’s tendency towards secrecy and his “shoot the messenger” reaction. She also noted some offices purposely not following standard reporting methodologies so that they look better. Frank cited the problem of a leader who didn’t believe in using information to make decisions. Henry noted that a barrier to having his office’s work be used to a greater extend lied in the fact that the institution perceives itself as very successful and views IR as overly critical:
I really think that successful institutions are the ones that have the hardest job making a change. This place has never been in a crisis. . . . In 1997-98 we got 10 years of re-accreditation with a totally clean slate, we passed our levy with a 72% affirmative vote, and we were re-validated as a member of the League for Innovation in the Community College. Well, then, the [state] Performance Report came out and then they were like “what’s IR trying to do here, throwing all this mud on our faces.”
Marshall added the related barrier of lack of user sophistication, that is, leaders not
knowing what to do with the information that institutional research supplies. He discussed the need for IR to move on from just being a provider of information to taking an educational role of working with leaders to act upon it. He noted that he does monthly seminars for department chairs.
Martha noted a barrier that was articulated by several participants: lack of data quality
from cooperating offices such as Registrar, Academic Affairs, or Information Technology. She also volunteered another dilemma that has important ethical implications: people asking her to do things that are beyond her capability.
Finally, both Linda and Susan said that moving the IR office to a less visible location on
campus had led to an “out of sight, out of mind” situation that they combated by being highly visible in other locations.
Participants discussed both taking advantage of opportunities provided at their
institutions as well as proactive strategies they have used to increase their effectiveness. Important opportunities included, as Andrea noted, “having a budget and the freedom to spend it as I like;” good support for involvement in professional development activities such as attending the AIR Forum, other conferences, and visiting other campuses; having friends and colleagues both on and off campus with whom to share ideas, experiences, and frustrations; and having good relationships with supervisors. Susan spoke about the opportunity to learn from mentors:
I’ve definitely been blessed by fabulous mentors. . . Several of them have gone onto and are presidents of different universities. . . . They were all fabulous men. They included me from the very beginning in meetings and discussions. I had to be part of the conversation so I understood the thinking process. . . . So now I try to include my staff in conversations wherever I can because you have to be in the conversation to get how people think about things, to understand what the other tangential issues are that are not always easy to identify.
96

Several of those interviewed discussed actively working to build relationships with data custodians and with customers. Linda noted the importance of informal contacts with faculty and staff members across campus. Marshall stated: Building good relationships is absolutely essential for people to take to heart what the data say.”
It was noted earlier that several of the participants have been leaders in AIR and other
professional associations at various levels. Elizabeth said that being a member and leader in such groups was “tremendously helpful in becoming more effective and in understanding how to become more effective.” Frank also said that being involved in consulting activities gives one a broader perspective.
Similarly, many of those interviewed discussed the importance of taking the initiative to
be included in campus groups. Frank stated, “I wheedle my way into everything.” And Elizabeth took pride in declaring, “everybody knows me.” Susan described her habit of going out to lunch with various people every day as being helpful in sharing ideas, building trust, and connecting to others.
Another proactive strategy for effectiveness involved becoming a recognized expert in
some IR-related specialty (such as environmental scanning for Frank and TQM for Susan); this broadens one’s perspective and garners respect.
Additional Suggestions for Improving Effectiveness in the Profession.
Several themes emerged in response to a final question about additional ideas for improving effectiveness in IR. Linda and Susan both discussed the critical need for institutional researchers to try to rise above the press of day-to-day demands and focus on critical issues that are most important to the institution so that we may have the greatest impact. Networking, continuing to learn new things, taking advantage of colleagues’ willingness to share, and continuing to evaluate the role of the office were mentioned in one form or another by each of the participants; Elizabeth specifically suggested doing systematic, formal IR program reviews.
A last set of suggestions concerned professional development at a broad level. It was
noted that more practitioners, especially new ones, need to become actively involved in the AIR network. Linda stated that AIR needs to focus on support for members as they progress through their careers. Marshall suggests that as a group IR should push for good research on important topics on a national scope such as financial aid and accountability. He and Frank also articulated that we need to collaborate among ourselves and with other higher education professional associations (e.g., ACE) that get the attention of presidents.
Discussion
The study added depth and richness to the existing literature about effectiveness in
institutional research by means of collecting data from IR practitioners judged to be particularly effective by their colleagues. Effectiveness was defined by the participants as having the information produced by IR considered in decision making, although it was also recognized that other factors over which the institutional researcher has little or no control, such as politics and personalities, affect the decision process.
97

A large number of diverse activities and a large degree of experience among the office staff were commonalities found among effective institutional researchers. Also, the results confirmed Terenzini’s (1993) contention that contextual knowledge and skills (e.g., understanding of the institutional culture, history, politics, personalities, and the like) are critical for success in IR. Developing this set of knowledge and skills and cultivating relationships allows institutional researchers to establish and maintain trust. Key personal characteristics of effectiveness listed by participants included being objective, creative, flexible, timely, accurate, logical, cooperative, and responsive; having a broad perspective, not sacrificing principles or ethical standards; being able to function under pressure; actively listening; knowing your own capabilities and biases; wanting to and having the ability to learn new things; constantly re-evaluate the role of the office; keeping up with best practices; having network of colleagues; being willing to embrace change, and having a sense of humor. Effective institutional researchers are also very concerned about data integrity and have developed the ability to convey information effectively. Important technical/analytical skills (Terenzini, 1993) were also noted, such as being able to work with various types of computer software and accessing, manipulating, and analyzing data independently.
As Delaney (2001) found, workload and lack of recognition served as barriers to
effectiveness in IR. Other barriers included lack of utilization of the products and services provided by the IR office, lack of user sophistication, lack of data quality from cooperating offices, and the presence of the IR office in a low visibility location on campus. Opportunities that effective IR practitioners took advantage of and supports that they proactively developed included access to resources for professional development, attendance at conferences, visits to other campuses, developing a strong professional network (also noted by Delaney, 2000), access to institutional leaders (Huntington & Clagett (1991), mentoring (Delaney, 2001), becoming involved as members and leaders in campus groups and in professional organizations, and becoming experts in areas of specialization.
Finally, effective practitioners discussed the need for institutional researchers to rise
above the press of day-to-day demands and focus on critical issues that are most important to the institution, the need to continue to learn new things, to take advantage of colleagues’ willingness to share, and to continue to evaluate the role of the IR office. AIR was called upon to support practitioners’ professional development throughout their careers, and to serve as a means for institutional researchers to interact with others in academe in important national policy issues.
While the results of this study are not intended to generalize to all institutional
researchers or even to all those deemed particularly effective, they nevertheless provide some implications for practitioners and for those who impact their professional preparation. Just as many years of research about the effect of college on students has clearly determined that “What students do during college counts more in terms of desired outcomes than who they are or even where they go to college.” (Kuh, 2001, 1), this study suggests that what institutional researchers do in their jobs is more important than their backgrounds, institutional settings, and prescribed tasks. Effective institutional researchers develop a keen understanding of people and processes and use this understanding to tailor their activities and disseminate them effectively (Augustine, 2001). They are involved in an abundance of activities, interact with a diverse array of people, and cultivate the variety of professional characteristics listed above. They overcome barriers by
98

taking advantage of opportunities provided to them and proactively cultivating others. Strategies for those facilitating the preparation of institutional researchers include articulating the characteristics of effective IR, pairing aspiring and new professionals with effective practitioners early and often, and assisting them with developing an ongoing capacity to gage their own effectiveness.
References
Augustine, K. (2001). Factors influencing the use of institutional research studies from the researchers' perspective. Proquest Dissertation Abstracts No. AAT 3016793.
Billups, F. D. & DeLucia, L. A. (1990). Integrating institutional research into the organization. In. P. T. Terenzini and E. E. Chaffee (Series Eds.), and J. B. Presley (Vol. Ed.), Organizing effective institutional research offices. New Directions for Institutional Research, 66, 93-102. San Francisco: Jossey-Bass.
Bogdan, R. C. & Biklen, S. K. (1998). Qualitative research in education: An introduction to theory and methods. Boston, MA: Allyn & Bacon.
Chan, S. S. (1993). Changing roles of institutional research in strategic management. Research in Higher Education, 34(5), 533-549.
Chase, J. S. (1979). Time present and time past. In R. G. Cope (Ed.), Professional development for institutional research. New Directions for Institutional Research, 23, 15-22, San Francisco: Jossey-Bass.
Clyburn, M. (1991, May). An investigation of institutional research in small, private colleges in the southeastern United States. Paper presented at the 31st annual forum of the Association for Institutional Research, San Francisco, CA.
Crotty, M. (1998). The foundations of social research: Meaning and perspective n the research process. Thousand Oaks, CA: Sage Publications.
Delaney, A. M. (1997). The role of institutional research in higher education: Enabling researchers to meet new challenges. Research in Higher Education, 38(1), 1-16.
Delaney, A. M. (2000, May). Institutional researchers as leaders in policy: Perspectives and possibilities. Paper presented at the 40th annual forum of the Association for Institutional Research, Cincinnati, OH.
Delaney, A. M. (2001, June). Institutional researchers: Challenges, resources, and opportunities. Paper presented at the 41st annual forum of the Association for Institutional Research, Long Beach, CA.
Dressel, P. L. & Associates. (1971). Institutional research in the university: A handbook. San Francisco: Jossey-Bass.
Erlandson, D. A., Harris, E. L., Skipper, B. L., & Allen, S. D. (1993). Doing naturalistic inquiry: A guide to methods. Newburg Park, CA: Sage Publications.
Fincher, C. (1985). The art and science of institutional research. In P. T. Terenzini (Series Ed.) & M. W. Peterson and M. Corcoran (Vol. Eds.), Institutional research in transition. New Directions for Institutional Research, 46, 17-37. San Francisco: Jossey-Bass.
99

Gubasta, J. L. (1976, May). Conflicting pressures that impinge upon the operational effectiveness of institutional researchers: Challenges to the practitioner. Paper presented at the 16th annual forum of the Association for Institutional Research, Los Angeles, CA. (ED 126837)
Howard, R. (2001). Forward. In R. E. Howard (Ed.), Institutional Research: Decision support in higher education (pp. v-vii). Tallahassee, FL: The Association for Institutional Research.
Huntington, R. B. & Clagett, C. A. (1991, November). Increasing institutional research effectiveness and productivity: Findings from a national survey. Paper presented at the 18th annual conference of the Northeast Association for Institutional Research, Cambridge, MA.
Hurst. P. J., Matier, M. W., & Sidle, C. C. (1998). Fostering teamwork and teams from the institutional research office. In J. F. Volkwein (Series Ed.) & S. H. Frost (Vol. Ed.), Using teams in higher education: Cultural foundations for productive change. New Directions for Institutional Research, 100, 17-25. San Francisco: Jossey-Bass.
Hutchings, P. & Shulman, L. S. (2006, February). Learning about student learning from community colleges. Carnegie Perspectives. Retrieved April 19, 2006 from http://www.carnegiefoundation.org/perspectives/sub.asp?key=245&subkey=1096
Keller, G. (1995, Spring). Managing in tomorrow’s academic environment. In T. R. Sanford (Ed.), Preparing for the information needs of the twenty-first century. New Directions for Institutional Research, 85, 59-64. San Francisco: Jossey-Bass.
Knight, W. E. (2003). Conclusion. In W. E. Knight (Ed.), The primer for institutional research, 159-161. Tallahassee, FL: The Association for Institutional Research.
Knight, W. E., Moore, M. E., & Coperthwaite, C. C. (1997). Institutional research: Knowledge, skills, and perceptions of effectiveness. Research in Higher Education, 38(4), 419-433.
Kuh, G. D. (2001). The national survey of student engagement: Conceptual framework and overview of psychometric properties. Bloomington, IN: Indiana University, Center for Postsecondary Research and Planning
Kuh, G. & Associates (2005). Student success in college: Creating conditions that matter. San Francisco: Jossey-Bass.
Lasher, W. F. & Firnberg, J. W. (1983). The future of institutional research. In M. W. Peterson (Series Ed.) & J. W. Firnberg and W. F. Lasher (Vol. Eds.), The politics and pragmatics of institutional research. New Directions for Institutional Research, 38, 89-100. San Francisco: Jossey-Bass.
Lincoln, Y. S. & Guba, E. G. (1985). Naturalistic inquiry. Beverly Hills, CA: Sage Publications. Lindquist, S. B. (Winter 1999). A profile of institutional researchers from AIR national
membership surveys. In J. F. Volkwein (Series Ed. & Vol. Ed.), What is institutional research all about? A critical and comprehensive assessment of the profession. New Directions for Institutional Research, 104, 41-50. San Francisco: Jossey-Bass.
Lohmann, D. (1998, May). Positioning institutional research as a major player in policy decisions: Problems to solve, actions to take. Paper presented at the 38th annual forum of the Association for Institutional Research, Minneapolis, MN.
100

Matier, M. W., Sidle, C. C., & Hurst, P. J. (1995). Institutional researchers’ roles in the 21st century. In P. T. Terenzini (Series Ed.) & T. R. Sanford (Vol. Ed.), Preparing for the information needs of the twenty-first century. New Directions for Institutional Research, 85, 75-84. San Francisco: Jossey-Bass.
Merriam, S. B. (1998). Qualitative research and case study applications in education. San Francisco: Jossey-Bass.
Miles, M. B. & Huberman, A. M. (1994). Qualitative data analysis: An expanded sourcebook (2nd ed.). Thousand Oaks, CA: Sage Publications.
Muffo, J. A. (1999, Winter). A comparison of findings from regional studies of institutional research offices. In J. F. Volkwein (Series Ed. & Vol. Ed.), What is institutional research all about? A critical and comprehensive assessment of the profession. New Directions for Institutional Research, 104, 51-60. San Francisco: Jossey-Bass.
Patton, M. Q. (2002). Qualitative research and evaluation methods (3rd ed.). Thousand Oaks, CA: Sage Publications.
Peterson, M. W. (1999, Winter). The role of institutional research: From improvement to redesign. In J. F. Volkwein (Series Ed. & Vol. Ed.), What is institutional research all about? A critical and comprehensive assessment of the profession. New Directions for Institutional Research, 104, 83-103. San Francisco: Jossey-Bass.
Peterson, M. W. & Corcoran, M (Vol. Eds.) & Terenzini, P. T. (Series Ed.) (1985). Institutional research in transition. New Directions for Institutional Research, 46. San Francisco: Jossey-Bass.
Presley, J. B. (Vol. Ed.) &.Terenzini, P. T. (Series Ed.) (1990). Organizing effective institutional research offices. New Directions for Institutional Research, 66. San Francisco: Jossey-Bass.
Sanford, T. R. (1983, May). Coping strategies for job stress among institutional researchers. Paper presented at the 23rd annual forum of the Association for Institutional Research, Toronto. (Ed 232583)
Sanford, T. R. (1995, Spring). Higher education and institutional research: What lies ahead? In P. T. Terenzini (Series Ed.) & T. R. Sanford (Vol. Ed.), Preparing for the information needs of the twenty-first century. New Directions for Institutional Research, 85, 85-87.
Saupe, J. L. (1990). The functions of institutional research (2nd ed.). Tallahassee, FL: The Association for Institutional Research.
Storrar, S. J. (1981, May). Perceptions of organizational and political environments: Results from a national survey of institutional research/planning officers at large public universities. Paper presented at the 21st annual forum of the Association for Institutional Research, Minneapolis, MN. (ED 205094)
Terenzini, P. T. (1993). On the nature of institutional research and the knowledge and skills it requires. Research in Higher Education, 34(1), 1-10.
Terenzini, P. T. (1995 Fall/Winter). Evolution and evolution in institutional research. AIR Currents, 33(7).
101

Volkwein, J. F. (1990). The diversity of institutional research structures and tasks. In P. T. Terenzini and E. E. Chaffee (Series Eds.), and J. B. Presley (Vol. Ed.), Organizing Effective Institutional Research Offices. New Directions for Institutional Research, 66, 7-26. San Francisco: Jossey-Bass.
Volkwein, J. F. (1999, Winter). The four faces of institutional research. In J. F. Volkwein (Series Ed. & Vol. Ed.), What is institutional research all about? A critical and comprehensive assessment of the profession. New Directions for Institutional Research, 104, 9-19. San Francisco: Jossey-Bass.
102

STUDYING STUDENT LEARNING AT TWO-YEAR AND FOUR-YEAR INSTITUTIONS WITH CCSSE AND THE NSSE
William E. Knight
Director of Planning and Institutional Research and Adjunct Assistant Professor of Higher Education
Bowling Green State University Corby A. Coperthwaite
Director of Planning, Research and Assessment Connecticut Community Colleges
Mary Ann Coughlin Professor of Research and Statistics
Springfield College
An increasingly large share of post secondary enrollments is in two-year colleges (Cohen & Brawer, 2003). There is some evidence that an increasingly large portion of traditional college age students are attending two-year colleges and attending full-time. In Connecticut, for example, historically the part-time adult learner has been the primary consumer of a community college education; the number of traditional age students attending community colleges has increased by 56% since 1999, and the number of students enrolled full-time has increased by 62% since 1999 (Coperthwaite, 2002, 2003, 2004, 2005). Students attend a community college primarily because of cost and location. Most of them are working 20 hours or more a week, attempting to juggle family, finances and other responsibilities. Implicit in the decision of students who could enroll in four-year institutions, yet attend two-year colleges instead, is the assumption that student learning within the two sectors is equal. Important policy and practice questions include how institutional experiences affect learning in the two sectors and whether the magnitude of and effects upon learning in the two sectors have conditional effects (e.g., whether they are the same for students in various sub-populations). The purpose of this study is to contribute toward the small but growing body of evidence concerning cognitive effects of student attendance at two- and four-year institutions.
Pascarella and Terenzini (1991), in their voluminous meta-analysis of 20 years of college-student impact studies, reached a conclusion that is eloquently stated by Kuh (2001): “What students do during college counts more in terms of desired outcomes than who they are or even where they go to college” (p. 1). This result was tempered by the caveat that relatively few methodologically rigorous studies of effects on student learning took differences in students’ backgrounds into account and were carried out across a diverse array of students and institutions. Another concern was that few studies have explored the specific ways that student backgrounds combine with institutional experiences to affect student learning and development, as suggested in models by theorists such as Astin, (1984), Pace (1979), and Pascarella (1985).
Fortunately, a number of the studies called for by Pascarella and Terenzini have taken place in the decades of the 1990s and 2000s at both four-year and two-year institutions. Davis
103

and Murrell (1993) used Pace’s (1979) conceptual model and a dataset of College Student Experience Questionnaire (CSEQ) responses from Kuh et al.’s (1991) “involving institutions” (11 four-year institutions, n = 2,271) to develop a structural model of the effects of student background characteristics, majors, perceptions of the institutional environment, and academic and social effort on self-reported gains in general education, personal, and vocational skills. Pike (1999) developed a path analysis model with CSEQ plus campus data for 626 first year students at a Midwestern research university to explore relationships among background characteristics, involvement, interaction, integration, and self-reported gains. Pike (2000) used existing campus data plus survey results from 827 students at a Midwestern research university to develop a model of the relationships among background characteristics, students’ academic and social involvement, and their self-reported gains. Pike and Killian (2001) developed a similar structural model using CSEQ data from 598 students at the same university. Pike, Kuh, and Goneya (2003) developed a model based on 1,500 student CSEQ responses across six types of institutions as defined by 2000 Carnegie classifications; while the magnitudes of gains were significantly different across institutional types, the structural model of gains was stable.
Within the two-year college sector, Knight (1994) used Community College Student Experience Questionnaire (CCSEQ) data from 1,062 students at 7 regional campuses of a Midwestern university to develop path analysis models to explore relationships among student background characteristics, academic goals, and quality of effort and self-reported gains in six areas. Glover and Murrell (1998) used CCSEQ data from 4,210 students at nine colleges to develop multiple regression models that highlighted relationships among student background characteristics, quality of effort, perceptions of the institutional environment and self-reported general education and personal/social gains. Swigart (2000) used a similar approach, but with a single variable to measure gains, using CCSEQ data from 7,734 students who reported their intended academic goal as transferring to a four-year institution. Similarly, Swigart and Murrell (2000), using CCSEQ responses, found significantly greater self-reported growth for African-American (n=268) than Caucasian (n=284) students.
Only four studies were located that compared the magnitude of student learning between two- and four-year institutions and/or examined relationships among student characteristics, experiences, and growth between the two sectors. Bohr and Pascarella (1994), using data from 204 students at one two-year and one four-year institution, found no significant differences in gains on ACT Collegiate Assessment of Academic Proficiency (CAAP) reading comprehension, mathematics, or critical thinking measures after age, credit hours, and family responsibilities were controlled. Pascarella, Bohr, Nora, and Terenzini (1995) expanded the earlier study to 2,685 students at six four-year and five two-year institutions using similar variables and techniques and found no significant differences in the three CAAP modules or composite achievement; however, they did find that men and minority students benefited more from two-year colleges, while women and Caucasian students realized greater gains at four-year institutions. Strauss and Volkwein (2002) used a dataset from 7,658 sophomores at 51 institutions in the SUNY system to examine the effects of student background characteristics, financial aid/need, goal clarity, academic experiences and interactions with agents of socialization, perceptions of the institutional climate, student involvement, and institutional
104

commitment on grade point averages on a self-reported intellectual scale to determine how these varied by sector. They found differences in both the magnitude and patterns of influences between student groups at two-year and four-year colleges. Controlling for other factors, students at two-year colleges received higher grades, while those at four-year institutions reported greater growth. While pre-college academic achievement was a better predictor of college GPA at four-year institutions, student effort was a better predictor of GPA at two-year institutions. No meaningful sector differences were found in predictors of the self-reported intellectual scale. Finally, Pierson, Wolniak, Pascarella, and Flowers (2003), using data from 205 students at one two-year and one four-year institution, determined that, after controlling for an array of confounding variables, students at two-year colleges showed greater gains in three learning orientations characterized as Openness to Diversity/Challenge, Learning for Self-Understanding, and Internal Locus of Attribution for Academic Success. There were significant conditional effects for these gains across gender, race, and pre-college academic ability groups.
Given the enrollment trends, the accompanying policy and practice questions, and the paucity of literature on the topic, our interest was in using data from similar instruments with a variety of two- and four-year institutions to examine the magnitude of and effects upon learning in the two sectors. Specifically, our research questions included:
1. Is it possible to develop a structural and measurement model using data from both two-
and four-year institutions that accurately represents the relationships among students’ self-reported learning gains, involvement, perceptions of the educational environment, and background variables?
2. Is the research model the same (invariant) between the two- and four-year sectors? 3. Is there a significant difference between the learning gains in the two sectors, and 4. Are there significant conditional effects upon learning gains in the two sectors?
Method
Conceptual Model
The conceptual model underlying this study falls into the college impact family of models typified by Astin’s (1984, 1993) I-E-O theory of involvement, Pace’s (1979, 1984) theory of quality of effort, and Pascarella’s (1985) General Model for Assessing Change. The models posit that student background variables and institutional characteristics influence and combine with perceptions of the educational environment to influence quality of effort or involvement and, ultimately, learning and development. Measures
All data for the study were obtained from the National Survey of Student Engagement (for students at four-year institutions) or the Community College Survey of Student Engagement (for students at two-year colleges). The NSSE was “. . . specifically designed to assess the extent to which students are engaged in empirically derived good educational practices and what they gain from their college experience” (Kuh, 2001, p. 2). The NSSE items relate to practices shown to facilitate engagement or quality of effort (Astin, 1991; Chickering & Reisser, 1993; Kuh,
105

Schuh, Whitt, & Associates, 1991; Pascarella & Terenzini, 1991). Several studies have documented significant relationships between student engagement as reported by NSSE and direct measures of cognitive growth as measured by the ACT CAAP, as well as student grades (Ewell, 2002; Hughes & Pace, 2003; Carni, Kuh, & Klein, 2006). The CCSSE was developed from the NSSE for use in two-year colleges; there is a high degree of correspondence between them (Marti, n.d.).
The dependent or downstream variables in this study are self-reported student gains. The
validity of self-reports has been heavily studied; they are likely to be valid when (1) the information requested is known to the participants; (2) the questions are phrased clearly and unambiguously; (3) the questions refer to recent activities; (4) participants think the questions merit a serious and thoughtful response; and (5) the questions do not threaten, embarrass, or violate the privacy of the participant or encourage the participant to respond in socially desirable ways (Brandt, 1958; DeNisi & Shaw, 1977; Hansford & Hattie, 1982; Laing, Swayer, & Noble, 1989; Lowman & Williams, 1987; Pace, 1985; Pike, 1995). The NSSE “was intentionally designed to satisfy all these conditions” (Kuh, 2001, p. 4).
NSSE and CSSE data were merged into a single data set that contained only items that were phrased in the same way across sectors and years. Factor analysis results (see Tables 1-3) were used to sum items into scales. Learning gains were represented by two scales: Academic Gains and Personal-Social Gains. Perceptions of the educational environment were represented by three scales: Coursework Environment, Campus Climate, and Relational Environment. Involvement was measured by six scales: Student-Faculty, Service Learning, Academic, Diversity, Classmates, and Information Technology. Student background variables were recoded for use in the study; these included gender (female=1, male=0), ethnicity (student of color=1, Caucasian=0), first generation status (1=first generation, 0=not first generation), and class rank (1=freshman, 2=sophomore, 3=junior, 4=senior). The dichotomous ethnicity coding was due to the relatively large number of students of color. Table 1 - Factor Analysis Results: Gains Items Academic Gains Personal-Social Gains General Education 0.692 0.431 Work-Related Knowledge and Skills 0.606 0.475 Writing 0.799 0.482 Speaking 0.780 0.564 Thinking Critically and Analytically 0.816 0.498 Solving Numerical Problems 0.704 0.377 Using Computers 0.667 0.446 Understanding Yourself 0.545 0.810 Understanding People of Other Racial/Ethnic Backgrounds 0.512 0.844 Developing a Personal Code of Values and Ethics 0.551 0.875 Contributing to the Welfare of Your Community 0.461 0.771 % Variance Explained 49% 10%
106

Table 2 - Factor Analysis Results: Perceptions of the Environment Items Coursework Env. Campus Climate Relational Env. Memorizing 0.602 0.249 0.111 Analyzing 0.810 0.259 0.186 Synthesizing 0.807 0.323 0.247 Evaluating 0.775 0.249 0.202 Applying 0.781 0.279 0.222 Scholarly Environment 0.398 0.555 0.258 Environment for Diversity 0.304 0.755 0.347 Academic Environment 0.186 0.815 0.328 Social Environment 0.256 0.841 0.386 Student Environment 0.216 0.312 0.748 Faculty Environment 0.236 0.378 0.819 Administrative Environment 0.141 0.386 0.794 % Variance Explained 33% 15% 9% Table 3 - Factor Analysis Results: Student Involvement Student/ Service Info. Faculty Learning Academic Diversity Classmates Tech. Discussed Grades with Faculty 0.712 0.272 0.375 0.287 0.328 0.353 Discussed Career Plans with Faculty 0.705 0.354 0.280 0.233 0.240 0.135 Discussed Ideas from Class with Faculty Outside of Class 0.717 0.440 0.243 0.327 0.293 0.008 Received Prompt Feedback from Faculty 0.650 0.105 0.250 0.253 0.313 0.145 Worked Harder Than Expected to Meet Faculty Expectations 0.583 0.197 0.526 0.239 0.316 -0.001 Tutored Other Students 0.304 0.647 0.146 0.276 0.298 0.005 Participated in a Community-Based Project for Class 0.275 0.598 0.194 0.155 0.336 0.206 Worked with Faculty on Activities Other Than Course Work 0.532 0.666 0.140 0.264 0.264 0.006 Participating in Co-Curricular Activities 0.156 0.723 0.330 0.144 0.064 0.163 Integrated Diverse Concepts 0.352 0.236 0.706 0.286 0.439 0.291 Rewrote a paper 0.271 0.010 0.721 0.107 0.174 0.113 Preparing for Class/Studying 0.232 0.454 0.459 0.182 0.136 0.002 Conversations with Students of Other Racial Backgrounds 0.336 0.239 0.183 0.896 0.274 0.148 Conversations with Students with Different Views 0.326 0.269 0.223 0.902 0.263 0.171 Made a Class Presentation 0.314 0.395 0.346 0.194 0.676 0.154 Worked With Other Students on Projects During Class 0.260 0.003 0.102 0.190 0.732 0.206 Worked With Other Students on Projects Outside of Class 0.327 0.495 0.380 0.281 0.676 0.228 Used Electronic Media for Assignments 0.328 0.153 0.259 0.204 0.287 0.640 Used Email to Communicate with Faculty 0.461 0.315 0.487 0.229 0.278 0.654 Asked Questions in Class 0.511 0.289 0.202 0.342 0.486 -0.118 Discussed Academics with Others Outside of Class 0.518 0.170 0.255 0.562 0.341 0.002 Came to Class Unprepared -0.233 0.007 -0.317 0.006 0.006 0.556 % Variance Explained 26% 7% 6% 6% 5% 5%
107

Table 4 provides means, standard deviations, and reliabilities for the observed variables. Table 4 - Means, Standard Deviations, Number of Items, and Reliabilities for Measured Variables Variable Mean Std. Dev. Items Reliability Background
Female 0.64 0.48 Student of Color 0.17 0.37 First Generation 0.59 0.49 Class Level 1.53 1.05
Perceptions of the Environment Coursework Environment 13.82 3.32 5 0.82 Campus Climate 9.45 2.77 4 0.73 Relational Environment 15.56 3.21 3 0.66
Student Effort Student-Faculty 11.55 2.97 5 0.73 Service Learning 5.55 2.73 4 0.65 Academic 8.36 2.80 3 0.58 Diversity 4.97 1.89 2 0.85 Classmates 6.89 1.94 3 0.58 Info. Tech. 5.48 1.71 2 0.56
Gains Academic 19.47 4.72 7 0.86 Personal-Social 9.51 3.27 4 0.85 Sample
Data from 18 institutions, representing NSSE and CCSSE administrations between 2000 and 2006, were included in the original sample. Surveys were administered using recommended procedures. As a means of promoting similarity in students’ background characteristics for the study, NSSE data were only used for students who reported their age as between 18 and 24, and CCSSE data were only used for students who reported their age as 18-24, with highest current educational credential as a high school diploma or GED, and educational goal as transfer to a four-year institution. Cases with missing data were removed from the data set. Finally, a random sample of the four-year students was drawn so that the number of students from each sector would be equal in the final sample (n=1,232). The number of students sampled from each institution and the corresponding dates and methods of survey administration are listed in Table 5. Table 5 - Institutions, Sample Sizes, Dates, and Modes of CCSSE or NSSE Administration Sector Institution Sample Size Dates Modes of Administration 2-year Connecticut Community Colleges 375 2004, 2006 printed survey, in class 2-year Oakton Community College 19 2003, 2006 printed survey, in class 2-year Sinclair Community College 184 2002, 2003, 2004 printed survey, in class 2005, 2006 2-year Ivy Tech Community College 38 2006 printed survey, in class 4-year Springfield College 48 2004, 2006 printed and/or web, mailed 4-year Bowling Green State University 276 2000, 2001, 2003 printed and/or web, mailed 2005, 2006 4-year Indiana University-Purdue University-Indianapolis 292 2002, 2004, 2006 printed and/or web, mailed
108

Data Analysis While researchers who have analyzed institutional effects in CSEQ (Strauss and
Volkwein, 2002) and CCSEQ (Ethington, 2000) data have made a compelling case for the benefit of using hierarchical linear modeling techniques, our data set did not meet the requirement of a minimum of 30 institutions (Porter, 2005). Structural equation modeling was used with AMOS 4.0.
The data analysis was conducted in four phases, corresponding to the four research questions, using procedures illustrated by Pike (1999, 2000), Pike and Killian (2001), Pike, Kuh, and Goneya (2003), and Wang, Ye, Jackson, Rodgers, and Jones (2005). The first set of analyses tested the research model’s ability to adequately represent the covariances among the observed variable. Maximum likelihood estimation allowed the use of goodness of fit measures that were robust to departures from multivariate normality. Since the chi-square statistic is sensitive to sample size (Cheung & Rensvold, 2002), the Comparative Fit Index, Tucker Lewis Index, and Root Mean Square Error of Approximation were used to assess model goodness-of-fit (Hu & Bentler, 1999), using guidelines suggested by Hu and Bentler (1999), Browne and Cudeck (1993), and MacCallum, Browne, and Sugawara (1996). Modification indices and t values were inspected to determine whether permitting correlations between error terms and/or removing structural relationships would significantly improve model fit. Standardized direct, indirect, and total effects and squared multiple correlations for the final models were also computed.
The second phase involved determining whether the final model from the first phase was invariant across the two- and four-year institution groups. A variation of the final or baseline model was developed where all paths in the structural model and all factor loadings in the measurement model were constrained to be equal across the two sectors. The difference in chi-square values and degrees of freedom between the baseline and invariance models was used to evaluate the goodness of fit of the later. Next, a series of additional models were developed that constrained some, but not all of the structural paths and factor loadings were constrained between the two sectors; each was tested against the baseline model.
Third, a model consisting of the learning gains construct, its two associated observed variables, and their associated error terms was constrained to have structural paths and intercepts equal across sectors, while the mean of the learning gains construct was constrained to zero for one group and free to vary for the other. As shown by Arbuckle and Wothke (1999), who referenced the technique from Sorbom (1974), this approach allowed the estimation of mean differences in learning gains between the two sectors.
Last, the technique used in phase three was again employed in a series of additional analyses with subsets of the data to estimate mean differences in learning gains between the two sectors for females, students of color, first generation students, and freshmen.
109
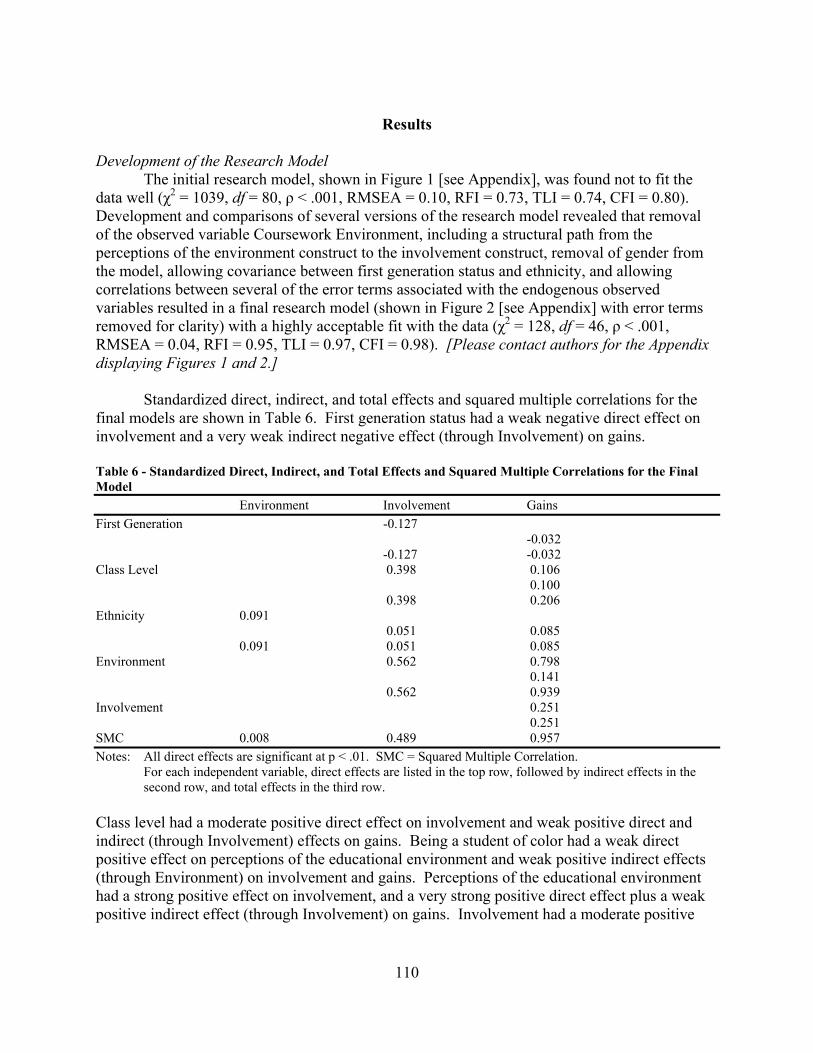
Results Development of the Research Model The initial research model, shown in Figure 1 [see Appendix], was found not to fit the data well (χ2 = 1039, df = 80, ρ < .001, RMSEA = 0.10, RFI = 0.73, TLI = 0.74, CFI = 0.80). Development and comparisons of several versions of the research model revealed that removal of the observed variable Coursework Environment, including a structural path from the perceptions of the environment construct to the involvement construct, removal of gender from the model, allowing covariance between first generation status and ethnicity, and allowing correlations between several of the error terms associated with the endogenous observed variables resulted in a final research model (shown in Figure 2 [see Appendix] with error terms removed for clarity) with a highly acceptable fit with the data (χ2 = 128, df = 46, ρ < .001, RMSEA = 0.04, RFI = 0.95, TLI = 0.97, CFI = 0.98). [Please contact authors for the Appendix displaying Figures 1 and 2.]
Standardized direct, indirect, and total effects and squared multiple correlations for the final models are shown in Table 6. First generation status had a weak negative direct effect on involvement and a very weak indirect negative effect (through Involvement) on gains.
Table 6 - Standardized Direct, Indirect, and Total Effects and Squared Multiple Correlations for the Final Model Environment Involvement Gains First Generation -0.127 -0.032 -0.127 -0.032 Class Level 0.398 0.106 0.100 0.398 0.206 Ethnicity 0.091 0.051 0.085 0.091 0.051 0.085 Environment 0.562 0.798 0.141 0.562 0.939 Involvement 0.251 0.251 SMC 0.008 0.489 0.957 Notes: All direct effects are significant at p < .01. SMC = Squared Multiple Correlation.
For each independent variable, direct effects are listed in the top row, followed by indirect effects in the second row, and total effects in the third row.
Class level had a moderate positive direct effect on involvement and weak positive direct and indirect (through Involvement) effects on gains. Being a student of color had a weak direct positive effect on perceptions of the educational environment and weak positive indirect effects (through Environment) on involvement and gains. Perceptions of the educational environment had a strong positive effect on involvement, and a very strong positive direct effect plus a weak positive indirect effect (through Involvement) on gains. Involvement had a moderate positive
110

direct effect on gains. The research model did a very poor job of explaining perceptions of the educational environment (squared multiple correlation of 0.008), and good job of explaining involvement (0.489), and a very good job of explaining gains (0.957). Invariance Between Groups
While the data fit the models for both groups, they did not fit several additional analyses that imposed sector invariances (i.e., that imposed the stricter standard that the pattern of structural paths and/or factor loadings was exactly between the CCSSE and NSSE data sets). As shown in Table 7, the total invariance model was rejected because it significantly increased poorness of fit when evaluated against the baseline model. Several additional models that variously constrained all structural paths only, all factor loadings only, and only selected structural paths or factor loadings were all also rejected when evaluated against the baseline model. These results were similar whether or not background variables of ethnicity, class level, and first generation status were included. Table 7 - Goodness-of-Fit Statistics for Group Invariance Tests Model χ2 df Δ χ2 Δ df ρ Baseline Model (combined two-year and four-year) 128 46 All Structural Paths and Factor Loadings Invariant 334 106 206 60 < .001 All Structural Paths Invariant 318 99 190 53 < .001 All Factor Loadings Invariant 323 99 195 53 < .001 Structural Paths from Involvement to Gains, Perceptions of the Environment to Gains, and Perceptions of the Environment to Involvement Invariant 308 95 180 98 < .001 Factor Loadings from Observed Variables to Gains Invariant 309 93 181 47 < .001 Factor Loadings from Observed Variables to Perceptions of the Environment Invariant 308 93 180 47 < .001 Factor Loadings from Observed Variables to Involvement Invariant 323 97 195 51 < .001 Differences in Mean Gains
The learning gains construct for two-year college students was found to have a mean of -2.32 and a standard error of 0.26. The resulting critical value of -8.88 indicates that two-year college students had significantly lesser learning gains than did students at four-year institutions (whose mean learning gains were constrained to zero). Conditional Effects
Table 8 indicates that two-year college students had significantly lower learning gains than students at four-year institutions when separate analyses were carried out for females and males; students of color and Caucasian students; first generation students and non-first generation students; and freshmen and upper class students.
111
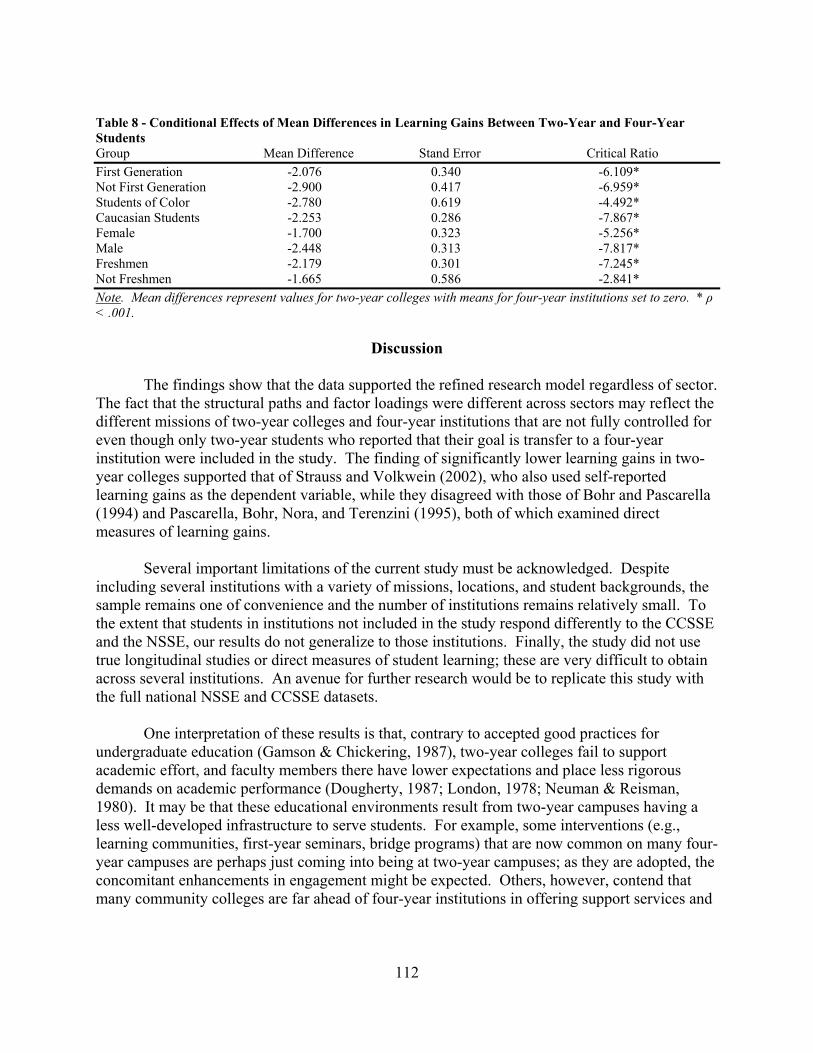
Table 8 - Conditional Effects of Mean Differences in Learning Gains Between Two-Year and Four-Year Students Group Mean Difference Stand Error Critical Ratio First Generation -2.076 0.340 -6.109* Not First Generation -2.900 0.417 -6.959* Students of Color -2.780 0.619 -4.492* Caucasian Students -2.253 0.286 -7.867* Female -1.700 0.323 -5.256* Male -2.448 0.313 -7.817* Freshmen -2.179 0.301 -7.245* Not Freshmen -1.665 0.586 -2.841* Note. Mean differences represent values for two-year colleges with means for four-year institutions set to zero. * ρ < .001.
Discussion
The findings show that the data supported the refined research model regardless of sector. The fact that the structural paths and factor loadings were different across sectors may reflect the different missions of two-year colleges and four-year institutions that are not fully controlled for even though only two-year students who reported that their goal is transfer to a four-year institution were included in the study. The finding of significantly lower learning gains in two-year colleges supported that of Strauss and Volkwein (2002), who also used self-reported learning gains as the dependent variable, while they disagreed with those of Bohr and Pascarella (1994) and Pascarella, Bohr, Nora, and Terenzini (1995), both of which examined direct measures of learning gains.
Several important limitations of the current study must be acknowledged. Despite
including several institutions with a variety of missions, locations, and student backgrounds, the sample remains one of convenience and the number of institutions remains relatively small. To the extent that students in institutions not included in the study respond differently to the CCSSE and the NSSE, our results do not generalize to those institutions. Finally, the study did not use true longitudinal studies or direct measures of student learning; these are very difficult to obtain across several institutions. An avenue for further research would be to replicate this study with the full national NSSE and CCSSE datasets.
One interpretation of these results is that, contrary to accepted good practices for undergraduate education (Gamson & Chickering, 1987), two-year colleges fail to support academic effort, and faculty members there have lower expectations and place less rigorous demands on academic performance (Dougherty, 1987; London, 1978; Neuman & Reisman, 1980). It may be that these educational environments result from two-year campuses having a less well-developed infrastructure to serve students. For example, some interventions (e.g., learning communities, first-year seminars, bridge programs) that are now common on many four-year campuses are perhaps just coming into being at two-year campuses; as they are adopted, the concomitant enhancements in engagement might be expected. Others, however, contend that many community colleges are far ahead of four-year institutions in offering support services and
112

innovative teaching strategies, and thus, the notion of the effects of infrastructure differences needs to be empirically validated.
Another interpretation involves underlying differences in the two student populations, despite the efforts to control for background characteristics. Students at four-year institutions may be more likely to come from households that perceive college attendance as a positive experience, especially with regard to forwarding goals of socioeconomic mobility. Two-year college students may have more short-term or less defined goals and may be likely to have fewer positive experiences in educational settings prior to college enrollment. Thus they may be somewhat more skeptical or less appreciative of the value added to their lives by higher education (American Association of Community Colleges and American Association of State Colleges and Universities, 2004).
Although both the NSSE and the CCSSE ask students to indicate whether they are enrolled on a full-time or part-time basis during the semester in which they complete the surveys, this background factor was not included in the analyses because of the frequency with which students change enrollment status, in addition to institutional differences in definitions of full-time and part-time. This background factor may have had an important effect on the between-sector results, however. Part-time students are more likely, on average, to be enrolled in two-year institutions. We do not know how differences in the experiences of full-time and part-time students bear out across four-year and two-year sectors.
A final caveat worthy of consideration is that the NSSE is mailed (in paper or electronically) to random samples of undergraduates, while the CCSSE, which is administered in randomly chosen classes. It is not clear how mode of administration effects may have related to the results.
References American Association of Community Colleges and American Association of State Colleges and
Universities. (2004). Improving access to the baccalaureate. Washington, DC: Community College Press.
Arbuckle, J. L., & Wothke, W. (1999). AMOS 4.0 User’s Guide. Chicago: Smallwaters Corp. Astin, A. W. (1984). Student involvement: A developmental theory for higher education. Journal
of College Student Personnel, 25, 297-308. Astin, A. W. (1991). Assessment for excellence: The philosophy and practice of assessment and
evaluation in higher education. New York: American Council on Education/Macmillan. Astin, A. W. (1993). What matters in college? Four critical years revisited. San Francisco:
Jossey-Bass. Bohr, L. & Pascarella, E. (1994). Cognitive effects of two-year and four-year institutions: A
preliminary study. Community College Review, 22, 4-11.
113

Brandt, R. M. (1958). The accuracy of self-estimates. Genetic Psychology Monographs, 58, 55-99.
Carni, R. M., Kuh, G. D., & Klein, S. P. (2006). Student engagement and student learning: Testing the linkages. Research in Higher Education, 47(1), 1-32.
Chickering, A. W., & Reisser, L. (1993). Education and identity (2nd ed.). San Francisco: Jossey-Bass.
Cohen, A. M. & Brawer, F. B. (2003). The American community college (4th ed.). San Francisco: Jossey-Bass.
Coperthwaite, C. (2002). Entering Student Survey. Retrieved October 30, 2006 from http://www.commnet.edu/planning/Research/SurveysStudies/EnteringStudentSurvey/ess.html
Coperthwaite, C. (2003). Entering Student Survey. Retrieved October 30, 2006 from http://www.commnet.edu/planning/Research/SurveysStudies/EnteringStudentSurvey/ess.html
Coperthwaite, C. (2004). Entering Student Survey. Retrieved October 30, 2006 from http://www.commnet.edu/planning/Research/SurveysStudies/EnteringStudentSurvey/ess.html
Coperthwaite, C. (2005). Entering Student Survey. Retrieved October 30, 2006 from http://www.commnet.edu/planning/Research/SurveysStudies/EnteringStudentSurvey/ess.html
Davis, T. M. & Murrell, P. H. (1993). A structural model of perceived academic, personal, and vocational gains related to college student responsibility. Research in Higher Education, 34(3), 267-289.
DeNisi, A. S. & Shaw, J. B. (1977). Investigation of the uses of self-reports of abilities. Journal of Applied Psychology, 62, 641-644.
Dougherty, K. (1987). The effects of community colleges: Aid or hindrance to socioeconomic attainment? Sociology of Education, 60, 86-103.
Ewell, P. T. (2002). An analysis of relationships between NSSE and selected student learning outcomes for seniors attending public institutions in South Dakota. Boulder, CO: National Center for Higher Education Management Systems.
Gamson, Z. & Chickering, A. (1987, March). Seven principles of good practice in undergraduate education. AAHE Bulletin, 5-10.
Glover, J. W. & Murrell, P. H. (1998). Campus environment and student involvement as predictors of outcomes of the community college experience. Journal of Applied Research in the Community College, 6, 5-13.
Hansford, B. C. & Hattie, J. A. (1982). The relationship between self and achievement/performance measures. Review of Educational Research, 52, 123-142.
Hughes, R. & Pace, C. R. (2003). Using NSSE to study student retention and withdrawal. Assessment Update, 15(4), 1-2.
Knight, W. E. (1994). Influences on the academic, career, and personal gains and satisfaction of community college students. Paper presented at the annual conference of the Association for Institutional Research, New Orleans, LA. (ED 3736440).
114

Kuh, G. D. (2001). The national survey of student engagement: Conceptual framework and overview of psychometric properties. Bloomington, IN: Indiana University, center for Postsecondary Research and Planning.
Kuh, G. D., Schuh, J. S., Whitt, E. J., & Associates. (1991). Involving colleges: Successful approaches to fostering student learning and personal development outside of the classroom. San Francisco: Jossey-Bass.
Laing, J., Swayer, R, & Noble, J. (1989). Accuracy of self-reported activities and accomplishments of college-bound seniors. Journal of College Student Development, 29, 362-368.
Lowman, R. L. & Williams, R. E. (1987). Validity of self-ratings of abilities and competencies. Journal of Vocational Behavior, 31, 1-13.
London, H. (1978). The culture of a community college. New York: Praeger. Marti, C. N. (n.d.). Overview of the CCSSE instrument and psychometric properties. Retrieved
October 30, 2006 from http://www.commnet.edu/planning/research/surveysstudies/CCSSE2004/ReliabilityValidity.pdf.
Neumann, W. & Reisman, D. (1980). The community college elite. In G. B. Vaughan (Ed.), Questioning the community college role (pp. 53-71). New Directions for Community Colleges, no. 32. San Francisco: Jossey-Bass.
Pace, C. R. (1979). Measuring the outcomes of college: Fifty years of findings and recommendations for the future. San Francisco: Jossey-Bass.
Pace, C. R. (1984). Measuring the quality of college student experiences: An account of the development and use of the College Student Experiences Questionnaire. Los Angeles: University of California, Higher Education Research Institute, Graduate School of Education.
Pace, C. R. (1985). The credibility of student self-reports. Los Angeles: University of California, Higher Education Research Institute, Graduate School of Education.
Pascarella, E. T. (1985). College environmental influences on learning and cognitive development: A critical review and synthesis. In J. Smart (Ed.), Higher Education: Handbook of Theory and Research, Vol. I (pp. 1-61). New York: Agathon Press.
Pascarella, E., Bohr, L., Nora, A., & Terenzini, P. (1995). Cognitive effects of 2-year and 4-year colleges: New Evidence. Educational Evaluation and Policy Analysis, 17, 83-96.
Pascarella, E. T. & Terenzini, P. T. (1991). How college affects students: Findings and insights from twenty years of research. San Francisco: Jossey-Bass.
Pierson, C. T., Wolniak, G. C., Pascarella, E. T., & Flowers, L. A. (2003). Impacts of two-year and four-year college attendance on learning orientations. The Review of Higher Education, 26(3), 299-321.
Pike, G. R. (1995). The relationships between self reports of college experiences and achievement test scores. Research in Higher Education, 36, 1-22.
115

Pike, G. R. (1999). The effects of residential learning communities and traditional residential living arrangements on educational gains during the first year of college. The Journal of College Student Development, 40, 269-284.
Pike, G. R. (2000). The influence of fraternity or sorority membership on students’ college experiences and cognitive development. Research in Higher Education, 41, 117-139.
Pike, G. R. & Killian, T. (2001). Reported gains in student learning: Do academic disciplines make a difference? Research in Higher Education, 42, 429-454.
Pike, G. R., Kuh, G. D., & Goneya, R. M. (2003). The relationship between institutional mission and students’ involvement and educational outcomes. Research in Higher Education, 44(2), 241-261.
Porter, S. R. (2005). What can multilevel models add to institutional research? In M. A. Coughlin (Ed.), Applications of Intermediate/Advanced Statistics in Institutional Research (pp. 110-131). Tallahassee, FL: The Association for Institutional Research.
Sorbom, D. (1974). A general method for studying differences in factor means and factor structure between groups. British Journal of Mathematical and Statistical Psychology, 27, 229-239.
Strauss, L. C. & Volkwein, J. F. (2002). Comparing student performance and growth in 2- and 4-year institutions. Research in Higher Education, 3(2), 133-161.
Swigart, T. E. (2000). Learning and personal growth in community college students who intend to transfer: The role of student involvement, institutional environment, and advising. Journal of Applied Research in the Community College, 8, 43-55.
Swigart, T. E. & Murrell, P. H. (2000). Factors influencing estimates of gains made among African-American and Caucasian community college students. Community College Journal of Research and Practice, 25, 297-312.
116
DO ACADEMIC INTEGRATION PROGRAMS HAVE A CASUAL IMPACT ON
STUDENT RETENTION?1 A STUDY OF A DEVELOPMENTAL MATHEMATICS COURSE USING DISCRETE-
TIME SURVIVAL AND REGRESSION-DISCONTINUITY ANALYSIS2
Sally A. Lesik Assistant Professor
Central Connecticut State University
INTRODUCTION
Many institutions of higher education offer some form of a developmental education program (National Center for Educational Statistics, 2001). The main objective of these programs is to help integrate students who are academically under-prepared into the college or university curriculum and thereby increase student retention (Boylan, Bonham, & White, 1999). Some of the existing research has found that students who have participated in developmental programs tend to stay enrolled in college longer when they are compared to students who have not participated in developmental programs. For example, Waycaster (2001) found that students who had participated in developmental programs stayed enrolled in college longer than those students who did not participate in developmental programs. Similarly, researchers at Sinclair Community College (1994) found a higher percentage of students who participated in developmental programs stayed enrolled in college over the course of three years as compared to non-developmental students. Hector and Hector (1992) claim that developmental students were more likely to stay in school and work towards obtaining both two- and four-year degrees as compared to non-developmental students. On the other hand, Feldman (1993) found that there was no effect of “remedial need” on one-year persistence in college, and Brooks-Leonard (1991) found no effect of developmental status on first-to-second-term retention. However, some studies have found that developmental programs may have a negative effect on student retention. For example, the U.S. Department of Education has found that, nationwide, 56% of students who did not need any developmental courses were more likely to stay enrolled in college and eventually earn a college degree, as compared to 45% of students who took two or fewer developmental courses (National Center for Educational Statistics, 2001). Other researchers (e.g. Baxter & Smith, 1998; Burley, Butner, & Cejda, 2001; Grimes, 1997; Hoyt, 1999) found that students who participated in developmental courses dropped out of college sooner when compared to students who did not take any developmental courses. One limitation of these and other studies is that they do not assess whether developmental programs have a causal impact on student retention; they only suggest whether developmental students are more or less likely to drop out of college when compared to non-developmental students. 1 NEAIR 2006 Best Paper Award. 2 An extended version of this paper is scheduled to appear Research in Higher Education in August 2007.
117

However, students who participate in developmental programs are clearly different from students who do not participate in such programs with respect to their academic ability. Furthermore, students who participate in developmental programs may also differ from students who do not participate in such programs with respect to other unobserved factors. If such unobserved factors are also related to the risk of dropping out of college, then any relationship between participation in a developmental program and student dropout, though suggestive, may be due to unobserved differences between developmental and non-developmental students, and not to the impact of the program itself. Thus, in order to establish a causal relationship between participation in a developmental program and student retention, all other relevant factors need to be equivalent (Wooldridge, 2003). To estimate the causal impact a developmental program has on the time-to-dropout, one would have to randomly assign all students either to the developmental program or to its alternative. Random assignment ensures that the only difference between developmental and non-developmental students is the assignment to the developmental program. By doing a random assignment, there would be no systematic unobserved differences between those students in the developmental program and those in the alternative. Then any difference in dropout rates between students in the developmental program (treatment) and the alternative (control) could provide an unbiased estimate of the causal effect that the developmental program has on student retention. Without randomization, any relationship that is detected between participation in the developmental program and subsequent dropout could be attributed to such unobserved factors. However, for developmental programs, random assignment is clearly not feasible because these programs are designed specifically for students with lower ability that may need extra support, not for students who are ready for college-level work. However, even though it may not make sense to use a random assignment process to assign students to a developmental program, other empirical approaches can be used to obtain an unbiased estimate of the causal effect of participating in a developmental program. In particular, the regression-discontinuity design (Thistlethwaite & Campbell, 1960; Trochim, 1984), can be used to investigate the causal impact that participation in a developmental program has on the time-to-dropout among students who are equivalent with respect to both observed and unobserved factors except for the assignment to the treatment group developmental program or its alternative. The general idea behind the regression-discontinuity design is that participants are assigned to the treatment or control groups based on an exogenously-determined and known cutoff score on an assignment variable, and not by a fair coin toss as in a randomized experiment (Shadish, Cook, & Campbell, 2002). Participants who score below the cutoff are assigned to the treatment group, and participants who score above the cutoff are assigned to the control group (or vice-versa). For a regression-discontinuity design to be successful in providing an unbiased estimate of the program effect, assignment to the treatment group must be based only on this cutoff score. The reason that causal inferences can be made using the regression-discontinuity design is because the cutoff score of the assignment variable was determined exogenously and individuals just above and just below the cutoff score should be identical in every way except in
118
their assignment to the treatment group similar to a tie-breaking random experiment at the cutoff (vanDerKlaauw, 2002, pg. 1258). In this paper, I use the regression-discontinuity design within the framework provided by discrete-time survival analysis to determine if participating in a developmental mathematics course has a causal impact on student retention. By combining these two methods, I was able to confirm that the risk of leaving college among students who participated in a developmental mathematics program was significantly lower than for equivalent students who did not participate in such programs.
RESEARCH DESIGN
The sample used consists of 212 students at a large state university in the northeast who entered as first-time, full-time freshmen between 2000 and 2002 who scored within five points of an exogenous cutoff score of an assignment variable. Outcome variable DROP, is a dichotomous variable that indicates whether or not a student was enrolled in each of six consecutive semesters, or three years, after beginning college in the 2000, 2001, or 2002 cohorts. DROP has value 1 in the semester in which the student left the university for the first time, and 0 for all earlier semesters. Time In order to address the question of when a student is most at risk for dropping out of the university, I used a system of time-varying dummy variables to record the particular semester to which each row of the person-period dataset refers. equals 1 in any row that refers to a student’s first semester at the university; equals 1 in rows referring to a student’s second semester; and so on, up to predictor .
1D
2D
6D Assignment predictor PLACE is a continuous predictor that represents the student’s continuous score on the mathematics placement test. Treatment indicator DEV is a dichotomous predictor that indicates whether or not a student was assigned to participate in the developmental program. If DEV = 0, the student was not assigned to participate in the developmental mathematics program because they scored greater than the predetermined cutoff score of 125 on the mathematics placement test; if DEV = 1, the student was assigned to participate in the developmental mathematics program because they scored lower than the predetermined cutoff score of 125 on the mathematics placement test.
STATISTICAL ANALYSIS
By using discrete-time survival analysis, the time-to-dropout can be estimated by calculating the risk or hazard probability that the event of dropping out will occur in each semester over the course of the three years (Singer & Willett, 2003). This hazard probability is conditional on the event occurring for the first time. Once a student has dropped out of the
119

university for the first time, they are no longer at risk for dropping out, and therefore are no longer included in the risk set beyond that time. In a regression-discontinuity design, an unbiased estimate of the treatment effect at the cutoff score can be found by adding the treatment indicator and the assignment variable as predictors to a baseline discrete-time hazard model as follows:
( ) ( ) ( )CPSDEVDDDth i 21662211logit 1 ββααα +++++= K ,
where is the population hazard, which describes the “risk” of dropping out in semester . Parameters
( )ith6,,2,1 where, K=ii 621 ,,, ααα K represent the population log-odds of
dropping out of the university for the first time during each specified period, DEV is the dichotomous treatment indicator, and CPS = PLACE – 125 is the continuous placement score centered at the cutoff score. Parameter 1β represents the causal effect of the assignment to the developmental program on the risk of dropout for individuals at the cutoff score (Shadish et al., 2002). Including the centered assignment variable as a covariate makes the treatment indicator (DEV) orthogonal to any possible unobserved confounding exogenous variable (Berk & Rauma, 1983), thus providing the opportunity to obtain an unbiased estimate of the treatment effect. No other covariates need to be added because the regression-discontinuity design emulates a tie-breaking random experiment at the cutoff score, where students are on average equivalent in all other respects except for the program assignment (Berk & DeLeeuw, 1999; Trochim, 1984). Including covariates in a regression-discontinuity design can serve as an empirical check for random assignment and also increase the efficiency of the estimate of the treatment effect (Judd & Kenny, 1981; Trochim, 1984). In order to estimate the treatment effect in a regression-discontinuity design, there has to be perfect compliance with the assignment to either the treatment group or control group that is based solely on the score received on the mathematics placement test. Instrumental variables estimation (IVE) can be used to estimate the effect of the “treatment-on-the-treated” by including in the sample those students (n = 11) who did not comply with the assignment based on the score they received on the mathematics placement test (Angrist & Krueger, 1991; Black, 1999; Imbens & vanDerKlaauw, 1995). Because these students did not comply with the assignment this results in a “fuzzy” discontinuity (Trochim, 1984) at the cutoff score. For the first stage of the instrumental variables estimation, I used the assignment variable (DEV) which indicates whether the student was assigned to participate in the developmental program, and the centered placement score (CPS), to predict whether or not a student actually participated in the developmental program (APE). This probability is estimated by the first-stage linear probability model as given in model (2):
( ) εγγγ +++= CPSDEVAPE 2102
Where APE is a dichotomous variable which indicates the actual program entered (APE = 1 if the student actually participated in the developmental program, APE = 0 if the student did not participate in the developmental program): DEV is the program assignment based on the score received on the mathematics placement test (DEV = 1 if the student was assigned to the
120

developmental program, DEV = 0 if the student was not assigned to the developmental program): and ε is the residual error. The second stage model consists of adding the predicted value of the actual program entered obtained from the first stage model (2) in place of the developmental indicator (DEV) as follows:
( ) ( ) ( )CPSEPADDDth j 21662211ˆlogit 3 ββααα +++++= K
FINDINGS
Figure 1 suggests that the relationship between the assignment and outcome variables is approximately linear using lowess smoother with a logit transformation. Notice that for students in the treatment group (those students with a scaled placement score of less than 0), the relationship between the placement score and outcome variable can roughly be approximated by a straight line. The same can be said for students in the control group. As an additional check on the linearity of the relationship between the assignment and outcome variables, the addition of non-linear quadratic and cubic terms and their respective interactions to the model was not significant (p > 0.20). Figure 1: Lowess smoother showing the relationship between the assignment to the developmental program and dropout using a logit transformation within the five-point discontinuity sample (n = 212).
-3.5
-3-2
.5-2
logi
t DR
OP
-5 0 5Placement Score
Fitted hazard probabilities at the centered cutoff score, can be found by using the parameter estimates given in Table 1 with the following formula:
( ) ( ) ( )EPADDDje
th ˆˆˆˆˆ 16622111
1ˆ4βααα ++++−+
=K
, where i = 1, 2, 3, …, 6
121

Table 1: Parameter estimates, robust standard errors, and goodness-of-fit statistics for the regression-discontinuity hazard model using instrumental variables estimation.
Predictor Parameter Estimate (n = 212)
D1 -1.873*** [.368]
D2 -.959** [.313]
D3 -1.576*** [.355]
D4 -1.625*** [.397]
D5 -2.758*** [.543]
D6 -2.736*** [.562]
EPA ˆ -1.462** [.506]
CPS -.247** [.090]
Goodness-of-fit -2LL 533.40 n parameters 8 AIC 551.40
* p < 0.05; ** p < 0.01; *** p < 0.001 Estimate of the treatment effect is highlighted.
The estimated survival probability for any semester is found by multiplying the estimated survival probability from the previous year by one minus the estimated risk of dropout for that semester (Singer & Willett, 2003):
( ) [ ])(ˆ1)(ˆ)(ˆ5 1 jjj thtStS −= −
Figure 2 gives the graphs of the fitted hazard and survival functions at the cutoff score. The fitted hazard function shows that the estimated hazard rate is significantly lower for students who participated in the developmental program versus equivalent students who did not participate in the developmental program. After the first year (or second semester) at the university, students who participated in the developmental program have an estimated risk of dropout of only 8.2%, while equivalent students who did not participate in the developmental program have an estimated risk of dropout of 27.7%. Similarly, after the second year (or fourth semester), students who participated in the developmental program have an estimated risk of dropout of 4.4% while equivalent students who did not participate in the developmental program have an estimated risk of dropout of 16.5%.
122

Figure 2: Fitted hazard and survival functions at the placement score cutoff using a regression-discontinuity hazard model with instrumental variables estimation for the sample of students who score within five points of the assignment cutoff score (n = 212).
0.1
.2.3
Fitte
d H
azar
d
1 2 3 4 5 6Semester
Non-Developmental Developmental
.4.6
.81
Fitte
d S
urvi
val
0 1 2 3 4 5 6Semester
Non-Developmental Developmental
The fitted survival function in Figure 2 illustrates that the estimated percentage of developmental students still enrolled at the university after the first year (or second semester) is 88.7% versus 62.7% for equivalent students who did not participate in the developmental program. Similarly, the estimated percentage of developmental students enrolled after the second year (or fourth semester) is 80.9% as compared to 43.4% of equivalent non-developmental students. In addition to determining the estimated risk of dropout, the estimated effect of participating in the developmental program at the centered cutoff score of 0, , can also be interpreted in terms of an odds ratio. The odds ratio is described as a ratio of the odds of dropping out of the university for the first time for equivalent developmental and non-developmental students in every time period during the course of six semesters. To compare the odds of risk of dropout for equivalent developmental and non-developmental students, the ratio of the estimated odds can be computed as follows:
462.11̂ −=β
123

( )( ) ( )1
6611
16611 ˆexpˆˆexp
ˆˆˆexp ratio odds Estimated β
ααβαα
=++
+++=
DDDD
K
K
Using this equation with an estimated effect of , gives an estimated odds ratio
of
462.11̂ −=β
( ) 2318.0)462.1exp(ˆexp 1 ≈−=β . The odds of dropping out of the university for the first time for students who participated in the developmental program are approximately 23.2% of the odds for equivalent non-developmental students who did not participate in the program. These odds can also be interpreted as students who do not participate in the developmental program are
approximately ( ) 3.4ˆexp1
1
=β
times more likely to drop out of the university during their first
three years when compared to equivalent students who do participate in the developmental program. Finally, Table 2 illustrates that the estimate of the treatment effect is robust to including students receiving the treatment at different times, and students receiving different amounts of treatment ( )523.1ˆ462.1 1 −≤≤− β . Table 2: Sample size, parameter estimates, robust standard errors, and confidence intervals for the estimates of the treatment effect addressing potential threats to validity.
Range of Discontinuity Sample
Baseline regression-discontinuity design
IVE with students removed who did not participate in the developmental program during their first semester model (3)
IVE with students removed who did not get the full treatment in the developmental program model (3)
5±
n = 212 -1.462** [.506] (-2.454, -.471)
n = 199 -1.471** [.507] (-2.464, -.477)
n = 192 -1.523** [.539] (-2.579, -.467)
• p < 0.05; ** p < 0.01
CONCLUSION
This study provides a framework that institutional researchers can use in assessing whether their developmental programs have a causal impact on student retention. The findings from this study suggest that researchers concerned with evaluating developmental education programs need to consider using an exogenous assignment variable to determine which students should be assigned to participate in a developmental program. By using such an assignment variable, and mandating that students adhere to their placement, makes the data amenable to using a regression-discontinuity design to obtain an unbiased estimate of the program effect.
124

The finding that participating in the developmental mathematics course has a positive impact on student retention suggests to policymakers that developmental education programs can be effective in helping to keep students enrolled in college. Developmental programs may be successful in helping to keep students retained by not only giving the students the opportunity to learn the mathematics they were supposedly taught in high school, but also by creating an atmosphere where students can begin to feel connected and integrated with the university. As Tinto (1996) notes, programs which “stress coping skills as well as the provision of information about the ways of negotiating the demands of college life” (pg. 3), and “change the quality of the academic experience for students” (pg. 1), can be invaluable in increasing student persistence.
REFERENCES Angrist, J. & Krueger, A. (1991). Does compulsory school attendance affect schooling and
earnings? Quarterly Journal of Economics, 106, 979-1014. Baxter, J. & Smith, S. (1998). Subsequent grades assessment of pedagogies in remedial
mathematics. Primus, 8(3), 276-288. Berk, R. & DeLeeuw, J. (1999). An evaluation of California's inmate classification system using
a generalized regression discontinuity design. Journal of the American Statistical Association, 94(448), 1045-1052.
Berk, R. & Rauma, D. (1983). Capitalizing on nonrandom assignment to treatments: A regression-discontinuity evaluation of a crime-control program. Journal of the American Statistical Association, 78(381), 21-27.
Black, S. (1999). Do better schools matter? Parental valuation of elementary education. Quarterly Journal of Economics, 114, 577-599.
Boylan, H., Bonham, B., & White, S. (1999). Developmental and remedial education in post secondary education. New Directions for Higher Education, 108, 87-101.
Brooks-Leonard, C. (1991). Demographic and academic factors associated with first-to-second-term retention in a two-year college. Community/Junior College, 15, 57-69.
Burley, H., Butner, B., & Cejda, B. (2001). Dropout and stopout patterns among developmental education students in Texas community colleges. Community College Journal of Research & Practice, 25, 767-782.
Feldman, M. (1993). Factors associated with one-year retention in a community college. Research in Higher Education, 34(4), 503-512.
Grimes, S. (1997). Underprepared community college students: Characteristics, persistence, and academic success. Community College Journal of Research & Practice, 21(1), 47-56.
Hector, J. & Hector, M. (1992). Impact of state-mandated developmental studies on college student retention. Paper presented at the Annual meeting of the American Educational Research Association, San Francisco, CA, ERIC ED 345 600.
Hoyt, J. (1999). Remedial education and student attrition. Community College Review, 27(2), 51-72.
125

Imbens, G. & vanDerKlaauw, W. (1995). Evaluating the cost of conscription in the Netherlands.
Journal of Business Economics and Statistics, 13, 207-215. Judd, C., & Kenny, D. (1981). Estimating the effects of social interventions. London, England:
Cambridge University Press. National Center for Educational Statistics. (2001). Remediation and degree completion: U.S.
Department of Education. Shadish, W., Cook, T., & Campbell, D. (2002). Experimental and quasi-experimental designs for
generalized causal inference. Boston, MA: Houghton Mifflin. Sinclair Community College. (1994). The impact of developmental education on student
progress: A three year longitudinal analysis. Dayton, OH: Office of Institutional Planning and Research, Sinclair Community College, ERIC ED 383 382.
Singer, J. & Willett, J. (2003). Applied longitudinal data analysis: Modeling change and event occurrence. New York, NY: Oxford University Press.
Thistlethwaite, D. & Campbell, D. (1960). Regression-discontinuity analysis: An alternative to the ex post facto experiment. Journal of Educational Psychology, 51, 309-317.
Tinto, V. (1996). Restructuring the first year of college. Planning for Higher Education, 25, 1-6. Trochim, W. (1984). Research design for program evaluation: The regression -discontinuity
approach. Newbury Park, CA: Sage. vanDerKlaauw, W. (2002). Estimating the effect of financial aid offers on college enrollment: A
regression-discontinuity approach. International Economic Review, 43(4), 1249-1287. Waycaster, P. (2001). Factors impacting success in community college developmental
mathematics courses and subsequent courses. Community College Journal of Research & Practice, 25, 403-416.
Wooldridge, J. (2003). Introductory econometrics: A modern approach (2nd ed.). Mason, Ohio: South-Western.
126

STUDENTS AND SENSITIVE ISSUES: DISCLOSING SEXUAL ORIENTATION AND
TRANSGENDERISM
Heather S. Roscoe Assistant Director
Dawn Geronimo Terkla Director
Office of Institutional Research & Evaluation Tufts University
In spring 2006, our Office of Institutional Research (OIR)1 was developing the Class of 2006 Senior Survey in collaboration with many individuals on campus. This year, the Lesbian Gay Bisexual Transgender (LGBT) Center Director suggested adding a transgender option within gender and adding a sexual orientation question. The rationale for adding these items was to be able to estimate the total LGBT population on campus based on the fact that the Senior Survey is administered to an entire class and tends to elicit a high response rate of approximately 85-92% each year. We agreed to include these items in the survey, but had concerns: 1) LGBT or questioning students might not respond honestly for fear of negative repercussions, and 2) other students might be offended by these questions. Some students react negatively when asked for race. They often select the “Other” option and write in such things as “human” and “none of your business.” Given students’ negative reactions to race questions, we were also concerned that sexual orientation and transgender questions might elicit stronger reactions. Although individual respondents are never identified and unit record data is safeguarded, we realize students may not be aware of or trust these procedures. Academia appears to be more tolerant and accepting of LGBT individuals than the general population, and our state is one of the leaders in acceptance of the LGBT population and LGBT rights (Baker, 2002), but it was not clear whether respondents would perceive these survey items as a threat and elect not to disclose.
Our research objective was three-fold: 1) to determine if/how other institutions were
collecting comparable data, 2) to ascertain how data is used and identify consequences that may have arisen, and 3) to become familiar with higher education LGBT issues and students’ willingness to divulge sexual orientation on a survey.
The data come from four sources: 1) a literature review of LGBT issues at higher
education institutions, 2) a survey of IR & LGBT professionals, 3) our experiences with the Class of 2006 Senior Survey administration, and 4) comparative transgender items from two anonymous surveys administered on campus within the past two years.
Estimating the size of the LGBT2 population in general, or specifically a college campus population, is complicated and the accuracy of these estimates is very difficult to determine. Alfred Kinsey is probably the most well known person to try to estimate the size of the LGBT
1 In September of 2006, the Tufts University Office of Institutional Research was renamed the Office of Institutional Research & Evaluation. All references to the office represent the name at the time of the event. 2 We were unable to locate literature speaking specifically to estimating the size of the transgender population. The early literature was estimating non-heterosexual sexual orientations.
127

population. He sampled only prisons and reform schools, which arguably biased his samples. In addition, his estimates were based on sexual behavior rather than self-identification. Nonetheless, his estimate was 10% (Kinsey, Pomeroy, & Martin, 1948; Kinsey, Pomeroy, Martin, & Gebhard, 1953). Other estimates of the general LGBT population tend to come from asking people to self identify, and these estimates are generally between 2% and 10%, but also fall prey to sample bias (Baker, 2002; Gates & Ost, 2004). Many higher education institutions have administered campus climate surveys, and the percentage of respondents who self-identified as non-heterosexual tends to fall between 3.5% and 8% (Reinisch, Hill, Sanders & Ziemba-Davis, 1995; Nelson & Baker, 1990; Newman & O’Leary-Kelly, 2003). However, a 2002 University of Minnesota study revealed that 41.5% of campus climate survey respondents reportedly did not disclose their sexual orientation on campus. Other research suggests students often will not disclose for anonymous surveys, so it is likely that any estimate under-represents the true population (Galt, 2003; Baker, 2002). LGBT individuals are constantly presented with the dilemma of whether to disclose their identity (Baker, 2002). History provides many examples of the dangers that disclosure poses, such as an increased likelihood to be the victim of violence, harassment, discrimination, or infringement on human/civil rights; being unable to serve in the U.S. Military; losing a job; being dismissed from college; not being accepted into college, graduate school, or residency programs; being excluded from involvement with the Boy Scouts, or until recently, being diagnosed as having a mental disorder (“Student’s suit for confidentiality breach,” 1987; Besner & Spungin, 1995; Baker, 2002; Morris & Rothblum, 1999; Oriel, Madlon-Kay, Govaker & Mersy, 1996; Morris & Rothblum, 1999; Brogan, Frank, Elon, Sivanesan, & O’Hanlan, 1999).
In recent years, the social stigma attached to homosexuality and transgenderism has seemed to lessen (Murphy, 1997). TV and the media have been instrumental in opening the public’s eyes to realize that gay people are not necessarily “twisted and deviant” (Baker, 2002, p. 99). Galt (2003) reported that between 1993 and 2001 the percentage of campus climate survey respondents who were LGBT and reported experiencing discrimination or harassment based on their sexual orientation decreased dramatically. Our institution is located in Massachusetts, which has been progressive and at the forefront of the movement towards acceptance, and is also the first and only state to allow same-sex marriage (Baker, 2002). Despite these recent developments in the mainstream acceptance of the LGBT population, it is understandable if individuals would not feel comfortable disclosing their sexual orientation.
Method
Survey of IR & LGBT Professionals A survey was designed and administered to elicit our colleagues’ experiences and advice.
It contained a mix of closed-ended, open-ended, and fill-in items, and was approved by the IRB3. Emails announcing the survey were released to both Institutional Research (electronic AIR newsletter, NEAIR & other regional AIR listservs, HEDS listserv) and the LGBT Center Directors Consortium listservs. Emails contained the survey URL, the purpose for the survey, how the results would be used, a promise of confidentiality, and contact information in case of technical difficulties or questions. 3 Survey available upon request.
128

Participants
It is impossible to calculate a response rate due to overlapping membership between the various IR groups and the difficulty of receiving verification that emails were sent on our behalf. In all, 175 valid responses were received. The respondents represent 39 of 50 states, 6 of 13 Canadian provinces, and a wide variety of institutional types. About 86% of respondents were in an IR-related field, while the remaining respondents were in an LGBT or diversity center-related field4. Class of 2006 Senior Survey The Class of 2006 Senior Survey is an online survey designed to be administered to all seniors who are eligible to graduate (N=1,404). Only those who are eligible to graduate are allowed access to the survey, and they are assured that their student ID is only being used for authentication purposes and that their responses are confidential.
This year, the Senior Survey included transgender as an option for the gender item, and also an item for sexual orientation that included the following as options: “Gay”, “Lesbian”, “Bisexual”, “Heterosexual”, “Queer”, “Unsure”, “Other, please specify” with a text box for the respondents to type in their responses, and “Prefer not to identify”. These items appear in the last section of the survey, “Background Information,” which contains all of the demographic items.
The data collected from surveys administered in our office goes through a recoding
process. One of the ways in which the data is recoded is by validating the “Other, please specify” responses. This involves two different steps. The first step involves reading through the responses written in the “Other, please specify” textbox. It is often the case that respondents will provide a written response in the “Other, please specify” textbox that is the same or very similar to an actual option that was provided. When this happens, their response will be recoded to reflect the response option they should have chosen. The second step is to ensure that if the respondent wrote in a valid response in the “Other, please specify” text box that they did not neglect to select “Other, please specify” as their responses, as oftentimes they forget to do so. In this way, someone who provides an “Other” response will now be counted as selecting “Other, please specify”. Typically, the number of responses that are recoded as a non-“Other” option or the numbers who write in a response but do not actually select “Other” is very small and the results are not highly impacted by this process. After these two steps have been completed, the data is considered ready for analysis.
The very last item on the Senior Survey is open-ended (“Please use the space below to
provide any additional comments about your Tufts experience”). If respondents felt the need to comment about the transgender or sexual orientation items, this would be their only opportunity after the actual items to do so. As such, the comments for this question were searched for references to the transgender and sexual orientation items.
4 It should be noted that only about 5% of U.S. schools have LGBT Centers, which may help account for the difference in response between Institutional Research professionals and LGBT or Diversity professionals.
129

Anonymous Surveys on Campus Including Transgender Option
Due to the fact that respondents to the Senior Survey must provide their student ID, we were afraid that the lack of anonymity despite the assurance of confidentiality might prevent some students from responding to items regarding transgenderism and sexual orientation honestly. Two surveys administered at Tufts in the past two years have included a transgender item and the responses to these surveys could validate the transgender results from the Senior Survey. While we were able to compare the impact of a survey being anonymous or confidential with regard to transgender identification, we were not able to make a similar comparison for sexual orientation.
The first anonymous survey to include a transgender item was the Alcohol & Drug Use
Survey. This web survey was administered in the fall of 2004 to the entire undergraduate student body (N=4,884). The purpose of the survey was to capture the prevalence of alcohol and drug use by students. Those completing the survey were eligible to win one iPod mini MP3 player and ten prizes of $25 gift certificates to the campus bookstore. Contact information to contact winners about prizes was collected in a separate web form so that contact information could not be connected to the survey data, thereby maintaining respondents’ anonymity.
The second anonymous survey to include a transgender item was the Latino Center
Survey. This web survey was administered in spring of 2006 to the entire Hispanic undergraduate population (N=300). Those completing the survey were eligible to win one of three $50 gift certificates to a nearby mall. Contact information to contact winners about prizes was collected in a separate web form so that contact information could not be connected to the survey data, thereby maintaining respondents’ anonymity.
Results
Survey of IR & LGBT Professionals
Results from the survey of colleagues revealed that about 8% of the responding institutions currently collect sexual orientation information. Those who currently collect this information were most likely to be in the Northeast (42.9%) or Southwest (21.4%), although the regions represented by those who collect were quite geographically diverse (See Figure 1).
Figure 1. Regions of those indicating their institution collects sexual orientation data.
42.9%
21.4%
7.1% 7.1% 7.1% 7.1% 7.1%
0%
10%
20%
30%
40%
50%
Northeast Southwest Mid-Atlantic Midwest Northwest Outside US Southeast
130
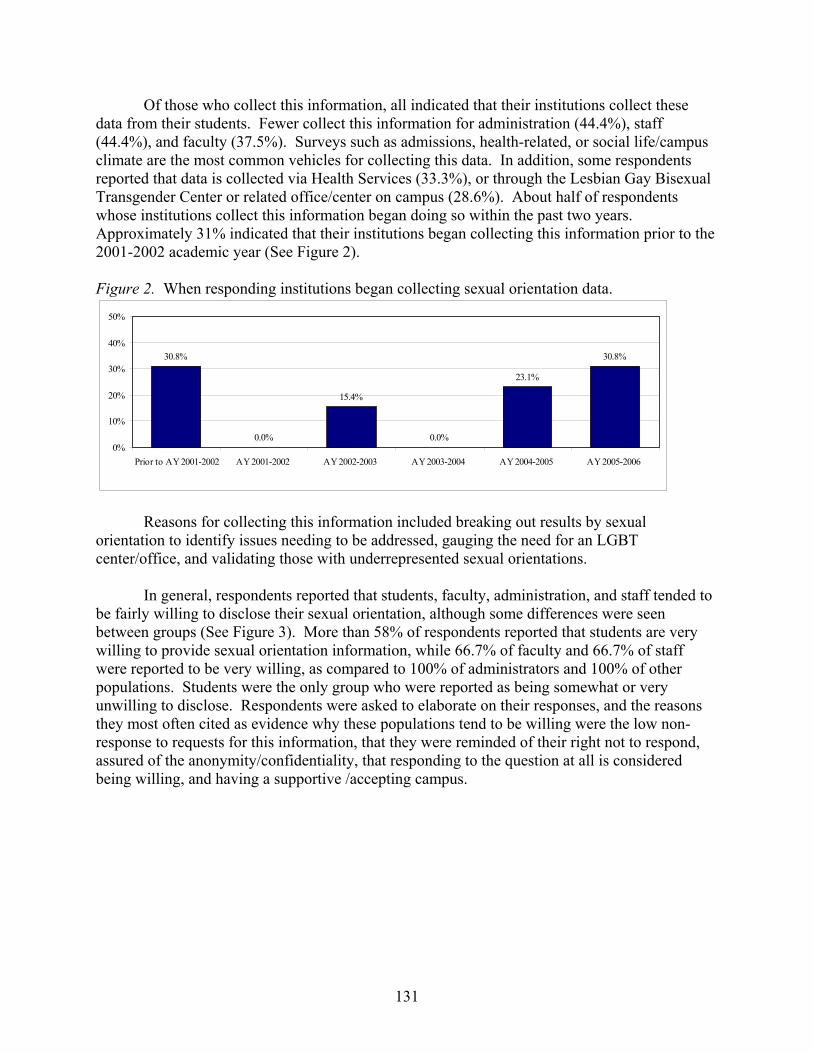
Of those who collect this information, all indicated that their institutions collect these
data from their students. Fewer collect this information for administration (44.4%), staff (44.4%), and faculty (37.5%). Surveys such as admissions, health-related, or social life/campus climate are the most common vehicles for collecting this data. In addition, some respondents reported that data is collected via Health Services (33.3%), or through the Lesbian Gay Bisexual Transgender Center or related office/center on campus (28.6%). About half of respondents whose institutions collect this information began doing so within the past two years. Approximately 31% indicated that their institutions began collecting this information prior to the 2001-2002 academic year (See Figure 2). Figure 2. When responding institutions began collecting sexual orientation data.
30.8%
0.0%
15.4%
0.0%
23.1%
30.8%
0%
10%
20%
30%
40%
50%
Prior to AY 2001-2002 AY 2001-2002 AY 2002-2003 AY 2003-2004 AY 2004-2005 AY 2005-2006
Reasons for collecting this information included breaking out results by sexual
orientation to identify issues needing to be addressed, gauging the need for an LGBT center/office, and validating those with underrepresented sexual orientations.
In general, respondents reported that students, faculty, administration, and staff tended to
be fairly willing to disclose their sexual orientation, although some differences were seen between groups (See Figure 3). More than 58% of respondents reported that students are very willing to provide sexual orientation information, while 66.7% of faculty and 66.7% of staff were reported to be very willing, as compared to 100% of administrators and 100% of other populations. Students were the only group who were reported as being somewhat or very unwilling to disclose. Respondents were asked to elaborate on their responses, and the reasons they most often cited as evidence why these populations tend to be willing were the low non-response to requests for this information, that they were reminded of their right not to respond, assured of the anonymity/confidentiality, that responding to the question at all is considered being willing, and having a supportive /accepting campus.
131

Figure 3. Willingness to provide sexual orientation information by population.
100.0%
66.7% 33.3%
100.0%
66.7% 33.3%
58.3% 25.0% 8.3% 8.3%
0% 10% 20% 30% 40% 50% 60% 70% 80% 90% 100%
Other populations
Staff
Administrators
Faculty
Students
Very willing Somewhat willing Somewhat unwilling Very unwilling
The majority of respondents reported that most individuals did not express much concern
with the institution having access to this information, but of all groups, students tended to be the most concerned (See Figure 4). Concerns often centered on issues of confidentiality/anonymity and how a breach of confidentiality/anonymity could impact them negatively, while one respondent reported that students felt that the university was “wasting resources” on collecting this information.
Figure 4. Percentage of respondents reporting groups expressing concern when asked for sexual orientation information.
40.0%
0.0%
22.2%
11.1%
0.0%0%
10%
20%
30%
40%
50%
Students Faculty Administrators Staff Other
Respondents were asked to provide a list of the categories they use when asking for
sexual orientation information. Eleven respondents shared their categories. It is interesting to note that some institutions reported using a number of specific categories (ex. Gay, Lesbian, Bisexual, Unsure), while others preferred to combine LGBT-type sexual orientations into one or just a few categories (ex. Gay/Lesbian, Gay/Lesbian/Bisexual/Transgender/Transsexual, Intersex, Queer) (See Table 1).
132

Table 1 Categories respondents use when collecting sexual orientation information
N Heterosexual/straight 10 Bisexual 8 Unsure and/or Questioning 7 Gay/Lesbian 6 Gay 4 Lesbian 3 Other/Other, please specify: 3 Gay/Lesbian/Bisexual/Transgender/Transsexual, Intersex, Queer (GLBTTIQ) 1 Prefer not to respond 1
Some of the challenges institutions faced when collecting this information were conflicts
due to religious affiliation, uneasiness with the categories used and their definitions, inability to determine if results are representative of the population, negative reactions by respondents or survey administrators, and inability to access collected data.
Institutions most often use this data to breakout survey results, develop diversity training,
and learn about the LGBT population. Some institutions indicated that they did not use the data. About 15% of institutions who collect sexual orientation information do so in a way that could possibly identify the respondent (name, student ID, Social Security Number). This identifying information is generally used to merge in other data such as demographic and academic information.
Survey respondents whose institutions did not collect sexual orientation information were
asked about the possibility of future collection. About 4% of these respondents indicated that their institutions are considering or planning on collecting this information in order to better understand and serve the LGBT population.
All respondents, regardless of whether their institutions collect sexual orientation
information, were asked for their opinions regarding the collection of this information, and if they foresaw any problems. The most popular themes running through the comments were a concern that students would not respond honestly for fear of their privacy being violated (N=52), the great potential for this information to be used incorrectly, not kept secure, or not kept confidential (N=37), or not being sure how the information would be used if it were collected on their campus (N=30) (See Table 2).
All respondents, regardless of whether their institutions collect sexual orientation information, were given the opportunity to provide any additional comments. Many of these comments expressed an interest in this topic and the results; that this research will be helpful to others; and wishes of good luck for us. However, some comments expressed that sexual orientation is such a sensitive issue that institutions should not be asking students or other institutional populations to identify themselves, that housing regulations need to be updated/reviewed in response to those whose sexual orientation is not heterosexual, legal issues of asking for sexual orientation disclosure, and being concerned about adding transgender and the effects of doing so on IPEDS and other types of reporting.
133

Table 2 Respondents’ thoughts, concerns, and problems foreseen about collecting sexual orientation information
N I'm concerned that if we asked, students wouldn't respond honestly/students concerned about privacy 52 Great potential of this info being used incorrectly, not being secure, or not being kept confidential 37 I'm not sure how it would be used/hasn't been raised as a question 30 I think it is important for an institution to know 23 The amount of missing data/non-response poses a problem and calls into question the representativeness of the data 18 There is no reason to collect/ not legally required to do so/liability issues 14 I think this information is too personal for us to ask 13 I'm unsure what categories to use if we start asking/ hard to agree on categories and definitions 12 I'm concerned about offending/ marginalizing people by asking 11 Sexual orientation can be fluid - what if a student changes their identity over time, what should be done? Will you allow for changes in your system? 10 Concerns about how to code transgender for IPEDS or other reporting/current data structures can't accommodate 8 Students would be reluctant to have this info in their student record 7 Because we are religiously affiliated, this would be problematic & we'll be slow to start collecting/Administration Opposed 4 May impact recruiting negatively 3 I'm afraid that merely asking would instill fear in a questioning or closeted students 2 Knowing when to ask students for this info (application, survey later, etc.) 2 We cannot collect this info right now because all survey forms currently ask for student ID as identifier. Once we can find a way around the student ID on the forms or if Federally mandated, we might collect. 2 Collecting this data may backfire - if it is found there are not as many students as you thought, administration might push to cut services 1 Concerned about lack of comparable data between institutions and longitudinally 1 Housing issues 1 Ignorance on our part may hinder us from collecting and interpreting this data properly 1
Class of 2006 Senior Survey
The Class of 2006 Senior Survey collected 1,194 responses, for a response rate of 85.0%, which is consistent with the historic response rate for this survey. Our concerns about seniors reacting negatively to being asked to provide their sexual orientation and/or whether they are transgender proved to be unfounded. No phone calls or emails from students were received expressing concern about how the data would be used, how secure the data was, or why this was included on the survey. Fifty-four respondents (4.5%) did not provide a response to the sexual orientation item, while 29 respondents (2.4%) did not provide a response to the gender/transgender item. As a result, these items suffered from approximately the same non-response as non-sensitive items in the same section of the survey, and even less non-response than the race/ethnicity items (9.7%).
None of the respondents indicated that they are transgender. Nine respondents wrote a
response in the “Other, please specify” text box for the sexual orientation item. The responses they provided and how we dealt with their responses is shown in Table 3.
134

Table 3 “Other” responses provided and the recoding decision made
Other text response How we decided to deal with their response daniellesexual This male selected "heterosexual" but then wrote this in. So, we just got rid of this text.
Human This person selected "other", so we had nothing to go on but to code this person as "prefer not to identify"
I only sleep with animals
This male selected "heterosexual" but then wrote this in. So, we just got rid of this text as we figured this person was probably just saying this to be difficult.
Normal This person selected "other", so we had nothing to go on but to code this person as "prefer not to identify"
straight We are not sure why they didn't select "heterosexual", so we recoded them as "heterosexual"
Straight We are not sure why they didn't select "heterosexual", so we recoded them as "heterosexual"
This is a ridiculous question
This person selected "other", so we had nothing to go on but to code this person as "prefer not to identify"
this is what I can't stand about Tufts- it does not matter!
This person selected "other", so we had nothing to go on but to code this person as "prefer not to identify"
Unsure We are not sure why they did not select "unsure", so we recoded them as "unsure" After the data had been recoded, it was found that only 3.9% of seniors selected “prefer
not to identify.” A total of 4.6% identified themselves as something other than heterosexual (See Figure 5), and this result falls well within the range of estimates of the general population and those at other institutions.
Anonymous Surveys on Campus Including Transgender Option The Latino Center Survey received 87 responses, for a response rate of 29.0%, and none of the respondents indicated that they were transgender. The Alcohol & Drug Use Survey received 1,921 responses, for a response rate of 39.3%. Two respondents (0.1% of the total respondents) indicated that they were transgender. None of the respondents to the Class of 2006 Senior Survey indicated that they were transgender, which is reasonably consistent with the results of these two surveys. Figure 5. Class of 2006 Senior Survey recoded responses to the sexual orientation item.
91.5%
3.9% 1.7% 1.5% 0.6% 0.4% 0.4% 0.0%0%
25%
50%
75%
100%
Heterosexual Prefer not toidentify
Gay Bisexual Queer Lesbian Unsure Other
135

Discussion
Although collecting sexual orientation on the Class of 2006 Senior Survey did not tend to
elicit negative reactions, we are glad our concerns led us to explore the issues and seek colleagues’ advice. Overall, it seems that most institutions collecting this information have not experienced strong negative reactions. This may be due to institutions being careful to specify that the information was for statistical purposes only, that individuals would not be identified, reminding respondents that they had the right not to respond to the question, and an open and accepting atmosphere on their campus.
However, our survey of IR and LGBT professionals confirmed that collecting this
information is not always possible or without incident. Many institutions, regardless of type, struggled with which categories to use, uneasiness with using the data due to the fact that it might not be representative of the true LGBT population, and gaining access to the data once it had been collected. IR & LGBT professionals also expressed concern about how collecting this information might impact IPEDS or other types of reporting where the categories for gender are strictly “Male” or “Female,” and that housing procedures and regulations are due for updating/review especially with respect to students who identify themselves as something other than heterosexual.
We enjoyed learning about the experiences of other institutions in similar endeavors, and
found some of the literature to be helpful in preparing to collect this information for the first time. We feel that although we know this data will never be perfectly representative of the true LGBT population, the data we do have can be used to inform the improvement of services offered to those in the LGBT population on our campus. We hope that the information we presented here will be informative and helpful to others who might be asked to undertake this sort of data collection in the future.
References
Baker, J. M. (2002). How homophobia hurts children: Nurturing diversity at home, at school,
and in the community. New York, NY: Harrington Park Press. Besner, H. F., & Spungin, C. I. (1995). Gay and lesbian students: Understanding their needs.
Washington, D.C.: Taylor & Francis. Brogan, D. J., Frank, E., Elon, L., Sivanesan, S. P., & O’Hanlan, K. A. (1999). Harassment of
lesbians as medical students and physicians. Journal of the American Medical Association, 282(13), 1290-1292.
Galt, B. D. (2003). Report on campus climate for GLBT people at the University of Minnesota -
Twin Cities. Retrieved June 28, 2006, from the University of Minnesota – Twin Cities GLBT Office Web Site: http://www1.umn.edu/glbt/StandWithUs/pdfs/TCCampusClimateReport.pdf
136

Gates, G. J., & Ost, J. (2004). The gay and lesbian atlas. Washington, D.C: Urban Institute
Press. Kinsey, A. C., Pomeroy, W. B., & Martin, C. E. (1948). Sexual behavior in the human male.
Philadelphia, PA: W. B. Saunders Company. Kinsey, A. C., Pomeroy, W. B., Martin, C. E., & Gebhard, P. H. (1953). Sexual behavior in the
human female. Philadelphia, PA: W. B. Saunders Company. Morris, J. F., & Rothblum, E. D. (1999). Who fills out a “lesbian” questionnaire?: The
interrelationship of sexual orientation, years “out”, disclosure of sexual orientation, sexual experience with women, and participation in the lesbian community. Psychology of Women Quarterly, 23, 537-557.
Murphy, T. F. (1997). Gay science: The ethics of sexual orientation research. New York, NY:
Columbia University Press. Nelson, R. & Baker, H. (1990, May). The educational climate for gay, lesbian, and bisexual students. Paper presented at the annual conference of the Association for Institutional
Research, Louisville, KY. Newman, J. L. & O’Leary-Kelly, A. M. (2003). Diversity and student experiences: A survey of
the University of Arkansas Campus. Retrieved June 28, 2006 from the University of Arkansas Diversity Task Force Web Site: http://advancement.uark.edu/diversity/diversity_downloads/student.pdf
Oriel, K. A., Madlon-Kay, D. J., Govaker, D., & Mersy, D. J. (1996). Gay and lesbian physicians in training: Family practice program directors’ attitudes and students’ perceptions of bias.
Family Medicine, 28(10), 720-725. Reinisch, J. M., Hill, C. A., Sanders, S. A., & Ziemba-Davis, M. (1995). High-risk sexual behavior at a Midwestern university: A confirmatory survey. Family Planning Perspectives,
27(2), 79-82. Riggle, E. D. B., Rostosky, S. S., & Reedy, C. S. (2005). Online surveys for BGLT research:
Issues and techniques. Journal of Homosexuality, 49(2), 1-21. Student’s suit for confidentiality breach. (1987, May-June). Mental and physical disability law
reporter, 195.
137
THE GRASS IS ALWAYS GREENER: ANALYZING STABILITY AND CHANGE
OVER-TIME IN U.S. NEWS’ PEER ASSESSMENT SURVEY SCORES
Kyle V. Sweitzer Graduate Research Assistant
J. Fredericks Volkwein Professor of Higher Education and Senior Scientist
Center for the Study of Higher Education Pennsylvania State University
Introduction and Objective
Many colleges and universities strive to improve their academic reputations. Some try to do so by becoming more selective in admissions. Some institutions try to recruit more esteemed faculty. Others upgrade their mission, degree offerings, and Carnegie classification. In today’s competitive academic market, academic reputation serves as a key institutional characteristic among many stakeholders. However, many institutions have found that improving academic reputation is no easy task. Using the annual U.S. News and World Report (USNWR) peer assessment ratings, this study examines the relative stability and change over time in the academic reputation of colleges and universities, focusing especially on those with changes in mission and highest degree offering.
Summary of the Literature
Several authors have analyzed the prestige and reputation of colleges and universities and discussed the impact that rankings and ratings have on institutions and their constituents. Some studies note the importance of reputational ratings on a student’s college choice (Sax, Astin, Korn, & Mahoney, 1995; McDonough, Antonio, Walpole, Perez, 1998). Ratings have been shown to influence institutional admissions and financial aid policies (Stecklow, 1995; Avery, Fairbanks, & Zeckhauser, 2003). Ehrenberg (2003) and Volkwein and Grunig (2005) make the case that ratings encourage schools to spend more, not less. Many schools even spend money on costly publicity materials to encourage higher ratings from their peer institutions (Hansen, 1998; Ehrenberg, 2003). Nevertheless, the payback from pursuing prestige may offset the costs. Monks and Ehrenberg (1999) found that a one-year improvement in rank in USNWR results in increased applications, a lower acceptance rate, greater yield, and higher SAT scores. Increased prestige may also result in flexibility in admissions, reduced teaching loads, and increased donations and appropriations (Brewer, Gates, & Goldman, 2002). While it may be debated as to how to measure institutional prestige, or whether prestige should even be measured, the prestige measure that has received the most attention in the past two decades or more has been the USNWR peer assessment rating. This subjective measure has accounted for as much as 100 percent of an institution’s overall rank in USNWR, and in recent years has accounted for 25 percent of a school’s ranking. This is still the variable weighted the heaviest in determining the rank. Due to the importance and influence of the USNWR peer assessment ratings, many administrators have good reason to care about them, and about the factors that influence them.
138
In addition to administrators, researchers also are interested in knowing what characteristics most influence institutional prestige and reputation. Some studies have analyzed the variables that correlate with reputation ratings. Several studies have found that two “inputs” – institutional size and admissions selectivity – are the best predictors of institutional prestige at the undergraduate level (Astin & Lee, 1972; Astin & Solmon, 1981; Volkwein, 1989; Schmitz, 1993; Grunig, 1997; Porter & Toutkoushian, 2002). A recent study by Volkwein and Sweitzer (2006) found that prestige in research universities relates to a somewhat different set of variables than prestige in liberal arts colleges. SAT scores and faculty salaries related to prestige in both types of institutions. However, enrollment size, expenditures per student, and graduation rates were more related to prestige among research universities, while institutional age, governance, and publications per faculty were more related to prestige in liberal arts colleges. Nearly all of these studies are cross-sectional, analyzing one year of ratings and predictors. Few studies analyze changes over time. A notable exception is Grewal, Dearden, and Lilien (2006), but this study only examines changes in the Top 50 “National Universities” category in USNWR. The Grewal study identifies the “stickiness” of the rankings, noting that the same 47 institutions have been in the Top 50 of the “National Universities” category over the past eight years. Some researchers have alluded to the notion that changes in reputation are slow in higher education, negating the need for yearly rankings (Volkwein & Grunig, 2005). Using USNWR data, this study aims to fill a gap in the literature by examining the stability over time in the academic reputation of institutions.
Population and Data Sources A total of 1,340 institutions have been ranked in USNWR’s America’s Best Colleges for at least three of the eight most recent editions (1999 to 2006). Almost all of these institutions have been ranked over the most recent five-year period, while the majority (1,098) has been ranked all eight years. These 1,340 institutions constitute the study’s population, and it is these eight editions (1999-2006) of USNWR that provide the data sources, since it is the magazine’s peer assessment rating that is the variable under consideration. USNWR places institutions into one of several categories for ranking purposes. Throughout the eight-year period, USNWR has had four broad categories. The USNWR categories are roughly aligned with the classifications used by the Carnegie Foundation for the Advancement of Teaching over the eight-year period. The more recent USNWR editions use the categories of “National Universities,” “Liberal Arts Colleges,” “Universities-Master’s,” and “Comprehensive Colleges-Bachelor’s.” Furthermore, the “Universities-Master’s” category and the “Comprehensive Colleges-Bachelor’s” category are each subdivided into four geographic regions – North, South, Midwest, and West. An institution’s academic reputation is the variable of interest in this study, and the specific reputation rating employed is the peer assessment score for each institution that USNWR reported in its 1999 through 2006 editions of America’s Best Colleges. The 1999 edition was chosen as the starting point because prior to 1999 the magazine employed a different scale in its peer reputational assessment survey. USNWR mails a survey to three individuals (president, provost, and admissions director) at each institution that is ranked. The survey consists of a list of “peer institutions,” and the respondents are asked to “rate the academic quality of undergraduate programs” at each school on the list (Wildavsky, 2005). Peer
139

institutions are those that are in the same USNWR category and/or geographic region, as described above. The scale employed in the survey ranges from 1 (marginal) to 5 (distinguished), and respondents can respond “Don’t Know” for institutions with which they are unfamiliar. The institutions within each category have remained fairly stable throughout the eight-year period, which is important if change over time is to be studied. Such stability helps to ensure some degree of consistency throughout the period studied in terms of a given institution having the same group of peer institutions. Likewise, there is some degree of consistency in terms of the respondents who are rating any given institution—if not in the individuals themselves, then at least in terms of the positions within the institution. For example, even if a given institution has had two different individuals serve as the admissions director during the period studied, what is constant is that the admissions director for that institution is rating the same institutional peers each year.
Statistical Analysis This study employs a hierarchical linear modeling (multilevel modeling) technique only for the purpose of calculating an intraclass correlation (ICC), which is done by running a null model (no predictor variables). The ICC is a measure of the proportion of variation in a variable between groups versus the proportion within groups (Raudenbush & Bryk, 2002). In this study, the intraclass correlation is the proportion of variation in peer assessment scores over time accounted for by differences between institutions versus the proportion of variation in scores accounted for by differences over time for a given institution. Beyond the calculation of the ICC, no other statistical techniques are employed in this study. The study is more descriptive in nature, highlighting trends over time in reputational ratings.
Results Two statistics were calculated as a measure of change in institutions’ peer assessment ratings. The first is the intraclass correlation, which equals 97.4 percent. Such a large ICC means that virtually all of the differences in peer assessment ratings from 1999 to 2006 are a result of how institutions are rated in the initial year of the study, as opposed to institutions’ ratings changing over time. This ICC verifies the notion that the academic reputations of colleges and universities do not change much. Another measure of the overall change in individual institutions’ peer assessment scores is the difference between the lowest and highest peer assessment score over the eight-year period for each institution in the population. Across all 1,340 four-year institutions rated by USNWR, the mean difference between the lowest and highest score in the peer assessment rating is 0.22. The standard deviation of the difference is 0.12. A difference of 0.4 between an institution’s lowest to highest peer assessment rating is required for a school to be at least one standard deviation above the mean difference of 0.22 for all schools. Of the 1,340 four-year institutions in the study, only 13 percent (178) have a difference of at least this magnitude. Some of these 178 schools have seen their peer assessment
140

scores generally rise, some have had peer scores generally decrease, while others have seen their peer assessment scores fluctuate. The number of schools that have enjoyed significant increases in reputation versus those that have experienced significant decreases is remarkably similar. In fact, of these 178 institutions, 50 have had peer ratings generally increase over the eight years, 51 have had generally decreasing peer scores, and 77 have had significant fluctuations in reputation with no substantial up or down overall trend. The reputational ratings of some institutions have not changed much between 1999 and 2006, if at all. There are 425 institutions of the 1,340 total that have either not changed at all in their peer assessment scores over the eight-year period or have had a difference of only 0.1 between their lowest and highest peer score. Thus, almost one-third (32 percent) of all four-year institutions in the United States have essentially remained unchanged in their academic reputations as assessed by presidents, provosts, and admissions deans. This is despite the fact that many institutions produce and distribute costly publicity material to promote their campuses in an effort to improve their visibility and prestige. Of these 425 institutions that have had little or no change in reputation, 173 are in the National Universities category, and 98 are in the Liberal Arts Colleges category. Thus, almost two-thirds (64 percent) of the institutions that have had a very stable academic reputation in the USNWR peer survey are in one of these two USNWR categories. Having a very stable academic reputation over time is especially true for those institutions that have not switched in Carnegie classification and have remained in the same USNWR category during the eight-year period covered by the study. Evidence of such stability in academic reputation is provided in Table 1, which displays the ratings over time just for those institutions remaining in the same USNWR category all eight years (the bulk of the institutions in the study). The average peer assessment rating across all 1098 such institutions ranges from a low of 2.85 in 1999 to a high of 2.90 in 2002. Rounded to the nearest tenth of a decimal (the degree of specificity reported by USNWR), the low score and high score remains unchanged at 2.9 over the eight-year period. Table 1. Average USNWR Peer Assessment Rating Over Time for Institutions Remaining in Same USNWR
Category All 8 Years USNWR Category 1999 2000 2001 2002 2003 2004 2005 2006 National Universities (n=224) 3.07 3.08 3.07 3.10 3.10 3.09 3.09 3.06 Liberal Arts Colleges (n=150) 3.09 3.09 3.06 3.15 3.14 3.13 3.11 3.11 Univ-Master’s (North) (n=134) 2.69 2.71 2.69 2.73 2.73 2.69 2.76 2.76 Univ-Master’s (South) (n=110) 2.77 2.83 2.88 2.86 2.82 2.83 2.82 2.83 Univ-Master’s (Midwest) (n=114) 2.75 2.78 2.80 2.80 2.78 2.76 2.72 2.72 Univ-Master’s (West) (n=102) 2.80 2.83 2.75 2.85 2.81 2.87 2.88 2.84 Comp Coll’s-Bach (North) (n=55) 2.62 2.61 2.67 2.74 2.64 2.69 2.75 2.69 Comp Coll’s-Bach (South) (n=86) 2.81 2.76 2.73 2.79 2.72 2.74 2.66 2.66 Comp Coll’s-Bach (Midwest) (n=93) 2.67 2.72 2.70 2.65 2.64 2.64 2.64 2.61 Comp Coll’s-Bach (West) (n=30) 2.79 2.79 2.82 2.89 2.82 3.02 2.99 2.92 Avg of all such institutions (n=1098) 2.85 2.87 2.86 2.90 2.87 2.88 2.88 2.86 While the majority of institutions have not switched USNWR category, some institutions have moved as a result of changes in their Carnegie classification (due to altering their missions
141

or degree offerings). Such changes in USNWR category have a significant impact on the academic reputation rating an institution receives. Table 2 shows the average rating over time for schools that moved upward in Carnegie classification, resulting in an upward move in USNWR category. The category switch occurred with the 2002 USNWR edition. Take note of the old and the new USNWR category names. These institutions exhibit upward “mission creep” from regional bachelor’s and master’s degree-granting institutions to regional master’s and national universities and liberal arts colleges. For these institutions, making the switch to a different USNWR category results in lower peer assessment ratings. The lower half of Table 2 shows the average rating for these institutions before and after the switch occurred, as well as the average decrease. Table 2. Average USNWR Peer Assessment Rating Over Time for Institutions Moving Upward in Carnegie Classification and in USNWR Category. Switch Occurred in 2002. USNWR Categories 1999 2000 2001 2002 2003 2004 2005 2006 Univ-Master’s to Nat’l Univ (n=21) 2.78 2.84 2.86 2.20 2.20 2.20 2.19 2.14 Comp Coll’s Bach to Liberal Arts (n-53) 2.94 2.93 2.90 2.03 2.06 2.03 2.03 2.03 Comp Coll’s Bach to Univ-Master’s (n=81) 2.86 2.87 2.87 2.54 2.52 2.51 2.53 2.49 Avg of all such institutions (n=155) 2.87 2.88 2.88 2.32 2.32 2.30 2.31 2.29 Avg Peer Rating Avg Peer Rating USNWR Categories Before Switch After Switch Change Univ-Master’s to Nat’l Univ (n=21) 2.83 2.19 - 0.64 Comp Coll’s Bach to Liberal Arts (n=53) 2.92 2.04 - 0.88 Comp Coll’s Bach to Univ-Master’s (n=81) 2.87 2.52 - 0.35 Avg of all such institutions (n=155) 2.88 2.31 - 0.57 Conversely, Table 3 shows the average rating over time for schools that experienced the opposite effect from moving between Carnegie and USNWR categories. Again, take note of the old and the new category names. These institutions exhibit downward “mission creep” from regional master’s and national universities, and liberal arts colleges to regional bachelor’s and master’s degree granting schools. These institutions, on average, received higher peer assessment ratings once they moved categories. The lower half of Table 3 shows the average rating for these institutions before and after the move occurred, as well as the average increase. Table 3. Average USNWR Peer Assessment Rating Over Time for Institutions Moving Downward in Carnegie Classification and in USNWR Category. Switch Occurred in 2002. USNWR Categories 1999 2000 2001 2002 2003 2004 2005 2006 Liberal Arts to Univ-Master’s (n=2) 2.40 2.40 2.30 3.10 3.20 3.20 3.20 3.20 Nat’l Univ to Univ-Master’s (n=1) 2.10 2.10 2.10 3.00 3.00 3.00 3.00 2.80 Univ-Master’s to Comp Coll’s Bach (n=8) 2.80 2.81 2.83 3.14 3.19 3.30 3.18 3.20 Liberal Arts to Comp Coll’s Bach (n=6) 2.25 2.18 2.22 3.27 3.22 3.23 3.22 3.15 Avg of all such institutions (n=17) 2.52 2.50 2.51 3.17 3.19 3.25 3.18 3.16 Avg Peer Rating Avg Peer Rating USNWR Categories Before Switch After Switch Change Liberal Arts to Univ-Master’s (n=2) 2.37 3.18 + 0.79 Nat’l Univ to Univ-Master’s (n=1) 2.10 2.96 + 0.86 Univ-Master’s to Comp Coll’s Bach (n=8) 2.81 3.20 + 0.39 Liberal Arts to Comp Coll’s Bach (n=6) 2.22 3.22 + 1.00 Avg of all such institutions (n=17) 2.51 3.19 + 0.68
142

Tables 2 and 3 collectively suggest that administrators from institutions in one USNWR
category rate a given institution differently than those from another USNWR category. Those schools with upward mission creep are rated more severely by their new peers, while those with downward mission creep are rated more favorably by their new peer group.
Conclusions and Implications This study examines the USNWR peer assessment ratings from 1999 to 2006 and finds remarkable stability in this indicator of institutional prestige. Only 13 percent of all four-year institutions that were rated by USNWR saw significant change (positive, negative, or fluctuating) in their peer assessment ratings over the past eight years. Such a small percentage of institutions changing significantly in academic reputation verify the notion that change does not happen quickly in higher education, and an institution’s academic reputation tends to be very stable over time. About 55 percent of the 1,340 institutions saw only modest changes (either 0.2 or 0.3 between their lowest to highest peer assessment rating), but almost one-third (32 percent) have seen essentially no change in academic reputation (0.1 or no change). Indeed, it appears to be rather difficult for institutions to alter their academic reputation, either positively or negatively. This is especially true for research universities and liberal arts colleges, and it is true despite the fact that many institutions produce costly publicity materials to promote their campuses. Introduced by Riesman in 1956, the concept of the academic procession in higher education is perhaps more true today than ever before. There are leading institutions that are followed and widely copied by those striving to reach the upper-echelon. These strivers, in turn, are pursued by those further back in the procession. Campus leaders and trustees push to advance their institutions to the next level. Institutional decline and closure is so rare that it is treated as near scandal. Strategic planning and benchmarking by colleges and universities almost always includes comparison to both current peers and “aspirational” peers. Furthermore, such competitiveness often drives institutions to add degree programs, and expand the institution’s mission, in order to acquire more resources and prestige. However, the results of this study suggest the need for caution when striving to upgrade institutional mission and degree programs. There are unintended consequences of doing so. Almost all of the institutions that changed their Carnegie classification upward were rated significantly lower by their new set of peer institutions. Conversely, those exhibiting downward mission creeps received higher ratings by their new peers. This study suggests that there may, indeed, be value in maintaining a focused and stable institutional mission as a means of reputation building. Contrary to popular belief, aspirations to move forward in Carnegie category may lower an institution’s published prestige rating. In higher education, contrary to other industries, standing still does not necessarily equate to moving backward.
143

References
Astin, A.W. & Lee, C.B.T. (1972). The invisible colleges. New York: McGraw-Hill. Astin, A.W. & Solmon, L. C. (1981). Are reputational ratings needed to measure quality?
Change, 13 (2): 14-19. Avery, C., Fairbanks, A., & Zeckhauser, R. (2003). The early admissions game: Joining the elite.
Cambridge, MA: Harvard University Press. Brewer, D. J., Gates, S. M., & Goldman, C. A. (2002). In pursuit of prestige: Strategy and
competition in U.S. higher education. New Brunswick, NJ: Transaction Publishers. Ehrenberg, R. G. (2003). Reaching for the brass ring: The U.S. News & World Report rankings
competition. The Review of Higher Education, 26 (2): 145-62. Grewal, R., Dearden, J. A., & Lilien, G. L. (2006). The university rankings game: Modeling the
competition among universities for ranking. Unpublished study conducted in the Smeal College of Business, Pennsylvania State University, University Park, PA.
Grunig, S. D. (1997). Research, reputation, and resources: The effect of research activity on perceptions of undergraduate education and institutional resource acquisition. Journal of Higher Education, 68 (1): 17-52.
Hansen, C. L. (1998). Brochures, I get brochures. Change, 30(4): 17. McDonough, P. M, Antonio, A. L., Walpole, M. B., & Perez, L. (1998). College rankings:
Democratized college knowledge for whom? Research in Higher Education, 39: 513-537. Monks, J. & Ehrenberg, R. G. (1999). U. S. News & World Report’s college rankings: Why they
do matter. Change, 31 (6): 42-51. Porter, S. R. & Toutkoushian, R. K. (2002). Institutional research productivity and the
connection to average student quality and overall reputation. Paper presented at the 2002 annual meetings of the Western Economic Association, Seattle, WA.
Raudenbush, S. W. & Bryk, A. S. (2002). Hierarchical linear models: Applications and data analysis methods, 2nd ed. Thousand Oaks, CA: Sage Publications.
Riesman, D. (1956). Constraint and variety in American education. Garden City, NY: Doubleday.
Sax, L. J., Astin, A. W., Korn, W. S., & Mahoney, K. M. (1995). The American freshman: National norms for fall 1995. Los Angeles: Higher Education Research Institute, UCLA.
Schmitz, C.C. (1993). Assessing the validity of higher education indicators. Journal of Higher Education, 64 (5): 503-521.
Stecklow, S. (1995). Colleges inflate SAT and graduation rates in popular guidebooks. Wall Street Journal, Apr. 5, 1995, pp A1, A4, A8.
Volkwein, J. F. (1989). Changes in quality among public universities. Journal of Higher Education, 60 (2): 136-151.
144

Volkwein, J. F. & Grunig, S. D. (2005). Reputation ratings in higher education: Double, double, toil and trouble. In Joseph Burke (Ed.), Achieving Accountability in Higher Education: Balancing Public, Academic, and Market Demands, Chapter 11, pp. 246-274. San Francisco: Jossey-Bass.
Volkwein, J. F. & Sweitzer, K. V. (2006). Institutional prestige and reputation among research universities and liberal arts colleges. Research in Higher Education, 47(2): 129-148.
Wildavsky, B. (Ed.). (2005). America’s best colleges, 2006 ed. Washington, DC: U.S. News and World Report.
145

MDs AND PhDs, EdDs AND MBAs: COMPARING GRADUATE PROGRAM
PRESTIGE RATINGS ACROSS PROFESSIONAL SCHOOLS
Kyle Sweitzer Graduate Research Assistant
Pennsylvania State University
Introduction and Purpose of the Study Prestige in higher education is a difficult construct to measure. Despite the abstract nature of the prestige construct, there has been no shortage of ratings and rankings that attempt to measure prestige and most of them are criticized for methodological flaws. Despite the negative publicity that rankings and ratings of both undergraduate and graduate programs have received, the rankings are, in fact, important to colleges and universities. For example, many institutions highlight their current place in the U.S. News and World Report undergraduate rankings. Likewise, many graduate programs in a variety of disciplines highlight their current ranking on their website. In addition, an increasing number of graduate programs highlight their ranking on publicity material distributed within disciplinary circles. There have been numerous studies that examine prestige among colleges and universities. A number of studies have examined prestige at the undergraduate level, while several others have examined prestige in graduate education. Many of these studies have used prestige rankings, or reputational ratings, as a measure of prestige. Several of these studies on reputational ratings at the graduate level have examined both versions of the National Research Council (NRC) ratings (Jones, Lindzey, & Coggeshall, 1982; Goldberger, Maher, & Flattau, 1995). These two comprehensive ratings of graduate program reputation are arguably the most respected ratings of graduate education that exist. However, it has been over a decade since the NRC published its latest version, and the academic community has long anticipated the publication of another update. Since the early 1990s, U.S. News and World Report has been publishing its annual edition of America’s Best Graduate Schools, which has filled the void left by the absence of an updated NRC publication. Many of the existing studies on prestige ratings at the graduate level have examined factors related to the prestige of an institution’s graduate programs as a whole (Volkwein, 1986; Grunig, 1997). Relatively few studies have examined prestige ratings at the graduate level for individual academic disciplines, despite the fact that graduate programs are usually rated according to discipline. For example, the reputable 1982 and 1995 NRC graduate ratings referenced above rate individual programs by academic disciplines or fields. Likewise, the U.S. News rankings of graduate schools also list separate rankings according to academic discipline. The purpose of this study is to examine the variables that relate to the U.S. News ratings of graduate schools in each of five broad disciplinary categories. The results for the five categories will then be compared to determine how closely the variables that relate to prestige in any one discipline relate to prestige in the others, and to determine how the concept of prestige compares across academic disciplines.
146

Literature Review
There are only a handful of studies that have examined prestige in graduate programs for individual academic disciplines, and many of them are decades old. Knudsen and Vaughn (1969), Abbott (1972), Baldi (1994), and Keith and Babchuk (1998) researched prestige in sociology departments. Hagstrom (1971) examined prestige among various science departments. Elton and Rodgers (1971) studied prestige ratings of physics departments. Many of these studies were done well before even the first version of the NRC ratings was published in 1982. As opposed to examining prestige in individual disciplines, a few other studies have examined the prestige of universities’ graduate programs as a whole, across a number of different fields. Such studies do so by aggregating the prestige ratings of an institution’s individual graduate programs among various academic disciplines (Volkwein, 1986; Grunig, 1997). The majority of these studies have found the same two factors to be most influential in explaining the variance in graduate school prestige ratings—size and selectivity, respectively. Most such studies of graduate education as a whole have examined the NRC ratings. Even fewer studies have examined the U.S. News graduate school ratings, despite their yearly publication for well over a decade. Sociologists Paxton and Bollen (2003) examined U.S. News graduate reputational ratings (as well as the NRC ratings) in three related academic disciplines, including sociology, political science, and economics. While the authors conclude that 20 to 30 percent of the variance in the ratings for these three disciplines is a result of systematic method error, most of the variance in these ratings is due to perceived departmental quality, which is what the ratings claim to measure. Clarke (2001) examined the U.S. News graduate school rankings (as well as the undergraduate rankings) in order to study the effects of the yearly changes in the magazine publisher’s ranking methodology. She concludes that comparing yearly shifts in an institution’s overall rank is not possible due to the annual changes in methodology. While the usefulness of analyzing changes in the rankings may be questionable, and debate continues over what the rankings actually measure, many authors do suggest that they nonetheless are important. Ehrenberg and Hurst (1996) suggest that prospective graduate students will use graduate ratings to inform their application and admission decision process. They also suggest that university administrators will use graduate program ratings to inform resource allocation decisions, including whether to add another faculty member to a given program. Indeed, Paxton and Bollen (2001) suggest that graduate program ratings can influence the status of a department within its own university, as well as a department’s status among others in its discipline across universities. Due to a lack of research that examines graduate ratings by discipline, little is known as to whether what constitutes graduate program prestige in one discipline is similar to that which equates to prestige in another. For example, does research activity within colleges of business relate to prestige to the same degree that research activity relates to prestige among colleges of engineering? Questions as these are what this study will explore, specifically examining the professional school disciplines of business, education, engineering, law, and medicine.
147

The Validity of Ratings and the Construct of Quality
Prestige ratings and rankings in higher education have been nothing if not controversial since the introduction of the first ratings in 1870 (Webster, 1986). No rating or ranking historically has received as much notoriety, nor as much criticism, as the U.S. News and World Report rankings. Most of the debate over the U.S. News rankings has been at the undergraduate level, although the methodology that U.S. News uses to rank graduate programs is very similar to the undergraduate methodology. Some of the debate over the U.S. News rankings has revolved around the variables that the magazine publisher includes in its ranking methodology, while some debate has been over the validity of the rankings. Others take issue with the very notion of ranking institutions in the first place. The debate over rankings and ratings essentially revolves around the construct of quality in higher education, and how valid the ratings are in measuring quality. The definition of quality in higher education is central to the validity of prestige ratings, but quality in higher education should likely vary for different types of consumers with different needs and abilities. McGuire (1995) suggests that there are three types of validity with regard to prestige ratings in higher education, which are face validity, construct validity, and predictive validity. According to both Anastasi (1988) and Krathwohl (1998), a measure has face validity if it appears to measure what it proclaims to measure. If a measure appears to be valid based on the results of the measure and what is thought to be accurate, then the construct has face validity. McGuire (1995) suggests that traditional stereotypes and hierarchies among colleges and universities serve to reinforce the face validity of prestige ratings among the general public, and face validity is likely the strength of the U.S. News methodology. Construct validity refers to how accurately a scoring system or survey measures a theoretical construct (Carmines & Zeller, 1979; Krathwohl, 1998). The theoretical construct that is at issue with regard to prestige ratings and rankings is the construct of quality in higher education. McGuire (1995) questions the construct validity of the rankings, especially those in U.S. News, because the variables selected to determine the rankings have little to do with the educational experiences a student receives. Studies conducted by McGuire (1995) on the variables chosen by U.S. News to rank institutions, as well as the weights that U.S. News assigns to them, indicate that the variables and their corresponding weights are arbitrary, and small changes to the weights could have a large resulting effect on an institution’s ranking. These studies call into question the construct validity of quality as measured by U.S. News. A related point is that prestige does not necessarily equate to educational quality. Since prestige ratings mostly measure variables related to institutional resources, the construct validity of institutional quality as measured by the ratings is called into question. The third type of validity at issue in prestige ratings is predictive validity. According to McGuire (1995), predictive validity, with regard to prestige ratings in higher education, implies that if one institution provides a higher quality education than another, then the educational outcomes of the higher-rated institution should be more favorable. Bogue and Saunders (1992) suggest that it is impossible to determine just from a ranking whether one institution provides a greater educational benefit than another; that is, “whether the institution does, in fact, make a value-added difference” (p. 77).
148

While there have been several models of quality in higher education proposed by various authors, Astin’s (1985) talent development model has likely received the most notoriety. Grunig (1997) makes the case that reputational ratings are not related to Astin’s (1985) talent development model of quality, which proposes that the best institutions are those that best develop and facilitate change in the skills, values, and attitudes of their students. Grunig (1997) asserts that measures of admissions statistics, tuition rates, program size, starting salaries, and research activity (all of which U.S. News employs in its graduate ranking methodology) do not capture student development very well. Grunig (1997) proposes that one model of quality that can be applied to higher education is the perceived service quality model from the marketing literature. Under the perceived service model of quality, a product or service is a quality one if it is perceived, or expected, to be better than the competition. Grunig (1997) argues that there are many parallels between the instruments used to assess perceived service quality in marketing and those used to measure reputation in higher education. In fact, the survey employed by U.S. News to measure reputation, whereby respondents are asked to rate the academic quality of their peers’ programs on a scale from 1 (marginal) to 5 (outstanding), is remarkably similar to a survey measuring perceptions of quality in marketing employed by Boulding, Kalra, Staelin, and Zeithaml (1993). Since it is the U.S. News peer assessment survey that is employed in this study as the measure of quality in graduate education, this study will adopt the perceived service model as its quality construct.
Research Questions The purpose of this study is to examine what variables relate to the U.S. News ratings of graduate schools in each of five professional school categories, and to examine whether the same or similar variables relate to prestige ratings across the disciplines. The specific research questions that will be addressed are:
1. What variables relate to the U.S. News and World Report peer assessment ratings of graduate programs in the professional school disciplines of business, education, engineering, law, and medicine?
2. Are there variables relating to prestige that are common across all of the disciplines in the study, and are there variables that are specific to certain disciplines?
3. How does the concept of prestige compare across professional school disciplines?
Methods Sample The institutions in the study are most of those that appear in the lists of “The Top Schools” in any of the five professional school disciplines of business, education, engineering, law, and medicine in the 2007 edition of America’s Best Graduate Schools, published by U.S. News and World Report. A school or college was included in this study for a given discipline only if complete data were available for every variable representing the school or college in that discipline. After excluding schools with missing data, the number of schools or colleges included in the study in each of the disciplinary categories were as follows: 49 schools of business, 50 schools of education, 50 schools of engineering, 92 schools of law, and 51 schools of medicine (in the medical “research” category).
149

Variables and Data Sources A separate regression model was estimated for each of the five professional school disciplines listed above. For each set of rankings (disciplines), U.S. News surveyed deans, faculty members, and administrators at each program, and asked them to rate the overall academic quality of the programs at each school in their discipline. Table 1 lists the number of schools in each discipline that U.S. News surveyed the specific types of individuals who were surveyed within each discipline, and the survey response rate for each discipline. The respondents were asked to rate the academic quality of their peers’ programs on a scale from 1 (marginal) to 5 (outstanding). The average of the scores for each school is reported in the magazine edition, and serves as the measure of prestige employed in this study. Thus, in each regression model, the dependent variable is the “Peer Assessment Score” reported for each program by U.S. News in its 2007 edition of America’s Best Graduate Schools.
Table 1. Individuals within each category of school who were surveyed by U.S. News and each survey’s response rate
Schools of Business Individuals in 399 accredited master’s programs in business were surveyed Individuals surveyed: business school deans and directors of accredited MBA programs 50% of all surveys were returned
Schools of Education Individuals in 276 graduate programs granting doctoral degrees in education were surveyed Individuals surveyed: education school deans and deans of graduate studies 50% of all surveys were returned
Schools of Engineering Individuals in 199 engineering schools granting doctoral degrees were surveyed Individuals surveyed: engineering school deans and deans of graduate studies 61% of all surveys were returned
Schools of Law Individuals in 180 accredited law schools were surveyed Individuals surveyed: law school deans and three faculty members at each school 67% of all surveys were returned
Schools of Medicine Individuals in 125 fully accredited medical schools and 19 schools of osteopathic medicine were surveyed Individuals surveyed medical school deans, deans of academic affairs, heads of internal medicine, and
directors of admissions 54% of all surveys were returned
Source: U.S. News and World Report, America’s Best Graduate Schools, 2007 Edition Some of the predictor variables in the study were also obtained from the 2007 edition of the U.S. News graduate rankings. U.S. News variables available for each of the five disciplines include average scores on standardized admissions tests (GRE, GMAT, LSAT, MCAT), program acceptance rate, full-time graduate enrollment in the school or program, and non-resident tuition. Student-faculty ratio or faculty-student ratio is available through U.S. News for four of the five disciplines, the exception being the business schools. Undergraduate GPA of incoming students is available for three of the five disciplines (business, law, and medicine). Total funded research expenditures (averaged over 2004 and 2005) and research expenditures per full-time faculty are
150

two variables that are available from the 2007 U.S. News edition for three of the five disciplines as well (education, engineering, medicine). Two variables are reported in U.S. News for just business schools and law schools. These are average starting salary and percent of graduates employed at graduation. Doctoral degrees awarded during 2004-05 are a variable that U.S. News only reports for education schools and engineering schools. U.S. News reports three variables for only one disciplinary category. The percent of fall 2005 graduate students in doctoral programs is reported for education schools. The proportion of full-time faculty in the National Academy of Engineering in 2005 is an engineering-specific variable. The bar exam passage rate is a variable specific to law schools.
Research activity was measured in terms of publications. Publication information was collected from the Institute for Scientific Information Web of Science Citation Indices for each individual school or college within a university. The two indices that were used in this study were the Science Citation Index and the Social Sciences Citation Index. Journals specific to an academic discipline were separated via searching on the “subject category” function within each index to ensure that only journals specific to a discipline were counted for each school in that discipline. Publication information was gathered for the period from January 2000 through December 2004. This five-year period was selected because U.S. News began administering reputation surveys in fall 2005 for the 2007 edition of America’s Best Graduate Schools.
Unfortunately, faculty salary data could not be collected for purposes of this study. Average salaries are reported by both AAUP and IPEDS for institutions as a whole, but not at the individual school, college, or program level. Collinearity was avoided by picking the strongest indicator from a set of variables that measured similar constructs. For example, standardized admissions tests and program acceptance rates are highly correlated for each of the discipline categories. Correlations were run among all of the variables for each of the disciplines in order to see which variables display the strongest relationships with the peer assessment dependent variable. As indicated above, many studies have shown that two factors -- institutional size and admissions selectivity -- are the most significant in explaining the variance in reputational scores at both the undergraduate and graduate level (Cartter, 1966; Astin, 1970; Astin & Lee, 1972; Astin & Solomon, 1981; Solomon & Astin, 1981; Volkwein, 1989; Schmitz, 1993; Grunig, 1997; Porter & Toutkoushian, 2002). Grunig’s (1997) factor analysis found that size and selectivity explain between 85 and 90 percent of the variance in average 1995 NRC ratings of the scholarly quality of graduate program faculty. For both public and private institutions, the size factor explained the greatest percentage of the variance, while the selectivity factor played the second-biggest role. A blocked (set-wise) regression was estimated separately for each of the five professional school disciplines in this study. Due to the influence of the size and selectivity factors reported in the previous studies listed above, the first variable that was entered into each regression model was a size variable, and the second was a selectivity variable. For each discipline, the specific size variable that was entered was full-time enrollment in the school or college. The selectivity
151
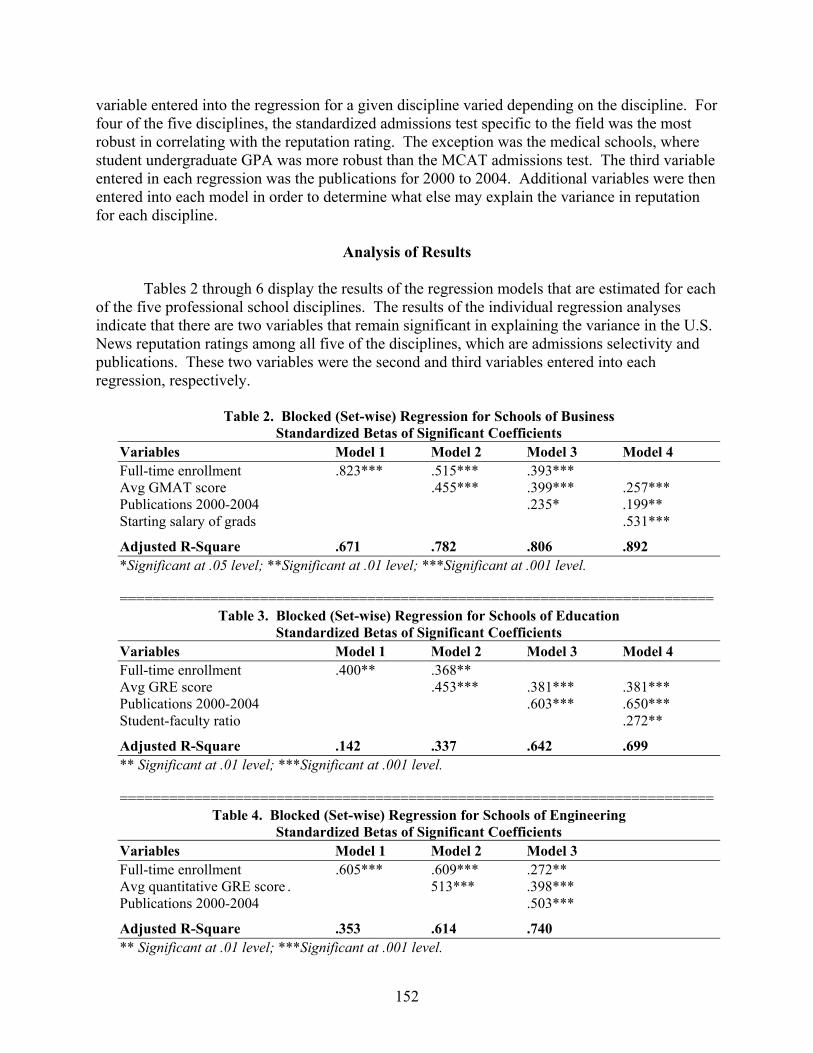
variable entered into the regression for a given discipline varied depending on the discipline. For four of the five disciplines, the standardized admissions test specific to the field was the most robust in correlating with the reputation rating. The exception was the medical schools, where student undergraduate GPA was more robust than the MCAT admissions test. The third variable entered in each regression was the publications for 2000 to 2004. Additional variables were then entered into each model in order to determine what else may explain the variance in reputation for each discipline.
Analysis of Results Tables 2 through 6 display the results of the regression models that are estimated for each of the five professional school disciplines. The results of the individual regression analyses indicate that there are two variables that remain significant in explaining the variance in the U.S. News reputation ratings among all five of the disciplines, which are admissions selectivity and publications. These two variables were the second and third variables entered into each regression, respectively.
Table 2. Blocked (Set-wise) Regression for Schools of Business Standardized Betas of Significant Coefficients
Variables Model 1 Model 2 Model 3 Model 4 Full-time enrollment .823*** .515*** .393*** Avg GMAT score .455*** .399*** .257*** Publications 2000-2004 .235* .199** Starting salary of grads .531***
Adjusted R-Square .671 .782 .806 .892 *Significant at .05 level; **Significant at .01 level; ***Significant at .001 level. ========================================================================
Table 3. Blocked (Set-wise) Regression for Schools of Education Standardized Betas of Significant Coefficients
Variables Model 1 Model 2 Model 3 Model 4 Full-time enrollment .400** .368** Avg GRE score .453*** .381*** .381*** Publications 2000-2004 .603*** .650*** Student-faculty ratio .272**
Adjusted R-Square .142 .337 .642 .699 ** Significant at .01 level; ***Significant at .001 level. ========================================================================
Table 4. Blocked (Set-wise) Regression for Schools of Engineering Standardized Betas of Significant Coefficients
Variables Model 1 Model 2 Model 3 Full-time enrollment .605*** .609*** .272** Avg quantitative GRE score . 513*** .398*** Publications 2000-2004 .503***
Adjusted R-Square .353 .614 .740 ** Significant at .01 level; ***Significant at .001 level.
152
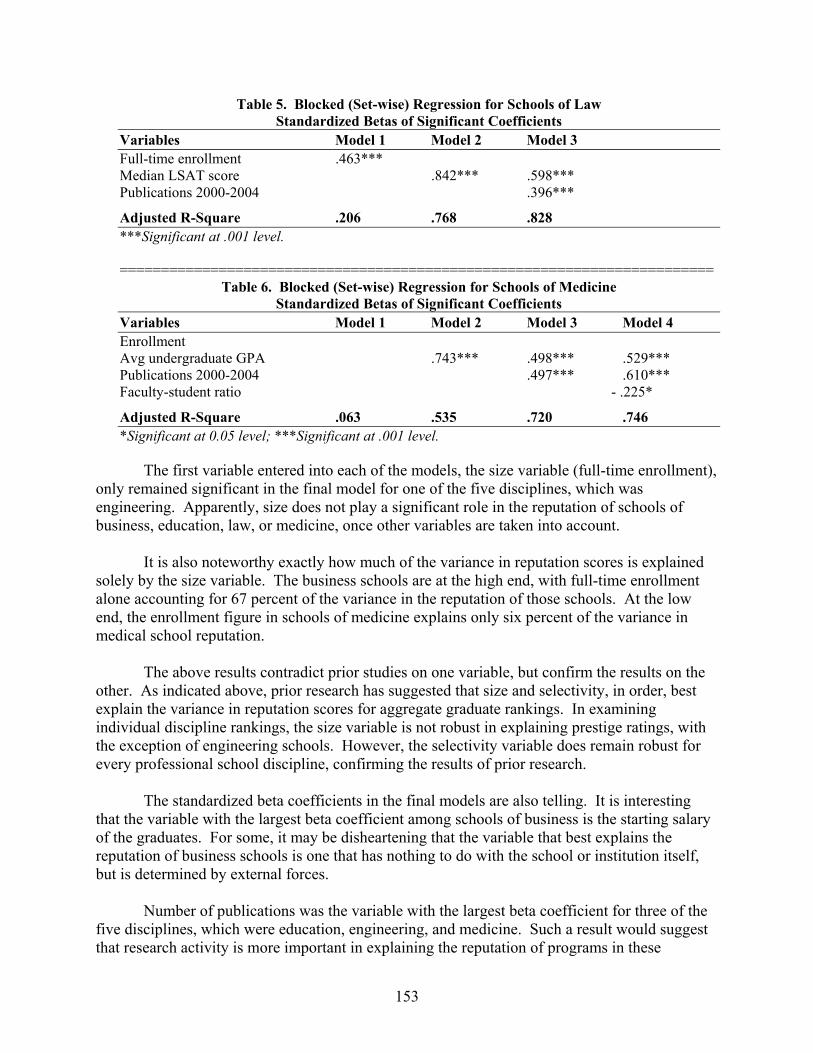
Table 5. Blocked (Set-wise) Regression for Schools of Law
Standardized Betas of Significant Coefficients Variables Model 1 Model 2 Model 3 Full-time enrollment .463*** Median LSAT score .842*** .598*** Publications 2000-2004 .396***
Adjusted R-Square .206 .768 .828 ***Significant at .001 level. ========================================================================
Table 6. Blocked (Set-wise) Regression for Schools of Medicine Standardized Betas of Significant Coefficients
Variables Model 1 Model 2 Model 3 Model 4 Enrollment Avg undergraduate GPA .743*** .498*** .529*** Publications 2000-2004 .497*** .610*** Faculty-student ratio - .225*
Adjusted R-Square .063 .535 .720 .746 *Significant at 0.05 level; ***Significant at .001 level.
The first variable entered into each of the models, the size variable (full-time enrollment), only remained significant in the final model for one of the five disciplines, which was engineering. Apparently, size does not play a significant role in the reputation of schools of business, education, law, or medicine, once other variables are taken into account. It is also noteworthy exactly how much of the variance in reputation scores is explained solely by the size variable. The business schools are at the high end, with full-time enrollment alone accounting for 67 percent of the variance in the reputation of those schools. At the low end, the enrollment figure in schools of medicine explains only six percent of the variance in medical school reputation. The above results contradict prior studies on one variable, but confirm the results on the other. As indicated above, prior research has suggested that size and selectivity, in order, best explain the variance in reputation scores for aggregate graduate rankings. In examining individual discipline rankings, the size variable is not robust in explaining prestige ratings, with the exception of engineering schools. However, the selectivity variable does remain robust for every professional school discipline, confirming the results of prior research. The standardized beta coefficients in the final models are also telling. It is interesting that the variable with the largest beta coefficient among schools of business is the starting salary of the graduates. For some, it may be disheartening that the variable that best explains the reputation of business schools is one that has nothing to do with the school or institution itself, but is determined by external forces. Number of publications was the variable with the largest beta coefficient for three of the five disciplines, which were education, engineering, and medicine. Such a result would suggest that research activity is more important in explaining the reputation of programs in these
153
disciplines than in the fields of business or law. As indicated above, starting salary of the graduates best explains reputation in business schools, and in law schools, admissions selectivity plays the greatest role (LSAT scores). In terms of the models as a whole, the variables entered into the regressions account for at least 70 percent of the overall variance in peer assessment scores for all five of the disciplines (as indicated by the adjusted R-square values). The model that is the most robust is the model for schools of business, which explains over 89 percent of the variance in peer reputation scores. The least robust model is that for schools of education, which only explains 70 percent of the variance in reputation scores.
Implications The results of the five regression models indicate that prestige in graduate education is somewhat similar to prestige in undergraduate education, at least to the degree that admissions selectivity plays a significant role. Prior studies have also suggested that research activity too plays a significant role in undergraduate prestige. In contrast to undergraduate ratings, however, size does not seem to matter in most graduate disciplines. As a whole, this research indicates that what determines prestige in graduate education varies only slightly by discipline. Admissions selectivity (mostly measured by standardized tests) and research activity (measured by publication counts) explains reputation in graduate programs in all five professional school disciplines.
References Abbott, W. F. (1972). University and departmental determinants of the prestige of sociology
departments. The American Sociologist, 7: 14-15. Anastasi, A. (1988). Psychological testing. (6th ed.) New York: Macmillan. Astin, A.W. (1970). How colleges are rated. Change, 2 (1): 11-86. Astin, A. W. (1985). Achieving educational excellence. San Francisco: Jossey-Bass. Astin, A. W. & Lee, C.B.T. (1972) The invisible colleges. New York: McGraw-Hill. Astin, A. W. & Solomon, L. C. (1981). Are reputational ratings needed to measure quality?
Change, 13 (2): 14-19. Baldi, S. (1994). Changes in the stratification structure of sociology, 1964-1992. American
Sociologist, 25: 28-43. Bogue, E. G. & Saunders, R. L. (1992). The evidence for quality: Strengthening the tests of
academic and administrative effectiveness. San Francisco: Jossey-Bass. Boulding, W., Kalra, A., Staelin, R., & Zeithaml, V. A. (1993). A dynamic process model of
service quality: From expectations to behavioral intentions. Journal of Marketing Research, 30, 7-27.
Carmines, E. G. & Zeller, R. A. (1979). Reliability and validity assessment. Series: Quantitative Applications in the Social Sciences, #17. Thousand Oaks, CA: Sage Publications.
154

Cartter, A. M. (1966). An assessment of quality in graduate education. Washington, DC :
American Council on Education. Clarke, M. (2001). Quantifying quality: Technical issues surrounding “U.S. News and World
Report’s” rankings of U.S. college and graduate schools. Paper presented at the annual meeting of the American Educational Research Association, Seattle, Washington, April 10-14, 2001.
Ehrenberg, R. G. & Hurst, P. J. (1996). A hedonic model: The 1995 NRC ratings of doctoral programs. Change, 28(3): 46-50.
Elton, C. F., & Rodgers, S. A. (1971). Physics department ratings: Another evaluation. Science, 174: 565-568.
Goldberger, M. L., Maher, B. A., & Flattau, P. E. (Eds.) (1995). Research-doctorate programs in the United States: Continuity and change. National Research Council. Washington, DC: National Academy Press.
Grunig, S. D. (1997). Research, reputation, and resources: The effect of research activity on perceptions of undergraduate education and institutional resource acquisition. Journal of Higher Education, 68 (1): 17-52.
Hagstrom, W. O. (1971). Inputs, outputs, and the prestige of university science departments. Sociology of Education, 44: 375-397.
Jones, L. V., Lindzey, G., & Coggeshall, P. E. (Eds.). (1982). Assessment of research-doctorate programs in the United States. Washington, DC: National Academy of Science Press.
Keith, B. & Babchuck, N. (1998). The quest for institutional recognition: A longitudinal analysis of scholarly productivity and academic prestige among sociology departments. Social Forces, 76: 1495-1533.
Knudsen, D. D. & Vaughn, T. R. (1969). Quality in graduate education: A re-evaluation of the rankings of sociology departments in the Cartter Report. The American Sociologist, 4: 12-19.
Krathwohl, D. R. (1998). Methods of educational and social science research: An integrated approach. (2nd ed.). Long Grove, IL: Waveland Press, Inc.
McGuire, M. D. (1995). Validity issues for reputational studies. In R.D. Walleri and M. K. Moss (Eds.), Evaluating and Responding to College Guidebooks and Rankings, New Directions for Institutional Research, 88: pp. 45-60. San Francisco: Jossey-Bass.
Paxton, P. & Bollen, K. A. (2003). Perceived quality and methodology in graduate department ratings: Sociology, political science, and economics. Sociology of Education, 76(1): 71-88.
Porter, S. R. & Toutkoushian, R. K. (2002). Institutional research productivity and the connection to average student quality and overall reputation. Paper presented at the 2002 annual meetings of the Western Economic Association, Seattle, WA.
Schmitz, C.C. (1993). Assessing the validity of higher education indicators. Journal of Higher Education, 64 (5): 503-521.
Solomon, L.C. & Astin, A.W. (1981). A new study of excellence in undergraduate education – Part one: Departments without distinguished graduate programs, Change, 13 (1): 22-28.
155

U.S. News and World Report. (2006). America’s best graduate schools, 2007 edition.
Washington, DC: U.S. News and World Report. Volkwein, J. F. (1986). Campus autonomy and its relationship to measures of university quality.
Journal of Higher Education, 57(5): 510-528. Volkwein, J. F. (1989). Changes in quality among public universities. Journal of Higher
Education, 60 (2): 136-151. Webster, D. S. (1986). Academic quality rankings of American colleges and universities.
Springfield, IL: Thomas.
156

PENN STATE’S FIRST-YEAR SEMINAR IN BUSINESS:
INTEGRATING STUDENT TRANSITION WITH THE WORLD OF BUSINESS
Kyle V. Sweitzer Graduate Research Assistant
Vicki L. Baker Management and Organization Department
Smeal College of Business Pennsylvania State University
Abstract: The Smeal College of Business at Penn State University recently partnered with the Picower Foundation to create the Picower Embark Program First-Year Seminar (FYS) in Business. As a result, the Smeal College added four modules to its FYS curriculum: leadership and team building, workplace diversity, community service, and ethical behavior. This article outlines these new FYS modules developed under the Picower grant in Penn State’s business college, along with the research design that will be implemented to examine what impact the new modules will have on student development. The article also summarizes both the historical development and recent trends in first-year seminars, and it demonstrates how a first-year seminar can satisfy disciplinary accreditation standards in schools of business.
Introduction and Significance of Topic More and more college and university personnel beyond just those in student affairs are focusing their efforts on student development initiatives, particularly during the first year of college (Evans, Forney, & Guido-DiBrito, 1998). This trend in first-year student development initiatives has been stimulated by the public (via governmental agencies) through a greater push for accountability in higher education and the recent trend in assessing student-learning outcomes. Thus, institutions have undertaken the responsibility for student development as part of their academic mission, and they have recognized that student retention and persistence during the first year and beyond is a critical consideration for all constituents. As institutions strive to focus on the multi-dimensional needs and vocational preparation of an increasingly diverse student body, student development is becoming the responsibility of all members of the academic community (Evans et al., 1998). In recent years, the Smeal College of Business at Penn State University has taken on the task of student development via various initiatives, including improving the first-year seminar for business students through the generosity of the Picower Foundation. Few would argue that an institution cannot effectively and fully develop its students without retaining them and seeing them through to degree completion. Thus, student retention and persistence is an area of increasing importance in higher education. Several studies have been conducted surrounding the issue of undergraduate student persistence (Pascarella, Terenzini, & Wolfle, 1986; Cabrera, Castaneda, Nora, & Hengstler, 1992; Tinto, 1997). According to Tinto, “Students enter a college or university with varying patterns of personal, family, and academic characteristics and skills, including initial dispositions and intentions with respect to college attendance and personal goals” (Pascarella & Terenzini, 1991,p. 51).
157

Several factors contribute to a student’s overall college experience and decision to commit to a college or university. Tinto (1997) researched educational characteristics that affect student persistence by examining the classroom as the center of educational activity in institutions of higher education. Tinto believed that little research had been done surrounding how classroom experiences matter and how these experiences come to shape student persistence. Students spend a great deal of time in the classroom and on the university or college campus. Therefore, it is reasonable to assume that the experiences and interactions students are exposed to during their first year of college contribute to the student’s perceptions, expectations, and feelings towards college. One way institutions are shaping the student experience early in one’s academic career is through the first-year seminar, which is an ideal medium to not only influence student development, but also student retention. In addition, institutions can kill the proverbial “two birds with one stone” if their freshmen seminars are also able to satisfy accreditation requirements within a given discipline. This article will demonstrate how schools of business can do just that.
Relevant Literature First-Year Seminars Historically Harvard University, under A. Lawrence Lowell’s presidency (1909-1933), began to foster the development of freshmen and recognized that incoming first-year students needed guidance and social as well as academic support, and created common living quarters for entering freshmen (Morison, 1936). During his inaugural speech, President Lowell stated: America has not yet contributed her share to the scholarly creation, and the fault lies in part at the door of our universities. They do not strive enough in the impressionable years of early manhood to stimulate intellectual appetite and ambition (Morison, 1936, p. 444). The focus on the freshman class of 1914 and the experiences they were exposed to upon arrival at Harvard in the freshmen halls proved not only to be a good decision by the administration at the time, but the model continues to this day in American higher education. By 1930, approximately one-third of all colleges and universities offered courses geared toward freshmen, with nine out of ten freshmen required to enroll in such courses by 1938 (Mueller, 1961). By 1948, 43 percent of all academic institutions in the United States required an orientation course during the first year of study (Gordon, 1989). However, by the mid-1960s, orientation courses became extinct due to lack of faculty support. Nonetheless, there was a resurgence during the 1970s in first-year seminars because colleges and universities were seeing a more diverse student population, including first-generation students, older returning students, and academically under-prepared students. Such trends compelled institutions to reintroduce first-year seminars into the curriculum (Felker, 1984). The evolution of the freshmen orientation course reflects the sustained concern for the needs of freshmen (Gordon, 1989). Topics covered during freshmen orientation courses in the 1970s through the late-1980s included how to study, institutional history, college life and student activities, curriculum, vocation, use of campus resources, reading, note taking, communication, history of higher education, and citizenship, to name a few (Upcraft, Gardner, and Associates, 1989). The impetus
158
behind these topics was to introduce students to college life, and to provide them with a foundation of skills that would help them be successful students and citizens. Some of the issues that surrounded first-year seminars during their resurgence in the 1970s and 1980s have continued to the present day. At the end of the 1980s, researchers noted that there was ongoing debate over what should be included in the curriculum of a first-year seminar, as well as who should instruct the course (Upcraft et al., 1989). On one side of the spectrum, many tenured faculty across every type of institution did not want to take on the responsibility of developing the curriculum and teaching such a course. Many faculty believed that their time would be better spent preparing and teaching upper-level courses or pursuing research interests. However, on the other side of the spectrum, the general consensus was that part-time or adjunct faculty should not teach a first-year seminar course for several reasons. One such reason is that first-year students need to feel like the institution considers the first-year course to be important. Another reason is that there is a sense that first-year students need to connect to and build relationships with full-time faculty as soon as possible. Upcraft et al. (1989) note that another issue that surfaced that involves the faculty with regards to first-year seminar courses was how to merge faculty with student services personnel in their involvement with the course. This issue continues today, as first-year seminar courses increasingly focus on student transitions and adjustment to college life. There are still other issues involving first-year seminars that emerged during the 1970s and 1980s which persist today, as documented by Upcraft et al. (1989). These include how much credit, if any, should be awarded for a first-year seminar course, and how to market the course such that first-year students will feel like they want to take it, rather than that they have to take it. The merits of having upper-class students serve as peer facilitators for a first-year seminar also continues to be debated among those designing such courses. First-Year Seminars Today Nearly 95 percent of today’s colleges and universities in the United States have adopted some form of the first-year seminar (Barefoot, 1993). While freshmen orientation courses through the years have had varied degrees of academic content, the 21st century first-year seminar is more intellectually focused. An increasing number of first-year seminars (especially those at large universities) are specific to a certain discipline and are housed within a specific college or department within a university. Based on a review of recent studies in higher education, Pascarella and Terenzini (2005) found that, “[first-year] seminars vary widely in content, duration, structure, pedagogies, and degree credit value, but all have the goal of promoting academic performance, persistence, and degree completion” (p. 400). In fact, the literature review conducted by Pascarella and Terenzini, though selective, reveals that first-year seminars consistently yield positive and statistically significant advantages to students who enroll in such courses. In other words, students who participate in first-year seminars are more likely to persist into the sophomore year of study and ultimately attain a bachelor’s degree. Researchers such as Fidler and Fidler (1991) and Barefoot (1993) also found that other positive effects, in addition to persistence and degree attainment, result from participation in a first-year seminar. A few of these positive effects include: satisfaction with the college
159

experience, more meaningful and regular interactions with faculty, greater involvement in extracurricular activities, and students are more inclined to have positive self-perceptions of themselves as learners. As noted above, in the early days of the first-year (or freshman) seminar, the goal was to help students succeed in taking courses during the first year and persist to the sophomore year. Upcraft, Gardner, and Barefoot (2004) suggest that, “The first-year seminar is one of the most powerful predictors of first-year student persistence into the sophomore year” (p. 42). However, the authors suggest that in today’s world of higher education, persistence to sophomore year is not enough. In order for a first-year seminar to be successful, it must also assist students in developing intellectual and academic competencies, as well as building and maintaining interpersonal relationships. The successful first-year seminar will also help students to develop an understanding of their own identity, to focus on the importance of health and wellness, to reflect on faith and spiritual dimensions of life, and to develop multicultural awareness and civic responsibility. Upcraft et al. (2004) reviewed the progress of the first-year seminar over the past twenty years. They found that the first-year seminar is moving in a positive direction and found greater interest in the first-year student experience at the campus, national, and international levels. They also discovered emerging interest in research focused on understanding the first-year experience, increased collaboration between faculty and student affairs professionals, infusion of technology into the first-year seminar experience, and increased support through external funding to improve the freshman experience. However, Upcraft et al. (2004) project that there are still challenges ahead. Such challenges include: no clear agreement as to the purpose of the first year, meeting the needs of a growing diverse student population, a need for greater emphasis on student learning as opposed to retention, struggles for funding at the detriment of institutional priorities, and still unacceptable first-year academic success rates. As a result of these challenges, institutions and academic programs are being forced to find creative ways to improve the first-year student experience while still preparing students academically. Penn State’s Picower Embark Program is an example of a discipline-specific (business) first-year seminar undertaking such challenges.
Penn State’s Smeal College of Business First-Year Seminar In 1999, the First-Year Seminar (FYS) became a requirement for students in the Smeal College of Business at Penn State University with two primary goals: (1) to provide an opportunity for the college’s freshmen to interact with the university’s senior professionals, and (2) to offer a common curriculum to all first-year students with an interest in business that assists with their transition into academic life through personal decision-making and exploration of career paths. Between 1,000 and 1,200 students have participated in the Smeal College of Business FYS each academic year since its inception. From its beginning in 1999, the FYS in Penn State’s Smeal College of Business aimed to improve opportunities for incoming first-year students. These improved opportunities included fostering the exploration of academic values, interests, and career ideas, providing students with
160

hands-on, experiential activities both in and out of the classroom. The FYS has also served as a conduit for students to foster relationships early in the college experience with senior faculty. The first several years of the Smeal College FYS, known then as “Business Beginnings,” were successful in assisting students in their transition to college life. However, the course was not very specific to business fields, despite it being housed in the Smeal College of Business. There was discussion within the college to expand the curriculum and offer new activities within the FYS course; however, there was a concern as to how the new activities would be funded. According to Upcraft et al. (2004), funding for first-year seminars has been and continues to be a growing concern nationwide. In 2003, Penn State’s Smeal College of Business met this challenge. The Smeal College partnered with the Jeffrey and Barbara Picower Foundation. As a result, the Picower Embark Program First-Year Seminar was launched to support the Smeal College mission of focusing on first-year transition to college, personal values, leadership skills, and inclusion of underrepresented groups for students interested in pursuing business careers. As a result of the partnership, the Smeal College FYS added several modules to its curriculum, which focus on business-specific topics. The new modules include leadership and team building, diversity in the workplace (with special emphasis on race and ethnicity), community service (including tangible opportunities for service participation), and ethical behavior in academic life and business decision-making. The Picower FYS Curriculum The curriculum in the Picower Embark Program FYS in Penn State’s Smeal College of Business has several demands placed on it. The curriculum in this business-specific, first-year course must not only help students make the transition to college life like most first-year seminars, but it must also introduce students to the majors and opportunities in the Smeal College, as well as introduce them to the world of business in general. While these demands are not necessarily competing, it is challenging to meet all of them effectively via a two-credit course over just one semester. Like many first-year seminars, the Picower FYS is designed to introduce students to college life. The seminar introduces students to strategies allowing them to manage their time effectively, including keeping a calendar and prioritizing assignments. The curriculum also stresses the importance of setting goals, both academically and career-wise. Study skills and note-taking skills are emphasized, and students spend a class period at the campus library, while a librarian demonstrates how to navigate the on-line library system. Merging First-Year Seminar Priorities with Business Priorities Today’s business landscape provides an array of opportunities for a first-year seminar in a business school to not only introduce students to the world of business, but to simultaneously prepare students for college life. The business scandals of the late-1980s, such as the insider trading scandals, prompted a push for schools of business to address both leadership and ethics. The scandals continued into the 1990s and the new millennium, and corporate citizenship became increasingly emphasized in the business world. The current decade has also seen the tragedies of terrorism and natural disasters rock our nation and the world; thus, community
161

service has reached new heights in levels of participation. Likewise, the business marketplace has increasingly become a global marketplace, and diversity has been emphasized in hiring and in business practices. “Surely business education must be an enterprise of both the intellect and the spirit – an endeavor that engages one’s character and values, spurs one’s imagination and sense of meaning, and stimulates one’s sense of responsibility and accountability and one’s desire to lead and create” (Piper, Gentile, & Daloz-Parks, 1993, p. 4). The accrediting body for business colleges agrees, recently stating, “Management education must prepare students to contribute to their organizations and the larger society and to grow personally and professionally throughout their careers” (Association to Advance Collegiate Schools of Business, 2005, p. 1). Integrating Picower FYS and AACSB Standards The accrediting body for business schools, the Association to Advance Collegiate Schools of Business (AACSB), has established accreditation guidelines, which are very broad and can be satisfied in a variety of ways. Such broadly stated accreditation standards allow for a first-year seminar course to meet several of these guidelines, while simultaneously meeting the more traditional FYS goals of assimilation into college and freshmen retention. Institutions, which view first-year seminars as solely for the purpose of introducing students to college life, or as solely for the purpose of increasing freshmen retention, do not often, integrate discipline-specific topics into their FYS course curricula. In such cases, institutions, and in particular individual schools and colleges, forego the opportunity to fulfill disciplinary accreditation standards via FYS course content. The Picower FYS in Penn State’s Smeal College of Business has been able to integrate very specific standards established by the accrediting body for schools of business into its curriculum. Examples of such integration in the Picower FYS modules are detailed below. “Use of information technology” (AACSB, 2005, p. 15) is given specific mention in the most recent AACSB guidelines. Penn State University invested in an on-line course management system in recent years, known as Angel, which allows students and instructors to have instant 24-hour access to course syllabi, assignments, handouts, class notes, course reserves, and activities. Through Angel, students can also instantly connect to their classmates or work groups in order to complete course assignments or activities. One of the goals of the Picower FYS is to familiarize first-year business students with Angel, as it is a technology that is increasingly utilized by faculty across the university. Also, familiarity with Angel helps to ensure that Penn State students are proficient in the use of information technology in today’s increasingly technological environment, and it helps to satisfy the AACSB standard relating to information technology cited above. As noted previously, the Picower FYS curriculum aims to introduce students to the Smeal College of Business, familiarizing them with the majors, minors, and other opportunities within the college. Students are required to complete a “Majors and Careers” project, which not only introduces students to the majors and minors in the Smeal College of Business, but also gives many freshmen their first public speaking assignment. The project calls for students to work in teams of three, and for the team to research one of the majors in the Smeal College. The teams then present the major and associated careers, including course requirements, faculty in the major, upper-class student perspectives, and perspectives from working professionals.
162

Communication skills, including public speaking skills, are also emphasized to students as essential for many of the majors in the Smeal College, as well as for success in the business world. This assignment also speaks to accreditation standards, as ensuring that business students have sufficient communication abilities is given specific mention in the most recent AACSB guidelines (AACSB, 2005). Combining the perspectives of life as a college student with life as a professional in the business world is critical to the revised FYS curriculum that was developed with the grant from the Picower Foundation. As stated above, the four new modules that were added to the curriculum were leadership, diversity, community service, and ethics. Instructors in the Picower FYS emphasize how these four modules can touch students’ lives, both as students at Penn State, as well as in the world of business. Two of these four new modules also are directly related to specific AACSB accreditation guidelines. In the module on leadership, students are introduced to leadership principles and the class discusses leadership in organizations. Just as important, however, is the discussion on leadership opportunities at Penn State, including those in student clubs and organizations. A scavenger hunt is also part of the module on leadership. Students are randomly assigned to teams as they enter the classroom on a given day, and each team is provided with one list of items they need to acquire or locate during the class period. The following class period, students are asked to share with the class the group dynamics that took place, and who among them took leadership roles. Ensuring that undergraduates have an understanding of multicultural and diversity issues (AACSB, 2005) is included in the most recent accreditation guidelines for business schools. In the diversity module, instructors discuss diversity in the workplace, as well as the importance of diversity at Penn State. One assignment asks students to choose two companies and evaluate the companies’ diversity practices, in terms of how well the company actually practices what it preaches with regard to their commitment to diversity. Likewise, students have an in-class (and at times a heated) conversation about the diversity they see around them on campus, and whether they think it is important to have a diverse student body. The community service module is one where students are required to perform an act of community service at some point during the semester. There are a variety of options from which students can choose. Most of the service activities take place off-campus, and they are usually arranged and/or sponsored by Penn State’s Center for Student Engagement. In relating community service to the business world, students discuss the notions of corporate citizenship and social responsibility, and are given the task of researching and evaluating businesses as to how well they “give back” to their communities. Students are required to submit a written reflection on their experience in performing the community service activity. They also make a small presentation to the class about their experience, providing them with another opportunity to gain public speaking and oral communication experience. “Ethical understanding and reasoning abilities” (AACSB, 2005, p. 15) is listed in the most recent AACSB guidelines. The ethics module combines the notion of business ethics with ethics in academics. Students are given hypothetical scenarios of individuals in corporations having to make difficult decisions involving the financial health of a company versus the
163

physical health of its employees or the local citizens. Real-world examples may also be brought in. Likewise, students are encouraged to discuss academic integrity, and the consequences of getting caught cheating are outlined in class. The recent AACSB accreditation guidelines also include “reflective thinking skills” (AACSB, 2005, p. 15) as critical in undergraduate education. There are a number of opportunities for students in the Picower FYS to reflect critically on their experiences. For example, as part of the community service module described above, students are required to submit a written paper in which they reflect on their experience in performing the community service activity, how the activity met their expectations, and their thoughts on the benefit provided the recipient. Students are also asked to submit a written reflection on the scavenger hunt activity as part of the leadership module. The course modules detailed above represent the additions to the first-year seminar in Penn State’s Smeal College of Business since the college’s partnership with the Picower Foundation. It is important to the Picower Foundation to measure the effectiveness of these new modules in meeting the goals of the first-year seminar course. The research methodology that will be employed in order to measure student outcomes is outlined below.
Research Methodology and Conceptual Framework Figure 1 depicts the conceptual model that will be employed to determine how well the Picower Embark Program FYS influences a student’s understanding of important business considerations while also influencing the likelihood of student transition, success, and retention in the first year of college. Specifically, the conceptual model will allow for an examination as to the extent to which the additional modules developed under the Picower Embark Program (leadership, diversity, community service, and ethics) are effective in influencing student attitudes and beliefs in these four content areas.
Figure 1. PICOWER EMBARK PROGRAM -- SMEAL COLLEGE OF BUSINESS
CHANGE IN STUDENT LEARNING
• IN-CLASS EXPERIENCES • OUT-OF-CLASS EXPERIENCES
CURRICULUM DEVELOPMENT (4) New Modules
• LEADERSHIP
• DIVERSITY
• COMMUNITY
SERVICE
• ETHICS
PICOWER EMBARK
PROGRAM FACULTY TRAINING
• STANDARD CURRICULUM
MODULES/ SYLLABUS • ON-LINE COURSE PLATFORM
CONTINUOUS IMPROVEMENT
164

The changes to the FYS curriculum have resulted in uniformity across the 60 sections of FYS taught in Penn State’s Smeal College of Business each academic year (40 in the fall term, 20 in the spring term). To augment these curricular revisions, faculty training occurs prior to and throughout each semester to support effective pedagogy and ensure a positive student experience. In turn, students enrolled in the Picower FYS are exposed to in- and out-of-class activities geared towards improving their understanding of the four new curriculum modules, as well as other topics, such as time management, study skills, majors and careers in business, and understanding the business world in general. All students in every section of the Smeal College Picower FYS are exposed to all four of the new curriculum modules (leadership, diversity, community service, ethics) as well as to the other topics mentioned above. In addition, on-line pre- and post-test surveys will be administered to FYS participants to determine changes over the course of the semester in student understanding of key curriculum areas, student satisfaction with the FYS experience, and in the effectiveness in achieving desired outcomes. Additionally, focus groups will be conducted in various sections to assess student perceptions of in- and out-of-class activities as they relate to curricular goals and objectives. Results from the pre- and post-tests and focus groups will be used to support continuous improvement efforts in the FYS in order to support the objectives outlined by the Picower Foundation. The goals for the FYS set forth by the Picower Foundation include: (1) to develop a curriculum that advances the best practices of leading business firms through development of structured experiences in effective leadership and teamwork, diversity in the workplace, community service, and ethical behavior; (2) to develop a curriculum to assist student transition into the academic and professional world of business; and (3) to engage students in an examination of possible career paths in business and provide resources to pursue avenues that best match their interests. The progress of each semester’s Picower FYS students will be monitored longitudinally throughout their Penn State academic career in order to assess student perception of academic and social integration, academic achievement and persistence in college, advancement towards degree completion, and ultimately graduation.
Practical Implications From a practical standpoint, the Picower Embark Program serves as an example of how a FYS can be developed to address university goals (i.e., transition and retention), while simultaneously introducing first-year students to discipline-specific issues faced in more advanced business curricula and the business world in general. Other first-year seminars can use the Picower Embark Program as a model of how to determine whether program objectives are meeting both student and university needs while introducing students to discipline-specific content. The Picower program is an example of how a course can positively contribute to the first-year experience and also serve as an introduction to specific majors early in a student’s academic pursuits. Finally, the Picower program demonstrates how a first-year seminar can meet disciplinary accreditation guidelines, specifically in a college of business.
165

References
Association to Advance Collegiate Schools of Business. (2005). Eligibility procedures and
accreditation standards for business accreditation. Tampa, FL: Author. Barefoot, B. O. (1993). Exploring the evidence: Reporting outcomes of freshman seminars.
Columbia: University of South Carolina, National Resource Center for the Freshman Year Experience.
Cabrera, A. F., Castaneda, M. B., Nora, A., & Hengstler, D. (1992). The convergence between two theories of college persistence. The Journal of Higher Education, 63 (2): 143-164.
Evans, N. J., Forney, D. S., & Guido-DiBrito, F. (1998). Student development in college: Theory, research, and practice. San Francisco: Jossey-Bass.
Felker, K. (1984). Grow: An experience for college freshmen. Journal of Physical Education and Recreation, 49: 558-561.
Fidler, P. P. & Fidler, D. S. (1991). First national survey on freshman seminar programs: Findings, conclusions, and recommendations. Columbia: University of South Carolina, National Resource Center for the Freshman Year Experience.
Gordon, V. N. (1989) Origins and purposes of the freshman seminar. In M. L. Upcraft, J. N. Gardner, & Associates (Eds.), The freshman year experience: Helping students survive and succeed in college. San Francisco: Jossey-Bass. p.183-197.
Morrison, S. E. (1936). Three centuries of Harvard. Cambridge, MA: Harvard University Press. Mueller, K. (1961). Student persistence work in higher education. Boston: Houghton Mifflin. Pascarella, E. T. & Terenzini, P. T. (1991). How college affects students: Findings and insights
from twenty years of research. San Francisco: Jossey-Bass. Pascarella, E. T. & Terenzini, P. T. (2005). How college affects students: A third decade of
research, volume 2. San Francisco: Jossey-Bass. Pascarella, E. T., Terenzini, P. T., & Wolfle, L. M. (1986). Orientation to college and freshman
year persistence/withdrawal decisions. The Journal of Higher Education, 57 (2): 155-175. Piper, T. R., Gentile, M. C., & Daloz-Parks, S. (1993). Can ethics be taught?: Perspectives,
challenges, and approaches at Harvard Business School. Boston: Harvard Business School. Tinto, V. (1997). Classrooms as communities: Exploring the educational character of student
persistence. The Journal of Higher Education, 68 (6): 599-623. Upcraft, M. L., Gardner, J. N., & Associates (1989). The freshman year experience: Helping
students survive and succeed in college. San Francisco: Jossey-Bass. Upcraft, M. L., Gardner, J. N., & Barefoot, B. O. (2004). Challenging and supporting the first-
year student: A handbook for improving the first year of college. San Francisco: Jossey-Bass.
166

THE IMPACT OF FINANCIAL AID ON FRESHMAN RETENTION1
Mindy Wang
Director of Planning and Institutional Research Catholic University of America
Abstract: The results show that amount of unmet need is the single most important financial aid factor for freshmen to persist. Other financial aid factors that are important to freshman retention include total aid amount and the loan amount. The majority of our students said that financial aid was extremely important for them and that their financial need was not fully met. Average loan amounts our students are willing to take were also examined.
Objectives of the Research
Most institutions of higher learning are experiencing a money crunch due to a sluggish American economy and tight budgets. To better support students who are most likely to succeed, colleges place a high priority on improved allocation of financial aid. Income from student enrollment is the main financial resource for many universities; at the same time, the university contributes a large amount of tuition revenue as financial aid for its students. This study surveyed students to determine the importance of financial aid in their decisions to persist at our university. The survey also collected students’ perspectives on the impact of financial aid, suggestions to improve financial aid services and the loan amount they are willing to take.
In addition, due to a decline in freshman retention, a retention committee was formed at our campus to find out what we can do to better retain students. We were called upon to do different analyses to find out what matter the most. From our exploratory analyses, we know that unmet need probably is the most important financial aid factor that influences freshmen retention. Other factors that might be important to retention include, but may not be limited to, high school GPA, SAT scores, first semester GPA, living on campus, and campus ministry participation.
Literature Review According to Tierney (1980), lower-income students generally are more sensitive to tuition than are upper-income groups. Minorities often avoid loans and, when loans are used, persistence can be negatively impacted; however, a higher portion of students with gift-aid-only packages persisted the following year (Fenske, Porter, & DuBrook, 2000). Reliance on loans to finance undergraduate education may produce detrimental effects on student retention (Mulugetta, Saleh, & Mulugetta, 1997). Students reevaluate their decision of college choice. If post matriculation reevaluations of the benefits and costs of attendance are consistent with their earlier perceptions, students are likely to view their implicit contract as inviolate and decide to persist at that college. On the other hand, if student’s subsequent experience and perceptions of the benefits and costs of attendance compare unfavorably with their prematriculation expectations, decision to leave may be more likely (Paulsen and St. John, 1997). All the articles 1 The funding of this study was partially supported by a NEAIR research grant.
167

suggested that unmet need and loan amount are the major financial aid factors that related to student retention.
Methodology This study surveyed the Fall 2005 freshman cohort at a private doctoral institution. A questionnaire was sent to each freshman that received financial aid in the fall term. The study was conducted in the spring semester of the 2005-06 academic year. One month after the first mailing, a follow-up mailing was sent out. One month after the follow-up, a second mailing was sent out. Logistic regression and descriptive statistics were used to analyze the data; answers to the open-ended questions on the students’ opinions and suggestions are also presented.
Summary of the Data Sources According to Trusheim (1994), college freshmen are relatively accurate in reporting whether any financial aid was received. However, students’ self-reports of the specific financial aid awards and amounts do not correspond closely to actual data. Data extracted from the financial aid system were also used to get more accurate aid amount information and to avoid data missing in the survey. Information from the survey, as well as financial aid data and student enrollment data from Peoplesoft system, was all used in the research.
Summary of the Results The Logistic Regression analysis showed that the unmet need amount is the single most important factor to impact new freshman retention in the following spring semester and into the second year. Other factors tested were whether the student has a loan(s), the amount of the loan(s), total financial aid amount, family income, amount of grant and scholarship aid, and the amount of work-study funds. In addition, non-financial aid variables were also examined: these include, but not limited to, SAT math and verbal scores; mother’s educational level; father’s educational level; high school GPA; first semester GPA; living on campus; and campus ministry participation. Tables 1 through 8 show a selection of models with different variables tested. From the tables we know that while unmet need is almost always statistically significant, total aid amount and loan amount are also important for freshman retention. However, most of the variables other than financial aid were not significant, while those important financial aid variables were in the model already. A few exceptions are following: the first semester GPA is highly significant in predicting second year retention; high school GPA is significant in predicting second year retention; and SAT math is significant in predicting second semester retention.
168

Table 1. Independent Variable: Unmet Need
Logistic Regression Results: Predicting Freshman Retention Beta Coefficient P-value Second Semester Retention
Unmet Need -0.0301 0.0180* Total Aid Amount 0.0801 0.0009***
Second Year Retention Unmet Need -0.0268 0.0013** Total Aid Amount 0.0196 0.0684
* p<=.05;** p<=.01; *** p<=.001
Table2. Independent Variables: Unmet Need, Aid Amount, Family Income, and Loan Amount
Logistic Regression Results: Predicting Freshman Retention Beta Coefficient P-value Second Semester Retention
Unmet Need -0.4056 <.0001*** Total Aid Amount 0.7141 <.0001*** Family Income 0.00105 0.8397 Loan Amount -0.00065 <.0001***
Second Year Retention Unmet Need -0.1134 <.0001*** Total Aid Amount 0.1516 <.0001***
Family Income 0.00252 0.2888 Loan Amount -0.00016 <.0001***
* p<=.05;** p<=.01; *** p<=.001
Table 3. Independent Variables: Unmet Need, Aid Amount, Family Income, Loan Amount, and Grant/Scholarship Amount
Logistic Regression Results: Predicting Freshman Retention Beta Coefficient P-value Second Semester Retention
Unmet Need -0.3275 0.0011* Total Aid Amount 0.9716 <.0001*** Family Income 0.00128 0.8192 Loan Amount -0.00091 <.0001*** Grant/Scholarship Amount -0.00041 0.0047**
Second Year Retention Unmet Need -0.1005 0.0007*** Total Aid Amount 0.1926 <.0001*** Family Income 0.00234 0.3265 Loan Amount -0.00020 <.0001*** Grant/Scholarship Amount -0.00007 0.2185
* p<=.05;** p<=.01; *** p<=.001
169

Table 4. Independent Variables: Unmet Need, Aid Amount, Family Income,
Loan Amount, Grant/Scholarship Amount, and Work Study Amount
Logistic Regression Results: Predicting Freshman Retention Beta Coefficient P-value Second Semester Retention
Unmet Need -0.3240 0.1275 Total Aid Amount 0.7524 0.0119* Family Income 0.00155 0.9585 Loan Amount -0.00070 0.0119* Grant/Scholarship Amount -0.00014 0.6715
Work Study Amount 0.00163 0.2586 Second Year Retention
Unmet Need -0.1547 0.0037** Total Aid Amount 0.0986 0.1056 Family Income 0.00362 0.6109 Loan Amount -0.00013 0.0197* Grant/Scholarship Amount 0.000002085 0.9797 Work Study Amount 0.000609 0.2424
* p<=.05;** p<=.01; *** p<=.001
Table 5. Independent Variables: Unmet Need, Aid Amount, Loan Amount, and High School GPA
Logistic Regression Results: Predicting Freshman Retention Beta Coefficient P-value Second Semester Retention
Unmet Need -0.3783 <.0001*** Total Aid Amount 0.7317 <.0001*** Loan Amount -0.00063 <.0001*** High School GPA -1.8248 0.0722
Second Year Retention Unmet Need -0.1129 <.0001*** Total Aid Amount 0.1152 <.0001*** Loan Amount -0.00012 <.0001*** High School GPA 0.9024 0.0013**
* p<=.05;** p<=.01; *** p<=.001
170

Table 6. Independent Variables: Unmet Need, Aid Amount, Loan Amount,
SAT Math, and SAT Verbal
Logistic Regression Results: Predicting Freshman Retention Beta Coefficient P-value Second Semester Retention
Unmet Need -0.7339 0.0062** Total Aid Amount 1.8521 0.0067** Loan Amount -0.00155 0.0062** SAT Math -0.0351 0.0227*
SAT Verbal -0.0185 0.0852 Second Year Retention
Unmet Need -0.1106 <.0001*** Total Aid Amount 0.1290 <.0001*** Loan Amount -0.00013 <.0001*** SAT Math 0.00349 0.1152 SAT Verbal -0.00148 0.4764
* p<=.05;** p<=.01; *** p<=.001
Table 7. Independent Variables: Unmet Need, Aid Amount, Loan Amount, Father’s Educational Level, and Mother’s Education Level
Logistic Regression Results: Predicting Freshman Retention Beta Coefficient P-value Second Semester Retention
Unmet Need -0.4699 <.0001*** Total Aid Amount 0.7527 <.0001*** Loan Amount -0.00069 <.0001*** Father’s Educational level -0.8269 0.4789 Mother’s Educational level -0.5814 0.5643
Second Year Retention Unmet Need -0.1280 <.0001*** Total Aid Amount 0.1481 <.0001***
Loan Amount -0.00016 <.0001*** Father’s Educational level 0.1095 0.6862
Mother’s Educational level 0.4100 0.1353 * p<=.05;** p<=.01; *** p<=.001
171

Table 8. Independent Variables: Unmet Need, Aid Amount, Loan Amount,
and First Semester GPA
Logistic Regression Results: Predicting Freshman Retention Beta Coefficient P-value Second Semester Retention
Unmet Need -0.3677 <.0001*** Total Aid Amount 0.6851 <.0001*** Loan Amount -0.00058 <.0001*** First Semester GPA -0.2053 0.6524
Second Year Retention Unmet Need -0.1102 <.0001*** Total Aid Amount 0.1161 <.0001*** Loan Amount -0.00012 <.0001*** First Semester GPA 0.6601 <.0001***
* p<=.05;** p<=.01; *** p<=.001 The results also show that the majority of the students consider financial aid extremely important (67%) and report that their needs are not fully met (58%). As to how they acquire the money needed not covered by financial aid, the following are represented of the student comments.
• depleting lifetime savings • obtain loans: student, parent plus, commercial, etc. • seek work: part- or full-time during semester; work-study; summer jobs • families sold homes or other assets • second parent obtained work outside home • college fund accounts; 529 Plans
A significant portion of the students expressed that they themselves are solely responsible
for paying their tuition. Their families are either unable or unwilling to help in financing their college education. Some students expressed that their families were already stretched thin paying loans for other sibling’s education(s). Students were also asked about suggestions for financial aid offices. The following comments came from that open-ended question.
• have a better relationship with student accounts offices • improve financial aid’s web sites to be less confusing • give students more personal contact and keep them better informed
Some students reiterate that they are responsible for paying for their education, as their
families are either unable or unwilling to help them in financing their college education. Some also expressed the burden of debt when other siblings were also in college. In general, students supplied the following suggestions.
• scholarships after the first year • more merit-based scholarships based on academic performance • not be penalized in the amount they would receive working part-time • re-evaluate need and student performance annually
172

• consider other factors besides income when the University is making decisions on
financial aid • University might consider the amount of money owed by the family, as family’s gross
income is not best indicator for family contributions.
Conclusions Unmet need was the most important financial aid factor that impacts students’ persistence. Other key financial aid factors include total aid amount and loan amount. As to how large a loan the students were willing to take, while 22% of the survey respondents said they were willing to take out as many loans as necessary, 26% of the survey respondents said they do not want to take out a loan at all. Among those who reported the amount they were willing to take on loan, the average amount was $38,059 for their whole college career.
Implications for Research/Practice Since the unmet need is the best financial aid predictor on freshman retention, the research results confirm that the University is on the right track by increasing the number of need-based aid. In responding to last year’s lower retention rate in the freshman cohort, we tried to increase need-based aid to keep students with need retain without dropping out due to financial difficulty. Further research is needed to find out how loan amount has impacted the students’ retention, what amount of unmet need should be used as a cutting point for the University to intervene, and how to evaluate the institutional financial aid allocation from the University’s financial point of view.
References Braunstein, A., McGrath, M., & Pescatrice, D. (1999). Measuring the impact of income and
financial aid offers on college enrollment decisions. Research in Higher Education. 40(3): 247-259.
Fenske, R. H., Porter, J. D., & DuBrock, C. P. (2000). Tracking financial aid and persistence of women, minority and needy students in science, engineering, and mathematics. Research in Higher Education. 41(4): 67-94.
Hu, S. & Hossler, D. (2000). Willingness to pay and preference for private institutions. Research in Higher Education. 41(6): 685-701.
Mulugetta, Y., Saleh, D. A., & Mulugetta, A. (1997). Student aid issues at private institutions. New Directions for Institutional Research. 95: 43-64.
Paulsen, M. B. & St. John, E. P. (1997). The financial nexus between college choice and persistence. New Directions for Institutional Research. 95: 65-81.
Savoca, E. (1990). Another look at the demand for higher education: Measuring the price sensitivity of the decision to apply to college. Economics of Education Review. 9(2): 123-134.
St John, E. P., Andrieu, S., Oescher, J., & Starkey, J. B. (1994). The influence of student aid and within-year persistence by traditional college-Age students in four-year colleges. Research in Higher Education. 35(4): 455-480.
173

Tierney, M. L. (1980). The impact of financial aid on student demand for public/private higher
education. Research in Higher Education. 51(5): 527-545. Trusheim, D. (1994). How valid is self-reported financial aid information? Research in Higher
Education. 35(3): 335-348.
174