Nonlinear RANSAC Optimization for Parameter Estimation with Applications to Phagocyte Transmigration
10
Nonlinear RANSAC Optimization for Parameter Estimation with Applications to Phagocyte Transmigration Mingon Kang, Department of Computer Science, University of Texas at Arlington, Arlington, Texas, USA 76019 Jean Gao, and Department of Computer Science, University of Texas at Arlington, Arlington, Texas, USA 76019 Liping Tang Department of Bioengineering, University of Texas at Arlington, Arlington, Texas, USA 76019 Mingon Kang: [email protected]; Jean Gao: [email protected]; Liping Tang: [email protected] Abstract Developing vigorous mathematical equations and estimating accurate parameters within feasible computational time are two indispensable parts to build reliable system models for representing biological properties of the system and for producing reliable simulation. For a complex biological system with limited observations, one of the daunting tasks is the large number of unknown parameters in the mathematical modeling whose values directly determine the performance of computational modeling. To tackle this problem, we have developed a data-driven global optimization method, nonlinear RANSAC, based on RANdom SAmple Consensus (a.k.a. RANSAC) method for parameter estimation of nonlinear system models. Conventional RANSAC method is sound and simple, but it is oriented for linear system models. We not only adopt the strengths of RANSAC, but also extend the method to nonlinear systems with outstanding performance. As a specific application example, we have targeted understanding phagocyte transmigration which is involved in the fibrosis process for biomedical device implantation. With well-defined mathematical nonlinear equations of the system, nonlinear RANSAC is performed for the parameter estimation. In order to evaluate the general performance of the method, we also applied the method to signalling pathways with ordinary differential equations as a general format. I. INTRODUCTION Computational modeling and simulation have been highlighted in biomedical research for decades since they can provide blueprints for biological insights and new knowledge discovery without carrying out astronomically expensive biological experiments. They have played an important role in not only discovering biological components’ nature but also providing quantitative prediction. However, the complexity and intractability of biological systems have made the desired goals challenging, which is followed by research endeavors utilizing mathematical system models. A typical system model is constructed based on biological hypotheses that are conventionally obtained from biological experiments and/or reported literature. The hypotheses may consist of several consecutive, causal stages reflecting relations among biological components of the system. Computational simulation with the maximum likelihood method can conduct quantitative prediction of biological components which are visible or invisible. Eventually, the simulation can provide evolutionary prediction over time, the evidence for the biological component’s property, and discovery of system mechanism. One of the major challenges for computational system modeling is the definition of system parameters. Parameter estimation has been dealt with as an optimization problem with NIH Public Access Author Manuscript Proc Int Conf Mach Learn Appl. Author manuscript; available in PMC 2012 December 06. Published in final edited form as: Proc Int Conf Mach Learn Appl. 2011 ; 1: 501–504. $watermark-text $watermark-text $watermark-text
-
Upload
independent -
Category
Documents
-
view
2 -
download
0
Transcript of Nonlinear RANSAC Optimization for Parameter Estimation with Applications to Phagocyte Transmigration

Nonlinear RANSAC Optimization for Parameter Estimation withApplications to Phagocyte Transmigration
Mingon Kang,Department of Computer Science, University of Texas at Arlington, Arlington, Texas, USA 76019
Jean Gao, andDepartment of Computer Science, University of Texas at Arlington, Arlington, Texas, USA 76019
Liping TangDepartment of Bioengineering, University of Texas at Arlington, Arlington, Texas, USA 76019Mingon Kang: [email protected]; Jean Gao: [email protected]; Liping Tang: [email protected]
AbstractDeveloping vigorous mathematical equations and estimating accurate parameters within feasiblecomputational time are two indispensable parts to build reliable system models for representingbiological properties of the system and for producing reliable simulation. For a complex biologicalsystem with limited observations, one of the daunting tasks is the large number of unknownparameters in the mathematical modeling whose values directly determine the performance ofcomputational modeling. To tackle this problem, we have developed a data-driven globaloptimization method, nonlinear RANSAC, based on RANdom SAmple Consensus (a.k.a.RANSAC) method for parameter estimation of nonlinear system models. Conventional RANSACmethod is sound and simple, but it is oriented for linear system models. We not only adopt thestrengths of RANSAC, but also extend the method to nonlinear systems with outstandingperformance. As a specific application example, we have targeted understanding phagocytetransmigration which is involved in the fibrosis process for biomedical device implantation. Withwell-defined mathematical nonlinear equations of the system, nonlinear RANSAC is performedfor the parameter estimation. In order to evaluate the general performance of the method, we alsoapplied the method to signalling pathways with ordinary differential equations as a general format.
I. INTRODUCTIONComputational modeling and simulation have been highlighted in biomedical research fordecades since they can provide blueprints for biological insights and new knowledgediscovery without carrying out astronomically expensive biological experiments. They haveplayed an important role in not only discovering biological components’ nature but alsoproviding quantitative prediction. However, the complexity and intractability of biologicalsystems have made the desired goals challenging, which is followed by research endeavorsutilizing mathematical system models. A typical system model is constructed based onbiological hypotheses that are conventionally obtained from biological experiments and/orreported literature. The hypotheses may consist of several consecutive, causal stagesreflecting relations among biological components of the system. Computational simulationwith the maximum likelihood method can conduct quantitative prediction of biologicalcomponents which are visible or invisible. Eventually, the simulation can provideevolutionary prediction over time, the evidence for the biological component’s property, anddiscovery of system mechanism.
One of the major challenges for computational system modeling is the definition of systemparameters. Parameter estimation has been dealt with as an optimization problem with
NIH Public AccessAuthor ManuscriptProc Int Conf Mach Learn Appl. Author manuscript; available in PMC 2012 December 06.
Published in final edited form as:Proc Int Conf Mach Learn Appl. 2011 ; 1: 501–504.
$waterm
ark-text$w
atermark-text
$waterm
ark-text

methods categorized as linear or nonlinear optimization. Since most biological systems cannot be represented by linear systems, in this study, we leave linear systems out of thediscussion. We provide a simple but robust methodology for parameter estimation of acomplex nonlinear system. To overcome the non-linear system limitation and to inherit thesimplicity and outlier-resistent strengths of original RANSAC, we develop a nonlinearRANSAC method which turns out to be computationally efficient and better fitting results.
As a specific application example, parameter estimation for a phagocyte transmigrationsystem is conducted. With remarkable development and increasing demand of medicalimplants such as breast implants, encapsulated tissues/cells, neural electrodes, and eyeimplants, medical implants are becoming more common. However, the increasing number ofmedical implants failure also has been reported. Medical implants provoke unpredictedresponses and reactions from the immune system, and tend to lead fibrotic capsule formationsurrounding the medical device. Phagocyte transmigration is one of the key steps involvedin fibrosis formed around an implanted biomedical device. Accurate modeling andsimulation of the phagocyte transmigration will disclose the contributing components andpredict the evolution of foreign body responses, which will eventually lead to the failure ratereduction in implantation.
To evaluate the method with general applications, signaling pathway models with dynamicobservations are synthetically generated, and the parameters which represent their signalingrelations between components in the systems are estimated by the proposed nonlinearRANSAC method.
II. METHODA. RANdom SAmple Consensus
Least squares approaches are commonly used for model fitting solutions in over-determinedsystems where there are more equations than unknown variables. Least squares approachesminimize the sum of residuals between data points and estimations from the model.However, one of drawbacks of least squares is that least squares approaches are verysensitive to outliers, which consequently produce distorted results.
Random sample consensus was proposed by Fischler et al. [1] to tackle the linear leastsquares problem that are sensitive to outliers. Unlike common numerical approaches basedon least squares, RANSAC is a very simple and strong data-driven method to estimatereliable linear regression solution by ignoring outliers. RANSAC randomly selects s numberof points from whole samples, and then fit the model with the selected subset of the samplesthrough several iterations. For each iteration, it counts the number of points which arelocated within a certain distance between the fitted model and points of the sample subset.When the number of points accepted by the criteria is more than a threshold T or it meets apredefined maximum iteration k, it stops. The threshold T is the minimum inlier number inthe sample subset in order to accept that the model is correct. In RANSAC method, there arethree input parameters required to be pre-defined, which are the number of iteration trials k,the threshold T, and the error-tolerance ξ for the tolerance distance between estimations andobservations to check if the data point is inlier or not. To compute k, it assumes probabilityw that a certain data point is within the error tolerance of the model, b is the probability thatthe s selected data points in the sample subset are all inliers (i.e., b = ws), and desiredprobability z to have enough good samples.
Kang et al. Page 2
Proc Int Conf Mach Learn Appl. Author manuscript; available in PMC 2012 December 06.
$waterm
ark-text$w
atermark-text
$waterm
ark-text

(1)
Moveover, it needs to calculate T which is the least inliers number for the sample subsetbelonging to error tolerance of the model. In other words, when the number of inliersreaches T, the iteration would terminate early.
(2)
where N is the total number of the data points. Error-tolerance ξ is usually determinedempirically.
B. Nonlinear RANSAC for nonlinear systemsWhile RANSAC is suggested for linear systems, biological system modeling is mainly builtby using nonlinear mathematical functions due to biological complexity. In this paper,nonlinear RANSAC is introduced which extends RANSAC method to complex nonlinearsystems. The overall process is described in the following.
1. Generate sample subsets.
2. Solve minimizing the score function with constrains.
3. Count the number of samples belong to the error tolerance of the model.
4. If the count number is larger than T, it terminates.
5. If the iteration number is larger than k, it terminates.
6. Otherwise repeat (1) – (5) iteratively.
7. A local optimizer is performed with inliers.
The method targets the parameter estimation solution of nonlinear systems fitting the modelto the observation data. Like RANSAC, it produces k subsets of samples randomly selectedusing uniform distribution, where the size of samples subset s is defined in Eq. (3).
(3)
where P is the number of parameters, and γ is the threshold of the maximum sample size.Then, each subset generates constraints with the selected samples. The score function isdefined in Eq. (4) by least squares function but only with sample subsets. At least P numberof sample subsets are normally required to determine the function. However, the cost wouldbe exponentially increasing with large sample size since the large sample size producestremendous constraints. Therefore, the threshold of maximum sample size γ is used.
Let Si be a sample subset, i.e., Si = [ςt1, ςt2, …, ςts], 1 ≤ i ≤ P, S = [S1, S2, …, SP ], and S ∈ℜ. f (x; p) is the nonlinear function to represent the model where x is a state variable, and pis a parameter vector; p = [p1, p2, … pP ].
(4)
Kang et al. Page 3
Proc Int Conf Mach Learn Appl. Author manuscript; available in PMC 2012 December 06.
$waterm
ark-text$w
atermark-text
$waterm
ark-text

where F (x, S; p) is the least square function with only sample subsets, ξ is the errortolerance to determine acceptance of the sample points which means the data points arecompatible to the system as inliers. The minimization problem with inequality constraintscan be solved by Lagrange multiplier.
(5)
The inequality constraints and small size of observations limit the boundary of hyperspacefor parameter p, and reduce computational complexity with only selected samples withoutsensitivity to outliers. It produces approximately estimated parameter p which makes theerror residual to be minimized with sample subsets. Meanwhile, it also counts the number ofobservations belonging to within error tolerance of the model with the estimated parameter.Nonlinear RANSAC also has the same criteria to terminate the iterations: (1) the number ofiterations is more than k by Eq. (1); (2) the number of samples within the error tolerance ofthe model is satisfied with T in Eq. (2) with a prior probability w.
Although nonlinear RANSAC algorithm results in reliable parameter estimation, the result,however, may not be the best solution since the solution is still biased to sample subsets.Therefore, Levenberg-Marquardt algorithm (a.k.a. LMA) is adopted for a maximizationstep. However, the drawback of LMA is that LMA is a local optimizer not global. In otherwords, only if initial estimation starts within the convex set where optimal solution ispresent, LMA could find the optimum of the function. Nonlinear RANSAC may provide agood initial parameter input to LMA. To maximize the performance of nonlinear RANSAC,LMA is used in the final step with input of initial parameter which is estimated by nonlinearRANSAC. Moreover, only the observations which are determined as inliers by nonlinearRANSAC are passed to LMA to minimize the sensitivity of least squares approaches tooutliers.
III. PHAGOCYTE TRANSMIGRATIONExcessive fibrotic responses around medical implants can interfere the functionality of theimplants. Phagocyte transmigration is known as one of the major reactions of the immunesystem. In our experiment, phagocytes in the capillaries are induced by the immune systemto peritoneal space when a device is implanted and subsequently lead fibrotic formationsurrounding the biomaterial. Tang et al. [2] had conducted experiments to recognizecomponents involved in foreign body reactions and to discover their responses andreactions. From hypotheses of previous studies and experiments [3], [4], [5], [6], [7], it isbelieved that different components - mast cells, histamine, histamine receptors, and P/Eselectins - and their interactions are involved in the process of phagocyte transmigration.Based on current biological experiments and reporting, for the diverse components involvedin the process of phagocyte transmigration, mathematical equations for the system areorganized in Eq. (6) [8].
Kang et al. Page 4
Proc Int Conf Mach Learn Appl. Author manuscript; available in PMC 2012 December 06.
$waterm
ark-text$w
atermark-text
$waterm
ark-text

(6)
where Ċ* represents the first order derivative of the function, k*s are parameters to describeeither their promotion or degradation rates. Ch(t), Chr(t), Cs(t), Cpmnp(t), Cpmn(t), Cmpp(t),and Cmp(t) are the time-related concentration functions of histamine, histamine receptors, P/E selectins, permeability of PMN, PMN, permeability of MΦ, and MΦ, respectively.Nonlinear RANSAC is performed to estimate parameters of the system, which consists ofseven equations and 15 unknown parameters with observations for PMN and MΦ. Fig. 1illustrates that nonlinear RANSAC provides more reliable results which are not biased tooutliers than least square approaches. For example, there are four observations which areone data point is a likely outlier at 16th hour in Fig. 1(a). However, least squares approachestake all data points account into the score function, so it produces more outlier sensitiveresults.
IV. EVALUATION WITH SYNTHETIC PATHWAYSTo quantitatively test the performance of the proposed method, evaluation was carried outfor the general case, especially parameter estimation of the signalling pathways inbioinformatics. For a typical signaling pathway, we assume that there are c nodes whichmay represent significant proteins, genes, or any components with strong relations betweenthem in biology, where c2 number of parameters are present The system can be modeledwith c nonlinear functions using ordinary differential equations in Eq. (7).
(7)
where pij denotes the signalling rate of relation between xi and xj. For the result of nonlinearRANSAC algorithm with the synthetic data, the computational cost is not exponentiallyincreased as the number of parameter is increasing, but it increases rather relative linearly inFig. 2(a). The number of parameters is the square of the number of nodes. Since nonlinearRANSAC is a data-driven method, the number of parameters does not affect thecomputational cost more sensitively. The scores with different numbers of parameters areplotted in Fig. 2(b). The score is calculated by the least squares function with observationdata which are identified as inliers.
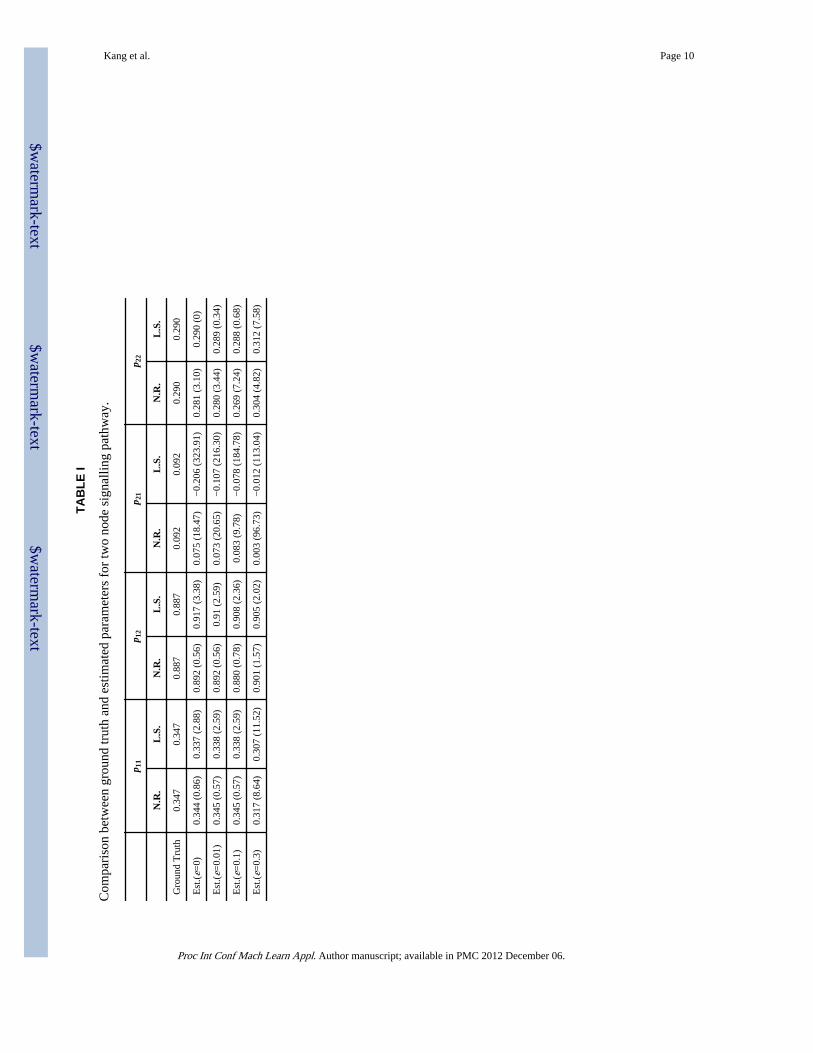
The quantitative parameter estimation results for signalling pathways with two to four nodesare listed in Table I and Fig. 3, where nonlinear RANSAC (N.R.) and least squaresapproaches (L.S.) are compared for their performance. Noise with different variances (ε =error variance) are added by Gaussian distribution. In Table I, we list the absolute values ofestimated parameters for the two-node signaling pathway by both nonlinear RANSAC andleast squares approaches. In addition, for easy comparison, the estimated parameter values
Kang et al. Page 5
Proc Int Conf Mach Learn Appl. Author manuscript; available in PMC 2012 December 06.
$waterm
ark-text$w
atermark-text
$waterm
ark-text

are compared for their error rates ( ). Nonlinear RANSACoutperforms least squares with less error rates. Because the synthetic data are generated withGaussian error distribution and the errors are evenly distributed, least squares performancecan be as good as nonlinear RANSAC. However, observation data is generally not evenlydistributed with good balance rather but irregular with outliers in practice. Thus, nonlinearestimation would provide better performance as the non-biased solution in real.
V. DISCUSSION AND CONCLUSIONIn this paper, we presented a nonlinear RANSAC scheme for optimal parameter estimation.Nonlinear RANSAC is oriented from data-driven algorithms identifying inliers to avoid thesensitivity of outliers. Observable data typically have either high measurement error orobservation noise. Therefore, the complexity of feasible models is exponentially increasingas the unknown parameter number is increasing. However, nonlinear RANSAC performswith linear computational cost for high dimensional spaces of the parameters. Although thenumber of parameter is increasing exponentially, the cost is still increasing linearlyaccording to the result of the experiment. This is attributed to the fact that nonlinearRANSAC performance depends on picked sample subsets and ignores outliers, whichconsequently makes efficient computation.
As a typical application, phagocyte transmigration is evaluated with existing mathematicalequations and the proposed nonlinear RANSAC method. Since nonlinear RANSAC filtersoutliers, the more likely precise properties of the mechanism are re-estimated. Erroneousestimation of the parameters can lead to unexpected prediction of the system. By applyingnonlinear RANSAC, we can produce a reliable system model for phagocyte transmigration,and the computational simulation can be used to predict the evolution of phagocytetransmigration over time for the predictable surgical procedures.
AcknowledgmentsThe authors gratefully thank the support from NIH under grant R01EB007271.
References1. Fischler M, Bolles R. Random sample consensus: a paradigm for model fitting with applications to
image analysis and automated cartography. Comm of the ACM. 1981; 24(15):381–395.
2. Tang L, Jennings TA, Eaton JW. Mast cells mediate acute inflammatory responses to implantedbiomaterials. Proceedings of the National Academy of Sciences. 1998; 95
3. Christenson L, Aebischer P, McMillan P, Galletti PM. Tissue reaction to intraperitoneal polymerimplants: species difference and effects of corticoids and doxorubicin. Jounal of BiomedicalMaterials Research. 1989; 23(7):705–718.
4. Tang L, Eaton J. Inflammatory responses to biomaterials. American journal of clinical pathology.1995; 103(4):466–71. [PubMed: 7726145]
5. Tang L, Wu Y, Timmons RB. Fibrinogen adsorption and host tissue responses to plasmafunctionalized surfaces. Jounal of Biomedical Materials Research. 1998; 42(1):156–163.
6. Tang L, Eaton J. Natural responses to unnatural materials: A molecular mechanism for foreign bodyreactions. Molecular Medicine. 1999; 5(6):351–358. [PubMed: 10415159]
7. Tang L, Jiang W, Welty SE. The participation of p- and e-selectins on biomaterial-mediated tissueresponses. Journal of Biomedical Materials Research. 2001; 62:471–477. [PubMed: 12378692]
8. Kang, M.; Gao, J.; Tang, L. Computational modeling of phagocyte transmigration duringbiomaterial-mediated foreign body responses. Proceedings of IEEE International Conference onBioinformatics and Biomedicine; 2010. p. 609-612.
Kang et al. Page 6
Proc Int Conf Mach Learn Appl. Author manuscript; available in PMC 2012 December 06.
$waterm
ark-text$w
atermark-text
$waterm
ark-text

Fig. 1.Performance comparison between nonlinear RANSAC (blue) and least squares approaches(red). (a) and (b) are the results with optimal parameters estimated by nonlinear RANSACand least squares approaches for PMN and MΦ, respectively. (c) and (d) are simulationcomputed up to 35 hours by two different methods for PMN and MΦ, respectively.
Kang et al. Page 7
Proc Int Conf Mach Learn Appl. Author manuscript; available in PMC 2012 December 06.
$waterm
ark-text$w
atermark-text
$waterm
ark-text

Fig. 2.Nonlinear RANSAC performance results with plots of (a) computational time and (b)scores.
Kang et al. Page 8
Proc Int Conf Mach Learn Appl. Author manuscript; available in PMC 2012 December 06.
$waterm
ark-text$w
atermark-text
$waterm
ark-text

Fig. 3.Comparison between ground truth and estimated parameters for three (a) and four node (b)signalling pathways.
Kang et al. Page 9
Proc Int Conf Mach Learn Appl. Author manuscript; available in PMC 2012 December 06.
$waterm
ark-text$w
atermark-text
$waterm
ark-text
$waterm
ark-text$w
atermark-text
$waterm
ark-text
Kang et al. Page 10
TAB
LE I
Com
pari
son
betw
een
grou
nd tr
uth
and
estim
ated
par
amet
ers
for
two
node
sig
nalli
ng p
athw
ay.
p 11
p 12
p 21
p 22
N.R
.L
.S.
N.R
.L
.S.
N.R
.L
.S.
N.R
.L
.S.
Gro
und
Tru
th0.
347
0.34
70.
887
0.88
70.
092
0.09
20.
290
0.29
0
Est
.(ε=
0)0.
344
(0.8
6)0.
337
(2.8
8)0.
892
(0.5
6)0.
917
(3.3
8)0.
075
(18.
47)
−0.
206
(323
.91)
0.28
1 (3
.10)
0.29
0 (0
)
Est
.(ε=
0.01
)0.
345
(0.5
7)0.
338
(2.5
9)0.
892
(0.5
6)0.
91 (
2.59
)0.
073
(20.
65)
−0.
107
(216
.30)
0.28
0 (3
.44)
0.28
9 (0
.34)
Est
.(ε=
0.1)
0.34
5 (0
.57)
0.33
8 (2
.59)
0.88
0 (0
.78)
0.90
8 (2
.36)
0.08
3 (9
.78)
−0.
078
(184
.78)
0.26
9 (7
.24)
0.28
8 (0
.68)
Est
.(ε=
0.3)
0.31
7 (8
.64)
0.30
7 (1
1.52
)0.
901
(1.5
7)0.
905
(2.0
2)0.
003
(96.
73)
−0.
012
(113
.04)
0.30
4 (4
.82)
0.31
2 (7
.58)
Proc Int Conf Mach Learn Appl. Author manuscript; available in PMC 2012 December 06.