Non‐catalytic, gas‐solid reversible reaction mechanism implementing diffuse interface model
12
Non-Catalytic, Gas-Solid Reversible Reaction Mechanism Implementing Diffuse Interface Model ABDUL REHMAN KHAN Chemical Engineering Department, Faculty of Engineering and Petroleum, PO Box 5969, Safat 13060 Kuwait University, Kuwait Received 21 July 1998; accepted 22 March 1999 ABSTRACT: Gas-solid reactions in chemical and metallurgical industries often involve solid pellets and a gaseous reactant. The progress of chemical reaction is measured by the move- ment of zones within the pellet and has been explained in terms of diffusion and chemical reaction processes. Earlier models identified a single reaction zone, in addition to product layer and unreacted core. In the present article, two reaction zones are envisaged as a more plausible explanation of the movement of the zones as the reaction proceeds. Earlier models for reversible reactions have assumed that conditions at the interface between the reaction zone and the unreacted core correspond to equilibrium at the prevailing temperature. The gaseous concentrations were assumed to permeate the core at the interfacial values so that no reaction occured in the core. More realistically, the present article envisages an additional zone within which the gaseous concentrations fall from the equilibrium values to zero. It is assumed that in the reaction zone proper, referred to as zone I, having thickness z I , the con- centration profile is sigmoidal. This agrees with the earlier work of Khan and Bowen [1] and Prasannan and Doraswamy. [2] In zone I and the concentration of the reactant gas varies between [A i ] and [A*]. In the zone II, having thickness z 2 , concentration varies linearly between [A*] and zero. This model has been applied successfully to the data of the reduction of he- matite [3] at different temperatures. The contribution of different forms of resistance, diffusion in product layer, chemical reaction and diffusion in the reactant core, is assessed as function of time (start to the end of reaction). The thickness of the zones remain almost constant as the reaction progresses. In particular, the influences of the product and core diffusion coef- ficients and chemical equilibrium constant on the extant reaction are evaluated. The depen- dence of concentration profile and zone thickness on equilibrium constant, K, velocity con- stant, k, diffusional coefficients D C and D P has been investigated thoroughly. The thickness of both zones has been evaluated for leading variables. q 1999 John Wiley & Sons, Inc. Int J Chem Kinet 31: 559– 570, 1999 Correspondence to: Dr. A. R. Khan (Fax: 965-4839848, E-mail: rehmankuc01.kuniv.edu.kw) q 1999 John Wiley & Sons, Inc. CCC 0538-8066/99/080559-12 INTRODUCTION Gas-solid reactions have usually been analyzed in terms of structural or distributed models. The former class of models is based on the behavior of the indi- vidual grains of the solid matrix or pore dimension in the solids. In the second type of models, the important feature is the knowledge of the chemical reaction itself
-
Upload
independent -
Category
Documents
-
view
0 -
download
0
Transcript of Non‐catalytic, gas‐solid reversible reaction mechanism implementing diffuse interface model
Non-Catalytic, Gas-SolidReversible ReactionMechanism ImplementingDiffuse Interface ModelABDUL REHMAN KHAN
Chemical Engineering Department, Faculty of Engineering and Petroleum, PO Box 5969, Safat 13060 Kuwait University,Kuwait
Received 21 July 1998; accepted 22 March 1999
ABSTRACT: Gas-solid reactions in chemical and metallurgical industries often involve solidpellets and a gaseous reactant. The progress of chemical reaction is measured by the move-ment of zones within the pellet and has been explained in terms of diffusion and chemicalreaction processes. Earlier models identified a single reaction zone, in addition to productlayer and unreacted core. In the present article, two reaction zones are envisaged as a moreplausible explanation of the movement of the zones as the reaction proceeds. Earlier modelsfor reversible reactions have assumed that conditions at the interface between the reactionzone and the unreacted core correspond to equilibrium at the prevailing temperature. Thegaseous concentrations were assumed to permeate the core at the interfacial values so thatno reaction occured in the core. More realistically, the present article envisages an additionalzone within which the gaseous concentrations fall from the equilibrium values to zero. It isassumed that in the reaction zone proper, referred to as zone I, having thickness zI, the con-centration profile is sigmoidal. This agrees with the earlier work of Khan and Bowen [1] andPrasannan and Doraswamy. [2] In zone I and the concentration of the reactant gas variesbetween [Ai] and [A*]. In the zone II, having thickness z2, concentration varies linearly between[A*] and zero. This model has been applied successfully to the data of the reduction of he-matite [3] at different temperatures. The contribution of different forms of resistance, diffusionin product layer, chemical reaction and diffusion in the reactant core, is assessed as functionof time (start to the end of reaction). The thickness of the zones remain almost constant asthe reaction progresses. In particular, the influences of the product and core diffusion coef-ficients and chemical equilibrium constant on the extant reaction are evaluated. The depen-dence of concentration profile and zone thickness on equilibrium constant, K, velocity con-stant, k, diffusional coefficients DC and DP has been investigated thoroughly. The thickness ofboth zones has been evaluated for leading variables. q 1999 John Wiley & Sons, Inc. Int J Chem
Kinet 31: 559–570, 1999
JCK(Wiley) RIGHT BATCH
shortstandardlong
Correspondence to: Dr. A. R. Khan (Fax: 965-4839848, E-mail:rehmankuc01.kuniv.edu.kw)q 1999 John Wiley & Sons, Inc. CCC 0538-8066/99/080559-12
INTRODUCTION
Gas-solid reactions have usually been analyzed interms of structural or distributed models. The formerclass of models is based on the behavior of the indi-vidual grains of the solid matrix or pore dimension inthe solids. In the second type of models, the importantfeature is the knowledge of the chemical reaction itself
and of the diffusional processes that govern movementto and from the reaction site. There are two extremecases of the distributed models, one being a sharp in-terface model and the other a homogeneous model.Bowen and Cheng [4] have proposed that reaction oc-curred in a diffuse zone between the solid product andreactant. Szekely and Evans [5,6] and Gray and Hen-derson [7] have experimentally confirmed the forma-tion of reaction zone during the reduction of nickeloxide and wustite respectively. Mantri et al. [8] havesuggested a general model for gas-solid irreversiblereactions to cover three stages, a) zone formation, b)zone travel, and c) zone collapse.
In a gas-solid reaction, in which one reactant andone product are particularly susceptible to diffusionresistance, product gases accumulate in contact withthe solid product. The possibility of a reverse reactionmust be considered. Shen and Smith [9] and Silabanet al. [10] have discussed diffusional effects in a re-versible gas-solid reaction. Szekely and Evans, [5,6]Evans and Song, [11] Ranade and Harrison, [12] andEvans and Rande [13] have considered reversibility ingas-solid reactions using a grain model, where onemole of gaseous reactant produces one mole of gas-eous product. Mutasher et al. [14] have applied a dif-fuse interface model for fixed bed reactor for anisothermal reversible gas-solid reaction. Their as-sumption of linear concentration profile within the re-action zone has restricted its application. Jamshidi andAle Ebrahim, [15] Maalmi et al., [16] Trnka et al.,[17], and Uhde and Hoffman [18] have mathemati-cally interpreted the gas-solid noncatalytic reactionbehavior. Pais and Portugal [19] have discussed amathematical model for non-catalytic liquid-solid re-versible reaction. Khan and Bowen [1,20] have com-pared three different types of concentration profiles,linear, sigmoidal and exponential in the reaction zonein a spherical pellet for diffuse interface model. Thequestion was raised about the travel of the zone at thezone-core interface, where the concentration of gas-eous reactant A was equal to equilibrium concentra-tion [A*]. In the present article, a two-zone model hasbeen put forward for reversible gas-solid non-catalyticreactions to explain the progress of reaction as a resultof moving the reaction zones into the solid reactantcore using diffuse interface model. This model can fitthe experimental data of Ansari and Bowen [3] satis-factorily explaining the diffusion and reaction mech-anism. The variation of the magnitude of different dif-fusion resistances (product and reactant core) andreaction resistance for gas-solid reaction as a functionof time has been evaluated. The influence of variousparameters on the values of the zone thickness has alsobeen thoroughly investigated.
MODEL DEVELOPMENT
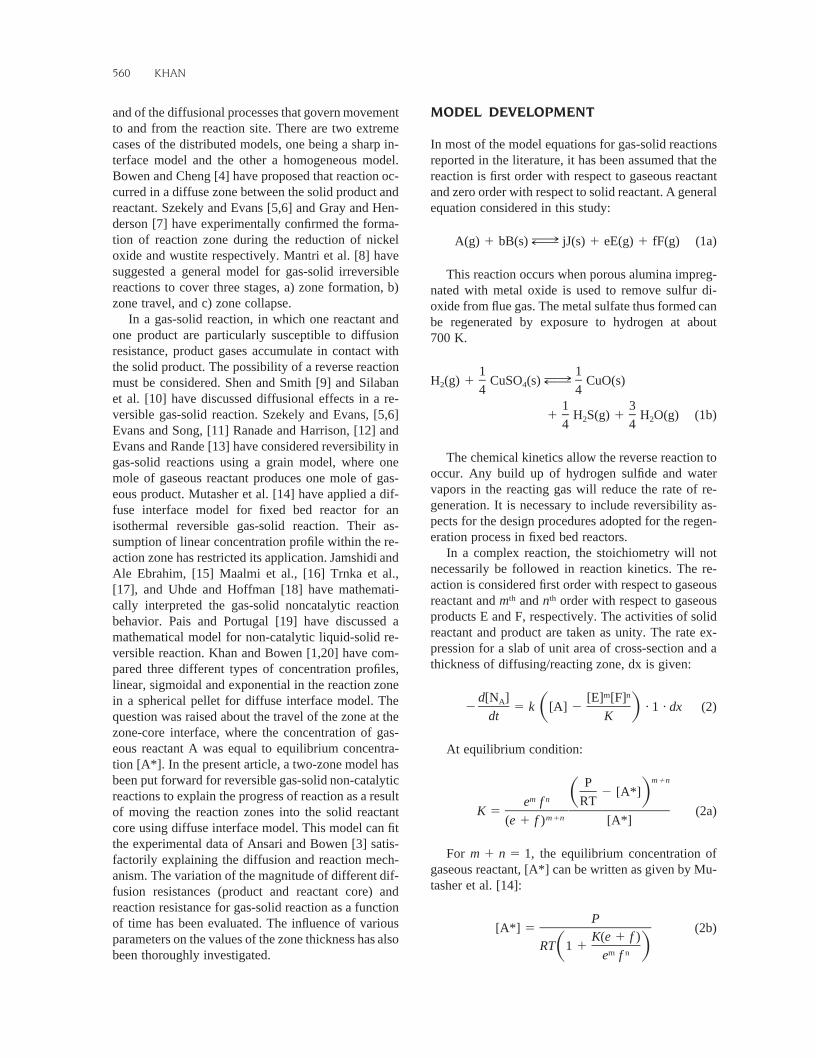
In most of the model equations for gas-solid reactionsreported in the literature, it has been assumed that thereaction is first order with respect to gaseous reactantand zero order with respect to solid reactant. A generalequation considered in this study:
A(g) 1 bB(s) VJ jJ(s) 1 eE(g) 1 fF(g) (1a)
This reaction occurs when porous alumina impreg-nated with metal oxide is used to remove sulfur di-oxide from flue gas. The metal sulfate thus formed canbe regenerated by exposure to hydrogen at about700 K.
1 1H (g) 1 CuSO (s) VJ CuO(s)2 44 4
1 31 H S(g) 1 H O(g) (1b)2 24 4
The chemical kinetics allow the reverse reaction tooccur. Any build up of hydrogen sulfide and watervapors in the reacting gas will reduce the rate of re-generation. It is necessary to include reversibility as-pects for the design procedures adopted for the regen-eration process in fixed bed reactors.
In a complex reaction, the stoichiometry will notnecessarily be followed in reaction kinetics. The re-action is considered first order with respect to gaseousreactant and mth and nth order with respect to gaseousproducts E and F, respectively. The activities of solidreactant and product are taken as unity. The rate ex-pression for a slab of unit area of cross-section and athickness of diffusing/reacting zone, dx is given:
m nd[N ] [E] [F]A2 5 k [A] 2 · 1 · dx (2)S Ddt K
At equilibrium condition:
m1nP2 [A*]S Dm n RTe f
K 5 (2a)m1n(e 1 f ) [A*]
For the equilibrium concentration ofm 1 n 5 1,gaseous reactant, [A*] can be written as given by Mu-tasher et al. [14]:
P[A*] 5 (2b)
K(e 1 f )RT 1 1S Dm ne f
560 KHAN
JCK(Wiley) LEFT BATCH
shortstandardlong
Combining equations (2 and 2a) results in:
d[N ]A2dt
m ne f5 k 1 1 ([A] 2 [A*]) dx (3)FS D GK(e 1 f )
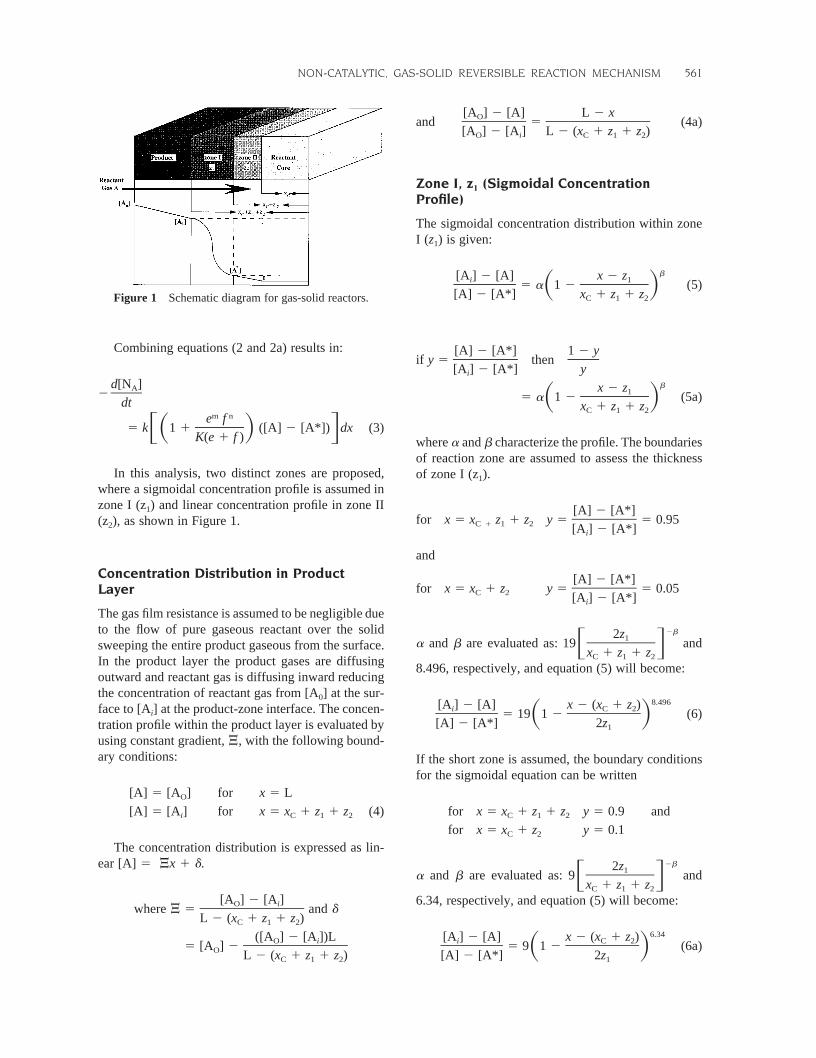
In this analysis, two distinct zones are proposed,where a sigmoidal concentration profile is assumed inzone I (z1) and linear concentration profile in zone II(z2), as shown in Figure 1.
Concentration Distribution in ProductLayer
The gas film resistance is assumed to be negligible dueto the flow of pure gaseous reactant over the solidsweeping the entire product gaseous from the surface.In the product layer the product gases are diffusingoutward and reactant gas is diffusing inward reducingthe concentration of reactant gas from [A0] at the sur-face to [Ai] at the product-zone interface. The concen-tration profile within the product layer is evaluated byusing constant gradient, J, with the following bound-ary conditions:
[A] 5 [A ] for x 5 LO
[A] 5 [A ] for x 5 x 1 z 1 z (4)i C 1 2
The concentration distribution is expressed as lin-ear [A] 5 Jx 1 d.
[A ] 2 [A ]O iwhere J 5 and dL 2 (x 1 z 1 z )C 1 2
([A ] 2 [A ])LO i5 [A ] 2O L 2 (x 1 z 1 z )C 1 2
[A ] 2 [A] L 2 xOand 5 (4a)[A ] 2 [A ] L 2 (x 1 z 1 z )O i C 1 2
Zone I, z1 (Sigmoidal ConcentrationProfile)
The sigmoidal concentration distribution within zoneI (z1) is given:
b[A ] 2 [A] x 2 zi 15 a 1 2 (5)S D[A] 2 [A*] x 1 z 1 zC 1 2
[A] 2 [A*] 1 2 yif y 5 then
[A ] 2 [A*] yi
bx 2 z15 a 1 2 (5a)S Dx 1 z 1 zC 1 2
where a and b characterize the profile. The boundariesof reaction zone are assumed to assess the thicknessof zone I (z1).
[A] 2 [A*]for x 5 x z 1 z y 5 5 0.95C 1 1 2 [A ] 2 [A*]i
and
[A] 2 [A*]for x 5 x 1 z y 5 5 0.05C 2 [A ] 2 [A*]i
a and b are evaluated as: and2b2z119F Gx 1 z 1 zC 1 2
8.496, respectively, and equation (5) will become:
8.496[A ] 2 [A] x 2 (x 1 z )i C 25 19 1 2 (6)S D[A] 2 [A*] 2z1
If the short zone is assumed, the boundary conditionsfor the sigmoidal equation can be written
for x 5 x 1 z 1 z y 5 0.9 andC 1 2
for x 5 x 1 z y 5 0.1C 2
a and b are evaluated as: and2b2z19F Gx 1 z 1 zC 1 2
6.34, respectively, and equation (5) will become:
6.34[A ] 2 [A] x 2 (x 1 z )i C 25 9 1 2 (6a)S D[A] 2 [A*] 2z1
NON-CATALYTIC, GAS-SOLID REVERSIBLE REACTION MECHANISM 561
JCK(Wiley) RIGHT BATCH
shortstandardlong
Figure 1 Schematic diagram for gas-solid reactors.
The concentration gradient can be expressed:
b21 bd[A] dy ab(x 1 2z 1 z 2 x) (x 1 z 1 z ) ([A ] 2 [A*])C 1 2 C 1 2 i2 5 ([A ] 2 [A*]) 5i x* b b 2dx dx (((x 1 z 1 z ) ) 1 a(x 1 2z 1 z 2 x) )x C 1 2 C 1 2
By substituting equation (6) in equation (3) the rate ofreaction in the zone I (z1) is given:
d[N ] x 1z 1zA C 1 22 5 Ex 1zdt C 2
m ne fk 1 1 ([A ] 2 [A*])S D iK(e 1 f )
dx (7)bx 2 (x 1 z )C 21 1 19 1 2S D2z1
The rate of diffusion in the product layer can beworked out by differentiating equation (4a):
d[A]2DP *x 1 z 1 zdx C 1 2
D ([A ] 2 [A ])P 0 i5 (8)L 2 (x 1 z 1 z )C 1 2
Diffusion within reaction zone can also be calcu-lated from the differentiation of the concentration pro-file within reaction zone:
d[A]2DP *x 1 z 1 zdx C 1 2
dy5 D ([A ] 2 [A*])P i *x 1 z 1 zdx C 1 2
dywhere *x 1 z 1 zdx C 1 2
b21 babz (x 1 z 1 z )1 C 1 25 andb b 2((x 1 z 1 z ) 1 az )C 1 2 1
d[A]2DP *x 1 z 1 zdx C 1 2
b21 bD abz (x 1 z 1 z ) ([A ] 2 [A*])P 1 C 1 2 i5 (9)b b 2((x 1 z 1 z ) 1 a z )C 1 2 1
Zone II, z2 (Linear Profile)
For zone II (z2) the concentration profile within thiszone is assumed to be linear and can be written:
d[A]2DC *x 1 zdx C 2
dy5 D P([A ] 2 [A*])C i *x 1 zdx C 2
[A*]5 D (10)C z2
Equating rate of diffusion at the zone I (z1)-zone II(z2) interface to the rate of diffusion in zone II (z2):
b21 bdy ab(2z ) (x 1 z 1 z )1 C 1 25 (11)* b b 2x 1 zdx ((x 1 z 1 z ) 1 a(2z ) )C 2 C 1 2 1
[A*]D 5C z2
b21 bD ab(2z ) (x 1 z 1 z ) ([A ] 2 [A*])C 1 C 1 2 i
b b 2((x 1 z 1 z ) 1 a(2z ) )C 1 2 1
and z2 can be evaluated:
b b 2((x 1 z 1 z ) 1 a(2z ) ) [A*]C 1 2 1z 5 (12)2 b21 bab(2z ) (x 1 z 1 z ) ([A ] 2 [A*])1 C 1 2 i
a, z1, z2, and [Ai] can be calculated by solving equa-tions (7, 8, 9, and 12) simultaneously, where the rateof diffusion is considered equal to the rate of reactionat steady state. The concentration change from [AO] atthe surface of the solid to zero at x equal to(x 5 L)L and xC, is due to different types of resistance, productdiffusion, chemical reaction, and core diffusion. Thiswork illustrates how these values of resistance con-tribute to the overall reaction with the lapse of time.The general modified form of the diffuse interfacemodel for reversible gas-solid noncatalytic reaction inconjunction with the experimental data of Ansari and
562 KHAN
JCK(Wiley) LEFT BATCH
shortstandardlong
Bowen [3] is used to rectify some of the assumptionsintroduced by Mutasher et al. [14]
([A ] 2 O)O Concentration change/[molar rate]2dN /dtA
m n 21e fk 1 1S DK(ee 1 f)L 2 (x 1 z 1 z ) xx 1 z 1 zC 1 2 2C 1 25 1 dx 1 (13)E bx 1 z x 2 (x 1 z )D C 2 DS H J DC 2P C1 1 19 1 2S D2z1
(Product Layer) (Chemical Reaction) (Core)
These three resistance terms are additive and over-all cumulative value represents the total resistance forgas-solid reaction of the type discussed here. Theproduct layer builds up with the progress of reaction,increasing the diffusional resistance, while the resist-ance values due to chemical reaction and core diffu-sion are constant (weak function of time).
The travel of zone within solid reactant in the cubedpellet is explained in terms of the diffusion of the re-actant and product gases. The influence of various pa-rameters, equilibrium constant K, velocity constant k,diffusional coefficients, DP, DC and the order of reac-tion with respect to gaseous product m and n has beeninvestigated thoroughly.
RESULT AND DISCUSSION
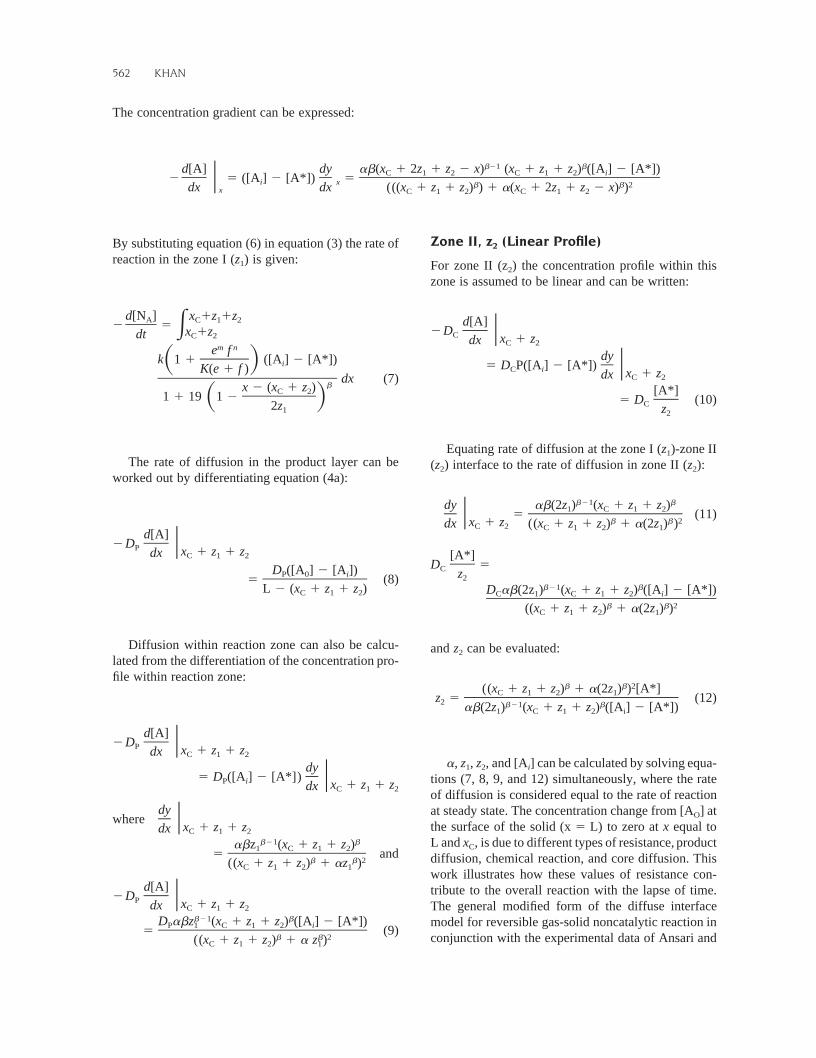
Mutasher et al. [14] and Khan and Bowen [1] havedeveloped a mathematical model for gas-solid non-catalytic reaction in a spherical geometry based on thediffuse interface concept. Different types of concen-tration profiles within the reaction zone—linear, sig-moidal and exponential—have been proposed, thesigmoidal case being shown in Figure 2. The reactantgas concentration is [Ai] at and [A*] atr 1 zC
rC in a spherical pellet. In this earlier version, lack ofreaction in the unreacted core is due to the fact thatthe reactant and product gases permeate the core at theequilibrium concentration. However, in those circum-stances it is difficult to define a driving force whichwill cause the reaction zone to move inwards as thereaction progresses, since there is no concentrationgradient in the core. In the present work, the reactionzone for a simple geometrical shape (cuboid) has beenconsidered. An additional zone is introduced throughwhich the equilibrium concentration, postulated forthe zone-core interface in the earlier model, falls tozero. As the reaction proceeds, the zones, which areof constant width, travel from one end of the slab. AtxC, where the concentration of gaseous reactant A isnegligible, it diffuses into the reactant core with thelapse of time, whereas at the concentration ofx 1 zC 2
reactant gas A is [A*]. In zone II a constant concen-tration gradient exists equivalent to ([A*]/z2) facilitat-ing the mass transport of gaseous reactant A into thereaction core. The concentration of reactant A at
is [Ai] and in the bulk of gaseous phasex 1 z 1 zC 1 2
is [AO]. Pure gas A is considered in this model devel-opment so that the external gaseous film resistance canbe ignored. The process of diffusion of gaseous reac-tant A in the core is controlled by diffusional coeffi-cient of solid reactant core, DC.
At the start of the reaction the solid reactant(t 5 0)was in a nitrogen (inert) atmosphere and was exposedto the gaseous reactant A. The forward reaction initi-ated the formation of the zones followed by the prod-uct layer. The inert gas was gradually removed byfresh reactant gas, A at xC, diffusing deep in the core.At interface the equilibrium concentrations ofx 1 zC 2
reactant and product gases let these gases to diffuseinto core replacing the inert gas. In zone II (z2) theforward reaction is mainly dominant due to the scar-city of the solid product. The product gases diffuseoutward to the product layer. The first plateau in Fig-
NON-CATALYTIC, GAS-SOLID REVERSIBLE REACTION MECHANISM 563
JCK(Wiley) RIGHT BATCH
shortstandardlong
Figure 2 Zone travel during the progression of the reactionin spherical pellet.
ure 5 in the breakthrough curves is presumably due tothe reversible reaction. The product layer borders withzone I (z1) followed by zone II (z2) approaching thereaction core. The second plateau is corresponding tothe completion of the irreversible reaction where allthe product gases are swept by the diffusion of freshreactant gas for large finite time.
At the start of the reaction the solid reactant(t 5 0)was in nitrogen (inert) atmosphere and was exposedto the gaseous reactant A. The forward reaction initi-ated the formation of the zones followed by the prod-uct layer. The inert gas was gradually removed byfresh reactant gas, A at xC, diffusing deep in the core.At interface, the equilibrium concentrationsX 1 zC 2
of reactant and product gases let these gases to diffuseinto core replacing the inert gas. In zone II (z2) theforward reaction is mainly dominant due to the scar-city of the solid product. The product gases diffuse
outward to the product layer. The first plateau in Fig-ure 5 in the breakthrough curves is presumably due tothe reversible reaction. The product layer borders withzone I (z1) followed by zone II (z2) approaching thereactant core. The second plateau is corresponding tothe completion of the irreversible reaction where allthe product gases are swept by the diffusion of freshreactant gas for large finite time.
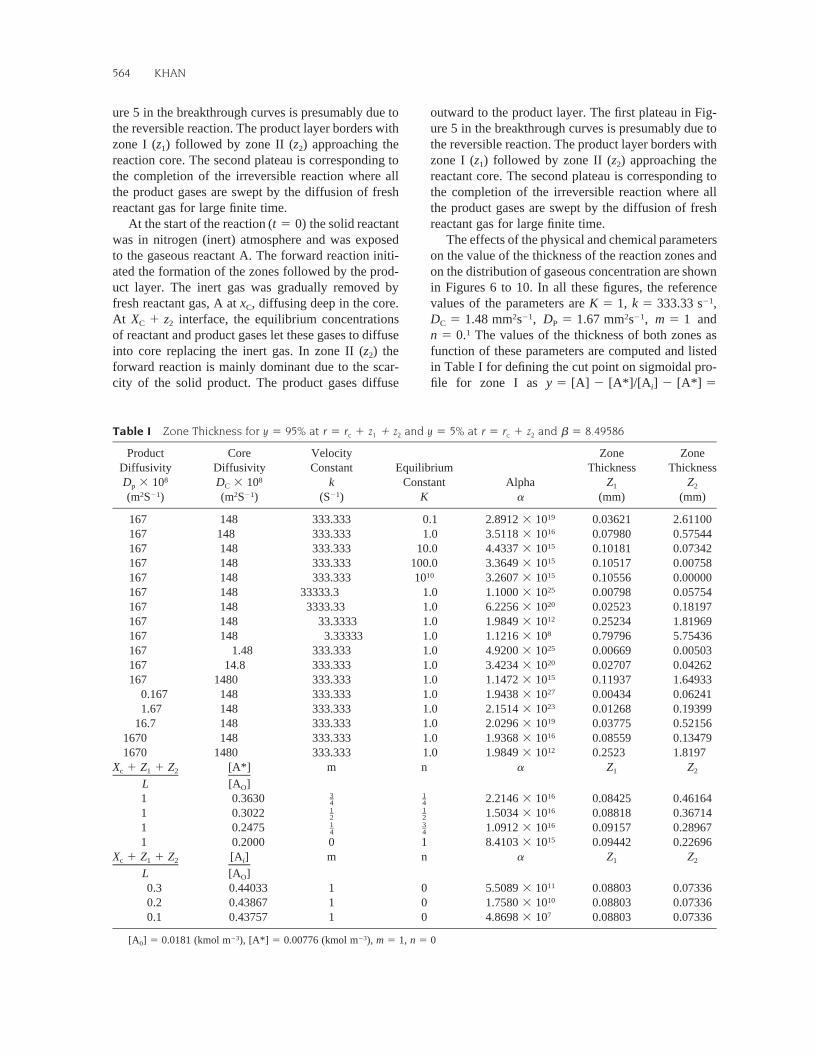
The effects of the physical and chemical parameterson the value of the thickness of the reaction zones andon the distribution of gaseous concentration are shownin Figures 6 to 10. In all these figures, the referencevalues of the parameters are 21K 5 1, k 5 333.33 s ,
and2 21 2 21D 5 1.48 mm s , D 5 1.67 mm s , m 5 1C P
The values of the thickness of both zones as1n 5 0.function of these parameters are computed and listedin Table I for defining the cut point on sigmoidal pro-file for zone I as y 5 [A] 2 [A*]/[A ] 2 [A*] 5i
564 KHAN
JCK(Wiley) LEFT BATCH
shortstandardlong
Table I Zone Thickness for at and at andy 5 95% r 5 r 1 z 1 z y 5 5% r 5 r 1 z b 5 8.49586c 1 2 c 2
ProductDiffusivity
8D 3 10p
CoreDiffusivity
8D 3 10C
VelocityConstant
kEquilibrium
ConstantK
Alphaa
ZoneThickness
Z1
ZoneThickness
Z22 21(m S ) 2 21(m S ) 21(S ) (mm) (mm)
167 148 333.333 0.1 192.8912 3 10 0.03621 2.61100167 148 333.333 1.0 163.5118 3 10 0.07980 0.57544167 148 333.333 10.0 154.4337 3 10 0.10181 0.07342167 148 333.333 100.0 153.3649 3 10 0.10517 0.00758167 148 333.333 1010 153.2607 3 10 0.10556 0.00000167 148 33333.3 1.0 251.1000 3 10 0.00798 0.05754167 148 3333.33 1.0 206.2256 3 10 0.02523 0.18197167 148 33.3333 1.0 121.9849 3 10 0.25234 1.81969167 148 3.33333 1.0 81.1216 3 10 0.79796 5.75436167 1.48 333.333 1.0 254.9200 3 10 0.00669 0.00503167 14.8 333.333 1.0 203.4234 3 10 0.02707 0.04262167 1480 333.333 1.0 151.1472 3 10 0.11937 1.64933
0.167 148 333.333 1.0 271.9438 3 10 0.00434 0.062411.67 148 333.333 1.0 232.1514 3 10 0.01268 0.19399
16.7 148 333.333 1.0 192.0296 3 10 0.03775 0.521561670 148 333.333 1.0 161.9368 3 10 0.08559 0.134791670 1480 333.333 1.0 121.9849 3 10 0.2523 1.8197
X 1 Z 1 Zc 1 2
L
[A*]
[A ]O
m n a Z1 Z2
1 0.3630 34
14
162.2146 3 10 0.08425 0.461641 0.3022 1
212
161.5034 3 10 0.08818 0.367141 0.2475 1
434
161.0912 3 10 0.09157 0.289671 0.2000 0 1 158.4103 3 10 0.09442 0.22696
X 1 Z 1 Zc 1 2
L
[A ]i[A ]O
m n a Z1 Z2
0.3 0.44033 1 0 115.5089 3 10 0.08803 0.073360.2 0.43867 1 0 101.7580 3 10 0.08803 0.073360.1 0.43757 1 0 74.8698 3 10 0.08803 0.07336
(kmol (kmol23 23[A ] 5 0.0181 m ), [A*] 5 0.00776 m ), m 5 1, n 5 00
0.95 at and y is equal to 0.005 atx 1 z 1 z x 1C 1 2 C
For short zone the variation of the values of thez .2
thickness for both zones is expressed in terms of theseparameters for using cut point on sigmoidal profile forzone I as aty 5 [A] 2 [A*]/[A ] 2 [A*] 5 0.9i
andx 1 z 1 z y 5 [A] 2 [A*]/[A ] 2 [A*] 5C 1 2 i
at in Table II.0.1 x 1 zC 2
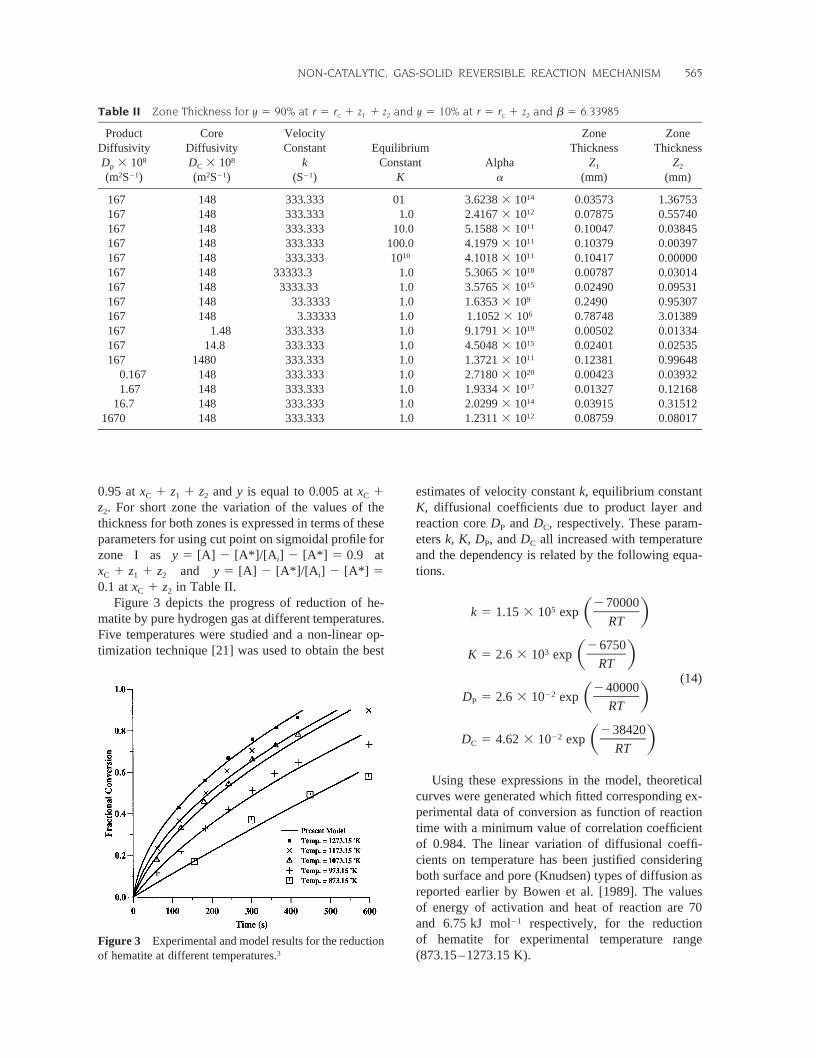
Figure 3 depicts the progress of reduction of he-matite by pure hydrogen gas at different temperatures.Five temperatures were studied and a non-linear op-timization technique [21] was used to obtain the best
estimates of velocity constant k, equilibrium constantK, diffusional coefficients due to product layer andreaction core DP and DC, respectively. These param-eters k, K, DP, and DC all increased with temperatureand the dependency is related by the following equa-tions.
2700005k 5 1.15 3 10 exp S DRT
267503K 5 2.6 3 10 exp
(14)
S DRT
24000022D 5 2.6 3 10 expP S DRT
23842022D 5 4.62 3 10 expC S DRT
Using these expressions in the model, theoreticalcurves were generated which fitted corresponding ex-perimental data of conversion as function of reactiontime with a minimum value of correlation coefficientof 0.984. The linear variation of diffusional coeffi-cients on temperature has been justified consideringboth surface and pore (Knudsen) types of diffusion asreported earlier by Bowen et al. [1989]. The valuesof energy of activation and heat of reaction are 70and respectively, for the reduction216.75 kJ molof hematite for experimental temperature range(873.15–1273.15 K).
NON-CATALYTIC, GAS-SOLID REVERSIBLE REACTION MECHANISM 565
JCK(Wiley) RIGHT BATCH
shortstandardlong
Table II Zone Thickness for at and at andy 5 90% r 5 r 1 z 1 z y 5 10% r 5 r 1 z b 5 6.33985c 1 2 c 2
ProductDiffusivity
8D 3 10p
CoreDiffusivity
8D 3 10C
VelocityConstant
kEquilibrium
ConstantK
Alphaa
ZoneThickness
Z1
ZoneThickness
Z22 21(m S ) 2 21(m S ) 21(S ) (mm) (mm)
167 148 333.333 01 143.6238 3 10 0.03573 1.36753167 148 333.333 1.0 122.4167 3 10 0.07875 0.55740167 148 333.333 10.0 115.1588 3 10 0.10047 0.03845167 148 333.333 100.0 114.1979 3 10 0.10379 0.00397167 148 333.333 1010 114.1018 3 10 0.10417 0.00000167 148 33333.3 1.0 185.3065 3 10 0.00787 0.03014167 148 3333.33 1.0 153.5765 3 10 0.02490 0.09531167 148 33.3333 1.0 91.6353 3 10 0.2490 0.95307167 148 3.33333 1.0 61.1052 3 10 0.78748 3.01389167 1.48 333.333 1.0 199.1791 3 10 0.00502 0.01334167 14.8 333.333 1.0 154.5048 3 10 0.02401 0.02535167 1480 333.333 1.0 111.3721 3 10 0.12381 0.99648
0.167 148 333.333 1.0 202.7180 3 10 0.00423 0.039321.67 148 333.333 1.0 171.9334 3 10 0.01327 0.12168
16.7 148 333.333 1.0 142.0299 3 10 0.03915 0.315121670 148 333.333 1.0 121.2311 3 10 0.08759 0.08017
Figure 3 Experimental and model results for the reductionof hematite at different temperatures.3
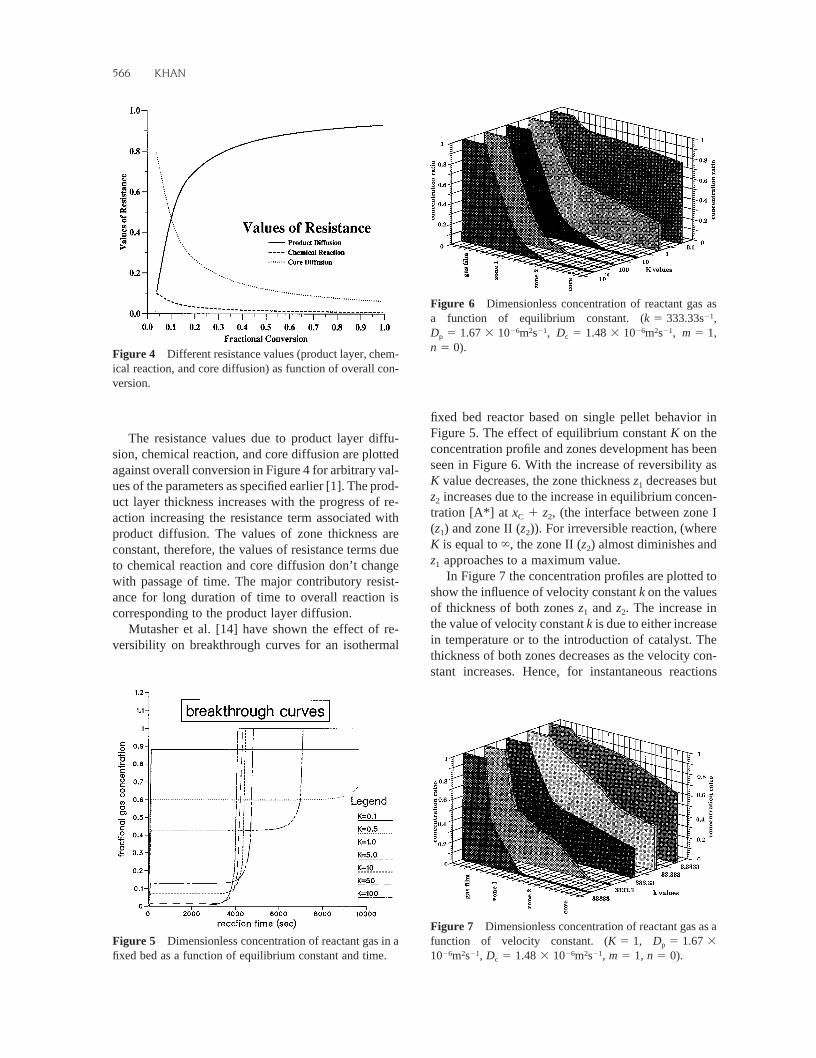
The resistance values due to product layer diffu-sion, chemical reaction, and core diffusion are plottedagainst overall conversion in Figure 4 for arbitrary val-ues of the parameters as specified earlier [1]. The prod-uct layer thickness increases with the progress of re-action increasing the resistance term associated withproduct diffusion. The values of zone thickness areconstant, therefore, the values of resistance terms dueto chemical reaction and core diffusion don’t changewith passage of time. The major contributory resist-ance for long duration of time to overall reaction iscorresponding to the product layer diffusion.
Mutasher et al. [14] have shown the effect of re-versibility on breakthrough curves for an isothermal
fixed bed reactor based on single pellet behavior inFigure 5. The effect of equilibrium constant K on theconcentration profile and zones development has beenseen in Figure 6. With the increase of reversibility asK value decreases, the zone thickness z1 decreases butz2 increases due to the increase in equilibrium concen-tration [A*] at (the interface between zone Ix 1 z ,C 2
(z1) and zone II (z2)). For irreversible reaction, (whereK is equal to `, the zone II (z2) almost diminishes andz1 approaches to a maximum value.
In Figure 7 the concentration profiles are plotted toshow the influence of velocity constant k on the valuesof thickness of both zones z1 and z2. The increase inthe value of velocity constant k is due to either increasein temperature or to the introduction of catalyst. Thethickness of both zones decreases as the velocity con-stant increases. Hence, for instantaneous reactions
566 KHAN
JCK(Wiley) LEFT BATCH
shortstandardlong
Figure 4 Different resistance values (product layer, chem-ical reaction, and core diffusion) as function of overall con-version.
Figure 5 Dimensionless concentration of reactant gas in afixed bed as a function of equilibrium constant and time.
Figure 6 Dimensionless concentration of reactant gas asa function of equilibrium constant. 21(k 5 333.33s ,
26 2 21 26 2 21D 5 1.67 3 10 m s , D 5 1.48 3 10 m s , m 5 1,p c
n 5 0).
Figure 7 Dimensionless concentration of reactant gas as afunction of velocity constant. (K 5 1, D 5 1.67 3p
26 2 21 26 2 2110 m s , D 5 1.48 3 10 m s , m 5 1, n 5 0).c
(diffusion control processes), the assumptions ofshrinking core, sharp interface can be safely applied.For slow reactions (reaction control processes), bothzones are of distinct thickness and simple sharp inter-face and shrinking core concepts are no longer appli-cable.
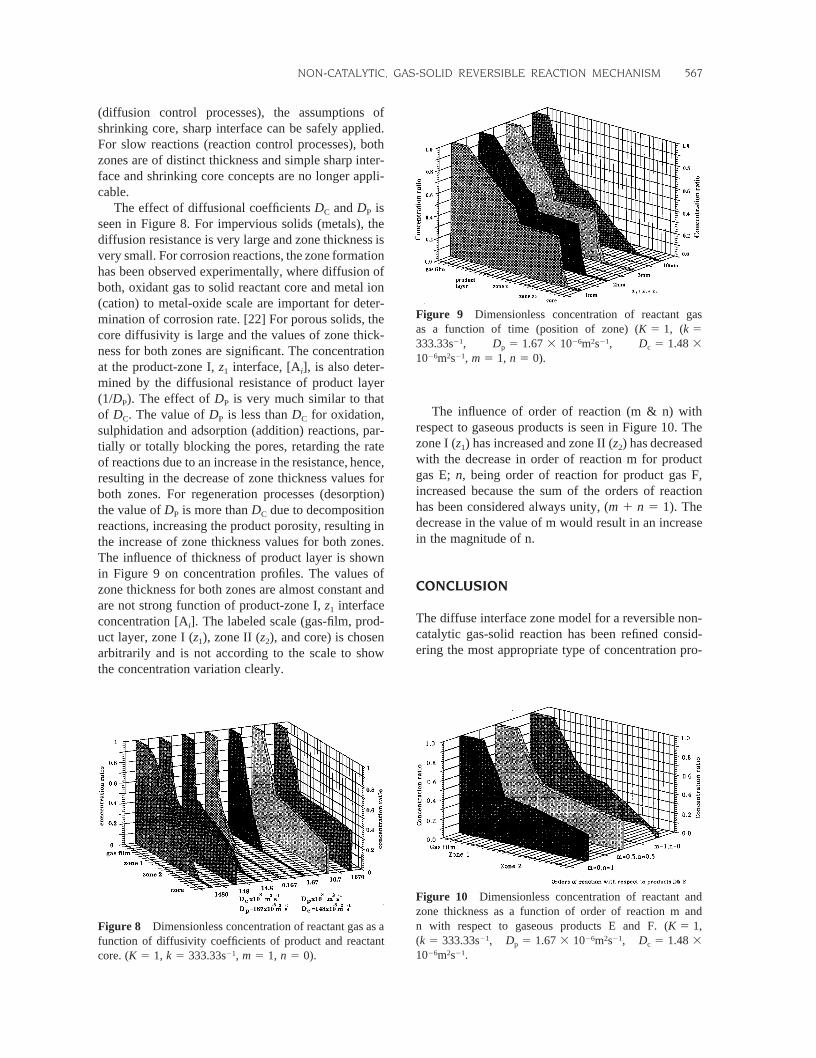
The effect of diffusional coefficients DC and DP isseen in Figure 8. For impervious solids (metals), thediffusion resistance is very large and zone thickness isvery small. For corrosion reactions, the zone formationhas been observed experimentally, where diffusion ofboth, oxidant gas to solid reactant core and metal ion(cation) to metal-oxide scale are important for deter-mination of corrosion rate. [22] For porous solids, thecore diffusivity is large and the values of zone thick-ness for both zones are significant. The concentrationat the product-zone I, z1 interface, [Ai], is also deter-mined by the diffusional resistance of product layer(1/DP). The effect of DP is very much similar to thatof DC. The value of DP is less than DC for oxidation,sulphidation and adsorption (addition) reactions, par-tially or totally blocking the pores, retarding the rateof reactions due to an increase in the resistance, hence,resulting in the decrease of zone thickness values forboth zones. For regeneration processes (desorption)the value of DP is more than DC due to decompositionreactions, increasing the product porosity, resulting inthe increase of zone thickness values for both zones.The influence of thickness of product layer is shownin Figure 9 on concentration profiles. The values ofzone thickness for both zones are almost constant andare not strong function of product-zone I, z1 interfaceconcentration [Ai]. The labeled scale (gas-film, prod-uct layer, zone I (z1), zone II (z2), and core) is chosenarbitrarily and is not according to the scale to showthe concentration variation clearly.
The influence of order of reaction (m & n) withrespect to gaseous products is seen in Figure 10. Thezone I (z1) has increased and zone II (z2) has decreasedwith the decrease in order of reaction m for productgas E; n, being order of reaction for product gas F,increased because the sum of the orders of reactionhas been considered always unity, The(m 1 n 5 1).decrease in the value of m would result in an increasein the magnitude of n.
CONCLUSION
The diffuse interface zone model for a reversible non-catalytic gas-solid reaction has been refined consid-ering the most appropriate type of concentration pro-
NON-CATALYTIC, GAS-SOLID REVERSIBLE REACTION MECHANISM 567
JCK(Wiley) RIGHT BATCH
shortstandardlong
Figure 8 Dimensionless concentration of reactant gas as afunction of diffusivity coefficients of product and reactantcore. 21(K 5 1, k 5 333.33s , m 5 1, n 5 0).
Figure 9 Dimensionless concentration of reactant gasas a function of time (position of zone) (K 5 1, (k 5
21 26 2 21333.33s , D 5 1.67 3 10 m s , D 5 1.48 3p c26 2 2110 m s , m 5 1, n 5 0).
Figure 10 Dimensionless concentration of reactant andzone thickness as a function of order of reaction m andn with respect to gaseous products E and F. (K 5 1,
21 26 2 21(k 5 333.33s , D 5 1.67 3 10 m s , D 5 1.48 3p c26 2 2110 m s .
files. A successful attempt has been made to explainthe mechanism for progression of reaction reflectingthe movement of zones deep into the reaction core ina Cartesian geometry (cubed slab). It is suggested thatin zone I (z1) both forward and reversible reactionsoccur, while in zone II (z2) it is mainly forward reac-tion due to the deficiency of the product gases. Eitherreaction resistance or diffusion resistance determinesthe extent of reaction. The reaction resistance has beencomplicated due to the reversibility of chemical reac-tion and diffusion resistance has been affected becauseof the formation of the product layer.
The model has been used to access the relative im-portance of diffusion in the product layer, chemicalreaction, and core diffusion. Initially, the rate of re-action is controlled by core diffusion and by chemicalreaction. Later, as the reaction zones are formed andbegin to move inwards, diffusion of hydrogen throughsolid product layer to the reaction zones becomes animportant factor. The numerically evaluated values fordiffusional coefficients for product layer and reactioncore suggest a combination of pore (Knudsen) andbulk gas diffusion during the reduction process asfunction of temperature. The true values of the energyof activation and heat of reaction are computed for thetemperature range and are represented873–1273 Kby equation (14).
The influence of various parameters, equilibriumconstant K, velocity constant k, diffusional coefficientsDC and DP, and orders of reaction due to gaseous prod-ucts m & n, on the concentration profiles and the val-ues of zone thickness for both suggested zones, hasbeen studied by varying most of these variables 1000-fold. The orders of reaction have been varied fraction-ally between one and zero so that the sum of these
orders is always unity, The different(m 1 n 5 1).combinations of m and n, orders of reaction with re-spect to gaseous products E and F, which have been
investigated, are3 1 1 1 1 1 3
1 & 0, & , , & , & ,S 4 4 4 2 2 4 4The variation of concentration is ex-and 0 & 1 .D
pressed as a fraction of gaseous bulk concentration,[A]/[AO] and the effect of all the variables K, k, DP,and DC on the overall conversion for other geometricalshapes is subject of continued research.
The values of the thickness of zone I (z1) and zoneII (z2) have not been influenced by the product layerformation. The effect of product layer growth is shownin Figure 7. As the reaction proceeds the product layergrows thicker, decreasing the product layer-zone I (z1)interface concentration, [Ai]. The concentration distri-bution is linear from [AO] to [Ai] in this layer with aconstant gradient J. The values of thickness of zoneI, z1 and zone II, z2 are not a strong function of productlayer growth and product layer-zone I, interface con-centration, [Ai]. These results are consistent with theearlier calculated values of zone thickness reported inBowen et al. [1989].
The contribution of various types of resistance in-volved during gas-solid reactions, product layer dif-fusion, chemical reaction and core diffusion has beeninvestigated as function of reaction time for arbitraryselected values. [1] At the start of the reaction, the corediffusion and chemical reaction resistances are con-tributing for the overall conversion. For the case ofhalf-life time, the values of the product layer, reactionresistance, and core diffusion resistance are 86.5, 1.5and 13%, respectively. The product layer diffusionalresistance becomes the major contributory factor dur-ing the later part of reaction.
568 KHAN
JCK(Wiley) LEFT BATCH
shortstandardlong
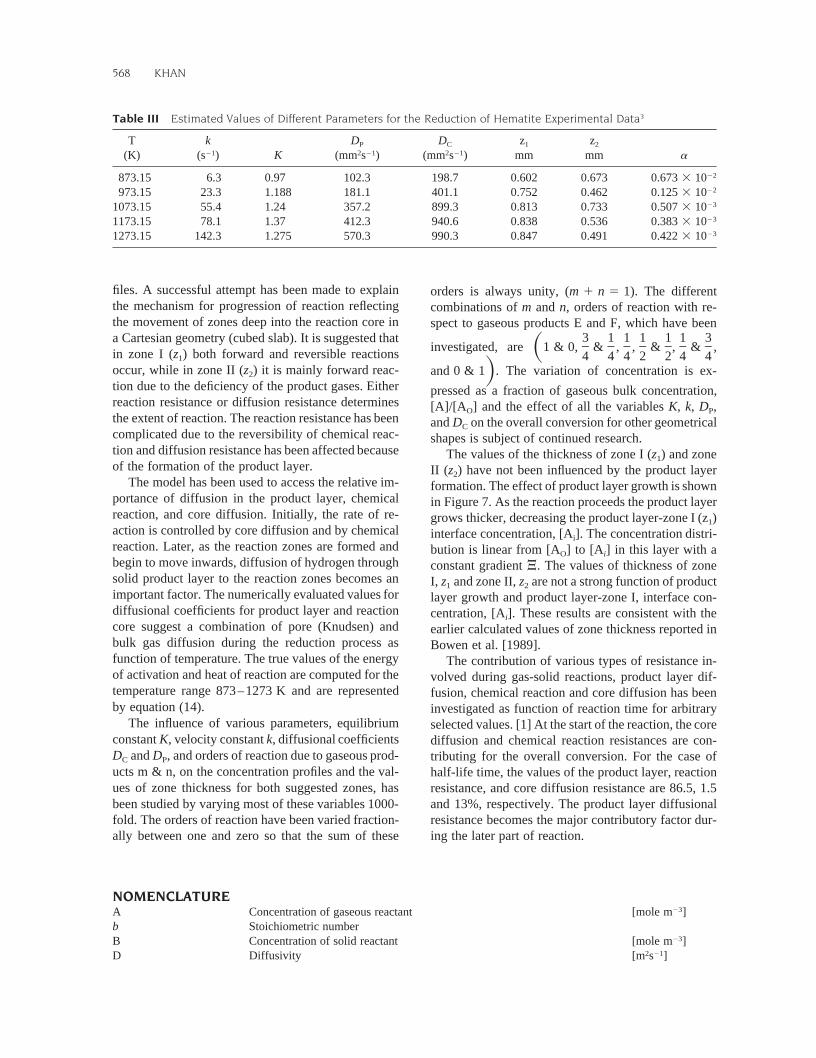
Table III Estimated Values of Different Parameters for the Reduction of Hematite Experimental Data3
T(K)
k21(s ) K
DP2 21(mm s )
DC2 21(mm s )
z1
mmz2
mm a
873.15 6.3 0.97 102.3 198.7 0.602 0.673 220.673 3 10973.15 23.3 1.188 181.1 401.1 0.752 0.462 220.125 3 10
1073.15 55.4 1.24 357.2 899.3 0.813 0.733 230.507 3 101173.15 78.1 1.37 412.3 940.6 0.838 0.536 230.383 3 101273.15 142.3 1.275 570.3 990.3 0.847 0.491 230.422 3 10
NOMENCLATUREA Concentration of gaseous reactant 23[mole m ]b Stoichiometric numberB Concentration of solid reactant 23[mole m ]D Diffusivity 2 21[m s ]
NON-CATALYTIC, GAS-SOLID REVERSIBLE REACTION MECHANISM 569
JCK(Wiley) RIGHT BATCH
shortstandardlong
e Stoichiometric numberE Concentration of gaseous product 23[mole m ]f Stoichiometric numberF Concentration of gaseous product 23[mole m ]j Stoichiometric number for solid productJ Concentration of solid product 23[mole m ]k Velocity constant 21(s )K Equilibrium constantL Total length of solid reactant slab (m)m Order of reaction with respect of gaseous product, En Order of reaction with respect to gaseous product, Fx Position in the solid reactant slaby Dimensionless concentration as given in Equation 5az Reaction zone thickness (m)
Greek lettersa coefficient in equation 5b coefficient in equation 5d coefficient in equation 4J coefficient in equation 4
Subscript and Superscript1 Reaction zone 12 Reaction zone 2c Core (solid reactant)i interfaceo bulk gas phasep solid product* Equilibrium
BIBLIOGRAPHY
1. Khan, A. R.; Bowen, J. H. A Theoretical Analysis ofReaction Zone Thickness and Concentration Profile inNon-Catalytic, Gas-Solid Reactions; Chem Eng ResDes 1992, 70, 265–275.
2. Prasannan, P. C.; Doraswamy, L. K. Gas-Solid Reac-tions: Experimental Evaluations of Zone Model; ChemEng Sci 1982, 37, 925–937.
3. Ansari, Q. A. K.; Bowen, J. H. Model of Reduction byHydrogen of Powdered Hematite; Trans Inst Min Met1985, (Section C: Mineral Process Extr. Metall.) 94,89–95.
4. Bowen, J. H.; Cheng, C. K. A Diffuse Interface ModelFluid-Solid Reaction; Chem Eng Sci 1969, 24, 1829–1931.
5. Szekely, J.; Evans, J. W. A Structural Model for Gas-Solid Reactions with a Moving Boundary, I; Chem EngSci 1970, 25, 1091–1107.
6. Szekely, J.; Evans, J. W. A Structural Model for Gas-Solid Reactions with a Moving Boundary, II; Chem EngSci 1971, 26, 1901–1913.
7. Gray, N. B.; Henderson, J. Hydrogen Reduction ofDense Hematites; Trans Met Soc, AIME 1966, 1213–1217.
8. Mantri, V. B.; Gokran, A. N.; Doraiswamy, L. K. Anal-ysis of Gas-Solid Reactions: Formulation of a GeneralModel; Chem Eng Sci 1976, 31, 779–786.
9. Shen, J.; Smith, J. M. Diffusional Effects in Gas-SolidReactions; Ind Eng Chem Fund 1965, 4, 293–301.
10. Silaban, A.; Narcida, M.; Harrison, D. P. Characteristicsof the Reversible Reaction Between CO2 (g) andCalcined Dolomite; Chem Eng Cumm 1996, 146, 149–162.
11. Evans, J. W.; Song, S. Application of Porous PelletModel to Fixed, Moving, and Fluidized Bed Gas-SolidReactors; Ind Eng Chem Process Des Dev 1972, 13,146–152.
12. Ranade, P. V.; Harrison, D. P. The Grain Model Appliedto Porous Solids with Varying Structural Properties;Chem Eng Sci 1979, 34, 427–432.
13. Evans, J. W.; Ranade, M. G. The Grain Model for Re-action Between a Gas and Porous Solid—a Refined Ap-proximate Solution to the Equations; Chem Eng Sci1980, 35, 1261–1262.
14. Mutasher, E. I.; Khan, A. R.; Bowen, J. H. Reversible,Non-Catalytic Reactions Between Gases and Solids inFixed Beds; Ind Eng Chem Res Dev 1989, 28, 1550–1553.
15. Jamshidi, I.; Ale, Ebrahim, H. New Solution Technique
of Moving Boundary Problems for Gas-Solid Reactions;Application to Half Order Volume Reaction Model;Chem Eng J 1996, 63, 79–83.
16. Maalmi, M.; Strieder, W. C.; Varma, A. SpatiotemporalEvaluation of Conversion and Selectivity for Simulta-neous Non-Catalytic Gas-Solid Reactions in a Compactof Particles; Ind Eng Chem Res 1997, 36, 1470–1479.
17. Trnka, O.; Hartman, M.; Svoboda, K. An AlternativeSemi-Implicit Method for the Integration of Highly StiffNonlinear Differential Equations; Comput Chem Eng1997, 21, 277–282.
18. Uhde, G.; Hoffmann, V. Non-Catalytic Gas-Solid Re-actions: Modeling of Simultaneous Reactions and For-mation of Surface with a Non-Isothermal Cracking CoreModel; Chem Eng Sci 1997, 52, 1045–1054.
19. Pais, F. I. C. C.; Portugal, A. A. T. G. A MathematicalModel for Non-Catalytic Liquid-Solid Reversible Re-actions; Comput Chem Eng 1998, 22, 459–474.
20. Khan, A. R.; Bowen, J. H. Analysis of Fixed Bed Re-actor Using a Diffusive Interface Single Pellet Model.1999.
21. Rosenbrock, H. H. An Automatic Method for Findingthe Greatest or Least Value of the Function; Comput J1960, 3, 175–183.
22. Khan, A. R.; Al-Hajji, J. N.; Reda, M. R. GeneralizedDiffuse Interface Model for Determination of KineticsParameters in High Temperature Internal Corrosion(Gas/Solid Reaction); Int J Chem Kinet 1998, 30, 903–912.
570 KHAN
JCK(Wiley) LEFT BATCH
shortstandardlong