
Non-Performing Assets and its importance with reference to ...
19
1 International E Conference on Adapting to the New Business Normal – The way ahead December 3-4, 2020 Mysuru, India ISBN: 978-93-83302-47-5 Non-Performing Assets and its importance with reference to Axis Bank Ltd, Mumbai Prof. Saptarshi D Mukherjee Asst. Professor, KLES’s IMSR, Hubli Email:[email protected] Mr. Sachin A Phirangi Student, KLES’s IMSR, Hubli Email: [email protected] Abstract: To improve the efficiency and profitability of the banks the NPA need to be reduced and controlled. Reduced NPA generally indicate that the credit appraisal process has been strengthened and growth in NPA indicate the need for maintain provision in the balance sheet which will affect the profitability of the banks. “Dr.T.B Gurumoorthy, B. Sudha volume:2| Issue:2|November 2012|ISSN -2249-555X (The non- performance or non-receipt of interest and principal blocked banks money in the form of funds and is not available for further use of banking business and thus the profit margin of the banks goes down)”. It shows the magnitude of NPAs is increasing in the private sector and the public sector banks. The connection bank must be aware of the problems and recovery of NPAs and Bank should maintain zero level of NPA which prevents fresh flow of NPA and helps them to recovery of existing heavy stock of NPA’s. “Salini R Chandran, K. Alamelu volume:8| Issue:2S6, ISSN: 2277-3878 (The main reason for this was willful default from the borrowers and the study will be realistic suggestions on improving asset quality of banks in India)”.Usually NPA is broadly defined as one with interest or principal repayment installment unpaid for more than 90 days prior to 1993 . Axis Bank should concentrate more on 1. Credit Appraisal 2. Risk Management 3. Recoveries of loan amount 4. Monitoring Credit appraisal is assessing the credit worthiness or repayment capacity of specific borrowers with main focus on his/her ability and their intention is to pay back his/her loan amount. Banks
-
Upload
khangminh22 -
Category
Documents
-
view
4 -
download
0
Transcript of Non-Performing Assets and its importance with reference to ...
1
International E Conference on Adapting to the New Business Normal – The way ahead
December 3-4, 2020 Mysuru, India
ISBN: 978-93-83302-47-5
Non-Performing Assets and its importance with reference to Axis
Bank Ltd, Mumbai
Prof. Saptarshi D Mukherjee Asst. Professor,
KLES’s IMSR, Hubli
Email:[email protected]
Mr. Sachin A Phirangi Student,
KLES’s IMSR, Hubli
Email: [email protected]
Abstract:
To improve the efficiency and profitability of the banks the NPA need to be reduced and
controlled. Reduced NPA generally indicate that the credit appraisal process has been
strengthened and growth in NPA indicate the need for maintain provision in the balance sheet
which will affect the profitability of the banks. “Dr.T.B Gurumoorthy, B. Sudha volume:2|
Issue:2|November 2012|ISSN -2249-555X (The non- performance or non-receipt of interest and
principal blocked banks money in the form of funds and is not available for further use of
banking business and thus the profit margin of the banks goes down)”. It shows the magnitude
of NPAs is increasing in the private sector and the public sector banks. The connection bank
must be aware of the problems and recovery of NPAs and Bank should maintain zero level of
NPA which prevents fresh flow of NPA and helps them to recovery of existing heavy stock of
NPA’s. “Salini R Chandran, K. Alamelu volume:8| Issue:2S6, ISSN: 2277-3878 (The main reason
for this was willful default from the borrowers and the study will be realistic suggestions on
improving asset quality of banks in India)”.Usually NPA is broadly defined as one with interest
or principal repayment installment unpaid for more than 90 days prior to 1993 .
Axis Bank should concentrate more on
1. Credit Appraisal
2. Risk Management
3. Recoveries of loan amount
4. Monitoring
Credit appraisal is assessing the credit worthiness or repayment capacity of specific borrowers
with main focus on his/her ability and their intention is to pay back his/her loan amount. Banks
2
International E Conference on Adapting to the New Business Normal – The way ahead
December 3-4, 2020 Mysuru, India
ISBN: 978-93-83302-47-5
have to timely look after the NPA’s and risk associated to the assets attached and try to
mitigate the risk by proper functioning of their collection policies.
Keywords: Gross NPA, Net NPA, Defaulters, loan Recovery, Asset Quality, Profitability, NPA Management and Private Sector Banks Introduction
Banking in India has its origin carry as the Vedic period. It is believed that the transition from money lending to banking must have occurred even before Manu, the great Hindu jurist, who has developed a section of his work to deposits and advances and laid down rules relating to the interest. During the mogal period, the indigenous bankers played a very important role in lending money and financing foreign trade and commerce. During the days of East India company, it was to turn of the agency houses top carry on the banking business. The general bank of India was the first joint stock bank to be established in the year 1786. The others which followed were the banks of Hindustan and Bengal Bank. The bank of Hindustan is reported to have continued till 1906, while the other two failed in the meantime. In the first half of the 19th century the East India Company established three banks; The Bank of Bengal in 1809, The Bank of Bombay in 1840 and The Imperial Bank of Bank of India was established on the 27th Jan 1921, with the passing of the SBI Act 1955, the undertaking of The Imperial Bank of India was taken over by the newly constituted SBI. The Reserve Bank which is the Central Bank was created in 1935 by passing of RBI Act 1934, in the wake of swadeshi movement, a number of banks with Indian Management were established in the country namely Punjab National Bank Ltd, Bank of India Ltd, Canara Bank Ltd, Indian Bank Ltd, The Bank of Baroda Ltd, The Central Bank of India Ltd. On July 19th 1969, 14 major banks the country were and in 15th April 1980 six more commercial private sector banks were also taken over by the government. The Indian Banking industry, which is governed by the Banking Regulation Act of India 1949, can be broadly classified into two major categories, non-scheduled banks and scheduled banks. Scheduled banks comprise commercial banks and the co-operative banks
The first phase of financial reforms resulted in the nationalization of 14 major banks in 1969 and resulted in a shift from class banking to mass banking. This in turn resulted in the significant growth in the geographical coverage of banks. Every bank had to earmark a min percentage of their loan portfolio to sectors identified as “priority sectors” the manufacturing sectors also grew during the 1970’s in protected environments and the banking sector was a critical source. The next wave of reforms saw the
nationalization of 6 more commercial banks in 1980 since then the number of scheduled commercial banks increased four-fold and the number of bank branches increased to eight fold.
After the second phase of financial sector reforms and liberalization of the sector in the early nineties. The PSB’s found it extremely difficult to complete with the new private sector banks and the foreign banks. The new private sector first made their appearance after the guidelines permitting them were issued in January 1993.
Objectives of the study:
• To analyze the financial performance of the bank at the different level of Npa in different years.
• To evaluate profitability positions of the bank
3
International E Conference on Adapting to the New Business Normal – The way ahead
December 3-4, 2020 Mysuru, India
ISBN: 978-93-83302-47-5
• To know the concept of non performance asset
• To analyze NPA in Axis bank and measures to reduce it.
Research Methodology
Type of research: Secondary data:
To fulfill the objective of my study, I have collected the data from annual reports and official
Websites
The various sources that were used for the collection of secondary data are
• www.Axis bank.com
• www.rbi.org.in
Company PROFILE:
Axis Bank Ltd., the first bank to begin operations as new private banks in 1994 afire the Government of India allowed new private banks to be established. Axis Bank was jointly promoted by the Administrator of the specified undertaking of the
Unit Trust of India (UTI-1)
Life Insurance Corporation of India (LIC) General Insurance Corporation Ltd.
Additionally, with associates National Insurance Company Ltd., The New India Assurance Company, The Oriental Insurance Corporation and United Insurance Company Ltd.
Hub Bank is the third biggest private part bank in India. Pivot Bank offers the entire range of money related administrations to client portions covering Large and Mid-Corporate, MSME, Agriculture and Retail Businesses. The Bank has a substantial impression of 3703 branches and 13,814 ATMs spread over the province as on 12 Aug 2016 which is the biggest ATM organize in nation among Private Sector Banks in India. The abroad tasks of the Bank are spread over its seven worldwide workplaces with branches at Singapore, Hong Kong, DIFC (Dubai International Financial Centre), Colombo and Shanghai and delegate workplaces at Dubai and Abu Dhar with an accounting report size of 6,91,330/ - Cr. as on 31st March 2018, Axis Bank has accomplished steady development and stable resource quality with a 5-year CAGR (2012-13 to 2017-18) of 15% in Total Assets, 12% in Total Deposits, 17% in Total Advances
The most recent contributions of the bank alongside Dollar Varian is the Euro and Pound Sterling variations of the International Travel Currency Card (TCDC Card). The Travel Currency Card is a mark based prepaid travel card which empowers traveller’s global access to their Money in neighbourhood cash of the meeting province in a sheltered and helpful way. The Bank has qualities in both retail and corporate managing an account and is focused on embracing the best business rehearses internationally in request to accomplish perfection.

4
International E Conference on Adapting to the New Business Normal – The way ahead
December 3-4, 2020 Mysuru, India
ISBN: 978-93-83302-47-5
Development of the Modern Banking
For the history of modern banking in India a preface to the English agency is the days of east India Company would be necessary. The bank of Hindustan was the first Joint stock bank to be established under European management. But soon if first half of the 9thcentury.The east India company established 3 banks.
But of Bengali in 1809 with capital lake under government after the 3 decade there were another two banks were established namely the banks Bombay in 1840, the bank of Madras in 1843. These banks known as the presidency banks. These 3 banks were amalgamated in 27th January 1921 to form the empirical bank of India. The aid commercial bank was perhaps the first purely joint stock bank to be established in the 1889. Later the Punjab national bank and people’s banks were established.
The swadeshi movement of 1905 gave a great stimulus to the development of Indian banks. The banks of India were started in 1906.The A Indian bank in 1907. The bank of Baroda in 1908 and the central bank of India in 1911.However the banking crises of 1943 unit hard.
In 1922 the bank king industry witnessed many bank failure. It is only recent year’s such bank failure has been prevented 2 stability restored. In 1935 we established the reserve bank of India which is acting as the central bank of our country.
Amongst various banking instructions in the country in the organized sectors. The commercial banks are the oldest institutions having a wide network of branches. In fact one of the commercial banks in our country state bank of India has got more than 12000 branches all over the country. However commercial banks have the lion’s shares in the total banking operation 1 the country.
In 1995 the Imperial bank of India has been taken over by the newly constituted the state bank of India. Pursuant to the provisions of the state bank of act of 1956 eight state owned banks were nationalized with effect from July 19, 1969 again a 23/04/1980 six more banks were also nationalized. Thus bringing to a total of 92% of banking system 1 India under the public sector. Regional rural banks are the new banking institutions which have been added to the Indian banking scheme since October 1975 under the regional rural banks Act 1976.With the shift in the government policies towards the state ownership banks with the shareholdings of public has been converted drawn corporate bodies into national institution under 2 phase that is once in 1969 and then again in 1981. Today as many as 28 lakhs constitute the strong public sector commercial banks today contributes business in the country.
Introduction:
Non Performing Assets surfaced suddenly in the Indian banking scenario, around the eighties. In the midst of turbulent structured changes overtaking the international banking institutions and where the global financial markets were undergoing sweeping changes.
Management of Non Performing Assets now days a critical affecting the operation of the banks. It is better for Indian banks to follow the standardized system to measure the efficiency, productivity, assets recognition norms, and capital adequacy to compete in the competitive new economy.
Meaning of Non Performing Assets:
With a view to moving towards international best practices and to ensure greater transparency the ‘90 days overdue’ norms for identification of Non Performing Assets has been adopted by the R.B.I.

5
International E Conference on Adapting to the New Business Normal – The way ahead
December 3-4, 2020 Mysuru, India
ISBN: 978-93-83302-47-5
So NPA refers to,
• Interest or Installments of principal remain overdue for a period of more than 90 days in
respect of term loan.
• The account remains ‘Out of order’ for a period of more than 90 days. In respect of an
overdraft/ C.C.
• The bills remains ‘overdue’ for a period of more than 90 days in the case of bills
purchased and discounted.
• Any amount to be received remains ‘overdue’ for a period of more than 90 days in
respect of other accounts.
• A loan granted for short duration crops is treated as NPA, if the installment of principal
or interest thereon remains overdue for two crops season and a loan granted for long
duration crops is treated as NPA, if an installment of principal or interest thereon
remains overdue for one crop season.
• An account would be classified as NPA only if the interest charged during any quarter is
not serviced fully within 90 days from the end of the quarter. So in short NPA refers to
those assets where in which the bank does not earn income, asset or loan granted.
If an irregular account continuously remain as irregular category for a period of 90 days (earlier 180 days) it seems NPA. According to the guidelines of the RBI once an account is listed as NPA, the interest has to be deducted out of the profit of the same accounting year Diagram showing how performing assets turns into Non RBI guidelines on income recognition (interest income on NPAs):

6
International E Conference on Adapting to the New Business Normal – The way ahead
December 3-4, 2020 Mysuru, India
ISBN: 978-93-83302-47-5
Banks recognize income including interest income in advance on accrual basis. That is income is accounted for as and when it is earned. The prima-facie condition for accrual of income is that it should not be unreasonable to expect its ultimate collection. However, NPAs involves significant uncertainty with respect to its ultimate collection.
Considering the fact in accordance with the guidelines for income recognition issued by the Reserve Bank of India (RBI) banks should not recognize interest income on such NPAs until it is actually realized.
Reversal of Interest Income:
If any advance becomes NPA as at the close of any year interest accrued and credited to income account in the corresponding should be reversed or provided for if the same is not realized.
Reporting of NPAs:
Banks are required to furnish report on NPA as on 31st march of each year after completion of audit. The NPA would relate to the banks global portfolio including the advances at the foreign branches.
Classification of Assets:
The NPAs are classified into 3 categories namely:
➢ Sub –standard Assets
➢ Doubtful Assets
➢ Loss Assets
These are being classifies by the banks based on the period for which the asset has remained
non-performing and the reliability of the dues.
Sub –Standard Assets:
An assets become NPA is first classified as sub-standard asset and which remains as NPA for a period less than or equal to 12 months (earlier 18 months)In such cases, the current net worth of the borrower/ guarantor or the current market value of the security charged is not enough to such an assets will have well defined or weakness that endanger the liquidation of the debt and are characterized by the distinct possibility that the banks will sustain some loss, if deficiencies are not corrected.
Doubtful Assets:
A standard asset becomes a doubtful if it has remained as a substandard for a period exceeding 12 months (before 18 months). A loan classified as doubtful has all the weaknesses inherent in assets that were classified as sub- standard with the added characteristics that the that the weakness makes collection or liquidation in full on the basis of currently known facts, conditions and values highly questionable and improbable.
Loss Assets:
7
International E Conference on Adapting to the New Business Normal – The way ahead
December 3-4, 2020 Mysuru, India
ISBN: 978-93-83302-47-5
An assets, which is considered as irrecoverable by the banks of internal or external auditor or the R.B.I. inspection is treated as loss account but the amount has not been written off wholly. In classification or assets interest above categories should be done taking interest account the degree of well defined or weakness and the extent of deepened on collateral security for realization of dues.
Banks should establish appropriate internal system to eliminate the tendency to delay or postpone the identification of NPA especially in the respect of high value accounts. The banks may even fix minimum cut off point to decide what would constitute a high value account depending their respective business levels.
In terms of RBI guidelines as and when an assets become a NPA such advances would be first classified as sub-standard one for a period that should not exceed 18 months and subsequently as doubtful assets.
It should be noted that the above classification is only for the purpose of computing the amount of provision that should be made with respect to bank advances and certainly not for the purpose of presentation of advances in the bank balance sheet.
Up gradation of loan account classified as NPA
In case of any borrower pays the arrears interest and principal classified as NPA the account should no longer be treated as non-performing and may be classified as ‘Standard’ account.
Classification to be based on borrowers-wise and not facility wise
The classification as NPA of the accounts should be based on the borrower wise and not based on the facility wise. That is if a borrower is having more than one facility (like two or more accounts) in the same bank. The borrowers all the facilities should be treated as NPAs and not particular facility or part thereof which has become irregular.
Note: If the borrower is availing limits from more than one branch all the limits of the borrowers in all the branches to be treated as NPA
Mains reasons for accounts becoming NPA’s:
➢ Units closed
➢ Borrower absconding
➢ Sale of assets
➢ Diversion of funds
➢ Willful default
➢ Non renewal of the limits
➢ Interest/Installments not paid
➢ Non repayment of loans due to natural calamities such as drought, floods earthquakes etc.
➢ Lack of verification

8
International E Conference on Adapting to the New Business Normal – The way ahead
December 3-4, 2020 Mysuru, India
ISBN: 978-93-83302-47-5
➢ Economic factor
➢ Natural calamities
➢ Financial factor
➢ Business failures
Often stated reasons for NPAs in India:
➢ Corruption
➢ Judicial system flaws
➢ Non existence fear of penalties
➢ Inefficient credit appraisal systems
➢ Lack of technology, methodology and data support for scientific credit appraisal
Ways to reduce NPAs:
➢ Personal contact.
➢ Frequent follow-up by bank officials.
➢ Issue of periodical deposits.
➢ Adjustments of his/her O/S deposits.
➢ Apply of scientific for appraisal before the loan is disbursed and monitor it closely in real time.
➢ Conduct recovery Champaign
➢ Break up recovery to branch level network
➢ Take every NPA case as a separate issue and analyze the need for further funding from an economic point of view
➢ Implement a system for selecting a good borrower.
Steps taken by the Bank to reduce NPAs:
➢ Bank is planning to go for securitization of huge transaction accounts
➢ Interestensive follow up with advocates/civil courts/DRTs for speedy disposal of cases.
➢ Officials from various offices visit borrowers/ branches for discussions/ review of NPAs.
➢ Liberal policy adopted for compromise in account with balances below 50000 and those that are more than 10 years old.
➢ Risk management systems put in place.
9
International E Conference on Adapting to the New Business Normal – The way ahead
December 3-4, 2020 Mysuru, India
ISBN: 978-93-83302-47-5
➢ Apply of scientific for appraisal before the loan is disbursed and monitor it closely in real time.
➢ Axis bank has regularly conducted recovery campaigns.
➢ Break up recovery to branch level network
➢ Take every NPA case as a separate issue and analyze the need for further funding from an economic point of view.
➢ Axis bank has implemented a system for selecting a good borrower.
➢ Axis bank has followed all credit exposures are classified as per RBI guidelines into performing and non-performing assets
➢ Provisions are made on substandard and doubtful assets at rates prescribed by RBI. Loss assets and unsecured portion of doubtful assets are provided/ written off as per the extent RBI guidelines.
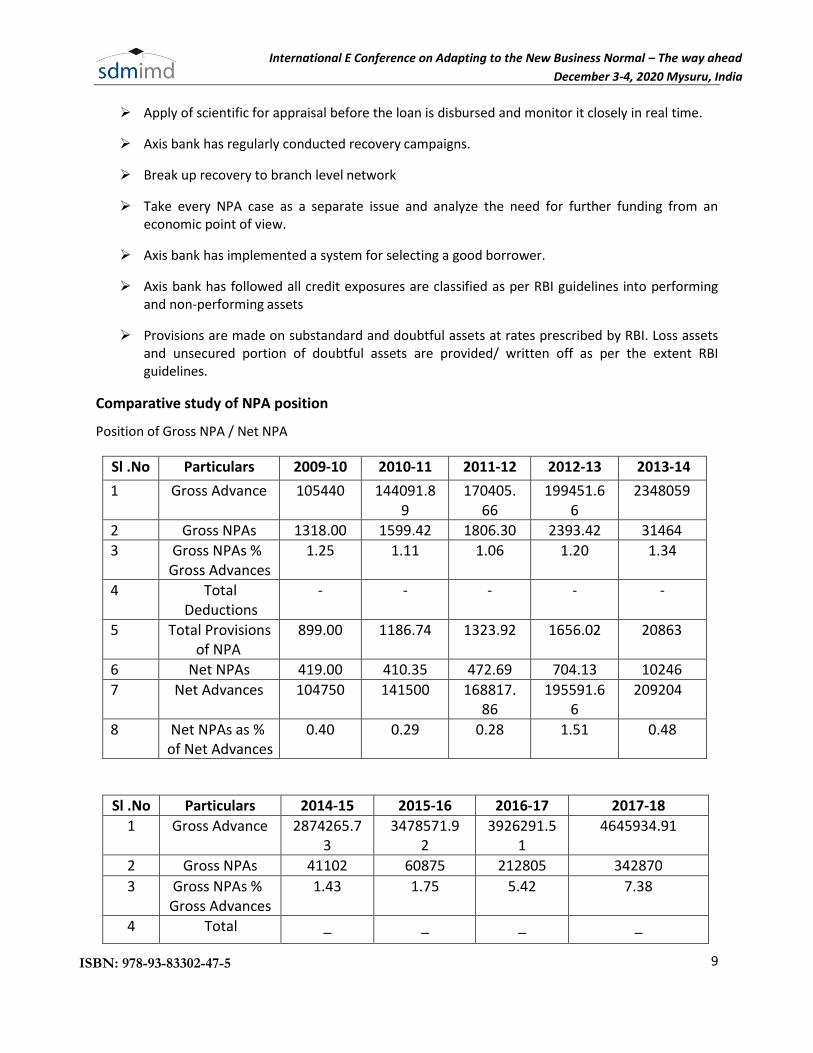
Comparative study of NPA position
Position of Gross NPA / Net NPA
Sl .No Particulars 2009-10 2010-11 2011-12 2012-13 2013-14
1 Gross Advance 105440 144091.89
170405.66
199451.66
2348059
2 Gross NPAs 1318.00 1599.42 1806.30 2393.42 31464
3 Gross NPAs % Gross Advances
1.25 1.11 1.06 1.20 1.34
4 Total Deductions
- - - - -
5 Total Provisions of NPA
899.00 1186.74 1323.92 1656.02 20863
6 Net NPAs 419.00 410.35 472.69 704.13 10246
7 Net Advances 104750 141500 168817.86
195591.66
209204
8 Net NPAs as % of Net Advances
0.40 0.29 0.28 1.51 0.48
Sl .No Particulars 2014-15 2015-16 2016-17 2017-18
1 Gross Advance 2874265.73
3478571.92
3926291.51
4645934.91
2 Gross NPAs 41102 60875 212805 342870
3 Gross NPAs % Gross Advances
1.43 1.75 5.42 7.38
4 Total _ _ _ _

10
International E Conference on Adapting to the New Business Normal – The way ahead
December 3-4, 2020 Mysuru, India
ISBN: 978-93-83302-47-5
Deductions
5 Total Provisions of NPA
26293 36000 122981 174132
6 Net NPAs 13167 25221 86266 165983
7 Net Advances 2862391.30
3454931.50
3817079.65
4498184.28
8 Net NPAs as % of Net Advances
0.46 0.73 2.26 3.69
Calculation of each year
2009-10 Gross NPA- Provision of NPA = Net NPA 1318 - 899 = 419
Movement of NPA mentioned in the balance sheet is 419
For Standard Asset provision amount is 419–419= 0
Movement of provision of NPA + Standard Asset
899+ 0= 0 Net NPA – Standard Asset 419–0= 419
2010-11 Gross NPA- Provision of NPA = Net NPA
1599.42–1186.74= 412.68
Movement of NPA mentioned in the balance sheet is 410.35
For Standard Asset provision amount is
412.68–410.35= 2.33
Movement of provision of NPA + Standard Asset
1186.74+ 2.33 = 1189.07
Net NPA – Standard Asset
412.35– 2.33 = 410.35
2011-12 Gross NPA- Provision of NPA = Net NPA
1806.30– 1323.92 = 482.38
Movement of NPA mentioned in the balance sheet is 472.64

11
International E Conference on Adapting to the New Business Normal – The way ahead
December 3-4, 2020 Mysuru, India
ISBN: 978-93-83302-47-5
For Standard Asset provision amount is
482.38– 472.64 = 9.74
Movement of provision of NPA + Standard Asset
1323.92+ 9.74 = 1333.66
Net NPA – Standard Asset
482.38– 9.74 = 472.64
2012-13 Gross NPA- Provision of NPA = Net NPA
2393.42– 1656.02 = 737.4
Movement of NPA mentioned in the balance sheet is 704.13
For Standard Asset provision amount is
737.4– 704.13 = 33.27
Movement of provision of NPA + Standard Asset
1656.02+ 33.27 = 1689.29
Net NPA – Standard Asset
737.4– 33.27 = 704.13
2013-14 Gross NPA- Provision of NPA = Net NPA
31464– 20863 = 10601
Movement of NPA mentioned in the balance sheet is 10246
For Standard Asset provision amount is
10601– 10246 = 355
Movement of provision of NPA + Standard Asset
20863+ 355 = 21218
Net NPA – Standard Asset
10601– 355 = 10246

12
International E Conference on Adapting to the New Business Normal – The way ahead
December 3-4, 2020 Mysuru, India
ISBN: 978-93-83302-47-5
2014-15 Gross NPA- Provision of NPA = Net NPA
41102– 26923 = 14179
Movement of NPA mentioned in the balance sheet is 13167
For Standard Asset provision amount is
14179– 13167 = 1012
Movement of provision of NPA + Standard Asset
26923+1012 = 27935
Net NPA – Standard Asset
14149– 1012 = 13167
2015-16 Gross NPA- Provision of NPA = Net NPA
60875– 36000 = 24875
Movement of NPA mentioned in the balance sheet is 25221
For Standard Asset provision amount is
24875-25221 = 346
Movement of provision of NPA + Standard Asset
36000 +364 = -35654
Net NPA – Standard Asset
24875 +346 = 25221
2016-17 Gross NPA- Provision of NPA = Net NPA
212805– 122981 = 89824
Movement of NPA mentioned in the balance sheet is 86266
For Standard Asset provision amount is
89824 – 86266 = 3558
Movement of provision of NPA + Standard Asset
13
International E Conference on Adapting to the New Business Normal – The way ahead
December 3-4, 2020 Mysuru, India
ISBN: 978-93-83302-47-5
122981 +3558 = 126539
Net NPA – Standard Asset
89824 – 3558 = 86266
2017-18 Gross NPA- Provision of NPA = Net NPA
342870 - 174132= 168738
Movement of NPA mentioned in the balance sheet is 165983
For Standard Asset provision amount is
168738-165983 = 2755
Movement of provision of NPA + Standard Asset
174132 +2755 = 176887
Net NPA – Standard Asset
168738 – 2755 =165983
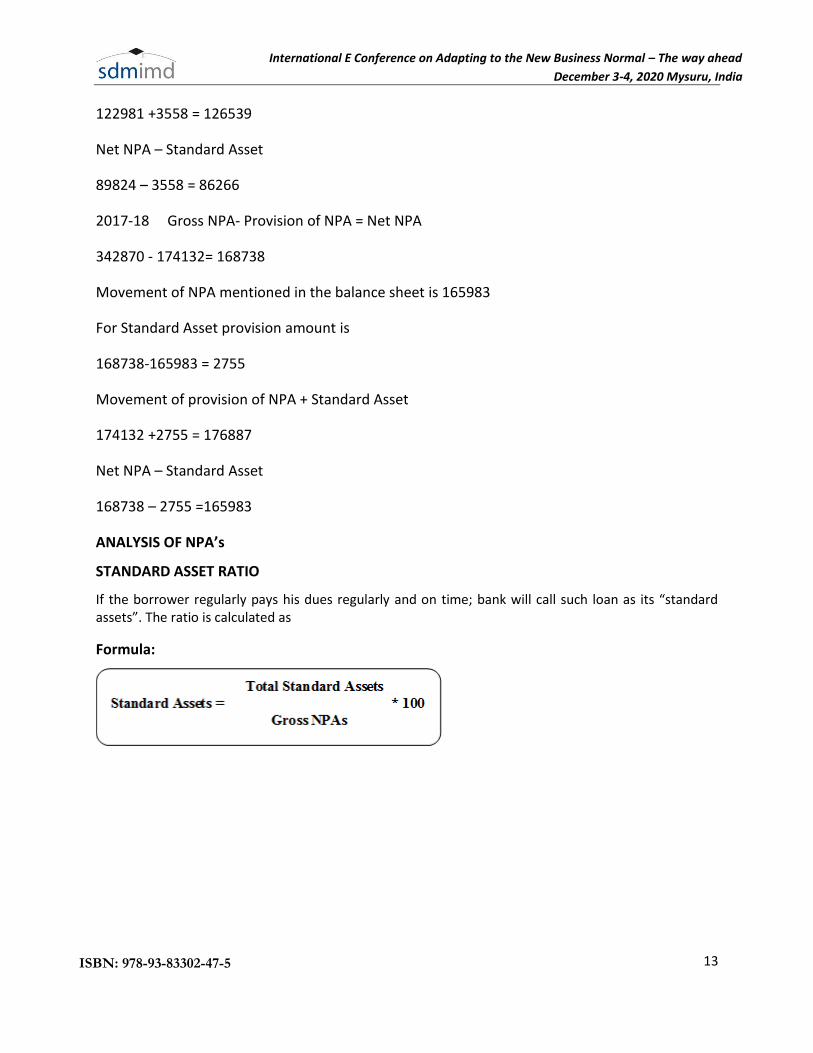
ANALYSIS OF NPA’s
STANDARD ASSET RATIO
If the borrower regularly pays his dues regularly and on time; bank will call such loan as its “standard assets”. The ratio is calculated as
Formula:

14
International E Conference on Adapting to the New Business Normal – The way ahead
December 3-4, 2020 Mysuru, India
ISBN: 978-93-83302-47-5
STANDARD ASSETS
YEAR STANDARD
ASSETS ((Rs in
Millions)
GROSS NPAs
(Rs in Millions)
PERCENTAGE
2009-10 0 1318.00 0
2010-11 2.33 1599.42 0.14
2011-12 9.74 1806.30 0.54
2012-13 33.27 2393.42 1.39
2013-14 355.00 31464.00 1.13
2014-15 1012.00 41102.00 2.47
2015-16 346.00 60875.00 0.57
2016-17 3558.00 212805.00 1.67
2017-18 2755.00 342870.00 0.80
INTERPRETATION
In the data analysis represents from the above table and graph it shows that NPAs percentage
of the 2010-2011 is 0.14% and it goes on increasing in each year. The highest npa percentage in
the year 2014-2015 is 2.47% & in the year 2017-18 it reduced to 0.80%.where in the bank has
its fresh Npa and properly controlled & followed the provision & guidelines of the RBI
SUB – STANDARD ASSETS RATIO
15
International E Conference on Adapting to the New Business Normal – The way ahead
December 3-4, 2020 Mysuru, India
ISBN: 978-93-83302-47-5
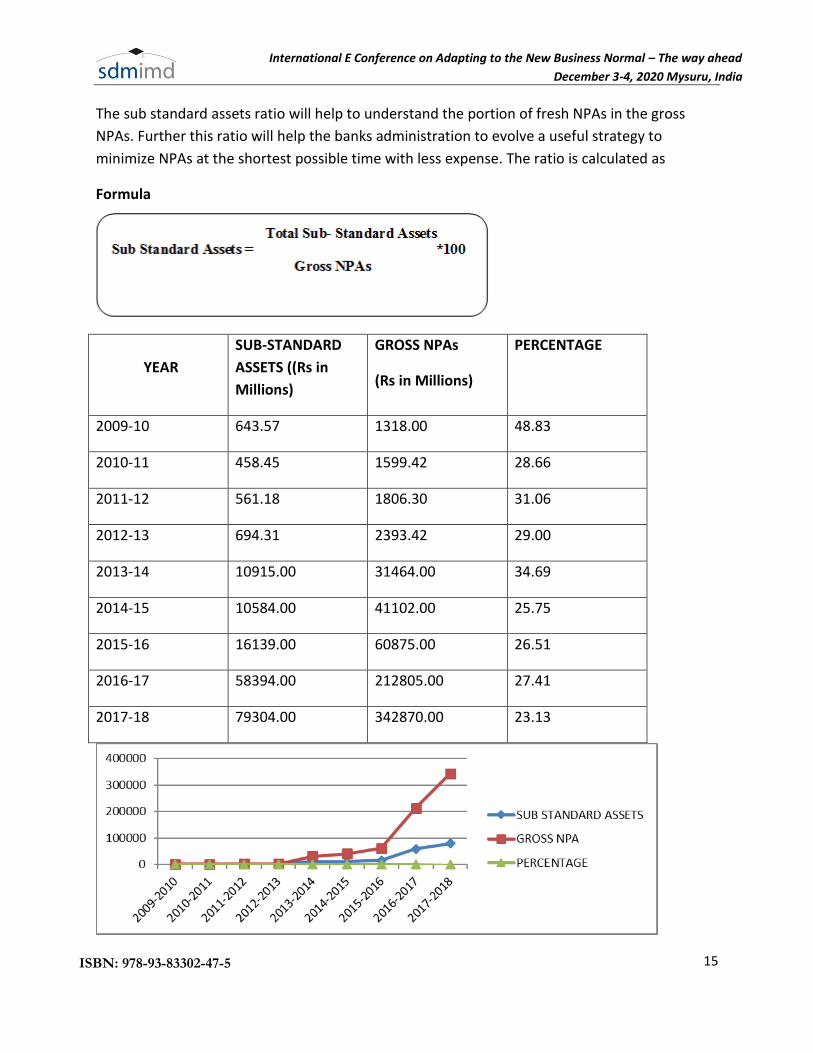
The sub standard assets ratio will help to understand the portion of fresh NPAs in the gross
NPAs. Further this ratio will help the banks administration to evolve a useful strategy to
minimize NPAs at the shortest possible time with less expense. The ratio is calculated as
Formula
YEAR
SUB-STANDARD
ASSETS ((Rs in
Millions)
GROSS NPAs
(Rs in Millions)
PERCENTAGE
2009-10 643.57 1318.00 48.83
2010-11 458.45 1599.42 28.66
2011-12 561.18 1806.30 31.06
2012-13 694.31 2393.42 29.00
2013-14 10915.00 31464.00 34.69
2014-15 10584.00 41102.00 25.75
2015-16 16139.00 60875.00 26.51
2016-17 58394.00 212805.00 27.41
2017-18 79304.00 342870.00 23.13
16
International E Conference on Adapting to the New Business Normal – The way ahead
December 3-4, 2020 Mysuru, India
ISBN: 978-93-83302-47-5
INTERPRETATION
In this graph the highest Sub-Standard assets are in the year 2017-18 is 79304.00and other one in the year of 2016-17 is 58394.00 the both are highest in the sub-standard assets involving in bank. The reduction in the percentage of Sub-Standard assets indicates less addition of fresh NPA. But, another inference derived is in, more Sub-Standard assets slipped into doubtful and loss category of assets
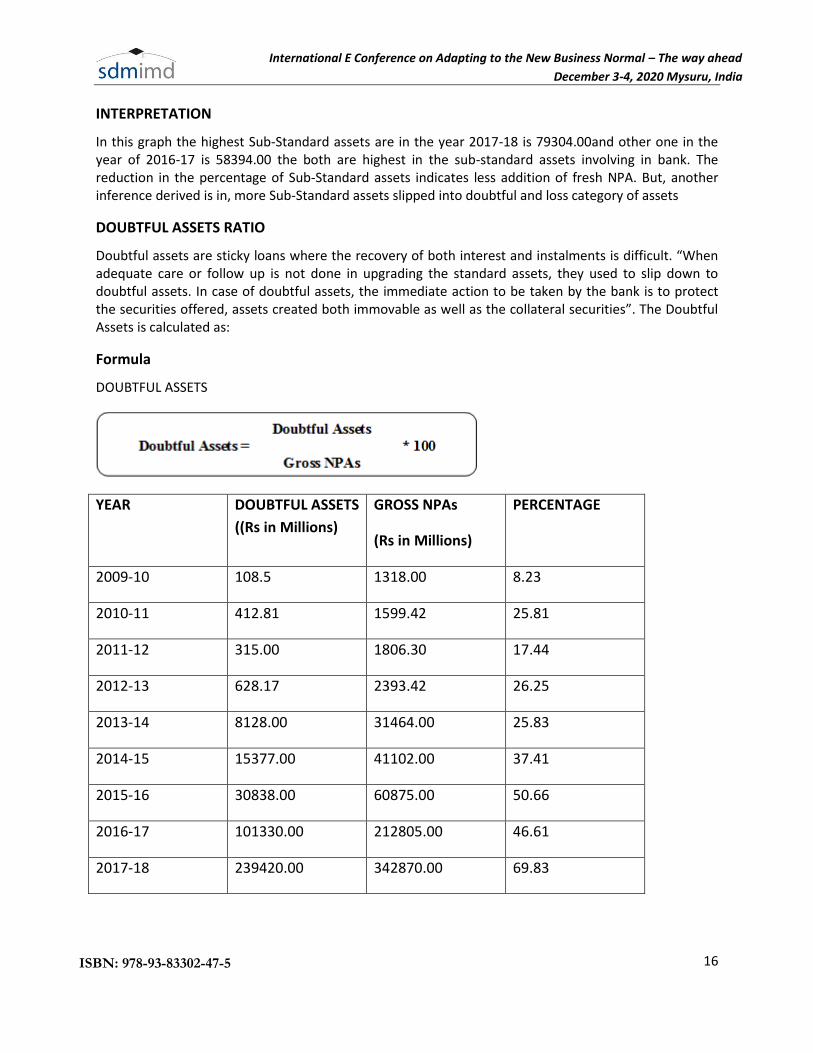
DOUBTFUL ASSETS RATIO
Doubtful assets are sticky loans where the recovery of both interest and instalments is difficult. “When adequate care or follow up is not done in upgrading the standard assets, they used to slip down to doubtful assets. In case of doubtful assets, the immediate action to be taken by the bank is to protect the securities offered, assets created both immovable as well as the collateral securities”. The Doubtful Assets is calculated as:
Formula
DOUBTFUL ASSETS
YEAR DOUBTFUL ASSETS
((Rs in Millions)
GROSS NPAs
(Rs in Millions)
PERCENTAGE
2009-10 108.5 1318.00 8.23
2010-11 412.81 1599.42 25.81
2011-12 315.00 1806.30 17.44
2012-13 628.17 2393.42 26.25
2013-14 8128.00 31464.00 25.83
2014-15 15377.00 41102.00 37.41
2015-16 30838.00 60875.00 50.66
2016-17 101330.00 212805.00 46.61
2017-18 239420.00 342870.00 69.83
17
International E Conference on Adapting to the New Business Normal – The way ahead
December 3-4, 2020 Mysuru, India
ISBN: 978-93-83302-47-5
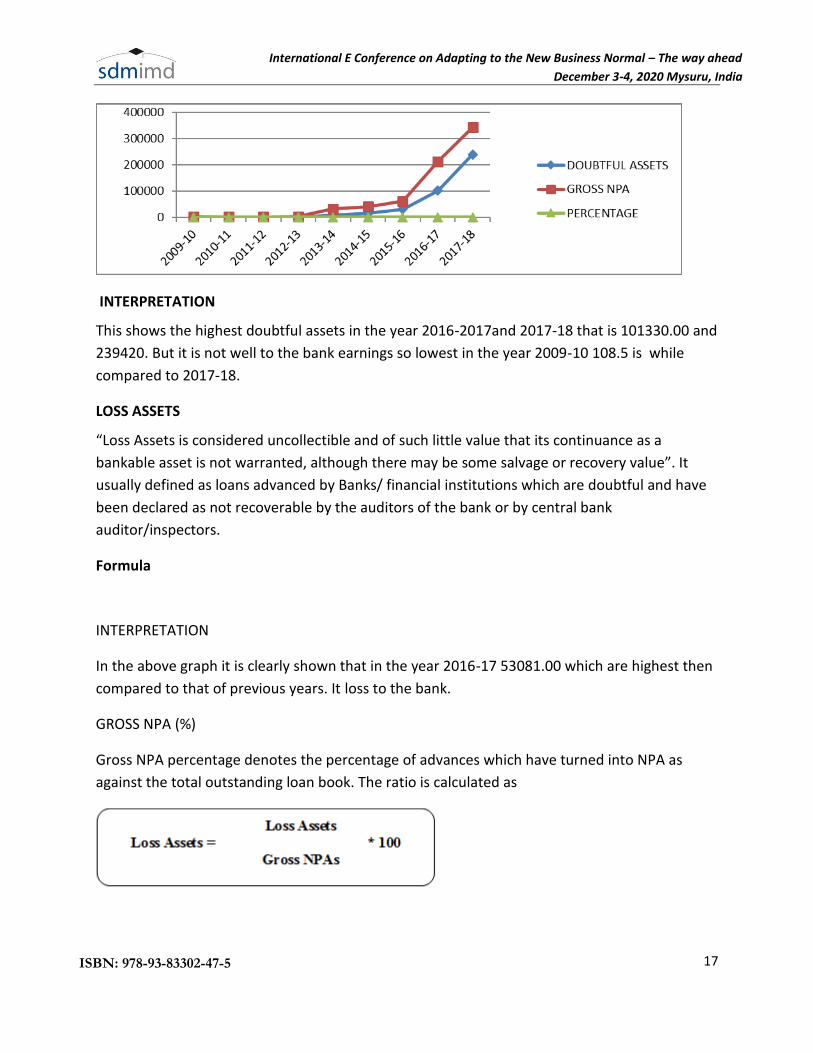
INTERPRETATION
This shows the highest doubtful assets in the year 2016-2017and 2017-18 that is 101330.00 and
239420. But it is not well to the bank earnings so lowest in the year 2009-10 108.5 is while
compared to 2017-18.
LOSS ASSETS
“Loss Assets is considered uncollectible and of such little value that its continuance as a
bankable asset is not warranted, although there may be some salvage or recovery value”. It
usually defined as loans advanced by Banks/ financial institutions which are doubtful and have
been declared as not recoverable by the auditors of the bank or by central bank
auditor/inspectors.
Formula
INTERPRETATION
In the above graph it is clearly shown that in the year 2016-17 53081.00 which are highest then
compared to that of previous years. It loss to the bank.
GROSS NPA (%)
Gross NPA percentage denotes the percentage of advances which have turned into NPA as
against the total outstanding loan book. The ratio is calculated as

18
International E Conference on Adapting to the New Business Normal – The way ahead
December 3-4, 2020 Mysuru, India
ISBN: 978-93-83302-47-5
YEAR LOSS ASSETS ((Rs in
Millions)
GROSS NPAs
(Rs in Millions)
PERCENTAGE
2009-10 565.93 1318.00 42.94
2010-11 728.16 1599.42 45.53
2011-12 930.12 1806.30 51.49
2012-13 1070.94 2393.42 44.75
2013-14 12421.00 31464.00 39.47
2014-15 15141.00 41102.00 36.84
2015-16 13898.00 60875.00 22.83
2016-17 53081.00 212805.00 24.94
2017-18 24146.00 342870.00 7.04
NET NPA (%)
Net NPA percentage denotes the proportion of advances which turned into NPA after adjusting for the provisions already made by the bank / financial institution. The ratio is calculated as,
19
International E Conference on Adapting to the New Business Normal – The way ahead
December 3-4, 2020 Mysuru, India
ISBN: 978-93-83302-47-5
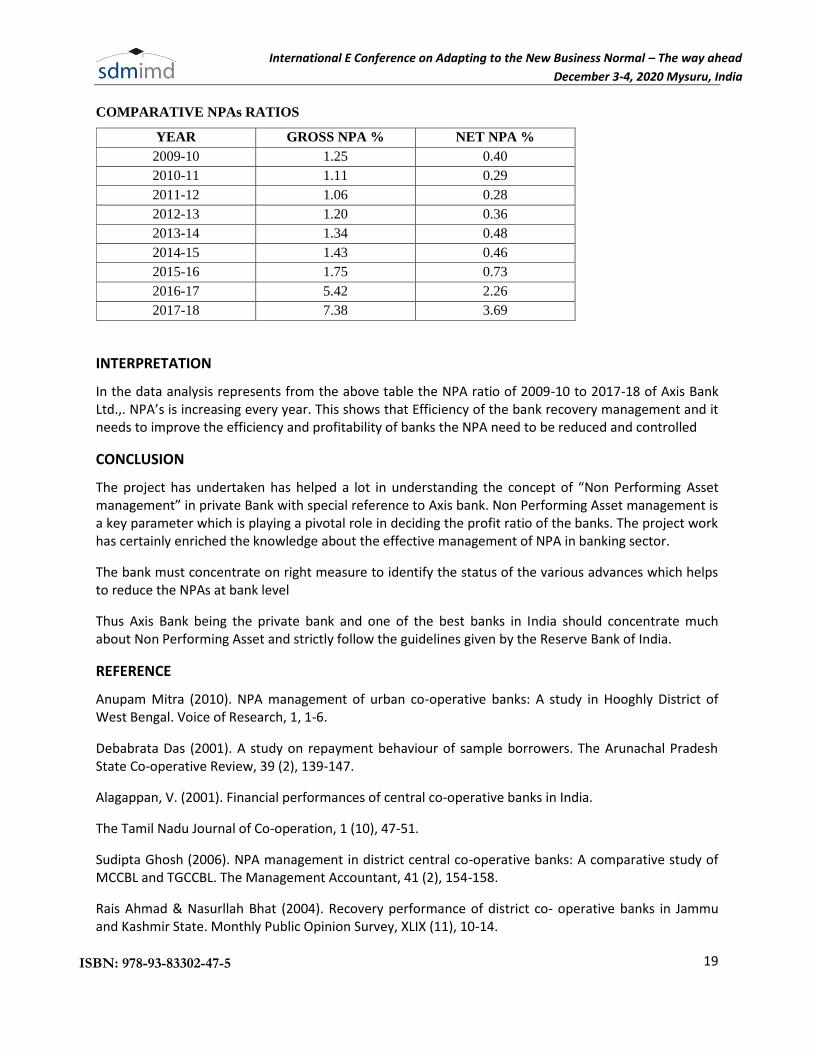
COMPARATIVE NPAs RATIOS
YEAR GROSS NPA % NET NPA %
2009-10 1.25 0.40
2010-11 1.11 0.29
2011-12 1.06 0.28
2012-13 1.20 0.36
2013-14 1.34 0.48
2014-15 1.43 0.46
2015-16 1.75 0.73
2016-17 5.42 2.26
2017-18 7.38 3.69
INTERPRETATION
In the data analysis represents from the above table the NPA ratio of 2009-10 to 2017-18 of Axis Bank Ltd.,. NPA’s is increasing every year. This shows that Efficiency of the bank recovery management and it needs to improve the efficiency and profitability of banks the NPA need to be reduced and controlled
CONCLUSION
The project has undertaken has helped a lot in understanding the concept of “Non Performing Asset management” in private Bank with special reference to Axis bank. Non Performing Asset management is a key parameter which is playing a pivotal role in deciding the profit ratio of the banks. The project work has certainly enriched the knowledge about the effective management of NPA in banking sector.
The bank must concentrate on right measure to identify the status of the various advances which helps to reduce the NPAs at bank level
Thus Axis Bank being the private bank and one of the best banks in India should concentrate much about Non Performing Asset and strictly follow the guidelines given by the Reserve Bank of India.
REFERENCE
Anupam Mitra (2010). NPA management of urban co-operative banks: A study in Hooghly District of West Bengal. Voice of Research, 1, 1-6.
Debabrata Das (2001). A study on repayment behaviour of sample borrowers. The Arunachal Pradesh State Co-operative Review, 39 (2), 139-147.
Alagappan, V. (2001). Financial performances of central co-operative banks in India.
The Tamil Nadu Journal of Co-operation, 1 (10), 47-51.
Sudipta Ghosh (2006). NPA management in district central co-operative banks: A comparative study of MCCBL and TGCCBL. The Management Accountant, 41 (2), 154-158.
Rais Ahmad & Nasurllah Bhat (2004). Recovery performance of district co- operative banks in Jammu and Kashmir State. Monthly Public Opinion Survey, XLIX (11), 10-14.