
No. 79 January 2019
64
No. 79 January 2019
-
Upload
khangminh22 -
Category
Documents
-
view
1 -
download
0
Transcript of No. 79 January 2019

No. 79 January 2019

The Survey Statistician 2 January 2019
Editors: Danutė Krapavickaitė and Eric Rancourt
Section Editors:
Peter Wright Country Reports
Eric Rancourt Ask the Experts
Risto Lehtonen New and Emerging Methods
Danutė Krapavickaitė Book & Software Review
Production and Circulation: Mārtiņš Liberts (Central Statistical Bureau of Latvia), Nicholas Husek (Australian Bureau of Statistics), and Olivier Dupriez (World Bank)
The Survey Statistician is published twice a year by the International Association of Survey Statisticians and distributed to all its members. The Survey Statistician is also available on the IASS website at http://isi-iass.org/home/services/the-survey-statistician/
Enquiries for membership in the Association or change of address for current members should be addressed to:
IASS Secretariat Membership Officer Margaret de Ruiter-Molloy International Statistical Institute P.O. Box 24070, 2490 AB the Hague The Netherlands
Comments on the contents or suggestions for articles in the Survey Statistician should be sent via e-mail to the editors:
Danutė Krapavickaitė ([email protected]) or Eric Rancourt ([email protected]).
In this Issue:
3 Letter from the Editors
5 Letter from the President
6 Report from the Scientific Secretary
9 News and Announcements • The Second Congress of Polish Statistics
• Big Data Meets Survey Science (BigSurv18) conference
• 62nd ISI World Statistics Congress 2019 (ISI WSC 2019)
• Measuring the 2030 Agenda for Sustainable Development
13 Ask the Experts • What are alternative data sources, and how
to use them? by Frauke Kreuter
16 New and Emerging Methods • Calibration methods for small domain
estimation by Risto Lehtonen and Ari Veijanen
27 Book & Software Review • Roderick J.A. Little and Donald B. Rubin
(2002) Statistical Analysis with Missing Data, 2nd ed., John Wiley & Sons
• Richard Valliant and Jill A. Dever (2017) Survey Weights: A Step-by-step Guide to Calculation, 1st ed., Stata Press
31 Country Reports • Argentina
• Canada
• Fiji
• Latvia
• Malaysia
• New Zealand
• Poland
38 Upcoming Conferences and Workshops • 62nd ISI World Statistics Congress 2019 (ISI
WSC 2019)
• IASS Support to Conferences in 2019
42 In Other Journals
60 Welcome New Members
61 IASS Executive Committee Members
62 Institutional Members
63 Change of Address Form
MLiberts
Text Box
ISSN 2521-991X

The Survey Statistician 3 January 2019
Letter from the Editors
The current issue of The Survey Statistician (TSS) will reach you after complete start of the New
Year 2019. We wish the readers success in your work and life in this New Year.
The current issue of TSS summarizes the main projects in survey statistics implemented in 2018
and presents also 2018 year evaluation of the achievements attained earlier. Knowledge of all
statistical community is enriched by these brilliant gains.
The issue starts with the Letter from the President where he highlights the 2018 accomplishments
of the IASS stressing the impact it has had through the sponsoring of conferences. Related to such
events that can take place in developing countries, he then encourages people to get involved in
technical assistance. He concludes with the announcement of who will deliver the President’s invited
lecture at the World Statistics Congress in Kuala Lumpur this coming August.
Report from the Scientific Secretary Risto Lehtonen presents the current situation on the ongoing
organizational work for the 62th World Statistical Congress (WSC) in Kuala Lumpur, Malaysia, on
August 18-23, 2019. This is one of the largest meetings of the world statistical community,
concentrating on the presentation of knowledge in many fields, and you still are able to submit your
proposal for the contributed presentation before February 31, 2019, if you have not done it yet. WSC
gives the participants a possibility for acquaintance, communication, fruitful discussions, exchange
of knowledge. The meeting is usually glamorized with the cultural centrepieces of the hosting
country.
The rest of the Report from the Scientific Secretary presents the conferences supported by IASS in
2018 and future events supported by IASS in 2019. Please submit your contributions and take part
at these events! Competition for the Cochran-Hansen prize of IASS stimulates young statisticians to
demonstrate their results and prepare themselves for the future career of the statisticians. Scientific
Secretary invites to submit a paper before February 15, 2019.
News and Announcements section includes formal information about the 62th WSC and contact
information needed for participation at the event.
It is a big pleasure to present information about the Second Congress of Polish Statisticians held in
Warsaw. Five statisticians were granted with the Jerzy Spława-Neyman medal, and the section
paper presents congratulations to the laureates.
The year 2018 saw the first BigSurv conference (BigSurv 2018). Thanks to Antje Kirchner, one of
the organizers, TSS presents a brief summary of the event which was a success. This conference
brought together experts from multiple disciplines with an agenda focused on how to combine
different approaches on topics such as collection, processing and analysis of data. Experts where
from the survey, social sciences, information technology and other backgrounds. Many of the
presentations will be featured in an up-coming book and there are already some plans to hold a
second event in 2020.
In the Ask the Experts section, Frauke Kreuter considers alternative data sources and how to use
them. This is a very topical issue as nonresponse rates and survey costs are going up in a world of
ever-increasing data demands coupled with the fact that immense amounts of data are now
becoming available to statisticians.
Small area estimation is one of the most popular topics in survey statistics of the 21st century. New
and Emerging Methods section presents a paper by Risto Lehtonen and Ari Veijanen where they

The Survey Statistician 4 January 2019
present an overview of the calibration methodology in small area estimation and present their own
simulation results for methods comparison.
The Book & Software Review section includes reviews of two books. The first one is prepared by
Sahar Z. Zangeneh for a book Statistical Analysis with Missing Data by Roderick J. A. Little and
Donald B. Rubin. It is pleasant to memorize that the authors received the Karl Pearson Prize at the
61st WSC by ISI in Morocco. Despite firstly published in 1987, the methods described in the book
attained many attacks of criticism, they still are important and useful nowadays.
Review of the new book Survey Weights: A Step-by-step Guide to Calculation by Richard Valliant
and Jill A. Dever published in 2017 is written by Andrés Gutiérrez. This book is devoted to the basics
of survey sampling enriched with complex methods for non-response adjustment, traditional
calibration and various variance estimation methods including bootstrap. The exceptional feature of
the book is that practical examples are presented using Stata software code.
The Country Reports section (edited by Peter Wright) has always been a central feature of The
Survey Statistician. This issue includes reports on the activities in survey statistics in seven countries
and we thank all country representatives for their contribution.
Due to the rotation in the editorial board we have a new designer for The Survey Statistician newsletter, and we will transfer responsibility for editing the Ask the Experts section. We kindly thank Lori Young of Statistics Canada for her creative work when making the design for the newsletter during last several years and Kennon Copeland of the University of Chicago for being editor of the contents of the Ask the Experts section. We wish them success in their other duties.
We thank Mārtiņš Liberts from the Central Statistical Bureau of Latvia for preparing the tables of
contents in the In Other Journals section. We also thank Mārtiņš for preparation of the design for
The Survey Statistician as it is now.
As always, we want to address everyone working hard to put The Survey Statistician together and
in particular Margaret A. de Ruiter-Molloy of the Statistics Netherlands, Janusz Wywiał of the
University of Economics in Katowice, Nicholas Husek at the Australian Bureau of Statistics and
Olivier Dupriez from the World Bank for their invaluable assistance.
Please let Risto Lehtonen ([email protected]) know if you want to contribute to the New and
Emerging Methods section in the future. If you have any questions which you would like to be
answered by an expert, please send them to Eric Rancourt of the Statistics Canada
([email protected]). If you are interested in writing a book or software review or suggesting a
source to be reviewed, please get in touch with Danutė Krapavickaitė of the Vilnius Gediminas
Technical University, Lithuania ([email protected]). The country reports should be sent to
Peter Wright of Statistics Canada ([email protected]).
If you have any information about the conferences, events or just the ideas you would like to share
with other statisticians – please contact with any member of the editorial board of the newsletter.
The Survey Statistician is available for downloading from the IASS website at
http://isi-iass.org/home/services/the-survey-statistician/.
Danutė Krapavickaitė ([email protected])
Eric Rancourt ([email protected])

The Survey Statistician 5 January 2019
Letter from the President
The year 2018 seems to have flown by. I have not managed to achieve all the things I would have
liked to as President, but the IASS enters 2019 as a healthy organisation. We are able to support a
number of workshops and conferences each year and for me it has been a pleasure to be able to
liaise with the organisers of these. In 2018 the IASS supported events in China, France, Latvia and
UK. We have already agreed to support events in Spain, Italy, Sweden and Nigeria in 2019. I am
particularly pleased about the workshop in Nigeria, which will have already taken place by the time
you read this newsletter. It is not part of a regular series of workshops, but is instead a training event
made possible solely by the existence of the IASS funding. I hope that we will be able to encourage
and support more capacity-building events of this kind in developing countries in the future. And I
hope that we will be able to include a colourful report of the Nigerian workshop in the next issue of
the Survey Statistician.
If you haven’t made a New Year’s resolution this year, you could do worse than offering your expert
services to a worthy cause. Survey statisticians are in great demand from non-profit organisations
of various kinds and even just a little advice can be invaluable in setting a project off in the right
direction. Both the Royal Statistical Society in the UK and the American Statistical Association run
schemes to put volunteering statisticians in touch with needy non-profit organisations. Make a
difference in 2019 and earn yourself a whole lot of gratitude! Details of how the schemes work and
how you can contribute can be found at the respective websites:
• Statisticians for Society (RSS):
(http://www.rss.org.uk/RSS/Get_involved/Statisticians_for_Society.aspx)
• Statistics Without Borders (ASA): (https://community.amstat.org/statisticswithoutborders)
A privilege of being President is that I get to choose who should present the President’s invited
lecture at the World Statistics Congress. I am delighted to announce that Gero Carletto from the
World Bank will present the lecture at the congress in Kuala Lumpur in August. Gero has a wealth
of experience in cross-national surveys, notably as manager of the Living Standards Measurement
Survey and the Integrated Surveys on Agriculture. At the Center for Development Data (C4D2) in
Rome, he is leading a programme to foster methodological innovation and strengthen capacity in
household surveys in low- and middle-income countries. His lecture, “A Thing of the Past?
Household Surveys in the New Global Data Ecosystem” will make the point that the countries that
need good surveys the most are the ones that can least afford them. Gero will focus on a number of
methodological and technological innovations to improve the accuracy, timeliness and cost-
effectiveness of survey instruments, with a focus on low- and middle-income countries with scarce
resources and weak capacity, and will make recommendations for future methodological research
to address some of the current trends and to enhance the value of household survey data in the
evolving global data ecosystem. Don’t miss it!
Peter Lynn, President

The Survey Statistician 6 January 2019
Report from the Scientific Secretary
ISI WSC 2019. Starting with the 62th World Statistics Congress of the ISI and its Associations, there
are a number of announcements concerning the scientific programme. The Scientific Programme
Committee (SPC), chaired by Yves-Laurent Grize, has completed the selection of proposals
submitted for Invited Paper Sessions (IPS). The Local Programme Committee, chaired by Datin
Rozita Talha, has done the same thing for the Special Topic Session (STS) proposals. Both lists
have been released at the ISI WSC 2019 webpage. Thanks to the work of Cynthia Clark as the IASS
representative for the SPC and the activity of the other IASS Executive Committee members and
IASS members, the scientific programme will contain a fair number of sessions on survey statistics
and related areas.
The SPC has made decisions on the Special Invited Paper Sessions (SIPS) proposed by the ISI
Associations. I am glad to announce that IASS is organizing two Special Invited Paper Sessions
proposed by the IASS Executive Committee. Peter Lynn informs that Gero Carletto of World Bank
has agreed to act as invited speaker for IPS167 (IASS President's Invited Session). For IPS182
(IASS Journal and Cochran-Hansen Prize Invited Session), I want to inform that an invited talk will
be delivered by Frauke Kreuter (University of Mannheim, University of Maryland, Institute for
Employment Research, Germany). The other invited speaker will be the winner of the Cochran-
Hansen Prize 2019 competition. Pedro Silva of IBGE, Brazil, has agreed to serve as discussant for
the session.
Contributed paper sessions will constitute a major share of the scientific programme of the ISI WSC
2019. It is foreseen that a good number of interesting presentations will be given by IASS members,
as in the previous WSC:s.
Denise Silva, the IASS representative in the Short Course Committee, informs that a short course
"Imputation methods for the treatment of item nonresponse in surveys" proposed by David Haziza
has been approved in the Short Course programme.
The ISI WSC 2019 will take place in 18-23 August 2019 in Kuala Lumpur, Malaysia. Registration
has been opened. More information is available at (http://www.isi2019.org/).
The Cochran-Hansen Prize of the IASS is awarded every two years and is given for the best paper
on survey research methods submitted by a young statistician for a developing country or transition
country. The prize winner of the 2019 competition will be invited to present his or her paper at the
ISI WSC 2019. There is still time for paper submission, it is open until 15 February 2019. Anders
Holmberg serves as the Chair of the Award Committee. The complete announcement is published
at (http://isi-iass.org/home/cochran-hansen-prize).
Report on conferences and workshops supported by IASS in 2018. As in the previous years
IASS has provided modest financial support for a number of conferences and workshops in survey
statistics. The following events have been supported in 2018.
The SAE 2018 Conference on Small Area Estimation, A Celebration of Professor Danny
Pfeffermann's 75th Birthday, was held in 16-18 June 2018 in Shanghai, China. The keynote
speakers were James O. Berger, Malay Ghosh and J.N.K. Rao. The second Award for
Outstanding Contribution to Small Area Estimation was given to Danny Pfeffermann.
Summaries of the keynote lectures, as well as an interview of Danny Pfeffermann by Lyu Ni
and Kai Tan and the dinner speech of Danny Pfeffermann, were published in Statistical Theory
and Related Fields, Volume 2, Issue 2, 2018. The conference was hosted by the East China
Normal University (ECNU).

The Survey Statistician 7 January 2019
MoLS2 – Second International Conference on the Methodology of Longitudinal Surveys was
organized in 25–27 July 2018 in Essex, UK. Four pre-conference workshops were arranged.
The conference highlighted broadly the methodology of longitudinal surveys and the advances
made in the last 12 years. A Wiley book entitled Advances in Longitudinal Survey Methodology,
edited by Peter Lynn, will be published containing monograph papers presented at the
conference. The event was hosted by the Institute for Social and Economic Research (ISER)
at the University of Essex. Interested readers can find the scientific programme and links to
abstracts of presentations at the conference website:
(https://www.understandingsociety.ac.uk/mols2).
The Baltic-Nordic-Ukrainian Network on Survey Statistics, together with partner organizations,
arranged its annual Workshop on Survey Statistics Theory and Methodology in 21–24 August
2018 in Jelgava, Latvia. The main theme of the workshop was "Population census based on
administrative data". Keynote speakers were Li-Chun Zhang and Anders Holmberg. In
addition, talks of seven additional invited speakers and 28 contributed papers were presented.
The winner of the first Best Student Paper Award was Diana Sokurova (University of Tartu,
Estonia) with a paper "The local pivotal method and its application on StatVillage data".
Congratulations! The workshop was hosted by the Latvia University of Life Sciences and
Technologies, Faculty of Economics and Social Development. Workshop programme and
abstracts plus slides of the presentations can be accessed at the workshop website:
(http://home.lu.lv/~pm90015/workshop2018/).
10ème Colloque francophone sur les sondages took place in 24–26 October 2018 in Lyon,
France. In addition to the opening and closing talks, the scientific programme contained a total
of 13 invited presentations and several contributed paper sessions. A special plenary session
for the presentation of the 2018 Waksberg Award laureate Jean-Claude Deville was arranged.
Links to papers of invited speakers and abstracts of contributed papers are given at the
conference website (http://sondages2018.sfds.asso.fr/).
The IASS community congratulates warmly Danny Pfeffermann, the Second SAE Award
laureate, and Jean-Claude Deville, the Waksberg Award 2018 laureate.
IASS Support to Conferences in 2019. The IASS Executive Committee has published a Call for
Requests for Support for Workshops and Conferences for events to take place in 2019. The
Executive Committee has decided to support financially the following four events meeting the criteria
of the call.
ITACOSM 2019, the 6th ITAlian COnference on Survey Methodology, will take place in 5-7
June 2019 at the Department of Statistics, Computer Science, Applications, of the University
of Florence. ITACOSM is a bi-annual international conference promoted by the Survey
Sampling Group (S2G) of the Italian Statistical Society (SIS) whose aim is promoting
methodological and applied research in survey sampling, in human as well as natural sciences.
The conference will include plenary (invited) sessions, specialized (invited) sessions on
specific topics, contributed sessions, and poster sessions. More information are available at
the SIS website:
(http://meetings3.sis-statistica.org/index.php/ITACOSM2019/ITACOSM2019).
BaNoCoSS-2019, The 5th Baltic-Nordic Conference on Survey Statistics, will be held in 16-20
June 2019 in Örebro, Sweden. BaNoCoSS-2019 is a scientific conference presenting
developments on theory, methodology and applications of survey statistics in a broad sense.
Keynote addresses are on Spatial survey sampling and analysis, and GIS, to be given by
Roberto Benedetti and Federica Piersimoni. Deadline for submission of titles and abstracts of
contributed papers and posters is 8 April 2019. BaNoCoSS-2019 is organized by the Baltic-
Nordic-Ukrainian (BNU) Network on Survey Statistics in collaboration with Örebro University
and Statistics Sweden. For more information please follow the website at
(https://www.oru.se/hh/banocoss2019).

The Survey Statistician 8 January 2019
EESW19, the sixth biennial European Establishment Statistics Workshop, will be held in
Bilbao, the Basque Country, Spain, on 24-27 September 2019. EESW9 will be hosted by
EUSTAT, the statistical office of the Basque Country. The first day is devoted to short courses,
followed by the traditional two-and-a-half day workshop. Under a broad heading of Using
modern technology for improving establishment statistics, EESW19 welcomes contributions
on all topics related to statistics about and for businesses and other organizational entities.
Further information can be found at the conference website:
(https://statswiki.unece.org/display/ENBES/EESW19).
In addition, IASS has decided to support financially a regional Survey Process Design
Workshop that will be organized as a one-day event in February 2019 at the Federal University
of Agriculture, Abeokuta, Ogun State, Nigeria.
The Survey Statistician publishes regularly methodological papers on developments in survey
statistics. The New and Emerging Methods section is open for such papers. Please contact me if
you want to endorse TSS by writing an article to the New and Emerging Methods section.
I complete my report by wishing Happy New Year 2019 for all readers of The Survey Statistician.
Risto Lehtonen ([email protected])

The Survey Statistician 9 January 2019
News and Announcements
The Second Congress of Polish Statistics
Along with the Polish Statistical Association, Statistics Poland organised the Second Congress of
Polish Statistics, held in Warsaw, 10–12 July 2018, which marked the 100th anniversary of founding
Statistics Poland (https://kongres.stat.gov.pl/en/).
The Congress lasted three days. The framework program of the event contained a series of thematic
sessions, including a jubilee panel on the history of Polish statistics, as well as sessions devoted to
Polish statistics on the international arena, methodology of statistical surveys, mathematical
statistics, regional statistics, population statistics, social and economic statistics, statistical data
issues and, also sports and tourism statistics.
In a Congress, which emphasised the contribution of Poles to the global treasury of statistical
knowledge, representatives of foreign institutions and scientific units participated. The Congress
constitutes a unique opportunity for the representatives of official statistics, research centres and
other partners involved in the study of social, economic and environmental processes to meet and
exchange their knowledge, views and experiences.
Welcome and Opening/Plenary Session presentations:
1. Dominik Rozkrut. 100 years of Statistics Poland: from historical perspective to forward look.
2. Czesław Domański. The role of the scientific community in the process of shaping public
statistics.
3. Stanisława Bartosiewicz. Three out of three on the beginning of population statistics of the
Second Polish Republic.
4. Graham Kalton. The Past, Present, and Future of Social Surveys.
To celebrate the 100th anniversary of the Polish Statistical Association in 2012 was established the
Jerzy Spława-Neyman Medal in order to appreciate the most outstanding statisticians, teachers of
statistics and all people of science that by their work significantly contributed to the development of
statistics or its education.
Laureates of Jerzy Spława-Neyman Medal 2018 awarded at the second Congress of Polish
Statistics 2018 are:
• Czesław Domański, University of Łódź.
• Marie Hušková, Charles University in Prague.
• Jan Kordos, Warsaw School of Economics.
• Mirosław Krzyśko, University of Adam Mickiewicz in Poznań.
• Carl-Eric Särndal, Statistics Sweden.
Congratulations to the laureates!

The Survey Statistician 10 January 2019
Big Data Meets Survey Science (BigSurv18) conference
The European Survey Research Association (ESRA) held the first conference on Big Data Meets
Survey Science (BigSurv18). The conference, held 25-27 October 2018, at the Universitat Pompeu
Fabra’s Research and Expertise Centre for Survey Methodology (RECSM) in Barcelona, Spain, was
a truly interdisciplinary and international event. More than 400 researchers and practitioners from
more than 45 countries who are working at the intersection of the social sciences and computer and
data science gathered to “Explore New Statistical Frontiers at the Intersection of Big Data and Survey
Science”.
BigSurv18 began with 143 delegates taking one of four stimulating short-courses and another 24
delegates participating in the “Green City Hackathon,” co-organized with the city of Barcelona. A
tone of collaborative problem-solving across disciplines was set as the main conference kicked off
with two inspiring keynote addresses and a plenary session.
The keynotes included “Automating Metadata Documentation” by Dr. Julia Lane (professor, New
York University [NYU] Wagner Graduate School of Public Service; provostial fellow, NYU Center for
Urban Science and Progress) and “Data Science for Public Good” by Dr. Tom Smith (managing
director, Data Science Campus of the Office for National Statistics, UK). Both were moderated by
Dr. Craig Hill (senior vice president; Survey, Computing, and Statistical Sciences; RTI International;
USA).
Dr. Frauke Kreuter (professor, Institute for Employment Research, University of Mannheim,
University of Maryland) organized an engaging plenary session, “Big Data, Surveys, and the Privacy-
Ethics Challenge,” which featured renowned experts on the topic.
Once the main scientific program began, delegates were spoiled for choice with 51 individual
sessions (including 2 poster sessions) scheduled across 2 full days. The conference emphasized
the combination of approaches from different disciplines for the collection, processing, and analysis
of data. Sessions focused on how researchers can combine perspectives from both areas: (1) that
which touches upon expertly designed small data carefully measuring human behaviors, attitudes,
and opinions and (2) that which centers on organic, electronic data capturing massive quantities of
observations about our everyday lives in real-time.
Topics of discussion ranged from generating summary statistics that describe entire populations to
leveraging fine-grained data that inform the context of each observation; from the sampling of
individuals within populations to considering the implications of “N=all”; and from applying the Total
Survey Error paradigm to adopting a total statistical uncertainty framework that will be needed to
encompass the new quality issues associated with Big Data. More information on the conference
and the program can be found here (https://www.bigsurv18.org/program2018).
Feedback from the delegates has been positive—with many describing the conference as
“awesome” with “rigor, breadth, and depth!” Organizers are now engaged in planning a continuation
of this conference—BigSurv20.
Much of BigSurv18’s success will be reflected in the forthcoming special issue of Social Science
Computer Review and an edited volume, published by John Wiley & Sons, that features selected
presentations from the event. Details on these two publications—which should be released in 2019
and 2020, respectively—will follow soon.
Antje Kirchner (Research Triangle Institute, USA)

The Survey Statistician 11 January 2019
62nd ISI World Statistics Congress 2019 (ISI WSC 2019)
The 62nd ISI World Statistics Congress is organized by the International Statistical Institute (ISI) in
Kuala Lumpur, Malaysia, August 18–23, 2019. Homepage: (http://www.isi2019.org/).
The list of Invited Paper Sessions (IPS) is announced.
The list of Special Topic Sessions (STS) is also confirmed and already announced in December
2018.
Individuals are most welcomed to submit a contributed paper for presentation at the ISI WSC 2019.
For the submission to be considered by the Local Programme Committee (LPC), it should include a
title, an abstract and a short paper of not more than 6 pages. The paper must not have been
published in any other conference proceedings or publication before the 62nd ISI WSC. The
copyright for the abstracts and papers in the proceedings resides jointly with the authors and the ISI.
Authors are free to publish expanded versions of the material elsewhere.
The contributed paper submitted is preferable to cover a wide range of topics nominating one of the
following themes: Applied Statistics, Big Data, Finance, Machine Learning and Data Discovery,
Official Statistics, Probability Theory, Social Statistics, Statistical Inference, Statistical Modelling,
Statistics Education, Simulation and Computation, Other areas of Statistics. Besides new or
improved statistical methods, cross-discipline and applied paper submissions are especially
welcome.
The submission of abstracts and papers for Contributed Paper Sessions (CPS) is open until 31
January 2019. See detailed submission guidelines at the ISI WSC website:
(http://www.isi2019.org/scientific-programme/).
Paper Submission for the Cochran-Hansen Prize 2019 Competition
The Cochran-Hansen Prize of the IASS is awarded every two years and is given for the best paper
on survey research methods submitted by a young statistician for a developing country or transition
country. The prize winner will be invited to present his or her paper at the 2019 World Statistics
Congress in Kuala Lumpur, Malaysia.
Submission of papers to the Cochran-Hansen Prize 2019 competition of the IASS is open until
15 February 2019. Papers must be sent to Dr Anders Holmberg, the Chair of the IASS 2019
Cochran-Hansen Prize Committee, email ([email protected]). The complete announcement is
published at (http://isi-iass.org/home/cochran-hansen-prize).
Measuring the 2030 Agenda for Sustainable Development
The 2030 Agenda for Sustainable Development is a global agenda, “to end poverty and hunger
everywhere; to combat inequalities within and among countries; to build peaceful, just and inclusive
societies; to protect human rights and promote gender equality and the empowerment of women and
girls; and to ensure the lasting protection of the planet and its natural resources. We resolve also to
create conditions for sustainable, inclusive and sustained economic growth, shared prosperity and
decent work for all, taking into account different levels of national development and capacities”
(United Nations General Assembly resolution A/Res/70/1).
The 2030 Agenda is a balance of the three pillars of sustainability – economic, social and
environmental – and there are 17 Goals and 169 targets associated with the 2030 Agenda.
In 2015, the United Nations Statistics Commission (UNSC) was tasked by the General Assembly to
develop and implement the Global Indicator Framework to measure the Sustainable Development

The Survey Statistician 12 January 2019
Goals (SDGs). To do this, the UNSC created the Inter-Agency Expert Group on Sustainable
Development Goal Indicators (IAEG-SDG) which is made up of 27 countries from all the regions of
the UN. Since 2015, the IAEG-SDG has been working with multilateral organisations, industry and
civil society to develop the Global Indicator Framework. In July of 2016, the Global Indicator
Framework was endorsed by the General Assembly as the starting point for measuring the SDGs.
Since July 2016, the IAEG-SDG continues to ensure the statistical robustness of indicators being
developed. To facilitate the implementation, indicators have been classified into three tiers.
• Tier I – Indicator is conceptually clear, has an internationally established methodology and
standards are available, and data are regularly produced by countries for at least 50 per
cent of countries and of the population in every region where the indicator is relevant.
• Tier II – Indicator is conceptually clear, has an internationally established methodology and
standards are available, but data are not regularly produced by countries.
• Tier III – No internationally established methodology or standards are yet available for the
indicator, but methodology/standards are being (or will be) developed or tested.
As of November 2018, there were 100 Tier I indicators, 82 Tier II indicators and 44 Tier III indicators.
In addition to these, there are 6 indicators that have multiple tiers (different components of the
indicator are classified into different tiers).
Over the course of the 2015 – 2030 period, there will be 2 occasions to revise the Global Indicator
Framework. The first is in 2020 and the second will be in 2025.
In addition to the development of the global indicator framework, the IAEG-SDG has also created
three working groups to address specific areas relevant to SDG indicator implementation. These are
Statistical Data and Metadata Exchange (SDMX), Geo-spatial information, and Interlinkages on SDG
statistics.
Membership to the IAEG-SDG is based upon regional representation and rotation every 2 years,
however some countries may remain in the group longer than that to ensure continuity.
Cara William (Statistics Canada, Canada)

The Survey Statistician 13 January 2019
Ask the Experts
What are alternative data sources, and how to use them?
Frauke Kreuter
Joint Program in Survey Methodology, University of Maryland
University of Mannheim & IAB, Germany
National Statistical Institutes (NSIs) around the globe find themselves in a significantly different
environment for obtaining information and providing statistical data for policy makers. For decades
data could be collected via face-to-face or phone surveys, however, we now increasingly see calls
to use alternative data sources to combat the rising costs of surveys as well as rising nonresponse
rates. Moreover, leveraging existing alternative data sources can not only reduce the cost of surveys,
but can also reduce the time it takes provide the desired information [1].
What are those alternative data sources everyone is talking about? The easiest way to think of
them is to think of data that are not collected through surveys or experiments but created through
different processes. In the U.S. administrative data are considered one form of alternative data
source, collected by government entities for program administration, regulatory, or law enforcement
purpose. This classification of administrative data sources as alternative data might seem strange to
those from countries in which the statistical system was founded on the use of administrative data,
such as Denmark, Finland, Iceland, Norway, and Sweden; or come from countries that base their
data collection on registers. However, in the U.S. (and other countries), access to administrative
data, for other than their primary purposes, has been limited so far -- a situation that is only now
changing, in part in response to the recommendations of the 2016 U.S. Commission on Evidence-
Based Policymaking and related efforts [2][3] and also given the always-expanding data needs of
users.
Structurally very similar to administrative data are so-called transaction data, resulting from
transactions between businesses and their customers or government entities. Like administrative
data, they are the by-product of other activities and their collection is designed to meet the purpose
of said activity. This shared feature is also one of the key challenges when using alternative data
sources. Salganik labels this difference as custom made vs. ready-made: experiments and surveys
are carefully tailored to a customer’s need, whereas administrative and transaction data come with
a set of variables needed for the primary purpose and a measurement that may or may not meet the
constructs of interest to a researcher or an NSI [4][5]. Often even harder to process with even less
clearly defined measurement properties are data from voluntary (and often deliberate) posts on
social media platforms or other online outlets. This mismatch between the measurements desired,
and the measurements provided in alternative data sources, means there is a good amount of post
processing needed when dealing with administrative data – not unlike the effort that goes into
designing a survey or an experiment.

The Survey Statistician 14 January 2019
Figure 1. Stylized depiction of effort and resources needed for traditional and alternative data
sources before and after data collection.
What is needed to make use of alternative data? The recommendations of the U.S. National
Academies of Science Panel on “Improving Federal Statistics for Policy and Social Science
Research Using Multiple Data Sources and State-of-the-Art Estimation Methods” include six
elements needed to make use alternative data [6]. First, to address the problem of insufficient
information in most of the alternative data sources, records from several data sources will need to
be linked (see Mulrow’s Ask the Expert post in the May 2017 IASS Newsletter). Second, data
collection and processing pipelines currently used by federal statistical agencies will need to change
to allow for enough transparency of the methods used to process and combine the data, and to
clearly communicate those methods to users. Third, because privacy threats increase with linked
datasets strategies need to be developed and implement to safeguard privacy while increasing
accessibility to linked data sets for statistical purposes. Fourth, new quality frameworks need to be
developed and should include additional dimensions that better capture user needs, such as
timeliness, relevance, accuracy, accessibility, coherence, integrity, privacy, transparency, and
interpretability. More dimensions also mean more attention needs to be paid to the tradeoffs
between different quality aspects of data. Fifth, most likely a new entity will be needed to facilitate
secure access to data and to allow for the combination of multiple data sources. Sixth, new skills are
needed for employees working in Statistical Agencies and researchers working with alternative data
sources. Besides knowledge of the already mentioned record linkage techniques, knowledge of
statistical methods for combining data from multiple sources is needed as well as skills in database
management, privacy-preserving and privacy-enhancing technologies, and a fundamental
understanding of the quality of the alternative data sources. Data users need an understanding of
the data generating processes and the consequences of quality compromises for analyses to be
done later on.
This list has without a doubt a U.S. centric bias and is most relevant to countries without existing
digital infrastructure designed for sharing data across functions. An interesting counter example exist
in Estonia [7]. However even in the best designed system, it will be important to understand how the
data are generated and what they can reasonably be used for (or not). It will also be important to not
only master the new skills, but to preserve some of the survey methodology knowledge to augment
the alternative data sources with data collection specifically designed to measure those elements
not captured in the alternative data sources. This was also the spirit of the first BigSurv Conference
in Barcelona last year, bringing together (big) data scientist and survey methodologists, as well as
in job postings of all big four U.S. tech companies (Amazon, Google, Facebook, and Apple) – looking
for survey methodologists.

The Survey Statistician 15 January 2019
References
[1] National Academies of Sciences, Engineering, and Medicine (2017) Innovations in Federal
Statistics: Combining Data Sources While Protecting Privacy. Washington, DC: The National
Academies Press. Retrieved from https://doi.org/10.17226/24652
[2] Commission on Evidence based Policy (2017) The Promise of Evidence-Based Policymaking.
Washington DC. Retrieved from https://www.cep.gov/
[3] Office of Management and Budget (2019) Federal Data Strategy. Washington DC. Retrieved
from https://strategy.data.gov
[4] Salganik, M. (2017) Bit by Bit: Social Research in the Digital Age. Princeton University Press
[5] Couper, M. (2013) Is the Sky Falling? New Technology, Changing Media, and the Future of
Surveys. Survey Research Methods, 7, 3, 145-156
[6] National Academies of Sciences, Engineering, and Medicine (2017) Federal Statistics, Multiple
Data Sources, and Privacy Protection: Next Steps. Washington, DC: The National Academies Press.
https://doi.org/10.17226/24893
[7] Hammersley, B. (2017) Concerned about Brexit? Why not become an e-resident of Estonia The
most advanced digital society in the world is a former Soviet Republic on the edge of the Baltic Sea.
Wired. 3/27/2018

The Survey Statistician 16 January 2019
New and Emerging Methods
Calibration methods for small domain estimation
Risto Lehtonen1 and Ari Veijanen2
1 University of Helsinki, [email protected] 2 Statistics Finland, [email protected]
Abstract. Small area estimation was discussed in this section of The Survey Statistician in the July
2010 issue by Danny Pfeffermann in his article "Small Area Estimation: Basic Concepts, Models and
Ongoing Research". A more comprehensive review article was published a couple years later
(Pfeffermann 2013). The Wiley book "Small Area Estimation, Second Edition" of 2015 by J.N.K. Rao
and Isabel Molina presents an update to Rao's monograph of 2003 on small area estimation. These
important sources cover model-based and design-based approaches on small area estimation (SAE)
and show in particular the progress in model-based methods, and the progress is ongoing. In this
article we introduce methods that incorporate assisting models in a design-based estimation
procedure for population characteristics (totals, means etc.) for subgroups or domains, including
small domains (with small sample size). We use logistic mixed models in model-assisted calibration
estimation of poverty rates for administrative regions (domains of interest). Statistical properties
(design bias and accuracy) of the method is compared with the classical model-free calibration
method of Deville and Särndal (1992) and further, with a model-based SAE method that relies on
the same logistic mixed model as the model-assisted counterpart. Our design-based simulation
experiments employ real data obtained from registers of Statistics Finland. The paper is partly based
on Lehtonen and Veijanen (2018).
Some keywords. Model-free calibration, model-assisted calibration, mixed models, empirical best
predictor, design-based simulation experiments
1. Introduction
Calibration techniques offer flexible tools for the estimation for finite populations by effectively
introducing auxiliary data in the estimation procedure. Calibration estimation was formalized in the
seminal paper of Jean-Claude Deville and Carl-Erik Särndal (Deville and Särndal 1992). The
methodology is widely used in official statistics and elsewhere for design-based estimation of totals,
means and other characteristics for populations and sub-populations (domains) whose sample sizes
are large enough for reliable estimation. In typical situations, the important sub-divisions of the
population are pre-specified and set in the sampling design by stratification. By using suitable
allocation techniques, sample sizes in the strata or planned domains are determined large enough
for reliable results, and estimation is performed by so-called direct calibration. In this approach,
estimation is carried out independently in each stratum. In small area or small domain estimation,
the domain structures of interest are not usually known in advance but emerge afterwards. Sample
sizes in such unplanned domains are random variates and can be small (even zero). For small
domains, the classical calibration can become unreliable because of the possible instability of the

The Survey Statistician 17 January 2019
estimates (e.g. Hidiroglou and Estevao 2016), and coefficients of variation for statistics of interest
appear too large to be released. This property restricts the use of direct calibration in small domain
estimation. Estevao and Särndal (1999, 2004) and Lehtonen and Veijanen (2009) discuss model-
free calibration in the estimation for domains.
Classical calibration estimation is called "model-free" (Särndal 2007) because an explicit model
statement is not necessarily needed. From the modelling point of view, model-free calibration is best
justified for continuous study variables, under an implicit linear fixed-effects model. Wu and Sitter
(2001) presented a model calibration (model-assisted calibration) method that involves explicit
model specification. Wu (2003) showed that the model calibration estimator of Wu and Sitter (2001)
for the finite population mean is optimal among a class of calibration estimators. Model-assisted
calibration allows flexible modelling with e.g. generalized linear models (GLM) and generalized linear
mixed models (GLMM) for different study variable types, including binary, polytomous, ordinal and
count variables. Recent developments in model-assisted calibration using for example
nonparametric and semiparametric methods and adaptive lasso techniques are presented in
Montanari and Ranalli (2005), Breidt and Opsomer (2009), Rueda et al. (2010), Wang and Wang
(2011), McConville et al. (2017) and Chen et al. (2018). Chandra and Chambers (2011) presented
a model-based view to the method of Wu and Sitter. Overviews on calibration estimation include
Fuller (2002), Särndal (2007), Kott (2009), Kim and Park (2010) and Park and Kim (2014).
Model-assisted calibration for small domain estimation is discussed for example in Fabrizi et al.
(2014), Lehtonen and Veijanen (2012, 2016) and Morales et al. (2018). The model-assisted
calibration method introduced in Lehtonen and Veijanen (2012) involves two phases. In the
modelling phase, a carefully chosen model is fitted for the entire sample data set. Predicted values
are calculated for population elements by using estimated model parameters and known values of
auxiliary variables. Predictions are used in the calibration phase when constructing the calibration
equation and a calibrated domain estimator. Calibrated weights are determined to produce the
population sums of predictions at a selected hierarchical level of population. Calibration can be
defined at the population level, at the domain level, or at an intermediate level, for example at a
higher regional level that contains the domain of interest. Lehtonen and Veijanen (2012) introduced
two subclasses of (essentially indirect) model-assisted domain estimators. In a semi-direct
approach, predictions for a given domain only are incorporated in the calibration phase, whereas in
a semi-indirect approach, predictions outside the domain (e.g. from neighbouring areas) also
contribute. As design-based methods, model-free calibration and model-assisted calibration involve
nearly design unbiased estimation for domain totals and other finite population parameters. For a
nearly design unbiased estimator, the design bias is, under mild conditions, an asymptotically
insignificant contribution to the estimator’s mean squared error (MSE) (Särndal, 2007, p. 99).
In small area estimation, mixed models are often imposed to account for spatial heterogeneity in
population. Logistic mixed models are chosen for binary or polytomous study variables. Examples
in model-based SAE are Jiang and Lahiri (2006), Datta (2009), Molina et al. (2014), Hobza and
Morales (2016) and Hobza et al. (2018). In model-assisted small domain estimation, unit-level
logistic mixed models, as well as fixed-effects models, have been incorporated in generalized
regression (GREG) and model-assisted calibration estimators. Examples are Lehtonen, Särndal and
Veijanen (2003, 2005), Lehtonen and Veijanen (2012, 2016, 2018) and Morales et al. (2018). We
present in Section 3 an empirical comparison of bias and accuracy of a model-assisted small domain
estimator and a model-based SAE method that use logistic mixed models.
The paper is organized as follows. The design-based and model-based methods considered here
are introduced in Section 2. In Section 3, the statistical properties (bias, accuracy) of the methods

The Survey Statistician 18 January 2019
are examined by using design-based simulation experiments with real data obtained from statistical
registers of Statistics Finland. Discussion is in Section 4.
2. Methods
2.1. Notation and preliminaries
Consider a finite population = {1,2,..., ,..., }U k N of size N, where k refers to the label of population
element. A sample s U of n elements is drawn from U with sampling design ( )p . Design weights
are = 1/k ka , where k is inclusion probability for k U . Sub-populations of U or domains of
interest are denoted dU , =1,...,d D , where D is the number of domains. In small domain estimation,
the number of domains can be large. The size of domain dU is
dN and the size of the corresponding
subset = d ds U s of sample s is dn . We discuss unplanned type domains; the realized domain
sample sizes dn are not controlled by the sampling design but are random. Therefore,
dn can be
small, even zero, in some domains. We do not address the case of zero sample elements in a
domain. Auxiliary information on variables related to the phenomenon of study plays a crucial role.
We assume an access to unit-level auxiliary information; let = 1( ,..., )k k Jkx xx denote a vector value
known for population element k U . We usually insert in the vector a value =0 1kx for all k. The
study variable values ky are obtained for sample elements k s . The sample and auxiliary data
sets are merged at the unit level by using unique identifiers that are available for both data sources.
Today, this option is met in many advanced statistical data infrastructures. Under the set-up above,
we assume a complete data set without missingness.
2.2. Models
In our empirical example we deal with a binary study variable. A logistic model formulation is a natural
choice. In small domain estimation, a mixed model is often preferred over a fixed-effects model, in
particular if the number of domains is large. A logistic mixed model for domain estimation
incorporates domain-specific random intercepts 2~ (0, )d uu N for domain dU and is given by
+
= = = =+ +
exp( )( | ) { 1| ; } , , 1,...,
1 exp( )k d
m k d k d d
k d
uE y u P y u k U d D
u
x ββ
x β, (1)
where = 0 1( , ,..., )k k k Jkx x xx with =0 1kx for all k, = 0 1( , ,..., )Jβ is a vector of fixed effects common
for all domains and m refers to the expectation under the model. The parameters β and 2
u are first
estimated by maximum likelihood methods (e.g. R package lme4 or SAS procedure GLIMMIX) and
estimates ˆdu are calculated. Predictions = = ˆˆ ˆ{ 1| ; }k k dy P y u β are then computed for dk U ,
=1,...,d D .
2.3. Estimators
Domain totals of a binary variable y are given by
= d
d k
k U
t y , =1,...,d D , (2)
where = 1ky refers to the occurrence of the event of interest (such as a person is in poverty) and
= 0ky otherwise. Proportion parameter (e.g. at-risk-of poverty rate) in domain d is defined as
= dd
d
tr
N. (3)
Calibration estimators for domain totals (2) are of the form
ˆ
d
d dk k
k s
t w y
= , =1,...,d D , (4)

The Survey Statistician 19 January 2019
where dkw denotes a method-specific calibrated weight for unit k in domain d. We denote ˆdMFCt the
model-free calibration estimator and ˆdMCt the model-assisted counterpart. A Horvitz-Thompson (HT)
type calibration estimator of proportion (3) in domain d is:
= =ˆ
ˆ , 1,...,ddHT
d
tr d D
N, (5)
where domain sizes dN are assumed known. A Hájek type estimator
= ˆˆ /
ddHA d dkk sr t w
provides an alternative to estimator (5).
In a comparison of model-assisted calibration with a model-based method we consider an empirical
best (EB) predictor type estimator of domain totals (2), given by
ˆ ˆ , 1,...,d
dEB kk Ut y d D
= = , (6)
see e.g. Hobza and Morales (2016). A HT type EB predictor of proportion (3) is defined as
= =_
ˆˆ , 1,...,dEBdEB HT
d
tr d D
N. (7)
Estimators ˆdMCt and ˆdEBt that use model (1) are of indirect type, as data on y-variable from other
domains also contribute in the estimation for a given domain.
2.4. Calibration estimators of domain totals
Calibration in domain estimation. A calibration weighting system is introduced by deriving
calibration equations for a given calibration vector and solving the equations under a chi-square type
distance function. In domain estimation, calibration equations are given by
= d d
di i i
i s i U
w z z , =1,...,d D , (8)
where diw is calibration weight for element i in domain d and iz denotes a generic calibration vector.
Using Lagrange multipliers we minimize:
−− −
2( )
d d d
dk kd di i i
k s i s i Uk
w aw
aλ z z (9)
subject to calibration equations (8). The equation is minimized by weights
( )= +1dk k d kw a λ z , (10)
where
−
= −
1
d d d
d i i i i i i
i U i s i s
a aλ z z z z , =1,...,d D . (11)
We assume
d
i i ii sa z z be invertible. In domain estimation, the weights (10) are applied over a
domain.
Model-free calibration (MFC). In classical model-free calibration of Deville and Särndal (1992), a
calibration equation is imposed:
k k kk s k Uw x x
= ,

The Survey Statistician 20 January 2019
that is, the weighted sample sums of auxiliary x-variable values reproduce the known population
sums (coherence or benchmarking property). In domain estimation with MFC, calibration vector iz
for (8) contains the original auxiliary x-variables; it is of the form
= = 0 1( , ,..., )i i i i Jix x xz x , di U , =1,...,d D , (12)
where =0 1ix for di U . Calibration equations (8) are given by
= = =
0 1, ,...,
d d d d d d
di i di i i i i Ji
i s i s i U i U i U i U
w w x x xz x x , =1,...,d D . (13)
We minimize (9) subject to (13) and obtain a MFC estimator of domain total dt of the form
= ˆ
d
dMFC dk k
k s
t w y , =1,...,d D , (14)
where weights dkw are computed by (10) and (11) with z-vector given by (12).
Calibrated weights in (14) for classical calibration are obtained without reference to any specific y-
variable. Thus, the same weight system can be used for a desired set of study variables (multi-
purposiveness). The phrase "model free" is justified, because there is no explicit model statement.
Estimator (14) is of direct type, because data on y-variable from a domain of interest only are used.
The right-hand part of (13) indicates that unit-level auxiliary data are not needed; it is enough to have
access to the known domain totals of x-variables.
Model-assisted calibration (MC). Model-assisted calibration for domain estimation allows explicit
modelling as a part of the calibration procedure. In the modeling phase for a binary variable, the
logistic mixed model (1) is fitted for the entire sample data set and predictions ˆky are calculated for
dk U , =1,...,d D . In the calibration phase, the predictions are incorporated in the calibration z-
vector, and calibration weights are determined by inserting the z-vector into formulas (8) to (11).
Calibration vector iz for (8) is:
= 0ˆ( , )i i ix yz , di U , (15)
where =0 1ix for di U . Variable 0x is included to force the sample sum of calibrated weights to
reproduce the known domain sizes dN . Predictions in (15) are computed as:
+
= =+ +
ˆ ˆexp( )ˆ , , 1,...,
ˆ ˆ1 exp( )
k dk d
k d
uy k U d D
u
x β
x β, (16)
where = 0 1( , ,..., )k k k Jkx x xx , dk U , β̂ is the vector of estimated fixed effects and ˆdu are estimates
for the domain-specific random intercepts. By equation (16), MC requires an access to unit-level
auxiliary data for computing the predictions. Calibration equations (8) are given by
= =
0
ˆ,d d d d
di i i i i
i s i U i U i U
w x yz z , =1,...,d D . (17)
We minimize (9) subject to (17) and obtain a model-assisted calibration estimator of dt :
= ˆ
d
dMC dk k
k s
t w y , =1,...,d D , (18)
where weights dkw are computed by (10) and (11) with z-vector given by (15).
It is justified to call MC estimator (18) indirect, because formulas (15) and (16) show that y-variable
values outside domain d contribute in deriving predictions ˆky for weights
dkw . For a further

The Survey Statistician 21 January 2019
specification, Lehtonen and Veijanen (2012) called estimator (18) semi-direct, as weight calibration
is performed at the domain level.
3. Monte Carlo experiments
Simulation design. The binary poverty indicator shows when a person’s equivalized income is
smaller than or equal to the poverty threshold, 60% of the median equivalized income M in the
population. The indicator for sample person k is defined as = ˆ{ 0.6 }k ky I y M , where = 1ky if a
person is in poverty and 0 otherwise. The quantity ˆ0.6M is the estimated poverty threshold, where
M̂ is estimated by HT from the estimated distribution function of equivalized income in the population
(Lehtonen and Veijanen 2012). The binary poverty indicator y acts as the study variable in the
calibration exercise.
For design-based simulation experiments, an adult population of about 600,000 persons was
constructed from real income data of Statistics Finland, containing 36 LAU level 1 regions in Western
Finland. In addition to the equalized income variable, our population contained three auxiliary
variables: two-category gender, three-category age and three-category labor force status. We
created indicator variables for classes of each qualitative variable; one indicator for sex and two
indicators for age and labor force status. The complete auxiliary x-vector for k U thus is
= 0 1 2 3 4 5( , , , , , )k k k k k k kx x x x x xx , where 0 1kx = . The covariates showed some explanatory power: in
logistic models, the complete x-data explained about 15% of the variation of y. As domains of interest
we used the D = 36 LAU-1 regions. Overall poverty rate in population was 14.3%. In the regions,
lowest rate was 9.9% and highest was 22.4%.
In the simulations, K = 1000 samples of n = 2000 units were drawn with simple random sampling
without replacement (SRSWOR) from the unit-level population. Design bias and accuracy of domain
poverty estimators d̂r were measured by absolute relative bias (ARB) and relative root mean
squared error (RRMSE):
1
ˆ ˆ( ) | (1/ ) ( ) | /K
d dj d d
j
ARB r K r r r=
= − and 2
1
ˆ ˆ( ) (1/ ) ( ) /K
d dj d d
j
RRMSE r K r r r=
= − .
Poverty rate (3) for domain d was estimated by HT type estimators = ˆˆ /d d dr t N , =1,...,d D , where ˆdt
is obtained for MFC by (14), MC by (18) and EB by (6). Our logistic mixed models (1) contained
regional random intercepts associated with LAU-1 regions. We computed average ARB and RRMSE
over three domain size classes defined by expected domain sample size.
Design-based calibration estimators. Results for model-free calibration MFC and model-assisted
calibration MC are in Table 1. ARB figures are not presented because both estimators appeared
nearly design unbiased.
Over all domains, indirect model-assisted calibration shows better accuracy than direct model-free
calibration. This holds for all domain sample size classes and is best visible in the smallest size
class. The difference in accuracy between MFC and MC declines with increasing domain sample
size. Accuracy figures are nearly equal in the largest size class. The logistic mixed model in MC
clearly tends to improve accuracy over MFC, whose implicit assisting model is a linear fixed-effects
model fitted separately in each domain. As a direct estimator, MFC may suffer from instability
problems in the smallest domains.

The Survey Statistician 22 January 2019
Table 1. Average relative root mean squared error (RRMSE) (%) of model-free and model-assisted
calibration estimators of domain poverty rates in three domain sample size classes in a design-based
simulation experiment.
Estimator Calibration vector & assisting
model
Expected domain sample size All 36
domains Minor <25 units
(10 domains)
Medium 25-50 units
(16 domains)
Major >50 units
(10 domains)
Direct estimator
Model-free calibration MFC 1 2 3 4 5(1
Calibratio
, , , , ,
n vector
)k k k k k kx x x x x =z 61.1 40.4 20.1 47.3
Indirect estimator
Model-assisted calibration MC
1 2 3 4 5
ˆCalibration vector (1, )
ˆ ˆˆ ˆ ˆexp( ) / (1 exp( )), ,
1,...,36, (1, , , , , )
k k
k k d k d d
k k k k k k
y
y u u k U
d x x x x x
=
= + + +
= =
z
x β x β
x
54.1 37.6 19.8 43.0
Model-assisted and model-based estimators. It is known that design-based and model-based
methods differ in their design-based properties. Design-based estimators are constructed nearly
design unbiased; model-based estimators do not possess this built-in property. We compared
empirically the bias and accuracy properties of model-assisted MC and model-based EBP. Both
methods use model (1) and employ the same auxiliary x-data. Simulation results are in Table 2.
A trade-off between design bias and accuracy is seen in the results. MC appears nearly design
unbiased as expected, and EB predictor is design biased. Mean ARB figures of EBP are large in the
smallest domains, and ARB remains substantial in the other domain classes too. The opposite side
of the coin shows the superiority of EBP in accuracy, notably in the smallest domains. The difference
in accuracy between MC and EBP declines with increasing domain sample size.
Table 2. Average absolute relative bias (ARB) (%) and average relative root mean squared error
(RRMSE) (%) of design-based model-assisted calibration estimator and model-based EB predictor
of poverty rates in three domain sample size classes in a design-based simulation experiment.
Estimator
Average ARB (%) Average RRMSE (%)
Expected domain sample size Expected domain sample size
Minor <25
Medium 25-50
Major >50
Minor <25
Medium 25-50
Major >50
Design-based estimator
MC 1.3 1.2 0.56 54.1 37.6 19.8
Model-based estimator
EBP 16.2 11.1 9.0 21.7 18.4 16.3
1 2 3 4 5
Model in MC and EBP:
( ) exp( ) / (1 exp( )), (1, , , , , ) , , 1,...,36m k k d k d k k k k k k ddE y u u u x x x x x k U d = + + + = =x β x β x
The results verify that the role of model is different in the two methods. EB predictor relies on the
model. EBP can be badly design biased if the model is misspecified in a given domain, and the bias
can dominate MSE. In MC, model is used as an assisting tool. MC remains nearly design unbiased
in every domain even under model misspecification. For both methods, model improvement results
in improved accuracy. In a SAE study on the effect of model improvement to accuracy, Lehtonen et
al. (2003) showed that when moving from a "weaker" model to a "stronger" model, average relative

The Survey Statistician 23 January 2019
improvement in MSE can be much larger for a model-based estimator than for a model-assisted
estimator, and the strength of the effect depends on the domain sample size.
Let us illustrate the trade-off between bias and accuracy by Figure 1. It shows the distribution of
relative error ˆ ˆ( ) ( ( ) ) /i d d i d dRE r r s r r= − , 1,...,1000i = , for MC and EBP in a large domain.
Figure 1. Distribution (%) of relative error of design-based MC estimator (left-hand panel) and model-
based EBP estimator (right-hand panel) of poverty rate in a large domain.
The expectation of the distribution of relative error for MC is about zero, implying nearly design
unbiased estimation. For EBP, the expectation differs from zero, indicating some design bias.
Variation of relative error of EBP is smaller than that of MC, suggesting slightly better accuracy for
EBP for a large domain. Lehtonen et al. (2005) reported related results for model-assisted GREG
estimators and model-based estimators of EBP type that use similar models.
4. Discussion
Classical calibration with direct model-free estimation becomes unreliable when domain or area
sample sizes get small. In these situations, model-based small area estimation methods are often
used, such as EBLUP and empirical best (EB) prediction methods. We introduced a related model-
assisted calibration approach for small domain estimation. An indirect model-assisted calibration
(MC) estimator and an indirect EBP type estimator were constructed that use logistic mixed models
for a binary study variable. We studied the bias and accuracy properties of the estimators by design-
based simulation experiments. Our results verified the near design unbiasedness of model-free and
model-assisted calibration estimators. The accuracy superiority of model-assisted calibration over
direct model-free calibration was observed in small domains in particular, where direct model-free
calibration often fails. A comparison of model-assisted calibration with model-based empirical best
predictor manifested a trade-off between bias and accuracy. While the model-assisted estimator
remained nearly design unbiased, the accuracy was worse than that of the model-based method.
The price that had to be paid by the model-based method for better accuracy was a risk of
uncontrolled design bias. The bias was most apparent in small domains.
In small area estimation literature, composite estimators that are constructed as a weighted
combination of design-based estimator and model-based estimator have been proposed as a
compromise method. Composite estimators are discussed for example in Rao and Molina (2015)
and Tzavidis et al. (2018). Lehtonen et al. (2003) reported empirical results on relative behaviour of
certain model-assisted, model-based and composite estimators for small domain estimation.
Hidiroglou and Estevao (2016) reported results from design-based simulation experiments on the
relative performance of selected design-based and model-based estimators of domain totals under

The Survey Statistician 24 January 2019
equal probability sampling. They used at least approximately design unbiased estimators (direct
model-free calibration estimators and an indirect modified regression estimator) and certain model-
based small area estimators (design-biased synthetic and EBLUP estimators and a pseudo EBLUP
that was constructed to account for model mis-specification). The modified regression estimator was
the best design-based estimator in accuracy. Design bias of the pseudo EBLUP estimator was
smaller than the bias of the other model-based estimators, and the bias decreased when domain
sample size grew. In accuracy, the pseudo EBLUP outperformed the other model-based estimators
as well as the best design-based estimator. Even if there are certain differences in the set-up, the
results are in many respects comparable to the results of this paper.
We used linear calibration with a chi-square type distance function. It is well known that linear
calibration can involve large variation of weights and negative weights. Such weights are often
considered unfeasible in practical applications. Many techniques have been proposed in the
literature to restrict the variation of weights and for weight trimming and smoothing (e.g. Deville and
Särndal 1992 p. 378, Chen et al. 2002, Park and Fuller 2005, Beaumont and Bocci 2008, Guggemos
and Tillé 2010, Kim 2010, Wu and Lu 2016). Alternative (asymptotically equivalent) distance
functions are possible in order to avoid unfeasible weights (Deville and Särndal 1992, Section 2).
However, it is not clear how these techniques behave in small domain estimation. More research is
needed in this area.
In small domain estimation with linear calibration, weight distributions can differ considerably
between model-free and model-assisted methods (Lehtonen and Veijanen 2018). In small domains,
the distribution of weights calibrated by the model-free method tends to become instable, and
extreme negative and positive weights can appear. The distribution of weights in model-assisted
calibration tends to be more stable, even in small domains. Model-assisted calibration weighting can
also be considered as a weight smoothing method for small domain estimation.
In model-assisted calibration, the built-in coherence property of model-free calibration to reproduce
the known (published) official statistics of the covariate or auxiliary variables is lost. Methods have
been proposed to overcome this restriction. Examples are the multiple model calibration method of
Montanari and Ranalli (2009) and a hybrid calibration method of Lehtonen and Veijanen (2018)
developed for small domain estimation.
The assessment of the precision of domain estimates is an important phase of an estimation
procedure. Estimation of design variance for classical calibration and GREG estimation are
discussed in Deville and Särndal (1992) and Deville (1999), for domain estimation see Lehtonen,
Särndal and Veijanen (2003) and Lehtonen and Veijanen (2009). Torabi and Rao (2008) address
MSE estimation of a GREG estimator assisted by a mixed model. Variance estimation in model
calibration is discussed for example in Montanari and Ranalli (2005) and Kim and Park (2010).
References
Beaumont, J.-F. and Bocci, C. (2008) Another look at ridge calibration. METRON, LXVI, 5–20.
Breidt, F.J., and Opsomer, J.D. (2009) Nonparametric and semiparametric estimation in complex
surveys, theory, methods and inference. In Rao, C.R. and Pfeffermann, D. (Eds.) Handbook of
Statistics, Vol. 29B. Sample Surveys: Inference and Analysis. Elsevier, Amsterdam, 103–119.
Chandra, H. and Chambers, R. (2011) Small area estimation under transformation to linearity.
Survey Methodology, 37, 39–51.
Chen, J., Sitter, R.R. and Wu, C. (2002) Using empirical likelihood methods to obtain range
restricted weights in regression estimators for surveys. Biometrika, 89, 230–237.

The Survey Statistician 25 January 2019
Chen, J.K.T., Valliant, R.L. and Elliott, M.R. (2018) Model-assisted calibration of non-probability
sample survey data using adaptive LASSO. Survey Methodology, 44, 117–144.
Datta, G. (2009) Model-based approach to small area estimation. In Rao, C.R. and Pfeffermann, D.
(Eds.) Handbook of Statistics, Vol. 29B. Sample Surveys: Inference and Analysis. Elsevier,
Amsterdam, 251–288.
Deville, J.-C. (1999) Variance estimation for complex statistics and estimators: Linearization and
residual techniques. Survey Methodology, 25, 193–203.
Deville, J.-C. and Särndal, C.-E. (1992) Calibration estimators in survey sampling. JASA, 87, 376–
382.
Estevao, V.M. and Särndal, C.-E. (1999) The use of auxiliary information in design-based
estimation for domains. Survey Methodology, 25, 213–221.
Estevao, V.M. and Särndal, C.-E. (2004) Borrowing strength is not the best technique within a wide
class of design-consistent domain estimators. Journal of Official Statistics, 20, 645–669.
Fabrizi, E., Salvati, N., Pratesi, M., and Tzavidis, N. (2014) Outlier robust model-assisted small
area estimation. Biometrical Journal, 56, 157–175.
Fuller, W.A. (2002) Regression estimation for survey samples. Survey Methodology, 28, 5–23.
Guggemos, F. and Tillé, Y. (2010) Penalized calibration in survey sampling: Design-based
estimation assisted by mixed models. J. Statist. Plann. Inference, 140, 3199–3212.
Hidiroglou, M.A. and Estevao, V.M. (2016) A comparison of small area and calibration estimators
via simulation. Joint Issue of Statistics in Transition and Survey Methodology, 17, 133–154.
Hobza, T. and Morales, D. (2016) Empirical Best Prediction under unit-level logit mixed models.
Journal of Official Statistics, 32, 661–692.
Hobza, T., Morales, D. and Santamaría, L. (2018) Small area estimation of poverty proportions
under unit-level temporal binomial-logit mixed models. TEST, 27, 270–294.
Jiang, J. and Lahiri, P. (2006) Mixed model prediction and small area estimation. TEST, 15, 1–96.
Kim, J.K. (2010) Calibration estimation using exponential tilting in sample surveys. Survey
Methodology, 36, 145–155.
Kim, J.K. and Park, M. (2010) Calibration estimation in survey sampling. International Statistical
Review, 78, 21–39.
Kott, P.S. (2009) Calibration weighting: combining probability samples and linear prediction
models. In Rao, C.R. and Pfeffermann, D. (Eds.) Handbook of statistics, Vol. 29B. Sample surveys:
Inference and Analysis. Elsevier, Amsterdam, 55–82.
Lehtonen, R. and Veijanen, A. (2009) Design-based methods of estimation for domains and small
areas. In Rao, C.R. and Pfeffermann, D. (Eds.) Handbook of Statistics, Vol. 29B. Sample Surveys:
Inference and Analysis. Elsevier, Amsterdam, 219–249.
Lehtonen, R. and Veijanen, A. (2012) Small area poverty estimation by model calibration. Journal
of the Indian Society of Agricultural Statistics, 66, 125–133.
Lehtonen, R. and Veijanen, A. (2016) Design-based methods to small area estimation and
calibration approach. In: Pratesi, M. (Ed.) Analysis of Poverty Data by Small Area Estimation.
Wiley, Chichester, 109–127.

The Survey Statistician 26 January 2019
Lehtonen, R. and Veijanen, A. (2018) Small area estimation with calibration methods. Paper
presented at "10ème Colloque francophone sur les sondages", October 2018, Lyon, France.
Lehtonen, R., Särndal, C.-E. and Veijanen, A. (2003) The effect of model choice in estimation for
domains, including small domains. Survey Methodology, 29, 33–44.
Lehtonen, R., Särndal, C.-E. and Veijanen, A. (2005) Does the model matter? Comparing model-
assisted and model-dependent estimators of class frequencies for domains. Statistics in Transition,
7, 649–673.
McConville, K.S., Breidt, F.J., Lee, T.C.M. and Moisen, G.G. (2017) Model-assisted survey
regression estimation with the lasso. Journal of Survey Statistics and Methodology, 5, 131–158.
Molina, I., Nandram, B. and Rao, J.N.K. (2014) Small area estimation of general parameters with
application to poverty indicators: a hierarchical Bayes approach. The Annals of Applied Statistics,
8, 852–885.
Montanari, G.E. and Ranalli, M.G. (2005) Nonparametric model calibration estimation in survey
sampling. JASA, 100, 1429–1442.
Montanari, G. E. and Ranalli, M. G. (2009) Multiple and ridge model calibration. Proceedings of
Workshop on Calibration and Estimation in Surveys 2009. Statistics Canada.
Morales, D., Rueda, M. and Esteban, D. (2018) Model-assisted estimation of small area poverty
measures: an application within the Valencia region in Spain. Social Indicators Research, 138,
873-900.
Park, S. and Kim, J.K. (2014) Instrumental-variable calibration estimation in survey sampling.
Statistica Sinica, 24, 1001–1015.
Park, M. and Fuller, W.A. (2005) Towards nonnegative regression weights for survey samples.
Survey Methodology, 31, 85–93.
Rao, J.N.K. and Molina, I. (2015) Small Area Estimation, 2nd ed. Wiley, New York.
Rueda, M., Sánchez-Borrego, I., Arcos, A. and Martínez, S. (2010) Model-calibration estimation of
the distribution function using nonparametric regression. Metrika, 71, 33–44.
Särndal, C.-E. (2007) The calibration approach in survey theory and practice. Survey Methodology,
33, 99–119.
Tzavidis, N., Zhang, L.-C., Luna, A., Schmid, T. and Rojas-Perilla, N. (2018) From start to finish: a
framework for the production of small area official statistics. JRSS A, 181, 927–979.
Wang, L., and Wang, S. (2011) Nonparametric additive model-assisted estimation for survey data.
Journal of Multivariate Analysis, 102, 1126–1140.
Wu, C. (2003). Optimal calibration estimators in survey sampling. Biometrika 90, 937–951.
Wu, C. and Lu, W.W. (2016) Calibration weighting methods for complex surveys. International
Statistical Review, 84, 79–98.
Wu, C. and Sitter, R.R. (2001) A model-calibration approach to using complete auxiliary
information from survey data. JASA, 96, 185–193.

The Survey Statistician 27 January 2019
Book and Software Review
Roderick J.A. Little and Donald B. Rubin (2002)
Statistical Analysis with Missing Data, 2nd ed.
John Wiley & Sons
Sahar Z. Zangeneh
Fred Hutchinson Cancer Research Center, USA
Missing data is an inescapable component of all real datasets, irrespective of scientific area and
discipline. The survey research community has long recognized this reality and profound attention
has been focused on minimizing the occurrence of missing observations and mitigating biases in
statistical estimates. Such pioneering efforts have been operationalized at the design, data
collection, and analysis levels, and have motivated a large body of research. Statistical methods for
handling known forms of nonresponse are readily available and built into standard software
packages, which can be reliably used for estimating standard summary measures. What is less
known to most data analysts is the statistical theory underlying each method.
Any method for handling nonresponse relies on assumptions, and blindly using a method could
outweigh its potential benefits. While there are numerous high-quality books on the topic of missing
data, most of these books either focus on specific application areas, narrow statistical methodology,
or require prior familiarity with the topic. Little and Rubin’s Statistical Analysis with Missing Data is
unique in presenting a unified approach to statistical analysis with missing data and providing a self-
contained and comprehensive overview of likelihood-based approaches for missing data. Such a
comprehensive and unified structure not only provides analysts with the ability to choose appropriate
methods for analysis, but also provides researchers with technical knowledge to extend existing--
and develop new -- statistical methodology. With survey response rates declining and surveys
evolving in terms of objectives, form and complexity, there is once again a dire need for development
of new statistical methods for analyzing incomplete data. Grown out of several decades of research
by two prominent statisticians, the classic Wiley book Statistical Analysis with Missing Data, 2nd
Edition, continues to be the ideal resource for (bio)statisticians as well as statistical analysts dealing
with incomplete data.
The content of the book is elegantly organized into three parts. While the book does assume a basic
knowledge of probability theory and mathematical statistics, each of the three parts increases in
degree of technicality and rigor. Part I caters to a more general audience: the general problem of
missing data is introduced in a simple manner and key concepts are presented. Standard methods
for handling missing data such as weighting and imputation are also presented in Part I. Part II
focuses on likelihood-based approaches to analysis with missing data. Part II is suitable for anyone
interested in using or developing methods for analyzing incomplete data. While more dense and
technical than Part I, Part II is self-contained and suitable for analysts, methodologists, and
practitioners. Various inferential tools are presented, and some of the concepts introduced in Part I
are revisited with more rigor. Part III extends the theory presented in Part II in analyzing more
complex data structures and is suitable for a more statistical audience. While many of the examples
are now dated, the development of the ideas and the manner in which the theory presented in Part
II is extended is extremely useful for carrying out new research.
Part I is defined by Chapters 1-5, and can be used as a stand-alone introductory textbook for
understanding and analyzing incomplete data. Chapter 1 introduces key concepts, definitions and

The Survey Statistician 28 January 2019
notation used throughout the book. Concepts of missing data patterns and mechanisms are
introduced in this chapter along with different approaches to handling missing data. Chapter 3
reviews methods of complete case analysis, including weighting methods commonly used in design-
based survey inference. Chapter 4 and 5 present imputation methods, first starting with very simple
single imputation in Chapter 4, and advancing to multiple imputation in Chapter 5. Measuring
imputation uncertainty is also thoroughly discussed in Chapter 5. The assumptions underlying each
of the methods presented are stated and their limitations are identified. Given the current
computational tools, Chapter 2 is a bit outdated and could be easily skipped all together, without
interrupting the flow of the book. The first part of the book also motivates more rigorous likelihood-
based theory, which is presented in Part II.
Part II is defined by Chapters 6-10 and covers likelihood-based approaches to statistical analysis
with missing data. Part II covers likelihood-based methods which ignore the missing data mechanism
and suffice in many practical applications. This part is geared towards a mathematical audience,
balancing computation and rigor, and in my opinion, forms the main thrust of the book. Chapter 6
reviews key concepts in the theory of maximum likelihood (ML): it starts first with likelihood-based
inference for complete data, emphasizing asymptotic and Bayesian methods for inference, and then
extends these concepts for incomplete data. Chapter 6 ends with a brief introduction to likelihood
theory for coarsened data, which is very technical. Similar to Chapter 1, Chapter 6 introduces
concepts used throughout Part II, many of which are revisited in subsequent chapters of the book.
Focusing on continuous multivariate normal data, Chapter 7 introduces methods based on
factorizing the joint likelihood. This chapter starts with maximum likelihood estimation for bivariate
normal data where one variable is subject to nonresponse, and gradually increases in dimension
and complexity, ending with multivariate data with special non-monotone patterns of missingness.
Inferential tools for parameter estimates are also introduced as well as computation using the Sweep
operator.
The Expectation Maximization (EM) algorithm and its extensions are introduced in Chapters 8 and
9. Chapter 8 first outlines the need for iterative methods of maximizing the likelihood function.
Several methods, including the EM algorithm are introduced along with their convergence properties.
The remainder of Chapter 8 introduces extensions of the EM algorithm and compares and contrasts
their features. Chapter 9 surveys large sample inferences based on maximum likelihood, when ML
estimates are obtained using EM-type algorithms. Asymptotic methods are reviewed along with
resampling and Bayesian methods of inference. Chapter 10 is devoted to Bayesian simulation
methods. This chapter starts with iterative methods such as data augmentation and the Gibbs
sampler, and revisits multiple imputation (MI) within the framework of Bayesian inference.
Convergence properties and large-sample features of resulting estimators are presented.
Construction of approximate test statistics are also briefly surveyed. This chapter ends with
alternative methods for creating multiple imputations, which are useful in situations where the joint
distribution of the variables is unknown or complex, and assessing convergence is difficult and time-
consuming. In contrast to Chapters 4 and 5 which present MI in a very intuitive manner using real
data examples, Chapter 10 is dense and mathematical.
Part III is defined by Chapters 11-15. This part focuses broadly on likelihood-based approaches for
analyzing incomplete data, when the standard assumptions outlined in Parts I and II do not hold.
The missing data mechanism continues to be assumed ignorable until the end of Chapter 14. The
assumption of ignorability is only relaxed in Chapter 15, where nonignorable missing data are
introduced and briefly surveyed. Chapters 11 and 12 present maximum likelihood estimation
assuming the data is multivariate normal. Chapter 11 studies models assuming different dependence
structures. Examples include linear regression, mixed effects and time-series models. Robust
methods for estimation and inference are presented in Chapter 12. Chapter 13 relaxes the
assumption of multivariate normality and studies ML estimation for partially classified contingency
tables: estimators obtained from both unconstrained models and constrained log-linear are
presented along with corresponding methods for inference. Consistent with the rest of the book,
methods of inference based on large sample theory and Bayesian methods are presented. Building

The Survey Statistician 29 January 2019
upon the previous two chapters, Chapter 14 presents methods for datasets exhibiting both
continuous and categorical data. The final chapter of Part III and last chapter of the book is chapter
15, which introduces nonignorable missing-data models and briefly reviews the literature on this
topic. This chapter is perfect for a savvy investigator familiarizing themselves with challenges with
data that are missing not at random, as well as a researcher wanting to contribute to this area.
Almost two decades since its release, Little and Rubin’s Statistical Analysis with Missing Data,
remains a timeless resource for anyone analysing or wanting to do research for incomplete data. In
particular, its emphasis on underlying patterns and mechanisms, and simultaneous presentation of
various inferential tools, facilitate choosing appropriate methods for analysis, and enable accurate
comparison of approaches. Its reference list provides the curious reader a great resource on the
classical literature and allows him/her to navigate through the recent research. In the era of big data,
more and messier data will increasingly become available. Such increased volume and variety of
missing data necessitates analysts to understand and correctly choose appropriate methods, and
for researchers to develop new methods when existing methods fail.
Richard Valliant and Jill A. Dever (2017)
Survey Weights: A Step-by-step Guide to Calculation, 1st ed.
Stata Press
Andrés Gutiérrez
Statistics Division of the United Nations Economic Commission for Latin America and the
Caribbean, Colombia
This book takes to the reader to a comprehensive journey in the initial steps of the analysis of a
complex survey. The definition of sampling weights is one of the most crucial tasks for the
methodologist to implement. Proper adjustments in the survey weights will yield to unbiased and
precise inferences about the parameters of interest in the survey. However, following a naïve
approach to the adjustment of sampling weights, or even worse, doing nothing to face the
deficiencies of sampling frames and the nonresponse reality, will yield to inadequate information,
and consequently poor decision making that will affect directly to the society that relies on the
reliability and consistency of survey data.
The book starts with a general overview of the weighting process, defining the proper statistical
context in which this kind of inference is carried out. Mainly, I found Figure 1.1 very clarifying about
the process of representing a whole population from a selected sample from a defective sampling
frame. In the first chapter, the authors also define the basic concepts for the reader to get used to
the terminology that they will be using in the remaining chapters. Also, they present a quick and non-
comprehensive introduction to some of the most commonly used sampling designs and introduce
the critical topic of disposition codes that will define every single adjustment of sampling weights
over the rest of the book.
Chapter two presents the first step when computing survey weights. They result from the definition
of the sampling design. Therefore, the authors show some basic examples related to simple random
sampling, stratified simple random sampling with varying stratum sizes, probability proportional to
size sampling and multistage sampling. All these examples come with some Stata code that will
select a sample according to the sampling method discussed and will generate the corresponding
sampling weights. Finally, eligibility adjustment is briefly discussed as it is the most straightforward
adjustment presented in the book.
Chapter three discusses the topic of nonresponse adjustments. The authors present the types of
nonresponse and their patterns associated with. Then simple class adjustments are performed as a
way to reduce weights variability. Therefore, the authors discuss some techniques for the estimation

The Survey Statistician 30 January 2019
of propensity scores, and they present the corresponding Stata code needed to implement such an
adjustment. One attractive feature of this chapter is that the authors present classical methods based
on logistic regressions as well as more complicated models such as regression trees, random forest,
boosting, and so forth.
The next chapter presents a further explanation on a topic that deserves much attention: calibration.
The authors discuss some of the traditional approaches to calibration, such as poststratification,
raking, and general calibration. The way as they present the methodological applications are
motivating: however, the basic user will find it a little tricky to follow them, because authors use some
Stata complements, written by some other researchers, and attention may deviate from the central
topic to a computational issue. Despite this workaround, the reader will find useful the rest of the
chapter, where the authors present some practical problems such as negative calibration weights,
reduction of weight variability and calibration to sample estimates.
One of the most important topics in practice is introduced in chapter five. The authors discourse the
subject of variance estimation for a variety of sampling estimators. They first introduce the theoretical
approach through the use of sampling formulas, and then they give the general result of the ultimate
cluster technique, where a single-stage stratified with-replacement sampling design is considered.
This technique is presented for both linear and nonlinear estimators, and comprehensive examples
are given along with their Stata codes. Consequently, they show a discussion about the methods
based on replicates: Jackknife, balanced repeated replication (BRR) - where Hadamard matrices
and the Fay adjustment are explained, and the finite population version of the Bootstrap. Some
advice and guidance are presented in the chapter, and I am sure that the reader will find this chapter
so valuable as the authors explain procedures step-by-step.
It is my impression that chapter six would find a better place at the final of the book (as an appendix).
Although the information contained in that chapter is essential, especially for those survey
methodologists working with nonprobability surveys, the reading is not fluent, because before and
after that very chapter the authors are discussing weighting from a design-based perspective, and
chapter six (in the middle of the book) is about model-based inference. The authors present some
predictors for a population total, based on regression models; later, they define the corresponding
weights as a function of the estimated regression coefficients.
Chapter seven returns to the design-based context discussing two-phase sampling, and a variety of
problems that methodologist face in complex situations. Also, the authors present a complete
discussion about the use of survey weights when estimating analytical quantities, such as regression
coefficients, and they discuss whether to use weights or not. Finally, after a comprehensive
presentation of the adjustments done to the original sampling weights by the survey methodologists,
the book concludes with an essay about survey quality. I found myself astonished before this
excellent excerpt where authors show their expertise and seniority. The reading is clear as they
summarize the practice of a good weighting process and give the reader many hints to examine the
quality and pertinence of every single step in the adjustment of the weights.
It is noticeable how Stata users are growing all over the segment of official statistics, and they would
benefit from this book. However, as a native R user, I found it very valuable as, for myself, it was
effortless to translate all the Stata code into R code or SAS code. Across all the computational
platforms that can be used, when it comes to dealing with complex survey data there appear to be
a common language. First, defining the strata, then describing the primary sampling units, then the
corresponding weights, and so on. Because of this similarity, the book will be very much appreciated
for everyone who earns a basic knowledge of statistical programming, independent from the
platform.

The Survey Statistician 31 January 2019
Country Reports
ARGENTINA
Reporting: Veronica Beritich
National Study on the Profile of Persons with Disabilities
The Principles and Recommendations for Population and Housing Censuses, Revision 2, of the
United Nations (UN, 2010), based on the Washington Group proposal, dedicate a section to the
inclusion of the measurement of disability in Population Censuses and in complementary or specific
surveys. The concept "disability status" aims to "characterize the population with and without
disability". People with disabilities are those who "have a greater risk than the general population of
experiencing restrictions in their development."
The need to quantify, to know and to establish the needs of the population with disabilities in the
territory at a national and regional level constitutes a sustained and intensified historical demand in
Argentina. This allows government to estimate the demand of resources that are required for their
assistance. Additionally, counting with this essential information for formulating public policies will
favor greater integration of disables not only in the field of health, but also in education, employment
and urban planning.
The National Institute of Statistics and Censuses (INDEC) presents the preliminary results of the
National Study on the Profile of Persons with Disabilities, in agreement with the National Agency for
Disability (ANDIS), within the framework of the National Disability Plan (decree n ° 868/2017). During
April and May 2018, INDEC interviewed around 41,000 private homes in urban areas of 5,000 and
more inhabitants throughout the national territory. It used the direct interview methodology with digital
devices, or tablets. This operation has national and regional representation, involving six statistical
regions: Great Buenos Aires, Northwest, Northeast, Cuyo, Pampean, and Patagonia.
The preliminary results of the study on July 19 present the prevalence of difficulties and main
sociodemographic characteristics of the population of 6 years and over living in private homes in the
urban area, in localities of 5,000 and more inhabitants of the country.
According to the “International Classification of Functioning, Disability and Health (CIF)” from the
World Health Organization (WHO, 2001), “disability” refers to any limitation in the activity and
restriction in the participation, originated in the interaction between a person with a health condition
and the contextual factors (physical, human, attitudinal and sociopolitical environment), in order to
develop in their daily life within their physical and social environment, according to their sex and age.
This study aims to quantify the population of 6 years and over with difficulties to see, hear, walk or
climb stairs, grab and lift objects with their arms or hands, take care of themselves (for example, to
bathe, dress or eat alone), talk or communicate, understand what is said, learn things, remember or
concentrate, control their behavior, and play with other children of their age (only for the population
aged from 6 to 12 years old). It also includes people using a hearing aid, and people having a valid
disability certificate, even if they do not have a difficulty.
The specific objective is to describe the profile of the population with difficulties according to:
relationship or kinship with the rest of the household members, sex, age, place of birth, health
coverage, social security, educational characteristics, conjugal situation, work characteristics,
possession and use of disability certificate, age, origin of the difficulty, and housing conditions.

The Survey Statistician 32 January 2019
The operative definition is "People with difficulty" involving those people with at least one answer
"yes, a lot of difficulty" or "cannot do it" in the questions about difficulties.
The prevalence of persons with difficulty of 6 years and over is 10.2%. In absolute terms, it
corresponds to an estimate of 3,571,983 people living in localities of 5,000 or more inhabitants. Cuyo
region has the highest proportion of people with impairment (11.0%) and Patagonia region has the
lowest proportion (9%).
In general, prevalence is greater for women (10.8%) than for men (9.5%). Among people aged 80
years and over, there is a difference of 11% between both sexes. Besides, about 50% of women
aged 80 and over have some difficulty. The prevalence of 5% among the youngest persons, from 6
to 39 years old is lower than in the adults group, from 40 to 64 years old (12%). Prevalence for
people aged 65 and over exceeds 25% and, in people aged 80 and over, it is 46.6%.
Among males with difficulty, 32.5% correspond to a population aged 65 and over. Meanwhile, in the
case of women with difficulty, prevalence in that age group reaches 41.9%. Among the population
with only one difficulty, the most frequent kind is motor difficulty (42.7%), followed by visual (23.3%),
auditory (18.6%), and mental-cognitive difficulties (12.7%). Speech and communication (1.5%) as
well as self-care (1.2%) are the least prevalent.
In the age group 6 to 14 years, those who have only mental-cognitive difficulty predominate with a
48.3% prevalence. Among those 65 and over, having motor impairment only stands out (53.2%).
Meanwhile, in the group of 15 to 64 years, having motor difficulty only (39.9%) or having visual
difficulty only (30%) are dominant.
A valid disability certificate mainly allows to obtain a free transport pass, comprehensive medication,
medical coverage, and to obtain rehabilitation benefits like transportation, educational benefits, etc.
Approximately 60% of people with difficulty do not have a certificate of disability but, among those
who have a valid certificate, only 9.5% do not use it.
General information on this survey can be found at (https://www.indec.gov.ar/).
For further information, please contact [email protected].
CANADA
Reporting: Laurie Reedman
A pilot project using Municipal Wastewater to Measure Cannabis Consumption:
Experimental Estimates
Over the last year Statistics Canada has been updating the national statistical system to capture the
social and economic changes related to the legalization of cannabis. A key set of information pertains
to the consumption of cannabis in Canada. Given that cannabis was previously illegal accurate
measures of consumption were difficult to obtain as the stigma associated with use, or reluctance to
disclose purchases from non-regulated suppliers are two factors that could contribute to under-
reporting.
In an effort to address the issue of under-reporting Statistics Canada is exploring the use of a new
technique called Wastewater-based Epidemiology (WBE). WBE has been used in Europe since
2007 to report on the relative consumption of different types of drugs in large cities. When a person
consumes cannabis (THC), his or her body processes the cannabis into a metabolite THC-COOH
that is later eliminated from the body into the wastewater system. WBE involves sampling municipal
wastewater flows, and conducting chemical analysis of the samples using specialized equipment
and techniques to measure concentrations of compounds in the wastewater, and in this case, THC-
COOH. The advantages of WBE include low cost, no burden on residents or businesses, quick

The Survey Statistician 33 January 2019
turnaround time from sampling to reporting, the ability to report for fairly small areas such as a single
large city, and importantly, the potential to more accurately determine the total mass of cannabis
consumed.
Statistics Canada has implemented a pilot-test of wastewater-based epidemiology. The pilot project
covers parts of five large urban centres across the country, and close to 8.4 million people. Each site
is sampled continuously during the second week of the month. Sampling started in March 2018, and
will continue through the spring of 2019. All processes and analytical performance are compliant with
the Sewage Analysis Core Group Europe (SCORE), a worldwide academic consortium specializing
in wastewater-based epidemiology.
Consumption of cannabis is calculated as the product of drug metabolite concentration, flow rate
through the wastewater treatment plant, excretion rate and drug potency, divided by the population
served by the wastewater treatment plant. A scaling factor can also be applied to achieve daily,
weekly or annual estimates. In the case of cannabis, there are many different products available,
with different potency levels and different modes of consumption. The rate at which the metabolite
is eliminated from the body depends on all these factors. For this reason, a composite excretion rate
should be calculated to account for the relative popularity of the different products. However, to date
we do not have all the parameters needed to calculate a composite excretion rate, therefore an
approximation cited in WBE literature is used.
Estimates from the first few months of data collection are coherent with what researchers have found
through Statistics Canada surveys, that is, the annual total consumption of cannabis in Canada is in
the range of 500 to 1500 metric tonnes, and regular cannabis users are consuming on average just
under 1 gram per day. The wide uncertainty is a reflection of our lack of confidence in the true
distribution of excretion rates and potency of cannabis products, and variability in the monthly data.
FIJI
Reporting: M. G. M. Khan
Fiji National Housing and Population Census 2017
The Fiji Bureau of Statistics (FBoS) had its 7th round of Housing and Population Census from 17th
September- 8th October 2017. A de-facto method of counting was used where each persons were
enumerated wherever they were during census night which was 17th September. Computer Assisted
Personal Interview (CAPI) was used for the first time in the history of Census taking in Fiji via the
Survey Solutions an application provided by the World Bank. The first Census release went into
publication two months after the Census. Info graphics have been used extensively in the 2nd
release. The 2017 Census results are available online at
(https://www.statsfiji.gov.fj/index.php/census-2017/census-2017-release-1).
Contact persons: Ms Maria Musudroka ([email protected]),
Mr Mosese Qaloewai ([email protected]).
Seasonal Adjustment of Time Series Data
FBoS has been releasing Bi-Annual Seasonally Adjusted Tourist Arrival since December 2016.
Since May 2018, Seasonally Adjusted Visitor Arrivals have been released on a monthly basis. This
is a development work and the Australian Bureau of Statistics (ABS) has provided technical support.
The software currently used for Seasonal Adjustment is SEASABS (Seasonal Adjustment Software
for ABS) provided freely by ABS. Seasonally Adjusted Fiji Visitor Arrivals releases are available
online at (https://www.statsfiji.gov.fj/index.php/latest-releases/tourism-and-migration/visitor-arrivals).
Contact persons: Ms Shaista Bi ([email protected]), Mr Rupeni Tawake ([email protected]).

The Survey Statistician 34 January 2019
2014 GDP Rebase
With the increase in demand for a recent base year, the Fiji Bureau of Statistics is currently working
on a GDP rebase for the year 2014. A Supply and Use table for 2014 will also be compiled. The
2014 industry reports for the entire economy is used in the GDP rebasing exercise. Apart from the
industry reports, the indicators and deflators used for GDP estimation like the Industrial Production
Index, Consumer Price Index, Import & Export Price Index and Building Material Price Index will all
be rebased to the year 2014.
These are important development works to update Fiji’s GDP by expenditure and income approach
which are currently available up to 2011. These statistics are published on our website
(https://www.statsfiji.gov.fj/) as well as on our quarterly publication titled Key Statistics.
Contact persons: Ms Amelia Tungi ([email protected]), Ms Artika Devi ([email protected]).
Household Income and Expenditure Survey (HIES) 2019-2020
FBoS is currently preparing for the 2019-2020 HIES. The HIES is a year-long nationwide survey
which gathers information on household income and expenditure from a representative sample of
households. The major uses of HIES data are as follows:
1. The reweighting of the Consumer Price Index (CPI).
2. Benchmark estimates are derived when such surveys are carried out while indicators are
used to provide non-survey year estimates.
3. The collection of Household Sector information which is an important input to the compilation
of GDP.
4. Reveal the extent and nature of poverty in Fiji.
5. Informal sector studies.
A new module will be included in the 2018-2019 HIES and is titled ‘Multidimensional Poverty’. CAPI
will also be used for the first time in this survey. The contact persons are Ms Maria Musudroka
([email protected]) and Mr Mosese Qaloewai ([email protected]).
LATVIA
Reporting: Mārtiņš Liberts
Workshop of the Baltic–Nordic–Ukrainian Network on Survey Statistics 2018
The Workshop of the Baltic–Nordic–Ukrainian Network on Survey Statistics 2018 was organised in
Jelgava (Latvia) on August 21–24. It was the twenty-second annual event organised by the Baltic–
Nordic–Ukrainian (BNU) Network on Survey Statistics (https://wiki.helsinki.fi/display/BNU). The aim
of the workshop was to maintain the cooperation between survey statisticians in Baltic and Nordic
countries, Ukraine and Belarus. The objectives were to present recent achievements and results,
learn from teachers and colleagues, discuss the future, share opinions and experience and
strengthen contacts between survey statisticians. The main topic of the workshop in 2018 was
“Population census based on administrative data”. Other survey statistics related topics were
presented as lectures or contributed papers.
There were 61 participants from 12 countries – Austria, Belarus, Estonia, Finland, Latvia, Lithuania,
Norway, Poland, Russia, Sweden, Ukraine, and the United Kingdom. The audience of the workshop
was diverse – consisting of undergraduate students, research students, university teachers and
practising statisticians.
The keynote speakers were Prof. Li-Chun Zhang (University of Southampton, UK & Statistics
Norway) and Dr. Anders Holmberg (Statistics Norway). Keynote speakers gave a series of six

The Survey Statistician 35 January 2019
lectures entitled “The past, present and future of population censuses: Methodology and quality
aspects when data sources are being reused and combined to transform a census system”. There
were seven lectures given by invited speakers – Maciej Beręsewicz (Poznań University of
Economics and Business, Poland & Statistical Office in Poznań, Poland), Natallia Bokun (Belarus
State Economic University), Juris Breidaks (Central Statistical Bureau of Latvia), Danutė
Krapavickaitė (Vilnius Gediminas Technical University, Lithuania), Manuela Lenk (Statistics Austria),
Prof. Li-Chun Zhang (University of Southampton, UK & Statistics Norway), and Carl-Erik Särndal
(Statistics Sweden). There were 28 presentations of contributed papers all discussed by invited
discussants.
The best student paper award was announced for the first time at the BNU events. Six papers
presented at the workshop were competing for the award. The winner of the first BNU Best Student
Paper Award is Diana Sokurova (University of Tartu, Estonia) with a paper titled “The Local Pivotal
Method and its Application on StatVillage Data”. Congratulations!
The sponsors of the workshop were the International Statistical Institute (World Bank Trust Fund for
Statistical Capacity Building), the International Association of Survey Statisticians, the Nordplus
Higher Education program (Nordic Council of Ministers), and the Central Statistical Bureau of Latvia.
The next annual event organised by the BNU network will be the Fifth Baltic–Nordic Conference on
Survey Statistics (BaNoCoSS) organised in 16–20 June 2019 in Örebro, Sweden.
The BNU workshop 2018 website: (http://home.lu.lv/~pm90015/workshop2018).
For further information, please contact [email protected].
MALAYSIA
Reporting: YBhg. Dato’ Sri Mohd Uzir Mahidin
Key features of the My Local Stats initiative
My Local Stats is disseminated via
application and publication. In line with
the Department of Statistics Malaysia,
2015-2020 Transformation Plan,
Strategy 3: Strengthening the Statistical
Delivery System, an interactive system
mobile application known as My Local
Stats was developed by the Department
of Statistics, Malaysia (DOSM).
My Local Stats is developed in two
versions: web and the smartphone
(mobile apps). It allows users to access
statistics up to the district level through
the DOSM website and their respective
smartphone apps. My Local Stats 1.0
(Phase 1) provides the latest statistics of
the number of establishments by major
district, derived from the Economic Census. Birth and death statistics as well as population estimates
by regions for 2015 and 2017 are also available.

The Survey Statistician 36 January 2019
The first publication of My Local Stats was introduced in 2017. This publication contains Social and
Economic statistics up to the district level. Social statistics comprise Basic Information; Population;
Housing; Labour Force; Household Income & Expenditure; Education; Health; Welfare Services;
Public Safety; Communication and Recreation; Internet and Social Media; and Basic Amenities.
Meanwhile, the economic
statistics comprise Gross
Domestic Product (GDP);
Consumer Price Index (CPI);
Export & Import; Agriculture;
Mining and Quarrying;
Manufacturing; Construction
and Services.
This publication was launched by the Deputy Prime Minister Malaysia, Dato’ Seri Dr Wan Azizah Dr
Wan Ismail on 26th July 2018 at the Multimedia University, Cyberjaya.
NEW ZEALAND
Reporting: Susmita Das
Stats NZ exploring different ways to collect household survey information
Stats NZ is determining how it can integrate its existing household surveys into a yet-to-be-
developed large-scale attribute survey.
Stats NZ is in a strong position to integrate survey content because of its ongoing work standardising
production and collection systems. The census attribute survey being developed as part of the
proposed new census model will also aid this project. Other than the post-censal surveys, the three
main surveys carried out by Stats NZ are the Household Labour Force Survey (HLFS), the General
Social Survey, and the Household Economic Survey.
The survey content could be integrated in various ways:
• dropping existing surveys and developing a new one
• merging existing surveys to have fewer surveys
• combining some stages of existing surveys, for example making data collection a single
process.
Initially we identified a set of criteria to decide which options should be considered. Five options were
then assessed: full integration, no integration, and three intermediate options. Each option was then
rated based on user and producer acceptability, the extent of sampling method changes, sample
sizes and sampling cycle, reduced costs, flexibility gains, and loss of information.
The strongest option was integrating all household surveys, except the HLFS, into the new census
attribute survey. The fallback option was to keep all the surveys separate but make use of higher
pooling opportunities for some of the content. We are currently identifying what steps are needed to
obtain the preferred option.
Administrative data census model
Stats NZ is also investigating an administrative data census model that would combine linked
administrative data and survey sources. A large-scale attribute survey sampling 5 percent of the
population annually would collect a range of social and economic variables down to small areas and
small population groups that cannot otherwise be obtained from linked administrative data sources.
For more information, please contact [email protected].

The Survey Statistician 37 January 2019
POLAND
Reporting: Tomasz Żądło
Second Congress of Polish Statistics
The Second Congress of Polish Statistics took place in Warsaw from 10th to 12th July 2018, on the
100th anniversary of the founding of Statistics Poland. It was organized by Statistics Poland and the
Polish Statistical Association. Almost 500 participants took part in 32 sessions including four
sessions on “Survey Sampling and Small Area Estimation” and three sessions on “Population
statistics”.
The detailed program is available here
(https://kongres.stat.gov.pl/images/pdf/harmonogram_II_kongresu_statystyki_polskiej_en.pdf).
The book of abstracts and all presentations can be found at
• https://kongres.stat.gov.pl/images/pdf/abstrakty.pdf
• https://kongres.stat.gov.pl/en/sesje-naukowe/prezentacje/10-lipca
• https://kongres.stat.gov.pl/en/sesje-naukowe/prezentacje/11-lipca
• https://kongres.stat.gov.pl/en/sesje-naukowe/prezentacje/12-lipca
During the Second Congress of Polish Statistics 2018 the following persons were awarded the Jerzy
Spława-Neyman Medal by the Chapter of the Polish Statistical Society: Prof. Czesław Domański
(University of Łódź), Prof. Marie Hušková (Charles University in Prague), Prof. Jan Kordos (Warsaw
School of Economics), Prof. Mirosław Krzyśko (Adam Mickiewicz University in Poznań) and Prof.
Carl-Eric Särndal (Statistics Sweden).

The Survey Statistician 38 January 2019
Upcoming Conferences and Workshops
62nd ISI World Statistics Congress 2019 (ISI WSC 2019)
• Organized by: International Statistical Institute (ISI) 62nd ISI World Statistics Congress
• When: August 18-23, 2019
• Where: Kuala Lumpur, Malaysia
• Homepage: http://www.isi2019.org/
This is a global gathering of statistical practitioners, professionals and experts from industries,
academia and official authorities to exchange knowledge and establish networks for future
engagements and collaborations.
The 62nd ISI WSC 2019 will bring together about 2,500 delegates, comprises statistical researchers,
academia, industry practitioners, analysts and policymakers, from all over the world to share insights
on development in statistical science and to advance application of statistics for discovery, innovation
and decision making. About 1,300 papers in various statistical disciplines and applications will be
presented and discussed over a period of five days. In addition to the Scientific Program, satellite
seminars, meetings and short courses will be organized as the pre- and post-congress events.
Organizers believe that such a gathering of great minds will definitely surface great things!
The Congress venue, Kuala Lumpur Convention Centre, is strategically located in the Kuala Lumpur
City Centre (KLCC), overlooking the iconic PETRONAS Twin Towers and the 50-acre KLCC Park.
The Centre is the city’s most technologically–advanced, purpose-built facility for international,
regional and local conventions,
Paper Submission for ISI WSC 2019 Contributed Paper Sessions (CPS)
IASS encourages members to submit abstracts and papers for Contributed Paper Sessions (CPS).
The submission will be closed on 31 January 2019. Detailed submission guidelines can be found at
(http://www.isi2019.org/submissions-guidelines/).
Paper Submission for the Cochran-Hansen Prize 2019 Competition
Submission of papers to the Cochran-Hansen Prize 2019 competition of the IASS will stay open until
15 February 2019. The prize is given for the best paper on survey research methods submitted by a
young statistician from a developing or transition country. The complete announcement can be found
at (http://isi-iass.org/home/cochran-hansen-prize/).

The Survey Statistician 39 January 2019
IASS Support to Conferences in 2019
The Executive Committee of the IASS has decided to support financially the following conferences
and workshops that will be organized in 2019.
ITACOSM 2019 – the 6th ITAlian COnference on Survey Methodology
• Organized by: Survey Sampling Group (S2G) of the Italian Statistical Society (SIS) and
supported by the International Association of Survey Statisticians (IASS)
• When: June 5-7, 2019
• Where: Florence, Italy
• Homepage: http://meetings3.sis-statistica.org/index.php/ITACOSM2019/ITACOSM2019
ITACOSM is a bi-annual international conference promoted by the Survey Sampling Group (S2G) of
the Italian Statistical Society (SIS) whose aim is promoting the scientific discussion on the
developments of theory and application of survey sampling methodologies in the fields of economics,
social and demographic sciences, of official statistics and in the studies on biological and
environmental phenomena.
Fundamental changes in the nature of data, their availability, the way in which they are collected,
integrated, and disseminated are a big challenge for all those working with designed data from
surveys as well as organic data. ITACOSM 2019 tries to give a response to the increasing demand
from researchers and practitioners for the appropriate methods and right tools to face these changes.
ITACOSM 2019 will include plenary (invited) sessions on very relevant themes, specialized (invited)
sessions on specific topics, contributed sessions, and poster sessions.
Keynote speakers for ITACOSM 2019 are:
• Prof. Paul Biemer (RTI International)
• Prof. Elisabetta Carfagna (University of Bologna), as past-S2G coordinator
• Prof. David Haziza (University of Montréal)
• Prof. Li-Chun Zhang (University of Southampton, Statistics Norway, University of Oslo)
The 5th Baltic-Nordic Conference on
Survey Statistics – BaNoCoSS-2019
• Organized by: the Baltic-Nordic-Ukrainian
(BNU) Network on Survey Statistics and
Örebro University, in cooperation with
Statistics Sweden, and supported by the
International Association of Survey
Statisticians (IASS)
• When: June 16-20, 2019
• Where: Örebro, Sweden
• Homepage: https://www.oru.se/hh/banocoss2019
April 8, 2019 is a deadline for submission of titles and abstracts of contributed papers and posters.

The Survey Statistician 40 January 2019
BaNoCoSS-2019 is a scientific conference presenting developments on theory, methodology and
applications of survey statistics in a broad sense.
The conference provides a platform for discussion and exchange of ideas for a variety of people.
These include, for example, statisticians, researchers and other experts of universities, national
statistical institutes, and research institutes and other governmental bodies, and private enterprises,
dealing with survey research methodology, empirical research and statistics production. University
students in statistics and related disciplines provide an important interest group of the conference.
The conference will include key note sessions, specialized (invited) sessions on specific topics,
contributed sessions, and poster sessions. Keynote speakers are Roberto Benedetti, professor,
University of Chieti-Pescara, and Federica Piersimoni, Dr, senior researcher, Italian National
Statistical Institute with presentations on the theme Spatial survey sampling and analysis and GIS.
Additional speakers are invited for presentations on other areas of survey statistics. Two of them are
Esa Läärä, professor, University of Oulu, with presentation Uses of sampling methodology in
epidemiologic research, and Vera Toepoel, Dr, assistant professor, University of Utrecht, with Mobile
surveys and sensor data.
Examples of topics of contributed papers and posters: Model-based and non-parametric methods;
Non-response and non-sampling errors in surveys; Sampling design and estimation methods;
Combining data from registers, surveys and associated methods; Use of big data, web and internet
surveys; Survey methodology; Teaching of survey statistics.
EESW19, the sixth biennial European
Establishment Statistics Workshop
• Hosted by: EUSTAT, the statistical office
of the Basque Country, Spain, and
supported by EFTA and International
Association of Survey Statisticians (IASS).
• When: 24-27 September 2019
• Where: Bilbao, the Basque Country, Spain
• Homepage: https://statswiki.unece.org/display/ENBES/EESW19
• Registration deadline: March 31, 2019
Continuing in the traditions of its preceding five events, EESW19 is devoted to furthering the
understanding of topics in designing, collecting, analysing and using statistics about and for
businesses and other organizational entities. EESW19 is aiming to continue to be a prime European
venue for official statistics methodologists, academic researchers and private sector professionals
in the fields of business, economic and other areas of establishment statistics to exchange
experiences, share new methods and findings, learn from each other, and create opportunities for
deeper collaboration.
The first day is devoted to short courses, followed by the traditional two-and-a-half-day workshop.
Methodologists, academic researchers and private sector professionals are invited to submit the
papers on all topics related to statistics about and for businesses and other organisational entities:
sample design, data collection, response process, editing and imputation, estimation, modelling,
quality assessment, data presentation and dissemination, metadata and process data for
establishment statistics, cross-national statistics, and similar.
Especially are welcome contributions on some of the emerging topics:
• Development and implementation of electronic communication,
• Making best use of administrative and alternative data sources,
• Speeding up production.

The Survey Statistician 41 January 2019
Survey Process Design Workshop
• Organized by: The Federal University of Agriculture and
supported by EFTA and International Association of Survey
Statisticians (IASS).
• When: February 2019, a one-day event.
• Where: Abeokuta, Ogun State, Nigeria.
• Homepage of the university: https://unaab.edu.ng/

The Survey Statistician 42 January 2019
In Other Journals
Journal of Survey Statistics and Methodology
Volume 6, Issue 3, September 2018
https://academic.oup.com/jssam/issue/6/3
Survey Statistics
An Unbalanced Ranked-Set Sampling Method to Get More Than One Sample from Each Set
B Panahbehagh; R Bruggemann; A Parvardeh; M Salehi; M R Sabzalian
Estimating Survey Questionnaire Profiles for Measurement Error Risk
Barry Schouten; Frank Bais; Vera Toepoel
Survey Methodology
Nonresponse and Measurement Error Variance among Interviewers in Standardized and
Conversational Interviewing
Brady T West; Frederick G Conrad; Frauke Kreuter; Felicitas Mittereder
Overview of Three Field Methods for Improving Coverage of Address-Based Samples for In-
Person Interviews
Rachel Harter; Ned English
Mitigating Satisficing in Cognitively Demanding Grid Questions: Evidence from Two Web-
Based Experiments
Joss Roßmann; Tobias Gummer; Henning Silber
New Insights on the Cognitive Processing of Agree/Disagree and Item-Specific Questions
Jan Karem Höhne; Timo Lenzner
Motivated Misreporting in Web Panels
Ruben L Bach; Stephanie Eckman
Volume 6, Issue 4, December 2018
https://academic.oup.com/jssam/issue/6/4
Survey Statistics
A Bayesian Analysis of Design Parameters in Survey Data Collection
Barry Schouten; Nino Mushkudiani; Natalie Shlomo; Gabi Durrant; Peter Lundquist; James
Wagner

The Survey Statistician 43 January 2019
Survey Methodology
How Do Question Evaluation Methods Compare in Predicting Problems Observed in Typical
Survey Conditions?
Aaron Maitland; Stanley Presser
Improving Traditional Nonresponse Bias Adjustments: Combining Statistical Properties
with Social Theory
Andy Peytchev; Stanley Presser; Mengmeng Zhang
Are Interviewer Effects on Interview Speed Related to Interviewer Effects on Straight-Lining
Tendency in the European Social Survey? An Interviewer-Related Analysis
Caroline Vandenplas; Geert Loosveldt; Koen Beullens; Katrijn Denies
A Method for Accounting for Classification Error in a Stratified Cellphone Sample
Marcus E Berzofsky; Caroline B Scruggs; Howard Speizer; Kimberly C Peterson; Bo Lu; Timothy
Sahr
Survey Methodology
Volume 44, Number 2, December 2018
https://www150.statcan.gc.ca/n1/pub/12-001-x/12-001-x2018002-eng.htm
Measuring uncertainty associated with model-based small area estimators
J.N.K. Rao, Susana Rubin-Bleuer and Victor M. Estevao
Small area estimation for unemployment using latent Markov models
Gaia Bertarelli, M. Giovanna Ranalli, Francesco Bartolucci, Michele D’Alò and Fabrizio Solari
Sample-based estimation of mean electricity consumption curves for small domains
Anne De Moliner and Camelia Goga
Coordination of spatially balanced samples
Anton Grafström and Alina Matei
Using balanced sampling in creel surveys
Ibrahima Ousmane Ida, Louis-Paul Rivest, and Gaétan Daigle
Optimizing a mixed allocation
Antoine Rebecq and Thomas Merly-Alpa
Variance estimation under monotone non-response for a panel survey
Hélène Juillard and Guillaume Chauvet
How to decompose the non-response variance: A total survey error approach
Keven Bosa, Serge Godbout, Fraser Mills and Frédéric Picard

The Survey Statistician 44 January 2019
Comparison of the conditional bias and Kokic and Bell methods for Poisson and stratified
sampling
Thomas Deroyon and Cyril Favre-Martinoz
Criteria for choosing between calibration weighting and survey weighting
Mohammed El Haj Tirari and Boutaina Hdioud
Journal of Official Statistics
Volume 34: Issue 3 (September 2018)
https://content.sciendo.com/view/journals/jos/34/3/jos.34.issue-3.xml
Responsive and Adaptive Design for Survey Optimization
Asaph Young Chun, Steven G. Heeringa and Barry Schouten
A Distance Metric for Modeling the Quality of Administrative Records for Use in the 2020
U.S. Census
Andrew Keller, Vincent T. Mule, Darcy Steeg Morris and Scott Konicki
Transitioning a Survey to Self-Administration using Adaptive, Responsive, and Tailored
(ART) Design Principles and Data Visualization
Joe Murphy, Paul Biemer and Chip Berry
A Study of Interviewer Compliance in 2013 and 2014 Census Test Adaptive Designs
Gina Walejko and James Wagner
Estimation of True Quantiles from Quantitative Data Obfuscated with Additive Noise
Debolina Ghatak and Bimal Roy
Accounting for Spatial Variation of Land Prices in Hedonic Imputation House Price Indices:
a Semi-Parametric Approach
Yunlong Gong and Jan de Haan
Accounting for Complex Sampling in Survey Estimation: A Review of Current Software
Tools
Brady T. West, Joseph W. Sakshaug and Guy Alain S. Aurelien
Generalized Method of Moments Estimators for Multiple Treatment Effects Using
Observational Data from Complex Surveys
Bin Liu, Cindy Long Yu, Michael Joseph Price and Yan Jiang
Volume 34: Issue 4 (December 2018)
https://content.sciendo.com/view/journals/jos/34/4/jos.34.issue-4.xml
Preface
Martin Karlberg, Silvia Biffignandi, Piet J.H. Daas, Loredana Di Consiglio, Anders Holmberg, Risto
Lehtonen, Ralf T. Münnich, Boro Nikic, Marianne Paasi, Natalie Shlomo, Roxane Silberman and
Ineke Stoop
Data Organisation and Process Design Based on Functional Modularity for a Standard
Production Process
David Salgado, M. Elisa Esteban, Maria Novás, Soledad Saldaña and Luis Sanguiao

The Survey Statistician 45 January 2019
Efficiency and Agility for a Modern Solution of Deterministic Multiple Source Prioritization
and Validation Tasks
Annalisa Cesaro and Leonardo Tininini
Detecting Reporting Errors in Data from Decentralised Autonomous Administrations with
an Application to Hospital Data
Arnout van Delden, Jan van der Laan and Annemarie Prins
Population Size Estimation and Linkage Errors: the Multiple Lists Case
Loredana Di Consiglio and Tiziana Tuoto
Statistical Matching as a Supplement to Record Linkage: A Valuable Method to Tackle
Nonconsent Bias?
Jonathan Gessendorfer, Jonas Beste, Jörg Drechsler and Joseph W. Sakshaug
Assessing the Quality of Home Detection from Mobile Phone Data for Official Statistics
Maarten Vanhoof, Fernando Reis, Thomas Ploetz and Zbigniew Smoreda
Megatrend and Intervention Impact Analyzer for Jobs: A Visualization Method for Labor
Market Intelligence
Rain Opik, Toomas Kirt and Innar Liiv
Augmenting Statistical Data Dissemination by Short Quantified Sentences of Natural
Language
Miroslav Hudec, Erika Bednárová and Andreas Holzinger
Survey Practice
Volume 11, Issue 2, 2018
https://www.surveypractice.org/issue/591
Probability-Based Samples on Twitter: Methodology and Application
Marcus E. Berzofsky, Tasseli McKay, Y. Patrick Hsieh, Amanda Smith
Smart(phone) Approaches to Mobile App Data Collection
Yasamin Miller, Cyrus DiCiccio, Juan Lavista, Cheryl Gore-Felton, Carlos Acle, Jeff Hancock,
Amanda Richardson, Lorene Nelson, Oxana Palesh, Ingrid Oakley-Girvan
Within-Household Selection and Dual-Frame Telephone Surveys: A Comparative
Experiment of Eleven Different Selection Methods
Jennifer Marlar, Manas Chattopadhyay, Jeff Jones, Stephanie Marken, Frauke Kreuter
Comparing Response Rates, Costs, and Tobacco-Related Outcomes Across Phone, Mail,
and Online Surveys
Elizabeth M. Brown, Lindsay T. Olson, Matthew C. Farrelly, James M. Nonnemaker, Haven
Battles, Joel Hampton
Taking Another Look at Counterarguments: When do Survey Respondents Switch their
Answers?
Thomas R. Marshall

The Survey Statistician 46 January 2019
Ask the Expert: Polling the 2018 Elections
Scott Keeter
Protecting Human Subjects in the Digital Age: Issues and Best Practices of Data Protection
Thomas Jamieson, Güez Salinas
Interview with an Expert Series – Usability Testing in Survey Research
Nicholas Parker
Developing a New Measure of Transportation Insecurity: An Exploratory Factor Analysis
Alix Gould-Werth, Jamie Griffin, Alexandra K. Murphy
Predictors of Multitasking and its Impact on Data Quality: Lessons from a Statewide Dual-
frame Telephone Survey
Eva Aizpurua, Ki H. Park, Erin O. Heiden, Jill Wittrock, Mary E. Losch
Exploring Reminder Calls Intended to Increase Interviewer Compliance with Data Collection
Protocols
Amanda Nagle, Gina Walejko
The Use of Response Propensity Modeling (RPM) for Allocating Differential Survey
Recruitment Strategies: Purpose, Rationale, and Implementation
Paul J Lavrakas, Michael Jackson, Cameron McPhee
Survey Research Methods
Vol 12, No 2 (2018)
https://ojs.ub.uni-konstanz.de/srm/issue/view/138
Mixed-Mode: Past, Present, and Future
Edith D. DeLeeuw
Item Sum Double-List Technique: An Enhanced Design for Asking Quantitative Sensitive
Questions
Ivar Krumpal, Ben Jann, Martin Korndörfer, Stefan Schmukle
Sequence Matters in Online Probing: the Impact of the Order of Probes on Response
Quality, Motivation of Respondents, and Answer Content
Katharina Meitinger, Michael Braun, Dorothée Behr
From Strangers to Acquaintances? Interviewer Continuity and Socially Desirable
Responses in Panel Surveys
Simon Kühne
How to Abbreviate Questionnaires and Avoid the Sins?
Paweł Kleka, Emilia Soroko
Respondent Mental Health, Mental Disorders and Survey Interview Outcomes
Francisco Perales Perez, Bernard Baffour

The Survey Statistician 47 January 2019
Vol 12, No 3 (2018)
https://ojs.ub.uni-konstanz.de/srm/issue/view/139
Two Simple Methods to Improve Official Statistics for Small Subpopulations
Nikolas Mittag
A Closer Look at Attitude Scales with Positive and Negative Items. Response Latency
Perspectives on Measurement Quality
Jochen Mayerl, Christoph Giehl
Continuity Trumps? The Impact of Interviewer Change on Item Nonresponse
Kristin Hajek, Nina Schumann
Memory Gaps in the American Time Use Survey. Are Respondents Forgetful or is There
More to it?
Antje Kirchner, Robert F Belli, Ana Lucía Córdova-Cazar, Caitlin E Deal
Randomization in Surveys with the Halton Sequence
Kien T. Le, Martha McRoy, Abdoulaye Diop
Is satisficing responsible for response order effects in rating scale questions?
Florian Keusch, Ting Yang
Statistical Journal of the IAOS
Volume 34, issue 3 (2018)
https://content.iospress.com/journals/statistical-journal-of-the-iaos/34/3
Interview with Irena Križman
Condon, Katherine M.
Development and application of international guidelines for
statistical business registers: Discussant’s remarks
Colledge, Michael
Development and application of the SBR guidelines of the
Conference of European Statisticians
Rainer, Norbert
Development and application of the african development bank statistical business register
guidelines
Madhow, Vikash; Muwele, Besa; Mungralee, Sariff
Experiences in application of the European Statistical System Business Registers
Recommendations Manual
Liotti, Amerigo
Reconciliation of inconsistent data sources by correction for measurement error: The
feasibility of parameter re-use
Pankowska, Paulina; Bakker, Bart; Oberski, Daniel L.; Pavlopoulos, Dimitris
The quality assurance of official statistics in Japan: Framework and practice
Takahashi, Masao

The Survey Statistician 48 January 2019
The National Statistical System in Nigeria: Developments and issues
Ekpenyong, Emmanuel John; Enang, Ekaette Inyang
Statistical monitoring for politics in the European Union and the OECD, supporting
economic growth and social progress: A comparison between Europe 2020 and the OECD
Better Life Initiative
Schnorr-Bäcker, Susanne
The Aggregate Association Index applied to stratified 2 × 2 tables: Application to the 1893
election data in New Zealand
Tran, Duy; Beh, Eric J.; Hudson, Irene L.
Small area estimation strategy for the 2011 Census in England and Wales
Baffour, Bernard; Silva, Denise; Veiga, Alinne; Sexton, Christine; Brown, James J.
Improving seasonal adjustment by accounting for sample error correlation using state
space models
Mayer, Andreas
Synthetic time series technique for predicting network-wide road traffic
Cirillo, Cinzia; Han, Ying; Kaushik, Kartik; Lahiri, Parthasarathi
An updated analysis of the predictive ability of Mexico’s Manufacturing Business Opinion
Survey
Guerrero, Víctor M.; Sainz, Esperanza
Civil registration and national identity system all under one roof: Uganda’s fastest path to
the revitalization of CRVS for Africa
Habaasa, Gilbert; Natamba, Jonan
Early versus late respondents in web surveys: Evidence from a national health survey
Klingwort, Jonas; Buelens, Bart; Schnell, Rainer
Volume 34, issue 4 (2018)
https://content.iospress.com/journals/statistical-journal-of-the-iaos/34/4
Interview Olav Ljones
Condon, Katherine M.
The usability of administrative data for register-based censuses
Schulte Nordholt, Eric
Telematics data for official statistics: An experience with big data
Husek, Nicholas
Hard to count: How survey and administrative records modeling can enhance census
nonresponse followup
Chow, Melissa C.; Janicki, Hubert P.; Kutzbach, Mark J.; Warren, Lawrence F.; Yi, Moises
What can administrative tax information tell us about income measurement in household
surveys? Evidence from the Consumer Expenditure Surveys
Brummet, Quentin; Flanagan-Doyle, Denise; Mitchell, Joshua; Voorheis, John; Erhard, Laura;
McBride, Brett

The Survey Statistician 49 January 2019
Evaluating race and Hispanic origin responses of Medicaid participants using census data
Fernandez, Leticia E.; Rastogi, Sonya; Ennis, Sharon R.; Noon, James M.
Using administrative records to increase quality and reduce burden in the Survey of
Graduate Students and Postdoctorates in Science and Engineering
Gordon, Jonathan; Eckman, Stephanie; Einaudi, Peter; Sanders, Herschel; Yamaner, Mike
Accurate reporting of U.S. opioid deaths: Level, type, temporal and geographical
comparability
Kadane, Joseph B.; Williams, Karl E.
Evaluating the utility of a commercial data source for estimating property tax amounts
Seeskin, Zachary H.
Predicting postsecondary trajectories in Virginia high schools using publicly available data
Pires, Bianica; Crandell, Ian; Arnsbarger, Madison; Lancaster, Vicki; Schroeder, Aaron; Shipp,
Stephanie; Kang, Wendy; Robinson, Paula; Keller, Sallie
Realisation of ‘administrative data first’ in quarterly business statistics
Liken, Craig; Page, Mathew; Stewart, John
Big Data ethics and selection-bias: An official statistician’s perspective
Tam, Siu-Ming; Kim, Jae-Kwang
When adjusting for the bias due to linkage errors: A sensitivity analysis
Di Consiglio, Loredana; Tuoto, Tiziana
Matching techniques and administrative data records linkage
Zeidan, Haitham
Community-based canvassing to improve the U.S. Census Bureau’s Master Address File:
California’s experience in LUCA 2018
Kissam, Ed; Quezada, Cindy; Intili, Jo Ann
International Statistical Review
Volume 86, Issue 2, August 2018
https://onlinelibrary.wiley.com/toc/17515823/2018/86/2
Optimal Adaptive Designs with Inverse Ordinary Differential Equations
Eugene Demidenko
Missing Data: A Unified Taxonomy Guided by Conditional Independence
Marco Doretti, Sara Geneletti and Elena Stanghellini
The Use of Prior Information in Very Robust Regression for Fraud Detection
Marco Riani, Aldo Corbellini and Anthony C. Atkinson
Estimating Precision and Recall for Deterministic and Probabilistic Record Linkage
James Chipperfield, Noel Hansen and Peter Rossiter

The Survey Statistician 50 January 2019
Methods and Tools for Bayesian Variable Selection and Model Averaging in Normal Linear
Regression
Anabel Forte, Gonzalo Garcia-Donato and Mark Steel
Towards a Routine External Evaluation Protocol for Small Area Estimation
Alan H. Dorfman
A History of the GLIM Statistical Package
Murray Aitkin
Measuring Identification Risk in Microdata Release and Its Control by Post-randomisation
Tapan K. Nayak, Cheng Zhang and Jiashen You
Comparing Inference Methods for Non-probability Samples
Bart Buelens, Joep Burger and Jan A. van den Brakel
Modeling Temporally Evolving and Spatially Globally Dependent Data
Emilio Porcu, Alfredo Alegria and Reinhard Furrer
Volume 86, Issue 3, December 2018
https://onlinelibrary.wiley.com/toc/17515823/2018/86/3
Statistical Medical Fraud Assessment: Exposition to an Emerging Field
Tahir Ekin, Francesca Ieva, Fabrizio Ruggeri and Refik Soyer
A Tutorial on the Practical Use and Implication of Complete Sufficient Statistics
Lisa Hermans, Geert Molenberghs, Marc Aerts, Michael G. Kenward and Geert Verbeke
A Brief Review of Approaches to Non-ignorable Non-response
Anna Sikov
Ranking Forecasts by Stochastic Error Distance, Information and Reliability Measures
Omid M. Ardakani, Nader Ebrahimi and Ehsan S. Soofi
A Method for Testing Additivity in Unreplicated Two-Way Layouts Based on Combining
Multiple Interaction Tests
Zahra Shenavari and Mahmood Kharrati-Kopaei
Vine Copulas for Imputation of Monotone Non-response
Caren Hasler, Radu V. Craiu and Louis-Paul Rivest
On Properties of the MixedTS Distribution and Its Multivariate Extension
Asmerilda Hitaj, Friedrich Hubalek, Lorenzo Mercuri and Edit Rroji
Estimation and Testing in M-quantile Regression with Applications to Small Area Estimation
Annamaria Bianchi, Enrico Fabrizi, Nicola Salvati and Nikos Tzavidis
Geostatistical Methods for Disease Mapping and Visualisation Using Data from Spatio-
temporally Referenced Prevalence Surveys
Emanuele Giorgi, Peter J. Diggle, Robert W. Snow and Abdisalan M. Noor

The Survey Statistician 51 January 2019
Transactions on Data Privacy
Volume 11, Issue 2, August 2018
http://www.tdp.cat/issues16/vol11n02.php
PATCONFDB: Design and Evaluation of Access Pattern Confidentiality-Preserving Indexes
Alexander Degitz, Hannes Hartenstein
Biometric Systems Private by Design: Reasoning about privacy properties of biometric
system architectures
Julien Bringer, Hervé Chabanne, Daniel Le Métayer, Roch Lescuyer
PRUDEnce: a System for Assessing Privacy Risk vs Utility in Data Sharing Ecosystems
Francesca Pratesi, Anna Monreale, Roberto Trasarti, Fosca Giannotti, Dino Pedreschi, Tadashi
Yanagihara
Anonymising social graphs in the presence of active attackers
Sjouke Mauw, Yunior Ramírez-Cruz, Rolando Trujillo-Rasua
Volume 11, Issue 3, December 2018
http://www.tdp.cat/issues16/vol11n03.php
Big Data Privacy Context: Literature Effects On Secure Informational Assets
Celina Rebello, Elaine Tavares
Personalized Anonymization for Set-Valued Data by Partial Suppression
Takuma Nakagawa, Hiromi Arai, Hiroshi Nakagawa
EPIC: a Methodology for Evaluating Privacy Violation Risk in Cybersecurity Systems
Sergio Mascetti, Nadia Metoui, Andrea Lanzi, Claudio Bettini
Differentially Private Verification of Regression Predictions from Synthetic Data
Haoyang Yu, Jerome P. Reiter
Journal of the Royal Statistical Society,
Series A (Statistics in Society)
Volume 181, Issue 4, October 2018
https://rss.onlinelibrary.wiley.com/toc/1467985x/2018/181/4
Editorial
Editorial: Statistical flaws in the teaching excellence and student outcomes framework in
UK higher education
Guy Nason

The Survey Statistician 52 January 2019
Original Articles
From start to finish: a framework for the production of small area official statistics
Nikos Tzavidis, Li-Chun Zhang, Angela Luna, Timo Schmid, Natalia Rojas-Perilla
Small area estimation under informative sampling and not missing at random non-response
Michael Sverchkov, Danny Pfeffermann
Non-parametric evidence of second-leg home advantage in European football
Gery Geenens, Thomas Cuddihy
Can incentives improve survey data quality in developing countries?: results from a field
experiment in India
Guy Stecklov, Alexander Weinreb, Calogero Carletto
Which schools and pupils respond to educational achievement surveys?: a focus on the
English Programme for International Student Assessment sample
Gabriele B. Durrant, Sylke V. Schnepf
The use of a three-level M-quantile model to map poverty at local administrative unit 1 in
Poland
Stefano Marchetti, Maciej Beręsewicz, Nicola Salvati, Marcin Szymkowiak, Łukasz Wawrowski
A comparison of joint models for longitudinal and competing risks data, with application to
an epilepsy drug randomized controlled trial
Graeme L. Hickey, Pete Philipson, Andrea Jorgensen, Ruwanthi Kolamunnage-Dona
Continuous inference for aggregated point process data
Benjamin M. Taylor, Ricardo Andrade-Pacheco, Hugh J. W. Sturrock
A design-based approach to small area estimation using a semiparametric generalized
linear mixed model
Hongjian Yu, Yueyan Wang, Jean Opsomer, Pan Wang, Ninez A. Ponce
Latent variable modelling with non-ignorable item non-response: multigroup response
propensity models for cross-national analysis
Jouni Kuha, Myrsini Katsikatsou, Irini Moustaki
Generalizing evidence from randomized trials using inverse probability of sampling weights
Ashley L. Buchanan, Michael G. Hudgens, Stephen R. Cole, Katie R. Mollan, Paul E. Sax, Eric S.
Daar, Adaora A. Adimora, Joseph J. Eron, Michael J. Mugavero
Correlates of record linkage and estimating risks of non-linkage biases in business data
sets
Jamie C. Moore, Peter W. F. Smith, Gabriele B. Durrant
Inference for instrumental variables: a randomization inference approach
Hyunseung Kang, Laura Peck, Luke Keele
Obituaries
Tata Subba Rao, 1942–2018
Patrick J. Laycock
Derek John Pike, 1944–2018
Robert Curnow
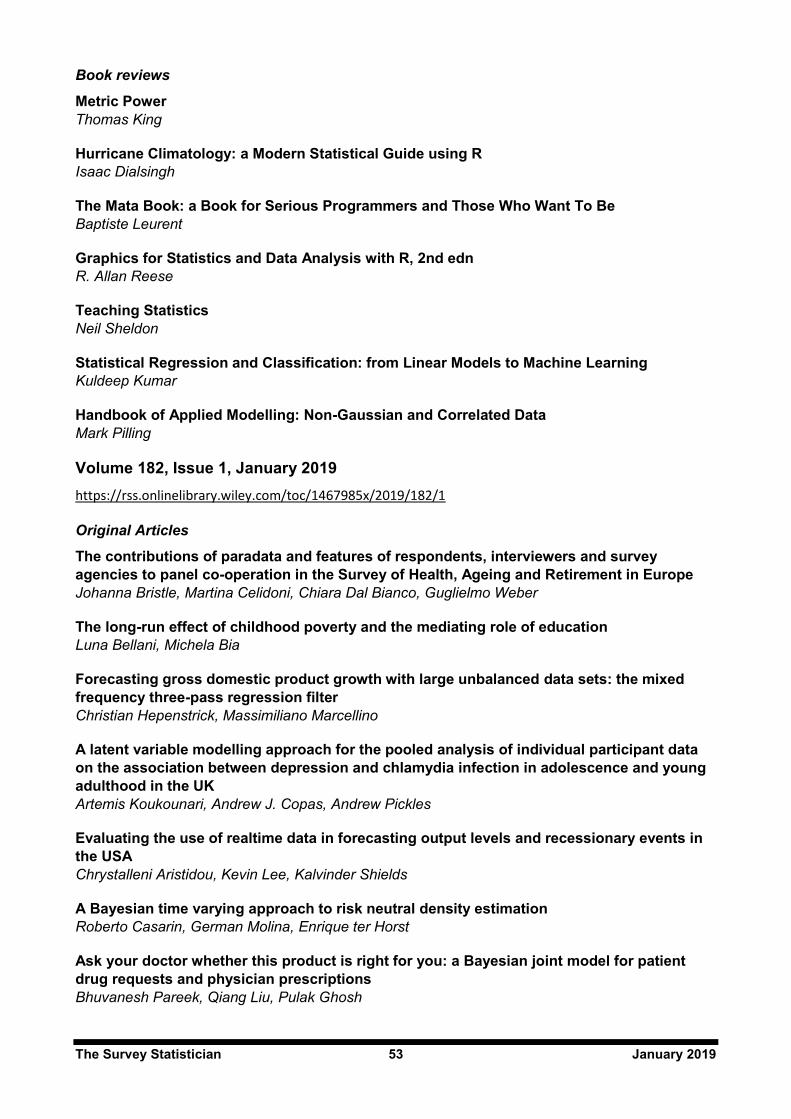
The Survey Statistician 53 January 2019
Book reviews
Metric Power
Thomas King
Hurricane Climatology: a Modern Statistical Guide using R
Isaac Dialsingh
The Mata Book: a Book for Serious Programmers and Those Who Want To Be
Baptiste Leurent
Graphics for Statistics and Data Analysis with R, 2nd edn
R. Allan Reese
Teaching Statistics
Neil Sheldon
Statistical Regression and Classification: from Linear Models to Machine Learning
Kuldeep Kumar
Handbook of Applied Modelling: Non-Gaussian and Correlated Data
Mark Pilling
Volume 182, Issue 1, January 2019
https://rss.onlinelibrary.wiley.com/toc/1467985x/2019/182/1
Original Articles
The contributions of paradata and features of respondents, interviewers and survey
agencies to panel co-operation in the Survey of Health, Ageing and Retirement in Europe
Johanna Bristle, Martina Celidoni, Chiara Dal Bianco, Guglielmo Weber
The long-run effect of childhood poverty and the mediating role of education
Luna Bellani, Michela Bia
Forecasting gross domestic product growth with large unbalanced data sets: the mixed
frequency three-pass regression filter
Christian Hepenstrick, Massimiliano Marcellino
A latent variable modelling approach for the pooled analysis of individual participant data
on the association between depression and chlamydia infection in adolescence and young
adulthood in the UK
Artemis Koukounari, Andrew J. Copas, Andrew Pickles
Evaluating the use of realtime data in forecasting output levels and recessionary events in
the USA
Chrystalleni Aristidou, Kevin Lee, Kalvinder Shields
A Bayesian time varying approach to risk neutral density estimation
Roberto Casarin, German Molina, Enrique ter Horst
Ask your doctor whether this product is right for you: a Bayesian joint model for patient
drug requests and physician prescriptions
Bhuvanesh Pareek, Qiang Liu, Pulak Ghosh

The Survey Statistician 54 January 2019
Bayesian semiparametric modelling of contraceptive behaviour in India via sequential
logistic regressions
Tommaso Rigon, Daniele Durante, Nicola Torelli
Visualizing rate of change: an application to age-specific fertility rates
Han Lin Shang
Participating in a panel survey changes respondents’ labour market behaviour
Ruben L. Bach, Stephanie Eckman
Model-based county level crop estimates incorporating auxiliary sources of information
Andreea L. Erciulescu, Nathan B. Cruze, Balgobin Nandram
Misspecification of multimodal random-effect distributions in logistic mixed models for
panel survey data
Louise Marquart, Michele Haynes
A Bayesian approach to modelling subnational spatial dynamics of worldwide non-state
terrorism, 2010–2016
André Python, Janine B. Illian, Charlotte M. Jones-Todd, Marta Blangiardo
Early illicit drug use and the age of onset of homelessness
Duncan McVicar, Julie Moschion, Jan C. van Ours
Obituaries
Ian Maclean MBE, MA, 1930–2018
Douglas Graham Altman, 1948–2018
Journal of the American
Statistical Association
Volume 113, Issue 522 (2018)
https://www.tandfonline.com/toc/uasa20/113/522?nav=tocList
Presidential Address
Statistics: Essential Now More Than Ever
Barry D. Nussbaum
Applications and Case Studies
A Permutation Test for the Regression Kink Design
Peter Ganong & Simon Jäger
Estimating the Number of Sources in Magnetoencephalography Using Spiked Population
Eigenvalues
Zhigang Yao, Ye Zhang, Zhidong Bai & William F. Eddy
Scalable Bayesian Modeling, Monitoring, and Analysis of Dynamic Network Flow Data
Xi Chen, Kaoru Irie, David Banks, Robert Haslinger, Jewell Thomas & Mike West

The Survey Statistician 55 January 2019
Statistical Methods for Standard Membrane-Feeding Assays to Measure Transmission
Blocking or Reducing Activity in Malaria
Bruce J. Swihart, Michael P. Fay & Kazutoyo Miura
A Tailored Multivariate Mixture Model for Detecting Proteins of Concordant Change Among
Virulent Strains of Clostridium Perfringens
Kun Chen, Neha Mishra, Joan Smyth, Haim Bar, Elizabeth Schifano, Lynn Kuo & Ming-Hui Chen
On Estimation of the Hazard Function From Population-Based Case–Control Studies
Li Hsu, Malka Gorfine & David Zucker
A Unified Framework for Fitting Bayesian Semiparametric Models to Arbitrarily Censored
Survival Data, Including Spatially Referenced Data
Haiming Zhou & Timothy Hanson
Semiparametric Estimation of Longitudinal Medical Cost Trajectory
Liang Li, Chih-Hsien Wu, Jing Ning, Xuelin Huang, Ya-Chen Tina Shih & Yu Shen
Nested Hierarchical Functional Data Modeling and Inference for the Analysis of Functional
Plant Phenotypes
Yuhang Xu, Yehua Li & Dan Nettleton
Disentangling Bias and Variance in Election Polls
Houshmand Shirani-Mehr, David Rothschild, Sharad Goel & Andrew Gelman
Theory and Methods
Model Selection for High-Dimensional Quadratic Regression via Regularization
Ning Hao, Yang Feng & Hao Helen Zhang
Bayesian Regression Trees for High-Dimensional Prediction and Variable Selection
Antonio R. Linero
Unsupervised Self-Normalized Change-Point Testing for Time Series
Ting Zhang & Liliya Lavitas
Multivariate Functional Principal Component Analysis for Data Observed on Different
(Dimensional) Domains
Clara Happ & Sonja Greven
Boosting in the Presence of Outliers: Adaptive Classification With Nonconvex Loss
Functions
Alexander Hanbo Li & Jelena Bradic
Bayesian Nonparametric Calibration and Combination of Predictive Distributions
Federico Bassetti, Roberto Casarin & Francesco Ravazzolo
Design-Based Maps for Finite Populations of Spatial Units
L. Fattorini, M. Marcheselli & L. Pratelli
Group-Linear Empirical Bayes Estimates for a Heteroscedastic Normal Mean
Asaf Weinstein, Zhuang Ma, Lawrence D. Brown & Cun-Hui Zhang
Equivalence of Regression Curves
Holger Dette, Kathrin Möllenhoff, Stanislav Volgushev & Frank Bretz

The Survey Statistician 56 January 2019
On Reject and Refine Options in Multicategory Classification
Chong Zhang, Wenbo Wang & Xingye Qiao
Dimensionality Reduction and Variable Selection in Multivariate Varying-Coefficient Models
With a Large Number of Covariates
Kejun He, Heng Lian, Shujie Ma & Jianhua Z. Huang
Hidden Population Size Estimation From Respondent-Driven Sampling: A Network
Approach
Forrest W. Crawford, Jiacheng Wu & Robert Heimer
On the Effect of Bias Estimation on Coverage Accuracy in Nonparametric Inference
Sebastian Calonico, Matias D. Cattaneo & Max H. Farrell
Parametric-Rate Inference for One-Sided Differentiable Parameters
Alexander R. Luedtke & Mark J. van der Laan
Distribution-Free Detection of Structured Anomalies: Permutation and Rank-Based Scans
Ery Arias-Castro, Rui M. Castro, Ervin Tánczos & Meng Wang
Efficient Functional ANOVA Through Wavelet-Domain Markov Groves
Li Ma & Jacopo Soriano
Invariant Inference and Efficient Computation in the Static Factor Model
Joshua Chan, Roberto Leon-Gonzalez & Rodney W. Strachan
Optimal Subsampling for Large Sample Logistic Regression
HaiYing Wang, Rong Zhu & Ping Ma
Residuals and Diagnostics for Ordinal Regression Models: A Surrogate Approach
Dungang Liu & Heping Zhang
The Bouncy Particle Sampler: A Nonreversible Rejection-Free Markov Chain Monte Carlo
Method
Alexandre Bouchard-Côté, Sebastian J. Vollmer & Arnaud Doucet
Using Standard Tools From Finite Population Sampling to Improve Causal Inference for
Complex Experiments
Rahul Mukerjee, Tirthankar Dasgupta & Donald B. Rubin
Nonparametric Maximum Likelihood Estimators of Time-Dependent Accuracy Measures for
Survival Outcome Under Two-Stage Sampling Designs
Dandan Liu, Tianxi Cai, Anna Lok & Yingye Zheng
Efficient Estimation for Semiparametric Structural Equation Models With Censored Data
Kin Yau Wong, Donglin Zeng & D. Y. Lin
Testing for Inequality Constraints in Singular Models by Trimming or Winsorizing the
Variance Matrix
Ori Davidov, Casey M. Jelsema & Shyamal Peddada
Semiparametric Ultra-High Dimensional Model Averaging of Nonlinear Dynamic Time Series
Jia Chen, Degui Li, Oliver Linton & Zudi Lu

The Survey Statistician 57 January 2019
Reviews
Partial Identification of the Average Treatment Effect Using Instrumental Variables: Review
of Methods for Binary Instruments, Treatments, and Outcomes
Sonja A. Swanson, Miguel A. Hernán, Matthew Miller, James M. Robins & Thomas S. Richardson
Volume 113, Issue 523 (2018)
https://www.tandfonline.com/toc/uasa20/113/523?nav=tocList
Applications and Case Studies
Bayesian Neural Networks for Selection of Drug Sensitive Genes
Faming Liang, Qizhai Li & Lei Zhou
Controlling the FDR in Imperfect Matches to an Incomplete Database
Uri Keich & William Stafford Noble
Optimal Probability Weights for Inference With Constrained Precision
Michele Santacatterina & Matteo Bottai
Latent Variable Poisson Models for Assessing the Regularity of Circadian Patterns over
Time
Sungduk Kim & Paul S. Albert
Modeling Motor Learning Using Heteroscedastic Functional Principal Components Analysis
Daniel Backenroth, Jeff Goldsmith, Michelle D. Harran, Juan C. Cortes, John W. Krakauer &
Tomoko Kitago
A Bayesian Phase I/II Trial Design for Immunotherapy
Suyu Liu, Beibei Guo & Ying Yuan
Maximum Rank Reproducibility: A Nonparametric Approach to Assessing Reproducibility in
Replicate Experiments
Daisy Philtron, Yafei Lyu, Qunhua Li & Debashis Ghosh
Front-Door Versus Back-Door Adjustment With Unmeasured Confounding: Bias Formulas
for Front-Door and Hybrid Adjustments With Application to a Job Training Program
Adam N. Glynn & Konstantin Kashin
On the Long-Run Volatility of Stocks
Carlos M. Carvalho, Hedibert F. Lopes & Robert E. McCulloch
Cross-Screening in Observational Studies That Test Many Hypotheses
Qingyuan Zhao, Dylan S. Small & Paul R. Rosenbaum
Theory and Methods
On Recursive Bayesian Predictive Distributions
P. Richard Hahn, Ryan Martin & Stephen G. Walker
Distribution-Free Predictive Inference for Regression
Jing Lei, Max G’Sell, Alessandro Rinaldo, Ryan J. Tibshirani & Larry Wasserman
Assessing Time-Varying Causal Effect Moderation in Mobile Health
Audrey Boruvka, Daniel Almirall, Katie Witkiewitz & Susan A. Murphy

The Survey Statistician 58 January 2019
Quantitative Evaluation of the Trade-Off of Strengthened Instruments and Sample Size in
Observational Studies
Ashkan Ertefaie, Dylan S. Small & Paul R. Rosenbaum
Quasi-Likelihood Estimation of a Censored Autoregressive Model With Exogenous
Variables
Chao Wang & Kung-Sik Chan
A Weighted Edge-Count Two-Sample Test for Multivariate and Object Data
Hao Chen, Xu Chen & Yi Su
False Discovery Rate Smoothing
Wesley Tansey, Oluwasanmi Koyejo, Russell A. Poldrack & James G. Scott
Weighted False Discovery Rate Control in Large-Scale Multiple Testing
Pallavi Basu, T. Tony Cai, Kiranmoy Das & Wenguang Sun
Oracle Estimation of a Change Point in High-Dimensional Quantile Regression
Sokbae Lee, Yuan Liao, Myung Hwan Seo & Youngki Shin
Optimal Control and Additive Perturbations Help in Estimating Ill-Posed and Uncertain
Dynamical Systems
Quentin Clairon & Nicolas J.-B. Brunel
On the Use of Reproducing Kernel Hilbert Spaces in Functional Classification
José R. Berrendero, Antonio Cuevas & José L. Torrecilla
Functional Feature Construction for Individualized Treatment Regimes
Eric B. Laber & Ana-Maria Staicu
Estimation and Inference of Heterogeneous Treatment Effects using Random Forests
Stefan Wager & Susan Athey
Quantile-Optimal Treatment Regimes
Lan Wang, Yu Zhou, Rui Song & Ben Sherwood
A Bayesian Machine Learning Approach for Optimizing Dynamic Treatment Regimes
Thomas A. Murray, Ying Yuan & Peter F. Thall
Robust High-Dimensional Volatility Matrix Estimation for High-Frequency Factor Model
Jianqing Fan & Donggyu Kim
Identifying Latent Structures in Restricted Latent Class Models
Gongjun Xu & Zhuoran Shang
Modeling Persistent Trends in Distributions
Jonas Mueller, Tommi Jaakkola & David Gifford
Edge Exchangeable Models for Interaction Networks
Harry Crane & Walter Dempsey
Confidence Regions for Spatial Excursion Sets From Repeated Random Field Observations,
With an Application to Climate
Max Sommerfeld, Stephan Sain & Armin Schwartzman

The Survey Statistician 59 January 2019
A Randomized Sequential Procedure to Determine the Number of Factors
Lorenzo Trapani
Inference in Linear Regression Models with Many Covariates and Heteroscedasticity
Matias D. Cattaneo, Michael Jansson & Whitney K. Newey
On the Null Distribution of Bayes Factors in Linear Regression
Quan Zhou & Yongtao Guan
Review
Bayesian Inference in the Presence of Intractable Normalizing Functions
Jaewoo Park & Murali Haran

The Survey Statistician 60 January 2019
Welcome New Members!
We are very pleased to welcome the following new IASS members!
Title First name Surname Country
DR. Guillaume Chauvet France
DR. Robert Graham Clark Australia
DR. Jennifer Madans United States
DR. Fernando A. da Silva Moura Brazil
PROF. Wlodzimierz Okrasa Poland
DR. Ibrahim S. Yansaneh United States

The Survey Statistician 61 January 2019
IASS Executive Committee Members
Executive officers (2017 – 2019)
President: Peter Lynn (UK) [email protected]
President-elect: Denise Silva (Brazil) [email protected]
Vice-Presidents:
Scientific Secretary: Risto Lehtonen (Finland) [email protected]
VP Finance: Jean Opsomer (USA) [email protected]
Chair of the Cochran-Hansen
Prize Committee and IASS
representative on the ISI
Awards Committee:
Anders Holmberg, (Norway/Sweden)
IASS representative on the
2019 World Statistics Congress
Scientific Programme
Committee:
Cynthia Clark (USA) [email protected]
Ex Officio Member: Ada van Krimpen [email protected]
IASS Twitter Account @iass_isi (https://twitter.com/iass_isi)

The Survey Statistician 62 January 2019
Institutional Members
International organisations:
• Eurostat (European Statistical Office)
• Observatoire économique et statistique d'Afrique subsaharienne (AFRISTAT)
National statistical offices:
• Australian Bureau of Statistics, Australia
• Instituto Brasileiro de Geografia e Estatística (IBGE), Brazil
• Statistics Canada, Canada
• Statistics Denmark, Denmark
• Statistics Finland, Finland
• Statistisches Bundesamt (Destatis), Germany
• Israel Central Bureau of Statistics, Israel
• Istituto nazionale di statistica (Istat), Italy
• Statistics Korea, Republic of Korea
• Direcção dos Serviços de Estatística e Censos (DSEC), Macao, SAR China
• Statistics Mauritius, Mauritius
• Instituto Nacional de Estadística y Geografía (INEGI), Mexico
• Statistics New Zealand, New Zealand
• Statistics Norway, Norway
• Instituto Nacional de Estatística (INE), Portugal
• Statistics Sweden, Sweden
• National Agricultural Statistics Service (NASS), United States
• National Center of Health Statistics (NCHS), United States
Private companies:
• Numérika (Asesoría estadística y estudios cuantitativos), Mexico
• RTI International, United States
• Survey Research Center (SRC), United States
• Westat, United States

The Survey Statistician 63 January 2019
Change of Address Form

Read the Survey
Statistician online!
http://isi-iass.org/home/services/the-survey-statistician/