Nitrogen deposition in Spain: Modeled patterns and threatened habitats within the Natura 2000...
11
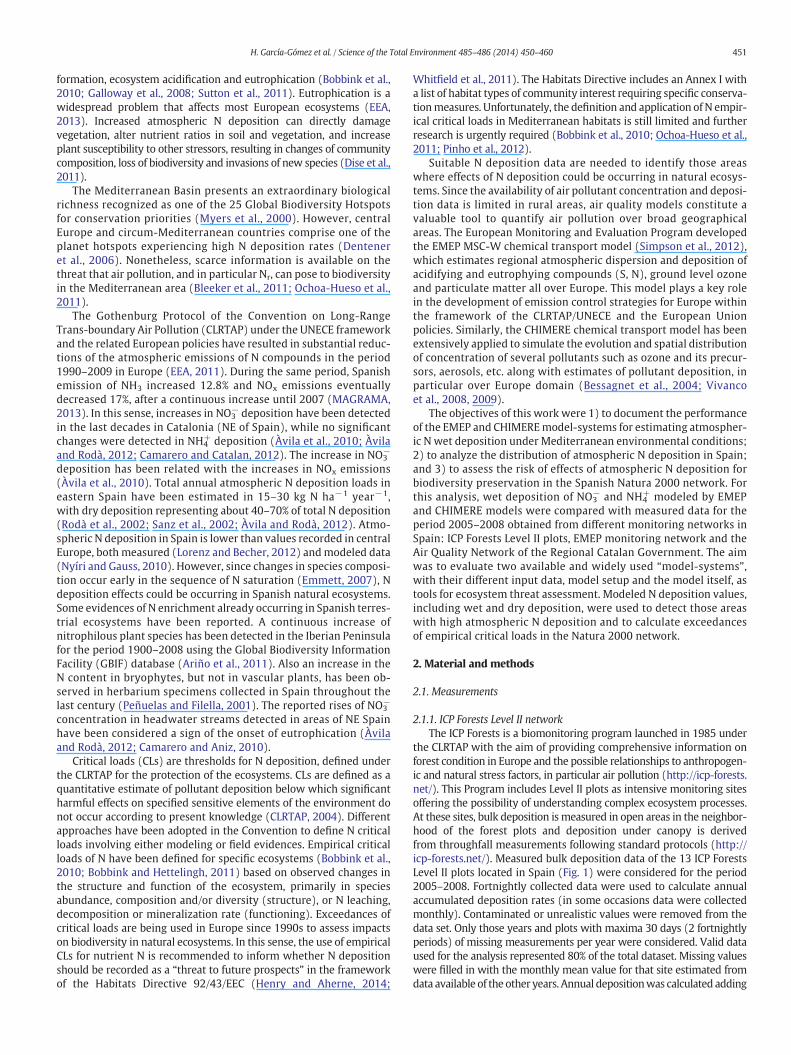
Nitrogen deposition in Spain: Modeled patterns and threatened habitats within the Natura 2000 network H. García-Gómez a, ⁎, J.L. Garrido a , M.G. Vivanco a , L. Lassaletta b , I. Rábago a , A. Àvila c , S. Tsyro d , G. Sánchez e , A. González Ortiz f , I. González-Fernández a , R. Alonso a a Atmospheric Pollution Division, CIEMAT, Av. Complutense 40, Madrid 28040, Spain b CNRS/Université Pierre et Marie Curie, UMR Sisyphe, 4 Place Jussieu, Paris 75005, France c CREAF (Center for Ecological Research and Forestry Applications), Universitat Autònoma de Barcelona, Bellaterra 08193, Spain d MSC-W of EMEP, Norwegian Meteorological Institute, Henrik Mohns plass 1, Oslo 0313, Norway e Spanish Ministry of Agriculture, Food and Environment (ICP Forests), c/Ríos Rosas 24-6°, Madrid 28003, Spain f Spanish Ministry of Agriculture, Food and Environment (Air Quality and Industrial Environment), Pza. S. Juan de la Cruz, s/n, Madrid 28071, Spain HIGHLIGHTS • CHIMERE and EMEP models acceptably estimate atmospheric N wet deposition in Spain. • Total (wet + dry) atmospheric N deposition in Spain in 2008 was up to 19–23 kg N ha -1 . • Natural grasslands are the habitats most threatened by N deposition. • Biodiversity conservation in 3–7% of the assessed area could be threatened by N deposition. • Habitats in mountain areas are particularly threatened by N deposition. abstract article info Article history: Received 20 December 2013 Received in revised form 13 March 2014 Accepted 23 March 2014 Available online xxxx Editor: Charlotte Poschenrieder Keywords: Nitrogen deposition Air quality model Monitoring network Critical load exceedance Natura 2000 network Alpine grasslands The Mediterranean Basin presents an extraordinary biological richness but very little information is available on the threat that air pollution, and in particular reactive nitrogen (N), can pose to biodiversity and ecosystem functioning. This study represents the first approach to assess the risk of N enrichment effects on Spanish ecosystems. The suit- ability of EMEP and CHIMERE air quality model systems as tools to identify those areas where effects of atmospheric N deposition could be occurring was tested. For this analysis, wet deposition of NO 3 - and NH 4 + estimated with EMEP and CHIMERE model systems were compared with measured data for the period 2005–2008 obtained from differ- ent monitoring networks in Spain. Wet N deposition was acceptably predicted by both models, showing better re- sults for oxidized than for reduced nitrogen, particularly when using CHIMERE. Both models estimated higher wet deposition values in northern and northeastern Spain, and decreasing along a NE–SW axis. Total (wet + dry) nitro- gen deposition in 2008 reached maxima values of 19.4 and 23.0 kg N ha -1 year -1 using EMEP and CHIMERE models respectively. Total N deposition was used to estimate the exceedance of N empirical critical loads in the Natura 2000 network. Grassland habitats proved to be the most threatened group, particularly in the northern al- pine area, pointing out that biodiversity conservation in these protected areas could be endangered by N deposition. Other valuable mountain ecosystems can be also threatened, indicating the need to extend atmospheric deposition monitoring networks to higher altitudes in Spain. © 2014 Elsevier B.V. All rights reserved. 1. Introduction The global biogeochemical cycle of nitrogen (N) has been deeply altered by human activities to the extent that the planetary boundary for human safe operating has long been crossed (Rockström et al., 2009). Anthropogenic reactive nitrogen (N r ) circulates across different compartments (atmosphere, hydrosphere and terrestrial ecosystems) inducing a cascade of environmental effects, such as tropospheric ozone Science of the Total Environment 485–486 (2014) 450–460 ⁎ Corresponding author. Tel.: +34 913466556; fax: +34 913466121. E-mail addresses: [email protected] (H. García-Gómez), [email protected] (J.L. Garrido), [email protected] (M.G. Vivanco), [email protected] (L. Lassaletta), [email protected] (I. Rábago), [email protected] (A. Àvila), [email protected] (S. Tsyro), [email protected] (G. Sánchez), [email protected] (A. González Ortiz), [email protected] (I. González-Fernández), [email protected] (R. Alonso). http://dx.doi.org/10.1016/j.scitotenv.2014.03.112 0048-9697/© 2014 Elsevier B.V. All rights reserved. Contents lists available at ScienceDirect Science of the Total Environment journal homepage: www.elsevier.com/locate/scitotenv
Transcript of Nitrogen deposition in Spain: Modeled patterns and threatened habitats within the Natura 2000...
Science of the Total Environment 485–486 (2014) 450–460
Contents lists available at ScienceDirect
Science of the Total Environment
j ourna l homepage: www.e lsev ie r .com/ locate /sc i totenv
Nitrogen deposition in Spain: Modeled patterns and threatened habitatswithin the Natura 2000 network
H. García-Gómez a,⁎, J.L. Garrido a, M.G. Vivanco a, L. Lassaletta b, I. Rábago a, A. Àvila c, S. Tsyro d, G. Sánchez e,A. González Ortiz f, I. González-Fernández a, R. Alonso a
a Atmospheric Pollution Division, CIEMAT, Av. Complutense 40, Madrid 28040, Spainb CNRS/Université Pierre et Marie Curie, UMR Sisyphe, 4 Place Jussieu, Paris 75005, Francec CREAF (Center for Ecological Research and Forestry Applications), Universitat Autònoma de Barcelona, Bellaterra 08193, Spaind MSC-W of EMEP, Norwegian Meteorological Institute, Henrik Mohns plass 1, Oslo 0313, Norwaye Spanish Ministry of Agriculture, Food and Environment (ICP Forests), c/Ríos Rosas 24-6°, Madrid 28003, Spainf Spanish Ministry of Agriculture, Food and Environment (Air Quality and Industrial Environment), Pza. S. Juan de la Cruz, s/n, Madrid 28071, Spain
H I G H L I G H T S
• CHIMERE and EMEP models acceptably estimate atmospheric N wet deposition in Spain.• Total (wet + dry) atmospheric N deposition in Spain in 2008 was up to 19–23 kg N ha−1.• Natural grasslands are the habitats most threatened by N deposition.• Biodiversity conservation in 3–7% of the assessed area could be threatened by N deposition.• Habitats in mountain areas are particularly threatened by N deposition.
⁎ Corresponding author. Tel.: +34 913466556; fax: +3E-mail addresses: [email protected] (H. García-G
[email protected] (I. Rábago), [email protected] (A(A. González Ortiz), [email protected] (I. Gonzá
http://dx.doi.org/10.1016/j.scitotenv.2014.03.1120048-9697/© 2014 Elsevier B.V. All rights reserved.
a b s t r a c t
a r t i c l e i n f oArticle history:Received 20 December 2013Received in revised form 13 March 2014Accepted 23 March 2014Available online xxxx
Editor: Charlotte Poschenrieder
Keywords:Nitrogen depositionAir quality modelMonitoring networkCritical load exceedanceNatura 2000 networkAlpine grasslands
TheMediterranean Basin presents an extraordinary biological richness but very little information is available on thethreat that air pollution, and in particular reactive nitrogen (N), can pose to biodiversity and ecosystem functioning.This study represents the first approach to assess the risk of N enrichment effects on Spanish ecosystems. The suit-ability of EMEP and CHIMERE air qualitymodel systems as tools to identify those areaswhere effects of atmosphericN deposition could be occurringwas tested. For this analysis, wet deposition of NO3
− andNH4+ estimatedwith EMEP
and CHIMEREmodel systems were compared with measured data for the period 2005–2008 obtained from differ-ent monitoring networks in Spain. Wet N deposition was acceptably predicted by both models, showing better re-sults for oxidized than for reduced nitrogen, particularly when using CHIMERE. Both models estimated higher wetdeposition values in northern and northeastern Spain, and decreasing along a NE–SWaxis. Total (wet+ dry) nitro-gen deposition in 2008 reached maxima values of 19.4 and 23.0 kg N ha−1 year−1 using EMEP and CHIMEREmodels respectively. Total N deposition was used to estimate the exceedance of N empirical critical loads in theNatura 2000 network. Grassland habitats proved to be the most threatened group, particularly in the northern al-pine area, pointing out that biodiversity conservation in these protected areas could be endangered byNdeposition.Other valuablemountain ecosystems can be also threatened, indicating the need to extend atmospheric depositionmonitoring networks to higher altitudes in Spain.
© 2014 Elsevier B.V. All rights reserved.
1. Introduction
The global biogeochemical cycle of nitrogen (N) has been deeplyaltered by human activities to the extent that the planetary boundary
4 913466121.ómez), [email protected] (. Àvila), [email protected] (S. Tslez-Fernández), rocio.alonso@ciemat
for human safe operating has long been crossed (Rockström et al.,2009). Anthropogenic reactive nitrogen (Nr) circulates across differentcompartments (atmosphere, hydrosphere and terrestrial ecosystems)inducing a cascade of environmental effects, such as tropospheric ozone
J.L. Garrido), [email protected] (M.G. Vivanco), [email protected] (L. Lassaletta),yro), [email protected] (G. Sánchez), [email protected] (R. Alonso).
451H. García-Gómez et al. / Science of the Total Environment 485–486 (2014) 450–460
formation, ecosystem acidification and eutrophication (Bobbink et al.,2010; Galloway et al., 2008; Sutton et al., 2011). Eutrophication is awidespread problem that affects most European ecosystems (EEA,2013). Increased atmospheric N deposition can directly damagevegetation, alter nutrient ratios in soil and vegetation, and increaseplant susceptibility to other stressors, resulting in changes of communitycomposition, loss of biodiversity and invasions of new species (Dise et al.,2011).
The Mediterranean Basin presents an extraordinary biologicalrichness recognized as one of the 25 Global Biodiversity Hotspotsfor conservation priorities (Myers et al., 2000). However, centralEurope and circum-Mediterranean countries comprise one of theplanet hotspots experiencing high N deposition rates (Denteneret al., 2006). Nonetheless, scarce information is available on thethreat that air pollution, and in particular Nr, can pose to biodiversityin the Mediterranean area (Bleeker et al., 2011; Ochoa-Hueso et al.,2011).
The Gothenburg Protocol of the Convention on Long-RangeTrans-boundary Air Pollution (CLRTAP) under the UNECE frameworkand the related European policies have resulted in substantial reduc-tions of the atmospheric emissions of N compounds in the period1990–2009 in Europe (EEA, 2011). During the same period, Spanishemission of NH3 increased 12.8% and NOx emissions eventuallydecreased 17%, after a continuous increase until 2007 (MAGRAMA,2013). In this sense, increases in NO3
− deposition have been detectedin the last decades in Catalonia (NE of Spain), while no significantchanges were detected in NH4
+ deposition (Àvila et al., 2010; Àvilaand Rodà, 2012; Camarero and Catalan, 2012). The increase in NO3
−
deposition has been related with the increases in NOx emissions(Àvila et al., 2010). Total annual atmospheric N deposition loads ineastern Spain have been estimated in 15–30 kg N ha−1 year−1,with dry deposition representing about 40–70% of total N deposition(Rodà et al., 2002; Sanz et al., 2002; Àvila and Rodà, 2012). Atmo-spheric N deposition in Spain is lower than values recorded in centralEurope, both measured (Lorenz and Becher, 2012) andmodeled data(Nyíri and Gauss, 2010). However, since changes in species composi-tion occur early in the sequence of N saturation (Emmett, 2007), Ndeposition effects could be occurring in Spanish natural ecosystems.Some evidences of N enrichment already occurring in Spanish terres-trial ecosystems have been reported. A continuous increase ofnitrophilous plant species has been detected in the Iberian Peninsulafor the period 1900–2008 using the Global Biodiversity InformationFacility (GBIF) database (Ariño et al., 2011). Also an increase in theN content in bryophytes, but not in vascular plants, has been ob-served in herbarium specimens collected in Spain throughout thelast century (Peñuelas and Filella, 2001). The reported rises of NO3
−
concentration in headwater streams detected in areas of NE Spainhave been considered a sign of the onset of eutrophication (Àvilaand Rodà, 2012; Camarero and Aniz, 2010).
Critical loads (CLs) are thresholds for N deposition, defined underthe CLRTAP for the protection of the ecosystems. CLs are defined as aquantitative estimate of pollutant deposition below which significantharmful effects on specified sensitive elements of the environment donot occur according to present knowledge (CLRTAP, 2004). Differentapproaches have been adopted in the Convention to define N criticalloads involving either modeling or field evidences. Empirical criticalloads of N have been defined for specific ecosystems (Bobbink et al.,2010; Bobbink and Hettelingh, 2011) based on observed changes inthe structure and function of the ecosystem, primarily in speciesabundance, composition and/or diversity (structure), or N leaching,decomposition or mineralization rate (functioning). Exceedances ofcritical loads are being used in Europe since 1990s to assess impactson biodiversity in natural ecosystems. In this sense, the use of empiricalCLs for nutrient N is recommended to inform whether N depositionshould be recorded as a “threat to future prospects” in the frameworkof the Habitats Directive 92/43/EEC (Henry and Aherne, 2014;
Whitfield et al., 2011). The Habitats Directive includes an Annex I witha list of habitat types of community interest requiring specific conserva-tionmeasures. Unfortunately, the definition and application of N empir-ical critical loads in Mediterranean habitats is still limited and furtherresearch is urgently required (Bobbink et al., 2010; Ochoa-Hueso et al.,2011; Pinho et al., 2012).
Suitable N deposition data are needed to identify those areaswhere effects of N deposition could be occurring in natural ecosys-tems. Since the availability of air pollutant concentration and deposi-tion data is limited in rural areas, air quality models constitute avaluable tool to quantify air pollution over broad geographicalareas. The European Monitoring and Evaluation Program developedthe EMEP MSC-W chemical transport model (Simpson et al., 2012),which estimates regional atmospheric dispersion and deposition ofacidifying and eutrophying compounds (S, N), ground level ozoneand particulate matter all over Europe. This model plays a key rolein the development of emission control strategies for Europe withinthe framework of the CLRTAP/UNECE and the European Unionpolicies. Similarly, the CHIMERE chemical transport model has beenextensively applied to simulate the evolution and spatial distributionof concentration of several pollutants such as ozone and its precur-sors, aerosols, etc. along with estimates of pollutant deposition, inparticular over Europe domain (Bessagnet et al., 2004; Vivancoet al., 2008, 2009).
The objectives of this work were 1) to document the performanceof the EMEP and CHIMEREmodel-systems for estimating atmospher-ic N wet deposition under Mediterranean environmental conditions;2) to analyze the distribution of atmospheric N deposition in Spain;and 3) to assess the risk of effects of atmospheric N deposition forbiodiversity preservation in the Spanish Natura 2000 network. Forthis analysis, wet deposition of NO3
− and NH4+ modeled by EMEP
and CHIMERE models were compared with measured data for theperiod 2005–2008 obtained from different monitoring networks inSpain: ICP Forests Level II plots, EMEP monitoring network and theAir Quality Network of the Regional Catalan Government. The aimwas to evaluate two available and widely used “model-systems”,with their different input data, model setup and the model itself, astools for ecosystem threat assessment. Modeled N deposition values,including wet and dry deposition, were used to detect those areaswith high atmospheric N deposition and to calculate exceedancesof empirical critical loads in the Natura 2000 network.
2. Material and methods
2.1. Measurements
2.1.1. ICP Forests Level II networkThe ICP Forests is a biomonitoring program launched in 1985 under
the CLRTAP with the aim of providing comprehensive information onforest condition in Europe and the possible relationships to anthropogen-ic and natural stress factors, in particular air pollution (http://icp-forests.net/). This Program includes Level II plots as intensive monitoring sitesoffering the possibility of understanding complex ecosystem processes.At these sites, bulk deposition is measured in open areas in the neighbor-hood of the forest plots and deposition under canopy is derivedfrom throughfall measurements following standard protocols (http://icp-forests.net/). Measured bulk deposition data of the 13 ICP ForestsLevel II plots located in Spain (Fig. 1) were considered for the period2005–2008. Fortnightly collected data were used to calculate annualaccumulated deposition rates (in some occasions data were collectedmonthly). Contaminated or unrealistic values were removed from thedata set. Only those years and plots with maxima 30 days (2 fortnightlyperiods) of missing measurements per year were considered. Valid dataused for the analysis represented 80% of the total dataset. Missing valueswere filled in with the monthly mean value for that site estimated fromdata available of the other years. Annual depositionwas calculated adding
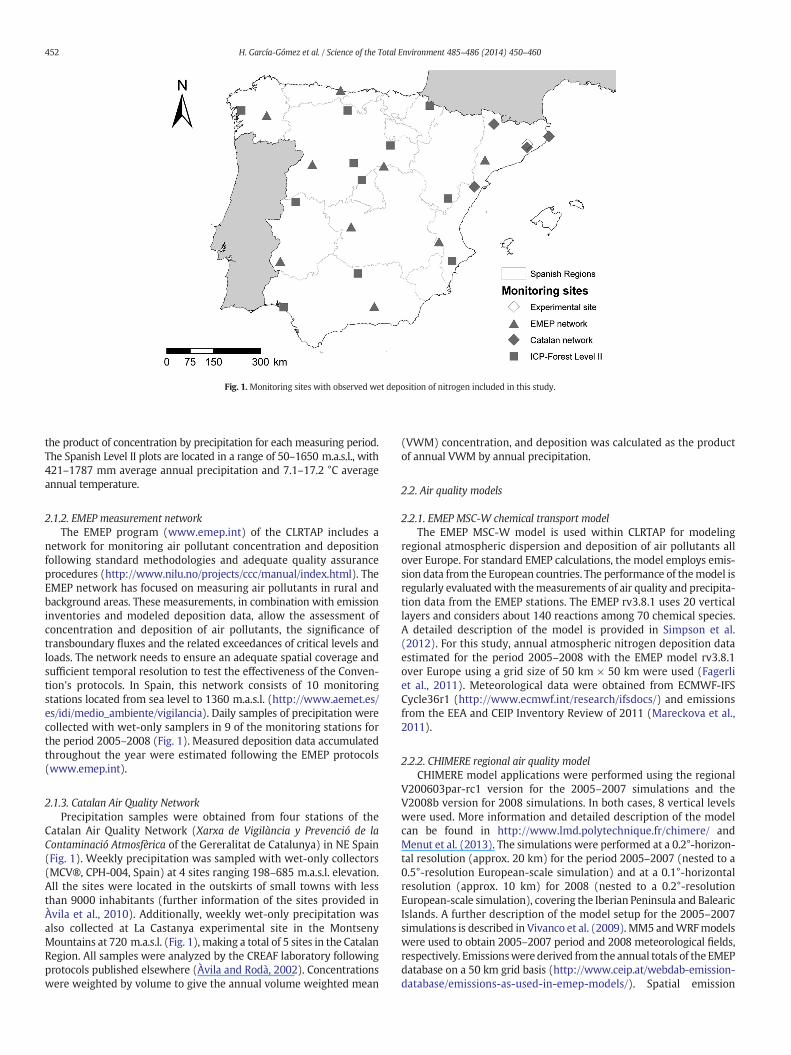
Fig. 1. Monitoring sites with observed wet deposition of nitrogen included in this study.
452 H. García-Gómez et al. / Science of the Total Environment 485–486 (2014) 450–460
the product of concentration by precipitation for each measuring period.The Spanish Level II plots are located in a range of 50–1650 m.a.s.l., with421–1787 mm average annual precipitation and 7.1–17.2 °C averageannual temperature.
2.1.2. EMEP measurement networkThe EMEP program (www.emep.int) of the CLRTAP includes a
network for monitoring air pollutant concentration and depositionfollowing standard methodologies and adequate quality assuranceprocedures (http://www.nilu.no/projects/ccc/manual/index.html). TheEMEP network has focused on measuring air pollutants in rural andbackground areas. These measurements, in combination with emissioninventories and modeled deposition data, allow the assessment ofconcentration and deposition of air pollutants, the significance oftransboundary fluxes and the related exceedances of critical levels andloads. The network needs to ensure an adequate spatial coverage andsufficient temporal resolution to test the effectiveness of the Conven-tion's protocols. In Spain, this network consists of 10 monitoringstations located from sea level to 1360 m.a.s.l. (http://www.aemet.es/es/idi/medio_ambiente/vigilancia). Daily samples of precipitation werecollected with wet-only samplers in 9 of the monitoring stations forthe period 2005–2008 (Fig. 1). Measured deposition data accumulatedthroughout the year were estimated following the EMEP protocols(www.emep.int).
2.1.3. Catalan Air Quality NetworkPrecipitation samples were obtained from four stations of the
Catalan Air Quality Network (Xarxa de Vigilància y Prevenció de laContaminació Atmosfèrica of the Gereralitat de Catalunya) in NE Spain(Fig. 1). Weekly precipitation was sampled with wet-only collectors(MCV®, CPH-004, Spain) at 4 sites ranging 198–685 m.a.s.l. elevation.All the sites were located in the outskirts of small towns with lessthan 9000 inhabitants (further information of the sites provided inÀvila et al., 2010). Additionally, weekly wet-only precipitation wasalso collected at La Castanya experimental site in the MontsenyMountains at 720 m.a.s.l. (Fig. 1), making a total of 5 sites in the CatalanRegion. All samples were analyzed by the CREAF laboratory followingprotocols published elsewhere (Àvila and Rodà, 2002). Concentrationswere weighted by volume to give the annual volume weighted mean
(VWM) concentration, and deposition was calculated as the productof annual VWM by annual precipitation.
2.2. Air quality models
2.2.1. EMEP MSC-W chemical transport modelThe EMEP MSC-W model is used within CLRTAP for modeling
regional atmospheric dispersion and deposition of air pollutants allover Europe. For standard EMEP calculations, the model employs emis-sion data from the European countries. The performance of themodel isregularly evaluated with themeasurements of air quality and precipita-tion data from the EMEP stations. The EMEP rv3.8.1 uses 20 verticallayers and considers about 140 reactions among 70 chemical species.A detailed description of the model is provided in Simpson et al.(2012). For this study, annual atmospheric nitrogen deposition dataestimated for the period 2005–2008 with the EMEP model rv3.8.1over Europe using a grid size of 50 km × 50 km were used (Fagerliet al., 2011). Meteorological data were obtained from ECMWF-IFSCycle36r1 (http://www.ecmwf.int/research/ifsdocs/) and emissionsfrom the EEA and CEIP Inventory Review of 2011 (Mareckova et al.,2011).
2.2.2. CHIMERE regional air quality modelCHIMERE model applications were performed using the regional
V200603par-rc1 version for the 2005–2007 simulations and theV2008b version for 2008 simulations. In both cases, 8 vertical levelswere used. More information and detailed description of the modelcan be found in http://www.lmd.polytechnique.fr/chimere/ andMenut et al. (2013). The simulations were performed at a 0.2°-horizon-tal resolution (approx. 20 km) for the period 2005–2007 (nested to a0.5°-resolution European-scale simulation) and at a 0.1°-horizontalresolution (approx. 10 km) for 2008 (nested to a 0.2°-resolutionEuropean-scale simulation), covering the Iberian Peninsula and BalearicIslands. A further description of the model setup for the 2005–2007simulations is described in Vivanco et al. (2009). MM5 andWRFmodelswere used to obtain 2005–2007 period and 2008 meteorological fields,respectively. Emissionswere derived from the annual totals of the EMEPdatabase on a 50 km grid basis (http://www.ceip.at/webdab-emission-database/emissions-as-used-in-emep-models/). Spatial emission
453H. García-Gómez et al. / Science of the Total Environment 485–486 (2014) 450–460
distribution and NMVOC speciation were performed as indicated inVivanco et al. (2009).
2.3. Comparison of measured and modeled data
The location of the monitoring sites of the different networks wasmatched with the corresponding EMEP and CHIMERE grid cells usingARCGIS version 9.3 (ESRI, Redlands CA, USA). Unfortunately, none of themonitoring sites included in this analysis were located in the Canary orBalearic Islands, thus the reported values of Spanish N wet depositionrepresent only the peninsular territory. Annual bulk deposition of NO3
−
and NH4+ measured in the ICP Forests plots and annual wet-only deposi-
tion measured in the EMEP and Catalan networks were compared withmodeled wet deposition data obtainedwith EMEP and CHIMEREmodels.A set of metrics commonly used in model evaluation (Chang and Hanna,2004; Yu et al., 2006), such as index of agreement (IOA), mean normal-ized bias (MNB), mean normalized absolute error (MNAE) and rootmean square error (RMSE, not normalized) were calculated as shown inTable 1 for nitrate wet deposition (WDON), ammonium wet deposition(WDRN) and total Nwet deposition (WDTN). Also scatterplots, Pearson'scorrelation coefficient (r) and linear regression were used to study therelationships between modeled and measured values. All the analysiswere performed using Statistica version 11 (StatSoft, Inc. Tule, OK,USA). Significance probability level was set at 0.05.
2.4. Risk assessment of atmospheric N deposition in the Natura 2000network
Total atmospheric N deposition, including wet and dry deposition,estimated for 2008 with EMEP and CHIMERE models was used toevaluate the risk of N effects in the Spanish Natura 2000 designatedareas. Only the habitat types of Community interest described in theAnnex I of the Habitats Directive located within the Natura 2000network were considered. Natural habitats of Community interest arethose habitats which are in danger of disappearance in their naturalrange; or have a small natural range following their regression or byreason of their intrinsically restricted area; or present outstandingexamples of typical characteristics of their biogeographical regions.These habitats covered 37% of the 188,856.9 km2 included in theSpanish Natura 2000 network (about 30% of the Spanish territory). Thespatial distribution of the habitat types of Community interest withinthe Natura 2000 network was obtained from the Spanish National Biodi-versity Assessment (http://www.magrama.gob.es/es/biodiversidad/servicios/banco-datos-naturaleza/).
The habitat types were matched with the corresponding EUNIShabitat classification used for defining empirical CLs (http://eunis.eea.europa.eu/related-reports.jsp). Empirical critical loads (CLs) of N deposi-tion recently revised in Bobbink and Hettelingh (2011) were used forestimating N exceedances, calculated as deposition minus CL (positiveexceedance is taken to be undesirable). In order to focus on mainterrestrial ecosystems, some habitats were excluded of the analysis:
Table 1Definition of themetrics used for evaluatingmodel performance. N: pairs of modeled (Mi)and observed (Oi) deposition. O corresponds to the arithmetic mean of observed values.The index i is over time series and over all the locations in the domain.
Statistical metric Equation
Index of agreement IOA ¼ 1 MiOið Þ2MiO�� ��þ OiO
�� ��� �2
Mean normalized bias MNB ¼ 1N
MiOi
Oi
� �¼ 1
NMi
Oi1Þ
�
Mean normalized absolute error MNAE ¼ 1N
MiOij jOi
� �
Root mean square error RMSE ¼ 1N MiOið Þ2�
12
�
coastal and halophytic habitats, freshwater habitats, rocky habitats andcaves, and wetlands. Consequently, the area considered for estimating Nexceedances occupied an extension of 52,182.9 km2. The CL assigned toeach habitat type was the average of the range of empirical CLs reportedby Bobbink and Hettelingh (2011) for each habitat type. When an Nempirical CLwas not defined for a habitat, the CLs of similar or equivalenthabitatswere used (these cases represented about 30%of the total surfaceassessed). Annex 1 of the present work describes the details of the Nempirical CLs applied to eachhabitat type included in the analysis. Habitattypes of Annex I of the Habitats Directive have been gathered in habitatssub-groups in Table 2, showing the minimum and maximum CL usedwithin the sub-group, given that different habitat types are included.The scientific background supporting the empirical CL of N is describedin detail in Bobbink and Hettelingh (2011). The exceedance values andthe area where the CL is exceeded were estimated for each vegetationtype. Additionally, for each habitat sub-group, CL exceedances wereestimated weighting exceedances by the corresponding areas. All theanalysis were performed using ARCGIS version 9.3 (ESRI, Redlands CA,USA) and MS Access 2010 (Microsoft, Seattle WA, USA).
3. Results and discussion
3.1. Comparison of measured and modeled data
Measured values of annual precipitation and N wet deposition werecomparedwith values estimatedwith the EMEP and CHIMERE air qualitymodels (Table 3, Fig. 2). In general, the CHIMEREmodel performed betterfor estimating WDON than EMEP, since better correlation and IOA and alower error metrics (RMSE, MNB and MNAE) were obtained (Table 3).The scatterplots of model results vs. observations showed, in general,similar regression functions for both models. The slope and interceptionvalues indicate an underestimation of the high and overestimation thelow N deposition values. In the case of WDRN, the CHIMERE modelprovided less correct estimates than EMEP as deduced from the lowercorrelation and IOA, higher MNB and MNAE (Table 3), and regressionfunctions and scatterplots (Fig. 2). CHIMERE clearly underestimatedWDRN (with aMNBof−46%). For total wet deposition (WDTN), the cor-relation coefficients for the CHIMERE results were better, while the EMEPmodel provided higher IOA. However, CHIMERE clearly underestimatedWDTN (with aMNB of−26%), mostly due to the strong underpredictionof WDRN. The values of RMSE and MNAE were very similar for bothmodels. The RMSEmetrics indicated that the average difference betweenboth model estimations of WDTN was about 0.2 kg N ha−1 year−1.
Interestingly, annual precipitation estimates used by bothmodels cor-related better withmeasured values thanwet deposition. Some underes-timation of high precipitation was shown by both models, but all theevaluation metrics indicated an adequate model performance (high IOAvalues and relatively low values of MNB and MNAE). The estimates ofprecipitation for the Spanish ICP Forest plots showed that both EMEPand CHIMERE performed better than values reported when comparingEMEP model with ICP-Forest data across Europe (Simpson et al.,2006a). This result could be explained by the homogeneity of precipita-tion collectors used in Spain compared to the variety of collectors usedby the different countries in previous comparisons (Erisman et al., 2003).
Nitrogen wet deposition estimations were also compared withobserved values for eachmeasurement network independently. Model-ing N wet deposition in EMEP sites obtained the best results, especiallywhen using the EMEPmodel (Table 3), with correlation coefficients in arange (0.60–0.76) similar to those reported for other European areas(Simpson et al., 2006b). In fact, a recent review reported that EMEPmodel performance for estimating N compounds concentration inprecipitation in the Mediterranean area was comparable to the onefound in other parts of Europe (Aas et al., 2010).
Model estimates of N wet deposition for the ICP Forests sites weresimilar or slightly more incorrect than for EMEP sites. In this case,both EMEP and CHIMERE models underestimated wet N deposition
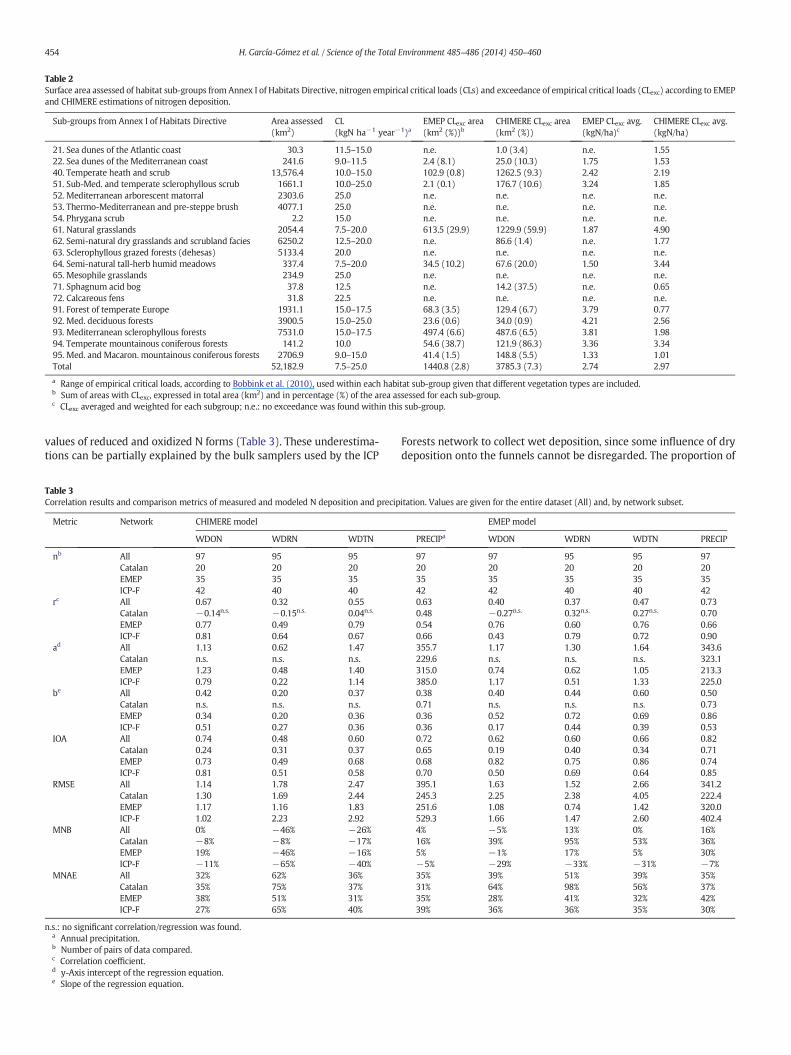
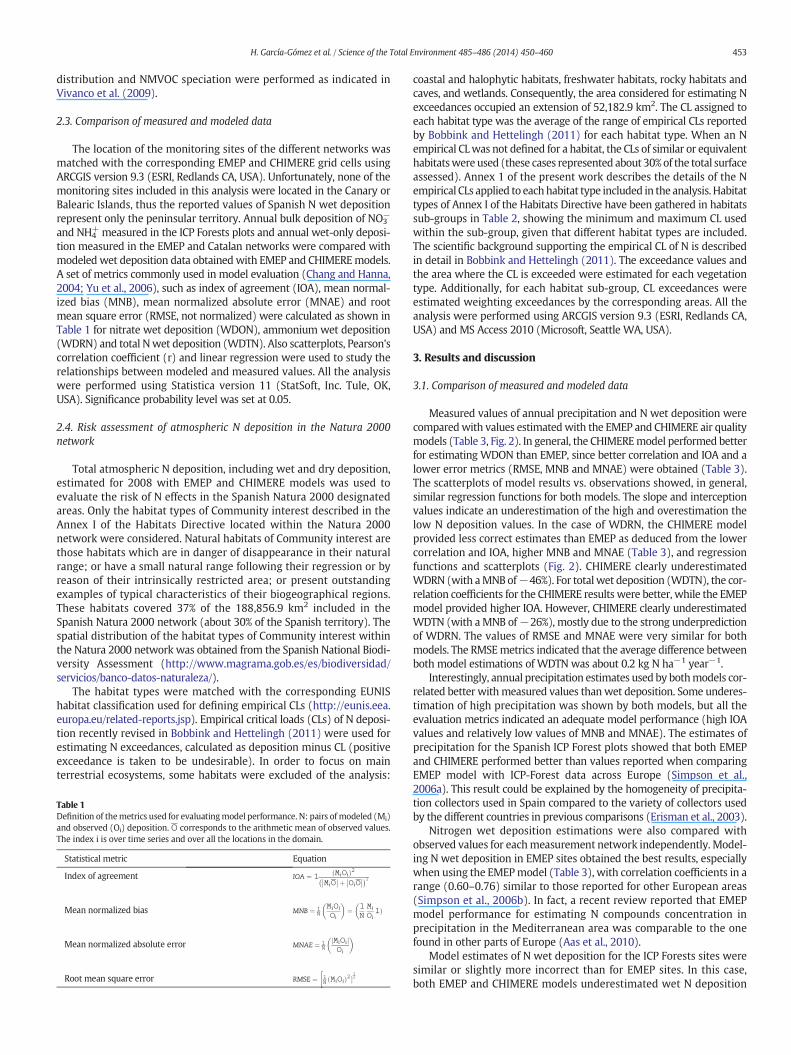
Table 2Surface area assessed of habitat sub-groups from Annex I of Habitats Directive, nitrogen empirical critical loads (CLs) and exceedance of empirical critical loads (CLexc) according to EMEPand CHIMERE estimations of nitrogen deposition.
Sub-groups from Annex I of Habitats Directive Area assessed(km2)
CL(kgN ha−1 year−1)a
EMEP CLexc area(km2 (%))b
CHIMERE CLexc area(km2 (%))
EMEP CLexc avg.(kgN/ha)c
CHIMERE CLexc avg.(kgN/ha)
21. Sea dunes of the Atlantic coast 30.3 11.5–15.0 n.e. 1.0 (3.4) n.e. 1.5522. Sea dunes of the Mediterranean coast 241.6 9.0–11.5 2.4 (8.1) 25.0 (10.3) 1.75 1.5340. Temperate heath and scrub 13,576.4 10.0–15.0 102.9 (0.8) 1262.5 (9.3) 2.42 2.1951. Sub-Med. and temperate sclerophyllous scrub 1661.1 10.0–25.0 2.1 (0.1) 176.7 (10.6) 3.24 1.8552. Mediterranean arborescent matorral 2303.6 25.0 n.e. n.e. n.e. n.e.53. Thermo-Mediterranean and pre-steppe brush 4077.1 25.0 n.e. n.e. n.e. n.e.54. Phrygana scrub 2.2 15.0 n.e. n.e. n.e. n.e.61. Natural grasslands 2054.4 7.5–20.0 613.5 (29.9) 1229.9 (59.9) 1.87 4.9062. Semi-natural dry grasslands and scrubland facies 6250.2 12.5–20.0 n.e. 86.6 (1.4) n.e. 1.7763. Sclerophyllous grazed forests (dehesas) 5133.4 20.0 n.e. n.e. n.e. n.e.64. Semi-natural tall-herb humid meadows 337.4 7.5–20.0 34.5 (10.2) 67.6 (20.0) 1.50 3.4465. Mesophile grasslands 234.9 25.0 n.e. n.e. n.e. n.e.71. Sphagnum acid bog 37.8 12.5 n.e. 14.2 (37.5) n.e. 0.6572. Calcareous fens 31.8 22.5 n.e. n.e. n.e. n.e.91. Forest of temperate Europe 1931.1 15.0–17.5 68.3 (3.5) 129.4 (6.7) 3.79 0.7792. Med. deciduous forests 3900.5 15.0–25.0 23.6 (0.6) 34.0 (0.9) 4.21 2.5693. Mediterranean sclerophyllous forests 7531.0 15.0–17.5 497.4 (6.6) 487.6 (6.5) 3.81 1.9894. Temperate mountainous coniferous forests 141.2 10.0 54.6 (38.7) 121.9 (86.3) 3.36 3.3495. Med. and Macaron. mountainous coniferous forests 2706.9 9.0–15.0 41.4 (1.5) 148.8 (5.5) 1.33 1.01Total 52,182.9 7.5–25.0 1440.8 (2.8) 3785.3 (7.3) 2.74 2.97
a Range of empirical critical loads, according to Bobbink et al. (2010), used within each habitat sub-group given that different vegetation types are included.b Sum of areas with CLexc, expressed in total area (km2) and in percentage (%) of the area assessed for each sub-group.c CLexc averaged and weighted for each subgroup; n.e.: no exceedance was found within this sub-group.
454 H. García-Gómez et al. / Science of the Total Environment 485–486 (2014) 450–460
values of reduced and oxidized N forms (Table 3). These underestima-tions can be partially explained by the bulk samplers used by the ICP
Table 3Correlation results and comparison metrics of measured and modeled N deposition and precip
Metric Network CHIMERE model
WDON WDRN WDTN
nb All 97 95 95Catalan 20 20 20EMEP 35 35 35ICP-F 42 40 40
rc All 0.67 0.32 0.55Catalan −0.14n.s. −0.15n.s. 0.04n.s.
EMEP 0.77 0.49 0.79ICP-F 0.81 0.64 0.67
ad All 1.13 0.62 1.47Catalan n.s. n.s. n.s.EMEP 1.23 0.48 1.40ICP-F 0.79 0.22 1.14
be All 0.42 0.20 0.37Catalan n.s. n.s. n.s.EMEP 0.34 0.20 0.36ICP-F 0.51 0.27 0.36
IOA All 0.74 0.48 0.60Catalan 0.24 0.31 0.37EMEP 0.73 0.49 0.68ICP-F 0.81 0.51 0.58
RMSE All 1.14 1.78 2.47Catalan 1.30 1.69 2.44EMEP 1.17 1.16 1.83ICP-F 1.02 2.23 2.92
MNB All 0% −46% −26%Catalan −8% −8% −17%EMEP 19% −46% −16%ICP-F −11% −65% −40%
MNAE All 32% 62% 36%Catalan 35% 75% 37%EMEP 38% 51% 31%ICP-F 27% 65% 40%
n.s.: no significant correlation/regression was found.a Annual precipitation.b Number of pairs of data compared.c Correlation coefficient.d y-Axis intercept of the regression equation.e Slope of the regression equation.
Forests network to collect wet deposition, since some influence of drydeposition onto the funnels cannot be disregarded. The proportion of
itation. Values are given for the entire dataset (All) and, by network subset.
EMEP model
PRECIPa WDON WDRN WDTN PRECIP
97 97 95 95 9720 20 20 20 2035 35 35 35 3542 42 40 40 420.63 0.40 0.37 0.47 0.730.48 −0.27n.s. 0.32n.s. 0.27n.s. 0.700.54 0.76 0.60 0.76 0.660.66 0.43 0.79 0.72 0.90355.7 1.17 1.30 1.64 343.6229.6 n.s. n.s. n.s. 323.1315.0 0.74 0.62 1.05 213.3385.0 1.17 0.51 1.33 225.00.38 0.40 0.44 0.60 0.500.71 n.s. n.s. n.s. 0.730.36 0.52 0.72 0.69 0.860.36 0.17 0.44 0.39 0.530.72 0.62 0.60 0.66 0.820.65 0.19 0.40 0.34 0.710.68 0.82 0.75 0.86 0.740.70 0.50 0.69 0.64 0.85395.1 1.63 1.52 2.66 341.2245.3 2.25 2.38 4.05 222.4251.6 1.08 0.74 1.42 320.0529.3 1.66 1.47 2.60 402.44% −5% 13% 0% 16%16% 39% 95% 53% 36%5% −1% 17% 5% 30%−5% −29% −33% −31% −7%35% 39% 51% 39% 35%31% 64% 98% 56% 37%35% 28% 41% 32% 42%39% 36% 36% 35% 30%
455H. García-Gómez et al. / Science of the Total Environment 485–486 (2014) 450–460

Fig. 3. (a) Annual averages of wet deposition of N-nitrate (WDON), N-ammonium(WDRN) and precipitation observed atmonitoring sites. (b) Annual averages of wet depo-sition of WDON and WDRN and precipitation at monitoring sites, predicted by EMEP(black lines) and CHIMERE (gray lines) models. Solid lines: WDON; dashed lines:WDRN; dotted lines: precipitation rate.
456 H. García-Gómez et al. / Science of the Total Environment 485–486 (2014) 450–460
dry deposition collected in the funnels depends on location, climate,sampler aerodynamic characteristics and chemical component (Erismanet al., 2003). Results from bulk vs. wet-only comparison in the experi-mental Catalan site (La Castanya) indicated an overestimation of about10% of nitrate concentration in bulk collectors, although ammoniumwas underestimated by 25% (Izquierdo and Àvila, 2012).
Surprisingly, model predictions of N wet deposition were fairly poorwhen comparing with measurements obtained in the five Catalanmonitoring sites. Correlations between modeled and measured deposi-tionwere not significant and the IOAmetrics were always below 0.5 forboth model approaches (Table 3). The lack of correlation in the Catalanregion was not directly explained by poor predictions of precipitation,which were acceptable with both model systems. The small range ofdeposition values collected in the area could hinder statistic correlation.Also the complex topography of this region and the influence of localemissions might explain the poor model performance at small regionalscale. In these conditions, the EMEPmodel with a 50 × 50 km resolutioncannot be expected to reproduce small-scale variations in depositionregimes as it is argued in previous studies (e.g. Simpson et al., 2006a).However, CHIMERE model, despite its finer resolution, obtained onlyslightly better error metrics for the Catalan sites.
The higher resolution used with CHIMERE for 2008 estimations(10 × 10 km compared to 20 × 20 km resolution used for 2005–2007)did not improve the overall estimation of wet deposition and all theevaluation metrics considered were within the ranges of valuesobserved for previous years (data not shown). Similarly, increasingEMEP model resolution and a finer placement of emission sources areexpected to have significant improvements in polluted areas but a sim-ilar performance has been described for wet deposition and concentra-tion in precipitation estimations in rural areas (Cuvelier et al., 2013;Hirst and Storvik, 2003; Nyíri and Gauss, 2010).
In summary, evaluation metrics and scatterplots of modeled vs.measured values indicate that both CHIMERE and EMEPmodels generallyunderestimate the high and overestimate the lowmeasured atmosphericN deposition values. Nevertheless, estimations of total N wet depositionperformance in Spain provided by both models are in general withinacceptable ranges (Table 3, Fig. 2), although results should be appliedwith caution, especially at small regional scale. Differences on the resultsobtained with both model systems can be explained by the differentinput data, setup and model estimations. The models' setup was not har-monized because the analysis performed did not intend to compare bothmodels. A more detailed comparison of both models is currently beingdeveloped considering monthly values.
3.2. Atmospheric nitrogen deposition in Spain
Annual values of N wet deposition measured in the monitoring sitesfor the period 2005–2008 ranged 0.3–7.7 kg N ha−1 year−1 of WDRN,0.4–9.6 kg N ha−1 year−1 of WDON, and 0.7–13.3 kg N ha−1 year−1 ofWDTN. For each monitoring station, interannual variability of measuredwet deposition represented about 25–30% of the average value. Similarvariability was observed in wet deposition values estimated withCHIMERE in the cells corresponding to those sites, while EMEP modelpresented lower interannual variability (13–14%). The difference inscale between EMEP and CHIMERE could be the reason for this disparity.Despite this lower interannual variability observed in the EMEP results,both models provided acceptable predictions of wet deposition valuesas discussed in the previous section. It is interesting that the noticeable14% reduction of oxidized N emissions reported in 2008 with respect tothe previous year (MAGRAMA, 2013) was not reflected in measurednor in modeled WDON (Fig. 3). This result is probably related to the
Fig. 2. Scatterplots and regression lines formodeled vs. observed annual values of oxidized (WDEMEP monitoring sites; □ —•—•□ ICP-forests level II monitoring sites; ♦ Catalan monitoring sit
higher precipitation rate registered in 2008 compared to 2007, andhighlights the importance of considering precipitation variability whenevaluating the effectiveness of control emission strategies on depositiontrends. In fact,measured total Nwet deposition (WDTN)was significantlycorrelated with precipitation (r = 0.61; p b 0.05) for the period consid-ered. Accordingly, maximum wet deposition was mainly located in theNorthern area of Spain where the highest precipitation occurs.
Average measured wet deposition of oxidized N (WDON) for theperiod 2005–2008 was 2.33 kg N ha−1 year−1, a 12% higher than the2.08 kg N ha−1 year−1 of reduced N (WDRN). However, many of theinland sites located far from the coast and from the main industrialareas showed slightly higher WDRN than WDON. This composition ofmeasured wet deposition seems to reflect total national emissions of re-duced and oxidized N, since average values for the period 2005–2008 ofoxidized N were 26% higher than emissions of reduced N (400.3 kTonof N-NOx vs 318.3 kTon of N-NH3 respectively; MAGRAMA, 2013). Onthe other hand, modeled deposition of oxidized and reduced N in thesemonitoring sites showed an averaged ratio WDON/WDRN slightlylower than expected in the case of EMEPmodel (0.96) and clearly higherfor CHIMERE model (2.67).
ModeledNwet deposition in Spain showed a decreasingdistributionalong a NE–SW axis, with higher deposition in the northern and easterncoastal regions than inland and southern areas (Fig. 4). EMEP modelshowed similar distribution patterns of oxidized and reduced Ndeposition, with the highest values in NE of Spain (reaching 6.5 and7.7 kg N ha−1 year−1, respectively). CHIMERE showed higher deposition
ON), reduced (WDRN) and total Nwet deposition (WDTN) atmonitoring sites.▲·······▲es. Solid line shows the regression line for all data together.
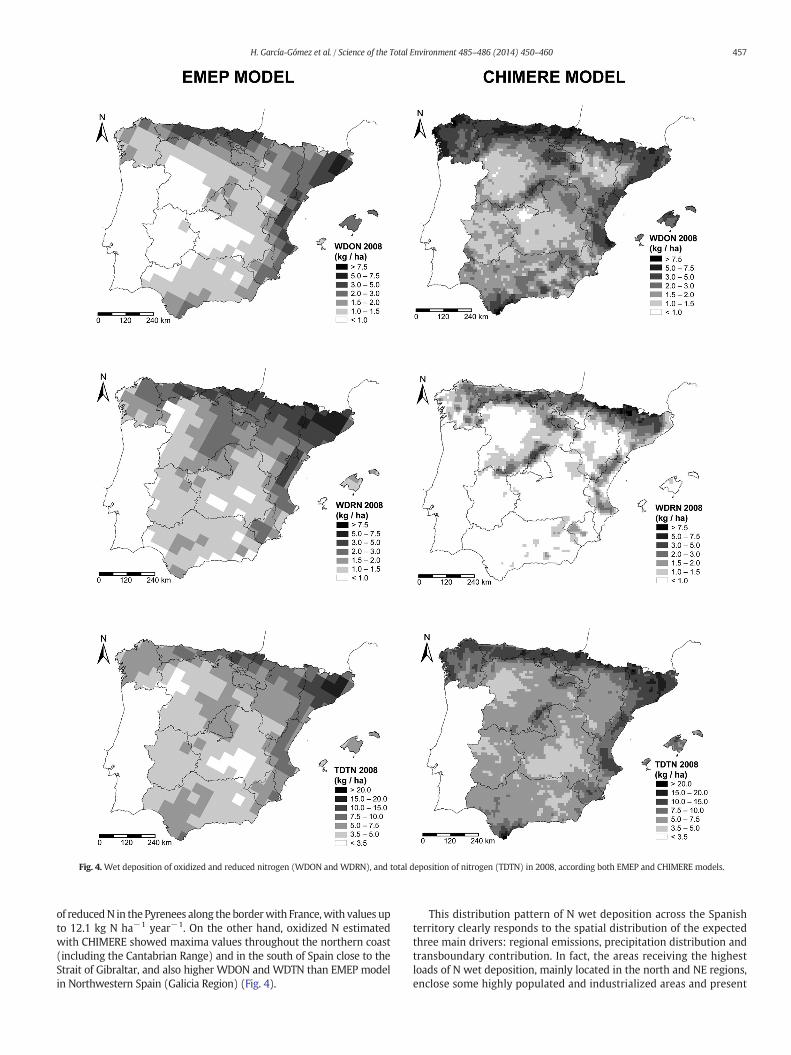
Fig. 4. Wet deposition of oxidized and reduced nitrogen (WDON and WDRN), and total deposition of nitrogen (TDTN) in 2008, according both EMEP and CHIMERE models.
457H. García-Gómez et al. / Science of the Total Environment 485–486 (2014) 450–460
of reducedN in the Pyrenees along the borderwith France,with values upto 12.1 kg N ha−1 year−1. On the other hand, oxidized N estimatedwith CHIMERE showed maxima values throughout the northern coast(including the Cantabrian Range) and in the south of Spain close to theStrait of Gibraltar, and also higher WDON and WDTN than EMEP modelin Northwestern Spain (Galicia Region) (Fig. 4).
This distribution pattern of N wet deposition across the Spanishterritory clearly responds to the spatial distribution of the expectedthree main drivers: regional emissions, precipitation distribution andtransboundary contribution. In fact, the areas receiving the highestloads of N wet deposition, mainly located in the north and NE regions,enclose some highly populated and industrialized areas and present
458 H. García-Gómez et al. / Science of the Total Environment 485–486 (2014) 450–460
high precipitation rates (AEMET, 2011). Transboundary pollution canalso represent an important contribution (up to 60–70%) in some ofthe areas that show high N deposition such as Northern Spain or thevicinity of the Strait of Gibraltar (Nyíri et al., 2010).
Air quality models also provide estimations of N dry deposition.Spanish WDTN estimated for 2008 was within the range 1.5–13.4 kgN ha−1 year−1 when using EMEP and 0.9–16.1 kg N ha−1 year−1
when using CHIMERE. Dry deposition estimated with EMEP in 2008represented 14–59% of total N deposition with an average value of40%. In the case of CHIMERE, dry deposition represented 11–83% oftotal N deposition with an average value of 54%. Previous studies per-formed in Spain calculated that dry deposition represented 62–67% oftotal N deposition in Quercus ilex forests (Rodà et al., 2002) and 40–75%in Pinus halepensis forests (Sanz et al., 2002) in NE and eastern Spainrespectively. Values estimated by the models on those grid cells wheremonitoring plots are located in Q. ilex or P. halepensis forests, showedthat 39% with EMEP and 54% with CHIMERE of N total deposition wasassociated to dry deposition. Although data from different years are com-pared, these results might suggest that the importance of dry depositioncould be underestimated, particularly by the EMEP model, for thisMediterranean area. More detailed studies are needed to characterizedry deposition in ecosystems under typicallyMediterranean climate con-ditions.When considering both dry andwet N deposition, total N deposi-tion in 2008 in Spain reached maxima values of 19.45 kg N ha−1 year−1
and 22.98 kg N ha−1 year−1 for EMEP and CHIMERE, respectively. Distri-bution of total N deposition followed similar patterns to those observedfor wet deposition, with higher values in the north and NE of the countryand close to the strait of Gibraltar in the south (Fig. 4).
3.3. Risk assessment of atmospheric N deposition in the Natura 2000network
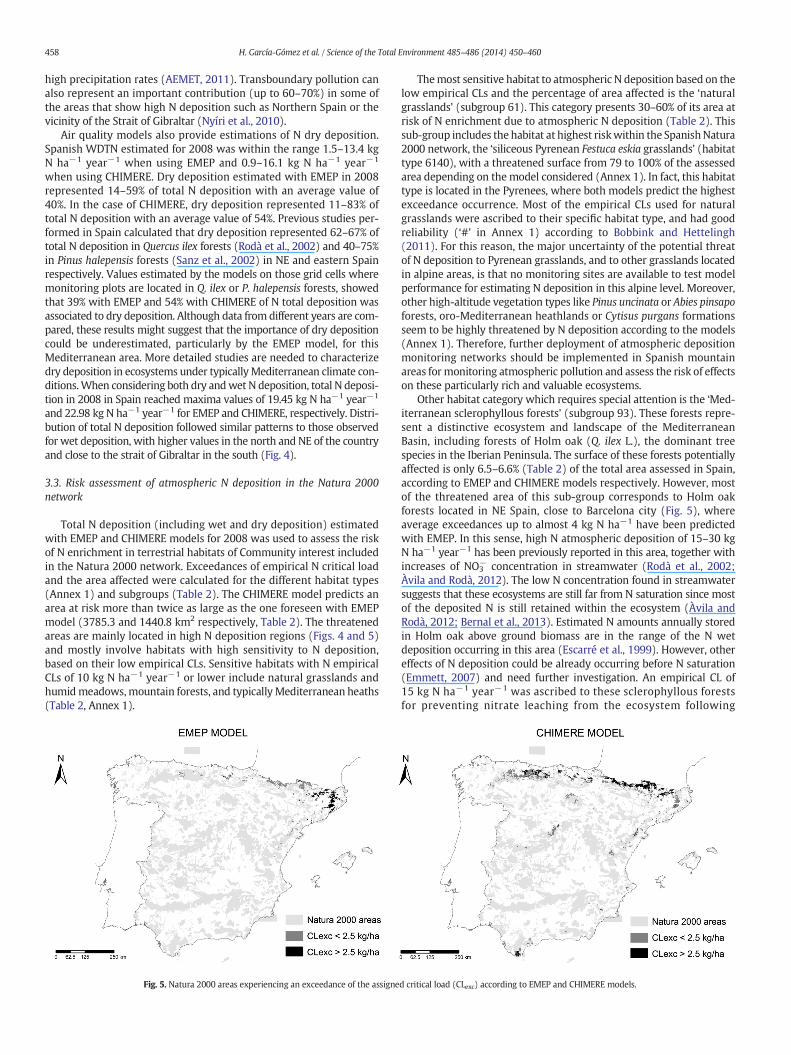
Total N deposition (including wet and dry deposition) estimatedwith EMEP and CHIMERE models for 2008 was used to assess the riskof N enrichment in terrestrial habitats of Community interest includedin the Natura 2000 network. Exceedances of empirical N critical loadand the area affected were calculated for the different habitat types(Annex 1) and subgroups (Table 2). The CHIMERE model predicts anarea at risk more than twice as large as the one foreseen with EMEPmodel (3785.3 and 1440.8 km2 respectively, Table 2). The threatenedareas are mainly located in high N deposition regions (Figs. 4 and 5)and mostly involve habitats with high sensitivity to N deposition,based on their low empirical CLs. Sensitive habitats with N empiricalCLs of 10 kg N ha−1 year−1 or lower include natural grasslands andhumidmeadows,mountain forests, and typically Mediterranean heaths(Table 2, Annex 1).
Fig. 5. Natura 2000 areas experiencing an exceedance of the assigne
Themost sensitive habitat to atmospheric N deposition based on thelow empirical CLs and the percentage of area affected is the ‘naturalgrasslands’ (subgroup 61). This category presents 30–60% of its area atrisk of N enrichment due to atmospheric N deposition (Table 2). Thissub-group includes the habitat at highest riskwithin the SpanishNatura2000 network, the ‘siliceous Pyrenean Festuca eskia grasslands’ (habitattype 6140), with a threatened surface from 79 to 100% of the assessedarea depending on themodel considered (Annex 1). In fact, this habitattype is located in the Pyrenees, where both models predict the highestexceedance occurrence. Most of the empirical CLs used for naturalgrasslands were ascribed to their specific habitat type, and had goodreliability (‘#’ in Annex 1) according to Bobbink and Hettelingh(2011). For this reason, the major uncertainty of the potential threatof N deposition to Pyrenean grasslands, and to other grasslands locatedin alpine areas, is that no monitoring sites are available to test modelperformance for estimating N deposition in this alpine level. Moreover,other high-altitude vegetation types like Pinus uncinata or Abies pinsapoforests, oro-Mediterranean heathlands or Cytisus purgans formationsseem to be highly threatened by N deposition according to the models(Annex 1). Therefore, further deployment of atmospheric depositionmonitoring networks should be implemented in Spanish mountainareas for monitoring atmospheric pollution and assess the risk of effectson these particularly rich and valuable ecosystems.
Other habitat category which requires special attention is the ‘Med-iterranean sclerophyllous forests’ (subgroup 93). These forests repre-sent a distinctive ecosystem and landscape of the MediterraneanBasin, including forests of Holm oak (Q. ilex L.), the dominant treespecies in the Iberian Peninsula. The surface of these forests potentiallyaffected is only 6.5–6.6% (Table 2) of the total area assessed in Spain,according to EMEP and CHIMERE models respectively. However, mostof the threatened area of this sub-group corresponds to Holm oakforests located in NE Spain, close to Barcelona city (Fig. 5), whereaverage exceedances up to almost 4 kg N ha−1 have been predictedwith EMEP. In this sense, high N atmospheric deposition of 15–30 kgN ha−1 year−1 has been previously reported in this area, together withincreases of NO3
− concentration in streamwater (Rodà et al., 2002;Àvila and Rodà, 2012). The low N concentration found in streamwatersuggests that these ecosystems are still far from N saturation since mostof the deposited N is still retained within the ecosystem (Àvila andRodà, 2012; Bernal et al., 2013). Estimated N amounts annually storedin Holm oak above ground biomass are in the range of the N wetdeposition occurring in this area (Escarré et al., 1999). However, othereffects of N deposition could be already occurring before N saturation(Emmett, 2007) and need further investigation. An empirical CL of15 kg N ha−1 year−1 was ascribed to these sclerophyllous forestsfor preventing nitrate leaching from the ecosystem following
d critical load (CLexc) according to EMEP and CHIMERE models.

459H. García-Gómez et al. / Science of the Total Environment 485–486 (2014) 450–460
expert criteria (Bobbink and Hettelingh, 2011). However, criticalloads from 5.5 kg N ha−1 year−1 to 26 kg N ha−1 year−1 havebeen proposed for the protection of epiphytic lichens in similarnatural ecosystems (Fenn et al., 2010; Pinho et al., 2012).
Both models highlight that the highest occurrence of threatenedareas happen in NE Spain, particularly in the Pyrenees mountainrange, where 41% and 71% of the area assessed within the SpanishAlpine Bio-geographical Region could be experiencing CL exceedances,according to EMEP and CHIMERE models, respectively. This high riskis explained by the elevated N deposition and the presence of sensitivehabitats such as mountain grasslands, heaths and some forest ecosys-tems. This result agreeswith the effects of N deposition already reportedin the area of Central Pyrenees (Aigüestortes i Estany de Sant MauriciNational Park, 2236 m.a.s.l.), where increases of nitrate concentration inheadwater streams of high altitude catchments have been associatedwith aN saturation process due to atmosphericNdeposition (Aigüestortesi Estany de Sant Maurici National Park, 2236 m.a.s.l.; Camarero andCatalan, 2012; Camarero and Aniz, 2010). Other areas, detected withthe CHIMERE model, where exceedances of N empirical CLs could be oc-curring are themountainous regions locatednorth ofMadrid City (centralSpain), in the Eastern Coast, on the Cantabrian Range (northern Spain)and near the Strait of Gibraltar (southern Spain).
The present analysis represents the first approach to assess the riskof effects of N enrichment for Spanish ecosystems within Natura 2000network. Exceedances of N critical loads were related with highWDON more often than with high WDRN or dry deposition rates.Although further investigation is urgently needed to confirm thesuitability of N empirical critical loads used, this study points out thatsome natural ecosystems could be receiving atmospheric N depositionabove safety thresholds and, consequently, suffering harmful effects.The habitats most at risk are the Pyrenean grasslands, mountain forestsof P. uncinata or A. pinsapo, Mediterranean sclerophyllous forests ofCatalonia and the oro-Mediterranean heathlands of the CantabrianRange. Interestingly, some evidences of N effects have been alreadyreported in some of these areas (Àvila and Rodà, 2012; Blanes et al.,2013; Camarero and Catalan, 2012). These agreements suggest thatthemethodology applied in this analysis results suitable for risk assess-ment of N deposition effects in Spanish natural and semi-naturalhabitats.
4. Conclusions
EMEP and CHIMERE air quality models constitute suitable tools toprovide acceptable estimates of N wet deposition, particularly foroxidized N in Spain. However, estimates should be applied with cautionin studies at small regional scale and in regions with complex topogra-phy and the influence of local emissions. Measured wet deposition ofnitrogen in Spain reached maxima values of WDTN up to 13.3 kgN ha−1 year−1 in northern Spain for the period 2005–2008. Bothmodels estimated higher wet deposition of N in the north and northeastSpain. Adding dry deposition, total N deposition in 2008 in Spain reachedmaxima values of 19.5 kg N ha−1 year−1 and 22.9 kg N ha−1 year−1
calculated with EMEP and CHIMERE, respectively. Distribution of total Ndeposition followed similar patterns observed for wet deposition.
Total atmospheric N deposition exceeded in many areas the empiri-cal critical loads proposed for the protection of terrestrial habitat ofCommunity interest included in the Spanish Natura 2000 network.The habitats presenting the highest risk of N effects are the naturalgrasslands ofmountain areas located in the north (Pyrenees, CantabrianRange), together with some forests and endemic heaths in the sameareas. Biodiversity conservation in these protected areas could beendangered by N deposition. Other habitats showing significantexceedances of N empirical critical loads were located in mountainareas close to high emission sources, such as Mediterranean forestsand mountain scrublands close to Barcelona and Madrid cities, in theEastern Coast, and near the Strait of Gibraltar.
These results highlight that atmospheric N deposition should be con-sidered as a factor that could be affecting the biodiversity and health ofthe protected natural ecosystems in Spain. Since most of the threatenedhabitats are located inmountain areas, atmospheric deposition networksshould be extended and include some monitoring stations in mountainregions. More detailed investigations should be carried out to quantifycurrent effects, to improve empirical critical loads definition for someMediterranean ecosystems and to explore possible management prac-tices that might ameliorate these effects.
Supplementary data to this article can be found online at http://dx.doi.org/10.1016/j.scitotenv.2014.03.112.
Conflict of interest
The authors declare that there are no conflicts of interest.
Acknowledgments
This researchwas funded by the Spanish projects ConsoliderMontesCSD2008-00040, CGL2009-13188-C03-02, Comunidad de Madrid-Agrisost project S2009AGR-1630, and the EU-FP7-ENV-2011 ECLAIREproject. This study was also supported by the Spanish Ministry of Agri-culture, Food and Environment (Resolución 15398, BOE n° 230). Wesincerely acknowledge the two anonymous reviewers for a very de-tailed and constructive revision of our work. The authors would like tospecially acknowledge Eugenio Sánchez García for his help with GISprocessing and Fernando Martín Llorente and Hilde Fagerli for theirhelpful comments and suggestions.
References
Aas W, Solberg S, Gauss M, Simpson D. The Mediterranean Region. Transboundaryacidification, eutrophication and ground level ozone in Europe in 2008. EMEP statusreport 1/2010Oslo, Norway: The Norwegian Meteorological Institute; 2010. p.99–104.
AEMET. Iberian climate atlas. In: National Meteorological Agency and Ministry ofEnvironment, Marine and Rural Affaris, editors. Air temperature and precipitation(1971–2000); 2011. [Available at http://www.aemet.es/documentos/es/conocermas/publicaciones/Atlas-climatologico/Atlas.pdf].
Ariño AH, Gimeno BS, Pérez de Zabalza A, Ibáñez R, Ederra A, Santamaría JM. Influence of ni-trogen deposition on plant biodiversity at Natura 2000 sites in Spain. In: HicksWK, et al,editors. Nitrogen deposition and Natura 2000. Science & practice in determining envi-ronmental impacts. COST729/Nine/ESF/CCW/JNCC/SEI Workshop ProceedingsCOST;2011. p. 140–6. [http://cost729.ceh.ac.uk/n2kworkshop].
Àvila A, Rodà F. Assessing decadal changes in rainwater alkalinity at a rural Mediterra-nean site in the Montseny Mountains (NE Spain). Atmos Environ 2002;36:2881–90.
Àvila A, Rodà F. Changes in atmospheric deposition and streamwater chemistry over25 years in undisturbed catchments in a Mediterranean mountain environment. SciTotal Environ 2012;434:18–27.
Àvila A,Molowny-Horas R, Gimeno BS, Peñuelas J. Analysis of decadal time series inwet Nconcentrations at five rural sites in NE Spain. Water Air Soil Pollut 2010;207(1–4):123–38.
Bernal S, Belillas C, Ibáñez JJ, Àvila A. Exploring the long-term response of undisturbedMediterranean catchments to changes in atmospheric inputs through time seriesanalysis. Sci Total Environ 2013;458–460:535–45.
Bessagnet B, Hodzic A, Vautard R, Beekmann M, Rouil L, Rosset R. Aerosol modelling withCHIMERE — first evaluation at continental scale. Atmos Environ 2004;38(18):2803–17.
Blanes MC, Viñegla B, Merino J, Carreira JA. Nutritional status of Abies pinsapo forestsalong a nitrogen deposition gradient: do C/N/P stoichiometric shifts modifyphotosynthetic nutrient use efficiency? Oecologia 2013;171:797–808.
Bleeker A, Hicks WK, Dentener E, Galloway J, Erisman JW. N deposition as a threat to theworld's protected areas under the convention on biological diversity. Environ Pollut2011;159(10):2280–8.
Review and revision of empirical critical loads and dose–response relationships. In:Bobbink R, Hettelingh JP, editors. Coordination centre for effectsNational Institutefor Public Health and the Environment (RIVM); 2011. [www.rivm.nl/cce. 244 pp.].
Bobbink R, Hicks K, Galloway J, Spranger T, Alkemade R, Ashmore M, et al. Global assess-ment of nitrogen deposition effects on terrestrial plant diversity: a synthesis. EcolAppl 2010;20(1):30–59.
Camarero L, Aniz M. Surface waters monitoring in the LTER-Aigüestortes node: trendsand indicators of the impacts of N and S atmospheric deposition. Ecosistemas 2010;19(2):24–41. [(in Spanish)].
Camarero L, Catalan J. Atmospheric phosphorus depositionmay cause lakes to revert fromphosphorus limitation back to nitrogen limitation. Nat Commun 2012;3:1118.
Chang JC, Hanna SR. Air quality model performance evaluation. Meteorol Atmos Phys2004;87:167–96.

460 H. García-Gómez et al. / Science of the Total Environment 485–486 (2014) 450–460
CLRTAP. Manual on methodologies and criteria for modelling and mapping of criticalloads and levels and air pollution effects, risks and trends. Dessau, Germany:Umweltbundesamt; 2004 [Available on-line at http://www.icpmapping.org].
Cuvelier C, Thunis P, Karam D, Schaap M, Hendriks C, Kranenburg R, et al. ScaleDep: perfor-mance of European chemistry-transportmodels as function of horizontal special resolu-tion. EMEP Technical report 1/2013; 2013. [63 pp.].
Dentener F, Drevet J, Lamarque JF, Bey I, Eickhout B, Fiore AM, et al. Nitrogen and sulfurdeposition on regional and global scales: a multi-model evaluation. Global BiogeochemCycles 2006;20(4):GB4003.
Dise NB, Ashmore M, Belyazid S, Bleeker A, Bobbink B, de VriesW, et al. Nitrogen as a threatto European terrestrial biodiversity. In: SuttonMA, et al, editors. The European nitrogenassessment. Sources, effects and policy perspectivesCambridge University Press; 2011.p. 463–94.
EEA. Air quality in Europe — 2011 report. European Environment Agency TechnicalReport 12/2011; 2011. [Available on-line at http://www.eea.europa.eu].
EEA. Air quality in Europe — 2013 report. European Environment Agency TechnicalReport No. 9/2013; 2013. [Available on-line at http://www.eea.europa.eu].
Emmett AB. Nitrogen saturation of terrestrial ecosystems: some recent findings and theirimplications for our conceptual framework. Water Air Soil Pollut Focus 2007;7:99–109.
Erisman JW, Mols H, Fonteijn P, Geusebroek M, Draaijers G, Bleeker A, et al. Field inter-comparison of precipitation measurements performed within the framework of thePan European Intensive Monitoring Program of EU/ICP forest. Environ Pollut 2003;125:139–55.
Escarré A, Rodà F, Terradas J, Mayor X. Nutrient distribution and cycling. In: Rodà F,Retana J, Gracia CA, Bellot J, editors. Ecology of Mediterranean evergreen oak forests.Ecological studiesBerlin: Springer; 1999. p. 253–69.
Fagerli H, Gauss M, Benedictow A, Griesfeller J, Jonson JE, Nyiri A, et al. Transboundaryacidification, eutrophication and ground level ozone in Europe in 2009. EMEP StatusReport 1/2011. Oslo: Norwegian Meteorological Institute; 2011. [127 pp.].
FennME, Allen EB, Weiss SB, Jovan S, Geiser LH, Tonnesen GS, et al. Nitrogen critical loadsand management alternatives for N-impacted ecosystems in California. J EnvironManage 2010;91:2404–23.
Galloway JN, Townsend AR, Erisman JW, Bekunda M, Cai ZC, Freney JR, et al. Transforma-tion of the nitrogen cycle: recent trends, questions, and potential solutions. Science2008;320(5878):889–92.
Henry J, Aherne J. Nitrogen deposition and exceedance of critical loads for nutrient nitro-gen in Irish grasslands. Sci Total Environ 2014;470–471:216–23.
Hirst D, Storvik G. Estimating critical load exceedance by combining the EMEPmodelwithdata from measurement stations. Sci Total Environ 2003;310:163–70.
Izquierdo R, Àvila A. Comparison of collection methods to determine atmospheric depo-sition in a rural Mediterranean site (NE Spain). J Atmos Chem 2012;69(4):351–68.
Lorenz M, Becher GForest condition in Europe, 2012. Technical report of ICP forests. Workreport of the Thünen Institute forWorld Forestry 2012/1Hamburg: ICP Forests; 2012.[165 pp.].
MAGRAMA. Inventario de Emisiones a la Atmósfera de España. Edición 2013 (serie 1990–2011). Sumario de resultados de acidificadores, eutrofizadores y precursores delozono; 2013. [Available on-line at www.magrama.gob.es (in Spanish)].
Mareckova K, Wankmüller R, Tista M, Murrells T, Walker H. Inventory review 2011(review of emission data reported under the LRTAP Convention and NEC Directive,stages 1 and 2 review, shipping emissions, status of gridded data and LPS data).EEA & CEIP technical report 2011; 2011. [70 pp.].
Menut L, Bessagnet B, Khvorostyanov D, Beekmann M, Blond N, Colette A, et al. CHIMERE2013: a model for regional atmospheric composition modeling. Geosci Model Dev2013;6(4):981–1028.
Myers N, Mittermeier RA, Mittermeier CG, da Fonseca GA, Kent J. Biodiversity hotspots forconservation priorities. Nature 2000;403(6772):853–8.
Nyíri Á, Gauss M. Improved resolution in the EMEP model. Transboundary acidification,eutrophication and ground level ozone in Europe in 2008. EMEP Status Report2010Oslo, Norway: The Norwegian Meteorological Institute; 2010. p. 99–104.
Nyíri Á, Gauss M, Klein H. Transboundary air pollution by main pollutants (S, N, O3) andPM in 2010. Spain. MSC-W Data Note 1/20101890-0003; 2010. [24 pp.].
Ochoa-Hueso R, Allen EB, Branquinho C, Cruz C, Dias T, Fenn ME, et al. Nitrogen deposi-tion effects on Mediterranean-type ecosystems: an ecological assessment. EnvironPollut 2011;159(10):2265–79.
Peñuelas J, Filella I. Herbaria century record of increasing eutrophication in Spanishterrestrial ecosystems. Glob Chang Biol 2001;7:427–33.
Pinho P, Theobald MR, Dias T, Tang YS, Cruz C, Martins-Loução MA, et al. Critical loads ofnitrogen deposition and critical levels of atmospheric ammonia for semi-naturalMediterranean evergreen woodlands. Biogeosciences 2012;9:1205–15.
Rockström J, Steffen W, Noone K, Persson Å, Chapin FS, Lambin EF, et al. A safe operatingspace for humanity. Nature 2009;461(7263):472–5.
Rodà F, Àvila A, Rodrigo A. Nitrogen deposition in Mediterranean forests. Environ Pollut2002;118:205–13.
Sanz MJ, Carratalá A, Gimeno C, Millán MM. Atmospheric nitrogen deposition on the eastcoast of Spain: relevance of dry deposition in semi-arid Mediterranean regions.Environ Pollut 2002;118:259–72.
Simpson D, Fagerli H, Hellsten S, Knulst JC, Westling O. Comparison of modelled andmonitored deposition fluxes of sulphur and nitrogen to ICP-forest sites in Europe.Biogeosciences 2006a;3:337–55.
Simpson D, Butterbach-Bahl K, Fagerl H, Kesik M, Skiba U, Tang S. Deposition and emis-sions of reactive nitrogen over European forests: a modelling study. Atmos Environ2006b;40(29):5712–26.
Simpson D, Benedictow A, Berge H, Bergstrom R, Emberson LD, Fagerli H, et al. The EMEPMSC-W chemical transport model — technical description. Atmos Chem Phys 2012;12(16):7825–65.
SuttonMA, Billen G, Bleeker A, Erisman JW, Grennfelt P, van Grinsven H, et al. The Europeannitrogen assessment. Technical summary. In: SuttonMA, et al, editors. The European ni-trogen assessment. Sources, effects and policy perspectivesCambridge University Press;2011. [pp. xxxv-li].
Vivanco MG, Correa M, Azula O, Palomino I, Martín F. Influence of model resolution onozone predictions over Madrid area (Spain). The 2008 International Conference onComputational Science and Applications (ICCSA 2008). Perugia (Italy) lecture notesin computing science LNCS 5072Germany: Editorial: Springer; 2008. p. 165–78.[ISBN-10: 3-540-69838-8].
Vivanco MG, Palomino I, Vautard R, Bessagnet B, Martín F, Menut L, et al. Multi-yearassessment of photochemical air quality simulation over Spain. Environ ModelSoftware 2009;24:63–73.
Whitfield C, Strachan I, Aherne J, Dirnböck T, Dise N, Franzaring J, et al. Assessing nitrogendeposition impacts on conservation status. Working group report. In: HicksWK, et al,editors. Nitrogen deposition and Natura 2000: science and practice in determiningenvironmental impacts. COST729/Nine/ESF/CCW/JNCC/SEI workshop proceedingsCOST;2011. p. 88–100.
Yu S, Eder B, Dennis R, Schwartz SH. New unbiased symmetric metrics for evaluation ofair quality models. Atmos Sci Lett 2006;7:26–34.