NICOLÁS IGNACIO ARAYA RIVERA INFLUENCE OF HEAT ...
90
NICOLÁS IGNACIO ARAYA RIVERA INFLUENCE OF HEAT TREATMENTS ON THE MICROSTRUCTURAL EVOLUTION AND MECHANICAL PROPERTIES OF SELF-LUBRICATING SINTERED STEEL Dissertação de Mestrado apresentada ao Programa de Pós-Graduação em Ciência e Engenharia de Materiais, como requisito parcial para a obtenção do grau de Mestre em Ciência e Engenharia de Materiais. Orientador: Aloisio Nelmo Klein Co orientador: Claudio Aguilar FLORIANÓPOLIS 2016
-
Upload
khangminh22 -
Category
Documents
-
view
0 -
download
0
Transcript of NICOLÁS IGNACIO ARAYA RIVERA INFLUENCE OF HEAT ...

NICOLÁS IGNACIO ARAYA RIVERA
INFLUENCE OF HEAT TREATMENTS ON THE
MICROSTRUCTURAL EVOLUTION AND MECHANICAL
PROPERTIES OF SELF-LUBRICATING SINTERED STEEL
Dissertação de Mestrado apresentada ao
Programa de Pós-Graduação em Ciência
e Engenharia de Materiais, como
requisito parcial para a obtenção do grau
de Mestre em Ciência e Engenharia de
Materiais.
Orientador: Aloisio Nelmo Klein
Co orientador: Claudio Aguilar
FLORIANÓPOLIS
2016

II

III
NICOLÁS ARAYA RIVERA
INFLUENCE OF HEAT TREATMENTS ON THE
MICROSTRUCTURAL EVOLUTION AND MECHANICAL
PROPERTIES OF SELF-LUBRICATING SINTERED STEEL
Esta Dissertação foi julgada adequada para obtenção do Título de
“Mestre em Ciência e Engenharia de Materiais” e aprovada em sua
forma final pelo Programa de Pós-Graduação em Ciência e Engenharia
de Materiais.
Florianópolis, 26 de Fevereiro de 2016.
____________________________________
Prof. Dr. Antônio Pedro Novaes de Oliveira
Coordenador do Curso
____________________________
Prof. Dr. Ing. Aloísio Nelmo Klein
Orientador
________________________
Prof. Dr. Ing. Claudio Aguilar
Ramirez
Coorientador
Banca Examinadora:
________________________
Prof. Dr. Ing. Cesar Edil da Costa
UDESC/Joinville
________________________
Prof. Dr. Eng. Jose Daniel Biasoli
de Mello
Universidade Federal de
Uberlândia
________________________
Dr. Eng. Tatiana Bendo
Universidade Federal de Santa Catarina

IV
To my daugther who will have an
entire world to explore and learn
as long she never stop pursuing her
dreams.

V
AGRADECIMENTOS
Ao Professor Dr. Claudio Aguilar por me motivar para fazer a minha
pós-graduação numa instituição de excelência e também pela paciência
ao longo do processo.
Ao Professor Dr. Aloisio Nelmo Klein pela maravilhosa acolhida e
apoio desde a minha primeira visita no LabMat no ano 2012.
Ao Dr. Cristiano Binder pela orientação na parte teórica e prática e pela
excelente disposição na hora de resolver qualquer dúvida ou problema.
A minha namorada Paula Aranda pela paciência e apoio durante esta
fase
Ao Rogério Antônio Campos pela eficiência com a qual desempenha
seu trabalho frente a secretaria do PGMAT/UFSC. Pela simpatia e
disposição em sempre auxiliar os alunos.
Aos companheiros do LabMat pelo bom convívio, motivação e ajuda
dispensada durante este período. Especialmente aos meus colegas de
sala Caroline, Luiz, Gilberto, Nilda, Maisa e Cleber pela acolhida, os
risos e pelo auxílio na hora de me adaptar na vida Brasileira.
Ao BNDES e ao CNPQ e CAPES pelo financiamento da pesquisa.
E a todos aqueles que contribuíram, de maneira direta ou indireta, para o
êxito na conclusão do mestrado.

VI

VII
"Where there is a tree to be planted, you
plant it. Where there is an error to be
corrected, correct it. There is always an
effort that everybody dodges, you do it.
You be the one that moves the rock away
of the road”
Gabriela Mistral
“I’m of those who think that
science has a great beauty. A scientist in
his laboratory is not a mere technician: he
is also a child confronting natural
phenomena that impress him as though
they were fairy tales”
Marie Curie

VIII

IX
RESUMO
A pesquisa e desenvolvimento de materiais autolubrificantes
estão diretamente associados com o desejo de diminuir o consumo de
energia em aplicações onde lubrificantes fluidos são indesejados.
Pesquisar e caracterizar as suas propriedades se torna crítico quando as
aplicações requerem uma resistência mecânica maior da que os
materiais atualmente disponíveis. O escopo do presente trabalho é
caracterizar as propriedades mecânicas e o comportamento da
microestrutura de aços sinterizados autolubrificantes com adições de
SiC o que atua como precursor na formação de nódulos de grafita dentro
do material. Este processo foi previamente desenvolvido pelo equipe de
pesquisa do LabMat/UFSC.
A liga utilizada como matriz foi Fe + 0.45C + 4Ni + 1Mo % em
massa com adições de 2 e 3% de SiC. A rota de processamento foi:
Moldagem de Pós por Injeção, seguido de remoção química de ligantes
e remoção de ligantes e sinterização assistida por plasma (PADS pelas
suas siglas em inglês) seguido de martempera a 180 °C, duas condições
de revenido (530 e 300 °C) e austempera a 300 °C para gerar 4
condições para cada liga estudada.
A temperabilidade e os parâmetros para os tratamentos térmicos
foram determinados utilizando dilatometria diferencial e simulações por
software. A dureza, as tensões de escoamento e máxima assim como a
capacidade de endurecimento por deformação foram estudadas
utilizando medições de dureza e ensaios de tensão uniaxial. A
microestrutura foi analisada por microscopia ótica, microscopia
eletrônica de varredura, espectroscopia de energia dispersiva e medições
de micro dureza. Os resultados do presente trabalho mostram que a
dissolução parcial do Ni na liga matriz afeta a microestrutura e o
comportamento ao longo do tratamento térmico junto com o Mo, por
outra parte o Si dissolvido na matriz produto da dissociação do SiC afeta
notoriamente a morfologia da microestrutura e o comportamento
dilatométrico do material sob condições de aquecimento e resfriamento.
Palavras-chave: tratamentos térmicos, sinterização, materiais
autolubrificantes.

X

XI
ABSTRACT
Self-lubricating materials research and development are directly
linked with the pursuing of energy savings in applications were fluid
lubricants are undesired. Researching and characterizing its properties
becomes critical when the applications require higher mechanical
resistance than of the materials currently available. The scope of this
work is to characterize the mechanical and microstructural behavior of
sintered self-lubricating steels with SiC additions acting as a precursor
phase for graphite nodules, this process route was previously developed
by the research team of LabMat/UFSC.
The alloy used as matrix was Fe + 0.45C + 4Ni + 1Mo wt% with
additions of 2 and 3 wt% SiC. The process route was: Metal Injection
Molding, then chemical debinding and Plasma Assisted Debinding and
Sintering (PADS) followed by 3 different heat treatments: martempering
at 180 °C and tempering at 530 °C and 300 °C respectively and
austempering at 300 °C to generate 4 different conditions for each
studied alloy
Hardenability and heat treatments parameters were determined
using dilatometric tests and software simulations. Hardness, yield and
tensile strength and strain hardening behavior were studied using
hardness measures and uniaxial mechanical testing. The microstructure
was analyzed by optical microscopy, scanning electron microscopy,
energy dispersive spectroscopy and microhardness indentations. The
findings of this work shows that partial dissolution of Ni in the matrix
affects both microstructure and behavior during heat treatments as well
as Mo, on the other hand dissolved Si in the matrix due SiC dissolution
notably affects the morphology of the microstructure and the material
dilatometric behavior under heating and cooling conditions
Key-words: heat treatment, sintering, self- lubricating materials.

XII

XIII
LIST OF FIGURES
FIG. 1 - POWDER INJECTION MOLDING PROCESS ROUTE ........................ 30
FIG. 2 - CROSS-SECTIONAL SKETCH OF THE OPERATING REGION OF AN
INJECTION MACHINE ...................................................................... 31
FIG. 3 - SKETCH OF THE OPERATION OF THE INJECTION MACHINE
THROUGH ONE CYCLE .................................................................... 32
FIG. 4 - IDEAL DISTRIBUTION OF LUBRICATING PARTICLES IN A SINTERED
MATERIAL ...................................................................................... 34
FIG. 5 - DIFFERENCE BETWEEN CRYSTALLINE (A) AND TURBOSTRATIC (B)
GRAPHITE STACKING ...................................................................... 35
FIG. 6 - UPPER VIEW OF GRAPHITE LAYERS FOR CRYSTALLINE STACKING
(A) AND TURBOSTRATIC STACKING (B) .......................................... 36
FIG. 7 - RELATIONSHIP BETWEEN SCUFFING RESISTANCE AND FRICTION
COEFFICIENT WITH SIC CONTENT IN A FE + 0.6C SELF-LUBRICATING
PIM SINTERED STEEL ..................................................................... 37
FIG. 8 - RELATIONSHIP BETWEEN MECHANICAL PROPERTIES AND SIC
CONTENT OF A FE + 0.6C SELF-LUBRICATING PIM SINTERED STEEL
....................................................................................................... 37
FIG. 9 - MICROSTRUCTURE OF FE + 0.6C + 0-5SIC ALLOYS SINTERED 1
HOUR AT 1150°C ........................................................................... 38
FIG. 10 - EFFECT OF NI AND MO ADDITIONS TO A FE + 0.6C + 3SIC SELF-
LUBRICATING PIM SINTERED STEEL .............................................. 39
FIG. 11 - METASTABLE EQUILIBRIUM DIAGRAM OF THE FE-C SYSTEM .. 41
FIG. 12 - ALLOY ELEMENTS INFLUENCE IN EUTECTOID TEMPERATURE
AND COMPOSITION ......................................................................... 42
FIG. 13 - COMPARISON BETWEEN IT DIAGRAMS FOR AISI 4140 STEEL AL
AFTER 6 S AUSTENIZING TIME AT 950 °C (CONTINUOUS LINE) AND
10 MIN AT 860 °C (DASHED LINE) ................................................. 44
FIG. 14 - ISOTHERMAL TRANSFORMATION (UPPER) AND CCT (LOWER)
DIAGRAMS FOR AISI 4140 STEEL CONTAINING. THE CT DIAGRAMS
ARE COMPUTED (DASHED LINES) AND EXPERIMENTALLY
DETERMINED (CONTINUOUS LINE) ................................................. 45
FIG. 15 - DIFFERENCES BETWEEN CONVENTIONAL QUENCHING +
TEMPERING (A), MARTEMPERING + TEMPERING (B) AND MODIFIED
MARTEMPERING + TEMPERING (C) ................................................. 46
FIG. 16 - EFFECT OF TEMPERING TEMPERATURE ON THE MECHANICAL
PROPERTIES OF AN AISI 4340 OIL-QUENCHED STEEL BAR. ............ 48
FIG. 17 - COMPARISON OF TIME-TEMPERATURE TRANSFORMATION
CYCLES FOR CONVENTIONAL QUENCHING + TEMPERING AND
AUSTEMPERING .............................................................................. 50

XIV
FIG. 18 - SCHEMATIC REPRESENTATION OF UPPER BAINITE AND LOWER
BAINITE TRANSITIONS .................................................................... 51
FIG. 19 - VICKERS HARDNESS VALUE FOR PEARLITE AND BAINITE
PRODUCED IN A 0.69C PLAIN CARBON STEEL. ............................... 52
FIG. 20 – EXPERIMENTAL PROCEDURE FLOW DIAGRAM. ....................... 53
FIG. 21 - TEST SPECIMENS: (A) TENSILE TESTS (B) OTHER TESTS .......... 55
FIG. 22 - HEATING DILATOMETRIC TEST FOR FE+ 0.6C +4NI + + 1MO
WITH VARIABLE SIC% ................................................................... 61
FIG. 23 - COOLING DILATOMETRIC TEST FOR FE+ 0.6C +4NI + + 1MO
WITH VARIABLE SIC% ................................................................... 63
FIG. 24 - SIMULATED CCT DIAGRAM FOR BASE ALLOY ........................ 64
FIG. 25 - TENSILE TEST AND HARDNESS RESULTS FOR FE + 0.6C + 4NI +
1MO SINTERED STEEL IN THE AS SINTERED AND HEAT TREATED
CONDITIONS ................................................................................... 65
FIG. 26 – TENSILE TEST AND HARDNESS RESULTS FOR BASE ALLOY + 2
WT% SIC SINTERED STEEL IN THE AS SINTERED AND HEAT
TREATED CONDITIONS ................................................................... 66
FIG. 27 - TENSILE TEST AND HARDNESS RESULTS FOR BASE ALLOY + 3
WT% SIC SINTERED STEEL IN THE AS SINTERED AND HEAT
TREATED CONDITIONS ................................................................... 66
FIG. 28 - TENSILE TEST AND HARDNESS RESULTS FOR EACH CONDITION
AND ALLOY .................................................................................... 67
FIG. 29 - INSTANTANEOUS STRAIN HARDENING EXPONENTS (N) V/S TRUE
STRAIN FOR: (A) BASE ALLOY, (B) BASE ALLOY + 2% SIC AND (C)
BASE ALLOY + 3%SIC ................................................................... 70
FIG. 30 - (PORES + NODULES) VOLUMETRIC % OF FE + 0.6C ALLOYS
WITH INCREASING SIC CONTENTS SINTERED AT DIFFERENT
TEMPERATURES FOR 60 MIN .......................................................... 72
FIG. 31 - OPTICAL MICROSCOPY AT 200X OF FE + 0.6C + 4NI + 1MO
UNDER AS SINTERED AND HEAT TREATED CONDITIONS. THE AS
SINTERED SAMPLES WERE ETCHED WITH PICRAL 4 WT% AND THE
HEAT TREATED SAMPLES WERE ETCHED WITH NITAL 2 WT% ....... 73
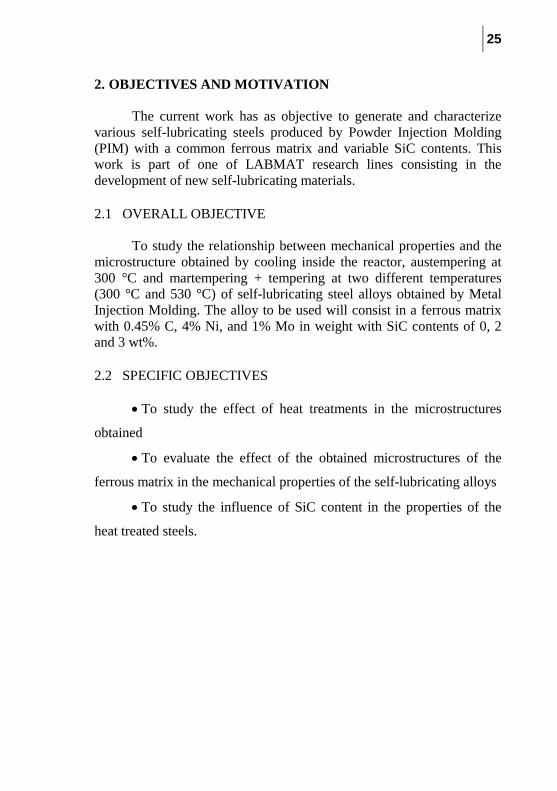
FIG. 32 - OPTICAL MICROSCOPY AT 1000X OF FE + 0.6C + 4NI + 1MO
UNDER AS SINTERED AND HEAT TREATED CONDITIONS ................ 74
FIG. 33 - OPTICAL MICROSCOPY AT 1000X OF FE + 0.6C + 4NI + 1MO
UNDER AS SINTERED AND HEAT TREATED CONDITIONS ................ 74
FIG. 34 - OPTICAL MICROSCOPY AT 200X OF FE + 0.6C + 4NI + 1MO +
2SIC UNDER AS SINTERED AND HEAT TREATED CONDITIONS. THE
AS SINTERED SAMPLES WERE ETCHED WITH PICRAL 4 WT% AND
THE HEAT TREATED SAMPLES WERE ETCHED WITH NITAL 2 WT% 76
FIG. 35 - OPTICAL MICROSCOPY AT 1000X OF FE + 0.6C + 4NI + 1MO +

XV
2SIC AND FE + 0.6C + 4NI + 1MO + 3SIC UNDER AS SINTERED AND
HEAT TREATED CONDITIONS. THE AS SINTERED SAMPLES WERE
ETCHED WITH PICRAL 4 WT% AND THE HEAT TREATED SAMPLES
WERE ETCHED WITH NITAL 2 WT% ................................................ 77
FIG. 36 - SEM IMAGES OF FE + 0.6C + 4NI + 1MO + 3SIC IN THE AS
SINTERED AND THE MARTEMPERED AND TEMPERED CONDITION .. 79
FIG. 37 - SEM IMAGES OF FE + 0.6C + 4NI + 1MO AND FE + 0.6C + 4NI +
1MO + 3SIC + 3SIC IN THE AUSTEMPERED CONDITION ............... 79
FIG. 38 - ELEMENTS X-RAY INTENSITY PEAKS ALONG A GRAPHITE
NODULE OF A FE + 0.6C + 4NI + 1MO + 3SIC AS SINTERED SAMPLE
....................................................................................................... 80
FIG. 39 - MICROHARDNESS PROFILE OF FE + 0.6C + 4NI + 1MO AND FE +
0.6C + 4NI + 1MO + 3SIC MARTEMPERED AND TEMPERED 2H AT
530°C ............................................................................................ 81
FIG. 40 - SEM IMAGE AND EDS SCAN ON A VICKERS MICROINDENTATION
DONE OVER A GRAPHITE NODULE , MEASURED HARDNESS WAS OF
HV0.01 133 ...................................................................................... 81

XVI

XVII
LIST OF TABLES
TABLE 1 - APPLICATIONS WHERE FLUID LUBRICANTS ARE UNDESIRABLE
OR UNSUITED. ................................................................................ 28
TABLE 2 - RAW POWDER MATERIALS USED ........................................... 54
TABLE 3 - BINDER COMPOSITION ........................................................... 54
TABLE 4 - POWDER INJECTION MOLDING PROCESSING PARAMETERS ... 55
TABLE 5 - PROCESSING PARAMETERS FOR THE PLASMA ASSISTED
DEBINDING AND SINTERING STEP .................................................. 56
TABLE 6 - AUSTENITE TRANSFORMATION TEMPERATURES FOR FE + 0.6C
+ 4NI + 1MO SINTERED STEEL WITH VARIABLE AMOUNT OF SIC .. 62
TABLE 7 - AUSTENITE DISSOCIATION TEMPERATURES FOR FE + 0.6C +
4NI + 1MO SINTERED STEEL WITH VARIABLE AMOUNT OF SIC ..... 63

XVIII

XIX
LIST OF ABREVIATURES AND ACRONYMS
ABNT – Associação Brasileira de Normas Técnicas
IBGE – Instituto Brasileiro de Geografia e Estatístic
A1 – Lower austenitic transformation temperature
A3 – Upper austenitic transformation temperature
BS – Bainitic transformation start
BF – Bainitic transformation finish
CCT – Continuous Cooling Transformation
EDS – Energy Dispersive Spectroscopy
LABMAT – Laboratorio de Materiais
MS – Martensitic transformation start temperature
PIM – Powder Injection Molding
PS – Pearlitic transformation start
PF – Pearlitic transformation finish
SEM – Scanning Electron Microscope
SiC – Silicon Carbide
UFSC – Universidade Federal de Santa Catarina
UTS – Ultimate Tensile Strenght
YS – Yield Strenght

XX

XXI
INDEX
1. INTRODUCTION ............................................................................. 23 2. OBJECTIVES AND MOTIVATION ............................................... 25
2.1 OVERALL OBJECTIVE ........................................................... 25 2.2 SPECIFIC OBJECTIVES .......................................................... 25
3. LITERATURE REVIEW .................................................................. 27 3.1 SOLID LUBRICATION ............................................................ 27 3.2 METAL INJECTION MOLDING ............................................. 29 3.3 SELF-LUBRICATING STEELS ............................................... 33 3.4 HEAT TREATMENT OF STEELS ........................................... 40
3.4.1 Isothermal Transformation Diagrams ............................... 43 3.4.2 Continuous Cooling Diagrams ......................................... 44 3.4.3 Tempering of Steels .......................................................... 46
4. MATERIALS AND METHODS ...................................................... 53 4.1 RAW MATERIALS ................................................................... 53 4.2 POWDER MIXTURE PREPARATION ................................... 54 4.3 POWDER INJECTION MOLDING .......................................... 54 4.4 DEBINDING AND SINTERING. ............................................. 55 4.5 HEAT TREATING .................................................................... 57 4.6 CHARACTERIZATION ........................................................... 57
4.6.1. Differential Dilatometry ................................................... 57 4.6.2. Metalographic Preparation ................................................ 57 4.6.3. Optical Microscopy .......................................................... 58 4.6.4. Scanning Electron Microscopy ......................................... 58 4.6.5. Hardness. .......................................................................... 58 4.6.6. Micro-Hardness ................................................................ 59 4.6.7. Tensile Tests ..................................................................... 59

XXII
5. RESULTS AND DISCUSSION………………………………….....61
5.1 HEAT TREATMENTS.............................................................. 61 5.1.1 Dilatometry and CCT diagrams........................................ 61
5.2 MECHANICAL PROPERTIES ................................................ 64 5.2.1 Tensile And Hardness Values .......................................... 65 5.2.2 Strain Hardening............................................................... 69
5.3 MICROSTRUCTURAL CHARACTERIZATION ................... 72 6. CONCLUSIONS ............................................................................... 83 7. SUGGESTIONS FOR FUTURE RESEARCH ................................ 85 REFERENCES ..................................................................................... 87

23
1. INTRODUCTION
The growing development of society and technology is closely
related to the research of new and better materials. In this context the
energetic efficiency and the mechanical behavior of machines and its
components have been one of the most relevant focuses of research to
the industry in the last years, hence, new materials capable of decreasing
energy loses by friction and at the same time, suitable for severe
mechanical and tribological conditions have been developed
In conditions where the friction coefficient can’t be decreased by
using liquid lubricants (for example, high vacuum or high temperature
conditions), solid lubrication appears as an alternative to conventional
lubrication by creating a solid layer that prevents the direct contact
between surfaces in relative movement. Usually solid lubricants shows a
low shear strength and low molecular compression which allows the
formation and maintenance of the required lubricating layer
(STACHOWIAK; BATCHELOR, 2006)
One of the research lines of the ‘Laboratorio de Materiais’ of the
Universidade Federal de Santa Catarina (LABMAT/UFSC) is the
developing and characterization of dry self-lubricating steels produced
by powder metallurgy. These steels have the property that the
microstructural component which provides the solid lubrication is
produced “in situ” during the sintering step. The in situ generation of the
lubricating phase prevents the formation of a lubricant layer between the
powder particles when de lubricating phase is added into the mixture of
powders, previous to the sintering step. This lubricating layer hinders
the sintering process and makes impossible to attain the desired
mechanical properties. The precursor for the in situ formation of the
lubricating phase in the steels developed by the LABMAT is silicon
carbide (SiC) which, during sintering, dissociates as Cgraphite + Si in solid
solution (DE MELLO et al., 2013)
Currently the mechanical and tribological behavior of low alloy
steels with SiC contents of 1,2,3,4 and 5% (BINDER, 2009) and the morphology and growth kinetics of graphite nodules (REBELO, 2014)
have been studied. These previous research shows that the addition of
Ni in the ferrous matrix produces a lower friction coefficient in these
steels being this effect reinforced by the addition of Mo by hardening
the matrix and affecting the shape of the graphite nodules, both

24
elements, besides producing a decrease in the friction coefficient,
considerably increases the hardenability of these new alloys. Besides the
previous studies, there are many challenges and opportunities in this
field, such as improving mechanical and tribological properties through
a better understanding of how both the lubricating phase and the matrix
phases forms and interacts when sliding onto another surface. As heat
treatment can severely affect the properties of ferrous alloys, the
objective of this work is to characterize the influence of heat treatment
in the microstructure and mechanical properties of SiC based self-
lubricating sintered steels.
25
2. OBJECTIVES AND MOTIVATION
The current work has as objective to generate and characterize
various self-lubricating steels produced by Powder Injection Molding
(PIM) with a common ferrous matrix and variable SiC contents. This
work is part of one of LABMAT research lines consisting in the
development of new self-lubricating materials.
2.1 OVERALL OBJECTIVE
To study the relationship between mechanical properties and the
microstructure obtained by cooling inside the reactor, austempering at
300 °C and martempering + tempering at two different temperatures
(300 °C and 530 °C) of self-lubricating steel alloys obtained by Metal
Injection Molding. The alloy to be used will consist in a ferrous matrix
with 0.45% C, 4% Ni, and 1% Mo in weight with SiC contents of 0, 2
and 3 wt%.
2.2 SPECIFIC OBJECTIVES
To study the effect of heat treatments in the microstructures
obtained
To evaluate the effect of the obtained microstructures of the
ferrous matrix in the mechanical properties of the self-lubricating alloys
To study the influence of SiC content in the properties of the
heat treated steels.

26

27
3. LITERATURE REVIEW
3.1 SOLID LUBRICATION
Friction and wear are caused by contact and relative movement
between two surfaces. A method to reduce both is to place a lubricating
layer that can be a solid, oil, grease or gas. Machinery elements such as
bearings, rails, cylinders, flexible couplings, chains and others possess
surfaces that move relatively to each other by sliding, rolling,
approaching and moving away of each other or combinations of these
movements, therefore, these components are lubricated to prevent or
decrease the contact between the surfaces. Mobile parts are lubricated
by placing and maintaining films that minimize the contact between the
surfaces and that are easily sheared and as a consequence: the friction
force that goes against the movement of such surfaces is lowered. If
direct contact between the surfaces occurs the friction forces involved
are drastically risen which results in high temperatures and wear
(MIYOSHI, 2001)
Without lubrication most of the machinery would have its
lifespan greatly reduced. With inadequate lubrication the excessive wear
would be the most severe consequence, because the point in which the
machinery components can no longer be used will be quickly achieved
and therefore the components will have to be retired from service and
repaired accordingly. Reparations costs might be high, but productivity
losses can surely be the most expensive consequences. With insufficient
lubrication even if the components haven’t failed the friction forces
between the surfaces are so elevated that the engines might be
overloaded thus generating excessive energy losses (MIYOSHI, 2001)
A solid lubricant is any material applied as a fine layer or powder
into a surface to reduce friction and wear. Solid lubrication is obtained
by using self-lubricating materials or a third solid body of low friction
coefficient between the moving surfaces (CLAUSS, 1972). Oils and
greases have a wide application range where they can be used
successfully, however, they may present difficulties in their application such as sealing issues, excessive load or under extreme environmental
conditions. Solid lubricants will be rather preferred over liquid or
gaseous lubricants for several reasons: in high vacuum applications,
spatial equipment or in the food industry the liquid lubricants could be

28
evaporated, polluting products such as food, optical and electronical
equipment. At high temperatures the liquid lubricants are decomposed
and oxidized and at cryogenic temperatures the liquid lubricants are
highly viscous becoming unsuitable for lubrication (MIYOSHI, 2001).
Table 1 shows some applications where fluid lubrication is
undesirable.
Table 1 - Applications where fluid lubricants are undesirable or
unsuited.
Requirement Application
To avoid contamination of the
product or the environment
Food processing
Space telescopes
Microscopes and cameras
Paper processing
Medical equipment
To provide and maintain
lubrication in hard to reach
areas
Planes
Space vehicles
Satellites
Nuclear reactors
Abrasion resistance in dirty
environments
Space rovers
Cars
Mining equipment
Off-road vehicles
Construction equipment
To provide stationary service
Planes
Train engines
Missile components
Telescope frames
Furnaces
Source: Adapted by the author from MIYOSHI (2001)

29
Currently several different methods have been developed for the
application of solid lubrication, for example, it can be provided by
deposited DLC layers (ÖZMEN; TANAKA; SUMIYA, 2000; ZHANG;
SHEN; SUN, 2010), BCN (DENG et al., 2014), polymer based
composite layers (ZOUARI et al., 2014), etc. Solid lubrication can be
also provided by incorporating solid lubricant in the bulk material by
powder pressing (KATO et al., 2003; KOVÁČIK et al., 2008) or metal
injection molding (MIM) (FURLAN et al., 2012). The solid lubricant
can be also be generated in-situ using MIM which, besides incorporating
the desired precursor in the bulk material, allows the microstructural
design appropriated for in situ generation of the lubricating phase
(SCHROEDER et al., 2010).
3.2 METAL INJECTION MOLDING
Powder metallurgy technologies have had a great development in
the recent decades resulting into a very interesting technique for
engineers, not only for its reproducing capabilities, but also because it
allows to its users to plan the microstructure of the molded pieces by
selectively adding phases or pores, adapting the product for its
application. Powder metallurgy techniques enables the production of
solid bodies, similarly to casting processes, but while casting processes
only are technically/economically feasible for low to mid melting point
metals, powder metallurgy can be applied to almost all of them (ASM
INTERNATIONAL HANDBOOK COMMITEE, 1998). Thereby most
of the available products made by powder metallurgy aren´t available as
cast materials for example: composites, high temperature ceramics,
some polymers, refractory metals and a wide variety of intermetallic
compounds, cermets and mixed materials. For industrial production
costs are always a critical factor, so the possibility of producing
complex shapes in its final form has an important economic benefit, in
powder technologies this relies on the capability to replicate the mold
over and over again (GERMAN, 2005).
Products produced by injection molding have a wide range of
uses, mainly for its low costs and high complexity of shapes
(GERMAN, 2005). Metal injection molding use that principles by using
a feed with a high content of thermoplastic particles. The steps of this
process are shown in Fig. 1.

30
Fig. 1 - Powder Injection Molding process route
Source: ASM INTERNATIONAL HANDBOOK COMMITTEE (1998)
The process begins with the mixture of the selected powders and
binders. Particles of powders used in this process often have average
sizes below 20 m with near spherical shapes. Binders are thermoplastic

31
mixes of waxes, polymers, oils, lubricants and surfactants. The binder
imparts viscous flow properties to the mixture allowing it to fill mold
with complexes geometries. When the binder freezes in the die, the
piece is ejected. Finally the binder is removed and the powder structure
is sintered. The product may then be further densified, heat threated or
machined.
The equipment used for shaping is similar to what is used in
plastic injection. Fig. 2 shows a cross-section of a MIM unit. Most
molding machines fill a die through a gate from a pressurized and
heated barrel. A plunger or a reciprocating screw generates the pressure
needed to fill the die. Fig. 3 provides a conceptual outline of the
molding sequence (GERMAN, 2005).
Fig. 2 - Cross-sectional sketch of the operating region of an injection
machine
Source: RANDALL GERMAN (2005)

32
Fig. 3 - Sketch of the operation of the injection machine through one
cycle
Source: RANDALL GERMAN (2005)
The metal injection molding process is practiced with many
variations, yet the basic principles are similar: small polymeric particles
are used to aid in the densification during sintering, this particles are
referred as the binding system. The binding system is formulated to attain a high packing density with a low viscosity, is also required for it
to have enough lubricant to fill the inter-particular gaps and to lubricate
the sliding between particles in the molding process (GERMAN, 2005).
The binder is mainly composed by two or three components, for
example, 65% paraffin wax, 30% polypropylene and 5% stearic acid for

33
a 6% in mass for steel injection. In this work the binder is composed by
a mixture of thermoplastic resin, plasticizer, lubricant, surfactant and
anti-oxidant being an 8% of the feed total mass, this is required to obtain
the required characteristic for the materials studied in this work: the self-
lubricating steels.
3.3 SELF-LUBRICATING STEELS
Dry self-lubricating components have been used for decades in
domestic and desktop equipment such as printers, electric shavers and
blenders. Metallic matrixes of these components are commonly made of
cooper, iron and nickel. Compounds such as MoS2, WS2, low melting
point metals as silver, tin and lead and also graphite are the most used as
solid lubricants (CUI et al., 2013; DU et al., 2012; FURLAN et al.,
2012; KATO et al., 2003; MOUSTAFA et al., 2002). A great share of
the self-lubricating composites developed in the past have a high percent
of solid lubricant (15 to 40% v/v). This is added to obtain the required
friction coefficient, however has as a consequence a discontinuous
metallic matrix, hence, low mechanical properties (BINDER et al.,
2010).
In the case of the sintered self-lubricating steels developed by the
Laboratorio de Materiais from the Universidade Federal de Santa
Catarina (LabMat/UFSC), the lubricating particles (graphite) are
generated in-situ during the sintering process. In this case the ideal
precursor particle is those which is composed by an element that has
both a high solubility into iron and a strong ferrite stabilizing behavior
and an element that form a lubricating phase when the precursor is
decomposed yet don’t solubilizes into the iron matrix, this is why the
self-lubricating steels developed in the LabMat uses silicon carbide
(SiC) particles as precursor phase.
The dispersed solid lubricant must form a completely
discontinuous phase, for example, discrete particles uniformly
distributed in the base metal. Big lubricating particles will form a
discontinuous phase, however they will be prejudicial to the mechanical
properties, small particles may form a continuous phase which will also
be prejudicial to the mechanical properties, therefore exist an optimal
size for the dispersed lubricating particles and thereby exist a free mean
path between them which allows the metallic matrix to be completely
continuous (BINDER et al., 2010). Fig. 4 presents an example of the

34
desired situation. In theory a regular distribution of solid lubricant
particles means that each particle has to provide enough lubricant for a
well-defined surface area.
Fig. 4 - Ideal distribution of lubricating particles in a sintered material
Source: Binder (2009)
The study of the dissociation of SiC in a steel matrix was done by
both (BINDER, 2009) and (REBELO, 2014). The latter particularly
studied the SiC content influence in the structure of the graphite
generated during sintering and the influence of alloy elements,
particularly Ni in SiC dissociation kinetics and Si-C dissolution into the
ferrous matrix. The influence of the alloys elements in graphite
morphology was also studied.
A strong dependence between time-temperature, SiC dissolution
and microstructural evolution was found. For samples sintered below
1050 °C, SiC dissociation isn’t complete showing larger graphite
nodules in the gap between 1100 °C up to 1200 °C. It was also found
that for short sintering times SiC dissociation isn’t complete and for
longer sintering times (more than 120 minutes at 1100 °C) completely
homogenization occurs and the graphite nodules are completely
dissolved (BINDER, 2009).
The graphite generated by SiC dissociation is turbostratic
(BINDER, 2009; REBELO, 2014). Turbostratic graphite is a carbon
allotrope with a sp2 hybridation state which presents a parallel random
stacking with no tridimensional order. Volume properties are essentially

35
isotropic. In turbostratic graphite the net spacing (c axis) is ≥ 0.34 nm,
exceeding those of crystalline graphite which is of 0.334 nm
(DRESSELHAUS, 1997; REBELO, 2014; WELZ, 2003). The
turbostratic stacking can be found mainly in carbon materials obtained
at low temperatures, where the hexagonal layers are usually small and
few of them are parallel stacked. Turbostratic graphite is produced
mainly due to lattice defects such as stacking faults, vacancies and
dislocations (WELZ, 2003).
Figs. 5 and 6 shows the difference between crystalline graphite
and turbostratic graphite stacking.
Fig. 5 - Difference between crystalline (a) and turbostratic (b) graphite
stacking
Source: Knox et al. (1986)

36
Fig. 6 - Upper view of graphite layers for crystalline stacking (a) and
turbostratic stacking (b)
Source: Rebelo (2014)
It can be noticed that crystalline graphite shows a regular array of
graphite layers stacked in order to minimize the spacing between layers
meanwhile turbostratic graphite have a random stacking order in the c
axis.
On the other hand mechanical and tribological properties of these
steels were studied in (BINDER, 2009). The objective of the mentioned
study therefore was to produce PIM sintered steels with variable
contents of SiC, Ni and Mo. The Fe powder used was the BASF CL-OM
produced by the carbonyl process with carbon and oxygen contents of
0.8 and 0.2 wt% respectively and to study its mechanical and
tribological properties. The fig. 7 particularly shows the variation of the
scuffing resistance and friction coefficient with SiC content on a Fe +
0.6C steel matrix, the fig 8 shows the variation of mechanical properties
with SiC content on the same steel matrix, the samples where sintered at
1150 °C and then cooled inside the reactor, no further heat treatments
where performed.

37
Fig. 7 - Relationship between scuffing resistance and friction
coefficient with SiC content in a Fe + 0.6C self -lubricating PIM
sintered steel
Source: De Mello et al. (2011)
Fig. 8 - Relationship between mechanical properties and SiC content
of a Fe + 0.6C self-lubricating PIM sintered steel
Source: Binder et al. (2010)
Scuffing resistance measures the work that the lubricating layer is able to endure until it looses the ability to lubricate the sliding contact
(by breakage of other effects produced by the sliding motion itself). The
scuffing resistance presented in fig. 7 was measured by sliding an
spherical counter-body against the samples and applying incremental
normal forces in steps of 7N until the friction coefficient consistently

38
surpasses a certain criteria (0.2 for solid lubrication) according to the
process developed by De Mello in 2006. As shown by fig. 7 alloys with
1% SiC presents the lower durability of the lubricating layer and the
highest friction coefficient (taking the 0% SiC alloy as a base), this
occurs because it doesn’t have enough lubricant phase (graphite) to
maintain the lubricating layer integrity as the counter-body breaks it.
The Fig 8 shows how SiC additions to the matrix affects the mechanical
properties of the carbon steel by producing solid solution hardening (due
both silicon and carbon being dissolved into the matrix) and an increase
in the hardenability of the samples.
The figure 9 shows the microstructural aspect of the above
mentioned alloys, is noticeable that for SiC contents ≥ 3% the resulting
microstructure turns to be almost completely ferritic.
Fig. 9 - Microstructure of Fe + 0.6C + 0-5SiC alloys sintered 1 hour at
1150°C
Source: Binder (2009)

39
The figure 10 shows the effect on scuffing resistance and friction
coefficient of Ni and Mo addition on a Fe + 0.6C + 3SiC self-lubricating
steel sintered 1 hour at 1150°C.
Fig. 10 - Effect of Ni and Mo additions to a Fe + 0.6C + 3SiC self-
lubricating PIM sintered steel
Source: Binder et al. (2010)
Figure 10 shows that Ni and Mo additions have a positive effect
in the tribological properties of the self-lubricating steel studied, the
reduction of the friction coefficient and the increase on durability are
related with the improvement of the mechanical properties of the matrix
associated to solid solution hardening and microstructural changes
produced by Ni and Mo. SiC quantity influences the Si availability and
hence the stabilizing effect done by Si. As shown in fig 9, for SiC
contents of 1% and 2% a low amount of graphite nodules was found due
the low availability of SiC in the samples. From a 3% SiC the resulting
microstructure consist in ferrite rings with graphite nodules inside
(BINDER, 2009). Ni presence on the samples produces the generation
of large and compact nodules when compared to those generated in the
same conditions without Ni addition (DE MELLO et al., 2013) this is
because while Ni is a stabilizer it also greatly reduces the diffusion
coefficient of Si into the matrix, this causes Si to build up around the
graphite nodules during the dissociation of SiC, this build up causes
ferrite to precipitate around the ferrite nodules due Si ferrite stabilizing

40
effect, as carbon have a limited solubility into ferrite (< 0,02 wt%) the
graphite nodules generated this way remain rounded without loosing too
mucho carbon to the matrix.
Highly stabilized ferritic microstructures (such as ferrite
containing a high percent of silicon) have a poor or almost none
susceptibility to quenching and tempering heat treatments, however as
was found in (DE MELLO et al., 2013) Fe + 0.6C +4Ni +1Mo + 3SiC
shows a mixed microstructure of ferrite and austenite derivates such as
martensite, bainite and retained austenite. So taking into account all the
factors presented up to this point the alloys to be heat threated and
characterized will have a Fe + 0.6C + 4Ni + 1Mo matrix and 2 and 3%
SiC, using a 0% SiC alloy as comparative basis. All the test specimens
will be sintered at 1150 °C for 1hour to achieve SiC dissolution without
generating complete homogenization. The next sub-section makes a
brief introduction to steel heat treatments.
3.4 HEAT TREATMENT OF STEELS
Steels are commonly defined as ferrous alloys with carbon
content between a centesimal percent up to a 2% in mass that could have
other alloy elements such as Mn, Cr, Ni, etc. This means that steels can
exhibit a wide variety of properties depending on its chemical
composition, phases and microconstituents which in time depends on
the heat treatments applied on it (HARRY, 1995).
The objective of heat treatments is to improve mechanical
properties such as hardness or toughness. To achieve the maximum
hardness in low alloy steels the desired microstructure is martensite.
Martensite hardness depends on carbon content, however, if the
sample’s microstructure isn’t completely martensitic the final hardness
of the treated piece will be lower (ASM INTERNATIONAL
HANDBOOK COMMITEE, 1991).
Figure 11 shows a metastable equilibrium diagram for the Fe-C
system. If alloy elements are added, the position of A1, A3 and Acm lines
is changed as so is the eutectoid composition (ASM INTERNATIONAL
HANDBOOK COMMITEE, 1991).

41
Fig. 11 - Metastable equilibrium diagram of the Fe-C system
Source: ASM International (1991)
Figure 12 shows the variation of A1 line and eutectoid carbon
with the addition of some alloy elements.

42
Fig. 12 - Alloy elements influence in eutectoid temperature and
composition
Source: ASM International (1991)
From figure 12 can be noticed that:
- All the alloy elements shown decrease eutectoid’s carbon
content.
- phase stabilizers decrease A1 temperature.
- phase stabilizers increase A1 temperature.
Phase transformations kinetics aspects are as important as
equilibrium diagrams for steel heat treatments. Metastable phases

43
martensite and bainite are generally produced by rapid cooling to room
temperature (quenching) or by isothermal decomposition of austenite at
relatively low temperatures (but higher than room temperature). If these
metastable phases are reheated to moderate temperatures, they are
decomposed in more stable mixtures of ferrite and cementite. This
process is known as tempering. To predict the microstructural evolution
of steel during cooling isothermal transformation (IT) and continuous
cooling (CCT) diagrams are used
3.4.1 Isothermal Transformation Diagrams
These diagrams show what occurs when a defined steel piece is
maintained at a constant temperature by a prolonged amount of time.
Microstructural developing in time can be tracked by having samples
treated in lead or salt, quenching them in incremental times and then
measuring the phases formed with a microscope (ASM
INTERNATIONAL HANDBOOK COMMITEE, 1991). An alternative
is to use an unique sample and a dilatometer to record dimensional
changes in time produced by microstructural changes in the sample
(ASM INTERNATIONAL HANDBOOK COMMITEE, 1998). Figure
13 presents and ITT diagram example for a AISI 4140 steel under two
different austenizing conditions.

44
Fig. 13 - Comparison between IT diagrams for AISI 4140 steel al after
6 s austenizing time at 950 °C (continuous line) and 10 min at 860 °C
(dashed line)
Source: ASM International (1991)
3.4.2 Continuous Cooling Diagrams
The use of isothermal cooling is common for most of
experimental research; however this situation isn’t just as common in
practice. For that reason continuous cooling diagrams (CCT) have been
developed. These diagrams can be helpful if the cooling rate of the
sample is either known or can be calculated or simulated (ASM
INTERNATIONAL HANDBOOK COMMITEE, 1991). Figure 14
shows IT and CCT diagrams for a AISI 4130 steel.

45
Fig. 14 - Isothermal transformation (upper) and CCT (lower) diagrams
for AISI 4140 steel containing. The CT diagrams are computed
(dashed lines) and experimentally determined (continuous line)
Source: ASM International (1991)
In this work the involved alloy elements were silicon, nickel and
molybdenum. Both Mo and Si are elements that stabilize alpha phase
and therefore increase the A1 temperature, Ni however is a gamma
phase stabilizer and hence it decreases A1 temperature. In the other
hand all three of them lower the carbon content of the eutectoid point;
all this was shown back in fig 12. About the transformation diagrams all
these alloy elements increase hardenability displacing pearlite formation
curves to the right. As both methods of cooling were presented, this

46
study used isothermal cooling treatments such as martempering +
tempering and austempering.
3.4.3 Tempering of Steels
3.4.3.1 Martempering and Tempering
Martempering consist in an interrupted quench from the
austenizing temperature of certain alloy, cast, tool or stainless steels.
Cooling is delayed just above martensitic transformation in a molten salt
or oil bath for the time needed to equalize temperature throughout a
piece, for the purpose of minimizing distortion, cracking and residual
stress. Cooling to room temperature in air finalizes the process. The
resulting microstructure is primarily martensitic and is untempered and
brittle (HARRY, 1995).The fig 15 shows differences between
conventional quenching and martempering.
Fig. 15 - Differences between conventional quenching + tempering (a),
martempering + tempering (b) and modified martempering + tempering
(c)

47
Source: ASM International (1995)
In martempering residual stresses are lower than those developed
in conventional quenching because the greatest thermal variations come
while the steel is still in its relatively plastic austenitic condition and
because final transformation and thermal changes occur throughout a
part at essentially the same time (HARRY, 1995).
Other advantages of the process are:
Susceptibility to cracking is reduced or eliminated
When the austenitizing bath is a neutral salt and is
controlled by the addition of methane or by proprietary
rectifiers to maintain its neutrality parts are protected
with a residual coating of neutral salt until they are
immersed in the martempering bath
Martempering often eliminates the need for quenching
fixtures, which are required to minimize distortion in
conventional quenching
The only difference between martempering and modified
martempering is the temperature of the quenching bath as it’s below that
of the Ms point which increases the severity of the quench (see fig 15-c).
This capability is important for steels with lower hardenability that
require faster cooling to get a great depth of hardness (HARRY, 1995)
Finally tempering is performed after martempering to reduce the
fragility of the martensitic phase by isothermally transforming it into a

48
mixture of ferrite and spheroidized cementite, this can be done in a
conventional electric furnace or in a molten neutral salt bath to avoid
excessive decarburization and oxidation of the pieces. Fig 16 shows and
example of mechanical properties changes associated with tempering
temperatures.
Fig. 16 - Effect of tempering temperature on the mechanical properties
of an AISI 4340 oil-quenched steel bar.
Source: ASM International (1995)

49
Some strong carbide-forming elements such as chromium,
molybdenum and vanadium causes secondary hardening in tempered
steel by forming small, dispersed carbides during the martensite
decomposition process being more effective in increasing hardness at
temperatures above 205°C. Silicon was found to be most effective in
increasing hardness at 315°C. The increase in hardness caused by
elements like phosphorus, nickel and silicon can be attributed to solid-
solution strengthening. Under certain conditions, such as with highly
alloyed steels, hardness may actually increase (HARRY, 1995).
3.4.3.2 Austempering
In this process, a ferrous alloy is isothermally quenched at a
temperature below that of pearlite transformation but above that of Ms.
Workpieces are heated to a temperature within the austenitizing
range, usually 790 to 915 °C. Quenching is done onto a bath maintained
at a constant temperature, usually in a range of 260 to 400 °C. Parts are
allowed to transform isothermally to bainite in this bath. Cooling to
room temperature completes the process (HARRY, 1995)
Fig. 17 shows the differences between austempering and
conventional quenching and tempering. In true austempering metal must
be coolod from austenitic temperature to the temperature of the
austempering bath fast enough to ensure complete transformation of
austenite to bainite.

50
Fig. 17 - Comparison of time-temperature transformation cycles for
conventional quenching + tempering and austempering
Source: ASM International (1995)
Advantages of austempering include higher ductility, toughness
and strength at a given hardness and reduced distortion when compared
to martensite based heat treatments.
The most appropriate description of bainite is that the
microstructure consist of a non-lamellar mixture of ferrite and carbides,
which can be classified further into upper and lower bainite
(BHADESHIA, 2001a). This distinction is because there are clear
differences in the mechanical properties of upper and lower bainite.
Lower bainite is obtained by transformation at relatively low
temperatures. Both upper and lower bainite form as aggregates of small
plates of ferrite. The essential difference between them is in the nature
of the carbide precipitates. Upper bainitic ferrite is free of precipitation,
the carbides present grows from the carbon-enriched residual austenite
between the plates of ferrite. In addition to this type of precipitation,
there are carbide precipitates in lower bainite’s ferrite (BHADESHIA,
1980, 2001a). Fig 18 shows the differences between upper bainite and
lower bainite in terms of carbides precipitation.

51
Fig. 18 - Schematic representation of upper bainite and lower bainite
transitions
Source: Bhadeshia (2001a)
As for the mechanical properties it should be pointed that lower
bainite presents an higher impact toughness with a lower ductile-brittle
transition temperature when compared to upper bainite (BHADESHIA,
2001b), also for a determined carbon content it has an higher hardness
value when compared with upper bainite as shown in fig 19.

52
Fig. 19 - Vickers hardness value for pearlite and bainite produced in a
0.69C plain carbon steel.
Source: Bhadeshia (2001b)
For the current work an austempering temperature of 300 °C was
used for 2 hours to achieve acceptable growth kinetics of lower bainite
in a Fe + 0.6C + 4Ni + 1Mo steel matrix. The materials and methods
used to determine the heat treatment parameters are discussed in the
following chapter.

53
4. MATERIALS AND METHODS
In this chapter the characteristics of the materials used, the
equipment and the characterization techniques used in the current work
are introduced. Regarding this Fig. 20 shows a flow diagram of the
experimental procedure used in this work.
Fig. 20 – Experimental procedure flow diagram.
Source: Author.
4.1 RAW MATERIALS
The raw materials used to produce the test specimens are listed
below in table 2. Table 3 shows the characteristics of the polymer binder
system composed by a mixture of thermoplastic resin, plasticizer,
lubricant, surfactant and anti-oxidizer being a 8% of the feed’s total
mass.
Mixing of Metallic Powders and Binders
Metal Injection Molding
Debinding and Sintering
Phase Transformation Characterization and Heat Treating
Microstructural Characterization
Mechanical Characterization

54
Table 2 - Raw powder materials used
Element Commercial
name
Particle mean
size (µm)
Purity (%) Supplier
Fe CL-OM 7.84 98,3 Basf
Ni PF-10F 6.06 99,9 ATMIX
Mo OMP 5.50 99,8 HC Starck
SiC 800 10.0 99,0 Cobral
Source: Raw materials datasheets.
Table 3 - Binder composition
Element Mass % of the mixture % of the constituent in
the binder
Polypropylene 3,405 42,56
EVA 1,321 16,51
Paraffin 2,895 36,19
Cocamide DEA 0,363 04,54
Anti-oxidant 0,018 0,20
Total 8,000 100,00
Source: Author.
4.2 POWDER MIXTURE PREPARATION
A pre-mixture step to homogeneously distribute the binder
(polyprophilene, paraffin-wax, EVA, Cocamide DEA and antioxidant)
into the raw material mixture was manually performed into a single
container and then the mixing step was done using a sigma class Haake
mixer at 180 °C, 70 RPM for 90 minutes. After the mixing step the now
denominated feedstock was crushed using a Seibt blade grinder. The
product of the whole process was a load of granules containing a
mixture of the raw materials and the binder system with the adequate
size to be used in the injection equipment.
4.3 POWDER INJECTION MOLDING
After feedstocks preparation the test specimens were injected. For
tensile test, tensile test specimens were injected according to MPIF 50
standard, its geometry is shown in figure 21 (a). For microstructural
characterization and hardness and micro hardness measurements bowtie
specimens were produced as shown in figure 21 (b).

55
Fig. 21 - Test specimens: (a) Tensile tests (b) Other tests
(a)
H=19,00 mm;D=3,00
mm;L=69,80 mm
(b)
Source: Adapted from Binder, (2009)
The equipment used for powder injection molding of the test
specimens was an Airburg 320S with a closure force of 50 tf and the
main parameters used during the injection process are listed in table 4.
Table 4 - Powder Injection Molding processing parameters
Injection Pressure (bar) 1000
Settlement Pressure (bar) 800
Injection Temperature (°C) 180
Source: Author.
4.4 DEBINDING AND SINTERING.
The multicomponent binder system as described in table 3
requires a two-step debinding process in order to achieve optimal
removal of the polymeric components. The first step was chemical
dissolution of the lower molecular weight components of the binding
system using hexane (CH₃(CH₂)₄CH₃) heated at 55 °C, first by
exposing the samples to the hexane vapor 2 hours and then by
immersing the samples into the hexane bath 6 hours. This two-step
chemical debinding can be explained as follows: when the specimens
are exposed to hexane vapor, the more soluble elements starts to
dissolve, leaving fine conduits in the form of pores. When the specimen
is then immersed into the bath the solvent easily penetrates the sample
up to the core due the existing pore channels. As the solvent penetrates
the sample, the existing channels broaden and new pores start to grow.
This situation persists until all the soluble binder is extracted during this
step.

56
To remove the component with higher molecular weight (namely
polypropylene) plasma assisted debinding and sintering process was
used (PADS). The PADS process was done under controlled heating
conditions using an hydrogen flux of 1000 cm3/minute up to 500 °C.
Then a 500 cm3/minute flux was used which consisted into a mixture of
95% argon (99.999% purity) and 5% hydrogen (99.995% purity).
Operational parameters of the complete process are listed in table 5.
Table 5 - Processing parameters for the Plasma Assisted Debinding and
Sintering step
Temperature
(°C)
Heating rate
(°C/minute) ton (s) Gas flux
(%)
Pressure
(torr)
H2 Ar
Troom to 300 7.0 50 100 - 1
300 to 500 1.0 100 100 - 1
500 to 1150 5.0 50 5 95 1
1150 1 hour
sintering
50 5 95 1
Cooling - 50 5 95 0.5
Voltage (V) 400
Source: Author
The sintering temperature and time were chosen from the
findings exposed by Binder in 2009 as they proved to be good
parameters to obtain low porosity (< 4%), high mechanical properties
and a high amount of SiC dissociated without achieving complete
dissolution.

57
4.5 HEAT TREATING
Four different conditions/heat treatments were considered for the
current work.
1. As Sintered condition: The initial condition of all the sintered
specimens, it consist into cooling the samples inside the
reactor when the sintering process is finished, is
characterized for its low cooling rate which behaves in a
decreasing logarithmical way, the PADS reactor takes 3
hours to reach 200°C so it can be shut down, the rest of the
cooling occurs overnight in a vacuum environment until the
samples are finally extracted the day after.
2. Martempered and tempered at 300°C: These test specimens
were austenized and quenched into a salt bath at 180 °C for
20 minutes, then they were air cooled to room temperature
and tempered in a salth bath 2 hours at 300 °C.
3. Martempered and tempered at 530 °C: These test specimens
were austenized and quenched into a salt bath at 180 °C for
20 minutes, then they were air cooled and tempered 2 hours
at 530 °C.
4. Austempered: These test specimens were austenized and then
austempered into a salt bath 2 hours at 300 °C.
The austenizing parameters for treatments 2,3 and 4 were 20
minutes at 880 °C, the time was chosen according to ASM Heat
Treater’s Guide (HARRY, 1995).
4.6 CHARACTERIZATION
4.6.1. Differential Dilatometry
Differential dilatometry was used to analyze phase changes at
heating and cooling. For these tests: samples taken from sintered tensile
test specimens were used, with dimensions of 4.8 x 10 mm (diameter x
height). The tests conditions were: Heating at 10 °C/min up to 950°C,
then a 20 minutes step at 950 °C and then cooling at 10 °C/min up to
100 °C into an atmosphere of 95% Ar-5% H2.
4.6.2. Metalographic Preparation

58
Metallographic samples were cut using a BUEHLER ISOMET
4000 precision cutter with a low density diamond saw. Immediately the
samples were mounted into epoxy resin and then sanded and polished.
The microstructure was revealed using Nital 2% (98 ml alcohol and 2
ml nitric acid) and Picral 4% (100 ml alcohol + 4 grams of picric acid).
4.6.3. Optical Microscopy
The optical images were obtained using a Leica DM4000
microscope coupled with a Leica DC 300 digital camera. The images
were white balanced and digitalized using LAS v4.5 software, the
resolution of the images was 2560 x 1920 pixels.
4.6.4. Scanning Electron Microscopy
Characterization of the cross-section of the specimens in terms of
size and composition of microstructural constituents was done by using
SEM microscopes.
a) Conventional scanning electron microscope (SEM) model
JEOL JSM-6390LV with tungsten filament, accelerating
potential from 0.5 to 30kV and benchtop SEM HITACHI
TM3030. Chemical composition was obtained using an
energy dispersive spectrometry microprobe coupled with the
SEM. Superficial images were obtained using the secondary
electron (SE) detector at different magnifications.
b) Field emission gun (FEG) SEM, model JEOL JSM-6701F.
With cold cathode, ultra vaccum and high resolution: 1nm
(30kV) – 2.2n (1.2kV). Acceleration potential varying from
0.5 to 30 kV and magnification from 25x to 650000x.
4.6.5. Hardness.
Hardness measurements were done using a 2.5 diameter tungsten
sphere according to ISO 6506 standard. The machine used for testing
was an EMCO-TEST M4C/R. 10 indents were used to attain a hardness
value in each sample tested.

59
4.6.6. Micro-Hardness
Micro hardness tests were performed using Vickers scale
according to ASTM E386 standard, the applied load was of 10g. The
equipment used was a Shimatzu HMV 2000.
4.6.7. Tensile Tests
Tensile tests were performed according to ISO 6892 standard.
The equipment used was a Zwick/Roell testing machine. The test
specimens had a gauge length of 35 mm and mean diameters of 4.8 mm.
3 tensile specimens were used in each test.

60

61
5. RESULTS AND DISCUSSION
In this chapter mechanical and microstructural properties
obtained as result of sintering and heats treating of the samples are
exposed. Phase transformations and its correlations with chemical and
mechanical properties of the studied alloys are discussed.
5.1 HEAT TREATMENTS
To determine the parameters for heat treatments software
simulations and dilatometric measures were used, A1 and A3
temperatures were determined directly from dilatometric result and non-
equilibrium parameters such as MS, BS and BF were estimated using
ASM STECAL 3.0.3 software.
5.1.1 Dilatometry and CCT diagrams
Dilatometric test were performed on the three alloys in the as-
sinter condition. The samples were heated up to 950°C and then cooled
to 100°C, both heating and cooling rates were set to 10 °C/min. Figs 22
and 23 shows dilatometric curves for heating and cooling for the three
alloys respectively.
Fig. 22 - Heating dilatometric test for Fe+ 0.6C +4Ni + + 1Mo with
variable SiC%
Source: Author
1
3
2

62
From the heating dilatometric curves several things should be
noticed:
1- The samples undergo a previous transformation prior to
carbide dissolution and ferrite transformation into austenite:
This can be explained by a partial tempering process as a
result of martensite present in the as sintered samples.
2- SiC content decreases the severity of the volumetric change
from ferrite to austenite: as part of the microstructure of the
SiC containing alloys is highly stabilized ferrite hence, if
doesn’t transform into austenite in the A1-A3 range. This is
particularly noticeable in the samples containing 3 wt% SiC
where the A1-A3 range appears as an almost flat line rather
than a “bump” when compared to the other two samples.
3- A1-A3 temperatures are influenced by the Si dissolved in the
matrix product of the SiC dissolution during sintering: as Si
difficult the transformation of ferrite into austenite, a rise in
the transformation temperatures A1 and A3 is expected.
Table 6 shows the A1-A3 temperatures determined for all the
three samples.
Table 6 - Austenite transformation temperatures for Fe + 0.6C + 4Ni +
1Mo Sintered steel with variable amount of SiC
0% SiC 2% SiC 3% SiC
A1 (°C) 685 725 735
A3 (°C) 730 770 755
Austenite dissociation into ferrite and carbides was studied by
cooling down the samples at a rate of 10°C/min as presented in figure
23.

63
Fig. 23 - Cooling dilatometric test for Fe+ 0.6C +4Ni + + 1Mo with
variable SiC%
Source: Author
The cooling curve shows the same inverse relationship between
the extent of the volumetric change ↔ + carbides and the quantity of
SiC (and hence, dissolved Si) in the material. The table 7 shows the PS
and PF temperatures obtained from the curves above.
Table 7 - Austenite dissociation temperatures for Fe + 0.6C + 4Ni + 1M o
sintered steel with variable amount of SiC
0% SiC 2% SiC 3% SiC
Ps (°C) 515 480 475
Pf (°C) 425 420 440
Continuous cooling diagrams (CCT) were simulated for the Fe +
0.6C + 4Ni + 1Mo base alloy using the ASM Stecal 3.0.3 software. Fig
24 shows the simulated diagram and the thermal cicles corresponding to
sintering and to the heat treatments of martempering and austempering
used in the current work.
Ps Pf

64
Fig. 24 - Simulated CCT diagram for base alloy
Source: ASM Stecal 3.0.3
The software reports A1-A3 temperatures for this alloy of 659-723
°C which are reasonably close to the 685-730 °C obtained by
dilatometry. Therefore the heat treatments parameters were chosen
taking into account both the experimental and simulated results plus a
margin to ensure the occurrence of the desired transformations, as can
be seen in the diagram by martempering at 180°C the expected
microstructure would be 50% martensite, this is further increased by the
2 hours step and cooling to room temperature. For austempering what’s
expected is to have at least 50% bainite
5.2 MECHANICAL PROPERTIES
Once the test specimens were heat treated, tensile and hardness
tests were performed in order to characterize the material and the
influence of SiC content and heat treatments in the mechanical
properties of these alloys. The strain hardening behavior is also
documented and discussed in this chapter.
Sintering
Austempering
Martempering

65
5.2.1 Tensile And Hardness Values
Figs. 25 – 27 show the tensile tests results and Brinell hardness
measures for Fe + 0.6C + 4Ni + 1Mo sintered steel containing 0, 2 and 3
wt% SiC.
Fig. 25 - Tensile test and hardness results for Fe + 0.6C + 4Ni + 1Mo
sintered steel in the As Sintered and heat treated conditions
Source: Author.
For the base alloy, mechanical properties such as YS, UTS and
hardness behave as expected. The as-sinter samples presents high
ductility and low mechanical resistance while the martempered and
austempered samples exhibits greater mechanical resistance but
sacrificing ductility, the austempered samples have a behavior “in-
between” the samples tempered at 300 and 530 °C in what respects to
tensile properties but shows slightly higher hardness than the sample
martempered and tempered at 300 °C.

66
Fig. 26 – Tensile test and hardness results for base alloy + 2 wt% SiC
sintered Steel in the As Sintered and heat treated conditions
Source: Author
With the addition of 2 wt% SiC the heat treatment effect on the
mechanical properties changes, for this alloy the samples martempered
and tempered at 300°C shows higher yield strength, tensile strength,
hardness and deformation than the samples tempered at 530°C. The
austempered samples show higher deformation and lower yield and
tensile strength with hardness between the two martempered samples.
Fig. 27 - Tensile test and hardness results for base alloy + 3 wt% SiC
sintered Steel in the As Sintered and heat treated conditions
Source: Author

67
With the addition of 3 wt% of SiC the overall behavior of the
previous alloy is conserved. The samples tempered at 300 °C have
higher yield and tensile strength than the samples tempered at 530 °C
but remain with higher deformation while the austempered samples now
shows mechanical properties in between the As Sintered and the
martempered and tempered at 530 °C samples. The higher hardness and
mechanical resistance of the samples tempered at 300 °C follows the
behavior of the base alloy and can be explained by the higher amount of
untempered martensite due to the lower tempering temperature, the
higher deformation compared to the other samples may be explained by
its higher tensile strength which allows the pieces to undergo more
elastic deformation until the fracture. The true plastic deformation will
be discussed in the next section.
To illustrate the influence of the SiC content in the mechanical
properties of these steels fig. 28 shows the above results comparing the
SiC additions influence for each condition.
Fig. 28 - Tensile test and hardness results for each condition and alloy
Source: Author

68
In general terms the additions of SiC to the base alloy improves
its mechanical properties by increasing its hardness and mechanical
strength without a considerable decrease in ductility. It should be
noticed that there are many effects that have to be considered, at one
hand the SiC additions adds dissolved Si to the matrix causing solid
solution hardening, also the zones with a high amount of Si remains
ferritic which is a ductile but soft microstructure, finally the additions of
SiC increases the amount of volume consisting in graphite and pores as
will be discussed in the microstructural characterization chapter;
mechanically graphite nodules behaves as pores due its low shear
strength being its presence detrimental to the mechanical properties.
For the austempered samples the trend is reversed, without great
differences in ductility the hardness and mechanical resistance decreases
with SiC additions. This on principle contradicts the fact that Si
additions into bainite produces an increase in the hardness and
mechanical properties as stated in (BHADESHIA, 2001b) and reported
by (CAI et al., 2011). However, as the same austempering treatment was
performed in the three steel alloys disregarding in SiC content, Si
dissolution into the matrix may have caused a deviation on the bainite
formation kinetics, therefore resulting in different microstructures with
different properties when compared to the base alloy. This will be
further discussed in the following chapters.

69
5.2.2 Strain Hardening
Several strain hardening models have been developed to fit
experimental stress – strain data into a mathematical model where one
or more strain hardening exponents can be extracted (HERTELÉ; DE
WAELE; DENYS, 2011). The Hollomon equation is regarded as the
most simple and practical way to obtain this parameter even being the
method chosen by the ASTM International in their standard (ASTM
INTERNATIONAL, 2007). The Hollomon strain hardening exponent
(n) is calculated according to equations 1, 2 and 3:
𝜎 = 𝐾𝜀𝑛 (1)
Where; True Stress 𝜎 = 𝑆(1 + 𝑒) (2)
True Strain 𝜀 = ln(1 + 𝑒) (3)
Being S the engineering stress and e the engineering strain.
However deviations from this behavior had been reported at low and
high strains (KIM et al., 2013; ZHANG et al., 2006). Nevertheless
calculations of instant n values over true strain has proven to be a good
method to analyze the behavior of steels with mixed microstructures
(ZHANG; DING; MISRA, 2015).
The instant strain hardening exponent (n) is calculated as the
slope of the curve Log (𝜎) = nLog(𝜀) + Log (k) for each value of 𝜀.
Figure 29 a, b and c shows the instant strain hardening exponent for Fe
+ 0.6C + 4Ni + 1Mo sintered steel with additions of 2 and 3% SiC under
as sinter, martempered and tempered at 300°C, martempered and
tempered at 530°C and austempered conditions.

70
Fig. 29 - Instantaneous strain hardening exponents (n) v/s true strain
for: (a) Base alloy, (b) Base alloy + 2% SiC and (c) Base alloy +
3%SiC
a
b

71
Source: Author
From the figures it should be noticed that:
- The steels with additions of SiC exhibits in general larger
plastic strain and strain hardening than the base alloy due to
the presence of ductile ferrite as a byproduct of SiC
dissociation.
- The As Sintered and austempered samples shows larger
strains and strain hardening exponents than the martempered
samples, SiC additions greatly increases these differences.
- Plastic strain behavior of austempered samples compared
with the As Sintered conditions is affected by SiC content,
this can be related with the influence of dissolved Si in the
microstructure of the austempered samples as previously
discussed.
As an high strain hardening coefficient have been reported to
positively influence the wear resistance under dry sliding conditions of
ferrous alloys containing graphite nodules (BEDOLLA-JACUINDE et
al., 2015) while decreasing the friction coefficient (STRAFFELINI et al., 2011) this analysis should be considered of relevance for future
research.
c

72
5.3 MICROSTRUCTURAL CHARACTERIZATION
To characterize the microstructure obtained by heat treating in the
studied alloys, Optical and Scanning electron microscopy was used; this
was also complemented with Energy Dispersive X-Ray Spectroscopy
and HV 0.1 and HV 0.01 micro hardness measures.
As was found by Binder in 2009, porosity in steels processed by
PIM + PADS is unavoidable, also the presence of graphite contributes to
this effect as it low shear module and density makes it to behave like
pores when it comes to mechanical testing and density measures. Figure
30 show the pores + graphite nodules percent in volume as function of
sintering temperature (1 hour) and SiC content.
Fig. 30 - (Pores + nodules) volumetric % of Fe + 0.6C alloys with
increasing SiC contents sintered at different temperatures for 60 min
Source: Adapted by the author of Binder (2009).
The presence of pores and graphite nodules, while not easy to
optically distinguish one from another, must be considered as it
influences mechanical properties such as elastic modulus and yield
strength (BRIS CABRERA, 2006; BUCH; GOLDSCHMIDT, 1969;
FERNÁNDEZ CASTAÑÓN, 2014) and tribological properties
(DUBRUJEAUD; VARDAVOULIAS; JEANDIN, 1994; ROHATGI;
RAY; LIU, 1992).
Temperature, °C
Pe
rce
nt,
%

73
Figure 31shows the microstructure at 200X of the base alloy Fe +
0.6C + 4Ni + 1Mo under as sintered and heat treated conditions.
Fig. 31 - Optical microscopy at 200X of Fe + 0.6C + 4Ni + 1Mo under
As Sintered and heat treated conditions. The As Sintered samples were
etched with Picral 4 wt% and the heat treated samples were etched
with Nital 2 wt%
As sinter Martempered 1h and Tempered 2h at 530 °C
Martempered 1h and Tempered 2h at 300 °C Austempered 2h at 300 °C
Source: Author
The as-sinter samples were etched with Picral reagent as it
presents a microstructure of fine dispersed carbides. HV0.1 hardness tests
were performed into the etched and unetched regions of the
microstructure. The etched regions (ferrite + carbides) had a HV0.1
hardness of 289 ± 27.8 Vickers and the unetched regions had a HV0.1
hardness of 446 ± 51.3 Vickers, this may correspond with a region of
untempered martensite and retained austenite (as hardness doesn’t
correspond with pure 0.45% carbon martensite). These unetched regions
are common for all the alloys and conditions studied.
SEM and EDS line scans were performed in the as sintered
sample to analyze the difference between etched and unetched regions.
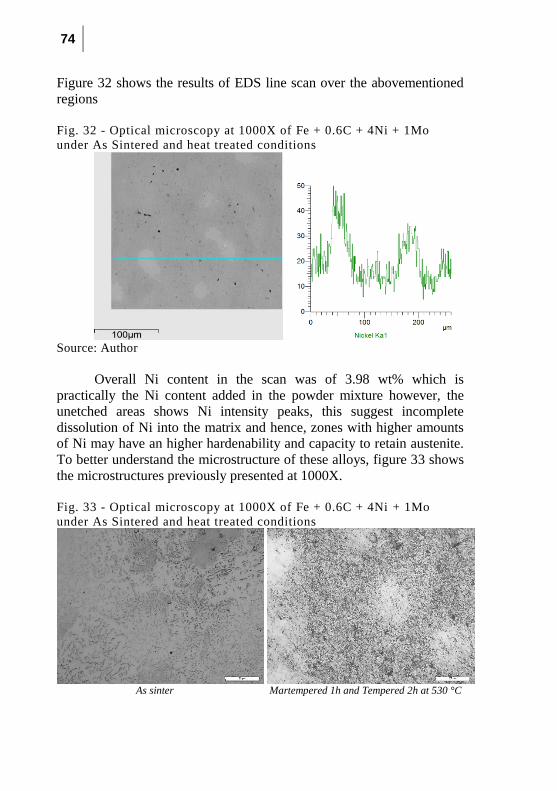
74
Figure 32 shows the results of EDS line scan over the abovementioned
regions
Fig. 32 - Optical microscopy at 1000X of Fe + 0.6C + 4Ni + 1Mo
under As Sintered and heat treated conditions
Source: Author
Overall Ni content in the scan was of 3.98 wt% which is
practically the Ni content added in the powder mixture however, the
unetched areas shows Ni intensity peaks, this suggest incomplete
dissolution of Ni into the matrix and hence, zones with higher amounts
of Ni may have an higher hardenability and capacity to retain austenite.
To better understand the microstructure of these alloys, figure 33 shows
the microstructures previously presented at 1000X.
Fig. 33 - Optical microscopy at 1000X of Fe + 0.6C + 4Ni + 1Mo
under As Sintered and heat treated conditions
As sinter Martempered 1h and Tempered 2h at 530 °C

75
Martempered 1h and Tempered 2h at 300 °C Austempered 2h at 300 °C
Source: Author
The microstructure of the As Sintered samples consists in a fine
dispersion of carbides into a ferritic matrix combined with small
martensitic zones, as it was previously discussed. This explains the
higher plastic strain and strain hardening when compared to the
martempered samples. The martempered and tempered samples both
presents a mixture of tempered and untempered martensite, it has to be
taken into account that in this case untempered martensite can be present
due both nickel segregation and partial tempering in the regions with
lower amounts of nickel. This is visible as zones with a high amount of
nickel appear brighter. The austempered samples show a coarser
microstructure with fine dispersed carbides which may correspond to
lower bainite.
Figure 34 shows the changes of microstructure with the addition
of 2 wt% SiC to the base alloy.

76
Fig. 34 - Optical microscopy at 200X of Fe + 0.6C + 4Ni + 1Mo +
2SiC under As Sintered and heat treated conditions. The As Sintered
samples were etched with Picral 4 wt% and the heat treated samples
were etched with Nital 2 wt%
As sinter Martempered 1h and Tempered 2h at 530 °C
Martempered 1h and Tempered 2h at 300 °C Austempered 2h at 300 °C
Source: Author
The As Sintered samples exhibits the same arrangements of fine
carbides into a ferritic matrix and unetched zones with segregated nickel
but also presents unetched regions close to the graphite nodules, this is
noticeable when etching with picral reagent as it etches carbides
preferably. The martempered samples show tempered martensite
microstructure and some areas resembling a bainitic microstructure
rather than martensitic. This can be explained as Si promotes the ferrite
nucleation from retained austenite (CAI et al., 2011) and therefore,
equiaxial ferrite laths can be expected to nucleate in the Si rich areas
next to the graphite nodules.
Samples with 3 wt% SiC follows the same trend as the samples
with 2 wt% SiC. In this regards figure 35 shows optical micrography

77
images at 1000X of samples with additions of 2 wt% and 3 wt% SiC
under As Sintered and heat threated conditions.
Fig. 35 - Optical microscopy at 1000X of Fe + 0.6C + 4Ni + 1Mo +
2SiC and Fe + 0.6C + 4Ni + 1Mo + 3SiC under As Sintered and heat
treated conditions. The As Sintered samples were etched with Picral 4
wt% and the heat treated samples were etched with Nital 2 wt%
Fe + 0.6C + 4Ni + 1Mo + 2SiC As Sinter Fe + 0.6C + 4Ni + 1Mo + 3SiC As Sinter
Fe + 0.6C + 4Ni + 1Mo + 2SiC
Martempered 1h and Tempered 2h at 530 °C
Fe + 0.6C + 4Ni + 1Mo + 3SiC
Martempered 1h and Tempered 2h at 530 °C

78
Source: Author
The As Sintered samples presents a fine dispersion of carbides
into ferrite but its morphology is different. Samples with 2 wt% SiC
presents fine carbides and highly stabilized ferrite zones next to graphite
nodules due SiC dissociation and Si dissolution. On the other hand
samples with 3 wt% SiC have a larger area of stabilized ferrite with fine
carbides precipitated in grain boundaries due carbon rejection of
stabilized ferrite, it still maintain darker areas of ferrite with dispersed
carbides inside the ferrite grains. The martempered samples exhibits a
tempered martensite structure with areas were the microstructure turns
into bainite, this is more noticeable by looking the microstructure of the
austempered samples which presents ferrite laths growing from
austenitic grains. Figure 36 presents a comparison at 10.000X between
the microstructures of Fe + 0.6C + 4Ni + 1Mo + 3SiC alloy under As
Sintered and martempered and tempered conditions. Figure 37 compares
the morphology of the microstructure of Fe + 0.6C + 4Ni + 1Mo and Fe
+ 0.6C + 4Ni + 1Mo + 3SiC austempered samples.
Fe + 0.6C + 4Ni + 1Mo + 2SiC
Martempered 1h and Tempered 2h at 300 °C
Fe + 0.6C + 4Ni + 1Mo + 3SiC
Martempered 1h and Tempered 2h at 300 °C
Fe + 0.6C + 4Ni + 1Mo + 2SiC Austempered
2h at 300 °C
Fe + 0.6C + 4Ni + 1Mo + 3SiC Austempered
2h at 300 °C
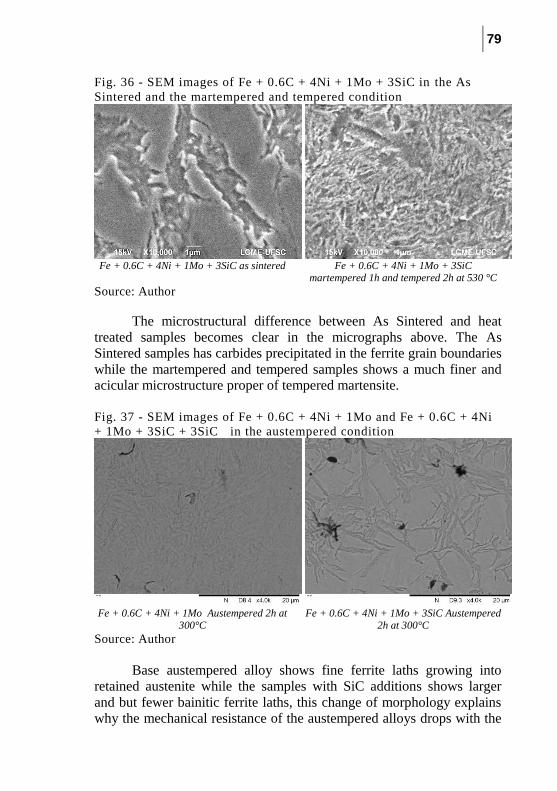
79
Fig. 36 - SEM images of Fe + 0.6C + 4Ni + 1Mo + 3SiC in the As
Sintered and the martempered and tempered condition
Fe + 0.6C + 4Ni + 1Mo + 3SiC as sintered Fe + 0.6C + 4Ni + 1Mo + 3SiC
martempered 1h and tempered 2h at 530 °C
Source: Author
The microstructural difference between As Sintered and heat
treated samples becomes clear in the micrographs above. The As
Sintered samples has carbides precipitated in the ferrite grain boundaries
while the martempered and tempered samples shows a much finer and
acicular microstructure proper of tempered martensite.
Fig. 37 - SEM images of Fe + 0.6C + 4Ni + 1Mo and Fe + 0.6C + 4Ni
+ 1Mo + 3SiC + 3SiC in the austempered condition
Fe + 0.6C + 4Ni + 1Mo Austempered 2h at
300°C Fe + 0.6C + 4Ni + 1Mo + 3SiC Austempered
2h at 300°C Source: Author
Base austempered alloy shows fine ferrite laths growing into
retained austenite while the samples with SiC additions shows larger
and but fewer bainitic ferrite laths, this change of morphology explains
why the mechanical resistance of the austempered alloys drops with the

80
SiC content and the strain hardening exponent rises. Larger ferrite grains
into bainite allows more dislocation movement within the grains,
lowering it hardness and yield strength but allowing more plastic strain
and strain hardening.
Graphite nodule presence was also measured using SEM and
EDS scanning. Figure 38 shows the elements intensity peaks along a
graphite module.
Fig. 38 - Elements x-ray intensity peaks along a graphite nodule of a
Fe + 0.6C + 4Ni + 1Mo + 3SiC As Sintered sample
Source: Author
Graphite nodules also influences the hardness distribution of
these materials, graphite nodules surrounded by a ferrite ring have a
lower hardness while its surroundings became hardened for solid
solution and hardenability increase effect of Si into the alloy. Figure 38
shows a HV0.01 microhardness profile. Figure 40 shows a SEM image
and a EDS of an indentation done over a graphite nodule in a Fe + 0.6C
+ 4Ni + 1Mo + 3SiC alloy martempered and tempered at 530 °C.

81
Fig. 39 - Microhardness profile of Fe + 0.6C + 4Ni + 1Mo and Fe +
0.6C + 4Ni + 1Mo + 3SiC martempered and tempered 2h at 530°C
Source: Author
Fig. 40 - SEM image and EDS scan on a vickers microindentation done
over a graphite nodule , measured hardness was of HV0.01 133
C-K O-K Si-K Fe-K Ni-K Mo-L
B2O3-4h(3)_pt1 14.70 1.51 80.50 2.75 0.54
B2O3-4h(3)_pt2 95.33 0.00 0.15 4.23 0.14 0.15
Source: Author
As shown by figs. 39 and 40 the presence of graphite nodules and
segregated Si causes microstructural and mechanical heterogeneity,
these factors must be considered of interest when analyzing the wear
behavior of these alloys.

82

83
6. CONCLUSIONS
Sintered self-lubricating steels were produced by powder
injection molding and plasma assisted debinding and sintering. These
were heat treated and its mechanical properties and microstructural
evolution were studied. From these studies was found that:
Nickel segregation occurred during the sintering process.
This caused the apparition of harder zones into the
microstructure probably constituted by martensite and
retained austenite.
SiC addition to the base alloy decreases the severity in
terms of volumetric changes of the transformation ↔
+ Fe3C.
Si dissolution into the matrix rises the A1 temperature
due to ferrite stabilization.
Si dissolution into the matrix modifies the microstructure
of the specimens, not only by generating highly
stabilized ferrite zones around graphite nodules as found
in previous works but also by modifying the morphology
of the matrix’s microstructure after heat treatment.
SiC addition improves mechanical resistance for all the
samples with a peak at 2% SiC. This trend is reversed for
austempered samples as its bainitic microstructure
appears to be coarser than the one found in the samples
without SiC.
SiC addition improves ductility of the samples and
favors strain hardening in samples that weren’t
martempered.

84
85
7. SUGGESTIONS FOR FUTURE RESEARCH
For continuity of the current work the following subjects for
research are suggested:
To further study the strain hardening behavior of these
alloys under different modes of deformation.
To study the influence of the degree of disorder and
defects presents in the graphite nodules in the
tribological behavior of these materials.
To study the tribological behavior of the heat treated
samples
A more detailed study on the microstructural influence of
Si under several heat treatment conditions (temperatures
and time).
To study the mechanical properties and microstructure of
these alloys using different ceramic powders as precursor
phases.
To develop new matrix alloys and heat treatments for
these steels with enhanced mechanical and tribological
properties.

86

87
REFERENCES
ASM INTERNATIONAL HANDBOOK COMMITEE. Heat Treating.
In: ASM INTERNATIONAL (Ed.). . ASM Handbook. Cleveland: The
Materials Information Company, 1991. v. IVp. 15–28.
ASM INTERNATIONAL HANDBOOK COMMITEE. Powder Metal
Technologies and Applications. In: ASM INTERNATIONAL (Ed.). .
ASM Handbook. The Materials Information Company, 1998. p. 2762.
ASTM INTERNATIONAL. Standard Test Method for Tensile
Strain-Hardening Exponents ( n-Values ) of Metallic Sheet Materials, 2007.
BEDOLLA-JACUINDE, A. et al. Sliding wear behavior of austempered
ductile iron microalloyed with boron. Wear, p. 1–9, 2015.
BHADESHIA, H. K. D. H. Lower Bainite Transformation and the
Significance of Carbide Precipitation. Acta Metallurgica, v. 28, p.
1103–1114, 1980.
BHADESHIA, H. K. D. H. Upper & Lower Bainite. In: Bainite in
Steels. Institute of Materials, Minerals and Mining, 2001a. p. 189–200.
BHADESHIA, H. K. D. H. Mechanical Properties. In: Bainite in Steels.
Institute of Materials, Minerals and Mining, 2001b. p. 285–342.
BINDER, C. DESENVOLVIMENTO DE NOVOS TIPOS DE AÇOS
SINTERIZADOS AUTOLUBRIFICANTES A SECO COM
ELEVADA RESISTÊNCIA MECÂNICA ALIADA A BAIXO
COEFICIENTE DE ATRITO VÍA MOLDAGEM DE PÓS POR
INJECÃO. Universidade Federal de Santa Catarina, 2009.
BINDER, C. et al. “Fine tuned” steels point the way to a focused future.
Metal Powder Report, v. 65, n. 4, p. 29–37, maio 2010.
BRIS CABRERA, J. L. Comportamiento Mecánico de Aceros
Sinterizados de Alta Densidad. UNIVERSITAT POLITÉCNICA DE
CATALUNYA, 2006.
BUCH, A.; GOLDSCHMIDT, S. Influence or Porosily on Elaslic

88
Moduli of Sinlered Malerials. Materials Science and Engineering, v.
5, n. 2, 1969.
CAI, M. et al. Effects of Si on Microstructural Evolution and
Mechanical Properties of Hot-rolled Ferrite and Bainite Dual-phase
Steels. ISIJ International, v. 51, n. 3, p. 476–481, 2011.
CLAUSS, F. J. Solid Lubricants and Self-Lubricating Solids. I ed.
New York: Academic Press Inc., 1972.
CUI, G. et al. The bronze–silver self-lubricating composite under sea
water condition. Tribology International, v. 60, p. 83–92, abr. 2013.
DE MELLO, J. D. B. et al. Effect of the metallic matrix on the sliding
wear of plasma assisted debinded and sintered MIM self-lubricating
steel. Wear, v. 301, n. 1-2, p. 648–655, abr. 2013.
DENG, X. et al. Deposition and tribological behaviors of ternary BCN
coatings at elevated temperatures. Surface and Coatings Technology,
p. 1–5, out. 2014.
DRESSELHAUS, M. S. Future directions in carbon science. Annu.
Rev. Mater. Sci., v. 27, p. 1–34, 28 mar. 1997.
DU, G. Y. et al. Research on Frictional Behavior of Tungsten Disulfide
Thin Films Prepared by Rf Magnetron Sputtering on Restless Steel.
Physics Procedia, v. 32, p. 532–538, jan. 2012.
DUBRUJEAUD, B.; VARDAVOULIAS, M.; JEANDIN, M. The role
of porosity in the dry sliding wear of a sintered ferrous alloy. Wear, v.
174, n. 1-2, p. 155–161, 1994.
FERNÁNDEZ CASTAÑÓN, J. INFLUENCIA DE LA POROSIDAD
COMPORTAMIENTO EN SERVICIO DE ACEROS SINTERIZADOS : ANÁLISIS TEÓRICO Y EXPERIMENTAL.
Universidad de Oviedo, 2014.
FURLAN, K. P. et al. Thermal Stability of the MoS2 Phase in Injection
Moulded 17-4 PH Stainless Steel. Journal of Materials Research and
Technology, v. 1, n. 3, p. 134–140, out. 2012.

89
GERMAN, R. M. Powder Metallurgy & Particulate Materials
Processing. Princeton: Metal Powder Industries Federation, 2005.
HARRY, C. Heat Treater’s Guide: Practices and Procedures for
Irons and Steels - Heat Treating Processes and Related Technology
Introduction. ASM International, 1995.
HERTELÉ, S.; DE WAELE, W.; DENYS, R. A generic stress-strain
model for metallic materials with two-stage strain hardening behaviour.
International Journal of Non-Linear Mechanics, v. 46, n. 3, p. 519–
531, 2011.
KATO, H. et al. Wear and mechanical properties of sintered copper–tin
composites containing graphite or molybdenum disulfide. Wear, v. 255,
n. 1-6, p. 573–578, ago. 2003.
KIM, J.-H. et al. Strain rate dependent tensile behavior of advanced high
strength steels: Experiment and constitutive modeling. Materials
Science and Engineering: A, v. 559, p. 222–231, 2013.
KOVÁČIK, J. et al. Effect of composition on friction coefficient of Cu–
graphite composites. Wear, v. 265, n. 3-4, p. 417–421, jul. 2008.
MIYOSHI, K. Solid Lubrication Fundamentals and Applications.
1st. ed. Cleveland: CRC Press, 2001.
MOUSTAFA, S. . et al. Friction and wear of copper–graphite
composites made with Cu-coated and uncoated graphite powders.
Wear, v. 253, n. 7-8, p. 699–710, out. 2002.
ÖZMEN, Y.; TANAKA, A.; SUMIYA, T. Effect of humidity on the
tribological behavior of diamond-like carbon (DLC) film coated on WC-
Co by physical vapor deposition method. Surface and Coatings
Technology, v. 133-134, p. 455–459, 2000.
REBELO, D. MORFOLOGIA E ESTRUTURA DOS NÓDULOS
DE GRAFITE GERADOS PELA DISSOCIAÇÃO DE SiC NA SINTERIZAÇÃO DE LIGAS FERROSAS. Universidade Federal de
Santa Catarina, 2014.

90
ROHATGI, P. K.; RAY, S.; LIU, Y. Tribological properties of metal
matrix-graphite particle composites. International Materials Reviews,
v. 37, n. 1, p. 129–152, 1992.
SCHROEDER, R. et al. Internal lubricant as an alternative to coating
steels. Metal Powder Report, v. 65, n. 7, p. 24–31, nov. 2010.
STACHOWIAK, G. W.; BATCHELOR, A. W. SOLID
LUBRICATION AND SURFACE TREATMENTS. In: Engineering
Tribology. Third Edit ed. p. 419–459.
STRAFFELINI, G. et al. Dry rolling-sliding wear of austempered cast
iron. Wear, v. 271, n. 9-10, p. 1602–1608, 2011.
WELZ, S. Identification of carbon allotropes in carbide derived
carbon using electron microscopy. University of Illinois, Chicago,
2003.
ZHANG, D.; SHEN, B.; SUN, F. Study on tribological behavior and
cutting performance of CVD diamond and DLC films on Co-cemented
tungsten carbide substrates. Applied Surface Science, v. 256, n. 8, p.
2479–2489, fev. 2010.
ZHANG, J.; DING, H.; MISRA, R. D. K. Enhanced strain hardening
and microstructural characterization in a low carbon quenching and
partitioning steel with partial austenization. Materials Science and
Engineering: A, v. 636, p. 53–59, 2015.
ZHANG, Z. et al. Theoretical Calculation of the Strain-Hardening
Exponent and the Strength Coefficient of Metallic Materials. Journal of
Materials Engineering and Performance, v. 15, n. 1, p. 19–22, 2006.
ZOUARI, M. et al. A comparative investigation of the tribological
behavior and scratch response of polyester powder coatings filled with
different solid lubricants. Progress in Organic Coatings, v. 77, n. 9, p.
1408–1417, set. 2014.


![Heidegger, M. Ser y El Tiempo [Tr. Jorge Eduardo Rivera]](https://static.fdokumen.com/doc/165x107/632577a8545c645c7f09b75b/heidegger-m-ser-y-el-tiempo-tr-jorge-eduardo-rivera.jpg)